UNITED STATES
SECURITIES AND EXCHANGE COMMISSION
Washington, D.C. 20549
FORM N-CSR
CERTIFIED SHAREHOLDER REPORT OF REGISTERED
MANAGEMENT INVESTMENT COMPANIES
Investment Company Act file number: 811-06652
Aberdeen Investment Funds
Exact name of registrant as specified in charter:
1735 Market Street, 32nd Floor
Philadelphia, PA 19103
Address of principal executive offices:
Ms. Andrea Melia
Aberdeen Asset Management Inc.
1735 Market Street, 32nd Floor
Philadelphia, PA 19103
Name and address of agent for service:
Registrant’s telephone number, including area code: 866-667-9231
Date of fiscal year end: October 31
Date of reporting period: October 31, 2016
Item 1. Reports to Shareholders.

Aberdeen Investment Funds
Annual Report
October 31, 2016
Aberdeen Select International Equity Fund
Aberdeen Select International Equity Fund II
Aberdeen Total Return Bond Fund
Aberdeen Global High Income Fund

| Page 1 | ||||
| Page 2 | ||||
| Page 9 | ||||
| Page 16 | ||||
| Page 30 | ||||
| Page 41 | ||||
| Page 54 | ||||
| Page 75 | ||||
| Page 76 | ||||
| Page 77 | ||||
| Page 78 | ||||
| Page 82 | ||||
Investors should carefully consider a fund’s investment objectives, risks, fees, and expenses before investing any money. To obtain this and other fund information, please call 866-667-9231 to request a prospectus, or download a prospectus at www.aberdeen-asset.us. Please read it carefully before investing any money.
Investing in mutual funds involves risk, including possible loss of principal.
Aberdeen Select International Equity Fund, Aberdeen Select International Equity Fund II, Aberdeen Total Return Bond Fund, and Aberdeen Global High Income Fund, (each a “Fund” and collectively the “Funds”) are distributed by Aberdeen Fund Distributors, LLC, Member FINRA, 1735 Market Street, 32nd Floor, Philadelphia, PA 19103.
Aberdeen Asset Management Inc. (AAMI) has been registered as an investment adviser under the Investment Advisers Act of 1940 since August 23,1995.
Statement Regarding Availability of Quarterly Portfolio Schedule.
The complete schedule of portfolio holdings for the Aberdeen Investment Funds is included in the Funds’ semi-annual and annual reports to shareholders. The Aberdeen Investment Funds file complete schedules of portfolio holdings for each Fund with the Securities and Exchange Commission (the “SEC”) for the first and third quarters of each fiscal year on Form N-Q. The Funds’ Forms N-Q are available on the SEC’s website at http://www.sec.gov. The Funds’ Forms N-Q may be reviewed and copied at the SEC’s Public Reference Room in Washington, DC, and information on the operation of the Public Reference Room may be obtained by calling 800-SEC-0330. The Funds make their most recent Forms N-Q available to shareholders on www.aberdeen-asset.us or upon request without charge.
Statement Regarding Availability of Proxy Voting Record.
Information regarding the policies and procedures that the Funds use to determine how to vote proxies relating to portfolio securities is available without charge, upon request, by calling 866-667-9231. The information is also included in the Funds’ Statement of Additional Information, which is available on the Funds’ website at www.aberdeen-asset.us and on the SEC’s website at www.sec.gov.
Information relating to how each Fund voted proxies relating to portfolio securities held during the most recent twelve months ended June 30 is available by August 30 of the relevant year: (i) upon request and without charge by calling 866-667-9231; and (ii) on the SEC’s website at www.sec.gov.
The 12-month reporting period ended October 31, 2016 appeared to encapsulate the adage: “Expect the unexpected.” Myriad economic and geopolitical events prompted numerous bouts of volatility in the global financial markets over the period – and beyond. There was abundant speculation regarding U.S. Federal Reserve (Fed) monetary policy, with investor sentiment alternatively shifting towards and away from interest-rate hikes with each release of economic data. In early 2016, oil and commodity prices ended their prolonged slump and led to a rally in global equities. However, in June 2016, the UK’s surprising approval of a referendum to leave the European Union (EU) – commonly referred to as “Brexit” – sent tremors through the global markets. Stock prices fell sharply, oil prices slumped, and the British sterling plummeted to a 30-year low against the U.S. dollar. Investor sentiment recovered soon thereafter as central banks in Japan and parts of Europe unexpectedly imposed negative interest rates in a bid to combat low inflation and boost spending. In the U.S., Fed policy remained on hold for most of the reporting period after the central bank increased its benchmark interest rate for the first time in more than nine years in December 2015. Additionally, for much of the reporting period, investors focused on the pending U.S. presidential election and its possible impact on the global economy and financial markets. Shortly after the end of the reporting period in early November, real estate magnate Donald Trump, seemingly benefiting from a global surge in populism that had led to the successful campaign for Brexit, secured what generally had been deemed an improbable victory in the presidential election versus former U.S. Secretary of State Hillary Clinton.
The Morgan Stanley Capital International (MSCI) World Index, a global equity market benchmark, registered a modest gain of 1.8% for the reporting period. Shares of U.S. large-cap companies significantly outperformed their developed-market peers in Europe, but lagged large-cap Asian stocks. The U.S. broader-market S&P 500 Index was up 4.5% for the period, versus the corresponding -7.5% and 8.0% returns of the MSCI Europe and MSCI All-Country (AC) Asia Pacific indices. Emerging-markets and global natural resources stocks benefited from the sharp rebound in oil and commodity prices, with the MSCI Emerging Markets and the S&P Global Natural Resources indices climbing 9.7% and 13.6%, respectively, for the reporting period.1
U.S. equities saw modest gains over the reporting period, with large-cap stocks slightly outperforming small-cap company stocks. Economic growth was sluggish for most of the period before expanding sharply in the third quarter of 2016. The U.S. employment picture continued to improve, albeit at a somewhat slower rate in the second half of the reporting period. However, average hourly wages rose 2.8% over the 12-month reporting period – the largest year-over-year increase since June 2009. Corporate results were generally positive, with 72% of S&P 500 Index companies exceeding consensus earnings estimates and 54% posting better-than-expected revenue for the third-quarter 2016 earnings season.2
Given their significant exposure to the uncertainty generated by Brexit, UK and European stocks lost ground and were the weakest global equity market performers over the reporting period. The UK electorate’s surprising vote to leave the EU counterbalanced the upturn in the European markets for much of the first half of 2016, as the European Central Bank’s aggressive monetary easing had boosted investor sentiment. Earlier in the reporting period, stocks in the region fell amid concerns regarding the terror attacks in Paris and Brussels in November 2015 and March 2016, respectively.
The Asian stock markets performed well during the reporting period despite a slowdown in economic growth in China and the government’s devaluation of its currency, the renminbi, as well as the Brent crude oil price dropping to a multi-year low at the beginning of the 2016 calendar year. The strength in the second half of the period was attributable primarily to investors’ optimism regarding rising oil and commodity prices and global central bank monetary policy. Stock prices rose in response to the European Central Bank’s package of fresh monetary stimulus and the Bank of Japan’s (BoJ’s) move to impose negative interest rates. Additionally, the Japanese yen moved higher amid the flight to safety shortly after the Brexit vote and investors’ hopes that the BoJ would take further stimulus measures. China’s economy strengthened due to increased infrastructure spending and a robust real estate market.
The strong performance of emerging-market equities over the reporting period was attributable primarily to a significant upturn in the Latin America region – particularly Brazil. That market rallied sharply after former President Dilma Rousseff was impeached on charges of fiscal mismanagement and subsequently removed from office. Vice President Michel Temer succeeded her as president. Temer’s economic team, which includes former central bank president Henrique Meirelles serving as finance minister, unveiled an ambitious program of reforms in an effort to buttress the country’s public finances. In contrast, Mexican stocks declined over the reporting period, hampered by an economic slowdown and the global slump in oil prices. Additionally, the Mexican peso weakened against the U.S. dollar on concerns regarding the possible impact of trade restrictions and tariffs and tougher immigration laws under a Trump administration.
Global fixed-income securities saw positive returns over the reporting period as most central banks maintained accommodative monetary policy. Benchmark interest rates remained slightly above 0% in the U.S. and dipped into negative territory in Europe and Japan. Global investment-grade bonds, as measured by the Bloomberg Barclays Global Aggregate Bond Index, gained 5.6% during the reporting period. High-yield issues significantly outperformed their investment-grade counterparts for the period. The Bank of America Merrill Lynch Global High Yield Constrained Index climbed 10.6%, as the asset class was bolstered mainly by the upturn in global commodity prices for much of the reporting period.
Outlook
It seems that the global financial markets have been subjected to heavy doses of Trump- and Brexit-related news, in our view. Both trending topics caused upheaval in equity and bond prices and prompted furious but short-lived sell-offs in the markets. With the continued rise of insurgent populist movements elsewhere in the developed world, we think that we may be heading for an economic and political “crunch point.” The electoral tests thus far in 2016 have brought de-globalization and protectionist tendencies into the front line of government in both the U.S. and the UK. Other incumbent governments facing such challenges in the year ahead – most obviously in France and Germany – are taking notice and contemplating how to explain the benefits of globalization, while acknowledging they could and should be shared more widely.
We feel that it is worth bearing in mind that the story of populism and de-globalization is nuanced, with both negative and positive implications for champions of globalization. On the downside, this complexity may make it harder to successfully address the causes of discontent and reduce the risk of damaging de-globalization. Nonetheless, protectionism is not an inevitable, reflexive response to the challenges the world faces on the other side of the global financial crisis. Returning to the UK, and specifically the EU referendum result, young people voted “remain” overall, whereas older demographic groups favored “leave.” At least in this case, in our opinion, those who have spent all their lives in a globalized world appear most reluctant to give up on it just yet.
Hugh Young
Managing Director
Aberdeen Asset Management
| 1 | Indexes are unmanaged and have been provided for comparison purposes only. No fees or expenses are reflected. You cannot invest directly in an index. |
| 2 | Source: FactSet, “Earnings Insight,” November 2016 |
2016 Annual Report
1
Aberdeen Select International Equity Fund (Unaudited)
Aberdeen Select International Equity Fund (Institutional Class shares net of fees) returned 1.30% for the 12-month period ended October 31, 2016, versus 0.72% for its benchmark, the MSCI All Country (AC) World ex USA Index, during the same period. For broader comparison, the average return of the Fund’s peer category of International Large-Cap Growth Funds (comprising 41 funds), as measured by Lipper, Inc., was -2.26% for the period.
International equities rose modestly amid numerous periods of volatility during the reporting period. Stock markets tumbled early in the period when commodity prices plummeted and the U.S. Federal Reserve (Fed) raised interest rates for the first time in a decade, and again in June 2016, when the UK voted to leave the European Union (“Brexit”). However, investor sentiment recovered quickly in both instances. Meanwhile, investors reacted positively as central banks in Japan and parts of Europe unexpectedly imposed negative interest rates to combat low inflation and boost spending, while persistent deflationary pressures forced the Fed to maintain an accommodative monetary policy stance. The end of the period saw anxiety rise again, ahead of a nail-biting finish to the U.S. presidential election in early November. Republican Donald Trump subsequently won the election on November 8. Elsewhere, oil prices fluctuated throughout the reporting period, in tandem with ongoing speculation over a production cap by members of the Organization of the Petroleum Exporting Countries (OPEC).
At the stock level, the position in Banco Bradesco contributed to Fund performance for the reporting period, riding the rally in Brazilian stocks. The upturn was supported by rising investor confidence as Michel Temer took over as the country’s president and an ambitious program of reforms was unveiled in an effort to buttress the country’s public finances. The holding in Taiwan Semiconductor Manufacturing Co. also benefited Fund performance. The company’s shares rose in line with the wider semiconductor industry, as solid demand improved the company’s cash flows. Shin-Etsu Chemical Co.’s stock price rose as its core polyvinyl chloride (PVC) business posted healthy results over the reporting period. The company plans to build a new local silicone production plant in a bid to take advantage of the rapidly expanding market.
Conversely, the Fund’s holding in Novartis detracted from performance for the reporting period. The company’s shares fell in line with the broader healthcare and pharmaceuticals sectors, which were hampered by concerns about the impact that the outcome of the U.S. election might have on pharmaceutical prices. The position in Inmarsat, a UK-based provider of global mobile satellite communications services, also detracted from Fund performance after the company reduced its 2016 earnings forecast following concerns about a glut of satellite broadband. Furthermore, technological innovation in the sector led to pricing pressures. Finally, the holding in Prudential weighed on Fund performance after the UK-based multi-lines insurer reported weak quarterly earnings over the period, attributable to a decline in premiums earned and lower asset management income.
During the reporting period, we initiated positions in Australian biopharmaceutical company CSL; Inmarsat; Hong Kong exchange-listed subway operator MTR Corp.; French cosmetics maker L’Oreal; restaurant, coffee shop and budget hotel group Whitbread; German pharmaceutical firm Bayer, Thailand-based commercial bank Kasikornbank; property developer Ayala Land; Japanese manufacturing company Keyence; and two Hong Kong exchange-listed companies – subway operator MTR Corp. and luggage-maker Samsonite International. We also established a new position in Japanese cycling and fishing equipment manufacturer Shimano, which we believe has a sustainable technological advantage, having focused on research and development, in an industry with high barriers to entry.
We exited positions in two French companies: natural gas and electricity supplier Engie and retailer Casino Guichard Perrachon. We also sold the Fund’s shares in Swedish telecommunications company Ericsson; Swiss multi-lines insurer Zurich Insurance; and UK exchange-listed diversified financial services company HSBC Holdings. Furthermore, we exited the Fund’s position in Canadian National Railway. While the stock performed well over the reporting period, we feel that the company faces an increasingly challenging operating environment.
We anticipate that global markets will remain cautious in light of the unexpected U.S. election result, which rattled financial markets in a reactionary sell-off. Until there is greater clarity on President-elect Trump’s policies, we think that it is difficult to predict the impact on the U.S. dollar and the Fed’s monetary policy, and more turmoil is expected in coming months. Meanwhile, we believe that there may be further uncertainty driven by the upcoming Brexit negotiations, mounting debt concerns in China and uncertainty over central-bank policy in Europe. Despite the turbulent outlook, we maintain faith in our investment process, which seeks opportunities to add to what we believe are high-quality holdings at a good price, which we feel should benefit the Fund’s performance over the long term.
Portfolio Management:
Aberdeen Global Equity Team
PAST PERFORMANCE DOES NOT GUARANTEE FUTURE RESULTS.
The performance quoted represents past performance, which does not guarantee future results. Class A shares have up to a 0.25% 12b-1 fee. The investment return and principal value of an investment will fluctuate so that an investor’s shares, when redeemed, may be worth more or less than their original cost. Current performance of the Fund may be lower or higher than the performance quoted. Performance data current to the most recent month-end may be obtained by calling 866-667-9231 or visiting www.aberdeen-asset.us.
Investing in mutual funds involves risk, including the possible loss of principal. There is no assurance that the investment objective of any fund will be achieved. Indexes are unmanaged and have been provided for comparison purposes only. No fees or expenses are reflected. You cannot invest directly in an index.
Lipper is a leading global provider of mutual fund information and analysis to fund companies, financial intermediaries and media organizations.
Annual Report 2016
2
Aberdeen Select International Equity Fund (Unaudited) (concluded)
Risk Considerations
Foreign securities may be more volatile, harder to price and less liquid than U.S. securities. They are subject to different accounting and regulatory standards and currency exchange rate, political and economic risks. Fluctuation in currency exchange rates may impact a Fund’s returns more greatly to the extent a Fund does not hedge currency exposure or hedging techniques are unsuccessful. The foregoing risks are enhanced in emerging market countries.
Equity stocks of small and mid-cap companies carry greater risk and more volatility than equity stocks of larger, more established companies.
Stocks issued by large cap companies subject the Fund to the risk that those stocks may underperform stocks issued by companies with smaller capitalizations or the market as a whole.
Investing a significant portion of the Fund’s assets in securities of companies conducting business in a broadly related group of industries within an economic sector may make the Fund more vulnerable to unfavorable developments in that sector.
Please read the prospectus for more detailed information regarding these and other risks.
2016 Annual Report
3
Aberdeen Select International Equity Fund (Unaudited)
Average Annual Total Return (For periods ended October 31, 2016) | 1 Yr. | 5 Yr. | 10 Yr. | |||||||
Class A | 0.99% | 0.56% | (1.95% | ) | ||||||
Institutional Class | 1.30% | 0.82% | (1.70% | ) | ||||||
Annual Report 2016
4
Aberdeen Select International Equity Fund (Unaudited)
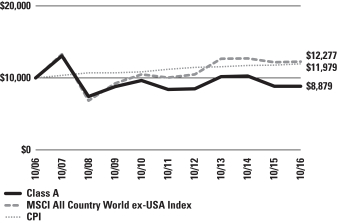
Performance of a $10,000 Investment (as of October 31, 2016)

Comparative performance of $10,000 invested in Class A shares of the Aberdeen Select International Equity Fund, Morgan Stanley Capital International All Country World ex-USA Index (MSCI ACWI ex-USA Index), and the Consumer Price Index (CPI) over a 10-year period ended October 31, 2016. Unlike the Fund’s returns, the returns for these unmanaged indexes do not reflect any fees or expenses. Investors cannot invest directly in market indexes.
The MSCI ACWI ex-USA Index captures large and mid cap representation across 22 of 23 Developed Markets (DM) countries (excluding the United States (U.S.) and 23 Emerging Markets (EM) countries). With 1,853 constituents, the index covers approximately 85% of the global equity opportunity set outside the U.S.
The CPI is a measure of the average change over time in the prices paid by urban consumers for a market basket of consumer goods and services.
Investment return and principal value will fluctuate, and when redeemed, shares may be worth more or less than original cost. Past performance is no guarantee of future results. The Average Annual Total Return table and performance graph do not reflect the deduction of taxes that a shareholder would pay on Fund distributions or the redemption of Fund shares. Investing in mutual funds involves market risk, including loss of principal. Performance returns assume the reinvestment of all distributions. Performance returns reflect fee waivers and reimbursements in effect without which returns would have been lower.
Portfolio Summary (as a percentage of net assets)
October 31, 2016 (Unaudited)
| Asset Allocation | ||||
Common Stocks | 91.5% | |||
Preferred Stocks | 8.0% | |||
Closed End Funds | –% | 1 | ||
Government Bonds | –% | 1 | ||
Short-Term Investment | –% | |||
Other assets in excess of liabilities | 0.5% | |||
| 100.0% | ||||
| 1 | Represents a security that is fair valued at zero pursuant to procedures approved by the Fund’s Board of Trustees. See Note 2(a) of the accompanying Notes to Financial Statements. |
| Amounts | listed as “–” are 0% or round to 0% |
The following table summarizes the composition of the Fund’s portfolio, in Standard & Poor’s Global Industry Classification Standard (GICS) sectors, expressed as a percentage of net assets. The GICS structure consists of 11 sectors, 24 industry groups, 68 industries and 157 sub-industries. As of October 31, 2016, the Fund did not have more than 25% of its assets invested in any industry group.
| Top Sectors | ||||
Consumer Staples | 16.0% | |||
Health Care | 12.6% | |||
Industrials | 12.1% | |||
Financials | 12.0% | |||
Information Technology | 11.4% | |||
Telecommunication Services | 10.1% | |||
Materials | 7.4% | |||
Real Estate | 6.1% | |||
Consumer Discretionary | 5.9% | |||
Energy | 5.9% | |||
Other | 0.5% | |||
| 100.0% | ||||
2016 Annual Report
5
Aberdeen Select International Equity Fund (Unaudited) (concluded)
| Top Holdings* | ||||
Roche Holding AG | 3.9% | |||
Japan Tobacco, Inc. | 3.8% | |||
Novartis AG | 3.7% | |||
Taiwan Semiconductor Manufacturing Co. Ltd. | 3.6% | |||
Nestle SA | 3.5% | |||
Shin-Etsu Chemical Co. Ltd. | 3.3% | |||
Samsung Electronics Co. Ltd., Preferred Shares | 3.1% | |||
Singapore Telecommunications Ltd. | 3.1% | |||
Royal Dutch Shell PLC, B Shares | 3.0% | |||
Check Point Software Technologies Ltd. | 2.9% | |||
Other | 66.1% | |||
| 100.0% | ||||
| * | For the purpose of listing top holdings, Short-Term Investments are included as part of Other. |
| Top Countries | ||||
United Kingdom | 22.3% | |||
Japan | 14.9% | |||
Switzerland | 11.1% | |||
Hong Kong | 9.4% | |||
Germany | 8.0% | |||
Singapore | 6.2% | |||
Taiwan | 3.6% | |||
Canada | 3.1% | |||
Republic of South Korea | 3.1% | |||
Israel | 2.9% | |||
Other | 15.4% | |||
| 100.0% | ||||
Annual Report 2016
6
Statement of Investments
October 31, 2016
Aberdeen Select International Equity Fund
| Shares or Principal Amount | Value | |||||||
COMMON STOCKS (91.5%) | ||||||||
AUSTRALIA (1.1%) | ||||||||
Health Care (1.1%) | ||||||||
CSL Ltd. (a) | 31,200 | $ | 2,380,733 | |||||
CANADA (3.1%) | ||||||||
Materials (1.4%) | ||||||||
Potash Corp. of Saskatchewan, Inc. | 187,600 | 3,050,441 | ||||||
Telecommunication Services (1.7%) | ||||||||
TELUS Corp. | 109,700 | 3,551,980 | ||||||
| 6,602,421 | ||||||||
FRANCE (1.5%) | ||||||||
Consumer Staples (1.5%) | ||||||||
L’Oreal SA (a) | 17,800 | 3,189,032 | ||||||
GERMANY (5.4%) | ||||||||
Health Care (3.9%) | ||||||||
Bayer AG (a) | 30,200 | 2,998,547 | ||||||
Fresenius Medical Care AG & Co. KGaA (a) | 64,500 | 5,253,790 | ||||||
| 8,252,337 | ||||||||
Materials (1.5%) | ||||||||
Linde AG (a) | 19,800 | 3,270,298 | ||||||
| 11,522,635 | ||||||||
HONG KONG (9.4%) | ||||||||
Consumer Discretionary (1.7%) | ||||||||
Samsonite International SA (a) | 1,174,800 | 3,686,073 | ||||||
Financials (2.8%) | ||||||||
AIA Group Ltd. (a) | 960,000 | 6,039,361 | ||||||
Industrials (3.8%) | ||||||||
Jardine Matheson Holdings Ltd. | 91,900 | 5,597,629 | ||||||
MTR Corp. Ltd. (a) | 466,500 | 2,581,647 | ||||||
| 8,179,276 | ||||||||
Real Estate (1.1%) | ||||||||
Swire Pacific Ltd., Class A (a) | 219,500 | 2,281,452 | ||||||
| 20,186,162 | ||||||||
ISRAEL (2.9%) | ||||||||
Information Technology (2.9%) | ||||||||
Check Point Software Technologies Ltd. (b) | 72,600 | 6,139,056 | ||||||
ITALY (1.5%) | ||||||||
Energy (1.5%) | ||||||||
Tenaris SA, ADR | 112,400 | 3,169,680 | ||||||
JAPAN (14.9%) | ||||||||
Consumer Discretionary (1.8%) | ||||||||
Shimano, Inc. (a) | 23,000 | 3,932,532 | ||||||
Consumer Staples (3.8%) | ||||||||
Japan Tobacco, Inc. (a) | 210,900 | 8,018,444 | ||||||
Industrials (1.8%) | ||||||||
FANUC Corp. (a) | 21,500 | 3,936,380 | ||||||
Information Technology (1.8%) | ||||||||
Keyence Corp. (a) | 5,200 | 3,812,075 | ||||||
Materials (3.3%) | ||||||||
Shin-Etsu Chemical Co. Ltd. (a) | 93,800 | 7,112,041 | ||||||
Real Estate (2.4%) | ||||||||
Daito Trust Construction Co. Ltd. (a) | 30,300 | 5,077,635 | ||||||
| 31,889,107 | ||||||||
LATVIA (0.0%) | ||||||||
Financials (0.0%) | ||||||||
AS Parex Banka (a)(b)(c) | 1,424,182 | – | ||||||
MEXICO (2.5%) | ||||||||
Consumer Staples (2.5%) | ||||||||
Fomento Economico Mexicano SAB de CV, ADR | 55,100 | 5,271,419 | ||||||
PHILIPPINES (1.0%) | ||||||||
Real Estate (1.0%) | ||||||||
Ayala Land, Inc. (a) | 2,983,700 | 2,231,785 | ||||||
SINGAPORE (6.2%) | ||||||||
Financials (1.5%) | ||||||||
Oversea-Chinese Banking Corp. Ltd. (a) | 540,229 | 3,291,148 | ||||||
Real Estate (1.6%) | ||||||||
City Developments Ltd. (a) | 556,800 | 3,390,206 | ||||||
Telecommunication Services (3.1%) | ||||||||
Singapore Telecommunications Ltd. (a) | 2,339,900 | 6,521,128 | ||||||
| 13,202,482 | ||||||||
SOUTH AFRICA (1.4%) | ||||||||
Telecommunication Services (1.4%) | ||||||||
MTN Group Ltd. (a) | 351,400 | 3,035,160 | ||||||
SWEDEN (1.9%) | ||||||||
Industrials (1.9%) | ||||||||
Atlas Copco AB, A Shares (a) | 143,100 | 4,192,125 | ||||||
SWITZERLAND (11.1%) | ||||||||
Consumer Staples (3.5%) | ||||||||
Nestle SA (a) | 103,300 | 7,490,683 | ||||||
Health Care (7.6%) | ||||||||
Novartis AG (a) | 111,400 | 7,905,788 | ||||||
Roche Holding AG (a) | 36,700 | 8,429,313 | ||||||
| 16,335,101 | ||||||||
| 23,825,784 | ||||||||
TAIWAN (3.6%) | ||||||||
Information Technology (3.6%) | ||||||||
Taiwan Semiconductor | 1,275,000 | 7,651,723 | ||||||
THAILAND (1.7%) | ||||||||
Financials (1.7%) | ||||||||
Kasikornbank PCL (a) | 735,300 | 3,610,216 | ||||||
See accompanying Notes to Financial Statements.
2016 Annual Report
7
Statement of Investments (concluded)
October 31, 2016
Aberdeen Select International Equity Fund
| Shares or Principal Amount | Value | |||||||
UNITED KINGDOM (22.3%) | ||||||||
Consumer Discretionary (2.4%) | ||||||||
Whitbread PLC (a) | 116,800 | $ | 5,159,667 | |||||
Consumer Staples (2.1%) | ||||||||
British American Tobacco PLC (a) | 77,000 | 4,413,096 | ||||||
Energy (4.4%) | ||||||||
John Wood Group PLC (a) | 335,100 | 3,149,662 | ||||||
Royal Dutch Shell PLC, B Shares (a) | 246,900 | 6,368,169 | ||||||
| 9,517,831 | ||||||||
Financials (3.7%) | ||||||||
Prudential PLC (a) | 256,800 | 4,190,686 | ||||||
Standard Chartered PLC (a)(b) | 419,100 | 3,644,456 | ||||||
| 7,835,142 | ||||||||
Industrials (4.6%) | ||||||||
Experian PLC (a) | 228,800 | 4,398,574 | ||||||
Rolls-Royce Holdings PLC (a)(b) | 358,500 | 3,182,267 | ||||||
Rolls-Royce Holdings PLC, C Shares (b) | 16,491,000 | 20,185 | ||||||
Weir Group PLC (The) (a) | 110,800 | 2,301,624 | ||||||
| 9,902,650 | ||||||||
Materials (1.2%) | ||||||||
BHP Billiton PLC (a) | 174,300 | 2,620,960 | ||||||
Telecommunication Services (3.9%) | ||||||||
Inmarsat PLC (a) | 383,900 | 3,293,115 | ||||||
Vodafone Group PLC (a) | 1,859,300 | 5,106,241 | ||||||
| 8,399,356 | ||||||||
| 47,848,702 | ||||||||
VENEZUELA (0.0%) | ||||||||
Financials (0.0%) | ||||||||
Banco Venezolano de Credito SA (a)(b)(c) | 156 | – | ||||||
Industrials (0.0%) | ||||||||
Cemex Venezuela SACA-I (a)(b)(c) | 15,843,815 | – | ||||||
| – | ||||||||
Total Common Stocks | 195,948,222 | |||||||
CLOSED END FUNDS (0.0%) | ||||||||
RUSSIA (0.0%) | ||||||||
Renaissance Pre-IPO Fund (a)(b)(c) | 92,634 | – | ||||||
Total Closed End Funds | – | |||||||
GOVERNMENT BONDS (0.0%) | ||||||||
VENEZUELA (0.0%) | ||||||||
Bonos de la Deuda Publica Nacional (VEF), | 49,500,000 | – | ||||||
Bonos de la Deuda Publica Nacional (VEF), | 20,000,000 | – | ||||||
| – | ||||||||
Total Government Bonds | – | |||||||
PREFERRED STOCKS (8.0%) | ||||||||
BRAZIL (2.3%) | ||||||||
Financials (2.3%) | ||||||||
Banco Bradesco SA, ADR, Preferred Shares | 481,000 | 5,007,210 | ||||||
GERMANY (2.6%) | ||||||||
Consumer Staples (2.6%) | ||||||||
Henkel AG & Co. KGaA, Preferred Shares (a) | 43,200 | 5,552,525 | ||||||
REPUBLIC OF SOUTH KOREA (3.1%) | ||||||||
Information Technology (3.1%) | ||||||||
Samsung Electronics Co. Ltd., Preferred Shares (a) | 5,700 | 6,553,686 | ||||||
Total Preferred Stocks | 17,113,421 | |||||||
SHORT-TERM INVESTMENT (0.0%) | ||||||||
UNITED STATES (0.0%) | ||||||||
State Street Institutional U.S. Government Money Market Fund (d) | 148 | 148 | ||||||
Total Short-Term Investment | 148 | |||||||
Total Investments | 213,061,791 | |||||||
Other assets in excess of liabilities—0.5% | 1,125,840 | |||||||
Net Assets—100.0% | $ | 214,187,631 | ||||||
| (a) | Fair Valued Security. Fair Values are determined pursuant to procedures approved by the Fund’s Board of Trustees. See Note 2(a) of the accompanying Notes to Financial Statements. |
| (b) | Non-income producing security. |
| (c) | The Fund’s adviser has deemed this security to be illiquid based upon procedures approved by the Board of Trustees. Illiquid securities held by the Fund represent 0.00% of net assets as of October 31, 2016. |
| (d) | Registered investment company advised by State Street Global Advisors. |
| (e) | See accompanying Notes to Financial Statements for tax unrealized appreciation/depreciation of securities. |
| ADR | American Depositary Receipt |
| VEF | Venezuelan Bolivar |
See accompanying Notes to Financial Statements.
Annual Report 2016
8
Aberdeen Select International Equity Fund II (Unaudited)
Aberdeen Select International Equity Fund II (Institutional Class shares net of fees) returned 0.75% for the 12-month period ended October 31, 2016, versus 0.72% for its benchmark, the MSCI All Country (AC) World ex USA Index, during the same period. For broader comparison, the average return of the Fund’s peer category of International Large-Cap Growth Funds (comprising 41 funds), as measured by Lipper, Inc., was -2.26% for the period.
International equities rose modestly amid numerous periods of volatility during the reporting period. Stock markets tumbled early in the period when commodity prices plummeted and the U.S. Federal Reserve (Fed) raised interest rates for the first time in a decade, and again in June 2016, when the UK voted to leave the European Union (“Brexit”). However, investor sentiment recovered quickly in both instances. Meanwhile, investors reacted positively as central banks in Japan and parts of Europe unexpectedly imposed negative interest rates to combat low inflation and boost spending, while persistent deflationary pressures forced the Fed to maintain an accommodative monetary policy stance. The end of the period saw anxiety rise again, ahead of a nail-biting finish to the U.S. presidential election in early November. Republican Donald Trump subsequently won the election on November 8. Elsewhere, oil prices fluctuated throughout the reporting period, in tandem with ongoing speculation over a production cap by members of the Organization of the Petroleum Exporting Countries (OPEC).
At the stock level, the position in Banco Bradesco contributed to Fund performance for the reporting period, riding the rally in Brazilian stocks. The upturn was supported by rising investor confidence as Michel Temer took over as the country’s president and an ambitious program of reforms was unveiled in an effort to buttress the country’s public finances. The holding in Taiwan Semiconductor Manufacturing Co. also benefited Fund performance. The company’s shares rose in line with the wider semiconductor industry, as solid demand improved the company’s cash flows. Shin-Etsu Chemical Co.’s stock price rose as its core polyvinyl chloride (PVC) business posted healthy results over the reporting period. The company plans to build a new local silicone production plant in a bid to take advantage of the rapidly expanding market.
Conversely, the Fund’s holding in Novartis detracted from performance for the reporting period. The company’s shares fell in line with the broader healthcare and pharmaceuticals sectors, which were hampered by concerns about the impact that the outcome that the U.S. election might have on pharmaceutical prices. The position in Inmarsat, a UK-based provider of global mobile satellite communications services, also detracted from Fund performance after the company reduced its 2016 earnings forecast following concerns about a glut of satellite broadband. Furthermore, technological innovation in the sector led to pricing pressures. Finally, the holding in Prudential weighed on Fund performance after the UK-based multi-lines insurer reported weak quarterly earnings over the period, attributable to a decline in premiums earned and lower asset management income.
During the reporting period, we initiated positions in Australian biopharmaceutical company CSL; Inmarsat; Hong Kong exchange-listed subway operator MTR Corp.; French cosmetics maker L’Oreal; restaurant, coffee shop and budget hotel group Whitbread, German pharmaceutical firm Bayer, Thailand-based commercial bank Kasikornbank; property developer Ayala Land; Japanese manufacturing company Keyence; and two Hong Kong exchange-listed companies – subway operator MTR Corp. and luggage-maker Samsonite International. We also established a new position in Japanese cycling and fishing equipment manufacturer Shimano, which we believe has a sustainable technological advantage, having focused on research and development, in an industry with high barriers to entry.
We exited positions in three French companies: natural gas and electricity supplier Engie; electricity distributor Schneider Electric; and retailer Casino Guichard Perrachon. We also sold the Fund’s shares in Swedish telecommunications company Ericsson; Swiss multi-lines insurer Zurich Insurance; Sweden-based Nordea Bank; Brazilian miner Vale; and UK exchange-listed diversified financial services company HSBC Holdings. Furthermore, we exited the Fund’s position in Canadian National Railway. While the stock performed well over the reporting period, we feel that the company faces an increasingly challenging operating environment.
We anticipate that global markets will remain cautious in light of the unexpected U.S. election result, which rattled financial markets in a reactionary sell-off. Until there is greater clarity on President-elect Trump’s policies, we think that it is difficult to predict the impact on the U.S. dollar and the Fed’s monetary policy, and more turmoil is expected in coming months. Meanwhile, we believe that there may be further uncertainty driven by the upcoming Brexit negotiations, mounting debt concerns in China and uncertainty over central-bank policy in Europe. Despite the turbulent outlook, we maintain faith in our investment process, which seeks opportunities to add to what we believe are high-quality holdings at a good price, which we feel should benefit the Fund’s performance over the long term.
Portfolio Management:
Aberdeen Global Equity Team
PAST PERFORMANCE DOES NOT GUARANTEE FUTURE RESULTS.
The performance quoted represents past performance, which does not guarantee future results. Class A Shares have up to a 0.25% 12b-1 fee. The investment return and principal value of an investment will fluctuate so that an investor’s shares, when redeemed, may be worth more or less than their original cost. Current performance of the Fund may be lower or higher than the performance quoted. Performance data current to the most recent month-end may be obtained by calling 866-667-9231 or visiting www.aberdeen-asset.us.
Investing in mutual funds involves risk, including the possible loss of principal. There is no assurance that the investment objective of any fund will be achieved. Indexes are unmanaged and have been provided for comparison purposes only. No fees or expenses are reflected. You cannot invest directly in an index.
Lipper is a leading global provider of mutual fund information and analysis to fund companies, financial intermediaries and media organizations.
2016 Annual Report
9
Aberdeen Select International Equity Fund II (Unaudited) (concluded)
Risk Considerations
Foreign securities may be more volatile, harder to price and less liquid than U.S. securities. They are subject to different accounting and regulatory standards and currency exchange rate, political and economic risks. Fluctuation in currency exchange rates may impact a Fund’s returns more greatly to the extent a Fund does not hedge currency exposure or hedging techniques are unsuccessful. The foregoing risks are enhanced in emerging market countries.
Equity stocks of small- and mid-cap companies carry greater risk and more volatility than equity stocks of larger, more established companies.
Stocks issued by large cap companies subject the Fund to the risk that those stocks may underperform stocks issued by companies with smaller capitalizations or the market as a whole.
Investing a significant portion of the Fund’s assets in securities of companies conducting business in a broadly related group of industries within an economic sector may make the Fund more vulnerable to unfavorable developments in that sector.
Please read the prospectus for more detailed information regarding these and other risks.
10
Annual Report 2016
Aberdeen Select International Equity Fund II (Unaudited)
Average Annual Total Return (For periods ended October 31, 2016) | 1 Yr. | 5 Yr. | 10 Yr. | |||||||
Class A | 0.33% | 1.04% | (1.18% | ) | ||||||
Institutional Class | 0.75% | 1.31% | (0.92% | ) | ||||||
2016 Annual Report
11
Aberdeen Select International Equity Fund II (Unaudited)
Performance of a $10,000 Investment (as of October 31, 2016)
Comparative performance of $10,000 invested in Class A shares of the Aberdeen Select International Equity Fund II, Morgan Stanley Capital International All Country World ex-USA Index (MSCI ACWI ex-USA Index), and the Consumer Price Index (CPI) over a 10-year period ended October 31, 2016. Unlike the Fund’s returns, the returns for these unmanaged indexes do not reflect any fees or expenses. Investors cannot invest directly in market indexes.
The MSCI ACWI ex-USA Index captures large and mid cap representation across 22 of 23 Developed Markets (DM) countries (excluding the United States (U.S.) and 23 Emerging Markets (EM) countries). With 1,853 constituents, the index covers approximately 85% of the global equity opportunity set outside the U.S.
The CPI is a measure of the average change over time in the prices paid by urban consumers for a market basket of consumer goods and services.
Investment return and principal value will fluctuate, and when redeemed, shares may be worth more or less than original cost. Past performance is no guarantee of future results. The Average Annual Total Return table and performance graph do not reflect the deduction of taxes that a shareholder would pay on Fund distributions or the redemption of Fund shares. Investing in mutual funds involves market risk, including loss of principal. Performance returns assume the reinvestment of all distributions. Performance returns reflect fee waivers and reimbursements in effect without which returns would have been lower.
Portfolio Summary (as a percentage of net assets)
October 31, 2016 (Unaudited)
| Asset Allocation | ||||
Common Stocks | 90.4% | |||
Preferred Stocks | 7.8% | |||
Short-Term Investment | 1.3% | |||
Other assets in excess of liabilities | 0.5% | |||
| 100.0% | ||||
The following table summarizes the composition of the Fund’s portfolio, in Standard & Poor’s Global Industry Classification Standard (GICS) sectors, expressed as a percentage of net assets. The GICS structure consists of 11 sectors, 24 industry groups, 68 industries and 157 sub-industries. As of October 31, 2016, the Fund did not have more than 25% of its assets invested in any industry group.
| Top Sectors | ||||
Consumer Staples | 15.3% | |||
Health Care | 12.4% | |||
Financials | 12.2% | |||
Industrials | 12.1% | |||
Information Technology | 11.0% | |||
Telecommunication Services | 10.1% | |||
Materials | 7.3% | |||
Energy | 6.5% | |||
Consumer Discretionary | 5.7% | |||
Real Estate | 5.6% | |||
Other | 1.8% | |||
| 100.0% | ||||
Annual Report 2016
12
Aberdeen Select International Equity Fund II (Unaudited) (concluded)
| Top Holdings* | ||||
Roche Holding AG | 3.8% | |||
Novartis AG | 3.7% | |||
Taiwan Semiconductor Manufacturing Co. Ltd. | 3.5% | |||
Shin-Etsu Chemical Co. Ltd. | 3.5% | |||
Japan Tobacco, Inc. | 3.4% | |||
Royal Dutch Shell PLC, B Shares | 3.4% | |||
Nestle SA | 3.3% | |||
Singapore Telecommunications Ltd. | 3.0% | |||
Samsung Electronics Co. Ltd., Preferred Shares | 3.0% | |||
AIA Group Ltd. | 2.9% | |||
Other | 66.5% | |||
| 100.0% | ||||
| * | For the purpose of listing top holdings, Short-Term Investments are included as part of Other. |
| Top Countries | ||||
United Kingdom | 22.4% | |||
Japan | 14.1% | |||
Switzerland | 10.8% | |||
Hong Kong | 9.1% | |||
Germany | 7.8% | |||
Singapore | 6.1% | |||
Taiwan | 3.5% | |||
Canada | 3.1% | |||
Republic of South Korea | 3.0% | |||
Israel | 2.9% | |||
Other | 17.2% | |||
| 100.0% | ||||
2016 Annual Report
13
Statement of Investments
October 31, 2016
Aberdeen Select International Equity Fund II
| Shares or Principal Amount | Value | |||||||
COMMON STOCKS (90.4%) | ||||||||
AUSTRALIA (1.0%) | ||||||||
Health Care (1.0%) | ||||||||
CSL Ltd. (a) | 13,200 | $ | 1,007,233 | |||||
CANADA (3.1%) | ||||||||
Materials (1.4%) | ||||||||
Potash Corp. of Saskatchewan, Inc. | 91,300 | 1,484,570 | ||||||
Telecommunication Services (1.7%) | ||||||||
TELUS Corp. | 52,800 | 1,709,613 | ||||||
| 3,194,183 | ||||||||
FRANCE (1.5%) | ||||||||
Consumer Staples (1.5%) | ||||||||
L’Oreal SA (a) | 8,500 | 1,522,853 | ||||||
GERMANY (5.4%) | ||||||||
Health Care (3.9%) | ||||||||
Bayer AG (a) | 14,600 | 1,449,628 | ||||||
Fresenius Medical Care AG & Co. KGaA (a) | 31,300 | 2,549,514 | ||||||
| 3,999,142 | ||||||||
Materials (1.5%) | ||||||||
Linde AG (a) | 9,700 | 1,602,116 | ||||||
| 5,601,258 | ||||||||
HONG KONG (9.1%) | ||||||||
Consumer Discretionary (1.5%) | ||||||||
Samsonite International SA (a) | 497,700 | 1,561,592 | ||||||
Financials (2.9%) | ||||||||
AIA Group Ltd. (a) | 478,200 | 3,008,357 | ||||||
Industrials (3.7%) | ||||||||
Jardine Matheson Holdings Ltd. | 44,700 | 2,722,677 | ||||||
MTR Corp. Ltd. (a) | 196,000 | 1,084,679 | ||||||
| 3,807,356 | ||||||||
Real Estate (1.0%) | ||||||||
Swire Pacific Ltd., Class A (a) | 98,500 | 1,023,795 | ||||||
| 9,401,100 | ||||||||
ISRAEL (2.9%) | ||||||||
Information Technology (2.9%) | ||||||||
Check Point Software Technologies Ltd. (b) | 35,400 | 2,993,424 | ||||||
ITALY (1.6%) | ||||||||
Energy (1.6%) | ||||||||
Tenaris SA, ADR | 58,700 | 1,655,340 | ||||||
JAPAN (14.1%) | ||||||||
Consumer Discretionary (1.8%) | ||||||||
Shimano, Inc. (a) | 11,000 | 1,880,776 | ||||||
Consumer Staples (3.4%) | ||||||||
Japan Tobacco, Inc. (a) | 92,900 | 3,532,069 | ||||||
Industrials (1.7%) | ||||||||
FANUC Corp. (a) | 9,600 | 1,757,639 | ||||||
Information Technology (1.6%) | ||||||||
Keyence Corp. (a) | 2,200 | 1,612,801 | ||||||
Materials (3.5%) | ||||||||
Shin-Etsu Chemical Co. Ltd. (a) | 47,500 | 3,601,514 | ||||||
Real Estate (2.1%) | ||||||||
Daito Trust Construction Co. Ltd. (a) | 13,200 | 2,212,039 | ||||||
| 14,596,838 | ||||||||
MEXICO (2.7%) | ||||||||
Consumer Staples (2.7%) | ||||||||
Fomento Economico Mexicano SAB de CV, ADR | 29,000 | 2,774,430 | ||||||
PHILIPPINES (1.0%) | ||||||||
Real Estate (1.0%) | ||||||||
Ayala Land, Inc. (a) | 1,449,400 | 1,084,140 | ||||||
SINGAPORE (6.1%) | ||||||||
Financials (1.6%) | ||||||||
Oversea-Chinese Banking Corp. Ltd. (a) | 270,062 | 1,645,254 | ||||||
Real Estate (1.5%) | ||||||||
City Developments Ltd. (a) | 245,100 | 1,492,348 | ||||||
Telecommunication Services (3.0%) | ||||||||
Singapore Telecommunications Ltd. (a) | 1,122,700 | 3,128,882 | ||||||
| 6,266,484 | ||||||||
SOUTH AFRICA (1.4%) | ||||||||
Telecommunication Services (1.4%) | ||||||||
MTN Group Ltd. (a) | 170,400 | 1,471,802 | ||||||
SWEDEN (2.1%) | ||||||||
Industrials (2.1%) | ||||||||
Atlas Copco AB, A Shares (a) | 72,500 | 2,123,893 | ||||||
SWITZERLAND (10.8%) | ||||||||
Consumer Staples (3.3%) | ||||||||
Nestle SA (a) | 47,500 | 3,444,409 | ||||||
Health Care (7.5%) | ||||||||
Novartis AG (a) | 54,300 | 3,853,540 | ||||||
Roche Holding AG (a) | 17,100 | 3,927,554 | ||||||
| 7,781,094 | ||||||||
| 11,225,503 | ||||||||
TAIWAN (3.5%) | ||||||||
Information Technology (3.5%) | ||||||||
Taiwan Semiconductor Manufacturing Co. Ltd. (a) | 612,000 | 3,672,827 | ||||||
THAILAND (1.7%) | ||||||||
Financials (1.7%) | ||||||||
Kasikornbank PCL (a) | 358,700 | 1,761,165 | ||||||
See accompanying Notes to Financial Statements.
Annual Report 2016
14
Statement of Investments (concluded)
October 31, 2016
Aberdeen Select International Equity Fund II
| Shares or Principal Amount | Value | |||||||
UNITED KINGDOM (22.4%) | ||||||||
Consumer Discretionary (2.4%) | ||||||||
Whitbread PLC (a) | 56,111 | $ | 2,478,717 | |||||
Consumer Staples (2.0%) | ||||||||
British American Tobacco PLC (a) | 36,900 | 2,114,847 | ||||||
Energy (4.9%) | ||||||||
John Wood Group PLC (a) | 169,800 | 1,595,979 | ||||||
Royal Dutch Shell PLC, B Shares (a) | 134,700 | 3,474,250 | ||||||
| 5,070,229 | ||||||||
Financials (3.6%) | ||||||||
Prudential PLC (a) | 125,400 | 2,046,386 | ||||||
Standard Chartered PLC (a)(b) | 199,600 | 1,735,704 | ||||||
| 3,782,090 | ||||||||
Industrials (4.6%) | ||||||||
Experian PLC (a) | 106,600 | 2,049,336 | ||||||
Rolls-Royce Holdings PLC (a)(b) | 176,600 | 1,567,610 | ||||||
Rolls-Royce Holdings PLC, C Shares (b) | 8,123,600 | 9,943 | ||||||
Weir Group PLC (The) (a) | 52,600 | 1,092,649 | ||||||
| 4,719,538 | ||||||||
Materials (0.9%) | ||||||||
BHP Billiton PLC (a) | 62,600 | 941,320 | ||||||
Telecommunication Services (4.0%) | ||||||||
Inmarsat PLC (a) | 184,500 | 1,582,651 | ||||||
Vodafone Group PLC (a) | 931,800 | 2,559,025 | ||||||
| 4,141,676 | ||||||||
| 23,248,417 | ||||||||
Total Common Stocks | 93,600,890 | |||||||
PREFERRED STOCKS (7.8%) | ||||||||
BRAZIL (2.4%) | ||||||||
Financials (2.4%) | ||||||||
Banco Bradesco SA, ADR, Preferred Shares | 238,250 | 2,480,182 | ||||||
GERMANY (2.4%) | ||||||||
Consumer Staples (2.4%) | ||||||||
Henkel AG & Co. KGaA, Preferred Shares (a) | 19,800 | 2,544,907 | ||||||
REPUBLIC OF SOUTH KOREA (3.0%) | ||||||||
Information Technology (3.0%) | ||||||||
Samsung Electronics Co. Ltd., Preferred Shares (a) | 2,700 | 3,104,378 | ||||||
Total Preferred Stocks | 8,129,467 | |||||||
SHORT-TERM INVESTMENT (1.3%) | ||||||||
UNITED STATES (1.3%) | ||||||||
State Street Institutional U.S. Government Money Market Fund (c) | $ | 1,334,756 | $ | 1,334,756 | ||||
Total Short-Term Investment | 1,334,756 | |||||||
Total Investments | 103,065,113 | |||||||
Other assets in excess of liabilities—0.5% | 515,069 | |||||||
Net Assets—100.0% | $ | 103,580,182 | ||||||
| (a) | Fair Valued Security. Fair Values are determined pursuant to procedures approved by the Fund’s Board of Trustees. See Note 2(a) of the accompanying Notes to Financial Statements. |
| (b) | Non-income producing security. |
| (c) | Registered investment company advised by State Street Global Advisors. |
| (d) | See accompanying Notes to Financial Statements for tax unrealized appreciation/depreciation of securities. |
| ADR | American Depositary Receipt |
See accompanying Notes to Financial Statements.
2016 Annual Report
15
Aberdeen Total Return Bond Fund (Unaudited)
The Aberdeen Total Return Bond Fund (Institutional Class shares net of fees) returned 5.29% for the 12-month period ended October 31, 2016, versus the 4.37% return of its benchmark, the Bloomberg Barclays U.S. Aggregate Bond Index, for the same period. For broader comparison, the average return of the Fund’s Lipper peer category of Core Bond Funds (consisting of 150 funds) was 4.28% for the period.
The U.S. economy grew by a generally lower-than-expected average annualized rate of 1.5% over the 12-month reporting period despite strong job growth, attributable primarily to low business investment and weakness in net exports. Consumer spending also failed to rebound to the strong levels seen in 2014. Unlike in 2015, when U.S. growth was one of the bright spots globally, the U.S. fell back to fourteenth among the G20 nations,1,2 lagging the UK and the Eurozone among its major market peers. Growth in emerging-market economies bottomed during the period, with the growth gap versus that of developed markets widening after three years of tightening. Global inflation was muted for most of the reporting period, and failed to accelerate meaningfully, even in the U.S. As growth and inflation deviated from consensus expectations, the necessary adjustments during the period by central banks and the market produced significant volatility, particularly given multitudes of political risks.
The U.S. Federal Reserve (Fed) raised interest rates for the first time in seven years in December 2015, while projecting four more hikes in 2016. The resulting concerns about reduced monetary stimuli and subsequent fear of recession in the U.S. and China led to a global deflation scare that dominated markets through the first half of 2016. From November 1, 2015 to its trough in the first quarter of 2016, commodity prices declined sharply with crude oil prices plunging from $52 to near $35 per barrel. Inflation expectations in the U.S., measured by the 10-year Treasury Inflation-Protected Securities (TIPS) breakeven rate,3 fell from 1.58% to 1.20%. Risk assets sold off dramatically while “safe-haven” government bond yields moved significantly lower. Emerging-market assets were particularly hard hit by a sharp rise in the U.S. dollar and precipitous fall in commodity prices.
However, near the end of the first quarter of 2016, market sentiment improved rapidly, as global central banks moved to restore confidence while commodity prices generally bottomed as supply adjusted significantly. Beginning at the end of January 2016, the Bank of Japan lowered its benchmark interest rate into negative territory. In March, the European Central Bank announced plans to expand its bond-buying program to corporate bonds in a bid to improve sovereign bonds’ liquidity, while still expanding its balance sheet. Policymakers in China and many developing countries also implemented monetary and fiscal stimuli in an effort to support economic growth and financial markets. With a backdrop of strong monetary policy accommodation, yields of global developed-market sovereign bonds dropped sharply, driving investors to risk assets in general.
Global markets were hit with a massive shock at the end of June 2016, when voters in the UK unexpectedly approved the referendum to leave the European Union (EU). Stock markets took a brief but dramatic dive, while the sterling plummeted and UK inflation expectations skyrocketed. The Bank of England moved decisively to support credit and boost confidence. Despite the resilient performance of risk assets, questions about the voters’ rebuke to globalization surged in the context of the impending U.S. presidential election in early November 2016.
Subdued inflation and concern over tightening financial conditions both domestically and globally kept the Fed on hold for most of 2016. Communications suggested that the expected terminal rate4 had been lowered, and would be achieved through a very shallow path. This kept U.S. interest rates very low, even as the economy gained steam, including a 2.9% annualized growth rate in the third quarter of 2016. Despite the volatility, risk assets – especially investment-grade corporates and bonds tied to residential or commercial real estate – performed well over the reporting period. Mortgage-backed securities (MBS) modestly lagged the overall market, hampered by high prepayment rates and periods of volatility.
During the reporting period, the Fund derived positive alpha5 from global rate allocation, sector allocation and security selection in the U.S. The Fund’s underweight to U.S. rates in favor of both developed- and emerging-markets rates had a positive impact on performance, as the deflation scare of the first half of 2016 hit harder overseas and elicited aggressive policy responses. Additionally, the Fund’s EU government bond holdings contributed to performance for the reporting period. The Fund’s position in Indonesia was the strongest performer in foreign rates. Political stability, structural reforms, fiscal stimulus and a huge improvement in its balance of payments formed a positive investment backdrop in Indonesia. Benign inflation and high real rates enabled Bank Indonesia to cut its policy rate to close to 200 basis points, resulting in strong performance of Indonesian bonds. Indonesia’s parliament also passed a tax amnesty bill, bolstering the tax base for the government and attracting capital inflows. As a result, the strengthening of the Indonesian rupiah added positively to the Fund’s performance.
Despite additional alpha generated from positions in the Indian rupee and Turkish lira, the Fund’s exposure to the Mexican peso weighed on performance for the reporting period. The peso was hurt by its relatively low yield and crowded positioning by foreign investors, and its decline was accelerated by risks stemming from Donald Trump as the Republican Presidential nominee. Our stop-loss6 order was triggered and we completely hedged out the Fund’s currency position.
| 1 | Source: Bloomberg, November 2016. |
| 2 | The G20 nations include 19 individual countries – Argentina, Australia, Brazil, Canada, China, France, Germany, India, Indonesia, Italy, Japan, South Korea, Mexico, Russia, Saudi Arabia, South Africa, Turkey, the UK and the U.S. – along with the European Union. |
| 3 | The breakeven rate is the difference between the yield on a nominal fixed-rate bond and the real yield on an inflation-linked bond (such as a Treasury Inflation-Protected Security, or TIPS) of similar maturity and credit quality. |
| 4 | The terminal rate is what economists consider the “natural” or neutral interest rate that is consistent with full employment and capacity utilization, and stable prices. |
| 5 | Alpha is a measure of performance that takes the volatility of a mutual fund and compares its risk-adjusted performance to a benchmark index. |
| 6 | Under a stop-loss order, a security is sold when it reaches a certain price. It is designed to limit an investor’s loss on a position in a security. |
Annual Report 2016
16
Aberdeen Total Return Bond Fund (Unaudited) (continued)
Security selection in corporate bonds also benefited Fund performance, as we took advantage of what we believed were attractive valuations in basic materials and energy issues resulting from the plunge in commodities at the start of 2016. Notable contributors to Fund performance included the bonds of Devon Energy and Glencore, which were trading at distressed levels in early 2016. However, aggressive actions by both management teams to shield their balance sheets through equity issuance and asset sales, coupled with recovering prices of oil and metal commodities, resulted in their strong performance in the second half of the reporting period. The Fund’s overweight position in long-duration7 industrial bonds also had a positive impact on performance.
The Fund’s overweight to spread products and TIPS provided sector rotation alpha over the reporting period. Rotation in mortgage-backed securities (MBS) was a notable contributor, as we were able to position the Fund with low exposure to volatility but high sensitivity to credit. In a bid to avoid volatility, we positioned the Fund with an overall underweight to agency MBS, and favored bonds tied to higher interest-rate loans and 15-year loans. We sought to gain exposure to mortgage credit through non-agency MBS and government-sponsored enterprise (GSE)8 credit risk transfer securities, which allow bond investors to share exposure to the government agencies’ high-quality underwriting. We took advantage of the market downturn in the first quarter of 2016 by increasing the Fund’s position in commercial mortgage-backed securities (CMBS) and going down in the capital structure.9
We employed derivatives, including Treasury futures, in an effort to manage the Fund’s overall yield-curve and interest-rate exposure, as well as foreign exchange forwards10 in an effort to gain exposure to foreign markets and to hedge risks from sovereign bond holdings. The performance of the Fund’s currency positions largely offset each other over the reporting period, while our use of futures bolstered the Fund’s performance in global interest-rate allocation and yield-curve positioning. The derivatives positions subtracted 0.63% from Fund performance for the reporting period.
Shortly after the close of the reporting period, Donald Trump won the U.S. presidential election, and the impact on financial markets was significant. With the Republicans due to control both branches of Congress, the market has generally anticipates a massive deficit-financed fiscal package aimed to accelerate U.S. economic growth and inflation. In addition to pledging to reduce regulation, Trump campaigned on infrastructure spending of up to $1 trillion, as well as cuts in corporate and personal income taxes. Other prominent themes of Trump’s campaign, however, were tougher immigration laws and trade restrictions. Nevertheless, it appears that the markets are focusing on the business- and growth-friendly potential of a Trump administration, while significantly discounting the risk to economic growth posed by the possibility of reduced trade and free movement of people to the U.S.
Consequently, U.S. risk assets rallied following the election, while U.S. Treasury yields and the U.S. dollar rose sharply. We believe that potential improvements in revenues and earnings, coupled with reduced new issuance and regulation, can be supportive to investment-grade corporate bonds. Some recurrence of inflation and term premium11 in the U.S. Treasury yield curve are long overdue, in our opinion.
Nevertheless, we feel that the market needs to adjust pricing of a few risks. First, the benefits of a fiscal stimulus package, should one be enacted, are many months away from being felt in the real economy. Trade restrictions, on the other hand, could begin to have a negative impact sooner, particularly if other countries retaliate. In our view, economic nationalism in the U.S. would be a strong headwind to global growth, and most publicly traded U.S. companies are multinationals that derive substantial revenues from international trade. Secondly, we think that the Fed could start to pivot in its monetary policy accommodation due to expected or realized inflation pressure, where the consequential effects on asset prices are neither clear nor tested. It appears that the market has priced in only two Fed interest-rate hikes from December 2016 through the 2017 calendar year, which we feel could prove to be an underestimation. Finally, we believe that Trump’s win, similar to Brexit,12 showcased threats to established political and economic order. Upcoming political events, particularly in Europe, may potentially cause instability in growth and in the banking system. Therefore, we may look to gradually shift or increase the Fund’s exposure to interest rates as protection against excessive optimism. We have been reducing the Fund’s overweight to corporate bonds into the rally in credit spreads as we believe that deterioration in the credit matrix will likely prevent them from reaching historically tight levels. We remain cautious on agency MBS as we expect higher market volatility going forward, and a faster-moving Fed could end its quantitative easing reinvestment. We retain our preference for residential MBS. We intend to be more selective regarding when and where to allocate to emerging-market assets, by considering prospects for growth, structural balances and policy, as well as valuations relative to the availability of financing.
| 7 | Duration is an estimate of bond price sensitivity to changes in interest rates. The higher the duration, the greater the change (i.e., higher risk) in relation to interest-rate movements. |
| 8 | Government-sponsored enterprise (GSE) credit risk transfer securities are general obligations of the U.S. Federal National Mortgage Association (Fannie Mae) and the U.S. Federal Home Loan Mortgage Corporation (Freddie Mac). The securities shift credit risk on a pool of loans to reinsurers and reduce taxpayers’ risk by increasing the role of private capital in the mortgage market. |
| 9 | CMBS capital structure comprises several tranches. Each tranche is one part of a deal or structured financing comprising several related securities that are offered at the same time but have different risks, rewards and/or maturities. |
| 10 | A foreign exchange forward is a binding contract in the foreign exchange market that locks in the exchange rate for the purchase or sale of a currency on a future date. |
| 11 | Term premium is the excess yield that investors require to hold a long-term bond instead of several shorter-term bonds. |
| 12 | “Brexit” is an abbreviation of “British exit,” which refers to the June 23, 2016 referendum by British voters to exit the European Union. |
2016 Annual Report
17
Aberdeen Total Return Bond Fund (Unaudited) (concluded)
Portfolio Management:
Aberdeen North American Fixed Income Team
PAST PERFORMANCE DOES NOT GUARANTEE FUTURE RESULTS.
The performance quoted represents past performance, which does not guarantee future results. Class A shares have up to a 0.25% 12b-1 fee. The investment return and principal value of an investment will fluctuate so that an investor’s shares, when redeemed, may be worth more or less than their original cost. Current performance of the Fund may be lower or higher than the performance quoted. Performance data current to the most recent month-end may be obtained by calling 866-667-9231 or visiting www.aberdeen-asset.us.
Investing in mutual funds involves risk, including possible loss of principal. There is no assurance that the investment objective of any fund will be achieved. Indexes are unmanaged and have been provided for comparison purposes only. No fees or expenses are reflected. You cannot invest directly in an index.
Lipper is a leading global provider of mutual fund information and analysis to fund companies, financial intermediaries and media organizations.
Risk Considerations
Fixed income securities are subject to certain risks including, but not limited to: interest rate (changes in interest rates may cause a decline in the market value of an investment), credit (changes in the financial condition of the issuer, borrower, counterparty, or underlying collateral), prepayment (debt issuers may repay or refinance their loans or obligations earlier than anticipated), and extension (principal repayments may not occur as quickly as anticipated, causing the expected maturity of a security to increase).
Investments in asset-backed and mortgage-backed securities include additional risks that investors should be aware which include those associated with fixed income securities, as well as increased susceptibility to adverse economic developments.
Derivatives are speculative and may hurt the Fund’s performance. They present the risk of disproportionately increased losses and/or reduced gains when the financial asset or measure to which the derivative is linked changes in unexpected ways.
Foreign securities may be more volatile, harder to price and less liquid than U.S. securities. They are subject to different accounting and regulatory standards and currency exchange rate, political and economic risks. Fluctuation in currency exchange rates may impact a Fund’s returns more greatly to the extent a Fund does not hedge currency exposure or hedging techniques are unsuccessful. The foregoing risks are enhanced in emerging market countries.
Municipal securities can be affected by adverse tax, legislative or political changes and the financial condition of the issuers of municipal securities.
Investing a significant portion of the Fund’s assets in securities of companies conducting business in a broadly related group of industries within an economic sector may make the Fund more vulnerable to unfavorable developments in that sector.
Please read the prospectus for more detailed information regarding these and other risks.
Annual Report 2016
18
Aberdeen Total Return Bond Fund (Unaudited)
| Average Annual Total Return (For periods ended October 31, 2016) | 1 Yr. | 5 Yr. | 10 Yr. | |||||||
Class A | 5.02% | 2.90% | 4.79% | |||||||
Institutional Class | 5.29% | 3.16% | 5.06% | |||||||
2016 Annual Report
19
Aberdeen Total Return Bond Fund (Unaudited)
Performance of a $10,000 Investment (as of October 31, 2016)
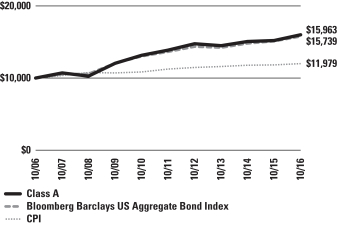
Comparative performance of $10,000 invested in Class A shares of the Aberdeen Total Return Bond Fund, Bloomberg Barclays U.S. Aggregate Bond Index and the Consumer Price Index (CPI) over a 10-year period ended October 31, 2016. Unlike the Fund’s returns, the returns for these unmanaged indexes do not reflect any fees or expenses. Investors cannot invest directly in market indexes.
The Bloomberg Barclays U.S. Aggregate Bond Index is a broad-based flagship benchmark that measures the investment grade, U.S. Dollar-denominated, fixed-rate taxable bond market. The index includes Treasuries, government-related and corporate securities, MBS (agency fixed-rate and hybrid ARM pass-throughs), ABS and CMBS (agency and non-agency). Provided the necessary inclusion rules are met, U.S. Aggregate eligible securities also contribute to the multi-currency Global Aggregate Index and the U.S. Universal Index, which includes high yield and emerging markets debt.
The CPI is a measure of the average change over time in the prices paid by urban consumers for a market basket of consumer goods and services.
Investment return and principal value will fluctuate, and when redeemed, shares may be worth more or less than original cost. Past performance is no guarantee of future results. The Average Annual Total Return table and performance graph do not reflect the deduction of taxes that a shareholder would pay on Fund distributions or the redemption of Fund shares. Investing in mutual funds involves market risk, including loss of principal. Performance returns assume the reinvestment of all distributions. Performance returns reflect fee waivers and reimbursements in effect without which returns would have been lower.
Portfolio Summary (as a percentage of net assets)
October 31, 2016 (Unaudited)
| Asset Allocation | ||||
Corporate Bonds | 29.6% | |||
U.S. Agencies | 13.3% | |||
Non-Agency Mortgage-Backed Securities | 11.2% | |||
Asset-Backed Securities | 10.7% | |||
U.S. Treasuries | 8.8% | |||
Commercial Mortgage-Backed Securities | 8.6% | |||
Government Bonds | 8.2% | |||
Municipal Bonds | 5.6% | |||
Short-Term Investment | 3.3% | |||
Agency Mortgage-Backed Securities | 2.4% | |||
Liabilities in excess of other assets | (1.7)% | |||
| 100.0% | ||||
The following chart summarizes the composition of the Fund’s portfolio, expressed as a percentage of net assets. The industries listed below may include more than one industry group. As of October 31, 2016, the Fund did not have more than 25% of its assets invested in any industry group.
| Top Industries | ||||
Commercial Banks | 8.8% | |||
Oil, Gas & Consumable Fuels | 3.2% | |||
Electric Utilities | 2.4% | |||
Media | 1.4% | |||
Software | 1.3% | |||
Computers & Peripherals | 1.1% | |||
Energy Equipment & Services | 1.1% | |||
Banks | 0.9% | |||
Aerospace & Defense | 0.9% | |||
Miscellaneous Manufacturing | 0.8% | |||
Other | 78.1% | |||
| 100.0% | ||||
Annual Report 2016
20
Aberdeen Total Return Bond Fund (Unaudited) (concluded)
| Top Holdings* | ||||
U.S. Treasury Bond 05/15/2046 | 2.1% | |||
U.S. Treasury Notes 08/15/2026 | 2.1% | |||
Canadian Government Bond 03/01/2021 | 2.0% | |||
New Zealand Government Bond 03/15/2019 | 1.3% | |||
Indonesia Treasury Bond, Series FR73 05/15/2031 | 1.1% | |||
Indonesia Treasury Bond, Series FR56 09/15/2026 | 1.1% | |||
DNB Bank ASA 04/03/2017 | 1.0% | |||
U.S. Treasury Notes 09/30/2023 | 0.9% | |||
Los Angeles Unified School District General Obligation Unlimited Bonds 07/01/2034 | 0.9% | |||
State of California General Obligation Unlimited Bonds 04/01/2039 | 0.8% | |||
Other | 86.7% | |||
| 100.0% | ||||
| * | For the purpose of listing top holdings, Short-Term Investments are included as part of Other. |
| Top Countries | ||||
United States | 83.4% | |||
Canada | 2.6% | |||
New Zealand | 2.5% | |||
Australia | 2.2% | |||
Indonesia | 2.2% | |||
Sweden | 2.0% | |||
Netherlands | 1.6% | |||
Norway | 1.0% | |||
Supranational | 0.9% | |||
Panama | 0.8% | |||
Other | 0.8% | |||
| 100.0% | ||||
2016 Annual Report
21
Statement of Investments
October 31, 2016
Aberdeen Total Return Bond Fund
| Shares or Principal Amount | Value (US$) | |||||||
ASSET-BACKED SECURITIES (10.7%) | ||||||||
UNITED STATES (10.7%) | ||||||||
Ally Auto Receivables Trust, Series 2016-2, Class A3 (USD), 1.35%, 05/15/2020 | $ | 2,001,000 | $ | 2,006,660 | ||||
Ally Master Owner Trust, Series 2014-5, | 2,167,000 | 2,174,511 | ||||||
Avis Budget Rental Car Funding AESOP LLC | ||||||||
Series 2013-2A, Class A, (USD), 2.97%, 02/20/2020 (a) | 1,458,000 | 1,487,237 | ||||||
Series 2015-2A, Class A (USD), 2.63%, 12/20/2021 (a) | 1,490,000 | 1,503,924 | ||||||
BMW Vehicle Lease Trust | ||||||||
Series 2015-2, Class A3 (USD), 1.40%, 09/20/2018 | 2,080,000 | 2,083,372 | ||||||
Series 2016-2, Class A3, (USD), 1.43%, 09/20/2019 | 1,118,000 | 1,117,777 | ||||||
Chase Issuance Trust | ||||||||
Series 2007-B1, Class B1, (USD), 0.78%, 04/15/2019 (b) | 3,640,000 | 3,638,606 | ||||||
Series 2007-C1, Class C1, (USD), 0.99%, 04/15/2019 (b) | 2,960,000 | 2,959,393 | ||||||
Series 2015-A5, Class A5, (USD), 1.36%, 04/15/2020 | 2,483,000 | 2,490,172 | ||||||
Series 2016-A5, Class A5, (USD), 1.27%, 07/15/2021 | 2,036,000 | 2,033,218 | ||||||
Chesapeake Funding LLC, Series 2013-1A, Class A (USD), 0.98%, 01/07/2025 (a)(b) | 515,739 | 515,696 | ||||||
Citibank Credit Card Issuance Trust, | 2,334,000 | 2,456,438 | ||||||
Discover Card Execution Note Trust, | 2,615,000 | 2,616,894 | ||||||
Ford Credit Floorplan Master Owner Trust, | 2,090,000 | 2,102,076 | ||||||
Ford Credit Floorplan Master Owner Trust A, Series 2012-5, Class A, (USD), 1.49%, 09/15/2019 | 2,300,000 | 2,306,688 | ||||||
GE Dealer Floorplan Master Note Trust, | 2,240,000 | 2,241,708 | ||||||
GM Financial Automobile Leasing Trust | ||||||||
Series 2014-2A, Class A3 (USD), 1.22%, 01/22/2018 (a) | 1,329,905 | 1,330,633 | ||||||
Series 2015-2, Class A2B (USD), | 1,856,532 | 1,856,332 | ||||||
Series 2016-3, Class A3, (USD), 1.61%, 12/20/2019 | 1,221,000 | 1,229,111 | ||||||
Honda Auto Receivables Owner Trust | ||||||||
Series 2014-1, Class A3 (USD), 0.67%, 11/21/2017 | 731,526 | 731,289 | ||||||
Series 2016-3, Class A2, (USD), 1.01%, 10/18/2018 | 2,030,000 | 2,029,734 | ||||||
Series 2016-4, Class A2, (USD), 1.04%, 04/18/2019 | 2,977,000 | 2,976,414 | ||||||
Mercedes-Benz Auto Lease Trust, | 837,000 | 836,719 | ||||||
Mercedes-Benz Auto Receivables Trust, | 1,618,227 | 1,618,729 | ||||||
Navistar Financial Dealer Note Master Trust II, Series 2015-1, Class A (USD), 1.93%, 06/25/2020 (a)(b) | 1,990,000 | 1,991,166 | ||||||
Nissan Auto Receivables Owner Trust, | 10,565 | 10,564 | ||||||
SLM Student Loan Trust | ||||||||
Series 2011-1, Class A1 (USD), 1.05%, 03/25/2026 (b) | 520,543 | 520,373 | ||||||
Series 2011-2, Class A1 (USD), 1.13%, 11/25/2027 (b) | 1,045,193 | 1,044,555 | ||||||
Series 2013-2, Class A (USD), 0.98%, 06/25/2043 (b) | 676,091 | 664,094 | ||||||
Synchrony Credit Card Master Note Trust, | 1,728,000 | 1,749,219 | ||||||
Toyota Auto Receivables Owner Trust, | 1,867,000 | 1,867,243 | ||||||
United States Small Business Administration, Series 2007-P10A, Class 1 (USD), 5.46%, 02/10/2017 | 153,992 | 156,246 | ||||||
Volkswagen Auto Loan Enhanced Trust, | 712,733 | 711,516 | ||||||
Volvo Financial Equipment LLC, | 730,000 | 734,779 | ||||||
| 55,793,086 | ||||||||
Total Asset-Backed Securities | 55,793,086 | |||||||
COMMERCIAL MORTGAGE-BACKED SECURITIES (8.6%) |
| |||||||
UNITED STATES (8.6%) | ||||||||
Banc of America Commercial Mortgage Trust, Series 2006-5, Class AM (USD), 5.45%, 09/10/2047 | 1,409,064 | 1,408,046 | ||||||
Barclays Commercial Mortgage Securities Trust, Series 2015-SLP, Class B (USD), 2.13%, 02/15/2028 (a)(b) | 1,840,000 | 1,829,301 | ||||||
Bear Stearns Commercial Mortgage Securities Trust, Series 2007-PW17, Class AM (USD), 1.22%, 06/11/2050 (a)(b) | 2,494,750 | 2,460,467 | ||||||
CD Commercial Mortgage Trust, Series 2007-CD4, Class A4 (USD), 5.32%, 12/11/2049 | 730,248 | 732,722 | ||||||
CGRBS Commercial Motgage Trust, Series 2013-VN05, Class B (USD), 3.58%, 03/13/2035 (a)(b) | 1,760,000 | 1,839,728 | ||||||
Citigroup Commercial Mortgage Trust, Series 2007-C6, Class AM (USD), 5.71%, 12/10/2049 (b) | 1,580,000 | 1,603,224 | ||||||
COMM 2014-TWC Mortgage Trust, Series 2014-TWC, Class B (USD), 2.13%, 02/13/2032 (a)(b) | 1,580,000 | 1,577,617 | ||||||
See accompanying Notes to Financial Statements.
Annual Report 2016
22
Statement of Investments (continued)
October 31, 2016
Aberdeen Total Return Bond Fund
| Shares or Principal Amount | Value (US$) | |||||||
COMM 2015-DC1 Mortgage Trust, Series 2015-DC1, Class ASB (USD), 3.14%, 02/10/2048 | $ | 1,540,000 | $ | 1,610,980 | ||||
Commercial Mortgage Trust, Series 2007-GG11, Class A4 (USD), 5.74%, 12/10/2049 | 2,010,559 | 2,056,663 | ||||||
FDIC Guaranteed Notes Trust, Series 2010-C1, Class A (USD), 2.98%, 12/06/2020 (a) | 1,572,122 | 1,589,347 | ||||||
FREMF Mortgage Trust | ||||||||
Series 2011-K704, Class B (USD), 4.54%, 10/25/2030 (a)(b) | 1,770,000 | 1,848,686 | ||||||
Series 2011-K703, Class B (USD), 4.88%, 07/25/2044 (a)(b) | 1,810,000 | 1,888,480 | ||||||
Series 2012-K23, Class C, (USD), 3.66%, 10/25/2045 (a)(b) | 721,000 | 721,847 | ||||||
Series 2013-K29, Class B (USD), 3.48%, 05/25/2046 (a)(b) | 1,020,000 | 1,058,232 | ||||||
Series 2013-K32, Class B, (USD), 3.54%, 10/25/2046 (a)(b) | 2,187,181 | 2,275,504 | ||||||
GS Mortgage Securites Corp. Trust, Series 2012-SHOP, Class A (USD), 2.93%, 06/05/2031 (a) | 2,650,000 | 2,717,022 | ||||||
GSCCRE Commercial Mortgage Trust, Series 2015-HULA, Class B (USD), 2.83%, 08/15/2032 (a)(b) | 2,250,000 | 2,240,644 | ||||||
JP Morgan Chase Commercial Mortgage Securities Trust | ||||||||
Series 2014-INN, Class A (USD), 1.46%, 06/15/2029 (a)(b) | 2,250,000 | 2,246,556 | ||||||
Series 2015-UES, Class C (USD), 3.62%, 09/05/2032 (a)(b) | 2,025,000 | 2,097,499 | ||||||
Morgan Stanley Capital Barclays Bank Trust, Series 2016-MART, Class A, (USD), 2.20%, 09/13/2031 (a) | 2,406,000 | 2,405,161 | ||||||
Morgan Stanley Capital I Trust | ||||||||
Series 2006-IQ12, Class AM (USD), 5.37%, 12/15/2043 | 1,250,000 | 1,249,425 | ||||||
Series 2007-IQ16, Class A4 (USD), 5.81%, 12/12/2049 | 2,124,435 | 2,175,558 | ||||||
SFAVE Commercial Mortgage Securities Trust | ||||||||
Series 2015-5AVE, Class B (USD), 4.39%, 01/05/2043 (a)(b) | 1,010,000 | 979,951 | ||||||
Series 2015-5AVE, Class C (USD), 4.39%, 01/05/2043 (a)(b) | 1,500,000 | 1,397,740 | ||||||
Wachovia Bank Commercial Mortgage Trust, Series 2006-C28, Class AM (USD), 5.60%, 10/15/2048 (b) | 477,195 | 476,641 | ||||||
Wells Fargo Commercial Mortgage Trust | ||||||||
Series 2015-C29, Class ASB (USD), 3.40%, 06/15/2048 | 930,000 | 985,540 | ||||||
Series 2015-LC22, Class ASB (USD), 3.57%, 09/15/2058 | 1,060,000 | 1,129,630 | ||||||
| 44,602,211 | ||||||||
Total Commercial Mortgage-Backed Securities |
| 44,602,211 | ||||||
NON-AGENCY MORTGAGE-BACKED SECURITIES (11.2%) |
| |||||||
UNITED STATES (11.2%) | ||||||||
Agate Bay Mortgage Trust, Series 2016-3, Class A5, CMO, (USD), 3.50%, 08/25/2046 (a)(b) | 1,882,312 | 1,947,675 | ||||||
Alternative Loan Trust | ||||||||
Series 2004-28CB, Class 3A1 (USD), 6.00%, 01/25/2035 | 1,442,547 | 1,421,500 | ||||||
Series 2005-86CB, Class A8 (USD), 5.50%, 02/25/2036 | 1,188,698 | 1,074,763 | ||||||
Banc of America Mortgage Trust, | 470,103 | 487,092 | ||||||
Bear Stearns Adjustable Rate Mortgage Trust, Series 2004-3, Class 4A (USD), 3.28%, 07/25/2034 (b) | 776,682 | 763,964 | ||||||
CHL Mortgage Pass-Through Trust, Series 2005-21, Class A2 (USD), 5.50%, 10/25/2035 | 611,825 | 599,777 | ||||||
Citigroup Mortgage Loan Trust | ||||||||
Series 2005-11, Class A3 (USD), 2.99%, 11/25/2035 (b) | 1,271,122 | 1,216,419 | ||||||
Series 2014-A, Class A (USD), 4.00%, 01/25/2035 (a)(b) | 620,573 | 647,907 | ||||||
Series 2014-J1, Class A1 (USD), 3.50%, 06/25/2044 (a)(b) | 1,462,044 | 1,500,521 | ||||||
Series 2015-PS1, Class A1 (USD), 3.75%, 09/25/2042 (a)(b) | 1,012,711 | 1,049,687 | ||||||
Credit Suisse Mortgage Capital Trust | ||||||||
Series 2013-6, Class2A1 (USD), 3.50%, 08/25/2043 (a)(b) | 1,109,220 | 1,131,750 | ||||||
Series 2013-7, Class A11 (USD), 3.50%, 08/25/2043 (a)(b) | 1,454,612 | 1,479,903 | ||||||
Credit Suisse Mortgage Trust | ||||||||
Series 2013-7, Class A2 (USD), 3.00%, 08/25/2043 (a)(b) | 947,322 | 931,953 | ||||||
Series 2015-WIN1, Class A6 (USD), 3.50%, 12/25/2044 (a)(b) | 1,202,458 | 1,241,797 | ||||||
EverBank Mortgage Loan Trust, Series 2013-2, Class A (USD), 3.00%, 06/25/2043 (a)(b) | 1,076,182 | 1,090,882 | ||||||
Federal Home Loan Mortgage Corp., Series 2015-HQA1, Class M2, CMO (USD), 3.18%, 03/25/2028 (b) | 1,840,000 | 1,872,805 | ||||||
GSR Mortgage Loan Trust, Series 2005-6F, Class 1A6 (USD), 5.25%, 07/25/2035 | 1,431,524 | 1,511,061 | ||||||
IndyMac INDA Mortgage Loan Trust | ||||||||
Series 2005-AR2, Class 3A1 (USD), 3.08%, 01/25/2036 (b) | 1,162,787 | 1,040,506 | ||||||
Series 2006-AR1, Class A1 (USD), 3.18%, 08/25/2036 (b) | 314,688 | 301,231 | ||||||
JP Morgan Mortgage Trust | ||||||||
Series 15-6, Class A13 (USD), 3.50%, 10/25/2045 (a)(b) | 2,146,719 | 2,179,214 | ||||||
Series 16-1, Class A13 (USD), 3.50%, 05/25/2046 (a) | 2,095,249 | 2,152,010 | ||||||
Series 2005-A4, Class 3A1 (USD), 2.81%, 07/25/2035 (b) | 1,310,370 | 1,297,520 | ||||||
Series 2005-A5, Class 2A2 (USD), 3.24%, 08/25/2035 (b) | 1,092,938 | 1,099,734 | ||||||
Series 2006-S1, Class 2A6 (USD), 6.00%, 04/25/2036 | 985,883 | 1,038,411 | ||||||
Series 2013-1, Class 1A2 (USD), 3.00%, 03/25/2043 (a)(b) | 1,374,800 | 1,384,601 | ||||||
See accompanying Notes to Financial Statements.
2016 Annual Report
23
Statement of Investments (continued)
October 31, 2016
Aberdeen Total Return Bond Fund
| Shares or Principal Amount | Value (US$) | |||||||
Series 2013-1, Class B1 (USD), 3.52%, 03/25/2043 (a)(b) | $ | 2,808,024 | $ | 2,850,090 | ||||
Series 2014-1, Class 2A2 (USD), 3.50%, 01/25/2044 (a)(b) | 1,895,057 | 1,961,052 | ||||||
Series 2014-IVR3, Class 3A1 (USD), 2.94%, 09/25/2044 (a)(b) | 1,315,352 | 1,338,201 | ||||||
Series 2014-IVR6, Class AM, CMO (USD), 2.87%, 07/25/2044 (a)(b) | 1,629,216 | 1,625,120 | ||||||
MASTR Adjustable Rate Mortgages Trust, Series 2006-2, Class 4A1 (USD), 2.98%, 02/25/2036 (b) | 572,253 | 528,664 | ||||||
Merrill Lynch Mortgage Investors Trust | ||||||||
Series 2007-2, Class 2A1 (USD), 3.06%, 06/25/2037 (b) | 1,240,834 | 1,201,069 | ||||||
Series 2007-3, Class 2A2 (USD), 3.20%, 09/25/2037 (b) | 1,191,201 | 1,167,730 | ||||||
NCUA Guaranteed Notes Trust | ||||||||
Series 2010-R2, Class 1A (USD), 0.90%, 11/06/2017 (b) | 1,145,295 | 1,145,589 | ||||||
Series 2010-R3, Class 1A (USD), 1.09%, 12/08/2020 (b) | 2,251,762 | 2,255,850 | ||||||
New Residential Mortgage Loan Trust | ||||||||
Series 2014-1A, Class A (USD), 3.75%, 01/25/2054 (a)(b) | 927,682 | 966,432 | ||||||
Series 2014-2A, Class A3 (USD), 3.75%, 05/25/2054 (a)(b) | 1,094,568 | 1,139,290 | ||||||
PHH Mortgage Trust, Series 2008-CIM1, Class 21A1 (USD), 6.00%, 05/25/2038 | 1,327,164 | 1,385,372 | ||||||
Sequoia Mortgage Trust | ||||||||
Series 2013-4, Class A2 (USD), 2.50%, 04/25/2043 (b) | 1,035,100 | 1,027,422 | ||||||
Series 2013-5, Class A1 (USD), 2.50%, 05/25/2043 (a)(b) | 1,191,585 | 1,200,375 | ||||||
Series 2013-6, Class A1 (USD), 2.50%, 05/25/2043 (b) | 1,395,730 | 1,392,249 | ||||||
Structured Asset Securities Corp., Series 2004-18H, Class A5 (USD), 4.75%, 10/25/2034 | 2,829,405 | 2,846,842 | ||||||
Thornburg Mortgage Securities Trust | ||||||||
Series 2007-4, Class 2A1 (USD), 2.85%, 09/25/2037 (b) | 1,248,904 | 1,230,818 | ||||||
Series 2007-4, Class 3A1 (USD), 5.99%, 09/25/2037 (b) | 130,470 | 132,792 | ||||||
WaMu Mortgage Pass Through Certificates, Series 2005-AR7, Class A3 (USD), 2.76%, 08/25/2035 (b) | 1,331,353 | 1,333,544 | ||||||
Wells Fargo Mortgage Backed Securities Trust | ||||||||
Series 2006-10, Class A4 (USD), 6.00%, 08/25/2036 | 853,008 | 852,550 | ||||||
Series 2006-19, Class A4 (USD), 5.25%, 12/26/2036 | 255,065 | 255,177 | ||||||
| 58,298,911 | ||||||||
Total Non-Agency Mortgage-Backed Securities |
| 58,298,911 | ||||||
CORPORATE BONDS (29.6%) | ||||||||
AUSTRALIA (0.8%) | ||||||||
Commercial Banks (0.8%) | ||||||||
KfW (AUD), 6.00%, 08/20/2020 (c) | 3,000,000 | 2,584,797 | ||||||
National Australia Bank Ltd. (USD), 1.25%, 03/08/2018 (a) | 1,363,000 | 1,362,557 | ||||||
| 3,947,354 | ||||||||
CANADA (0.6%) | ||||||||
Commercial Banks (0.4%) | ||||||||
National Bank of Canada (USD), 1.45%, 11/07/2017 | 2,110,000 | 2,111,471 | ||||||
Oil, Gas & Consumable Fuels (0.2%) | ||||||||
Canadian Natural Resources Ltd. (USD), 5.85%, 02/01/2035 | 1,039,000 | 1,116,075 | ||||||
| 3,227,546 | ||||||||
CHILE (0.3%) | ||||||||
Electric Utilities (0.3%) | ||||||||
AES Gener SA (USD), 5.25%, 08/15/2021 (a) | 1,372,000 | 1,457,994 | ||||||
FRANCE (0.6%) | ||||||||
Apparel (0.6%) | ||||||||
LVMH Moet Hennessy Louis Vuitton SE (USD), 1.63%, 06/29/2017 (a) | 2,950,000 | 2,955,667 | ||||||
GUERNSEY (0.6%) | ||||||||
Commercial Banks (0.6%) | ||||||||
Credit Suisse Group Funding Guernsey Ltd. (USD), 3.80%, 09/15/2022 | 3,170,000 | 3,226,565 | ||||||
LUXEMBOURG (0.2%) | ||||||||
Miscellaneous Manufacturing (0.2%) | ||||||||
Pentair Finance SA (USD), 3.15%, 09/15/2022 | 1,200,000 | 1,193,477 | ||||||
NETHERLANDS (1.6%) | ||||||||
Commercial Banks (0.9%) | ||||||||
Cooperatieve Centrale Raiffeisen-Boerenleenbank BA (USD), 4.38%, 08/04/2025 | 1,970,000 | 2,078,602 | ||||||
Cooperatieve Rabobank UA (USD), 3.95%, 11/09/2022 | 2,400,000 | 2,519,314 | ||||||
| 4,597,916 | ||||||||
Electric Utilities (0.4%) | ||||||||
Enel Finance International (USD), 6.00%, 10/07/2039 (a) | 1,800,000 | 2,153,452 | ||||||
Pharmaceutical (0.3%) | ||||||||
Teva Pharmaceutical Finance Netherlands III BV (USD), 4.10%, 10/01/2046 | 1,650,000 | 1,538,108 | ||||||
| 8,289,476 | ||||||||
NORWAY (1.0%) | ||||||||
Commercial Banks (1.0%) | ||||||||
DNB Bank ASA (USD), 3.20%, 04/03/2017 (a) | 5,020,000 | 5,062,936 | ||||||
PANAMA (0.8%) | ||||||||
Leisure Time (0.8%) | ||||||||
Carnival Corp. (USD), 3.95%, 10/15/2020 | 3,680,000 | 3,955,374 | ||||||
See accompanying Notes to Financial Statements.
Annual Report 2016
24
Statement of Investments (continued)
October 31, 2016
Aberdeen Total Return Bond Fund
| Shares or Principal Amount | Value (US$) | |||||||
SUPRANATIONAL (0.9%) | ||||||||
Banks (0.9%) | ||||||||
International Bank for Reconstruction & Development | ||||||||
Series GDIF (AUD), 3.50%, 04/29/2019 | $ | 3,040,000 | $ | 2,395,124 | ||||
(NZD), 4.63%, 02/26/2019 | 2,930,000 | 2,193,042 | ||||||
| 4,588,166 | ||||||||
SWEDEN (2.0%) | ||||||||
Commercial Banks (2.0%) | ||||||||
Nordea Bank AB (USD), 3.13%, 03/20/2017 (a) | 4,300,000 | 4,334,478 | ||||||
Skandinaviska Enskilda Banken AB (USD), 2.63%, 03/15/2021 | 3,024,000 | 3,096,609 | ||||||
Svenska Handelsbanken AB (USD), 2.45%, 03/30/2021 | 2,858,000 | 2,910,310 | ||||||
| 10,341,397 | ||||||||
UNITED KINGDOM (0.7%) | ||||||||
Commercial Banks (0.4%) | ||||||||
HSBC Holdings PLC (USD), 6.88%, 06/01/2021 (b)(d) | 2,243,000 | 2,366,365 | ||||||
Oil, Gas & Consumable Fuels (0.3%) | ||||||||
BP Capital Markets PLC (USD), 3.12%, 05/04/2026 | 1,533,000 | 1,553,018 | ||||||
| 3,919,383 | ||||||||
UNITED STATES (19.5%) | ||||||||
Aerospace & Defense (0.9%) | ||||||||
United Technologies Corp. | ||||||||
(USD), 4.15%, 05/15/2045 | 1,650,000 | 1,749,901 | ||||||
(USD), 3.75%, 11/01/2046 | 2,730,000 | 2,715,113 | ||||||
| 4,465,014 | ||||||||
Auto Manufacturers (0.7%) | ||||||||
Ford Motor Credit Co. LLC (USD), 3.10%, 05/04/2023 | 1,631,000 | 1,633,500 | ||||||
General Motors Co. (USD), | 1,520,000 | 1,872,034 | ||||||
| 3,505,534 | ||||||||
Beverages (0.5%) | ||||||||
Anheuser-Busch InBev Finance, Inc. (USD), 4.90%, 02/01/2046 | 2,171,000 | 2,488,678 | ||||||
Biotechnology (0.2%) | ||||||||
Amgen, Inc. (USD), 4.40%, 05/01/2045 | 1,235,000 | 1,260,811 | ||||||
Commercial Banks (2.7%) | ||||||||
Citigroup, Inc. (USD), 4.45%, 09/29/2027 | 2,780,000 | 2,935,391 | ||||||
Goldman Sachs Group, Inc. (The) (USD), 4.25%, 10/21/2025 | 1,710,000 | 1,792,466 | ||||||
JPMorgan Chase & Co. (USD), 4.35%, 08/15/2021 | 3,370,000 | 3,682,581 | ||||||
Morgan Stanley (USD), 4.00%, 07/23/2025 | 2,090,000 | 2,231,167 | ||||||
Wells Fargo & Co. (USD), 4.10%, 06/03/2026 | 3,460,000 | 3,639,505 | ||||||
| 14,281,110 | ||||||||
Computers & Peripherals (1.1%) | ||||||||
Apple, Inc. | ||||||||
(USD), 4.65%, 02/23/2046 | 3,403,000 | 3,759,862 | ||||||
(USD), 3.85%, 08/04/2046 | 2,000,000 | 1,952,678 | ||||||
| 5,712,540 | ||||||||
Diversified Financial Services (0.5%) | ||||||||
KKR Group Finance Co. III LLC (USD), 5.13%, 06/01/2044 (a) | 1,240,000 | 1,235,010 | ||||||
Legg Mason, Inc. (USD), 5.63%, 01/15/2044 | 1,260,000 | 1,285,295 | ||||||
| 2,520,305 | ||||||||
Diversified Telecommunication Services (0.4%) |
| |||||||
AT&T, Inc. (USD), 4.75%, 05/15/2046 | 2,060,000 | 2,023,769 | ||||||
Electric Utilities (1.7%) |
| |||||||
Duke Energy Carolinas LLC, Series A (USD), 6.00%, 12/01/2028 | 1,475,000 | 1,894,869 | ||||||
Edison International (USD), 3.75%, 09/15/2017 | 3,915,000 | 3,995,555 | ||||||
Entergy Corp. (USD), 2.95%, 09/01/2026 | 1,151,000 | 1,140,832 | ||||||
Exelon Corp. (USD), 3.40%, 04/15/2026 | 1,548,000 | 1,601,598 | ||||||
| 8,632,854 | ||||||||
Energy Equipment & Services (1.1%) | ||||||||
Buckeye Partners LP (USD), 3.95%, 12/01/2026 | 474,000 | 474,395 | ||||||
Energy Transfer Partners LP (USD), 4.15%, 10/01/2020 | 2,770,000 | 2,901,908 | ||||||
Plains All American Pipeline LP / PAA Finance Corp. (USD), 3.65%, 06/01/2022 | 2,210,000 | 2,279,429 | ||||||
| 5,655,732 | ||||||||
Healthcare Products (0.5%) | ||||||||
Medtronic, Inc. (USD), 4.38%, 03/15/2035 | 2,640,000 | 2,901,658 | ||||||
Healthcare Providers & Services (0.7%) | ||||||||
Aetna, Inc. (USD), 2.80%, 06/15/2023 | 2,055,000 | 2,085,470 | ||||||
Quest Diagnostics, Inc. (USD), 3.45%, 06/01/2026 | 1,569,000 | 1,616,059 | ||||||
| 3,701,529 | ||||||||
Insurance (0.6%) | ||||||||
American International Group, Inc. (USD), 6.25%, 05/01/2036 | 2,424,000 | 2,976,764 | ||||||
Internet (0.5%) | ||||||||
eBay, Inc. (USD), 3.80%, 03/09/2022 | 2,341,000 | 2,486,175 | ||||||
Media (1.4%) | ||||||||
21st Century Fox America, Inc. (USD), 7.30%, 04/30/2028 | 2,260,000 | 3,015,995 | ||||||
Time Warner Cos., Inc. (USD), 7.57%, 02/01/2024 | 3,275,000 | 4,165,764 | ||||||
| 7,181,759 | ||||||||
Metals & Mining (0.6%) | ||||||||
Glencore Funding LLC | ||||||||
(USD), 4.63%, 04/29/2024 (a) | 1,460,000 | 1,488,733 | ||||||
(USD), 4.00%, 04/16/2025 (a) | 1,874,000 | 1,849,167 | ||||||
| 3,337,900 | ||||||||
See accompanying Notes to Financial Statements.
2016 Annual Report
25
Statement of Investments (continued)
October 31, 2016
Aberdeen Total Return Bond Fund
| Shares or Principal Amount | Value (US$) | |||||||
Miscellaneous Manufacturing (0.6%) | ||||||||
Pentair Finance SA (USD), 1.88%, 09/15/2017 | $ | 3,190,000 | $ | 3,196,983 | ||||
Oil, Gas & Consumable Fuels (2.7%) | ||||||||
Chevron Corp. (USD), 0.91%, 02/22/2017 (b) | 3,370,000 | 3,371,432 | ||||||
Devon Energy Corp. (USD), 7.95%, 04/15/2032 | 3,430,000 | 4,338,604 | ||||||
Hess Corp. (USD), 5.80%, 04/01/2047 | 1,346,000 | 1,392,468 | ||||||
Marathon Petroleum Corp. (USD), 4.75%, 09/15/2044 | 1,690,000 | 1,500,208 | ||||||
Murphy Oil Corp. (USD), 6.13%, 12/01/2042 | 793,000 | 745,420 | ||||||
Valero Energy Corp. (USD), 7.50%, 04/15/2032 | 2,070,000 | 2,628,130 | ||||||
| 13,976,262 | ||||||||
Pharmaceutical (0.3%) |
| |||||||
AbbVie, Inc. (USD), 4.45%, 05/14/2046 | 1,380,000 | 1,367,369 | ||||||
Software (1.3%) | ||||||||
Electronic Arts, Inc. (USD), 3.70%, 03/01/2021 | 2,363,000 | 2,501,580 | ||||||
Microsoft Corp. (USD), 4.45%, 11/03/2045 | 4,010,000 | 4,420,079 | ||||||
| 6,921,659 | ||||||||
Transportation (0.5%) |
| |||||||
FedEx Corp. (USD), 4.90%, 01/15/2034 | 2,510,000 | 2,827,967 | ||||||
| 101,422,372 | ||||||||
Total Corporate Bonds | 153,587,707 | |||||||
MUNICIPAL BONDS (5.6%) |
| |||||||
UNITED STATES (5.6%) | ||||||||
CALIFORNIA (2.2%) | ||||||||
Los Angeles Unified School District General Obligation Unlimited Bonds | ||||||||
(USD), 5.76%, 07/01/2029 | 2,050,000 | 2,584,271 | ||||||
(USD), 6.76%, 07/01/2034 | 3,147,000 | 4,467,293 | ||||||
State of California General Obligation Unlimited Bonds (USD), 7.55%, 04/01/2039 | 2,870,000 | 4,448,959 | ||||||
| 11,500,523 | ||||||||
CONNECTICUT (0.6%) | ||||||||
State of Connecticut General Obligation Unlimited Bonds | ||||||||
(USD), 5.09%, 10/01/2030 | 855,000 | 1,022,554 | ||||||
Series A (USD), 5.85%, 03/15/2032 | 1,580,000 | 2,001,892 | ||||||
| 3,024,446 | ||||||||
MASSACHUSETTS (0.4%) | ||||||||
Commonwealth of Massachusetts General Obligation Limited Bonds, Series E (USD), 4.20%, 12/01/2021 | 1,740,000 | 1,920,612 | ||||||
NEW YORK (1.9%) | ||||||||
New York City Municipal Water Finance Authority Revenue Bonds (Build America Bonds) (USD), 5.44%, 06/15/2043 | 2,085,000 | 2,758,643 | ||||||
New York City Transitional Finance Authority Revenue Bonds (Build America Bonds) (USD), 5.77%, 08/01/2036 | 1,150,000 | 1,484,351 | ||||||
New York City Transitional Finance Authority Revenue Bonds (Qualified School Construction BD) | ||||||||
(USD), 5.27%, 05/01/2027 | 1,440,000 | 1,761,307 | ||||||
(USD), 5.01%, 08/01/2027 | 1,190,000 | 1,435,723 | ||||||
New York State Dormitory Authority Revenue Bonds (Build America Bonds) (USD), 5.50%, 03/15/2030 | 1,980,000 | 2,462,070 | ||||||
| 9,902,094 | ||||||||
PENNSYLVANIA (0.5%) | ||||||||
Pennsylvania State General Obligation Unlimited Bonds (Build America Bonds) | ||||||||
Series B (USD), 4.65%, 02/15/2026 | 1,520,000 | 1,693,554 | ||||||
Series B (USD), 5.45%, 02/15/2030 | 650,000 | 800,104 | ||||||
| 2,493,658 | ||||||||
Total Municipal Bonds | 28,841,333 | |||||||
GOVERNMENT BONDS (8.2%) |
| |||||||
AUSTRALIA (1.4%) | ||||||||
Australia Government Bond | ||||||||
(AUD), 1.25%, 02/21/2022 (a)(e) | 2,230,000 | 1,942,248 | ||||||
(AUD), 3.75%, 04/21/2037 (a) | 2,930,000 | 2,509,171 | ||||||
International Bank for Reconstruction & Development (NZD), 3.50%, 01/22/2021 | 4,150,000 | 3,050,958 | ||||||
| 7,502,377 | ||||||||
CANADA (2.0%) | ||||||||
Canadian Government Bond (CAD), 0.75%, 03/01/2021 | 13,840,000 | 10,357,970 | ||||||
INDONESIA (2.2%) | ||||||||
Indonesia Treasury Bond | ||||||||
Series FR56 (IDR), 8.38%, 09/15/2026 | 67,113,000,000 | 5,490,474 | ||||||
Series FR73 (IDR), 8.75%, 05/15/2031 | 67,119,000,000 | 5,754,858 | ||||||
| 11,245,332 | ||||||||
NEW ZEALAND (2.5%) | ||||||||
New Zealand Government Bond | ||||||||
(NZD), 5.00%, 03/15/2019(a) | 8,900,000 | 6,803,570 | ||||||
Series 521 (NZD), 6.00%, 05/15/2021 (a) | 4,730,000 | 3,934,130 | ||||||
Series 423 (NZD), 5.50%, 04/15/2023 (a) | 2,640,000 | 2,237,509 | ||||||
| 12,975,209 | ||||||||
REPUBLIC OF SOUTH KOREA (0.1%) | ||||||||
Korea Housing Finance Corp. (USD), 1.63%, 09/15/2018 (a) | 730,000 | 729,468 | ||||||
Total Government Bonds |
| 42,810,356 | ||||||
U.S. AGENCIES (13.3%) | ||||||||
UNITED STATES (13.3%) | ||||||||
Federal Home Loan Mortgage Corp. | ||||||||
(USD), 6.50%, 05/01/2022 | 910 | 1,019 | ||||||
(USD), 2.50%, 11/01/2031 | 3,900,000 | 4,013,039 | ||||||
See accompanying Notes to Financial Statements.
Annual Report 2016
26
Statement of Investments (continued)
October 31, 2016
Aberdeen Total Return Bond Fund
| Shares or Principal Amount | Value (US$) | |||||||
(USD), 6.50%, 08/01/2036 | $ | 335,555 | $ | 390,025 | ||||
(USD), 6.50%, 05/01/2038 | 998,181 | 1,157,255 | ||||||
(USD), 6.50%, 09/01/2038 | 62,457 | 71,604 | ||||||
(USD), 6.50%, 10/01/2038 | 556,754 | 647,911 | ||||||
(USD), 6.50%, 11/01/2038 | 89,474 | 102,544 | ||||||
(USD), 6.50%, 12/01/2038 | 280,124 | 321,113 | ||||||
(USD), 5.00%, 10/01/2041 | 1,640,968 | 1,825,793 | ||||||
(USD), 4.00%, 03/01/2042 | 2,768,248 | 2,976,064 | ||||||
(USD), 3.00%, 02/01/2043 | 1,263,760 | 1,304,220 | ||||||
(USD), 4.50%, 10/01/2043 | 1,561,048 | 1,706,202 | ||||||
(USD), 3.50%, 02/01/2044 | 4,165,075 | 4,384,503 | ||||||
(USD), 4.50%, 07/01/2044 | 1,591,391 | 1,738,298 | ||||||
(USD), 4.00%, 11/01/2044 | 2,820,206 | 3,019,612 | ||||||
(USD), 4.00%, 11/01/2044 | 1,358,332 | 1,453,278 | ||||||
(USD), 3.08%, 02/01/2045 (b) | 3,408,544 | 3,533,848 | ||||||
(USD), 4.00%, 02/01/2046 | 2,986,451 | 3,194,849 | ||||||
(USD), 3.50%, 05/01/2046 | 3,998,960 | 4,201,158 | ||||||
Federal National Mortgage Association | ||||||||
(USD), 3.00%, 09/01/2030 | 2,263,120 | 2,384,214 | ||||||
(USD), 3.00%, 10/01/2030 | 2,132,805 | 2,245,316 | ||||||
(USD), 3.50%, 03/01/2031 | 3,805,752 | 4,034,639 | ||||||
(USD), 3.00%, 11/01/2031 | 2,410,000 | 2,522,216 | ||||||
(USD), 3.50%, 03/01/2042 | 494,574 | 521,251 | ||||||
(USD), 3.50%, 06/01/2042 | 1,773,777 | 1,869,332 | ||||||
(USD), 4.00%, 06/01/2043 | 1,902,517 | 2,053,928 | ||||||
(USD), 4.00%, 11/01/2043 | 1,852,489 | 1,983,509 | ||||||
(USD), 4.50%, 03/01/2044 | 1,609,343 | 1,758,711 | ||||||
(USD), 4.50%, 08/01/2044 | 1,542,738 | 1,686,524 | ||||||
(USD), 3.07%, 01/01/2045 (b) | 1,705,923 | 1,776,378 | ||||||
(USD), 3.50%, 02/01/2045 | 1,456,355 | 1,540,344 | ||||||
(USD), 3.00%, 06/01/2045 | 1,865,470 | 1,930,328 | ||||||
(USD), 3.50%, 06/01/2045 | 1,979,659 | 2,099,800 | ||||||
(USD), 3.00%, 11/01/2046 | 2,680,000 | 2,759,353 | ||||||
Government National Mortgage Association | ||||||||
(USD), 6.00%, 04/15/2037 | 139,301 | 159,924 | ||||||
(USD), 6.00%, 06/15/2037 | 138,322 | 158,326 | ||||||
(USD), 6.00%, 09/15/2037 | 206,490 | 236,352 | ||||||
(USD), 6.00%, 11/15/2037 | 427,572 | 498,106 | ||||||
(USD), 6.00%, 11/15/2037 | 139,417 | 159,601 | ||||||
(USD), 6.00%, 12/15/2037 | 44,405 | 50,827 | ||||||
(USD), 6.00%, 04/15/2038 | 131,467 | 150,480 | ||||||
(USD), 6.00%, 07/15/2038 | 65,651 | 75,145 | ||||||
(USD), 6.00%, 09/15/2038 | 324,702 | 371,660 | ||||||
| 69,068,599 | ||||||||
Total U.S. Agencies |
| 69,068,599 | ||||||
U.S. TREASURIES (8.8%) | ||||||||
UNITED STATES (8.8%) | ||||||||
Treasury Inflation Protected Security | ||||||||
(USD), 0.63%, 01/15/2026(e) | 2,482,752 | 2,592,998 | ||||||
(USD), 0.75%, 02/15/2045(e) | 3,520,306 | 3,542,816 | ||||||
U.S. Treasury Bond (USD), 2.50%, 05/15/2046 | 11,394,600 | 11,186,165 | ||||||
U.S. Treasury Notes | ||||||||
(USD), 1.50%, 08/31/2018 | 1,840,000 | 1,861,491 | ||||||
(USD), 1.13%, 08/31/2021 | 2,538,600 | 2,516,486 | ||||||
(USD), 1.13%, 09/30/2021 | 4,110,000 | 4,071,309 | ||||||
(USD), 1.25%, 07/31/2023 | 4,180,000 | 4,087,091 | ||||||
(USD), 1.38%, 09/30/2023 | 5,000,000 | 4,921,290 | ||||||
(USD), 1.50%, 08/15/2026 | 11,152,100 | 10,819,723 | ||||||
| 45,599,369 | ||||||||
Total U.S. Treasuries |
| 45,599,369 | ||||||
AGENCY MORTGAGE-BACKED SECURITIES (2.4%) |
| |||||||
UNITED STATES (2.4%) | ||||||||
Federal Home Loan Mortgage Corp. | ||||||||
Series 2015-DNA3, Class M2, CMO, (USD), 3.38%, 04/25/2028 (b) | 1,500,000 | 1,536,002 | ||||||
Series 2016-DNA1, Class M2, CMO, (USD), 3.43%, 07/25/2028 (b) | 1,960,000 | 2,018,861 | ||||||
Series 2016-DNA3, Class M2, CMO, (USD), 2.53%, 12/25/2028 (b) | 1,159,000 | 1,172,003 | ||||||
Series 2016-HQA2, Class M2, CMO, (USD), 2.78%, 11/25/2028 (b) | 1,846,000 | 1,877,791 | ||||||
Structured Agency Credit Risk | ||||||||
Series 2014-HQ2, Class M2, CMO (USD), 2.73%, 09/25/2024 (b) | 1,880,000 | 1,930,417 | ||||||
Series 2015-DNA1, Class M2 (USD), 2.38%, 10/25/2027 (b) | 1,820,000 | 1,846,051 | ||||||
Series 2015-DNA2, Class M2, CMO (USD), 3.13%, 12/25/2027 (b) | 2,030,000 | 2,057,861 | ||||||
| 12,438,986 | ||||||||
Total Agency Mortgage-Backed Securities |
| 12,438,986 | ||||||
SHORT-TERM INVESTMENT (3.3%) | ||||||||
UNITED STATES (3.3%) | ||||||||
State Street Institutional U.S. Government Money Market Fund (f) | 17,439,605 | 17,439,605 | ||||||
Total Short-Term Investment |
| 17,439,605 | ||||||
Total Investments | 528,480,163 | |||||||
Liabilities in excess of other assets—(1.7)% | (8,903,149 | ) | ||||||
Net Assets—100.0% |
| $ | 519,577,014 | |||||
| (a) | Denotes a security issued under Regulation S or Rule 144A. |
| (b) | Variable or Floating Rate Security. Rate disclosed is as of October 31, 2016. |
| (c) | This security is government guaranteed. |
| (d) | Perpetual bond. This is a bond that has no maturity date, is redeemable and pays a steady stream of interest indefinitely. |
| (e) | Inflation linked security. |
| (f) | Registered investment company advised by State Street Global Advisors. |
| (g) | See accompanying Notes to Financial Statements for tax unrealized appreciation/depreciation of securities. |
| AUD | Australian Dollar |
| CAD | Canadian Dollar |
| GBP | British Pound Sterling |
| IDR | Indonesian Rupiah |
| INR | Indian Rupee |
| MXN | Mexican Peso |
| NZD | New Zealand Dollar |
| USD | U.S. Dollar |
See accompanying Notes to Financial Statements.
2016 Annual Report
27
Statement of Investments (continued)
October 31, 2016
Aberdeen Total Return Bond Fund
At October 31, 2016, the Fund held the following futures contracts:
| Futures Contracts | Number of Contracts Long/(Short) | Expiration Date | Unrealized Appreciation/ (Depreciation) | |||||||||
Australian 3 Year Bond Futures | 76 | 12/15/2016 | $ | (16,309 | ) | |||||||
United States Treasury Note 6%-5 year | 176 | 12/30/2016 | 1,794 | |||||||||
United States Treasury Note 6%-10 year | 108 | 12/20/2016 | (34,984 | ) | ||||||||
United States Treasury Note 6%-Ultra Bond | 8 | 12/20/2016 | 2,500 | |||||||||
United States Treasury Note 6%-Ultra Long | (113 | ) | 12/20/2016 | 324,327 | ||||||||
| 277,328 | ||||||||||||
At October 31, 2016, the Fund’s open forward foreign currency exchange contracts were as follows:
| Purchase Contracts Settlement Date* | Counterparty | Amount Purchased | Amount Sold | Fair Value | Unrealized Appreciation/ (Depreciation) | |||||||||||||||||||||||
| British Pound/United States Dollar 11/21/2016 | HSBC Bank USA | GBP | 3,800,000 | USD | 4,929,330 | $ | 4,652,901 | $ | (276,429 | ) | ||||||||||||||||||
| 11/21/2016 | Royal Bank of Canada | GBP | 6,071,148 | USD | 7,966,415 | 7,433,803 | (532,612 | ) | ||||||||||||||||||||
| Canadian Dollar/United States Dollar 11/14/2016 | Barclays Bank plc | CAD | 2,375,224 | USD | 1,778,887 | 1,770,995 | (7,892 | ) | ||||||||||||||||||||
| 11/14/2016 | HSBC Bank USA | CAD | 16,022,951 | USD | 12,210,396 | 11,946,902 | (263,494 | ) | ||||||||||||||||||||
| 11/14/2016 | Royal Bank of Canada | CAD | 2,640,732 | USD | 2,043,744 | 1,968,961 | (74,783 | ) | ||||||||||||||||||||
| 11/14/2016 | Westpac Banking Corp. | CAD | 9,924,036 | USD | 7,637,771 | 7,399,479 | (238,292 | ) | ||||||||||||||||||||
| Indian Rupee/United States Dollar 11/09/2016 | Barclays Bank plc | INR | 557,068,893 | USD | 8,227,276 | 8,331,684 | 104,408 | |||||||||||||||||||||
| 11/09/2016 | JPMorgan Chase Bank N.A. | INR | 241,252,008 | USD | 3,562,756 | 3,608,235 | 45,479 | |||||||||||||||||||||
| Indonesian Rupiah/United States Dollar 12/15/2016 | JPMorgan Chase Bank N.A. | IDR | 55,077,467,000 | USD | 4,186,809 | 4,195,517 | 8,708 | |||||||||||||||||||||
| Mexican Peso/United States Dollar 01/10/2017 | Goldman Sachs & Co. | MXN | 98,725,000 | USD | 5,244,997 | 5,184,614 | (60,383 | ) | ||||||||||||||||||||
| 01/10/2017 | HSBC Bank USA | MXN | 100,510,000 | USD | 5,274,593 | 5,278,355 | 3,762 | |||||||||||||||||||||
| New Zealand Dollar/United States Dollar 12/01/2016 | Royal Bank of Canada | NZD | 4,134,865 | USD | 3,024,050 | 2,953,323 | (70,727 | ) | ||||||||||||||||||||
| 12/01/2016 | Westpac Banking Corp. | NZD | 6,857,935 | USD | 4,998,121 | 4,898,273 | (99,848 | ) | ||||||||||||||||||||
| $ | 69,623,042 | $ | (1,462,103 | ) | ||||||||||||||||||||||||
See accompanying Notes to Financial Statements.
Annual Report 2016
28
Statement of Investments (concluded)
October 31, 2016
Aberdeen Total Return Bond Fund
| Sale Contracts Settlement Date* | Counterparty | Amount Purchased | Amount Sold | Fair Value | Unrealized Appreciation/ (Depreciation) | |||||||||||||||||||||
| United States Dollar/Australian Dollar 01/17/2017 | Royal Bank of Canada | USD | 9,654,866 | AUD | 12,784,888 | $ | 9,707,332 | $ | (52,466 | ) | ||||||||||||||||
| United States Dollar/British Pound 11/21/2016 | Citibank N.A. | USD | 12,826,225 | GBP | 9,871,148 | 12,086,704 | 739,521 | |||||||||||||||||||
| United States Dollar/Canadian Dollar 11/14/2016 | Barclays Bank plc | USD | 9,445,723 | CAD | 12,283,785 | 9,158,935 | 286,788 | |||||||||||||||||||
| 11/14/2016 | Citibank N.A. | USD | 11,862,731 | CAD | 15,477,587 | 11,540,272 | 322,459 | |||||||||||||||||||
| 11/14/2016 | Westpac Banking Corp. | USD | 9,448,193 | CAD | 12,283,784 | 9,158,935 | 289,258 | |||||||||||||||||||
| 11/15/2016 | Royal Bank of Canada | USD | 3,666,173 | CAD | 4,770,391 | 3,556,882 | 109,291 | |||||||||||||||||||
| United States Dollar/Indian Rupee 11/09/2016 | Barclays Bank plc | USD | 3,129,717 | INR | 209,737,992 | 3,136,902 | (7,185 | ) | ||||||||||||||||||
| 11/09/2016 | JPMorgan Chase Bank N.A. | USD | 3,590,364 | INR | 241,252,008 | 3,608,235 | (17,871 | ) | ||||||||||||||||||
| United States Dollar/Indonesian Rupiah 12/15/2016 | Goldman Sachs & Co. | USD | 1,499,855 | IDR | 19,708,095,000 | 1,501,261 | (1,406 | ) | ||||||||||||||||||
| 12/15/2016 | JPMorgan Chase Bank N.A. | USD | 8,937,564 | IDR | 119,708,095,000 | 9,118,744 | (181,180 | ) | ||||||||||||||||||
| United States Dollar/New Zealand Dollar 12/01/2016 | Barclays Bank plc | USD | 7,329,480 | NZD | 10,156,980 | 7,254,613 | 74,867 | |||||||||||||||||||
| 12/01/2016 | Citibank N.A. | USD | 7,323,183 | NZD | 10,156,980 | 7,254,613 | 68,570 | |||||||||||||||||||
| 12/01/2016 | HSBC Bank USA | USD | 7,326,434 | NZD | 10,156,981 | 7,254,614 | 71,820 | |||||||||||||||||||
| 12/01/2016 | Royal Bank of Canada | USD | 4,438,115 | NZD | 6,293,833 | 4,495,364 | (57,249 | ) | ||||||||||||||||||
| $ | 98,833,406 | $ | 1,645,217 | |||||||||||||||||||||||
| * | Certain contracts with different trade dates and like characteristics have been shown net. |
At October 31, 2016, the Fund’s centrally cleared interest rate swaps were as follows:
| Currency | Notional Amount | Expiration Date | Receive (Pay) Floating Rate | Floating Rate Index | Fixed Rate | Unrealized Depreciation | ||||||||||||||||||
| USD | 22,950,000 | 09/06/2018 | Pay | 3-month LIBOR Index | 1.03% | $ | (9,533 | ) | ||||||||||||||||
| $ | (9,533 | ) | ||||||||||||||||||||||
See accompanying Notes to Financial Statements.
2016 Annual Report
29
Aberdeen Global High Income Fund (Unaudited)
The Aberdeen Global High Income Fund (Institutional Class shares net of fees) returned 2.20% for the 12-month period ended October 31, 2016, versus the 10.57% return of its benchmark, the Bank of America Merrill Lynch (BofA ML) Global High Yield Constrained Index (hedged to U.S. dollars), during the same period. For broader comparison, the average return of the peer category of High Yield Funds (comprising 223 funds), as measured by Lipper, Inc., was 7.02% for the period.
Despite exceptionally weak conditions at the outset of the reporting period, the global high-yield market rallied sharply during the period. Market fears in late 2015, centered primarily on declining energy prices and a dearth of market liquidity, carried over to the beginning of 2016, hampering most risk assets. As energy prices began to bottom in the first quarter of 2016, however, liquidity returned and the market began to experience a strong, durable rally which saw the global high-yield asset class garner positive returns in the last nine months of the reporting period. At the beginning of the reporting period, the spread to worst1 on global high-yield bonds versus comparable-duration2 government securities stood at 606 basis points (bps). The spread widened to a peak level of 849 bps in mid-February 2016, given the market weakness at the outset of the year, before the sustained rally took hold and drove spreads significantly tighter to close the reporting period at 491 bps.
The U.S. high-yield market returned 10.2%3 over the reporting period. Underlying this performance was a significant recovery in some of the market segments which experienced the most notable declines in the second half of 2015. For example, lower-rated bonds were significant drivers of the U.S. market’s rally over the period, as CCC-rated and below4 credits gained 19.0%,5 while more conservative BB-rated issues returned 9.0%.6 Similarly, industry sectors which were the hardest hit in 2015, including steel and metals and mining, rebounded significantly, producing strong returns over the reporting period. The European high-yield sector also performed well over the reporting period, returning 7.9%.7 The market was able to post these returns despite its comparatively lower exposure to some of the stronger-performing commodity-related sectors and a generally more conservative credit profile, benefiting from exceptionally accommodative monetary policy actions from the European Central Bank (ECB). Emerging-market corporate bonds were the top performers in the global high-yield market, with a gain of 15.4%8 over the reporting period, bolstered mainly by the rebound in commodity prices and renewed investor enthusiasm for the asset class.
Fund performance for the reporting period was hindered largely by individual security selection and, to a lesser extent, overall asset allocation decisions. Poor security selection within the energy and basic industry segments of the industrials sector were the primary drivers of the Fund’s underperformance versus its benchmark for the reporting period. The largest detractor within the energy subsector was the Fund’s equity investment in DeepOcean, a Norwegian oilfield services provider which the Fund gained through the restructuring of Trico Marine in 2011. DeepOcean’s business was hampered over the reporting period as persistently low oil prices weakened demand for the company’s services, resulting in a substantial decline in the company’s share price. Despite the underperformance over the period, we retained the Fund’s position in DeepOcean at the end of the reporting period, given our view that the company’s business conditions and financial results are likely to improve. The Fund’s holding in the bonds of California Resources, a U.S.-based energy firm focused on oil and gas exploration and production, also weighed on performance during the reporting period as the precipitous decline in oil prices early in the period severely pressured prices of the company’s stock and bond prices. We exited the position during the period as we believe that the company will need a marked recovery in energy prices to support its capital structure9 going forward.
On the positive side, the Fund’s performance within the energy subsector benefited substantially from its holding in investment-
| 1 | Spread to worst comprises the difference in overall returns between two different classes of securities, or returns from the same class, but different representative securities. The spread to worst measures the difference from the weakest-performing security to the strongest, and can be seen as a measure of dispersion of returns within a given market or between markets. |
| 2 | Duration is an estimate of bond price sensitivity to changes in interest rates. The higher the duration, the greater the change (i.e., higher risk) in relation to interest-rate movements. |
| 3 | As measured by the BofA ML U.S. High Yield Master II Index which tracks the performance of below-investment-grade U.S. dollar-denominated corporate bonds issued in the U.S. domestic market. |
| 4 | Standard & Poor’s credit ratings express the agency’s opinion about the ability and willingness of an issuer, such as a corporation or state or city government, to meet its financial obligations in full and on time. Typically, ratings are expressed as letter grades that range, for example, from “AAA” to “D” to communicate the agency’s opinion of relative level of credit risk. Ratings from “AA” to “CCC” may be modified by the addition of a plus (+) or minus (-) sign to show relative standing within the major rating categories. |
| 5 | As measured by the BofA ML CCC and Lower U.S. High Yield Constrained Index, which is a subset of the BofA Merrill Lynch U.S. High Yield Index and includes all securities in the BofA ML U.S. High Yield Index rated CCC and lower by Standard & Poor’s (or equivalent as rated by Moody’s or Fitch). The BofA ML U.S. High Yield Index tracks the performance of U.S. dollar-denominated below investment-grade corporate debt publicly issued in the US domestic market. |
| 6 | As measured by the BofA ML BB US High Yield Constrained Index, which is a subset of the BofA Merrill Lynch U.S. High Yield Index and includes all securities in the BofA ML U.S. High Yield Index rated BB+ through BB- by Standard & Poor’s (or equivalent as rated by Moody’s or Fitch). The BofA Merrill Lynch U.S. High Yield Index tracks the performance of US dollar denominated below-investment-grade corporate debt publicly issued in the U.S. domestic market. |
| 7 | As measured by the BofA ML European Currency High Yield Constrained Index (hedged to U.S. dollars) includes contains all securities in The BofA ML European Currency High Yield Index but caps issuer exposure at 3%. The BofA Merrill Lynch European Currency High Yield Index tracks the performance of euro- and sterling-denominated below-investment-grade corporate debt publicly issued in the eurobond, sterling domestic or euro domestic markets. |
| 8 | As measured by the BofA Merrill Lynch High Yield US Emerging Markets Corporate Plus Index, which tracks the performance of U.S. dollar-denominated below investment grade emerging markets corporate debt publicly issued in the U.S. domestic or eurobond market. |
| 9 | A company’s capital structure comprises the financing of its overall operations and growth by using different sources of funds. The capital structure may include a mix of long- and short-term debt, common equity and preferred equity. |
Annual Report 2016
30
Aberdeen Global High Income Fund (Unaudited) (continued)
grade bonds issued by Kinder Morgan, a pipeline and energy infrastructure service provider, which is not represented in the benchmark BofA ML Global High Yield Constrained Index. The bonds outperformed following a bondholder-friendly dividend cut, and fears of a potential credit rating downgrade receded. We exited the Fund’s holding following the rally based on relative value considerations.
Most of the Fund’s underperformance within the basic industry subsector was attributable to the lack of positions in securities that are constituents of the benchmark index, including some distressed coal issues and metals and mining securities, which benefited from the significant rebound in commodity prices over the reporting period. Within the technology, media and telecommunications (TMT) sector, the Fund’s performance was hindered by the holding in a first lien term loan10 issued by Isola Group, a supplier to printed circuit boards manufacturers, which came under pressure as global supply chains for electronics swelled early in 2016, weighing on the company’s quarterly results. We exited the Fund’s position based on our view that loan-holders would receive only a partial recovery if the company were forced to file for bankruptcy given the asset-light nature of the business.
Regarding the impact of sector allocation over the reporting period, Fund performance benefited from a substantial underweight to BB-rated credits relative to the benchmark, as these issues significantly underperformed amid the market rally. Conversely, the Fund’s allocations to split-rated11 and investment-grade securities weighed on performance despite strong security selection in these credit-rating categories. By geographical regions, the Fund’s underweight to emerging-market credit, particularly in Latin America, weighed on performance as these companies disproportionately benefited from the positive turn in investor sentiment toward emerging markets at the beginning of 2016, and the concurrent recovery in commodity prices.
The Fund employs derivatives, including foreign exchange forwards12 and credit default swaps.13 The Fund utilizes foreign exchange forwards to hedge its exposure to changes in the value of its holdings due to movements in currency exchange rates. The Fund uses credit default swaps to gain, or hedge, exposure to specific companies. The Fund also employs credit default swaps on indices primarily for the purpose of managing market exposure. The derivatives positions contributed 1.50% to Fund performance for the reporting period.
We established several new positions in the Fund over the reporting period, including in the bonds of U.S. retail drugstore chain operator Rite Aid Corp., as we believe that the company’s proposed merger with Walgreens will be approved and result in significant financial and competitive benefits for the company. Additionally, we added to the Fund’s existing position in Goodyear Tire and Rubber Co., as we believe that the company has an attractive replacement business and may potentially achieve an investment-grade credit rating over the intermediate term. We maintained the Fund’s positions in both Rite Aid and Goodyear at the end of the reporting period.
We remain cautiously optimistic about prospects for the U.S. high-yield asset class, while we feel that there is a relatively more supportive environment in Europe and, to a lesser degree, in the emerging markets. In our view, the U.S. high-yield market presents both cautionary and bullish signals for investors. On the positive side, we observe a benign default environment driven partially by the rally in commodity prices over the reporting period. We also believe that the U.S. market, with spread levels at 486 bps over comparable-duration U.S. Treasuries as of the end of the reporting period on October 31, 2016, is pricing in a level of defaults at 6%, which is well above both current rates and our expectations over the next 12 months. Nonetheless, we recognize that the Federal Reserve appears determined to finally embark on a course of raising interest rates, which we believe may destabilize the economic recovery. We see a relatively more benign environment for high-yield bonds outside the U.S., particularly in Europe, where policymakers at the ECB and the Bank of England continue to provide unprecedented levels of monetary support to markets. Taking these factors into account, we anticipate becoming increasingly selective in our credit selection process for companies domiciled or operating in the U.S., while placing additional emphasis on finding what we feel are suitable opportunities in geographic regions such as Europe or the emerging markets, which we think stand to benefit from improved macroeconomic backdrops and supportive monetary policies.
Portfolio Management:
Aberdeen North American Fixed Income Team
PAST PERFORMANCE DOES NOT GUARANTEE FUTURE RESULTS.
The performance quoted represents past performance, which does not guarantee future results. Class A shares have up to a 0.25% 12b-1 fee. The investment return and principal value of an investment will fluctuate so that an investor’s shares, when redeemed, may be worth more or less than their original cost. Current performance of the Fund may be lower or higher than the performance quoted. Performance data current to the most recent month-end may be obtained by calling 866-667-9231 or visiting www.aberdeen-asset.us.
Investing in mutual funds involves risk, including the possible loss of principal. There is no assurance that the investment objective of any fund will be achieved. Indexes are unmanaged and have been provided for comparison purposes only. No fees or expenses are reflected. You cannot invest directly in an index.
Lipper is a leading global provider of mutual fund information and analysis to fund companies, financial intermediaries and media organizations.
Risk Considerations
Fixed income securities are subject to certain risks including, but not limited to: interest rate (changes in interest rates may cause a decline in the market value of an investment), credit (changes in the financial condition of the issuer, borrower, counterparty, or underlying collateral), prepayment (debt issuers may repay or refinance their loans or obligations earlier than anticipated), and extension (principal
| 10 | A term loan is a bank-issued loan for a specific amount that has a specified repayment schedule and either a fixed or floating interest rate. |
| 11 | Split-rated securities are bonds for which two credit-rating agencies assign two different ratings. |
| 12 | A foreign exchange forward is a binding contract in the foreign exchange market that locks in the exchange rate for the purchase or sale of a currency on a future date. |
| 13 | A credit default swap protects a lender in the event of default on the part of the borrower by transferring the associated risk in return for periodic income payments. |
2016 Annual Report
31
Aberdeen Global High Income Fund (Unaudited) (concluded)
repayments may not occur as quickly as anticipated, causing the expected maturity of a security to increase).
Non-investment-grade debt securities (high yield/junk bonds) may be subject to greater market fluctuations, risk of default or loss of income and principal than higher-rated securities.
Derivatives are speculative and may hurt the Fund’s performance. They present the risk of disproportionately increased losses and/or reduced gains when the financial asset or measure to which the derivative is linked changes in unexpected ways.
Foreign securities may be more volatile, harder to price and less liquid than U.S. securities. They are subject to different accounting and regulatory standards and currency exchange rate, political and economic risks. Fluctuation in currency exchange rates may impact a Fund’s returns more greatly to the extent a Fund does not hedge currency exposure or hedging techniques are unsuccessful. The foregoing risks are enhanced in emerging market countries.
Investing a significant portion of the Fund’s assets in securities of companies conducting business in a broadly related group of industries within an economic sector may make the Fund more vulnerable to unfavorable developments in that sector.
Please read the prospectus for more detailed information regarding these and other risks.
Annual Report 2016
32
Aberdeen Global High Income Fund (Unaudited)
| Average Annual Total Return (For periods ended October 31, 2016) | 1 Yr. | 5 Yr. | 10 Yr. | |||||||
Class A | 1.91% | 4.21% | 5.72% | |||||||
Institutional Class | 2.21% | 4.48% | 5.99% | |||||||
2016 Annual Report
33
Aberdeen Global High Income Fund (Unaudited)
Performance of a $10,000 Investment (as of October 31, 2016)
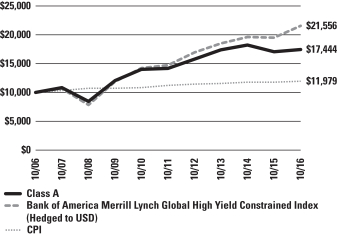
Comparative performance of $10,000 invested in Class A shares of the Aberdeen Global High Income Fund, Bank of America Merrill Lynch Global High Yield Constrained Index (hedged to the U.S. Dollar) and the Consumer Price Index (CPI) over a 10-year period ended October 31, 2016. Unlike the Fund’s returns, the returns for these unmanaged indexes do not reflect any fees or expenses. Investors cannot invest directly in market indexes.
The Bank of America Merrill Lynch Global High Yield Constrained Index (hedged to the U.S. Dollar) tracks the performance of USD, CAD, GBP and EUR denominated below investment grade corporate debt publicly issued in the major domestic or eurobond markets but caps issuer exposure at 2%.
The CPI is a measure of the average change over time in the prices paid by urban consumers for a market basket of consumer goods and services.
Investment return and principal value will fluctuate, and when redeemed, shares may be worth more or less than original cost. Past performance is no guarantee of future results. The Average Annual Total Return table and performance graph do not reflect the deduction of taxes that a shareholder would pay on Fund distributions or the redemption of Fund shares. Investing in mutual funds involves market risk, including loss of principal. Performance returns assume the reinvestment of all distributions. Performance returns reflect fee waivers and reimbursements in effect without which returns would have been lower.
Portfolio Summary (as a percentage of net assets)
October 31, 2016 (Unaudited)
| Asset Allocation | ||||
Corporate Bonds | 87.5% | |||
Government Bonds | 2.4% | |||
Bank Loans | 2.2% | |||
Exchange Traded Funds | 2.0% | |||
Short-Term Investment | 1.4% | |||
Government Agencies | 1.3% | |||
Preferred Stocks | 0.8% | |||
Common Stocks | 0.2% | |||
Other assets in excess of liabilities | 2.2% | |||
| 100.0% | ||||
The following chart summarizes the composition of the Fund’s portfolio, expressed as a percentage of net assets. The industries listed below may include more than one industry group. As of October 31, 2016, the Fund did not have more than 25% of its assets invested in any industry group.
| Top Industries | ||||
Oil, Gas & Consumable Fuels | 9.6% | |||
Diversified Telecommunication Services | 8.8% | |||
Commercial Banks | 7.0% | |||
Media | 6.2% | |||
Chemicals | 4.0% | |||
Diversified Financial Services | 3.8% | |||
Electric Utilities | 3.5% | |||
Healthcare Providers & Services | 3.3% | |||
Metals & Mining | 3.2% | |||
Commercial Services & Supplies | 3.3% | |||
Other | 47.3% | |||
| 100.0% | ||||
| Top Holdings* | ||||
iShares Euro High Yield Corporate Bond UCITS ETF | 2.0% | |||
Altice US Finance I Corp. 07/15/2023 | 1.4% | |||
CCO Holdings LLC / CCO Holdings Capital Corp. 02/15/2026 | 1.3% | |||
Pertamina Persero PT 05/20/2023 | 1.3% | |||
Rite Aid Corp. 04/01/2023 | 1.2% | |||
TerraForm Power Operating LLC 02/01/2023 | 1.2% | |||
Petrobras International Finance Co. 01/27/2021 | 1.2% | |||
Calpine Corp. 01/15/2025 | 1.1% | |||
MEG Energy Corp. 01/30/2023 | 1.1% | |||
Sprint Corp. 09/15/2023 | 1.1% | |||
Other | 87.1% | |||
| 100.0% | ||||
| * | For the purpose of listing top holdings, Short-Term Investments are included as part of Other. |
| Top Countries | ||||
United States | 61.0% | |||
United Kingdom | 7.6% | |||
Canada | 5.0% | |||
Brazil | 2.5% | |||
Netherlands | 2.5% | |||
Republic of Ireland | 2.0% | |||
Germany | 2.0% | |||
Italy | 1.8% | |||
Argentina | 1.6% | |||
Other | 2.2% | |||
Other | 11.8% | |||
| 100.0% | ||||
Annual Report 2016
34
Statement of Investments
October 31, 2016
Aberdeen Global High Income Fund
| Shares or Principal Amount | Value (US$) | |||||||
CORPORATE BONDS (87.5%) | ||||||||
ARGENTINA (0.2%) | ||||||||
Cablevision SA (USD), 6.50%, 06/15/2021 (a) | $ | 1,031,000 | $ | 1,074,818 | ||||
AUSTRALIA (0.4%) | ||||||||
QBE Insurance Group Ltd. (USD), 6.75%, 12/02/2044 (a)(b) | 1,871,000 | 2,047,810 | ||||||
BELGIUM (0.3%) | ||||||||
KBC Group NV (EUR), | 1,791,000 | 1,970,986 | ||||||
BRAZIL (2.5%) | ||||||||
Banco do Brasil SA (USD), | 4,050,000 | 3,770,550 | ||||||
Petrobras Global Finance BV | ||||||||
(USD), 6.25%, 03/17/2024 | 1,785,000 | 1,768,935 | ||||||
(USD), 8.75%, 05/23/2026 | 2,000,000 | 2,258,000 | ||||||
Petrobras International Finance Co. (USD), 5.38%, 01/27/2021 | 6,905,000 | 6,854,593 | ||||||
| 14,652,078 | ||||||||
CANADA (5.0%) | ||||||||
Bombardier, Inc. (USD), | 705,000 | 629,212 | ||||||
Cenovus Energy, Inc. (USD), 3.80%, 09/15/2023 | 280,000 | 276,550 | ||||||
First Quantum Minerals Ltd. (USD), 7.25%, 10/15/2019 (a) | 3,971,000 | 3,936,254 | ||||||
Gateway Casinos & Entertainment Ltd. (CAD), 8.50%, 11/26/2020 (a) | 4,878,000 | 3,454,932 | ||||||
GFL Environmental, Inc. (USD), 9.88%, 02/01/2021 (a) | 3,235,000 | 3,558,500 | ||||||
Kissner Milling Co. Ltd. (USD), 7.25%, 06/01/2019 (a) | 3,920,000 | 4,057,200 | ||||||
MEG Energy Corp. | ||||||||
(USD), 6.38%, 01/30/2023 (a) | 7,944,000 | 6,593,520 | ||||||
(USD), 7.00%, 03/31/2024 (a) | 1,983,000 | 1,635,975 | ||||||
SCM Insurance Services, Inc. (CAD), 9.25%, 08/22/2019 (e)(f) | 7,230,000 | 1,886,603 | ||||||
Teck Resources Ltd. (USD), 8.00%, 06/01/2021 (a) | 2,700,000 | 2,956,500 | ||||||
Teine Energy Ltd. (USD), 6.88%, 09/30/2022 (a) | 526,000 | 537,835 | ||||||
| 29,523,081 | ||||||||
CHILE (0.7%) | ||||||||
VTR Finance BV (USD), 6.88%, 01/15/2024 (a) | 3,935,000 | 4,126,831 | ||||||
CHINA (0.4%) | ||||||||
Wanda Properties International Co. Ltd. (USD), 7.25%, 01/29/2024 (a) | 2,050,000 | 2,309,833 | ||||||
DOMINICAN REPUBLIC (0.3%) | ||||||||
AES Andres BV / Dominican Power Partners / Empresa Generadora de Electricidad It (USD), 7.95%, 05/11/2026 (a) | 1,765,000 | 1,877,519 | ||||||
EL SALVADOR (0.1%) | ||||||||
AES El Salvador Trust II (USD), 6.75%, 03/28/2023 (a) | 500,000 | 471,250 | ||||||
FRANCE (1.1%) | ||||||||
HomeVi SAS (EUR), 6.88%, 08/15/2021 (a) | 1,173,000 | 1,377,050 | ||||||
SFR Group SA (USD), 6.00%, 05/15/2022 (a) | 3,983,000 | 4,098,786 | ||||||
SFR Group SA (USD), 7.38%, 05/01/2026 (a) | 978,000 | 989,003 | ||||||
| 6,464,839 | ||||||||
GEORGIA (0.1%) | ||||||||
BGEO Group JSC (USD), 6.00%, 07/26/2023 (a) | 500,000 | 514,810 | ||||||
GERMANY (2.0%) | ||||||||
ALBA Group PLC & Co. KG (EUR), 8.00%, 05/15/2018 (a) | 4,375,000 | 4,755,591 | ||||||
Safari Holding Verwaltungs GmbH (EUR), 8.25%, 02/15/2021 (a) | 2,985,000 | 3,465,200 | ||||||
Unitymedia Hessen GmbH & Co. KG / Unitymedia NRW GmbH (USD), 5.50%, 01/15/2023 (a) | 3,125,000 | 3,250,000 | ||||||
| 11,470,791 | ||||||||
GUATEMALA (0.1%) | ||||||||
Industrial Senior Trust (USD), 5.50%, 11/01/2022 (a) | 500,000 | 500,330 | ||||||
HUNGARY (0.1%) | ||||||||
Nitrogenmuvek Vegyipari Zrt, 7.88%, 05/21/2020 | 500,000 | 523,752 | ||||||
ITALY (1.3%) | ||||||||
Snai SpA (EUR), 6.38%, 11/07/2021 (a) | 436,000 | 485,499 | ||||||
Wind Acquisition Finance SA | ||||||||
(USD), 4.75%, 07/15/2020 (a) | 2,235,000 | 2,257,350 | ||||||
(USD), 7.38%, 04/23/2021 (a) | 4,623,000 | 4,761,690 | ||||||
| 7,504,539 | ||||||||
KAZAKHSTAN (0.1%) | ||||||||
KazMunayGas National Co. JSC (USD), 7.00%, 05/05/2020 (a) | 500,000 | 556,866 | ||||||
LUXEMBOURG (1.4%) | ||||||||
Altice Financing SA (USD), 7.50%, 05/15/2026 (a) | 1,840,000 | 1,899,800 | ||||||
ARD Finance SA (USD), 7.13%, 09/15/2023 (a)(d) | 1,200,000 | 1,192,500 | ||||||
Bank of New York Mellon Luxembourg SA (The), Series PRX (EUR), 4.20%, 12/15/2050 (b) | 3,100,000 | 1,573,899 | ||||||
INEOS Group Holdings SA (EUR), 5.38%, 08/01/2024 (a) | 2,017,000 | 2,209,090 | ||||||
Millicom International Cellular SA (USD), 6.63%, 10/15/2021 (a) | 500,000 | 525,025 | ||||||
Trinseo Materials Operating SCA / Trinseo Materials Finance, Inc. (EUR), 6.38%, 05/01/2022 (a) | 745,000 | 870,852 | ||||||
| 8,271,166 | ||||||||
See accompanying Notes to Financial Statements.
2016 Annual Report
35
Statement of Investments (continued)
October 31, 2016
Aberdeen Global High Income Fund
| Shares or Principal Amount | Value (US$) | |||||||
MEXICO (0.5%) | ||||||||
Alfa SAB de CV (USD), 6.88%, 03/25/2044 (a) | $ | 2,663,000 | $ | 2,869,382 | ||||
NETHERLANDS (2.5%) | ||||||||
Constellium NV (USD), 8.00%, 01/15/2023 (a) | 3,780,000 | 3,704,400 | ||||||
ING Groep NV (USD), | 2,027,000 | 2,006,730 | ||||||
NXP BV / NXP Funding LLC (USD), 4.13%, 06/01/2021 (a) | 2,147,000 | 2,297,290 | ||||||
Ziggo Secured Finance BV (USD), 5.50%, 01/15/2027 (a) | 6,420,000 | 6,355,800 | ||||||
| 14,364,220 | ||||||||
NIGERIA (0.5%) | ||||||||
Ihs Netherlands Holdco BV (USD), 9.50%, 10/27/2021 (a) | 3,020,000 | 3,148,000 | ||||||
PARAGUAY (0.1%) | ||||||||
Banco Regional SAECA (USD), 8.13%, 01/24/2019 (a) | 500,000 | 542,600 | ||||||
RUSSIA (0.4%) | ||||||||
Global Ports Finance PLC (USD), 6.87%, 01/25/2022 (a) | 500,000 | 518,185 | ||||||
GTLK Europe Ltd. (USD), 5.95%, 07/19/2021 (a) | 500,000 | 516,799 | ||||||
Metalloinvest Finance DAC (USD), 5.63%, 04/17/2020 (a) | 500,000 | 521,499 | ||||||
Sberbank of Russia Via SB Capital SA (USD), 6.13%, 02/07/2022 (a) | 500,000 | 544,439 | ||||||
| 2,100,922 | ||||||||
SOUTH AFRICA (1.0%) | ||||||||
MTN Mauritius Investment Ltd. (USD), 6.50%, 10/13/2026 (a) | 1,600,000 | 1,627,400 | ||||||
Sappi Papier Holding GmbH (USD), 7.50%, 06/15/2032 (a)(e) | 4,647,000 | 4,437,885 | ||||||
| 6,065,285 | ||||||||
SPAIN (0.7%) | ||||||||
Obrascon Huarte Lain SA | ||||||||
(EUR), 4.75%, 03/15/2022 (a) | 2,001,000 | 1,756,730 | ||||||
(EUR), 5.50%, 03/15/2023 (a) | 629,000 | 554,114 | ||||||
OHL Investments SA, Series OHL, (EUR), 4.00%, 04/25/2018 (a) | 2,000,000 | 2,052,793 | ||||||
| 4,363,637 | ||||||||
SWITZERLAND (0.2%) | ||||||||
UBS Group AG (USD), | 1,339,000 | 1,433,567 | ||||||
TURKEY (0.3%) | ||||||||
Turkiye Halk Bankasi A.S. (USD), 5.00%, 07/13/2021 (a) | 500,000 | 483,218 | ||||||
Turkiye Sise ve Cam Fabrikalari A.S. (USD), 4.25%, 05/09/2020 (a) | 500,000 | 498,125 | ||||||
Yasar Holding A.S. (USD), 8.88%, 05/06/2020 (a) | 500,000 | 536,250 | ||||||
| 1,517,593 | ||||||||
UNITED KINGDOM (7.6%) | ||||||||
Anglo American Capital PLC (USD), 4.88%, 05/14/2025 (a) | 2,400,000 | 2,454,000 | ||||||
Annington Finance No 5 PLC (GBP), 13.00%, 01/15/2023 (a)(d) | 1,902,103 | 2,664,083 | ||||||
Argon Capital PLC for Royal Bank of Scotland (GBP), 2.71%, 12/31/2016 (b)(c) | 3,203,000 | 3,097,175 | ||||||
Boparan Finance PLC (GBP), 5.50%, 07/15/2021 (a) | 1,606,000 | 1,803,571 | ||||||
Corral Petroleum Holdings (EUR), 11.75%, 05/15/2021 (a)(d) | 2,290,000 | 2,386,962 | ||||||
CYBG PLC | ||||||||
(GBP), 8.00%, 12/08/2022 (a)(b)(c) | 2,640,000 | 2,936,338 | ||||||
(GBP), 5.00%, 02/09/2026 (a)(b) | 2,580,000 | 2,989,342 | ||||||
Galaxy Finco Ltd. (GBP), | 1,600,000 | 1,939,209 | ||||||
Inmarsat Finance PLC (USD), 4.88%, 05/15/2022 (a) | 6,717,000 | 6,368,388 | ||||||
International Personal Finance PLC (EUR), 5.75%, 04/07/2021 (a) | 2,163,000 | 2,184,479 | ||||||
Lloyds Bank PLC (GBP), | 2,638,000 | 5,698,048 | ||||||
Matalan Finance PLC (GBP), 6.88%, 06/01/2019 (a) | 2,480,000 | 2,325,377 | ||||||
Nationwide Building Society (GBP), 6.88%, 06/20/2019 (a)(b)(c) | 1,280,000 | 1,547,137 | ||||||
New Look Secured Issuer PLC (GBP), 6.50%, 07/01/2022 (a) | 1,264,000 | 1,393,692 | ||||||
Pizzaexpress Financing 2 PLC (GBP), 6.63%, 08/01/2021 (a) | 1,078,000 | 1,303,420 | ||||||
TVL Finnace PLC (GBP), 8.50%, 05/15/2023 (a) | 892,000 | 1,145,853 | ||||||
Virgin Media Secured Finance PLC (GBP), 5.50%, 01/15/2025 (a) | 1,754,100 | 2,193,180 | ||||||
| 44,430,254 | ||||||||
UNITED STATES (57.1%) | ||||||||
Adient Global Holdings Ltd. (USD), 4.88%, 08/15/2026 (a) | 3,753,000 | 3,700,833 | ||||||
Albertsons Cos LLC / Safeway, Inc. / New Albertson’s, Inc. / Albertson’s LLC (USD), 6.63%, 06/15/2024 (a) | 1,256,000 | 1,306,240 | ||||||
Albertsons Cos. LLC / Safeway, Inc. / New Albertson’s, Inc. / Albertson’s LLC (USD), 5.75%, 03/15/2025 (a) | 4,096,000 | 4,053,770 | ||||||
Alliance Data Systems Corp. (USD), 5.88%, 11/01/2021 (a) | 1,125,000 | 1,136,250 | ||||||
Ally Financial, Inc. (USD), 5.13%, 09/30/2024 | 5,845,000 | 6,181,087 | ||||||
Altice US Finance I Corp. (USD), 5.38%, 07/15/2023 (a) | 7,773,000 | 7,981,316 | ||||||
AMC Entertainment Holdings (GBP), 6.38%, 11/15/2024 (a) | 1,234,000 | 1,528,708 | ||||||
Antero Resources Corp. (USD), 5.13%, 12/01/2022 | 875,000 | 885,938 | ||||||
Avis Budget Car Rental LLC / Avis Budget Finance, Inc. | ||||||||
(USD), 5.50%, 04/01/2023 | 2,427,000 | 2,411,831 | ||||||
(USD), 6.38%, 04/01/2024 (a) | 978,000 | 987,780 | ||||||
(USD), 5.25%, 03/15/2025 (a) | 423,000 | 403,436 | ||||||
See accompanying Notes to Financial Statements.
Annual Report 2016
36
Statement of Investments (continued)
October 31, 2016
Aberdeen Global High Income Fund
| Shares or Principal Amount | Value (US$) | |||||||
Axalta Coating Systems LLC (USD), 4.88%, 08/15/2024 (a) | $ | 870,000 | $ | 885,225 | ||||
Blue Racer Midstream LLC / Blue Racer Finance Corp. (USD), 6.13%, 11/15/2022 (a) | 4,944,000 | 4,857,480 | ||||||
California Resources Corp. (USD), 8.00%, 12/15/2022 (a) | 1,155,000 | 785,400 | ||||||
Callon Petroleum Co. (USD), 6.13%, 10/01/2024 (a) | 548,000 | 565,810 | ||||||
Calpine Corp. (USD), 5.75%, 01/15/2025 | 6,830,000 | 6,667,787 | ||||||
Carrizo Oil & Gas, Inc. (USD), 6.25%, 04/15/2023 | 1,230,000 | 1,269,975 | ||||||
CCO Holdings LLC / CCO Holdings Capital Corp. | ||||||||
(USD), 5.75%, 02/15/2026 (a) | 7,558,000 | 7,893,386 | ||||||
(USD), 5.50%, 05/01/2026 (a) | 332,000 | 340,924 | ||||||
Cengage Learning, Inc. (USD), 9.50%, 06/15/2024 (a) | 6,071,000 | 5,752,272 | ||||||
CenturyLink, Inc. | ||||||||
Series W (USD), 6.75%, 12/01/2023 | 665,000 | 685,781 | ||||||
Series Y (USD), 7.50%, 04/01/2024 | 1,483,000 | 1,547,881 | ||||||
Cenveo Corp. (USD), 6.00%, 08/01/2019 (a) | 4,097,000 | 3,625,845 | ||||||
CHS/Community Health Systems, Inc. (USD), 6.88%, 02/01/2022 | 2,442,000 | 1,874,235 | ||||||
Citgo Holding, Inc. (USD), 10.75%, 02/15/2020 (a) | 1,094,000 | 1,119,025 | ||||||
Citigroup, Inc., Series T, FRN (USD), 6.25%, 08/15/2026 (b)(c) | 2,000,000 | 2,155,800 | ||||||
Constellation Brands, Inc. (USD), 4.75%, 12/01/2025 | 4,912,000 | 5,397,060 | ||||||
Continental Resources, Inc. (USD), 3.80%, 06/01/2024 | 3,952,000 | 3,655,600 | ||||||
DPH Holdings Corp. (USD), | 1,500,000 | 56,250 | ||||||
Dynegy, Inc. | ||||||||
(USD), 7.38%, 11/01/2022 | 5,655,000 | 5,481,816 | ||||||
(USD), 7.63%, 11/01/2024 | 1,641,000 | 1,579,463 | ||||||
EMI Music Publishing Group North America Holdings, Inc. (USD), 7.63%, 06/15/2024 (a) | 3,130,000 | 3,396,050 | ||||||
Endo Ltd. / Endo Finance LLC / Endo Finco, Inc. (USD), 6.00%, 07/15/2023 (a) | 6,091,000 | 5,329,625 | ||||||
Energy Future Intermediate Holding Co. LLC / EFIH Finance, Inc. (USD), 11.75%, 03/01/2022 (a)(g)(h) | 1,782,035 | 2,298,825 | ||||||
Ensco PLC (USD), 5.20%, 03/15/2025 | 4,123,000 | 3,364,121 | ||||||
Equinix, Inc. (USD), 5.88%, 01/15/2026 | 4,405,000 | 4,719,605 | ||||||
First Data Corp. | ||||||||
(USD), 7.00%, 12/01/2023 (a) | 3,311,000 | 3,476,550 | ||||||
(USD), 5.00%, 01/15/2024 (a) | 789,000 | 803,794 | ||||||
First Maryland Capital I (USD), 1.88%, 01/15/2027 (b) | 3,113,000 | 2,673,289 | ||||||
Florida East Coast Holdings Corp. | ||||||||
(USD), 6.75%, 05/01/2019(a) | 2,395,000 | 2,418,950 | ||||||
(USD), 9.75%, 05/01/2020(a)(e) | 1,553,000 | 1,545,235 | ||||||
Freeport-McMoRan, Inc. (USD), 3.55%, 03/01/2022 | 6,615,000 | 6,102,337 | ||||||
Fresh Market, Inc. (The) (USD), 9.75%, 05/01/2023 (a) | 3,025,000 | 2,586,375 | ||||||
Frontier Communications Corp. (USD), 6.88%, 01/15/2025 | 3,320,000 | 2,792,950 | ||||||
General Motors (Escrow Shares) | ||||||||
(USD), 8.80%, 03/01/2049 (f) | 7,200,000 | – | ||||||
(USD), 8.38%, 07/15/2049 (f) | 3,550,000 | – | ||||||
Goldman Sachs Group, Inc. (The), Series M, (USD), 5.38%, 05/10/2020 (b)(c) | 1,960,000 | 1,972,250 | ||||||
Goodyear Tire & Rubber Co. (The) (USD), 5.00%, 05/31/2026 | 2,734,000 | 2,764,758 | ||||||
Hardwoods Acquisition, Inc. (USD), 7.50%, 08/01/2021 (a) | 4,430,000 | 3,233,900 | ||||||
HCA, Inc. | ||||||||
(USD), 5.25%, 04/15/2025 | 2,377,000 | 2,495,850 | ||||||
(USD), 5.88%, 02/15/2026 | 5,923,000 | 6,233,957 | ||||||
(USD), 5.25%, 06/15/2026 | 260,000 | 272,350 | ||||||
HD Supply, Inc. (USD), 5.75%, 04/15/2024 (a) | 4,621,000 | 4,863,603 | ||||||
Hilcorp Energy I LP / Hilcorp Finance Co. (USD), 5.75%, 10/01/2025 (a) | 2,628,000 | 2,647,710 | ||||||
Hornbeck Offshore Services, Inc. (USD), 5.00%, 03/01/2021 | 3,788,000 | 2,272,800 | ||||||
JBS USA LUX SA / JBS USA Finance, Inc. (USD), 5.75%, 06/15/2025 (a) | 4,652,000 | 4,582,220 | ||||||
JC Penney Corp., Inc. (USD), 5.88%, 07/01/2023 (a) | 714,000 | 737,348 | ||||||
Kinder Morgan, Inc. (USD), 7.80%, 08/01/2031 | 2,929,000 | 3,638,952 | ||||||
Kratos Defense & Security Solutions, Inc. (USD), 7.00%, 05/15/2019 | 3,305,000 | 3,024,075 | ||||||
Landry’s, Inc. (USD), 6.75%, 10/15/2024 (a) | 4,185,000 | 4,279,163 | ||||||
Lennar Corp. (USD), 4.88%, 12/15/2023 | 4,696,000 | 4,813,400 | ||||||
Level 3 Financing, Inc. | ||||||||
(USD), 5.38%, 08/15/2022 | 2,729,000 | 2,810,870 | ||||||
(USD), 5.38%, 01/15/2024 | 1,000,000 | 1,022,500 | ||||||
Meritor, Inc. (USD), 6.25%, 02/15/2024 | 2,580,000 | 2,557,425 | ||||||
MGM Resorts International (USD), 6.00%, 03/15/2023 | 5,210,000 | 5,652,850 | ||||||
Momentive Performance Materials, Inc. | ||||||||
(USD), 8.88%, 10/15/2020 (f) | 14,578,000 | – | ||||||
(USD), 3.88%, 10/24/2021 | 6,475,000 | 5,795,125 | ||||||
Murphy Oil Corp. (USD), 6.88%, 08/15/2024 | 659,000 | 696,044 | ||||||
Nationstar Mortgage LLC / Nationstar Capital Corp. (USD), 6.50%, 07/01/2021 | 3,475,000 | 3,466,313 | ||||||
Neiman Marcus Group Ltd., LLC (USD), 8.00%, 10/15/2021 (a) | 3,118,000 | 2,587,940 | ||||||
NewStar Financial, Inc. (USD), 7.25%, 05/01/2020 | 3,638,000 | 3,656,190 | ||||||
NRG Energy, Inc. | ||||||||
(USD), 6.63%, 03/15/2023 | 1,074,000 | 1,076,685 | ||||||
(USD), 7.25%, 05/15/2026 (a) | 1,298,000 | 1,283,605 | ||||||
Oasis Petroleum, Inc. | ||||||||
(USD), 6.50%, 11/01/2021 | 993,000 | 991,759 | ||||||
(USD), 6.88%, 01/15/2023 | 4,270,000 | 4,205,950 | ||||||
PBF Logistics LP / PBF Logistics Finance Corp. (USD), 6.88%, 05/15/2023 | 1,767,000 | 1,722,825 | ||||||
PNC Preferred Funding Trust I (USD), 2.50%, 03/15/2017 (a)(b)(c) | 6,180,000 | 6,033,225 | ||||||
Post Holdings, Inc. (USD), | 3,410,000 | 3,316,225 | ||||||
Rite Aid Corp. (USD), 6.13%, 04/01/2023 (a) | 6,850,000 | 7,252,437 | ||||||
Rowan Cos., Inc. (USD), 4.88%, 06/01/2022 | 2,000,000 | 1,730,000 | ||||||
See accompanying Notes to Financial Statements.
2016 Annual Report
37
Statement of Investments (continued)
October 31, 2016
Aberdeen Global High Income Fund
| Shares or Principal Amount | Value (US$) | |||||||
Sabine Pass Liquefaction LLC | ||||||||
(USD), 5.75%, 05/15/2024 | $ | 694,000 | $ | 737,375 | ||||
(USD), 5.88%, 06/30/2026 (a) | 1,857,000 | 2,008,253 | ||||||
(USD), 5.00%, 03/15/2027 (a) | 2,015,000 | 2,055,300 | ||||||
Sanchez Energy Corp. (USD), 6.13%, 01/15/2023 | 1,200,000 | 1,032,000 | ||||||
Scientific Games International, Inc. (USD), 7.00%, 01/01/2022 (a) | 5,397,000 | 5,767,234 | ||||||
Sealed Air Corp. | ||||||||
(USD), 5.25%, 04/01/2023 (a) | 270,000 | 284,850 | ||||||
(USD), 5.50%, 09/15/2025 (a) | 3,780,000 | 4,039,875 | ||||||
Service Corp. International (USD), 5.38%, 05/15/2024 | 3,904,000 | 4,118,720 | ||||||
Sinclair Television Group, Inc. (USD), 5.63%, 08/01/2024 (a) | 5,660,000 | 5,744,900 | ||||||
Springs Industries, Inc. (USD), 6.25%, 06/01/2021 | 4,607,000 | 4,814,315 | ||||||
Sprint Corp. (USD), 7.88%, 09/15/2023 | 6,420,000 | 6,371,850 | ||||||
State Street Capital Trust IV (USD), 1.85%, 06/01/2077 (b) | 3,587,000 | 3,089,304 | ||||||
Sunoco LP / Sunoco Finance Corp. (USD), 6.25%, 04/15/2021 | 4,339,000 | 4,458,323 | ||||||
T-Mobile USA, Inc. | ||||||||
(USD), 6.00%, 04/15/2024 | 756,000 | 806,085 | ||||||
(USD), 6.50%, 01/15/2026 | 5,276,000 | 5,796,741 | ||||||
Tenet Healthcare Corp. | ||||||||
(USD), 4.35%, 06/15/2020 (b) | 2,114,000 | 2,140,425 | ||||||
(USD), 6.75%, 06/15/2023 | 5,506,000 | 5,072,402 | ||||||
TerraForm Power Operating LLC (USD), 9.38%, 02/01/2023 (a)(i) | 6,932,000 | 6,983,990 | ||||||
TransDigm, Inc. | ||||||||
(USD), 6.50%, 07/15/2024 | 1,370,000 | 1,448,775 | ||||||
(USD), 6.50%, 05/15/2025 | 2,129,000 | 2,227,466 | ||||||
(USD), 6.38%, 06/15/2026 (a) | 1,257,000 | 1,291,693 | ||||||
Tronox Finance LLC (USD), 7.50%, 03/15/2022 (a) | 3,506,000 | 3,155,400 | ||||||
United Rentals North America, Inc. | ||||||||
(USD), 5.75%, 11/15/2024 | 2,000,000 | 2,085,000 | ||||||
(USD), 5.50%, 07/15/2025 | 4,725,000 | 4,801,781 | ||||||
Valeant Pharmaceuticals International | ||||||||
(USD), 6.38%, 10/15/2020 (a) | 1,745,000 | 1,513,788 | ||||||
Valeant Pharmaceuticals International, Inc. | ||||||||
(EUR), 4.50%, 05/15/2023 (a) | 6,150,000 | 5,191,645 | ||||||
(USD), 5.88%, 05/15/2023 (a) | 2,625,000 | 2,080,313 | ||||||
Whiting Petroleum Corp. (USD), 5.75%, 03/15/2021 | 505,000 | 470,913 | ||||||
WR Grace & Co-Conn | ||||||||
(USD), 5.13%, 10/01/2021(a) | 3,626,000 | 3,870,755 | ||||||
(USD), 5.63%, 10/01/2024(a) | 2,830,000 | 3,074,088 | ||||||
Zayo Group LLC / Zayo Capital, Inc. (USD), 6.00%, 04/01/2023 | 5,403,000 | 5,713,672 | ||||||
| 334,219,445 | ||||||||
VIETNAM (0.5%) |
| |||||||
Vingroup JSC (USD), | 2,725,000 | 2,889,863 | ||||||
Total Corporate Bonds | 511,806,067 | |||||||
GOVERNMENT BONDS (2.4%) |
| |||||||
ARGENTINA (1.4%) |
| |||||||
Argentina Bonar Bonds (USD), 8.75%, 05/07/2024 (h) | 2,672,897 | 3,106,500 | ||||||
Argentine Republic Government International Bond (USD), 7.50%, 04/22/2026 (a) | 4,585,000 | 5,020,575 | ||||||
| 8,127,075 | ||||||||
GHANA (0.7%) |
| |||||||
Republic of Ghana (USD), | 4,560,000 | 4,382,639 | ||||||
PARAGUAY (0.3%) | ||||||||
Paraguay Government International Bond (USD), 5.00%, 04/15/2026 (a) | 1,620,000 | 1,725,300 | ||||||
Total Government Bonds | 14,235,014 | |||||||
GOVERNMENT AGENCIES (1.3%) | ||||||||
INDONESIA (1.3%) | ||||||||
Pertamina Persero PT (USD), 4.30%, 05/20/2023 (a) | 7,032,000 | 7,300,995 | ||||||
Total Government Agencies | 7,300,995 | |||||||
BANK LOANS (2.2%) | ||||||||
ITALY (0.5%) | ||||||||
Inter Media Communication (FCE) (EUR), 5.50%, 05/28/2019 | 2,670,647 | 2,917,045 | ||||||
UNITED STATES (1.7%) | ||||||||
Asurion LLC (USD), 8.50%, 03/03/2021 (b) | 3,936,000 | 3,958,959 | ||||||
Landry’s, Inc., 2016 Term Loan B (USD), 4.00%, 10/04/2023 | 1,576,000 | 1,587,492 | ||||||
Ligado Networks LLC (USD), 9.75%, 12/07/2020 | 3,588,133 | 3,368,361 | ||||||
Lonestar Intermediate Super Holdings, LLC, Term Loan B (USD), 10.00%, 08/31/2021 | 800,000 | 808,250 | ||||||
| 9,723,062 | ||||||||
Total Bank Loans | 12,640,107 | |||||||
COMMON STOCKS (0.2%) | ||||||||
NORWAY (0.2%) | ||||||||
Deep Ocean (e)(f)(j) | 1,427,968 | 1,071,207 | ||||||
Total Common Stocks | 1,071,207 | |||||||
PREFERRED STOCKS (0.8%) | ||||||||
UNITED STATES (0.8%) | ||||||||
GMAC Capital Trust I, Preferred Shares, Series 2 (USD) (b) | 176,738 | 4,512,121 | ||||||
Total Preferred Stocks | 4,512,121 | |||||||
EXCHANGE TRADED FUNDS (2.0%) | ||||||||
REPUBLIC OF IRELAND (2.0%) | ||||||||
iShares Euro High Yield Corporate Bond UCITS ETF | 104,500 | 12,100,128 | ||||||
Total Exchange Traded Funds | 12,100,128 | |||||||
See accompanying Notes to Financial Statements.
Annual Report 2016
38
Statement of Investments (continued)
October 31, 2016
Aberdeen Global High Income Fund
| Shares or Principal Amount | Value (US$) | |||||||
SHORT-TERM INVESTMENT (1.4%) | ||||||||
UNITED STATES (1.4%) | ||||||||
State Street Institutional U.S. Government Money Market Fund (k) | $ | 8,417,278 | $ | 8,417,278 | ||||
Total Short-Term Investment | 8,417,278 | |||||||
Total Investments | 572,082,917 | |||||||
Other assets in excess of liabilities—2.2% | 12,751,651 | |||||||
Net Assets—100.0% | $ | 584,834,568 | ||||||
| (a) | Denotes a security issued under Regulation S or Rule 144A. |
| (b) | Variable or Floating Rate Security. Rate disclosed is as of October 31, 2016. |
| (c) | Perpetual bond. This is a bond that has no maturity date, is redeemable and pays a steady stream of interest indefinitely. |
| (d) | Payment-in-kind. This is a type of bond that pays interest in additional bonds rather than in cash. |
| (e) | The Fund’s adviser has deemed this security to be illiquid based upon procedures approved by the Board of Trustees. Illiquid securities held by the Fund represent 1.54% of net assets as of October 31, 2016. |
| (f) | This security was fair valued by the Fund’s pricing committee as approved by the Fund’s Board of Trustees. Note 2(a) of the accompanying Notes to Financial Statements. |
| (g) | Security is in default. |
| (h) | Inflation linked security. |
| (i) | Indicates a stepped coupon bond. This bond was issued with a low coupon that gradually increases over the life of the bond. |
| (j) | Investment in affiliate. |
| (k) | Registered investment company advised by State Street Global Advisors. |
| (l) | See accompanying Notes to Financial Statements for tax unrealized appreciation/depreciation of securities. |
| CAD | Canadian Dollar |
| ETF | Exchange-Traded Fund |
| EUR | Euro Currency |
| GBP | British Pound Sterling |
| NOK | Norwegian Krone |
| USD | U.S. Dollar |
See accompanying Notes to Financial Statements.
2016 Annual Report
39
Statement of Investments (concluded)
October 31, 2016
Aberdeen Global High Income Fund
At October 31, 2016, the Fund’s open forward foreign currency exchange contracts were as follows:
| Purchase Contracts Settlement Date* | Counterparty | Amount Purchased | Amount Sold | Fair Value | Unrealized Appreciation/ (Depreciation) | |||||||||||||||||||||||
| British Pound/United States Dollar | ||||||||||||||||||||||||||||
03/01/2017 | Barclays Bank PLC | GBP | 7,158,000 | USD | 10,436,929 | $ | 8,785,102 | $ | (1,651,827 | ) | ||||||||||||||||||
03/01/2017 | Citibank N.A. | GBP | 10,136,551 | USD | 13,270,493 | 12,440,715 | (829,778 | ) | ||||||||||||||||||||
| Canadian Dollar/United States Dollar | ||||||||||||||||||||||||||||
02/10/2017 | Citibank N.A. | CAD | 1,644,000 | USD | 1,255,037 | 1,226,734 | (28,303 | ) | ||||||||||||||||||||
02/10/2017 | Goldman Sachs & Co. | CAD | 169,000 | USD | 127,947 | 126,106 | (1,841 | ) | ||||||||||||||||||||
02/10/2017 | HSBC | CAD | 2,586,000 | USD | 1,954,990 | 1,929,644 | (25,346 | ) | ||||||||||||||||||||
| Euro/United States Dollar | ||||||||||||||||||||||||||||
02/10/2017 | Barclays Bank PLC | EUR | 11,848,942 | USD | 13,227,158 | 13,068,021 | (159,137 | ) | ||||||||||||||||||||
02/10/2017 | Deutsche Bank AG | EUR | 9,000,000 | USD | 10,017,423 | 9,925,965 | (91,458 | ) | ||||||||||||||||||||
02/10/2017 | Goldman Sachs & Co. | EUR | 1,059,000 | USD | 1,175,346 | 1,167,955 | (7,391 | ) | ||||||||||||||||||||
02/10/2017 | HSBC | EUR | 20,134,000 | USD | 22,596,160 | 22,205,488 | (390,672 | ) | ||||||||||||||||||||
02/10/2017 | Royal Bank of Canada | EUR | 4,000,000 | USD | 4,490,680 | 4,411,540 | (79,140 | ) | ||||||||||||||||||||
| Norwegian Krone/United States Dollar | ||||||||||||||||||||||||||||
02/13/2017 | Barclays Bank PLC | NOK | 30,667,000 | USD | 3,589,114 | 3,712,935 | 123,821 | |||||||||||||||||||||
| 02/13/2017 | Royal Bank of Canada | NOK | 10,110,000 | USD | 1,236,249 | 1,224,044 | (12,205 | ) | ||||||||||||||||||||
| $ | 80,224,249 | $ | (3,153,277 | ) | ||||||||||||||||||||||||
| Sale Contracts Settlement Date* | Counterparty | Amount Purchased | Amount Sold | Fair Value | Unrealized Appreciation/ (Depreciation) | |||||||||||||||||||||||
| United States Dollar/British Pound | ||||||||||||||||||||||||||||
03/01/2017 | Deutsche Bank AG | USD | 1,291,237 | GBP | 889,500 | $ | 1,091,694 | $ | 199,543 | |||||||||||||||||||
03/01/2017 | JPMorgan Chase Bank N.A. | USD | 1,605,039 | GBP | 1,311,000 | 1,609,007 | (3,968 | ) | ||||||||||||||||||||
03/01/2017 | Royal Bank of Canada | USD | 52,923,650 | GBP | 37,904,000 | 46,520,050 | 6,403,600 | |||||||||||||||||||||
03/01/2017 | Westpac Banking Corp. | USD | 2,359,799 | GBP | 1,938,000 | 2,378,531 | (18,732 | ) | ||||||||||||||||||||
| United States Dollar/Canadian Dollar | ||||||||||||||||||||||||||||
02/10/2017 | Citibank N.A. | USD | 8,414,825 | CAD | �� | 11,726,000 | 8,749,807 | (334,982 | ) | |||||||||||||||||||
| United States Dollar/Euro | ||||||||||||||||||||||||||||
02/10/2017 | Barclays Bank PLC | USD | 8,882,925 | EUR | 7,721,000 | 8,515,376 | 367,549 | |||||||||||||||||||||
02/10/2017 | Citibank N.A. | USD | 53,415,476 | EUR | 48,654,000 | 53,659,769 | (244,293 | ) | ||||||||||||||||||||
02/10/2017 | Royal Bank of Canada | USD | 205,207 | EUR | 180,000 | 198,519 | 6,688 | |||||||||||||||||||||
02/10/2017 | Westpac Banking Corp. | USD | 34,112,366 | EUR | 29,645,500 | 32,695,579 | 1,416,787 | |||||||||||||||||||||
| United States Dollar/Norwegian Krone | ||||||||||||||||||||||||||||
| 02/13/2017 | Royal Bank of Canada | USD | 5,789,182 | NOK | 49,552,500 | 5,999,451 | (210,269 | ) | ||||||||||||||||||||
| $ | 161,417,783 | $ | 7,581,923 | |||||||||||||||||||||||||
| * | Certain contracts with different trade dates and like characteristics have been shown net. |
See accompanying Notes to Financial Statements.
Annual Report 2016
40
Statements of Assets and Liabilities
October 31, 2016
| Aberdeen Select International Equity Fund | Aberdeen Select International Equity Fund II | Aberdeen Total Return Bond Fund | Aberdeen Global High Income Fund | |||||||||||||
Assets: | ||||||||||||||||
Investments in securities, at fair value | $ | 213,061,643 | $ | 101,730,357 | $ | 511,040,558 | $ | 562,594,432 | ||||||||
Affiliated securities, at fair value (Note 6) | – | – | – | 1,071,207 | ||||||||||||
Short-term investments | 148 | 1,334,756 | 17,439,605 | 8,417,278 | ||||||||||||
|
|
|
|
|
|
|
| |||||||||
Total investments | 213,061,791 | 103,065,113 | 528,480,163 | 572,082,917 | ||||||||||||
|
|
|
|
|
|
|
| |||||||||
Foreign currency, at fair value | 964,534 | 15,866 | 305,970 | – | ||||||||||||
Cash | – | – | 701,276 | – | ||||||||||||
Cash collateral pledged for futures | – | – | 164,880 | – | ||||||||||||
Cash collateral pledged for swaps | – | – | 140,638 | – | ||||||||||||
Receivable for investments sold | – | – | 14,099,807 | 7,479,698 | ||||||||||||
Interest and dividends receivable | 354,580 | 178,110 | 2,785,582 | 9,739,990 | ||||||||||||
Unrealized appreciation on forward foreign currency exchange contracts | – | – | 2,124,931 | 8,517,988 | ||||||||||||
Receivable for capital shares issued | 15,784 | 23,605 | 213,415 | 186,262 | ||||||||||||
Variation margin receivable for futures contracts | – | – | 137,112 | – | ||||||||||||
Variation margin on swap contracts | – | – | 4,500 | – | ||||||||||||
Tax reclaim receivable | 954,140 | 470,466 | – | – | ||||||||||||
Other receivables | 295,476 | 227,764 | 94,525 | 116,647 | ||||||||||||
Prepaid expenses | 3,052 | 1,586 | 10,727 | 14,137 | ||||||||||||
|
|
|
|
|
|
|
| |||||||||
Total assets | 215,649,357 | 103,982,510 | 549,263,526 | 598,137,639 | ||||||||||||
|
|
|
|
|
|
|
| |||||||||
Liabilities: | ||||||||||||||||
Due to custodian | – | – | – | 540,716 | ||||||||||||
Payable for investments purchased | 128,837 | 49,106 | 26,849,941 | 7,047,949 | ||||||||||||
Unrealized depreciation on forward foreign currency exchange contracts | – | – | 1,941,817 | 4,089,342 | ||||||||||||
Payable for capital shares redeemed | 212,756 | 99,766 | 469,418 | 973,515 | ||||||||||||
Accrued foreign capital gains tax | – | – | 27,416 | – | ||||||||||||
Payable for income taxes on recovered tax refunds (Note 2g) | 168,213 | 47,267 | – | – | ||||||||||||
Accrued expenses and other payables: | ||||||||||||||||
Investment advisory fees | 167,281 | 80,354 | 124,396 | 425,218 | ||||||||||||
Distribution fees | 39,777 | 12,850 | 13,851 | 50,375 | ||||||||||||
Audit fees | 16,965 | 15,486 | 19,837 | 28,362 | ||||||||||||
Custodian fees | 13,474 | 9,802 | 25,804 | 25,844 | ||||||||||||
Legal fees | 12,090 | 5,470 | 49,929 | 894 | ||||||||||||
Transfer agent fees | 8,429 | 9,650 | 12,586 | 19,886 | ||||||||||||
Other | 693,904 | 72,577 | 151,517 | 100,970 | ||||||||||||
|
|
|
|
|
|
|
| |||||||||
Total liabilities | 1,461,726 | 402,328 | 29,686,512 | 13,303,071 | ||||||||||||
|
|
|
|
|
|
|
| |||||||||
Net Assets | $ | 214,187,631 | $ | 103,580,182 | $ | 519,577,014 | $ | 584,834,568 | ||||||||
|
|
|
|
|
|
|
| |||||||||
Cost: | ||||||||||||||||
Investments in securities, at cost | $ | 272,940,338 | $ | 115,919,127 | $ | 499,053,021 | $ | 567,279,695 | ||||||||
Affiliated securities, at cost (Note 6) | – | – | – | 30,083,125 | ||||||||||||
Short-term investments | 148 | 1,334,756 | 17,439,605 | 8,417,278 | ||||||||||||
Foreign currency | 2,604,812 | 15,857 | 325,600 | 162 | ||||||||||||
Net Assets Consist of: | ||||||||||||||||
Par value | $ | 9,585 | $ | 10,571 | $ | 38,024 | $ | 68,980 | ||||||||
Paid in capital in excess of par value | 2,307,974,154 | 1,472,727,898 | 493,108,391 | 822,019,290 | ||||||||||||
Accumulated net investment income/(loss) | 996,362 | 1,199,505 | (1,014,347 | ) | (73,080 | ) | ||||||||||
Accumulated net realized gain/(loss) from investments and foreign currency transactions | (2,033,202,923 | ) | (1,356,134,674 | ) | 15,016,596 | (207,846,150 | ) | |||||||||
Net unrealized appreciation/(depreciation) on investments and translation of assets and liabilities denominated in foreign currencies | (61,589,547 | ) | (14,223,118 | ) | 12,428,350 | (29,334,472 | ) | |||||||||
|
|
|
|
|
|
|
| |||||||||
Net Assets | $ | 214,187,631 | $ | 103,580,182 | $ | 519,577,014 | $ | 584,834,568 | ||||||||
|
|
|
|
|
|
|
| |||||||||
2016 Annual Report
41
Statements of Assets and Liabilities (concluded)
October 31, 2016
| Aberdeen Select International Equity Fund | Aberdeen Select International Equity Fund II | Aberdeen Total Return Bond Fund | Aberdeen Global High Income Fund | |||||||||||||
Net Assets | ||||||||||||||||
Class A Shares | $ | 182,093,762 | $ | 59,389,552 | $ | 65,241,765 | $ | 233,368,832 | ||||||||
Institutional Class Shares | 32,093,869 | 44,190,630 | 454,335,249 | 351,465,736 | ||||||||||||
|
|
|
|
|
|
|
| |||||||||
Total | $ | 214,187,631 | $ | 103,580,182 | $ | 519,577,014 | $ | 584,834,568 | ||||||||
|
|
|
|
|
|
|
| |||||||||
Shares Outstanding | ||||||||||||||||
Class A Shares | 8,179,661 | 6,064,397 | 4,717,689 | 26,522,256 | ||||||||||||
Institutional Class Shares | 1,405,349 | 4,506,322 | 33,306,553 | 42,457,653 | ||||||||||||
|
|
|
|
|
|
|
| |||||||||
Total | 9,585,010 | 10,570,719 | 38,024,242 | 68,979,909 | ||||||||||||
|
|
|
|
|
|
|
| |||||||||
Net asset value and redemption price per share | ||||||||||||||||
Class A Shares | $ | 22.26 | $ | 9.79 | $ | 13.83 | $ | 8.80 | ||||||||
Institutional Class Shares | $ | 22.84 | $ | 9.81 | $ | 13.64 | $ | 8.28 | ||||||||
Amounts listed as “–” are $0 or round to $0.
See accompanying Notes to Fnancial Statements.
Annual Report 2016
42
Statements of Operations
For the Year Ended October 31, 2016
| Aberdeen Select International Equity Fund | Aberdeen Select International Equity Fund II | Aberdeen Total Return Bond Fund | Aberdeen Global High Income Fund | |||||||||||||
INVESTMENT INCOME: | ||||||||||||||||
Dividend income | $ | 7,274,610 | $ | 3,565,923 | $ | – | $ | 2,150,781 | ||||||||
Interest income | 1,323,766 | 1,250 | 28,575,841 | 55,783,633 | ||||||||||||
Foreign tax withholding | (643,759 | ) | (328,844 | ) | (134,017 | ) | (675 | ) | ||||||||
Other income | 295,426 | (b) | 233,670 | (b) | 95,378 | 113,210 | ||||||||||
|
|
|
|
|
|
|
| |||||||||
| 8,250,043 | 3,471,999 | 28,537,202 | 58,046,949 | |||||||||||||
|
|
|
|
|
|
|
| |||||||||
EXPENSES: | ||||||||||||||||
Investment advisory fees | 2,121,979 | 1,047,709 | 3,163,946 | 5,584,740 | ||||||||||||
Distribution fees Class A | 504,037 | 163,666 | 176,629 | 831,389 | ||||||||||||
Transfer agent fees | 49,578 | 52,789 | 75,283 | 121,716 | ||||||||||||
Trustee fees | 83,751 | 42,240 | 332,921 | 246,845 | ||||||||||||
Legal fees | 11,208 | 7,958 | 141,257 | 64,330 | ||||||||||||
Printing fees | 44,888 | 39,878 | 87,715 | 118,028 | ||||||||||||
Custodian fees | 85,800 | 66,189 | 145,380 | 165,793 | ||||||||||||
Registration and filing fees | 32,935 | 39,226 | 51,933 | 45,544 | ||||||||||||
Audit fees | 38,508 | 33,987 | 43,859 | 62,146 | ||||||||||||
Income taxes on recovered tax refunds (a) | 168,213 | 47,267 | – | – | ||||||||||||
Other | 128,500 | 86,927 | 243,128 | 444,976 | ||||||||||||
|
|
|
|
|
|
|
| |||||||||
Total expenses before reimbursed/waived expenses | 3,269,397 | 1,627,836 | 4,462,051 | 7,685,507 | ||||||||||||
Interest expense (Note 11) | 681 | 538 | – | 1,351 | ||||||||||||
|
|
|
|
|
|
|
| |||||||||
Total operating expenses before reimbursed/waived expenses | 3,270,078 | 1,628,374 | 4,462,051 | 7,686,858 | ||||||||||||
Expenses reimbursed (Note 3) | – | – | (262,142 | ) | (367,227 | ) | ||||||||||
Expenses waived by investment adviser (Note 3) | (11,789 | ) | (5,821 | ) | (45,199 | ) | (42,959 | ) | ||||||||
|
|
|
|
|
|
|
| |||||||||
Total operating expenses | 3,258,289 | 1,622,553 | 4,154,710 | 7,276,672 | ||||||||||||
|
|
|
|
|
|
|
| |||||||||
Net Investment Income | 4,991,754 | 1,849,446 | 24,382,492 | 50,770,277 | ||||||||||||
|
|
|
|
|
|
|
| |||||||||
Realized gain on investment transactions | (38,579,323 | ) | (16,056,722 | ) | 20,667,830 | (145,274,618 | ) | |||||||||
Realized gain on credit default swap contracts | – | – | 6,024 | 3,493,426 | ||||||||||||
Realized loss on futures contracts | – | – | (1,031,991 | ) | – | |||||||||||
Realized loss on written options | – | – | (33,520 | ) | – | |||||||||||
Realized gain/(loss) on foreign currency transactions | (1,823,696 | ) | (1,801,364 | ) | (6,345,552 | ) | 10,579,225 | |||||||||
Payment from affiliate (Note 3) | 113,111 | 127,579 | – | – | ||||||||||||
|
|
|
|
|
|
|
| |||||||||
Net realized gain/(loss) from investments and foreign currency transactions | (40,289,908 | ) | (17,730,507 | ) | 13,262,791 | (131,201,967 | ) | |||||||||
|
|
|
|
|
|
|
| |||||||||
Net change in unrealized appreciation/(depreciation) on investment transactions | 35,039,863 | 13,953,196 | 9,213,415 | 76,235,199 | ||||||||||||
Net change in unrealized appreciation/depreciation on credit default swap contracts | – | – | (9,533 | ) | (3,274,089 | ) | ||||||||||
Net change in unrealized appreciation/depreciation on futures contracts | – | – | 449,001 | – | ||||||||||||
Net change in unrealized appreciation/(depreciation) on translation of assets and liabilities denominated in foreign currencies | (48,056 | ) | 953,657 | 1,004,531 | (177,955 | ) | ||||||||||
|
|
|
|
|
|
|
| |||||||||
Net change in unrealized appreciation/(depreciation) from investments and translation of assets and liabilities denominated in foreign currencies | 34,991,807 | 14,906,853 | 10,657,414 | 72,783,155 | ||||||||||||
|
|
|
|
|
|
|
| |||||||||
Net realized/unrealized gain/(loss) from investments and foreign currency transactions | (5,298,101 | ) | (2,823,654 | ) | 23,920,205 | (58,418,812 | ) | |||||||||
|
|
|
|
|
|
|
| |||||||||
CHANGE IN NET ASSETS RESULTING FROM OPERATIONS | $ | (306,347 | ) | $ | (974,208 | ) | $ | 48,302,697 | $ | (7,648,535 | ) | |||||
|
|
|
|
|
|
|
| |||||||||
| (a) | See note 2g of the Notes to Financial Statements |
| (b) | Other income includes a one-time reimbursement for overbilling of prior year custodian out-of-pocket fees. |
Amounts listed as “–” are $0 or round to $0.
See accompanying Notes to Financial Statements.
2016 Annual Report
43
Statements of Changes in Net Assets
| Aberdeen Select International Equity Fund | Aberdeen Select International Equity Fund II | |||||||||||||||
| Year Ended October 31, 2016 | Year Ended October 31, 2015 | Year Ended October 31, 2016 | Year Ended October 31, 2015 | |||||||||||||
FROM INVESTMENT ACTIVITIES: | ||||||||||||||||
Operations: | ||||||||||||||||
Net investment income | $ | 4,991,754 | $ | 9,327,807 | $ | 1,849,446 | $ | 3,821,302 | ||||||||
Net realized loss from investments and foreign currency transactions (including payment from affiliate) | (40,289,908 | ) | (41,765,286 | ) | (17,730,507 | ) | (3,888,799 | ) | ||||||||
Net change in unrealized appreciation/(depreciation) on investments and translation of assets and liabilities denominated in foreign currencies | 34,991,807 | (24,664,324 | ) | 14,906,853 | (27,451,716 | ) | ||||||||||
|
|
|
|
|
|
|
| |||||||||
Changes in net assets resulting from operations | (306,347 | ) | (57,101,803 | ) | (974,208 | ) | (27,519,213 | ) | ||||||||
|
|
|
|
|
|
|
| |||||||||
Distributions to Shareholders From: | ||||||||||||||||
Net investment income: | ||||||||||||||||
Class A | (7,266,740 | ) | (16,428,379 | ) | (2,281,685 | ) | (4,809,380 | ) | ||||||||
Institutional Class | (1,312,755 | ) | (3,496,500 | ) | (2,004,083 | ) | (4,729,021 | ) | ||||||||
|
|
|
|
|
|
|
| |||||||||
Change in net assets from shareholder distributions | (8,579,495 | ) | (19,924,879 | ) | (4,285,768 | ) | (9,538,401 | ) | ||||||||
|
|
|
|
|
|
|
| |||||||||
Common Stock Transactions: | ||||||||||||||||
Change in net assets from capital transactions | (63,004,165 | ) | (116,820,137 | ) | (39,423,360 | ) | (43,730,663 | ) | ||||||||
|
|
|
|
|
|
|
| |||||||||
Change in net assets | (71,890,007 | ) | (193,846,819 | ) | (44,683,336 | ) | (80,788,277 | ) | ||||||||
|
|
|
|
|
|
|
| |||||||||
Net Assets: | ||||||||||||||||
Beginning of year | 286,077,638 | 479,924,457 | 148,263,518 | 229,051,795 | ||||||||||||
|
|
|
|
|
|
|
| |||||||||
End of year | $ | 214,187,631 | $ | 286,077,638 | $ | 103,580,182 | $ | 148,263,518 | ||||||||
|
|
|
|
|
|
|
| |||||||||
Accumulated net investment income at end of year | $ | 996,362 | $ | 7,683,121 | $ | 1,199,505 | $ | 3,787,566 | ||||||||
|
|
|
|
|
|
|
| |||||||||
CAPITAL TRANSACTIONS: | ||||||||||||||||
Class A Shares | ||||||||||||||||
Proceeds from shares issued | $ | 3,520,938 | $ | 4,811,603 | $ | 3,302,327 | $ | 11,051,363 | ||||||||
Dividends reinvested | 7,047,478 | 16,112,995 | 2,211,187 | 4,669,220 | ||||||||||||
Cost of shares redeemed | (63,472,070 | ) | (111,824,230 | ) | (22,625,201 | ) | (37,598,671 | ) | ||||||||
|
|
|
|
|
|
|
| |||||||||
Total Class A | (52,903,654 | ) | (90,899,632 | ) | (17,111,687 | ) | (21,878,088 | ) | ||||||||
|
|
|
|
|
|
|
| |||||||||
Institutional Class Shares | ||||||||||||||||
Proceeds from shares issued | 1,091,627 | 1,723,909 | 3,506,655 | 4,387,592 | ||||||||||||
Dividends reinvested | 1,259,027 | 3,368,549 | 1,788,327 | 4,113,653 | ||||||||||||
Cost of shares redeemed | (12,451,165 | ) | (31,012,963 | ) | (27,606,655 | ) | (30,353,820 | ) | ||||||||
|
|
|
|
|
|
|
| |||||||||
Total Institutional Class | (10,100,511 | ) | (25,920,505 | ) | (22,311,673 | ) | (21,852,575 | ) | ||||||||
|
|
|
|
|
|
|
| |||||||||
Change in net assets from capital transactions: | $ | (63,004,165 | ) | $ | (116,820,137 | ) | $ | (39,423,360 | ) | $ | (43,730,663 | ) | ||||
|
|
|
|
|
|
|
| |||||||||
SHARE TRANSACTIONS: | ||||||||||||||||
Class A Shares | ||||||||||||||||
Issued | 169,839 | 189,629 | 336,523 | 1,026,899 | ||||||||||||
Reinvested | 345,804 | 637,886 | 244,619 | 422,554 | ||||||||||||
Redeemed | (2,960,685 | ) | (4,413,829 | ) | (2,415,815 | ) | (3,391,374 | ) | ||||||||
|
|
|
|
|
|
|
| |||||||||
Total Class A Shares | (2,445,042 | ) | (3,586,314 | ) | (1,834,673 | ) | (1,941,921 | ) | ||||||||
|
|
|
|
|
|
|
| |||||||||
Institutional Class Shares | ||||||||||||||||
Issued | 48,753 | 66,093 | 364,152 | 391,640 | ||||||||||||
Reinvested | 60,385 | 130,311 | 198,089 | 372,614 | ||||||||||||
Redeemed | (568,512 | ) | (1,189,930 | ) | (2,926,559 | ) | (2,763,043 | ) | ||||||||
|
|
|
|
|
|
|
| |||||||||
Total Institutional Class Shares | (459,374 | ) | (993,526 | ) | (2,364,318 | ) | (1,998,789 | ) | ||||||||
|
|
|
|
|
|
|
| |||||||||
Total change in shares: | (2,904,416 | ) | (4,579,840 | ) | (4,198,991 | ) | (3,940,710 | ) | ||||||||
|
|
|
|
|
|
|
| |||||||||
Amounts listed as “–” are $0 or round to $0.
See accompanying Notes to Financial Statements.
Annual Report 2016
44
Statements of Changes in Net Assets
| Aberdeen Total Return Bond Fund | Aberdeen Global High Income Fund | |||||||||||||||
| Year Ended October 31, 2016 | Year Ended October 31, 2015 | Year Ended October 31, 2016 | Year Ended October 31, 2015 | |||||||||||||
FROM INVESTMENT ACTIVITIES: | ||||||||||||||||
Operations: | ||||||||||||||||
Net investment income | $ | 24,382,492 | $ | 35,694,768 | $ | 50,770,277 | $ | 123,705,167 | ||||||||
Net realized gain/(loss) from investments and foreign currency transactions | 13,262,791 | (5,075,598 | ) | (131,201,967 | ) | (104,791,545 | ) | |||||||||
Net change in unrealized appreciation/(depreciation) on investments and translation of assets and liabilities denominated in foreign currencies | 10,657,414 | (15,540,882 | ) | 72,783,155 | (130,577,310 | ) | ||||||||||
|
|
|
|
|
|
|
| |||||||||
Changes in net assets resulting from operations | 48,302,697 | 15,078,288 | (7,648,535 | ) | (111,663,688 | ) | ||||||||||
|
|
|
|
|
|
|
| |||||||||
Distributions to Shareholders From: | ||||||||||||||||
Net investment income: | ||||||||||||||||
Class A | (804,456 | ) | (2,128,685 | ) | (12,940,756 | ) | (29,921,233 | ) | ||||||||
Institutional Class | (11,635,403 | ) | (24,545,585 | ) | (23,383,937 | ) | (62,514,715 | ) | ||||||||
Net realized gains: | ||||||||||||||||
Class A | — | (1,774,676 | ) | — | (19,357,727 | ) | ||||||||||
Institutional Class | — | (16,506,438 | ) | — | (37,810,111 | ) | ||||||||||
Tax return of capital: | ||||||||||||||||
Class A | — | (139,855 | ) | — | (7,343,917 | ) | ||||||||||
Institutional Class | — | (1,437,186 | ) | — | (13,557,044 | ) | ||||||||||
|
|
|
|
|
|
|
| |||||||||
Change in net assets from shareholder distributions | (12,439,859 | ) | (46,532,425 | ) | (36,324,693 | ) | (170,504,747 | ) | ||||||||
|
|
|
|
|
|
|
| |||||||||
Common Stock Transactions: | ||||||||||||||||
Change in net assets from capital transactions | (519,267,893 | ) | (479,011,379 | ) | (691,650,006 | ) | (782,474,860 | ) | ||||||||
|
|
|
|
|
|
|
| |||||||||
Change in net assets | (483,405,055 | ) | (510,465,516 | ) | (735,623,234 | ) | (1,064,643,295 | ) | ||||||||
|
|
|
|
|
|
|
| |||||||||
Net Assets: | ||||||||||||||||
Beginning of year | 1,002,982,069 | 1,513,447,585 | 1,320,457,802 | 2,385,101,097 | ||||||||||||
|
|
|
|
|
|
|
| |||||||||
End of year | $ | 519,577,014 | $ | 1,002,982,069 | $ | 584,834,568 | $ | 1,320,457,802 | ||||||||
|
|
|
|
|
|
|
| |||||||||
Accumulated net investment income/(loss) at end of year | $ | (1,014,347 | ) | $ | (398,993 | ) | $ | (73,080 | ) | $ | (6,976,141 | ) | ||||
|
|
|
|
|
|
|
| |||||||||
CAPITAL TRANSACTIONS: | ||||||||||||||||
Class A Shares | ||||||||||||||||
Proceeds from shares issued | $ | 16,784,233 | $ | 37,097,408 | $ | 64,778,775 | $ | 263,981,338 | ||||||||
Dividends reinvested | 741,485 | 3,949,037 | 12,438,271 | 51,945,174 | ||||||||||||
Cost of shares redeemed | (30,570,235 | ) | (114,703,680 | ) | (349,375,916 | ) | (519,101,949 | ) | ||||||||
|
|
|
|
|
|
|
| |||||||||
Total Class A | (13,044,517 | ) | (73,657,235 | ) | (272,158,870 | ) | (203,175,437 | ) | ||||||||
|
|
|
|
|
|
|
| |||||||||
Institutional Class Shares | ||||||||||||||||
Proceeds from shares issued | 149,682,968 | 303,606,043 | 144,838,165 | 515,517,331 | ||||||||||||
Dividends reinvested | 10,951,764 | 40,271,196 | 14,661,454 | 75,342,754 | ||||||||||||
Cost of shares redeemed | (666,858,108 | ) | (749,231,383 | ) | (578,990,755 | ) | (1,170,159,508 | ) | ||||||||
|
|
|
|
|
|
|
| |||||||||
Total Institutional Class | (506,223,376 | ) | (405,354,144 | ) | (419,491,136 | ) | (579,299,423 | ) | ||||||||
|
|
|
|
|
|
|
| |||||||||
Change in net assets from capital transactions: | $ | (519,267,893 | ) | $ | (479,011,379 | ) | $ | (691,650,006 | ) | $ | (782,474,860 | ) | ||||
|
|
|
|
|
|
|
| |||||||||
SHARE TRANSACTIONS: | ||||||||||||||||
Class A Shares | ||||||||||||||||
Issued | 1,244,630 | 2,748,452 | 7,639,129 | 26,975,595 | ||||||||||||
Reinvested | 55,056 | 292,904 | 1,457,481 | 5,371,018 | ||||||||||||
Redeemed | (2,255,811 | ) | (8,556,002 | ) | (40,835,590 | ) | (53,425,599 | ) | ||||||||
|
|
|
|
|
|
|
| |||||||||
Total Class A Shares | (956,125 | ) | (5,514,646 | ) | (31,738,980 | ) | (21,078,986 | ) | ||||||||
|
|
|
|
|
|
|
| |||||||||
Institutional Class Shares | ||||||||||||||||
Issued | 11,204,546 | 22,822,380 | 18,154,335 | 55,398,609 | ||||||||||||
Reinvested | 825,130 | 3,029,667 | 1,822,279 | 8,227,773 | ||||||||||||
Redeemed | (49,274,628 | ) | (56,681,811 | ) | (71,688,072 | ) | (128,014,246 | ) | ||||||||
|
|
|
|
|
|
|
| |||||||||
Total Institutional Class Shares | (37,244,952 | ) | (30,829,764 | ) | (51,711,458 | ) | (64,387,864 | ) | ||||||||
|
|
|
|
|
|
|
| |||||||||
Total change in shares: | (38,201,077 | ) | (36,344,410 | ) | (83,450,438 | ) | (85,466,850 | ) | ||||||||
|
|
|
|
|
|
|
| |||||||||
Amounts listed as “–” are $0 or round to $0.
See accompanying Notes to Financial Statements.
2016 Annual Report
45
Financial Highlights
Selected Data for Each Share of Capital Outstanding Throughout the Periods Indicated
Aberdeen Select International Equity Fund
| Investment Activities | Distributions | |||||||||||||||||||||||||||||||
| Net Asset Value, Beginning of Period | Net Investment Income (a) | Net Realized and Unrealized Gains (Losses) on Investments | Total from Investment Activities | Net Investment Income | Tax Return of Capital | Total Distributions | Net Asset Value, End of Period | |||||||||||||||||||||||||
Class A Shares | ||||||||||||||||||||||||||||||||
Year Ended October 31, 2016 | $ | 22.82 | $ | 0.45 | (e) | $ | (0.29 | ) | $ | 0.16 | $ | (0.72 | ) | $ | – | $ | (0.72 | ) | $ | 22.26 | ||||||||||||
Year Ended October 31, 2015 | 28.00 | 0.62 | (f) | (4.60 | ) | (3.98 | ) | (1.20 | ) | – | (1.20 | ) | 22.82 | |||||||||||||||||||
Year Ended October 31, 2014 | 28.63 | 1.09 | (1.12 | ) | (0.03 | ) | (0.60 | ) | – | (0.60 | ) | 28.00 | ||||||||||||||||||||
Year Ended October 31, 2013 | 23.84 | 0.37 | 4.55 | 4.92 | (0.13 | ) | – | (0.13 | ) | 28.63 | ||||||||||||||||||||||
Year Ended October 31, 2012 | 24.55 | 0.30 | (0.62 | ) | (0.32 | ) | (0.39 | ) | – | (0.39 | ) | 23.84 | ||||||||||||||||||||
Institutional Class Shares | ||||||||||||||||||||||||||||||||
Year Ended October 31, 2016 | 23.40 | 0.51 | (e) | (0.28 | ) | 0.23 | (0.79 | ) | – | (0.79 | ) | 22.84 | ||||||||||||||||||||
Year Ended October 31, 2015 | 28.69 | 0.67 | (f) | (4.68 | ) | (4.01 | ) | (1.28 | ) | – | (1.28 | ) | 23.40 | |||||||||||||||||||
Year Ended October 31, 2014 | 29.33 | 1.19 | (1.16 | ) | 0.03 | (0.67 | ) | – | (0.67 | ) | 28.69 | |||||||||||||||||||||
Year Ended October 31, 2013 | 24.44 | 0.31 | 4.80 | 5.11 | (0.22 | ) | – | (0.22 | ) | 29.33 | ||||||||||||||||||||||
Year Ended October 31, 2012 | 25.20 | 0.36 | (0.64 | ) | (0.28 | ) | (0.48 | ) | – | (0.48 | ) | 24.44 | ||||||||||||||||||||
| (a) | Net investment income/(loss) is based on average shares outstanding during the period. |
| (b) | Includes interest expense that amounts to less than 0.01%. |
| (c) | During the period, certain fees were waived and/or reimbursed. If such waivers/reimbursements had not occurred, the ratios would have been as indicated. |
Amounts listed as “–” are $0 or round to $0.
See accompanying Notes to Financial Statements.
Annual Report 2016
46
Financial Highlights (continued)
Selected Data for Each Share of Capital Outstanding Throughout the Periods Indicated
Aberdeen Select International Equity Fund (concluded)
| Ratios/Supplemental Data | ||||||||||||||||||||||
| Total Return | Net Assets at End of Period (000’s) | Ratio of Expenses (Net of Reimbursements/Waivers) to Average Net Assets (b)(c) | Ratio of Net Investment Income to Average Net Assets | Ratio of Expenses (Prior to Reimbursements) to Average Net Assets (b)(c) | Portfolio Turnover (d) | |||||||||||||||||
| 0.99 | %(e)(g) | $ | 182,094 | 1.42 | %(h) | 2.08 | %(e) | 1.42 | %(h) | 23 | % | |||||||||||
| (14.62 | %)(f) | 242,444 | 1.28 | % | 2.47 | % | 1.28 | % | 11 | % | ||||||||||||
| (0.04 | %) | 397,911 | 1.26 | % | 3.83 | % | 1.26 | % | 12 | % | ||||||||||||
| 20.70 | % | 554,922 | 1.25 | % | 1.39 | % | 1.26 | % | 94 | % | ||||||||||||
| (1.14 | %) | 877,738 | 1.23 | % | 1.30 | % | 1.24 | % | 35 | % | ||||||||||||
| 1.30 | %(e)(g) | 32,094 | 1.17 | %(h) | 2.31 | %(e) | 1.17 | %(h) | 23 | % | ||||||||||||
| (14.40 | %)(f) | 43,633 | 1.04 | % | 2.56 | % | 1.04 | % | 11 | % | ||||||||||||
| 0.19 | % | 82,014 | 1.02 | % | 4.06 | % | 1.03 | % | 12 | % | ||||||||||||
| 21.04 | % | 110,893 | 1.03 | % | 1.15 | % | 1.04 | % | 94 | % | ||||||||||||
| (0.93 | %) | 1,138,838 | 1.00 | % | 1.51 | % | 1.01 | % | 35 | % | ||||||||||||
| (d) | Portfolio turnover is calculated on the basis of the Fund as a whole without distinguishing among the classes of shares. |
| (e) | Included within Net Investment Income per share, Total Return, and Ratio of Net Investment Income to Average Net Assets are the effects of a one-time reimbursement for overbilling of prior years’ custodian out-of-pocket fees. If such amounts were excluded the impact to the Net Investment Income per share, Total Return, and Ratio of Net Investment Income to Average Net Assets for Class A Shares would have been reduced by $0.03, 0.14%, and 0.13%, respectively. For Institutional Class Shares, these amounts would have been reduced by $0.03, 0.13%, and 0.13%, respectively. |
| (f) | Included within Net Investment Income per share, Total Return, and Ratio of Net Investment Income to Average Net Assets are the effects of withholding tax refunds (Note 2g of the Notes to Financial Statements). If such amounts were excluded, the Net Investment Income per share, Total Return, and Ratio of Net Investment Income to Average Net Assets for Class A Shares would have been $0.53, (15.03%), and 2.11%, respectively. For Institutional Class Shares, these amounts would have been $0.58, (14.80%), and 2.20%, respectively. |
| (g) | Included within Net Realized and Unrealized Gains (Losses) on Investment per share is a payment from affiliate (See Note 3). If such payment was excluded, the total return would have been 0.94% for Class A Shares and 1.21% for Institutional Class Shares. |
| (h) | Included within the Ratio of Expenses to Average Net Assets are estimated income taxes due to prior year recovered tax refunds. If such amounts were excluded the Ratio of Expenses to Average Net Assets would have been 1.35% for Class A Shares and 1.10% for Institutional Class Shares. |
2016 Annual Report
47
Financial Highlights (continued)
Selected Data for Each Share of Capital Outstanding Throughout the Periods Indicated
Aberdeen Select International Equity Fund II
| Investment Activities | Distributions | |||||||||||||||||||||||||||||||
| Net Asset Value, Beginning of Period | Net Investment Income (a) | Net Realized and Unrealized Gains (Losses) on Investments | Total from Investment Activities | Net Investment Income | Tax Return of Capital | Total Distributions | Net Asset Value, End of Period | |||||||||||||||||||||||||
Class A Shares | ||||||||||||||||||||||||||||||||
Year Ended October 31, 2016 | $ | 10.03 | $ | 0.14 | (e) | $ | (0.08 | ) | $ | 0.06 | $ | (0.30 | ) | $ | – | $ | (0.30 | ) | $ | 9.79 | ||||||||||||
Year Ended October 31, 2015 | 12.23 | 0.21 | (f) | (1.89 | )(g) | (1.68 | ) | (0.52 | ) | – | (0.52 | ) | 10.03 | |||||||||||||||||||
Year Ended October 31, 2014 | 12.18 | 0.42 | (0.36 | ) | 0.06 | (0.01 | ) | – | (0.01 | ) | 12.23 | |||||||||||||||||||||
Year Ended October 31, 2013 | 10.38 | 0.13 | 1.92 | 2.05 | (0.25 | ) | – | (0.25 | ) | 12.18 | ||||||||||||||||||||||
Year Ended October 31, 2012 | 10.46 | 0.12 | (0.05 | ) | 0.07 | (0.15 | ) | – | (0.15 | ) | 10.38 | |||||||||||||||||||||
Institutional Class Shares | ||||||||||||||||||||||||||||||||
Year Ended October 31, 2016 | 10.04 | 0.16 | (e) | (0.06 | ) | 0.10 | (0.33 | ) | – | (0.33 | ) | 9.81 | ||||||||||||||||||||
Year Ended October 31, 2015 | 12.25 | 0.24 | (f) | (1.90 | )(g) | (1.66 | ) | (0.55 | ) | – | (0.55 | ) | 10.04 | |||||||||||||||||||
Year Ended October 31, 2014 | 12.20 | 0.46 | (0.38 | ) | 0.08 | (0.03 | ) | – | (0.03 | ) | 12.25 | |||||||||||||||||||||
Year Ended October 31, 2013 | 10.45 | 0.11 | 1.97 | 2.08 | (0.33 | ) | – | (0.33 | ) | 12.20 | ||||||||||||||||||||||
Year Ended October 31, 2012 | 10.54 | 0.14 | (0.04 | ) | 0.10 | (0.19 | ) | – | (0.19 | ) | 10.45 | |||||||||||||||||||||
| (a) | Net investment income/(loss) is based on average shares outstanding during the period. |
| (b) | During the period, certain fees were waived and/or reimbursed. If such waivers/reimbursements had not occurred, the ratios would have been as indicated. |
Amounts listed as “–” are $0 or round to $0.
See accompanying Notes to Financial Statements.
Annual Report 2016
48
Financial Highlights (continued)
Selected Data for Each Share of Capital Outstanding Throughout the Periods Indicated
Aberdeen Select International Equity Fund II (concluded)
| Ratios/Supplemental Data | ||||||||||||||||||||||
| Total Return | Net Assets at End of Period (000’s) | Ratio of Expenses (Net of Reimbursements/Waivers) to Average Net Assets (b)(c) | Ratio of Net Investment Income to Average Net Assets | Ratio of Expenses (Prior to Reimbursements) to Average Net Assets (b)(c) | Portfolio Turnover (d) | |||||||||||||||||
| 0.83 | %(e)(h) | $ | 59,390 | 1.49 | %(i) | 1.49 | %(e) | 1.50 | %(i) | 23 | % | |||||||||||
| (14.16 | %)(f)(g) | 79,263 | 1.38 | % | 1.93 | %(f) | 1.38 | % | 12 | % | ||||||||||||
| 0.46 | % | 120,387 | 1.32 | % | 3.41 | % | 1.33 | % | 11 | % | ||||||||||||
| 20.00 | % | 168,028 | 1.21 | % | 1.19 | % | 1.23 | % | 97 | % | ||||||||||||
| 0.91 | % | 278,360 | 1.30 | % | 1.21 | % | 1.32 | % | 34 | % | ||||||||||||
| 1.25 | %(e)(h) | 44,191 | 1.26 | %(i) | 1.71 | %(e) | 1.27 | %(i) | 23 | % | ||||||||||||
| (13.96 | %)(f)(g) | 69,000 | 1.13 | % | 2.16 | %(f) | 1.13 | % | 12 | % | ||||||||||||
| 0.64 | % | 108,665 | 1.10 | % | 3.69 | % | 1.11 | % | 11 | % | ||||||||||||
| 20.36 | % | 157,876 | 1.04 | % | 1.02 | % | 1.04 | % | 97 | % | ||||||||||||
| 1.11 | % | 806,052 | 1.01 | % | 1.33 | % | 1.02 | % | 34 | % | ||||||||||||
| (c) | Includes interest expense that amounts to less than 0.01%. |
| (d) | Portfolio turnover is calculated on the basis of the Fund as a whole without distinguishing among the classes of shares. |
| (e) | Included within Net Investment Income per share, Total Return, and Ratio of Net Investment Income to Average Net Assets are the effects of a one-time reimbursement for overbilling of prior years’ custodian out-of-pocket fees. If such amounts were excluded the impact to the Net Investment Income per share, Total Return, and Ratio of Net Investment Income to Average Net Assets for Class A Shares would have been reduced by $0.02, 0.21%, and 0.20%, respectively. For Institutional Class Shares, these amounts would have been reduced by $0.03, 0.31%, and 0.19%, respectively. |
| (f) | Included within Net Investment Income per share, Total Return, and Ratio of Net Investment Income to Average Net Assets are the effects of withholding tax refunds (Note 2g of the Notes to Financial Statements). If such amounts were excluded, the Net Investment Income per share, Total Return, and Ratio of Net Investment Income to Average Net Assets for Class A Shares would have been $0.18, (14.42%), and 1.66%, respectively. For Institutional Class Shares, these amounts would have been $0.21, (14.22%), and 1.89%, respectively. |
| (g) | Included within Net Realized and Unrealized Gains (Losses) on Investment per share is a payment from affiliate (See Note 3). If such payment was excluded, the total return would have been (14.33%) for Class A Shares and (14.13%) for Institutional Class Shares. |
| (h) | Included within Net Realized and Unrealized Gains (Losses) on Investment per share is a payment from affiliate (See Note 3). If such payment was excluded, the total return would have been 0.73% for Class A Shares and 1.04% for Institutional Class Shares. |
| (i) | Included within the Ratio of Expenses to Average Net Assets are estimated income taxes due to prior year recovered tax refunds. If such amounts were excluded the Ratio of Expenses to Average Net Assets would have been 1.45% for Class A Shares and 1.22% for Institutional Class Shares. |
2016 Annual Report
49
Financial Highlights (continued)
Selected Data for Each Share of Capital Outstanding Throughout the Periods Indicated
Aberdeen Total Return Bond Fund
| Investment Activities | Distributions | |||||||||||||||||||||||||||||||||||
| Net Asset Value, Beginning of Period | Net Investment Income (a) | Net Realized and Unrealized Gains (Losses) on Investments | Total from Investment Activities | Net Investment Income | Net Realized Gains | Tax Return of Capital | Total Distributions | Net Asset Value, End of Period | ||||||||||||||||||||||||||||
Class A Shares | ||||||||||||||||||||||||||||||||||||
Year Ended October 31, 2016 | $ | 13.32 | $ | 0.34 | $ | 0.32 | $ | 0.66 | $ | (0.15 | ) | $ | – | $ | – | $ | (0.15 | ) | $ | 13.83 | ||||||||||||||||
Year Ended October 31, 2015 | 13.60 | 0.32 | (0.19 | ) | 0.13 | (0.22 | ) | (0.17 | ) | (0.02 | ) | (0.41 | ) | 13.32 | ||||||||||||||||||||||
Year Ended October 31, 2014 | 13.30 | 0.34 | 0.18 | 0.52 | (0.22 | ) | – | – | (0.22 | ) | 13.60 | |||||||||||||||||||||||||
Year Ended October 31, 2013 | 14.17 | 0.31 | (0.56 | ) | (0.25 | ) | (0.29 | ) | (0.30 | ) | (0.03 | ) | (0.62 | ) | 13.30 | |||||||||||||||||||||
Year Ended October 31, 2012 | 14.02 | 0.34 | 0.56 | 0.90 | (0.49 | ) | (0.26 | ) | – | (0.75 | ) | 14.17 | ||||||||||||||||||||||||
Institutional Class Shares | ||||||||||||||||||||||||||||||||||||
Year Ended October 31, 2016 | 13.14 | 0.36 | 0.33 | 0.69 | (0.19 | ) | – | – | (0.19 | ) | 13.64 | |||||||||||||||||||||||||
Year Ended October 31, 2015 | 13.43 | 0.35 | (0.20 | ) | 0.15 | (0.25 | ) | (0.17 | ) | (0.02 | ) | (0.44 | ) | 13.14 | ||||||||||||||||||||||
Year Ended October 31, 2014 | 13.13 | 0.37 | 0.18 | 0.55 | (0.25 | ) | – | – | (0.25 | ) | 13.43 | |||||||||||||||||||||||||
Year Ended October 31, 2013 | 14.03 | 0.35 | (0.56 | ) | (0.21 | ) | (0.36 | ) | (0.30 | ) | (0.03 | ) | (0.69 | ) | 13.13 | |||||||||||||||||||||
Year Ended October 31, 2012 | 13.91 | 0.38 | 0.55 | 0.93 | (0.55 | ) | (0.26 | ) | – | (0.81 | ) | 14.03 | ||||||||||||||||||||||||
| (a) | Net investment income/(loss) is based on average shares outstanding during the period. |
| (b) | During the period, certain fees were waived and/or reimbursed. If such waivers/reimbursements had not occurred, the ratios would have been as indicated. |
Amounts listed as “–” are $0 or round to $0.
See accompanying Notes to Financial Statements.
Annual Report 2016
50
Financial Highlights (continued)
Selected Data for Each Share of Capital Outstanding Throughout the Periods Indicated
Aberdeen Total Return Bond Fund (concluded)
| Ratios/Supplemental Data | ||||||||||||||||||||||
| Total Return | Net Assets at End of Period (000’s) | Ratio of Expenses (Net of Reimbursements/Waivers) to Average Net Assets | Ratio of Net Investment Income to Average Net Assets | Ratio of Expenses (Prior to Reimbursements) to Average Net Assets (b) | Portfolio Turnover (c) | |||||||||||||||||
| 5.02 | % | $ | 65,242 | 0.69 | % | 2.47 | % | 0.74 | % | 151 | % | |||||||||||
| 0.91 | % | 75,595 | 0.69 | % | 2.37 | % | 0.71 | % | 102 | % | ||||||||||||
| 3.96 | % | 152,196 | 0.68 | % | 2.56 | % | 0.69 | % | 128 | % | ||||||||||||
| (1.81 | %) | 153,370 | 0.68 | % | 2.29 | % | 0.70 | % | 265 | % | ||||||||||||
| 6.64 | % | 247,217 | 0.69 | % | 2.47 | % | 0.69 | % | 236 | % | ||||||||||||
| 5.29 | % | 454,335 | 0.44 | % | 2.72 | % | 0.47 | % | 151 | % | ||||||||||||
| 1.12 | % | 927,387 | 0.44 | % | 2.62 | % | 0.45 | % | 102 | % | ||||||||||||
| 4.25 | % | 1,361,252 | 0.42 | % | 2.81 | % | 0.43 | % | 128 | % | ||||||||||||
| (1.59 | %) | 1,449,776 | 0.42 | % | 2.56 | % | 0.43 | % | 265 | % | ||||||||||||
| 6.97 | % | 1,849,138 | 0.41 | % | 2.73 | % | 0.41 | % | 236 | % | ||||||||||||
| (c) | Portfolio turnover is calculated on the basis of the Fund as a whole without distinguishing among the classes of shares. |
2016 Annual Report
51
Financial Highlights (continued)
Selected Data for Each Share of Capital Outstanding Throughout the Periods Indicated
Aberdeen Global High Income Fund
| Investment Activities | Distributions | |||||||||||||||||||||||||||||||||||
| Net Asset Value, Beginning of Period | Net Investment Income (a) | Net Realized and Unrealized Gains (Losses) on Investments | Total from Investment Activities | Net Investment Income | Net Realized Gains | Tax Return of Capital | Total Distributions | Net Asset Value, End of Period | ||||||||||||||||||||||||||||
Class A Shares | ||||||||||||||||||||||||||||||||||||
Year Ended October 31, 2016 | $ | 8.98 | $ | 0.49 | $ | (0.33 | ) | $ | 0.16 | $ | (0.34 | ) | $ | – | $ | – | $ | (0.34 | ) | $ | 8.80 | |||||||||||||||
Year Ended October 31, 2015 | 10.38 | 0.62 | (1.22 | ) | (0.60 | ) | (0.44 | ) | (0.25 | ) | (0.11 | ) | (0.80 | ) | 8.98 | |||||||||||||||||||||
Year Ended October 31, 2014 | 10.61 | 0.62 | (0.13 | ) | 0.49 | (0.61 | ) | (0.11 | ) | – | (0.72 | ) | 10.38 | |||||||||||||||||||||||
Year Ended October 31, 2013 | 10.30 | 0.72 | 0.30 | 1.02 | (0.71 | ) | – | – | (0.71 | ) | 10.61 | |||||||||||||||||||||||||
Year Ended October 31, 2012 | 10.14 | 0.73 | 0.34 | 1.07 | (0.74 | ) | (0.16 | ) | (0.01 | ) | (0.91 | ) | 10.30 | |||||||||||||||||||||||
Institutional Class Shares | ||||||||||||||||||||||||||||||||||||
Year Ended October 31, 2016 | 8.47 | 0.48 | (0.31 | ) | 0.17 | (0.36 | ) | – | – | (0.36 | ) | 8.28 | ||||||||||||||||||||||||
Year Ended October 31, 2015 | 9.85 | 0.61 | (1.16 | ) | (0.55 | ) | (0.47 | ) | (0.25 | ) | (0.11 | ) | (0.83 | ) | 8.47 | |||||||||||||||||||||
Year Ended October 31, 2014 | 10.10 | 0.61 | (0.11 | ) | 0.50 | (0.64 | ) | (0.11 | ) | – | (0.75 | ) | 9.85 | |||||||||||||||||||||||
Year Ended October 31, 2013 | 9.84 | 0.71 | 0.29 | 1.00 | (0.74 | ) | – | – | (0.74 | ) | 10.10 | |||||||||||||||||||||||||
Year Ended October 31, 2012 | 9.72 | 0.73 | 0.31 | 1.04 | (0.74 | ) | (0.16 | ) | (0.02 | ) | (0.92 | ) | 9.84 | |||||||||||||||||||||||
| (a) | Net investment income/(loss) is based on average shares outstanding during the period. |
| (b) | During the period, certain fees were waived and/or reimbursed. If such waivers/reimbursements had not occurred, the ratios would have been as indicated. |
| (c) | Includes interest expense that amounts to less than 0.01%. |
Amounts listed as “–” are $0 or round to $0.
See accompanying Notes to Financial Statements.
Annual Report 2016
52
Financial Highlights (concluded)
Selected Data for Each Share of Capital Outstanding Throughout the Periods Indicated
Aberdeen Global High Income Fund (concluded)
| Ratios/Supplemental Data | ||||||||||||||||||||||
| Total Return | Net Assets at End of Period (000’s) | Ratio of Expenses (Net of Reimbursements/Waivers) to Average Net Assets (b)(c) | Ratio of Net Investment Income to Average Net Assets | Ratio of Expenses (Prior to Reimbursements) to Average Net Assets (b)(c) | Portfolio Turnover (d) | |||||||||||||||||
| 1.91 | % | $ | 233,369 | 1.00 | % | 5.76 | % | 1.06 | % | 72 | % | |||||||||||
| (6.01 | %)(e) | 522,964 | 1.00 | % | 6.43 | % | 1.04 | % | 79 | % | ||||||||||||
| 4.70 | % | 823,808 | 1.00 | % | 5.76 | % | 1.01 | % | 96 | % | ||||||||||||
| 10.20 | % | 999,250 | 0.99 | % | 6.83 | % | 1.00 | % | 57 | % | ||||||||||||
| 11.22 | % | 1,066,487 | 0.99 | % | 7.26 | % | 1.01 | % | 62 | % | ||||||||||||
| 2.21 | % | 351,466 | 0.75 | % | 6.00 | % | 0.79 | % | 72 | % | ||||||||||||
| (5.85 | %) | 797,494 | 0.75 | % | 6.68 | % | 0.76 | % | 79 | % | ||||||||||||
| 5.01 | % | 1,561,293 | 0.74 | % | 6.01 | % | 0.75 | % | 96 | % | ||||||||||||
| 10.53 | % | 1,553,543 | 0.75 | % | 7.10 | % | 0.75 | % | 57 | % | ||||||||||||
| 11.49 | % | 2,130,565 | 0.73 | % | 7.53 | % | 0.74 | % | 62 | % | ||||||||||||
| (d) | Portfolio turnover is calculated on the basis of the Fund as a whole without distinguishing among the classes of shares. |
| (e) | The total return shown above includes the impact of financial statement adjustments to the NAV per share. |
2016 Annual Report
53
October 31, 2016
1. Organization
Aberdeen Investment Funds (the “Trust”) was organized as a business trust under the laws of the State of Massachusetts by a Master Trust Agreement adopted on April 30, 1992 and is registered with the U.S. Securities and Exchange Commission (“SEC”) under the Investment Company Act of 1940, as amended (the “1940 Act”) as an open-end management investment company. As of October 31, 2016, the Trust offered four diversified, open-ended investment funds: Aberdeen Select International Equity Fund (the “Select International Equity Fund”), Aberdeen Select International Equity Fund II (the “Select International Equity Fund II”), Aberdeen Total Return Bond Fund (the “Total Return Bond Fund”), and Aberdeen Global High Income Fund (the “Global High Income Fund”). Each series of the Trust are also referred to herein as a “Fund” or collectively, the “Funds”.
Each of the Funds offers multiple share classes. As of October 31, 2016, all of the Funds offered Class A and Institutional Class shares. The classes of shares are offered to different types of investors and have different expense structures, as outlined in the Funds’ prospectus. Each class of shares has exclusive voting rights with respect to matters that affect that class. Income, realized gains and losses, unrealized appreciation and depreciation, and expenses that are not attributable to a specific class are allocated daily to each class based on its relative net assets. Expenses directly attributable to a Fund are charged to that Fund. Other expenses are allocated to the respective Fund based on average daily net assets.
Each Fund has distinct investment objectives. Following are the objectives for the Funds:
| Fund Name | Investment Objective | |
Select International Equity Fund | Seeks long-term growth of capital. | |
Select International Equity Fund II | Seeks long-term growth of capital. | |
Total Return Bond Fund | Seeks to provide total return, which consists of two components: (1) changes in the market value of the Fund’s portfolio securities (both realized and unrealized appreciation/depreciation) and (2) income received from its portfolio securities. | |
Global High Income Fund | Seeks to maximize total return, principally through a high level of current income, and secondarily through capital appreciation. |
2. Summary of Significant Accounting Policies
The following is a summary of significant accounting policies followed by the Funds in the preparation of their financial statements. The policies conform to accounting principles generally accepted in the United States of America (“GAAP”). The preparation of financial statements requires management to make estimates and assumptions that affect the reported amounts of assets and liabilities, disclosure of contingent assets and liabilities at the date of the financial statements, and the reported amounts of income and expenses for the period. Actual results could differ from those estimates. The books and records of the Funds are maintained in U.S. Dollars.
| a. | Security Valuation |
The Funds value their securities at current market value or fair value, consistent with the Funds’ valuation procedures (the “Valuation Procedures”) and regulatory requirements. Equity securities that are traded on an exchange are valued at the last quoted sale price on the principal exchange on which the security is traded at the “Valuation Time” subject to application, when appropriate, of the valuation factors described in the paragraph below. Under normal circumstances, the Valuation Time is as of the close of regular trading on the New York Stock Exchange (usually 4:00 p.m. Eastern Time).
Each Fund’s assets for which market quotations are readily available are valued at fair value on the basis of quotations furnished by a pricing service or provided by securities dealers. Equity investments are generally valued using the last sale price or official closing price taken from the primary market in which each security trades, or if no sales occurred during the day, at the mean of the current quoted bid and ask prices.
Foreign equity securities that are traded on foreign exchanges that close prior to 4:00 p.m. Eastern time are valued by applying valuation factors to the last sale price or the mean price as noted above. Valuation factors are provided by an independent pricing service provider. These valuation factors are used when pricing a Fund’s portfolio holdings to estimate market movements between the time foreign markets close and the time a Fund values such foreign securities. These valuation factors are based on inputs such as depositary receipts, indices, futures, sector indices/ETFs, exchange rates, and local exchange opening and closing prices of each security. When prices with the application of valuation factors are utilized, the value assigned to the foreign securities may not be the same as quoted or published prices of the securities on their primary markets. Valuation factors are not utilized if the independent pricing service provider is unable to provide a valuation factor or if the valuation factor falls below a predetermined threshold.
Annual Report 2016
54
Notes to Financial Statements (continued)
October 31, 2016
Fixed income securities are generally valued using prices provided directly by independent third party services or provided directly from one or more broker dealers or market makers, each in accordance with the Valuation Procedures approved by the Trust’s Board of Trustees (the “Board”). The pricing services may use valuation models or matrix pricing, which consider yield or prices with respect to comparable bond quotations from bond dealers or by reference to other securities that are considered comparable in such characteristics as credit rating, interest rates and maturity date, to determine current fair value. Pricing services generally price debt securities assuming orderly transactions of an institutional “round lot” size, but some trades occur in smaller “odd lot” size that may be affected at lower prices than institutional round lot trades.
Assets and liabilities initially expressed in foreign currency will be converted into U.S. Dollar values. Short-term debt securities (such as commercial paper and U.S. treasury bills) having a remaining maturity of 60 days or less are valued at the last quoted or evaluated bid price on the valuation date provided by an independent pricing service, or on the basis of amortized cost if it represents the best approximation for fair value. To the extent each Fund invests in other open-ended funds, the Fund will calculate its net asset value (“NAV”) based upon the NAV of the underlying funds in which it invests. The prospectuses of these underlying funds explain the circumstances under which they will use good faith fair value pricing and the effects of such fair value pricing.
Short-term investments are comprised of cash and cash equivalents invested in short-term investment funds which are redeemable daily. The Fund sweeps available cash into the State Street Institutional U.S. Government Money Market Fund, a “government money market fund” pursuant to Rule 2a-7 under the Investment Company of 1940, as amended, which has an objective to maintain a $1.00 NAV, which is not guaranteed. Registered investment companies are valued at their net asset value as reported by such company. Generally, these investment types are categorized as Level 1 investments.
Derivative instruments are generally valued according to the following procedures. For forward currency exchange contracts the market value is interpolated by the pricing agent by using forward spot points obtained from an authorized pricing service. Futures contracts are generally valued at the most recent settlement price as of NAV determination. Generally for swap agreements, if quotes are unavailable from authorized pricing services swap pricing is determined using a modelling tool which considers and forecasts the impact of cash flow projections, prevailing and expected interest rate movements, and potential credit events. Swap prices are generally evaluated based upon the latest available data provided by the counterparty and rely upon an industry accepted modelling tool.
When market quotations or exchange rates are not readily available, or if the Funds’ investment adviser, Aberdeen Asset Management Inc. (the “Adviser”), concludes that such market quotations do not accurately reflect fair value, the fair value of a Fund’s assets are determined in good faith in accordance with the Valuation Procedures. For options, swaps and warrants, a fair value price may be determined using readily available market quotations, prices provided by independent pricing services, or by using modeling tools provided by industry accepted financial data service providers. Key inputs to such tools may include yield and prices from comparable or reference assets, maturity or expiration dates, ratings and interest rates. In addition, the Adviser, through its pricing committee, may determine the fair value price in accordance with the Valuation Procedures approved by the Board.
In accordance with the authoritative guidance on fair value measurements and disclosures under GAAP, the Funds disclose the fair value of their investments using a three-level hierarchy that classifies the inputs to valuation techniques used to measure the fair value. The hierarchy assigns Level 1 measurements to valuations based upon unadjusted quoted prices in active markets for identical assets, Level 2 measurements to valuations based upon significant observable inputs, including adjusted quoted prices in active markets for similar assets, and Level 3 measurements to valuations based upon unobservable inputs that are significant to the valuation. Inputs refer broadly to the assumptions that market participants would use in pricing the asset or liability, including assumptions about risk, for example, the risk inherent in a particular valuation technique used to measure fair value including a pricing model and/or the risk inherent in the inputs to the valuation technique. Inputs may be observable or unobservable. Observable inputs are inputs that reflect the assumptions market participants would use in pricing the asset or liability, which are based on market data obtained from sources independent of the reporting entity. Unobservable inputs are inputs that reflect the reporting entity’s own assumptions about the assumptions market participants would use in pricing the asset or liability developed based on the best information available in the circumstances. A financial instrument’s level within the fair value hierarchy is based upon the lowest level of any input that is significant to the fair value measurement. The three-level hierarchy of inputs is summarized below:
| • | Level 1- quoted prices in active markets for identical investments; |
| • | Level 2- other significant observable inputs (including quoted prices for similar securities, interest rates, prepayment speeds, and credit risk); or |
| • | Level 3- significant unobservable inputs (including the Fund’s own assumptions in determining the fair value of investments). |
For movements between the Levels within the fair value hierarchy, the Funds have adopted a policy of recognizing transfers at the end of each period. As described above, certain foreign securities are valued utilizing valuation factors provided by an independent pricing service to
2016 Annual Report
55
Notes to Financial Statements (continued)
October 31, 2016
reflect any significant market movements between the time foreign markets close and the time the Fund values such foreign securities. The utilization of valuation factors may result in transfers between Level 1 and Level 2. During the period ended October 31, 2016, Global High Income Fund and Total Return Bond Fund had no transfers between levels.
During the year ended October 31, 2016, Select International Equity Fund and Select International Equity Fund II had transfers between Level 1 and Level 2 because there was a valuation factor applied at October 31, 2016 that had not been applied at a prior period end or a valuation factor applied at a prior period end that was not applied at October 31, 2016. For the year ended October 31, 2016 there were no significant changes to the fair valuation methodologies. The following is a summary of Funds which had significant transfers:
| Fund | Transfer from Level 1 | Transfer from Level 2 | Transfer from Level 3 | |||
Select International Equity Fund | $– | $5,597,629 | $– | |||
Select International Equity Fund II | – | 2,722,677 | – |
The following is a summary of the inputs used as of October 31, 2016 in valuing the Funds’ investments and other financial instruments at fair value. The inputs or methodology used for valuing securities are not necessarily an indication of the risk associated with investing in those securities.
| Investments, at Value | LEVEL 1–Quoted Prices ($) | LEVEL 2–Other Significant Observable Inputs ($) | LEVEL 3–Significant Unobservable Inputs ($) | Total ($) | ||||||||||||
| Select International Equity Fund | ||||||||||||||||
| Investments in Securities | ||||||||||||||||
Common Stocks | 26,800,388 | 169,147,834 | – | 195,948,222 | ||||||||||||
Preferred Stocks | 5,007,210 | 12,106,211 | – | 17,113,421 | ||||||||||||
Short-Term Investment | 148 | – | – | 148 | ||||||||||||
|
|
|
|
|
|
|
| |||||||||
| 31,807,746 | 181,254,045 | – | 213,061,791 | |||||||||||||
|
|
|
|
|
|
|
| |||||||||
| Select International Equity Fund II | ||||||||||||||||
| Investments in Securities | ||||||||||||||||
Common Stocks | 13,349,997 | 80,250,893 | – | 93,600,890 | ||||||||||||
Preferred Stocks | 2,480,182 | 5,649,285 | – | 8,129,467 | ||||||||||||
Short-Term Investment | 1,334,756 | – | – | 1,334,756 | ||||||||||||
|
|
|
|
|
|
|
| |||||||||
| 17,164,935 | 85,900,178 | – | 103,065,113 | |||||||||||||
|
|
|
|
|
|
|
| |||||||||
Annual Report 2016
56
Notes to Financial Statements (continued)
October 31, 2016
| Investments, at Value | LEVEL 1–Quoted Prices ($) | LEVEL 2–Other Significant Observable Inputs ($) | LEVEL 3–Significant Unobservable Inputs ($) | Total ($) | ||||||||||||
| Total Return Bond Fund | ||||||||||||||||
| Investments in Securities | ||||||||||||||||
Asset-Backed Securities | – | 55,793,086 | – | 55,793,086 | ||||||||||||
Commercial Mortgage-Backed Securities | – | 44,602,211 | – | 44,602,211 | ||||||||||||
Non-Agency Mortgage-Backed Securities | – | 58,298,911 | – | 58,298,911 | ||||||||||||
Corporate Bonds | – | 153,587,707 | – | 153,587,707 | ||||||||||||
Municipal Bonds | – | 28,841,333 | – | 28,841,333 | ||||||||||||
Government Bonds | – | 42,810,356 | – | 42,810,356 | ||||||||||||
U.S. Agencies | – | 69,068,599 | – | 69,068,599 | ||||||||||||
U.S. Treasuries | – | 45,599,369 | – | 45,599,369 | ||||||||||||
Agency Mortgage-Backed Securities | – | 12,438,986 | – | 12,438,986 | ||||||||||||
Short-Term Investment | 17,439,605 | – | – | 17,439,605 | ||||||||||||
| Other Financial Instruments | ||||||||||||||||
| Assets: | ||||||||||||||||
Futures Contracts | 328,621 | – | – | 328,621 | ||||||||||||
Forward Foreign Currency Exchange Contracts | – | 2,124,931 | – | 2,124,931 | ||||||||||||
| Liabilities: | ||||||||||||||||
Futures Contracts | (51,293 | ) | – | – | (51,293 | ) | ||||||||||
Forward Foreign Currency Exchange Contracts | – | (1,941,817 | ) | – | (1,941,817 | ) | ||||||||||
Interest Rate Swap Agreements | – | (9,533 | ) | – | (9,533 | ) | ||||||||||
|
|
|
|
|
|
|
| |||||||||
| 17,716,933 | 511,214,139 | – | 528,931,072 | |||||||||||||
|
|
|
|
|
|
|
| |||||||||
| Global High Income Fund | ||||||||||||||||
| Investments in Securities | ||||||||||||||||
Corporate Bonds | – | 509,863,214 | 1,942,853 | 511,806,067 | ||||||||||||
Government Bonds | – | 14,235,014 | – | 14,235,014 | ||||||||||||
Government Agencies | – | 7,300,995 | – | 7,300,995 | ||||||||||||
Bank Loans | – | 9,723,062 | 2,917,045 | 12,640,107 | ||||||||||||
Common Stocks | – | – | 1,071,207 | 1,071,207 | ||||||||||||
Preferred Stocks | 4,512,121 | – | – | 4,512,121 | ||||||||||||
Exchange Traded Funds | 12,100,128 | – | – | 12,100,128 | ||||||||||||
Short-Term Investment | 8,417,278 | – | – | 8,417,278 | ||||||||||||
| Other Financial Instruments | ||||||||||||||||
| Assets: | ||||||||||||||||
Forward Foreign Currency Exchange Contracts | – | 8,531,859 | – | 8,531,859 | ||||||||||||
| Liabilities: | ||||||||||||||||
Forward Foreign Currency Exchange Contracts | – | (4,103,213 | ) | – | (4,103,213 | ) | ||||||||||
|
|
|
|
|
|
|
| |||||||||
| 25,029,527 | 545,550,931 | 5,931,105 | 576,511,563 | |||||||||||||
|
|
|
|
|
|
|
| |||||||||
| Amounts listed as “–” are $0 or round to $0. |
2016 Annual Report
57
Notes to Financial Statements (continued)
October 31, 2016
Select International Equity Fund Rollforward of Level 3 Fair Value Measurement For the Year Ended October 31, 2016 | ||||||||||||||||||||||||||||||||||||||||
| Investments in Securities | Balance as of October 31, 2015 | Accrued Discounts (Premiums) | Realized Gain (Loss) | Change in Unrealized Appreciation (Depreciation) | Net Purchases | Net Sales | Net Transfers in to Level 3 | Net Transfers out of Level 3 | Balance as of October 31, 2016 | Change in Unrealized Appreciation (Depreciation) from Investments Held at October 31, 2016 | ||||||||||||||||||||||||||||||
COMMON STOCK | ||||||||||||||||||||||||||||||||||||||||
Latvia | $ | – | $ | – | $ | – | $ | – | $ | – | $ | – | $ | – | $ | – | $ | – | $ | – | ||||||||||||||||||||
Serbia | – | – | (4,264,296 | ) | 4,264,296 | – | – | – | – | – | – | |||||||||||||||||||||||||||||
Venezuela | – | – | (98,170 | ) | 98,208 | – | (38 | ) | – | – | – | – | ||||||||||||||||||||||||||||
GOVERNMENT BONDS | ||||||||||||||||||||||||||||||||||||||||
Venezuela | – | 39,719 | (1,203,226 | ) | 1,163,517 | – | (10 | ) | – | – | – | – | ||||||||||||||||||||||||||||
EXCHANGE TRADED FUNDS | ||||||||||||||||||||||||||||||||||||||||
Russia | – | �� | – | – | – | – | – | – | – | – | – | |||||||||||||||||||||||||||||
TOTAL | $ | – | $ | 39,719 | $ | (5,565,692 | ) | $ | 5,526,021 | $ | – | $ | (48 | ) | $ | – | $ | – | $ | – | $ | – | ||||||||||||||||||
Global High Income Fund Rollforward of Level 3 Fair Value Measurement For the Period Ended October 31, 2016 | ||||||||||||||||||||||||||||||||||||||||
| Investments in Securities | Balance as of October 31, 2015 | Accrued Discounts (Premiums) | Realized Gain (Loss) | Change in Unrealized Appreciation (Depreciation) | Net Purchases | Net Sales | Net Transfers in to Level 3 | Net Transfers out of Level 3 | Balance as of October 31, 2016 | Change in Unrealized Appreciation (Depreciation) from Investments Held at October 31, 2016 | ||||||||||||||||||||||||||||||
BANK LOANS | ||||||||||||||||||||||||||||||||||||||||
Italy | $ | 9,993,061 | $ | 31,001 | $ | (2,203,664 | ) | $ | 2,536,895 | $ | – | (7,440,248 | ) | $ | – | $ | – | $ | 2,917,045 | $ | 2,536,895 | |||||||||||||||||||
United States | 21,298,070 | 115,778 | (4,926,618 | ) | 3,140,173 | – | (19,627,403 | ) | – | – | – | – | ||||||||||||||||||||||||||||
COMMON STOCK | ||||||||||||||||||||||||||||||||||||||||
Norway | 11,244,457 | – | – | (10,173,250 | ) | – | – | – | – | 1,071,207 | (10,173,250 | ) | ||||||||||||||||||||||||||||
United States | 3,380,976 | – | (1,494,392 | ) | 792,243 | – | (2,678,827 | ) | – | – | – | – | ||||||||||||||||||||||||||||
CORPORATE BONDS | ||||||||||||||||||||||||||||||||||||||||
Canada | 10,244,723 | 12,233 | (2,540,163 | ) | (2,595,984 | ) | – | (3,234,206 | ) | – | – | 1,886,603 | (2,595,984 | ) | ||||||||||||||||||||||||||
United States | 45,188 | – | – | 11,062 | – | – | – | – | 56,250 | 11,062 | ||||||||||||||||||||||||||||||
TOTAL | $ | 56,206,475 | $ | 159,012 | $ | (11,164,837 | ) | $ | (6,288,861 | ) | $ | – | $ | (32,980,684 | ) | $ | – | $ | – | $ | 5,931,105 | $ | (10,221,277 | ) | ||||||||||||||||
The following is quantitative information about level 3 fair value measurements:
| Description | Fair Value at 10/31/16 ($) | Valuation Technique(s) | Unobservable Inputs | Range | Weighted Average | |||||||||||||||
Global High Income Fund | ||||||||||||||||||||
Bank Loans | $ | 2,917,045 | Broker Pricing | Bid/Ask Spread | $ | 109.2 | $ | 109.2 | ||||||||||||
Common Stocks | 1,071,207 | Evaluated Pricing | Bid/Ask Spread | 0.8 | 0.8 | |||||||||||||||
Corporate Bonds | 1,942,853 | Broker Pricing/Evaluated Pricing | Bid/Ask Spread | 3.8-26.1 | 22.3 | |||||||||||||||
Broker Pricing: Includes indicative broker quotes that cannot be corroborated by observable market data.
Evaluated Pricing: In determining the fair value of the Common Stock as of October 31, 2016, the Global High Income Fund used the Market Approach to derive an evaluated price.
Market Approach: References actual transactions in the equity of the enterprise being valued or transactions in similar enterprises that are traded in private and public markets. Third-party transactions in the equity of an entity generally represent the best estimate of fair value if they are completed at arm’s length. The Guideline Public Company Method involves identifying and selecting publicly traded companies
Annual Report 2016
58
Notes to Financial Statements (continued)
October 31, 2016
with financial and operating characteristics similar to the company being valued. Once publicly traded companies are identified, valuation multiples can be derived, adjusted for comparability, and then applied to the subject company to estimate the value of its equity or invested capital. Similarly, the Comparable Transactions Method analyzes transactions involving target companies operating in industries similar to the subject company. While it is known that no two companies are exactly alike, nor are any two transactions structured identically, consideration is given to comparisons of the capital structure, operations, size, and profitability, as well as other operating characteristics of the target companies. Once comparable transactions for reasonable targets are identified, valuation multiples can be derived, adjusted for comparability, and then applied to the subject company to estimate the value of its equity or invested capital.
| b. | Restricted Securities |
Restricted securities are privately-placed securities whose resale is restricted under U.S. securities laws. The Funds may invest in restricted securities, including unregistered securities eligible for resale without registration pursuant to Rule 144A and privately-placed securities of U.S. and non-U.S. issuers offered outside the U.S. without registration pursuant to Regulation S under the Securities Act of 1933, as amended. Rule 144A securities may be freely traded among certain qualified institutional investors, such as the Funds, but resale of such securities in the U.S. is permitted only in limited circumstances.
The following Fund owned private placement investments that were purchased through private offerings or acquired through initial public offerings and cannot be sold without prior registration under the Securities Act of 1933 or pursuant to an exemption therefrom. In addition, this Fund has generally agreed to further restrictions on the disposition of certain holdings as set forth in various agreements entered into in connection with the purchase of these private placement investments. The acquisition dates of these investments, the date the enforceable right to acquire these private placement investments was obtained, along with the cost and values at October 31, 2016, are as follows:
| Shares/Face Amount | Acquistion Date | Right to Acquire Date | Cost | Market Value | Percentage of Net Assets | |||||||||||||||||
Global High Income Fund | ||||||||||||||||||||||
Deep Ocean | 1,427,968 | 5/12/2011 | 5/12/2011 | $ | 30,083,125 | $ | 1,071,207 | 0.18 | % | |||||||||||||
SCM Insurance Services, Inc. | 7,230,000 | 8/21/2014 | 8/21/2014 | $ | 6,566,846 | $ | 1,886,603 | 0.32 | % | |||||||||||||
| c. | Foreign Currency Translation |
Foreign currency amounts are translated into U.S. Dollars at the current rate of exchange as of Valuation Time to determine the value of investments, assets and liabilities. Purchases and sales of securities, and income and expenses are translated at the prevailing rate of exchange on the respective date of these transactions. The Funds do not isolate that portion of the results of operations resulting from changes in foreign exchange rates on investments from fluctuations arising from changes in market prices of securities held. These fluctuations are included with the net realized and unrealized gain or loss from investments and foreign currencies within the Statements of Operations.
Foreign securities, currencies, and other assets and liabilities denominated in foreign currencies are translated into U.S. Dollars at the exchange rate of said currencies against the U.S. Dollar, as of the Valuation Time, as provided by an independent pricing service.
Investments in emerging markets can be riskier and more volatile than investments in the United States and other developed markets. Adverse political and economic developments can make it more difficult for the Select International Equity Fund and Select International Equity Fund II to sell foreign securities which could reduce the NAV of the Funds. In contrast to more established markets, emerging markets may have governments that are less stable and markets that are less liquid, increasing your investment risk. At October 31, 2016, the Select International Equity Fund held Venezuelan securities and held Venezuelan Bolivar. Venezuela currently imposes foreign exchange controls which prohibit the Select International Equity Fund from repatriating dividends, interest, or other income from investments or proceeds from the sale of Venezuelan securities. The Venezuelan securities and Venezuelan Bolivar have been fair valued at $0.00.
| d. | Derivative Financial Instruments |
Certain Funds are authorized to use derivatives to manage currency risk, credit risk, and interest rate risk and to replicate, or use as a substitute for, physical securities. Losses may arise due to changes in the value of the contract or if the counterparty does not perform under the contract. The use of derivative instruments involves, to varying degrees, elements of market risk in excess of the amount recognized in the Statements of Assets and Liabilities.
Forward Foreign Currency Exchange Contracts
A forward foreign currency exchange contract (“forward contract”) involves an obligation to purchase and sell a specific currency at a future date, which may be any fixed number of days from the date of the contract agreed upon by the parties, at a price set at the time of the contract. Forward contracts are used to manage a Fund’s currency exposure in an efficient manner. They are used to sell unwanted currency exposure that comes with holding securities in a market, or to buy currency exposure where the exposure from holding securities is
2016 Annual Report
59
Notes to Financial Statements (continued)
October 31, 2016
insufficient to give the desired currency exposure either in absolute terms or relative to the benchmark. The use of forward contracts allows the separation of decision-making between markets and their currencies. The forward contract is marked-to-market daily and the change in market value is recorded by a Fund as unrealized appreciation or depreciation. Forward contracts’ prices are received daily from an independent pricing provider. When the forward contract is closed, a Fund records a realized gain or loss equal to the difference between the value at the time it was opened and the value at the time it was closed. These realized and unrealized gains and losses are reported on the Statements of Operations. During the fiscal year ended October 31, 2016, the Funds used forward contracts to hedge some of the Funds’ foreign currency holdings. Managing active currency risk involves both hedging currency risk and adding currency risk in excess of underlying bond positions. A Fund may also enter into forward contracts to obtain potential appreciation of a foreign currency, which also adds currency risk.
Futures Contracts
Certain Funds may invest in financial futures contracts (“futures contracts”) for the purpose of hedging their existing portfolio securities, or securities that a Fund intends to purchase, against fluctuations in value caused by changes in prevailing market interest rates or prices. Futures contracts may also be entered into for non-hedging purposes; however, in those instances the aggregate initial margin and premiums required to establish a Fund’s positions may not exceed 5% of a Fund’s NAV after taking into account unrealized profits and unrealized losses on any such contract it has entered.
Upon entering into a futures contract, a Fund is required to pledge to the broker an amount of cash and/or other assets equal to a certain percentage of the contract amount. This payment is known as “initial margin”. Subsequent payments, known as “variation margin,” are calculated each day, depending on the daily fluctuations in the fair value/market value of the underlying assets. An unrealized gain/(loss) equal to the variation margin is recognized on a daily basis. When the contract expires or is closed, the gain/(loss) is realized and is presented in the Statements of Operations as a net realized gain/(loss) on futures contracts. Futures contracts are valued daily at their last quoted sale price on the exchange on which they are traded.
A “sale” of a futures contract means a contractual obligation to deliver the securities or foreign currency called for by the contract at a fixed price at a specified time in the future. A “purchase” of a futures contract means a contractual obligation to acquire the securities or foreign currency at a fixed price at a specified time in the future.
Should market conditions change unexpectedly, a Fund may not achieve the anticipated benefits of the futures contracts and may realize a loss. The use of futures transactions for hedging purposes involves the risk of imperfect correlation in movements in the price of futures contracts, interest rates and the value/market value of the underlying hedged assets. During the fiscal year ended October 31, 2016, U.S. Treasury futures contracts were used to manage Total Return Bond Fund’s overall curve and interest rate exposure.
Options
Options are instruments that provide a right to buy (call) or sell (put) a particular security or an index of securities at a fixed price within a certain time period. Options differ from forward and futures contracts in that the buyer of the option has no obligation to perform under the contract. An option is out-of-the money if the exercise price of the option is above, in the case of a call option, or below, in the case of a put option, the current price (or interest rate or yield for certain options) of the referenced security or instrument. Use of put and call options may result in losses to a Fund, force the sale or purchase of portfolio securities at inopportune times or for prices higher than (in the case of put options) or lower than (in the case of call options) current market values, limit the amount of appreciation a Fund can realize on its investments or cause a Fund to hold a security it might otherwise sell. The Funds did not hold options as of October 31, 2016.
Swaps
The Total Return Bond Fund enters into interest rate swaps to manage interest-rate exposure. The Global High Income Fund uses credit default swaps to gain, or hedge, exposure to specific companies. A swap is an agreement that obligates two parties to exchange a series of cash flows and/or meet certain obligations at specified intervals based upon or calculated by reference to changes in specified prices or rates (interest rates in the case of interest rate swaps, currency exchange rates in the case of currency swaps) or the occurrence of a credit event with respect to an underlying reference obligation (in the case of a credit default swap) for a specified amount of an underlying asset or notional principal amount. The Fund will enter into swaps only on a net basis, which means that the two payment streams are netted out, with the Fund receiving or paying, as the case may be, only the amount of the difference between the two payments. Except for currency swaps and credit default swaps, the notional principal amount is used solely to calculate the payment streams but is not exchanged. With respect to currency swaps, actual principal amounts of currencies may be exchanged by the counterparties at the initiation, and again upon the termination of the transaction.
Traditionally, swaps were customized, privately negotiated agreements executed between two parties (“OTC Swaps”) but since 2013, certain swaps are required to be cleared pursuant to rules and regulations related to the Dodd–Frank Wall Street Reform and Consumer Protection Act (“Dodd Frank”) and/or Regulation (EU) No 648/2012 on OTC Derivatives, Central Counterparties and Trade Repositories (“EMIR”)
Annual Report 2016
60
Notes to Financial Statements (continued)
October 31, 2016
(“Cleared Swaps”). Like OTC Swaps, Cleared Swaps are negotiated bilaterally. Unlike OTC Swaps, the act of clearing results in two swaps executed between each of the parties and a central counterparty (“CCP”), and thus the counterparty credit exposure of the parties is to the CCP rather than to one another. Upon entering into a Cleared Swap, a Fund is required to pledge an amount of cash and/or other assets equal to a certain percentage of the contract amount. This payment is known as “initial margin”. Subsequent payments, known as “variation margin,” are calculated each day, depending on the daily fluctuations in the fair value/market value of the underlying assets. An unrealized gain/(loss) equal to the variation margin is recognized on a daily basis. When the contract matures or is terminated, the gain or loss is realized and is presented in the Statements of Operations as a net realized gain or loss on swap contracts. As of March 2017, a Fund may be required to provide variation and/or initial margin for OTC Swaps pursuant to further rules and regulations related to Dodd Frank and EMIR. The margin requirements associated with OTC Swaps and Cleared Swaps may not be the same.
Entering into swap agreements involves, to varying degrees, elements of credit, market and interest risk in excess of the amounts reported on the Statement of Assets and Liabilities. Such risks involve the possibility that there will be no liquid market for these agreements, that the counterparty to the agreements may default on its obligation to perform and that there may be unfavorable changes in the value of the index or securities underlying the agreement. The Funds’ maximum risk of loss from counterparty risk related to swaps is the fair value of the contract. This risk is mitigated by the posting of collateral by the counterparties to the Funds to cover the Funds’ exposure to the counterparty.
Interest Rate Swaps
A Fund uses interest rate swap contracts to manage its exposure to interest rates. Interest rate swap contracts typically represent the exchange between a Fund and a counterparty of respective commitments to make variable rate and fixed rate payments with respect to a notional amount of principal. Interest rate swap contracts may have a term that is greater than one year, but typically require periodic interim settlement in cash, at which time the specified value of the variable interest rate is reset for the next settlement period. Net payments of interest are recorded as realized gains or losses. During the period that the swap contract is open, the contract is marked-to-market as the net amount due to or from a Fund and changes in the value of swap contracts are recorded as unrealized gains or losses.
Credit Default Swaps
A credit default swap is an agreement whereby one party, the buyer, is obligated to pay the other party, the seller, a periodic stream of payments over the term of the contract in return for a contingent payment upon the occurrence of a credit event with respect to an underlying reference obligation. A Fund might use credit default swap contracts to limit or to reduce risk exposure of the Fund to defaults of corporate and sovereign issues (i.e., to reduce risk when the Fund owns or has exposure to such issuers). A Fund also might use credit default swap contracts to create direct or synthetic short or long exposure to domestic or foreign corporate debt securities or certain sovereign debt securities to which the Fund is not otherwise exposed.
Summary of Derivative Instruments
The Fund may use derivatives for various purposes as noted above.
| Location on the Statement of Assets and Liabilities | ||||
| Derivative Instrument Risk Type | Asset Derivatives | Liability Derivatives | ||
| Interest Rate Risk | Variation margin receivable for futures contracts Variation margin receivable for centrally cleared interest rate swap contracts | Variation margin payable for futures contracts Variation margin payable for centrally cleared interest rate swap contracts | ||
| Foreign Exchange Risk | Unrealized appreciation on forward foreign currency exchange contracts | Unrealized depreciation on forward foreign currency exchange contracts | ||
| Credit Risk | Variation margin receivable for centrally cleared credit default swap contracts | Variation margin payable for centrally cleared credit default swap contracts | ||
2016 Annual Report
61
Notes to Financial Statements (continued)
October 31, 2016
The following is a summary of the fair value of Derivative Instruments, not accounted for as hedging instruments, as of October 31, 2016:
| Total Return Bond Fund | Asset Derivatives | Liability Derivatives | ||||||||||
| Year Ended October 31, 2016 | Year Ended October 31, 2016 | |||||||||||
| Derivatives not accounted for as hedging instruments and risk exposure | Statement of Assets and Liabilities Location | Fair Value | Statement of Assets and Liabilities Location | Fair Value | ||||||||
| Interest rate swaps | ||||||||||||
(interest rate risk) | Unrealized appreciation on over-the-counter interest rate swaps | $ | 4,500 | Unrealized depreciation on over-the-counter interest rate swaps | $ | – | ||||||
| Forward foreign exchange contracts | ||||||||||||
(foreign exchange risk) | Unrealized appreciation on forward currency exchange contracts | 2,124,931 | Unrealized depreciation on forward currency exchange contracts | 1,941,817 | ||||||||
| Futures contracts | ||||||||||||
(Interest Rate Risk) | Unrealized appreciation on futures contracts | 137,112 | Unrealized depreciation on futures contracts | – | ||||||||
Total | $ | 2,266,543 | $ | 1,941,817 | ||||||||
| Global High Income Fund | Asset Derivatives | Liability Derivatives | ||||||||||
| Year Ended October 31, 2016 | Year Ended October 31, 2016 | |||||||||||
| Derivatives not accounted for as hedging instruments and risk exposure | Statement of Assets and Liabilities Location | Fair Value | Statement of Assets and Liabilities Location | Fair Value | ||||||||
| Forward foreign exchange contracts | ||||||||||||
(foreign exchange risk) | Unrealized appreciation on forward currency exchange contracts | $ | 8,517,988 | Unrealized depreciation on forward currency exchange contracts | $ | 4,089,342 | ||||||
Total | $ | 8,517,988 | $ | 4,089,342 | ||||||||
A reconciliation of the gross amounts on the Statements of Assets and Liabilities as of October 31, 2016 to the net amounts by broker and derivative type, including any collateral received or pledged, is included in the following tables:
| Gross Amounts Not Offset in Statement of Assets & Liabilities | Gross Amounts Not Offset in Statement of Assets and Liabilities | |||||||||||||||||||||||||||||||
| Description | Gross Amounts of Assets Presented in Statement of Financial Position | Financial Instruments | Collateral Received(1) | Net Amount(3) | Gross Amounts of Liabilities Presented in Statement of Financial Position | Financial Instruments | Collateral Pledged(1) | Net Amount(3) | ||||||||||||||||||||||||
| Assets | Liabilities | |||||||||||||||||||||||||||||||
Total Return Bond Fund | ||||||||||||||||||||||||||||||||
Forward foreign currency(2) | ||||||||||||||||||||||||||||||||
Barclays Bank plc | $ | 466,063 | $ | (15,077 | ) | $ | – | $ | 450,986 | $ | 15,077 | $ | (15,077 | ) | $ | – | $ | – | ||||||||||||||
Citibank N.A. | 1,130,550 | – | – | 1,130,550 | – | – | – | – | ||||||||||||||||||||||||
Goldman Sachs & Co. | – | – | – | – | 61,789 | – | – | 61,789 | ||||||||||||||||||||||||
HSBC Bank USA | 75,582 | (75,582 | ) | – | – | 539,923 | (75,582 | ) | – | 464,341 | ||||||||||||||||||||||
JPMorgan Chase Bank N.A. | 54,187 | (54,187 | ) | – | – | 199,051 | (54,187 | ) | – | 144,864 | ||||||||||||||||||||||
Royal Bank of Canada | 109,291 | (109,291 | ) | – | – | 787,837 | (109,291 | ) | – | 678,546 | ||||||||||||||||||||||
Westpac Banking Corp. | 289,258 | (289,258 | ) | – | – | 338,140 | (289,258 | ) | – | 48,882 | ||||||||||||||||||||||
Annual Report 2016
62
Notes to Financial Statements (continued)
October 31, 2016
| (1) | In some instances, the actual collateral received and/or pledged may be more than the amount shown here due to overcollateralization. |
| (2) | Includes financial instrument (forwards) which are not subject to master netting arrangement across funds, or other another similar arrangement. |
| (3) | Net amounts represent the net receivables/(payable) that would be due from/to the counterparty in the event of default. Exposure from financial derivative instruments can only be netted across transactions governed under the same master agreement with the same legal entity. |
| Gross Amounts Not Offset in Statement of Assets & Liabilities | Gross Amounts Not Offset in Statement of Assets and Liabilities | |||||||||||||||||||||||||||||||
| Description | Gross Amounts of Assets Presented in Statement of Financial Position | Financial Instruments | Collateral Received(1) | Net Amount(3) | Gross Amounts of Liabilities Presented in Statement of Financial Position | Financial Instruments | Collateral Pledged(1) | Net Amount(3) | ||||||||||||||||||||||||
| Assets | Liabilities | |||||||||||||||||||||||||||||||
Global High Income Fund | ||||||||||||||||||||||||||||||||
Forward foreign currency(2) | ||||||||||||||||||||||||||||||||
Barclays Bank PLC | $ | 491,370 | $ | (491,370 | ) | $ | – | $ | – | $ | 1,810,964 | $ | (491,370 | ) | $ | – | $ | 1,319,594 | ||||||||||||||
Citibank N.A. | – | – | – | – | 1,437,356 | – | – | 1,437,356 | ||||||||||||||||||||||||
Deutsche Bank AG | 199,543 | (91,458 | ) | – | 108,085 | 91,458 | (91,458 | ) | – | – | ||||||||||||||||||||||
Goldman Sachs & Co. | – | – | – | – | 9,232 | – | – | 9,232 | ||||||||||||||||||||||||
HSBC | – | – | – | – | 416,018 | – | – | 416,018 | ||||||||||||||||||||||||
JPMorgan Chase Bank N.A. | – | – | – | – | 3,968 | – | – | 3,968 | ||||||||||||||||||||||||
Royal Bank of Canada | 6,410,288 | (301,614 | ) | – | 6,108,674 | 301,614 | (301,614 | ) | – | – | ||||||||||||||||||||||
Westpac Banking Corp. | 1,416,787 | (18,732 | ) | – | 1,398,055 | 18,732 | (18,732 | ) | – | – | ||||||||||||||||||||||
| (1) | In some instances, the actual collateral received and/or pledged may be more than the amount shown here due to overcollateralization. |
| (2) | Includes financial instrument (forwards) which are not subject to master netting arrangement across funds, or other another similar arrangement. |
| (3) | Net amounts represent the net receivables/(payable) that would be due from/to the counterparty in the event of default. Exposure from financial derivative instruments can only be netted across transactions governed under the same master agreement with the same legal entity. |
The Effect of Derivative Instruments on the Statement of Operations for the fiscal year ended October 31, 2016:
| Total Return Bond Fund | ||||||||||
| Derivatives not accounted for as hedging instruments | Location of Gain or (Loss) on Derivatives | Realized Gain or (Loss) on Derivatives | Change in Unrealized Appreciation/ (Depreciation) on Derivatives | |||||||
| Realized/Unrealized Gain/(Loss) from Investments, Futures Contracts and Foreign Currency Transactions | ||||||||||
| Credit default swaps | ||||||||||
(credit risk) | $ | 6,024 | $ | (9,533 | ) | |||||
| Forward foreign exchange contracts | ||||||||||
(foreign exchange risk) | (6,124,035 | ) | 1,004,548 | |||||||
| Futures contracts | ||||||||||
(Interest Rate Risk) | (1,031,991 | ) | 449,001 | |||||||
Total | $ | (7,150,002 | ) | $ | 1,444,016 | |||||
2016 Annual Report
63
Notes to Financial Statements (continued)
October 31, 2016
| Global High Income Fund | ||||||||||
| Derivatives not accounted for as hedging instruments | Location of Gain or (Loss) on Derivatives | Realized Gain or (Loss) on Derivatives | Change in Unrealized Appreciation/ (Depreciation) on Derivatives | |||||||
| Realized/Unrealized Gain/(Loss) from Investments, Futures Contracts and Foreign Currency Transactions | ||||||||||
| Credit default swaps | ||||||||||
(credit risk) | $ | 3,493,426 | $ | (3,274,089 | ) | |||||
| Forward foreign exchange contracts | ||||||||||
(foreign exchange risk) | 13,131,871 | (445,666 | ) | |||||||
Total | $ | 16,625,297 | $ | (3,719,755 | ) | |||||
Information about derivatives reflected as of the date of this report is generally indicative of the type of activity for the fiscal year ended October 31, 2016. The table below summarizes the weighted average values of derivatives holdings by the Funds during the fiscal year ended October 31, 2016.
| Fund | Forward foreign exchange contracts (Average Notional Value) | Futures contracts (Average Notional Value) | Swap contracts (Average Notional Value) | Options purchased (Average Notional Value) | ||||||||||||
Total Return Bond Fund | $ | 219,425,675 | $ | 5,426,682 | $ | 22,975,000 | * | $ | 110,000 | ** | ||||||
Global High Income Fund | 241,581,537 | – | 14,589,417 | – | ||||||||||||
The Funds value derivatives at fair value, as described in the results of operations. Accordingly, the Funds do not follow hedge accounting even for derivatives employed as economic hedges.
| * | Average notional value for the period from September 1, 2016 through October 31, 2016. |
| ** | Average notional value for the period from August 1, 2016 through August 31, 2016. |
| e. | Bank Loans |
Global High Income Fund may invest in bank loans. Bank loans include floating and fixed-rate debt obligations. Floating rate loans are debt obligations issued by companies or other entities with floating interest rates that reset periodically. Bank loans may include, but are not limited to, term loans, delayed funding loans, bridge loans and revolving credit facilities. Loan interest will primarily take the form of assignments purchased in the primary or secondary market but may include participants. Floating rate loans are secured by specific collateral of the borrower and are senior to most other securities of the borrower (e.g., common stock or debt instruments) in the event of bankruptcy. Floating rate loans are often issued in connection with recapitalizations, acquisitions, leveraged buyouts, and refinancings. Floating rate loans are typically structured and administered by a financial institution that acts as the agent of the lenders participating in the floating rate loan. Floating rate loans may be acquired directly through the agent, as an assignment from another lender who holds a direct interest in the floating rate loan, or as a participation interest in another lender’s portion of the floating rate loan.
Global High Income Fund may enter into, or acquire participation in, delayed funding loans and revolving credit facilities. Delayed funding loans and revolving credit facilities are borrowings in which the Global High Income Fund agrees to make loans up to a maximum amount upon demand by the borrowing issuer for a specified term. A revolving credit facility differs from a delayed funding loan in that as the borrowing issuer repays the loan, an amount equal to the repayment is again made available to the borrowing issuer under the facility. The borrowing issuer may at any time borrow and repay amounts so long as, in the aggregate, at any given time the amount borrowed does not exceed the maximum amount established by the loan agreement. Delayed funding loans and revolving credit facilities usually provide for floating or variable rates of interest.
There are a number of risks associated with an investment in bank loans including credit risk, interest rate risk, illiquid securities risk, and prepayment risk. There is also the possibility that the collateral securing a loan, if any, may be difficult to liquidate or be insufficient to cover the amount owed under the loan. These risks could cause a Fund to lose income or principal on a particular investment, which in turn could affect the Fund’s returns. In addition, bank loans may settle on a delayed basis, resulting in the proceeds from the sale of such loans not being readily available to make additional investments or to meet a Fund’s redemption obligations. To the extent the extended settlement process gives rise to short-term liquidity needs, a Fund may hold additional cash, sell investments or temporarily borrow from banks or other lenders.
As of October 31, 2016, none of the Funds held unfunded commitments or bridge loans.
Annual Report 2016
64
Notes to Financial Statements (continued)
October 31, 2016
| f. | Security Transactions, Investment Income and Expenses |
Security transactions are recorded on the trade date. Realized and unrealized gains/(losses) from security and currency transactions are calculated on the identified cost basis. Dividend income is recorded on the ex-dividend date except for certain dividends on foreign securities, which are recorded as soon as a Fund is informed after the ex-dividend date. Interest income is recorded on an accrual basis using the effective interest method. Expenses are recorded on an accrual basis. Expenses directly attributable to a Fund are charged to that Fund. Expenses not directly attributable to a Fund are allocated proportionately among all Funds of the Trust. For each of the Funds, the method for allocating income, fund level expenses, and realized and unrealized gains or losses among classes is based on the total net asset value of each class’s shares in proportion to the total net assets of the relevant Fund. Expenses specific to a class (such as Rule 12b-1 and Transfer Agent fees) are charged to that class.
| g. | Foreign Taxes |
Funds that invest in foreign securities are subject to foreign taxes that may be imposed by certain countries in which the Funds invest. The Funds generally record foreign taxes based on applicable foreign tax law. The Funds incur withholding taxes on certain foreign dividends and interest, and those taxes are accrued at the time the associated income is recorded. The Funds file withholding tax reclaims in certain jurisdictions to recover a portion of amounts previously withheld. The Funds record a reclaim receivable based on, among other things, a jurisdiction’s legal obligation to pay reclaims as well as payment history and market convention.
In consideration of recent decisions rendered by European courts, the Select International Equity Fund and Select International Equity Fund II (the “International Equity Funds”) have filed for additional reclaims related to prior years in accordance with European Union law. However, consistent with U.S. GAAP accrual requirements, the International Equity Funds have not recorded a corresponding receivable amount because there is limited historical precedent for U.S. funds collecting reclaims of this magnitude and the total amount of the reclaims that these funds may receive in the future is uncertain. Any amounts to which the International Equity Funds may be entitled, if and when recorded, likely would result in an increase in the net asset value per share of each fund at that time. As of October 31, 2016, the total amount of reclaims filed for the International Equity Funds in the countries that may be affected by the European courts’ decisions (namely, Spain, France, Germany, The Netherlands, and Poland) represents approximately 10% of the net asset value per share before the impact of any tax (if applicable) or additional costs incurred in the pursuit of such reclaims, for each of the International Equity Funds; however, the recovery of any or all of this amount and timing of recovery, if any, is uncertain.
On May 21, 2015, the Select International Equity Fund and the Select International Equity Fund II (collectively “the Funds”) received withholding tax refunds of $1,355,000 (0.35% of total net assets as of October 31, 2015) and $500,000 (0.25% of total net assets as of October 31, 2015), respectively, from the Finnish Tax Authority (FTA) in connection with the Funds’ filing of withholding tax reclaims for taxes that were previously paid by the Funds to the FTA. Estimated income taxes due, including costs associated with entering into a closing agreement with the Internal Revenue Service, on the recovery of such claims have been booked to the Funds as of October 31, 2016. The amounts represent 0.07% and 0.04% of total net assets as of October 31, 2016 of the Select International Equity Fund and Select International Equity Fund II, respectively.
| h. | Distributions |
Distributions from net investment income, if any, are declared and paid monthly for the Total Return Bond Fund and Global High Income Fund. Distributions from net investment income, if any, are declared and paid annually for the Select International Equity Fund and Select International Equity Fund II. The Funds will also declare and pay distributions annually from net realized gains on investment transactions and net realized foreign exchange gains, if any. Dividends and distributions to shareholders are recorded on the ex-dividend date. Additional distributions of net investment income and capital gains may be made at the discretion of the Board to avoid the application of the excise tax imposed under Section 4982 of the Internal Revenue Code of 1986, as amended (the “Code”), for certain undistributed amounts.
Dividends and distributions to shareholders are determined in accordance with federal income tax regulations, which may differ from GAAP. These differences are primarily due to differing treatments of income and gains on various investment securities held by the Funds, timing differences and differing characterization of distributions made by the Funds as a whole.
| i. | Federal Income Taxes |
Each Fund intends to continue to qualify as a “regulated investment company” by complying with the provisions available to certain investment companies, as defined in Subchapter M of the Code, and to make distributions of net investment income and net realized capital gains sufficient to relieve the Funds from all federal income taxes. Therefore, no federal income tax provision is required.
Management of the Funds has concluded that there are no significant uncertain tax positions that would require recognition in the financial statements. Since tax authorities can examine previously filed tax returns, the Funds’ U.S. federal and state tax returns for each of the four fiscal years up to the most recent fiscal year ended October 31 are subject to such review.
2016 Annual Report
65
Notes to Financial Statements (continued)
October 31, 2016
| j. | Repurchase Agreements |
The Funds may enter into repurchase agreements under the terms of a Master Repurchase Agreement. It is each Fund’s policy that its custodian/counterparty segregate the underlying collateral securities, the value of which exceeds the principal amount of the repurchase transaction, including accrued interest. The repurchase price generally equals the price paid by a Fund plus interest negotiated on the basis of current short-term rates. To the extent that any repurchase transaction exceeds one business day, the collateral is valued on a daily basis to determine its adequacy. Under the Master Repurchase Agreement, if the counterparty defaults and the value of the collateral declines, or if bankruptcy proceedings are commenced with respect to the counterparty of the security, realization of the collateral by the Funds may be delayed or limited. Repurchase agreements are subject to contractual netting arrangements with the counterparty, Fixed Income Clearing Corp. To the extent a Fund enters into repurchase agreements, additional information on individual repurchase agreements is included in the Statements of Investments.
3. Agreements and Transactions with Affiliates
| a. | Investment Adviser |
Under the Investment Advisory Agreements with the Funds, effective May 22, 2013, Aberdeen Asset Management Inc. (“Aberdeen” or the “Adviser”) manages the Funds in accordance with the policies and procedures established by the Board. Prior to May 22, 2013, the Funds were managed by Artio Global Management LLC (the “Predecessor Adviser”).
For services provided under the terms of the current Investment Advisory Agreement, each Fund pays the Adviser an annual management fee (as a percentage of its average daily net assets) paid monthly according to the following schedule:
| Fund | Fee Schedule | |||||||
Select International Equity Fund | Of the first $5 billion | 0.900% | ||||||
| On the next $2.5 billion | 0.880% | |||||||
| Over $7.5 billion | 0.850% | |||||||
Select International Equity Fund II | Of the first $5 billion | 0.900% | ||||||
| On the next $2.5 billion | 0.880% | |||||||
| Over $7.5 billion | 0.850% | |||||||
Total Return Bond Fund | On all assets | 0.350% | ||||||
Global High Income Fund | Of the first $5 billion | 0.650% | ||||||
| On the next $2.5 billion | 0.630% | |||||||
| On the next $2.5 billion | 0.600% | |||||||
| Over $10 billion | 0.590% | |||||||
The Adviser has engaged the services of Aberdeen Asset Managers Limited (the “Subadviser”), an affiliate, pursuant to the subadvisory agreements. The Subadviser manages a portion of the International Equity Funds’ investments and has responsibility for making all investment decisions for the portion of a Fund’s assets that it manages. Pursuant to the subadvisory agreements, the Adviser pays fees to the Subadviser.
Certain of the Funds and Aberdeen have entered into written contracts (“Expense Limitation Agreements”) limiting operating expenses for all classes of each Fund from exceeding the amounts listed below. This contractual limitation may not be terminated without the approval of the Board until the earlier of (a) the termination of the Investment Advisory Agreement or (b) the end of February, 2017. This limit excludes certain expenses, including taxes, interest, brokerage commissions, and other expenditures which are capitalized in accordance with GAAP, and other extraordinary expenses not incurred in the ordinary course of the Fund’s business.
| Fund | Class A Limit | Institutional Class Limit | ||||
Total Return Bond Fund | 0.69% | 0.44 | % | |||
Global High Income Fund | 1.00% | 0.75 | % | |||
The Adviser has agreed to continue to waive a portion of its management fee for each of the Funds at the annual rate of 0.005% of the respective Funds’ average daily assets. The waiver may be terminated at any time by the Board.
Aberdeen may request and receive reimbursement from a Fund of the advisory fees waived and other expenses reimbursed pursuant to the Expense Limitation Agreements at a later date not to exceed three years from the fiscal year in which the corresponding reimbursement to the Funds was made.
Annual Report 2016
66
Notes to Financial Statements (continued)
October 31, 2016
However, no reimbursement will be made for fees waived unless:
| (i) | the total annual expense ratio of the class making such reimbursement is less than the limit set forth above; and |
| (ii) | the payment of such reimbursement is approved by the Board on a quarterly basis (the “Reimbursement Requirements”). |
If the Board approves any changes in the waiver terms or limitations, reimbursements are only permitted to the extent that the terms of the Expense Limitation Agreements in effect at the time of the waiver are met at the time that reimbursement is approved. Except as provided for in the Expense Limitation Agreements, reimbursement of amounts previously waived or assumed by Aberdeen is not permitted.
As of October 31, 2016, to the extent the Reimbursement Requirements are met, the cumulative potential reimbursements for each Fund, based on expenses reimbursed by Aberdeen would be:
| Fund | Amount 2014 | Amount 2015 | Amount 2016 | Total* | ||||||||||||
Select International Equity Fund | $ | – | $ | – | $ | – | $ | – | ||||||||
Select International Equity Fund II | – | – | – | – | ||||||||||||
Total Return Bond Fund | 22,047 | 82,622 | 262,142 | 366,811 | ||||||||||||
Global High Income Fund | 75,716 | 198,764 | 367,227 | 641,707 | ||||||||||||
| * | Amounts reported are due to expire throughout the respective 3-year expiration period presented above. |
| Amounts listed as “–” are $0 or round to $0. |
During the years ended October 31, 2015 and October 31, 2016, the Adviser contributed $305,291 and $127,579, respectively, to the Select International Equity Fund II, to correctly record an aged dividend receivable at its net realizable value inclusive of currency fluctuations.
During the year ended October 31, 2016, the Adviser contributed $113,111 to the Select International Equity Fund to correctly record an aged dividend receivable at its net realizable value inclusive of currency fluctuations.
4. Distributor and Shareholder Services
The Funds and Aberdeen Fund Distributors, LLC (the “Distributor” or “AFD”) are parties to the current Underwriting Agreement (the “Underwriting Agreement”) whereby the Distributor acts as principal underwriter for the Funds’ shares. Prior to May 22, 2013, Quasar Distributors, LLC (“Quasar”) was the distributor of the Funds.
The Funds have adopted a Distribution Plan (the “Plan”) pursuant to Rule 12b-1 under the 1940 Act with respect to certain classes of shares. The Plan permits the Funds to compensate AFD, as the Funds’ Distributor, for expenses associated with the distribution of certain classes of shares of the Funds of the Trust. Although actual distribution expenses may be more or less, under the Plan, the Funds pay the Distributor an annual fee of 0.25% for Class A shares.
Under its terms, the Funds’ Plan shall remain in effect from year to year, provided such continuance is approved annually by a vote of a majority of the Board members and a majority of those Board members who are not “interested persons” of the Funds and who have no direct or indirect financial interest in the operation of the Plan or in any agreement related to the Plan.
The Adviser or an affiliate of the Adviser may pay additional amounts from its own resources to dealers or other financial intermediaries, for aid in distribution or for aid in providing administrative services to shareholders.
5. Investment Transactions
Purchases and sales of securities (excluding short-term securities) for the fiscal year ended October 31, 2016, were as follows:
| Fund | Purchases | Sales | ||||||
Select International Equity Fund | $ | 54,210,363 | $ | 118,626,470 | ||||
Select International Equity Fund II | 25,971,366 | 63,695,250 | ||||||
Total Return Bond Fund | 1,303,517,808 | 1,755,979,351 | ||||||
Global High Income Fund | 576,937,745 | 1,223,397,096 | ||||||
2016 Annual Report
67
Notes to Financial Statements (continued)
October 31, 2016
6. Investments in Affiliated Issuers
An affiliated issuer, as defined under the Investment Company Act of 1940, as amended, includes an issuer in which a Fund holds 5% or more of the issuer’s outstanding voting securities. A summary of the Funds’ investments in securities of these issuers for the fiscal year ended October 31, 2016 is set forth below:
| Affiliate | Shares Held October 31, 2016 | Purchases (Cost) | Sales (Proceeds) | Dividend Income | Fair Value October 31, 2016 | |||||||||||||||
Global High Income Fund | ||||||||||||||||||||
Deep Ocean | 1,427,968 | $ | – | $ | – | $ | – | $ | 1,071,207 | |||||||||||
| Amounts | listed as “–” are $0 or round to $0. |
7. Portfolio Investment Risks
| a. | Active Trading Risk |
A Fund may engage in active and frequent trading of portfolio securities to achieve its investment objective. If a Fund does trade this way, it may incur increased costs, which can lower the actual return of the Fund.
| b. | Asset-Backed Securities Risk |
Like traditional fixed income securities, the value of asset-backed securities typically increases when interest rates fall and decreases when interest rates rise. Certain asset-backed securities may also be subject to the risk of prepayment.
| c. | Bank Loan Risk |
There are a number of risks associated with an investment in bank loans including credit risk, interest rate risk, illiquid securities risk, and prepayment risk. There is also the possibility that the collateral securing a loan, if any, may be difficult to liquidate or be insufficient to cover the amount owed under the loan. These risks could cause a Fund to lose income or principal on a particular investment, which in turn could affect a Fund’s returns.
| d. | Credit Default Swap Risk |
Credit default swap contracts, a type of derivative instrument, involve special risks and may result in losses to the Fund. Credit default swap contracts may in some cases be illiquid, and they increase credit risk since the Fund has exposure to both the issuer of the referenced obligation and the counterparty to the credit default swap contracts. Swaps may be difficult to unwind or terminate. The swap market could be disrupted or limited as a result of recent legislation, and these changes could adversely affect the Fund. Additionally, to the extent the Fund sells credit default swap contracts, the Fund effectively adds economic leverage to its portfolio because, in addition to its total net assets, the Fund is subject to investment exposure on the notional amount of the swap in the event of a default of the referenced debt obligation.
| e. | Credit Risk |
A debt instrument’s price depends, in part, on the credit quality of the issuer, borrower, counterparty, or underlying collateral and can decline in response to changes in the financial condition of the issuer, borrower, counterparty, or underlying collateral, or changes in specific or general market, economic, industry, political, regulatory, geopolitical, or other conditions.
| f. | Delayed Funding Loans and Revolving Credit Facilities Risk |
There are a number of risks associated with an investment in delayed funding loans and revolving credit facilities including credit, interest rate and liquidity risk and the risks of being a lender. There may be circumstances under which the borrowing issuer’s credit risk may be deteriorating and yet a Fund may be obligated to make loans to the borrowing issuer as the borrowing issuer’s credit continues to deteriorate, including at a time when the borrowing issuer’s financial condition makes it unlikely that such amounts will be repaid. Delayed funding loans and revolving credit facilities may be subject to restrictions on transfer, and only limited opportunities may exist to resell such instruments.
| g. | Derivatives Risk (Including Options, Futures and Swaps) |
Derivatives are speculative and may hurt the Fund’s performance. Derivatives present the risk of disproportionately increased losses and/or reduced opportunities for gains when the financial asset or measure to which the derivative is linked changes in unexpected ways. The potential benefits to be derived from the Fund’s derivatives strategy are dependent upon the portfolio managers’ ability to discern pricing inefficiencies and predict trends in markets, which decisions could prove to be inaccurate. This requires different skills and techniques than predicting changes in the price of individual securities, and there can be no assurance that the use of this strategy will be successful.
Annual Report 2016
68
Notes to Financial Statements (continued)
October 31, 2016
Hedged Exposure Risk – Losses generated by a derivative or practice used by the Fund for hedging purposes should be offset in part by gains on the hedged investment depending on the degree of correlation between the hedging instrument and the assets hedged. However, while hedging can reduce or eliminate losses, it can also reduce or eliminate gains.
Correlation Risk – The Fund is exposed to the risk that changes in the value of a hedging instrument will not match those of the investment being hedged.
Counterparty Risk – Derivative transactions depend on the creditworthiness of the counterparty and the counterparty’s ability to fulfill its contractual obligations.
Speculative Exposure Risk – To the extent that a derivative or practice is not used as a hedge, the Fund is directly exposed to its risks. Gains or losses from speculative positions in a derivative may be much greater than the derivative’s original cost. For example, potential losses from writing uncovered call options and from speculative short sales are unlimited.
| h. | Emerging Markets Risk |
A magnification of the risks that apply to foreign investments. These risks are greater for securities of companies in emerging market countries because the countries may have less stable governments, more volatile currencies and less established markets (see “Foreign Securities Risk” below).
| i. | Foreign Currency Exposure Risk |
The value of foreign currencies relative to the U.S. Dollar fluctuates in response to market, economic, political, regulatory, geopolitical or other conditions. A decline in the value of a foreign currency versus the U.S. Dollar reduces the value in U.S. Dollars of investments denominated in that foreign currency. This risk may impact the Fund more greatly to the extent the Funds do not hedge its currency risk, or hedging techniques used by the Adviser are unsuccessful.
| j. | Foreign Securities Risk |
Foreign securities may be more volatile, harder to price and less liquid than U.S. securities.
| k. | High-Yield Bonds and Other Lower-Rated Securities Risk |
A Fund’s investments in high-yield bonds (commonly referred to as “junk bonds”) and other lower-rated securities will subject the Fund to substantial risk of loss. Investments in high-yield bonds are speculative and issuers of these securities are generally considered to be less financially secure and less able to repay interest and principal than issuers of investment-grade securities. Prices of high-yield bonds tend to be very volatile. These securities are less liquid than investment-grade debt securities and may be difficult to price or sell, particularly in times of negative sentiment toward high-yield securities.
| l. | Illiquid Securities Risk |
Illiquid securities are assets which may not be sold or disposed of in the ordinary course of business within seven days at approximately the price at which the Fund has valued the investment on its books and may include such securities as those not registered under U.S. securities laws or securities that cannot be sold in public transactions. An inability to sell a portfolio position can adversely affect the Fund’s value or prevent the Fund from being able to take advantage of other investment opportunities. Illiquid securities and relatively less liquid securities may also be difficult to value. Over recent years, the capacity of dealers to make markets in fixed income securities has been outpaced by the growth in the size of the fixed income markets. Liquidity risk may be magnified in a rising interest rate environment or when investor redemptions from fixed income funds may be higher than normal, due to the increased supply in the market that would result from selling activity.
The Fund employs proprietary procedures and tests using third-party and internal data inputs that seek to assess and manage the liquidity of its portfolio holdings. The Fund’s procedures and tests take into account relevant market, trading and other factors, and monitor whether liquidity assessments should be adjusted based on changed market conditions. These procedures and tests are designed to assist the Fund in determining its ability to meet redemption requests in various market conditions. In light of the dynamic nature of markets, there can be no assurance that these procedures and tests will enable the Fund to ensure that it has sufficient liquidity to meet redemption requests.
| m. | Impact of Large Redemptions and Purchases of Fund Shares |
Occasionally, shareholders may make large redemptions or purchases of a Fund’s shares, which may cause the Fund to have to sell securities or invest additional cash. These transactions may adversely affect the Fund’s performance and increase transaction costs. In addition, large redemption requests may exceed the cash balance of the Fund and result in credit line borrowing fees or overdraft charges to the Fund until the sales of portfolio securities to cover the redemption request settle.
2016 Annual Report
69
Notes to Financial Statements (continued)
October 31, 2016
| n. | Interest Rate Risk |
A Fund’s fixed income investments are subject to interest rate risk, which generally causes the value of a fixed income portfolio to decrease when interest rates rise resulting in a decrease in the Fund’s net assets. The Fund may be subject to a greater risk of rising interest rates due to the current period of historically low rates and the effect of potential government fiscal policy initiatives and resulting market reaction to those initiatives. Interest rate fluctuations tend to have a greater impact on fixed income-securities with a greater time to maturity and/or lower coupon. In periods of market volatility, the market values of fixed income securities may be more sensitive to changes in interest rates.
| o. | Large-Cap Securities Risk |
Stocks issued by large cap companies subject the Fund to the risk that those stocks may underperform stocks issued by companies with smaller capitalizations or the market as a whole.
| p. | Leverage Risk |
Certain transactions may give rise to a form of leverage. Such transactions may include, among others, loans of securities, and the use of when-issued, delayed delivery or forward commitment transactions. The use of derivatives may also cause leveraging risk.
| q. | Market Risk |
Deteriorating market conditions might cause a general weakness in the market that reduces the prices of securities in that market in which a Fund invests.
| r. | Mid-Cap Securities Risk |
Stocks of mid-cap companies tend to be more volatile and less liquid than larger company stocks of larger companies.
| s. | Mortgage-Related Securities Risk |
A Fund may invest in mortgage-related securities. Rising interest rates may cause an issuer to exercise its right to pay principal later than expected which tends to extend the duration of mortgage-related securities, making them more sensitive to changes in interest rates. As a result, in a period of rising interest rates, a Fund that holds mortgage-related securities may exhibit additional volatility. This is known as extension risk. In addition, mortgage-related securities are subject to prepayment risk. When interest rates decline, borrowers may pay off their mortgages sooner than expected. This can reduce the returns of a Fund because the Fund will have to reinvest that money at the lower prevailing interest rates.
| t. | Municipal Securities Risk |
A Fund may invest in municipal bonds which may be significantly affected by political and economic changes, including inflation, as well as uncertainties in the municipal market related to taxation, legislative changes, or the rights of municipal security holders. Municipal Bonds have varying levels of sensitivity to changes in interest rates. In general, the price of a Municipal Bond can fall when interest rates rise and can rise when interest rates fall. Interest rate risk is generally lower for shorter-term Municipal Bonds and higher for long term Municipal Bonds. Under certain market conditions, the Adviser may purchase Municipal Bonds that the Adviser perceives are undervalued. Undervalued Municipal Bonds are subject to the same market volatility and principal and interest rate risks described above. Lower quality Municipal Bonds involve greater risk of default or price changes due to changes in the credit quality of the issuer. The value of lower quality Municipal Bonds often fluctuates in response to political or economic developments and can decline significantly over short periods of time or during periods of general or regional economic difficulty. In the case of tax-exempt Municipal Bonds, if the Internal Revenue Service or state tax authorities determine that an issuer of a tax-exempt Municipal Bond has not complied with applicable tax requirements, interest from the security could become taxable at the federal, state and/or local level, and the security could decline significantly in value. Municipal Bonds are subject to credit or default risk. Credit risk is the risk that the issuer of a municipal security might not make interest and principal payments on the security as they become due.
| u. | Prepayment Risk |
As interest rates decline, debt issuers may repay or refinance their loans or obligations earlier than anticipated. The issuers of fixed income securities may, therefore, repay principal in advance. This forces a Fund to reinvest the proceeds from the principal prepayments at lower rates, which reduces the Fund’s income.
| v. | Private Placements and Other Restricted Securities Risk |
Investments in private placements and other restricted securities, including Regulation S Securities and Rule 144A Securities, could have the effect of increasing a Fund’s level of illiquidity. Private placements and restricted securities may be less liquid than other investments because such securities may not always be readily sold in broad public markets and a Fund might be unable to dispose of such securities promptly or at prices reflecting their true value.
Annual Report 2016
70
Notes to Financial Statements (continued)
October 31, 2016
| w. | Sector Risk |
To the extent that a Fund has a significant portion of its assets invested in securities of companies conducting business in a broadly related group of industries within an economic sector, the Fund may be more vulnerable to unfavorable developments in that economic sector than funds that invest more broadly.
| x. | Securities Selection Risk |
The investment team may select securities that underperform the stock market or other funds with similar investment objectives and strategies.
| y. | Small-Cap Securities Risk |
Stocks of smaller companies are usually less stable in price and less liquid than those of larger, more established companies. Therefore, they generally involve greater risk.
| z. | Sovereign Debt Risk |
Periods of economic and political uncertainty may result in the illiquidity and increased price volatility of a foreign government’s debt securities held by the Fund and impact an issuer’s ability and willingness to pay interest or repay principal when due. The Fund may have limited recourse to compel payment in the event of a default. A foreign government’s default on its debt securities may cause the value of securities held by the Fund to decline significantly.
Please read the prospectus for more detailed information regarding these and other risks.
8. Contingencies
In the normal course of business, the Funds may provide general indemnifications pursuant to certain contracts and organizational documents. The Funds’ maximum exposure under these arrangements is dependent on future claims that may be made against the Funds, and therefore, cannot be estimated; however, based on experience, the risk of loss from such claims is considered remote.
9. Tax Information
As of October 31, 2016, the tax cost of securities and the breakdown of unrealized appreciation/(depreciation) for each Fund were as follows:
| Tax Cost of Securities | Unrealized Appreciation | Unrealized Depreciation | Net Unrealized Appreciation/ (Depreciation) | |||||||||||||
Select International Equity Fund | $ | 273,293,016 | $ | 14,250,783 | $ | (74,482,008 | ) | $ | (60,231,225 | ) | ||||||
Select International Equity Fund II | 117,374,617 | 6,621,880 | (20,931,384 | ) | (14,309,504 | ) | ||||||||||
Total Return Bond Fund | 518,073,426 | 13,892,299 | (3,485,562 | ) | 10,406,737 | |||||||||||
Global High Income Fund | 606,949,366 | 21,557,967 | (56,424,416 | ) | (34,866,449 | ) | ||||||||||
The tax character of distributions paid during the fiscal year ended October 31, 2016 was as follows (total distributions paid may differ from the Statements of Changes in Net Assets because for tax purposes dividends are recognized when actually paid):
| Distributions paid from | ||||||||||||||||||||||||
| Fund | Ordinary Income | Net Long Term Capital Gains | Total Taxable Distributions | Tax Exempt Distributions | Return of Capital | Total Distributions Paid | ||||||||||||||||||
Select International Equity Fund | $ | 8,579,495 | $ | – | $ | 8,579,495 | $ | – | $ | – | $ | 8,579,495 | ||||||||||||
Select International Equity Fund II | 4,285,768 | – | 4,285,768 | – | – | 4,285,768 | ||||||||||||||||||
Total Return Bond Fund | 12,439,859 | – | 12,439,859 | – | – | 12,439,859 | ||||||||||||||||||
Global High Income Fund | 36,324,693 | – | 36,324,693 | – | – | 36,324,693 | ||||||||||||||||||
2016 Annual Report
71
Notes to Financial Statements (continued)
October 31, 2016
The tax character of distributions paid during the fiscal year ended October 31, 2015 was as follows (total distributions paid may differ from the Statements of Changes in Net Assets because for tax purposes dividends are recognized when actually paid):
| Distributions paid from | ||||||||||||||||||||||||
| Fund | Ordinary Income | Net Long Term Capital Gains | Total Taxable Distributions | Tax Exempt Distributions | Return of Capital | Total Distributions Paid | ||||||||||||||||||
Select International Equity Fund | $ | 19,924,879 | $ | – | $ | 19,924,879 | $ | – | $ | – | $ | 19,924,879 | ||||||||||||
Select International Equity Fund II | 9,538,401 | – | 9,538,401 | – | – | 9,538,401 | ||||||||||||||||||
Total Return Bond Fund | 23,348,183 | 21,607,201 | 44,955,384 | – | 1,577,041 | 46,532,425 | ||||||||||||||||||
Global High Income Fund | 103,149,950 | 46,453,836 | 149,603,786 | – | 20,900,961 | 170,504,747 | ||||||||||||||||||
As of October 31, 2016, the components of accumulated earnings/(deficit) on a tax basis were as follows:
| Fund | Undistributed Tax Exempt Income | Undistributed Ordinary Income | Undistributed Long-Term Capital Gains | Accumulated Earnings | Distributions Payable | Late Year Ordinary and Post-October Capital Loss Deferrals | Other Temporary Differences | Unrealized Appreciation/ (Depreciation)* | Accumulated Capital and Other Losses** | Total Accumulated Earnings/ (Deficit) | ||||||||||||||||||||||||||||||
Select International Equity Fund | $ | – | $ | 1,281,584 | $ | – | $ | – | $ | – | $ | – | $ | – | $ | (61,942,077 | ) | $ | (2,033,135,615 | ) | $ | (2,093,796,108 | ) | |||||||||||||||||
Select International Equity Fund II | – | 1,316,269 | – | – | – | – | (13,952 | ) | (14,343,853 | ) | (1,356,116,751 | ) | (1,369,158,287 | ) | ||||||||||||||||||||||||||
Total Return Bond Fund | – | 11,895,047 | 4,920,801 | – | – | – | (582,170 | ) | 10,196,921 | – | 26,430,599 | |||||||||||||||||||||||||||||
Global High Income Fund | – | 5,313,666 | – | – | – | – | (4,428,646 | ) | (30,503,736 | ) | (207,634,986 | ) | (237,253,702 | ) | ||||||||||||||||||||||||||
| * | The difference between the book-basis and tax-basis unrealized appreciation/(depreciation) is attributable primarily to tax deferral of losses on wash sales. |
| ** | As of October 31, 2016, for Federal income tax purposes, the following Funds have capital loss carryforwards available to offset capital gains, if any, to the extent provided by the Treasury regulations, which expire in the years set forth below. |
| Fund | Amount | Expires | ||||
Select International Equity Fund | $ | 1,643,693,179 | 2017 (Short-Term) | |||
Select International Equity Fund | 19,115,447 | Unlimited (Short-Term) | ||||
Select International Equity Fund | 370,326,989 | Unlimited (Long-Term) | ||||
Select International Equity Fund II | 1,211,390,775 | 2017 (Short-Term) | ||||
Select International Equity Fund II | 121,152,924 | 2018 (Short-Term) | ||||
Select International Equity Fund II | 2,844,319 | Unlimited (Short-Term) | ||||
Select International Equity Fund II | 20,728,733 | Unlimited (Long-Term) | ||||
Global High Income Fund | 58,054,816 | Unlimited (Short-Term) | ||||
Global High Income Fund | 149,580,170 | Unlimited (Long-Term) | ||||
Under the Regulated Investment Company Modernization Act of 2010, the Funds are permitted to carry forward capital losses incurred in taxable years beginning after December 22, 2010 for an unlimited period. However, any losses incurred during those taxable years will be required to be utilized prior to the losses incurred in pre-enactment taxable years. As a result of this ordering rule, pre-enactment capital loss carryforwards may be more likely to expire unused. Additionally, post-enactment capital losses that are carried forward will retain their character as either short-term or long-term capital losses rather than being considered all short-term as under previous law.
GAAP requires that certain components of net assets be adjusted to reflect permanent differences between financial and tax reporting. Accordingly, the table below details the necessary reclassifications, which are a result of permanent differences primarily attributable to foreign currency gain/(loss), litigation, expired capital loss carryforward, paydown gain/(loss), equalization, security spinoff, excess Finland EU credit carryforward, CCP clearing fees, capital gains reclass, amortization and defaulted bond adjustments. These reclassifications have no effect on net assets or net asset values per share.
Annual Report 2016
72
Notes to Financial Statements (continued)
October 31, 2016
| Fund | Paid-in Capital | Accumulated Net Investment Income/(Loss) | Accumulated Net Realized Gain/(Loss) | |||||||||
Select International Equity Fund | $ | (314,279,850 | ) | $ | (3,099,018 | ) | $ | 317,378,868 | ||||
Select International Equity Fund II | (1,379,267,427 | ) | (151,739 | ) | 1,379,419,166 | |||||||
Total Return Bond Fund | 10,440,167 | (12,557,987 | ) | 2,117,820 | ||||||||
Global High Income Fund | – | (7,542,523 | ) | 7,542,523 | ||||||||
10. Significant Shareholders
As of October 31, 2016, the following Funds had shareholders with the percentage ownership indicated, which are considered significant shareholders (holdings greater than 5.0%) for financial reporting purposes:
| Fund | Record Ownership % | Number of Account Owners | ||||
Select International Equity Fund | 63.7 | % | 2 | |||
Select International Equity Fund II | 57.0 | 4 | ||||
Total Return Bond Fund | 54.7 | 3 | ||||
Global High Income Fund | 63.0 | 6 | ||||
11. Line of Credit
Aberdeen Investment Funds (the “Borrowers”) entered into a Credit Agreement (the “Agreement”) with State Street Bank and Trust Company (the “Bank”). The Agreement provides for a revolving credit facility (the “Credit Facility”) to be utilized for temporary or emergency purposes to fund shareholder redemptions or for other short-term liquidity purposes. The amount of the Credit Facility was reduced from $100,000,000 to $50,000,000 effective April 18, 2016. The Funds may draw up to their stated sublimit (subject to certain other limitations therein):
| Sublimit Amount | Average Outstanding Daily Balance | Average Weighted Interest Rate | Days Utilized | |||||||||||||
Select International Equity | $ | 50,000,000 | $ | 778,057 | 1.67 | % | 22 | |||||||||
Select International Equity II | $ | 50,000,000 | 780,177 | 1.73 | % | 15 | ||||||||||
Total Return Bond Fund | $ | 50,000,000 | – | – | – | |||||||||||
| Amounts | listed as “–” are $0 or round to $0. |
In addition, the Global High Income Fund entered into a separate Credit Agreement (the “Global High Income Fund Credit Agreement”) with the Bank. The Global High Income Fund Credit Agreement provides for a revolving credit facility (the “Global High Income Fund Credit Facility”) to be utilized for temporary or emergency purposes to fund shareholder redemptions or for other short-term liquidity purposes. The amount of the Global High Income Fund Credit Facility was reduced from $150,000,000 to $100,000,000 effective April 18, 2016. The Global High Income Fund may draw the entire $100,000,000 (subject to certain limitations).
| Sublimit Amount | Average Outstanding Daily Balance | Average Weighted Interest Rate | Days Utilized | |||||||||||||
Global High Income Fund | $ | 100,000,000 | $ | 4,872,872 | 1.75% | 6 | ||||||||||
| Amounts | listed as “–” are $0 or round to $0. |
Principal on each outstanding loan made under the Agreement and the Global High Income Fund Credit Agreement shall bear the interest at a variable rate per annum equal to the higher of (a) the Federal Funds Rate as in effect on that day plus 1.25% and (b) the One-Month London Interbank Offered Rate as in effect on that day (not less than zero) plus 1.25%. In addition, the Borrowers shall pay to the Bank a commitment fee at the rate of 0.22% per annum on the daily unused portion of each of the Credit Facility or Global High Income Fund Credit Facility, as applicable, which is allocated among the Borrowers in such manner as is determined by the Board to be reasonable.
2016 Annual Report
73
Notes to Financial Statements (concluded)
October 31, 2016
12. Subsequent Events
Management has evaluated the need for disclosures and/or adjustments resulting from subsequent events through the date the financial statements were issued. Based on this evaluation, no disclosures and/or adjustments other than those described above were required to the financial statements as of October 31, 2016, except as disclosed below.
On December 16, 2016, the Select International Equity Fund received withholding tax refunds of $826,334 (0.41% of total net assets) from the Dolnoslaski Tax Office in Wroclaw, Poland in connection with the Fund’s filing of withholding tax reclaims for taxes that were previously paid by the Fund.
Annual Report 2016
74
Report of Independent Registered Public Accounting Firm
The Shareholders and Board of Trustees
Aberdeen Investment Funds:
We have audited the accompanying statements of assets and liabilities, including the statements of investments, of the Aberdeen Investment Funds comprised of the Aberdeen Select International Equity Fund, Aberdeen Select International Equity Fund II, Aberdeen Total Return Bond Fund, and Aberdeen Global High Income Fund (collectively, the “Funds”), as of October 31, 2016, and the related statements of operations for the year then ended, the statements of changes in net assets for each of the years in the two-year period then ended and the financial highlights for each of the years or periods in the five-year period then ended. These financial statements and financial highlights are the responsibility of the Funds’ management. Our responsibility is to express an opinion on these financial statements and financial highlights based on our audits.
We conducted our audits in accordance with the standards of the Public Company Accounting Oversight Board (United States). Those standards require that we plan and perform the audit to obtain reasonable assurance about whether the financial statements and financial highlights are free of material misstatement. An audit includes examining, on a test basis, evidence supporting the amounts and disclosures in the financial statements. Our procedures included confirmation of securities owned as of October 31, 2016, by correspondence with custodians and brokers, or by other appropriate auditing procedures. An audit also includes assessing the accounting principles used and significant estimates made by management, as well as evaluating the overall financial statement presentation. We believe that our audits provide a reasonable basis for our opinion.
In our opinion, the financial statements and financial highlights referred to above present fairly, in all material respects, the financial position of the Funds as of October 31, 2016, the results of their operations for the year then ended, the changes in their net assets for each of the years in the two-year period then ended, and the financial highlights for each of the years or periods in the five-year period then ended, in conformity with U.S. generally accepted accounting principles.

Philadelphia, Pennsylvania
December 29, 2016
2016 Annual Report
75
Other Tax Information (Unaudited)
For the period ended October 31, 2016, certain dividends paid by the Funds may be subject to a maximum tax rate of 15% as provided for by the Jobs and Growth Tax Relief Reconciliation Act of 2003. The Funds intend to designate the maximum amount allowable as taxed at a maximum rate of 15%. Complete information will be reported in conjunction with your 2016 Form 1099-DIV.
During the year ended October 31, 2016, the following Fund designated dividends as long-term capital gains:
| Fund | Amount | |||
Total Return Bond Fund | $ | 1,870,278 | ||
Pursuant to Section 852 of the Internal Revenue Code, the amount designated as long-term capital gains distributions was distributed in connection with share redemptions.
The Funds intend to elect to pass through to their shareholders the credit for taxes paid in foreign countries during its fiscal year ended October 31, 2016. In accordance with the current tax laws, the foreign income and foreign tax per share (for a share outstanding as of October 31, 2016) was as follows:
| Fund | Foreign Tax | |||
Select International Equity Fund | $ | 0.0528 | ||
Select International Equity Fund II | $ | 0.0247 | ||
For the year ended October 31, 2016, the following Funds paid qualified dividend income:
| Fund | Qualified Dividend Income | |||
Select International Equity Fund | 100.00 | % | ||
Select International Equity Fund II | 94.00 | % | ||
Global High Income Fund | 0.94 | % | ||
For the taxable year ended October 31, 2016, the following percentage of income dividends paid by the Global High Income Fund qualify for the dividends received deduction available to corporate shareholders:
| Fund | Dividend Received Deduction | |||
Global High Income Fund | 0.94 | % | ||
Annual Report 2016
76
Shareholder Expense Examples (Unaudited)
As a shareholder of the Aberdeen Investment Funds you incur ongoing costs, including investment advisory fees, shareholder service fees, distribution fees and other Fund expenses. The examples below are intended to help you understand your ongoing costs (in dollars) of investing in the Funds and to compare these costs with the ongoing costs of investing in other mutual funds.
The examples assume that you had a $1,000 investment in the Class at the beginning of the reporting period, May 1, 2016 and continued to hold your shares at the end of the reporting period, October 31, 2016.
Actual Expenses
The table below provides information about actual account values and actual expenses. You may use the information together with the amount you invested, to estimate the expenses that you paid over the period. Simply divide your account value by $1,000 (for example, an $8,600 account value divided by $1,000 = 8.6), then multiply the result by the number under the heading entitled “Actual Expenses Paid During Period” for the class of a Fund that you own to estimate the expenses you paid on your account during the period.
Hypothetical Example for Comparison Purposes
The table below provides information about hypothetical account values and hypothetical expenses based on the Class’ actual expense ratio and an assumed rate of return of 5% per year before expenses, which is not the Class’ actual return. The hypothetical account values and expenses may not be used to estimate the actual ending account balance or expenses you paid for the period. You may use this information to compare the ongoing costs of investing in the Class of a Fund and other funds. To do so, compare the 5% hypothetical example with the 5% hypothetical examples that appear in the shareholder reports of the other funds.
| Beginning Account Value, May 1, 2016 | Actual Ending Account Value, October 31, 2016 | Hypothetical Ending Account Value | Actual Expenses Paid During Period* | Hypothetical Expenses Paid During Period*1 | Annualized Expense Ratio** | |||||||||||||||||||||
Select International Equity Fund | ||||||||||||||||||||||||||
Class A | $ | 1,000.00 | $ | 969.90 | $ | 1,018.55 | $ | 6.49 | $ | 6.65 | 1.31% | |||||||||||||||
Institutional Class | $ | 1,000.00 | $ | 968.80 | $ | 1,019.81 | $ | 5.25 | $ | 5.38 | 1.06% | |||||||||||||||
Select International Equity Fund II | ||||||||||||||||||||||||||
Class A | $ | 1,000.00 | $ | 969.50 | $ | 1,017.95 | $ | 7.08 | $ | 7.25 | 1.43% | |||||||||||||||
Institutional Class | $ | 1,000.00 | $ | 967.40 | $ | 1,019.05 | $ | 5.98 | $ | 6.14 | 1.21% | |||||||||||||||
Total Return Bond Fund | Class A | $ | 1,000.00 | $ | 1,021.30 | $ | 1,021.67 | $ | 3.51 | $ | 3.51 | 0.69% | ||||||||||||||
Institutional Class | $ | 1,000.00 | $ | 1,022.20 | $ | 1,022.93 | $ | 2.24 | $ | 2.24 | 0.44% | |||||||||||||||
Global High Income Fund | Class A | $ | 1,000.00 | $ | 1,049.40 | $ | 1,020.11 | $ | 5.15 | $ | 5.08 | 1.00% | ||||||||||||||
Institutional Class | $ | 1,000.00 | $ | 1,050.10 | $ | 1,021.37 | $ | 3.86 | $ | 3.81 | 0.75% | |||||||||||||||
| * | Expenses are equal to the Fund’s annualized expense ratio multiplied by the average account value over the period multiplied by 184/366 (to reflect the one-half year period). |
| ** | The expense ratio presented represents a six-month, annualized ratio. |
| 1 | Represents the hypothetical 5% return before expenses. |
2016 Annual Report
77
Supplemental Information (Unaudited)
Board Consideration of Advisory and Sub-Advisory Agreements – Aberdeen Investment Funds
At an in-person meeting of the Board of Trustees of the Aberdeen Investment Funds (the “Trust”) held on June 16, 2016, the Board, including a majority of the Board Members who are not “interested persons” of the Trust (the “Independent Trustees”) as that term is defined in the Investment Company Act of 1940, as amended (the “1940 Act”), voted to renew for a one-year period the advisory agreement (the “Advisory Agreement”) between the Trust, on behalf of each of Aberdeen Select International Equity Fund, Aberdeen Select International Equity Fund II, Aberdeen Total Return Bond Fund and Aberdeen Global High Income Fund (collectively, the “Funds”), and Aberdeen Asset Management Inc. (the “Adviser”). The Board, including a majority of the Independent Trustees, also voted to renew for an annual period the sub-advisory agreement between the Adviser and Aberdeen Asset Managers Limited (the “Sub-Adviser”) with respect to Select International Equity Fund and Select International Equity Fund II (the “Sub- Advisory Agreement” and, together with the Advisory Agreement, the “Advisory Agreements”). The Sub-Adviser is an affiliate of the Adviser. The Adviser and the Sub-Adviser are sometimes referred to collectively as the “Advisers.”
In addition to the meeting on June 16, 2016, the Investment Management and Service Contracts Committee (the “Committee”) of the Board met on March 18, 2016, April 21, 2016, May 20, 2016 and June 7, 2016 to discuss, among other things: the peer groups proposed by an independent third party to be used for comparison of the Funds’ fees and performance; the Funds’ performance and expenses, including in-person interviews with the Advisers’ management personnel; information provided by the Advisers in response to an information request made on behalf of the Independent Trustees by their independent legal counsel; supplemental information requested from the Advisers that the Independent Trustees believed to be reasonably necessary for their review of the Advisory Agreements; and the legal standards applicable to the Board’s review.
At the request of the Committee, the Independent Trustees that are not members of the Committee attended and participated in the Committee’s meetings.
In connection with the contract review meetings convened by the Committee, the Independent Trustees reviewed a variety of information provided by the Advisers, both initially and supplementally, relating to the Funds, the Advisory Agreements and the Advisers, including comparative performance, fee and expense information provided by an independent third party and other information regarding the nature, extent and quality of services provided by the Advisers under their respective Advisory Agreements. The materials provided generally included, among other items:
| • | information on the investment performance of the Funds and comparative performance of peer groups of funds and the Funds’ performance benchmarks; |
| • | information on the Funds’ advisory fees and other expenses, including information comparing each Fund’s advisory fees and other expenses to those of a peer group of funds and information about any applicable expense limitations and fee “breakpoints;” |
| • | sales and redemption data with respect to each Fund; |
| • | information about the profitability of the Advisory Agreements to the Advisers; |
| • | reports prepared by the Advisers in response to requests submitted by the Independent Trustees’ independent legal counsel on behalf of the Independent Trustees; and |
| • | a memorandum from the Independent Trustees’ independent legal counsel regarding the responsibilities of the Board in considering for approval the continuation of investment advisory and investment sub-advisory arrangements under the 1940 Act and relevant state law. |
The Board, including the Independent Trustees, also considered other matters such as:
| • | the Advisers’ financial results and financial condition; |
| • | each Fund’s investment objective and strategies; |
| • | the Advisers’ investment personnel and operations, including changes to such personnel and operations; |
| • | arrangements relating to the distribution of the Funds’ shares and the related costs; |
| • | the procedures employed to determine the value of the Funds’ assets; |
| • | the allocation of the Funds’ brokerage, if any, including, if applicable, allocations to brokers affiliated with the Advisers and the use, if any, of “soft” commission dollars to pay Fund expenses and to pay for research and other similar services; |
| • | the resources devoted to, and the record of compliance with, the Funds’ investment policies and restrictions, policies on personal securities transactions and other compliance policies; and |
| • | possible conflicts of interest. |
Annual Report 2016
78
Supplemental Information (Unaudited) (continued)
The Board also considered the nature, extent and quality of the services provided to the Funds by the Adviser’s affiliates. Throughout the process, the Independent Trustees were afforded the opportunity to ask questions of and request additional materials from the Adviser and the Sub- Adviser.
In addition to the materials requested by the Independent Trustees in connection with their annual consideration of the continuation of the Advisory Agreements, the Board receives materials in advance of each regular quarterly meeting of the Board that provides information relating to the services provided by the Advisers, including detailed information about the Funds’ investment performance. This information generally includes, among other things, third-party performance rankings for various periods (including prior to the Advisers’ management of the Funds) comparing each Fund against its peer group, total return information for various periods, and details of sales and redemptions of each Fund’s shares for the period. The Board also receives periodic presentations from the portfolio management teams in connection with the performance of the Funds.
The Independent Trustees were advised by separate independent legal counsel throughout the process. The Independent Trustees consulted in executive sessions with such independent counsel regarding consideration of the renewal of the Advisory Agreements. In considering whether to approve the continuation of the Advisory Agreements, the Board, including the Independent Trustees, did not identify any single factor as determinative. Individual Board members may have evaluated the information presented differently from one another, giving different weights to various factors. Matters considered by the Board, including the Independent Trustees, in connection with their approval of the continuation of the Advisory Agreements included the factors listed below.
The nature, extent and quality of the services provided to the Funds under the Advisory Agreements. The Board considered the nature, extent and quality of the services provided by Advisers, as applicable to the Funds and the resources dedicated to the Funds by the Advisers and their affiliates. The Board considered, among other things:
| • | The Advisers’ investment experience; |
| • | The background and experience of the Advisers’ senior management personnel and the qualifications, background and responsibilities of the portfolio managers that are primarily responsible for the day-to-day portfolio management services for the Funds; |
| • | The allocation of responsibilities among the Advisers; |
| • | The Advisers’ role in coordinating the activities of the Funds’ other service providers; |
| • | Information provided on a regular basis by the Trust’s Chief Compliance Officer regarding the effectiveness of the Advisers’ compliance policies and procedures; |
| • | The Advisers’ risk management processes; |
| • | The Advisers’ focus on monitoring the performance of the Funds and addressing performance matters; |
| • | The benefits to shareholders of investing in a mutual fund that is part of a family of funds that offers shareholders the right to exchange shares of one type of fund for shares of another type of fund, and provides a variety of fund and shareholder services; and |
| • | Its knowledge of management and the quality of the performance of management’s duties through Board meetings, discussion and reports during the preceding year. |
After reviewing these and related factors, the Board concluded that the nature, extent and quality of the services provided to the Funds by the Advisers were extensive in nature and of high quality and supported the renewal of the Advisory Agreements.
Investment performance. The Independent Trustees requested and received information about the performance of the Funds over various time periods, including information that compared the performance of each Fund to the performance of relevant peer groups of funds and its performance benchmark. When applicable, the Board considered the performance of each Fund compared to the performance of comparable funds or accounts managed by the Adviser and its affiliates. In addition, the Board reviewed data prepared by an independent third party which analyzed the performance of each Fund using a variety of performance metrics.
The Board considered the Advisers’ performance and reputation generally, the performance of the Aberdeen fund family generally, and the Advisers’ responsiveness to the Board’s concerns about performance and their willingness to take steps intended to improve performance from the time they commenced management of the Funds in 2013.
In addition to the foregoing, the Board considered the specific factors set forth below with respect to the performance of each Fund for the periods ended March 31, 2016. In each case, the Board noted that the Advisers assumed management of each Fund on May 22, 2013, and that the Funds’ performance for periods prior to that time reflects the performance of the Funds’ previous investment adviser.
2016 Annual Report
79
Supplemental Information (Unaudited) (continued)
Aberdeen Select International Equity Fund. The Board noted that the Select International Equity Fund had performance in the bottom quintile when compared to its peer group over the 1-, 2-, 4- and 5-year periods, and had performance in the fourth quintile over the 3-year period. The Board noted that for the year-to-date the Select International Equity Fund had performance in the first quintile. The Board noted that it will continue to closely monitor the Fund’s performance.
Aberdeen Select International Equity Fund II. The Board noted that for all reported periods except year-to-date the Select International Equity Fund II ranked in the bottom quintile. The Board noted that for the year-to-date the Select International Equity Fund II had performance in the first quintile. The Board noted that it will continue to closely monitor the Fund’s performance.
Aberdeen Global High Income Fund. The Board noted that the Fund’s performance versus its peer group was ranked in the fifth quintile for the year-to-date, 1-, 2- and 5- year periods, in the fourth quintile for the 3- and 4- year periods and the third quintile for the 10-year period. The Board noted the increased monitoring of the Fund’s performance during its regular quarterly meeting as well as in the meetings of the Committee and that the Board would continue to closely monitor the Fund’s performance.
Aberdeen Total Return Bond Fund. The Board noted that the Fund performed in the first quintile for the year-to-date period when compared to its peer group average, in the third quintile for the 1-year period, the fourth quintile for the 2-, 3- and 5-year periods, in the fifth quintile for the 4-year period, and in the second quintile for the 10-year period. The Board noted that it would continue to closely monitor the Fund’s performance.
Fees paid for advisory services and expenses. The Board considered the fees charged to the Funds for advisory services as well as the total expense levels of the Funds. This information included comparisons (provided both by management and by an independent third party) of each Fund’s net management fee and total expense level to those of its peer group (the “Expense Group”) and information about the advisory fees charged by the Adviser to separately managed accounts with a similar investment strategy.
In comparing each Fund’s net management fee to that of comparable funds, the Board noted that such fee included advisory fees, but not fund administration fees. In considering the fees charged to any comparable accounts, the Board considered, among other things, management’s discussion of the differences required to manage the different types of accounts. In evaluating each of the Fund’s advisory fees, the Board also took into account the demands, complexity and quality of the investment management of the Funds.
The Board also noted that the sub-advisory fees, as applicable, for the Funds are paid by the Adviser, not the Funds, out of its advisory fee. The Board also considered that the Adviser had entered into expense limitation agreements with respect to the Aberdeen Global High Income Fund and the Aberdeen Total Return Bond Fund, pursuant to which the Adviser agreed to waive a portion of its advisory fee and/or reimburse certain expenses as a means of limiting each Fund’s total annual operating expenses for a period of time. Additionally, the Adviser has agreed to waive a portion of its management fees for each of the Funds at the annual rate of 0.005% of the respective Fund’s average daily net assets.
The Board also considered other benefits directly or indirectly received by the Adviser and its affiliates from their relationships with the Funds, such as the engagement of affiliates of the Adviser to provide distribution services to the Funds.
In addition to the factors described above, the Board considered the specific factors set forth below with respect to each Fund’s fees and expenses. The Board considered the advisory fees, both contractual and after waivers and reimbursements, and also considered total expenses, both including Rule 12b-1 fees and excluding such fees.
Aberdeen Select International Equity Fund. The Board noted that the Fund’s contractual management fees and actual management fees are above the peer group median, ranking 8 of 13 funds. The Board also considered that the Fund’s total expenses ranked 11 of 13 funds in the peer group. The Board noted the decline in assets of the Select International Equity Fund which resulted in fixed expenses being spread across lower assets.
Aberdeen Select International Equity Fund II. The Board considered that the Fund’s contractual management fees are higher than the peer group median, ranking 9 of 13 funds, and that the Fund’s actual management fees are also higher than the median, ranking of 8 of 13 funds. The Board noted that the Fund’s total expenses are higher than the median, ranking 8 of 13 funds in the peer group. The Board noted the decline in assets of the Select International Equity Fund II which resulted in fixed expenses being spread across lower assets.
Aberdeen Global High Income Fund. The Board considered that the Fund’s contractual management fees and actual management fees are slightly higher than the peer group median, ranking 8 of 14 funds. The Board noted that the Fund’s total expenses both including Rule 12b-1 fees and excluding such fees, are slightly lower than the median, ranking 7 of 14 funds in the peer group. The Board noted the complexity of the securities held in the Fund’s portfolio.
Aberdeen Total Return Bond Fund. The Board considered that the Fund’s contractual management fees are lower than the peer group median, ranking 5 of 19 funds, and that the Fund’s actual management fees are lower than the peer group median, ranking 6 of 19 funds. The Board noted that the Fund’s total expenses, both including Rule 12b-1 fees and excluding such fees, are lower than the median, ranking 5 of 19 funds in the peer group.
Annual Report 2016
80
Supplemental Information (Unaudited) (concluded)
The Independent Trustees asked for, and received, information about the fees paid by other funds and accounts managed by the Adviser. The Independent Trustees considered the nature of the other accounts, which included comingled and separately managed accounts. The Independent Trustees noted the differences in managing the Funds compared to other accounts managed by the Advisers, including, among other things, the complexity of managing the Funds in light of regulatory, tax and compliance considerations resulting from the Funds’ status as registered investment companies.
After reviewing these and related factors, and taking into account management’s discussion regarding Fund expenses, the Board concluded that the advisory fees, and as applicable, the sub- advisory fees, were fair and reasonable, and that the costs of these services generally and the related profitability of the Adviser and its affiliates from their relationships with the Funds were reasonable and supported the renewal of the Advisory Agreements.
Economies of Scale. The Board considered the existence of any economies of scale in the provision of services by the Advisers and whether those economies would be shared with the Funds through breakpoints in the investment advisory fees or other means, such as expense waivers or limitations. The Board noted that the Global High Income Fund and the Total Return Bond Fund benefitted from an expense limitation agreement, and that the fees of Select International Equity Fund, Select International Equity Fund II and Global High Income Fund were subject to breakpoints. The Board considered the Adviser’s belief that the Total Return Bond Fund does not have breakpoints at this time because this Fund has a lower overall fee structure.
The Board also considered the potential effect of each Fund’s size on fees, noting that if a Fund’s assets increase over time, the Fund may realize other economies of scale if assets increase proportionally more than some expenses. The Board took note of the decline in the Funds’ assets and the effect of such decline on the Funds’ expense ratios.
Profitability and costs. The Board examined the profitability of the Adviser and its affiliates on a Fund-by-Fund basis. The Board also considered information about the allocation of expenses used to calculate profitability. When reviewing the Adviser’s profitability, the Board considered guidance from the Securities and Exchange Commission and the courts regarding adviser profitability, the performance of the Funds, the expense levels of the Funds, and whether the Adviser had implemented breakpoints, if any, and expense limitations, with respect to the Funds.
Other factors. The Board also considered other factors, which included, but were not limited to, the following:
| • | the effect of any market and economic volatility on the performance, asset levels and expense ratios of the Funds; |
| • | whether the Funds have operated in accordance with their investment objectives, the Funds’ record of compliance with their investment restrictions, and the compliance programs of the Trust and the Adviser. The Trustees also considered the compliance-related resources that the Adviser and its affiliates provide to the Funds; |
| • | the Adviser’s financial condition and its ability to continue to provide a high level of service under the Advisory Agreements; and |
| • | so-called “fallout benefits” to the Adviser, such as the benefits of research made available to the Adviser by reason of brokerage commissions generated by the Funds’ securities transactions or reputational and other indirect benefits. The Board considered any possible conflicts of interest associated with these fallout and other benefits, and the reporting, disclosure and other processes in place to disclose and monitor such possible conflicts of interest. |
* * *
Based on their evaluation of factors that they deemed to be material, including those factors described above, the Independent Trustees concluded that the advisory fee, and as applicable, sub-advisory fee structures, were reasonable in light of the nature and quality of the services provided, and recommended that renewal of the Advisory Agreements would be in the best interest of each Fund and its shareholders. Accordingly, the Board, and the Independent Trustees voting separately, approved the Advisory Agreements for an additional one-year period.
2016 Annual Report
81
Management of the Funds (Unaudited)
As of October 31, 2016
Board of Trustees and Officers of the Funds
| Name, Address, and Age | Position(s) Held, Length of Time Served and Term of Office* | Principal Occupation During Past 5 Years | Number of Portfolios In Fund Complex Overseen by Trustee** | Other Directorships Held by Trustee During Past 5 Years*** | ||||
Trustees who are not Interested Persons (as Defined in the 1940 Act) of the Funds | ||||||||
Antoine Bernheim**** 63 | Trustee of the Trust since November 2004; Chairman of the Fund Complex since December 2008. | President, Dome Capital Management, Inc., 1984–present (investment advisory firm); Chairman, Dome Securities Corp., 1995–2012 (broker/dealer); President, The U.S. Offshore Funds Directory, 1990–present (publishing). | 4 | None | ||||
Thomas Gibbons**** 69 | Trustee of the Trust since November 2004. | President, Cornerstone Associates Management, 1987–present (consulting firm). | 4 | None | ||||
Cynthia Hostetler**** 54 | Trustee of the Trust since September 2011. | Member of the Board of Directors of the Edgen Group (energy), 2012–2013, TriLinc Global Impact Fund, 2013–present, Vulcan Materials Company, 2014–present and Independent Directors Council (August 2014–present); Vice President of Investment Funds, Overseas Private Investment Corporation, 2001–2009; President, First Manhattan Bancorporation, 1991–2006. | 4 | Director, Edgen Group (NYSE: EDG) 2012–2013; Director, TriLinc Global Impact Fund, 2013–present; Director, Vulcan Materials Company (NYSE: VMC), 2014–present (construction materials). | ||||
Robert S. Matthews**** 73 | Trustee of the Trust since June 1992. | Managing Partner, Matthews & Co., 1990–present (certified public accounting firm). | 4 | Trustee, Allstate Financial Investment Trust, 2008–2009, (investment company). | ||||
Peter Wolfram**** 63 | Trustee of the Trust since June 1992. | Partner, Kelley Drye & Warren LLP, 1983–present (law firm). | 4 | Friends of Atlantik-Bruecke e.V. Foundation, 2004–present. | ||||
| * | Each Trustee serves during the lifetime of the Funds or until he or she dies, resigns, retires, is declared bankrupt or incompetent, or is removed or, if sooner, until the next special meeting of the Funds’ shareholders and until the election and qualification of his or her successor. The current retirement age is 75. |
| ** | The Aberdeen Fund Complex consists of the Trust which currently consists of four portfolios, Aberdeen Funds, Aberdeen Asia-Pacific Income Fund, Inc., Aberdeen Global Income Fund, Inc., Aberdeen Australia Equity Fund, Inc., Aberdeen Chile Fund, Inc., Aberdeen Israel Fund, Inc., Aberdeen Indonesia Fund, Inc., Aberdeen Latin America Equity Fund, Inc., Aberdeen Emerging Markets Smaller Company Opportunities Fund, Inc., Aberdeen Singapore Fund, Inc., The Asia Tigers Fund, Inc., The India Fund, Inc., Aberdeen Greater China Fund, Inc. and Aberdeen Japan Equity Fund, Inc. |
| *** | Directorships held in (1) any other investment companies registered under the 1940 Act, (2) any company with a class of securities registered pursuant to Section 12 of the Securities Exchange Act of 1934, as amended (the “Exchange Act”) or (3) any company subject to the requirements of Section 15(d) of the Exchange Act. |
| **** | Each Trustee may be contacted by writing to the Trustee c/o Aberdeen Asset Management Inc., 1735 Market Street, 32nd Floor, Philadelphia, Pennsylvania 19103, Attn: Alan Goodson. |
Annual Report 2016
82
Management of the Funds (Unaudited) (continued)
As of October 31, 2016
| Name, Address, and Age | Position(s) Held, Length of Time Served and Term of Office* | Principal Occupation During Past 5 Years | Number of Portfolios in Fund Complex Overseen by Trustee** | Other Directorships Held by Trustee During Past 5 Years*** | ||||
Trustee who is an Interested Person (as Defined in the 1940 Act) of the Funds | ||||||||
Andrew Smith****† 48 | Trustee of the Trust since September 2014†† | Co-Head of Americas for Aberdeen since June 2014. Mr. Smith is Chief Operating Officer of Aberdeen Asset Management Inc. He held various roles since he joined Aberdeen including Chief Compliance Officer for their North American Closed End Funds as well as Chief Financial Officer and Chief Operating Officer for Aberdeen in the Americas. Andrew joined Aberdeen in December 2000 as the result of the acquisition of Murray Johnstone. | 4 | Aberdeen Asset Management Inc. (2009-2015) (investment adviser) | ||||
| * | Each Trustee serves during the lifetime of the Funds or until he or she dies, resigns, retires, is declared bankrupt or incompetent, or is removed or, if sooner, until the next special meeting of the Funds’ shareholders and until the election and qualification of his or her successor. The current retirement age is 75. |
| ** | The Aberdeen Fund Complex consists of the Trust, which currently consists of four portfolios, Aberdeen Funds, Aberdeen Asia-Pacific Income Fund, Inc., Aberdeen Global Income Fund, Inc., Aberdeen Australia Equity Fund, Inc., Aberdeen Chile Fund, Inc., Aberdeen Israel Fund, Inc., Aberdeen Indonesia Fund, Inc., Aberdeen Latin America Equity Fund, Inc., Aberdeen Emerging Markets Smaller Company Opportunities Fund, Inc., Aberdeen Singapore Fund, Inc., The Asia Tigers Fund, Inc., The India Fund, Inc., Aberdeen Greater China Fund, Inc. and Aberdeen Japan Equity Fund, Inc. |
| *** | Directorships held in (1) any other investment companies registered under the 1940 Act, (2) any company with a class of securities registered pursuant to Section 12 of the Securities Exchange Act of 1934, as amended (the “Exchange Act”) or (3) any company subject to the requirements of Section 15(d) of the Exchange Act. |
| **** | Each Trustee may be contacted by writing to the Trustee c/o Aberdeen Asset Management Inc., 1735 Market Street, 32nd Floor, Philadelphia, Pennsylvania 19103, Attn: Alan Goodson. |
| † | Mr. Smith is considered to be an “interested person” of the Funds as defined in the 1940 Act because of his affiliation with the Adviser. |
| †† | Mr. Smith resigned as of December 15, 2016. |
2016 Annual Report
83
Management of the Funds (Unaudited) (continued)
As of October 31, 2016
Officers of the Funds
| Name, Address, and Age | Position(s) Held, Length of Time Served and Term of Office1 | Principal Occupation During Past 5 Years | ||
Bev Hendry* Aberdeen Asset Management Inc. 1735 Market Street, 32nd Floor Philadelphia, PA 19103 63 | President and Chief Executive Officer Officer of the Trust | Currently, Co-Head of Americas and Director for Aberdeen Asset Management Inc. since July 2014. He first joined Aberdeen in 1987 and helped establish Aberdeen’s business in the Americas in Fort Lauderdale. Mr. Hendry left Aberdeen in 2008 when the company moved to consolidate its headquarters in Philadelphia. Mr. Hendry re-joined Aberdeen from Hansberger Global Investors in Fort Lauderdale, Florida, where he worked for six years as Chief Operating Officer. | ||
Andrew Smith Aberdeen Asset Management Inc. 1735 Market Street, 32nd Floor Philadelphia, PA 19103 48 | Vice President of the Trust Officer of the Trust | Co-Head of Americas for Aberdeen since June 2014. Mr. Smith is Chief Operating Officer and Director of Aberdeen Asset Management Inc. He held various roles since he joined Aberdeen including Chief Compliance Officer for their North American Closed End Funds as well as Chief Financial Officer and Chief Operating Officer for Aberdeen in the Americas. Andrew joined Aberdeen in December 2000 as the result of the acquisition of Murray Johnstone. | ||
Jeffrey Cotton* Aberdeen Asset Management Inc. 1735 Market Street, 32nd Floor Philadelphia, PA 19103 39 | Chief Compliance Officer, Anti-Money Laundering and Identity Theft Officer and Vice President Officer of the Trust | Currently, Director, Vice President and Head of Compliance–Americas for Aberdeen Asset Management Inc. Mr. Cotton joined Aberdeen in 2010. Prior to joining Aberdeen, Mr. Cotton was a Senior Compliance Officer at Old Mutual Asset Management (2009-2010) supporting its affiliated investment advisers and mutual fund platform. Mr. Cotton was also a Vice President and Senior Compliance Manager at Bank of America/Columbia Management (2006-2009). | ||
Andrea Melia* Aberdeen Asset Management Inc. 1735 Market Street, 32nd Floor, Philadelphia, PA 19103 47 | Chief Financial Officer and Treasurer Officer of the Trust | Currently, Vice President and Head of Fund Administration–U.S. for Aberdeen Asset Management Inc. Ms. Melia joined Aberdeen Asset Management Inc. in September 2009. Prior to joining Aberdeen, Ms. Melia was Director of fund administration and accounting oversight for Princeton Administrators LLC, a division of BlackRock Inc. and had worked with Princeton Administrators since 1992. | ||
Megan Kennedy* Aberdeen Asset Management Inc. 1735 Market Street, 32nd Floor Philadelphia, PA 19103 42 | Assistant Secretary and Vice President Officer of the Trust | Currently, Head of Product Management for Aberdeen Asset Management Inc. Ms. Kennedy joined Aberdeen Asset Management Inc. in 2005 as a Senior Fund Administrator. Ms. Kennedy was promoted to Assistant Treasurer Collective Funds/North American Mutual Funds in February 2008 and promoted to Treasurer Collective Funds/North American Mutual Funds in July 2008. |
Annual Report 2016
84
Management of the Funds (Unaudited) (continued)
As of October 31, 2016
| Name, Address, and Age | Position(s) Held, Length of Time Served and Term of Office1 | Principal Occupation During Past 5 Years | ||
Lucia Sitar* Aberdeen Asset Management Inc. 1735 Market Street, 32nd Floor Philadelphia, PA 19103 45 | Chief Legal Officer and Vice President Officer of the Trust since 2013 | Currently, Vice President and Managing U.S. Counsel for Aberdeen Asset Management Inc. Ms. Sitar joined Aberdeen Asset Management Inc. in July 2007. | ||
Alan Goodson* Aberdeen Asset Management Inc. 1735 Market Street, 32nd Floor Philadelphia, PA 19103 42 | Vice President Officer of the Trust since 2013 | Currently, Head of Product–U.S., overseeing Product Management, Product Development and Investor Services for Aberdeen’s registered and unregistered investment companies in the U.S. and Canada. Mr. Goodson is Director and Vice President of Aberdeen Asset Management Inc. and joined Aberdeen in 2000. | ||
Stephen Docherty* Aberdeen Asset Management Inc. 1735 Market Street, 32nd Floor Philadelphia, PA 19103 46 | Vice President Officer of the Trust since 2013 | Currently, Head of Global Equities for Aberdeen Asset Managers Limited. Mr. Docherty joined Aberdeen Asset Managers Limited in 1994. | ||
Steven Logan Aberdeen Asset Management Inc. 1735 Market Street, 32nd Floor Philadelphia, PA 19103 48 | Vice President Officer of the Trust since 2016 | Currently, Global Head of High Yield for Aberdeen Asset Managers Limited. Mr. Logan joined Aberdeen following the SWIP acquisition in April 2014. Mr. Logan joined SWIP in 2001 as an Investment Director and became Head of European High Yield in 2006 | ||
Jennifer Nichols* Aberdeen Asset Management Inc. 1735 Market Street, 32nd Floor Philadelphia, PA 19103 38 | Vice President Officer of the Trust since 2013 | Currently, Global Head of Legal for Aberdeen. Director and Vice President for Aberdeen Asset Management Inc. (since October 2006). | ||
Lynn Chen Aberdeen Asset Management Inc. 1735 Market Street, 32nd Floor Philadelphia, PA 19103 53 | Vice President Officer of the Trust since 2016 | Currently, Head of Total Return Bond for Aberdeen Asset Management Inc. Ms. Chen joined Aberdeen Asset Management Inc. in May 2013 following the acquisition of Artio Global Management. From 2002-2013, she held a role similar to a Senior Investment Manager with Artio Global Management’s Fixed Income Group. | ||
Hugh Young* Aberdeen Asset Management Inc. 1735 Market Street, 32nd Floor Philadelphia, PA 19103 58 | Vice President Officer of the Trust | Currently, Managing Director of Aberdeen Asset Management Asia Limited (“AAMAL”) and member of the Executive Management Committee and Director of Aberdeen Asset Management PLC (since 1991 and 2011, respectively). Mr. Young joined Aberdeen in 1991. | ||
Brian Link State Street Bank and Trust Company 100 Huntington, CHP0026 Boston, MA 02116 44 | Secretary Officer of the Trust since 2014 | Vice President and Managing Counsel, State Street Bank and Trust Company (since 2007). |
2016 Annual Report
85
Management of the Funds (Unaudited) (concluded)
As of October 31, 2016
| Name, Address, and Age | Position(s) Held, Length of Time Served and Term of Office1 | Principal Occupation During Past 5 Years | ||
Eric Olsen* Aberdeen Asset Management Inc. 1735 Market Street, 32nd Floor Philadelphia, PA 19103 46 | Assistant Treasurer Officer of the Trust | Currently, Deputy Head of Fund Administration–US for Aberdeen Asset Management Inc. Mr. Olsen joined Aberdeen Asset Management Inc. in August 2013. Prior to joining Aberdeen Asset Management Inc., Mr. Olsen was a Director of Financial Reporting for BNY Mellon Asset Servicing and had worked with BNY Mellon since 1998. | ||
Brian O’Neill* Aberdeen Asset Management Inc. 1735 Market Street, 32nd Floor, Philadelphia, PA 19103 48 | Assistant Treasurer Officer of the Trust | Currently, Senior Fund Administration Manager–U.S. for Aberdeen Asset Management Inc. Mr. O’Neill joined Aberdeen Asset Management Inc. in 2008. Prior to joining Aberdeen Asset Management Inc., Mr. O’Neill was a Director of Fund Accounting with Nationwide Funds Group (2002-2008). |
| 1 | Pursuant to the Trust’s By-laws, officers of the Trust are elected by the Board of Trustees to hold such office until his or her successor is chosen and qualified, or until they resign or are removed from office. |
| 2 | Mr. Smith resigned as of December 15, 2016. |
| * | Mr. Hendry, Mr. Cotton, Ms. Melia, Mr. O’Neill, Ms. Kennedy, Ms. Sitar, Mr. Goodson, Mr. Young and Ms. Nichols hold officer position(s) in one or more of the following: Aberdeen Asia-Pacific Income Fund, Inc., Aberdeen Australia Equity Fund, Inc., Aberdeen Global Income Fund, Inc., Aberdeen Chile Fund, Inc., Aberdeen Israel Fund, Inc., Aberdeen Indonesia Fund, Inc., Aberdeen Latin America Equity Fund, Inc., Aberdeen Emerging Markets Smaller Company Opportunities Fund, Inc., Aberdeen Singapore Fund, Inc., The Asia Tigers Fund, Inc., The India Fund, Inc., Aberdeen Greater China Fund, Inc., Aberdeen Funds, Aberdeen Japan Equity Fund, Inc., each of which may also be deemed to be a part of the same “Fund Complex” as the Funds. |
Annual Report 2016
86
Management Information
Trustees
Antoine Bernheim, Chairman
Thomas Gibbons
Cynthia Hostetler
Robert S. Matthews
Peter Wolfram
Officers
Bev Hendry, President and Chief Executive Officer
Jeffrey Cotton, Chief Compliance Officer, Vice President and Anti-Money Laundering and Identity Theft Officer
Andrea Melia, Treasurer and Chief Financial Officer
Brian Link, Secretary
Megan Kennedy, Assistant Secretary and Vice President
Lucia Sitar, Chief Legal Officer and Vice President
Lynn Chen, Vice President
Alan Goodson, Vice President
Stephen Docherty, Vice President
Steven Logan, Vice President
Jennifer Nichols, Vice President
Hugh Young, Vice President
Brian O’Neill, Assistant Treasurer
Eric Olsen, Assistant Treasurer
Investment Adviser
Aberdeen Asset Management Inc.
1735 Market Street, 32nd Floor
Philadelphia, PA 19103
Transfer Agent
Boston Financial Data Services, Inc.
30 Dan Road
Canton, MA 02021
Distributor
Aberdeen Fund Distributors LLC
1735 Market Street, 32nd Floor
Philadelphia, PA 19103
Fund Administrator, Custodian & Fund Accountant
State Street Bank and Trust Company
1 Heritage Drive, 3rd Floor
North Quincy, MA 02171
Independent Registered Public Accounting Firm
KPMG LLP
1601 Market Street
Philadelphia, PA 19103
Fund Counsel
Morrison & Foerster LLP
250 West 55th Street
New York, NY 10019-9601
Aberdeen Asset Management Inc. 1735 Market Street, 32nd Floor Philadelphia, PA 19103 aberdeen-asset.us |
|
AOE-0377-AR
Item 2. Code of Ethics.
(a) As of October 31, 2016, the Registrant had adopted a code of ethics that applies to the Registrant’s principal executive officer, principal financial officer, principal accounting officer or controller, or persons performing similar functions, regardless of whether these individuals are employed by the Registrant or a third party (the “Code of Ethics”).
(c) During the period covered by the report, no material changes were made to the provisions of the Code of Ethics.
(d) During the period covered by the report, the Registrant did not grant any waivers to the provisions of the Code of Ethics.
(f) The Code of Ethics is included with this Form N-CSR as Exhibit 12(a)(1).
Item 3. Audit Committee Financial Expert.
The Registrant’s Board of Trustees has determined that there is at least one member who qualifies as an “audit committee financial expert” serving on its Audit Committee. Mr. Robert S. Matthews is the “audit committee financial expert” and is considered to be an “Independent Trustee” as each term is defined in Item 3 of Form N-CSR.
Item 4. Principal Accountant Fees and Services.
Fiscal Year Ended | (a) Audit Fees | (b) Audit-Related Fees | (c)1 Tax Fees | (d) All Other Fees | ||||||||||||
October 31, 2016 | $ | 147,085 | $ | — | $ | 33,000 | $ | — | ||||||||
October 31, 2015 | $ | 156,000 | $ | 5,250 | $ | 33,000 | $ | — | ||||||||
| 1 | The Tax Fees are the aggregate fees billed for professional services rendered by KPMG LLP for the review of Form 1120-RIC, Form 8613, and review of excise tax distribution calculations. |
(e)(1) Audit Committee Pre-Approval Policies and Procedures. The Registrant’s audit committee pre-approves all audit and non-audit services to be performed by the Registrant’s accountant before the accountant is engaged by the Registrant to perform such services.
(e)(2) The percentage of services described in each of paragraphs (b) through (d) of this Item that were approved by the audit committee pursuant to paragraph (c)(7)(i)(C) of Rule 2-01 of Regulation S-X are as follows:
(b) None.
(c) None.
(d) Not applicable.
(f) Not applicable.
(g) The aggregate non-audit fees billed by the Registrant’s accountant for services to the Registrant and to the Registrant’s investment adviser and all entities controlling, controlled by, or under common control with the Adviser that provide services to the Registrant for the Registrant’s fiscal years ended October 31, 2016 and October 31, 2015 were $733,286 and $213,745, respectively.
(h) The Registrant’s Audit Committee of the Board of Trustees has considered whether the provision of non-audit services that were rendered to the Registrant’s investment adviser (not including any sub-adviser whose role is primarily portfolio management and is subcontracted with or overseen by another investment adviser), and any entity controlling, controlled by, or under common control with the investment adviser that provides ongoing services to the Registrant that were not pre-approved pursuant to paragraph (c)(7)(ii) or Rule 2-01 of Regulation S-X is compatible with maintaining the principal accountant’s independence and has concluded that it is.
Item 5. Audit Committee of Listed Registrants.
Not applicable.
Item 6. Schedule of Investments
(a) Included as part of the Reports to Shareholders filed under Item 1 of this Form N-CSR.
(b) Not applicable.
Item 7. Disclosure of Proxy Voting Policies and Procedures for Closed-End Management Investment Companies.
Not applicable.
Item 8. Portfolio Managers of Closed-end Management Investment Companies.
Not applicable.
Item 9. Purchases of Equity Securities by Closed-End Management Investment Company and Affiliated Purchasers.
Not applicable.
Item 10. Submission of Matters to a Vote of Security Holders.
During the period ended October 31, 2016, there were no material changes to the procedures by which shareholders may recommend nominees to the Registrant’s Board of Trustees.
Item 11. Controls and Procedures.
(a) The Registrant’s principal executive and principal financial officers, or persons performing similar functions, have concluded that the Registrant’s disclosure controls and procedures (as defined in Rule 30a-3(c) under the Investment Company Act of 1940 (the “Act”) (17 CFR 270.30a-3(c))) are effective, as of a date within 90 days of the filing date of the report that includes the disclosure required by this paragraph, based on the evaluation of these controls and procedures required by Rule 30a-3(b) under the Act (17 CFR 270.30a3(b)) and Rule 13a-15(b) or 15d-15(b) under the Securities Exchange Act of 1934 (17 CFR 240.13a-15(b) or 240.15d15(b)).
(b) There were no changes in the Registrant’s internal control over financial reporting (as defined in Rule 30a-3(d) under the Act (17 CFR 270.30a-3(d)) that occurred during the second fiscal quarter of the period covered by this report that has materially affected, or are reasonably likely to materially affect, the Registrant’s internal control over financial reporting.
Item 12. Exhibits.
(a)(1) The Code of Ethics of the Registrant for the period covered by this report as required pursuant to Item 2 of this Form N-CSR.
(a)(2) Certifications pursuant to Rule 30a-2(a) under the Act and Section 302 of the Sarbanes-Oxley Act of 2002 are attached hereto.
(a)(3) Not applicable.
(b) Certifications pursuant to Rule 30a-2(b) under the Act and Section 906 of the Sarbanes-Oxley Act of 2002 are attached hereto.
SIGNATURES
Pursuant to the requirements of the Securities Exchange Act of 1934 and the Investment Company Act of 1940, as amended, the Registrant has duly caused this report to be signed on its behalf by the undersigned, thereunto duly authorized.
| Aberdeen Investment Funds | ||
| By: | /s/ Bev Hendry | |
| Bev Hendry | ||
| Principal Executive Officer of | ||
| Aberdeen Investment Funds | ||
Date: January 6, 2017
Pursuant to the requirements of the Securities Exchange Act of 1934 and the Investment Company Act of 1940, as amended, this report has been signed below by the following persons on behalf of the Registrant and in the capacities and on the dates indicated.
| By: | /s/ Bev Hendry | |
Bev Hendry Principal Executive Officer of Aberdeen Investment Funds | ||
Date: January 6, 2017
| By: | /s/ Andrea Melia | |
Andrea Melia Principal Financial Officer of Aberdeen Investment Funds | ||
Date: January 6, 2017