UNITED STATES
SECURITIES AND EXCHANGE COMMISSION
Washington, D.C. 20549
FORM N-CSR
CERTIFIED SHAREHOLDER REPORT OF
REGISTERED MANAGEMENT INVESTMENT COMPANIES
Investment Company Act file number: | 811-06652 |
|
|
Exact name of registrant as specified in charter: | Aberdeen Investment Funds |
|
|
Address of principal executive offices: | 1900 Market Street, Suite 200 |
| Philadelphia, PA 19103 |
|
|
Name and address of agent for service: | Ms. Andrea Melia |
| Aberdeen Standard Investments Inc. |
| 1900 Market Street, Suite 200 |
| Philadelphia, PA 19103 |
|
|
Registrant’s telephone number, including area code: | 866-667-9231 |
|
|
Date of fiscal year end: | October 31 |
|
|
Date of reporting period: | April 30, 2020 |
Item 1. Reports to Shareholders.
![]()
Aberdeen Investment Funds
Semi-Annual Report
April 30, 2020
Aberdeen Select International Equity Fund
Class A – BJBIX ¢ Institutional Class – JIEIX
Aberdeen Global Equity Impact Fund
Class A – JETAX ¢ Institutional Class – JETIX
Aberdeen Total Return Bond Fund
Class A – BJBGX ¢ Institutional Class – JBGIX
Aberdeen Global High Income Fund
Class A – BJBHX ¢ Institutional Class – JHYIX
Beginning with reports for the period ending April 30, 2021, as permitted by regulations adopted by the Securities and Exchange Commission, paper copies of the Funds’ shareholder reports like this one will no longer be sent by mail, unless you specifically request paper copies of the reports from Aberdeen Investment Funds or from your financial intermediary, such as a broker-dealer or bank. Instead, the reports will be made available on a website, and you will be notified by mail each time a report is posted and provided with a website link to access the report.
If you already elected to receive shareholder reports electronically, you will not be affected by this change and you need not take any action. You may elect to receive shareholder reports and other communications from the Fund or your financial intermediary electronically following the instructions included with this disclosure or by contacting your financial intermediary or the Funds.
You may elect to receive all future reports in paper free of charge. You can inform the Funds or your financial intermediary that you wish to continue receiving paper copies of your shareholder reports by following the instructions included with this disclosure or by contacting the Funds at (866) 667-9231 or your financial intermediary. Your election to receive reports in paper will apply to all funds held with your financial intermediary or with the Trust.
![]()
Table of Contents
|
|
|
|
Market Review |
| Page 1 |
|
|
|
|
|
Aberdeen Select International Equity Fund |
| Page 3 |
|
|
|
|
|
Aberdeen Global Equity Impact Fund (formerly, Aberdeen Select International Equity Fund II) |
| Page 9 |
|
|
|
|
|
Aberdeen Total Return Bond Fund |
| Page 15 |
|
|
|
|
|
Aberdeen Global High Income Fund |
| Page 29 |
|
|
|
|
|
Financial Statements |
| Page 39 |
|
|
|
|
|
Notes to Financial Statements |
| Page 54 |
|
|
|
|
|
Shareholder Expense Examples |
| Page 74 |
|
Investors should carefully consider a fund’s investment objectives, risks, fees, charges and expenses before investing any money. To obtain this and other fund information, please call 866-667-9231 to request a prospectus, or download a prospectus at www.aberdeen-asset.us. Please read it carefully before investing any money.
Investing in mutual funds involves risk, including possible loss of principal.
Aberdeen Investment Funds is distributed by Aberdeen Fund Distributors LLC, Member FINRA, 1900 Market Street, Suite 200, Philadelphia, PA 19103.
Aberdeen Standard Investments Inc. (“ASII”) (formerly, Aberdeen Asset Management Inc.) has been registered as an investment adviser under the Investment Advisers Act of 1940 since August 23, 1995.
Statement Regarding Availability of Quarterly Portfolio Schedule.
The complete schedule of portfolio holdings for each fund of Aberdeen Investment Funds (each a “Fund” and collectively, the “Funds”) is included in the Funds’ semi-annual and annual reports to shareholders. Aberdeen Investment Funds also files complete schedules of portfolio holdings for each Fund with the Securities and Exchange Commission (the “Commission”) for the first and third quarters of each fiscal year as an exhibit to its reports on Form N-PORT. The Funds’ Form N-PORT filings are available on the Commission’s website at www.sec.gov and the Funds make the information on the exhibit to Form N-PORT available to shareholders upon request without change by calling 1-866-667-9231.
Statement Regarding Availability of Proxy Voting Record.
Information regarding the policies and procedures that the Funds use to determine how to vote proxies relating to portfolio securities is available without charge, upon request, by calling 1-866-667-9231. The information is also included in the Funds’ Statement of Additional Information, which is available on the Funds’ website at www.aberdeen-asset.us and on the Commission’s website at www.sec.gov.
Information relating to how each Fund voted proxies relating to portfolio securities held during the most recent twelve months ended June 30 is available by August 30 of the relevant year: (i) upon request and without charge by calling 1-866-667-9231; and (ii) on the Commission’s website at www.sec.gov.
Market Review
The six-month period ended April 30, 2020, was extremely challenging for global financial markets, as the onset of coronavirus (COVID-19) disrupted economic activities. Investors feared that the subsequent economic impact would result in a recession deeper than the global financial crisis (GFC) of 2008-2009. Global equity and fixed-income markets performed well in the first half of the reporting period as trade tensions between the U.S. and China eased and prospects of a partial deal between the world’s two largest economies improved. This changed in late February 2020, however, as the spread of the COVID-19 pandemic from China to other parts of the world rattled global markets. This was further compounded by a plunge in oil prices after Saudi Arabia and Russia failed to reach an agreement on production cuts amid a drop in demand. The monetary policy tightening by many central banks globally in the fourth quarter of 2019, gave way to policy easing as governments worldwide rolled out emergency fiscal stimulus, and central banks lowered interest rates.
By the end of the reporting period, some positive signs emerged as COVID-19 infection rates tapered globally. The phased-in reopening of the Chinese economy, along with the easing of social-distancing measures in some U.S. states and European countries, lifted investors’ risk appetite. Global equity prices moved higher in April 2020, while bond yields and currencies stabilized as liquidity issues abated. However, oil prices continued to decline. The drop in demand negated the largest coordinated output cut in history by the Organization of Petroleum Exporting Countries (OPEC) and its key partners. The price of West Texas Intermediate (WTI) Crude oil futures briefly turned negative on April 20, 2020, due to the lack of storage capacity.
Global equity prices finished the six-month reporting period in negative territory, with the Morgan Stanley Capital International (MSCI) World Index,1 a global equity market benchmark, returning –7.68%. U.S. large-cap company shares, as represented by the broader-market S&P 500 Index,2 were the strongest performers among developed markets for the period, returning –3.2%, while the Asia-Pacific region, as measured by the MSCI AC Asia-Pacific ex-Japan Index,3 returned –7.5% for the period. Japanese and European equities underperformed the overall global stock market, with the Tokyo Stock Price Index (TOPIX)4 and the MSCI Europe Index5 posting returns of –10.2% and –15.5%, respectively, for the reporting period.
In the U.S., the Federal Reserve (Fed) responded to the market carnage by implementing two separate emergency rate cuts totaling 50 and 100 basis points (bps), respectively, in March 2020, lowering the federal funds target rate to a range of 0% to 0.25%. In a statement issued following its monetary policy meeting on April 28-29, the Fed noted that it is “committed to using its full range of tools to support the U.S. economy in this challenging time, thereby promoting its maximum employment and price stability goals.” The pandemic significantly hampered the U.S. economy in the first quarter of 2020. U.S. gross domestic product (GDP) decreased at an annualized rate of 5.0% in the first three months of the year, down sharply from the 2.1% increase in the fourth quarter of 2019.6
The Asia-Pacific region held up relatively well amid the pandemic in the first four months of 2020. Investors’ fears of a global recession grew as widespread lockdowns to curb the spread of the virus crippled
economic activity worldwide. Volatile oil prices attributable to the pandemic-induced drop in demand and worries about excess output further dampened investor sentiment. Central banks and governments in the Asia-Pacific region cut their respective benchmark interest rates, and implemented fiscal stimulus. These actions, along with slowing infection rates and easing lockdown restrictions near the end of the reporting period, enabled the Asia Pacific market to recoup some losses in April.
Emerging-market equities, as represented by the MSCI Emerging Markets Index,7 underperformed their developed-market counterparts, returning –10.5% for the reporting period. The asset class was affected disproportionately by the slump in the oil price globally. In the first half of the reporting period, geopolitical tensions in the Middle East caused the Brent Crude oil price to rise. However, with energy demand already weakening amid the COVID-19 pandemic fallout, a pact between oil-producing nations to limit supply collapsed. This subsequent plunge in crude prices further battered investor sentiment for emerging-market stocks.
International real estate stocks, as measured by the Financial Times Stock Exchange European Public Real Estate Association/National Association of Real Estate Investment Trusts (FTSE EPRA/NAREIT) Global ex U.S. Index,8 returned –20.8% for the reporting period, significantly underperforming the –13.2% return of the broader international equity market, as represented by the MSCI AC World ex-USA Index.9 Emerging markets were the weakest performers amid currency pressures and concern about the willingness of populist governments in countries such as Mexico and Brazil to respond decisively to the pandemic. Relative ‘safe-haven’ countries, including Switzerland, Germany and Belgium, were the strongest performers for the reporting period. Those sectors that were disproportionately hampered by the COVID-19-induced lockdowns, such as retail and hospitality, notably lagged the overall international real estate equity market for the period, while shares of logistics, residential and communications infrastructure companies performed relatively well.
Fixed-income securities were not immune to the volatility in the global financial markets during the reporting period, and there was divergent performance across geographical regions. The U.S. market was the strongest performer globally, with the Bloomberg Barclays U.S. Aggregate Index10 returning 4.9% over the period. The U.S. market benefited from the “risk-off” environment in the second half of the reporting period, as investors sought what they perceived to be ‘safe-haven’ assets. This factor, combined with the Fed’s aggressive monetary policy easing, led to a steep decline in yields across the U.S. Treasury curve. Yields on two- three-, five- and ten-year Treasury notes fell 132, 128, 115 and 105 bps to 0.20%, 0.24%, 0.36% and 0.64%, respectively, over the six-month reporting period, with the ten- to two-year spread widening by 27 bps to +44 bps. Conversely, emerging-market debt, as measured by the J.P. Morgan EMBI Global Diversified Index,11 returned –10.1% over the reporting period, and was the primary market laggard. As market volatility increased and oil prices plummeted, investors’ fears rose regarding the ability of certain economies within the emerging-market asset class to service debt obligations, most notably Argentina and Lebanon.
Market Review (concluded)
Outlook
The downturn in the global financial markets in the first quarter of 2020 was historic. Within the span of a few weeks, the dramatic spread of the COVID-19 pandemic across developed markets resulted in increasing containment measures, leading to a significant repricing of all asset classes. Certain macroeconomic indicators recently have implied that economic activity has returned, especially in China and parts of Asia that were the first to be hit by the virus. However, we refrain from concluding that things are “back to normal.”
In our view, the pandemic and associated shutdowns of economic activity have created an enormous negative growth shock that may cause deep recessions worldwide. However, with new infections declining in many regions, the attention of governments globally is turning to exit strategies and the nature of the economic recovery. We believe that the exits from lockdowns will be gradual, but even a tentative reopening of some economies should spur a strong rebound in growth.
COVID-19
The respiratory illness COVID-19 caused by a novel coronavirus has resulted in a global pandemic and major disruption to economies and markets around the world, including the United States. Financial markets have experienced extreme volatility and severe losses, and trading in many instruments has been disrupted. Liquidity for many instruments has been greatly reduced for periods of time. Some interest rates are very low and in some cases yields are negative. Some sectors of the economy and individual issuers have experienced particularly large losses. These circumstances may continue for an extended period of time, and may continue to affect adversely the value and liquidity of the fund’s investments. The ultimate economic fallout from the pandemic, and the long-term impact on economies, markets, industries and individual issuers, including the Funds, are not
known. Governments and central banks, including the Federal Reserve in the U.S., have taken extraordinary and unprecedented actions to support local and global economies and the financial markets. The impact of these measures, and whether they will be effective to mitigate the economic and market disruption, will not be known for some time.
Aberdeen Standard Investments
___________________________________
1 | The MSCI World Index tracks the performance of large- and mid-cap stocks across 23 developed-market countries. |
2 | The S&P 500 Index is an unmanaged index considered representative of the U.S. stock market. |
3 | The MSCI AC Asia Pacific ex Japan Index tracks the performance of large and mid-cap stocks across two of three developed-market countries (excluding Japan) and nine emerging markets countries in Asia. |
4 | The Tokyo Stock Price Index (TOPIX) is a market capitalization-weighted index of large- and mid-sized companies listed on the Tokyo Stock Exchange. |
5 | The MSCI Europe Index tracks the performance of large- and mid-cap stocks across 15 developed-market countries in Europe. |
6 | Source: U.S. Department of Commerce, May 2020 |
7 | The MSCI Emerging Markets Index tracks the performance of large and mid-cap stocks across 24 emerging-market countries. |
8 | The FTSE EPRA/NAREIT Global ex U.S. Index is an unmanaged index considered representative of real estate companies and real estate investment trusts (REITs) outside the U.S. |
9 | The MSCI AC World ex-USA Index tracks the performance of large- and mid-cap stocks across 22 developed-market countries outside of the U.S., as well as 26 emerging-market countries. |
10 | The Bloomberg Barclays U.S. Aggregate Index is a broad-based flagship benchmark that measures the investment-grade, U.S. dollar-denominated, fixed-rate taxable bond market. |
11 | The J .P. Morgan EMBI Global Diversified Index is a comprehensive global local emerging markets index comprising liquid, fixed-rate, domestic currency government bonds. |
Indexes are unmanaged and have been provided for comparison purposes only. No fees or expenses are reflected. You cannot invest directly in an index.
Aberdeen Select International Equity Fund (Unaudited)
The Aberdeen Select International Equity Fund (Institutional Class shares net of fees) returned –15.13% for the six-month period ending April 30, 20120 versus –13.22% for its benchmark, the MSCI All Country (AC) World ex USA Index (Net Dividends), during the same period.
International equities declined over the six-month period ended April 30, 2020. Stock prices advanced in the first half of the period as tensions between U.S. and China eased and prospects of a partial deal between the world’s two largest economies improved. At the beginning of 2020, the U.S. broader-market S&P 500 Index1 touched a record high in the wake of the U.S.-China trade truce and generally positive economic data. In late February, however, the spread of COVID-19 pandemic from China rattled global stock markets. In response, the U.S. government unveiled a US$2 trillion stimulus program and the U.S. Federal Reserve implemented emergency interest-rate cuts, which provided some respite for investors. Many other global central banks followed suit. On the corporate front, many companies withdrew earlier forecasts as countries closed their borders and imposed lockdowns. An oil-price plunge further battered investor sentiment after a Saudi Arabia-Russian pact to limit supply collapsed amid slowing demand due to the pandemic. Global equity markets rebounded towards the end of the period in April, aided by unprecedented monetary and fiscal stimulus globally, and a slowdown in the rate of new COVID-19 infections in many countries.
The Fund underperformed its benchmark, the MSCI AC World ex USA Index (Net Dividends), for the reporting period.
At the stock level, holdings in UK-based cinema operator Cineworld Group PLC and European aircraft manufacturer Airbus SE detracted from Fund performance as a result of the pandemic. Cineworld was forced to close its cinemas amid lockdowns in the UK and U.S., where the company does business. Uncertainty surrounding the duration of lockdowns and how social distancing measures will be applied to cinemas in the future fueled investors’ concerns around Cineworld’s liquidity. Airbus, a position that we initiated during the period, was hampered by travel restrictions and border closures. We continue to look beyond the short-term challenges to the company’s long-term goal of becoming more efficient. In Australia, the Fund’s holding in Treasury Wine Estates (TWE) also had a negative impact on performance as the wine-maker experienced key management departures and competition in North America. Bush fires in Australia also posed a risk to the company’s vineyards and harvests. Though these near-term uncertainties weighed on the stock price, we maintain our belief in TWE’s future growth, especially as it gains premium market share in China.
Conversely, the Fund’s position in Denmark-based drug-maker Novo Nordisk A/S was a key contributor to performance for the reporting period as investors perceived its business model and earnings to be relatively insulated against disruptions from the COVID-19 pandemic.
Novo Nordisk’s sales appeared to be more resilient than those of many of its peers, given the company’s relatively higher reliance on home-administered drugs. The firm controls almost one-third of the global market in diabetes treatment products, and half of the insulin market. Over the long term, we believe that an increasingly overweight and aging population in developed markets should continue to drive demand for these products. The Fund’s holding in Genus PLC enhanced Fund performance as the UK-based animal genetics company benefited from signs of rising global pork and dairy prices, which would increase demand for its products that assist in breeding higher-quality livestock. Finally, shares of the Fund’s position in Japanese drugstore chain operator Welcia advanced as the company continued to post solid same-store sales over the reporting period.
During the reporting period, we sought to take advantage of share-price volatility to add new stocks to the Fund. We established a new positon in Anglo-Swedish drug-maker AstraZeneca PLC, as we believe that its upcoming product launches and pipeline news could help boost profits. We also initiated a holding Airbus (as previously noted), which we believe has a stronger product portfolio than its U.S.-based competitor, Boeing Co. We are aware that COVID-19 has negative implications for air traffic, but we believe that future gains in market share could allow Airbus to become efficient and, therefore, more profitable and likely to generate more cash. In addition, we purchased shares of Alstom S.A. We believe that the French rail transportation firm should see sustained order momentum as its products benefit from decarbonization trends and increased government spending to support the economy. We added to the Fund’s existing position in German utility RWE AG. The company generates wind, solar and biomass-derived power and, in our view, should deliver better growth and returns as capital is allocated towards clean energy and away from fossil fuels. We believe that the shares will perform better when RWE demonstrates that it can build and monetize assets, recycling the funds into future ventures.
In contrast, we exited the Fund’s positions in several companies over the reporting period. Japanese drug-maker Shionogi & Co. Ltd.’s share price continued to discount future potential from specific products that may take longer to materialize. Furthermore, the company’s management recently revised downwards its forecasts for other areas of its portfolio. Canada-based diversified entertainment company Entertainment One Ltd. reached an agreement to be purchased by U.S.-based toymaker Hasbro Inc. (which the Fund does not hold). We also sold the Fund’s shares in Japanese baby care and mother care products maker Pigeon Corp. as we believe that investors’ expectations for its growth were higher than it would be capable of delivering. Finally, we exited the Fund’s holding in Norway-based telecommunications company Telenor ASA due to regulatory changes in its domestic market and increasing competition that we had not anticipated.
1 The S&P 500 Index is an unmanaged index considered representative of the broader U.S. stock market. Indexes are unmanaged and have been provided for comparison purposes only. No fees or expenses are reflected. You cannot invest directly in an index.
| 2020 Semi-Annual Report |
Aberdeen Select International Equity Fund (Unaudited) (concluded)
Effective February 28, 2020, the Fund’s Board of Trustees approved a change in the Fund’s primary benchmark from the MSCI AC World ex USA Index (Gross Dividends) to the MSCI AC World ex USA Index (Net Dividends). The change from a gross to a net dividend benchmark is in line with industry practice and is more appropriate for the Fund, as it is also calculated net of withholding taxes, to which the Fund is generally subject. The change in benchmark does not affect the investment objective of the Fund, nor the way in which the portfolio is managed.
In light of the recent bouts of volatility driven by pandemic fears, we have reassessed the Fund’s underlying holdings to consider the potential impact of the COVID-19 pandemic. We are talking to management teams and updating our strategy as the situation unfolds. Most of the companies have experienced, or are expecting, an adverse impact on earnings and cash flows. Nevertheless, we take a long-term view. We believe that, in most cases, these are high-quality companies whose economic moats2 and structural drivers remain intact. In our view, they are also broadly supported by reasonable margins and solid balance sheets, with capable management teams at the helm. Furthermore, we believe that global equity valuations are generally at compelling levels, presenting opportunities to add to our preferred Fund holdings or initiate new positions. We believe that our diversification3 strategy has kept the Fund’s performance resilient thus far. Fund holdings whose businesses performed relatively well during the reporting period counterbalanced others in sectors in which the pandemic has had a more negative impact.
Certain macro indicators recently have implied that economic activity has returned, especially in China and parts of Asia that were the first to be hit by the virus. However, we refrain from concluding that things are back to normal. Some businesses will be disrupted for a long period, while others stand to benefit post-COVID-19. In such fluid times, we believe that good bottom-up analysis and stock selection are even more crucial. In our view, we have the advantage of an effective proprietary research platform, and a well-resourced and experienced Fund management team that has navigated many past crises. We remain disciplined in putting capital to work to ensure the Fund’s largest weights are in those high-quality companies that in our view have the highest potential returns. We believe that this will continue to benefit the Fund’s performance.
Portfolio Management:
Global Equity Team
PAST PERFORMANCE DOES NOT GUARANTEE FUTURE RESULTS.
The performance quoted represents past performance, which does not guarantee future results. Class A Shares pay a Rule 12b-1 fee of up to 0.25% of net assets. The investment return and principal value of an investment will fluctuate so that an investor’s shares, when redeemed, may be worth more or less than their original cost. Current performance of the Fund may be lower or higher than the performance quoted. Performance data current to the most recent month-end may be obtained by calling 866-667-9231 or visiting www.aberdeenstandard.com/en-us/us/investor/fund-centre.
Investing in mutual funds involves risk, including the possible loss of principal. There is no assurance that the investment objective of any fund will be achieved. Indexes are unmanaged and have been provided for comparison purposes only. No fees or expenses are reflected. You cannot invest directly in an index.
Risk Considerations
Foreign securities may be more volatile, harder to price and less liquid than U.S. securities. They are subject to different accounting and regulatory standards and currency exchange rate, political and economic risks. Fluctuation in currency exchange rates may impact a Fund’s returns more greatly to the extent a Fund does not hedge currency exposure or hedging techniques are unsuccessful. The foregoing risks are enhanced in emerging market countries.
Equity stocks of small and mid-cap companies carry greater risk and more volatility than equity stocks of larger, more established companies.
Stocks issued by large cap companies subject the Fund to the risk that those stocks may underperform stocks issued by companies with smaller capitalizations or the market as a whole.
Investing a significant portion of the Fund’s assets in securities of companies conducting business in a broadly related group of industries within an economic sector may make the Fund more vulnerable to unfavorable developments in that sector.
Please read the prospectus for more detailed information regarding these and other risks.
2 A moat is a competitive advantage that one company has over other companies in the same industry.
3 Diversification does not ensure a profit or protect against a loss in a declining market
2020 Semi-Annual Report |
|
Aberdeen Select International Equity Fund (Unaudited)
Average Annual Total Return | Six Month† | 1 Yr. | 5 Yr. | 10 Yr. |
Class A | (15.21%) | (13.90%) | (1.10%) | 0.10% |
Institutional Class | (15.13%) | (13.70%) | (0.85%) | 0.35% |
* Performance shown for periods after December 16, 2016 reflect the Fund’s receipt of payment from some European jurisdictions related to prior years (2005-2008) in accordance with European Union law under Article 63 of the Treaty on the Functioning of the European Union (the “Article 63 EU Tax Reclaims”). The receipt of these extraordinary payments increased the Fund’s performance for all periods that include December 2016, February 2017, July 2017, October 2017, February 2019 March 2019 and September 2019 in a manner that may not recur in the future, and the Fund’s performance was significantly higher than it would have been absent receipt of the Article 63 EU Tax Reclaims. For Class A, the average annual total return excluding the receipt of Article 63 EU Tax Reclaims was (18.11%), (18.78%), (3.93%) and (1.34%), respectively, for the six-month, 1-year, 5-year, and 10-year periods ended April 30, 2020. For Institutional Class, the average annual total return excluding the receipt of Article 63 EU Tax Reclaims was (18.00%), (18.59%), (3.73%) and (1.12%), respectively, for the six-month, 1-year, 5-year, and 10-year periods ended April 30, 2020.There can be no assurance that the Fund will receive additional Article 63 EU Tax Reclaim payments or maintain this level of performance in the future. Please see Note 2(g) and the Fund’s prospectus dated February 28, 2020 for further information.
Performance of a $10,000 Investment (as of April 30, 2020)
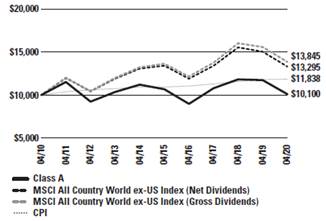
Comparative performance of $10,000 invested in Class A shares of the Aberdeen Select International Equity Fund, Morgan Stanley Capital International (MSCI) All Country World ex-USA Index (ACWI ex-USA) (net dividends) MSCI ACWI ex-USA (gross dividends)
and the Consumer Price Index (CPI) over a 10-year period ended April 30, 2020. Effective February 28, 2020, the MSCI All Country World ex-USA Index (net dividends) replaced the MSCI All Country World ex-USA Index (gross dividends) as the Fund’s primary benchmark. The Adviser believes that the change from a gross to a net dividend benchmark is in line with industry practice and is more appropriate for the Fund, as it is calculated net of withholding taxes to which the Fund is generally subject. Unlike the Fund’s returns, the returns for these unmanaged indexes do not reflect any fees or expenses. Investors cannot invest directly in market indexes.
The MSCI ACWI ex-USA Index (net dividends) and the MSCI ACWI ex-USA (gross dividends) capture large and mid-cap representation across 22 of 23 Developed Markets (DM) countries (excluding the United States (U.S.) and 24 Emerging Markets (EM) countries). With 2,163 constituents, the index covers approximately 85% of the global equity opportunity set outside the U.S.
The CPI is a measure of the average change over time in the prices paid by urban consumers for a market basket of consumer goods and services.
Investment return and principal value will fluctuate, and when redeemed, shares may be worth more or less than original cost. Past performance is no guarantee of future results. The Average Annual Total Return table and performance graph do not reflect the deduction of taxes that a shareholder would pay on Fund distributions or the redemption of Fund shares. Investing in mutual funds involves market risk, including loss of principal. Performance returns assume the reinvestment of all distributions. Performance returns reflect fee waivers and reimbursements in effect without which returns would have been lower.
| 2020 Semi-Annual Report |
Aberdeen Select International Equity Fund (Unaudited)
Portfolio Summary (as a percentage of net assets)
April 30, 2020 (Unaudited)
Asset Allocation |
|
|
Common Stocks |
| 107.6% |
Preferred Stocks |
| 0.8% |
Short-Term Investment |
| 0.3% |
Liabilities in Excess of Other Assets |
| (8.7%) |
|
| 100.0% |
The following table summarizes the composition of the Fund’s portfolio, in S&P Global Industry Classification Standard (GICS) sectors, expressed as a percentage of net assets. The GICS structure consists of 11 sectors, 24 industry groups, 69 industries and 158 sub-industries. As of April 30, 2020, the Fund did not have more than 25% of its assets invested in any single industry or industry group. The sectors as classified by GICS, are comprised of several industries.
Top Sectors |
|
Industrials | 20.3% |
Consumer Staples | 16.2% |
Consumer Discretionary | 14.8% |
Health Care | 13.6% |
Financials | 13.1% |
Communication Services | 7.7% |
Utilities | 7.6% |
Materials | 4.1% |
Energy | 4.0% |
Real Estate | 3.8% |
Other | (5.2%) |
| 100.0% |
Top Holdings* |
|
Alibaba Group Holding Ltd., ADR | 4.4% |
Novo Nordisk AS, Class B | 4.2% |
Nestle SA | 4.1% |
Koninklijke DSM NV | 4.1% |
Vonovia SE | 3.8% |
Enel SpA | 3.8% |
RWE AG | 3.8% |
Genus PLC | 3.6% |
BAE Systems PLC | 3.3% |
AIA Group Ltd. | 3.1% |
Other | 61.8% |
| 100.0% |
* For the purpose of listing top holdings, Short-Term Investments are included as part of Other.
Top Countries |
|
United Kingdom | 14.7% |
France | 14.7% |
China | 13.9% |
Japan | 8.0% |
Germany | 7.6% |
Switzerland | 6.9% |
Netherlands | 6.1% |
Italy | 6.0% |
Canada | 4.6% |
Denmark | 4.2% |
Other | 13.3% |
| 100.0% |
Statement of Investments
April 30, 2020 (Unaudited)
Aberdeen Select International Equity Fund
|
|
|
|
|
| |
|
| Shares |
| Value |
| |
COMMON STOCKS (107.6%) |
|
|
|
|
| |
AUSTRALIA (3.1%) |
|
|
|
|
| |
Consumer Staples (2.2%) |
|
|
|
|
| |
Treasury Wine Estates Ltd. |
| 357,852 |
| $ | 2,353,721 |
|
Health Care (0.9%) |
|
|
|
|
| |
Cochlear Ltd. |
| 8,699 |
| 1,034,289 |
| |
|
|
|
| 3,388,010 |
| |
CANADA (4.6%) |
|
|
|
|
| |
Consumer Discretionary (2.1%) |
|
|
|
|
| |
Restaurant Brands International, Inc. |
| 46,340 |
| 2,260,488 |
| |
Consumer Staples (2.5%) |
|
|
|
|
| |
Alimentation Couche-Tard, Inc., Class B |
| 96,800 |
| 2,701,040 |
| |
|
|
|
| 4,961,528 |
| |
CHINA (13.9%) |
|
|
|
|
| |
Communication Services (2.8%) |
|
|
|
|
| |
Tencent Holdings Ltd. |
| 58,200 |
| 3,059,541 |
| |
Consumer Discretionary (8.4%) |
|
|
|
|
| |
Alibaba Group Holding Ltd., ADR (a) |
| 23,784 |
| 4,820,303 |
| |
Li Ning Co. Ltd. |
| 446,000 |
| 1,408,233 |
| |
Shenzhou International Group Holdings Ltd. |
| 251,600 |
| 2,903,875 |
| |
|
|
|
| 9,132,411 |
| |
Financials (2.7%) |
|
|
|
|
| |
Ping An Insurance Group Co. of China Ltd., H Shares |
| 295,000 |
| 3,001,996 |
| |
|
|
|
| 15,193,948 |
| |
DENMARK (4.2%) |
|
|
|
|
| |
Health Care (4.2%) |
|
|
|
|
| |
Novo Nordisk AS, Class B |
| 71,972 |
| 4,591,096 |
| |
FRANCE (14.7%) |
|
|
|
|
| |
Communication Services (4.2%) |
|
|
|
|
| |
Ubisoft Entertainment SA (a) |
| 32,055 |
| 2,384,309 |
| |
Vivendi SA |
| 100,534 |
| 2,172,856 |
| |
|
|
|
| 4,557,165 |
| |
Energy (2.4%) |
|
|
|
|
| |
TOTAL SA |
| 74,002 |
| 2,626,506 |
| |
Financials (1.7%) |
|
|
|
|
| |
AXA SA |
| 106,065 |
| 1,885,464 |
| |
Industrials (6.4%) |
|
|
|
|
| |
Airbus SE (a) |
| 24,500 |
| 1,551,303 |
| |
Alstom SA |
| 55,500 |
| 2,276,553 |
| |
Vinci SA |
| 38,400 |
| 3,145,802 |
| |
|
|
|
| 6,973,658 |
| |
|
|
|
| 16,042,793 |
| |
GERMANY (7.6%) |
|
|
|
|
| |
Real Estate (3.8%) |
|
|
|
|
| |
Vonovia SE |
| 84,400 |
| 4,173,482 |
| |
|
|
|
|
|
| |
|
| Shares |
| Value |
| |
Utilities (3.8%) |
|
|
|
|
| |
RWE AG |
| 144,300 |
| $ | 4,151,177 |
|
|
|
|
| 8,324,659 |
| |
HONG KONG (3.1%) |
|
|
|
|
| |
Financials (3.1%) |
|
|
|
|
| |
AIA Group Ltd. |
| 362,200 |
| 3,324,187 |
| |
ISRAEL (3.0%) |
|
|
|
|
| |
Information Technology (3.0%) |
|
|
|
|
| |
NICE Ltd. (a) |
| 19,837 |
| 3,257,819 |
| |
ITALY (6.0%) |
|
|
|
|
| |
Industrials (2.2%) |
|
|
|
|
| |
Prysmian SpA |
| 127,337 |
| 2,402,593 |
| |
Utilities (3.8%) |
|
|
|
|
| |
Enel SpA |
| 608,500 |
| 4,156,325 |
| |
|
|
|
| 6,558,918 |
| |
JAPAN (8.0%) |
|
|
|
|
| |
Consumer Discretionary (2.7%) |
|
|
|
|
| |
Sony Corp. |
| 45,500 |
| 2,928,110 |
| |
Consumer Staples (2.1%) |
|
|
|
|
| |
Welcia Holdings Co. Ltd. |
| 30,500 |
| 2,214,250 |
| |
Health Care (2.0%) |
|
|
|
|
| |
Asahi Intecc Co. Ltd. |
| 82,800 |
| 2,193,475 |
| |
Industrials (1.2%) |
|
|
|
|
| |
Nihon M&A Center, Inc. |
| 41,000 |
| 1,337,518 |
| |
|
|
|
| 8,673,353 |
| |
LATVIA (0.0%) |
|
|
|
|
| |
Financials (0.0%) |
|
|
|
|
| |
AS Parex Banka (a)(b)(c)(d) |
| 1,424,182 |
| – |
| |
MACAU (1.6%) |
|
|
|
|
| |
Consumer Discretionary (1.6%) |
|
|
|
|
| |
Sands China Ltd. |
| 434,000 |
| 1,757,047 |
| |
NETHERLANDS (6.1%) |
|
|
|
|
| |
Financials (2.0%) |
|
|
|
|
| |
ASR Nederland NV |
| 81,176 |
| 2,183,887 |
| |
Materials (4.1%) |
|
|
|
|
| |
Koninklijke DSM NV |
| 36,596 |
| 4,485,273 |
| |
|
|
|
| 6,669,160 |
| |
NORWAY (3.0%) |
|
|
|
|
| |
Consumer Staples (3.0%) |
|
|
|
|
| |
Mowi ASA |
| 188,845 |
| 3,234,349 |
| |
POLAND (2.5%) |
|
|
|
|
| |
Consumer Staples (2.5%) |
|
|
|
|
| |
Dino Polska SA (a)(e) |
| 63,337 |
| 2,678,508 |
| |
Statement of Investments (concluded)
April 30, 2020 (Unaudited)
Aberdeen Select International Equity Fund
|
|
|
|
|
| |
|
| Shares |
| Value |
| |
COMMON STOCKS (continued) |
|
|
|
|
| |
REPUBLIC OF IRELAND (1.3%) |
|
|
|
|
| |
Industrials (1.3%) |
|
|
|
|
| |
Ryanair Holdings PLC, ADR (a) |
| 21,500 |
| $ | 1,364,605 |
|
SWEDEN (3.3%) |
|
|
|
|
| |
Industrials (3.3%) |
|
|
|
|
| |
Assa Abloy AB, Class B |
| 105,047 |
| 1,880,544 |
| |
Sandvik AB (a) |
| 114,300 |
| 1,758,324 |
| |
|
|
|
| 3,638,868 |
| |
SWITZERLAND (6.9%) |
|
|
|
|
| |
Consumer Staples (4.1%) |
|
|
|
|
| |
Nestle SA |
| 42,710 |
| 4,523,417 |
| |
Financials (2.8%) |
|
|
|
|
| |
Zurich Insurance Group AG |
| 9,571 |
| 3,034,527 |
| |
|
|
|
| 7,557,944 |
| |
UNITED KINGDOM (14.7%) |
|
|
|
|
| |
Communication Services (0.7%) |
|
|
|
|
| |
Cineworld Group PLC |
| 979,287 |
| 807,362 |
| |
Energy (1.6%) |
|
|
|
|
| |
BP PLC |
| 448,300 |
| 1,766,487 |
| |
Health Care (6.5%) |
|
|
|
|
| |
AstraZeneca PLC |
| 30,600 |
| 3,200,515 |
| |
Genus PLC |
| 91,005 |
| 3,909,781 |
| |
|
|
|
| 7,110,296 |
| |
Industrials (5.9%) |
|
|
|
|
| |
BAE Systems PLC |
| 555,461 |
| 3,542,970 |
| |
RELX PLC |
| 124,676 |
| 2,837,147 |
| |
|
|
|
| 6,380,117 |
| |
|
|
|
| 16,064,262 |
| |
Total Common Stocks |
|
|
| 117,281,054 |
| |
|
|
|
|
|
| |
|
| Shares |
| Value |
| |
PREFERRED STOCKS (0.8%) |
|
|
|
|
| |
BRAZIL (0.8%) |
|
|
|
|
| |
Financials (0.8%) |
|
|
|
|
| |
Banco Bradesco SA, Preferred Shares |
| 264,000 |
| $ | 929,697 |
|
Total Preferred Stocks |
|
|
| 929,697 |
| |
SHORT-TERM INVESTMENT (0.3%) |
|
|
|
|
| |
UNITED STATES (0.3%) |
|
|
|
|
| |
State Street Institutional U.S. Government Money Market Fund, Premier Class, 0.22% (f) |
| 300,297 |
| 300,297 |
| |
Total Investments |
|
|
| 118,511,048 |
| |
Liabilities in Excess of Other Assets—(8.7)% |
|
|
| (9,482,365 | ) | |
Net Assets—100.0% |
|
|
| $ | 109,028,683 |
|
(a) Non-income producing security.
(b) The Fund’s adviser has deemed this security to be illiquid based upon procedures approved by the Board of Trustees. Illiquid securities held by the Fund represent 0.00% of net assets as of April 30, 2020.
(c) Level 3 security. See Note 2(a) of the accompanying Notes to Financial Statements.
(d) Illiquid security.
(e) Denotes a security issued under Regulation S or Rule 144A.
(f) Registered investment company advised by State Street Global Advisors. The rate shown is the 7 day yield as of April 30, 2020.
(g) See accompanying Notes to Financial Statements for tax unrealized appreciation/(depreciation) of securities.
ADR American Depositary Receipt
PLC Public Limited Company
Aberdeen Global Equity Impact Fund (Unaudited)
The Aberdeen Global Equity Impact Fund (Institutional Class shares net of fees) returned –3.12% for the six-month period ending April 30, 2019, versus –7.68% for its benchmark, the MSCI All Country (AC) World Index (Net Dividends), during the same period.
Global equities declined over the six-month period ended April 30, 2020. Stock prices advanced in the first half of the period as tensions between U.S. and China eased and prospects of a partial deal between the world’s two largest economies improved. At the beginning of 2020, the U.S. broader-market S&P 500 Index1 touched a record high in the wake of the U.S.-China trade truce and generally positive economic data. In late February, however, the spread of the coronavirus (COVID-19) pandemic from China rattled global stock markets. In response, the U.S. government unveiled a US$2 trillion stimulus program and the U.S. Federal Reserve implemented emergency interest-rate cuts, which provided some respite for investors. Many other global central banks followed suit. On the corporate front, many companies withdrew earlier forecasts as countries closed their borders and imposed lockdowns. An oil-price plunge further battered investor sentiment after a Saudi Arabia-Russian pact to limit supply collapsed amid slowing demand due to the pandemic. Global equity markets rebounded towards the end of the period in April, aided by unprecedented monetary and fiscal stimulus globally, and a slowdown in the rate of new COVID-19 infections in many countries.
The Fund’s relative outperformance versus its benchmark, the MSCI AC World Index (Net Dividends), for the reporting period was due mainly to positive stock selection in the U.S. and UK, as well as an overweight allocation to Denmark.
At the stock level, U.S. real estate investment trust (REIT) Equinix Inc. was a key contributor to Fund performance as the company provides data warehouses that benefited from the COVID-19 outbreak and increased demand for cloud computing. Equinix delivered positive results for the first quarter of its 2020 fiscal year, and issued a forecast indicating that the higher pandemic-driven demand will likely be sustained even after the crisis subsides. Equinix remains committed to powering its data centers with renewable energy, which we believe will gain in importance as global demand for data centers increases. U.S. managed care firm UnitedHealth Group Inc. was buoyed by expectations that there would be no significant change to the U.S.’s current healthcare policy. Shares of the Fund’s holding in South Korean battery maker Samsung SDI Co, Ltd. rose in tandem with forecasts of high sales growth for electric vehicles.
Conversely, the Fund’s position in Banco Bradesco detracted from performance during the reporting period as the Brazilian lender’s stock price moved lower due to slowing economic growth and investors’ fears of asset-quality deterioration. The company’s management has made provisions for bad debt arising from the pandemic. While investors appeared to view this negatively, we believe that the loan-loss provisions will leave Banco Bradesco in a better position to
emerge from the crisis, and allows the bank to focus on deepening the penetration of basic financial services to underserved customers. Similarly, shares of Bank Rakyat Indonesia Tbk PT were hampered by investors’ concerns over an economic slowdown that is likely to hit its customers, which comprise mainly small companies and consumers. We believe that the stock’s valuation is now attractive when balanced against a longer-term perspective, and that the bank might benefit from pandemic-related economic stimulus. The lack of exposure to internet retailing giant Amazon.com Inc., and technology giants Microsoft Corp. and Apple Inc., also weighed modestly on performance for the reporting period. The Fund does not hold these stocks because their business models do not meet our criteria.
During the reporting period, we sought to take advantage of market volatility to initiate holdings in six companies. In our view, French rail transportation firm Alstom S.A.’s organic growth should accelerate as its green mobility solutions benefit from decarbonization trends. We established a new position in Goodman Group Ltd., as we believe that the Australian property firm will see strong underlying growth in net asset value and cash flow, given its growing fund management business. In our opinion, the firm demonstrates good environmental commitments, and 75% of its portfolio is certified “green,” with new developments built to be fully sustainable. Israeli garment printing solutions provider Kornit Digital Ltd. serves the textile industry. The company’s stock price came under short term pressure due to coronavirus-related concerns about consumer demand. The printing technology by the U.S. exchange–listed firm reduces water and chemical use, and is being rapidly adopted by large textile manufacturers. Kornit Digital’s services have the potential to significantly improve water use and efficiency in an industry with a poor track record, aligning with our water and sanitation investment pillar. We initiated a holding in AstraZeneca PLC as we believe that investors have not fully appreciated the Anglo-Swedish drug-maker’s multiple product launches and positive product pipeline news. The company’s focus on key priority health conditions that are highlighted by the World Health Organization and United Nations, as well as robust pricing policy and access-to-medicine initiatives, fit well within our health and Social Care investment pillars. Tetra Tech Inc. is the leading water services firm in the U.S. and offers resource management services to a broad range of industries, directly benefiting water-stressed regions, including Florida, Texas and California. The focus on water efficiency and reduction of wastage aligns with our water and sanitation investment pillar. Tetra Tech has been successful in moving towards higher-end services and focusing on higher-growth opportunities. Finally, we established a new position in Ireland-based building materials supplier Kingspan Group PLC, as we believe that demand for better thermal efficiency in the construction sector will support an attractive growth outlook. This is well aligned with our sustainable real estate and infrastructure investment pillar.
1 The S&P 500 Index is an unmanaged index considered representative of the broader U.S. stock market. Indexes are unmanaged and have been provided for comparison purposes only. No fees or expenses are reflected. You cannot invest directly in an index.
2020 Semi-Annual Report 9
Aberdeen Global Equity Impact Fund (Unaudited) (concluded)
Effective February 28, 2020, the Fund’s Board of Trustees approved a change in the Fund’s primary benchmark from the MSCI AC World Index (Gross Dividends) to the MSCI AC World Index (Net Dividends). The change from a gross to a net dividend benchmark is in line with industry practice and is more appropriate for the Fund, as it is also calculated net of withholding taxes, to which the Fund is generally subject. The change in benchmark does not affect the investment objective of the Fund, nor the way in which the portfolio is managed.
The Fund seeks to deliver positive returns and to invest in companies whose products and services have a positive environmental or social impact, factors that have become even more important in light of the COVID-19 pandemic. We use the United Nation’s Sustainable Development Goals as guiding principles. Specifically, we identify companies which in our view provide products and services that deliver measurable output in making a positive impact, as well as those which we believe have a clear intention to solve a global issue and are spending money to make an impact in the future. In light of the recent bouts of volatility driven by pandemic fears, we have reassessed the Fund’s underlying holdings to consider COVID-19’s potential impact. We are talking to management teams and updating our strategy as the situation unfolds. Most companies have experienced, or are expecting, an adverse impact on earnings and cash flows. Nevertheless, we take a long-term view. In most cases, these are high-quality companies whose economic moats2 and structural drivers remain intact. In our opinion, they are also broadly supported by reasonable margins and solid balance sheets, with capable management at the helm.
Certain macro indicators recently have implied that economic activity has returned, especially in China and parts of Asia that were the first to be hit by the virus. However, we refrain from concluding that things are back to normal. Some businesses will be disrupted for a long period, while others stand to benefit post-COVID-19. In such fluid times, we believe that good bottom-up analysis and stock selection are even more crucial. In our view, we have the advantage of an effective proprietary research platform, and a well-resourced and experienced Fund management team that has navigated many past crises. We remain disciplined in putting capital to work to ensure the Fund’s largest weights are in those high-quality companies that we believe have the highest potential returns. We believe that this will continue to benefit the Fund’s performance.
Portfolio Management:
Global Equity Team
PAST PERFORMANCE DOES NOT GUARANTEE FUTURE RESULTS.
The performance quoted represents past performance, which does not guarantee future results. Class A Shares pay a Rule 12b-1 fee of up to 0.25% of net assets. The investment return and principal value of an investment will fluctuate so that an investor’s shares, when redeemed, may be worth more or less than their original cost. Current performance of the Fund may be lower or higher than the performance quoted. Performance data current to the most recent month-end may be obtained by calling 866-667-9231 or visiting www.aberdeenstandard.com/en-us/us/investor/fund-centre.
Investing in mutual funds involves risk, including the possible loss of principal. There is no assurance that the investment objective of any fund will be achieved. Indexes are unmanaged and have been provided for comparison purposes only. No fees or expenses are reflected. You cannot invest directly in an index.
Risk Considerations
Foreign securities may be more volatile, harder to price and less liquid than U.S. securities. They are subject to different accounting and regulatory standards and currency exchange rate, political and economic risks. Fluctuation in currency exchange rates may impact a Fund’s returns more greatly to the extent a Fund does not hedge currency exposure or hedging techniques are unsuccessful. The foregoing risks are enhanced in emerging market countries.
Equity stocks of small- and mid-cap companies carry greater risk and more volatility than equity stocks of larger, more established companies.
In implementing the Fund’s ESG (Environmental, Social and Governance) impact investment strategy, the Adviser may select or exclude securities of issuers in certain industries, sectors, regions or countries for reasons other than the issuer’s investment performance. For this reason, the Fund may underperform other funds that do not implement an ESG impact strategy.
The definition of “impact investing” will vary according to an investor’s beliefs and values. There is no guarantee that the Adviser’s definition of impact investing, security selection criteria or investment judgment will reflect the beliefs or values of any particular investor.
Please read the prospectus for more detailed information regarding these and other risks.
2 A moat is a competitive advantage that one company has over other companies in the same industry.
10 2020 Semi-Annual Report
Aberdeen Global Equity Impact Fund (Unaudited)
Average Annual Total Return | Six Month† | 1 Yr. | 5 Yr. | 10 Yr. |
|
Class A | (3.22%) | 1.15% | 1.12% | 1.62% |
|
Institutional Class | (3.12%) | 1.42% | 1.38% | 1.87% |
|
* Performance shown for periods after February 1, 2017 reflect the Fund’s receipt of payment from some European jurisdictions related to prior years (2005-2009) in accordance with European Union law under Article 63 of the Treaty on the Functioning of the European Union (the “Article 63 EU Tax Reclaims”). The receipt of these extraordinary payments increased the Fund’s performance for all periods that include February 2017, October 2017, August 2018, February 2019 and September 2019 in a manner that may not recur in the future, and the Fund’s performance was significantly higher than it would have been absent receipt of the Article 63 EU Tax Reclaims. For Class A, the average annual total return excluding the receipt of Article 63 EU Tax Reclaims was (4.09%), (0.91%), (0.25%), and 0.92%, respectively, for the six-month, 1-year, 5-year, and 10-year periods ended April 30, 2020. For Institutional Class, the average annual total return excluding the receipt of Article 63 EU Tax Reclaims was (3.89%), (0.52%), 0.03%, and 1.19%, respectively, for the six-month, 1-year, 5-year, and 10-year periods ended April 30, 2020.There can be no assurance that the Fund will receive additional Article 63 EU Tax Reclaim payments or maintain this level of performance in the future. Please see the Fund’s prospectus dated February, 28, 2020 for further information.
Performance of a $10,000 Investment (as of April 30, 2020)
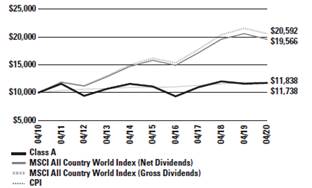
Comparative performance of $10,000 invested in Class A shares of the Aberdeen Global Equity Impact Fund, Morgan Stanley Capital International (MSCI) All Country World Index (ACWI) (net dividends) MSCI ACWI (gross dividends) and the Consumer Price Index (CPI) over
a 10-year period ended April 30, 2020. Effective February 28, 2020, the MSCI All Country World Index (ACWI) (net dividends) replaced the MSCI All Country World Index (ACWI) (gross dividends) as the Fund’s primary benchmark. The Adviser believes that the change from a gross to a net dividend benchmark is in line with industry practice and is more appropriate for the Fund, as it is calculated net of withholding taxes to which the Fund is generally subject. Unlike the Fund’s returns, the returns for these unmanaged indexes do not reflect any fees or expenses. Investors cannot invest directly in market indexes.
The MSCI ACWI is an unmanaged index considered representative of developed and emerging market stock markets.
MSCI ACWI captures large and mid-cap representation across 23 Developed Markets (DM) and 24 Emerging Markets (EM) countries. With 2,774 constituents, the index covers approximately 85% of the global investable equity opportunity set.
The CPI is a measure of the average change over time in the prices paid by urban consumers for a market basket of consumer goods and services.
Investment return and principal value will fluctuate, and when redeemed, shares may be worth more or less than original cost. Past performance is no guarantee of future results. The Average Annual Total Return table and performance graph do not reflect the deduction of taxes that a shareholder would pay on Fund distributions or the redemption of Fund shares. Investing in mutual funds involves market risk, including loss of principal. Performance returns assume the reinvestment of all distributions. Performance returns reflect fee waivers and reimbursements in effect without which returns would have been lower.
2020 Semi-Annual Report 11
Aberdeen Global Equity Impact Fund (Unaudited)
Portfolio Summary (as a percentage of net assets)
April 30, 2020 (Unaudited)
Asset Allocation |
|
|
Common Stocks | 103.9% |
|
Money Market Funds | 0.3% |
|
Liabilities in Excess of Other Assets | (4.2%) |
|
| 100.0% |
|
The following table summarizes the composition of the Fund’s portfolio, in S&P Global Industry Classification Standard (GICS) sectors, expressed as a percentage of net assets. The GICS structure consists of 11 sectors, 24 industry groups, 69 industries and 158 sub-industries. As of April 30, 2020, the Fund did not have more than 25% of its assets invested in any single industry or industry group. The sectors as classified by GICS, are comprised of several industries.
Top Sectors |
|
|
|
Health Care |
| 23.2% |
|
Industrials |
| 22.2% |
|
Information Technology |
| 16.0% |
|
Real Estate |
| 11.0% |
|
Financials |
| 9.0% |
|
Materials |
| 7.5% |
|
Communication Services |
| 6.3% |
|
Utilities |
| 5.3% |
|
Consumer Discretionary |
| 3.4% |
|
Other |
| (3.9%) |
|
|
| 100.0% |
|
Top Holdings |
|
|
|
UnitedHealth Group, Inc. |
| 4.1% |
|
Prologis, Inc., REIT |
| 3.9% |
|
Safaricom PLC |
| 3.7% |
|
Equinix, Inc., REIT |
| 3.6% |
|
Umicore SA |
| 3.6% |
|
John Laing Group PLC |
| 3.2% |
|
Mastercard, Inc., Class A |
| 3.2% |
|
NextEra Energy, Inc. |
| 3.0% |
|
Wuxi Biologics Cayman, Inc. |
| 3.0% |
|
salesforce.com, Inc. |
| 2.9% |
|
Other |
| 65.8% |
|
|
| 100.0% |
|
Top Countries |
|
|
|
United States |
| 36.4% |
|
United Kingdom |
| 14.2% |
|
France |
| 8.2% |
|
Denmark |
| 6.8% |
|
China |
| 5.5% |
|
Netherlands |
| 4.2% |
|
Australia |
| 3.8% |
|
Kenya |
| 3.7% |
|
Belgium |
| 3.5% |
|
Hong Kong |
| 2.7% |
|
Other |
| 11.0% |
|
|
| 100.0% |
|
12 2020 Semi-Annual Report
Statement of Investments
April 30, 2020 (Unaudited)
Aberdeen Global Equity Impact Fund
|
| Shares |
| Value |
| |
COMMON STOCKS (103.9%) |
|
|
|
|
| |
AUSTRALIA (3.8%) |
|
|
|
|
| |
Industrials (2.1%) |
|
|
|
|
| |
Cleanaway Waste Management Ltd. |
| 925,500 |
| $ | 1,116,637 |
|
Real Estate (1.7%) |
|
|
|
|
| |
Goodman Group, REIT |
| 108,200 |
| 921,565 |
| |
|
|
|
| 2,038,202 |
| |
BELGIUM (3.5%) |
|
|
|
|
| |
Materials (3.5%) |
|
|
|
|
| |
Umicore SA |
| 44,100 |
| 1,911,316 |
| |
BRAZIL (1.8%) |
|
|
|
|
| |
Consumer Discretionary (0.8%) |
|
|
|
|
| |
YDUQS Part |
| 78,200 |
| 436,450 |
| |
Financials (1.0%) |
|
|
|
|
| |
Banco Bradesco SA |
| 162,008 |
| 523,154 |
| |
|
|
|
| 959,604 |
| |
CHINA (5.5%) |
|
|
|
|
| |
Financials (2.5%) |
|
|
|
|
| |
Ping An Insurance Group Co. of China Ltd., H Shares |
| 133,000 |
| 1,353,443 |
| |
Health Care (3.0%) |
|
|
|
|
| |
Wuxi Biologics Cayman, Inc. (a)(b) |
| 104,500 |
| 1,626,690 |
| |
|
|
|
| 2,980,133 |
| |
DENMARK (6.8%) |
|
|
|
|
| |
Health Care (2.5%) |
|
|
|
|
| |
Novo Nordisk AS, Class B |
| 21,100 |
| 1,345,969 |
| |
Industrials (2.0%) |
|
|
|
|
| |
Vestas Wind Systems AS |
| 12,700 |
| 1,090,589 |
| |
Utilities (2.3%) |
|
|
|
|
| |
Orsted AS (a) |
| 12,400 |
| 1,252,529 |
| |
|
|
|
| 3,689,087 |
| |
FRANCE (8.2%) |
|
|
|
|
| |
Financials (1.8%) |
|
|
|
|
| |
AXA SA |
| 54,400 |
| 967,041 |
| |
Health Care (0.9%) |
|
|
|
|
| |
Orpea |
| 4,700 |
| 522,794 |
| |
Industrials (5.5%) |
|
|
|
|
| |
Alstom SA |
| 38,200 |
| 1,566,925 |
| |
Schneider Electric SE |
| 15,000 |
| 1,386,185 |
| |
|
|
|
| 2,953,110 |
| |
|
|
|
| 4,442,945 |
| |
GERMANY (2.7%) |
|
|
|
|
| |
Information Technology (1.2%) |
|
|
|
|
| |
Infineon Technologies AG |
| 34,200 |
| 635,809 |
| |
|
| Shares |
| Value |
|
Materials (1.5%) |
|
|
|
|
|
Covestro AG (a) |
| 24,000 |
| $806,187 |
|
|
|
|
| 1,441,996 |
|
HONG KONG (2.7%) |
|
|
|
|
|
Financials (2.7%) |
|
|
|
|
|
AIA Group Ltd. |
| 161,000 |
| 1,477,620 |
|
INDONESIA (1.0%) |
|
|
|
|
|
Financials (1.0%) |
|
|
|
|
|
Bank Rakyat Indonesia Persero Tbk PT |
| 2,842,700 |
| 517,051 |
|
ISRAEL (1.3%) |
|
|
|
|
|
Industrials (1.3%) |
|
|
|
|
|
Kornit Digital Ltd. (b) |
| 21,100 |
| 699,993 |
|
KENYA (3.7%) |
|
|
|
|
|
Communication Services (3.7%) |
|
|
|
|
|
Safaricom PLC |
| 7,337,600 |
| 1,974,523 |
|
NETHERLANDS (4.2%) |
|
|
|
|
|
Information Technology (1.7%) |
|
|
|
|
|
ASML Holding NV |
| 3,100 |
| 905,464 |
|
Materials (2.5%) |
|
|
|
|
|
Koninklijke DSM NV |
| 11,000 |
| 1,348,181 |
|
|
|
|
| 2,253,645 |
|
NORWAY (2.6%) |
|
|
|
|
|
Communication Services (2.6%) |
|
|
|
|
|
Telenor ASA |
| 91,000 |
| 1,395,852 |
|
REPUBLIC OF IRELAND (0.8%) |
|
|
|
|
|
Industrials (0.8%) |
|
|
|
|
|
Kingspan Group PLC |
| 9,000 |
| 458,613 |
|
SOUTH KOREA (2.5%) |
|
|
|
|
|
Information Technology (2.5%) |
|
|
|
|
|
Samsung SDI Co. Ltd. |
| 5,600 |
| 1,322,921 |
|
TAIWAN (2.5%) |
|
|
|
|
|
Industrials (2.5%) |
|
|
|
|
|
Voltronic Power Technology Corp. |
| 57,200 |
| 1,357,835 |
|
UNITED KINGDOM (14.2%) |
|
|
|
|
|
Consumer Discretionary (1.4%) |
|
|
|
|
|
Countryside Properties PLC (a) |
| 153,200 |
| 780,522 |
|
Health Care (7.4%) |
|
|
|
|
|
AstraZeneca PLC |
| 14,900 |
| 1,558,421 |
|
Clinigen Healthcare Ltd. |
| 140,000 |
| 1,273,102 |
|
GlaxoSmithKline PLC |
| 55,400 |
| 1,155,788 |
|
|
|
|
| 3,987,311 |
|
Statement of Investments (concluded)
April 30, 2020 (Unaudited)
Aberdeen Global Equity Impact Fund
|
| Shares |
| Value |
| |
COMMON STOCKS (continued) |
|
|
|
|
| |
UNITED KINGDOM (continued) |
|
|
|
|
| |
Industrials (5.4%) |
|
|
|
|
| |
John Laing Group PLC (a) |
| 373,600 |
| $ | 1,713,949 |
|
RELX PLC |
| 52,500 |
| 1,184,494 |
| |
|
|
|
| 2,898,443 |
| |
|
|
|
| 7,666,276 |
| |
UNITED STATES (36.1%) |
|
|
|
|
| |
Consumer Discretionary (1.2%) |
|
|
|
|
| |
Chegg, Inc. (b) |
| 15,400 |
| 658,350 |
| |
Health Care (9.4%) |
|
|
|
|
| |
HMS Holdings Corp. (b) |
| 52,700 |
| 1,511,172 |
| |
Merck & Co., Inc. |
| 16,800 |
| 1,332,912 |
| |
UnitedHealth Group, Inc. |
| 7,600 |
| 2,222,772 |
| |
|
|
|
| 5,066,856 |
| |
Industrials (2.6%) |
|
|
|
|
| |
Tetra Tech, Inc. |
| 7,300 |
| 549,544 |
| |
Trane Technologies PLC |
| 9,700 |
| 847,974 |
| |
|
|
|
| 1,397,518 |
| |
Information Technology (10.6%) |
|
|
|
|
| |
Accenture PLC, Class A |
| 6,900 |
| 1,277,811 |
| |
Autodesk, Inc. (b) |
| 6,100 |
| 1,141,493 |
| |
Mastercard, Inc., Class A |
| 6,200 |
| 1,704,814 |
| |
salesforce.com, Inc. (b) |
| 9,800 |
| 1,587,110 |
| |
|
|
|
| 5,711,228 |
| |
Real Estate (9.3%) |
|
|
|
|
| |
American Tower Corp., REIT |
| 4,100 |
| 975,800 |
| |
Equinix, Inc., REIT |
| 2,900 |
| 1,958,080 |
| |
Prologis, Inc., REIT |
| 23,600 |
| 2,105,828 |
| |
|
|
|
| 5,039,708 |
| |
Utilities (3.0%) |
|
|
|
|
| |
NextEra Energy, Inc. |
| 7,100 |
| 1,640,952 |
| |
|
|
|
| 19,514,612 |
| |
Total Common Stocks |
|
|
| 56,102,224 |
| |
|
| Shares |
| Value |
| |
MONEY MARKET FUNDS (0.3%) |
|
|
|
|
| |
UNITED STATES (0.3%) |
|
|
|
|
| |
State Street Institutional U.S. Government Money Market Fund, Premier Class, 0.22% (c) |
| 164,673 |
| $ | 164,673 |
|
Total Money Market Funds |
|
|
| 164,673 |
| |
Total Investments |
|
|
| 56,266,897 |
| |
Liabilities in Excess of Other Assets—(4.2)% |
|
|
| (2,272,705 | ) | |
Net Assets—100.0% |
|
|
| $ | 53,994,192 |
|
(a) Denotes a security issued under Regulation S or Rule 144A.
(b) Non-income producing security.
(c) Registered investment company advised by State Street Global Advisors. The rate shown is the 7 day yield as of April 30, 2020.
(d) See accompanying Notes to Financial Statements for tax unrealized appreciation/(depreciation) of securities.
PLC Public Limited Company
REIT Real Estate Investment Trust
See accompanying Notes to Financial Statements.
14 | 2020 Semi-Annual Report |
|
Aberdeen Total Return Bond Fund (Unaudited)
Aberdeen Total Return Bond Fund (Institutional Class shares net of fees) returned 4.39% for the six-month period ended April 30, 2020, versus the 4.86% return of its benchmark, the Bloomberg Barclays U.S. Aggregate Bond Index, during the same period.
Global financial markets experienced significant bouts of volatility during the six-month period ended April 30, 2020. Over the first half of the reporting period, investor sentiment was bolstered by generally positive economic data reports and news of a “phase one” agreement in the U.S.-China trade dispute. Credit spreads, particularly those of corporate bonds, approached and remained near decade-high tight levels until mid-February 2020. However, in February and March 2020, global financial markets experienced the quickest bearish turn on record. In March, the spread of the COVID-19 pandemic beyond Asia forced many countries from Europe to the U.S. to essentially shut down. The collapse of oil prices attributable to the lack of demand and price war between the Organization of the Petroleum Exporting Countries (OPEC) and Russia intensified investors’ fear of a bankruptcy wave in the energy sector and beyond. Weak economic data outside the U.S. and a flood of 30 million initial unemployment claims in the U.S. over a six-week span shed light on the unprecedented shock to the global economy from both the supply and demand sides of the economic coin. The daunting prospect of a COVID-19 induced deep recession ignited a financial crisis which, to some extent, was more severe than that during the global financial crisis (GFC) of the late 2000s. The spikes in volatility in global government bond markets and credit spreads due to liquidity crunch and malfunctioning of the market were more pronounced.
Global policymakers scrambled – repeatedly and with unseen speed and scale – to mitigate the economic and financial fallout from the pandemic and related containment measures. The U.S. Federal Reserve’s (Fed) two emergency interest-rate cuts in March 2020, reduced the federal funds rate by an aggregate of 150 basis points (bps) to a range of 0% to 0.25%. The Fed also expanded its quantitative easing program, not only in purchasing “unlimited” quantity to government-related instruments, but also to include investment-grade1 corporate bonds for the first time. The central bank also resurrected its Term Asset-Backed Securities Loan Facility (TALF) from 2008, but with more restrictive provisions. In April 2020, the Fed further expanded its lending programs to $2.3 trillion, including high-yield credits in a further break with tradition. An unfolding labor-market crisis led the U.S. Congress to pass a third relief package followed by an addition to the Paycheck Protection Program (PPP) totaling near $3 trillion. The package included funding for the Fed to leverage lending to corporations; loan/grants to small- and medium-sized enterprises (SMEs); direct cash payments to individuals; tax breaks; expanded unemployment benefits; and aid to healthcare
providers and state and local governments. Central banks around the world, particularly in developed-market countries, all embarked on massive monetary and fiscal policy support ranging 3% to 17% of their respective gross domestic products (GDP). In April 2020 alone, G42 central bank balance sheets expanded by $4.4 trillion and their fiscal packages increased by over $2 trillion. The aggressive monetary and fiscal policy support brought some stabilization to the markets towards the end of the reporting period as investors perceived that the risk of an economic depression and a financial calamity had diminished.
The broader U.S. fixed-income market, as measured by the Bloomberg Barclays U.S. Aggregate Bond Index, returned 4.86% over reporting period amid investors’ fears surrounding the impact of the worldwide spread of the COVID-19 pandemic on the global economy. In the “risk-off” market environment during the reporting period, U.S. Treasury securities outperformed all other fixed income assets, returning 7.95%, as measured by the Bloomberg Barclays U.S. Treasury Index.3 The flight to safety in the market, as well as Fed’s monetary policy actions, led to dramatic declines in yields across the U.S. Treasury curve. Yields on two- three-, five- and ten-year Treasury notes fell 132, 128, 115 and 105 basis points (bps) to 0.20%, 0.24%, 0.36% and 0.64%, respectively, over the six-month reporting period, with the ten- to two-year spread widening by 27 bps to +44 bps. Non-Treasury assets experienced a tremendous amount of volatility and registered the most abrupt declines and quickest recoveries. For example, following a strong performance in the last two months of 2019, the highly indebted corporate bond sector, as measured by the Bloomberg Barclay’s Corporate Bond Index,4 was range-bound until mid-February 2020, when the index underperformed versus the Bloomberg Barclays U.S. Treasury Index by more than 18% over the next 22 business days. After the announcement of policy supports, corporate bonds recover more than 10% against comparable-duration5 Treasuries over the next 26 business days.
The Fund modestly underperformed relative to its benchmark, the Bloomberg Barclays U.S. Aggregate Bond Index, for the six-month period ended April 30, 2020. Fund performance was hampered by the allocation to spread products (taxable bonds other than U.S. Treasuries), despite positive contributions from the yield-curve positioning and holdings in foreign currency-denominated government bonds. The largest detractors from Fund performance were the overweight allocations relative to U.S. Treasuries to non-government-backed residential mortgage-backed securities (RMBS), taxable municipal bonds, and commercial mortgage-backed securities (CMBS). Conversely, the Fund’s pivot from an underweight to and overweight position in corporate bonds, as well as an underweight allocation to emerging-market bonds, benefited performance for the
1 | Companies whose bonds are rated as “investment-grade’“ have a lower chance of defaulting on their debt than those rated as “non-investment grade.” Bonds rated BBB or above by credit rating agencies Standard and Poor’s and Fitch or Baa3 or above by Moody’s are classified as investment-grade. |
2 | The G4 nations comprise Brazil, Germany, India, and Japan, which support each other’s bids for permanent seats on the United Nations Security Council. |
3 | The Bloomberg Barclays Corporate Bond Index tracks the performance of the U.S. investment-grade, fixed-rate, taxable corporate bond market. Indexes are unmanaged and have been provided for comparison purposes only. No fees or expenses are reflected. You cannot invest directly in an index. |
4 | The Bloomberg Barclays U.S. Treasury Index tracks the performance of U.S. dollar-denominated, fixed-rate, nominal debt issued by the U.S. Treasury. |
5 | Duration is an estimate of bond price sensitivity to changes in interest rates. The higher the duration, the greater the change (i.e., higher risk) in relation to interest-rate movements. |
| 2020 Semi-Annual Report |
Aberdeen Total Return Bond Fund (Unaudited) (continued)
reporting period. Security selection in the corporate sector significantly bolstered Fund performance, which more than offset the negative impact from security selection in other sectors. The Fund’s long duration exposure versus the benchmark, along with holdings in foreign government bonds and currency positioning, contributed significantly to performance for the reporting period.
At the beginning of 2020, we had been cautious regarding the elevated valuations in the late-market cycle and had positioned the Fund with a quality tilt and away from highly leveraged sectors such as corporate bonds. We exited the Fund’s foreign bond and currency exposure at the onset of the COVID-19 outbreak, which enhanced Fund performance as emerging-market assets declined sharply. Fund performance benefited substantially during the reporting period from a large underweight allocation to corporate bonds, the weakest-performing spread sector. However, even highly rated6 assets could hardly withstand collapsing economies worldwide and the global financial market meltdown in March 2020. The “sell what you can” phenomenon disproportionately weighed on the Fund’s holdings in high-quality and short-maturity assets. The Fed’s choice of supporting corporate bonds down to the BBB- rating category but not AAA rated private-label7 MBS and CMBS distorted relative value in the market. We did not dwell upon the fairness or moral hazard of government policies, but quickly moved the Fund from an underweight allocation to an overweight position in the corporate sector following the Fed’s announcement that it was expanding its asset purchases into corporate bonds.
We employed derivatives over the reporting period, including U.S. Treasury futures, in an effort to manage the Fund’s overall yield-curve and interest-rate exposure, and protect the Fund from sharply rising yields. We utilized foreign exchange forwards8 in a bid to gain exposure to foreign markets efficiently and to hedge currency risks from sovereign bond holdings. Our use of currency forwards9 bolstered the Fund’s positions in global investments as the U.S. dollar performed well over the reporting period. The derivatives positions contributed less than 1.00% to the Fund’s absolute return for the reporting period.
It is difficult to estimate the depth and length of the unparalleled economic downturn stemming from the COVID-19 pandemic and containment measures. We think that economic headlines will likely worsen before getting better, with meaningful downside. The timeline of recovery entails heightened uncertainties due to many factors affecting its three interrelated determinants: health, government
policy and consumer and business reactions. The market is focusing on the slowing of infection, easing of lockdown, and ultimate recovery with the help of a COVID-19 vaccine. In our view, the Fed’s rapid and extraordinary monetary response should dampen volatility, provide liquidity to the market, and backstop weak links in the financial system. With the Fed ill-suited to cure economic woes, we think that the U.S. government’s massive and expanding fiscal stimulus packages and other aid may bridge income gaps and help prevent permanent loss of economic output. We anticipate that more assistance for small businesses, state and local governments, as well as various parts of mortgage ecosystem, will likely be forthcoming. In the short term, there are few constraints on how much the Fed and the administration of U.S. President Donald Trump will support each other and act as necessary to prevent severe and prolonged disruption to the economy until a meaningful recovery or inflation.
Our focus is to ride the liquidity wave to invest in what we believe are high-quality credits that the Fed is, or is expected to be, purchasing or financing. We believe that the key is to avoid securities with higher default probability while hedging some downside systematic risk9 with a long duration exposure. We plan to adjust the Fund’s overweight to investment-grade corporate bonds according to valuation. We will be patient and wait for spread compression11 in ABS, CMBS and taxable municipal bonds as the Fed ramps up support for these securities. We maintain our view that, despite the lack of government assistance thus far, the U.S. private residential mortgage market will be able to weather the storm. We believe that homeowners will have both great incentive and ability to pay, while mortgage lenders and servicers, as well as the U.S. government, will be more responsive and creative in an effort to prevent costly foreclosures and avoid a repeat of the GFC. In our view, selling some fully priced government-backed MBS and CMBS to the Fed will leave us with more ammunition to take advantage of market volatility.
We believe that the Fund’s potential to benefit from foreign currency denominated government bond exposure has increased, with the U.S. yield advantage narrowing or reversing. Bonds from countries with accommodative monetary policy and manageable deficits and debt burdens may provide diversification12 and capital preservation. Emerging markets generally face strong headwinds, so differentiation and deep-dive will be crucial. Being selective and active, particularly in foreign-exchange management, some countries will offer attractive risk-adjusted returns
6 | Moody’s, Standard & Poor’s (S&P) and Fitch are international credit rating agencies. Moody’s assigns a rating from ‘Aaa’ to ‘C’, with ‘Aaa’ being the highest quality and ‘C’ the lowest quality. S&P’s and Fitch’s ratings are expressed as letter grades that range from “AAA” to “D” to communicate each agency’s opinion of relative level of credit risk. Ratings from ‘AA’ to ‘CCC’ may be modified by the addition of a plus (+) or minus (-) sign to show relative standing within the major rating categories. The investment grade category is a rating from AAA to BBB-. |
7 | Private-label MBS and CMBS are securitized mortgages that do not conform to the criteria set by the government sponsored enterprises: Freddie Mac, Fannie Mae and Ginnie Mae. |
8 | A foreign exchange forward is a binding contract in the foreign exchange market that locks in the exchange rate for the purchase or sale of a currency on a future date. |
9 | A currency forward is a binding contract in the foreign exchange market that locks in the exchange rate for the purchase or sale of a currency on a future date. |
10 | Systematic risk refers to the risk inherent to the entire market or market segment. |
11 | Spread compression refers to a decrease in the difference in yield between a U.S. Treasury security and another debt security of the same maturity but different credit quality. |
12 | Diversification does not ensure a profit or protect against a loss in a declining market. |
2020 Semi-Annual Report |
|
Aberdeen Total Return Bond Fund (Unaudited) (concluded)
Portfolio Management
North American Fixed Income Team
PAST PERFORMANCE DOES NOT GUARANTEE FUTURE RESULTS.
The performance quoted represents past performance, which does not guarantee future results. Class A Shares pay a Rule 12b-1 fee of up to 0.25% of net assets. The investment return and principal value of an investment will fluctuate so that an investor’s shares, when redeemed, may be worth more or less than their original cost. Current performance of the Fund may be lower or higher than the performance quoted. Performance data current to the most recent month-end may be obtained by calling 866-667-9231 or visiting www.aberdeenstandard.com/en-us/us/investor/fund-centre.
Investing in mutual funds involves risk, including possible loss of principal. There is no assurance that the investment objective of any fund will be achieved. Indexes are unmanaged and have been provided for comparison purposes only. No fees or expenses are reflected. You cannot invest directly in an index.
Risk Considerations
Fixed income securities are subject to certain risks including, but not limited to: interest rate (changes in interest rates may cause a decline in the market value of an investment), credit (changes in the financial condition of the issuer, borrower, counterparty, or underlying collateral), prepayment (debt issuers may repay or refinance their loans or obligations earlier than anticipated), and extension (principal repayments may not occur as quickly as anticipated, causing the expected maturity of a security to increase).
Investments in asset-backed and mortgage-backed securities include additional risks that investors should be aware which include those associated with fixed income securities, as well as increased susceptibility to adverse economic developments.
The Fund may use derivatives as a substitute for taking a position or reducing exposure to underlying assets. Derivatives are speculative and may hurt the Fund’s performance.
Foreign securities may be more volatile, harder to price and less liquid than U.S. securities. They are subject to different accounting and regulatory standards and currency exchange rate, political and economic risks. Fluctuation in currency exchange rates may impact a Fund’s returns more greatly to the extent a Fund does not hedge currency exposure or hedging techniques are unsuccessful. The foregoing risks are enhanced in emerging market countries.
Municipal securities can be affected by adverse tax, legislative or political changes and the financial condition of the issuers of municipal securities.
Investing a significant portion of the Fund’s assets in securities of companies conducting business in a broadly related group of industries within an economic sector may make the Fund more vulnerable to unfavorable developments in that sector.
Please read the prospectus for more detailed information regarding these and other risks.
Aberdeen Total Return Bond Fund (Unaudited)
Average Annual Total Return |
| Six |
| 1 Yr. |
| 5 Yr. |
| 10 Yr. |
|
Class A |
| 4.28% |
| 9.91% |
| 3.56% |
| 3.90% |
|
Institutional Class |
| 4.39% |
| 10.14% |
| 3.82% |
| 4.17% |
|
Performance of a $10,000 Investment (as of April 30, 2020)
Comparative performance of $10,000 invested in Class A shares of the Aberdeen Total Return Bond Fund, Barclays U.S. Aggregate Bond Index and the Consumer Price Index (CPI) over a 10-year period ended April 30, 2020. Unlike the Fund’s returns, the returns for these unmanaged indexes do not reflect any fees or expenses. Investors cannot invest directly in market indexes.
The Barclays U.S. Aggregate Bond Index (the “U.S. Aggregate”) is a broad-based flagship benchmark that measures the investment grade, U.S. Dollar-denominated, fixed-rate taxable bond market. The index includes Treasuries, government-related and corporate securities, MBS (agency fixed-rate and hybrid ARM pass-throughs), ABS and CMBS (agency and non-agency). Provided the necessary inclusion rules are met, U.S. Aggregate eligible securities also contribute to the multi-currency Bloomberg Barclays Global Aggregate Bond Index and the Bloomberg Barclays U.S. Universal Index, which includes high yield and emerging markets debt.
The CPI is a measure of the average change over time in the prices paid by urban consumers for a market basket of consumer goods and services.
Investment return and principal value will fluctuate, and when redeemed, shares may be worth more or less than original cost. Past performance is no guarantee of future results. The Average Annual Total Return table and performance graph do not reflect the deduction of taxes that a shareholder would pay on Fund distributions or the redemption of Fund shares. Investing in mutual funds involves market risk, including loss of principal. Performance returns assume the reinvestment of all distributions. Performance returns reflect fee waivers and reimbursements in effect without which returns would have been lower.
2020 Semi-Annual Report |
|
Aberdeen Total Return Bond Fund (Unaudited)
Portfolio Summary (as a percentage of net assets)
April 30, 2020 (Unaudited)
Asset Allocation |
|
|
|
Corporate Bonds |
| 34.4% |
|
U.S. Agencies |
| 15.4% |
|
U.S. Treasuries |
| 14.8% |
|
Commercial Mortgage-Backed Securities |
| 10.3% |
|
Asset-Backed Securities |
| 7.3% |
|
Municipal Bonds |
| 5.4% |
|
Non-Agency Mortgage-Backed Securities |
| 5.0% |
|
Government Bonds |
| 2.9% |
|
Short-Term Investment |
| 2.7% |
|
Agency Mortgage-Backed Securities |
| 1.5% |
|
Other Assets in Excess of Liabilities |
| 0.3% |
|
|
| 100.0% |
|
The following chart summarizes the composition of the Fund’s portfolio, expressed as a percentage of net assets. The industries listed below may include more than one industry group. As of April 30, 2020, the Fund did not have more than 25% of its assets invested in any industry group.
Top Industries |
|
|
|
Commercial Banks |
| 8.0% |
|
Electric Utilities |
| 5.3% |
|
Auto Manufacturers |
| 3.1% |
|
Oil, Gas & Consumable Fuels |
| 2.2% |
|
Diversified Telecommunication Services |
| 2.0% |
|
Software |
| 1.4% |
|
Healthcare Providers & Services |
| 1.3% |
|
Aerospace & Defense |
| 1.3% |
|
Beverages |
| 1.2% |
|
Pharmaceutical |
| 1.1% |
|
Other |
| 73.1% |
|
|
| 100.0% |
|
Top Holdings* |
|
|
|
U.S. Treasury Bond 11/15/2049 |
| 4.0% |
|
U.S. Treasury Bond 02/15/2049 |
| 3.3% |
|
U.S. Treasury Note 02/15/2022 |
| 3.0% |
|
U.S. Treasury Note 01/15/2022 |
| 2.5% |
|
Federal National Mortgage Association 12/01/2046 |
| 1.8% |
|
Government National Mortgage Association 05/20/2048 |
| 1.6% |
|
Federal National Mortgage Association 01/01/2047 |
| 1.2% |
|
Citigroup, Inc., (fixed rate to 04/08/2025, variable rate thereafter) 04/08/2026 |
| 1.2% |
|
U.S. Treasury Note 12/15/2022 |
| 1.2% |
|
Kentucky Utilities Co. 11/01/2020 |
| 1.2% |
|
Other |
| 79.0% |
|
|
| 100.0% |
|
* | For the purpose of listing top holdings, Short-Term Investments are included as part of Other. |
Top Countries |
|
|
|
United States |
| 88.5% |
|
United Kingdom |
| 3.0% |
|
Italy |
| 1.7% |
|
Germany |
| 1.7% |
|
Indonesia |
| 1.4% |
|
Netherlands |
| 1.1% |
|
New Zealand |
| 1.0% |
|
Belgium |
| 0.8% |
|
Denmark |
| 0.5% |
|
Other |
| 0.3% |
|
|
| 100.0% |
|
Statement of Investments
April 30, 2020 (Unaudited)
Aberdeen Total Return Bond Fund
|
| Shares or |
| Value |
| ||
ASSET-BACKED SECURITIES (7.3%) |
|
|
| ||||
UNITED STATES (7.3%) |
|
|
|
|
| ||
AmeriCredit Automobile Receivables Trust, |
| $ | 5,161 |
| $ | 5,165 |
|
Americredit Automobile Receivables Trust, |
| 893,000 |
| 901,805 |
| ||
CNH Equipment Trust, |
| 299,548 |
| 300,632 |
| ||
Daimler Trucks Retail Trust, |
| 1,005,000 |
| 1,009,930 |
| ||
Ford Credit Auto Lease Trust, |
| 774,000 |
| 777,537 |
| ||
Ford Credit Floorplan Master Owner Trust A |
| 480,000 |
| 482,265 |
| ||
Series 2019-3, Class A1, ABS (USD), 2.23%, 09/15/2024 |
| 970,000 |
| 942,596 |
| ||
GM Financial Automobile Leasing Trust, |
| 1,173,000 |
| 1,189,955 |
| ||
Hertz Vehicle Financing LLC, |
| 957,000 |
| 890,966 |
| ||
John Deere Owner Trust, |
| 222,861 |
| 223,218 |
| ||
Mercedes-Benz Auto Lease Trust, |
| 1,104,000 |
| 1,106,661 |
| ||
Nissan Auto Lease Trust, |
| 496,316 |
| 497,744 |
| ||
SLM Student Loan Trust |
| 254,728 |
| 253,192 |
| ||
Series 2012-3, Class A, ABS, (USD), 1M USD LIBOR + 0.650%, 1.14%, 12/27/2038 (b) |
| 849,360 |
| 801,199 |
| ||
Series 2013-2, Class A, (USD), 1M USD LIBOR + 0.450%, 0.94%, 06/25/2043 (b) |
| 957,749 |
| 893,800 |
| ||
Tesla Auto Lease Trust |
| 874,000 |
| 875,418 |
| ||
Series 2019-A, Class D, ABS (USD), 3.37%, 01/20/2023 (a) |
| 637,000 |
| 603,325 |
| ||
Towd Point Mortgage Trust |
| 620,637 |
| 634,331 |
| ||
Series 2019-3, Class M2, ABS (USD), 4.25%, 02/25/2059 (a)(b) |
| 754,557 |
| 682,526 |
| ||
|
| Shares or |
| Value |
| ||
Series 2019-4, Class A1, ABS (USD), 2.90%, 10/25/2059 (a)(b) |
| $ | 700,778 |
| $ | 721,547 |
|
|
|
|
| 13,793,812 |
| ||
Total Asset-Backed Securities |
|
|
| 13,793,812 |
| ||
COMMERCIAL MORTGAGE-BACKED SECURITIES (10.3%) |
| ||||||
UNITED STATES (10.3%) |
|
|
|
|
| ||
BANK |
| 460,000 |
| 411,509 |
| ||
Series 2020-BN26, Class B, VRN (USD), 2.91%, 03/15/2063 (b) |
| 551,434 |
| 472,186 |
| ||
BX Trust, |
| 878,707 |
| 873,678 |
| ||
Citigroup Commercial Mortgage Trust, |
| 652,000 |
| 614,724 |
| ||
COMM Mortgage Trust |
| 521,826 |
| 524,646 |
| ||
Series 2019-GC44, Class C (USD), 3.65%, 08/15/2057 (b) |
| 589,206 |
| 466,694 |
| ||
Commercial Mortgage Trust, |
| 769,000 |
| 806,396 |
| ||
CSAIL Commercial Mortgage Trust, |
| 741,000 |
| 646,519 |
| ||
Federal Home Loan Mortgage Corp., |
| 1,106,000 |
| 1,053,934 |
| ||
Federal National Mortgage Association, |
| 757,131 |
| 770,412 |
| ||
FREMF Mortgage Trust, |
| 608,000 |
| 553,342 |
| ||
JP Morgan Chase Commercial Mortgage Securities Trust, |
| 1,029,000 |
| 1,057,478 |
| ||
JP Morgan Mortgage Trust |
| 583,622 |
| 593,830 |
| ||
Series 2016-3, Class 1A3, CMO, VRN, (USD), 3.50%, 10/25/2046 (a)(b) |
| 417,047 |
| 421,007 |
| ||
Series 2017-2, Class B3, CMO (USD), 3.71%, 05/25/2047 (a)(b) |
| 975,945 |
| 935,225 |
| ||
Series 2019-9, Class B3, CMO (USD), 3.94%, 05/25/2050 (a)(b) |
| 933,061 |
| 747,600 |
| ||
Statement of Investments (continued)
April 30, 2020 (Unaudited)
Aberdeen Total Return Bond Fund
|
| Shares or |
| Value |
| ||
COMMERCIAL MORTGAGE-BACKED SECURITIES (continued) |
| ||||||
UNITED STATES (continued) |
|
|
|
|
| ||
JPMBB Commercial Mortgage Securities Trust |
| $ | 625,000 |
| $ | 659,524 |
|
Series 2014-C24, Class A4A1 (USD), 3.37%, 11/15/2047 |
| 878,000 |
| 914,757 |
| ||
Morgan Stanley Bank of America Merrill Lynch Trust |
| 787,000 |
| 792,820 |
| ||
Series 2013-C13, Class A4 (USD), 4.04%, 11/15/2046 |
| 659,000 |
| 692,376 |
| ||
Morgan Stanley Capital I Trust, |
| 881,000 |
| 851,249 |
| ||
New Residential Mortgage Loan Trust, |
| 601,582 |
| 628,876 |
| ||
Nomura Asset Acceptance Corp. Alternative Loan Trust, |
| 255,410 |
| 264,230 |
| ||
SFAVE Commercial Mortgage Securities Trust |
| 870,000 |
| 676,268 |
| ||
Series 2015-5AVE, Class D (USD), 4.53%, 01/05/2043 (a)(b) |
| 562,000 |
| 398,385 |
| ||
UBS Commercial Mortgage Trust, |
| 547,000 |
| 445,303 |
| ||
Wells Fargo Commercial Mortgage Trust, |
| 680,000 |
| 670,242 |
| ||
WFRBS Commercial Mortgage Trust |
| 747,000 |
| 728,625 |
| ||
Series 2012-C10, Class AS, (USD), 3.24%, 12/15/2045 |
| 996,000 |
| 978,703 |
| ||
|
|
|
| 19,650,538 |
| ||
Total Commercial Mortgage-Backed Securities |
|
|
| 19,650,538 |
| ||
NON-AGENCY MORTGAGE-BACKED SECURITIES (5.0%) |
| ||||||
UNITED STATES (5.0%) |
|
|
|
|
| ||
CHL Mortgage Pass-Through Trust, |
| 312,558 |
| 261,024 |
| ||
Citigroup Mortgage Loan Trust, |
| 189,777 |
| 173,667 |
| ||
Flagstar Mortgage Trust, |
| 1,191,753 |
| 1,169,925 |
| ||
|
| Shares or |
| Value |
| ||
GSR Mortgage Loan Trust, |
| $ | 305,657 |
| $ | 312,025 |
|
IndyMac INDA Mortgage Loan Trust, |
| 336,441 |
| 276,354 |
| ||
JP Morgan Mortgage Trust |
| 500,619 |
| 501,125 |
| ||
Series 2005-A5, Class 2A2 (USD), 4.40%, 08/25/2035 (b) |
| 326,644 |
| 315,525 |
| ||
Series 2006-S1, Class 2A6 (USD), 6.00%, 04/25/2036 |
| 454,952 |
| 457,641 |
| ||
Series 2014-IVR3, Class 3A1 (USD), 2.65%, 09/25/2044 (a)(b) |
| 278,150 |
| 277,466 |
| ||
Series 2016-5, Class A1 (USD), 2.67%, 12/25/2046 (a)(b) |
| 412,475 |
| 410,372 |
| ||
Series 2017-1, Class A3, (USD), 3.50%, 01/25/2047 (a)(b) |
| 36 |
| 36 |
| ||
Series 2018-6, Class B2 (USD), 3.95%, 12/25/2048 (a)(b) |
| 969,757 |
| 904,398 |
| ||
New Residential Mortgage Loan Trust, |
| 619,432 |
| 652,651 |
| ||
PHH Mortgage Trust, |
| 443,655 |
| 458,413 |
| ||
Sequoia Mortgage Trust |
| 595,833 |
| 608,693 |
| ||
Series 2017-CH2, Class A13 (USD), 4.00%, 12/25/2047 (a)(b) |
| 902,867 |
| 919,615 |
| ||
Structured Asset Securities Corp., |
| 619,795 |
| 625,605 |
| ||
Thornburg Mortgage Securities Trust |
| 312,873 |
| 295,237 |
| ||
Series 2007-4, Class 3A1 (USD), 4.00%, 09/25/2037 (b) |
| 13,898 |
| 13,880 |
| ||
WaMu Mortgage Pass Through Certificates, |
| 361,148 |
| 327,568 |
| ||
WinWater Mortgage Loan Trust, |
| 583,356 |
| 568,535 |
| ||
|
|
|
| 9,529,755 |
| ||
Total Non-Agency Mortgage-Backed Securities |
|
|
| 9,529,755 |
| ||
CORPORATE BONDS (34.4%) |
|
|
|
|
| ||
BELGIUM (0.8%) |
|
|
|
|
| ||
Beverages (0.8%) |
|
|
| ||||
Anheuser-Busch InBev Worldwide, Inc. (USD), 3.50%, 06/01/2030 |
| 1,350,000 |
| 1,439,921 |
| ||
Statement of Investments (continued)
April 30, 2020 (Unaudited)
Aberdeen Total Return Bond Fund
|
| Shares or |
| Value |
| ||
CORPORATE BONDS (continued) |
|
|
|
|
| ||
DENMARK (0.5%) |
|
|
|
|
| ||
Commercial Banks (0.5%) |
|
|
|
|
| ||
Danske Bank AS (USD), |
| $ | 945,000 |
| $ | 976,940 |
|
GERMANY (1.7%) |
|
|
|
|
| ||
Auto Manufacturers (1.7%) |
|
|
|
|
| ||
BMW US Capital LLC |
| 1,967,000 |
| 1,976,095 |
| ||
(USD), 3.90%, 04/09/2025 (a) |
| 1,122,000 |
| 1,194,334 |
| ||
|
|
|
| 3,170,429 |
| ||
ITALY (1.2%) |
|
|
|
|
| ||
Commercial Banks (1.2%) |
|
|
|
|
| ||
UniCredit SpA |
| 932,000 |
| 961,283 |
| ||
(USD), 7.83%, 12/04/2023 (a) |
| 1,270,000 |
| 1,382,827 |
| ||
|
|
|
| 2,344,110 |
| ||
NETHERLANDS (1.1%) |
|
|
|
|
| ||
Oil, Gas & Consumable Fuels (0.5%) |
|
|
|
|
| ||
Shell International Finance BV (USD), |
| 901,000 |
| 928,871 |
| ||
Semiconductors (0.6%) |
|
|
|
|
| ||
NXP BV / NXP Funding LLC |
| 987,000 |
| 1,115,648 |
| ||
|
|
|
| 2,044,519 |
| ||
UNITED KINGDOM (3.0%) |
|
|
|
|
| ||
Commercial Banks (2.4%) |
|
|
|
|
| ||
HSBC Holdings PLC, (fixed rate to 09/12/2025, variable rate thereafter) (USD), |
| 1,795,000 |
| 1,967,119 |
| ||
Lloyds Banking Group PLC, (fixed rate to 07/09/2024, variable rate thereafter), VRN (USD), |
| 1,225,000 |
| 1,288,239 |
| ||
Royal Bank of Scotland Group PLC, (fixed rate to 03/22/2024, variable rate thereafter) (USD), |
| 1,243,000 |
| 1,324,888 |
| ||
|
|
|
| 4,580,246 |
| ||
Diversified Telecommunication Services (0.6%) |
| ||||||
Vodafone Group PLC (USD), |
| 890,000 |
| 1,060,705 |
| ||
|
|
|
| 5,640,951 |
| ||
UNITED STATES (26.1%) |
|
|
|
|
| ||
Aerospace & Defense (1.3%) |
|
|
|
|
| ||
Boeing Co. (The) (USD), |
| 1,660,000 |
| 1,661,494 |
| ||
|
| Shares or |
| Value |
| ||
Raytheon Technologies Corp. (USD), |
| $ | 551,000 |
| $ | 772,072 |
|
|
|
|
| 2,433,566 |
| ||
Auto Manufacturers (1.4%) |
|
|
|
|
| ||
Ford Holdings LLC (USD), |
| 930,000 |
| 855,600 |
| ||
Toyota Motor Credit Corp. (USD), |
| 1,700,000 |
| 1,778,729 |
| ||
|
|
|
| 2,634,329 |
| ||
Beverages (0.4%) |
|
|
|
|
| ||
Constellation Brands, Inc. (USD), |
| 775,000 |
| 786,873 |
| ||
Building Materials (0.5%) |
|
|
|
|
| ||
Carrier Global Corp. |
| 182,000 |
| 183,107 |
| ||
(USD), 3.38%, 04/05/2040 (a) |
| 770,000 |
| 684,161 |
| ||
|
|
|
| 867,268 |
| ||
Chemicals (0.9%) |
|
|
|
|
| ||
DuPont de Nemours, Inc. (USD), |
| 1,108,000 |
| 1,113,639 |
| ||
Sherwin-Williams Co. (USD), |
| 540,000 |
| 588,908 |
| ||
|
|
|
| 1,702,547 |
| ||
Commercial Banks (3.9%) |
|
|
|
|
| ||
Bank of America Corp., (fixed rate to 10/22/2029, variable rate thereafter) (USD), |
| 1,565,000 |
| 1,630,045 |
| ||
Citigroup, Inc., (fixed rate to 04/08/2025, variable rate thereafter), FRN (USD), |
| 2,250,000 |
| 2,355,908 |
| ||
Citizens Bank NA/Providence (USD), |
| 1,108,000 |
| 1,108,136 |
| ||
JPMorgan Chase & Co., (fixed rate to 04/22/2030, variable rate thereafter), FRN (USD), |
| 1,106,000 |
| 1,128,957 |
| ||
Morgan Stanley, (fixed rate to 04/01/2030, variable rate thereafter), FRN (USD), |
| 1,126,000 |
| 1,237,733 |
| ||
|
|
|
| 7,460,779 |
| ||
Commercial Services & Supplies (0.2%) |
|
|
|
|
| ||
Equifax, Inc. (USD), |
| 290,000 |
| 294,112 |
| ||
Diversified Financial Services (0.2%) |
|
|
|
|
| ||
Ally Financial, Inc. (USD), |
| 442,000 |
| 471,022 |
| ||
Statement of Investments (continued)
April 30, 2020 (Unaudited)
Aberdeen Total Return Bond Fund
|
| Shares or |
| Value |
| ||
CORPORATE BONDS (continued) |
|
|
|
|
| ||
UNITED STATES (continued) |
|
|
|
|
| ||
Diversified Telecommunication Services (1.4%) |
|
|
|
|
| ||
Verizon Communications, Inc. (USD), 3.88%, 02/08/2029 |
| $ | 1,112,000 |
| $ | 1,286,004 |
|
(USD), 4.50%, 08/10/2033 |
| 1,110,000 |
| 1,373,785 |
| ||
|
|
|
| 2,659,789 |
| ||
Electric Utilities (5.3%) |
|
|
|
|
| ||
AEP Texas, Inc., Series H (USD), |
| 790,000 |
| 867,120 |
| ||
Berkshire Hathaway Energy Co. (USD), |
| 531,000 |
| 674,682 |
| ||
Entergy Texas, Inc. (USD), |
| 540,000 |
| 608,456 |
| ||
Florida Power & Light Co. (USD), |
| 476,000 |
| 515,562 |
| ||
IPALCO Enterprises, Inc. (USD), |
| 1,343,000 |
| 1,421,068 |
| ||
Kentucky Utilities Co. (USD), |
| 2,262,000 |
| 2,273,374 |
| ||
Mississippi Power Co. (USD), |
| 560,000 |
| 613,279 |
| ||
Oklahoma Gas & Electric Co. (USD), |
| 1,015,000 |
| 1,080,302 |
| ||
Southern California Edison Co., |
| 1,127,000 |
| 1,226,097 |
| ||
Tucson Electric Power Co. (USD), |
| 620,000 |
| 725,765 |
| ||
|
|
|
| 10,005,705 |
| ||
Energy Equipment & Services (0.5%) |
|
|
|
|
| ||
Western Midstream Operating LP (USD), |
| 1,070,000 |
| 946,950 |
| ||
Health Care Equipment & Supplies (0.2%) |
|
|
|
|
| ||
Thermo Fisher Scientific, Inc. (USD), |
| 397,000 |
| 447,697 |
| ||
Healthcare Providers & Services (1.3%) |
|
|
|
|
| ||
Laboratory Corp. of America Holdings (USD), |
| 1,049,000 |
| 1,088,724 |
| ||
Quest Diagnostics, Inc. (USD), |
| 1,240,000 |
| 1,346,900 |
| ||
|
|
|
| 2,435,624 |
| ||
Insurance (0.4%) |
|
|
|
|
| ||
Prudential Financial, Inc. (USD), |
| 770,000 |
| 763,532 |
| ||
Machinery-Diversified (0.3%) |
|
|
|
|
| ||
Deere & Co. (USD), |
| 531,000 |
| 631,217 |
| ||
Media (0.1%) |
|
|
|
|
| ||
Fox Corp. (USD), |
| 164,000 |
| 173,331 |
| ||
|
| Shares or |
| Value |
| ||
Miscellaneous Manufacturing (0.6%) |
|
|
|
|
| ||
General Electric Co. (USD), |
| $ | 1,110,000 |
| $ | 1,128,720 |
|
Oil, Gas & Consumable Fuels (1.7%) |
|
|
|
|
| ||
BP Capital Markets America, Inc. (USD), |
| 939,000 |
| 968,733 |
| ||
Exxon Mobil Corp. (USD), |
| 930,000 |
| 943,167 |
| ||
Valero Energy Corp. (USD), |
| 1,330,000 |
| 1,327,407 |
| ||
|
|
|
| 3,239,307 |
| ||
Pharmaceutical (1.1%) |
|
|
|
|
| ||
CVS Health Corp. |
| 1,105,000 |
| 1,354,230 |
| ||
(USD), 4.25%, 04/01/2050 |
| 565,000 |
| 652,960 |
| ||
|
|
|
| 2,007,190 |
| ||
Real Estate Investment Trust (REIT) Funds (0.7%) |
|
|
|
|
| ||
American Tower Corp. (USD), |
| 860,000 |
| 900,181 |
| ||
Welltower, Inc. (USD), |
| 545,000 |
| 527,845 |
| ||
|
|
|
| 1,428,026 |
| ||
Retail (1.0%) |
|
|
|
|
| ||
McDonald’s Corp. (USD), |
| 1,028,000 |
| 1,124,644 |
| ||
Starbucks Corp. (USD), |
| 702,000 |
| 700,387 |
| ||
|
|
|
| 1,825,031 |
| ||
Semiconductors (0.3%) |
|
|
|
|
| ||
Broadcom, Inc. (USD), |
| 578,000 |
| 636,808 |
| ||
Software (1.4%) |
|
|
|
|
| ||
Broadridge Financial Solutions, Inc. (USD), |
| 765,000 |
| 787,751 |
| ||
Electronic Arts, Inc. (USD), |
| 330,000 |
| 382,995 |
| ||
Fiserv, Inc. (USD), |
| 811,000 |
| 886,296 |
| ||
Oracle Corp. (USD), |
| 576,000 |
| 607,205 |
| ||
|
|
|
| 2,664,247 |
| ||
Transportation (1.0%) |
|
|
|
|
| ||
FedEx Corp. (USD), |
| 1,125,000 |
| 1,202,199 |
| ||
United Parcel Service, Inc. (USD), |
| 560,000 |
| 798,092 |
| ||
|
|
|
| 2,000,291 |
| ||
|
|
|
| 49,643,961 |
| ||
Total Corporate Bonds |
|
|
| 65,260,831 |
| ||
See accompanying Notes to Financial Statements.
2020 Semi-Annual Report 23
Statement of Investments (continued)
April 30, 2020 (Unaudited)
Aberdeen Total Return Bond Fund
|
| Shares or |
| Value |
| ||
MUNICIPAL BONDS (5.4%) |
|
|
|
|
| ||
UNITED STATES (5.4%) |
|
|
|
|
| ||
CALIFORNIA (1.7%) |
|
|
|
|
| ||
City of San Francisco CA Public Utilities |
| $ | 685,000 |
| $ | 716,435 |
|
Los Angeles Unified School District General |
| 630,000 |
| 896,509 |
| ||
Regents of the University of California |
| 875,000 |
| 1,328,600 |
| ||
San Diego County Regional Transportation |
| 239,000 |
| 248,581 |
| ||
|
|
|
| 3,190,125 |
| ||
CONNECTICUT (0.8%) |
|
|
|
|
| ||
State of Connecticut General Obligation |
| 1,205,000 |
| 1,528,169 |
| ||
FLORIDA (0.2%) |
|
|
|
|
| ||
Country of Broward, FL Airport |
| 310,000 |
| 303,614 |
| ||
MASSACHUSETTS (0.6%) |
|
|
|
|
| ||
Massachusetts School Building Authority, |
| 1,050,000 |
| 1,082,749 |
| ||
NEW YORK (1.1%) |
|
|
|
|
| ||
New York State Dormitory Authority, |
| 535,000 |
| 524,755 |
| ||
State of New York State Thruway Authority, |
| 1,560,000 |
| 1,530,563 |
| ||
|
|
|
| 2,055,318 |
| ||
OHIO (0.4%) |
|
| �� |
|
| ||
JobsOhio Beverage System, Series A (USD), |
| 795,000 |
| 797,409 |
| ||
TEXAS (0.6%) |
|
|
|
|
| ||
Grand Parkway Transportation Corp. (USD), |
| 440,000 |
| 441,610 |
| ||
State of Texas (USD), |
| 750,000 |
| 799,425 |
| ||
|
|
|
| 1,241,035 |
| ||
|
|
|
| 10,198,419 |
| ||
Total Municipal Bonds |
|
|
| 10,198,419 |
| ||
GOVERNMENT BONDS (2.9%) |
|
|
|
|
| ||
INDONESIA (1.4%) |
|
|
|
|
| ||
Indonesia Treasury Bond |
| 15,959,000,000 |
| 1,011,186 |
| ||
Series FR65 (IDR), 6.63%, 05/15/2033 |
| 27,830,000,000 |
| 1,630,324 |
| ||
|
|
|
| 2,641,510 |
| ||
|
| Shares or |
| Value |
| ||
ITALY (0.5%) |
|
|
|
|
| ||
Republic of Italy Government |
| $ | 920,000 |
| $ | 864,916 |
|
NEW ZEALAND (1.0%) |
|
|
|
|
| ||
New Zealand Government |
| 2,521,000 |
| 1,928,247 |
| ||
Total Government Bonds |
|
|
| 5,434,673 |
| ||
U.S. AGENCIES (15.4%) |
|
|
|
|
| ||
UNITED STATES (15.4%) |
|
|
|
|
| ||
Federal Home Loan Mortgage Corp. |
| 875,000 |
| 1,024,978 |
| ||
Series K089, Class A2 (USD), |
| 827,556 |
| 967,157 |
| ||
Series 2016-HQA4, Class M2 (USD), |
| 417,650 |
| 415,710 |
| ||
MBS (USD), 4.50%, 08/01/2046 |
| 324,842 |
| 353,597 |
| ||
MBS (USD), 3.00%, 10/01/2046 |
| 623,456 |
| 671,788 |
| ||
MBS (USD), 4.00%, 01/01/2047 |
| 1,343,701 |
| 1,454,287 |
| ||
MBS (USD), 3.50%, 07/01/2049 |
| 1,130,245 |
| 1,222,042 |
| ||
MBS (USD), 3.00%, 01/01/2050 |
| 1,777,818 |
| 1,898,073 |
| ||
Federal National Mortgage Association |
| 788,730 |
| 852,815 |
| ||
MBS (USD), 3.00%, 08/01/2043 |
| 830,966 |
| 892,254 |
| ||
MBS (USD), 3.50%, 12/01/2046 |
| 2,068,681 |
| 2,242,367 |
| ||
MBS (USD), 4.50%, 12/01/2046 |
| 991,815 |
| 1,081,482 |
| ||
MBS (USD), 3.00%, 01/01/2047 |
| 2,202,055 |
| 2,369,185 |
| ||
MBS (USD), 4.00%, 07/01/2048 |
| 646,706 |
| 689,412 |
| ||
MBS (USD), 5.00%, 09/01/2048 |
| 631,779 |
| 686,312 |
| ||
MBS (USD), 4.50%, 01/01/2049 |
| 613,167 |
| 662,802 |
| ||
MBS (USD), 4.50%, 02/01/2049 |
| 594,076 |
| 648,691 |
| ||
FREMF Mortgage Trust |
| 1,037,000 |
| 955,879 |
| ||
Series 2018-K80, Class C, VRN, (USD), |
| 888,000 |
| 822,900 |
| ||
Series 2017-K71, Class C (USD), |
| 525,000 |
| 469,511 |
| ||
Government National Mortgage Association |
| 1,166,434 |
| 1,247,888 |
| ||
MBS (USD), 3.50%, 03/20/2046 |
| 1,279,183 |
| 1,377,060 |
| ||
MBS (USD), 4.50%, 06/20/2047 |
| 521,796 |
| 571,357 |
| ||
MBS (USD), 3.50%, 11/20/2047 |
| 1,015,512 |
| 1,090,604 |
| ||
MBS (USD), 3.50%, 02/20/2048 |
| 855,000 |
| 924,389 |
| ||
MBS (USD), 4.00%, 05/20/2048 |
| 1,539,421 |
| 1,679,224 |
| ||
MBS (USD), 4.00%, 05/20/2048 |
| 1,273,972 |
| 1,385,807 |
| ||
MBS (USD), 4.00%, 09/20/2048 |
| 599,597 |
| 652,199 |
| ||
|
|
|
| 29,309,770 |
| ||
Total U.S. Agencies |
|
|
| 29,309,770 |
| ||
See accompanying Notes to Financial Statements.
2020 Semi-Annual Report 24
Statement of Investments (continued)
April 30, 2020 (Unaudited)
Aberdeen Total Return Bond Fund
|
| Shares or |
| Value |
| ||
U.S. TREASURIES (14.8%) |
|
|
|
|
| ||
UNITED STATES (14.8%) |
|
|
|
|
| ||
U.S. Treasury Bond |
| $ | 4,371,800 |
| $ | 6,175,680 |
|
(USD), 2.25%, 08/15/2049 |
| 1,138,300 |
| 1,404,066 |
| ||
(USD), 2.38%, 11/15/2049 |
| 6,043,200 |
| 7,645,592 |
| ||
U.S. Treasury Note |
| 4,509,400 |
| 4,685,549 |
| ||
(USD), 2.50%, 02/15/2022 |
| 5,404,600 |
| 5,626,273 |
| ||
(USD), 1.63%, 12/15/2022 |
| 2,236,100 |
| 2,317,333 |
| ||
(USD), 1.50%, 02/15/2030 |
| 331,200 |
| 358,110 |
| ||
|
|
|
| 28,212,603 |
| ||
Total U.S. Treasuries |
|
|
| 28,212,603 |
| ||
AGENCY MORTGAGE-BACKED SECURITIES (1.5%) |
|
|
|
|
| ||
UNITED STATES (1.5%) |
|
|
|
|
| ||
Federal Home Loan Mortgage Corp. |
| 734,685 |
| 783,748 |
| ||
(USD), 5.00%, 10/01/2041 |
| 330,564 |
| 375,631 |
| ||
Federal National Mortgage Association (USD), |
| 845,148 |
| 938,743 |
| ||
Government National Mortgage |
| 648,477 |
| 712,369 |
| ||
|
|
|
| 2,810,491 |
| ||
Total Agency Mortgage-Backed Securities |
|
|
| 2,810,491 |
| ||
SHORT-TERM INVESTMENT (2.7%) |
|
|
|
|
| ||
UNITED STATES (2.7%) |
|
|
|
|
| ||
State Street Institutional U.S. Government |
| 5,088,163 |
| 5,088,163 |
| ||
Total Short-Term Investment |
|
|
| 5,088,163 |
| ||
Total Investments |
|
|
| 189,289,055 |
| ||
Other Assets in Excess of Liabilities—0.3% |
|
|
| 603,666 |
| ||
Net Assets—100.0% |
|
|
| $ | 189,892,721 |
| |
(a) Denotes a security issued under Regulation S or Rule 144A.
(b) Variable Rate Instrument. The rate shown is based on the latest available information as of April 30, 2020. Certain variable rate securities are not based on a published reference rate and spread but are determined by the issuer or agent and are based on current market conditions. These securities do not indicate a reference rate and spread in their description.
(c) Registered investment company advised by State Street Global Advisors. The rate shown is the 7 day yield as of April 30, 2020.
(d) See accompanying Notes to Financial Statements for tax unrealized appreciation/(depreciation) of securities.
AUD Australian Dollar
CAD Canadian Dollar
CLP Chilean Peso
CMT Constant Maturity Treasury
COP Colombian Peso
EUR Euro Currency
HKD Hong Kong Dollar
IDR Indonesian Rupiah
ILS Israeli Shekel
INR Indian Rupee
JPY Japanese Yen
MXN Mexican Peso
NOK Norwegian Krone
NZD New Zealand Dollar
PLC Public Limited Company
RUB Russian Ruble
USD U.S. Dollar
See accompanying Notes to Financial Statements.
2020 Semi-Annual Report 25
Statement of Investments (continued)
April 30, 2020 (Unaudited)
Aberdeen Total Return Bond Fund
At April 30, 2020, the Fund held the following futures contracts:
Futures Contracts |
| Number of |
| Expiration |
| Notional |
| Market |
| Unrealized |
|
LONG CONTRACT POSITIONS |
|
|
|
|
|
|
|
|
|
|
|
Euro BTP Futures |
| 14 |
| 06/08/2020 |
| $ 2,105,325 |
| $ 2,126,387 |
| $ 21,062 |
|
United States Treasury Note 6%—10 year |
| 3 |
| 06/19/2020 |
| 416,859 |
| 417,187 |
| 328 |
|
United States Treasury Note 6%—5 year |
| 36 |
| 06/30/2020 |
| 4,495,237 |
| 4,517,437 |
| 22,200 |
|
United States Treasury Note 6%—2 year |
| 145 |
| 06/30/2020 |
| 31,588,164 |
| 31,962,305 |
| 374,141 |
|
|
|
|
|
|
|
|
|
|
| $417,731 |
|
SHORT CONTRACT POSITIONS |
|
|
|
|
|
|
|
|
|
|
|
United States Treasury Note 6%—Ultra Bond |
| (7 | ) | 06/19/2020 |
| $ (1,563,578 | ) | $ (1,573,469 | ) | $ (9,891 | ) |
United States Treasury Note 6%—10 year |
| (26 | ) | 06/19/2020 |
| (4,013,765 | ) | (4,082,812 | ) | (69,047 | ) |
|
|
|
|
|
|
|
|
|
| $ (78,938 | ) |
|
|
|
|
|
|
|
|
|
| $338,793 |
|
At April 30, 2020, the Fund’s open forward foreign currency exchange contracts were as follows:
Purchase Contracts |
| Counterparty |
| Amount |
| Amount |
| Fair Value |
| Unrealized |
| ||
Australian Dollar/United States Dollar |
|
|
|
|
|
|
|
|
|
|
| ||
06/26/2020 |
| Goldman Sachs |
| AUD | 2,675,000 |
| USD | 1,590,344 |
| $1,743,425 |
| $ 153,081 |
|
06/26/2020 |
| HSBC Bank |
| AUD | 1,617,000 |
| USD | 970,358 |
| 1,053,876 |
| 83,518 |
|
Canadian Dollar/United States Dollar |
|
|
|
|
|
|
|
|
|
|
|
|
|
06/26/2020 |
| HSBC Bank |
| CAD | 2,700,000 |
| USD | 1,877,737 |
| 1,939,963 |
| 62,226 |
|
06/26/2020 |
| JPMorgan Chase |
| CAD | 2,815,741 |
| USD | 1,988,871 |
| 2,023,124 |
| 34,253 |
|
Chilean Peso/United States Dollar |
|
|
|
|
|
|
|
|
|
|
|
|
|
05/08/2020 |
| Barclays Bank |
| CLP | 1,628,085,559 |
| USD | 1,947,471 |
| 1,950,292 |
| 2,821 |
|
05/08/2020 |
| JPMorgan Chase |
| CLP | 1,628,085,559 |
| USD | 1,927,413 |
| 1,950,292 |
| 22,879 |
|
Colombian Peso/United States Dollar |
|
|
|
|
|
|
|
|
|
|
|
|
|
05/18/2020 |
| Goldman Sachs |
| COP | 7,309,969,000 |
| USD | 1,806,849 |
| 1,844,138 |
| 37,289 |
|
05/18/2020 |
| JPMorgan Chase |
| COP | 7,309,969,000 |
| USD | 1,803,594 |
| 1,844,138 |
| 40,544 |
|
Euro/United States Dollar |
|
|
|
|
|
|
|
|
|
|
|
|
|
05/26/2020 |
| Citibank |
| EUR | 3,157,678 |
| USD | 3,485,153 |
| 3,461,708 |
| (23,445 | ) |
05/26/2020 |
| HSBC Bank |
| EUR | 1,786,000 |
| USD | 2,025,703 |
| 1,957,961 |
| (67,742 | ) |
05/26/2020 |
| JPMorgan Chase |
| EUR | 1,786,000 |
| USD | 1,949,179 |
| 1,957,961 |
| 8,782 |
|
05/26/2020 |
| Royal Bank of Canada |
| EUR | 893,322 |
| USD | 984,484 |
| 979,334 |
| (5,150 | ) |
Hong Kong Dollar/United States Dollar |
|
|
|
|
|
|
|
|
|
|
|
|
|
05/20/2020 |
| HSBC Bank |
| HKD | 14,723,000 |
| USD | 1,898,331 |
| 1,898,758 |
| 427 |
|
Indian Rupee/United States Dollar |
|
|
|
|
|
|
|
|
|
|
|
|
|
06/26/2020 |
| HSBC Bank |
| INR | 300,000,000 |
| USD | 3,866,478 |
| 3,949,154 |
| 82,676 |
|
Indonesian Rupiah/United States Dollar |
|
|
|
|
|
|
|
|
|
|
|
|
|
05/08/2020 |
| Barclays Bank |
| IDR | 30,857,916,000 |
| USD | 1,853,885 |
| 2,059,470 |
| 205,585 |
|
07/02/2020 |
| Citibank |
| IDR | 30,707,297,000 |
| USD | 1,853,186 |
| 2,000,807 |
| 147,621 |
|
07/02/2020 |
| HSBC Bank |
| IDR | 30,707,297,000 |
| USD | 1,854,530 |
| 2,000,808 |
| 146,278 |
|
Japanese Yen/United States Dollar |
|
|
|
|
|
|
|
|
|
|
|
|
|
07/02/2020 |
| JPMorgan Chase |
| JPY | 409,400,000 |
| USD | 3,819,396 |
| 3,818,217 |
| (1,179 | ) |
Mexican Peso/United States Dollar |
|
|
|
|
|
|
|
|
|
|
|
|
|
05/08/2020 |
| Goldman Sachs |
| MXN | 46,611,000 |
| USD | 1,884,020 |
| 1,932,986 |
| 48,966 |
|
05/08/2020 |
| HSBC Bank |
| MXN | 46,611,000 |
| USD | 1,915,235 |
| 1,932,986 |
| 17,751 |
|
See accompanying Notes to Financial Statements.
2020 Semi-Annual Report |
|
Statement of Investments (continued)
April 30, 2020 (Unaudited)
Aberdeen Total Return Bond Fund
Purchase Contracts Settlement Date* |
| Counterparty |
| Amount |
| Amount |
| Fair Value |
| Unrealized |
| ||
New Russian Ruble/United States Dollar |
|
|
|
|
|
|
|
|
|
|
| ||
05/06/2020 |
| Barclays Bank |
| RUB | 297,156,000 |
| USD | 3,845,363 |
| $ 4,003,853 |
| $ 158,490 |
|
05/18/2020 |
| Citibank |
| RUB | 142,253,000 |
| USD | 1,926,764 |
| 1,911,123 |
| (15,641 | ) |
New Zealand Dollar/United States Dollar |
|
|
|
|
|
|
|
|
|
|
|
|
|
06/11/2020 |
| Citibank |
| NZD | 2,134,351 |
| USD | 1,273,211 |
| 1,308,984 |
| 35,773 |
|
06/11/2020 |
| JPMorgan Chase |
| NZD | 2,655,352 |
| USD | 1,548,376 |
| 1,628,511 |
| 80,135 |
|
Norwegian Krone/United States Dollar |
|
|
|
|
|
|
|
|
|
|
|
|
|
06/04/2020 |
| Barclays Bank |
| NOK | 3,363,446 |
| USD | 306,797 |
| 328,350 |
| 21,553 |
|
06/04/2020 |
| HSBC Bank |
| NOK | 42,256,383 |
| USD | 4,248,657 |
| 4,125,201 |
| (123,456 | ) |
06/04/2020 |
| JPMorgan Chase |
| NOK | 18,006,386 |
| USD | 1,896,528 |
| 1,757,840 |
| (138,688 | ) |
06/04/2020 |
| Royal Bank of Canada |
| NOK | 8,529,138 |
| USD | 809,782 |
| 832,641 |
| 22,859 |
|
|
|
|
|
|
|
|
|
|
| $58,195,901 |
| $ 1,038,206 |
|
Sale Contracts Settlement Date* |
| Counterparty |
| Amount |
| Amount |
| Fair Value |
| Unrealized |
| ||
United States Dollar/Australian Dollar |
|
|
|
|
|
|
|
|
|
|
| ||
06/26/2020 |
| Citibank |
| USD | 1,019,343 |
| AUD | 1,636,000 |
| $ 1,066,259 |
| $ (46,916 | ) |
06/26/2020 |
| JPMorgan Chase |
| USD | 1,683,659 |
| AUD | 2,656,000 |
| 1,731,041 |
| (47,382 | ) |
United States Dollar/Canadian Dollar |
|
|
|
|
|
|
|
|
|
|
|
|
|
06/26/2020 |
| JPMorgan Chase |
| USD | 3,928,341 |
| CAD | 5,515,741 |
| 3,963,087 |
| (34,746 | ) |
United States Dollar/Chilean Peso |
|
|
|
|
|
|
|
|
|
|
|
|
|
05/08/2020 |
| Citibank |
| USD | 1,934,742 |
| CLP | 1,628,085,559 |
| 1,950,292 |
| (15,550 | ) |
05/08/2020 |
| HSBC Bank |
| USD | 1,916,861 |
| CLP | 1,628,085,559 |
| 1,950,292 |
| (33,431 | ) |
United States Dollar/Colombian Peso |
|
|
|
|
|
|
|
|
|
|
|
|
|
05/18/2020 |
| Citibank |
| USD | 3,710,247 |
| COP | 14,619,938,000 |
| 3,688,277 |
| 21,970 |
|
United States Dollar/Euro |
|
|
|
|
|
|
|
|
|
|
|
|
|
05/26/2020 |
| Citibank |
| USD | 2,492,804 |
| EUR | 2,264,356 |
| 2,482,375 |
| 10,429 |
|
05/26/2020 |
| HSBC Bank |
| USD | 2,291,705 |
| EUR | 2,106,914 |
| 2,309,773 |
| (18,068 | ) |
05/26/2020 |
| JPMorgan Chase |
| USD | 1,912,820 |
| EUR | 1,752,322 |
| 1,921,041 |
| (8,221 | ) |
05/26/2020 |
| Royal Bank of Canada |
| USD | 1,884,616 |
| EUR | 1,713,408 |
| 1,878,380 |
| 6,236 |
|
United States Dollar/Indian Rupee |
|
|
|
|
|
|
|
|
|
|
|
|
|
06/26/2020 |
| Citibank |
| USD | 1,900,659 |
| INR | 150,000,000 |
| 1,974,577 |
| (73,918 | ) |
06/26/2020 |
| JPMorgan Chase |
| USD | 1,949,571 |
| INR | 150,000,000 |
| 1,974,577 |
| (25,006 | ) |
United States Dollar/Indonesian Rupiah |
|
|
|
|
|
|
|
|
|
|
|
|
|
05/08/2020 |
| Citibank |
| USD | 1,922,612 |
| IDR | 30,857,916,000 |
| 2,059,470 |
| (136,858 | ) |
07/02/2020 |
| Barclays Bank |
| USD | 1,775,194 |
| IDR | 30,707,297,000 |
| 2,000,808 |
| (225,614 | ) |
07/02/2020 |
| JPMorgan Chase |
| USD | 1,765,802 |
| IDR | 30,707,297,000 |
| 2,000,808 |
| (235,006 | ) |
07/16/2020 |
| Barclays Bank |
| USD | 637,193 |
| IDR | 10,026,236,600 |
| 651,054 |
| (13,861 | ) |
07/16/2020 |
| HSBC Bank |
| USD | 1,407,663 |
| IDR | 22,670,410,318 |
| 1,472,105 |
| (64,442 | ) |
07/16/2020 |
| JPMorgan Chase |
| USD | 469,976 |
| IDR | 7,554,878,125 |
| 490,576 |
| (20,600 | ) |
07/23/2020 |
| Barclays Bank |
| USD | 1,870,376 |
| IDR | 30,225,288,443 |
| 1,959,919 |
| (89,543 | ) |
United States Dollar/Israeli Shekel |
|
|
|
|
|
|
|
|
|
|
|
|
|
05/28/2020 |
| HSBC Bank |
| USD | 1,904,767 |
| ILS | 6,664,000 |
| 1,912,855 |
| (8,088 | ) |
United States Dollar/Japanese Yen |
|
|
|
|
|
|
|
|
|
|
|
|
|
07/02/2020 |
| Royal Bank of Canada |
| USD | 1,909,578 |
| JPY | 206,510,000 |
| 1,925,989 |
| (16,411 | ) |
United States Dollar/Mexican Peso |
|
|
|
|
|
|
|
|
|
|
|
|
|
05/08/2020 |
| Citibank |
| USD | 1,934,808 |
| MXN | 46,611,000 |
| 1,932,986 |
| 1,822 |
|
05/08/2020 |
| Royal Bank of Canada |
| USD | 1,937,656 |
| MXN | 46,611,000 |
| 1,932,986 |
| 4,670 |
|
See accompanying Notes to Financial Statements.
| 2020 Semi-Annual Report |
Statement of Investments (concluded)
April 30, 2020 (Unaudited)
Aberdeen Total Return Bond Fund
Sale Contracts |
| Counterparty |
| Amount |
| Amount |
| Fair Value |
| Unrealized |
| ||
United States Dollar/New Russian Ruble |
|
|
|
|
|
|
|
|
|
|
| ||
05/06/2020 |
| Citibank |
| USD | 1,942,072 |
| RUB | 147,345,000 |
| $ 1,985,313 |
| $ (43,241 | ) |
05/06/2020 |
| Goldman Sachs |
| USD | 1,962,066 |
| RUB | 149,117,000 |
| 2,009,189 |
| (47,123 | ) |
05/18/2020 |
| Citibank |
| USD | 1,899,239 |
| RUB | 142,253,000 |
| 1,911,123 |
| (11,884 | ) |
United States Dollar/New Zealand Dollar |
|
|
|
|
|
|
|
|
|
|
|
|
|
06/11/2020 |
| Barclays Bank |
| USD | 3,042,706 |
| NZD | 4,737,351 |
| 2,905,387 |
| 137,319 |
|
06/11/2020 |
| Royal Bank of Canada |
| USD | 2,715,488 |
| NZD | 4,475,000 |
| 2,744,489 |
| (29,001 | ) |
United States Dollar/Norwegian Krone |
|
|
|
|
|
|
|
|
|
|
|
|
|
06/04/2020 |
| Citibank |
| USD | 1,892,385 |
| NOK | 17,600,000 |
| 1,718,167 |
| 174,218 |
|
06/04/2020 |
| Goldman Sachs |
| USD | 2,079,987 |
| NOK | 21,305,216 |
| 2,079,882 |
| 105 |
|
06/04/2020 |
| Royal Bank of Canada |
| USD | 3,552,936 |
| NOK | 33,250,137 |
| 3,245,983 |
| 306,953 |
|
|
|
|
|
|
|
|
|
|
| $63,829,060 |
| $ (581,188 | ) |
Total unrealized appreciation on open forward foreign currency exchange contracts |
|
|
|
|
|
| $ 2,077,229 |
| |||||
Total unrealized depreciation on open forward foreign currency exchange contracts |
|
|
|
|
|
| $(1,620,211 | ) | |||||
* Certain contracts with different trade dates and like characteristics have been shown net.
See accompanying Notes to Financial Statements.
2020 Semi-Annual Report |
|
Aberdeen Global High Income Fund (Unaudited)
Aberdeen Global High Income Fund (Institutional Class shares net of fees) returned –9.12% for the six-month period ended April 30, 2020, versus the –7.48% return of its benchmark, the ICE Bank of America (BofA) Global High Yield Constrained Index (hedged to U.S. dollars), during the same period.
Global financial markets experienced significant bouts of volatility during the six-month period ended April 30, 2020. Over the first half of the reporting period, investor sentiment was bolstered by generally positive economic data reports and news of a “phase one” agreement in the U.S.-China trade dispute. However, in February and March 2020, global financial markets experienced the quickest bearish turn on record. In March, the spread of the coronavirus (COVID-19) pandemic beyond Asia forced many countries from Europe to the U.S. to essentially shut down. The oil-price war by the Organization of the Petroleum Exporting Countries (OPEC) intensified fear of a bankruptcy wave in the energy sector and beyond. Extremely weak economic data from China and a more than tenfold jump in U.S. initial jobless claims shed light on the unprecedented shock to the global economy from both the supply and demand sides of the economic coin. The daunting prospect of a fiscal and monetary policy-induced deep recession ignited a financial crisis which, to some extent, was more severe than that during the global financial crisis (GFC) of the late 2000s. The spike in volatility in global government bond markets and credit spreads due to liquidity crunch and malfunctioning of the market was more pronounced. Consequently, the global high-yield market, as measured by the ICE BofA Global High Yield Constrained Index, experienced its second-worst month ever in March 2020, with spreads widening to a level not seen since that of the GFC. While lower-quality credit underperformed during the selloff in March, higher-quality issues were not immune from the carnage, as fund managers, in an effort to meet redemptions, were forced to sell what they could, not what they wanted.
Global policymakers scrambled – repeatedly and with unseen speed and scale – to mitigate the economic and financial fallout from the pandemic and related containment measures. The U.S. Federal Reserve’s (Fed) two emergency interest-rate cuts in March 2020, reduced the federal funds rate by an aggregate of 150 basis points (bps) to a range of 0% to 0.25%. The Fed also expanded its quantitative easing program, not only in “unlimited” quantity to government-related instruments, but also to include investment-grade1 corporate bonds for the first time. The Fed also allowed for the purchase of select “fallen angels”2 and high-yield exchange-traded funds (ETFs). The central bank’s action represented a sharp departure from the provisions in its Term Asset-Backed Securities Loan Facility (TALF) implemented during the GFC in 2008. An unfolding labor market crisis led the U.S. Congress to pass a third relief package totaling more than $2 trillion. The package included funding for the Fed to leverage lending to corporations; loan/grants to small- and
medium-sized enterprises (SMEs); direct cash payments to individuals; tax breaks; expanded unemployment benefits; and aid to healthcare providers and state and local governments. The European Central Bank (ECB) also announced a €750 billion (roughly US$819 billion) emergency purchase program with no limits on further commitments, although it surprised investors by keeping the federal funds rate unchanged. The aggressive monetary and fiscal policy supports helped spur a rally in the high-yield market, allowing it to recover some of it losses. Inflows into the global high-yield market more than reversed the strong outflows seen at the depth of the crisis. The new-issue market also opened as well, initially with senior secured issuance and then unsecured issues began to access the market as well with over US$37 billion of issuance in April 2020 alone.3
Despite its focus on higher-quality credits, the Fund underperformed relative to its benchmark, the ICE BofA Global High Yield Constrained Index, over the reporting period due to the weak performance of several individual holdings, as well as overall security selection in both the leisure and banking sectors. In contrast, overweight positions in defensive sectors such as telecommunications, as well as security selection and the underweight allocation to capital goods, contributed positively to Fund performance. However, this was not enough to offset the weakness in the leisure and banking sectors.
While we viewed the Fund’s positioning within the leisure sector as conservative, with holdings in the debt of companies with distinctive business models or defensive market positions, we believe that the COVID-19 pandemic will have a lasting impact on this sector. This is particularly applicable to companies whose customers require air travel to reach their destinations. These credits underperformed during the market selloff, and we subsequently reduced the Fund’s positions in these companies. We maintain our conviction in theme parks, which historically have performed well in economic recessions and are served by guests who primarily drive to the parks.
Additionally, the Fund’s positions in the banking sector detracted from performance for the reporting period as investors sold subordinated bonds of European banks. We believe that this was likely more of a reflection on the relative liquidity of the bonds, with fund managers seeking to raise cash to meet outflows, than fundamental credit concerns. Despite the challenges that the coronavirus may pose to banks, we maintain our view that banks are well positioned to weather the impact of the disease and the resulting recession.
To a lesser degree, the Fund’s holdings in the energy sector also had a negative impact on performance for the reporting period despite the relatively conservative positioning, with an underweight to the oilfield services subsector and generally a mix of shorter-dated and higher-quality issuers. However, with the record drop in oil prices in April, the Fund’s holdings did not perform as well as we had anticipated. While many of the issues rallied in May 2020 in light of better oil prices,
1 | Companies whose bonds are rated as “investment-grade’“ have a lower chance of defaulting on their debt than those rated as “non-investment grade.” Bonds rated BBB or above by credit rating agencies Standard and Poor’s and Fitch or Baa3 or above by Moody’s are classified as investment-grade. |
2 | “Fallen angels” are bonds that were initially assigned an investment-grade rating but have since been reduced to below-investment-grade status. Companies whose bonds are rated as “investment-grade” usually have a lower chance of defaulting on their debt than those rated as “non-investment grade.” These bonds generally are issued by long-established companies with strong balance sheets. Bonds rated BBB or above by major credit rating agencies are considered investment-grade. |
3 | Source: Lipper Analytical Services, May 2020 |
| 2020 Semi-Annual Report |
Aberdeen Global High Income Fund (Unaudited) (continued)
there were several securities that remained at depressed prices as even-higher oil prices are required foe these issues to recover. We maintain the Fund’s positions in these companies as we believe that their upside potential outweighs the downside at their current prices.
The Fund was active in new issuance during the period. Before the market volatility hit in March, we initiated holdings in Netherlands-based cable operator Ziggo N.V.; Chinese homebuilder CIFI Holdings (Group) Co. Ltd.; and three U.S.-based companies: homebuilder MI Homes Inc., credit card payment-processing services provider ADS Solutions Corp., and gaming-focused real estate investment trust (REIT) Vici Properties Inc. Following the market volatility, the Fund participated in the new issues of two fallen angels: Germany-based auto parts producer ZF Friedrichshafen AG, and U.S.-based automaker Ford Motor Co. The Fund also participated in new issues from investment-grade-rated hotel operator Marriott International Inc., and aerospace company Howmet Aerospace Inc.
Furthermore, in the secondary market, we initiated positions in several U.S.-based investment-grade-rated companies, including oil pipeline operator Western Midstream Partners, LP, chemicals company, Huntsman Corp., and oil and gas production company Continental Resources Inc., at spreads similar to those of BB rated4 securities. Following the steep decline in oil prices, the debt of Continental Resources and Western Midstream Partners were downgraded to high-yield ratings. We also initiated positions in Italian bank Banca Monte Dei Paschi di Siena S.p.A. and U.S.-based telecommunications company Cincinnati Bell Inc. We added to the Fund’s existing holdings in two U.S.-based companies, cable diversified telecommunications Cablevision Corp. and photo printing services company Shutterfly Inc., printing company Cimpress PLC, and Brazilian protein processor JBS S.A.
We reduced the Fund’s positions in the following U.S.-based companies as we believed that they had relatively high valuations: financial data services provider MSCI Inc.; rental car company Avis Budget Group Inc.; tire producer Goodyear Tire & Rubber Co.; casino operator MGM Resorts International; and independent power producer Calpine Corp. We also exited the Fund’s position in U.S.-based media company Graham Holdings Co. as we believed that it had poor relative value and a weaker business outlook. After the COVID-19 lockdown, we exited the Fund’s positions in Delta Airlines Inc. and radio broadcasting company Cumulous Media Inc., due to what we view as longer-term negative impacts on the company’s businesses. For Delta, we believe that air travel will take a while to recover, especially the most profitable transatlantic flights. Regarding Cumulous, we were concerned about the health of the small businesses that typically purchase advertising on the company’s television stations, as well as the company’s limited liquidity position. We employed derivatives over the reporting period that did not
materially impact the total return of the fund for the six month period ended April 30th.
Regarding the use of derivatives, the Fund employed foreign exchange forwards5 during the reporting period to hedge its exposure to changes in the value of its holdings due to movements in currency exchange rates. The use of foreign exchange forwards had a negative impact on the Fund’s total return for the six-month period ended April 30, 2020.
In our view, the actions by central banks and governments worldwide have reduced the severity of the liquidity crises that many companies are facing due to the coronavirus-related shutdowns. However, we believe that, if these companies secure additional liquidity by taking on more debt, whether it is through new bond issuance or drawing on their revolving credit lines, it ultimately will lead to more leverage for these companies. Combined with expectations of economic activity remaining below the pre-COVID-19 levels for an extended period of time, companies could find that they avoided a liquidity crisis, yet find themselves in a solvency crisis. This situation is exacerbated because high-yield issuers generally entered the current crisis with relatively high leverage.
As we begin to see data on the recovery, we will continually re-evaluate how post-coronavirus economic activity and the behavior of companies and consumers will affect sectors and issuers within the high-yield market. We believe that debt defaults will remain elevated. Our challenge is to avoid sectors and companies for which we believe that investors have underestimated the risks and to identify companies where the market has been too punitive. Following the global high-yield rally in April 2020, we believe that the higher-quality portion of the market does not offer the overall value that it had earlier; however, we are still finding what we view as pockets of value in both lower-rated investment-grade (primarily in the BBB segment) and higher-rated high-yield credits. We are looking at the lower-quality portion of the market for value as well, but generally, until there is more clarity on the nature of the recovery and we see which companies are relatively stronger and weaker performers, we believe that our higher-quality bias in the Fund’s portfolio is warranted.
Portfolio Management:
Global High Yield Team
PAST PERFORMANCE DOES NOT GUARANTEE FUTURE RESULTS.
The performance quoted represents past performance, which does not guarantee future results. Class A Shares pay a Rule 12b-1 fee of up to 0.25% of net assets. The investment return and principal value of an investment will fluctuate so that an investor’s shares, when redeemed, may be worth more or less than their original cost. Current performance of the Fund may be lower or higher than the performance quoted. Performance data current to the most recent month-end may be obtained by calling 866-667-9231 or visiting www.aberdeenstandard.com/en-us/us/investor/fund-centre.
4 | Moody’s, Standard & Poor’s (S&P) and Fitch are international credit rating agencies. Moody’s assigns a rating from ‘Aaa’ to ‘C’, with ‘Aaa’ being the highest quality and ‘C’ the lowest quality. S&P’s and Fitch’s ratings are expressed as letter grades that range from “AAA” to “D” to communicate each agency’s opinion of relative level of credit risk. Ratings from ‘AA’ to ‘CCC’ may be modified by the addition of a plus (+) or minus (-) sign to show relative standing within the major rating categories. The investment grade category is a rating from AAA to BBB-. |
5 | A foreign exchange forward is a binding contract in the foreign exchange market that locks in the exchange rate for the purchase or sale of a currency on a future date. |
2020 Semi-Annual Report |
|
Aberdeen Global High Income Fund (Unaudited) (concluded)
Investing in mutual funds involves risk, including the possible loss of principal. There is no assurance that the investment objective of any fund will be achieved. Indexes are unmanaged and have been provided for comparison purposes only. No fees or expenses are reflected. You cannot invest directly in an index.
Risk Considerations
Fixed income securities are subject to certain risks including, but not limited to: interest rate (changes in interest rates may cause a decline in the market value of an investment), credit (changes in the financial condition of the issuer, borrower, counterparty, or underlying collateral), prepayment (debt issuers may repay or refinance their loans or obligations earlier than anticipated), and extension (principal repayments may not occur as quickly as anticipated, causing the expected maturity of a security to increase).
Non-investment-grade debt securities (high yield/junk bonds) may be subject to greater market fluctuations, risk of default or loss of income and principal than higher-rated securities.
The Fund may use derivatives as a substitute for taking a position or reducing exposure to underlying assets. Derivatives are speculative and may hurt the Fund’s performance.
Foreign securities may be more volatile, harder to price and less liquid than U.S. securities. They are subject to different accounting and regulatory standards and currency exchange rate, political and economic risks. Fluctuation in currency exchange rates may impact a Fund’s returns more greatly to the extent a Fund does not hedge currency exposure or hedging techniques are unsuccessful. The foregoing risks are enhanced in emerging market countries.
Investing a significant portion of the Fund’s assets in securities of companies conducting business in a broadly related group of industries within an economic sector may make the Fund more vulnerable to unfavorable developments in that sector.
Please read the prospectus for more detailed information regarding these and other risks.
Aberdeen Global High Income Fund (Unaudited)
Average Annual Total Return (For periods ended April 30, 2020) |
| Six |
| 1 Yr. |
| 5 Yr. |
| 10 Yr. |
|
Class A |
| (9.28%) |
| (5.93%) |
| 0.54% |
| 3.44% |
|
Institutional Class |
| (9.12%) |
| (5.60%) |
| 0.81% |
| 3.70% |
|
Performance of a $10,000 Investment (as of April 30, 2020)
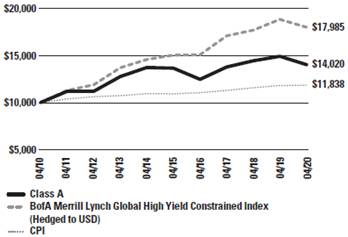
Comparative performance of $10,000 invested in Class A shares of the Aberdeen Global High Income Fund, ICE Bank of America Merrill Lynch Global High Yield Constrained Index (Hedged to USD) and the Consumer Price Index (CPI) over a 10-year period ended April 30, 2020. Unlike the Fund’s returns, the returns for these unmanaged indexes do not reflect any fees or expenses. Investors cannot invest directly in market indexes.
The ICE Bank of America Merrill Lynch Global High Yield Constrained Index (Hedged to the USD) tracks the performance of USD, CAD, GBP and EUR denominated below investment grade corporate debt publicly issued in the major domestic or eurobond markets but caps issuer exposure at 2%.
The CPI is a measure of the average change over time in the prices paid by urban consumers for a market basket of consumer goods and services.
Investment return and principal value will fluctuate, and when redeemed, shares may be worth more or less than original cost. Past performance is no guarantee of future results. The Average Annual Total Return table and performance graph do not reflect the deduction of taxes that a shareholder would pay on Fund distributions or the redemption of Fund shares. Investing in mutual funds involves market risk, including loss of principal. Performance returns assume the reinvestment of all distributions. Performance returns reflect fee waivers and reimbursements in effect without which returns would have been lower.
2020 Semi-Annual Report |
|
Aberdeen Global High Income Fund (Unaudited)
Portfolio Summary (as a percentage of net assets)
April 30, 2020 (Unaudited)
Asset Allocation |
|
|
|
Corporate Bonds |
| 91.7% |
|
Money Market Funds |
| 4.3% |
|
Bank Loans |
| 1.5% |
|
Common Stocks |
| –% |
|
Other Assets in Excess of Liabilities |
| 2.5% |
|
|
| 100.0% |
|
Amounts listed as “–“ are 0% or round to 0%.
The following chart summarizes the composition of the Fund’s portfolio, expressed as a percentage of net assets. The industries listed below may include more than one industry group. As of April 30, 2020, the Fund did not have more than 25% of its assets invested in any industry group.
Top Industries |
|
|
|
Media |
| 11.4% |
|
Diversified Telecommunication Services |
| 11.1% |
|
Commercial Banks |
| 7.3% |
|
Oil, Gas & Consumable Fuels |
| 6.3% |
|
Energy Equipment & Services |
| 4.1% |
|
Healthcare Providers & Services |
| 3.7% |
|
Diversified Financial Services |
| 3.6% |
|
Real Estate Investment Trust (REIT) Funds |
| 2.7% |
|
Metals & Mining |
| 2.6% |
|
Pharmaceutical |
| 2.6% |
|
Other |
| 44.6% |
|
|
| 100.0% |
|
Top Holdings |
|
|
|
Telecom Italia Capital SA 09/30/2034 |
| 1.4% |
|
IWH UK Midco Limited, EUR Term Loan B 01/31/2025 |
| 1.2% |
|
MDC Holdings, Inc. 01/15/2043 |
| 1.2% |
|
Photo Holdings Merger Sub, Inc. 10/01/2026 |
| 1.2% |
|
CSC Holdings LLC 10/15/2025 |
| 1.2% |
|
j2 Cloud Services LLC / j2 Global Co-Obligor, Inc. 07/15/2025 |
| 1.1% |
|
Petrobras Global Finance BV 01/15/2030 |
| 1.0% |
|
Parsley Energy LLC / Parsley Finance Corp. 10/15/2027 |
| 1.0% |
|
Sprint Corp. 09/15/2023 |
| 1.0% |
|
Huntsman International LLC 05/01/2029 |
| 1.0% |
|
Other |
| 88.7% |
|
|
| 100.0% |
|
Top Countries |
|
|
|
United States |
| 53.4% |
|
Netherlands |
| 5.1% |
|
United Kingdom |
| 4.8% |
|
France |
| 2.8% |
|
Luxembourg |
| 2.6% |
|
Italy |
| 2.4% |
|
Germany |
| 2.2% |
|
Turkey |
| 2.0% |
|
China |
| 1.9% |
|
Brazil |
| 1.9% |
|
Other |
| 20.9% |
|
|
| 100.0% |
|
Statement of Investments
April 30, 2020 (Unaudited)
Aberdeen Global High Income Fund
|
| Shares or |
| Value |
| ||
CORPORATE BONDS (91.7%) |
|
|
|
|
| ||
ARGENTINA (0.3%) |
|
|
|
|
| ||
Transportadora de Gas del Sur SA (USD), 6.75%, 05/02/2025 (a) |
| $ | 575,000 |
| $ | 421,193 |
|
AUSTRALIA (0.6%) |
|
|
|
|
| ||
Mineral Resources Ltd.(USD), 8.13%, 05/01/2027 (a) |
| 882,000 |
| 907,357 |
| ||
BRAZIL (1.9%) |
|
|
|
|
| ||
CSN Resources SA |
|
|
|
|
| ||
(USD), 7.63%, 02/13/2023 (a) |
| 465,000 |
| 365,025 |
| ||
(USD), 7.63%, 04/17/2026 (a) |
| 314,000 |
| 222,940 |
| ||
NBM US Holdings, Inc. (USD), 7.00%, 05/14/2026 (a) |
| 669,000 |
| 643,913 |
| ||
Petrobras Global Finance BV (USD), 5.09%, 01/15/2030 (a) |
| 1,685,000 |
| 1,535,877 |
| ||
|
|
|
| 2,767,755 |
| ||
CANADA (1.3%) |
|
|
|
|
| ||
Clearwater Seafoods, Inc. (USD), 6.88%, 05/01/2025 (a) |
| 1,370,000 |
| 1,250,139 |
| ||
Teck Resources Ltd. (USD), 6.25%, 07/15/2041 |
| 691,000 |
| 649,866 |
| ||
|
|
|
| 1,900,005 |
| ||
CHINA (1.9%) |
|
|
|
|
| ||
CIFI Holdings Group Co. Ltd. (USD), 6.45%, 11/07/2024 (a) |
| 1,060,000 |
| 1,035,230 |
| ||
Shimao Property Holdings Ltd. (USD), 5.20%, 01/30/2025 (a) |
| 1,045,000 |
| 1,034,550 |
| ||
Sunac China Holdings Ltd. (USD), 7.95%, 10/11/2023 (a) |
| 825,000 |
| 811,598 |
| ||
|
|
|
| 2,881,378 |
| ||
CONGO (0.4%) |
|
|
|
|
| ||
HTA Group Ltd. (USD), 9.13%, 03/08/2022 (a) |
| 560,000 |
| 551,040 |
| ||
DENMARK (0.6%) |
|
|
|
|
| ||
DKT Finance ApS (USD), 9.38%, 06/17/2023 (a) |
| 921,000 |
| 916,855 |
| ||
DOMINICAN REPUBLIC (0.4%) |
|
|
|
|
| ||
AES Andres BV / Dominican Power Partners / Empresa Generadora de Electricidad It (USD), 7.95%, 05/11/2026 (a) |
| 765,000 |
| 658,864 |
| ||
EL SALVADOR (0.3%) |
|
|
|
|
| ||
AES El Salvador Trust II (USD), 6.75%, 03/28/2023 (a) |
| 500,000 |
| 435,000 |
| ||
FRANCE (1.5%) |
|
|
|
|
| ||
Altice France SA |
|
|
|
|
| ||
(EUR), 2.50%, 01/15/2025 (a) |
| 103,000 |
| 106,416 |
| ||
(USD), 7.38%, 05/01/2026 (a) |
| 978,000 |
| 1,022,010 |
| ||
Casino Guichard Perrachon SA |
|
|
|
|
| ||
(EUR), 4.56%, 01/25/2023 (a) |
| 400,000 |
| 414,850 |
| ||
(EUR), 4.50%, 03/07/2024 (a) |
| 400,000 |
| 390,123 |
| ||
Quatrim SASU |
|
|
|
|
| ||
(EUR), 5.88%, 01/15/2024 (a) |
| 310,000 |
| 344,554 |
| ||
|
|
|
| 2,277,953 |
| ||
|
| Shares or |
| Value |
| ||
GEORGIA (0.3%) |
|
|
|
|
| ||
Bank of Georgia JSC (USD), 6.00%, 07/26/2023 (a) |
| $ | 500,000 |
| $ | 492,600 |
|
GERMANY (2.2%) |
|
|
|
|
| ||
Nidda BondCo GmbH (EUR), 5.00%, 09/30/2025 (a) |
| 305,000 |
| 315,143 |
| ||
Nidda Healthcare Holding GmbH (EUR), 3.50%, 09/30/2024 (a) |
| 623,000 |
| 660,075 |
| ||
Techem Verwaltungsgesellschaft 675 mbH (EUR), 2.00%, 07/15/2025 (a) |
| 699,000 |
| 723,869 |
| ||
Tele Columbus AG (EUR), 3.88%, 05/02/2025 (a) |
| 984,000 |
| 902,141 |
| ||
ZF Europe Finance BV |
|
|
|
|
| ||
(EUR), 2.00%, 02/23/2026 (a) |
| 300,000 |
| 292,181 |
| ||
(EUR), 2.50%, 10/23/2027 (a) |
| 300,000 |
| 292,412 |
| ||
|
|
|
| 3,185,821 |
| ||
ISRAEL (1.3%) |
|
|
|
|
| ||
Teva Pharmaceutical Finance Co. BV, Series 2 (USD), 3.65%, 11/10/2021 |
| 1,400,000 |
| 1,361,500 |
| ||
Teva Pharmaceutical Finance Netherlands III BV (USD), 3.15%, 10/01/2026 |
| 670,000 |
| 582,900 |
| ||
|
|
|
| 1,944,400 |
| ||
ITALY (2.4%) |
|
|
|
|
| ||
Banca Monte dei Paschi di Siena SpA, (fixed rate to 01/18/2023, variable rate thereafter) (EUR), 5.38%, 01/18/2028 (a) |
| 1,500,000 |
| 975,567 |
| ||
Telecom Italia Capital SA (USD), 6.00%, 09/30/2034 |
| 1,950,000 |
| 2,020,005 |
| ||
UniCredit SpA, (fixed rate to 06/03/2023, variable rate thereafter) (EUR), 6.63%, 06/03/2023 (a)(b) |
| 530,000 |
| 514,008 |
| ||
|
|
|
| 3,509,580 |
| ||
JAMAICA (0.4%) |
|
|
|
|
| ||
Digicel Group One Ltd. (USD), 8.25%, 12/30/2022 (a) |
| 930,000 |
| 548,700 |
| ||
JERSEY (0.6%) |
|
|
|
|
| ||
Newday Bondco PLC (GBP), 7.38%, 02/01/2024 (a) |
| 975,000 |
| 833,511 |
| ||
LUXEMBOURG (2.6%) |
|
|
|
|
| ||
Altice Financing SA (USD), 7.50%, 05/15/2026 (a) |
| 1,035,000 |
| 1,081,575 |
| ||
Altice France Holding SA |
|
|
|
|
| ||
(EUR), 8.00%, 05/15/2027 (a) |
| 283,000 |
| 314,642 |
| ||
(USD), 10.50%, 05/15/2027 (a) |
| 579,000 |
| 623,931 |
| ||
Galapagos SA (EUR), 5.38%, 06/15/2021 (a)(c) |
| 60,500 |
| 66 |
| ||
Intelsat Jackson Holdings SA (USD), 5.50%, 08/01/2023 |
| 1,035,000 |
| 562,134 |
| ||
Kleopatra Holdings 1 SCA (EUR), 9.25%, 06/30/2023 (a)(d) |
| 872,693 |
| 380,855 |
| ||
LHMC Finco 2 Sarl (EUR), 7.25%, 10/02/2025 (a)(d) |
| 250,000 |
| 127,393 |
| ||
Matterhorn Telecom SA (EUR), 3.13%, 09/15/2026 (a) |
| 662,000 |
| 707,316 |
| ||
|
|
|
| 3,797,912 |
| ||
Statement of Investments (continued)
April 30, 2020 (Unaudited)
Aberdeen Global High Income Fund
|
| Shares or |
| Value |
| ||
CORPORATE BONDS (continued) |
|
|
|
|
| ||
MEXICO (1.5%) |
|
|
|
|
| ||
Petroleos Mexicanos |
|
|
|
|
| ||
(USD), 6.49%, 01/23/2027 (a) |
| $ | 1,000,000 |
| $ | 813,000 |
|
(USD), 5.35%, 02/12/2028 |
| 1,115,000 |
| 830,686 |
| ||
Sixsigma Networks Mexico SA de CV (USD), 7.50%, 05/02/2025 (a) |
| 750,000 |
| 568,125 |
| ||
|
|
|
| 2,211,811 |
| ||
NETHERLANDS (5.1%) |
|
|
|
|
| ||
ING Groep NV, (fixed rate to 04/16/2025, variable rate thereafter) (USD), 6.50%, 04/16/2025 (b) |
| 1,027,000 |
| 1,018,270 |
| ||
Lincoln Financing SARL |
|
|
|
|
| ||
(EUR), 3.63%, 04/01/2024 (a) |
| 743,000 |
| 691,566 |
| ||
(EUR), 3.88%, 04/01/2024 (a)(e) |
| 166,000 |
| 156,729 |
| ||
OCI NV |
|
|
|
|
| ||
(EUR), 3.13%, 11/01/2024 (a) |
| 741,000 |
| 788,476 |
| ||
(USD), 5.25%, 11/01/2024 (a) |
| 470,000 |
| 463,025 |
| ||
Trivium Packaging Finance BV (USD), 5.50%, 08/15/2026 (a) |
| 1,135,000 |
| 1,163,375 |
| ||
UPCB Finance VII Ltd. (EUR), 3.63%, 06/15/2029 (a) |
| 1,016,000 |
| 1,097,707 |
| ||
Ziggo Bond Co. BV |
|
|
|
|
| ||
(EUR), 3.38%, 02/28/2030 (a) |
| 732,000 |
| 754,032 |
| ||
(USD), 5.13%, 02/28/2030 (a) |
| 200,000 |
| 197,000 |
| ||
Ziggo BV (USD), 5.50%, 01/15/2027 (a) |
| 1,169,000 |
| 1,189,107 |
| ||
|
|
|
| 7,519,287 |
| ||
NIGERIA (0.5%) |
|
|
|
|
| ||
IHS Netherlands Holdco BV (USD), 8.00%, 09/18/2027 (a) |
| 760,000 |
| 691,600 |
| ||
PANAMA (0.6%) |
|
|
|
|
| ||
C&W Senior Financing DAC (USD), 6.88%, 09/15/2027 (a) |
| 879,000 |
| 868,013 |
| ||
PORTUGAL (0.4%) |
|
|
|
|
| ||
Caixa Geral de Depositos SA, (fixed rate to 03/30/2022, variable rate thereafter) (EUR), 10.75%, 03/30/2022 (a)(b) |
| 600,000 |
| 669,016 |
| ||
REPUBLIC OF IRELAND (1.3%) |
|
|
|
|
| ||
Ardagh Packaging Finance PLC / Ardagh Holdings USA, Inc. (GBP), 4.75%, 07/15/2027 (a) |
| 656,000 |
| 797,768 |
| ||
Cimpress PLC (USD), 7.00%, 06/15/2026 (a) |
| 1,580,000 |
| 1,147,238 |
| ||
|
|
|
| 1,945,006 |
| ||
SOUTH AFRICA (1.1%) |
|
|
|
|
| ||
Liquid Telecommunications Financing PLC (USD), 8.50%, 07/13/2022 (a) |
| 1,150,000 |
| 975,775 |
| ||
Sappi Papier Holding GmbH (USD), 7.50%, 06/15/2032 (a)(f) |
| 709,000 |
| 673,550 |
| ||
|
|
|
| 1,649,325 |
| ||
|
| Shares or |
| Value |
| ||
SPAIN (0.9%) |
|
|
|
|
| ||
Banco Bilbao Vizcaya Argentaria SA, Series 9 (fixed rate to 03/05/2025, variable rate thereafter) (USD), 6.50%, 03/05/2025 (b) |
| $ | 800,000 |
| $ | 727,000 |
|
Cirsa Finance International Sarl |
|
|
|
|
| ||
(USD), 7.88%, 12/20/2023 (a) |
| 361,000 |
| 292,879 |
| ||
(EUR), 3.63%, 09/30/2025 (a)(e) |
| 408,000 |
| 330,859 |
| ||
|
|
|
| 1,350,738 |
| ||
SWEDEN (1.7%) |
|
|
|
|
| ||
Intrum AB |
|
|
|
|
| ||
(EUR), 3.50%, 07/15/2026 (a) |
| 806,000 |
| 671,274 |
| ||
(EUR), 3.00%, 09/15/2027 (a) |
| 705,000 |
| 568,356 |
| ||
Unilabs Subholding AB (EUR), 5.75%, 05/15/2025 (a) |
| 1,300,000 |
| 1,335,852 |
| ||
|
|
|
| 2,575,482 |
| ||
SWITZERLAND (1.7%) |
|
|
|
|
| ||
Credit Suisse Group AG, (fixed rate to 12/18/2024, variable rate thereafter) (USD), 6.25%, 12/18/2024 (a)(b) |
| 1,115,000 |
| 1,142,875 |
| ||
UBS Group AG, (fixed rate to 02/19/2025, variable rate thereafter) (USD), 7.00%, 02/19/2025 (a)(b) |
| 1,339,000 |
| 1,436,077 |
| ||
|
|
|
| 2,578,952 |
| ||
TURKEY (2.0%) |
|
|
|
|
| ||
Akbank Turk AS, (fixed rate to 03/16/2022, variable rate thereafter) (USD), 7.20%, 03/16/2027 (a) |
| 949,000 |
| 863,590 |
| ||
KOC Holding (USD), 5.25%, 03/15/2023 (a) |
| 820,000 |
| 803,600 |
| ||
Turk Telekomunikasyon (USD), 4.88%, 06/19/2024 (a) |
| 740,000 |
| 695,511 |
| ||
Turkiye Garanti Bankasi (USD), 5.88%, 03/16/2023 (a) |
| 200,000 |
| 196,462 |
| ||
Turkiye Garanti Bankasi AS (USD), 5.25%, 09/13/2022 (a) |
| 450,000 |
| 442,958 |
| ||
|
|
|
| 3,002,121 |
| ||
UKRAINE (0.9%) |
|
|
|
|
| ||
Metinvest BV (USD), 8.50%, 04/23/2026 (a) |
| 1,140,000 |
| 758,100 |
| ||
MHP Lux SA (USD), 6.95%, 04/03/2026 (a) |
| 619,000 |
| 569,480 |
| ||
|
|
|
| 1,327,580 |
| ||
UNITED ARAB EMIRATES (0.2%) |
|
|
|
|
| ||
Shelf Drilling Holdings Ltd. (USD), 8.25%, 02/15/2025 (a) |
| 835,000 |
| 242,150 |
| ||
UNITED KINGDOM (4.6%) |
|
|
|
|
| ||
Arqiva Broadcast Finance PLC (GBP), 6.75%, 09/30/2023 (a) |
| 800,000 |
| 1,034,845 |
| ||
Ashtead Capital, Inc. |
|
|
|
|
| ||
(USD), 4.00%, 05/01/2028 (a) |
| 289,000 |
| 275,995 |
| ||
(USD), 4.25%, 11/01/2029 (a) |
| 823,000 |
| 788,243 |
| ||
Pinewood Finance Co. Ltd. (GBP), 3.25%, 09/30/2025 (a) |
| 422,000 |
| 528,004 |
| ||
Pinnacle Bidco PLC (GBP), 6.38%, 02/15/2025 (a) |
| 492,000 |
| 498,593 |
| ||
Statement of Investments (continued)
April 30, 2020 (Unaudited)
Aberdeen Global High Income Fund
|
| Shares or |
| Value |
| ||
CORPORATE BONDS (continued) |
|
|
|
|
| ||
UNITED KINGDOM (continued) |
|
|
|
|
| ||
Royal Bank of Scotland Group PLC (fixed rate to 08/15/2021, variable rate thereafter) (USD), 8.63%, 08/15/2021 (b) |
| $ | 1,200,000 |
| $ | 1,224,000 |
|
Virgin Media Finance PLC (USD), 5.75%, 01/15/2025 (a) |
| 1,410,000 |
| 1,424,523 |
| ||
Virgin Money UK PLC (fixed rate to 12/08/2022, variable rate thereafter) (GBP), 8.00%, 12/08/2022 (a)(b) |
| 1,065,000 |
| 1,029,500 |
| ||
|
|
|
| 6,803,703 |
| ||
UNITED STATES (49.1%) |
|
|
|
|
| ||
ACI Worldwide, Inc. (USD), 5.75%, 08/15/2026 (a) |
| 754,000 |
| 750,230 |
| ||
Adams Homes, Inc. (USD), 7.50%, 02/15/2025 (a) |
| 1,054,000 |
| 959,140 |
| ||
Adient US LLC (USD), 9.00%, 04/15/2025 (a) |
| 328,000 |
| 341,940 |
| ||
Alliance Data Systems Corp. (USD), 4.75%, 12/15/2024 (a) |
| 1,267,000 |
| 937,580 |
| ||
Apergy Corp. (USD), 6.38%, 05/01/2026 |
| 668,000 |
| 547,760 |
| ||
ASGN, Inc. (USD), 4.63%, 05/15/2028 (a) |
| 830,000 |
| 765,426 |
| ||
Banff Merger Sub, Inc. (EUR), 8.38%, 09/01/2026 (a) |
| 725,000 |
| 742,849 |
| ||
Bausch Health Americas, Inc. (USD), 8.50%, 01/31/2027 (a) |
| 786,000 |
| 866,486 |
| ||
Berry Global, Inc. (USD), 4.88%, 07/15/2026 (a) |
| 771,000 |
| 787,528 |
| ||
Bruin E&P Partners LLC (USD), 8.88%, 08/01/2023 (a) |
| 951,000 |
| 23,775 |
| ||
CCO Holdings LLC / CCO Holdings Capital Corp. (USD), 5.75%, 02/15/2026 (a) |
| 750,000 |
| 781,950 |
| ||
(USD), 5.38%, 06/01/2029 (a) |
| 629,000 |
| 663,601 |
| ||
(USD), 4.50%, 08/15/2030 (a) |
| 251,000 |
| 252,255 |
| ||
CDW LLC / CDW Finance Corp. (USD), 4.13%, 05/01/2025 |
| 121,000 |
| 122,210 |
| ||
Cedar Fair LP (USD), 5.25%, 07/15/2029 (a) |
| 507,000 |
| 436,020 |
| ||
Cheniere Corpus Christi Holdings LLC (USD), 5.88%, 03/31/2025 |
| 584,000 |
| 604,261 |
| ||
(USD), 5.13%, 06/30/2027 |
| 1,130,000 |
| 1,126,686 |
| ||
Cheniere Energy Partners LP, Series WI (USD), 5.25%, 10/01/2025 |
| 753,000 |
| 718,814 |
| ||
Cincinnati Bell, Inc. (USD), 8.00%, 10/15/2025 (a) |
| 570,000 |
| 577,125 |
| ||
Cleveland-Cliffs, Inc. (USD), 6.75%, 03/15/2026 (a) |
| 149,000 |
| 130,003 |
| ||
CommScope, Inc. (USD), 6.00%, 03/01/2026 (a) |
| 691,000 |
| 690,965 |
| ||
Consolidated Communications, Inc. (USD), 6.50%, 10/01/2022 |
| 860,000 |
| 771,850 |
| ||
Continental Resources, Inc. (USD), 4.38%, 01/15/2028 |
| 465,000 |
| 358,050 |
| ||
Crestwood Midstream Partners LP / Crestwood Midstream Finance Corp. (USD), 5.63%, 05/01/2027 (a) |
| 1,260,000 |
| 819,000 |
| ||
CSC Holdings LLC |
|
|
|
|
| ||
(USD), 10.88%, 10/15/2025 (a) |
| 1,630,000 |
| 1,761,948 |
| ||
(USD), 5.75%, 01/15/2030 (a) |
| 211,000 |
| 219,374 |
| ||
DISH DBS Corp. (USD), 5.88%, 07/15/2022 |
| 875,000 |
| 883,094 |
| ||
Encompass Health Corp. |
|
|
|
|
| ||
(USD), 5.13%, 03/15/2023 |
| 1,095,000 |
| 1,089,525 |
| ||
(USD), 4.75%, 02/01/2030 |
| 274,000 |
| 274,036 |
| ||
|
| Shares or |
| Value |
| ||
Energy Transfer Operating LP, (fixed rate to 05/15/2025, variable rate thereafter), Series F, (USD), 6.75%, 05/15/2025 (b) |
| $ | 830,000 |
| $ | 630,800 |
|
Enviva Partners LP / Enviva Partners Finance Corp. (USD), 6.50%, 01/15/2026 (a) |
| 600,000 |
| 628,500 |
| ||
ESH Hospitality, Inc. (USD), 4.63%, 10/01/2027 (a) |
| 909,000 |
| 822,645 |
| ||
Fair Isaac Corp. (USD), 4.00%, 06/15/2028 (a) |
| 507,000 |
| 503,198 |
| ||
Ford Motor Co. |
|
|
|
|
| ||
(USD), 8.50%, 04/21/2023 |
| 827,000 |
| 818,730 |
| ||
(USD), 9.00%, 04/22/2025 |
| 534,000 |
| 519,315 |
| ||
(USD), 9.63%, 04/22/2030 |
| 52,000 |
| 51,090 |
| ||
Ford Motor Credit Co. LLC |
|
|
|
|
| ||
(USD), 4.69%, 06/09/2025 |
| 240,000 |
| 211,800 |
| ||
(USD), 4.39%, 01/08/2026 |
| 590,000 |
| 507,400 |
| ||
GCI LLC |
|
|
|
|
| ||
(USD), 6.63%, 06/15/2024 (a) |
| 630,000 |
| 652,050 |
| ||
(USD), 6.88%, 04/15/2025 |
| 660,000 |
| 681,450 |
| ||
General Motors (Escrow Shares) |
|
|
|
|
| ||
(USD), 8.80%, 03/01/2049 (g) |
| 7,200,000 |
| – |
| ||
(USD), 8.38%, 07/15/2049 (g) |
| 3,550,000 |
| – |
| ||
General Motors Financial Co., Inc. |
|
|
|
|
| ||
(USD), 3.45%, 04/10/2022 |
| 110,000 |
| 105,932 |
| ||
(USD), 3.70%, 05/09/2023 |
| 480,000 |
| 460,456 |
| ||
General Motors Financial Co., Inc., (fixed rate to 09/30/2027, variable rate thereafter), Series A, (USD), 3M USD LIBOR + 3.598%, 5.75%, 09/30/2027 (b) |
| 1,163,000 |
| 924,940 |
| ||
Gray Television, Inc. (USD), 7.00%, 05/15/2027 (a) |
| 970,000 |
| 976,984 |
| ||
Griffon Corp. (USD), 5.75%, 03/01/2028 |
| 441,000 |
| 420,053 |
| ||
HCA, Inc. (USD), 5.38%, 02/01/2025 |
| 885,000 |
| 951,499 |
| ||
Howmet Aerospace, Inc. (USD), 6.88%, 05/01/2025 |
| 623,000 |
| 637,091 |
| ||
Huntsman International LLC (USD), 4.50%, 05/01/2029 |
| 1,540,000 |
| 1,483,728 |
| ||
International Game Technology PLC (EUR), 3.50%, 06/15/2026 (a) |
| 1,372,000 |
| 1,276,657 |
| ||
Iron Mountain, Inc. (USD), 5.25%, 03/15/2028 (a) |
| 1,160,000 |
| 1,133,900 |
| ||
j2 Cloud Services LLC / j2 Global Co-Obligor, Inc. (USD), 6.00%, 07/15/2025 (a) |
| 1,584,000 |
| 1,599,840 |
| ||
JBS Investments II GmbH (USD), 5.75%, 01/15/2028 (a) |
| 1,364,000 |
| 1,329,900 |
| ||
JBS USA LUX SA / JBS USA Food Co. / JBS USA Finance, Inc. (USD), 5.50%, 01/15/2030 (a) |
| 375,000 |
| 379,688 |
| ||
Marriott International, Inc., Series EE (USD), 5.75%, 05/01/2025 |
| 386,000 |
| 403,189 |
| ||
MDC Holdings, Inc. (USD), 6.00%, 01/15/2043 |
| 1,855,000 |
| 1,790,075 |
| ||
Meredith Corp. (USD), 6.88%, 02/01/2026 |
| 1,420,000 |
| 1,207,000 |
| ||
Midcontinent Communications / Midcontinent Finance Corp. (USD), 5.38%, 08/15/2027 (a) |
| 642,000 |
| 648,934 |
| ||
Moss Creek Resources Holdings, Inc. (USD), 7.50%, 01/15/2026 (a) |
| 1,509,000 |
| 505,515 |
| ||
MPT Operating Partnership LP / MPT Finance Corp. |
|
|
|
|
| ||
(GBP), 2.55%, 12/05/2023 |
| 245,000 |
| 303,672 |
| ||
(GBP), 3.69%, 06/05/2028 |
| 782,000 |
| 950,338 |
| ||
Statement of Investments (continued)
April 30, 2020 (Unaudited)
Aberdeen Global High Income Fund
|
| Shares or |
| Value |
| ||
CORPORATE BONDS (continued) |
|
|
|
|
| ||
UNITED STATES (continued) |
|
|
|
|
| ||
Nabors Industries Ltd. (USD), 7.25%, 01/15/2026 (a) |
| $ | 246,000 |
| $ | 93,480 |
|
Nabors Industries, Inc. (USD), 4.63%, 09/15/2021 |
| 96,000 |
| 60,835 |
| ||
Navient Corp. |
|
|
|
|
| ||
(USD), 6.50%, 06/15/2022 |
| 1,150,000 |
| 1,112,625 |
| ||
(USD), 5.50%, 01/25/2023 |
| 300,000 |
| 278,250 |
| ||
Netflix, Inc. (USD), 3.63%, 06/15/2025 (a) |
| 466,000 |
| 471,243 |
| ||
New Enterprise Stone & Lime Co., Inc. (USD), 10.13%, 04/01/2022 (a) |
| 690,000 |
| 684,825 |
| ||
Novelis Corp. |
|
|
|
|
| ||
(USD), 5.88%, 09/30/2026 (a) |
| 1,355,000 |
| 1,317,466 |
| ||
(USD), 4.75%, 01/30/2030 (a) |
| 413,000 |
| 367,570 |
| ||
NRG Energy, Inc. |
|
|
|
|
| ||
(USD), 7.25%, 05/15/2026 |
| 838,000 |
| 900,850 |
| ||
(USD), 5.25%, 06/15/2029 (a) |
| 359,000 |
| 384,579 |
| ||
Oasis Petroleum, Inc. (USD), 6.88%, 01/15/2023 |
| 1,302,000 |
| 169,260 |
| ||
Occidental Petroleum Corp. |
|
|
|
|
| ||
(USD), 3.13%, 02/15/2022 |
| 521,000 |
| 474,214 |
| ||
(USD), 2.60%, 04/15/2022 |
| 425,000 |
| 374,000 |
| ||
(USD), 3.00%, 02/15/2027 |
| 530,000 |
| 376,300 |
| ||
Parsley Energy LLC / Parsley Finance Corp. |
|
|
|
|
| ||
(USD), 5.63%, 10/15/2027 (a) |
| 1,765,000 |
| 1,509,075 |
| ||
(USD), 4.13%, 02/15/2028 (a) |
| 295,000 |
| 241,900 |
| ||
Photo Holdings Merger Sub, Inc. (USD), 8.50%, 10/01/2026 (a) |
| 2,040,000 |
| 1,766,334 |
| ||
Qwest Capital Funding, Inc. |
|
|
|
|
| ||
(USD), 6.88%, 07/15/2028 |
| 1,015,000 |
| 933,800 |
| ||
(USD), 7.75%, 02/15/2031 |
| 1,020,000 |
| 1,010,789 |
| ||
Sealed Air Corp. (USD), 4.00%, 12/01/2027 (a) |
| 71,000 |
| 69,580 |
| ||
Select Medical Corp. (USD), 6.25%, 08/15/2026 (a) |
| 670,000 |
| 639,850 |
| ||
Sensata Technologies UK Financing Co. PLC (USD), 6.25%, 02/15/2026 (a) |
| 216,000 |
| 223,020 |
| ||
Sirius XM Radio, Inc. (USD), 5.50%, 07/01/2029 (a) |
| 635,000 |
| 669,671 |
| ||
Six Flags Entertainment Corp. (USD), 4.88%, 07/31/2024 (a) |
| 510,000 |
| 448,902 |
| ||
Six Flags Theme Parks, Inc. (USD), 7.00%, 07/01/2025 (a) |
| 76,000 |
| 78,645 |
| ||
SM Energy Co. (USD), 6.75%, 09/15/2026 |
| 1,180,000 |
| 321,550 |
| ||
|
|
|
|
|
| ||
Sprint Corp. (USD), 7.88%, 09/15/2023 |
| 1,320,000 |
| 1,484,736 |
| ||
Staples, Inc. |
|
|
|
|
| ||
(USD), 7.50%, 04/15/2026 (a) |
| 1,410,000 |
| 1,113,900 |
| ||
(USD), 10.75%, 04/15/2027 (a) |
| 695,000 |
| 396,150 |
| ||
SunCoke Energy Partners LP / SunCoke Energy Partners Finance Corp. (USD), 7.50%, 06/15/2025 (a) |
| 1,165,000 |
| 888,312 |
| ||
Tecnoglass, Inc. (USD), 8.20%, 01/31/2022 (a) |
| 1,617,000 |
| 1,194,154 |
| ||
TEGNA, Inc. (USD), 4.63%, 03/15/2028 (a) |
| 833,000 |
| 746,576 |
| ||
Tempo Acquisition LLC / Tempo Acquisition Finance Corp. (USD), 5.75%, 06/01/2025 (a) |
| 127,000 |
| 127,000 |
| ||
Tenet Healthcare Corp. |
|
|
|
|
| ||
(USD), 4.63%, 07/15/2024 |
| 782,000 |
| 771,678 |
| ||
(USD), 6.25%, 02/01/2027 (a) |
| 605,000 |
| 595,683 |
| ||
|
| Shares or |
| Value |
| ||
USA Compression Partners LP / USA Compression Finance Corp. (USD), 6.88%, 09/01/2027 |
| $ | 913,000 |
| $ | 748,660 |
|
Vail Resorts, Inc. Co. (USD), 6.25%, 05/15/2025 (a) |
| 42,000 |
| 42,000 |
| ||
VICI Properties LP / VICI Note Co., Inc. (USD), 4.13%, 08/15/2030 (a) |
| 846,000 |
| 769,860 |
| ||
Viking Cruises Ltd. |
|
|
|
|
| ||
(USD), 6.25%, 05/15/2025 (a) |
| 1,122,000 |
| 748,935 |
| ||
(USD), 5.88%, 09/15/2027 (a) |
| 365,000 |
| 248,448 |
| ||
Vistra Operations Co. LLC (USD), 5.63%, 02/15/2027 (a) |
| 765,000 |
| 805,162 |
| ||
Western Midstream Operating LP |
|
|
|
|
| ||
(USD), 3.10%, 02/01/2025 |
| 159,000 |
| 145,088 |
| ||
(USD), 4.50%, 03/01/2028 |
| 183,000 |
| 161,269 |
| ||
(USD), 4.75%, 08/15/2028 |
| 1,207,000 |
| 1,063,307 |
| ||
(USD), 4.05%, 02/01/2030 |
| 253,000 |
| 230,863 |
| ||
WPX Energy, Inc. |
|
|
|
|
| ||
(USD), 8.25%, 08/01/2023 |
| 501,000 |
| 480,960 |
| ||
(USD), 5.75%, 06/01/2026 |
| 866,000 |
| 784,856 |
| ||
(USD), 4.50%, 01/15/2030 |
| 294,000 |
| 239,610 |
| ||
Wyndham Destinations, Inc. |
|
|
|
|
| ||
(USD), 5.40%, 04/01/2024 |
| 1,000,000 |
| 875,000 |
| ||
(USD), 6.35%, 10/01/2025 |
| 445,000 |
| 393,825 |
| ||
|
|
|
| 72,554,495 |
| ||
ZAMBIA (1.1%) |
|
|
|
|
| ||
First Quantum Minerals Ltd. |
|
|
|
|
| ||
(USD), 7.25%, 05/15/2022 (a) |
| 235,000 |
| 222,663 |
| ||
(USD), 7.25%, 04/01/2023 (a) |
| 387,000 |
| 351,241 |
| ||
(USD), 6.88%, 03/01/2026 (a) |
| 1,194,000 |
| 1,047,138 |
| ||
|
|
|
| 1,621,042 |
| ||
Total Corporate Bonds |
|
|
| 135,640,245 |
| ||
BANK LOANS (1.5%) |
|
|
|
|
| ||
FRANCE (1.3%) |
|
|
|
|
| ||
IWH UK Midco Limited, EUR Term Loan B (EUR), 1.12%, 01/31/2025 |
| 2,000,000 |
| 1,833,723 |
| ||
UNITED KINGDOM (0.2%) |
|
|
|
|
| ||
Froneri International Ltd., 2020 USD 2nd Lien Term Loan (USD), 0.18%, 01/31/2028 |
| 316,000 |
| 297,830 |
| ||
Total Bank Loans |
|
|
| 2,131,553 |
| ||
COMMON STOCKS (0.0%) |
|
|
|
|
| ||
UNITED KINGDOM (0.0%) |
|
|
|
|
| ||
Brighthouse Financial, Inc.(f)(g) |
| 35,521 |
| – |
| ||
Total Common Stocks |
|
|
| – |
| ||
Statement of Investments (concluded)
April 30, 2020 (Unaudited)
Aberdeen Global High Income Fund
|
| Shares or |
| Value |
|
MONEY MARKET FUNDS (4.3%) |
|
|
|
|
|
UNITED STATES (4.3%) |
|
|
|
|
|
State Street Institutional U.S. Government Money Market Fund, Premier Class, 0.22% (USD), 0.01%, 12/31/2030 (h) |
| $ 6,426,282 |
| $ 6,426,282 |
|
Total Money Market Funds |
|
|
| 6,426,282 |
|
Total Investments (Cost $161,811,854) (i)—97.5% |
|
|
| 144,198,080 |
|
Other Assets in Excess of Liabilities—2.5% |
|
|
| 3,712,067 |
|
Net Assets—100.0% |
|
|
| $147,910,147 |
|
(a) Denotes a security issued under Regulation S or Rule 144A.
(b) Perpetual bond. This is a bond that has no maturity date, is redeemable and pays a steady stream of interest indefinitely. The maturity date presented for these instruments represents the next call/put date.
(c) Security is in default.
(d) Payment-in-kind. This is a type of bond that pays interest in additional bonds rather than in cash.
(e) Variable Rate Instrument. The rate shown is based on the latest available information as of April 30, 2020. Certain variable rate securities are not based on a published reference rate and spread but are determined by the issuer or agent and are based on current market conditions. These securities do not indicate a reference rate and spread in their description.
(f) Illiquid security.
(g) Level 3 security. See Note 2(a) of the accompanying Notes to Financial Statements.
(h) Registered investment company advised by State Street Global Advisors. The rate shown is the 7 day yield as of April 30, 2020.
(i) See accompanying Notes to Financial Statements for tax unrealized appreciation/(depreciation) of securities.
EUR Euro Currency
GBP British Pound Sterling
PLC Public Limited Company
USD U.S. Dollar
At April 30, 2020, the Fund’s open forward foreign currency exchange contracts were as follows:
Purchase Contracts |
|
|
| Amount |
| Amount |
|
|
| Unrealized |
|
Settlement Date* |
| Counterparty |
| Purchased |
| Sold |
| Fair Value |
| Appreciation |
|
British Pound/United States Dollar |
|
|
|
|
|
|
|
|
|
|
|
07/08/2020 |
| Citibank N.A. |
| GBP 59,000 |
| USD 73,050 |
| $ 74,331 |
| $ 1,281 |
|
07/08/2020 |
| UBS AG |
| GBP 825,000 |
| USD 1,025,982 |
| 1,039,375 |
| 13,393 |
|
Euro/United States Dollar |
|
|
|
|
|
|
|
|
|
|
|
07/08/2020 |
| UBS AG |
| EUR1,058,000 |
| USD 1,151,775 |
| 1,160,930 |
| 9,155 |
|
|
|
|
|
|
|
|
| $2,274,636 |
| $23,829 |
|
Sale Contracts |
| Counterparty |
| Amount |
| Amount |
| Fair Value |
| Unrealized |
|
United States Dollar/British Pound |
|
|
|
|
|
|
|
|
|
|
|
07/08/2020 |
| UBS AG |
| USD 6,862,713 |
| GBP 5,514,000 |
| $ 6,946,802 |
| $ (84,089 | ) |
United States Dollar/Euro |
|
|
|
|
|
|
|
|
|
|
|
07/08/2020 |
| Citibank N.A. |
| USD 545,482 |
| EUR 500,000 |
| 548,644 |
| (3,162 | ) |
07/08/2020 |
| Royal Bank Of Canada (UK) |
| USD 515,771 |
| EUR 473,000 |
| 519,017 | ` | (3,246 | ) |
07/08/2020 |
| UBS AG |
| USD18,577,305 |
| EUR 16,949,000 |
| 18,597,927 |
| (20,622 | ) |
|
|
|
|
|
|
|
| $26,612,390 |
| $(111,119 | ) |
Total unrealized appreciation on open forward foreign currency exchange contracts |
|
|
| $ 23,829 |
| ||||||
Total unrealized depreciation on open forward foreign currency exchange contracts |
|
|
|
|
| $(111,119 | ) | ||||
* Certain contracts with different trade dates and like characteristics have been shown net.
See accompanying Notes to Financial Statements.
2020 Semi-Annual Report |
|
Statements of Assets and Liabilities (Unaudited)
April 30, 2020
|
| Aberdeen |
| Aberdeen |
| Aberdeen |
| Aberdeen |
| ||||
Assets: |
|
|
|
|
|
|
|
|
| ||||
Investments in securities, at fair value |
| $ | 118,210,751 |
| $ | 56,102,224 |
| $ | 184,200,892 |
| $ | 137,771,798 |
|
Short-term investments |
| 300,297 |
| 164,673 |
| 5,088,163 |
| 6,426,282 |
| ||||
Cash collateral pledged for futures |
| – |
| – |
| 288,482 |
| – |
| ||||
Foreign currency, at fair value |
| 82,578 |
| 49,526 |
| 41,587 |
| – |
| ||||
Cash at broker for forward foreign currency contracts |
| – |
| – |
| 330,000 |
| – |
| ||||
Receivable for investments sold |
| – |
| 183,118 |
| 3,650,451 |
| 2,171,463 |
| ||||
Interest and dividends receivable |
| 94,782 |
| 79,643 |
| 960,903 |
| 2,414,655 |
| ||||
Unrealized appreciation on forward foreign currency exchange contracts |
| – |
| – |
| 2,077,229 |
| 23,829 |
| ||||
Variation margin receivable for futures contracts |
| – |
| – |
| 862,983 |
| – |
| ||||
Receivable for capital shares issued |
| 254 |
| 1,220 |
| 78,452 |
| 5,423 |
| ||||
Receivable from Advisor (Note 3) |
| – |
| – |
| – |
| 3,931 |
| ||||
Tax reclaim receivable |
| 344,996 |
| 110,106 |
| – |
| – |
| ||||
Prepaid expenses |
| 17,415 |
| 8,196 |
| 22,940 |
| 28,216 |
| ||||
Total assets |
| 119,051,073 |
| 56,698,706 |
| 197,602,082 |
| 148,845,597 |
| ||||
Liabilities: |
|
|
|
|
|
|
|
|
| ||||
Due to custodian |
| – |
| – |
| 63,005 |
| 30 |
| ||||
Payable for investments purchased |
| 575 |
| – |
| 5,227,759 |
| 399,661 |
| ||||
Unrealized depreciation on forward foreign currency exchange contracts |
| – |
| – |
| 1,620,211 |
| 111,119 |
| ||||
Payable for capital shares redeemed |
| 55,140 |
| 27,381 |
| 372,243 |
| 46,404 |
| ||||
Payable for income taxes (See note 2g of the Notes to Financial Statements) |
| 9,691,823 |
| 2,522,118 |
| – |
| – |
| ||||
Cash due to broker for forward foreign currency contracts |
| – |
| – |
| 280,000 |
| – |
| ||||
Accrued expenses and other payables: |
|
|
|
|
|
|
|
|
| ||||
Sub-transfer agent and administrative services fees |
| 84,568 |
| 57,411 |
| 38,737 |
| 224,812 |
| ||||
Audit fees |
| 19,653 |
| 19,653 |
| 26,593 |
| 26,266 |
| ||||
Legal fees |
| 20,890 |
| 9,028 |
| 25,806 |
| 30,250 |
| ||||
Interest expense on line of credit |
| 15 |
| 120 |
| – |
| 5,335 |
| ||||
Custodian fees |
| 20,173 |
| 8,664 |
| 8,534 |
| 15,124 |
| ||||
Investment advisory fees |
| 38,926 |
| 6,848 |
| 5,277 |
| – |
| ||||
Distribution fees |
| 18,265 |
| 5,834 |
| 5,640 |
| 18,327 |
| ||||
Transfer agent fees |
| 3,914 |
| 3,012 |
| 3,239 |
| 3,725 |
| ||||
Other accrued expenses |
| 68,448 |
| 44,445 |
| 32,317 |
| 54,397 |
| ||||
Total liabilities |
| 10,022,390 |
| 2,704,514 |
| 7,709,361 |
| 935,450 |
| ||||
Net Assets |
| $ | 109,028,683 |
| $ | 53,994,192 |
| $ | 189,892,721 |
| $ | 147,910,147 |
|
Cost: |
|
|
|
|
|
|
|
|
| ||||
Investments in securities, at cost |
| $ | 134,997,985 |
| $ | 55,646,852 |
| $ | 180,168,765 |
| $ | 155,385,572 |
|
Short-term investment |
| 300,297 |
| 164,673 |
| 5,088,163 |
| 6,426,282 |
| ||||
Foreign currency |
| 81,658 |
| 49,526 |
| 41,023 |
| 147 |
| ||||
Net Assets Consist of: |
|
|
|
|
|
|
|
|
| ||||
Par value |
| $ | 4,968 |
| $ | 4,921 |
| $ | 13,732 |
| $ | 19,723 |
|
Paid in capital in excess of par value |
| 546,524,744 |
| 78,976,409 |
| 180,538,368 |
| 400,550,848 |
| ||||
Distributable earnings (accumulated loss) |
| (437,501,029 | ) | (24,987,138 | ) | 9,340,621 |
| (252,660,424 | ) | ||||
Net Assets |
| $ | 109,028,683 |
| $ | 53,994,192 |
| $ | 189,892,721 |
| $ | 147,910,147 |
|
Net Assets |
|
|
|
|
|
|
|
|
| ||||
Class A Shares |
| $ | 91,334,603 |
| $ | 29,663,225 |
| $ | 27,777,734 |
| $ | 89,563,696 |
|
Institutional Class Shares |
| 17,694,080 |
| 24,330,967 |
| 162,114,987 |
| 58,346,451 |
| ||||
Total |
| $ | 109,028,683 |
| $ | 53,994,192 |
| $ | 189,892,721 |
| $ | 147,910,147 |
|
Amounts listed as “–“ are $0 or round to $0.
See accompanying Notes to Financial Statements.
| 2020 Semi-Annual Report |
Statements of Assets and Liabilities (Unaudited) (concluded)
April 30, 2020
|
| Aberdeen |
| Aberdeen |
| Aberdeen |
| Aberdeen |
| ||||
Shares Outstanding**** |
|
|
|
|
|
|
|
|
| ||||
Class A Shares |
| 4,180,684 |
| 2,704,804 |
| 1,979,655 |
| 11,579,142 |
| ||||
Institutional Class Shares |
| 787,164 |
| 2,215,800 |
| 11,752,806 |
| 8,144,074 |
| ||||
Total |
| 4,967,848 |
| 4,920,604 |
| 13,732,461 |
| 19,723,216 |
| ||||
Net asset value and redemption price per share |
|
|
|
|
|
|
|
|
| ||||
Class A Shares |
| $ | 21.85 |
| $ | 10.97 |
| $ | 14.03 |
| $ | 7.73 |
|
Institutional Class Shares |
| $ | 22.48 |
| $ | 10.98 |
| $ | 13.79 |
| $ | 7.16 |
|
* | Under the Trust Agreement, the Trustees have authority to issue an unlimited number of shares of beneficial interest, par value $.001 per share. The Board of Trustees is authorized to reclassify and issue any unissued shares to any number of additional series without shareholder approval. |
Amounts listed as “–“ are $0 or round to $0.
See accompanying Notes to Financial Statements.
2020 Semi-Annual Report |
|
Statements of Operations (Unaudited)
For the Six-Month Period Ended April 30, 2020
|
| Aberdeen |
| Aberdeen |
| Aberdeen |
| Aberdeen |
| ||||
INVESTMENT INCOME: |
|
|
|
|
|
|
|
|
| ||||
Dividend income |
| $ | 1,408,815 |
| $ | 513,575 |
| $ | – |
| $ | – |
|
Interest income |
| 15,127 |
| 2,945 |
| 2,862,463 |
| 5,067,114 |
| ||||
Foreign tax withholding |
| (180,158 | ) | (30,899 | ) | (12,773 | ) | (6,137 | ) | ||||
Other income |
| – |
| – |
| – |
| 3,180 |
| ||||
Total Income |
| 1,243,784 |
| 485,621 |
| 2,849,690 |
| 5,064,157 |
| ||||
EXPENSES: |
|
|
|
|
|
|
|
|
| ||||
Investment advisory fees |
| 524,355 |
| 241,147 |
| 326,980 |
| 620,047 |
| ||||
Trustee fees |
| 48,331 |
| 20,959 |
| 61,469 |
| 71,932 |
| ||||
Legal fees |
| 39,653 |
| 17,521 |
| 50,060 |
| 57,419 |
| ||||
Audit fees |
| 18,081 |
| 18,081 |
| 24,685 |
| 24,933 |
| ||||
Printing fees |
| 25,198 |
| 17,499 |
| 19,158 |
| 28,732 |
| ||||
Custodian fees |
| 102,476 |
| 82,635 |
| 93,839 |
| 111,253 |
| ||||
Transfer agent fees |
| 11,896 |
| 10,038 |
| 9,073 |
| 13,005 |
| ||||
Distribution fees Class A |
| 136,241 |
| 41,756 |
| 33,869 |
| 135,190 |
| ||||
Sub-transfer agent and administrative service fees Class A |
| 32,198 |
| 15,748 |
| 8,237 |
| 54,863 |
| ||||
Sub-transfer agent and administrative service fees Class I |
| 2,911 |
| 7,907 |
| 7,988 |
| 34,578 |
| ||||
Registration and filing fees |
| 18,762 |
| 19,615 |
| 19,311 |
| 21,213 |
| ||||
Other |
| 42,168 |
| 26,097 |
| 37,551 |
| 75,704 |
| ||||
Total expenses before reimbursed/waived expenses |
| 1,002,270 |
| 519,003 |
| 692,220 |
| 1,248,869 |
| ||||
Interest expense |
| 346 |
| 100 |
| (871 | ) | 6,727 |
| ||||
Total operating expenses before reimbursed/waived expenses |
| 1,002,616 |
| 519,103 |
| 691,349 |
| 1,255,596 |
| ||||
Expenses reimbursed |
| (141,763 | ) | (144,163 | ) | (242,618 | ) | (393,471 | ) | ||||
Expenses waived by investment adviser |
| (3,277 | ) | (1,507 | ) | (4,671 | ) | (4,770 | ) | ||||
Total operating expenses |
| 857,576 |
| 373,433 |
| 444,060 |
| 857,355 |
| ||||
Net Investment Income |
| 386,208 |
| 112,188 |
| 2,405,630 |
| 4,206,802 |
| ||||
Realized gain/(loss) on investment transactions |
| (3,132,992 | ) | 556,236 |
| 5,623,501 |
| (717,600 | ) | ||||
Realized gain on futures contracts |
| – |
| – |
| 503,458 |
| – |
| ||||
Realized gain/(loss) on forward foreign currency exchange contracts |
| – |
| – |
| 246,923 |
| 491,483 |
| ||||
Realized gain/(loss) on foreign currency transactions |
| (37,519 | ) | 86,770 |
| (36,770 | ) | (1,566 | ) | ||||
Net realized gain/(loss) from investments, futures, written options, credit default swaps, forward foreign currency exchange contracts and foreign currency transactions |
| (3,170,511 | ) | 643,006 |
| 6,337,112 |
| (227,683 | ) | ||||
Net change in unrealized appreciation/(depreciation) on investment transactions |
| (17,700,578 | ) | (2,525,926 | ) | (1,696,451 | ) | (20,310,537 | ) | ||||
Net change in unrealized appreciation/(depreciation) on futures contracts |
| – |
| – |
| 438,140 |
| – |
| ||||
Net change in unrealized appreciation/(depreciation) on forward foreign currency exchange rate contracts |
| – |
| – |
| 527,611 |
| 585,774 |
| ||||
Net change in unrealized appreciation/(depreciation) on translation of assets and liabilities denominated in foreign currencies |
| 183,525 |
| (491 | ) | 3,735 |
| (10,124 | ) | ||||
Net change in unrealized appreciation/(depreciation) from investments, futures, forward foreign currency exchange contracts and translation of assets and liabilities denominated in foreign currencies |
| (17,517,053 | ) | (2,526,417 | ) | (726,965 | ) | (19,734,887 | ) | ||||
Net realized/unrealized gain/(loss) from investments, futures, forward foreign currency exchange contracts and translation of assets and liablities denominated in foreign currencies |
| (20,687,564 | ) | (1,883,411 | ) | 5,610,147 |
| (19,962,570 | ) | ||||
CHANGE IN NET ASSETS RESULTING FROM OPERATIONS |
| $ | (20,301,356 | ) | $ | (1,771,223 | ) | $ | 8,015,777 |
| $ | (15,755,768 | ) |
Amounts listed as “–“ are $0 or round to $0.
See accompanying Notes to Financial Statements.
| 2020 Semi-Annual Report |
Statements of Changes in Net Assets
|
|
|
|
|
|
|
|
|
|
|
|
| ||||
|
| Aberdeen Select International |
|
| Aberdeen Global |
| ||||||||||
|
| Six-Month |
|
| Year Ended |
|
| Six-Month |
|
| Year Ended |
| ||||
FROM INVESTMENT ACTIVITIES: |
|
|
|
|
|
|
|
|
|
|
|
| ||||
Operations: |
|
|
|
|
|
|
|
|
|
|
|
| ||||
Net investment income |
| $ | 386,208 |
|
| $ | 4,926,926 |
|
| $ | 112,188 |
|
| $ | 1,138,326 |
|
Net realized gain/(loss) from investments, futures, written options, credit default swaps, forward foreign currency exchange contracts and foreign currency transactions |
| (3,170,511 | ) |
| (8,044,959 | ) |
| 643,006 |
|
| (1,782,757 | ) | ||||
Net change in unrealized appreciation/(depreciation) on investments, futures, forward foreign currency exchange contracts and translation of assets and liabilities denominated in foreign currencies |
| (17,517,053 | ) |
| 24,104,999 |
|
| (2,526,417 | ) |
| 9,304,224 |
| ||||
Changes in net assets resulting from operations |
| (20,301,356 | ) |
| 20,986,966 |
|
| (1,771,223 | ) |
| 8,659,793 |
| ||||
Distributions to Shareholders From: |
|
|
|
|
|
|
|
|
|
|
|
| ||||
Distributable earnings: |
|
|
|
|
|
|
|
|
|
|
|
| ||||
Class A |
| (5,312,435 | ) |
| (1,053,676 | ) |
| (803,122 | ) |
| (624,526 | ) | ||||
Institutional Class |
| (1,093,873 | ) |
| (228,588 | ) |
| (726,056 | ) |
| (502,461 | ) | ||||
Change in net assets from shareholder distributions |
| (6,406,308 | ) |
| (1,282,264 | ) |
| (1,529,178 | ) |
| (1,126,987 | ) | ||||
Change in net assets from capital transactions |
| (12,125,340 | ) |
| (24,858,894 | ) |
| (5,575,459 | ) |
| (9,103,793 | ) | ||||
Change in net assets |
| (38,833,004 | ) |
| (5,154,192 | ) |
| (8,875,860 | ) |
| (1,570,987 | ) | ||||
Net Assets: |
|
|
|
|
|
|
|
|
|
|
|
| ||||
Beginning of period |
| 147,861,687 |
|
| 153,015,879 |
|
| 62,870,052 |
|
| 64,441,039 |
| ||||
End of period |
| $ | 109,028,683 |
|
| $ | 147,861,687 |
|
| $ | 53,994,192 |
|
| $ | 62,870,052 |
|
|
|
|
|
|
|
|
|
|
|
|
|
| ||||
Amounts listed as “–” are $0 or round to $0.
See accompanying Notes to Financial Statements.
2020 Semi-Annual Report |
|
Statements of Changes in Net Assets (concluded)
|
| Aberdeen Select International |
|
| Aberdeen Global |
| ||||||||||
|
| Six-Month |
|
| Year Ended |
|
| Six-Month |
|
| Year Ended |
| ||||
CAPITAL TRANSACTIONS: |
|
|
|
|
|
|
|
|
|
|
|
| ||||
Class A Shares |
|
|
|
|
|
|
|
|
|
|
|
| ||||
Proceeds from shares issued |
| $ | 507,740 |
|
| $ | 932,190 |
|
| $ | 478,688 |
|
| $ | 929,818 |
|
Dividends reinvested |
| 5,206,109 |
|
| 1,029,521 |
|
| 789,572 |
|
| 612,786 |
| ||||
Cost of shares redeemed |
| (12,499,021 | ) |
| (23,972,777 | ) |
| (4,733,580 | ) |
| (6,778,782 | ) | ||||
Total Class A |
| (6,785,172 | ) |
| (22,011,066 | ) |
| (3,465,320 | ) |
| (5,236,178 | ) | ||||
Institutional Class Shares |
|
|
|
|
|
|
|
|
|
|
|
| ||||
Proceeds from shares issued |
| 243,075 |
|
| 678,275 |
|
| 313,786 |
|
| 629,241 |
| ||||
Dividends reinvested |
| 1,038,151 |
|
| 219,031 |
|
| 658,005 |
|
| 458,213 |
| ||||
Cost of shares redeemed |
| (6,621,394 | ) |
| (3,745,134 | ) |
| (3,081,930 | ) |
| (4,955,069 | ) | ||||
Total Institutional Class |
| (5,340,168 | ) |
| (2,847,828 | ) |
| (2,110,139 | ) |
| (3,867,615 | ) | ||||
Change in net assets from capital transactions: |
| $ | (12,125,340 | ) |
| $ | (24,858,894 | ) |
| $ | (5,575,459 | ) |
| $ | (9,103,793 | ) |
SHARE TRANSACTIONS: |
|
|
|
|
|
|
|
|
|
|
|
| ||||
Class A Shares |
|
|
|
|
|
|
|
|
|
|
|
| ||||
Issued |
| 19,986 |
|
| 37,236 |
|
| 41,735 |
|
| 86,577 |
| ||||
Reinvested |
| 195,058 |
|
| 45,594 |
|
| 65,200 |
|
| 62,979 |
| ||||
Redeemed |
| (503,932 | ) |
| (959,483 | ) |
| (417,279 | ) |
| (628,136 | ) | ||||
Total Class A Shares |
| (288,888 | ) |
| (876,653 | ) |
| (310,344 | ) |
| (478,580 | ) | ||||
Institutional Class Shares |
|
|
|
|
|
|
|
|
|
|
|
| ||||
Issued |
| 9,456 |
|
| 26,162 |
|
| 27,067 |
|
| 57,741 |
| ||||
Reinvested |
| 37,834 |
|
| 9,445 |
|
| 54,291 |
|
| 47,044 |
| ||||
Redeemed |
| (247,560 | ) |
| (145,433 | ) |
| (270,372 | ) |
| (464,528 | ) | ||||
Total Institutional Class Shares |
| (200,270 | ) |
| (109,826 | ) |
| (189,014 | ) |
| (359,743 | ) | ||||
Total change in shares: |
| (489,158 | ) |
| (986,479 | ) |
| (499,358 | ) |
| (838,323 | ) | ||||
Amounts listed as “–” are $0 or round to $0.
See accompanying Notes to Financial Statements.
| 2020 Semi-Annual Report |
Statements of Changes in Net Assets
|
| Aberdeen Total |
|
| Aberdeen Global |
| ||||||||||
|
| Six-Month |
|
| Year Ended |
|
| Six-Month |
|
| Year Ended |
| ||||
FROM INVESTMENT ACTIVITIES: |
|
|
|
|
|
|
|
|
|
|
|
| ||||
Operations: |
|
|
|
|
|
|
|
|
|
|
|
| ||||
Net investment income |
| $ | 2,405,630 |
|
| $ | 5,720,676 |
|
| $ | 4,206,802 |
|
| $ | 11,638,157 |
|
Net realized gain/(loss) from investments, futures, written options, credit default swaps, forward foreign currency exchange contracts and foreign currency transactions |
| 6,337,112 |
|
| 2,511,478 |
|
| (227,683 | ) |
| (9,196,708 | ) | ||||
Net change in unrealized appreciation/(depreciation) on investments, futures, forward foreign currency exchange contracts and translation of assets and liabilities denominated in foreign currencies |
| (726,965 | ) |
| 13,899,673 |
|
| (19,734,887 | ) |
| 13,276,722 |
| ||||
Changes in net assets resulting from operations |
| 8,015,777 |
|
| 22,131,827 |
|
| (15,755,768 | ) |
| 15,718,171 |
| ||||
Distributions to Shareholders From: |
|
|
|
|
|
|
|
|
|
|
|
| ||||
Distributable earnings: |
|
|
|
|
|
|
|
|
|
|
|
| ||||
Class A |
| (372,942 | ) |
| (665,549 | ) |
| (2,326,990 | ) |
| (8,223,692 | ) | ||||
Institutional Class |
| (2,528,648 | ) |
| (4,279,060 | ) |
| (1,953,958 | ) |
| (7,225,670 | ) | ||||
Tax return of capital: |
|
|
|
|
|
|
|
|
|
|
|
| ||||
Class A |
| – |
|
| – |
|
| – |
|
| (1,106,741 | ) | ||||
Institutional Class |
| – |
|
| – |
|
| – |
|
| (907,505 | ) | ||||
Change in net assets from shareholder distributions |
| (2,901,590 | ) |
| (4,944,609 | ) |
| (4,280,948 | ) |
| (17,463,608 | ) | ||||
Change in net assets from capital transactions |
| 1,697,541 |
|
| (45,958,942 | ) |
| (50,066,711 | ) |
| (1,298,829 | ) | ||||
Change in net assets |
| 6,811,728 |
|
| (28,771,724 | ) |
| (70,103,427 | ) |
| (3,044,266 | ) | ||||
Net Assets: |
|
|
|
|
|
|
|
|
|
|
|
| ||||
Beginning of period |
| 183,080,993 |
|
| 211,852,717 |
|
| 218,013,574 |
|
| 221,057,840 |
| ||||
End of period |
| $ | 189,892,721 |
|
| $ | 183,080,993 |
|
| $ | 147,910,147 |
|
| $ | 218,013,574 |
|
|
|
|
|
|
|
|
|
|
|
|
|
| ||||
Amounts listed as “–” are $0 or round to $0.
See accompanying Notes to Financial Statements.
2020 Semi-Annual Report |
|
Statements of Changes in Net Assets (concluded)
|
| Aberdeen Total |
|
| Aberdeen Global |
| ||||||||||
|
| Six-Month |
|
| Year Ended |
|
| Six-Month |
|
| Year Ended |
| ||||
CAPITAL TRANSACTIONS: |
|
|
|
|
|
|
|
|
|
|
|
| ||||
Class A Shares |
|
|
|
|
|
|
|
|
|
|
|
| ||||
Proceeds from shares issued |
| $ | 3,734,974 |
|
| $ | 2,917,417 |
|
| $ | 12,141,474 |
|
| $ | 17,021,572 |
|
Dividends reinvested |
| 340,629 |
|
| 627,533 |
|
| 2,239,034 |
|
| 9,020,455 |
| ||||
Cost of shares redeemed |
| (3,686,066 | ) |
| (18,081,858 | ) |
| (28,571,669 | ) |
| (40,539,921 | ) | ||||
Total Class A |
| 389,537 |
|
| (14,536,908 | ) |
| (14,191,161 | ) |
| (14,497,894 | ) | ||||
Institutional Class Shares |
|
|
|
|
|
|
|
|
|
|
|
| ||||
Proceeds from shares issued |
| 22,160,351 |
|
| 43,494,897 |
|
| 28,488,346 |
|
| 90,133,868 |
| ||||
Dividends reinvested |
| 2,353,276 |
|
| 3,980,238 |
|
| 1,633,107 |
|
| 6,701,900 |
| ||||
Cost of shares redeemed |
| (23,205,623 | ) |
| (78,897,169 | ) |
| (65,997,003 | ) |
| (83,636,703 | ) | ||||
Total Institutional Class |
| 1,308,004 |
|
| (31,422,034 | ) |
| (35,875,550 | ) |
| 13,199,065 |
| ||||
Change in net assets from capital transactions: |
| $ | 1,697,541 |
|
| $ | (45,958,942 | ) |
| $ | (50,066,711 | ) |
| $ | (1,298,829 | ) |
SHARE TRANSACTIONS: |
|
|
|
|
|
|
|
|
|
|
|
| ||||
Class A Shares |
|
|
|
|
|
|
|
|
|
|
|
| ||||
Issued |
| 271,788 |
|
| 218,340 |
|
| 1,406,405 |
|
| 1,981,597 |
| ||||
Reinvested |
| 24,875 |
|
| 47,490 |
|
| 267,012 |
|
| 1,067,956 |
| ||||
Redeemed |
| (269,436 | ) |
| (1,390,448 | ) |
| (3,425,853 | ) |
| (4,727,209 | ) | ||||
Total Class A Shares |
| 27,227 |
|
| (1,124,618 | ) |
| (1,752,436 | ) |
| (1,677,656 | ) | ||||
Institutional Class Shares |
|
|
|
|
|
|
|
|
|
|
|
| ||||
Issued |
| 1,650,158 |
|
| 3,336,557 |
|
| 3,607,999 |
|
| 11,283,918 |
| ||||
Reinvested |
| 174,710 |
|
| 305,676 |
|
| 208,582 |
|
| 849,709 |
| ||||
Redeemed |
| (1,726,401 | ) |
| (6,090,047 | ) |
| (8,274,832 | ) |
| (10,534,928 | ) | ||||
Total Institutional Class Shares |
| 98,467 |
|
| (2,447,814 | ) |
| (4,458,251 | ) |
| 1,598,699 |
| ||||
Total change in shares: |
| 125,694 |
|
| (3,572,432 | ) |
| (6,210,687 | ) |
| (78,957 | ) | ||||
|
|
|
|
|
|
|
|
|
|
|
|
| ||||
Amounts listed as “–” are $0 or round to $0.
See accompanying Notes to Financial Statements.
| 2020 Semi-Annual Report |
Financial Highlights
Selected Data for Each Share of Capital Outstanding Throughout the Periods Indicated
Aberdeen Select International Equity Fund
|
|
|
|
| Investment Activities |
|
| Distributions |
|
|
|
| ||||||||
|
|
|
|
|
|
|
|
|
|
|
|
|
|
|
|
|
|
|
|
|
|
|
|
|
|
|
|
|
|
|
|
|
|
|
|
|
|
|
|
|
|
|
| Net |
|
| Net |
| Net |
| Total |
|
| Net |
| Tax |
| Total |
|
| Net |
|
Class A Shares |
|
|
|
|
|
|
|
|
|
|
|
|
|
|
|
|
|
|
|
|
Six Months Ended April 30, 2020* |
| $26.95 |
|
| $0.07 |
| $(3.95 | ) | $(3.88 | ) |
| $(1.22 | ) | $ – |
| $(1.22 | ) |
| $21.85 |
|
Year Ended October 31, 2019 |
| 23.64 |
|
| 0.81 | (g) | 2.70 |
| 3.51 |
|
| (0.20 | ) | – |
| (0.20 | ) |
| 26.95 |
|
Year Ended October 31, 2018 |
| 28.01 |
|
| 0.01 |
| (3.20 | ) | (3.19 | ) |
| (1.15 | ) | (0.03 | ) | (1.18 | ) |
| 23.64 |
|
Year Ended October 31, 2017 |
| 22.26 |
|
| 1.75 | (h) | 4.22 |
| 5.97 |
|
| (0.22 | ) | – |
| (0.22 | ) |
| 28.01 |
|
Year Ended October 31, 2016 |
| 22.82 |
|
| 0.45 | (i) | (0.29 | ) | 0.16 |
|
| (0.72 | ) | – |
| (0.72 | ) |
| 22.26 |
|
Year Ended October 31, 2015 |
| 28.00 |
|
| 0.62 | (k) | (4.60 | ) | (3.98 | ) |
| (1.20 | ) | – |
| (1.20 | ) |
| 22.82 |
|
Institutional Class Shares |
|
|
|
|
|
|
|
|
|
|
|
|
|
|
|
|
|
|
|
|
Six Months Ended April 30, 2020* |
| 27.74 |
|
| 0.10 |
| (4.06 | ) | (3.96 | ) |
| (1.30 | ) | – |
| (1.30 | ) |
| 22.48 |
|
Year Ended October 31, 2019 |
| 24.27 |
|
| 0.91 | (g) | 2.77 |
| 3.68 |
|
| (0.21 | ) | – |
| (0.21 | ) |
| 27.74 |
|
Year Ended October 31, 2018 |
| 28.73 |
|
| 0.09 |
| (3.30 | ) | (3.21 | ) |
| (1.22 | ) | (0.03 | ) | (1.25 | ) |
| 24.27 |
|
Year Ended October 31, 2017 |
| 22.84 |
|
| 1.72 | (h) | 4.46 |
| 6.18 |
|
| (0.29 | ) | – |
| (0.29 | ) |
| 28.73 |
|
Year Ended October 31, 2016 |
| 23.40 |
|
| 0.51 | (i) | (0.28 | ) | 0.23 |
|
| (0.79 | ) | – |
| (0.79 | ) |
| 22.84 |
|
Year Ended October 31, 2015 |
| 28.69 |
|
| 0.67 | (k) | (4.68 | ) | (4.01 | ) |
| (1.28 | ) | – |
| (1.28 | ) |
| 23.40 |
|
* | Unaudited |
|
|
(a) | Net investment income/(loss) is based on average shares outstanding during the period. |
|
|
(b) | Not annualized for periods less than one year. |
|
|
(c) | Annualized for periods less than one year. |
|
|
(d) | Includes interest expense that amounts to less than 0.01%. |
|
|
(e) | During the period, certain fees were waived and/or reimbursed. If such waivers/reimbursements had not occurred, the ratios would have been as indicated. |
|
|
(f) | Portfolio turnover is calculated on the basis of the Fund as a whole without distinguishing among the classes of shares. |
|
|
(g) | Included within Net Investment Income per share, Total Return, and Ratio of Net Investment Income to Average Net Assets are the effects of withholding tax refunds (Note 2g of the Notes to Financial Statements). If such amounts were excluded, the Net Investment Income per share, Total Return, and Ratio of Net Investment Loss to Average Net Assets for Class A Shares would have been $0.28, 12.13%, and 1.13%, respectively. For Institutional Class Shares, these amounts would have been $0.37,12.41%, and 1.42%, respectively. |
|
|
(h) | Included within Net Investment Income per share, Total Return, and Ratio of Net Investment Income to Average Net Assets are the effects of withholding tax refunds (Note 2g of the Notes to Financial Statements). If such amounts were excluded, the Net Investment Loss per share, Total Return, and Ratio of Net Investment Loss to Average Net Assets for Class A Shares would have been $(0.14), 20.27%, and (0.55)%, respectively. For Institutional Class Shares, these amounts would have been $(0.24), 20.55%, and (0.92)%, respectively. |
Amounts listed as “–” are $0 or round to $0.
See accompanying Notes to Financial Statements.
2020 Semi-Annual Report |
|
Financial Highlights (continued)
Selected Data for Each Share of Capital Outstanding Throughout the Periods Indicated
Aberdeen Select International Equity Fund (concluded)
|
|
| Ratios/Supplemental Data | ||||||||||||||
|
|
|
| ||||||||||||||
Total Return |
|
| Net Assets |
| Ratio of |
| Ratio of Expenses |
| Ratio of Expenses |
| Ratio of |
| Portfolio |
| |||
|
|
|
|
|
|
|
|
|
|
|
|
|
|
|
| ||
(15.21 | %) |
|
| $ 91,335 |
| 1.35% |
| 1.35% |
| 1.58% |
| 0.55 | % |
| 23 | % |
|
15.02 | %(g) |
|
| 120,472 |
| 1.44% |
| 2.99% |
| 3.06% |
| 3.24 | %(g) |
| 132 | % |
|
(11.93 | %) |
|
| 126,383 |
| 1.54% |
| 2.50% |
| 2.50% |
| 0.05 | % |
| 19 | % |
|
27.14 | %(h) |
|
| 177,342 |
| 1.42% |
| 3.93% |
| 3.93% |
| 7.02 | %(h) |
| 18 | % |
|
0.99 | %(i)(j) |
|
| 182,094 |
| 1.35% |
| 1.42% |
| 1.42% |
| 2.08 | %(i) |
| 23 | % |
|
(14.62 | %)(k) |
|
| 242,444 |
| 1.28% |
| 1.28% |
| 1.28% |
| 2.47 | %(k) |
| 11 | % |
|
|
|
|
|
|
|
|
|
|
|
|
|
|
|
|
|
|
|
(15.13 | %) |
|
| 17,694 |
| 1.10% |
| 1.10% |
| 1.29% |
| 0.77 | % |
| 23 | % |
|
15.34 | %(g) |
|
| 27,390 |
| 1.18% |
| 2.77% |
| 2.82% |
| 3.53 | %(g) |
| 132 | % |
|
(11.71 | %) |
|
| 26,633 |
| 1.30% |
| 2.22% |
| 2.23% |
| 0.33 | % |
| 19 | % |
|
27.42 | %(h) |
|
| 35,318 |
| 1.17% |
| 3.46% |
| 3.46% |
| 6.65 | %(h) |
| 18 | % |
|
1.30 | %(i)(j) |
|
| 32,094 |
| 1.10% |
| 1.17% |
| 1.17% |
| 2.31 | %(i) |
| 23 | % |
|
(14.40 | %)(k) |
|
| 43,633 |
| 1.04% |
| 1.04% |
| 1.04% |
| 2.56 | %(k) |
| 11 | % |
|
(i) Included within Net Investment Income per share, Total Return, and Ratio of Net Investment Income to Average Net Assets are the effects of a one-time reimbursement for overbilling of prior years’ custodian out-of-pocket fees. If such amounts were excluded, the impact to the Net Investment Income per share, Total Return, and Ratio of Net Investment Income to Average Net Assets for Class A Shares would have been reduced by $0.03, 0.13%, and 0.13%, respectively. For Institutional Class Shares, these amounts would have been reduced by $0.03, 0.13%, and 0.13%, respectively.
(j) Included within Net Realized and Unrealized Gains (Losses) on Investment per share is a payment that was made from affiliate, during the fiscal year ended October 31,2016, which contributed $113,111 to the Select International Equity Fund to correctly record an aged dividend receivable at its net realizable value inclusive of currencyfluctuations. If such payment was excluded, the total return would have been 0.94% for Class A Shares and 1.21% for Institutional Class Shares.
(k) Included within Net Investment Income per share, Total Return, and Ratio of Net Investment Income to Average Net Assets are the effects of withholding tax refunds (Note 2g of the Notes to Financial Statements). If such amounts were excluded, the Net Investment Income per share, Total Return, and Ratio of Net Investment Income to Average Net Assets for Class A Shares would have been $0.53, (15.03%), and 2.11%, respectively. For Institutional Class Shares, these amounts would have been $0.58, (14.80%), and 2.20%, respectively.
| 2020 Semi-Annual Report |
Financial Highlights (continued)
Selected Data for Each Share of Capital Outstanding Throughout the Periods Indicated
Aberdeen Global Equity Impact Fund
|
|
|
|
| Investment Activities |
|
| Distributions |
|
|
|
| ||||||
|
|
|
|
|
|
|
|
|
|
|
|
|
|
|
|
|
|
|
|
|
|
|
|
|
|
|
|
|
|
|
|
|
|
|
|
|
|
|
| Net |
|
| Net |
| Net |
| Total |
|
| Net |
| Total |
|
| Net |
|
Class A Shares |
|
|
|
|
|
|
|
|
|
|
|
|
|
|
|
|
|
|
Six Months Ended April 30, 2020* |
| $11.59 |
|
| $0.01 |
| $(0.36 | ) | $(0.35 | ) |
| $(0.27 | ) | $(0.27 | ) |
| $10.97 |
|
Year Ended October 31, 2019 |
| 10.29 |
|
| 0.18 | (g) | 1.30 |
| 1.48 |
|
| (0.18 | ) | (0.18 | ) |
| 11.59 |
|
Year Ended October 31, 2018 |
| 11.95 |
|
| 0.08 |
| (1.41 | ) | (1.33 | ) |
| (0.33 | ) | (0.33 | ) |
| 10.29 |
|
Year Ended October 31, 2017 |
| 9.79 |
|
| 0.43 | (h) | 1.89 |
| 2.32 |
|
| (0.16 | ) | (0.16 | ) |
| 11.95 |
|
Year Ended October 31, 2016 |
| 10.03 |
|
| 0.14 | (i) | (0.08 | ) | 0.06 |
|
| (0.30 | ) | (0.30 | ) |
| 9.79 |
|
Year Ended October 31, 2015 |
| 12.23 |
|
| 0.21 | (k) | (1.89 | )(l) | (1.68 | ) |
| (0.52 | ) | (0.52 | ) |
| 10.03 |
|
Institutional Class Shares |
|
|
|
|
|
|
|
|
|
|
|
|
|
|
|
|
|
|
Six Months Ended April 30, 2020* |
| 11.62 |
|
| 0.03 |
| (0.36 | ) | (0.33 | ) |
| (0.31 | ) | (0.31 | ) |
| 10.98 |
|
Year Ended October 31, 2019 |
| 10.30 |
|
| 0.21 | (g) | 1.30 |
| 1.51 |
|
| (0.19 | ) | (0.19 | ) |
| 11.62 |
|
Year Ended October 31, 2018 |
| 11.96 |
|
| 0.10 |
| (1.40 | ) | (1.30 | ) |
| (0.36 | ) | (0.36 | ) |
| 10.30 |
|
Year Ended October 31, 2017 |
| 9.81 |
|
| 0.45 | (h) | 1.88 |
| 2.33 |
|
| (0.18 | ) | (0.18 | ) |
| 11.96 |
|
Year Ended October 31, 2016 |
| 10.04 |
|
| 0.16 | (i) | (0.06 | ) | 0.10 |
|
| (0.33 | ) | (0.33 | ) |
| 9.81 |
|
Year Ended October 31, 2015 |
| 12.25 |
|
| 0.24 | (k) | (1.90 | )(l) | (1.66 | ) |
| (0.55 | ) | (0.55 | ) |
| 10.04 |
|
* | Unaudited |
|
|
(a) | Net investment income/(loss) is based on average shares outstanding during the period. |
|
|
(b) | Not annualized for periods less than one year. |
|
|
(c) | During the period, certain fees were waived and/or reimbursed. If such waivers/reimbursements had not occurred, the ratios would have been as indicated. |
|
|
(d) | Annualized for periods less than one year. |
|
|
(e) | Portfolio turnover is calculated on the basis of the Fund as a whole without distinguishing among the classes of shares. |
|
|
(f) | Includes interest expense that amounts to less than 0.01%. |
|
|
(g) | Included within Net Investment Income per share, Total Return, and Ratio of Net Investment Income to Average Net Assets are the effects of withholding tax refunds (Note 2g of the Notes to Financial Statements). If such amounts were excluded, the Net Investment Income per share, Total Return, and Ratio of Net Investment Loss to Average Net Assets for Class A Shares would have been $0.08, 13.56%, and 0.77%, respectively. For Institutional Class Shares, these amounts would have been $0.11, 13.81%, and 1.03%, respectively. |
|
|
(h) | Included within Net Investment Income per share, Total Return, and Ratio of Net Investment Income to Average Net Assets are the effects of withholding tax refunds (Note 2g of the Notes to Financial Statements). If such amounts were excluded, the Net Investment Loss per share, Total Return, and Ratio of Net Investment Loss to Average Net Assets for Class A Shares would have been $(0.06), 20.03%, and (0.61)%, respectively. For Institutional Class Shares, these amounts would have been $(0.04), 20.24%, and (0.37)%, respectively. |
Amounts listed as “–” are $0 or round to $0.
See accompanying Notes to Financial Statements.
2020 Semi-Annual Report |
|
Financial Highlights (continued)
Selected Data for Each Share of Capital Outstanding Throughout the Periods Indicated
Aberdeen Global Equity Impact Fund (concluded)
|
|
| Ratios/Supplemental Data |
| |||||||||||||||||
Total Return |
|
| Net Assets |
| Ratio of |
| Ratio of Expenses |
| Ratio of Expenses |
| Ratio of |
| Portfolio |
| |||||||
|
|
|
|
|
|
|
|
|
|
|
|
|
|
|
|
|
|
|
|
|
|
(3.22 | %) |
|
| $29,663 |
|
| 1.35 | % |
| 1.35 | %(f) |
| 1.85 | %(f) |
| 0.26 | % |
| 22 | % |
|
14.76 | %(g) |
|
| 34,933 |
|
| 1.53 | % |
| 2.21 | %(f) |
| 2.47 | %(f) |
| 1.69 | %(g) |
| 125 | % |
|
(11.48 | %) |
|
| 35,964 |
|
| 1.77 | % |
| 2.44 | %(f) |
| 2.44 | %(f) |
| 0.72 | % |
| 19 | % |
|
24.10 | %(h) |
|
| 49,363 |
|
| 1.58 | % |
| 3.14 | %(f) |
| 3.15 | %(f) |
| 3.98 | %(h) |
| 13 | % |
|
0.83 | %(i)(j) |
|
| 59,390 |
|
| 1.45 | % |
| 1.49 | %(f) |
| 1.50 | %(f) |
| 1.49 | %(i) |
| 23 | % |
|
(14.16 | %)(k)(l) |
|
| 79,263 |
|
| 1.38 | % |
| 1.38 | %(f) |
| 1.38 | %(f) |
| 1.93 | %(k) |
| 12 | % |
|
|
|
|
|
|
|
|
|
|
|
|
|
|
|
|
|
|
|
|
|
|
|
(3.12 | %) |
|
| 24,331 |
|
| 1.10 | % |
| 1.10 | %(f) |
| 1.56 | %(f) |
| 0.51 | % |
| 22 | % |
|
14.99 | %(g) |
|
| 27,937 |
|
| 1.28 | % |
| 1.97 | %(f) |
| 2.20 | %(f) |
| 1.95 | %(g) |
| 125 | % |
|
(11.23 | %) |
|
| 28,477 |
|
| 1.52 | % |
| 2.22 | %(f) |
| 2.23 | %(f) |
| 0.89 | % |
| 19 | % |
|
24.32 | %(h) |
|
| 44,659 |
|
| 1.33 | % |
| 2.88 | %(f) |
| 2.89 | %(f) |
| 4.22 | %(h) |
| 13 | % |
|
1.25 | %(i)(j) |
|
| 44,191 |
|
| 1.22 | % |
| 1.26 | %(f) |
| 1.27 | %(f) |
| 1.71 | %(i) |
| 23 | % |
|
(13.96 | %)(k)(l) |
|
| 69,000 |
|
| 1.13 | % |
| 1.13 | %(f) |
| 1.13 | %(f) |
| 2.16 | %(k) |
| 12 | % |
|
(i) | Included within Net Investment Income per share, Total Return, and Ratio of Net Investment Income to Average Net Assets are the effects of a one-time reimbursement for overbilling of prior years’ custodian out-of-pocket fees. If such amounts were excluded, the impact to the Net Investment Income per share, Total Return, and Ratio of Net Investment Income to Average Net Assets for Class A Shares would have been reduced by $0.02, 0.21%, and 0.20%, respectively. For Institutional Class Shares, these amounts would have been by reduced $0.03, 0.31%, and 0.19%, respectively. |
|
|
(j) | Included within Net Realized and Unrealized Gains (Losses) on Investment per share is a payment that was made from affiliate, during the fiscal year ended October 31, 2016, which contributed $127,579 to the Global Equity Impact Fund, to correctly record an aged dividend receivable at its net realizable value inclusive of currency fluctuations. If such payment was excluded, the total return would have been 0.73% for Class A Shares and 1.04% for Institutional Class Shares. |
|
|
(k) | Included within Net Investment Income per share, Total Return, and Ratio of Net Investment Income to Average Net Assets are the effects of withholding tax refunds (Note 2g of the Notes to Financial Statements). If such amounts were excluded, the Net Investment Income per share, Total Return, and Ratio of Net Investment Income to Average Net Assets for Class A Shares would have been $0.18, (14.42%), and 1.66%, respectively. For Institutional Class Shares, these amounts would have been $0.21, (14.22%), and 1.89%, respectively. |
|
|
(l) | Included within Net Realized and Unrealized Gains (Losses) on Investment per share is a payment that was made from affiliate, during the fiscal year ended October 31, 2015, which contributed $305,291 to the Global Equity Impact Fund, to correctly record an aged dividend receivable at its net realizable value inclusive of currency fluctuations. If such payment was excluded, the total return would have been (14.33%) for Class A Shares and (14.13%) for Institutional Class Shares. |
| 2020 Semi-Annual Report |
Financial Highlights (continued)
Selected Data for Each Share of Capital Outstanding Throughout the Periods Indicated
Aberdeen Total Return Bond Fund
|
|
|
| Investment Activities |
|
| Distributions |
|
|
|
| ||||||||||
|
|
|
|
|
|
|
|
|
|
|
| ||||||||||
| Net |
|
| Net |
| Net |
| Total |
|
| Net |
| Net |
| Tax |
| Total |
|
| Net |
|
Class A Shares |
|
|
|
|
|
|
|
|
|
|
|
|
|
|
|
|
|
|
|
|
|
Six Months Ended April 30, 2020* | $13.64 |
|
| $ 0.16 |
| $0.42 |
| $0.58 |
|
| $(0.19 | ) | $– |
| $– |
| $(0.19 | ) |
| $14.03 |
|
Year Ended October 31, 2019 | 12.49 |
|
| 0.36 |
| 1.09 |
| 1.45 |
|
| (0.30 | ) | – |
| – |
| (0.30 | ) |
| 13.64 |
|
Year Ended October 31, 2018 | 13.33 |
|
| 0.34 |
| (0.74 | ) | (0.40 | ) |
| (0.35 | ) | (0.07 | ) | (0.02 | ) | (0.44 | ) |
| 12.49 |
|
Year Ended October 31, 2017 | 13.83 |
|
| 0.33 |
| (0.18 | ) | 0.15 |
|
| (0.18 | ) | (0.47 | ) | – |
| (0.65 | ) |
| 13.33 |
|
Year Ended October 31, 2016 | 13.32 |
|
| 0.34 |
| 0.32 |
| 0.66 |
|
| (0.15 | ) | – |
| – |
| (0.15 | ) |
| 13.83 |
|
Year Ended October 31, 2015 | 13.60 |
|
| 0.32 |
| (0.19 | ) | 0.13 |
|
| (0.22 | ) | (0.17 | ) | (0.02 | ) | (0.41 | ) |
| 13.32 |
|
Institutional Class Shares |
|
|
|
|
|
|
|
|
|
|
|
|
|
|
|
|
|
|
|
|
|
Six Months Ended April 30, 2020* | 13.42 |
|
| 0.17 |
| 0.41 |
| 0.58 |
|
| (0.21 | ) | – |
| – |
| (0.21 | ) |
| 13.79 |
|
Year Ended October 31, 2019 | 12.30 |
|
| 0.39 |
| 1.07 |
| 1.46 |
|
| (0.34 | ) | – |
| – |
| (0.34 | ) |
| 13.42 |
|
Year Ended October 31, 2018 | 13.14 |
|
| 0.37 |
| (0.74 | ) | (0.37 | ) |
| (0.38 | ) | (0.07 | ) | (0.02 | ) | (0.47 | ) |
| 12.30 |
|
Year Ended October 31, 2017 | 13.64 |
|
| 0.36 |
| (0.18 | ) | 0.18 |
|
| (0.21 | ) | (0.47 | ) | – |
| (0.68 | ) |
| 13.14 |
|
Year Ended October 31, 2016 | 13.14 |
|
| 0.36 |
| 0.33 |
| 0.69 |
|
| (0.19 | ) | – |
| – |
| (0.19 | ) |
| 13.64 |
|
Year Ended October 31, 2015 | 13.43 |
|
| 0.35 |
| (0.20 | ) | 0.15 |
|
| (0.25 | ) | (0.17 | ) | (0.02 | ) | (0.44 | ) |
| 13.14 |
|
* Unaudited
(a) Net investment income/(loss) is based on average shares outstanding during the period.
(b) Not annualized for periods less than one year.
(c) Annualized for periods less than one year.
Amounts listed as “–“ are $0 or round to $0.
See accompanying Notes to Financial Statements.
2020 Semi-Annual Report |
Financial Highlights (continued)
Selected Data for Each Share of Capital Outstanding Throughout the Periods Indicated
Aberdeen Total Return Bond Fund (concluded)
|
|
| Ratios/Supplemental Data | ||||||||||
|
|
|
| ||||||||||
Total Return |
|
| Net Assets |
| Ratio of Expenses | Ratio of Expenses |
| Ratio of Net |
| Portfolio Turnover | |||
|
|
|
|
|
|
|
|
|
|
|
|
|
|
4.28% |
|
| $27,778 |
|
| 0.69 | % | 1.01 | % |
| 2.36% |
| 116% |
11.72% |
|
| 26,639 |
|
| 0.69 | % | 0.98 | % |
| 2.75% |
| 141% |
(3.19%) |
|
| 38,426 |
|
| 0.69 | %(f) | 0.88 | %(f) |
| 2.67% |
| 148% |
1.21%(g) |
|
| 62,556 |
|
| 0.69 | %(f) | 0.76 | %(f) |
| 2.46% |
| 151% |
5.02% |
|
| 65,242 |
|
| 0.69 | %(f) | 0.74 | %(f) |
| 2.47% |
| 151% |
0.91% |
|
| 75,595 |
|
| 0.69 | %(f) | 0.71 | %(f) |
| 2.37% |
| 102% |
|
|
|
|
|
|
|
|
|
|
|
|
|
|
4.39% |
|
| 162,115 |
|
| 0.44 | % | 0.70 | % |
| 2.61% |
| 116% |
12.02% |
|
| 156,442 |
|
| 0.44 | % | 0.68 | % |
| 2.98% |
| 141% |
(2.96%) |
|
| 173,427 |
|
| 0.44 | %(f) | 0.62 | %(f) |
| 2.93% |
| 148% |
1.50%(g) |
|
| 253,218 |
|
| 0.44 | %(f) | 0.51 | %(f) |
| 2.71% |
| 151% |
5.29% |
|
| 454,335 |
|
| 0.44 | %(f) | 0.47 | %(f) |
| 2.72% |
| 151% |
1.12% |
|
| 927,387 |
|
| 0.44 | %(f) | 0.45 | %(f) |
| 2.62% |
| 102% |
(d) During the period, certain fees were waived and/or reimbursed. If such waivers/reimbursements had not occurred, the ratios would have been as indicated.
(e) Portfolio turnover is calculated on the basis of the Fund as a whole without distinguishing among the classes of shares.
(f) Includes interest expense that amounts to less than 0.01%.
(g) The total return shown above includes the impact of financial statement rounding of the NAV per share and/or financial statement adjustments.
2020 Semi-Annual Report |
Financial Highlights (continued)
Selected Data for Each Share of Capital Outstanding Throughout the Periods Indicated
Aberdeen Global High Income Fund
|
|
|
| Investment Activities |
|
| Distributions |
|
|
|
| ||||||||||
|
|
|
|
|
|
|
|
|
|
|
| ||||||||||
| Net |
|
| Net |
| Net |
| Total |
|
| Net |
| Net |
| Tax |
| Total |
|
| Net |
|
Class A Shares |
|
|
|
|
|
|
|
|
|
|
|
|
|
|
|
|
|
|
|
|
|
Six Months Ended April 30, 2020* | $8.71 |
|
| $0.18 |
| $(0.98 | ) | $(0.80 | ) |
| (0.18 | ) | $– |
| $– |
| $(0.18 | ) |
| $7.73 |
|
Year Ended October 31, 2019 | 8.74 |
|
| 0.44 |
| 0.19 |
| 0.63 |
|
| (0.58 | ) | – |
| (0.08 | ) | (0.66 | ) |
| 8.71 |
|
Year Ended October 31, 2018 | 9.23 |
|
| 0.50 |
| (0.56 | ) | (0.06 | ) |
| (0.43 | ) | – |
| – |
| (0.43 | ) |
| 8.74 |
|
Year Ended October 31, 2017 | 8.80 |
|
| 0.52 |
| 0.38 |
| 0.90 |
|
| (0.43 | ) | – |
| (0.04 | ) | (0.47 | ) |
| 9.23 |
|
Year Ended October 31, 2016 | 8.98 |
|
| 0.49 |
| (0.33 | ) | 0.16 |
|
| (0.34 | ) | – |
| – |
| (0.34 | ) |
| 8.80 |
|
Year Ended October 31, 2015 | 10.38 |
|
| 0.62 |
| (1.22 | ) | (0.60 | ) |
| (0.44 | ) | (0.25 | ) | (0.11 | ) | (0.80 | ) |
| 8.98 |
|
Institutional Class Shares |
|
|
|
|
|
|
|
|
|
|
|
|
|
|
|
|
|
|
|
|
|
Six Months Ended April 30, 2020* | 8.08 |
|
| 0.18 |
| (0.90 | ) | (0.72 | ) |
| (0.20 | ) | – |
| – |
| (0.20 | ) |
| 7.16 |
|
Year Ended October 31, 2019 | 8.16 |
|
| 0.43 |
| 0.17 |
| 0.60 |
|
| (0.61 | ) | – |
| (0.07 | ) | (0.68 | ) |
| 8.08 |
|
Year Ended October 31, 2018 | 8.65 |
|
| 0.49 |
| (0.53 | ) | (0.04 | ) |
| (0.45 | ) | – |
| – |
| (0.45 | ) |
| 8.16 |
|
Year Ended October 31, 2017 | 8.28 |
|
| 0.51 |
| 0.35 |
| 0.86 |
|
| (0.45 | ) | – |
| (0.04 | ) | (0.49 | ) |
| 8.65 |
|
Year Ended October 31, 2016 | 8.47 |
|
| 0.48 |
| (0.31 | ) | 0.17 |
|
| (0.36 | ) | – |
| – |
| (0.36 | ) |
| 8.28 |
|
Year Ended October 31, 2015 | 9.85 |
|
| 0.61 |
| (1.16 | ) | (0.55 | ) |
| (0.47 | ) | (0.25 | ) | (0.11 | ) | (0.83 | ) |
| 8.47 |
|
* Unaudited
(a) Net investment income/(loss) is based on average shares outstanding during the period.
(b) Not annualized for periods less than one year.
(c) Annualized for periods less than one year.
(d) During the period, certain fees were waived and/or reimbursed. If such waivers/reimbursements had not occurred, the ratios would have been as indicated.
Amounts listed as “–” are $0 or round to $0.
See accompanying Notes to Financial Statements.
2020 Semi-Annual Report |
Financial Highlights (concluded)
Selected Data for Each Share of Capital Outstanding Throughout the Periods Indicated
Aberdeen Global High Income Fund (concluded)
|
|
| Ratios/Supplemental Data | ||||||||||
|
|
|
| ||||||||||
Total Return |
|
| Net Assets |
| Ratio of Expenses | Ratio of Expenses |
| Ratio of Net |
| Portfolio Turnover | |||
|
|
|
|
|
|
|
|
|
|
|
|
|
|
(9.28%) |
|
| $89,564 |
|
| 1.01 | %(f) | 1.45 | %(f) |
| 4.29% |
| 42% |
7.65% |
|
| 116,126 |
|
| 1.00 | %(g) | 1.33 | %(g) |
| 5.14% |
| 98% |
(0.66%) |
|
| 131,219 |
|
| 1.00 | %(g) | 1.22 | %(g) |
| 5.56% |
| 37% |
10.50% |
|
| 185,613 |
|
| 1.00 | %(g) | 1.14 | %(g) |
| 5.79% |
| 51% |
1.91% |
|
| 233,369 |
|
| 1.00 | %(g) | 1.06 | %(g) |
| 5.76% |
| 72% |
(6.01%)(h) |
|
| 522,964 |
|
| 1.00 | %(g) | 1.04 | %(g) |
| 6.43% |
| 79% |
|
|
|
|
|
|
|
|
|
|
|
|
|
|
(9.12%) |
|
| 58,346 |
|
| 0.76 | %(f) | 1.16 | %(f) |
| 4.57% |
| 42% |
7.91% |
|
| 101,888 |
|
| 0.75 | %(g) | 1.05 | %(g) |
| 5.39% |
| 98% |
(0.43%) |
|
| 89,839 |
|
| 0.75 | %(g) | 0.95 | %(g) |
| 5.80% |
| 37% |
10.76% |
|
| 203,575 |
|
| 0.75 | %(g) | 0.87 | %(g) |
| 6.01% |
| 51% |
2.21% |
|
| 351,466 |
|
| 0.75 | %(g) | 0.79 | %(g) |
| 6.00% |
| 72% |
(5.85%) |
|
| 797,494 |
|
| 0.75 | %(g) | 0.76 | %(g) |
| 6.68% |
| 79% |
(e) Portfolio turnover is calculated on the basis of the Fund as a whole without distinguishing among the classes of shares.
(f) Includes interest expense that amounts to 0.01%
(g) Includes interest expense that amounts to less than 0.01%.
(h) The total return shown above includes the impact of financial statement adjustments to the NAV per share.
2020 Semi-Annual Report |
Notes to Financial Statements
April 30, 2020 (unaudited)
1. Organization
Aberdeen Investment Funds (the “Trust”) was organized as a business trust under the laws of the State of Massachusetts by a Master Trust Agreement adopted on April 30, 1992 and is registered with the U.S. Securities and Exchange Commission (“SEC”) under the Investment Company Act of 1940, as amended (the “1940 Act”) as an open-end management investment company. As of April 30, 2020, the Trust offered four diversified, open-ended investment funds: Aberdeen Select International Equity Fund (the “Select International Equity Fund”), Aberdeen Global Equity Impact Fund (“Global Equity Impact Fund”), Aberdeen Total Return Bond Fund (the “Total Return Bond Fund”), and Aberdeen Global High Income Fund (the “Global High Income Fund”). Each series of the Trust is also referred to herein as a “Fund” or collectively, the “Funds”.
Under the Trust Agreement, the Trustees have authority to issue an unlimited number of shares of beneficial interest, par value $.001 per share. The Board of Trustees is authorized to reclassify and issue any unissued shares to any number of additional series without shareholder approval.
Each of the Funds offers multiple share classes. As of April 30, 2020, all of the Funds offered Class A and Institutional Class shares. The classes of shares are offered to different types of investors and have different expense structures, as outlined in the Funds’ prospectus. Each class of shares has exclusive voting rights with respect to matters that affect that class. Income, realized gains and losses, unrealized appreciation and depreciation, and expenses that are not attributable to a specific class are allocated daily to each class based on its relative net assets. Expenses directly attributable to a Fund are charged to that Fund. Other expenses are allocated to the respective Fund based on average daily net assets.
Each Fund has distinct investment objectives. Following are the objectives for the Funds:
Fund Name | Investment Objective |
Select International Equity Fund | Seeks long-term growth of capital. |
Global Equity Impact Fund | Seeks long-term growth of capital. |
Total Return Bond Fund | Seeks to provide total return, which is derived from capital appreciation and income. |
Global High Income Fund | Seeks to maximize total return, principally through a high level of current income, and secondarily through capital appreciation. |
2. Summary of Significant Accounting Policies
The Trust is an investment company and accordingly follows the investment company accounting and reporting guidance of the Financial Accounting Standards Board (“FASB”) Accounting Standard Codification Topic 946 Financial Services-Investment Companies. The following is a summary of significant accounting policies followed by the Funds in the preparation of their financial statements. The policies conform to generally accepted accounting principles (“GAAP”) in the United States of America. The preparation of financial statements requires management to make estimates and assumptions that affect the reported amounts of assets and liabilities, disclosure of contingent assets and liabilities at the date of the financial statements, and the reported amounts of income and expenses for the period. Actual results could differ from those estimates. The books and records of the Funds are maintained in U.S. Dollars.
a. Security Valuation
The Funds value their securities at current market value or fair value, consistent with regulatory requirements. “Fair value” is defined in the Funds’ Valuation and Liquidity Procedures as the price that could be received to sell an asset or paid to transfer a liability in an orderly transaction between willing market participants without a compulsion to transact at the measurement date.
In accordance with the authoritative guidance on fair value measurements and disclosures under GAAP, the Funds disclose the fair value of their investments using a three-level hierarchy that classifies the inputs to valuation techniques used to measure the fair value. The hierarchy assigns Level 1, the highest level, measurements to valuations based upon unadjusted quoted prices in active markets for identical assets, Level 2 measurements to valuations based upon other significant observable inputs, including adjusted quoted prices in active markets for similar assets, and Level 3, the lowest level, measurements to valuations based upon unobservable inputs that are significant to the valuation. Inputs refer broadly to the assumptions that market participants would use in pricing the asset or liability, including assumptions about risk, for example, the risk inherent in a particular valuation technique used to measure fair value including a pricing model and/or the risk inherent in the inputs to the valuation technique. Inputs may be observable or unobservable. Observable inputs are inputs that reflect the assumptions market participants would use in pricing the asset or liability, which are based on market data obtained from sources independent of the reporting entity. Unobservable inputs are inputs that reflect the reporting entity’s own assumptions about the assumptions market participants would use in pricing the asset or liability developed based on the best information available in the circumstances. A financial instrument’s level within the fair value hierarchy is based upon the lowest level of any input that is significant to the fair value measurement. Open-end mutual funds are valued at the respective net asset value (“NAV”) as reported by such company. The prospectuses for the registered open-end management investment companies in which a Fund invests explain the circumstances under which those companies will
2020 Semi-Annual Report |
|
Notes to Financial Statements (continued)
April 30, 2020 (unaudited)
use fair value pricing and the effects of using fair value pricing. Closed-end funds and exchange-traded funds (“ETFs”) are valued at the market price of the security at the Valuation Time. A security using any of these pricing methodologies is determined to be a Level 1 investment.
Equity securities that are traded on an exchange are valued at the last quoted sale price on the principal exchange on which the security is traded at the “Valuation Time” subject to application, when appropriate, of the valuation factors described in the paragraph below. Under normal circumstances, the Valuation Time is as of the close of regular trading on the New York Stock Exchange (usually 4:00 p.m. Eastern Time). In the absence of a sale price, the security is valued at the mean of the bid/ask price quoted at the close on the principal exchange on which the security is traded. Securities traded on NASDAQ are valued at the NASDAQ official closing price.
Foreign equity securities that are traded on foreign exchanges that close prior to Valuation Time are valued by applying valuation factors to the last sale price or the mean price as noted above. Valuation factors are provided by an independent pricing service provider approved by the Board. These valuation factors are used when pricing a Fund’s portfolio holdings to estimate market movements between the time foreign markets close and the time a Fund values such foreign securities. These valuation factors are based on inputs such as depositary receipts, indices, futures, sector indices/ETFs, exchange rates, and local exchange opening and closing prices of each security. When prices with the application of valuation factors are utilized, the value assigned to the foreign securities may not be the same as quoted or published prices of the securities on their primary markets. A security that applies a valuation factor is determined to be a Level 2 investment because the exchange-traded price has been adjusted. Valuation factors are not utilized if the independent pricing service provider is unable to provide a valuation factor or if the valuation factor falls below a predetermined threshold; in such case, the security is determined to be a Level 1 investment.
Long-term debt and other fixed-income securities are valued at the last quoted or evaluated bid price on the valuation date provided by an independent pricing service provider approved by the Board of Trustees of the Trust (the “Board”). If there are no current day bids, the security is valued at the previously applied bid. Pricing services generally price debt securities assuming orderly transactions of an institutional “round lot” size, and the strategies employed by the Aberdeen Standard Investments Inc. (formerly, Aberdeen Asset Management Inc.)(“Aberdeen,” the “Adviser” or “ASII”) generally trade in round lot sizes. In certain circumstances, fixed income securities may be held or transactions may be conducted in smaller, “odd lot” sizes. Odd lots may trade at lower or, occasionally, higher prices than institutional round lot trades. Short-term debt securities (such as commercial paper and U.S. treasury bills) having a remaining maturity of 60 days or less are valued at the last quoted or evaluated bid price on the valuation date provided by an independent pricing service, or on the basis of amortized cost if it represents the best approximation for fair value. Debt and other fixed-income securities are generally determined to be Level 2 investments.
Short-term investments are comprised of cash and cash equivalents invested in short-term investment funds which are redeemable daily. The Funds sweep available cash into the State Street Institutional U.S. Government Money Market Fund, a “government money market fund” pursuant to Rule 2a-7 under the 1940 Act, which has an objective to maintain a $1.00 NAV, which is not guaranteed. Registered investment companies are valued at their net asset value as reported by such company. Generally, these investment types are categorized as Level 1 investments.
Derivative instruments are generally valued according to the following procedures. Exchange traded derivatives are generally Level 1 investments and over-the-counter derivatives are generally Level 2 investments. Forward currency exchange contracts are generally valued based on the current spot exchange rates and the forward exchange rate points (ex. 1-month, 3-month) that are obtained from an approved pricing agent. Based on the actual settlement dates of the forward contracts held, an interpolated value of the forward points is combined with the spot exchange rate to derive the valuation. Futures contracts are generally valued at the most recent settlement price as of NAV determination. Swap agreements are generally valued by an approved pricing agent based on the terms of the swap agreement (including future cash flows). When market quotations or exchange rates are not readily available, or if the Adviser concludes that such market quotations do not accurately reflect fair value, the fair value of a Fund’s assets are determined in good faith in accordance with the Valuation Procedures.
In the event that a security’s market quotations are not readily available or are deemed unreliable (for reasons other than because the foreign exchange on which it trades closed before the Valuation Time (as defined below)), the security is valued at fair value as determined by the Funds’ Pricing Committee (the “Pricing Committee”), taking into account the relevant factors and surrounding circumstances using Valuation and Liquidity Procedures approved by the Board. Under normal circumstances, the Valuation Time is as of the close of regular trading on the New York Stock Exchange (usually 4:00 p.m. Eastern Time). A security that has been fair valued by the Pricing Committee may be classified as Level 2 or Level 3 depending on the nature of the inputs.
The three-level hierarchy of inputs is summarized below:
· Level 1 – quoted prices in active markets for identical investments;
· Level 2 – other significant observable inputs (including quoted prices for similar securities, interest rates, prepayment speeds, and credit risk); or
· Level 3 – significant unobservable inputs (including a Fund’s own assumptions in determining the fair value of investments).
| 2020 Semi-Annual Report |
Notes to Financial Statements (continued)
April 30, 2020 (unaudited)
A summary of standard inputs is listed below:
Security Type | Standard Inputs |
Foreign equities utilizing a fair | Depositary receipts, indices, futures, sector indices/ETFs, exchange rates, and local |
value factor | exchange opening and closing prices of each security. |
Debt and other fixed-income | Reported trade data, broker-dealer price quotations, benchmark yields, issuer spreads on |
securities | comparable securities, credit quality, yield, and maturity. |
Forward foreign currency | Forward exchange rate quotations. |
contracts |
|
Swap agreements | Market information pertaining to the underlying reference assets, i.e., credit spreads, credit event |
| probabilities, fair values, forward rates, and volatility measures. |
The following is a summary of the inputs used as of April 30, 2020 in valuing the Funds’ investments and other financial instruments at fair value. The inputs or methodology used for valuing securities are not necessarily an indication of the risk associated with investing in those securities.
Please refer to the Statements of Investments for a detailed breakout of the security types:
Investments, at Value |
| LEVEL 1 – Quoted | ) | LEVEL 2 – Other | ) | LEVEL 3 – Significant | ) | Total ($ | ) |
Select International Equity Fund |
|
|
|
|
|
|
|
|
|
Investments in Securities |
|
|
|
|
|
|
|
|
|
Common Stocks |
| 13,330,323 |
| 103,950,731 |
| – |
| 117,281,054 |
|
Preferred Stocks |
| 929,697 |
| – |
| – |
| 929,697 |
|
Short-Term Investment |
| 300,297 |
| – |
| – |
| 300,297 |
|
|
| 14,560,317 |
| 103,950,731 |
| – |
| 118,511,048 |
|
|
|
|
|
|
|
|
|
|
|
Global Equity Impact Fund |
|
|
|
|
|
|
|
|
|
Investments in Securities |
|
|
|
|
|
|
|
|
|
Common Stocks |
| 22,905,924 |
| 33,196,300 |
| – |
| 56,102,224 |
|
Money Market Funds |
| 164,673 |
| – |
| – |
| 164,673 |
|
|
| 23,070,597 |
| 33,196,300 |
| – |
| 56,266,897 |
|
|
|
|
|
|
|
|
|
|
|
Total Return Bond Fund |
|
|
|
|
|
|
|
|
|
Investments in Securities |
|
|
|
|
|
|
|
|
|
Asset-Backed Securities |
| – |
| 13,793,812 |
| – |
| 13,793,812 |
|
Commercial Mortgage-Backed Securities |
| – |
| 19,650,538 |
| – |
| 19,650,538 |
|
Non-Agency Mortgage-Backed Securities |
| – |
| 9,529,755 |
| – |
| 9,529,755 |
|
Corporate Bonds |
| – |
| 65,260,831 |
| – |
| 65,260,831 |
|
Municipal Bonds |
| – |
| 10,198,419 |
| – |
| 10,198,419 |
|
Government Bonds |
| – |
| 5,434,673 |
| – |
| 5,434,673 |
|
U.S. Agencies |
| – |
| 29,309,770 |
| – |
| 29,309,770 |
|
U.S. Treasuries |
| – |
| 28,212,603 |
| – |
| 28,212,603 |
|
Agency Mortgage-Backed Securities |
| – |
| 2,810,491 |
| – |
| 2,810,491 |
|
Short-Term Investment |
| 5,088,163 |
| — |
| – |
| 5,088,163 |
|
2020 Semi-Annual Report |
|
Notes to Financial Statements (continued)
April 30, 2020 (unaudited)
Investments, at Value |
| Level 1 |
| Level 2 |
| Level 3 |
| Total |
|
Other Financial Instruments |
|
|
|
|
|
|
|
|
|
Assets |
|
|
|
|
|
|
|
|
|
Futures Contracts |
| 417,731 |
| – |
| – |
| 417,731 |
|
Forward Foreign Currency Exchange Contracts |
| – |
| 2,077,229 |
| – |
| 2,077,229 |
|
Liabilities |
|
|
|
|
|
|
|
|
|
Futures Contracts |
| (78,938 | ) | – |
| – |
| (78,938 | ) |
Forward Foreign Currency Exchange Contracts |
| – |
| (1,620,211 | ) | – |
| (1,620,211 | ) |
|
| 5,426,956 |
| 184,657,910 |
| – |
| 190,084,866 |
|
Global High Income Fund |
|
|
|
|
|
|
|
|
|
Investments in Securities |
|
|
|
|
|
|
|
|
|
Corporate Bonds |
| – |
| 135,640,245 |
| – |
| 135,640,245 |
|
Bank Loans |
| – |
| 2,131,553 |
| – |
| 2,131,553 |
|
Money Market Funds |
| 6,426,282 |
| – |
| – |
| 6,426,282 |
|
Other Financial Instruments |
|
|
|
|
|
|
|
|
|
Assets |
|
|
|
|
|
|
|
|
|
Forward Foreign Currency Exchange Contracts |
| – |
| 23,829 |
| – |
| 23,829 |
|
Liabilities |
|
|
|
|
|
|
|
|
|
Forward Foreign Currency Exchange Contracts |
| – |
| (111,119 | ) | – |
| (111,119 | ) |
|
| 6,426,282 |
| 137,684,508 |
| – |
| 144,110,790 |
|
Level 3 investments held on Global High Income Fund, at the beginning, during and at the end of the six-month period in relation to net assets were not significant (less than 0.00% of total net assets) and accordingly, a reconciliation of Level 3 assets for the six-month period ended 4/30/20 is not presented. The valuation technique used at 4/30/20 was a single unadjusted broker quote. The inputs utilized by the broker to value the investment were not available.
b. Restricted Securities
Restricted securities are privately-placed securities whose resale is restricted under U.S. securities laws. The Funds may invest in restricted securities, including unregistered securities eligible for resale without registration pursuant to Rule 144A and privately-placed securities of U.S. and non-U.S. issuers offered outside the U.S. without registration pursuant to Regulation S under the Securities Act of 1933, as amended. Rule 144A securities may be freely traded among certain qualified institutional investors, such as the Funds, but resale of such securities in the U.S. is permitted only in limited circumstances.
c. Foreign Currency Translation
Foreign securities, currencies, and other assets and liabilities denominated in foreign currencies are translated into U.S. Dollars at the exchange rate of said currencies against the U.S. Dollar, as of the Valuation Time, as provided by an independent pricing service. Purchases and sales of securities, and income and expenses are translated at the prevailing rate of exchange on the respective date of these transactions. The Funds do not isolate that portion of the results of operations resulting from changes in foreign exchange rates on investments from fluctuations arising from changes in market prices of securities held. These fluctuations are included with the net realized and unrealized gain or loss from investments within the Statements of Operations.
Investments in emerging markets can be riskier and more volatile than investments in the United States and other developed markets. Adverse political and economic developments can make it more difficult for the Select International Equity Fund and Global Equity Impact Fund to sell foreign securities which could reduce the NAV of the Funds. In contrast to more established markets, emerging markets may have governments that are less stable and markets that are less liquid, increasing your investment risk.
| 2020 Semi-Annual Report |
Notes to Financial Statements (continued)
April 30, 2020 (unaudited)
d. Derivative Financial Instruments
Certain Funds are authorized to use derivatives to manage currency risk, credit risk, and interest rate risk and to replicate, or use as a substitute for, physical securities. Losses may arise due to changes in the value of the contract or if the counterparty does not perform under the contract. The use of derivative instruments involves, to varying degrees, elements of market risk in excess of the amount recognized in the Statements of Assets and Liabilities.
Forward Foreign Currency Exchange Contracts
A forward foreign currency exchange contract (“forward contract”) involves an obligation to purchase and sell a specific currency at a future date, which may be any fixed number of days from the date of the contract agreed upon by the parties, at a price set at the time of the contract. Forward contracts are used to manage a Fund’s currency exposure in an efficient manner. They are used to sell unwanted currency exposure that comes with holding securities in a market, or to buy currency exposure where the exposure from holding securities is insufficient to give the desired currency exposure either in absolute terms or relative to a particular benchmark or index. The use of forward contracts allows for the separation of investment decision-making between foreign exchange holdings and their currencies. The forward contract is marked-to-market daily and the change in market value is recorded by a Fund as unrealized appreciation/(depreciation). Forward contracts’ prices are received daily from an independent pricing provider. When the forward contract is closed, a Fund records a realized gain or loss equal to the difference between the value at the time it was opened and the value at the time it was closed. These realized and unrealized gains and losses are reported on the Statements of Operations. During the six-month period ended April 30, 2020, the Funds used forward contracts to hedge some of the Funds’ foreign currency holdings. Managing active currency risk involves both hedging currency risk and adding currency risk in excess of underlying bond positions. A Fund may also enter into forward contracts to obtain potential appreciation of a foreign currency, which also adds currency risk.
Futures Contracts
Certain Funds may invest in financial futures contracts (“futures contracts”) for the purpose of hedging their existing portfolio securities, or securities that a Fund intends to purchase, against fluctuations in value caused by changes in prevailing market interest rates or prices. Futures contracts may also be entered into for non-hedging purposes; however, in those instances, the aggregate initial margin and premiums required to establish a Fund’s positions may not exceed 5% of a Fund’s NAV after taking into account unrealized profits and unrealized losses on any such contract into which it has entered.
Upon entering into a futures contract, a Fund is required to pledge to the broker an amount of cash and/or other assets equal to a certain percentage of the contract amount. This payment is known as “initial margin”. Subsequent payments, known as “variation margin,” are calculated each day, depending on the daily fluctuations in the fair value/market value of the underlying assets. An unrealized gain/(loss) equal to the variation margin is recognized on a daily basis. When the contract expires or is closed, the gain/(loss) is realized and is presented in the Statements of Operations as a net realized gain/(loss) on futures contracts. Futures contracts are valued daily at their last quoted sale price on the exchange on which they are traded.
A “sale” of a futures contract means a contractual obligation to deliver the securities or foreign currency called for by the contract at a fixed price at a specified time in the future. A “purchase” of a futures contract means a contractual obligation to acquire the securities or foreign currency at a fixed price at a specified time in the future.
Should market conditions change unexpectedly, a Fund may not achieve the anticipated benefits of the futures contracts and may realize a loss. The use of futures transactions for hedging purposes involves the risk of imperfect correlation in movements in the price of futures contracts, interest rates and the value/market value of the underlying hedged assets. During the six-month period ended April 30, 2020, U.S. Treasury futures contracts were used to manage Total Return Bond Fund’s overall curve and interest rate exposure.
Options
Options are instruments that provide a right to buy (call) or sell (put) a particular security or an index of securities at a fixed price within a certain time period. Options differ from forward and futures contracts in that the buyer of the option has no obligation to perform under the contract. An option is out-of-the money if the exercise price of the option is above, in the case of a call option, or below, in the case of a put option, the current price (or interest rate or yield for certain options) of the referenced security or instrument. Use of put and call options may result in losses to a Fund, force the sale or purchase of portfolio securities at inopportune times or for prices higher than (in the case of put options) or lower than (in the case of call options) current market values, limit the amount of appreciation a Fund can realize on its investments or cause a Fund to hold a security it might otherwise sell. The Funds did not hold options as of April 30, 2020.
2020 Semi-Annual Report |
|
Notes to Financial Statements (continued)
April 30, 2020 (unaudited)
Swaps
The Total Return Bond Fund enters into interest rate swaps to manage interest-rate exposure. The Global High Income Fund uses credit default swaps to gain, or hedge, exposure to specific companies. A swap is an agreement that obligates two parties to exchange a series of cash flows and/or meet certain obligations at specified intervals based upon or calculated by reference to changes in specified prices or rates (interest rates in the case of interest rate swaps, currency exchange rates in the case of currency swaps) or the occurrence of a credit event with respect to an underlying reference obligation (in the case of a credit default swap) for a specified amount of an underlying asset or notional principal amount. A Fund will enter into swaps only on a net basis, which means that the two payment streams are netted out, with a Fund receiving or paying, as the case may be, only the amount of the difference between the two payments. Except for currency swaps and credit default swaps, the notional principal amount is used solely to calculate the payment streams but is not exchanged. With respect to currency swaps, actual principal amounts of currencies may be exchanged by the counterparties at the initiation, and again upon the termination of the transaction.
Traditionally, swaps were customized, privately negotiated agreements executed between two parties (“OTC Swaps”) but since 2013, certain swaps are required to be cleared pursuant to rules and regulations related to the Dodd – Frank Wall Street Reform and Consumer Protection Act (“Dodd Frank”) and/or Regulation (EU) No 648/2012 on OTC Derivatives, Central Counterparties and Trade Repositories (“EMIR”) (“Cleared Swaps”). Like OTC Swaps, Cleared Swaps are negotiated bilaterally. Unlike OTC Swaps, the act of clearing results in two swaps executed between each of the parties and a central counterparty (“CCP”), and thus the counterparty credit exposure of the parties is to the CCP rather than to one another. Upon entering into a Cleared Swap, a Fund is required to pledge an amount of cash and/or other assets equal to a certain percentage of the contract amount. This payment is known as “initial margin”. Subsequent payments, known as “variation margin,” are calculated each day, depending on the daily fluctuations in the fair value/market value of the underlying assets. An unrealized gain/(loss) equal to the variation margin is recognized on a daily basis. When the contract matures or is terminated, the gain or loss is realized and is presented in the Statements of Operations as a net realized gain or loss on swap contracts. As of March 2017, a Fund may be required to provide variation and/or initial margin for OTC Swaps pursuant to further rules and regulations related to Dodd Frank and EMIR. The margin requirements associated with OTC Swaps and Cleared Swaps may not be the same.
Entering into swap agreements involves, to varying degrees, elements of credit, market and interest rate risk in excess of the amounts reported on the Statement of Assets and Liabilities. Such risks involve the possibility that there will be no liquid market for these agreements, that the counterparty to the agreements may default on its obligation to perform and that there may be unfavorable changes in the value of the index or securities underlying the agreement. The Funds’ maximum risk of loss from counterparty risk related to swaps is the fair value of the contract. This risk is mitigated by the posting of collateral by the counterparties to the Funds to cover the Funds’ exposure to the counterparty.
Interest Rate Swaps
A Fund uses interest rate swap contracts to manage its exposure to interest rates. Interest rate swap contracts typically represent the exchange between a Fund and a counterparty of respective commitments to make variable rate and fixed rate payments with respect to a notional amount of principal. Interest rate swap contracts may have a term that is greater than one year, but typically require periodic interim settlement in cash, at which time the specified value of the variable interest rate is reset for the next settlement period. Net payments of interest are recorded as realized gains or losses. During the period that the swap contract is open, the contract is marked-to-market as the net amount due to or from a Fund and changes in the value of swap contracts are recorded as unrealized gains or losses.
Credit Default Swaps
A credit default swap is an agreement whereby one party, the buyer, is obligated to pay the other party, the seller, a periodic stream of payments over the term of the contract in return for a contingent payment upon the occurrence of a credit event with respect to an underlying reference obligation. A Fund might use credit default swap contracts to limit or to reduce risk exposure of the Fund to defaults of corporate and sovereign issues (i.e., to reduce risk when the Fund owns or has exposure to such issuers). A Fund also might use credit default swap contracts to create direct or synthetic short or long exposure to domestic or foreign corporate debt securities or certain sovereign debt securities to which the Fund is not otherwise exposed.
| 2020 Semi-Annual Report |
Notes to Financial Statements (continued)
April 30, 2020 (unaudited)
Summary of Derivative Instruments
Certain Funds may use derivatives for various purposes as noted above. The following is a summary of the location of fair value amounts of derivatives, not accounted for as hedging instruments, as of April 30, 2020:
|
| Location on the Statement of Assets and Liabilities |
| ||
Derivative Instrument Risk Type |
| Asset Derivatives |
| Liability Derivatives |
|
Interest Rate Risk |
| Variation margin receivable for futures contracts |
| Variation margin payable for futures contracts |
|
|
| Variation margin receivable for centrally cleared interest rate swap contracts |
| Variation margin payable for centrally cleared interest rate swap contracts |
|
Foreign Exchange Risk |
| Unrealized appreciation on forward foreign currency exchange contracts |
| Unrealized depreciation on forward foreign currency exchange contracts |
|
Credit Risk |
| Variation margin receivable for centrally cleared credit default swap contracts |
| Variation margin payable for centrally cleared credit default swap contracts |
|
|
|
|
|
|
|
The following is a summary of the fair value of derivative instruments, not accounted for as hedging instruments, as of April 30, 2020:
Total Return Bond Fund |
| Asset Derivatives |
| Liability Derivatives |
| ||||
Derivatives not accounted for as |
|
|
|
|
|
|
| ||
hedging instruments |
| Statement of Assets and |
| Fair Value |
| Statement of Assets and |
| Fair Value |
|
Forward foreign currency exchange contracts (foreign exchange risk) |
| Unrealized appreciation on forward foreign currency exchange contracts |
| $2,077,229 |
| Unrealized depreciation on forward foreign currency exchange contracts |
| $1,620,211 |
|
Futures contracts |
| Variation margin receivable for futures contracts |
| 417,731 |
| Variation margin payable for futures contracts |
| 78,938 |
|
Total |
|
|
| $2,494,960 |
|
|
| $1,699,149 |
|
* The values shown reflect unrealized appreciation/(depreciation) and the values shown in the Statement of Assets and Liabilities reflects variation margin.
Global High Income Fund |
| Asset Derivatives |
| Liability Derivatives |
| ||||
Derivatives not accounted for as |
|
|
|
|
|
|
| ||
hedging instruments |
| Statement of Assets and |
| Fair Value |
| Statement of Assets and |
| Fair Value |
|
Forward foreign currency exchange contracts (foreign exchange risk) |
| Unrealized appreciation on forward foreign currency exchange contracts |
| $23,829 |
| Unrealized depreciation on forward foreign currency exchange contracts |
| $111,119 |
|
Total |
|
|
| $23,829 |
|
|
| $111,119 |
|
2020 Semi-Annual Report |
|
Notes to Financial Statements (continued)
April 30, 2020 (unaudited)
|
|
A reconciliation of the gross amounts on the Statements of Assets and Liabilities as of April 30, 2020 to the net amounts by broker and derivative type, including any collateral received or pledged, is included in the following tables:
|
|
|
| Gross Amounts Not Offset |
|
|
| Gross Amounts Not Offset |
| ||||||||
|
| Gross Amounts |
| Financial |
| Collateral |
| Net Amount(3) |
| Gross Amounts |
| Financial |
| Collateral |
| Net Amount(3) |
|
Description |
| Assets |
| Liabilities |
| ||||||||||||
Total Return Bond Fund |
|
|
|
|
|
|
|
|
|
|
|
|
|
|
|
|
|
Forward foreign currency(2) |
|
|
|
|
|
|
|
|
|
|
|
|
|
|
|
|
|
Barclays Bank |
| $525,768 |
| $(329,018 | ) | $(80,000 | ) | $116,750 |
| $329,018 |
| $(329,018 | ) | $ – |
| $ – |
|
Citibank |
| 391,833 |
| (367,453 | ) | – |
| 24,380 |
| 367,453 |
| (367,453 | ) | – |
| – |
|
Goldman Sachs |
| 239,441 |
| (47,123 | ) | – |
| 192,318 |
| 47,123 |
| (47,123 | ) | – |
| – |
|
HSBC Bank |
| 392,876 |
| (315,227 | ) | (77,649 | ) | – |
| 315,227 |
| (315,227 | ) | – |
| – |
|
JPMorgan Chase |
| 186,593 |
| (186,593 | ) | – |
| – |
| 510,828 |
| (186,593 | ) | (210,000 | ) | 114,235 |
|
Royal Bank of Canada |
| 340,718 |
| (50,562 | ) | – |
| 290,156 |
| 50,562 |
| (50,562 | ) | – |
| – |
|
1. In some instances, the actual collateral received and/or pledged may be more than the amount shown here due to overcollateralization.
2. Includes financial instrument which are not subject to a master netting arrangement across funds, or another similar arrangement.
3. Net amounts represent the net receivables/(payable) that would be due from/to the counterparty in the event of default. Exposure from financial derivative instruments can only be netted across transactions governed under the same master netting agreement with the same legal entity.
|
|
|
| Gross Amounts Not Offset |
|
|
| Gross Amounts Not Offset |
| ||||||||
|
| Gross Amounts |
| Financial |
| Collateral |
| Net Amount(3) |
| Gross Amounts |
| Financial |
| Collateral |
| Net Amount(3) |
|
Description |
| Assets |
| Liabilities |
| ||||||||||||
Global High Income Fund |
|
|
|
|
|
|
|
|
|
|
|
|
|
|
|
|
|
Forward foreign currency(2) |
|
|
|
|
|
|
|
|
|
|
|
|
|
|
|
|
|
Citibank N.A. |
| $ 1,281 |
| $ (1,281 | ) | $– |
| $– |
| $ 3,162 |
| $ (1,281 | ) | $– |
| $ 1,881 |
|
Royal Bank Of Canada (UK) |
| – |
| – |
| – |
| – |
| 3,246 |
| – |
| – |
| 3,246 |
|
UBS AG |
| 22,548 |
| (22,548 | ) | – |
| – |
| 104,711 |
| (22,548 | ) | – |
| 82,163 |
|
1. In some instances, the actual collateral received and/or pledged may be more than the amount shown here due to overcollateralization.
2. Includes financial instrument which are not subject to a master netting arrangement across funds, or another similar arrangement.
3. Net amounts represent the net receivables/(payable) that would be due from/to the counterparty in the event of default. Exposure from financial derivative instruments can only be netted across transactions governed under the same master netting agreement with the same legal entity.
| 2020 Semi-Annual Report |
Notes to Financial Statements (continued)
April 30, 2020 (unaudited)
The effect of derivative instruments on the Statement of Operations for the six-month period ended April 30, 2020:
Aberdeen Total Return Bond Fund |
| Location of Gain or (Loss) on Derivatives |
| Realized Gain or (Loss) on Derivatives |
| Change in Unrealized Appreciation/ (Depreciation) on Derivatives |
|
| Realized/Unrealized Gain/(Loss) from Investments, Futures Contracts and Foreign Currency Transactions |
|
|
|
|
Forward foreign currency exchange contracts |
|
|
|
|
|
|
(foreign exchange risk) |
|
|
| $246,923 |
| $527,611 |
Futures contracts |
|
|
|
|
|
|
(interest rate risk) |
|
|
| 503,458 |
| 438,140 |
Total |
|
|
| $750,381 |
| $965,751 |
Aberdeen Global High Income Fund |
| Location of Gain or (Loss) on Derivatives |
| Realized Gain or (Loss) on Derivatives |
| Change in Unrealized Appreciation/ (Depreciation) on Derivatives |
|
| Realized/Unrealized |
|
|
|
|
Forward foreign currency exchange contracts |
|
|
|
|
|
|
(foreign exchange risk) |
|
|
| $ 491,483 |
| $ 585,774 |
Total |
|
|
| $491,483 |
| $585,774 |
Information about derivatives reflected as of the date of this report is generally indicative of the type of activity for the six-month period ended April 30, 2020. The table below summarizes the weighted average values of derivatives holdings by the Funds during the six-month period ended April 30, 2020.
Fund |
| Purchase Forward Foreign Currency Contracts (Average Notional Value) |
| Sale Forward Foreign Currency Contracts (Average Notional Value) |
| Long Futures Contracts (Average Notional Value) |
| Short Futures Contracts (Average Notional Value) |
|
Total Return Bond Fund |
| $35,391,373 |
| $38,407,905 |
| $36,566,842 |
| $5,215,906 |
|
Global High Income Fund |
| 5,430,954 |
| 38,443,475 |
| – |
| – |
|
The Funds value derivatives at fair value, as described in the results of operations. Accordingly, the Funds do not follow hedge accounting even for derivatives employed as economic hedges.
e. Bank Loans
Global High Income Fund may invest in bank loans. Bank loans include floating and fixed-rate debt obligations. Floating rate loans are debt obligations issued by companies or other entities with floating interest rates that reset periodically. Bank loans may include, but are not limited to, term loans, delayed funding loans, bridge loans and revolving credit facilities. Loan interest will primarily take the form of assignments purchased in the primary or secondary market but may include participants. Floating rate loans are secured by specific collateral of the borrower and are senior to most other securities of the borrower (e.g., common stock or debt instruments) in the event of bankruptcy. Floating rate loans are often issued in connection with recapitalizations, acquisitions, leveraged buyouts, and refinancings. Floating rate loans
2020 Semi-Annual Report |
|
Notes to Financial Statements (continued)
April 30, 2020 (unaudited)
are typically structured and administered by a financial institution that acts as the agent of the lenders participating in the floating rate loan. Floating rate loans may be acquired directly through the agent, as an assignment from another lender who holds a direct interest in the floating rate loan, or as a participation interest in another lender’s portion of the floating rate loan.
Global High Income Fund may enter into, or acquire participation in, delayed funding loans and revolving credit facilities. Delayed funding loans and revolving credit facilities are borrowings in which the Global High Income Fund agrees to make loans up to a maximum amount upon demand by the borrowing issuer for a specified term. A revolving credit facility differs from a delayed funding loan in that as the borrowing issuer repays the loan, an amount equal to the repayment is again made available to the borrowing issuer under the facility. The borrowing issuer may at any time borrow and repay amounts so long as, in the aggregate, at any given time the amount borrowed does not exceed the maximum amount established by the loan agreement. Delayed funding loans and revolving credit facilities usually provide for floating or variable rates of interest.
There are a number of risks associated with an investment in bank loans including credit risk, interest rate risk, illiquid securities risk, and prepayment risk. There is also the possibility that the collateral securing a loan, if any, may be difficult to liquidate or be insufficient to cover the amount owed under the loan. These risks could cause a Fund to lose income or principal on a particular investment, which in turn could affect the return. In addition, bank loans may settle on a delayed basis, resulting in the proceeds from the sale of such loans not being readily available to make additional investments or to meet a Fund’s redemption obligations. To the extent the extended settlement process gives rise to short-term liquidity needs, a Fund may hold additional cash, sell investments or temporarily borrow from banks or other lenders.
f. Security Transactions, Investment Income and Expenses
Security transactions are recorded on the trade date. Realized and unrealized gains/(losses) from security and currency transactions are calculated on the identified cost basis. Dividend income is recorded on the ex-dividend date except for certain dividends on foreign securities, which are recorded as soon as a Fund is informed after the ex-dividend date. Interest income is recorded on an accrual basis using the effective interest method. Expenses are recorded on an accrual basis. Expenses directly attributable to a Fund are charged to that Fund. Expenses not directly attributable to a Fund are allocated proportionately among all Funds of the Trust. For each of the Funds, the method for allocating income, fund level expenses, and realized and unrealized gains or losses among classes is based on the total net asset value of each class’s shares in proportion to the total net assets of the relevant Fund. Expenses specific to a class (such as Rule 12b-1 and Transfer Agent fees) are charged to that class.
g. Foreign Taxes
Funds that invest in foreign securities are subject to foreign taxes that may be imposed by certain countries in which the Funds invest. The Funds generally record foreign taxes based on applicable foreign tax law. The Funds incur withholding taxes on certain foreign dividends and interest, and those taxes are accrued at the time the associated income is recorded. The Funds file withholding tax reclaims in certain jurisdictions to recover a portion of amounts previously withheld. The Funds record a reclaim receivable based on, among other things, a jurisdiction’s legal obligation to pay reclaims as well as payment history and market convention.
The Select International Equity Fund and Global Equity Impact Fund (collectively, the “Equity Funds”) have received payments for Article 63 EU Tax Reclaims related to prior years (2005-2015). The Article 63 EU Tax Reclaim payments received by the Equity Funds from certain EU countries as of the date of this report significantly increased the Select International Equity Fund’s performance on various dates when the payments were received beginning on December 16, 2016 and the Global Equity Impact Fund’s performance on various dates when the payments were received beginning on February 1, 2017. Without these payments, each Equity Fund’s performance would have been lower during this period. In the tax years for which the Equity Funds filed Article 63 EU Tax Reclaims, certain shareholders were able to reduce their federal income taxes based upon the amount of taxes that these Funds paid to foreign jurisdictions. The receipt by the Equity Funds of the tax reclaims from these jurisdictions will also result in tax liability to the relevant Fund to offset the tax benefits that shareholders received in the past, the precise amount of the tax is uncertain and subject to settlement negotiations with the U.S. Internal Revenue Service (“U.S. IRS”). Based on information available as of the date of this report, an estimated tax amount has been accrued and is reflected within each Equity Fund’s net asset value and performance. Furthermore, upon final determination of the U.S. IRS, if the actual tax payable is greater than the amount currently accrued, and subject to the level of assets under management at the time of any subsequent adjustments, the relevant Equity Fund’s expenses, net asset value and performance may be materially adversely impacted. The precise amount of the tax remains uncertain as the matter remains unsettled with the U.S. IRS.
The Equity Funds have Article 63 EU Tax Reclaims outstanding related to prior years (2005-2015). Consistent with U.S. GAAP accrual requirements, the Equity Funds have recognized the Article 63 EU Tax Reclaims when a payment has been received, and have not recorded a receivable amount for any outstanding Article 63 EU Tax Reclaims because there is limited historical precedent for U.S. funds collecting reclaims of this magnitude and the total amount of the reclaims that these funds may receive in the future is uncertain. Any additional amounts to which the Equity Funds may be entitled, if and when recorded, likely would result in an increase in the net asset value per share of
| 2020 Semi-Annual Report |
Notes to Financial Statements (continued)
April 30, 2020 (unaudited)
each fund at that time. In addition, Article 63 EU Tax Reclaims amounts received will be subject to tax. The U.S. IRS has not yet determined the amount of taxes that the Equity Funds must pay on these amounts. For tax accounting purposes, interest payments received on these payments (if any) are treated as income and will be distributed in due course. Additionally, fluctuations in the value of foreign currencies may affect an Equity Fund’s tax liability, because the U.S. IRS may require the Fund to pay any taxes owed on interest payments on Article 63 EU Tax Reclaims amounts in U.S. Dollars based on the foreign currency exchange rate with the applicable jurisdiction that was in effect at the time the Article 63 EU Tax Reclaims amounts were received by the Fund. As of April 30, 2020, the total amount of outstanding reclaims filed by the Equity Funds in the countries that may be affected by the European courts’ decisions (namely, The Netherlands, Spain, Germany, France, and Sweden) represents approximately 9.8% and 12.6%, respectively, of net assets of Select International Equity Fund and Global Equity Impact Fund before the impact of interest or any tax or additional costs incurred in the pursuit of such reclaims. These amounts net of estimated taxes (but excluding the impact of interest or tax on such interest) represent 5.6% and 7.3%, respectively, of net assets of Select International Equity Fund and Global Equity Impact Fund. These percentages will change depending on the fluctuations of the net assets of the Funds. Receipt by a Fund of these amounts will make the Fund’s performance seem higher than it would be as a result of the performance of its portfolio investments.
The payments received on tax reclaims within the period ended April 30, 2020 and from prior periods were as follows:
|
|
|
| Percent of Total |
| Received | |
|
| Amount |
| Net Assets |
| Date Range | |
Select International Equity Fund |
|
|
|
|
|
| |
Withholding Tax Refunds Received from Country: |
|
|
|
|
|
| |
|
|
|
|
|
|
| |
Finland |
| $ | 1,355,000 |
| 0.35%* |
| 5/21/2015 |
Poland |
| 16,452,314 |
| 7.74%** |
| 12/16/16-2/24/2017 | |
Poland |
| 5,504,000 |
| 3.72%**** |
| 12/12/2018-9/4/2019 | |
Global Equity Impact Fund |
|
|
|
|
|
| |
Withholding Tax Refunds Received from Country: |
|
|
|
|
|
| |
|
|
|
|
|
|
| |
Finland |
| $ | 500,000 |
| 0.25%* |
| 5/21/2015 |
Poland |
| 4,400,193 |
| 4.68%** |
| 2/1/2017-2/24/2017 | |
Poland |
| 380,000 |
| 0.59%*** |
| 8/22/2018 | |
Poland |
| 1,011,000 |
| 1.61%**** |
| 2/12/2019-9/4/2019 | |
* As of October 31, 2015
** As of October 31, 2017
*** As of October 31, 2018
**** As of October 31, 2019
h. Distributions
Distributions from net investment income, if any, are declared and paid monthly for the Total Return Bond Fund and Global High Income Fund. Distributions from net investment income, if any, are declared and paid annually for the Select International Equity Fund and Global Equity Impact Fund. The Funds will also declare and pay distributions annually from net realized gains on investment transactions and net realized foreign exchange gains, if any. Dividends and distributions to shareholders are recorded on the ex-dividend date. Additional distributions of net investment income and capital gains may be made at the discretion of the Board to avoid the application of the excise tax imposed under Section 4982 of the Internal Revenue Code of 1986, as amended (the “Code”), for certain undistributed amounts.
Dividends and distributions to shareholders are determined in accordance with federal income tax regulations, which may differ from GAAP. These differences are primarily due to differing treatments of income and gains on various investment securities held by the Funds, timing differences and differing characterization of distributions made by the Funds as a whole.
i. Federal Income Taxes
Each Fund intends to continue to qualify as a “regulated investment company” by complying with the provisions available to certain investment companies, as defined in Subchapter M of the Code, and to make distributions of net investment income and net realized capital gains sufficient to relieve the Funds from all federal income taxes. Therefore, no federal income tax provision is required.
Management of the Funds has concluded that there are no significant uncertain tax positions that would require recognition in the financial statements. Since tax authorities can examine previously filed tax returns, the Funds’ U.S. federal and state tax returns for each of the four fiscal years up to the most recent fiscal year ended October 31, 2019 are subject to such review.
2020 Semi-Annual Report |
|
Notes to Financial Statements (continued)
April 30, 2020 (unaudited)
3. Agreements and Transactions with Affiliates
a. Investment Adviser
Under the Investment Advisory Agreements with the Funds, effective May 22, 2013, the Adviser manages the Funds in accordance with the policies and procedures established by the Board. Prior to May 22, 2013, the Funds were managed by Artio Global Management LLC (the “Predecessor Adviser”), which was acquired by the Adviser’s parent company on May 21, 2013.
For services provided under the terms of the current Investment Advisory Agreement, each Fund pays the Adviser an annual management fee (as a percentage of its average daily net assets) paid monthly according to the following schedule:
Fund |
| Fee Schedule |
|
|
Select International Equity Fund |
| Of the first $500 million |
| 0.800% |
|
| On the next $1.5 billion |
| 0.780% |
|
| Over $2 billion |
| 0.750% |
Global Equity Impact Fund |
| Of the first $500 million |
| 0.800% |
|
| On the next $1.5 billion |
| 0.780% |
|
| Over $2 billion |
| 0.750% |
Total Return Bond Fund |
| On all assets |
| 0.350% |
Global High Income Fund |
| Of the first $5 billion |
| 0.650% |
|
| On the next $2.5 billion |
| 0.630% |
|
| On the next $2.5 billion |
| 0.600% |
|
| Over $10 billion |
| 0.590% |
Effective February 28, 2019, the management fees for the Equity Funds were reduced to the rates noted above. Prior to that date, each of the Equity Funds paid monthly an annual management fee (as a percentage of its average daily net assets) at a rate of 0.90% of the first $5 billion, 0.88% on the next $2.5 billion and 0.85% over $7.5 billion.
The Adviser has engaged the services of an affiliate, Aberdeen Asset Managers Limited, as subadviser on behalf of the Equity Funds (the “Subadviser”), pursuant to the subadvisory agreements. The Subadviser manages a portion of the Equity Funds’ investments and has responsibility for making all investment decisions for the portion of a Fund’s assets that it manages. Pursuant to the subadvisory agreements, the Adviser pays fees to the Subadviser.
The Trust and the Adviser have entered into written contracts (“Expense Limitation Agreements”) limiting operating expenses for all classes of each Fund from exceeding the amounts listed in the table below. For each Fund noted below, this contractual limitation may not be terminated without the approval of the Board until the earlier of (a) the termination of the Investment Advisory Agreement or (b) the end of February, 2021. This limit excludes certain expenses, including taxes, interest, brokerage commissions, and other expenditures which are capitalized in accordance with GAAP, and other extraordinary expenses not incurred in the ordinary course of each Fund’s business.
|
| Class A | Institutional |
Fund |
| Limit | Class Limit |
Select International Equity Fund |
| 1.35% | 1.10% |
Global Equity Impact Fund |
| 1.35% | 1.10% |
Total Return Bond Fund |
| 0.69% | 0.44% |
Global High Income Fund |
| 1.00% | 0.75% |
The Adviser has agreed to continue to waive a portion of its management fee for each of the Funds at the annual rate of 0.005% of the respective Funds’ average daily assets. The waiver may be terminated at any time by the Board.
The Adviser may request and receive reimbursement from a Fund of the advisory fees waived and other expenses reimbursed pursuant to the Expense Limitation Agreements at a later date not to exceed three years from the fiscal year in which the corresponding reimbursement to the Funds was made.
However, no reimbursement will be made for fees waived unless:
(i) the total annual expense ratio of the class making such reimbursement is less than the limit set forth above; and
(ii) the payment of such reimbursement is approved by the Board on a quarterly basis (the “Reimbursement Requirements”).
| 2020 Semi-Annual Report |
Notes to Financial Statements (continued)
April 30, 2020 (unaudited)
If the Board approves any changes in the waiver terms or limitations, reimbursements are only permitted to the extent that the terms of the Expense Limitation Agreements in effect at the time of the waiver are met at the time that reimbursement is approved. Except as provided for in the Expense Limitation Agreements, reimbursement of amounts previously waived or assumed by the Adviser is not permitted.
As of April 30, 2020, to the extent the Reimbursement Requirements are met, the cumulative potential reimbursements for each Fund, based on expenses reimbursed by the Adviser would be:
Fund |
| Amount Fiscal Year 2017 (Expires 10/31/20) |
| Amount Fiscal Year 2018 (Expires 10/31/21) |
| Amount Fiscal Year 2019 (Expires 10/31/22) |
| Amount Six Months Ended April 30, 2020 (Expires 4/30/23) |
| Total* |
Select International Equity Fund |
| $ – |
| $ – |
| $ 92,601 |
| $141,763 |
| $ 234,364 |
Global Equity Impact Fund |
| – |
| – |
| 153,956 |
| 144,163 |
| 298,119 |
Total Return Bond Fund |
| 257,618 |
| 499,844 |
| 462,934 |
| 242,618 |
| 1,463,014 |
Global High Income Fund |
| 525,704 |
| 591,864 |
| 688,255 |
| 373,471 |
| 2,179,294 |
* Amounts reported are due to expire throughout the respective 3-year expiration period presented above.
Amounts listed as “–” are $0 or round to $0.
4. Distributor and Shareholder Services
The Trust and Aberdeen Fund Distributors, LLC (the “Distributor”) are parties to the current Underwriting Agreement (the “Underwriting Agreement”) whereby the Distributor acts as principal underwriter for the Funds’ shares.
The Trust has adopted a Distribution Plan (the “Plan”) pursuant to Rule 12b-1 under the 1940 Act with respect to certain classes of shares. The Plan permits the Funds to compensate the Distributor, for expenses associated with the distribution-related and/or shareholder services provided by such entities. These fees are paid to the Distributor and are either kept or paid to shareholders’ financial advisors or other intermediaries for distribution and shareholder services. Although actual distribution expenses may be more or less, under the Plan, the Funds pay the Distributor an annual fee of 0.25% for Class A shares.
Under its terms, the Plan shall remain in effect from year to year, provided such continuance is approved annually by a vote of a majority of the Board members and a majority of those Board members who are not “interested persons” of the Funds and who have no direct or indirect financial interest in the operation of the Plan or in any agreement related to the Plan.
The Adviser or an affiliate of the Adviser may pay additional amounts from its own resources to dealers or other financial intermediaries, for aid in distribution or for aid in providing administrative services to shareholders.
5. Investment Transactions
Purchases and sales of securities (excluding short-term securities) for the six-month period ended April 30, 2020, were as follows:
Fund |
| Purchases |
| Sales |
Select International Equity Fund |
| $ 32,019,242 |
| $ 44,312,184 |
Global Equity Impact Fund |
| 13,679,109 |
| 20,052,978 |
Total Return Bond Fund |
| 190,174,573 |
| 189,556,410 |
Global High Income Fund |
| 76,906,596 |
| 128,918,428 |
6. Portfolio Investment Risks
a. Asset-Backed Securities Risk
Like traditional fixed income securities, the value of asset-backed securities typically increases when interest rates fall and decreases when interest rates rise. Certain asset-backed securities may also be subject to the risk of prepayment.
b. Bank Loan Risk
There are a number of risks associated with an investment in bank loans including credit risk, interest rate risk, illiquid securities risk, and prepayment risk. There is also the possibility that the collateral securing a loan, if any, may be difficult to liquidate or be insufficient to cover
2020 Semi-Annual Report |
Notes to Financial Statements (continued)
April 30, 2020 (unaudited)
the amount owed under the loan. Bank loans have significantly longer settlement periods (e.g., longer than seven days) than more traditional investments resulting in the proceeds from the sale of such loans not being readily available to make additional investments or to meet a Fund’s redemption obligations. In addition, loans are not registered under the federal securities laws like stocks and bonds, so investors in loans have less protection against improper practices than investors in registered securities. These risks could cause a Fund to lose income or principal on a particular investment, which in turn could affect a Fund’s returns.
c. Country/Regional Focus Risk
Significant exposure to a single country or geographical region involves increased currency, political, regulatory and other risks. Market swings in the targeted country or geographical region likely will have a greater effect on portfolio performance than they would in a more geographically diversified fund.
d. Credit Default Swap Risk
Credit default swap contracts, a type of derivative instrument, involve special risks and may result in losses to the Global High Income Fund. Credit default swap contracts may in some cases be illiquid, and they increase credit risk since the Fund has exposure to both the issuer of the referenced obligation and the counterparty to the credit default swap contracts. Swaps may be difficult to unwind or terminate. The swap market could be disrupted or limited as a result of recent legislation, and these changes could adversely affect the Fund. Additionally, to the extent the Fund sells credit default swap contracts, the Fund effectively adds economic leverage to its portfolio because, in addition to its total net assets, the Fund is subject to investment exposure on the notional amount of the swap in the event of a default of the referenced debt obligation.
e. Cybersecurity Risk
Cybersecurity incidents may allow an unauthorized party to gain access to Fund assets, customer data (including private shareholder information), or proprietary information, or cause the Fund, the Adviser and/or its service providers (including, but not limited to, Fund accountants, custodians, sub-custodians, transfer agents and financial intermediaries) to suffer data breaches, data corruption or lose operational functionality.
f. Derivatives Risk (Including Options, Futures and Swaps)
Derivatives are speculative and may hurt a Fund’s performance. The potential benefits to be derived from the Fund’s options, futures and derivatives strategy are dependent upon the portfolio managers’ ability to discern pricing inefficiencies and predict trends in markets, which decisions could prove to be inaccurate.
Hedged Exposure Risk – Losses generated by a derivative or practice used by a Fund for hedging purposes should be substantially offset by gains on the hedged investment depending on the degree of correlation between the hedging instrument and the assets hedged. However, while hedging can reduce or eliminate losses, it can also reduce or eliminate gains.
Correlation Risk – A Fund is exposed to the risk that changes in the value of a hedging instrument will not match those of the investment being hedged.
Counterparty Risk – Derivative transactions depend on the creditworthiness of the counterparty and the counterparty’s ability to fulfill its contractual obligations.
Speculative Exposure Risk – To the extent that a derivative or practice is not used as a hedge, a Fund is directly exposed to its risks. Gains or losses from speculative positions in a derivative may be much greater than the derivative’s original cost. For example, potential losses from writing uncovered call options and from speculative short sales are unlimited.
g. Emerging Markets Risk
The Funds are subject to Emerging Markets Risk. This is a magnification of the risks that apply to foreign investments. These risks are greater for securities of companies in emerging market countries because the countries may have less stable governments, more volatile currencies and less established markets (see “Foreign Securities Risk” below).
h. Equity Securities Risk
The stock or other security of a company may not perform as well as expected, and may decrease in value, because of factors related to the company (such as poorer than expected earnings or certain management decisions) or to the industry in which the company is engaged (such as a reduction in the demand for products or services in a particular industry).
| 2020 Semi-Annual Report |
Notes to Financial Statements (continued)
April 30, 2020 (unaudited)
i. Fixed Income Securities Risk
Fixed income securities are subject to, among other risks, credit risk, extension risk, issuer risk, interest rate risk, market risk and prepayment risk.
j. Foreign Currency Exposure Risk
The value of foreign currencies relative to the U.S. Dollar fluctuates in response to market, economic, political, regulatory, geopolitical or other conditions. A decline in the value of a foreign currency versus the U.S. Dollar reduces the value in U.S. Dollars of investments denominated in that foreign currency. This risk may impact a Fund more greatly to the extent the Fund does not hedge its currency risk, or hedging techniques used by the Adviser are unsuccessful.
k. Foreign Securities Risk
Foreign countries in which the Fund may invest may have markets that are less liquid, less regulated and more volatile than U.S. markets. The value of the Fund’s investments may decline because of factors such as unfavorable or unsuccessful government actions, reduction of government or central bank support and political or financial instability. To the extent a Fund focuses its investments in a single country or only a few countries in a particular geographic region, economic, political, regulatory or other conditions affecting such country or region may have a greater impact on Fund performance relative to a more geographically diversified fund.
l. High-Yield Bonds and Other Lower-Rated Securities Risk
A Fund’s investments in high-yield bonds (commonly referred to as “junk bonds”) and other lower-rated securities will subject the Fund to substantial risk of loss. Investments in high-yield bonds are speculative and issuers of these securities are generally considered to be less financially secure and less able to repay interest and principal than issuers of investment-grade securities. Prices of high-yield bonds tend to be very volatile. These securities are less liquid than investment-grade debt securities and may be difficult to price or sell, particularly in times of negative sentiment toward high-yield securities.
m. Illiquid Securities Risk
Illiquid securities are assets which may not be sold or disposed of in the ordinary course of business within seven days at approximately the price at which a Fund has valued the investment on its books and may include such securities as those not registered under U.S. securities laws or securities that cannot be sold in public transactions. An inability to sell a portfolio position can adversely affect a Fund’s value or prevent the Fund from being able to take advantage of other investment opportunities. Over recent years, the capacity of dealers to make markets in fixed income securities has been outpaced by the growth in the size of the fixed income markets. Liquidity risk may be magnified in a rising interest rate environment or when investor redemptions from fixed income funds may be higher than normal, due to the increased supply in the market that would result from selling activity.
The Adviser employs procedures and tests using third-party and internal data inputs that seek to assess and manage the liquidity of the Fund’s portfolio holdings. These procedures and tests take into account the Fund’s investment strategy and liquidity of portfolio investments during both normal and foreseeable stressed conditions, cash-flow projections during both normal and reasonable foreseeable stressed conditions, relevant market, trading and other factors, and monitor whether liquidity should be adjusted based on changed market conditions. These procedures and tests are designed to assist the Fund in determining its ability to meet redemption requests in various market conditions. In light of the dynamic nature of markets, there can be no assurance that these procedures and tests will enable the Fund to ensure that it has sufficient liquidity to meet redemption requests.
n. Impact Investing Risk
In implementing the Fund’s ESG (Environmental, Social and Governance) investment strategy, the Adviser may select or exclude securities of issuers in certain industries, sectors, regions or countries for reasons other than the issuer’s investment performance. For this reason, the Fund may underperform other funds that do not implement an ESG strategy. ESG investing is qualitative and subjective by nature. In addition, the Fund may be required to sell a security when it might otherwise be disadvantageous for it to do so. Securities of companies with ESG practices may shift into and out of favor depending on market and economic conditions. The definition of “impact investing” will vary according to an investor’s beliefs and values. There is no guarantee that the Adviser’s definition of impact investing, security selection criteria or investment judgment will reflect the beliefs or values of any particular investor.
o. Interest Rate Risk
A Fund’s fixed income investments are subject to interest rate risk, which generally causes the value of a fixed income portfolio to decrease when interest rates rise resulting in a decrease in the Fund’s net assets. The Fund may be subject to a greater risk of rising interest rates due to the recent period of historically low rates and the effect of potential government fiscal policy initiatives and resulting market reaction to those initiatives. Interest rate fluctuations tend to have a greater impact on fixed income-securities with a greater time to maturity and/or
2020 Semi-Annual Report |
Notes to Financial Statements (continued)
April 30, 2020 (unaudited)
lower coupon. A fund with a longer average portfolio duration will be more sensitive to changes in interest rates than a fund with a shorter average portfolio duration. In periods of market volatility, the market values of fixed income securities may be more sensitive to changes in interest rates.
p. Issuer Risk
The value of a security may decline for reasons directly related to the issuer, such as management performance, financial leverage and reduced demand for the issuer’s goods or service.
q. Large-Cap Securities Risk
Stocks issued by large cap companies subject a Fund to the risk that those stocks may underperform stocks issued by companies with smaller capitalizations or the market as a whole.
r. Leverage Risk
Certain transactions may give rise to a form of leverage. Such transactions may include, among others, loans of securities, and the use of when-issued, delayed delivery or forward commitment transactions. The use of derivatives may also cause leveraging risk.
s. Management Risk
Each Fund is subject to the risk that the Adviser or Sub-adviser may make poor security selections. The Adviser or Sub-adviser and their portfolio managers apply their own investment techniques and risk analyses in making investment decisions for the Funds, and there can be no guarantee that these decisions will achieve the desired results for the Funds. In addition, the Adviser of Sub-adviser may select securities that underperform the relevant market of other funds with similar investment objectives and strategies.
t. Market Risk
Deteriorating market conditions might cause a general weakness in the market that reduces the prices of securities in that market in which a Fund invests.
u. Mid-Cap Securities Risk
Securities of medium-sized companies tend to be more volatile and less liquid than securities of larger companies.
v. Mortgage-Related Securities Risk
The Total Return Bond Fund may invest in mortgage-related securities. Rising interest rates may cause an issuer to exercise its right to pay principal later than expected which tends to extend the duration of mortgage-related securities, making them more sensitive to changes in interest rates. As a result, in a period of rising interest rates, a fund that holds mortgage-related securities may exhibit additional volatility. This is known as extension risk. In addition, mortgage-related securities are subject to prepayment risk. When interest rates decline, borrowers may pay off their mortgages sooner than expected. This can reduce the returns of the Fund because the Fund will have to reinvest that money at the lower prevailing interest rates.
w. Municipal Securities Risk
Certain Funds may invest in municipal bonds which may be significantly affected by political and economic changes, including inflation, as well as uncertainties in the municipal market related to taxation, legislative changes, or the rights of municipal security holders. Municipal Bonds have varying levels of sensitivity to changes in interest rates. In general, the price of a Municipal Bond can fall when interest rates rise and can rise when interest rates fall. Interest rate risk is generally lower for shorter-term Municipal Bonds and higher for long term Municipal Bonds. Under certain market conditions, the Adviser may purchase Municipal Bonds that the Adviser perceives are undervalued. Undervalued Municipal Bonds are subject to the same market volatility and principal and interest rate risks described above. Lower quality Municipal Bonds involve greater risk of default or price changes due to changes in the credit quality of the issuer. The value of lower quality Municipal Bonds often fluctuates in response to political or economic developments and can decline significantly over short periods of time or during periods of general or regional economic difficulty. In the case of tax-exempt Municipal Bonds, if the Internal Revenue Service or state tax authorities determine that an issuer of a tax-exempt Municipal Bond has not complied with applicable tax requirements, interest from the security could become taxable at the federal, state and/or local level, and the security could decline significantly in value. Municipal Bonds are subject to credit or default risk. Credit risk is the risk that the issuer of a municipal security might not make interest and principal payments on the security as they become due.
| 2020 Semi-Annual Report |
Notes to Financial Statements (continued)
April 30, 2020 (unaudited)
x. Portfolio Turnover Risk
The Total Return Bond Fund may engage in active and frequent trading of portfolio securities to achieve its investment objective. High portfolio turnover necessarily results in greater transaction costs which may reduce Fund performance. It may also result in greater realization of gains, which may include short-term gains taxable at ordinary income tax rates.
y. Private Placements and Other Restricted Securities Risk
Investments in private placements and other restricted securities, including Regulation S Securities and Rule 144A Securities, could have the effect of increasing a Fund’s level of illiquidity. Private placements and restricted securities may be less liquid than other investments because such securities may not always be readily sold in broad public markets and a Fund might be unable to dispose of such securities promptly or at prices reflecting their true value.
z. Sector Risk
To the extent that a Fund has a significant portion of its assets invested in securities of companies conducting business in a broadly related group of industries within an economic sector, the Fund may be more vulnerable to unfavorable developments in that economic sector than Funds that invest more broadly. Specifically, to the extent that the Global Equity Impact Fund invests in health care and industrials, and Select International Equity Fund invest in industrials, these Funds will be more vulnerable to the risks of these industries.
aa. Small-Cap Securities Risk
Securities of smaller companies are usually less stable in price and less liquid than those of larger, more established companies. Therefore, they generally involve greater risk.
bb. Sovereign Debt Risk
Periods of economic and political uncertainty may result in the illiquidity and increased price volatility of a foreign government’s debt securities held by a Fund and impact an issuer’s ability and willingness to pay interest or repay principal when due. A Fund may have limited recourse to compel payment in the event of a default. A foreign government’s default on its debt securities may cause the value of securities held by a Fund to decline significantly.
cc. Valuation Risk
The price that a Fund could receive upon the sale of any particular portfolio investment may differ from the Fund’s valuation of the investment, particularly for securities that trade in thin or volatile markets or that are valued using a fair valuation methodology or a price provided by an independent pricing service. As a result, the price received upon the sale of an investment may be less than the value ascribed by a Fund, and such Fund could realize a greater than expected loss or lesser than expected gain upon the sale of the investment. A Fund’s ability to value its investments may also be impacted by technological issues and/or errors by pricing services or other third-party service providers.
dd. Variable and Floating Rate Securities Risk
For floating and variable rate obligations, there may be a lag between an actual change in the underlying interest rate benchmark and the reset time for an interest payment of such an obligation, which could harm or benefit a Fund, depending on the interest rate environment or other circumstances.
Please read the prospectus for more detailed information regarding these and other risks.
ee. LIBOR Risk
A Fund may invest in certain debt securities, derivatives or other financial instruments that utilize LIBOR as a “benchmark” or “reference rate” for various interest rate calculations. In July 2017, the United Kingdom Financial Conduct Authority, which regulates LIBOR, announced a desire to phase out the use of LIBOR by the end of 2021. Although financial regulators and industry working groups have suggested alternative reference rates, such as European Interbank Offer Rate (“EURIBOR”), Sterling Overnight Interbank Average Rate (“SONIA”) and Secured Overnight Financing Rate (“SOFR”), global consensus on alternative rates is lacking and the process for amending existing contracts or instruments to transition away from LIBOR remains unclear. The elimination of LIBOR or changes to other reference rates or any other changes or reforms to the determination or supervision of reference rates could have an adverse impact on the market for, or value of, any securities or payments linked to those reference rates, which may adversely affect a Fund’s performance and/or net asset value. Uncertainty and risk also remain regarding the willingness and ability of issuers and lenders to include revised provisions in new and existing contracts or instruments. Consequently, the transition away from LIBOR to other reference rates may lead to increased volatility and illiquidity in markets that are tied to LIBOR, fluctuations in values of LIBOR-related investments or investments in issuers that utilize LIBOR, increased difficulty in borrowing or refinancing and diminished effectiveness of hedging strategies, adversely affecting a Fund’s performance. Furthermore, the risks associated with the expected discontinuation of LIBOR and transition may be exacerbated if the work necessary to effect an orderly transition
2020 Semi-Annual Report |
Notes to Financial Statements (continued)
April 30, 2020 (unaudited)
to an alternative reference rate is not completed in a timely manner. Because the usefulness of LIBOR as a benchmark could deteriorate during the transition period, these effects could occur prior to the end of 2021.
7. Contingencies
In the normal course of business, the Funds may provide general indemnifications pursuant to certain contracts and organizational documents. The Funds’ maximum exposure under these arrangements is dependent on future claims that may be made against the Funds, and therefore, cannot be estimated; however, the Funds expects the risk of loss from such claims to be remote.
8. Tax Information
As of April 30, 2020, the tax cost of securities and the breakdown of unrealized appreciation/(depreciation) for each Fund were as follows:
|
| Tax Cost of |
| Unrealized |
| Unrealized |
| Net | ) |
Select International Equity Fund |
| $135,399,306 |
| $10,315,983 |
| $(27,204,241 | ) | $(16,888,258 | ) |
Global Equity Impact Fund |
| 55,953,579 |
| 5,058,056 |
| (4,744,738 | ) | 313,318 |
|
Total Return Bond Fund |
| 185,683,564 |
| 8,887,281 |
| (5,281,790 | ) | 3,605,491 |
|
Global High Income Fund |
| 161,394,537 |
| 1,921,312 |
| (19,117,769 | ) | (17,196,457 | ) |
The tax character of distributions paid during the fiscal year ended October 31, 2019 was as follows (total distributions paid may differ from the Statements of Changes in Net Assets because for tax purposes dividends are recognized when actually paid):
|
| Distributions paid from |
| ||||||||||
Fund |
| Ordinary |
| Net Long Term |
| Total |
| Tax Exempt |
| Return of |
| Total |
|
Select International Equity Fund |
| $ 1,282,264 |
| $– |
| $ 1,282,264 |
| $– |
| $ – |
| $ 1,282,264 |
|
Global Equity Impact Fund |
| 1,126,987 |
| – |
| 1,126,987 |
| – |
| – |
| 1,126,987 |
|
Total Return Bond Fund |
| 4,944,609 |
| – |
| 4,944,609 |
| – |
| – |
| 4,944,609 |
|
Global High Income Fund |
| 15,449,362 |
| – |
| 15,449,362 |
| – |
| 2,014,246 |
| 17,463,608 |
|
Amounts listed as “–“ are $0 or round to $0.
As of October 31, 2019, the components of accumulated earnings/(deficit) on a tax basis were as follows:
Fund |
| Undistributed |
| Undistributed |
| Undistributed |
| Accumulated |
| Distributions |
| Late Year |
| Other |
| Unrealized |
| Accumulated |
| Total | ) |
Select International Equity Fund |
| $– |
| $5,979,259 |
| $– |
| $– |
| $– |
| $– |
| $ – |
| $904,329 |
| $(417,676,953 | ) | $(410,793,365 | ) |
Global Equity Impact Fund |
| – |
| 1,294,955 |
| – |
| – |
| – |
| – |
| (1,991 | ) | 2,979,830 |
| (25,959,531 | ) | (21,686,737 | ) |
Total Return Bond Fund |
| – |
| 736,857 |
| – |
| – |
| – |
| – |
| – |
| 4,415,001 |
| (925,420 | ) | 4,226,438 |
|
Global High Income Fund |
| – |
| – |
| – |
| – |
| – |
| – |
| – |
| 2,679,669 |
| (235,303,374 | ) | (232,623,705 | ) |
* The difference between the book-basis and tax-basis unrealized appreciation/(depreciation) is attributable primarily to tax deferral of losses on wash sales.
** As of October 31, 2019, for Federal income tax purposes, these Funds have capital loss carryforwards available to offset capital gains, if any, to the extent provided by the Treasury regulations, with no expiration.
| 2020 Semi-Annual Report |
Notes to Financial Statements (continued)
April 30, 2020 (unaudited)
As of October 31, 2019, for federal tax purposes, capital loss carryforwards, as shown in the table below, were available to the extent provided by the regulations to offset future realized gains on each respective fund throughout the years indicated.
Fund |
| Amount |
| Expires |
|
Select International Equity Fund |
| $ 15,747,962 |
| Unlimited (Short-Term) |
|
Select International Equity Fund |
| 401,928,991 |
| Unlimited (Long-Term) |
|
Global Equity Impact Fund |
| 1,077,952 |
| Unlimited (Short-Term) |
|
Global Equity Impact Fund |
| 24,881,579 |
| Unlimited (Long-Term) |
|
Total Return Bond Fund |
| 925,420 |
| Unlimited (Long-Term) |
|
Global High Income Fund |
| 53,779,090 |
| Unlimited (Short-Term) |
|
Global High Income Fund |
| 181,524,284 |
| Unlimited (Long-Term) |
|
9. Significant Shareholders
As of April 30, 2020, the Funds had shareholders with the percentage ownership indicated, which are considered significant shareholders (holdings greater than 5.0%) for financial reporting purposes:
Fund |
| Record |
| Number of |
|
Select International Equity Fund |
| 69.1% |
| 3 |
|
Global Equity Impact Fund |
| 52.1 |
| 3 |
|
Total Return Bond Fund |
| 65.6 |
| 6 |
|
Global High Income Fund |
| 66.9 |
| 6 |
|
10. Line of Credit
The Trust on behalf of each of the Funds noted in the table below (the “Borrowers”) entered into a Credit Agreement (the “Agreement”) with State Street Bank and Trust Company (the “Bank”). The Agreement provides for a revolving credit facility (the “Credit Facility”) to be utilized for temporary or emergency purposes to fund shareholder redemptions or for other short-term liquidity purposes. The amount of the Credit Facility was $25,000,000 for the portion of the reporting period ended April 13, 2020. On April 13, 2020, the Borrowers amended the Credit Facility to add the Global High Income Fund as an additional borrower and to increase the amount of the Credit Facility to $40,000,000. The Funds may draw up to their stated sublimit (subject to certain other limitations therein):
|
| Sublimit |
| Average Outstanding |
| Average Weighted |
| Days |
|
Select International Equity Fund |
| $25,000,000 |
| $379,167 |
| 2.88% |
| 6 |
|
Global Equity Impact Fund |
| 25,000,000 |
| 197,494 |
| 2.90 |
| 13 |
|
In addition, the Trust on behalf of the Global High Income Fund entered into a separate Credit Agreement (the “Global High Income Fund Credit Agreement”) with the Bank. The Global High Income Fund Credit Agreement provides for a revolving credit facility (the “Global High Income Fund Credit Facility”) to be utilized for temporary or emergency purposes to fund shareholder redemptions or for other short-term liquidity purposes. The amount of the Global High Income Fund Credit Facility was $40,000,000 for the six-month period ended April 30,
2020. The Global High Income Fund may draw the entire $40,000,000 (subject to certain limitations) until April 13, 2020. Effective April 13, 2020, the Global High Income Fund Credit Facility was terminated and the Global High Income Fund was added as an additional borrower to the Credit Facility, as noted above, which is also in the amount of $40,000,000. Under the Global High Income Fund Credit Facility, the Global High Income Fund was permitted to draw the entire $40,000,000 (subject to certain limitations). Under the Credit Facility, each Borrower is limited in the amounts that can be drawn by limitations stated therein.
|
| Sublimit |
| Average Outstanding |
| Average Weighted |
| Days |
|
Global High Income Fund |
| $40,000,000 |
| $4,914,457 |
| 2.93% |
| 17 |
|
Principal on each outstanding loan made under the Agreement and the Global High Income Fund Credit Agreement bears the interest at a variable rate per annum equal to the higher of (a) the Federal Funds Rate as in effect on that day (not less than zero) plus 1.25% or (b) the One-Month
2020 Semi-Annual Report |
|
Notes to Financial Statements (concluded)
April 30, 2020 (unaudited)
London Interbank Offered Rate (“LIBOR”) as in effect on that day (not less than zero) plus 1.25%. In addition, the Borrowers shall pay to the Bank a commitment fee at the rate of 0.25% per annum on the daily unused portion of each of the Credit Facility or Global High Income Fund Credit Facility, as applicable, which is allocated among the Borrowers in such manner as is determined by the Board to be reasonable. In 2017, the head of the United Kingdom’s Financial Conduct Authority announced a desire to phase out the use of LIBOR by the end of 2021. There remains uncertainty regarding the future utilization of LIBOR and the nature of any replacement reference rate. As such, the potential effect of a transition away from LIBOR on the Fund’s payment obligations under the revolving credit facility cannot yet be determined.
11. Subsequent Events
Management has evaluated the need for disclosures and/or adjustments resulting from subsequent events through the date the financial statements were issued. Based on this evaluation, no disclosures and/or adjustments were required to the financial statements as of April 30, 2020.
| 2020 Semi-Annual Report |
Shareholder Expense Examples (Unaudited)
As a shareholder of the Aberdeen Investment Funds you incur ongoing costs, including investment advisory fees, shareholder service fees, distribution fees and other Fund expenses. The examples below are intended to help you understand your ongoing costs (in dollars) of investing in the Funds and to compare these costs with the ongoing costs of investing in other mutual funds.
The examples assume that you had a $1,000 investment in the Class at the beginning of the reporting period, November 1, 2019 and continued to hold your shares at the end of the reporting period, April 30, 2020.
Actual Expenses
The table below provides information about actual account values and actual expenses. You may use the information together with the amount you invested, to estimate the expenses that you paid over the period. Simply divide your account value by $1,000 (for example, an $8,600 account value divided by $1,000 = 8.6), then multiply the result by the number under the heading entitled “Actual Expenses Paid During Period” for the class of a Fund that you own to estimate the expenses you paid on your account during the period.
Hypothetical Example for Comparison Purposes
The table below provides information about hypothetical account values and hypothetical expenses based on the Class’ actual expense ratio and an assumed rate of return of 5% per year before expenses, which is not the Class’ actual return. The hypothetical account values and expenses may not be used to estimate the actual ending account balance or expenses you paid for the period. You may use this information to compare the ongoing costs of investing in the Class of a Fund and other funds. To do so, compare the 5% hypothetical example with the 5% hypothetical examples that appear in the shareholder reports of the other funds.
|
|
|
| Beginning Account |
| Actual April 30, 2020 |
| Hypothetical |
| Actual Expenses |
| Hypothetical |
| Annualized |
|
Select International Equity Fund |
| Class A |
| $1,000.00 |
| $ 847.90 |
| $1,018.15 |
| $6.20 |
| $6.77 |
| 1.35% |
|
|
| Institutional Class |
| $1,000.00 |
| $ 848.70 |
| $1,019.39 |
| $5.06 |
| $5.52 |
| 1.10% |
|
Global Equity Impact Fund |
| Class A |
| $1,000.00 |
| $ 967.80 |
| $1,018.15 |
| $6.61 |
| $6.77 |
| 1.35% |
|
|
| Institutional Class |
| $1,000.00 |
| $ 968.80 |
| $1,019.39 |
| $5.38 |
| $5.52 |
| 1.10% |
|
Total Return Bond Fund |
| Class A |
| $1,000.00 |
| $1,042.80 |
| $1,021.43 |
| $3.50 |
| $3.47 |
| 0.69% |
|
|
| Institutional Class |
| $1,000.00 |
| $1,043.90 |
| $1,022.68 |
| $2.24 |
| $2.21 |
| 0.44% |
|
Global High Income Fund |
| Class A |
| $1,000.00 |
| $ 907.20 |
| $1,019.84 |
| $4.79 |
| $5.07 |
| 1.01% |
|
|
| Institutional Class |
| $1,000.00 |
| $ 908.80 |
| $1,021.08 |
| $3.61 |
| $3.82 |
| 0.76% |
|
* Expenses are equal to the Fund’s annualized expense ratio multiplied by the average account value over the period multiplied by 182/366 (to reflect the one-half year period).
1 Represents the hypothetical 5% return before expenses.
2020 Semi-Annual Report |
|
Liquidity Risk Management Program (Unaudited)
The Funds have adopted and implemented a liquidity risk management program (the “Liquidity Program”) consistent with the requirements of Rule 22e-4 under the 1940 Act (the “Liquidity Rule”). “Liquidity Risk” is defined as the risk that a fund could not meet redemption requests “without significant dilution of remaining investors’ interests in the fund.” Aberdeen Standard Investments Inc., the investment adviser and administrator to the Funds, has been approved and designated by the Board of Trustees (the “Board”) as the administrator of the Liquidity Program (the “Administrator”) and has retained a third party to perform certain functions, including liquidity analytics and providing market data. The Administrator has formed a Liquidity Risk Management Committee (the “Committee”) to help implement and carry out the day-to-day operations of the Liquidity Program.
As required by the Liquidity Rule, at a meeting on April 22, 2020, the Board received a written annual report on the operation and effectiveness of the Liquidity Program for the period from February 1, 2019 to January 31, 2020 (the “Reporting Period”). The annual report provided, among other items, an overview of the Liquidity Program including:
· information regarding the Committee and the monthly discussions by the Committee of various items including, but not limited to, the following:
o Review and analysis of appropriate liquidity categories for portfolio investments
o Review of highly liquid investment minimum (“HLIM”) and reasonably anticipated trading sizes (“RATS”)
o Review of current and upcoming market events, such as market closures, that may impact liquidity
o Review of large shareholder concentrations that may impact liquidity in the event of redemption
· the monitoring and classification of portfolio holdings in four liquidity categories (including the operation of the HLIM and any breaches); and
· enhancements to the Liquidity Program during the Reporting Period, which included:
o monthly liquidity reports being provided to portfolio managers
o changes to the Liquidity Program to address regulatory guidance relating to the closure of a foreign securities market for seven or more calendar days due to a foreign holiday.
The annual report concluded that the Liquidity Program was reasonably designed to assess and manage the Funds’ Liquidity Risk pursuant to the Liquidity Rule.
There can be no assurance that the Liquidity Program will achieve its objectives under all circumstances in the future. Please refer to your Fund’s Prospectus and Statement of Additional Information for more information regarding the risks of investing in a Fund, including a Fund’s exposure to liquidity risk and other risks to which the Funds may be subject.
| 2020 Semi-Annual Report |
Rev. 05/2019
FACTS | WHAT DO ABERDEEN FUNDS DO WITH YOUR PERSONAL INFORMATION? |
| ||||
Why? | Financial companies choose how they share your personal information. Federal law gives consumers the right to limit some but not all sharing. Federal law also requires us to tell you how we collect, share and protect your personal information. Please read this notice carefully to understand what we do. | |||||
What? | The types of personal information we collect and share depend on the product or service you have with us. The information can include: · Social Security/ Social Insurance number and account balance · Transaction history · Assets and Income · Investment experience · Checking account information and wire transfer instructions | |||||
How? | All financial companies need to share customers’ personal information to run their everyday business. In the section below, we list the reasons financial companies can share their customers’ personal information; the reasons ASI choose to share; and whether you can limit this sharing. We do not disclose nonpublic personal information about our clients or former clients to third parties other than as described below. Where Aberdeen Funds does share personal information with a trusted third party, it does so under strict terms that require the information to be used only for the purpose for which it was disclosed, kept confidential and protected by appropriate security safeguards. | |||||
|
|
|
| |||
Reasons we can share your personal | Do Aberdeen | Can you limit this |
| |||
For our everyday business purposes – | Yes | No |
| |||
For our marketing purposes – | Yes | Yes |
| |||
For joint marketing with our financial companies | No | We don’t share |
| |||
For our affiliate’s everyday business purposes – | Yes | No |
| |||
For our affiliate’s everyday business purposes – | No | We don’t share |
| |||
For our affiliates to market to you | No | We don’t share |
| |||
For our nonaffiliates to market to you | No | We don’t share |
| |||
To limit our sharing | · For queries related to Closed End Funds, please call 1-800-522-5465. For queries related to Aberdeen Funds and Aberdeen Investment Funds, please call 877-332-7806. |
| ||||
Questions? | www.aberdeenstandard.com |
| ||||
Page 2 |
|
Who we are |
|
Who is providing this notice? | ASI’s North American Funds (collectively referred to as “Aberdeen Funds”) |
What we do |
|
How does ASI protect my personal information? | To protect your personal information from unauthorized access and use, we use security measures that comply with federal law. These measures include computer safeguards and secured files and buildings. |
How does ASI collect my personal information? | We collect your personal information through various means for example, when you: · Open an account or give us your contact information · Seek advice about your investments or make deposits or withdrawals from your account · Enter into an investment advisory contract · Buy securities or interests in a fund from us · Tell us where to send money We also collect your personal information from others, such as credit bureaus, affiliates, or other companies. |
Why can’t I limit all sharing? | US Federal Law gives you the right to limit only: · Sharing for ASI and affiliates’ everyday business purposes – information about your creditworthiness · Affiliates from using your information to market to you · Sharing for nonaffiliates to market to you State or Provincial laws and individual companies may give you additional rights to limit sharing. In order to provide you with the services for which you have engaged ASI, the company relies on a number of third parties to provide support services, including profession, legal, accounting and technical support. |
What happens when I limit sharing for an account I hold jointly with someone else? | Your choices will apply to everyone on your account. |
Definitions |
|
Affiliates | Companies related by common ownership or control. They can be financial and nonfinancial companies. · Our affiliates include subsidiaries of Standard Life Aberdeen plc, a global financial services company. |
Nonaffiliates | Companies not related by common ownership and control. They can be financial and nonfinancial companies. · Aberdeen Funds does not share personal information with nonaffiliates so they can market to you. |
Joint marketing | A formal agreement between nonaffiliated financial companies that together market financial products or services to you. · Aberdeen Funds don’t jointly market. |
Other important information | |
This Privacy Notice is being provided by Aberdeen Funds and Aberdeen Investment Funds, each a U.S.-registered open-end investment company, and North-American-registered closed-end investment companies managed by Aberdeen Standard Investments Inc. or its affiliates (collectively, North American Funds). | |
Management Information
Trustees
Antoine Bernheim, Chairman
Thomas Gibbons
Bev Hendry
Peter Wolfram
Investment Adviser
Aberdeen Standard Investments Inc.
1900 Market Street, Suite 200
Philadelphia, PA 19103
Transfer Agent
DST Asset Manager Solutions, Inc.
430 W. 7th Street Ste. 219534
Kansas City, MO 64105-1407
Distributor
Aberdeen Fund Distributors LLC
1900 Market Street, Suite 200
Philadelphia, PA 19103
Fund Administrator, Custodian & Fund Accountant
State Street Bank and Trust Company
1 Lincoln Street
Boston, MA 02111
Independent Registered Public Accounting Firm
KPMG LLP
1601 Market Street
Philadelphia, PA 19103
Fund Counsel
Sidley Austin LLP
787 Seventh Avenue
New York, NY 10019
Aberdeen Standard Investments Inc. |
|
1900 Market Street, Suite 200 |
|
Philadelphia, PA 19103 |
|
aberdeenstandard.com/us |
|
|
|
AOE-0377-SAR |
Item 2. Code of Ethics.
Not applicable — for annual reports only.
Item 3. Audit Committee Financial Expert.
Not applicable — for annual reports only.
Item 4. Principal Accountant Fees and Services.
Not applicable — for annual reports only.
Item 5. Audit Committee of Listed Registrants.
Not applicable.
Item 6. Investments
(a) Included as part of the Reports to Shareholders filed under Item 1 of this Form N-CSR.
(b) Not applicable.
Item 7. Disclosure of Proxy Voting Policies and Procedures for Closed-End Management Investment Companies.
Not applicable.
Item 8. Portfolio Managers of Closed-end Management Investment Companies.
Not applicable.
Item 9. Purchases of Equity Securities by Closed-End Management Investment Company and Affiliated Purchasers.
Not applicable.
Item 10. Submission of Matters to a Vote of Security Holders.
During the period ended April 30, 2020, there were no material changes to the procedures by which shareholders may recommend nominees to the Registrant’s Board of Trustees.
Item 11. Controls and Procedures.
(a) The Registrant’s principal executive and principal financial officers, or persons performing similar functions, have concluded that the Registrant’s disclosure controls and procedures (as defined in Rule 30a-3(c) under the Investment Company Act of 1940 (the “Act”) (17 CFR 270.30a-3(c))) are effective, as of a date within 90 days of the filing date of the report that includes the disclosure required by this paragraph, based on the evaluation of these controls and procedures required by Rule 30a-3(b) under the Act (17 CFR 270.30a-3(b)) and Rule 13a-15(b) or 15d-15(b) under the Securities Exchange Act of 1934 (17 CFR 240.13a-15(b) or 240.15d-15(b)).
(b) There were no changes in the Registrant’s internal control over financial reporting (as defined in Rule 30a-3(d) under the Act (17 CFR 270.30a-3(d)) that occurred during the period covered by this report that has materially affected, or are reasonably likely to materially affect, the Registrant’s internal control over financial reporting.
Item 12. Disclosure of Securities Lending Activities for Closed-End Management Investment Companies.
Not applicable.
Item 13. Exhibits.
(a)(1) Not applicable.
(a)(3) Not applicable.
(a)(4) Not applicable.
SIGNATURES
Pursuant to the requirements of the Securities Exchange Act of 1934 and the Investment Company Act of 1940, as amended, the Registrant has duly caused this report to be signed on its behalf by the undersigned, thereunto duly authorized.
Aberdeen Investment Funds
By: | /s/ Bev Hendry |
|
Bev Hendry |
| |
Principal Executive Officer of |
| |
Aberdeen Investment Funds |
| |
Date: July 1, 2020 |
Pursuant to the requirements of the Securities Exchange Act of 1934 and the Investment Company Act of 1940, as amended, this report has been signed below by the following persons on behalf of the Registrant and in the capacities and on the dates indicated.
By: | /s/ Bev Hendry |
|
Bev Hendry |
| |
Principal Executive Officer of |
| |
Aberdeen Investment Funds |
| |
Date: July 1, 2020 |
By: | /s/ Andrea Melia |
|
Andrea Melia |
| |
Principal Financial Officer of |
| |
Aberdeen Investment Funds |
| |
|
| |
Date: July 1, 2020 |
| |