UNITED STATES
SECURITIES AND EXCHANGE COMMISSION
Washington, D.C. 20549
FORM N-CSR
CERTIFIED SHAREHOLDER REPORT
OF REGISTERED MANAGEMENT INVESTMENT COMPANIES
| Investment Company Act file number: | 811-06652 | |
| Exact name of registrant as specified in charter: | Aberdeen Investment Funds | |
| Address of principal executive offices: | 1735 Market Street, 32nd Floor | |
| Philadelphia, PA 19103 | ||
| Name and address of agent for service: | Ms. Andrea Melia | |
| Aberdeen Asset Management Inc. | ||
| 1735 Market Street, 32nd Floor | ||
| Philadelphia, PA 19103 | ||
| Registrant’s telephone number, including area code: | 866-667-9231 | |
| Date of fiscal year end: | October 31 | |
| Date of reporting period: | April 30, 2018 | |
Item 1. Reports to Shareholders.

Aberdeen Investment Funds
Semi-Annual Report
April 30, 2018
Aberdeen Select International Equity Fund
Aberdeen Select International Equity Fund II
Aberdeen Total Return Bond Fund
Aberdeen Global High Income Fund

| Page 1 | ||||
| Page 2 | ||||
| Page 8 | ||||
| Page 14 | ||||
| Page 28 | ||||
| Page 38 | ||||
| Page 52 | ||||
| Page 71 | ||||
Investors should carefully consider a fund’s investment objectives, risks, fees, and expenses before investing any money. To obtain this and other fund information, please call 866-667-9231 to request a prospectus, or download a prospectus at www.aberdeen-asset.us. Please read it carefully before investing any money.
Investing in mutual funds involves risk, including possible loss of principal.
Aberdeen Select International Equity Fund, Aberdeen Select International Equity Fund II, Aberdeen Total Return Bond Fund, and Aberdeen Global High Income Fund, (each a “Fund” and collectively the “Funds”) are distributed by Aberdeen Fund Distributors, LLC, Member FINRA, 1735 Market Street, 32nd Floor, Philadelphia, PA 19103.
Aberdeen Asset Management Inc. (AAMI) has been registered as an investment adviser under the Investment Advisers Act of 1940 since August 23,1995. Registration with the Securities and Exchange Commission does not imply any certain level of skill or training.
Statement Regarding Availability of Quarterly Portfolio Schedule.
The complete schedule of portfolio holdings for the Funds is included in the Funds’ semi-annual and annual reports to shareholders. The Funds file complete schedules of portfolio holdings for each Fund with the Securities and Exchange Commission (the “SEC”) for the first and third quarters of each fiscal year on Form N-Q. The Funds’ Forms N-Q are available on the SEC’s website at http://www.sec.gov. The Funds’ Forms N-Q may be reviewed and copied at the SEC’s Public Reference Room in Washington, DC, and information on the operation of the Public Reference Room may be obtained by calling 800-SEC-0330. The Funds make their most recent Forms N-Q available to shareholders on www.aberdeen-asset.us or upon request without charge.
Statement Regarding Availability of Proxy Voting Record.
Information regarding the policies and procedures that the Funds use to determine how to vote proxies relating to portfolio securities is available without charge, upon request, by calling 866-667-9231. The information is also included in the Funds’ Statement of Additional Information, which is available on the Funds’ website at www.aberdeen-asset.us and on the SEC’s website at www.sec.gov.
Information relating to how each Fund voted proxies relating to portfolio securities held during the most recent twelve months ended June 30 is available by August 30 of the relevant year: (i) upon request and without charge by calling 866-667-9231; and (ii) on the SEC’s website at www.sec.gov.
During the six-month period ended April 30, 2018, it seemed that global financial markets could have been the subject of a modern-day Charles Dickens novel, as they experienced “A Tale of Two Halves.” From late 2017 into the first month of 2018, global stock markets rallied on investors’ optimism regarding generally strong corporate earnings reports, U.S. tax reform, and relatively steady economic growth. An upsurge in volatility characterized the last three months of the reporting period, as investors mulled the possibility that rising inflation could prompt more aggressive interest-rate hikes from global central banks. U.S. President Donald Trump’s protectionist policies also caused uneasiness, particularly after his administration began to consider the assessment of import tariffs. This action sparked escalating trade tensions with China, but began to dissipate by the end of the reporting period. A historic agreement between North and South Korea to pursue a peace treaty, which would officially end the Korean War, also lifted investor sentiment.
Against this backdrop, the Morgan Stanley Capital International (MSCI) World Index,1 a global equity market benchmark, advanced 3.8% for the six-month period ended April 30, 2018. Shares of Japanese large-cap companies and international small-cap stocks were the strongest performers among global developed markets, with the Tokyo Stock Exchange Index (TOPIX) and the MSCI All-Country (AC) World ex USA Small Cap Index up 5.7% and 5.6%, respectively, for the reporting period. Global emerging equity markets, as measured by the MSCI Emerging Markets (EM) Index, outperformed their developed-market counterparts, gaining 4.9% for the same period.
U.S. equity indices rose sharply over the reporting period despite several bouts of volatility. Overall corporate results during the period generally met or exceeded expectations. Investors’ optimism regarding impending tax reform, which subsequently was implemented in early 2018, buoyed the U.S. market in late 2017 and early in the new year. Many large-cap companies responded to the reduction of the top U.S. corporate tax rate from 35% to 21% by increasing their dividend payments and accelerating share repurchases. U.S. large-cap stocks, as measured by the broader-market S&P 500 Index, gained 3.8% for the reporting period, modestly outperforming the 3.7% and 3.3% returns of their mid- and small-cap counterparts, as represented by the Russell Midcap and Russell 2000 indices, respectively. However, the positive outlook eventually was tempered by investors’ concerns about rising inflation requiring more aggressive interest-rate hikes by global central banks, most notably the U.S. Federal Reserve.
Shares of large-cap companies in the Asia-Pacific region also garnered positive returns over the reporting period, weathering the tensions about U.S. trade policy. Hong Kong exchange-listed stocks were the market leaders, benefiting from generally improving economic data and the central bank’s efforts to shore up the nation’s currency. However, in early 2018, investors grew skittish over a potentially accelerated pace of interest-rate hikes by major global central banks. An escalating trade spat between the U.S. and major trading partners, particularly China, further dented investor sentiment.
Within the emerging markets, South African stocks rose on investors’ optimism over the election of new President Cyril Ramaphosa. The Brazilian market was buoyed by encouraging economic signals and a court’s decision to uphold former President Luiz Inácio Lula da Silva’s corruption conviction. Russian equities gained ground amid higher energy prices and the central bank’s interest-rate cuts, which outweighed the impact of additional sanctions towards the end of the period.
Global bond markets were not spared from the volatility in the financial markets over the reporting period. Nonetheless, the Bloomberg Barclays Global Aggregate Bond Index, a fixed-income market benchmark, managed to record a total return of 1.2% for the period despite rising interest rates in the U.S. Yields on the two- and ten-year notes were up by corresponding margins of 89 and 57 basis points (bps), ending the period at 2.49% and 2.95%, respectively. Moving to the eastern side of the Atlantic Ocean, the European Central Bank announced a reduction in monthly asset purchases to €30 billion (roughly US$35 billion) beginning in January 2018, and indicated that the program will continue for another nine months from that date. Asian and emerging-market government bond yields generally rose over the reporting period; the increases were sharper in the second half, particularly in April 2018. Several Asian central banks also raised policy rates during the period, including Malaysia and Korea, spurred by firm economic growth and growing external inflation risks. Emerging fixed-income markets declined 2.4% over the period, as measured by the J.P. Morgan EMBI Global Diversified Index. Investment grade2 countries underperformed their high-yield counterparts, as the latter are more sensitive to U.S. Treasuries. Venezuela was among the weakest performers over the reporting period after the government announced its intention to restructure its external debt obligations. Later in the period, however, there was a partial recovery in the Venezuelan market, as investors sought to purchase the distressed securities after sovereign bonds traded down to US$0.20, and later as the market began to price in regime change, given the country’s deteriorating economic situation.
Despite facing headwinds from rising interest rates in the U.S., global real estate markets ended the reporting period in positive territory, with the Financial Times Stock Exchange European Public Real Estate Association/National Association of Real Estate Investment Trusts (FTSE EPRA/NAREIT) Global Real Estate Index returning 2.5%. Considering the extended duration of this economic growth cycle, we believe that global real estate markets generally remain quite healthy. Unlike prior cycles, the supply response has been comparatively restrained. Therefore, excess supply thus far has been limited to certain markets and, in our view, market fundamentals generally remain solid.
Outlook
While volatility persists in global stock markets, we believe that investors’ fears of an impending market crash may be overblown, considering macroeconomic indicators continue to point to improved growth and corporate earnings have largely been on the uptick. We remain optimistic regarding the macroeconomic backdrop within the U.S. and the firming growth that we are witnessing globally. We think that both corporate and consumer confidence remain robust and are manifesting themselves through strong demand and revenue growth for many sectors. Inflation and the resultant increases in input costs, however, remain an issue for many companies and likely will not abate in the near term. However, we believe that it remains important to monitor risks. Global central bankers could defy market expectations, and Trump’s protectionist stance and trade sparring with China could be further amplified. We also believe that the European economy could slide back into stagnation as populism gains traction, and China’s rush to revert to old ways of governing may stunt its economic evolution. In our view, the rise in oil prices is unlikely to prompt a surge in inflation, enabling a measured pace of monetary policy normalization in the major economies.
While we believe that there may still be periods of choppier waters, the market volatility may not be entirely bad, as it may moderate company valuations and compel investors to refocus on fundamentals. In our view, the positive backdrop remains characterized by strong global economic growth. Furthermore, we believe that U.S. tax reform should lead to less issuance of debt by U.S. companies and some corporate deleveraging. Nevertheless, tension between the U.S. and China around their future trade relationship is causing uncertainty.
Aberdeen Standard Investments*
| * | Aberdeen Standard Investments is a brand of the investment businesses of Aberdeen Asset Management and Standard Life Investments. In the United States, Aberdeen Standard Investments is the marketing name for the following affiliated, registered investment advisers: Aberdeen Asset Management Inc., Aberdeen Asset Managers Ltd., Aberdeen Asset Management Ltd., Aberdeen Asset Management Asia Ltd., Aberdeen Asset Capital Management, LLC, Standard Life Investments (Corporate Funds) Ltd., and Standard Life Investments (USA) Ltd. |
| 1 | Indexes are unmanaged and have been provided for comparison purposes only. No fees or expenses are reflected. You cannot invest directly in an index. |
| 2 | Companies whose bonds are rated as “investment grade” have a lower chance of defaulting on their debt than those rated as “non-investment grade.” Generally, these bonds are issued by long-established companies with strong balance sheets. Bonds rated BBB- or above are known as investment grade bonds. Standard & Poor’s credit ratings communicate the agency’s opinion of relative level of credit risk. Ratings from AA to CCC may be modified by the addition of a plus (+) or minus (-) sign to show relative standing within the major rating categories. The investment grade category is a rating from AAA to BBB-. |
| 2018 Semi-Annual Report | 1 |
Aberdeen Select International Equity Fund (Unaudited)
The Aberdeen Select International Equity Fund (Institutional Class shares net of fees) returned 0.66% for the six-month period ended April 30, 2018, versus 3.71% for its benchmark, the MSCI All Country (AC) World ex USA Index, during the same period. For broader comparison, the average return of the Fund’s peer category of International Large-Cap Growth Funds (comprising 73 funds), as measured by Lipper, Inc., was 2.28% for the period.
International equities rose during the six-month period ended April 30, 2018, buoyed by investors’ optimism over corporate earnings driven by an ongoing global economic growth recovery. Jay Powell’s appointment as U.S. Federal Reserve chair in February 2018 suggested continuity in the gradual normalization of monetary policy. China was boosted by mostly resilient growth, heralded in the widely watched National Party Congress1 in October 2017, and a sharp rise in internet stocks. President Xi Jinping consolidated his power, as the government abolished the two-term presidency limit, allowing him to remain at the helm indefinitely. Oil prices climbed, with Brent crude inching towards US$75 a barrel by the end of the reporting period. Global market volatility staged a comeback in the second half of the reporting period on fears that rising inflation could prompt more aggressive interest-rate hikes. U.S. President Donald Trump’s protectionist policies also caused unease, particularly after his administration began threatening import tariffs. This action sparked escalating trade tensions with China, but began to dissipate by the end of the reporting period. A historic agreement between North and South Korea to pursue a peace treaty, which would officially end the Korean War, also lifted investor sentiment.
Among the Fund’s individual holdings, Check Point Software Technologies was a significant detractor from the relative performance versus the benchmark MSCI AC World ex USA Index for the reporting period. The Israeli IT company posted strong results over the reporting period, but its share price fell because of “growing pains” with its enlarged sales force, which could dampen growth. The Fund’s holding in mobile satellite communications company Inmarsat detracted from performance due to its relatively mixed earnings reports and concerns about costs associated with its in-flight connectivity network rollout. Nonetheless, Inmarsat operates in an industry with numerous end-markets and high barriers to entry, and also pays an attractive dividend, which has grown consistently over the long term. The position in Japan Tobacco Inc. also detracted from Fund performance. The company’s shares declined as competing novel nicotine products continued to take market share from its domestic cigarette sales.
Conversely, the holding in diagnostic instruments manufacturer Sysmex Corp. bolstered the Fund’s relative performance as investors took a positive view of its clinical testing devices. The position in hospitality company Whitbread was a notable contributor to Fund performance after its share price jumped on news that it would spin off its Costa Coffee chain from the remainder of its business. Finally, the holding in AIA Group benefited the Fund’s relative performance as the multi-lines insurer posted generally positive results over the reporting period.
During the reporting period, we initiated a holding in Yum China, a leading restaurant-chain operator, as we like its mix of brands and believe that it may potentially benefit from attractive business prospects in China. We trimmed the Fund’s holdings in Shin-Etsu Chemical Co. and Taiwan Semiconductor Manufacturing Co. in an effort to diversify2 the Fund’s exposure to the semiconductor industry by reinvesting the sales proceeds into a new position in Infineon Technologies. We believe that Infineon Technologies is a high-quality business with a net-cash balance sheet that is well-established in automotive end-markets, and also serves the industrial automation market.
We exited the Fund’s position in Canadian telecommunications company Telus Corp. to fund what we believed were better opportunities elsewhere. We sold the Fund’s shares in Hong Kong rail and property firm MTR Corporation. In our view, the stock’s valuation has captured many of the positives within the business, but not some of the risks associated with expanding the rail franchise beyond its core geographical areas.
Volatility persists in global stock markets. Nonetheless, we believe that investors’ fears of an impending market crash may be overblown, considering macroeconomic indicators continue to point to improved growth and corporate earnings have largely been on the uptick. However, we believe that it remains important to monitor risks. Global central bankers could defy market expectations, and Trump’s protectionist stance and trade sparring with China could be further amplified. We also believe that the European economy could slide back into stagnation as populism gains traction, and China’s rush to revert to old ways of governing may stunt its economic evolution. Despite these uncertainties, we retain conviction in our fundamentals-focused investment process, seeking companies with robust balance sheets and good cash flow that we believe can stay resilient in the long term.
Portfolio Management:
Aberdeen Global Equity Team
PAST PERFORMANCE DOES NOT GUARANTEE FUTURE RESULTS.
The performance quoted represents past performance, which does not guarantee future results. Class A shares have up to a 0.25% 12b-1 fee. The investment return and principal value of an investment will fluctuate so that an investor’s shares, when redeemed, may be worth more or less than their original cost. Current performance of the Fund may be lower or higher than the performance quoted. Performance data current to the most recent month-end may be obtained by calling 866-667-9231 or visiting www.aberdeen-asset.us.
Investing in mutual funds involves risk, including the possible loss of principal. There is no assurance that the investment objective of any fund will be achieved. Indexes are unmanaged and have been provided for comparison purposes only. No fees or expenses are reflected. You cannot invest directly in an index.
| 1 | The Chinese Communist Party sets its national policy goals and elects its leadership positions at the National Party Congress, which is held every five years. |
| 2 | Diversification does not ensure a profit or protect against a loss in a declining market. |
| 2 | Semi-Annual Report 2018 |
Aberdeen Select International Equity Fund (Unaudited) (concluded)
Lipper is a leading global provider of mutual fund information and analysis to fund companies, financial intermediaries and media organizations.
Risk Considerations
Foreign securities may be more volatile, harder to price and less liquid than U.S. securities. They are subject to different accounting and regulatory standards and currency exchange rate, political and economic risks. Fluctuation in currency exchange rates may impact a Fund’s returns more greatly to the extent a Fund does not hedge currency exposure or hedging techniques are unsuccessful. The foregoing risks are enhanced in emerging market countries.
Equity stocks of small and mid-cap companies carry greater risk and more volatility than equity stocks of larger, more established companies.
Stocks issued by large cap companies subject the Fund to the risk that those stocks may underperform stocks issued by companies with smaller capitalizations or the market as a whole.
Investing a significant portion of the Fund’s assets in securities of companies conducting business in a broadly related group of industries within an economic sector may make the Fund more vulnerable to unfavorable developments in that sector.
Please read the prospectus for more detailed information regarding these and other risks.
| 2018 Semi-Annual Report | 3 |
Aberdeen Select International Equity Fund (Unaudited)
Average Annual Total Return* (For periods ended April 30, 2018) | Six Month† | 1 Yr. | 5 Yr. | 10 Yr. | ||||||||||||||
Class A | w/o SC** | 0.52% | 9.55% | 2.68% | (1.31)% | |||||||||||||
Institutional Class | w/o SC** | 0.66% | 9.83% | 2.94% | (1.07)% | |||||||||||||
| † | Not Annualized |
| * | Performance shown for periods after December 16, 2016 reflect the Fund’s receipt of payment from some European jurisdictions related to prior years (2005-2008) in accordance with European Union law under Article 63 of the Treaty on the Functioning of the European Union (the “Article 63 EU Tax Reclaims”). The receipt of these extraordinary payments increased the Fund’s performance for all periods that include December 2016 and February 2017 in a manner that may not recur in the future, and the Fund’s performance was significantly higher than it would have been absent receipt of the Article 63 EU Tax Reclaims. For Class A, the average annual total return excluding the receipt of Article 63 EU Tax Reclaims was 9.55%, 1.54%, and (1.86)%, respectively, for the 1-year, 5-year, and 10-year periods ended April 30, 2018. For Institutional Class, the average annual total return excluding the receipt of Article 63 EU Tax Reclaims was 9.83%, 1.81%, and (1.61)%, respectively, for the 1-year, 5-year, and 10-year periods ended April 30, 2018. There can be no assurance that the Fund will receive additional Article 63 EU Tax Reclaim payments or maintain this level of performance in the future. Please see Note 2(g) and the Fund’s prospectus dated February 28, 2018 for further information. |
| ** | Class A shares and Institutional Class shares are not subject to any sales charges. |
Performance of a $10,000 Investment (as of April 30, 2018)
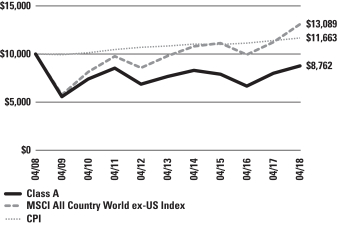
Comparative performance of $10,000 invested in Class A shares of the Aberdeen Select International Equity Fund, Morgan Stanley Capital International All Country World ex-USA Index (MSCI ACWI ex-USA Index), and the Consumer Price Index (CPI) over a 10-year period ended April 30, 2018. Unlike the Fund’s returns, the returns for these unmanaged indexes do not reflect any fees or expenses. Investors cannot invest directly in market indexes.
The MSCI ACWI ex-USA Index captures large and mid cap representation across 22 of 23 Developed Markets (DM) countries (excluding the United States (U.S.) and 24 Emerging Markets (EM) countries). With 1,858 constituents, the index covers approximately 85% of the global equity opportunity set outside the U.S.
The CPI is a measure of the average change over time in the prices paid by urban consumers for a market basket of consumer goods and services.
Investment return and principal value will fluctuate, and when redeemed, shares may be worth more or less than original cost. Past performance is no guarantee of future results. The Average Annual Total Return table and performance graph do not reflect the deduction of taxes that a shareholder would pay on Fund distributions or the redemption of Fund shares. Investing in mutual funds involves market risk, including loss of principal. Performance returns assume the reinvestment of all distributions. Performance returns reflect fee waivers and reimbursements in effect without which returns would have been lower.
| 4 | Semi-Annual Report 2018 |
Aberdeen Select International Equity Fund (Unaudited) (concluded)
Portfolio Summary (as a percentage of net assets)
April 30, 2018 (Unaudited)
| Asset Allocation | ||||
Common Stocks | 93.1% | |||
Preferred Stocks | 9.1% | |||
Short-Term Investment | 1.7% | |||
Government Bonds | –% | |||
Liabilities in Excess of Other Assets | (3.9)% | |||
| 100.0% | ||||
The following table summarizes the composition of the Fund’s portfolio, in Standard & Poor’s Global Industry Classification Standard (GICS) sectors, expressed as a percentage of net assets. The GICS structure consists of 11 sectors, 24 industry groups, 68 industries and 157 sub-industries. As of April 30, 2018, the Fund did not have more than 25% of its assets invested in any single industry or industry group.
| Top Sectors | ||||
Consumer Staples | 18.6% | |||
Financials | 16.5% | |||
Health Care | 13.1% | |||
Information Technology | 12.4% | |||
Industrials | 10.9% | |||
Consumer Discretionary | 8.5% | |||
Telecommunication Services | 6.8% | |||
Materials | 6.3% | |||
Energy | 4.6% | |||
Real Estate | 4.5% | |||
Other | (2.2)% | |||
| 100.0% | ||||
| Top Holdings* | ||||
Samsung Electronics Co. Ltd., Preferred Shares | 3.3% | |||
AIA Group Ltd. | 3.3% | |||
Henkel AG & Co. KGaA, Preferred Shares, 1.33% | 3.2% | |||
Taiwan Semiconductor Manufacturing Co. Ltd. | 3.0% | |||
Jardine Matheson Holdings Ltd. | 2.7% | |||
Fomento Economico Mexicano SAB de CV, ADR | 2.7% | |||
Vodafone Group PLC | 2.6% | |||
Japan Tobacco, Inc. | 2.6% | |||
Samsonite International SA | 2.6% | |||
Fresenius Medical Care AG & Co. KGaA | 2.6% | |||
Other | 71.4% | |||
| 100.0% | ||||
| * | For the purpose of listing top holdings, Short-Term Investments are included as part of Other. |
| Top Countries | ||||
United Kingdom | 20.0% | |||
Japan | 15.5% | |||
Germany | 10.4% | |||
Hong Kong | 8.5% | |||
Switzerland | 7.3% | |||
Republic of South Korea | 5.8% | |||
United States | 4.3% | |||
Brazil | 3.4% | |||
Singapore | 3.3% | |||
Taiwan | 3.0% | |||
Other | 18.5% | |||
| 100.0% | ||||
| 2018 Semi-Annual Report | 5 |
Statement of Investments
April 30, 2018 (Unaudited)
Aberdeen Select International Equity Fund
| Shares or Principal Amount | Value | |||||||
COMMON STOCKS (93.1%) | ||||||||
AUSTRALIA (1.2%) | ||||||||
Health Care (1.2%) | ||||||||
CSL Ltd. (a) | 18,500 | $ | 2,369,647 | |||||
BRAZIL (0.8%) | ||||||||
Energy (0.8%) | ||||||||
Ultrapar Participacoes SA, ADR | 89,600 | 1,551,872 | ||||||
CANADA (2.7%) | ||||||||
Industrials (1.2%) | ||||||||
Ritchie Bros Auctioneers, Inc. | 69,000 | 2,254,948 | ||||||
Materials (1.5%) | ||||||||
Nutrien Ltd. | 62,640 | 2,851,597 | ||||||
| 5,106,545 | ||||||||
CHINA (2.4%) | ||||||||
Consumer Discretionary (1.7%) | ||||||||
Yum China Holdings, Inc. | 77,600 | 3,318,176 | ||||||
Information Technology (0.7%) | ||||||||
Tencent Holdings Ltd. | 27,800 | 1,366,728 | ||||||
| 4,684,904 | ||||||||
FRANCE (1.9%) | ||||||||
Consumer Staples (1.9%) | ||||||||
L’Oreal SA (a) | 14,900 | 3,587,766 | ||||||
GERMANY (7.2%) | ||||||||
Health Care (4.6%) | ||||||||
Bayer AG (a) | 32,500 | 3,884,386 | ||||||
Fresenius Medical Care AG & Co. KGaA (a) | 49,100 | 4,982,214 | ||||||
| 8,866,600 | ||||||||
Information Technology (1.0%) | ||||||||
Infineon Technologies AG | 77,000 | 1,971,639 | ||||||
Materials (1.6%) | ||||||||
Linde AG (b) | 13,500 | 2,990,726 | ||||||
| 13,828,965 | ||||||||
HONG KONG (8.5%) | ||||||||
Financials (4.8%) | ||||||||
AIA Group Ltd. (a) | 697,400 | 6,232,801 | ||||||
Standard Chartered PLC (a) | 285,100 | 2,994,698 | ||||||
| 9,227,499 | ||||||||
Industrials (2.7%) | ||||||||
Jardine Matheson Holdings Ltd. (a) | 84,600 | 5,122,843 | ||||||
Real Estate (1.0%) | ||||||||
Swire Pacific Ltd., Class A (a) | 201,000 | 1,986,143 | ||||||
| 16,336,485 | ||||||||
INDIA (1.0%) | ||||||||
Financials (1.0%) | ||||||||
HDFC Bank Ltd., ADR | 20,600 | 1,973,686 | ||||||
ISRAEL (2.1%) | ||||||||
Information Technology (2.1%) | ||||||||
Check Point Software Technologies Ltd. (b) | 41,500 | 4,005,165 | ||||||
ITALY (1.2%) | ||||||||
Energy (1.2%) | ||||||||
Tenaris SA, ADR | 63,600 | 2,377,368 | ||||||
JAPAN (15.5%) | ||||||||
Consumer Discretionary (1.6%) | ||||||||
Shimano, Inc. (a) | 23,300 | 3,098,169 | ||||||
Consumer Staples (2.6%) | ||||||||
Japan Tobacco, Inc. (a) | 188,500 | 5,067,106 | ||||||
Financials (1.6%) | ||||||||
Japan Exchange Group, Inc. (a) | 164,400 | 3,044,535 | ||||||
Health Care (2.1%) | ||||||||
Sysmex Corp. (a) | 45,000 | 3,975,177 | ||||||
Industrials (1.3%) | ||||||||
FANUC Corp. (a) | 12,000 | 2,570,525 | ||||||
Information Technology (2.3%) | ||||||||
Keyence Corp. (a) | 7,200 | 4,390,411 | ||||||
Materials (2.1%) | ||||||||
Shin-Etsu Chemical Co. Ltd. (a) | 39,100 | 3,923,672 | ||||||
Real Estate (1.9%) | ||||||||
Daito Trust Construction Co. Ltd. (a) | 21,600 | 3,604,282 | ||||||
| 29,673,877 | ||||||||
LATVIA (0.0%) | ||||||||
Financials (0.0%) | ||||||||
AS Parex Banka (b)(c)(d) | 1,424,182 | – | ||||||
MEXICO (2.6%) | ||||||||
Consumer Staples (2.6%) | ||||||||
Fomento Economico Mexicano SAB de CV, ADR | 52,600 | 5,084,318 | ||||||
PHILIPPINES (1.6%) | ||||||||
Real Estate (1.6%) | ||||||||
Ayala Land, Inc. (a) | 3,919,300 | 3,079,751 | ||||||
REPUBLIC OF SOUTH KOREA (2.5%) | ||||||||
Consumer Staples (2.5%) | ||||||||
Amorepacific Group (a) | 35,900 | 4,783,947 | ||||||
SINGAPORE (3.3%) | ||||||||
Financials (2.2%) | ||||||||
Oversea-Chinese Banking Corp. Ltd. (a) | 402,429 | 4,156,521 | ||||||
Telecommunication Services (1.1%) | ||||||||
Singapore Telecommunications Ltd. (a) | 798,600 | 2,112,371 | ||||||
| 6,268,892 | ||||||||
SOUTH AFRICA (1.6%) | ||||||||
Telecommunication Services (1.6%) | ||||||||
MTN Group Ltd. (a) | 302,800 | 3,042,332 | ||||||
See accompanying Notes to Financial Statements.
| 6 | Semi-Annual Report 2018 |
Statement of Investments (concluded)
April 30, 2018 (Unaudited)
Aberdeen Select International Equity Fund
| Shares or Principal Amount | Value | |||||||
SWEDEN (2.0%) | ||||||||
Industrials (2.0%) | ||||||||
Atlas Copco AB, A Shares (a) | 97,900 | $ | 3,828,509 | |||||
SWITZERLAND (7.3%) | ||||||||
Consumer Staples (2.1%) | ||||||||
Nestle SA (a) | 51,900 | 4,020,697 | ||||||
Health Care (5.2%) | ||||||||
Novartis AG (a) | 64,000 | 4,926,355 | ||||||
Roche Holding AG (a) | 22,400 | 4,976,997 | ||||||
| 9,903,352 | ||||||||
| 13,924,049 | ||||||||
TAIWAN (3.0%) | ||||||||
Information Technology (3.0%) | ||||||||
Taiwan Semiconductor Manufacturing Co. Ltd. | 747,000 | 5,731,296 | ||||||
THAILAND (2.1%) | ||||||||
Financials (2.1%) | ||||||||
Kasikornbank PCL (a) | 629,900 | 3,999,260 | ||||||
UNITED KINGDOM (20.0%) | ||||||||
Consumer Discretionary (2.6%) | ||||||||
Whitbread PLC (a) | 84,300 | 4,959,970 | ||||||
Consumer Staples (3.7%) | ||||||||
British American Tobacco PLC (a) | 70,300 | 3,855,778 | ||||||
Diageo PLC | 92,500 | 3,299,905 | ||||||
| 7,155,683 | ||||||||
Energy (2.6%) | ||||||||
Royal Dutch Shell PLC, B Shares (a) | 138,500 | 4,944,288 | ||||||
Financials (2.2%) | ||||||||
Prudential PLC (a) | 161,600 | 4,155,386 | ||||||
Industrials (3.7%) | ||||||||
Experian PLC (a) | 174,000 | 3,986,717 | ||||||
Rolls-Royce Holdings PLC (a)(b) | 271,200 | 3,132,129 | ||||||
Rolls-Royce Holdings PLC, C Shares (b) | 19,255,200 | 26,509 | ||||||
| 7,145,355 | ||||||||
Materials (1.1%) | ||||||||
BHP Billiton PLC (a) | 99,600 | 2,123,712 | ||||||
Telecommunication Services (4.1%) | ||||||||
Inmarsat PLC (a) | 559,700 | 2,891,559 | ||||||
Vodafone Group PLC (a) | 1,740,400 | 5,078,853 | ||||||
| 7,970,412 | ||||||||
| 38,454,806 | ||||||||
UNITED STATES (2.6%) | ||||||||
Consumer Discretionary (2.6%) | ||||||||
Samsonite International SA (a) | 1,109,400 | 5,018,219 | ||||||
VENEZUELA (0.0%) | ||||||||
Financials (0.0%) | ||||||||
Banco Venezolano de Credito SA (b)(c) | 156 | – | ||||||
Industrials (0.0%) | ||||||||
Cemex Venezuela SACA-I (b)(c) | 15,843,815 | – | ||||||
| – | ||||||||
Total Common Stocks | 178,711,659 | |||||||
GOVERNMENT BONDS (0.0%) | ||||||||
VENEZUELA (0.0%) | ||||||||
Bonos de la Deuda Publica Nacional (VEF), 16.00%, 08/23/2018 (b)(c) | 49,500,000 | – | ||||||
Bonos de la Deuda Publica Nacional (VEF), 18.00%, 04/12/2018 (b)(c) | 20,000,000 | – | ||||||
| – | ||||||||
Total Government Bonds | – | |||||||
PREFERRED STOCKS (9.1%) | ||||||||
BRAZIL (2.6%) | ||||||||
Financials (2.6%) | ||||||||
Banco Bradesco SA, ADR, Preferred Shares, 1.94% | 493,581 | 4,837,094 | ||||||
GERMANY (3.2%) | ||||||||
Consumer Staples (3.2%) | ||||||||
Henkel AG & Co. KGaA, Preferred Shares, 1.33% (a) | 48,600 | 6,176,318 | ||||||
REPUBLIC OF SOUTH KOREA (3.3%) | ||||||||
Information Technology (3.3%) | ||||||||
Samsung Electronics Co. Ltd., Preferred Shares (a) | 3,200 | 6,362,859 | ||||||
Total Preferred Stocks | 17,376,271 | |||||||
SHORT-TERM INVESTMENT (1.7%) | ||||||||
UNITED STATES (1.7%) | ||||||||
State Street Institutional U.S. Government Money Market Fund, Institutional Class, 1.28% (d) | 3,341,314 | 3,341,314 | ||||||
Total Short-Term Investment | 3,341,314 | |||||||
Total Investments | 199,429,244 | |||||||
Liabilities in Excess of Other Assets—(3.9)% | (7,484,182 | ) | ||||||
Net Assets—100.0% | $ | 191,945,062 | ||||||
| (a) | Fair Values are determined pursuant to procedures approved by the Fund’s Board of Trustees. Unless otherwise noted, securities are valued by applying valuation factors to the exchange traded price. See Note 2(a) of the accompanying Notes to Financial Statements. |
| (b) | Non-income producing security. |
| (c) | The Fund’s adviser has deemed this security to be illiquid based upon procedures approved by the Board of Trustees. Illiquid securities held by the Fund represent 0.00% of net assets as of April 30, 2018. |
| (d) | Registered investment company advised by State Street Global Advisors. The rate shown is the 7 day yield as of April 30, 2018. |
| (e) | See accompanying Notes to Financial Statements for tax unrealized appreciation/(depreciation) of securities. |
| ADR | American Depositary Receipt |
| PLC | Public Limited Company |
See accompanying Notes to Financial Statements.
| 2018 Semi-Annual Report | 7 |
Aberdeen Select International Equity Fund II (Unaudited)
The Aberdeen Select International Equity Fund II (Institutional Class shares net of fees) returned 0.76% for the six-month period ended April 30, 2018, versus 3.71% for its benchmark, the MSCI All Country (AC) World ex USA Index, during the same period. For broader comparison, the average return of the Fund’s peer category of International Large-Cap Growth Funds (comprising 73 funds), as measured by Lipper, Inc., was 2.28% for the period.
International equities rose during the six-month period ended April 30, 2018, buoyed by investors’ optimism over corporate earnings driven by an ongoing global economic growth recovery. Jay Powell’s appointment as U.S. Federal Reserve chair in February 2018 suggested continuity in the gradual normalization of monetary policy. China was boosted by mostly resilient growth, heralded in the widely watched National Party Congress1 in October 2017, and a sharp rise in internet stocks. President Xi Jinping consolidated his power, as the government abolished the two-term presidency limit, allowing him to remain at the helm indefinitely. Oil prices climbed, with Brent crude inching towards US$75 a barrel by the end of the reporting period. Global market volatility staged a comeback in the second half of the reporting period on fears that rising inflation could prompt more aggressive interest-rate hikes. U.S. President Donald Trump’s protectionist policies also caused unease, particularly after his administration began threatening import tariffs. This action sparked escalating trade tensions with China, but began to dissipate by the end of the reporting period. A historic peace treaty between North and South Korea, which officially ended the Korean War, also lifted investor sentiment.
Among the Fund’s individual holdings, Check Point Software Technologies was a significant detractor from the relative performance versus the benchmark MSCI AC World ex USA Index for the reporting period. The Israeli IT company posted strong results over the reporting period, but its share price fell because of “growing pains” with its enlarged sales force, which could dampen growth. The Fund’s holding in mobile satellite communications company Inmarsat detracted from performance due to its relatively mixed earnings reports and concerns about costs associated with its in-flight connectivity network rollout. Nonetheless, Inmarsat operates in an industry with numerous end-markets and high barriers to entry, and also pays an attractive dividend, which has grown consistently over the long term. The position in Japan Tobacco Inc. also weighed on Fund performance. The company’s shares declined as competing novel nicotine products continued to take market share from its domestic cigarette sales.
Conversely, the holding in diagnostic instruments manufacturer Sysmex Corp. bolstered the Fund’s relative performance as investors took a positive view of its clinical testing devices. The position in hospitality company Whitbread was a notable contributor to Fund performance after its share price jumped on news that it would spin off its Costa Coffee chain from the remainder of its business. Finally, the holding in AIA Group benefited the Fund’s relative performance as the multi-lines insurer posted generally positive results over the reporting period.
During the reporting period, we initiated a holding in Yum China, a leading restaurant-chain operator, as we like its mix of brands and believe that it may potentially benefit from attractive business prospects in China. We trimmed the Fund’s holdings in Shin-Etsu Chemical Co. and Taiwan Semiconductor Manufacturing Co. in an effort to diversify2 the Fund’s exposure to the semiconductor industry by reinvesting the sales proceeds into a new position in Infineon Technologies. We believe that Infineon Technologies is a high-quality business with a net-cash balance sheet that is well-established in automotive end-markets, and also serves the industrial automation market.
We exited the Fund’s position in Canadian telecommunications company Telus Corp. to fund what we believed were better opportunities elsewhere. We sold the Fund’s shares in Hong Kong rail and property firm MTR Corporation. In our view, the stock’s valuation has captured many of the positives within the business, but not some of the risks associated with expanding the rail franchise beyond its core geographical areas.
Volatility persists in global stock markets. Nonetheless, we think that investors’ fears of an impending market crash may be overblown, considering macroeconomic indicators continue to point to improved growth and corporate earnings have largely been on the uptick. However, we believe that it remains important to monitor risks. Global central bankers could defy market expectations, and Trump’s protectionist stance and trade sparring with China could be further amplified. We also believe that the European economy could slide back into stagnation as populism gains traction, and China’s rush to revert to old ways of governing may stunt its economic evolution. Despite these uncertainties, we retain conviction in our fundamentals-focused investment process, seeking companies with robust balance sheets and good cash flow that we believe can stay resilient in the long term.
Portfolio Management:
Aberdeen Global Equity Team
PAST PERFORMANCE DOES NOT GUARANTEE FUTURE RESULTS.
The performance quoted represents past performance, which does not guarantee future results. Class A Shares have up to a 0.25% 12b-1 fee. The investment return and principal value of an investment will fluctuate so that an investor’s shares, when redeemed, may be worth more or less than their original cost. Current performance of the Fund may be lower or higher than the performance quoted. Performance data current to the most recent month-end may be obtained by calling 866-667-9231 or visiting www.aberdeen-asset.us.
Investing in mutual funds involves risk, including the possible loss of principal. There is no assurance that the investment objective of any fund will be achieved. Indexes are unmanaged and have been provided for comparison purposes only. No fees or expenses are reflected. You cannot invest directly in an index.
| 1 | The Chinese Communist Party sets its national policy goals and elects its leadership positions at the National Party Congress, which is held every five years. |
| 2 | Diversification does not ensure a profit or protect against a loss in a declining market. |
| 8 | Semi-Annual Report 2018 |
Aberdeen Select International Equity Fund II (Unaudited) (concluded)
Lipper is a leading global provider of mutual fund information and analysis to fund companies, financial intermediaries and media organizations.
Risk Considerations
Foreign securities may be more volatile, harder to price and less liquid than U.S. securities. They are subject to different accounting and regulatory standards and currency exchange rate, political and economic risks. Fluctuation in currency exchange rates may impact a Fund’s returns more greatly to the extent a Fund does not hedge currency exposure or hedging techniques are unsuccessful. The foregoing risks are enhanced in emerging market countries.
Equity stocks of small- and mid-cap companies carry greater risk and more volatility than equity stocks of larger, more established companies.
Stocks issued by large cap companies subject the Fund to the risk that those stocks may underperform stocks issued by companies with smaller capitalizations or the market as a whole.
Investing a significant portion of the Fund’s assets in securities of companies conducting business in a broadly related group of industries within an economic sector may make the Fund more vulnerable to unfavorable developments in that sector.
Please read the prospectus for more detailed information regarding these and other risks.
| 2018 Semi-Annual Report | 9 |
Aberdeen Select International Equity Fund II (Unaudited)
Average Annual Total Return* (For periods ended April 30, 2018) | Six Month† | 1 Yr. | 5 Yr. | 10 Yr. | ||||||||||||
Class A | w/o SC** | 0.65% | 9.45% | 2.38% | (0.68)% | |||||||||||
Institutional Class | w/o SC** | 0.76% | 9.75% | 2.66% | (0.43)% | |||||||||||
| † | Not Annualized |
| * | Performance shown for periods after February 1, 2017 reflect the Fund’s receipt of payment from some European jurisdictions related to prior years (2005-2009) in accordance with European Union law under Article 63 of the Treaty on the Functioning of the European Union (the “Article 63 EU Tax Reclaims”). The receipt of these extraordinary payments increased the Fund’s performance for all periods that include February 2017 in a manner that may not recur in the future, and the Fund’s performance was significantly higher than it would have been absent receipt of the Article 63 EU Tax Reclaims. For Class A, the average annual total return excluding the receipt of Article 63 EU Tax Reclaims was 9.45%, 1.70%, and (1.02)%, respectively, for the 1-year, 5-year, and 10-year periods ended April 30, 2018. For Institutional Class, the average annual total return excluding the receipt of Article 63 EU Tax Reclaims was 9.75%, 1.98%, and (0.76)%, respectively, for the 1-year, 5-year, and 10-year periods ended April 30, 2018. There can be no assurance that the Fund will receive additional Article 63 EU Tax Reclaim payments or maintain this level of performance in the future. Please see Note 2(g) and the Fund’s prospectus dated February, 28, 2018 for further information. |
| ** | Class A shares and Institutional Class shares are not subject to any sales charges. |
Performance of a $10,000 Investment (as of April 30, 2018)
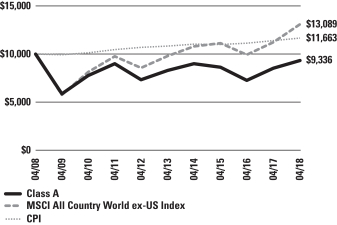
Comparative performance of $10,000 invested in Class A shares of the Aberdeen Select International Equity Fund II, Morgan Stanley Capital International All Country World ex-USA Index (MSCI ACWI ex-US Index), and the Consumer Price Index (CPI) over a 10-year period ended April 30, 2018. Unlike the Fund’s returns, the returns for these unmanaged indexes do not reflect any fees or expenses. Investors cannot invest directly in market indexes.
The MSCI ACWI ex-USA Index captures large and mid cap representation across 22 of 23 Developed Markets (DM) countries (excluding the United States (U.S.) and 24 Emerging Markets (EM) countries). With 1,858 constituents, the index covers approximately 85% of the global equity opportunity set outside the U.S.
The CPI is a measure of the average change over time in the prices paid by urban consumers for a market basket of consumer goods and services.
Investment return and principal value will fluctuate, and when redeemed, shares may be worth more or less than original cost. Past performance is no guarantee of future results. The Average Annual Total Return table and performance graph do not reflect the deduction of taxes that a shareholder would pay on Fund distributions or the redemption of Fund shares. Investing in mutual funds involves market risk, including loss of principal. Performance returns assume the reinvestment of all distributions. Performance returns reflect fee waivers and reimbursements in effect without which returns would have been lower.
| 10 | Semi-Annual Report 2018 |
Aberdeen Select International Equity Fund II (Unaudited) (concluded)
Portfolio Summary (as a percentage of net assets)
April 30, 2018 (Unaudited)
| Asset Allocation | ||||
Common Stocks | 92.4% | |||
Preferred Stocks | 8.6% | |||
Short-Term Investment | 1.4% | |||
Liabilities in Excess of Other Assets | (2.4)% | |||
| 100.0% | ||||
The following table summarizes the composition of the Fund’s portfolio, in Standard & Poor’s Global Industry Classification Standard (GICS) sectors, expressed as a percentage of net assets. The GICS structure consists of 11 sectors, 24 industry groups, 68 industries and 157 sub-industries. As of April 30, 2018, the Fund did not have more than 25% of its assets invested in any single industry or industry group.
| Top Sectors | ||||
Consumer Staples | 18.4% | |||
Financials | 16.1% | |||
Health Care | 12.7% | |||
Information Technology | 12.1% | |||
Industrials | 10.8% | |||
Consumer Discretionary | 8.6% | |||
Telecommunication Services | 6.8% | |||
Materials | 6.2% | |||
Energy | 4.7% | |||
Real Estate | 4.6% | |||
Other | (1.0)% | |||
| 100.0% | ||||
| Top Holdings* | ||||
Samsung Electronics Co. Ltd., Preferred Shares | 3.2% | |||
AIA Group Ltd. | 3.2% | |||
Henkel AG & Co. KGaA, Preferred Shares, 1.33% | 3.0% | |||
Taiwan Semiconductor Manufacturing Co. Ltd. | 3.0% | |||
Samsonite International SA | 2.8% | |||
Fomento Economico Mexicano SAB de CV, ADR | 2.8% | |||
Vodafone Group PLC | 2.7% | |||
Royal Dutch Shell PLC, B Shares | 2.7% | |||
Jardine Matheson Holdings Ltd. | 2.6% | |||
Japan Tobacco, Inc. | 2.6% | |||
Other | 71.4% | |||
| 100.0% | ||||
| * | For the purpose of listing top holdings, Short-Term Investments are included as part of Other. |
| Top Countries | ||||
United Kingdom | 20.2% | |||
Japan | 15.3% | |||
Germany | 10.2% | |||
Hong Kong | 8.4% | |||
Switzerland | 7.1% | |||
Republic of South Korea | 5.7% | |||
United States | 4.2% | |||
Singapore | 3.3% | |||
Brazil | 3.2% | |||
Taiwan | 2.9% | |||
Other | 19.5% | |||
| 100.0% | ||||
| 2018 Semi-Annual Report | 11 |
Statement of Investments
April 30, 2018 (Unaudited)
Aberdeen Select International Equity Fund II
| Shares or Principal Amount | Value | |||||||
COMMON STOCKS (92.4%) | ||||||||
AUSTRALIA (1.1%) | ||||||||
Health Care (1.1%) | ||||||||
CSL Ltd. (a) | 7,000 | $ | 896,623 | |||||
BRAZIL (0.8%) | ||||||||
Energy (0.8%) | ||||||||
Ultrapar Participacoes SA, ADR | 36,000 | 623,520 | ||||||
CANADA (2.6%) | ||||||||
Industrials (1.1%) | ||||||||
Ritchie Bros Auctioneers, Inc. | 27,000 | 882,371 | ||||||
Materials (1.5%) | ||||||||
Nutrien Ltd. | 27,300 | 1,242,794 | ||||||
| 2,125,165 | ||||||||
CHINA (2.4%) | ||||||||
Consumer Discretionary (1.7%) | ||||||||
Yum China Holdings, Inc. | 32,500 | 1,389,700 | ||||||
Information Technology (0.7%) | ||||||||
Tencent Holdings Ltd. | 11,600 | 570,289 | ||||||
| 1,959,989 | ||||||||
FRANCE (1.8%) | ||||||||
Consumer Staples (1.8%) | ||||||||
L’Oreal SA (a) | 6,000 | 1,444,738 | ||||||
GERMANY (7.2%) | ||||||||
Health Care (4.6%) | ||||||||
Bayer AG (a) | 14,200 | 1,697,178 | ||||||
Fresenius Medical Care AG & Co. KGaA (a) | 20,000 | 2,029,415 | ||||||
| 3,726,593 | ||||||||
Information Technology (1.0%) | ||||||||
Infineon Technologies AG | 32,000 | 819,382 | ||||||
Materials (1.6%) | ||||||||
Linde AG (b) | 5,600 | 1,240,598 | ||||||
| 5,786,573 | ||||||||
HONG KONG (8.4%) | ||||||||
Financials (4.7%) | ||||||||
AIA Group Ltd. (a) | 289,400 | 2,586,425 | ||||||
Standard Chartered PLC (a) | 112,300 | 1,179,602 | ||||||
| 3,766,027 | ||||||||
Industrials (2.6%) | ||||||||
Jardine Matheson Holdings Ltd. (a) | 35,000 | 2,119,380 | ||||||
Real Estate (1.1%) | ||||||||
Swire Pacific Ltd., Class A (a) | 89,500 | 884,377 | ||||||
| 6,769,784 | ||||||||
INDIA (1.0%) | ||||||||
Financials (1.0%) | ||||||||
HDFC Bank Ltd., ADR | 8,600 | 823,966 | ||||||
ISRAEL (2.1%) | ||||||||
Information Technology (2.1%) | ||||||||
Check Point Software Technologies Ltd. (b) | 17,200 | 1,659,972 | ||||||
ITALY (1.2%) | ||||||||
Energy (1.2%) | ||||||||
Tenaris SA, ADR | 25,100 | 938,238 | ||||||
JAPAN (15.3%) | ||||||||
Consumer Discretionary (1.5%) | ||||||||
Shimano, Inc. (a) | 9,100 | 1,210,015 | ||||||
Consumer Staples (2.6%) | ||||||||
Japan Tobacco, Inc. (a) | 78,400 | 2,107,486 | ||||||
Financials (1.7%) | ||||||||
Japan Exchange Group, Inc. (a) | 75,000 | 1,388,930 | ||||||
Health Care (2.0%) | ||||||||
Sysmex Corp. (a) | 18,700 | 1,651,907 | ||||||
Industrials (1.4%) | ||||||||
FANUC Corp. (a) | 5,100 | 1,092,473 | ||||||
Information Technology (2.2%) | ||||||||
Keyence Corp. (a) | 2,900 | 1,768,360 | ||||||
Materials (2.0%) | ||||||||
Shin-Etsu Chemical Co. Ltd. (a) | 16,300 | 1,635,699 | ||||||
Real Estate (1.9%) | ||||||||
Daito Trust Construction Co. Ltd. (a) | 9,000 | 1,501,784 | ||||||
| 12,356,654 | ||||||||
MEXICO (2.7%) | ||||||||
Consumer Staples (2.7%) | ||||||||
Fomento Economico Mexicano SAB de CV, ADR | 23,000 | 2,223,180 | ||||||
PHILIPPINES (1.6%) | ||||||||
Real Estate (1.6%) | ||||||||
Ayala Land, Inc. (a) | 1,630,100 | 1,280,918 | ||||||
REPUBLIC OF SOUTH KOREA (2.5%) | ||||||||
Consumer Staples (2.5%) | ||||||||
Amorepacific Group (a) | 15,000 | 1,998,864 | ||||||
SINGAPORE (3.3%) | ||||||||
Financials (2.2%) | ||||||||
Oversea-Chinese Banking Corp. Ltd. (a) | 174,462 | 1,801,945 | ||||||
Telecommunication Services (1.1%) | ||||||||
Singapore Telecommunications Ltd. (a) | 333,100 | 881,081 | ||||||
| 2,683,026 | ||||||||
SOUTH AFRICA (1.5%) | ||||||||
Telecommunication Services (1.5%) | ||||||||
MTN Group Ltd. (a) | 120,300 | 1,208,694 | ||||||
SWEDEN (1.9%) | ||||||||
Industrials (1.9%) | ||||||||
Atlas Copco AB, A Shares (a) | 39,700 | 1,552,521 | ||||||
See accompanying Notes to Financial Statements.
| 12 | Semi-Annual Report 2018 |
Statement of Investments (concluded)
April 30, 2018 (Unaudited)
Aberdeen Select International Equity Fund II
| Shares or Principal Amount | Value | |||||||
SWITZERLAND (7.1%) | ||||||||
Consumer Staples (2.1%) | ||||||||
Nestle SA (a) | 21,600 | $ | 1,673,354 | |||||
Health Care (5.0%) | ||||||||
Novartis AG (a) | 26,600 | 2,047,516 | ||||||
Roche Holding AG (a) | 9,100 | 2,021,905 | ||||||
| 4,069,421 | ||||||||
| 5,742,775 | ||||||||
TAIWAN (2.9%) | ||||||||
Information Technology (2.9%) | ||||||||
Taiwan Semiconductor Manufacturing Co. Ltd. | 311,000 | 2,386,122 | ||||||
THAILAND (2.0%) | ||||||||
Financials (2.0%) | ||||||||
Kasikornbank PCL (a) | 261,200 | 1,658,369 | ||||||
UNITED KINGDOM (20.2%) | ||||||||
Consumer Discretionary (2.6%) | ||||||||
Whitbread PLC (a) | 35,111 | 2,065,830 | ||||||
Consumer Staples (3.7%) | ||||||||
British American Tobacco PLC (a) | 29,300 | 1,607,031 | ||||||
Diageo PLC | 37,800 | 1,348,502 | ||||||
| 2,955,533 | ||||||||
Energy (2.7%) | ||||||||
Royal Dutch Shell PLC, B Shares (a) | 60,900 | 2,174,059 | ||||||
Financials (2.1%) | ||||||||
Prudential PLC (a) | 67,400 | 1,733,125 | ||||||
Industrials (3.8%) | ||||||||
Experian PLC (a) | 79,500 | 1,821,518 | ||||||
Rolls-Royce Holdings PLC (a)(b) | 111,000 | 1,281,955 | ||||||
Rolls-Royce Holdings PLC, C Shares (b) | 7,881,000 | 10,850 | ||||||
| 3,114,323 | ||||||||
Materials (1.1%) | ||||||||
BHP Billiton PLC (a) | 40,800 | 869,954 | ||||||
Telecommunication Services (4.2%) | ||||||||
Inmarsat PLC (a) | 232,800 | 1,202,707 | ||||||
Vodafone Group PLC (a) | 755,900 | 2,205,875 | ||||||
| 3,408,582 | ||||||||
| 16,321,406 | ||||||||
UNITED STATES (2.8%) | ||||||||
Consumer Discretionary (2.8%) | ||||||||
Samsonite International SA (a) | 496,000 | 2,243,588 | ||||||
Total Common Stocks | 74,684,685 | |||||||
PREFERRED STOCKS (8.6%) | ||||||||
BRAZIL (2.4%) | ||||||||
Financials (2.4%) | ||||||||
Banco Bradesco SA, ADR, Preferred Shares, 1.94% | 194,067 | 1,901,857 | ||||||
GERMANY (3.0%) | ||||||||
Consumer Staples (3.0%) | ||||||||
Henkel AG & Co. KGaA, Preferred Shares, 1.33% (a) | 19,400 | 2,465,444 | ||||||
REPUBLIC OF SOUTH KOREA (3.2%) | ||||||||
Information Technology (3.2%) | ||||||||
Samsung Electronics Co. Ltd., Preferred Shares (a) | 1,310 | 2,604,795 | ||||||
Total Preferred Stocks | 6,972,096 | |||||||
SHORT-TERM INVESTMENT (1.4%) | ||||||||
UNITED STATES (1.4%) | ||||||||
State Street Institutional U.S. Government Money Market Fund, Institutional Class, 1.28% (c) | 1,125,812 | 1,125,812 | ||||||
Total Short-Term Investment | 1,125,812 | |||||||
Total Investments | 82,782,593 | |||||||
Liabilities in Excess of Other Assets—(2.4)% | (1,915,818 | ) | ||||||
Net Assets—100.0% |
| $ | 80,866,775 | |||||
| (a) | Fair Values are determined pursuant to procedures approved by the Fund’s Board of Trustees. Unless otherwise noted, securities are valued by applying valuation factors to the exchange traded price. See Note 2(a) of the accompanying Notes to Financial Statements. |
| (b) | Non-income producing security. |
| (c) | Registered investment company advised by State Street Global Advisors. The rate shown is the 7 day yield as of April 30, 2018. |
| (d) | See accompanying Notes to Financial Statements for tax unrealized appreciation/(depreciation) of securities. |
| ADR | American Depositary Receipt |
| PLC | Public Limited Company |
See accompanying Notes to Financial Statements.
| 2018 Semi-Annual Report | 13 |
Aberdeen Total Return Bond Fund (Unaudited)
The Aberdeen Total Return Bond Fund (Institutional Class shares net of fees) returned -1.68% for the six-month period ended April 30, 2018, versus the -1.87% return of its benchmark, the Bloomberg Barclays U.S. Aggregate Bond Index, for the same period. For broader comparison, the average return of the Fund’s Lipper peer category of Core Bond Funds (comprising 220 funds) was -1.80% for the period.
After a relatively calm period in 2017, volatility returned with to global financial markets in the first quarter of 2018, with a major expansion of U.S. fiscal policy, some nascent signs of inflation, and fear of a trade war. U.S. economic growth remained solid over the six-month reporting period, with momentum and expectations accelerating and then receding somewhat. The labor market continued to tighten, with U.S. payrolls expanding by a monthly average of 198,000 during the six-month reporting period. The unemployment rate dipped 0.2 percentage point to 3.9% – its lowest level since April 2000.1 With such tight labor supply and the Consumer Price Index (CPI), an inflation indicator, approaching the U.S. Federal Reserve’s (Fed’s) annualized target rate of 2%, the economy received an unusual and large late-cycle fiscal boost, as the Republican majority in the U.S. Congress enacted tax reform legislation in December 2017. The bill cuts tax rates for corporations and individuals and reduces or eliminates some personal deductions, with estimated cost of more than $1.5 trillion over 10 years. The package is very favorable to corporations, which we believe should be supportive of credit markets as well as business and consumer sentiment. Congress also passed a budget that includes a $400 billion fiscal stimulus package.
The Fed, under the leadership of new Chair Jerome Powell, who succeeded Janet Yellen in early February 2018, appeared to be increasingly confident that the U.S. economy can withstand higher interest rates. The central bank raised its benchmark interest rate in two increments of 25 basis points (bps) to a range of 1.50% to 1.75% following its meetings in December 2017 and March 2018, and revised upward its expectations for the pace at which it will increase rates in 2019. U.S. companies generally reported strong fourth-quarter 2017 earnings results as they began to communicate the effect of the recently implemented U.S. tax cuts on their profits, while estimates of profit growth rose. Investors’ exuberance was curtailed by several economic data releases indicating signs of higher wages and inflation. Political uncertainty further unsettled the markets as the administration of President Donald Trump ramped up its threat of trade wars amid White House cabinet reshuffling. The U.S. announced tariffs on $50 billion in Chinese imports, and the Chinese government responded more promptly than expected. The threat of escalation of geopolitical hotspots also exacerbated the jittery market.
Globally, economic data in the Eurozone softened meaningfully from elevated levels after the beginning of 2018, populists made significant gains in the Italian election in March 2018, and Prime Minister Angela Merkel toiled to establish a coalition government in Germany. The European Central Bank (ECB) demonstrated that it is in no rush to raise interest rates, but scaled back its commitments to expand quantitative easing in the event the economy falters. In the UK, the backdrop of improving wage growth and low unemployment, combined with the news that the UK government and the European Union had agreed on the Brexit transition deal, provided the Bank of England (BoE) with the confidence to raise interest rates further. Economic growth in Japan and Prime Minister Shinzo Abe’s popularity appeared to have peaked, while inflation remained subdued. Conversely, China’s economic growth during the reporting period surprised to the upside, enhancing investor confidence in the emerging markets.
The U.S. Treasury yield curve bear2 flattened in early 2018 after a brief steepening, dominated by moves at the short end. Major developed markets also experienced notable increases in yields in the first two months of 2018. The upward trend in yields resulted from of the expectation of less accommodating global central bank monetary policy accommodation, a drastic rise in U.S. Treasury issuance, as well as reduced demand from central banks and private investors. Global risk markets experienced higher volatility and drawdowns3 as concerns over a potential trade war between the U.S. and China intensified. In the U.S. fixed-income market, the widening spread between the London Interbank Offered Rate (Libor) and the Overnight Indexed Swap4 presented strong headwinds. Spreads for non-U.S. Treasury securities widened dramatically between late January and the end of the reporting period, after narrowing sharply over the previous 12 months. U.S. corporate bonds, as measured by the ICE Bank of America Merrill Lynch (BofA ML) U.S. Corporate Master Index,5 fell 2.3% over the reporting period, while U.S., high-yield bonds, as represented by the ICE BofA ML U.S. High Yield Master II Index,6 declined 0.2%. Excess returns in securitized products were generally positive over the period with the option-adjusted spread of MBS widen the most for the period. The U.S. dollar depreciated against most G107 currencies throughout the reporting period due to concerns about the U.S. government’s funding of its increasing fiscal and trade deficits. Emerging-market equities held up relatively well over the period, but emerging-market debt lost ground.
| 1 | Source: U.S. Department of Labor, May 2018 |
| 2 | A yield curve bear occurs in an environment in which short-term interest rates are increasing at a quicker pace than long-term rates. |
| 3 | Drawdown refers to the peak-to-trough decline during a specific period for an investment, fund or commodity. |
| 4 | The London Interbank Offered Rate (Libor) is the most common benchmark interest rate index used to make adjustments to variable-rate loans and credit cards. Global banks use Libor when charging each other for short-term loans. The Overnight Indexed Swap (OIS) is an interest rate swap in which the overnight rate being exchanged for a fixed interest rate. |
| 5 | The ICE BofA ML U.S. Corporate Master Index tracks the performance of U.S. dollar-denominated investment-grade corporate debt publicly issued in the U.S. domestic market. Indexes are unmanaged and have been provided for comparison purposes only. No fees or expenses are reflected. You cannot invest directly in an index. |
| 6 | The ICE BofA ML U.S. High Yield Master II Index tracks the performance of U.S. dollar-, Canadian dollar-, euro- and sterling-denominated, below-investment-grade corporate debt publicly issued in the major domestic or eurobond markets. |
| 7 | The Fund’s investment universe includes six global fixed-income market segments: Core (U.S. investment-grade fixed income); Major (Eurozone, Japan and the UK, among others); Satellites (including, but not limited to Canada, Hong Kong and Switzerland); Convergence (Czech Republic, Hungary and Poland, among others); Commodity (including, but not limited to, Australia, Chile and Russia); and Low Correlation (Brazil, China and Mexico, among others). |
| 14 | Semi-Annual Report 2018 |
Aberdeen Total Return Bond Fund (Unaudited) (continued)
The strongest-performing currencies for the period included the Mexican peso, Colombian peso and South African rand.
The Fund’s investments in its Core U.S. market segment7 generated most of the outperformance versus its benchmark, the Bloomberg Barclays U.S. Aggregate Bond Index, for the reporting period. Security selection was the primary contributor to the Fund’s relative performance, with the bulk of the alpha9 emanating from Treasury Inflation-Protected Securities (TIPS) and investment-grade corporate credits, augmented by commercial mortgage-backed securities (CMBS). The Fund’s yield-curve positioning also benefited performance. Sector allocation decisions contributed to Fund performance, led by an underweight allocation to U.S. Treasuries relative to the benchmark. An underweight allocation to agency mortgage-backed securities (MBS) and an overweight to non-agency MBS also bolstered Fund performance. Conversely, the Fund’s overweight position in asset-backed securities (ABS) relative to the benchmark weighed on relative performance for the period.
On the international front, Fund performance over the reporting period was bolstered by holdings in non-U.S. dollar government bonds and our effective management of currency exposures. The Fund’s commodity segment produced strong results in the fixed-income sector, as holdings in South African government bonds and the country’s currency, the rand, generated substantial alpha.8 The Fund’s positions in government bonds in Russia and Australia also benefited performance; however, currency exposure in Russia and the Czech Republic offset some of the gains. Within the Fund’s low correlation9 segment, bond holdings and currency exposure in Chile, South Africa and New Zealand had a positive impact on performance for the reporting period. Similarly, in the Fund’s satellite segment, New Zealand dollar-denominated bonds contributed to relative performance as the country’s political and policy uncertainty dampened expectations of economic growth and interest-rate hikes. Currency positions in the Fund’s major and convergence segments encountered difficulties as hedging weighed on performance when volatility and correlation rose with the threat of trade and geopolitical conflicts.
We employed derivatives over the reporting period, including U.S. Treasury futures, in an effort to manage the Fund’s overall yield-curve and interest-rate exposure, and protect the Fund from sharply rising yields. We utilized foreign exchange forwards9 in an effort to gain exposure to foreign markets efficiently and to hedge currency risks from sovereign bond holdings. Our use of futures bolstered the Fund’s performance in global interest-rate allocation and yield-curve positioning. The derivatives positions did not have a significant impact on Fund performance for the reporting period.
At the beginning of 2018, we positioned the Fund with a relatively conservative risk profile as we believed that the markets were complacent, particularly to the threat of trade wars. We took profits in the Fund’s positions in foreign government bonds and currencies towards the end of 2017, when their spreads narrowed dramatically versus their U.S. counterparts. In January 2018, we reduced the Fund’s exposure to non-Treasury issues as their spreads tightened significantly when markets became exuberant by fiscal expansion and corporate earnings potential. In addition to a notable underweight allocation to agency MBS relative to the benchmark Bloomberg Barclays U.S. Aggregate Bond Index, we moved the Fund to an underweight to corporate credits while significantly reducing the market beta11 for the CMBS holdings. We sought the relative safety of high-quality ABS, especially after the front-end swap spreads12 widened. After the underperformance of spread sectors due to higher volatility, we gradually covered the Fund’s underweights at what we viewed as fairer valuation levels. For example, we increased the Fund’s exposure to corporate bonds to an overweight relative to the benchmark after the sell-off in the sector, while we reduced the holdings in ABS following a period of strong relative performance. We also increased the Fund’s exposure to foreign bonds and currencies when inflation indicators tempered while the Fed seemed to have tilted to gradual monetary policy-tightening after its March 2018 meeting, which proved to be premature.
We view the base case of our global outlook as a “long goodbye to Goldilocks.” In our opinion, solid global economic growth, slowly firming inflation and a gradual normalization of central bank monetary policy should be constructive for the performance of risk assets. We think there is evidence that global growth is peaking, though we see no sign of a major global recession in our investment horizon.13 Despite indications of slowing capital expenditures and consumer spending, we believe that the modest business investment boom is still in place, while seasonality likely contributed to the slip in consumer spending in the first quarter of 2018. We believe that the impact of fiscal stimuli will increase in mid-2018. In our view, the Fed appears set to continue on the path to raise its benchmark interest rate three times in 2018, as projected by the Fed “dot plot.”14 Hard inflation data most likely will determine the speed of future policy execution, along with the Fed’s slightly hawkish tilt. In our opinion, all these factors, coupled with higher U.S. Treasury supply, will drive yields higher; however, continued asset purchases by the Bank of Japan and the ECB could limit the extent of the rates sell-off globally. Nonetheless, we believe that the economic transition from reliance on monetary easing to fiscal stimuli will not be smooth, particularly with the threat of trade conflicts and inflation. We believe that volatility will remain high, as asset valuations are generally elevated.
| 7 | The Fund’s investment universe includes six global fixed-income market segments: Core (U.S. investment-grade fixed income); Major (Eurozone, Japan and the UK, among others); Satellites (including, but not limited to Canada, Hong Kong and Switzerland); Convergence (Czech Republic, Hungary and Poland, among others); Commodity (including, but not limited to, Australia, Chile and Russia); and Low Correlation (Brazil, China and Mexico, among others). |
| 8 | Alpha is a measure of performance that takes the volatility of a mutual fund and compares its risk-adjusted performance to a benchmark index. |
| 9 | Correlation is a measure of the degree to which the performance of two securities moves in relation to each other. |
| 11 | Beta is a measure of the volatility of a portfolio in comparison to a benchmark index. |
| 12 | A swap comprises a financial agreement to exchange cash flows. A swap spread is the difference between the fixed rate component of a given swap and the yield on a Treasury item or other fixed-income investment with a similar maturity. |
| 13 | Forecasts and estimates are offered as opinion and are not reflective of potential performance, are not guaranteed and actual events or results may differ materially. |
| 14 | The “dot plot” represents the Federal Reserve members’ views on where the federal funds rate should be at the end of the various calendar years as indicated, as well as over the long term. |
| 2018 Semi-Annual Report | 15 |
Aberdeen Total Return Bond Fund (Unaudited) (continued)
We are bearish regarding the Fund’s duration,15 particularly in the U.S., while we have positioned the Fund with a sizeable allocation to international government bonds. We intend to maintain the underweight allocation to agency MBS relative to the benchmark Bloomberg Barclays U.S. Aggregate Bond Index in an effort to protect against higher volatility and negative backdrop of the Fed’s balance-sheet unwinding. While the environment for U.S. household credit has been very strong, we are beginning to see some signs of normalization. Mortgage credit remains tight while the U.S. household debt-to-income ratio recently has risen. In our view, appreciation in home prices and tight supply should remain supportive of residential mortgage credits. Commercial real estate, despite negative headlines in the retail sector, continues to perform well, with positive supply and vacancy trends, and strong demand from overseas buyers keeping cap rates16 steady. Spreads widened during the recent market volatility, but are still tight enough that it pays to be selective, in our opinion. We continue to favor non-agency MBS and single-borrower CMBS, while we feel that there is less value in consumer ABS. We believe that the fundamental backdrop remains relatively positive for investment-grade17 credit, with earnings improving and leverage at manageable levels. After the recent credit spread-widening, we view corporate bonds as more fairly valued, with certain sectors such as banks and short-duration non-financials offering attractive entry points. We believe that the current short-end credit curve will steepen again over the next several months. Considering that the fundamental economic growth story for emerging markets remains intact, we maintain our preference for government bonds issued by countries with strengthening domestic economies and stable-to-improving balance of payments, as well as those that have managed to implement structural upgrades.
President Trump continues to work through his election manifesto with emphasis on “America first.” which we believe constitutes the largest risk to U.S. economic growth prospects and market stability. Despite some escalation of rhetoric, import tariffs have not been imposed and there has been progress on North American Free Trade Agreement (NAFTA) negotiations, which we believe supports the increasingly popular narrative that this is merely a trade skirmish rather than a war. Nonetheless, we believe that trade conflicts and geopolitical tensions are unlikely to dissipate, given questions relating to sanctions on Russia, the Iran nuclear pact, the denuclearization of North Korea, the Chinese political economy, and the lead-up to the mid-term Congressional elections in the U.S. in November 2018 In our view, the market appears to have underpriced European political risk relating to potential governments cobbled together by Euroskeptic18 parties. With the ECB due to taper its quantitative easing, political uncertainties may increase investors’ risk aversion in Europe, which could be further exacerbated by slowing of growth and trade that proven not temporary. These pose downside potential for economic growth and global financial markets. We favor allocating the Fund’s duration budget19 to markets where we believe that monetary policy provides investors with shelter from higher interest rates and are relatively immune or even benefit from the downside scenario. However, it appears that political risks present the biggest challenge for the Fund’s non-U.S. dollar exposure. We believe that the U.S. dollar will weaken due to the government’s increasing fiscal and trade deficits, as the depreciation of the currency presents the most politically expedient channel to address. In our opinion, protectionism and other harmful policies may discourage foreign investors and damage the U.S.’s reserve currency status. However, expectations of higher inflation and interest rates can be positive factors for the U.S. dollar, as well as potential safe-haven demands under a full blown trade or military war. We believe that another risk to our base case is inflation surprising to the upside as spare capacity is eroded in the most advanced economies; how central banks react to them in face of tightening financial conditions may prove challenging. We like the protective property of inflation-linked bonds. In our opinion, local-currency government bonds in the Fund’s commodity market segment should be effective tools amid an environment in which inflation dynamics are changing. We believe that effective management of yield-curve exposure while riding a flattening trend can be another crucial tool in navigating the turbulence in the U.S. fixed-income market.
Portfolio Management:
Aberdeen North American Fixed Income Team
PAST PERFORMANCE DOES NOT GUARANTEE FUTURE RESULTS.
The performance quoted represents past performance, which does not guarantee future results. Class A shares have up to a 0.25% 12b-1 fee. The investment return and principal value of an investment will fluctuate so that an investor’s shares, when redeemed, may be worth more or less than their original cost. Current performance of the Fund may be lower or higher than the performance quoted. Performance data current to the most recent month-end may be obtained by calling 866-667-9231 or visiting www.aberdeen-asset.us.
Investing in mutual funds involves risk, including possible loss of principal. There is no assurance that the investment objective of any fund will be achieved. Indexes are unmanaged and have been provided for comparison purposes only. No fees or expenses are reflected. You cannot invest directly in an index.
Lipper is a leading global provider of mutual fund information and analysis to fund companies, financial intermediaries and media organizations.
| 15 | Duration is an estimate of bond price sensitivity to changes in interest rates. The higher the duration, the greater the change (i.e., higher risk) in relation to interest-rate movements. |
| 16 | The capitalization (“cap”) rate comprises the rate of return on a real estate investment property based on the income that the property is expected to generate. |
| 17 | Companies whose bonds are rated as “investment-grade” have a lower chance of defaulting on their debt than those rated as “non-investment grade.” These bonds generally are issued by long-established companies with strong balance sheets. Bonds rated BBB or above by major credit rating agencies are considered investment-grade. |
| 18 | Euroskeptics are opposed to increasing the powers of the European Union. |
| 19 | Duration budgeting comprises the process of analyzing, allocating and deciding to which markets a portfolio’s duration should be allocated. |
| 16 | Semi-Annual Report 2018 |
Aberdeen Total Return Bond Fund (Unaudited) (concluded)
Risk Considerations
Fixed income securities are subject to certain risks including, but not limited to: interest rate (changes in interest rates may cause a decline in the market value of an investment), credit (changes in the financial condition of the issuer, borrower, counterparty, or underlying collateral), prepayment (debt issuers may repay or refinance their loans or obligations earlier than anticipated), and extension (principal repayments may not occur as quickly as anticipated, causing the expected maturity of a security to increase).
Investments in asset-backed and mortgage-backed securities include additional risks that investors should be aware which include those associated with fixed income securities, as well as increased susceptibility to adverse economic developments.
Derivatives are speculative and may hurt the Fund’s performance. They present the risk of disproportionately increased losses and/or reduced gains when the financial asset or measure to which the derivative is linked changes in unexpected ways.
Foreign securities may be more volatile, harder to price and less liquid than U.S. securities. They are subject to different accounting and regulatory standards and currency exchange rate, political and economic risks. Fluctuation in currency exchange rates may impact a Fund’s returns more greatly to the extent a Fund does not hedge currency exposure or hedging techniques are unsuccessful. The foregoing risks are enhanced in emerging market countries.
Municipal securities can be affected by adverse tax, legislative or political changes and the financial condition of the issuers of municipal securities.
Investing a significant portion of the Fund’s assets in securities of companies conducting business in a broadly related group of industries within an economic sector may make the Fund more vulnerable to unfavorable developments in that sector.
Please read the prospectus for more detailed information regarding these and other risks.
| 2018 Semi-Annual Report | 17 |
Aberdeen Total Return Bond Fund (Unaudited)
Average Annual Total Return (For periods ended April 30, 2018) | Six Month† | 1 Yr. | 5 Yr. | 10 Yr. | ||||||||||||
Class A | w/o SC* | (1.79)% | (0.02)% | 1.11% | 3.68% | |||||||||||
Institutional Class | w/o SC* | (1.68)% | 0.18% | 1.37% | 3.94% | |||||||||||
| † | Not Annualized |
| * | Class A shares and Institutional Class shares are not subject to any sales charges. |
Performance of a $10,000 Investment (as of April 30, 2018)
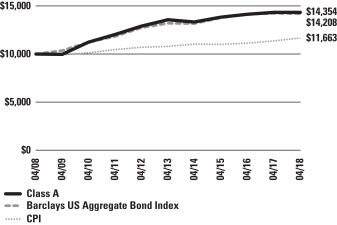
Comparative performance of $10,000 invested in Class A shares of the Aberdeen Total Return Bond Fund, Bloomberg Barclays U.S. Aggregate Bond Index and the Consumer Price Index (CPI) over a 10-year period ended April 30, 2018. Unlike the Fund’s returns, the returns for these unmanaged indexes do not reflect any fees or expenses. Investors cannot invest directly in market indexes.
The Bloomberg Barclays U.S. Aggregate Bond Index (the “U.S. Aggregate”) is a broad-based flagship benchmark that measures the investment grade, U.S. Dollar-denominated, fixed-rate taxable bond market. The index includes Treasuries, government-related and corporate securities, MBS (agency fixed-rate and hybrid ARM pass-throughs), ABS and CMBS (agency and non-agency). Provided the necessary inclusion rules are met, U.S. Aggregate eligible securities also contribute to the multi-currency Bloomberg Barclays Global Aggregate Bond Index and the Bloomberg Barclays U.S. Universal Index, which includes high yield and emerging markets debt.
The CPI is a measure of the average change over time in the prices paid by urban consumers for a market basket of consumer goods and services.
Investment return and principal value will fluctuate, and when redeemed, shares may be worth more or less than original cost. Past performance is no guarantee of future results. The Average Annual Total Return table and performance graph do not reflect the deduction of taxes that a shareholder would pay on Fund distributions or the redemption of Fund shares. Investing in mutual funds involves market risk, including loss of principal. Performance returns assume the reinvestment of all distributions. Performance returns reflect fee waivers and reimbursements in effect without which returns would have been lower.
| 18 | Semi-Annual Report 2018 |
Aberdeen Total Return Bond Fund (Unaudited) (concluded)
Portfolio Summary (as a percentage of net assets)
April 30, 2018 (Unaudited)
| Asset Allocation | ||||
Corporate Bonds | 34.2% | |||
Agency Mortgage-Backed Securities | 10.7% | |||
Commercial Mortgage-Backed Securities | 9.0% | |||
Asset-Backed Securities | 8.8% | |||
Non-Agency Mortgage-Backed Securities | 8.8% | |||
U.S. Treasuries | 8.6% | |||
Government Bonds | 7.7% | |||
U.S. Agencies | 7.2% | |||
Municipal Bonds | 3.8% | |||
Short-Term Investment | 0.3% | |||
Other Assets in Excess of Liabilities | 0.9% | |||
| 100.0% | ||||
The following chart summarizes the composition of the Fund’s portfolio, expressed as a percentage of net assets. The industries listed below may include more than one industry group. As of April 30, 2018, the Fund did not have more than 25% of its assets invested in any single industry or industry group.
| Top Industries | ||||
Commercial Banks | 12.5% | |||
Electric Utilities | 3.8% | |||
Internet | 1.7% | |||
Pharmaceutical | 1.7% | |||
Beverages | 1.7% | |||
Supranational | 1.4% | |||
Diversified Financial Services | 1.4% | |||
Auto Manufacturers | 1.3% | |||
Insurance | 1.1% | |||
Healthcare Providers & Services | 1.1% | |||
Other | 72.3% | |||
| 100.0% | ||||
| Top Holdings* | ||||
Norway Government Bond 02/17/2027 | 2.1% | |||
U.S. Treasury Note 08/15/2027 | 1.8% | |||
Citigroup, Inc. 07/15/2039 | 1.5% | |||
International Finance Corp. 08/15/2022 | 1.4% | |||
U.S. Treasury Note 02/28/2025 | 1.4% | |||
State of Connecticut General Obligation Unlimited Bonds, Series A 03/15/2032 | 1.2% | |||
U.S. Treasury Bond 05/15/2038 | 1.2% | |||
Standard Chartered PLC 09/08/2019 | 1.0% | |||
Citibank NA 09/18/2019 | 1.0% | |||
Government National Mortgage Association, MBS 09/20/2046 | 1.0% | |||
Other | 86.4% | |||
| 100.0% | ||||
| * | For the purpose of listing top holdings, Short-Term Investments are included as part of Other. |
| Top Countries | ||||
United States | 82.8% | |||
Norway | 3.0% | |||
Supranational | 2.4% | |||
Canada | 2.4% | |||
United Kingdom | 1.7% | |||
Malaysia | 1.5% | |||
Sweden | 1.2% | |||
South Africa | 1.1% | |||
Thailand | 1.1% | |||
Other | 0.9% | |||
Other | 1.9% | |||
| 100.0% | ||||
| 2018 Semi-Annual Report | 19 |
Statement of Investments
April 30, 2018 (Unaudited)
Aberdeen Total Return Bond Fund
| Shares or Principal Amount | Value (US$) | |||||||
ASSET-BACKED SECURITIES (8.8%) |
| |||||||
CANADA (0.5%) |
| |||||||
Golden Credit Card Trust, Series 2017-4A, Class A, 1M USD LIBOR + 0.520%, (USD), 2.42%, 07/15/2024 (a)(b) | $ | 1,418,000 | $ | 1,420,823 | ||||
UNITED STATES (8.3%) |
| |||||||
Ally Auto Receivables Trust, Series 2016-2, Class A3, (USD), 1.35%, 05/15/2020 | 553,258 | 550,808 | ||||||
American Express Credit Account Master Trust |
| |||||||
Series 2017-1, Class A, (USD), 1.93%, 09/15/2022 | 1,252,000 | 1,232,582 | ||||||
Series 2017-6, Class A, (USD), 2.04%, 05/15/2023 | 1,102,000 | 1,079,959 | ||||||
BMW Vehicle Lease Trust 2017-2, Series 2017-2, Class A3, ABS (USD), 2.07%, 10/20/2020 | 1,148,000 | 1,135,237 | ||||||
Capital One Multi-Asset Execution Trust, Series 2017-A5, Class A5, 1M USD LIBOR + 0.580%, (USD), 2.48%, 07/15/2027 (a) | 1,729,000 | 1,740,391 | ||||||
Chase Issuance Trust, Series 2016-A5, Class A5, (USD), 1.27%, 07/15/2021 | 1,076,000 | 1,058,381 | ||||||
Citibank Credit Card Issuance Trust |
| |||||||
Series 2014-A1, Class A1 (USD), 2.88%, 01/23/2023 | 1,204,000 | 1,202,455 | ||||||
Series 2016-A1, Class A1, ABS (USD), 1.75%, 11/19/2021 | 1,482,000 | 1,459,340 | ||||||
CNH Equipment Trust |
| |||||||
Series 2015-B, Class A4, (USD), 1.89%, 04/15/2022 | 1,300,000 | 1,291,262 | ||||||
Series 2017-A, Class A3, (USD), 2.07%, 05/16/2022 | 1,045,000 | 1,031,774 | ||||||
Daimler Trucks Retail Trust 2018-1, Series 2018-1, Class A4, ABS (USD), 3.03%, 11/15/2024 (b) | 1,493,000 | 1,490,059 | ||||||
Discover Card Execution Note Trust, Series 2016-A4, Class A4, (USD), 1.39%, 03/15/2022 | 1,465,000 | 1,439,093 | ||||||
Ford Credit Auto Lease Trust, Series 2017-B, Class A4 (USD), 2.17%, 02/15/2021 | 915,000 | 903,613 | ||||||
Ford Credit Auto Owner Trust, Series 2018-1, Class A (USD), 3.19%, 07/15/2031 (b) | 846,000 | 830,806 | ||||||
Ford Credit Floorplan Master Owner Trust, Series 2017-1, Class A1 (USD), 2.07%, 05/15/2022 | 1,012,000 | 994,202 | ||||||
Honda Auto Receivables Owner Trust, Series 2016-4, Class A2, (USD), 1.04%, 04/18/2019 | 339,063 | 338,522 | ||||||
John Deere Owner Trust, Series 2017-B, Class A3, (USD), 1.82%, 10/15/2021 | 1,490,000 | 1,465,322 | ||||||
SLM Student Loan Trust |
| |||||||
Series 2011-1, Class A1, (USD), 1M USD LIBOR + 0.520%, 2.42%, 03/25/2026 (a) | 283,661 | 284,485 | ||||||
Series 2011-2, Class A1, (USD), 1M USD LIBOR + 0.600%, 2.50%, 11/25/2027 (a) | 677,254 | 680,941 | ||||||
Series 2013-2, Class A, (USD), 1M USD LIBOR + 0.450%, 2.35%, 09/25/2043 (a) | 532,314 | 534,050 | ||||||
Synchrony Credit Card Master Note Trust, Series 2015-1, Class A, (USD), 2.37%, 03/15/2023 | 1,140,000 | 1,128,590 | ||||||
Tesla Auto Lease Trust 2018-A, Series 2018-A, Class D, ABS (USD), 3.30%, 05/20/2020 (b) | 782,000 | 778,057 | ||||||
Toyota Auto Receivables Owner Trust, Series 2016-D, Class A2A, (USD), 1.06%, 05/15/2019 | 193,979 | 193,727 | ||||||
Volvo Financial Equipment LLC, Series 2016-1A, Class A3 (USD), 1.67%, 02/18/2020 (b) | 776,408 | 773,590 | ||||||
| 23,617,246 | ||||||||
Total Asset-Backed Securities |
| 25,038,069 | ||||||
COMMERCIAL MORTGAGE-BACKED SECURITIES (9.0%) |
| |||||||
UNITED STATES (9.0%) |
| |||||||
Caesars Palace Las Vegas Trust, Series 2017-VICI, Class A (USD), 3.53%, 10/15/2034 (b) | 1,271,000 | 1,275,878 | ||||||
COMM 2016-DC2 Mortgage Trust, Series 2016-DC2, Class ASB (USD), 3.55%, 02/10/2049 | 1,031,000 | 1,037,347 | ||||||
Commercial Mortgage Trust |
| |||||||
Series 2014-TWC, Class B, (USD), 1M LIBOR + 1.600%, 3.50%, 02/13/2032 (a)(b) | 870,000 | 871,363 | ||||||
Series 2015-DC1, Class ASB (USD), 3.14%, 02/10/2048 | 1,000,000 | 995,573 | ||||||
Flagstar Mortgage Trust 2018-1, Series 2018-1, Class A3, CMO (USD), 3.50%, 03/25/2048 (a)(b) | 1,201,062 | 1,175,915 | ||||||
FREMF Mortgage Trust |
| |||||||
Series 2012-K21, Class C, (USD), 4.07%, 07/25/2045 (a)(b) | 996,583 | 976,886 | ||||||
Series 2012-K23, Class C, (USD), 3.78%, 10/25/2045 (a)(b) | 488,000 | 470,886 | ||||||
GS Mortgage Securities Corp. II, Series 2017-375H, Class B, (USD), 3.60%, 09/10/2037 (a)(b) | 1,375,000 | 1,328,591 | ||||||
GS Mortgage Securities Corp. Trust |
| |||||||
Series 2012-SHOP, Class B (USD), 3.31%, 06/05/2031 (b) | 1,363,000 | 1,364,720 | ||||||
Series 2017-GPTX, Class A (USD), 2.86%, 05/10/2034 (b) | 835,714 | 819,379 | ||||||
Series 2017-GPTX, Class C (USD), 3.30%, 05/10/2034 (b) | 1,045,000 | 1,020,223 | ||||||
GSCCRE Commercial Mortgage Trust, Series 2015-HULA, Class B, (USD), 1M LIBOR + 2.300%, 4.20%, 08/15/2032 (a)(b) | 1,340,000 | 1,345,057 | ||||||
Hilton USA Trust, Series 2016-SFP, Class C, (USD), 4.12%, 11/05/2035 (b) | 1,229,000 | 1,222,419 | ||||||
Morgan Stanley Bank of America Merrill Lynch Trust, Series 2017-C34, Class AS (USD), 3.86%, 11/15/2052 | 1,055,625 | 1,050,879 | ||||||
Morgan Stanley Capital I Trust |
| |||||||
Series 2017-CLS, Class A (USD), 2.60%, 11/15/2034 (a)(b) | 1,331,000 | 1,332,672 | ||||||
Series 2012-C4, Class A4 (USD), 3.24%, 03/15/2045 | 1,444,000 | 1,437,077 | ||||||
See accompanying Notes to Financial Statements.
| 20 | Semi-Annual Report 2018 |
Statement of Investments (continued)
April 30, 2018 (Unaudited)
Aberdeen Total Return Bond Fund
| Shares or Principal Amount | Value (US$) | |||||||
Sequoia Mortgage Trust 2018-5, Series 2018-5, Class A4, CMO (USD), 3.50%, 05/25/2048 (a)(b) | $ | 1,542,000 | $ | 1,524,894 | ||||
SFAVE Commercial Mortgage Securities Trust |
| |||||||
Series 2015-5AVE, Class B (USD), 4.53%, 01/05/2043 (a)(b) | 490,000 | 464,141 | ||||||
Series 2015-5AVE, Class C (USD), 4.53%, 01/05/2043 (a)(b) | 960,000 | 848,063 | ||||||
Wells Fargo Commercial Mortgage Trust |
| |||||||
Series 2015-C29, Class ASB (USD), 3.40%, 06/15/2048 | 1,160,000 | 1,161,061 | ||||||
Series 2015-LC22, Class ASB (USD), 3.57%, 09/15/2058 | 1,210,000 | 1,218,307 | ||||||
WFRBS Commercial Mortgage Trust, Series 2012-C10, Class AS, (USD), 3.24%, 12/15/2045 | 1,496,000 | 1,464,710 | ||||||
WFRBS Commercial Mortgage Trust 2012-C9, Series 2012-C9, Class AS (USD), 3.39%, 11/15/2045 | 1,391,000 | 1,379,734 | ||||||
| 25,785,775 | ||||||||
Total Commercial Mortgage-Backed Securities |
| 25,785,775 | ||||||
NON-AGENCY MORTGAGE-BACKED SECURITIES (8.8%) |
| |||||||
UNITED STATES (8.8%) |
| |||||||
Agate Bay Mortgage Trust |
| |||||||
Series 2014-3, Class B2, (USD), 3.82%, 11/25/2044 (a)(b) | 729,157 | 721,993 | ||||||
Series 2016-3, Class A5 (USD), 3.50%, 08/25/2046 (a)(b) | 833,884 | 829,129 | ||||||
CHL Mortgage Pass-Through Trust, Series 2005-21, Class A2 (USD), 5.50%, 10/25/2035 | 438,427 | 418,312 | ||||||
Citigroup Mortgage Loan Trust |
| |||||||
Series 2005-11, Class A3 (USD), 1 year CMT + 2.400%, 3.71%, 11/25/2035 (a) | 510,695 | 511,395 | ||||||
Series 2015-PS1, Class A1 (USD), 3.75%, 09/25/2042 (a)(b) | 585,089 | 586,656 | ||||||
Credit Suisse Mortgage Capital Trust, Series 2013-7, Class A11 (USD), 3.50%, 08/25/2043 (a)(b) | 945,961 | 930,885 | ||||||
CSMC Trust, Series 2014-WIN2, Class B1, (USD), 3.99%, 10/25/2044 (a)(b) | 1,386,108 | 1,396,513 | ||||||
Flagstar Mortgage Trust, Series 2017-2, Class B2, (USD), 4.14%, 10/25/2047 (a)(b) | 1,052,616 | 1,025,858 | ||||||
GSR Mortgage Loan Trust, Series 2005-6F, Class 1A6 (USD), 5.25%, 07/25/2035 | 526,960 | 551,582 | ||||||
IndyMac INDA Mortgage Loan Trust, Series 2005-AR2, Class 3A1 (USD), 3.58%, 01/25/2036 (a) | 568,735 | 526,427 | ||||||
JP Morgan Mortgage Trust |
| |||||||
Series 16-1, Class A13 (USD), 3.50%, 05/25/2046 (a)(b) | 700,010 | 680,979 | ||||||
Series 2005-A4, Class 3A1 (USD), 3.41%, 07/25/2035 (a) | 350,171 | 356,373 | ||||||
Series 2005-A5, Class 2A2 (USD), 3.69%, 08/25/2035 (a) | 707,781 | 730,212 | ||||||
Series 2006-S1, Class 2A6 (USD), 6.00%, 04/25/2036 | 667,595 | 708,469 | ||||||
Series 2013-1, Class B1 (USD), 3.49%, 03/25/2043 (a)(b) | 913,511 | 910,882 | ||||||
Series 2014-IVR3, Class 3A1 (USD), 2.77%, 09/25/2044 (a)(b) | 534,942 | 522,540 | ||||||
Series 2014-IVR6, Class AM (USD), 2.74%, 07/25/2044 (a)(b) | 445,084 | 441,741 | ||||||
Series 2016-5, Class A1 (USD), 2.60%, 12/25/2046 (a)(b) | 698,537 | 689,549 | ||||||
Series 2017-1, Class A3, (USD), 3.50%, 01/25/2047 (a)(b) | 52 | 52 | ||||||
Series 2017-2, Class A5, (USD), 3.50%, 05/25/2047 (a)(b) | 1,074,958 | 1,064,125 | ||||||
New Residential Mortgage Loan Trust |
| |||||||
Series 2014-2A, Class A3 (USD), 3.75%, 05/25/2054 (a)(b) | 662,092 | 664,184 | ||||||
Series 2017-1A, Class A1, (USD), 4.00%, 02/25/2057 (a)(b) | 1,281,103 | 1,295,428 | ||||||
Series 2017-2A, Class A3, (USD), 4.00%, 03/25/2057 (a)(b) | 920,987 | 931,304 | ||||||
PHH Mortgage Trust, Series 2008-CIM1, Class 21A1 (USD), 6.00%, 05/25/2038 | 898,390 | 918,810 | ||||||
Sequoia Mortgage Trust |
| |||||||
Series 2013-11, Class B3, (USD), 3.66%, 09/25/2043 (a)(b) | 656,707 | 644,170 | ||||||
Series 2017-1, Class A4 (USD), 3.50%, 02/25/2047 (a)(b) | 1,040,962 | 1,036,739 | ||||||
Series 2017-1, Class B2, (USD), 3.64%, 02/25/2047 (a)(b) | 679,925 | 657,643 | ||||||
Series 2017-CH1, Class A13, (USD), 4.00%, 08/25/2047 (a)(b) | 595,833 | 594,717 | ||||||
Series 2017-CH2, Class A13 (USD), 4.00%, 12/25/2047 (a)(b) | 902,867 | 901,098 | ||||||
Shellpoint Co-Originator Trust, Series 2016-1, Class 1A10 (USD), 3.50%, 11/25/2046 (a)(b) | 433,224 | 429,237 | ||||||
Structured Asset Securities Corp., Series 2004-18H, Class A5 (USD), 4.75%, 10/25/2034 | 937,372 | 960,128 | ||||||
Thornburg Mortgage Securities Trust |
| |||||||
Series 2007-4, Class 2A1 (USD), 3.34%, 09/25/2037 (a) | 528,290 | 526,992 | ||||||
Series 2007-4, Class 3A1 (USD), 3.44%, 09/25/2037 (a) | 80,305 | 80,953 | ||||||
WaMu Mortgage Pass Through Certificates, Series 2005-AR7, Class A3 (USD), 3.28%, 08/25/2035 (a) | 687,286 | 692,160 | ||||||
Wells Fargo Mortgage Backed Securities Trust, Series 2006-10, Class A4 (USD), 6.00%, 08/25/2036 | 523,518 | 523,724 | ||||||
WinWater Mortgage Loan Trust, Series 2015-2, Class B3, (USD), 3.91%, 02/20/2045 (a)(b) | 626,254 | 612,607 | ||||||
| 25,073,566 | ||||||||
Total Non-Agency Mortgage-Backed Securities |
| 25,073,566 | ||||||
See accompanying Notes to Financial Statements.
| 2018 Semi-Annual Report | 21 |
Statement of Investments (continued)
April 30, 2018 (Unaudited)
Aberdeen Total Return Bond Fund
| Shares or Principal Amount | Value (US$) | |||||||
CORPORATE BONDS (34.2%) |
| |||||||
CANADA (1.9%) |
| |||||||
Commercial Banks (1.9%) |
| |||||||
Canadian Imperial Bank of Commerce (USD), 2.10%, 10/05/2020 | $ | 2,089,000 | $ | 2,038,492 | ||||
Royal Bank of Canada (USD), 2.15%, 10/26/2020 | 1,070,000 | 1,045,816 | ||||||
Toronto-Dominion Bank (The) (USD), 1.90%, 10/24/2019 | 2,220,000 | 2,189,317 | ||||||
| 5,273,625 | ||||||||
FRANCE (0.2%) |
| |||||||
Electric Utilities (0.2%) |
| |||||||
Electricite de France SA (USD), 6.50%, 01/26/2019 (b) | 542,000 | 556,702 | ||||||
NETHERLANDS (0.9%) |
| |||||||
Electric Utilities (0.6%) |
| |||||||
Enel Finance International NV (USD), 3.63%, 05/25/2027 (b) | 1,800,000 | 1,699,916 | ||||||
Food Products (0.3%) |
| |||||||
Sigma Finance Netherlands BV (USD), 4.88%, 03/27/2028 (b) | 924,000 | 903,681 | ||||||
| 2,603,597 | ||||||||
SPAIN (0.8%) |
| |||||||
Commercial Banks (0.8%) |
| |||||||
Banco Santander SA |
| |||||||
(USD), 3.50%, 04/11/2022 | 1,200,000 | 1,185,284 | ||||||
(USD), 4.38%, 04/12/2028 | 1,000,000 | 990,338 | ||||||
| 2,175,622 | ||||||||
SUPRANATIONAL (1.4%) |
| |||||||
Supranational (1.4%) |
| |||||||
International Finance Corp. (AUD), 2.80%, 08/15/2022 | 5,444,000 | 4,115,073 | ||||||
SWEDEN (1.2%) |
| |||||||
Commercial Banks (1.2%) |
| |||||||
Skandinaviska Enskilda Banken AB (USD), 2.63%, 03/15/2021 | 1,938,000 | 1,903,932 | ||||||
Svenska Handelsbanken AB (USD), 2.45%, 03/30/2021 | 1,477,000 | 1,443,496 | ||||||
| 3,347,428 | ||||||||
UNITED KINGDOM (1.7%) |
| |||||||
Commercial Banks (1.7%) |
| |||||||
Santander UK Group Holdings PLC (USD), 3.57%, 01/10/2023 | 1,960,000 | 1,920,249 | ||||||
Standard Chartered PLC (USD), 2.40%, 09/08/2019 (b) | 2,977,000 | 2,945,909 | ||||||
| 4,866,158 | ||||||||
UNITED STATES (26.1%) |
| |||||||
Aerospace & Defense (0.2%) |
| |||||||
Rockwell Collins, Inc. (USD), 1.95%, 07/15/2019 | 489,000 | 482,686 | ||||||
Auto Manufacturers (1.3%) |
| |||||||
Ford Holdings LLC (USD), 9.30%, 03/01/2030 | 1,735,000 | 2,324,925 | ||||||
General Motors Co. (USD), 5.00%, 04/01/2035 | 1,350,000 | 1,310,871 | ||||||
| 3,635,796 | ||||||||
Beverages (1.7%) |
| |||||||
Anheuser-Busch InBev Worldwide, Inc. (USD), 8.20%, 01/15/2039 | 1,200,000 | 1,751,264 | ||||||
Diageo Investment Corp. (USD), 7.45%, 04/15/2035 | 1,376,000 | 1,955,772 | ||||||
Molson Coors Brewing Co. (USD), 1.90%, 03/15/2019 | 1,019,000 | 1,011,457 | ||||||
| 4,718,493 | ||||||||
Building Materials (0.3%) |
| |||||||
Vulcan Materials Co. (USD), 4.70%, 03/01/2048 (b) | 980,000 | 944,874 | ||||||
Commercial Banks (6.9%) |
| |||||||
Bank of America Corp. |
| |||||||
(USD), 3M USD LIBOR + 1.575%, 3.82%, 01/20/2028 (a) | 1,276,000 | 1,243,765 | ||||||
(USD), 3M USD LIBOR + 1.370%, 3.59%, 07/21/2028 (a) | 1,721,000 | 1,639,511 | ||||||
Citibank NA (USD), 1.85%, 09/18/2019 | 2,980,000 | 2,944,963 | ||||||
Citigroup, Inc. (USD), 8.13%, 07/15/2039 | 3,030,000 | 4,388,429 | ||||||
Citizens Bank NA/Providence (USD), 2.25%, 10/30/2020 | 1,748,000 | 1,705,287 | ||||||
Citizens Financial Group, Inc. (USD), 3M USD LIBOR + 3.558%, 5.16%, 06/29/2023 (a) | 1,540,000 | 1,546,936 | ||||||
Goldman Sachs Group, Inc. (The) (USD), 4.25%, 10/21/2025 | 1,060,000 | 1,049,599 | ||||||
JPMorgan Chase & Co. |
| |||||||
(USD), 4.35%, 08/15/2021 | 1,810,000 | 1,870,574 | ||||||
(USD), 4.01%, 04/23/2029 (a) | 2,060,000 | 2,021,667 | ||||||
Morgan Stanley (USD), 3M USD LIBOR + 1.340%, 3.59%, 07/22/2028 (a) | 1,350,000 | 1,283,454 | ||||||
| 19,694,185 | ||||||||
Computers & Peripherals (0.8%) |
| |||||||
Apple, Inc. (USD), 3.75%, 11/13/2047 | 2,291,000 | 2,137,769 | ||||||
Diversified Financial Services (1.4%) |
| |||||||
American Express Co. |
| |||||||
(USD), 2.20%, 10/30/2020 | 1,204,000 | 1,177,650 | ||||||
(USD), 3.40%, 02/27/2023 | 1,706,000 | 1,692,582 | ||||||
KKR Group Finance Co. III LLC (USD), 5.13%, 06/01/2044 (b) | 1,101,000 | 1,105,588 | ||||||
| 3,975,820 | ||||||||
Diversified Telecommunication Services (0.4%) |
| |||||||
AT&T, Inc. (USD), 3.40%, 05/15/2025 | 1,199,000 | 1,141,848 | ||||||
Electric Utilities (3.0%) |
| |||||||
Dominion Energy, Inc. |
| |||||||
Series A (USD), 1.88%, 01/15/2019 | 1,000,000 | 993,677 | ||||||
Series B (USD), 1.60%, 08/15/2019 | 893,000 | 876,958 | ||||||
Duke Energy Corp. (USD), 2.10%, 06/15/2018 | 422,000 | 421,764 | ||||||
See accompanying Notes to Financial Statements.
| 22 | Semi-Annual Report 2018 |
Statement of Investments (continued)
April 30, 2018 (Unaudited)
Aberdeen Total Return Bond Fund
| Shares or Principal Amount | Value (US$) | |||||||
Edison International (USD), 2.13%, 04/15/2020 | $ | 188,000 | $ | 184,317 | ||||
Entergy Gulf States Louisiana LLC (USD), 6.00%, 05/01/2018 | 730,000 | 730,000 | ||||||
Kansas City Power & Light Co. (USD), 4.20%, 03/15/2048 | 480,000 | 476,271 | ||||||
Nevada Power Co., Series N (USD), 6.65%, 04/01/2036 | 600,000 | 788,093 | ||||||
Progress Energy, Inc. (USD), 7.05%, 03/15/2019 | 1,427,000 | 1,478,469 | ||||||
PSEG Power LLC (USD), 5.13%, 04/15/2020 | 480,000 | 496,671 | ||||||
Sempra Energy |
| |||||||
(USD), 9.80%, 02/15/2019 | 723,000 | 759,803 | ||||||
(USD), 2.40%, 02/01/2020 | 1,320,000 | 1,303,436 | ||||||
| 8,509,459 | ||||||||
Energy Equipment & Services (0.3%) |
| |||||||
MPLX LP (USD), 4.70%, 04/15/2048 | 870,000 | 823,377 | ||||||
Food Products (0.2%) |
| |||||||
General Mills, Inc. (USD), 5.65%, 02/15/2019 | 686,000 | 701,070 | ||||||
Healthcare Products (0.2%) |
| |||||||
Stryker Corp. (USD), 2.00%, 03/08/2019 | 626,000 | 622,653 | ||||||
Healthcare Providers & Services (1.1%) |
| |||||||
Quest Diagnostics, Inc. |
| |||||||
(USD), 2.70%, 04/01/2019 | 1,554,000 | 1,553,953 | ||||||
(USD), 3.45%, 06/01/2026 | 1,680,000 | 1,610,564 | ||||||
| 3,164,517 | ||||||||
Insurance (1.1%) |
| |||||||
American International Group, Inc. (USD), 6.25%, 05/01/2036 | 930,000 | 1,087,340 | ||||||
Brighthouse Financial, Inc., Series WI (USD), 3.70%, 06/22/2027 | 1,515,000 | 1,371,742 | ||||||
Lincoln National Corp. (USD), 3.80%, 03/01/2028 | 841,000 | 817,762 | ||||||
| 3,276,844 | ||||||||
Internet (1.7%) |
| |||||||
Amazon.com, Inc. (USD), 4.05%, 08/22/2047 (b) | 1,170,000 | 1,157,318 | ||||||
eBay, Inc. (USD), 2.75%, 01/30/2023 | 2,590,000 | 2,488,857 | ||||||
Symantec Corp. (USD), 5.00%, 04/15/2025 (b) | 1,202,000 | 1,207,509 | ||||||
| 4,853,684 | ||||||||
Media (0.8%) |
| |||||||
Charter Communications Operating LLC / Charter Communications Operating Capital (USD), 5.75%, 04/01/2048 | 812,000 | 805,328 | ||||||
Comcast Corp. (USD), 4.00%, 11/01/2049 | 1,275,000 | 1,172,390 | ||||||
NBCUniversal Enterprise, Inc. (USD), 1.97%, 04/15/2019 (b) | 324,000 | 321,673 | ||||||
| 2,299,391 | ||||||||
Metals & Mining (0.4%) |
| |||||||
Glencore Funding LLC (USD), 4.13%, 05/30/2023 (b) | 1,070,000 | 1,066,041 | ||||||
Oil & Gas Services (0.3%) |
| |||||||
Baker Hughes a GE Co. LLC / Baker Hughes Co-Obligor, Inc. (USD), 4.08%, 12/15/2047 | 935,000 | 858,007 | ||||||
Oil, Gas & Consumable Fuels (0.4%) |
| |||||||
HollyFrontier Corp. (USD), 5.88%, 04/01/2026 | 1,176,000 | 1,257,787 | ||||||
Packaging & Containers (0.1%) |
| |||||||
Bemis Co., Inc. (USD), 6.80%, 08/01/2019 | 274,000 | 285,967 | ||||||
Pharmaceutical (1.7%) |
| |||||||
CVS Health Corp. |
| |||||||
(USD), 4.10%, 03/25/2025 | 858,000 | 854,912 | ||||||
(USD), 2.88%, 06/01/2026 | 2,600,000 | 2,373,310 | ||||||
Shire Acquisitions Investments Ireland DAC (USD), 1.90%, 09/23/2019 | 1,593,000 | 1,564,869 | ||||||
| 4,793,091 | ||||||||
Retail (0.4%) |
| |||||||
McDonald’s Corp. (USD), 3.25%, 06/10/2024 | 1,201,000 | 1,178,312 | ||||||
Semiconductors (0.3%) |
| |||||||
Broadcom Corp. / Broadcom Cayman Finance Ltd. (USD), 3.00%, 01/15/2022 | 906,000 | 883,298 | ||||||
Software (0.9%) |
| |||||||
Activision Blizzard, Inc. (USD), 6.13%, 09/15/2023 (b) | 1,364,000 | 1,419,992 | ||||||
Electronic Arts, Inc. (USD), 3.70%, 03/01/2021 | 1,265,000 | 1,278,447 | ||||||
| 2,698,439 | ||||||||
Transportation (0.2%) |
| |||||||
FedEx Corp. (USD), 8.00%, 01/15/2019 | 450,000 | 466,330 | ||||||
| 74,469,738 | ||||||||
Total Corporate Bonds |
| 97,407,943 | ||||||
MUNICIPAL BONDS (3.8%) |
| |||||||
UNITED STATES (3.8%) |
| |||||||
CALIFORNIA (1.8%) |
| |||||||
Los Angeles Unified School District General Obligation Unlimited Bonds (USD), 6.76%, 07/01/2034 | 1,620,000 | 2,133,021 | ||||||
Regents of the University of California Medical Center Pooled Revenue | ||||||||
Series H (USD), 6.55%, 05/15/2048 | 1,800,000 | 2,423,610 | ||||||
Series F (USD), 6.58%, 05/15/2049 | 440,000 | 591,378 | ||||||
| 5,148,009 | ||||||||
CONNECTICUT (1.2%) |
| |||||||
State of Connecticut General Obligation Unlimited Bonds, Series A (USD), 5.85%, 03/15/2032 | 2,880,000 | 3,346,877 | ||||||
See accompanying Notes to Financial Statements.
| 2018 Semi-Annual Report | 23 |
Statement of Investments (continued)
April 30, 2018 (Unaudited)
Aberdeen Total Return Bond Fund
| Shares or Principal Amount | Value (US$) | |||||||
PENNSYLVANIA (0.8%) |
| |||||||
Pennsylvania State General Obligation Unlimited Bonds (Build America Bonds) | ||||||||
Series B (USD), 4.65%, 02/15/2026 | $ | 1,050,000 | $ | 1,103,140 | ||||
(USD), 5.35%, 05/01/2030 | 1,300,000 | 1,352,494 | ||||||
| 2,455,634 | ||||||||
| 10,950,520 | ||||||||
Total Municipal Bonds |
| 10,950,520 | ||||||
GOVERNMENT BONDS (7.7%) |
| |||||||
MALAYSIA (1.5%) |
| |||||||
Malaysia Government Bond |
| |||||||
(MYR), 3.90%, 11/16/2027 | 5,570,000 | 1,390,704 | ||||||
Series 0317 (MYR), 4.76%, 04/07/2037 | 5,810,000 | 1,476,556 | ||||||
Malaysia Government Investment Issue (MYR), 3.95%, 04/14/2022 | 5,847,000 | 1,494,924 | ||||||
| 4,362,184 | ||||||||
NORWAY (3.0%) |
| |||||||
Norway Government Bond |
| |||||||
(NOK), 1.75%, 02/17/2027 (b) | 47,253,000 | 5,839,315 | ||||||
(NOK), 2.00%, 04/26/2028 (b) | 21,505,000 | 2,692,608 | ||||||
| 8,531,923 | ||||||||
SOUTH AFRICA (1.1%) |
| |||||||
South Africa Government Bond |
| |||||||
Series R186 (ZAR), 10.50%, 12/21/2026 | 16,730,000 | 1,531,000 | ||||||
Series 2037 (ZAR), 8.50%, 01/31/2037 | 19,720,000 | 1,518,565 | ||||||
| 3,049,565 | ||||||||
SUPRANATIONAL (1.0%) |
| |||||||
International Bank for Reconstruction & Development (NZD), 3.38%, 01/25/2022 | 4,031,000 | 2,885,131 | ||||||
THAILAND (1.1%) |
| |||||||
Thailand Government Bond |
| |||||||
(THB), 3.65%, 06/20/2031 | 44,450,000 | 1,520,370 | ||||||
(THB), 3.40%, 06/17/2036 | 45,880,000 | 1,505,747 | ||||||
| 3,026,117 | ||||||||
Total Government Bonds |
| 21,854,920 | ||||||
U.S. AGENCIES (7.2%) |
| |||||||
UNITED STATES (7.2%) |
| |||||||
Federal Home Loan Mortgage Corp. |
| |||||||
Series 2016-HQA4, Class M2 (USD), 1M USD LIBOR + 1.300%, 3.20%, 04/25/2029 (a) | 1,635,000 | 1,659,952 | ||||||
Series 2017-DNA3, Class M1, (USD), 2.65%, 03/25/2030 (a) | 1,012,411 | 1,015,138 | ||||||
MBS (USD), 3.00%, 10/01/2046 | 2,099,240 | 2,027,933 | ||||||
Federal National Mortgage Association |
| |||||||
Series 2017-C06, Class 2M1, 1M USD LIBOR + 0.750%, (USD), 2.65%, 02/25/2030 (a) | 1,288,101 | 1,289,490 | ||||||
MBS (USD), 2.50%, 10/01/2032 | 1,969,192 | 1,917,094 | ||||||
MBS (USD), 4.00%, 11/01/2044 | 2,801,323 | 2,886,243 | ||||||
MBS (USD), 3.00%, 08/01/2046 | 2,107,777 | 2,039,307 | ||||||
MBS (USD), 3.50%, 02/01/2048 | 2,172,935 | 2,174,999 | ||||||
Government National Mortgage Association, MBS (USD), 3.00%, 09/20/2046 | 3,010,468 | 2,944,654 | ||||||
Structured Agency Credit Risk |
| |||||||
Series 2015-DNA1, Class M2, (USD), 1M USD LIBOR + 1.850%, 3.75%, 10/25/2027 (a) | 1,160,000 | 1,183,688 | ||||||
Series 2016-DNA3, Class M2, (USD), 1M USD LIBOR + 2.000%, 3.90%, 12/25/2028 (a) | 1,342,000 | 1,364,941 | ||||||
| 20,503,439 | ||||||||
Total U.S. Agencies |
| 20,503,439 | ||||||
U.S. TREASURIES (8.6%) |
| |||||||
UNITED STATES (8.6%) |
| |||||||
Treasury Inflation Protected Security |
| |||||||
(USD), 0.38%, 07/15/2027 (c) | 1,470,097 | 1,425,529 | ||||||
(USD), 0.88%, 02/15/2047 (c) | 2,925,600 | 2,900,807 | ||||||
U.S. Treasury Bond |
| |||||||
(USD), 4.50%, 05/15/2038 | 2,690,000 | 3,295,250 | ||||||
(USD), 2.75%, 08/15/2047 | 598,600 | 558,662 | ||||||
(USD), 2.75%, 11/15/2047 | 1,583,500 | 1,477,480 | ||||||
U.S. Treasury Note |
| |||||||
(USD), 2.25%, 02/15/2021 | 989,800 | 980,366 | ||||||
(USD), 2.63%, 02/28/2023 | 857,900 | 851,834 | ||||||
(USD), 2.50%, 03/31/2023 | 1,767,300 | 1,743,897 | ||||||
(USD), 2.00%, 06/30/2024 | 1,320,000 | 1,255,135 | ||||||
(USD), 2.75%, 02/28/2025 | 3,902,800 | 3,867,888 | ||||||
(USD), 2.25%, 08/15/2027 | 5,436,400 | 5,134,213 | ||||||
(USD), 2.25%, 11/15/2027 | 929,900 | 876,794 | ||||||
| 24,367,855 | ||||||||
Total U.S. Treasuries |
| 24,367,855 | ||||||
AGENCY MORTGAGE-BACKED SECURITIES (10.7%) |
| |||||||
UNITED STATES (10.7%) |
| |||||||
Federal Home Loan Mortgage Corp. |
| |||||||
(USD), 2.50%, 11/01/2031 | 1,513,238 | 1,471,824 | ||||||
(USD), 3.00%, 02/01/2032 | 1,640,364 | 1,628,649 | ||||||
(USD), 5.00%, 10/01/2041 | 598,249 | 640,943 | ||||||
(USD), 4.00%, 03/01/2042 | 1,116,920 | 1,148,036 | ||||||
(USD), 4.50%, 07/01/2042 | 2,421,555 | 2,548,533 | ||||||
(USD), 3.50%, 03/01/2046 | 927,617 | 924,710 | ||||||
(USD), 3.50%, 05/01/2046 | 1,320,223 | 1,315,269 | ||||||
(USD), 4.00%, 06/01/2046 | 1,126,134 | 1,152,176 | ||||||
(USD), 3.00%, 12/01/2046 | 1,359,062 | 1,312,529 | ||||||
(USD), 4.00%, 03/01/2047 | 930,507 | 952,193 | ||||||
(USD), 4.50%, 04/01/2047 | 1,094,799 | 1,140,633 | ||||||
Federal National Mortgage Association |
| |||||||
(USD), 3.00%, 01/01/2030 | 1,714,884 | 1,703,535 | ||||||
(USD), 4.00%, 06/01/2043 | 835,903 | 857,375 | ||||||
(USD), 4.00%, 11/01/2043 | 830,034 | 849,106 | ||||||
(USD), 3.50%, 06/01/2045 | 878,360 | 875,747 | ||||||
(USD), 3.50%, 06/01/2046 | 2,687,468 | 2,674,545 | ||||||
(USD), 4.00%, 07/01/2046 | 1,067,848 | 1,088,574 | ||||||
(USD), 4.50%, 09/01/2046 | 859,971 | 904,612 | ||||||
(USD), 3.00%, 11/01/2046 | 1,216,820 | 1,175,652 | ||||||
(USD), 4.50%, 01/01/2047 | 950,902 | 991,731 | ||||||
(USD), 4.00%, 02/01/2047 | 1,244,278 | 1,268,655 | ||||||
See accompanying Notes to Financial Statements.
| 24 | Semi-Annual Report 2018 |
Statement of Investments (continued)
April 30, 2018 (Unaudited)
Aberdeen Total Return Bond Fund
| (d) | Registered investment company advised by State Street Global Advisors. The rate shown is the 7 day yield as of April 30, 2018. |
| (e) | See accompanying Notes to Financial Statements for tax unrealized appreciation/(depreciation) of securities. |
| AUD | Australian Dollar |
| CLP | Chilean Peso |
| COP | Colombian Peso |
| CZK | Czech Koruna |
| EUR | Euro Currency |
| HKD | Hong Kong Dollar |
| IDR | Indonesian Rupiah |
| INR | Indian Rupee |
| JPY | Japanese Yen |
| KRW | South Korean Won |
| MXN | Mexican Peso |
| MYR | Malaysian Ringgit |
| NOK | Norwegian Krone |
| NZD | New Zealand Dollar |
| PLC | Public Limited Company |
| PLN | Polish Zloty |
| RUB | New Russian Ruble |
| SEK | Swedish Krona |
| THB | Thai Baht |
| USD | U.S. Dollar |
| ZAR | South African Rand |
| Shares or Principal Amount | Value (US$) | |||||||
(USD), 3.00%, 03/01/2047 | $ | 2,703,900 | $ | 2,619,904 | ||||
(USD), 12M USD LIBOR + 1.602%, 2.89%, 06/01/2047 (a) | 1,152,951 | 1,147,131 | ||||||
| 30,392,062 | ||||||||
Total Agency Mortgage-Backed Securities |
| 30,392,062 | ||||||
SHORT-TERM INVESTMENT (0.3%) | ||||||||
UNITED STATES (0.3%) | ||||||||
State Street Institutional U.S. Government Money Market Fund, Institutional Class, 1.28% (d) | 944,823 | 944,823 | ||||||
Total Short-Term Investment | 944,823 | |||||||
Total Investments |
| 282,318,972 | ||||||
Other Assets in Excess of Liabilities—0.9% |
| 2,636,131 | ||||||
Net Assets—100.0% |
| $ | 284,955,103 | |||||
| (a) | Variable or Floating Rate Security. Rate disclosed is as of April 30, 2018. |
| (b) | Denotes a security issued under Regulation S or Rule 144A. |
| (c) | Inflation linked security. |
At April 30, 2018, the Fund held the following futures contracts:
| Futures Contracts | Number of Contracts Long/(Short) | Expiration Date | Notional Amount | Market Value | Unrealized Appreciation/ (Depreciation) | |||||||||||||||||||
LONG CONTRACT POSITIONS | ||||||||||||||||||||||||
90 Day Eurodollar Time Deposit | UBS | 119 | 06/18/2018 | $ | 29,288,838 | $ | 29,044,925 | $ | (243,913 | ) | ||||||||||||||
Australian 3 Year Bond | UBS | 100 | 06/15/2018 | 8,369,721 | 8,350,021 | (19,700 | ) | |||||||||||||||||
United States Treasury Note 6%-10 year | UBS | 264 | 06/20/2018 | 31,671,562 | 31,581,000 | (90,562 | ) | |||||||||||||||||
United States Treasury Note 6%-5 year | UBS | 103 | 06/29/2018 | 11,740,742 | 11,691,305 | (49,437 | ) | |||||||||||||||||
United States Treasury Note 6%-Ultra Long | UBS | 39 | 06/20/2018 | 6,117,344 | 6,127,875 | 10,531 | ||||||||||||||||||
| $ | (393,081 | ) | ||||||||||||||||||||||
SHORT CONTRACT POSITIONS | ||||||||||||||||||||||||
United States Treasury Note 6%-10 year | UBS | (162 | ) | 06/20/2018 | $ | (20,811,218 | ) | $ | (20,718,281 | ) | $ | 92,937 | ||||||||||||
United States Treasury Note 6%-Long Bond | UBS | (4 | ) | 06/20/2018 | (575,250 | ) | (575,375 | ) | (125 | ) | ||||||||||||||
| $ | 92,812 | |||||||||||||||||||||||
| $ | (300,269 | ) | ||||||||||||||||||||||
See accompanying Notes to Financial Statements.
| 2018 Semi-Annual Report | 25 |
Statement of Investments (continued)
April 30, 2018 (Unaudited)
Aberdeen Total Return Bond Fund
At April 30, 2018, the Fund’s open forward foreign currency exchange contracts were as follows:
| Purchase Contracts Settlement Date* | Counterparty | Amount | Amount Sold | Fair Value | Unrealized Appreciation/ (Depreciation) | |||||||||||||||||||||||
| Chilean Peso/United States Dollar | ||||||||||||||||||||||||||||
05/10/2018 | Goldman Sachs & Co. | CLP | 1,746,231,000 | USD | 2,908,204 | $ | 2,846,946 | $ | (61,258 | ) | ||||||||||||||||||
| Colombian Peso/United States Dollar | ||||||||||||||||||||||||||||
05/07/2018 | Citibank N.A. | COP | 4,293,810,000 | USD | 1,476,804 | 1,528,574 | 51,770 | |||||||||||||||||||||
05/07/2018 | Goldman Sachs & Co. | COP | 4,293,810,000 | USD | 1,477,389 | 1,528,574 | 51,185 | |||||||||||||||||||||
07/03/2018 | HSBC Bank USA | COP | 8,205,350,000 | USD | 2,937,827 | 2,918,210 | (19,617 | ) | ||||||||||||||||||||
| Crech Koruna/United States Dollar | ||||||||||||||||||||||||||||
05/29/2018 | UBS AG | CZK | 60,407,000 | USD | 2,900,014 | 2,853,842 | (46,172 | ) | ||||||||||||||||||||
| Euro/United States Dollar | ||||||||||||||||||||||||||||
05/29/2018 | JPMorgan Chase Bank N.A. | EUR | 2,433,000 | USD | 3,037,235 | 2,943,536 | (93,699 | ) | ||||||||||||||||||||
05/29/2018 | Royal Bank of Canada | EUR | 1,200,000 | USD | 1,487,592 | 1,451,806 | (35,786 | ) | ||||||||||||||||||||
| Hong Kong Dollar/United States Dollar | ||||||||||||||||||||||||||||
06/01/2018 | HSBC Bank USA | HKD | 46,708,000 | USD | 5,981,124 | 5,955,662 | (25,462 | ) | ||||||||||||||||||||
| Indian Rupee/United States Dollar | ||||||||||||||||||||||||||||
05/21/2018 | Barclays Bank plc | INR | 191,869,000 | USD | 2,929,745 | 2,880,189 | (49,556 | ) | ||||||||||||||||||||
| Indonesian Rupiah/United States Dollar | ||||||||||||||||||||||||||||
07/24/2018 | JPMorgan Chase Bank N.A. | IDR | 35,971,119,727 | USD | 2,564,420 | 2,560,154 | (4,266 | ) | ||||||||||||||||||||
| Japanese Yen/United States Dollar | ||||||||||||||||||||||||||||
05/01/2018 | Goldman Sachs & Co. | JPY | 300,000,000 | USD | 2,836,386 | 2,744,237 | (92,149 | ) | ||||||||||||||||||||
05/01/2018 | HSBC Bank USA | JPY | 642,410,000 | USD | 6,010,737 | 5,876,418 | (134,319 | ) | ||||||||||||||||||||
05/01/2018 | JPMorgan Chase Bank N.A. | JPY | 331,160,000 | USD | 3,063,752 | 3,029,272 | (34,480 | ) | ||||||||||||||||||||
05/01/2018 | Royal Bank of Canada | JPY | 637,950,000 | USD | 5,993,235 | 5,835,620 | (157,615 | ) | ||||||||||||||||||||
05/01/2018 | Westpac Banking Corp. | JPY | 320,020,000 | USD | 2,990,514 | 2,927,369 | (63,145 | ) | ||||||||||||||||||||
07/26/2018 | Goldman Sachs & Co. | JPY | 153,987,421 | USD | 1,420,131 | 1,416,945 | (3,186 | ) | ||||||||||||||||||||
07/26/2018 | Westpac Banking Corp. | JPY | 154,672,579 | USD | 1,423,929 | 1,423,250 | (679 | ) | ||||||||||||||||||||
| MXN/United States Dollar | ||||||||||||||||||||||||||||
05/25/2018 | HSBC Bank USA | MXN | 27,000,000 | USD | 1,437,336 | 1,438,730 | 1,394 | |||||||||||||||||||||
| New Zealand Dollar/United States Dollar | ||||||||||||||||||||||||||||
05/01/2018 | HSBC Bank USA | NZD | 4,193,622 | USD | 2,999,178 | 2,950,633 | (48,545 | ) | ||||||||||||||||||||
05/01/2018 | Royal Bank of Canada | NZD | 8,179,921 | USD | 5,869,355 | 5,755,393 | (113,962 | ) | ||||||||||||||||||||
| NOK/United States Dollar | ||||||||||||||||||||||||||||
05/14/2018 | Barclays Bank plc | NOK | 26,610,694 | USD | 3,455,998 | 3,318,293 | (137,705 | ) | ||||||||||||||||||||
05/14/2018 | HSBC Bank USA | NOK | 10,096,000 | USD | 1,310,968 | 1,258,948 | (52,020 | ) | ||||||||||||||||||||
05/14/2018 | JPMorgan Chase Bank N.A. | NOK | 24,215,324 | USD | 3,054,773 | 3,019,595 | (35,178 | ) | ||||||||||||||||||||
05/14/2018 | Royal Bank of Canada | NOK | 67,759,324 | USD | 8,740,018 | 8,449,432 | (290,586 | ) | ||||||||||||||||||||
| South African Rand/United States Dollar | ||||||||||||||||||||||||||||
06/25/2018 | Barclays Bank plc | ZAR | 38,934,301 | USD | 3,295,785 | 3,101,756 | (194,029 | ) | ||||||||||||||||||||
06/25/2018 | UBS AG | ZAR | 39,324,000 | USD | 3,140,795 | 3,132,802 | (7,993 | ) | ||||||||||||||||||||
| South Korean Won/United States Dollar | ||||||||||||||||||||||||||||
05/02/2018 | Citibank N.A. | KRW | 3,119,530,000 | USD | 2,964,488 | 2,920,772 | (43,716 | ) | ||||||||||||||||||||
| Swedish Krona/United States Dollar | ||||||||||||||||||||||||||||
| 07/10/2018 | Royal Bank of Canada | SEK | 24,215,000 | USD | 2,932,412 | 2,780,174 | (152,238 | ) | ||||||||||||||||||||
| $ | 88,847,132 | $ | (1,793,012 | ) | ||||||||||||||||||||||||
See accompanying Notes to Financial Statements.
| 26 | Semi-Annual Report 2018 |
Statement of Investments (concluded)
April 30, 2018 (Unaudited)
Aberdeen Total Return Bond Fund
| Sale Contracts Settlement Date* | Counterparty | Amount | Amount Sold | Fair Value | Unrealized Appreciation/ (Depreciation) | |||||||||||||||||||||||
| United States Dollar/Australian Dollar | ||||||||||||||||||||||||||||
06/25/2018 | Royal Bank of Canada | USD | 4,138,105 | AUD | 5,349,125 | $ | 4,027,744 | $ | 110,361 | |||||||||||||||||||
| United States Dollar/Chilean Peso | ||||||||||||||||||||||||||||
05/10/2018 | Citibank N.A. | USD | 2,928,444 | CLP | 1,746,231,000 | 2,846,946 | 81,498 | |||||||||||||||||||||
| United States Dollar/Colombian Peso | ||||||||||||||||||||||||||||
05/07/2018 | Citibank N.A. | USD | 2,974,583 | COP | 8,587,620,000 | 3,057,149 | (82,566 | ) | ||||||||||||||||||||
07/03/2018 | HSBC Bank USA | USD | 2,939,932 | COP | 8,205,350,000 | 2,918,210 | 21,722 | |||||||||||||||||||||
| United States Dollar/Crech Koruna | ||||||||||||||||||||||||||||
05/29/2018 | Barclays Bank plc | USD | 2,894,539 | CZK | 60,407,000 | 2,853,842 | 40,697 | |||||||||||||||||||||
| United States Dollar/Euro | ||||||||||||||||||||||||||||
05/29/2018 | HSBC Bank USA | USD | 4,483,936 | EUR | 3,633,000 | 4,395,342 | 88,594 | |||||||||||||||||||||
| United States Dollar/Indian Rupee | ||||||||||||||||||||||||||||
05/21/2018 | Citibank N.A. | USD | 2,923,495 | INR | 191,869,000 | 2,880,189 | 43,306 | |||||||||||||||||||||
| United States Dollar/Indonesian Rupiah | ||||||||||||||||||||||||||||
07/24/2018 | Citibank N.A. | USD | 2,552,591 | IDR | 35,971,119,727 | 2,560,154 | (7,563 | ) | ||||||||||||||||||||
| United States Dollar/Japanese Yen | ||||||||||||||||||||||||||||
05/01/2018 | Barclays Bank plc | USD | 1,416,192 | JPY | 153,987,421 | 1,408,593 | 7,599 | |||||||||||||||||||||
05/01/2018 | Citibank N.A. | USD | 2,980,279 | JPY | 317,650,000 | 2,905,690 | 74,589 | |||||||||||||||||||||
05/01/2018 | HSBC Bank USA | USD | 5,929,368 | JPY | 633,750,000 | 5,797,201 | 132,167 | |||||||||||||||||||||
05/01/2018 | JPMorgan Chase Bank N.A. | USD | 3,026,540 | JPY | 320,020,000 | 2,927,369 | 99,171 | |||||||||||||||||||||
05/01/2018 | Royal Bank of Canada | USD | 3,007,703 | JPY | 320,300,000 | 2,929,930 | 77,773 | |||||||||||||||||||||
05/01/2018 | Westpac Banking Corp. | USD | 4,463,450 | JPY | 485,832,579 | 4,444,133 | 19,317 | |||||||||||||||||||||
| United States Dollar/MXN | ||||||||||||||||||||||||||||
05/25/2018 | Citibank N.A. | USD | 1,410,331 | MXN | 27,000,000 | 1,438,730 | (28,399 | ) | ||||||||||||||||||||
05/25/2018 | Goldman Sachs & Co. | USD | 2,901,921 | MXN | 55,000,000 | 2,930,746 | (28,825 | ) | ||||||||||||||||||||
05/25/2018 | Royal Bank of Canada | USD | 1,432,285 | MXN | 27,000,000 | 1,438,730 | (6,445 | ) | ||||||||||||||||||||
| United States Dollar/New Russian Ruble | ||||||||||||||||||||||||||||
05/29/2018 | Goldman Sachs & Co. | USD | 2,898,747 | RUB | 181,563,000 | 2,874,207 | 24,540 | |||||||||||||||||||||
| United States Dollar/New Zealand Dollar | ||||||||||||||||||||||||||||
05/01/2018 | HSBC Bank USA | USD | 125,454 | NZD | 172,329 | 121,251 | 4,203 | |||||||||||||||||||||
05/01/2018 | Royal Bank of Canada | USD | 2,922,948 | NZD | 4,073,000 | 2,865,763 | 57,185 | |||||||||||||||||||||
05/01/2018 | Westpac Banking Corp. | USD | 5,953,259 | NZD | 8,128,214 | 5,719,012 | 234,247 | |||||||||||||||||||||
07/25/2018 | Westpac Banking Corp. | USD | 2,833,686 | NZD | 4,010,000 | 2,821,234 | 12,452 | |||||||||||||||||||||
| United States Dollar/NOK | ||||||||||||||||||||||||||||
05/14/2018 | Goldman Sachs & Co. | USD | 5,953,713 | NOK | 46,683,324 | 5,821,303 | 132,410 | |||||||||||||||||||||
05/14/2018 | HSBC Bank USA | USD | 2,765,009 | NOK | 21,553,822 | 2,687,712 | 77,297 | |||||||||||||||||||||
05/14/2018 | JPMorgan Chase Bank N.A. | USD | 10,554,239 | NOK | 82,953,019 | 10,344,051 | 210,188 | |||||||||||||||||||||
05/14/2018 | Royal Bank of Canada | USD | 5,911,053 | NOK | 46,022,000 | 5,738,838 | 172,215 | |||||||||||||||||||||
| United States Dollar/PLN | ||||||||||||||||||||||||||||
07/26/2018 | Citibank N.A. | USD | 2,843,678 | PLN | 9,906,000 | 2,826,597 | 17,081 | |||||||||||||||||||||
| United States Dollar/South African Rand | ||||||||||||||||||||||||||||
06/25/2018 | HSBC Bank USA | USD | 6,469,575 | ZAR | 78,258,301 | 6,234,558 | 235,017 | |||||||||||||||||||||
06/25/2018 | Royal Bank of Canada | USD | 3,139,723 | ZAR | 39,324,000 | 3,132,802 | 6,921 | |||||||||||||||||||||
| United States Dollar/South Korean Won | ||||||||||||||||||||||||||||
05/02/2018 | Citibank N.A. | USD | 2,933,820 | KRW | 3,119,530,000 | 2,920,772 | 13,048 | |||||||||||||||||||||
| United States Dollar/Swedish Krona | ||||||||||||||||||||||||||||
07/10/2018 | UBS AG | USD | 2,794,744 | SEK | 24,215,000 | 2,780,174 | 14,570 | |||||||||||||||||||||
| United States Dollar/Thai Baht | ||||||||||||||||||||||||||||
| 07/10/2018 | Westpac Banking Corp. | USD | 3,072,815 | THB | 95,632,453 | 3,036,214 | 36,601 | |||||||||||||||||||||
| $ | 111,685,186 | $ | 1,890,971 | |||||||||||||||||||||||||
| * | Certain contracts with different trade dates and like characteristics have been shown net. |
See accompanying Notes to Financial Statements.
| 2018 Semi-Annual Report | 27 |
Aberdeen Global High Income Fund (Unaudited)
The Aberdeen Global High Income Fund (Institutional Class shares net of fees) returned -0.05% for the six-month period ended April 30, 2018, versus the -0.21% return of its benchmark, the ICE Bank of America Merrill Lynch (BofA ML) Global High Yield Constrained Index (hedged to U.S. dollars), during the same period. For broader comparison, the average return of the peer category of High Yield Funds (comprising 284 funds), as measured by Lipper, Inc., was -0.31% for the period.
Global high-yield markets saw a modest decline of 0.21% for the six-month period ended April 30, 2018. During a period in which inexorably rising U.S. Treasury yields hampered returns, the relatively short average duration and higher yields of the asset class served to absorb much of the impact. The global high-yield market fared considerably better than the five-year Treasury and U.S. investment-grade markets, which returned -2.29% and -2.34%, respectively, for the reporting period.
There were several major events which captured investors’ attention during the reporting period. The U.S. Federal Reserve (Fed) increased its benchmark interest rate in both December 2017 and March 2018, and the consensus market opinion is that it remains on course for potentially two further hikes over the remainder of the 2018 calendar year. U.S. tax reform, which was supported by President Donald Trump and enacted by Congress in December 2017, was initially met with some euphoria in risk assets; however, as the pace of the sell-off in Treasuries accelerated, investors became concerned that the tax cuts could cause the economy to overheat, and towards the end of January 2018, U.S. equities declined and credit spreads widened.
U.S. economic data softened slightly during the first quarter of 2018, but remain at a level which we believe is supportive of credit markets. Furthermore, inflation remains subdued.
In Europe, the European Central Bank (ECB) began to taper its monthly purchases of securities under its quantitative easing program. It is generally expected that the ECB’s program will cease by the end of this year.
February 2018 was a month in which the focus turned to President Trump’s trade tariffs. The broad consensus in financial markets is that trade barriers ultimately tend to be a “lose/lose” situation, increasing costs for companies and consumers and resulting in unintended consequences. The tariffs were targeted mainly at China, which reacted with a series of its own “tit for tat” trade measures. However, the rhetoric seemed to calm relatively quickly. Investors’ attention turned to Russian sanctions that caused volatility in Russian debt issuers, as Specially Designated Nationals (SDNs) were put on a sanctions list, precluding companies in the U.S. and, by extension, the West from conducting business with them. Russian aluminum producer Rusal (which the Fund does not hold) was particularly hard-hit by the sanctions.
The Fund’s performance relative to its benchmark, the ICE BofA ML Global High Yield Constrained Index, for the reporting period was hampered mainly by holdings in New Look, a UK fashion retailer. We subsequently exited the Fund’s position in the company during the period. Other detractors from the Fund’s relative performance included Cengage Learning and Holdings, a U.S. education publisher that continues to endure structural challenges from online competition; and Ultra Petroleum Corp., an oil and gas exploration and production company that changed its drilling strategy leading to potentially higher execution risk. We sold the Fund’s holding in the bonds during the reporting period. The bonds of pet care products and services retailer PetSmart underperformed the overall market as the company faced online competition from Amazon. Cenveo, a printing business, defaulted on its debt during the period, although we managed to sell most of the Fund’s position at relatively higher price levels before the event.
The Fund’s positioning by credit rating had a positive impact on the relative performance for the reporting period. Given their low yields and long duration, BB rated credits struggled, returning -0.63%, compared to the respective 0.13% and 1.41% returns for B and CCC rated issues. At the end of the reporting period, the Fund was significantly underweight versus its benchmark to BB credits and overweight to B and CCC rated issues. The Fund’s short-duration position relative to the benchmark also had a positive impact on performance during a period of significantly rising Treasury yields.
The Fund’s relative performance also benefited from its holding in Valeant Pharmaceuticals, which continues to focus on improving its balance sheet. The position in retail pharmacy operator Rite-Aid Corp. was another strong contributor to Fund performance after it completed the sale of roughly one-third of its pharmacies to Walgreens Boots Alliance, the parent company of its competitor, Walgreens, and subsequently announced a sale of the residual business to supermarket chain operator Albertsons Companies. (The Fund does not have a position in Walgreens but does have a position in Albertsons.) The Fund’s holdings in the bonds of Neiman Marcus performed well after the high-end retailer reported generally stronger-than-expected results for the second quarter of its 2018 fiscal year. Other contributors to Fund performance for the reporting period included UK credit card services provider NewDay, which was bolstered by robust results for its 2017 fiscal year, and Golden Nugget Inc., which benefited from the strong performance of its restaurant and gaming businesses.
The Fund employs derivatives, including foreign exchange forwards and credit default swaps. The Fund utilizes foreign exchange forwards to hedge its exposure to changes in the value of its holdings due to movements in currency exchange rates. The Fund can use credit default swaps to gain, or hedge, exposure to specific companies. The Fund may also employ credit default swap indices primarily for the purpose of managing market exposure. The derivatives positions detracted approximately 0.80% from the Fund’s absolute return for the reporting period.
The average spread on the ICE BofA ML U.S. High Yield Master II Index ended the period at 346 bps, which is just 20 bps wider than the post-global financial crisis lows reached in January this year. As of the end of the reporting period on April 30, 2018, credit spreads had absorbed more than one-third of the rise in Treasury yields since
| 28 | Semi-Annual Report 2018 |
Aberdeen Global High Income Fund (Unaudited) (continued)
September 2017. However, we do not believe that spreads will continue to absorb further interest-rate hikes from the Fed. Current credit spread levels reflect low default rates, which are generally expected to continue, supported by decent economic growth and subdued inflation. Should higher inflation expectations force the Fed to move more aggressively than the market currently anticipates, this could pressure equities and, to some extent, high-yield securities. The credit cycle is mature and, while the individual and corporate tax cuts implemented in early 2018 may provide a small boost to U.S. gross domestic product, we believe that this may be offset by Fed interest-rate hikes. The current consensus market opinion suggests that the tax cuts favor higher-rated (i.e., less indebted) companies and impose a negative impact on the lower-rated part of high-yield markets. However, each company will have its own reaction function* and the extent to which they may have tax losses, accelerated depreciation of assets or other mitigating actions will not become apparent for some time. While valuations in the global high-yield market appear to be full, we believe that they reflect a strong environment for credit.
Index definitions
The performance of the global high-yield market is measured by the ICE Bank of America Merrill Lynch (BofA ML) Global High Yield Constrained Index, which tracks the performance of U.S. dollar-, Canadian dollar-, euro- and sterling-denominated, below-investment-grade corporate debt publicly issued in the major domestic or eurobond markets. Indexes are unmanaged and have been provided for comparison purposes only. No fees or expenses are reflected. You cannot invest directly in an index.
The performance of the five-year U.S. Treasury is measured by the ICE BofA ML U.S. Treasury 5 Year Current Index. The performance of the U.S. investment-grade sector is represented by the ICE BofA ML U.S. Corporate Master Index, which tracks the performance of U.S. dollar-denominated investment-grade corporate debt publicly issued in the U.S. domestic market.
The performance of BB rated credit is measured by the ICE BofA ML Global High Yield BB Rated Constrained Index, which is a subset of the ICE BofA ML Global High Yield Constrained Index and includes all securities in the ICE BofA ML Global High Yield Constrained Index rated BB by Standard & Poor’s (or equivalent as rated by Moody’s or Fitch). Standard & Poor’s, Moody’s and Fitch’s credit ratings express the respective agencies’ opinion about the ability and willingness of an issuer, such as a corporation or state or city government, to meet its financial obligations in full and on time. Typically, ratings are expressed as letter grades that range, for example, from AAA to D (Aaa to C for Moody’s) to communicate the agency’s opinion of relative level of credit risk. Ratings from “AA” to “CCC” may be modified by the addition of a plus (+) or minus (-) sign to show relative standing within the major rating categories.
The performance of B rated credit is measured by the ICE BofA ML Global High Yield B Rated Constrained Index, which is a subset of the ICE BofA ML Global High Yield Constrained Index and includes all securities in the ICE BofA ML U.S. High Yield Index rated B by Standard & Poor’s (or equivalent as rated by Moody’s or Fitch).
The performance of CCC rated credit is measured by the ICE BofA ML Global High Yield CCC & Lower Rated Constrained Index, which is a subset of the ICE BofA ML Global High Yield Constrained Index and includes all securities in the ICE BofA ML U.S. High Yield Index rated CCC and lower by Standard & Poor’s (or equivalent as rated by Moody’s or Fitch).
The ICE BofA ML U.S. High Yield Master II Index tracks the performance of U.S. dollar-denominated below-investment-grade corporate debt publicly issued in the U.S. domestic market.
All indices are hedged to U.S. dollars.
Portfolio Management:
Aberdeen Global High Yield Team
PAST PERFORMANCE DOES NOT GUARANTEE FUTURE RESULTS.
The performance quoted represents past performance, which does not guarantee future results. Class A shares have up to a 0.25% 12b-1 fee. The investment return and principal value of an investment will fluctuate so that an investor’s shares, when redeemed, may be worth more or less than their original cost. Current performance of the Fund may be lower or higher than the performance quoted. Performance data current to the most recent month-end may be obtained by calling 866-667-9231 or visiting www.aberdeen-asset.us.
Investing in mutual funds involves risk, including the possible loss of principal. There is no assurance that the investment objective of any fund will be achieved. Indexes are unmanaged and have been provided for comparison purposes only. No fees or expenses are reflected. You cannot invest directly in an index.
Lipper is a leading global provider of mutual fund information and analysis to fund companies, financial intermediaries and media organizations.
Risk Considerations
Fixed income securities are subject to certain risks including, but not limited to: interest rate (changes in interest rates may cause a decline in the market value of an investment), credit (changes in the financial condition of the issuer, borrower, counterparty, or underlying collateral), prepayment (debt issuers may repay or refinance their loans or obligations earlier than anticipated), and extension (principal repayments may not occur as quickly as anticipated, causing the expected maturity of a security to increase).
Non-investment-grade debt securities (high yield/junk bonds) may be subject to greater market fluctuations, risk of default or loss of income and principal than higher-rated securities.
Derivatives are speculative and may hurt the Fund’s performance. They present the risk of disproportionately increased losses and/or reduced gains when the financial asset or measure to which the derivative is linked changes in unexpected ways.
| * | The reaction function indicates the relationship between the output of one firm versus that of a competitor. |
| 2018 Semi-Annual Report | 29 |
Aberdeen Global High Income Fund (Unaudited) (concluded)
Foreign securities may be more volatile, harder to price and less liquid than U.S. securities. They are subject to different accounting and regulatory standards and currency exchange rate, political and economic risks. Fluctuation in currency exchange rates may impact a Fund’s returns more greatly to the extent a Fund does not hedge currency exposure or hedging techniques are unsuccessful. The foregoing risks are enhanced in emerging market countries.
Investing a significant portion of the Fund’s assets in securities of companies conducting business in a broadly related group of industries within an economic sector may make the Fund more vulnerable to unfavorable developments in that sector.
Please read the prospectus for more detailed information regarding these and other risks.
| 30 | Semi-Annual Report 2018 |
Aberdeen Global High Income Fund (Unaudited)
Average Annual Total Return (For periods ended April 30, 2018) | Six Month† | 1 Yr. | 5 Yr. | 10 Yr. | ||||||||||||
Class A | w/o SC* | (0.17)% | 4.75% | 2.49% | 5.92% | |||||||||||
Institutional Class | w/o SC* | (0.05)% | 5.00% | 2.76% | 6.19% | |||||||||||
| † | Not Annualized |
| * | Class A shares and Institutional Class shares are not subject to any sales charges. |
Performance of a $10,000 Investment (as of April 30, 2018)

Comparative performance of $10,000 invested in Class A shares of the Aberdeen Global High Income Fund, ICE Bank of America Merrill Lynch Global High Yield Constrained Index (hedged to the U.S. Dollar) and the Consumer Price Index (CPI) over a 10-year period ended April 30, 2018. Unlike the Fund’s returns, the returns for these unmanaged indexes do not reflect any fees or expenses. Investors cannot invest directly in market indexes.
The ICE Bank of America Merrill Lynch Global High Yield Constrained Index (hedged to the U.S. Dollar) tracks the performance of USD, CAD, GBP and EUR denominated below investment grade corporate debt publicly issued in the major domestic or eurobond markets but caps issuer exposure at 2%.
The CPI is a measure of the average change over time in the prices paid by urban consumers for a market basket of consumer goods and services.
Investment return and principal value will fluctuate, and when redeemed, shares may be worth more or less than original cost. Past performance is no guarantee of future results. The Average Annual Total Return table and performance graph do not reflect the deduction of taxes that a shareholder would pay on Fund distributions or the redemption of Fund shares. Investing in mutual funds involves market risk, including loss of principal. Performance returns assume the reinvestment of all distributions. Performance returns reflect fee waivers and reimbursements in effect without which returns would have been lower.
| 2018 Semi-Annual Report | 31 |
Aberdeen Global High Income Fund (Unaudited) (concluded)
Portfolio Summary (as a percentage of net assets)
April 30, 2018 (Unaudited)
| Asset Allocation | ||||
Corporate Bonds | 93.7% | |||
Short-Term Investment | 3.4% | |||
Bank Loans | 3.0% | |||
Common Stocks | 0.2% | |||
Liabilities in Excess of Other Assets | (0.3)% | |||
| 100.0% | ||||
The following chart summarizes the composition of the Fund’s portfolio, expressed as a percentage of net assets. The industries listed below may include more than one industry group. As of April 30, 2018, the Fund did not have more than 25% of its assets invested in any single industry or industry group.
| Top Industries | ||||
Oil, Gas & Consumable Fuels | 10.8% | |||
Media | 10.2% | |||
Diversified Telecommunication Services | 8.6% | |||
Entertainment | 6.4% | |||
Commercial Banks | 5.9% | |||
Diversified Financial Services | 5.2% | |||
Retail | 4.0% | |||
Food Products | 3.8% | |||
Commercial Services & Supplies | 3.4% | |||
Electric Utilities | 3.0% | |||
Other | 38.7% | |||
| 100.0% | ||||
| Top Holdings* | ||||
United Rentals North America, Inc. 07/15/2025 | 1.8% | |||
Valeant Pharmaceuticals International, Inc. 05/15/2023 | 1.6% | |||
Newday Bondco PLC 02/01/2024 | 1.5% | |||
AMC Entertainment Holdings, Inc. 11/15/2024 | 1.4% | |||
Gateway Casinos & Entertainment Ltd. 03/01/2024 | 1.4% | |||
Altice France SA 05/15/2022 | 1.4% | |||
Rite Aid Corp. 04/01/2023 | 1.4% | |||
CYBG PLC 12/08/2022 | 1.4% | |||
Calpine Corp. 01/15/2025 | 1.4% | |||
Senvion Holding GmbH 10/25/2022 | 1.3% | |||
Other | 85.4% | |||
| 100.0% | ||||
| * | For the purpose of listing top holdings, Short-Term Investments are included as part of Other. |
| Top Countries | ||||
United States | 49.0% | |||
United Kingdom | 10.9% | |||
Canada | 5.3% | |||
Luxembourg | 4.3% | |||
Brazil | 3.7% | |||
France | 3.5% | |||
Germany | 2.9% | |||
Netherlands | 2.9% | |||
Jersey | 1.8% | |||
Spain | 1.5% | |||
Other | 14.2% | |||
| 100.0% | ||||
| 32 | Semi-Annual Report 2018 |
Statement of Investments
April 30, 2018 (Unaudited)
Aberdeen Global High Income Fund
| Shares or Principal Amount | Value (US$) | |||||||
CORPORATE BONDS (93.7%) |
| |||||||
ARGENTINA (1.0%) |
| |||||||
Aeropuertos Argentina 2000 SA (USD), 6.88%, 02/01/2027 (a) | $ | 1,160,000 | $ | 1,206,980 | ||||
Cablevision SA (USD), 6.50%, 06/15/2021 (a) | 1,031,000 | 1,070,951 | ||||||
IRSA Propiedades Comerciales SA (USD), 8.75%, 03/23/2023 (a) | 535,000 | 587,168 | ||||||
| 2,865,099 | ||||||||
BRAZIL (3.7%) |
| |||||||
Azul Investments LLP (USD), 5.88%, 10/26/2024 (a) | 988,000 | 948,480 | ||||||
Banco do Brasil SA (USD), 10 year CMT + 6.362%, 9.00%, 06/18/2024 (a)(b)(c) | 1,000,000 | 1,058,400 | ||||||
JBS USA LUX SA / JBS USA Finance, Inc. (USD), 5.75%, 06/15/2025 (a) | 3,230,000 | 3,035,231 | ||||||
Petrobras Global Finance BV | ||||||||
(USD), 5.30%, 01/27/2025 (a) | 2,985,000 | 2,935,747 | ||||||
(USD), 8.75%, 05/23/2026 | 2,000,000 | 2,342,500 | ||||||
| 10,320,358 | ||||||||
CANADA (5.3%) |
| |||||||
Bombardier, Inc. (USD), 7.50%, 03/15/2025 (a) | 705,000 | 733,200 | ||||||
Gateway Casinos & Entertainment Ltd. (USD), 8.25%, 03/01/2024 (a) | 3,725,000 | 3,953,156 | ||||||
GFL Environmental, Inc. (USD), 5.63%, 05/01/2022 (a) | 280,000 | 280,350 | ||||||
MEG Energy Corp. |
| |||||||
(USD), 6.38%, 01/30/2023 (a) | 3,362,000 | 3,034,205 | ||||||
(USD), 6.50%, 01/15/2025 (a) | 1,014,000 | 1,014,203 | ||||||
Taseko Mines Ltd. (USD), 8.75%, 06/15/2022 (a) | 1,733,000 | 1,793,655 | ||||||
Teine Energy Ltd. (USD), 6.88%, 09/30/2022 (a) | 526,000 | 537,835 | ||||||
Telesat Canada / Telesat LLC (USD), 8.88%, 11/15/2024 (a) | 2,885,000 | 3,159,075 | ||||||
| 14,505,679 | ||||||||
CHILE (0.4%) |
| |||||||
Latam Finance Ltd. (USD), 6.88%, 04/11/2024 (a) | 1,172,000 | 1,205,871 | ||||||
CHINA (0.6%) |
| |||||||
Eagle Intermediate Global Holding BV/Ruyi US Finance LLC | ||||||||
(EUR), 5.38%, 05/01/2023 (a) | 100,000 | 123,477 | ||||||
(USD), 7.50%, 05/01/2025 (a) | 901,000 | 923,525 | ||||||
eHi Car Services Ltd. (USD), 5.88%, 08/14/2022 (a) | 585,000 | 540,896 | ||||||
| 1,587,898 | ||||||||
CONGO (0.2%) |
| |||||||
HTA Group Ltd. (USD), 9.13%, 03/08/2022 (a) | 560,000 | 586,712 | ||||||
DOMINICAN REPUBLIC (0.3%) |
| |||||||
AES Andres BV / Dominican Power Partners / Empresa Generadora de Electricidad It (USD), 7.95%, 05/11/2026 (a) | 765,000 | 819,506 | ||||||
EL SALVADOR (0.2%) |
| |||||||
AES El Salvador Trust II (USD), 6.75%, 03/28/2023 (a) | 500,000 | 483,125 | ||||||
FRANCE (3.1%) |
| |||||||
Altice France SA (USD), 6.00%, 05/15/2022 (a) | 3,983,000 | 3,925,724 | ||||||
Altice France SA |
| |||||||
(EUR), 5.38%, 05/15/2022 (a) | 1,075,000 | 1,327,386 | ||||||
(USD), 7.38%, 05/01/2026 (a) | 978,000 | 947,438 | ||||||
SPCM SA (USD), 4.88%, 09/15/2025 (a) | 2,455,000 | 2,377,545 | ||||||
| 8,578,093 | ||||||||
GEORGIA (0.2%) |
| |||||||
Bank of Georgia JSC (USD), 6.00%, 07/26/2023 (a) | 500,000 | 503,100 | ||||||
GERMANY (2.9%) |
| |||||||
Nidda BondCo GmbH (EUR), 5.00%, 09/30/2025 (a) | 305,000 | 359,909 | ||||||
Nidda Healthcare Holding GmbH (EUR), 3.50%, 09/30/2024 (a) | 623,000 | 741,162 | ||||||
PrestigeBidCo GmbH (EUR), 6.25%, 12/15/2023 (a) | 837,000 | 1,078,987 | ||||||
Senvion Holding GmbH (EUR), 3.88%, 10/25/2022 (a) | 3,256,000 | 3,591,006 | ||||||
Tele Columbus AG (EUR), 3.88%, 05/02/2025 (a) | 533,000 | 641,623 | ||||||
ZF North America Capital, Inc. (USD), 4.75%, 04/29/2025 (a) | 1,600,000 | 1,630,000 | ||||||
| 8,042,687 | ||||||||
GREECE (0.7%) |
| |||||||
Intralot Capital Luxembourg SA (EUR), 5.25%, 09/15/2024 (a) | 1,625,000 | 1,967,844 | ||||||
GUATEMALA (0.2%) |
| |||||||
Industrial Senior Trust (USD), 5.50%, 11/01/2022 (a) | 500,000 | 496,055 | ||||||
INDIA (0.6%) |
| |||||||
Vedanta Resources PLC (USD), 6.13%, 08/09/2024 (a) | 1,776,000 | 1,708,651 | ||||||
ITALY (0.5%) |
| |||||||
Wind Tre SpA (USD), 5.00%, 01/20/2026 (a) | 1,606,000 | 1,348,076 | ||||||
JAMAICA (0.5%) |
| |||||||
Digicel Group Ltd. (USD), 8.25%, 09/30/2020 (a) | 1,575,000 | 1,407,656 | ||||||
JERSEY (1.8%) |
| |||||||
LHC3 PLC (EUR), 4.13%, 08/15/2024 (a)(d) | 784,000 | 957,276 | ||||||
Newday Bondco PLC (GBP), 7.38%, 02/01/2024 (a) | 3,120,000 | 4,079,691 | ||||||
| 5,036,967 | ||||||||
KAZAKHSTAN (0.4%) |
| |||||||
KazMunayGas National Co. JSC (USD), 7.00%, 05/05/2020 (a) | 500,000 | 533,560 | ||||||
Nostrum Oil & Gas Finance BV (USD), 8.00%, 07/25/2022 (a) | 650,000 | 661,471 | ||||||
| 1,195,031 | ||||||||
LUXEMBOURG (4.3%) |
| |||||||
Altice Financing SA (USD), 7.50%, 05/15/2026 (a) | 1,960,000 | 1,930,600 | ||||||
Altice Finco SA (USD), 8.13%, 01/15/2024 (a) | 950,000 | 974,937 | ||||||
ARD Finance SA (USD), 7.13%, 09/15/2023 (d) | 1,200,000 | 1,227,000 | ||||||
See accompanying Notes to Financial Statements.
| 2018 Semi-Annual Report | 33 |
Statement of Investments (continued)
April 30, 2018 (Unaudited)
Aberdeen Global High Income Fund
| Shares or Principal Amount | Value (US$) | |||||||
Galapagos SA (EUR), 5.38%, 06/15/2021 (a) | $ | 1,500,000 | $ | 1,738,944 | ||||
Kleopatra Holdings 1 SCA (EUR), 8.50%, 06/30/2023 (a)(d) | 762,000 | 758,007 | ||||||
Matterhorn Telecom Holding SA (EUR), 4.88%, 05/01/2023 (a) | 1,280,000 | 1,572,778 | ||||||
Unilabs Subholding AB (EUR), 5.75%, 05/15/2025 (a) | 3,000,000 | 3,586,176 | ||||||
| 11,788,442 | ||||||||
MAURITIUS (0.4%) |
| |||||||
Liquid Telecommunications Financing PLC (USD), 8.50%, 07/13/2022 (a) | 1,150,000 | 1,210,304 | ||||||
MEXICO (0.7%) |
| |||||||
Axtel SAB de CV (USD), 6.38%, 11/14/2024 (a) | 796,000 | 792,020 | ||||||
Elementia SAB de CV (USD), 5.50%, 01/15/2025 (a) | 611,000 | 603,363 | ||||||
Grupo Posadas SAB de CV (USD), 7.88%, 06/30/2022 (a) | 575,000 | 598,000 | ||||||
| 1,993,383 | ||||||||
NETHERLANDS (2.6%) |
| |||||||
ING Groep NV (USD), 5 year USD Swap + 4.446%, 6.50%, 04/16/2025 (b)(c) | 2,027,000 | 2,086,391 | ||||||
Lincoln Finance Ltd. (EUR), 6.88%, 04/15/2021 (a) | 1,800,000 | 2,247,041 | ||||||
OCI (EUR), 5.00%, 04/15/2023 (a) | 232,000 | 285,182 | ||||||
Ziggo BV (USD), 5.50%, 01/15/2027 (a) | 2,620,000 | 2,469,350 | ||||||
| 7,087,964 | ||||||||
NIGERIA (0.8%) |
| |||||||
IHS Netherlands Holdco BV (USD), 9.50%, 10/27/2021 (a) | 1,075,000 | 1,110,000 | ||||||
United Bank for Africa PLC (USD), 7.75%, 06/08/2022 (a) | 575,000 | 592,434 | ||||||
Zenith Bank PLC (USD), 7.38%, 05/30/2022 (a) | 596,000 | 613,284 | ||||||
| 2,315,718 | ||||||||
PANAMA (0.3%) |
| |||||||
C&W Senior Financing DAC (USD), 6.88%, 09/15/2027 (a) | 879,000 | 871,089 | ||||||
PARAGUAY (0.2%) |
| |||||||
Banco Regional SAECA (USD), 8.13%, 01/24/2019 (a) | 500,000 | 517,800 | ||||||
REPUBLIC OF IRELAND (1.2%) |
| |||||||
Ardagh Packaging Finance PLC / Ardagh Holdings USA, Inc. | ||||||||
(USD), 7.25%, 05/15/2024 (a) | 2,235,000 | 2,357,925 | ||||||
(GBP), 4.75%, 07/15/2027 (a) | 656,000 | 881,666 | ||||||
| 3,239,591 | ||||||||
RUSSIA (1.4%) |
| |||||||
Credit Bank of Moscow Via CBOM Finance PLC (USD), 5.88%, 11/07/2021 (a) | 580,000 | 563,018 | ||||||
Global Ports Finance PLC (USD), 6.87%, 01/25/2022 (a) | 500,000 | 505,060 | ||||||
GTLK Europe DAC (USD), 5.95%, 07/19/2021 (a) | 500,000 | 501,150 | ||||||
Sberbank of Russia Via SB Capital SA (USD), 6.13%, 02/07/2022 (a) | 1,030,000 | 1,071,705 | ||||||
VEON Holdings BV (USD), 4.95%, 06/16/2024 (a) | 1,174,000 | 1,113,879 | ||||||
| 3,754,812 | ||||||||
SLOVENIA (0.4%) |
| |||||||
United Group BV (EUR), 4.38%, 07/01/2022 (a) | 820,000 | 1,012,523 | ||||||
SOUTH AFRICA (0.8%) |
| |||||||
Sappi Papier Holding GmbH (USD), 7.50%, 06/15/2032 (a)(e) | 2,017,000 | 2,163,232 | ||||||
SPAIN (1.5%) |
| |||||||
Codere Finance 2 Luxembourg SA, (EUR), 6.75%, 11/01/2021 (a) | 2,326,000 | 2,940,051 | ||||||
Haya Finance 2017 SA (EUR), 5.25%, 11/15/2022 (a) | 1,099,000 | 1,214,477 | ||||||
| 4,154,528 | ||||||||
SWITZERLAND (0.5%) |
| |||||||
UBS Group Funding Switzerland AG (USD), 5 year USD Swap + 4.866%, 7.00%, 02/19/2025 (a)(b)(c) | 1,339,000 | 1,432,564 | ||||||
TURKEY (0.5%) |
| |||||||
Akbank Turk AS (USD), 5 year USD Swap + 5.026%, 7.20%, 03/16/2027 (a)(c) | 949,000 | 964,184 | ||||||
Turkiye Halk Bankasi A.S. (USD), 5.00%, 07/13/2021 (a) | 500,000 | 473,750 | ||||||
| 1,437,934 | ||||||||
UKRAINE (0.2%) |
| |||||||
MHP Lux SA (USD), 6.95%, 04/03/2026 (a) | 619,000 | 603,525 | ||||||
UNITED ARAB EMIRATES (0.4%) |
| |||||||
Shelf Drilling Holdings Ltd. (USD), 8.25%, 02/15/2025 (a) | 998,000 | 1,012,970 | ||||||
UNITED KINGDOM (8.9%) |
| |||||||
Boparan Finance PLC (GBP), 5.25%, 07/15/2019 (a) | 675,000 | 923,659 | ||||||
BrightHouse Finco Ltd., PIK, (GBP), 9.00%, 05/15/2023 (a)(d) | 1,050,000 | 1,373,258 | ||||||
Cabot Financial Luxembourg SA (GBP), 8.38%, 08/01/2020 (a) | 502,000 | 711,249 | ||||||
Corral Petroleum Holdings AB (EUR), 11.75%, 05/15/2021 (a)(d) | 2,290,000 | 2,960,890 | ||||||
CPUK Finance Ltd. (GBP), 4.25%, 02/28/2047 (a) | 750,000 | 1,037,758 | ||||||
CYBG PLC (GBP), 8.00%, 12/08/2022 (a)(b) | 2,640,000 | 3,776,231 | ||||||
Galaxy Finco Ltd. (GBP), 7.88%, 11/15/2021 (a) | 1,600,000 | 2,169,678 | ||||||
Inmarsat Finance PLC (USD), 4.88%, 05/15/2022 (a) | 1,562,000 | 1,507,330 | ||||||
Jaguar Land Rover Automotive PLC (GBP), 5.00%, 02/15/2022 (a) | 172,000 | 249,816 | ||||||
KCA Deutag UK Finance PLC (USD), 9.63%, 04/01/2023 (a) | 895,000 | 921,850 | ||||||
Nationwide Building Society (GBP), 5 year GBP Swap + 4.880%, 6.88%, 06/20/2019 (a)(b)(c) | 1,280,000 | 1,838,555 | ||||||
Ocado Group PLC (GBP), 4.00%, 06/15/2024 (a) | 811,000 | 1,104,814 | ||||||
Pizzaexpress Financing 2 PLC (GBP), 6.63%, 08/01/2021 (a) | 1,078,000 | 1,390,545 | ||||||
See accompanying Notes to Financial Statements.
| 34 | Semi-Annual Report 2018 |
Statement of Investments (continued)
April 30, 2018 (Unaudited)
Aberdeen Global High Income Fund
| Shares or Principal Amount | Value (US$) | |||||||
Saga PLC (GBP), 3.38%, 05/12/2024 (a) | $ | 811,000 | $ | 1,052,222 | ||||
TVL Finance PLC (GBP), 8.50%, 05/15/2023 (a) | 713,600 | 1,051,967 | ||||||
Virgin Media Secured Finance PLC (GBP), 5.50%, 01/15/2025 (a) | 1,754,100 | 2,471,362 | ||||||
| 24,541,184 | ||||||||
UNITED STATES (45.1%) |
| |||||||
Albertsons Cos. LLC / Safeway, Inc. / New Albertson’s, Inc. / Albertson’s LLC | ||||||||
(USD), 6.63%, 06/15/2024 | 1,256,000 | 1,169,650 | ||||||
(USD), 5.75%, 03/15/2025 | 3,096,000 | 2,697,390 | ||||||
Alliance Data Systems Corp. |
| |||||||
(USD), 5.88%, 11/01/2021 (a) | 1,125,000 | 1,144,688 | ||||||
(EUR), 5.25%, 11/15/2023 (a) | 375,000 | 471,009 | ||||||
Altice US Finance I Corp. (USD), 5.38%, 07/15/2023 (a) | 2,693,000 | 2,696,366 | ||||||
AMC Entertainment Holdings, Inc. (GBP), 6.38%, 11/15/2024 | 2,834,000 | 3,963,016 | ||||||
Apergy Corp. (USD), 6.38%, 05/01/2026 (a) | 129,000 | 130,935 | ||||||
Avis Budget Car Rental LLC / Avis Budget Finance, Inc. | ||||||||
(USD), 6.38%, 04/01/2024 (a) | 978,000 | 987,780 | ||||||
(USD), 5.25%, 03/15/2025 (a) | 423,000 | 406,080 | ||||||
Berry Petroleum Co. LLC (USD), 7.00%, 02/15/2026 (a) | 602,000 | 617,050 | ||||||
Blue Racer Midstream LLC / Blue Racer Finance Corp. (USD), 6.13%, 11/15/2022 (a) | 1,379,000 | 1,413,475 | ||||||
BMC Software Finance, Inc. (USD), 8.13%, 07/15/2021 (a) | 2,115,000 | 2,109,712 | ||||||
Calpine Corp. (USD), 5.75%, 01/15/2025 | 4,080,000 | 3,743,808 | ||||||
CCO Holdings LLC / CCO Holdings Capital Corp. |
| |||||||
(USD), 5.75%, 02/15/2026 (a) | 3,033,000 | 3,010,252 | ||||||
(USD), 5.50%, 05/01/2026 (a) | 332,000 | 323,268 | ||||||
Cengage Learning, Inc. (USD), 9.50%, 06/15/2024 (a) | 4,206,000 | 3,280,680 | ||||||
Cenveo Corp. (USD), 6.00%, 08/01/2019 (a)(f) | 1,059,000 | 423,600 | ||||||
Change Healthcare Holdings LLC / Change Healthcare Finance, Inc. (USD), 5.75%, 03/01/2025 (a) | 1,700,000 | 1,661,750 | ||||||
Cheniere Energy Partners LP (USD), 5.25%, 10/01/2025 (a) | 419,000 | 409,573 | ||||||
Citgo Holding, Inc. (USD), 10.75%, 02/15/2020 (a) | 2,069,000 | 2,193,140 | ||||||
Commercial Metals Co. (USD), 5.75%, 04/15/2026 (a) | 1,241,000 | 1,242,551 | ||||||
Conduent Finance, Inc. / Conduent Business Services LLC (USD), 10.50%, 12/15/2024 (a) | 1,350,000 | 1,595,700 | ||||||
Diamond BC BV (EUR), 5.63%, 08/15/2025 (a) | 833,000 | 961,217 | ||||||
EMI Music Publishing Group North America Holdings, Inc. (USD), 7.63%, 06/15/2024 (a) | 3,130,000 | 3,388,225 | ||||||
Equinix, Inc. (USD), 5.88%, 01/15/2026 | 1,780,000 | 1,842,300 | ||||||
Frontier Communications Corp. (USD), 10.50%, 09/15/2022 | 1,670,000 | 1,469,099 | ||||||
General Motors (Escrow Shares) |
| |||||||
(USD), 8.80%, 03/01/2049 (g) | 7,200,000 | – | ||||||
(USD), 8.38%, 07/15/2049 (g) | 3,550,000 | – | ||||||
Golden Nugget, Inc. (USD), 8.75%, 10/01/2025 (a) | 2,725,000 | 2,847,625 | ||||||
Goodyear Tire & Rubber Co. (The) (USD), 5.13%, 11/15/2023 | 945,000 | 940,275 | ||||||
Grinding Media, Inc. / Moly-Cop AltaSteel Ltd. (USD), 7.38%, 12/15/2023 (a) | 400,000 | 422,500 | ||||||
Hardwoods Acquisition, Inc. (USD), 7.50%, 08/01/2021 (a) | 3,430,000 | 3,138,450 | ||||||
Hilcorp Energy I LP / Hilcorp Finance Co. (USD), 5.75%, 10/01/2025 (a) | 2,628,000 | 2,601,720 | ||||||
Iron Mountain, Inc. (USD), 5.25%, 03/15/2028 (a) | 1,230,000 | 1,157,738 | ||||||
JPMorgan Chase & Co., Series CC (USD), 4.63%, 11/01/2022 (b) | 1,975,000 | 1,851,562 | ||||||
Lennar Corp. (USD), 4.50%, 04/30/2024 | 624,000 | 608,400 | ||||||
Meredith Corp. (USD), 6.88%, 02/01/2026 (a) | 1,703,000 | 1,722,074 | ||||||
Meritage Homes Corp. (USD), 6.00%, 06/01/2025 (a) | 1,212,000 | 1,249,875 | ||||||
Moss Creek Resources Holdings, Inc. (USD), 7.50%, 01/15/2026 (a) | 1,509,000 | 1,516,545 | ||||||
Motors Liquidation Co. (USD), 8.88%, 10/15/2020 (g) | 14,578,000 | – | ||||||
MPT Operating Partnership LP / MPT Finance Corp. (USD), 5.00%, 10/15/2027 | 1,133,000 | 1,073,518 | ||||||
Nationstar Mortgage LLC / Nationstar Capital Corp. (USD), 6.50%, 07/01/2021 | 2,550,000 | 2,581,875 | ||||||
Neiman Marcus Group Ltd., LLC (USD), 8.00%, 10/15/2021 (a) | 3,118,000 | 2,104,650 | ||||||
New Enterprise Stone & Lime Co., Inc. (USD), 10.13%, 04/01/2022 (a) | 1,805,000 | 1,922,325 | ||||||
NRG Energy, Inc. (USD), 7.25%, 05/15/2026 | 928,000 | 989,610 | ||||||
Oasis Petroleum, Inc. (USD), 6.88%, 01/15/2023 | 2,220,000 | 2,278,275 | ||||||
Park-Ohio Industries, Inc. (USD), 6.63%, 04/15/2027 | 224,000 | 232,400 | ||||||
PBF Holding Co. LLC / PBF Finance Corp. (USD), 7.25%, 06/15/2025 | 1,500,000 | 1,556,250 | ||||||
PBF Logistics LP / PBF Logistics Finance Corp. (USD), 6.88%, 05/15/2023 | 1,767,000 | 1,784,670 | ||||||
PetSmart, Inc. |
| |||||||
(USD), 7.13%, 03/15/2023 (a) | 2,476,000 | 1,436,080 | ||||||
(USD), 5.88%, 06/01/2025 (a) | 105,000 | 75,338 | ||||||
(USD), 8.88%, 06/01/2025 (a) | 469,000 | 270,848 | ||||||
Plastipak Holdings, Inc. (USD), 6.25%, 10/15/2025 (a) | 520,000 | 504,400 | ||||||
Post Holdings, Inc. (USD), 5.00%, 08/15/2026 (a) | 1,890,000 | 1,771,875 | ||||||
Prestige Brands, Inc. (USD), 6.38%, 03/01/2024 (a) | 428,000 | 430,140 | ||||||
Radiate Holdco LLC / Radiate Finance, Inc. |
| |||||||
(USD), 6.88%, 02/15/2023 (a) | 512,000 | 495,360 | ||||||
(USD), 6.63%, 02/15/2025 (a) | 1,460,000 | 1,354,150 | ||||||
Rite Aid Corp. (USD), 6.13%, 04/01/2023 (a) | 3,805,000 | 3,857,319 | ||||||
Sable International Finance Ltd. (USD), 6.88%, 08/01/2022 (a) | 1,760,000 | 1,850,200 | ||||||
Sanchez Energy Corp. |
| |||||||
(USD), 6.13%, 01/15/2023 | 2,315,000 | 1,671,893 | ||||||
(USD), 7.25%, 02/15/2023 (a) | 1,131,000 | 1,142,310 | ||||||
Sprint Corp. |
| |||||||
(USD), 7.88%, 09/15/2023 | 2,325,000 | 2,493,562 | ||||||
(USD), 7.63%, 03/01/2026 | 662,000 | 697,583 | ||||||
Staples, Inc. (USD), 8.50%, 09/15/2025 (a) | 950,000 | 888,250 | ||||||
Summit Materials LLC / Summit Materials Finance Corp. (USD), 5.13%, 06/01/2025 (a) | 24,000 | 23,280 | ||||||
See accompanying Notes to Financial Statements.
| 2018 Semi-Annual Report | 35 |
Statement of Investments (continued)
April 30, 2018 (Unaudited)
Aberdeen Global High Income Fund
| Shares or Principal Amount | Value (US$) | |||||||
T-Mobile USA, Inc. (USD), 6.00%, 04/15/2024 | $ | 2,671,000 | $ | 2,797,872 | ||||
Tenet Healthcare Corp. (USD), 4.63%, 07/15/2024 (a) | 1,417,000 | 1,367,547 | ||||||
TopBuild Escrow Corp. (USD), 5.63%, 05/01/2026 (a) | 968,000 | 971,630 | ||||||
TransDigm, Inc. (USD), 6.50%, 07/15/2024 | 935,000 | 950,778 | ||||||
TTM Technologies, Inc. (USD), 5.63%, 10/01/2025 (a) | 1,300,000 | 1,274,000 | ||||||
United Rentals North America, Inc. (USD), 5.50%, 07/15/2025 | 4,725,000 | 4,843,125 | ||||||
Valeant Pharmaceuticals International, Inc. (EUR), 4.50%, 05/15/2023 (a) | 4,000,000 | 4,388,465 | ||||||
Valvoline, Inc. (USD), 5.50%, 07/15/2024 | 2,055,000 | 2,106,375 | ||||||
Vistra Energy Corp. (USD), 7.38%, 11/01/2022 | 1,940,000 | 2,044,275 | ||||||
Warrior Met Coal, Inc. (USD), 8.00%, 11/01/2024 (a) | 796,000 | 812,437 | ||||||
Weight Watchers International, Inc. (USD), 8.63%, 12/01/2025 (a) | 1,325,000 | 1,424,375 | ||||||
WMG Acquisition Corp. (USD), 5.50%, 04/15/2026 (a) | 591,000 | 593,955 | ||||||
WR Grace & Co-Conn (USD), 5.63%, 10/01/2024 (a) | 1,830,000 | 1,889,475 | ||||||
Wyndham Worldwide Corp. |
| |||||||
(USD), 4.15%, 04/01/2024 | 1,000,000 | 993,197 | ||||||
(USD), 5.10%, 10/01/2025 | 945,000 | 977,847 | ||||||
Zayo Group LLC / Zayo Capital, Inc. (USD), 6.00%, 04/01/2023 | 1,873,000 | 1,929,190 | ||||||
| 124,259,782 | ||||||||
VENEZUELA (0.5%) | ||||||||
Petroleos de Venezuela SA (USD), 6.00%, 05/16/2024 (a)(f)(h) | 5,000,000 | 1,262,500 | ||||||
ZAMBIA (0.4%) | ||||||||
First Quantum Minerals Ltd. (USD), 6.88%, 03/01/2026 (a) | 1,218,000 | 1,157,100 | ||||||
Total Corporate Bonds | 258,475,353 | |||||||
BANK LOANS (3.0%) | ||||||||
FRANCE (0.4%) | ||||||||
Financiere Sun S.A.S., 2017 EUR Term Loan B (EUR), 3.25%, 03/14/2023 | 1,000,000 | 1,208,354 | ||||||
NETHERLANDS (0.3%) | ||||||||
TMF Group Holding B.V., 2017 EUR 2nd Lien Term Loan (EUR), 0.00%, 12/08/2025 | 750,000 | 904,568 | ||||||
UNITED KINGDOM (1.8%) | ||||||||
EG Finco Limited, 2018 EUR Incremental Term Loan (EUR), 0.00%, 03/31/2025 | 1,000,000 | 1,201,562 | ||||||
EG Group Limited, 2018 GBP Term Loan B (GBP), 0.00%, 02/06/2025 | 1,000,000 | 1,370,676 | ||||||
IWH UK Midco Limited, 2017 Term Loan B (EUR), 4.00%, 11/28/2024 | 2,000,000 | 2,414,446 | ||||||
| 4,986,684 | ||||||||
UNITED STATES (0.5%) | ||||||||
Charah, LLC, 2017 Term Loan (USD), 8.21%, 10/25/2024 | 1,308,333 | 1,321,416 | ||||||
Total Bank Loans | 8,421,022 | |||||||
COMMON STOCKS (0.2%) | ||||||||
UNITED KINGDOM (0.2%) | ||||||||
Brighthouse Financial, Inc. | 88,182 | 485,600 | ||||||
Total Common Stocks | 485,600 | |||||||
SHORT-TERM INVESTMENT (3.4%) | ||||||||
UNITED STATES (3.4%) | ||||||||
State Street Institutional U.S. Government Money Market Fund, Institutional Class, 1.28% (i) | 9,410,457 | 9,410,457 | ||||||
Total Short-Term Investment | 9,410,457 | |||||||
Total Investments |
| 276,792,432 | ||||||
Liabilities in Excess of Other Assets—(0.3)% |
| (952,905 | ) | |||||
Net Assets—100.0% |
| $ | 275,839,527 | |||||
| (a) | Denotes a security issued under Regulation S or Rule 144A. |
| (b) | Perpetual bond. This is a bond that has no maturity date, is redeemable and pays a steady stream of interest indefinitely. The maturity date presented for these instruments represents the next call/put date. |
| (c) | Variable or Floating Rate Security. Rate disclosed is as of April 30, 2018. |
| (d) | Payment-in-kind. This is a type of bond that pays interest in additional bonds rather than in cash. |
| (e) | The Fund’s adviser has deemed this security to be illiquid based upon procedures approved by the Board of Trustees. Illiquid securities held by the Fund represent 0.78% of net assets as of April 30, 2018. |
| (f) | Security is in default. |
| (g) | This security was fair valued by the Fund’s pricing committee as approved by the Fund’s Board of Trustees. See Note 1(a) of the accompanying Notes to Statements of Investments. |
| (h) | Sinkable security. |
| (i) | Registered investment company advised by State Street Global Advisors. The rate shown is the 7 day yield as of April 30, 2018. |
| (j) | See accompanying Notes to Financial Statements for tax unrealized appreciation/(depreciation) of securities. |
| EUR | Euro Currency |
| GBP | British Pound Sterling |
| PIK | Payment In Kind |
| PLC | Public Limited Company |
| USD | U.S. Dollar |
See accompanying Notes to Financial Statements.
| 36 | Semi-Annual Report 2018 |
Statement of Investments (concluded)
April 30, 2018 (Unaudited)
Aberdeen Global High Income Fund
At April 30, 2018, the Fund’s open forward foreign currency exchange contracts were as follows:
| Purchase Contracts Settlement Date* | Counterparty | Amount Purchased | Amount Sold | Fair Value | Unrealized Depreciation | |||||||||||||||||||||||
| British Pound/United States Dollar | ||||||||||||||||||||||||||||
06/01/2018 | HSBC Bank USA | GBP | 792,000 | USD | 1,109,189 | $ | 1,091,785 | $ | (17,404 | ) | ||||||||||||||||||
06/01/2018 | JPMorgan Chase Bank N.A. | GBP | 160,000 | USD | 228,103 | 220,563 | (7,540 | ) | ||||||||||||||||||||
06/01/2018 | UBS AG | GBP | 1,571,500 | USD | 2,207,541 | 2,166,339 | (41,202 | ) | ||||||||||||||||||||
| Euro/United States Dollar | ||||||||||||||||||||||||||||
05/14/2018 | Goldman Sachs & Co. | EUR | 234,000 | USD | 284,709 | 282,798 | (1,911 | ) | ||||||||||||||||||||
05/14/2018 | HSBC Bank USA | EUR | 2,413,000 | USD | 3,015,115 | 2,916,198 | (98,917 | ) | ||||||||||||||||||||
| 05/14/2018 | JPMorgan Chase Bank N.A. | EUR | 61,000 | USD | 75,805 | 73,721 | (2,084 | ) | ||||||||||||||||||||
| $ | 6,751,404 | $ | (169,058 | ) | ||||||||||||||||||||||||
| Sale Contracts Settlement Date* | Counterparty | Amount Purchased | Amount Sold | Fair Value | Unrealized Appreciation | |||||||||||||||||||||||
| United States Dollar/British Pound | ||||||||||||||||||||||||||||
06/01/2018 | Citibank N.A. | USD | 32,618,637 | GBP | 23,354,500 | $ | 32,194,572 | $ | 424,065 | |||||||||||||||||||
| United States Dollar/Euro | ||||||||||||||||||||||||||||
05/14/2018 | Goldman Sachs & Co. | USD | 62,879 | EUR | 50,500 | 61,031 | 1,848 | |||||||||||||||||||||
05/14/2018 | JPMorgan Chase Bank N.A. | USD | 3,362,533 | EUR | 2,724,000 | 3,292,053 | 70,480 | |||||||||||||||||||||
05/14/2018 | Royal Bank of Canada | USD | 38,674,923 | EUR | 31,336,000 | 37,870,695 | 804,228 | |||||||||||||||||||||
05/14/2018 | UBS AG | USD | 126,612 | EUR | 102,500 | 123,875 | 2,737 | |||||||||||||||||||||
| 05/14/2018 | Westpac Banking Corp. | USD | 283,981 | EUR | 232,000 | 280,380 | 3,601 | |||||||||||||||||||||
| $ | 73,822,606 | $ | 1,306,959 | |||||||||||||||||||||||||
| * | Certain contracts with different trade dates and like characteristics have been shown net. |
See accompanying Notes to Financial Statements.
| 2018 Semi-Annual Report | 37 |
Statements of Assets and Liabilities (Unaudited)
April 30, 2018
| Aberdeen Select International Equity Fund | Aberdeen Select International Equity Fund II | Aberdeen Total Return Bond Fund | Aberdeen Global High Income Fund | |||||||||||||
Assets: | ||||||||||||||||
Investments in securities, at fair value | $ | 196,087,930 | $ | 81,656,781 | $ | 281,374,149 | $ | 267,381,975 | ||||||||
Short-term investments | 3,341,314 | 1,125,812 | 944,823 | 9,410,457 | ||||||||||||
Cash collateral pledged for futures | – | – | 405,138 | – | ||||||||||||
Foreign currency, at fair value | 117,620 | 63,126 | 96,123 | 94,739 | ||||||||||||
Cash | – | – | – | 4,359 | ||||||||||||
Cash collateral pledged for swaps | – | – | – | 19 | ||||||||||||
Cash at broker for forward foreign currency contracts | – | – | 470,000 | – | ||||||||||||
Interest and dividends receivable | 679,255 | 281,495 | 1,716,301 | 4,673,512 | ||||||||||||
Receivable for investments sold | 771,839 | 376,040 | 904,226 | 2,688,038 | ||||||||||||
Unrealized appreciation on forward foreign currency exchange contracts | – | – | 2,149,118 | 1,306,959 | ||||||||||||
Receivable for capital shares issued | 2,105 | 5,874 | 113,227 | 42,477 | ||||||||||||
Variation margin receivable for futures contracts | – | – | 215,055 | – | ||||||||||||
Tax reclaim receivable | 498,865 | 225,011 | – | – | ||||||||||||
Prepaid expenses | 19,722 | 8,590 | 26,776 | 30,824 | ||||||||||||
|
|
|
|
|
|
|
| |||||||||
Total assets | 201,518,650 | 83,742,729 | 288,414,936 | 285,633,359 | ||||||||||||
|
|
|
|
|
|
|
| |||||||||
Liabilities: | ||||||||||||||||
Due to custodian | – | – | 468,014 | – | ||||||||||||
Payable for investments purchased | 1,579,357 | 619,764 | 348,243 | 9,059,433 | ||||||||||||
Unrealized depreciation on forward foreign currency exchange contracts | – | – | 2,051,159 | 169,058 | ||||||||||||
Cash to broker for forward foreign currency contracts | – | – | 70,000 | – | ||||||||||||
Distributions payable | 287 | – | – | 107 | ||||||||||||
Payable for capital shares redeemed | 285,954 | 102,722 | 262,900 | 205,558 | ||||||||||||
Payable for income taxes (See note 2g of the Notes to Financial Statements) | 7,353,252 | 1,928,092 | – | – | ||||||||||||
Accrued expenses and other payables: | ||||||||||||||||
Investment advisory fees | 142,960 | 60,123 | 47,919 | 95,463 | ||||||||||||
Custodian fees | 44,943 | 31,349 | 56,617 | 78,638 | ||||||||||||
Legal fees | 38,896 | 16,850 | 40,193 | 47,004 | ||||||||||||
Audit fees | 44,465 | 41,973 | 28,108 | 27,782 | ||||||||||||
Distribution fees | 33,012 | 9,236 | 11,200 | 33,810 | ||||||||||||
Transfer agent fees | 4,940 | 2,997 | 3,332 | 4,487 | ||||||||||||
Other | 45,522 | 62,848 | 72,148 | 72,492 | ||||||||||||
|
|
|
|
|
|
|
| |||||||||
Total liabilities | 9,573,588 | 2,875,954 | 3,459,833 | 9,793,832 | ||||||||||||
|
|
|
|
|
|
|
| �� | ||||||||
Net Assets | $ | 191,945,062 | $ | 80,866,775 | $ | 284,955,103 | $ | 275,839,527 | ||||||||
|
|
|
|
|
|
|
| |||||||||
Cost: | ||||||||||||||||
Investments in securities, at cost | $ | 215,467,026 | $ | 80,815,347 | $ | 286,447,194 | $ | 270,033,227 | ||||||||
Short-term investment | 3,341,314 | 1,125,812 | 944,823 | 9,410,457 | ||||||||||||
Foreign currency | 1,758,575 | 63,324 | 84,720 | 95,345 | ||||||||||||
Net Assets Consist of: | ||||||||||||||||
Par value | $ | 7,084 | $ | 6,915 | $ | 22,568 | $ | 31,417 | ||||||||
Paid in capital in excess of par value | 604,606,811 | 222,985,972 | 292,558,725 | 500,973,193 | ||||||||||||
Accumulated net investment income/(loss) | (771,390 | ) | (312,669 | ) | (967,912 | ) | 2,579,481 | |||||||||
Accumulated net realized loss from investments and foreign currency transactions | (391,044,201 | ) | (142,747,046 | ) | (1,388,376 | ) | (225,979,354 | ) | ||||||||
Net unrealized appreciation/(depreciation) on investments and translation of assets and liabilities denominated in foreign currencies | (20,853,242 | ) | 933,603 | (5,269,902 | ) | (1,765,210 | ) | |||||||||
|
|
|
|
|
|
|
| |||||||||
Net Assets | $ | 191,945,062 | $ | 80,866,775 | $ | 284,955,103 | $ | 275,839,527 | ||||||||
|
|
|
|
|
|
|
| |||||||||
Net Assets | ||||||||||||||||
Class A Shares | $ | 158,702,901 | $ | 44,431,678 | $ | 53,820,407 | $ | 163,579,278 | ||||||||
Institutional Class Shares | 33,242,161 | 36,435,097 | 231,134,696 | 112,260,249 | ||||||||||||
|
|
|
|
|
|
|
| |||||||||
Total | $ | 191,945,062 | $ | 80,866,775 | $ | 284,955,103 | $ | 275,839,527 | ||||||||
|
|
|
|
|
|
|
| |||||||||
Shares Outstanding | ||||||||||||||||
Class A Shares | 5,882,461 | 3,798,633 | 4,210,856 | 18,124,718 | ||||||||||||
Institutional Class Shares | 1,201,554 | 3,116,700 | 18,357,632 | 13,291,796 | ||||||||||||
|
|
|
|
|
|
|
| |||||||||
Total | 7,084,015 | 6,915,333 | 22,568,488 | 31,416,514 | ||||||||||||
|
|
|
|
|
|
|
| |||||||||
Net asset value and redemption price per share | ||||||||||||||||
Class A Shares | $ | 26.98 | $ | 11.70 | $ | 12.78 | $ | 9.03 | ||||||||
Institutional Class Shares | $ | 27.67 | $ | 11.69 | $ | 12.59 | $ | 8.45 | ||||||||
Amounts listed as “–” are $0 or round to $0.
See accompanying Notes to Financial Statements.
| 38 | Semi-Annual Report 2018 |
Statements of Operations (Unaudited)
For the Six-Month Period Ended April 30, 2018
| Aberdeen Select International Equity Fund | Aberdeen Select International Equity Fund II | Aberdeen Total Return Bond Fund | Aberdeen Global High Income Fund | |||||||||||||
INVESTMENT INCOME: | ||||||||||||||||
Dividend income | $ | 2,677,460 | $ | 1,123,569 | $ | – | $ | – | ||||||||
Interest income | 613,390 | 6,132 | 4,786,817 | 10,671,940 | ||||||||||||
Foreign tax withholding | (234,471 | ) | (98,257 | ) | (7,711 | ) | – | |||||||||
Other income | 10 | – | 4,785 | 10 | ||||||||||||
|
|
|
|
|
|
|
| |||||||||
Total Income | 3,056,389 | 1,031,444 | 4,783,891 | 10,671,950 | ||||||||||||
|
|
|
|
|
|
|
| |||||||||
EXPENSES: | ||||||||||||||||
Investment advisory fees | 915,642 | 392,541 | 522,017 | 1,064,750 | ||||||||||||
Distribution fees Class A | 211,285 | 58,976 | 71,844 | 220,240 | ||||||||||||
Income taxes on recovered refunds(a) | 1,813,354 | 390,711 | – | – | ||||||||||||
Transfer agent fees | 15,961 | 12,938 | 13,705 | 20,710 | ||||||||||||
Trustee fees | 57,449 | 25,132 | 90,835 | 104,842 | ||||||||||||
Legal fees | 33,391 | 14,344 | 53,638 | 58,361 | ||||||||||||
Printing fees | 30,397 | 21,092 | 22,504 | 33,566 | ||||||||||||
Custodian fees | 63,871 | 45,371 | 83,694 | 109,795 | ||||||||||||
Registration and filing fees | 22,480 | 20,381 | 21,530 | 20,997 | ||||||||||||
Audit fees | 41,248 | 38,774 | 24,208 | 24,455 | ||||||||||||
Other | 51,263 | 42,647 | 47,164 | 94,215 | ||||||||||||
|
|
|
|
|
|
|
| |||||||||
Total expenses before reimbursed/waived expenses | 3,256,341 | 1,062,907 | 951,139 | 1,751,931 | ||||||||||||
Interest expense(b) | 369 | 787 | 326 | 1,163 | ||||||||||||
|
|
|
|
|
|
|
| |||||||||
Total operating expenses before reimbursed/waived expenses | 3,256,710 | 1,063,694 | 951,465 | 1,753,094 | ||||||||||||
Expenses reimbursed(c) | – | – | (215,588 | ) | (294,943 | ) | ||||||||||
Expenses waived by investment adviser(c) | (5,087 | ) | (2,181 | ) | (7,457 | ) | (8,190 | ) | ||||||||
|
|
|
|
|
|
|
| |||||||||
Total operating expenses | 3,251,623 | 1,061,513 | 728,420 | 1,449,961 | ||||||||||||
|
|
|
|
|
|
|
| |||||||||
Net Investment Income/(Loss) | (195,234 | ) | (30,069 | ) | 4,055,471 | 9,221,989 | ||||||||||
|
|
|
|
|
|
|
| |||||||||
Realized gain/(loss) on investment transactions | (1,428,042 | ) | 2,822,417 | (1,380,165 | ) | 1,916,244 | ||||||||||
Realized gain on futures contracts | – | – | (255,404 | ) | – | |||||||||||
Written options | – | – | (8,455 | ) | – | |||||||||||
Realized gain on credit default swap contracts | – | – | – | (347 | ) | |||||||||||
Realized gain/(loss) on forward foreign currency exchange contracts | – | – | 609,363 | (4,179,762 | ) | |||||||||||
Realized gain/(loss) on foreign currency transactions | (595,874 | ) | (5,915 | ) | (15,953 | ) | 149,912 | |||||||||
|
|
|
|
|
|
|
| |||||||||
Net realized gain/(loss) from investments and foreign currency transactions | (2,023,916 | ) | 2,816,502 | (1,050,614 | ) | (2,113,953 | ) | |||||||||
|
|
|
|
|
|
|
| |||||||||
Net change in unrealized appreciation/(depreciation) on investment transactions | 3,409,112 | (2,149,473 | ) | (6,266,181 | ) | (9,123,754 | ) | |||||||||
Net change in unrealized appreciation/(depreciation) on futures contracts | – | – | (336,524 | ) | – | |||||||||||
Net change in unrealized appreciation/(depreciation) on forward foreign currency exchange rate contracts | – | – | (1,239,647 | ) | 1,540,021 | |||||||||||
Net change in unrealized appreciation/(depreciation) on translation of assets and liabilities denominated in foreign currencies | 172,015 | 92,731 | 21,847 | (259,927 | ) | |||||||||||
|
|
|
|
|
|
|
| |||||||||
Net change in unrealized appreciation/(depreciation) from investments and translation of assets and liabilities denominated in foreign currencies | 3,581,127 | (2,056,742 | ) | (7,820,505 | ) | (7,843,660 | ) | |||||||||
|
|
|
|
|
|
|
| |||||||||
Net realized/unrealized gain/(loss) from investments and foreign currency transactions | 1,557,211 | 759,760 | (8,871,119 | ) | (9,957,613 | ) | ||||||||||
|
|
|
|
|
|
|
| |||||||||
CHANGE IN NET ASSETS RESULTING FROM OPERATIONS | $ | 1,361,977 | $ | 729,691 | $ | (4,815,648 | ) | $ | (735,624 | ) | ||||||
|
|
|
|
|
|
|
| |||||||||
| (a) | See Note 2g of the Notes to Financial Statements for additional information. |
| (b) | See Note 11 of the Notes to Financial Statement for additional information. |
| (c) | See Note 3 of the Notes to Financial Statement for additional information. |
Amounts listed as “–” are $0 or round to $0.
See accompanying Notes to Financial Statements.
| 2018 Semi-Annual Report | 39 |
Statements of Changes in Net Assets
| Aberdeen Select International Equity Fund | Aberdeen Select International Equity Fund II | |||||||||||||||
| Six-Month Period Ended April 30, 2018 (Unaudited) | Year Ended October 31, 2017 | Six-Month Period Ended April 30, 2018 (Unaudited) | Year Ended October 31, 2017 | |||||||||||||
FROM INVESTMENT ACTIVITIES: | ||||||||||||||||
Operations: | ||||||||||||||||
Net investment income/(loss) | $ | (195,234 | ) | $ | 15,120,451 | $ | (30,069 | ) | $ | 3,923,361 | ||||||
Net realized gain/(loss) from investments and foreign currency transactions | (2,023,916 | ) | (753,987 | ) | 2,816,502 | (892,977 | ) | |||||||||
Net change in unrealized appreciation/(depreciation) on investments and translation of assets and liabilities denominated in foreign currencies | 3,581,127 | 37,155,178 | (2,056,742 | ) | 17,213,463 | |||||||||||
|
|
|
|
|
|
|
| |||||||||
Changes in net assets resulting from operations | 1,361,977 | 51,521,642 | 729,691 | 20,243,847 | ||||||||||||
|
|
|
|
|
|
|
| |||||||||
Distributions to Shareholders From: | ||||||||||||||||
Net investment income: | ||||||||||||||||
Class A | (7,244,558 | ) | (1,729,501 | ) | (1,331,276 | ) | (794,000 | ) | ||||||||
Institutional Class | (1,514,185 | ) | (384,167 | ) | (1,222,394 | ) | (804,604 | ) | ||||||||
|
|
|
|
|
|
|
| |||||||||
Change in net assets from shareholder distributions | (8,758,743 | ) | (2,113,668 | ) | (2,553,670 | ) | (1,598,604 | ) | ||||||||
|
|
|
|
|
|
|
| |||||||||
Common Stock Transactions: | ||||||||||||||||
Change in net assets from capital transactions | (13,318,863 | ) | (50,934,914 | ) | (11,330,938 | ) | (28.203.733 | ) | ||||||||
|
|
|
|
|
|
|
| |||||||||
Change in net assets | (20,715,629 | ) | (1,526,940 | ) | (13,154,917 | ) | (9,558,490 | ) | ||||||||
|
|
|
|
|
|
|
| |||||||||
Net Assets: | ||||||||||||||||
Beginning of period | 212,660,691 | 214,187,631 | 94,021,692 | 103,580,182 | ||||||||||||
|
|
|
|
|
|
|
| |||||||||
End of period | $ | 191,945,062 | $ | 212,660,691 | $ | 80,866,775 | $ | 94,021,692 | ||||||||
|
|
|
|
|
|
|
| |||||||||
Accumulated net investment income/(loss) at end of period | $ | (771,390 | ) | $ | 8,182,587 | $ | (312,669 | ) | $ | 2,271,070 | ||||||
|
|
|
|
|
|
|
| |||||||||
CAPITAL TRANSACTIONS: | ||||||||||||||||
Class A Shares | ||||||||||||||||
Proceeds from shares issued | $ | 1,488,162 | $ | 7,176,305 | $ | 628,309 | $ | 2,613,795 | ||||||||
Dividends reinvested | 7,041,129 | 1,674,291 | 1,297,934 | 767,912 | ||||||||||||
Cost of shares redeemed | (21,050,874 | ) | (54,675,238 | ) | (5,899,437 | ) | (23,223,934 | ) | ||||||||
|
|
|
|
|
|
|
| |||||||||
Total Class A | (12,521,583 | ) | (45,824,642 | ) | (3,973,194 | ) | (19,842,227 | ) | ||||||||
|
|
|
|
|
|
|
| |||||||||
Institutional Class Shares | ||||||||||||||||
Proceeds from shares issued | 575,033 | 12,287,211 | 772,008 | 3,231,423 | ||||||||||||
Dividends reinvested | 1,461,156 | 369,916 | 1,088,727 | 716,120 | ||||||||||||
Cost of shares redeemed | (2,833,469 | ) | (17,767,399 | ) | (9,218,479 | ) | (12,309,049 | ) | ||||||||
|
|
|
|
|
|
|
| |||||||||
Total Institutional Class | (797,280 | ) | (5,110,272 | ) | (7,357,744 | ) | (8,361,506 | ) | ||||||||
|
|
|
|
|
|
|
| |||||||||
Change in net assets from capital transactions: | $ | (13,318,863 | ) | $ | (50,934,914 | ) | $ | (11,330,938 | ) | $ | (28,203,733 | ) | ||||
|
|
|
|
|
|
|
| |||||||||
SHARE TRANSACTIONS: | ||||||||||||||||
Class A Shares | ||||||||||||||||
Issued | 53,569 | 282,021 | 52,538 | 242,700 | ||||||||||||
Reinvested | 260,590 | 77,802 | 110,651 | 81,867 | ||||||||||||
Redeemed | (762,758 | ) | (2,208,424 | ) | (495,526 | ) | (2,257,994 | ) | ||||||||
|
|
|
|
|
|
|
| |||||||||
Total Class A Shares | (448,599 | ) | (1,848,601 | ) | (332,337 | ) | (1,933,427 | ) | ||||||||
|
|
|
|
|
|
|
| |||||||||
Institutional Class Shares | ||||||||||||||||
Issued | 20,301 | 473,495 | 64,711 | 297,315 | ||||||||||||
Reinvested | 52,768 | 16,792 | 92,895 | 76,427 | ||||||||||||
Redeemed | (100,705 | ) | (666,446 | ) | (774,856 | ) | (1,146,114 | ) | ||||||||
|
|
|
|
|
|
|
| |||||||||
Total Institutional Class Shares | (27,636 | ) | (176,159 | ) | (617,250 | ) | (772,372 | ) | ||||||||
|
|
|
|
|
|
|
| |||||||||
Total change in shares: | (476,235 | ) | (2,024,760 | ) | (949,587 | ) | (2,705,799 | ) | ||||||||
|
|
|
|
|
|
|
| |||||||||
Amounts listed as “–” are $0 or round to $0.
See accompanying Notes to Financial Statements.
| 40 | Semi-Annual Report 2018 |
Statements of Changes in Net Assets (continued)
| Aberdeen Total Return Bond Fund | Aberdeen Global High Income Fund | |||||||||||||||
| Six-Month Period Ended April 30, 2018 (Unaudited) | Year Ended October 31, 2017 | Six-Month Period Ended April 30, 2018 (Unaudited) | Year Ended October 31, 2017 | |||||||||||||
FROM INVESTMENT ACTIVITIES: | ||||||||||||||||
Operations: | ||||||||||||||||
Net investment income | $ | 4,055,471 | $ | 10,627,122 | $ | 9,221,989 | $ | 25,542,545 | ||||||||
Net realized gain/(loss) from investments and foreign currency transactions | (1,050,614 | ) | 2,026,752 | (2,113,953 | ) | (18,222,953 | ) | |||||||||
Net change in unrealized appreciation/(depreciation) on investments and translation of assets and liabilities denominated in foreign currencies | (7,820,505 | ) | (9,877,747 | ) | (7,843,660 | ) | 35,412,922 | |||||||||
|
|
|
|
|
|
|
| |||||||||
Changes in net assets resulting from operations | (4,815,648 | ) | 2,776,127 | (735,624 | ) | 42,732,514 | ||||||||||
|
|
|
|
|
|
|
| |||||||||
Distributions to Shareholders From: | ||||||||||||||||
Net investment income: | ||||||||||||||||
Class A | (1,132,186 | ) | (856,565 | ) | (3,579,033 | ) | (9,732,798 | ) | ||||||||
Institutional Class | (5,132,136 | ) | (5,137,062 | ) | (3,465,598 | ) | (13,130,842 | ) | ||||||||
Net realized gains: | ||||||||||||||||
Class A | (317,044 | ) | (2,234,881 | ) | – | – | ||||||||||
Institutional Class | (1,321,051 | ) | (14,581,517 | ) | – | – | ||||||||||
Tax return of capital: | ||||||||||||||||
Class A | – | – | – | (804,998 | ) | |||||||||||
Institutional Class | – | – | – | (951,720 | ) | |||||||||||
|
|
|
|
|
|
|
| |||||||||
Change in net assets from shareholder distributions | (7,902,417 | ) | (22,810,025 | ) | (7,044,631 | ) | (24,620,358 | ) | ||||||||
|
|
|
|
|
|
|
| |||||||||
Common Stock Transactions: | ||||||||||||||||
Change in net assets from capital transactions | (18,101,274 | ) | (183,768,674 | ) | (105,568,648 | ) | (213,758,294 | ) | ||||||||
|
|
|
|
|
|
|
| |||||||||
Change in net assets | (30,819,339 | ) | (203,802,572 | ) | (113,348,903 | ) | (195,646,138 | ) | ||||||||
|
|
|
|
|
|
|
| |||||||||
Net Assets: | ||||||||||||||||
Beginning of period | 315,774,442 | 519,577,014 | 389,188,430 | 584,834,568 | ||||||||||||
|
|
|
|
|
|
|
| |||||||||
End of period | $ | 284,955,103 | $ | 315,774,442 | $ | 275,839,527 | $ | 389,188,430 | ||||||||
|
|
|
|
|
|
|
| |||||||||
Accumulated net investment income/(loss) at end of period | $ | (967,912 | ) | $ | 1,240,939 | $ | 2,579,481 | $ | 402,123 | |||||||
|
|
|
|
|
|
|
| |||||||||
CAPITAL TRANSACTIONS: | ||||||||||||||||
Class A Shares | ||||||||||||||||
Proceeds from shares issued | $ | 4,162,922 | $ | 15,274,583 | $ | 30,101,060 | $ | 53,455,321 | ||||||||
Dividends reinvested | 1,355,467 | 2,885,508 | 3,450,686 | 10,134,195 | ||||||||||||
Cost of shares redeemed | (11,840,315 | ) | (18,528,123 | ) | (51,546,553 | ) | (120,391,587 | ) | ||||||||
|
|
|
|
|
|
|
| |||||||||
Total Class A | (6,321,926 | ) | (368,032 | ) | (17,994,807 | ) | (56,802,071 | ) | ||||||||
|
|
|
|
|
|
|
| |||||||||
Institutional Class Shares | ||||||||||||||||
Proceeds from shares issued | 22,121,964 | 58,714,536 | 23,286,934 | 59,736,716 | ||||||||||||
Dividends reinvested | 6,001,953 | 17,967,234 | 2,172,508 | 7,881,677 | ||||||||||||
Cost of shares redeemed | (39,903,265 | ) | (260,082,412 | ) | (113,033,283 | ) | (224,574,616 | ) | ||||||||
|
|
|
|
|
|
|
| |||||||||
Total Institutional Class | (11,779,348 | ) | (183,400,642 | ) | (87,573,841 | ) | (156,956,223 | ) | ||||||||
|
|
|
|
|
|
|
| |||||||||
Change in net assets from capital transactions: | $ | (18,101,274 | ) | $ | (183,768,674 | ) | $ | (105,568,648 | ) | $ | (213,758,294 | ) | ||||
|
|
|
|
|
|
|
| |||||||||
| 2018 Semi-Annual Report | 41 |
Statements of Changes in Net Assets (concluded)
| Aberdeen Total Return Bond Fund | Aberdeen Global High Income Fund | |||||||||||||||
| Six-Month Period Ended April 30, 2018 (Unaudited) | Year Ended October 31, 2017 | Six-Month Period Ended April 30, 2018 (Unaudited) | Year Ended October 31, 2017 | |||||||||||||
SHARE TRANSACTIONS: | ||||||||||||||||
Class A Shares | ||||||||||||||||
Issued | 317,914 | 1,150,715 | 3,279,192 | 5,969,227 | ||||||||||||
Reinvested | 103,368 | 221,027 | 379,046 | 1,141,452 | ||||||||||||
Redeemed | (902,908 | ) | (1,396,949 | ) | (5,642,521 | ) | (13,523,934 | ) | ||||||||
|
|
|
|
|
|
|
| |||||||||
Total Class A Shares | (481,626 | ) | (25,207 | ) | (1,984,283 | ) | (6,413,255 | ) | ||||||||
|
|
|
|
|
|
|
| |||||||||
Institutional Class Shares | ||||||||||||||||
Issued | 1,718,319 | 4,494,195 | 2,723,649 | 7,080,491 | ||||||||||||
Reinvested | 464,727 | 1,396,806 | 254,780 | 946,727 | ||||||||||||
Redeemed | (3,098,363 | ) | (19,924,605 | ) | (13,217,268 | ) | (26,954,236 | ) | ||||||||
|
|
|
|
|
|
|
| |||||||||
Total Institutional Class Shares | (915,317 | ) | (14,033,604 | ) | (10,238,839 | ) | (18,927,018 | ) | ||||||||
|
|
|
|
|
|
|
| |||||||||
Total change in shares: | (1,396,943 | ) | (14,058,811 | ) | (12,223,122 | ) | (25,340,273 | ) | ||||||||
|
|
|
|
|
|
|
| |||||||||
Amounts listed as “–” are $0 or round to $0.
See accompanying Notes to Financial Statements.
| 42 | Semi-Annual Report 2018 |
This page intentionally left blank.
Financial Highlights
Selected Data for Each Share of Capital Outstanding Throughout the Periods Indicated
Aberdeen Select International Equity Fund
| Investment Activities | Distributions | |||||||||||||||||||||||||||||||
| Net Asset Value, Beginning of Period | Net Investment Income (Loss) (a) | Net Realized and Unrealized Gains (Losses) on Investments | Total from Investment Activities | Net Investment Income | Tax Return of Capital | Total Distributions | Net Asset Value, End of Period | |||||||||||||||||||||||||
Class A Shares | ||||||||||||||||||||||||||||||||
Six Months Ended April 30, 2018* | $ | 28.01 | $ | (0.03 | ) | $ | 0.18 | $ | 0.15 | $ | (1.18 | ) | $ | – | $ | (1.18 | ) | $ | 26.98 | |||||||||||||
Year Ended October 31, 2017 | 22.26 | 1.75 | (g) | 4.22 | 5.97 | (0.22 | ) | – | (0.22 | ) | 28.01 | |||||||||||||||||||||
Year Ended October 31, 2016 | 22.82 | 0.45 | (h) | (0.29 | ) | 0.16 | (0.72 | ) | – | (0.72 | ) | 22.26 | ||||||||||||||||||||
Year Ended October 31, 2015 | 28.00 | 0.62 | (j) | (4.60 | ) | (3.98 | ) | (1.20 | ) | – | (1.20 | ) | 22.82 | |||||||||||||||||||
Year Ended October 31, 2014 | 28.63 | 1.09 | (1.12 | ) | (0.03 | ) | (0.60 | ) | – | (0.60 | ) | 28.00 | ||||||||||||||||||||
Year Ended October 31, 2013 | 23.84 | 0.37 | 4.55 | 4.92 | (0.13 | ) | – | (0.13 | ) | 28.63 | ||||||||||||||||||||||
Institutional Class Shares | ||||||||||||||||||||||||||||||||
Six Months Ended April 30, 2018* | 28.73 | 0.01 | 0.18 | 0.19 | (1.25 | ) | – | (1.25 | ) | 27.67 | ||||||||||||||||||||||
Year Ended October 31, 2017 | 22.84 | 1.72 | (g) | 4.46 | 6.18 | (0.29 | ) | – | (0.29 | ) | 28.73 | |||||||||||||||||||||
Year Ended October 31, 2016 | 23.40 | 0.51 | (h) | (0.28 | ) | 0.23 | (0.79 | ) | – | (0.79 | ) | 22.84 | ||||||||||||||||||||
Year Ended October 31, 2015 | 28.69 | 0.67 | (j) | (4.68 | ) | (4.01 | ) | (1.28 | ) | – | (1.28 | ) | 23.40 | |||||||||||||||||||
Year Ended October 31, 2014 | 29.33 | 1.19 | (1.16 | ) | 0.03 | (0.67 | ) | – | (0.67 | ) | 28.69 | |||||||||||||||||||||
Year Ended October 31, 2013 | 24.44 | 0.31 | 4.80 | 5.11 | (0.22 | ) | – | (0.22 | ) | 29.33 | ||||||||||||||||||||||
| * | Unaudited |
| (a) | Net investment income/(loss) is based on average shares outstanding during the period. |
| (b) | Not annualized for periods less than one year. |
| (c) | Includes interest expense that amounts to less than 0.01%. |
| (d) | Annualized for periods less than one year. |
| (e) | During the period, certain fees were waived and/or reimbursed. If such waivers/reimbursements had not occurred, the ratios would have been as indicated. |
| (f) | Portfolio turnover is calculated on the basis of the Fund as a whole without distinguishing among the classes of shares. |
| (g) | Included within Net Investment Income per share, Total Return, and Ratio of Net Investment Income to Average Net Assets are the effects of withholding tax refunds (Note 2g of the Notes to Financial Statements). If such amounts were excluded, the Net Investment Loss per share, Total Return, and Ratio of Net Investment Loss to Average Net Assets for Class A Shares would have been $(0.14), 20.27%, and (0.55)%, respectively. For Institutional Class Shares, these amounts would have been $(0.24), 20.55%, and (0.92)%, respectively. |
Amounts listed as “–” are $0 or round to $0.
See accompanying Notes to Financial Statements.
| 44 | Semi-Annual Report 2018 |
Financial Highlights (continued)
Selected Data for Each Share of Capital Outstanding Throughout the Periods Indicated
Aberdeen Select International Equity Fund (concluded)
| Ratios/Supplemental Data | ||||||||||||||||||||||||||
| Total Return (b) | Net Assets at End of Period (000’s) | Ratio of Expenses (Net of Reimbursement/ Waivers and Excluding Accruals for Estimated Tax Due on Foreign Tax Refund Recoveries) to Average Net Assets | Ratio of Expenses (Net of Reimbursements/ Waivers) to Average Net Assets (c)(d) | Ratio of Expenses (Prior to Reimbursements) to Average Net Assets (c)(d)(e) | Ratio of Net Investment Income (Loss) to Average Net Assets (d) | Portfolio Turnover (b)(f) | ||||||||||||||||||||
| 0.52 | % | $ | 158,703 | 1.46 | % | 2.34 | % | 2.34 | % | (0.24 | %) | 9 | % | |||||||||||||
| 27.14 | %(g) | 177,342 | 1.42 | % | 3.93 | % | 3.93 | % | 7.02 | %(g) | 18 | % | ||||||||||||||
| 0.99 | %(h)(i) | 182,094 | 1.35 | % | 1.42 | % | 1.42 | % | 2.08 | %(h) | 23 | % | ||||||||||||||
| (14.62 | %)(j) | 242,444 | 1.28 | % | 1.28 | % | 1.28 | % | 2.47 | %(j) | 11 | % | ||||||||||||||
| (0.04 | %) | 397,911 | 1.26 | % | 1.26 | % | 1.26 | % | 3.83 | % | 12 | % | ||||||||||||||
| 20.70 | % | 554,922 | 1.25 | % | 1.25 | % | 1.26 | % | 1.39 | % | 94 | % | ||||||||||||||
| 0.66 | % | 33,242 | 1.21 | % | 2.08 | % | 2.08 | % | 0.07 | % | 9 | % | ||||||||||||||
| 27.42 | %(g) | 35,318 | 1.17 | % | 3.46 | % | 3.46 | % | 6.65 | %(g) | 18 | % | ||||||||||||||
| 1.30 | %(h)(i) | 32,094 | 1.10 | % | 1.17 | % | 1.17 | % | 2.31 | %(h) | 23 | % | ||||||||||||||
| (14.40 | %)(j) | 43,633 | 1.04 | % | 1.04 | % | 1.04 | % | 2.56 | %(j) | 11 | % | ||||||||||||||
| 0.19 | % | 82,014 | 1.02 | % | 1.02 | % | 1.03 | % | 4.06 | % | 12 | % | ||||||||||||||
| 21.04 | % | 110,893 | 1.03 | % | 1.03 | % | 1.04 | % | 1.15 | % | 94 | % | ||||||||||||||
| (h) | Included within Net Investment Income per share, Total Return, and Ratio of Net Investment Income to Average Net Assets are the effects of a one-time reimbursement for overbilling of prior years’ custodian out-of-pocket fees. If such amounts were excluded, the impact to the Net Investment Income per share, Total Return, and Ratio of Net Investment Income to Average Net Assets for Class A Shares would have been reduced by $0.03, 0.13%, and 0.13%, respectively. For Institutional Class Shares, these amounts would have been reduced by $0.03, 0.13%, and 0.13%, respectively. |
| (i) | Included within Net Realized and Unrealized Gains (Losses) on Investment per share is a payment that was made from affiliate, during the fiscal year ended October 31,2016, which contributed $113,111 to the Select International Equity Fund to correctly record an aged dividend receivable at its net realizable value inclusive of currencyfluctuations. If such payment was excluded, the total return would have been 0.94% for Class A Shares and 1.21% for Institutional Class Shares. |
| (j) | Included within Net Investment Income per share, Total Return, and Ratio of Net Investment Income to Average Net Assets are the effects of withholding tax refunds (Note 2g of the Notes to Financial Statements). If such amounts were excluded, the Net Investment Income per share, Total Return, and Ratio of Net Investment Income to Average Net Assets for Class A Shares would have been $0.53, (15.03%), and 2.11%, respectively. For Institutional Class Shares, these amounts would have been $0.58, (14.80%), and 2.20%, respectively. |
| 2018 Semi-Annual Report | 45 |
Financial Highlights (continued)
Selected Data for Each Share of Capital Outstanding Throughout the Periods Indicated
Aberdeen Select International Equity Fund II
| Investment Activities | Distributions | |||||||||||||||||||||||||||||||
| Net Asset Value, Beginning of Period | Net Investment Income (Loss) (a) | Net | Total from Investment Activities | Net Investment Income | Tax Return of Capital | Total Distributions | Net Asset Value, End of Period | |||||||||||||||||||||||||
Class A Shares | ||||||||||||||||||||||||||||||||
Six Months Ended April 30, 2018* | $ | 11.95 | $ | (0.01 | ) | $ | 0.09 | $ | 0.08 | $ | (0.33 | ) | $ | – | $ | (0.33 | ) | $ | 11.70 | |||||||||||||
Year Ended October 31, 2017 | 9.79 | 0.43 | (g) | 1.89 | 2.32 | (0.16 | ) | – | (0.16 | ) | 11.95 | |||||||||||||||||||||
Year Ended October 31, 2016 | 10.03 | 0.14 | (h) | (0.08 | ) | 0.06 | (0.30 | ) | – | (0.30 | ) | 9.79 | ||||||||||||||||||||
Year Ended October 31, 2015 | 12.23 | 0.21 | (j) | (1.89 | )(k) | (1.68 | ) | (0.52 | ) | – | (0.52 | ) | 10.03 | |||||||||||||||||||
Year Ended October 31, 2014 | 12.18 | 0.42 | (0.36 | ) | 0.06 | (0.01 | ) | – | (0.01 | ) | 12.23 | |||||||||||||||||||||
Year Ended October 31, 2013 | 10.38 | 0.13 | 1.92 | 2.05 | (0.25 | ) | 0.00 | (0.25 | ) | 12.18 | ||||||||||||||||||||||
Institutional Class Shares | ||||||||||||||||||||||||||||||||
Six Months Ended April 30, 2018* | 11.96 | – | (l) | 0.09 | 0.09 | (0.36 | ) | – | (0.36 | ) | 11.69 | |||||||||||||||||||||
Year Ended October 31, 2017 | 9.81 | 0.45 | (g) | 1.88 | 2.33 | (0.18 | ) | – | (0.18 | ) | 11.96 | |||||||||||||||||||||
Year Ended October 31, 2016 | 10.04 | 0.16 | (h) | (0.06 | ) | 0.10 | (0.33 | ) | – | (0.33 | ) | 9.81 | ||||||||||||||||||||
Year Ended October 31, 2015 | 12.25 | 0.24 | (j) | (1.90 | )(k) | (1.66 | ) | (0.55 | ) | – | (0.55 | ) | 10.04 | |||||||||||||||||||
Year Ended October 31, 2014 | 12.20 | 0.46 | (0.38 | ) | 0.08 | (0.03 | ) | – | (0.03 | ) | 12.25 | |||||||||||||||||||||
Year Ended October 31, 2013 | 10.45 | 0.11 | 1.97 | 2.08 | (0.33 | ) | – | (0.33 | ) | 12.20 | ||||||||||||||||||||||
| * | Unaudited |
| (a) | Net investment income/(loss) is based on average shares outstanding during the period. |
| (b) | Not annualized for periods less than one year. |
| (c) | During the period, certain fees were waived and/or reimbursed. If such waivers/reimbursements had not occurred, the ratios would have been as indicated. |
| (d) | Annualized for periods less than one year. |
| (e) | Includes interest expense that amounts to less than 0.01%. |
| (f) | Portfolio turnover is calculated on the basis of the Fund as a whole without distinguishing among the classes of shares. |
| (g) | Included within Net Investment Income per share, Total Return, and Ratio of Net Investment Income to Average Net Assets are the effects of withholding tax refunds (Note 2g of the Notes to Financial Statements). If such amounts were excluded, the Net Investment Loss per share, Total Return, and Ratio of Net Investment Loss to Average Net Assets for Class A Shares would have been $(0.06), 20.03%, and (0.61)%, respectively. For Institutional Class Shares, these amounts would have been $(0.04), 20.24%, and (0.37)%, respectively. |
Amounts listed as “–” are $0 or round to $0.
See accompanying Notes to Financial Statements.
| 46 | Semi-Annual Report 2018 |
Financial Highlights (continued)
Selected Data for Each Share of Capital Outstanding Throughout the Periods Indicated
Aberdeen Select International Equity Fund II (concluded)
| Ratios/Supplemental Data | ||||||||||||||||||||||||||
| Total Return (b) | Net Assets at End of Period (000’s) | Ratio of Expenses (Net of Reimbursement/ Waivers and Excluding Accruals for Estimated Tax Due on Foreign Tax Refund Recoveries) to Average Net Assets | Ratio of Expenses (Net of Reimbursements/ Waivers) to Average Net Assets (c)(d)(e) | Ratio of Expenses (Prior to Reimbursements) to Average Net Assets (d)(c)(e) | Ratio of Net Investment Income (Loss) to Average Net Assets | Portfolio Turnover (b)(f) | ||||||||||||||||||||
| 0.65 | % | $ | 44,432 | 1.65 | % | 2.08 | % | 2.08 | % | (0.14 | %) | 9 | % | |||||||||||||
| 24.10 | %(g) | 49,363 | 1.58 | % | 3.14 | % | 3.15 | % | 3.98 | %(g) | 13 | % | ||||||||||||||
| 0.83 | %(h)(i) | 59,390 | 1.45 | % | 1.49 | % | 1.50 | % | 1.49 | %(h) | 23 | % | ||||||||||||||
| (14.16 | %)(j)(k) | 79,263 | 1.38 | % | 1.38 | % | 1.38 | % | 1.93 | %(j) | 12 | % | ||||||||||||||
| 0.46 | % | 120,387 | 1.32 | % | 1.32 | % | 1.33 | % | 3.41 | % | 11 | % | ||||||||||||||
| 20.00 | % | 168,028 | 1.21 | % | 1.21 | % | 1.23 | % | 1.19 | % | 97 | % | ||||||||||||||
| 0.76 | % | 36,435 | 1.40 | % | 1.86 | % | 1.86 | % | 0.02 | % | 9 | % | ||||||||||||||
| 24.32 | %(g) | 44,659 | 1.33 | % | 2.88 | % | 2.89 | % | 4.22 | %(g) | 13 | % | ||||||||||||||
| 1.25 | %(h)(i) | 44,191 | 1.22 | % | 1.26 | % | 1.27 | % | 1.71 | %(h) | 23 | % | ||||||||||||||
| (13.96 | %)(j)(k) | 69,000 | 1.13 | % | 1.13 | % | 1.13 | % | 2.16 | %(j) | 12 | % | ||||||||||||||
| 0.64 | % | 108,665 | 1.10 | % | 1.10 | % | 1.11 | % | 3.69 | % | 11 | % | ||||||||||||||
| 20.36 | % | 157,876 | 1.04 | % | 1.04 | % | 1.04 | % | 1.02 | % | 97 | % | ||||||||||||||
| (h) | Included within Net Investment Income per share, Total Return, and Ratio of Net Investment Income to Average Net Assets are the effects of a one-time reimbursement for overbilling of prior years’ custodian out-of-pocket fees. If such amounts were excluded, the impact to the Net Investment Income per share, Total Return, and Ratio of Net Investment Income to Average Net Assets for Class A Shares would have been reduced by $0.02, 0.21%, and 0.20%, respectively. For Institutional Class Shares, these amounts would have been by reduced $0.03, 0.31%, and 0.19%, respectively. |
| (i) | Included within Net Realized and Unrealized Gains (Losses) on Investment per share is a payment that was made from affiliate, during the fiscal year ended October 31, 2016, which contributed $127,579 to the Select International Equity Fund II, to correctly record an aged dividend receivable at its net realizable value inclusive ofcurrency fluctuations. If such payment was excluded, the total return would have been 0.73% for Class A Shares and 1.04% for Institutional Class Shares. |
| (j) | Included within Net Investment Income per share, Total Return, and Ratio of Net Investment Income to Average Net Assets are the effects of withholding tax refunds (Note 2g of the Notes to Financial Statements). If such amounts were excluded, the Net Investment Income per share, Total Return, and Ratio of Net Investment Income to Average Net Assets for Class A Shares would have been $0.18, (14.42%), and 1.66%, respectively. For Institutional Class Shares, these amounts would have been $0.21, (14.22%), and 1.89%, respectively. |
| (k) | Included within Net Realized and Unrealized Gains (Losses) on Investment per share is a payment that was made from affiliate, during the fiscal year ended October 31, 2015, which contributed $305,291 to the Select International Equity Fund II, to correctly record an aged dividend receivable at its net realizable value inclusive of currency fluctuations. If such payment was excluded, the total return would have been (14.33%) for Class A Shares and (14.13%) for Institutional Class Shares. |
| (l) | Less than $0.005 per share. |
| 2018 Semi-Annual Report | 47 |
Financial Highlights (continued)
Selected Data for Each Share of Capital Outstanding Throughout the Periods Indicated
Aberdeen Total Return Bond Fund
| Investment Activities | Distributions | |||||||||||||||||||||||||||||||||||
| Net Asset Value, Beginning of Period | Net Investment Income (a) | Net Realized and Unrealized Gains (Losses) on Investments | Total from Investment Activities | Net Investment Income | Net Realized Gains | Tax Return of Capital | Total Distributions | Net Asset Value, End of Period | ||||||||||||||||||||||||||||
Class A Shares | ||||||||||||||||||||||||||||||||||||
Six Months Ended April 30, 2018* | $ | 13.33 | $ | 0.16 | $ | (0.38 | ) | $ | (0.22 | ) | $ | (0.26 | ) | $ | (0.07 | ) | $ | – | $ | (0.33 | ) | $ | 12.78 | |||||||||||||
Year Ended October 31, 2017 | 13.83 | 0.33 | (0.18 | ) | 0.15 | (0.18 | ) | (0.47 | ) | – | (0.65 | ) | 13.33 | |||||||||||||||||||||||
Year Ended October 31, 2016 | 13.32 | 0.34 | 0.32 | 0.66 | (0.15 | ) | – | – | (0.15 | ) | 13.83 | |||||||||||||||||||||||||
Year Ended October 31, 2015 | 13.60 | 0.32 | (0.19 | ) | 0.13 | (0.22 | ) | (0.17 | ) | (0.02 | ) | (0.41 | ) | 13.32 | ||||||||||||||||||||||
Year Ended October 31, 2014 | 13.30 | 0.34 | 0.18 | 0.52 | (0.22 | ) | – | – | (0.22 | ) | 13.60 | |||||||||||||||||||||||||
Year Ended October 31, 2013 | 14.17 | 0.31 | (0.56 | ) | (0.25 | ) | (0.29 | ) | (0.30 | ) | (0.03 | ) | (0.62 | ) | 13.30 | |||||||||||||||||||||
Institutional Class Shares | ||||||||||||||||||||||||||||||||||||
Six Months Ended April 30, 2018* | 13.14 | 0.18 | (0.39 | ) | (0.21 | ) | (0.27 | ) | (0.07 | ) | – | (0.34 | ) | 12.59 | ||||||||||||||||||||||
Year Ended October 31, 2017 | 13.64 | 0.36 | (0.18 | ) | 0.18 | (0.21 | ) | (0.47 | ) | – | (0.68 | ) | 13.14 | |||||||||||||||||||||||
Year Ended October 31, 2016 | 13.14 | 0.36 | 0.33 | 0.69 | (0.19 | ) | – | – | (0.19 | ) | 13.64 | |||||||||||||||||||||||||
Year Ended October 31, 2015 | 13.43 | 0.35 | (0.20 | ) | 0.15 | (0.25 | ) | (0.17 | ) | (0.02 | ) | (0.44 | ) | 13.14 | ||||||||||||||||||||||
Year Ended October 31, 2014 | 13.13 | 0.37 | 0.18 | 0.55 | (0.25 | ) | – | – | (0.25 | ) | 13.43 | |||||||||||||||||||||||||
Year Ended October 31, 2013 | 14.03 | 0.35 | (0.56 | ) | (0.21 | ) | (0.36 | ) | (0.30 | ) | (0.03 | ) | (0.69 | ) | 13.13 | |||||||||||||||||||||
| * | Unaudited |
| (a) | Net investment income/(loss) is based on average shares outstanding during the period. |
| (b) | Not annualized for periods less than one year. |
| (c) | Annualized for periods less than one year. |
| (d) | During the period, certain fees were waived and/or reimbursed. If such waivers/reimbursements had not occurred, the ratios would have been as indicated. |
Amounts listed as “–” are $0 or round to $0.
See accompanying Notes to Financial Statements.
| 48 | Semi-Annual Report 2018 |
Financial Highlights (continued)
Selected Data for Each Share of Capital Outstanding Throughout the Periods Indicated
Aberdeen Total Return Bond Fund (concluded)
| Ratios/Supplemental Data | ||||||||||||||||||||||
| Total Return (b) | Net Assets at End of Period (000’s) | Ratio of Expenses (Net of Reimbursements/ Waivers) to Average Net Assets (c) | Ratio of Expenses (Prior to Reimbursements) to Average Net Assets (c)(d) | Ratio of Net Investment Income to Average Net Assets (c) | Portfolio Turnover (b)(e) | |||||||||||||||||
| (1.71 | %) | $ | 53,820 | 0.69 | % | 0.85 | % | 2.50 | % | 83 | % | ||||||||||
| 1.21 | %(f) | 62,556 | 0.69 | % | 0.76 | % | 2.46 | % | 151 | % | ||||||||||||
| 5.02 | % | 65,242 | 0.69 | % | 0.74 | % | 2.47 | % | 151 | % | ||||||||||||
| 0.91 | % | 75,595 | 0.69 | % | 0.71 | % | 2.37 | % | 102 | % | ||||||||||||
| 3.96 | % | 152,196 | 0.68 | % | 0.69 | % | 2.56 | % | 128 | % | ||||||||||||
| (1.81 | %) | 153,370 | 0.68 | % | 0.70 | % | 2.29 | % | 265 | % | ||||||||||||
| (1.61 | %) | 231,135 | 0.44 | % | 0.59 | % | 2.75 | % | 83 | % | |||||||||||
| 1.50 | %(f) | 253,218 | 0.44 | % | 0.51 | % | 2.71 | % | 151 | % | ||||||||||||
| 5.29 | % | 454,335 | 0.44 | % | 0.47 | % | 2.72 | % | 151 | % | ||||||||||||
| 1.12 | % | 927,387 | 0.44 | % | 0.45 | % | 2.62 | % | 102 | % | ||||||||||||
| 4.25 | % | 1,361,252 | 0.42 | % | 0.43 | % | 2.81 | % | 128 | % | ||||||||||||
| (1.59 | %) | 1,449,776 | 0.42 | % | 0.43 | % | 2.56 | % | 265 | % | ||||||||||||
| (e) | Portfolio turnover is calculated on the basis of the Fund as a whole without distinguishing among the classes of shares. |
| (f) | The total return shown above includes the impact of financial statement rounding of the NAV per share and/or financial statement adjustments. |
| 2018 Semi-Annual Report | 49 |
Financial Highlights (continued)
Selected Data for Each Share of Capital Outstanding Throughout the Periods Indicated
Aberdeen Global High Income Fund
| Investment Activities | Distributions | |||||||||||||||||||||||||||||||||||
| Net Asset Value, Beginning of Period | Net Investment Income (a) | Net Realized and Unrealized Gains (Losses) on Investments | Total from Investment Activities | Net Investment Income | Net Realized Gains | Tax Return of Capital | Total Distributions | Net Asset Value, End of Period | ||||||||||||||||||||||||||||
Class A Shares | ||||||||||||||||||||||||||||||||||||
Six Months Ended April 30, 2018* | $ | 9.23 | $ | 0.25 | $ | (0.27 | ) | $ | (0.02 | ) | $ | (0.18 | ) | $ | – | $ | – | $ | (0.18 | ) | $ | 9.03 | ||||||||||||||
Year Ended October 31, 2017 | 8.80 | 0.52 | 0.38 | 0.90 | (0.43 | ) | – | (0.04 | ) | (0.47 | ) | 9.23 | ||||||||||||||||||||||||
Year Ended October 31, 2016 | 8.98 | 0.49 | (0.33 | ) | 0.16 | (0.34 | ) | – | – | (0.34 | ) | 8.80 | ||||||||||||||||||||||||
Year Ended October 31, 2015 | 10.38 | 0.62 | (1.22 | ) | (0.60 | ) | (0.44 | ) | (0.25 | ) | (0.11 | ) | (0.80 | ) | 8.98 | |||||||||||||||||||||
Year Ended October 31, 2014 | 10.61 | 0.62 | (0.13 | ) | 0.49 | (0.61 | ) | (0.11 | ) | – | (0.72 | ) | 10.38 | |||||||||||||||||||||||
Year Ended October 31, 2013 | 10.30 | 0.72 | 0.30 | 1.02 | (0.71 | ) | – | – | (0.71 | ) | 10.61 | |||||||||||||||||||||||||
Institutional Class Shares | ||||||||||||||||||||||||||||||||||||
Six Months Ended April 30, 2018* | 8.65 | 0.24 | (0.24 | ) | – | (0.20 | ) | – | – | (0.20 | ) | 8.45 | ||||||||||||||||||||||||
Year Ended October 31, 2017 | 8.28 | 0.51 | 0.35 | 0.86 | (0.45 | ) | – | (0.04 | ) | (0.49 | ) | 8.65 | ||||||||||||||||||||||||
Year Ended October 31, 2016 | 8.47 | 0.48 | (0.31 | ) | 0.17 | (0.36 | ) | – | – | (0.36 | ) | 8.28 | ||||||||||||||||||||||||
Year Ended October 31, 2015 | 9.85 | 0.61 | (1.16 | ) | (0.55 | ) | (0.47 | ) | (0.25 | ) | (0.11 | ) | (0.83 | ) | 8.47 | |||||||||||||||||||||
Year Ended October 31, 2014 | 10.10 | 0.61 | (0.11 | ) | 0.50 | (0.64 | ) | (0.11 | ) | – | (0.75 | ) | 9.85 | |||||||||||||||||||||||
Year Ended October 31, 2013 | 9.84 | 0.71 | 0.29 | 1.00 | (0.74 | ) | – | – | (0.74 | ) | 10.10 | |||||||||||||||||||||||||
| * | Unaudited |
| (a) | Net investment income/(loss) is based on average shares outstanding during the period. |
| (b) | Not annualized for periods less than one year. |
| (c) | Includes interest expense that amounts to less than 0.01%. |
| (d) | Annualized for periods less than one year. |
Amounts listed as “–” are $0 or round to $0.
See accompanying Notes to Financial Statements.
| 50 | Semi-Annual Report 2018 |
Financial Highlights (concluded)
Selected Data for Each Share of Capital Outstanding Throughout the Periods Indicated
Aberdeen Global High Income Fund (concluded)
| Ratios/Supplemental Data | ||||||||||||||||||||||
| Total Return (b) | Net Assets at End of Period (000’s) | Waivers) | Ratio of Expenses (Prior to Reimbursements) to Average Net Assets (d)(c)(e) | Ratio of Net Investment Income to Average Net Assets (d) | Portfolio Turnover (b)(f) | |||||||||||||||||
| (0.17 | %) | $ | 163,579 | 1.00 | % | 1.19 | % | 5.49 | % | 17 | % | ||||||||||
| 10.50 | % | 185,613 | 1.00 | % | 1.14 | % | 5.79 | % | 51 | % | ||||||||||||
| 1.91 | % | 233,369 | 1.00 | % | 1.06 | % | 5.76 | % | 72 | % | ||||||||||||
| (6.01 | %)(g) | 522,964 | 1.00 | % | 1.04 | % | 6.43 | % | 79 | % | ||||||||||||
| 4.70 | % | 823,808 | 1.00 | % | 1.01 | % | 5.76 | % | 96 | % | ||||||||||||
| 10.20 | % | 999,250 | 0.99 | % | 1.00 | % | 6.83 | % | 57 | % | ||||||||||||
| (0.05 | %) | 112,260 | 0.75 | % | 0.92 | % | 5.73 | % | 17 | % | |||||||||||
| 10.76 | % | 203,575 | 0.75 | % | 0.87 | % | 6.01 | % | 51 | % | ||||||||||||
| 2.21 | % | 351,466 | 0.75 | % | 0.79 | % | 6.00 | % | 72 | % | ||||||||||||
| (5.85 | %) | 797,494 | 0.75 | % | 0.76 | % | 6.68 | % | 79 | % | ||||||||||||
| 5.01 | % | 1,561,293 | 0.74 | % | 0.75 | % | 6.01 | % | 96 | % | ||||||||||||
| 10.53 | % | 1,553,543 | 0.75 | % | 0.75 | % | 7.10 | % | 57 | % | ||||||||||||
| (e) | During the period, certain fees were waived and/or reimbursed. If such waivers/reimbursements had not occurred, the ratios would have been as indicated. |
| (f) | Portfolio turnover is calculated on the basis of the Fund as a whole without distinguishing among the classes of shares. |
| (g) | The total return shown above includes the impact of financial statement adjustments to the NAV per share. |
| 2018 Semi-Annual Report | 51 |
April 30, 2018 (Unaudited)
1. Organization
Aberdeen Investment Funds (the “Trust”) was organized as a business trust under the laws of the State of Massachusetts by a Master Trust Agreement adopted on April 30, 1992 and is registered with the U.S. Securities and Exchange Commission (“SEC”) under the Investment Company Act of 1940, as amended (the “1940 Act”) as an open-end management investment company. As of April 30, 2018, the Trust offered four diversified, open-ended investment funds: Aberdeen Select International Equity Fund (the “Select International Equity Fund”), Aberdeen Select International Equity Fund II (the “Select International Equity Fund II”), Aberdeen Total Return Bond Fund (the “Total Return Bond Fund”), and Aberdeen Global High Income Fund (the “Global High Income Fund”). Each series of the Trust is also referred to herein as a “Fund” or collectively, the “Funds”.
Each of the Funds offers multiple share classes. As of April 30, 2018, all of the Funds offered Class A and Institutional Class shares. The classes of shares are offered to different types of investors and have different expense structures, as outlined in the Funds’ prospectus. Each class of shares has exclusive voting rights with respect to matters that affect that class. Income, realized gains and losses, unrealized appreciation and depreciation, and expenses that are not attributable to a specific class are allocated daily to each class based on its relative net assets. Expenses directly attributable to a Fund are charged to that Fund. Other expenses are allocated to the respective Fund based on average daily net assets.
Each Fund has distinct investment objectives. Following are the objectives for the Funds:
| Fund Name | Investment Objective | |
Select International Equity Fund | Seeks long-term growth of capital. | |
Select International Equity Fund II | Seeks long-term growth of capital. | |
Total Return Bond Fund | Seeks to provide total return, which is derived from capital appreciation and income. | |
Global High Income Fund | Seeks to maximize total return, principally through a high level of current income, and secondarily through capital appreciation. |
2. Summary of Significant Accounting Policies
The Trust is an investment company and accordingly follows the investment company accounting and reporting guidance of the Financial Accounting Standards Board (“FASB”) Accounting Standard Codification Topic 946 Financial Services-Investment Companies. The following is a summary of significant accounting policies followed by the Funds in the preparation of their financial statements. The policies conform to generally accepted accounting principles in the United States of America (“GAAP”). The preparation of financial statements requires management to make estimates and assumptions that affect the reported amounts of assets and liabilities, disclosure of contingent assets and liabilities at the date of the financial statements, and the reported amounts of income and expenses for the period. Actual results could differ from those estimates. The books and records of the Funds are maintained in U.S. Dollars.
| a. | Security Valuation |
The Funds value their securities at current market value or fair value, consistent with the Funds’ valuation procedures (the “Valuation Procedures”) and regulatory requirements. Equity securities that are traded on an exchange are valued at the last quoted sale price on the principal exchange on which the security is traded at the “Valuation Time” subject to application, when appropriate, of the valuation factors described in the paragraph below. Under normal circumstances, the Valuation Time is as of the close of regular trading on the New York Stock Exchange (usually 4:00 p.m. Eastern Time).
Each Fund’s assets for which market quotations are readily available are valued at fair value on the basis of quotations furnished by a pricing service or provided by securities dealers. Equity investments are generally valued using the last sale price or official closing price taken from the primary market in which each security trades, or if no sales occurred during the day, at the mean of the current quoted bid and ask prices.
Foreign equity securities that are traded on foreign exchanges that close prior to 4:00 p.m. Eastern time are valued by applying valuation factors to the last sale price or the mean price as noted above. Valuation factors are provided by an independent pricing service provider. These valuation factors are used when pricing a Fund’s portfolio holdings to estimate market movements between the time foreign markets close and the time a Fund values such foreign securities. These valuation factors are based on inputs such as depositary receipts, indices, futures, sector indices/ETFs, exchange rates, and local exchange opening and closing prices of each security. When prices with the application of valuation factors are utilized, the value assigned to the foreign securities may not be the same as quoted or published prices of the securities on their primary markets. Valuation factors are not utilized if the independent pricing service provider is unable to provide a valuation factor or if the valuation factor falls below a predetermined confidence threshold.
| 52 | Semi-Annual Report 2018 |
Notes to Financial Statements (continued)
April 30, 2018 (Unaudited)
Per an amendment to the Valuation Procedures that became effective February 21, 2017, fixed income securities, which previously had been generally valued using the mean of bid and ask prices, are now generally valued using bid prices provided directly by independent third party services or provided directly from one or more broker dealers or market makers, each in accordance with the Valuation Procedures approved by the Trust’s Board of Trustees (the “Board”). The pricing services may use valuation models or matrix pricing, which consider yield or prices with respect to comparable bond quotations from bond dealers or by reference to other securities that are considered comparable in such characteristics as credit rating, interest rates and maturity date, to determine current fair value. If there are no current day bids, the security is valued at the previously applied bid. Pricing services generally price debt securities assuming orderly transactions of an institutional “round lot” size, and strategies employed by the Funds’ investment adviser, Aberdeen Asset Management Inc. (the “Adviser”), generally trade in round lot sizes. In certain circumstances, fixed income securities may be held or transactions may be conducted in smaller “odd lot” sizes. Odd lots may trade at lower, or occasionally, higher prices than institutional round lot trades. Short-term fixed income securities (such as commercial paper and U.S. treasury bills) having a remaining maturity of 60 days or less are valued at the last quoted or evaluated bid price on the valuation date provided by an independent pricing service, or on the basis of amortized cost if it represents the best approximation for fair value.
Assets and liabilities initially expressed in foreign currency will be converted into U.S. Dollar values. Short-term debt securities (such as commercial paper and U.S. treasury bills) having a remaining maturity of 60 days or less are valued at the last quoted or evaluated bid price on the valuation date provided by an independent pricing service, or on the basis of amortized cost if it represents the best approximation for fair value. To the extent each Fund invests in other open-ended funds, the Fund will calculate its net asset value (“NAV”) based upon the NAV of the underlying funds in which it invests. The prospectuses of these underlying funds explain the circumstances under which they will use good faith fair value pricing and the effects of such fair value pricing.
Short-term investments are comprised of cash and cash equivalents invested in short-term investment funds which are redeemable daily. The Fund sweeps available cash into the State Street Institutional U.S. Government Money Market Fund, a “government money market fund” pursuant to Rule 2a-7 under the 1940 Act, which has an objective to maintain a $1.00 NAV, which is not guaranteed. Registered investment companies are valued at their net asset value as reported by such company. Generally, these investment types are categorized as Level 1 investments.
Derivative instruments are generally valued according to the following procedures. For forward currency exchange contracts the market value is interpolated by the pricing agent by using forward spot points obtained from an authorized pricing service. Futures contracts are generally valued at the most recent settlement price as of NAV determination. Generally for swap agreements, if quotes are unavailable from authorized pricing services swap pricing is determined using a modelling tool which considers and forecasts the impact of cash flow projections, prevailing and expected interest rate movements, and potential credit events. Swap prices are generally evaluated based upon the latest available data provided by the counterparty and rely upon an industry accepted modelling tool.
When market quotations or exchange rates are not readily available, or if the Adviser concludes that such market quotations do not accurately reflect fair value, the fair value of a Fund’s assets are determined in good faith in accordance with the Valuation Procedures. For options, swaps and warrants, a fair value price may be determined using readily available market quotations, prices provided by independent pricing services, or by using modeling tools provided by industry accepted financial data service providers. Key inputs to such tools may include yield and prices from comparable or reference assets, maturity or expiration dates, ratings and interest rates. In addition, the Adviser, through its pricing committee, may determine the fair value price in accordance with the Valuation Procedures approved by the Board.
In accordance with the authoritative guidance on fair value measurements and disclosures under GAAP, the Funds disclose the fair value of their investments using a three-level hierarchy that classifies the inputs to valuation techniques used to measure the fair value. The hierarchy assigns Level 1, the highest level, measurements to valuations based upon unadjusted quoted prices in active markets for identical assets, Level 2 measurements to valuations based upon significant observable inputs, including adjusted quoted prices in active markets for similar assets, and Level 3, the lowest level, measurements to valuations based upon unobservable inputs that are significant to the valuation. Inputs refer broadly to the assumptions that market participants would use in pricing the asset or liability, including assumptions about risk, for example, the risk inherent in a particular valuation technique used to measure fair value including a pricing model and/or the risk inherent in the inputs to the valuation technique. Inputs may be observable or unobservable. Observable inputs are inputs that reflect the assumptions market participants would use in pricing the asset or liability, which are based on market data obtained from sources independent of the reporting entity. Unobservable inputs are inputs that reflect the reporting entity’s own assumptions about the assumptions market participants would use in pricing the asset or liability developed based on the best information available in the circumstances. A financial instrument’s level within the fair value hierarchy is based upon the lowest level of any input that is significant to the fair value measurement. The three-level hierarchy of inputs is summarized below:
| • | Level 1- quoted prices in active markets for identical investments; |
| • | Level 2- other significant observable inputs (including quoted prices for similar securities, interest rates, prepayment speeds, and credit risk); or |
| • | Level 3- significant unobservable inputs (including the Fund’s own assumptions in determining the fair value of investments). |
| 2018 Semi-Annual Report | 53 |
Notes to Financial Statements (continued)
April 30, 2018 (Unaudited)
For movements between the levels within the fair value hierarchy, the Funds have adopted a policy of recognizing transfers at the end of each period. As described above, certain foreign securities are valued utilizing valuation factors provided by an independent pricing service to reflect any significant market movements between the time foreign markets close and the time the Fund values such foreign securities. The utilization of valuation factors may result in transfers between Level 1 and Level 2.
During the six-month period ended April 30, 2018, Select International Equity Fund and Select International Equity Fund II had transfers between Level 1 and Level 2 because there was a valuation factor applied at April 30, 2018 that had not been applied at a prior period end or a valuation factor applied at a prior period end that was not applied at April 30, 2018. During the six-month period ended April 30, 2018, Global High Income Fund and Total Return Bond Fund had no transfers between levels. For the six-month period ended April 30, 2018, there were no significant changes to the fair valuation methodologies. The following is a summary of Funds which had significant transfers:
| Fund | Transfer from Level 1 | Transfer from Level 2 | Transfer from Level 3 | |||||||||
Select International Equity Fund | $ – | $3,299,905 | $ – | |||||||||
Select International Equity Fund II | $ – | $1,348,502 | $ – | |||||||||
The following is a summary of the inputs used as of April 30, 2018 in valuing the Funds’ investments and other financial instruments at fair value. The inputs or methodology used for valuing securities are not necessarily an indication of the risk associated with investing in those securities.
| Investments, at Value | LEVEL 1–Quoted Prices ($) | LEVEL 2–Other Significant Observable Inputs ($) | LEVEL 3–Significant Unobservable Inputs ($) | Total ($) | ||||||||||||
| Select International Equity Fund | ||||||||||||||||
| Investments in Securities | ||||||||||||||||
Common Stocks | 38,803,931 | 139,907,728 | – | 178,711,659 | ||||||||||||
Preferred Stocks | 4,837,094 | 12,539,177 | – | 17,376,271 | ||||||||||||
Short-Term Investment | 3,341,314 | – | – | 3,341,314 | ||||||||||||
|
|
|
|
|
|
|
| |||||||||
| 46,982,339 | 152,446,905 | – | 199,429,244 | |||||||||||||
|
|
|
|
|
|
|
| |||||||||
1 Represents a security that is fair valued at zero pursuant to procedures approved by the Fund’s Board of Trustees. |
| |||||||||||||||
| Select International Equity Fund II | ||||||||||||||||
| Investments in Securities | ||||||||||||||||
Common Stocks | 16,159,484 | 58,525,201 | – | 74,684,685 | ||||||||||||
Preferred Stocks | 1,901,857 | 5,070,239 | – | 6,972,096 | ||||||||||||
Short-Term Investment | 1,125,812 | – | – | 1,125,812 | ||||||||||||
|
|
|
|
|
|
|
| |||||||||
| 19,187,153 | 63,595,440 | – | 82,782,593 | |||||||||||||
|
|
|
|
|
|
|
| |||||||||
1 Represents a security that is fair valued at zero pursuant to procedures approved by the Fund’s Board of Trustees. |
| |||||||||||||||
| Total Return Bond Fund | ||||||||||||||||
| Investments in Securities | ||||||||||||||||
Asset-Backed Securities | – | 25,038,069 | – | 25,038,069 | ||||||||||||
Commercial Mortgage-Backed Securities | – | 25,785,775 | – | 25,785,775 | ||||||||||||
Non-Agency Mortgage-Backed Securities | – | 25,073,566 | – | 25,073,566 | ||||||||||||
Corporate Bonds | – | 97,407,943 | – | 97,407,943 | ||||||||||||
Municipal Bonds | – | 10,950,520 | – | 10,950,520 | ||||||||||||
Government Bonds | – | 21,854,920 | – | 21,854,920 | ||||||||||||
U.S. Agencies | – | 20,503,439 | – | 20,503,439 | ||||||||||||
U.S. Treasuries | – | 24,367,855 | – | 24,367,855 | ||||||||||||
| 54 | Semi-Annual Report 2018 |
Notes to Financial Statements (continued)
April 30, 2018 (Unaudited)
| Investments, at Value | LEVEL 1–Quoted Prices ($) | LEVEL 2–Other Significant Observable Inputs ($) | LEVEL 3–Significant Unobservable Inputs ($) | Total ($) | ||||||||||||
| Total Return Bond Fund (continued) | ||||||||||||||||
| Investments in Securities (continued) | ||||||||||||||||
Agency Mortgage-Backed Securities | – | 30,392,062 | – | 30,392,062 | ||||||||||||
Short-Term Investment | 944,823 | – | – | 944,823 | ||||||||||||
| Other Financial Instruments | ||||||||||||||||
| Assets | ||||||||||||||||
Futures Contracts | 103,468 | – | – | 103,468 | ||||||||||||
Forward Foreign Currency Exchange Contracts | – | 2,149,118 | – | 2,149,118 | ||||||||||||
| Liabilities | ||||||||||||||||
Futures Contracts | (403,737 | ) | – | – | (403,737 | ) | ||||||||||
Forward Foreign Currency Exchange Contracts | – | (2,051,159 | ) | – | (2,051,159 | ) | ||||||||||
|
|
|
|
|
|
|
| |||||||||
| 644,554 | 281,472,108 | – | 282,116,662 | |||||||||||||
|
|
|
|
|
|
|
| |||||||||
| Global High Income Fund | ||||||||||||||||
| Investments in Securities | ||||||||||||||||
Corporate Bonds | – | 258,475,353 | – | 258,475,353 | ||||||||||||
Bank Loans | – | 8,421,022 | – | 8,421,022 | ||||||||||||
Common Stocks | 485,600 | – | – | 485,600 | ||||||||||||
Short-Term Investment | 9,410,457 | – | – | 9,410,457 | ||||||||||||
| Other Financial Instruments | ||||||||||||||||
| Assets | ||||||||||||||||
Forward Foreign Currency Exchange Contracts | – | 1,306,959 | – | 1,306,959 | ||||||||||||
| Liabilities | ||||||||||||||||
Forward Foreign Currency Exchange Contracts | – | (169,058 | ) | – | (169,058 | ) | ||||||||||
|
|
|
|
|
|
|
| |||||||||
| 9,896,057 | 268,034,276 | – | 277,930,333 | |||||||||||||
|
|
|
|
|
|
|
| |||||||||
| Amounts | listed as “–” are $0 or round to $0. |
Global High Income Fund Rollforward of Level 3 Fair Value Measurement For the Period Ended April 30, 2018 | ||||||||||||||||||||||||||||||||||||||||
| Investments in Securities | Balance as of October 31, 2017 | Accrued Discounts (Premiums) | Realized Gain (Loss) | Change in Unrealized Appreciation (Depreciation) | Net Purchases | Net Sales | Net Transfers in to Level 3 | Net Transfers out of Level 3 | Balance as of April 30, 2018 | Change in Unrealized Appreciation (Depreciation) from Investments Held at April 30, 2018 | ||||||||||||||||||||||||||||||
BANK LOANS | ||||||||||||||||||||||||||||||||||||||||
Italy | $ | 2,940,129 | $ | 3,250 | $ | (408,222 | ) | $ | 454,621 | $ | – | (2,989,778 | ) | $ | – | $ | – | $ | – | $ | – | |||||||||||||||||||
TOTAL | $ | 2,940,129 | $ | 3,250 | $ | (408,222 | ) | $ | 454,621 | $ | – | $ | (2,989,778 | ) | $ | – | $ | – | $ | – | $ | – | ||||||||||||||||||
| b. | Restricted Securities |
Restricted securities are privately-placed securities whose resale is restricted under U.S. securities laws. The Funds may invest in restricted securities, including unregistered securities eligible for resale without registration pursuant to Rule 144A and privately-placed securities of
| 2018 Semi-Annual Report | 55 |
Notes to Financial Statements (continued)
April 30, 2018 (Unaudited)
U.S. and non-U.S. issuers offered outside the U.S. without registration pursuant to Regulation S under the Securities Act of 1933, as amended. Rule 144A securities may be freely traded among certain qualified institutional investors, such as the Funds, but resale of such securities in the U.S. is permitted only in limited circumstances.
| c. | Foreign Currency Translation |
Foreign securities, currencies, and other assets and liabilities denominated in foreign currencies are translated into U.S. Dollars at the exchange rate of said currencies against the U.S. Dollar, as of the Valuation Time, as provided by an independent pricing service. Purchases and sales of securities, and income and expenses are translated at the prevailing rate of exchange on the respective date of these transactions. The Funds do not isolate that portion of the results of operations resulting from changes in foreign exchange rates on investments from fluctuations arising from changes in market prices of securities held. These fluctuations are included with the net realized and unrealized gain or loss from investments and foreign currencies within the Statements of Operations.
Investments in emerging markets can be riskier and more volatile than investments in the United States and other developed markets. Adverse political and economic developments can make it more difficult for the Select International Equity Fund and Select International Equity Fund II to sell foreign securities which could reduce the NAV of the Funds. In contrast to more established markets, emerging markets may have governments that are less stable and markets that are less liquid, increasing your investment risk. At April 30, 2018, the Select International Equity Fund held Venezuelan securities and held Venezuelan Bolivar. Venezuela currently imposes foreign exchange controls which prohibit the Select International Equity Fund from repatriating dividends, interest, or other income from investments or proceeds from the sale of Venezuelan securities. The Venezuelan securities and Venezuelan Bolivar have been fair valued at $0.
| d. | Derivative Financial Instruments |
Certain Funds are authorized to use derivatives to manage currency risk, credit risk, and interest rate risk and to replicate, or use as a substitute for, physical securities. Losses may arise due to changes in the value of the contract or if the counterparty does not perform under the contract. The use of derivative instruments involves, to varying degrees, elements of market risk in excess of the amount recognized in the Statements of Assets and Liabilities.
Forward Foreign Currency Exchange Contracts
A forward foreign currency exchange contract (“forward contract”) involves an obligation to purchase and sell a specific currency at a future date, which may be any fixed number of days from the date of the contract agreed upon by the parties, at a price set at the time of the contract. Forward contracts are used to manage a Fund’s currency exposure in an efficient manner. They are used to sell unwanted currency exposure that comes with holding securities in a market, or to buy currency exposure where the exposure from holding securities is insufficient to give the desired currency exposure either in absolute terms or relative to the benchmark. The use of forward contracts allows the separation of decision-making between markets and their currencies. The forward contract is marked-to-market daily and the change in market value is recorded by a Fund as unrealized appreciation/(depreciation). Forward contracts’ prices are received daily from an independent pricing provider. When the forward contract is closed, a Fund records a realized gain or loss equal to the difference between the value at the time it was opened and the value at the time it was closed. These realized and unrealized gains and losses are reported on the Statements of Operations. During the six-month period ended April 30, 2018, the Funds used forward contracts to hedge some of the Funds’ foreign currency holdings. Managing active currency risk involves both hedging currency risk and adding currency risk in excess of underlying bond positions. A Fund may also enter into forward contracts to obtain potential appreciation of a foreign currency, which also adds currency risk.
Futures Contracts
Certain Funds may invest in financial futures contracts (“futures contracts”) for the purpose of hedging their existing portfolio securities, or securities that a Fund intends to purchase, against fluctuations in value caused by changes in prevailing market interest rates or prices. Futures contracts may also be entered into for non-hedging purposes; however, in those instances, the aggregate initial margin and premiums required to establish a Fund’s positions may not exceed 5% of a Fund’s NAV after taking into account unrealized profits and unrealized losses on any such contract into which it has entered.
Upon entering into a futures contract, a Fund is required to pledge to the broker an amount of cash and/or other assets equal to a certain percentage of the contract amount. This payment is known as “initial margin”. Subsequent payments, known as “variation margin,” are calculated each day, depending on the daily fluctuations in the fair value/market value of the underlying assets. An unrealized gain/(loss) equal to the variation margin is recognized on a daily basis. When the contract expires or is closed, the gain/(loss) is realized and is presented in the Statements of Operations as a net realized gain/(loss) on futures contracts. Futures contracts are valued daily at their last quoted sale price on the exchange on which they are traded.
| 56 | Semi-Annual Report 2018 |
Notes to Financial Statements (continued)
April 30, 2018 (Unaudited)
A “sale” of a futures contract means a contractual obligation to deliver the securities or foreign currency called for by the contract at a fixed price at a specified time in the future. A “purchase” of a futures contract means a contractual obligation to acquire the securities or foreign currency at a fixed price at a specified time in the future.
Should market conditions change unexpectedly, a Fund may not achieve the anticipated benefits of the futures contracts and may realize a loss. The use of futures transactions for hedging purposes involves the risk of imperfect correlation in movements in the price of futures contracts, interest rates and the value/market value of the underlying hedged assets. During the six-month period ended April 30, 2018, U.S. Treasury futures contracts were used to manage Total Return Bond Fund’s overall curve and interest rate exposure.
Options
Options are instruments that provide a right to buy (call) or sell (put) a particular security or an index of securities at a fixed price within a certain time period. Options differ from forward and futures contracts in that the buyer of the option has no obligation to perform under the contract. An option is out-of-the money if the exercise price of the option is above, in the case of a call option, or below, in the case of a put option, the current price (or interest rate or yield for certain options) of the referenced security or instrument. Use of put and call options may result in losses to a Fund, force the sale or purchase of portfolio securities at inopportune times or for prices higher than (in the case of put options) or lower than (in the case of call options) current market values, limit the amount of appreciation a Fund can realize on its investments or cause a Fund to hold a security it might otherwise sell. The Funds did not hold options as of April 30, 2018.
Swaps
The Total Return Bond Fund enters into interest rate swaps to manage interest-rate exposure. The Global High Income Fund uses credit default swaps to gain, or hedge, exposure to specific companies. A swap is an agreement that obligates two parties to exchange a series of cash flows and/or meet certain obligations at specified intervals based upon or calculated by reference to changes in specified prices or rates (interest rates in the case of interest rate swaps, currency exchange rates in the case of currency swaps) or the occurrence of a credit event with respect to an underlying reference obligation (in the case of a credit default swap) for a specified amount of an underlying asset or notional principal amount. A Fund will enter into swaps only on a net basis, which means that the two payment streams are netted out, with a Fund receiving or paying, as the case may be, only the amount of the difference between the two payments. Except for currency swaps and credit default swaps, the notional principal amount is used solely to calculate the payment streams but is not exchanged. With respect to currency swaps, actual principal amounts of currencies may be exchanged by the counterparties at the initiation, and again upon the termination of the transaction.
Traditionally, swaps were customized, privately negotiated agreements executed between two parties (“OTC Swaps”) but since 2013, certain swaps are required to be cleared pursuant to rules and regulations related to the Dodd–Frank Wall Street Reform and Consumer Protection Act (“Dodd Frank”) and/or Regulation (EU) No 648/2012 on OTC Derivatives, Central Counterparties and Trade Repositories (“EMIR”) (“Cleared Swaps”). Like OTC Swaps, Cleared Swaps are negotiated bilaterally. Unlike OTC Swaps, the act of clearing results in two swaps executed between each of the parties and a central counterparty (“CCP”), and thus the counterparty credit exposure of the parties is to the CCP rather than to one another. Upon entering into a Cleared Swap, a Fund is required to pledge an amount of cash and/or other assets equal to a certain percentage of the contract amount. This payment is known as “initial margin”. Subsequent payments, known as “variation margin,” are calculated each day, depending on the daily fluctuations in the fair value/market value of the underlying assets. An unrealized gain/(loss) equal to the variation margin is recognized on a daily basis. When the contract matures or is terminated, the gain or loss is realized and is presented in the Statements of Operations as a net realized gain or loss on swap contracts. As of March 2017, a Fund may be required to provide variation and/or initial margin for OTC Swaps pursuant to further rules and regulations related to Dodd Frank and EMIR. The margin requirements associated with OTC Swaps and Cleared Swaps may not be the same.
Entering into swap agreements involves, to varying degrees, elements of credit, market and interest risk in excess of the amounts reported on the Statement of Assets and Liabilities. Such risks involve the possibility that there will be no liquid market for these agreements, that the counterparty to the agreements may default on its obligation to perform and that there may be unfavorable changes in the value of the index or securities underlying the agreement. The Funds’ maximum risk of loss from counterparty risk related to swaps is the fair value of the contract. This risk is mitigated by the posting of collateral by the counterparties to the Funds to cover the Funds’ exposure to the counterparty.
Interest Rate Swaps
A Fund uses interest rate swap contracts to manage its exposure to interest rates. Interest rate swap contracts typically represent the exchange between a Fund and a counterparty of respective commitments to make variable rate and fixed rate payments with respect to a notional amount of principal. Interest rate swap contracts may have a term that is greater than one year, but typically require periodic interim settlement in cash, at which time the specified value of the variable interest rate is reset for the next settlement period. Net
| 2018 Semi-Annual Report | 57 |
Notes to Financial Statements (continued)
April 30, 2018 (Unaudited)
payments of interest are recorded as realized gains or losses. During the period that the swap contract is open, the contract is marked-to-market as the net amount due to or from a Fund and changes in the value of swap contracts are recorded as unrealized gains or losses.
Credit Default Swaps
A credit default swap is an agreement whereby one party, the buyer, is obligated to pay the other party, the seller, a periodic stream of payments over the term of the contract in return for a contingent payment upon the occurrence of a credit event with respect to an underlying reference obligation. A Fund might use credit default swap contracts to limit or to reduce risk exposure of the Fund to defaults of corporate and sovereign issues (i.e., to reduce risk when the Fund owns or has exposure to such issuers). A Fund also might use credit default swap contracts to create direct or synthetic short or long exposure to domestic or foreign corporate debt securities or certain sovereign debt securities to which the Fund is not otherwise exposed.
Summary of Derivative Instruments
Certain Funds may use derivatives for various purposes as noted above. The following is a summary of the location of fair value amounts of derivatives, not accounted for as hedging instruments, as of April 30, 2018:
| Location on the Statement of Assets and Liabilities | ||||
| Derivative Instrument Risk Type | Asset Derivatives | Liability Derivatives | ||
Interest Rate Risk | Variation margin receivable for futures contracts Variation margin receivable for centrally cleared interest rate swap contracts | Variation margin payable for futures contracts Variation margin payable for centrally cleared interest rate swap contracts | ||
Foreign Exchange Risk | Unrealized appreciation on forward foreign currency exchange contracts | Unrealized depreciation on forward foreign currency exchange contracts | ||
Credit Risk | Variation margin receivable for centrally cleared credit default swap contracts | Variation margin payable for centrally cleared credit default swap contracts | ||
The following is a summary of the fair value of Derivative Instruments, not accounted for as hedging instruments, as of April 30, 2018:
| Total Return Bond Fund | Asset Derivatives | Liability Derivatives | ||||||||||
| Period Ended April 30, 2018 | Period Ended April 30, 2018 | |||||||||||
| Derivatives not accounted for as hedging instruments and risk exposure | Statement of Assets and Liabilities Location | Fair Value | Statement of Assets and Liabilities Location | Fair Value | ||||||||
| Forward foreign exchange contracts | ||||||||||||
(foreign exchange risk) | Unrealized appreciation on forward currency exchange contracts | $ | 2,149,118 | Unrealized depreciation on forward currency exchange contracts | $ | 2,051,159 | ||||||
| Futures contracts | ||||||||||||
(interest rate risk) | Variation margin receivable for futures contracts | $ | 103,469 | Variation margin payable for futures contracts | $ | 560,769 | ||||||
Total | $ | 2,252,587 | $ | 2,611,928 | ||||||||
| Global High Income Fund | Asset Derivatives | Liability Derivatives | ||||||||||
| Period Ended April 30, 2018 | Period Ended April 30, 2018 | |||||||||||
| Derivatives not accounted for as hedging instruments and risk exposure | Statement of Assets and Liabilities Location | Fair Value | Statement of Assets and Liabilities Location | Fair Value | ||||||||
| Forward foreign exchange contracts | ||||||||||||
(foreign exchange risk) | Unrealized appreciation on forward currency exchange contracts | $ | 1,306,959 | Unrealized depreciation on forward currency exchange contracts | $ | 169,058 | ||||||
Total | $ | 1,306,959 | $ | 169,058 | ||||||||
| 58 | Semi-Annual Report 2018 |
Notes to Financial Statements (continued)
April 30, 2018 (Unaudited)
A reconciliation of the gross amounts on the Statements of Assets and Liabilities as of April 30, 2018 to the net amounts by broker and derivative type, including any collateral received or pledged, is included in the following tables:
| Gross Amounts Not Offset in Statement of Assets & Liabilities | Gross Amounts Not Offset in Statement of Assets and Liabilities | |||||||||||||||||||||||||||||||
| Description | Gross Amounts of Assets Presented in Statement of Financial Position | Financial Instruments | Collateral Received (1) | Net Amount (3) | Gross Amounts of Liabilities Presented in Statement of Financial Position | Financial Instruments | Collateral Pledged (1) | Net Amount (3) | ||||||||||||||||||||||||
| Assets | Liabilities | |||||||||||||||||||||||||||||||
| Total Return Bond Fund | ||||||||||||||||||||||||||||||||
Forward foreign currency (2) |
| |||||||||||||||||||||||||||||||
Barclays Bank plc | $ | 48,296 | $ | (48,296 | ) | $ | – | $ | – | $ | 381,290 | $ | (48,296 | ) | $ | (60,000 | ) | $ | 272,994 | |||||||||||||
Citibank N.A. | 281,292 | (162,244 | ) | (60,000 | ) | 59,048 | 162,244 | (162,244 | ) | – | – | |||||||||||||||||||||
Goldman Sachs & Co. | 208,135 | (185,418 | ) | – | 22,717 | 185,418 | (185,418 | ) | – | – | ||||||||||||||||||||||
HSBC Bank USA | 560,394 | (279,963 | ) | (10,000 | ) | 270,431 | 279,963 | (279,963 | ) | – | – | |||||||||||||||||||||
JPMorgan Chase Bank N.A. | 309,359 | (167,623 | ) | – | 141,736 | 167,623 | (167,623 | ) | – | – | ||||||||||||||||||||||
Royal Bank of Canada | 424,455 | (424,455 | ) | – | – | 756,632 | (424,455 | ) | – | 332,177 | ||||||||||||||||||||||
UBS AG | 14,570 | (14,570 | ) | – | – | 54,165 | (14,570 | ) | – | 39,595 | ||||||||||||||||||||||
Westpac Banking Corp. | 302,617 | (63,824 | ) | – | 238,793 | 63,824 | (63,824 | ) | – | – | ||||||||||||||||||||||
| 1. | In some instances, the actual collateral received and/or pledged may be more than the amount shown here due to overcollateralization. |
| 2. | Includes financial instrument which are not subject to a master netting arrangement across funds, or another similar arrangement. |
| 3. | Net amounts represent the net receivables/(payable) that would be due from/to the counterparty in the event of default. Exposure from financial derivative instruments can only be netted across transactions governed under the same master netting agreement with the same legal entity. |
| Gross Amounts Not Offset in Statement of Assets & Liabilities | Gross Amounts Not Offset in Statement of Assets and Liabilities | |||||||||||||||||||||||||||||||
| Description | Gross Amounts of Assets Presented in Statement of Financial Position | Financial Instruments | Collateral Received (1) | Net Amount (3) | Gross Amounts of Liabilities Presented in Statement of Financial Position | Financial Instruments | Collateral Pledged (1) | Net Amount (3) | ||||||||||||||||||||||||
| Assets | Liabilities | |||||||||||||||||||||||||||||||
| Global High Income Fund | ||||||||||||||||||||||||||||||||
Forward foreign currency (2) | ||||||||||||||||||||||||||||||||
Citibank N.A. | $ | 424,065 | $ | – | $ | – | $ | 424,065 | $ | – | $ | – | $ | – | $ | – | ||||||||||||||||
Goldman Sachs & Co. | 1,848 | (1,848 | ) | – | – | 1,911 | (1,848 | ) | – | 63 | ||||||||||||||||||||||
HSBC Bank USA | – | – | – | – | 116,321 | – | – | 116,321 | ||||||||||||||||||||||||
JPMorgan Chase Bank N.A. | 70,480 | (9,624 | ) | – | 60,856 | 9,624 | (9,624 | ) | – | – | ||||||||||||||||||||||
Royal Bank of Canada | 804,228 | – | – | 804,228 | – | – | – | – | ||||||||||||||||||||||||
UBS AG | 2,737 | (2,737 | ) | – | – | 41,202 | (2,737 | ) | – | 38,465 | ||||||||||||||||||||||
Westpac Banking Corp. | 3,601 | – | – | 3,601 | – | – | – | – | ||||||||||||||||||||||||
| 1. | In some instances, the actual collateral received and/or pledged may be more than the amount shown here due to overcollateralization. |
| 2. | Includes financial instrument which are not subject to a master netting arrangement across funds, or another similar arrangement. |
| 3. | Net amounts represent the net receivables/(payable) that would be due from/to the counterparty in the event of default. Exposure from financial derivative instruments can only be netted across transactions governed under the same master netting agreement with the same legal entity. |
| 2018 Semi-Annual Report | 59 |
Notes to Financial Statements (continued)
April 30, 2018 (Unaudited)
The Effect of Derivative Instruments on the Statement of Operations for the six-month period ended April 30, 2018:
| Total Return Bond Fund | ||||||||||
| Derivatives not accounted for as hedging instruments | Location of Gain or (Loss) on Derivatives | Realized Gain or (Loss) on Derivatives | Change in Unrealized Appreciation/ (Depreciation) on Derivatives | |||||||
| Realized/Unrealized Gain/(Loss) from Investments, Futures Contracts, Written options and Foreign Currency Transactions | ||||||||||
| Forward foreign exchange contracts | ||||||||||
(foreign exchange risk) | $ | 609,363 | $ | (1,239,647 | ) | |||||
| Futures contracts | ||||||||||
(interest rate risk) | $ | (255,404 | ) | $ | (336,524 | ) | ||||
| Written option contracts | ||||||||||
(interest rate risk) | $ | 8,455 | $ | – | ||||||
Total | $ | 362,414 | $ | (1,576,171 | ) | |||||
| Global High Income Fund | ||||||||||
| Derivatives not accounted for as hedging instruments | Location of Gain or (Loss) on Derivatives | Realized Gain or (Loss) on Derivatives | Change in Unrealized Appreciation/ (Depreciation) on Derivatives | |||||||
| Realized/Unrealized Gain/(Loss) from Investments, Futures Contracts, Written options and Foreign Currency Transactions | ||||||||||
| Credit default swaps | ||||||||||
(credit risk) | $ | (347 | ) | $ | – | |||||
| Forward foreign exchange contracts | ||||||||||
(foreign exchange risk) | $ | (4,179,762 | ) | $ | 1,540,021 | |||||
Total | $ | (4,180,109 | ) | $ | 1,540,021 | |||||
Information about derivatives reflected as of the date of this report is generally indicative of the type of activity for the six-month period ended April 30, 2018. The table below summarizes the weighted average values of derivatives holdings by the Funds during the six-month period ended April 30, 2018.
| Fund | Purchase Forward Foreign Currency Contracts (Average Notional Value) | Sale Forward Foreign Currency Contracts (Average Notional Value) | Long Futures Contracts (Average Notional Value) | Short Futures Contracts (Average Notional Value) | Written Option Contracts (Average Notional Value) | |||||||||||||||
Total Return Bond Fund | $ | 117,731,064 | $ | 127,962,172 | $ | 78,975,098 | $ | 17,214,273 | * | |||||||||||
Global High Income Fund | 20,446,983 | 92,983,240 | – | – | – | |||||||||||||||
| * | The Fund did not hold written options for a significant period of time during the six months ended April 30, 2018. |
| 60 | Semi-Annual Report 2018 |
Notes to Financial Statements (continued)
April 30, 2018 (Unaudited)
The Funds value derivatives at fair value, as described in the results of operations. Accordingly, the Funds do not follow hedge accounting even for derivatives employed as economic hedges.
| e. | Bank Loans |
Global High Income Fund may invest in bank loans. Bank loans include floating and fixed-rate debt obligations. Floating rate loans are debt obligations issued by companies or other entities with floating interest rates that reset periodically. Bank loans may include, but are not limited to, term loans, delayed funding loans, bridge loans and revolving credit facilities. Loan interest will primarily take the form of assignments purchased in the primary or secondary market but may include participants. Floating rate loans are secured by specific collateral of the borrower and are senior to most other securities of the borrower (e.g., common stock or debt instruments) in the event of bankruptcy. Floating rate loans are often issued in connection with recapitalizations, acquisitions, leveraged buyouts, and refinancings. Floating rate loans are typically structured and administered by a financial institution that acts as the agent of the lenders participating in the floating rate loan. Floating rate loans may be acquired directly through the agent, as an assignment from another lender who holds a direct interest in the floating rate loan, or as a participation interest in another lender’s portion of the floating rate loan.
Global High Income Fund may enter into, or acquire participation in, delayed funding loans and revolving credit facilities. Delayed funding loans and revolving credit facilities are borrowings in which the Global High Income Fund agrees to make loans up to a maximum amount upon demand by the borrowing issuer for a specified term. A revolving credit facility differs from a delayed funding loan in that as the borrowing issuer repays the loan, an amount equal to the repayment is again made available to the borrowing issuer under the facility. The borrowing issuer may at any time borrow and repay amounts so long as, in the aggregate, at any given time the amount borrowed does not exceed the maximum amount established by the loan agreement. Delayed funding loans and revolving credit facilities usually provide for floating or variable rates of interest.
There are a number of risks associated with an investment in bank loans including credit risk, interest rate risk, illiquid securities risk, and prepayment risk. There is also the possibility that the collateral securing a loan, if any, may be difficult to liquidate or be insufficient to cover the amount owed under the loan. These risks could cause a Fund to lose income or principal on a particular investment, which in turn could affect the Fund’s returns. In addition, bank loans may settle on a delayed basis, resulting in the proceeds from the sale of such loans not being readily available to make additional investments or to meet a Fund’s redemption obligations. To the extent the extended settlement process gives rise to short-term liquidity needs, a Fund may hold additional cash, sell investments or temporarily borrow from banks or other lenders.
| f. | Security Transactions, Investment Income and Expenses |
Security transactions are recorded on the trade date. Realized and unrealized gains/(losses) from security and currency transactions are calculated on the identified cost basis. Dividend income is recorded on the ex-dividend date except for certain dividends on foreign securities, which are recorded as soon as a Fund is informed after the ex-dividend date. Interest income is recorded on an accrual basis using the effective interest method. Expenses are recorded on an accrual basis. Expenses directly attributable to a Fund are charged to that Fund. Expenses not directly attributable to a Fund are allocated proportionately among all Funds of the Trust. For each of the Funds, the method for allocating income, fund level expenses, and realized and unrealized gains or losses among classes is based on the total net asset value of each class’s shares in proportion to the total net assets of the relevant Fund. Expenses specific to a class (such as Rule 12b-1 and Transfer Agent fees) are charged to that class.
| g. | Foreign Taxes |
Funds that invest in foreign securities are subject to foreign taxes that may be imposed by certain countries in which the Funds invest. The Funds generally record foreign taxes based on applicable foreign tax law. The Funds incur withholding taxes on certain foreign dividends and interest, and those taxes are accrued at the time the associated income is recorded. The Funds file withholding tax reclaims in certain jurisdictions to recover a portion of amounts previously withheld. The Funds record a reclaim receivable based on, among other things, a jurisdiction’s legal obligation to pay reclaims as well as payment history and market convention.
The Select International Equity Fund and Select International Equity Fund II (collectively, the “International Equity Funds”) have received payments for Article 63 EU Tax Reclaims related to prior years (2005-2015). The Article 63 EU Tax Reclaim payments received by the International Equity Funds from certain EU countries as of the date of this report significantly increased the Select International Equity Fund’s performance from December 16, 2016 and the Select International Equity Fund II’s performance from February 1, 2017. Without these payments, each International Equity Fund’s performance would have been lower during this period. In the tax years for which the International Equity Funds filed Article 63 EU Tax Reclaims, certain shareholders were able to reduce their federal income taxes based upon the amount of taxes that these Funds paid to foreign jurisdictions. The receipt by the International Equity Funds of the tax reclaims from these jurisdictions will also result in tax liability to the relevant Fund to offset the tax benefits that shareholders received in the past, the precise amount of the tax is uncertain and subject to settlement negotiations with the U.S. Internal Revenue Service (“U.S. IRS”). Based on information available as of the date of this report, an estimated tax amount has been accrued and is reflected within each International
| 2018 Semi-Annual Report | 61 |
Notes to Financial Statements (continued)
April 30, 2018 (Unaudited)
Equity Fund’s net asset value and performance. Furthermore, upon final determination of the U.S. IRS, if the actual tax payable is greater than the amount currently accrued, and subject to the level of assets under management at the time of any subsequent adjustments, the relevant International Equity Fund’s expenses, net asset value and performance may be materially adversely impacted. On November 20, 2017, based on information obtained during informal discussions with the U.S. IRS, the estimated tax amount accrued within the International Equity Funds was adjusted, resulting in an impact of -0.86% and -0.42%, respectively, to net assets of Select International Equity Fund and Select International Equity Fund II. The precise amount of the tax remains uncertain as the matter remains unsettled with the U.S. IRS.
The International Equity Funds have Article 63 EU Tax Reclaims outstanding related to prior years (2005-2015). Consistent with U.S. GAAP accrual requirements, the International Equity Funds have recognized the Article 63 EU Tax Reclaims when a payment has been received, and have not recorded a receivable amount for any outstanding Article 63 EU Tax Reclaims because there is limited historical precedent for U.S. funds collecting reclaims of this magnitude and the total amount of the reclaims that these funds may receive in the future is uncertain. Any additional amounts to which the International Equity Funds may be entitled, if and when recorded, likely would result in an increase in the net asset value per share of each fund at that time. In addition, Article 63 EU Tax Reclaims amounts received will be subject to tax. The U.S. IRS has not yet determined the amount of taxes that the International Equity Funds must pay on these amounts. For tax accounting purposes, interest payments received on these payments (if any) are treated as income and will be distributed in due course. Additionally, fluctuations in the value of foreign currencies may affect an International Equity Fund’s tax liability, because the U.S. IRS may require the Fund to pay any taxes owed on interest payments on Article 63 EU Tax Reclaims amounts in U.S. Dollars based on the foreign currency exchange rate with the applicable jurisdiction that was in effect at the time the Article 63 EU Tax Reclaims amounts were received by the Fund. As of April 30, 2018, the total amount of outstanding reclaims filed by the International Equity Funds in the countries that may be affected by the European courts’ decisions (namely, The Netherlands, Spain, Germany, France, and Sweden) represents approximately 5.7% and 8.9%, respectively, of net assets of Select International Equity Fund and Select International Equity Fund II before the impact of interest or any tax or additional costs incurred in the pursuit of such reclaims. These amounts net of estimated taxes (but excluding the impact of interest or tax on such interest) represent 3.3% and 5.1%, respectively, of net assets of Select International Equity Fund and Select International Equity Fund II. These percentages will change depending on the fluctuations of the net assets of the Funds. Receipt by a Fund of these amounts will make the Fund’s performance seem higher than it would be as a result of the performance of its portfolio investments.
There were no payments received within the six month period ended April 30, 2018. The payments received on tax reclaims and from prior periods were as follows:
| Amount | Percent of Total Net Assets | Received Date Range | ||||||||||
Select International Equity Fund | ||||||||||||
Withholding Tax Refunds Received from Country: | ||||||||||||
Finland | $ | 1,355,000 | 0.35 | %* | 5/21/2015 | |||||||
Poland | 16,452,314 | 7.74 | %** | 12/16/16-2/24/17 | ||||||||
Select International Equity Fund II | ||||||||||||
Withholding Tax Refunds Received from Country: | ||||||||||||
Finland | $ | 500,000 | 0.25 | %* | 5/21/2015 | |||||||
Poland | 4,400,193 | 4.68 | %** | 2/1/2017-2/24/17 | ||||||||
| * | As of October 31, 2015 |
| ** | October 31, 2017 |
| h. | Distributions |
Distributions from net investment income, if any, are declared and paid monthly for the Total Return Bond Fund and Global High Income Fund. Distributions from net investment income, if any, are declared and paid annually for the Select International Equity Fund and Select International Equity Fund II. The Funds will also declare and pay distributions annually from net realized gains on investment transactions and net realized foreign exchange gains, if any. Dividends and distributions to shareholders are recorded on the ex-dividend date. Additional distributions of net investment income and capital gains may be made at the discretion of the Board to avoid the application of the excise tax imposed under Section 4982 of the Internal Revenue Code of 1986, as amended (the “Code”), for certain undistributed amounts.
Dividends and distributions to shareholders are determined in accordance with federal income tax regulations, which may differ from GAAP. These differences are primarily due to differing treatments of income and gains on various investment securities held by the Funds, timing differences and differing characterization of distributions made by the Funds as a whole.
| 62 | Semi-Annual Report 2018 |
Notes to Financial Statements (continued)
April 30, 2018 (Unaudited)
| i. | Federal Income Taxes |
Each Fund intends to continue to qualify as a “regulated investment company” by complying with the provisions available to certain investment companies, as defined in Subchapter M of the Code, and to make distributions of net investment income and net realized capital gains sufficient to relieve the Funds from all federal income taxes. Therefore, no federal income tax provision is required.
Management of the Funds has concluded that there are no significant uncertain tax positions that would require recognition in the financial statements. Since tax authorities can examine previously filed tax returns, the Funds’ U.S. federal and state tax returns for each of the four fiscal years up to the most recent fiscal year ended October 31 are subject to such review.
3. Agreements and Transactions with Affiliates
| a. | Investment Adviser |
Under the Investment Advisory Agreements with the Funds, effective May 22, 2013, Aberdeen Asset Management Inc. (“Aberdeen” or the “Adviser”) manages the Funds in accordance with the policies and procedures established by the Board. Prior to May 22, 2013, the Funds were managed by Artio Global Management LLC (the “Predecessor Adviser”) , which was acquired by Aberdeen’s parent company on May 21, 2013.
For services provided under the terms of the current Investment Advisory Agreement, each Fund pays the Adviser an annual management fee (as a percentage of its average daily net assets) paid monthly according to the following schedule:
| Fund | Fee Schedule | |||||||
Select International Equity Fund | Of the first $5 billion | 0.90% | ||||||
| On the next $2.5 billion | 0.88% | |||||||
| Over $7.5 billion | 0.85% | |||||||
Select International Equity Fund II | Of the first $5 billion | 0.90% | ||||||
| On the next $2.5 billion | 0.88% | |||||||
| Over $7.5 billion | 0.85% | |||||||
Total Return Bond Fund | On all assets | 0.35% | ||||||
Global High Income Fund | Of the first $5 billion | 0.65% | ||||||
| On the next $2.5 billion | 0.63% | |||||||
| On the next $2.5 billion | 0.60% | |||||||
| Over $10 billion | 0.59% | |||||||
The Adviser has engaged the services of Aberdeen Asset Managers Limited (the “Subadviser”), an affiliate, pursuant to the subadvisory agreements. The Subadviser manages a portion of the International Equity Funds’ investments and has responsibility for making all investment decisions for the portion of a Fund’s assets that it manages. Pursuant to the subadvisory agreements, the Adviser pays fees to the Subadviser.
Certain of the Funds and Aberdeen have entered into written contracts (“Expense Limitation Agreements”) limiting operating expenses for all classes of each Fund from exceeding the amounts listed below. This contractual limitation may not be terminated without the approval of the Board until the earlier of (a) the termination of the Investment Advisory Agreement or (b) the end of February, 2019. This limit excludes certain expenses, including taxes, interest, brokerage commissions, and other expenditures which are capitalized in accordance with GAAP, and other extraordinary expenses not incurred in the ordinary course of the Fund’s business.
| Fund | Class A Limit | Institutional Class Limit | ||||||
Total Return Bond Fund | 0.69% | 0.44% | ||||||
Global High Income Fund | 1.00% | 0.75% | ||||||
The Adviser has agreed to continue to waive a portion of its management fee for each of the Funds at the annual rate of 0.005% of the respective Funds’ average daily assets. The waiver may be terminated at any time by the Board.
Aberdeen may request and receive reimbursement from a Fund of the advisory fees waived and other expenses reimbursed pursuant to the Expense Limitation Agreements at a later date not to exceed three years from the fiscal year in which the corresponding reimbursement to the Funds was made.
| 2018 Semi-Annual Report | 63 |
Notes to Financial Statements (continued)
April 30, 2018 (Unaudited)
However, no reimbursement will be made for fees waived unless:
(i) the total annual expense ratio of the class making such reimbursement is less than the limit set forth above; and
(ii) the payment of such reimbursement is approved by the Board on a quarterly basis (the “Reimbursement Requirements”).
If the Board approves any changes in the waiver terms or limitations, reimbursements are only permitted to the extent that the terms of the Expense Limitation Agreements in effect at the time of the waiver are met at the time that reimbursement is approved. Except as provided for in the Expense Limitation Agreements, reimbursement of amounts previously waived or assumed by Aberdeen is not permitted.
As of April 30, 2018, to the extent the Reimbursement Requirements are met, the cumulative potential reimbursements for each Fund, based on expenses reimbursed by Aberdeen would be:
| Fund | Amount Fiscal Year 2015 (Expires 10/31/18) | Amount Fiscal Year 2016 (Expires 10/31/19) | Amount Fiscal Year 2017 (Expires 10/31/20) | Amount Six Months Ended April 30, 2018 (Expires 4/30/21) | Total* | |||||||||||||||
Select International Equity Fund | $ | – | $ | – | $ | – | $ | – | $ | – | ||||||||||
Select International Equity Fund II | – | – | – | – | – | |||||||||||||||
Total Return Bond Fund | 82,622 | 262,142 | 257,618 | – | 602,382 | |||||||||||||||
Global High Income Fund | 198,764 | 367,227 | 525,704 | – | 1,091,695 | |||||||||||||||
| * | Amounts reported are due to expire throughout the respective 3-year expiration period presented above. |
| Amounts | listed as “–” are $0 or round to $0. |
4. Distributor and Shareholder Services
The Funds and Aberdeen Fund Distributors, LLC (the “Distributor” or “AFD”) are parties to the current Underwriting Agreement (the “Underwriting Agreement”) whereby the Distributor acts as principal underwriter for the Funds’ shares. Prior to May 22, 2013, Quasar Distributors, LLC (“Quasar”) was the distributor of the Funds.
The Funds have adopted a Distribution Plan (the “Plan”) pursuant to Rule 12b-1 under the 1940 Act with respect to certain classes of shares. The Plan permits the Funds to compensate the Distributor, for expenses associated with the distribution-related and/or shareholder services provided by such entities. These fees are paid to the Distributor and are either kept or paid to shareholders’ financial advisors or other intermediaries for distribution and shareholder services. Although actual distribution expenses may be more or less, under the Plan, the Funds pay the Distributor an annual fee of 0.25% for Class A shares.
Under its terms, the Funds’ Plan shall remain in effect from year to year, provided such continuance is approved annually by a vote of a majority of the Board members and a majority of those Board members who are not “interested persons” of the Funds and who have no direct or indirect financial interest in the operation of the Plan or in any agreement related to the Plan.
The Adviser or an affiliate of the Adviser may pay additional amounts from its own resources to dealers or other financial intermediaries, for aid in distribution or for aid in providing administrative services to shareholders.
5. Investment Transactions
Purchases and sales of securities (excluding short-term securities) for the six-month period ended April 30, 2018, were as follows:
| Fund | Purchases | Sales | ||||||
Select International Equity Fund | $ | 18,904,040 | $ | 42,708,896 | ||||
Select International Equity Fund II | 7,742,574 | 20,415,162 | ||||||
Total Return Bond Fund | 240,366,177 | 267,920,089 | ||||||
Global High Income Fund | 53,797,463 | 146,589,271 | ||||||
6. Portfolio Investment Risks
| a. | Active Trading Risk |
Certain Funds may engage in active and frequent trading of portfolio securities to achieve its investment objective. If a Fund does trade this way, it may incur increased costs, which can lower the actual return of the Fund.
| 64 | Semi-Annual Report 2018 |
Notes to Financial Statements (continued)
April 30, 2018 (Unaudited)
| b. | Asset-Backed Securities Risk |
Like traditional fixed income securities, the value of asset-backed securities typically increases when interest rates fall and decreases when interest rates rise. Certain asset-backed securities may also be subject to the risk of prepayment.
| c. | Bank Loan Risk |
There are a number of risks associated with an investment in bank loans including credit risk, interest rate risk, illiquid securities risk, and prepayment risk. There is also the possibility that the collateral securing a loan, if any, may be difficult to liquidate or be insufficient to cover the amount owed under the loan. Bank loans have significantly longer settlement periods (e.g., longer than seven days) than more traditional investments resulting in the proceeds from the sale of such loans not being readily available to make additional investments or to meet a Fund’s redemption obligations. In addition, loans are not registered under the federal securities laws like stocks and bonds, so investors in loans have less protection against improper practices than investors in registered securities. These risks could cause a Fund to lose income or principal on a particular investment, which in turn could affect a Fund’s returns.
| d. | Country/Regional Focus Risk |
Significant exposure to a single country or geographical region involves increased currency, political, regulatory and other risks. Market swings in the targeted country or geographical region likely will have a greater effect on portfolio performance than they would in a more geographically diversified fund.
| e. | Corporate Bonds |
Corporate bonds are debt instruments issued by domestic or foreign corporations or similar entities. Corporate bonds can decline in value in response to changes in the financial condition of the issuer and involve a risk of loss in case of issuer default or insolvency.
| f. | Credit Default Swap Risk |
Credit default swap contracts, a type of derivative instrument, involve special risks and may result in losses to the Fund. Credit default swap contracts may in some cases be illiquid, and they increase credit risk since the Fund has exposure to both the issuer of the referenced obligation and the counterparty to the credit default swap contracts. Swaps may be difficult to unwind or terminate. The swap market could be disrupted or limited as a result of recent legislation, and these changes could adversely affect the Fund. Additionally, to the extent the Fund sells credit default swap contracts, the Fund effectively adds economic leverage to its portfolio because, in addition to its total net assets, the Fund is subject to investment exposure on the notional amount of the swap in the event of a default of the referenced debt obligation.
| g. | Credit Risk |
A debt instrument’s price depends, in part, on the credit quality of the issuer, borrower, counterparty, or underlying collateral and can decline in response to changes in the financial condition of the issuer, borrower, counterparty, or underlying collateral, or changes in specific or general market, economic, industry, political, regulatory, geopolitical, or other conditions.
| h. | Derivatives Risk (Including Options, Futures and Swaps) |
Derivatives are speculative and may hurt a Fund’s performance. Derivatives present the risk of disproportionately increased losses and/or reduced opportunities for gains when the financial asset or measure to which the derivative is linked changes in unexpected ways. The potential benefits to be derived from the Fund’s options, futures and derivatives strategy are dependent upon the portfolio managers’ ability to discern pricing inefficiencies and predict trends in markets, which decisions could prove to be inaccurate. This requires different skills and techniques than predicting changes in the price of individual debt securities, and there can be no assurance that the use of this strategy will be successful.
Hedged Exposure Risk – Losses generated by a derivative or practice used by a Fund for hedging purposes should be substantially offset by gains on the hedged investment depending on the degree of correlation between the hedging instrument and the assets hedged. However, while hedging can reduce or eliminate losses, it can also reduce or eliminate gains.
Correlation Risk – A Fund is exposed to the risk that changes in the value of a hedging instrument will not match those of the investment being hedged.
Counterparty Risk – Derivative transactions depend on the creditworthiness of the counterparty and the counterparty’s ability to fulfill its contractual obligations.
Speculative Exposure Risk – To the extent that a derivative or practice is not used as a hedge, a Fund is directly exposed to its risks. Gains or losses from speculative positions in a derivative may be much greater than the derivative’s original cost. For example, potential losses from writing uncovered call options and from speculative short sales are unlimited.
| 2018 Semi-Annual Report | 65 |
Notes to Financial Statements (continued)
April 30, 2018 (Unaudited)
| i. | Emerging Markets Risk |
Certain Funds are subject to Emerging Markets Risk. This is a magnification of the risks that apply to foreign investments. These risks are greater for securities of companies in emerging market countries because the countries may have less stable governments, more volatile currencies and less established markets (see “Foreign Securities Risk” below).
| j. | Extension Risk |
Principal repayments may not occur as quickly as anticipated, causing the expected maturity of a security to increase. Rapidly rising interest rates may cause prepayments to occur more slowly than expected, thereby lengthening the maturity of the securities held by the Fund and making their prices more sensitive to rate changes and more volatile.
| k. | Foreign Currency Exposure Risk |
The value of foreign currencies relative to the U.S. Dollar fluctuates in response to market, economic, political, regulatory, geopolitical or other conditions. A decline in the value of a foreign currency versus the U.S. Dollar reduces the value in U.S. Dollars of investments denominated in that foreign currency. This risk may impact a Fund more greatly to the extent the Fund does not hedge its currency risk, or hedging techniques used by the Adviser are unsuccessful.
| l. | Foreign Securities Risk |
Foreign securities may be more volatile, harder to price and less liquid than U.S. securities. They are subject to different accounting and regulatory standards, and political and economic risks.
| m. | High-Yield Bonds and Other Lower-Rated Securities Risk |
A Fund’s investments in high-yield bonds (commonly referred to as “junk bonds”) and other lower-rated securities will subject the Fund to substantial risk of loss. Investments in high-yield bonds are speculative and issuers of these securities are generally considered to be less financially secure and less able to repay interest and principal than issuers of investment-grade securities. Prices of high-yield bonds tend to be very volatile. These securities are less liquid than investment-grade debt securities and may be difficult to price or sell, particularly in times of negative sentiment toward high-yield securities.
| n. | Illiquid Securities Risk |
Illiquid securities are assets which may not be sold or disposed of in the ordinary course of business within seven days at approximately the price at which a Fund has valued the investment on its books and may include such securities as those not registered under U.S. securities laws or securities that cannot be sold in public transactions. An inability to sell a portfolio position can adversely affect a Fund’s value or prevent the Fund from being able to take advantage of other investment opportunities. Over recent years, the capacity of dealers to make markets in fixed income securities has been outpaced by the growth in the size of the fixed income markets. Liquidity risk may be magnified in a rising interest rate environment or when investor redemptions from fixed income funds may be higher than normal, due to the increased supply in the market that would result from selling activity.
Each Fund employs proprietary procedures and tests using third-party and internal data inputs that seek to assess and manage the liquidity of its portfolio holdings. A Fund’s procedures and tests take into account relevant market, trading and other factors, and monitor whether liquidity assessments should be adjusted based on changed market conditions. These procedures and tests are designed to assist a Fund in determining its ability to meet redemption requests in various market conditions. In light of the dynamic nature of markets, there can be no assurance that these procedures and tests will enable a Fund to ensure that it has sufficient liquidity to meet redemption requests.
| o. | Impact of Large Redemptions and Purchases of Fund Shares Risk |
Occasionally, shareholders may make large redemptions or purchases of Fund shares, which may cause a Fund to have to sell securities or invest additional cash. These transactions may adversely affect a Fund’s performance and increase transaction costs. In addition, large redemption requests may exceed the cash balance of a Fund and result in credit line borrowing fees and/or overdraft charges to the Fund until the sale of portfolio securities to cover the redemption request settle. For additional information on redemptions, please see the Statement of Changes in Net Assets.
| p. | Interest Rate Risk |
A Fund’s fixed income investments are subject to interest rate risk, which generally causes the value of a fixed income portfolio to decrease when interest rates rise resulting in a decrease in the Fund’s net assets. A Fund may be subject to a greater risk of rising interest rates due to the current period of historically low rates and the effect of potential government fiscal policy initiatives and resulting market reaction to those initiatives. Interest rate fluctuations tend to have a greater impact on fixed income securities with a greater time to maturity and/or lower coupon. In periods of market volatility, the market values of fixed income securities may be more sensitive to changes in interest rates. A fund with a longer average portfolio duration will be more sensitive to changes in interest rates than a Fund with a shorter average portfolio duration.
| 66 | Semi-Annual Report 2018 |
Notes to Financial Statements (continued)
April 30, 2018 (Unaudited)
| q. | Issuer Risk |
The value of a security may decline for reasons directly related to the issuer, such as management performance, financial leverage and reduced demand for the issuer’s goods or service.
| r. | Large-Cap Securities Risk |
Stocks issued by large cap companies subject the Fund to the risk that those stocks may underperform stocks issued by companies with smaller capitalizations or the market as a whole.
| s. | Leverage Risk |
Certain transactions may give rise to a form of leverage. Such transactions may include, among others, loans of securities, and the use of when-issued, delayed delivery or forward commitment transactions. The use of derivatives may also cause leveraging risk.
| t. | Market Risk |
Deteriorating market conditions might cause a general weakness in the market that reduces the prices of securities in that market in which a Fund invests.
| u. | Mid-Cap Securities Risk |
Securities of medium-sized companies tend to be more volatile and less liquid than securities of larger companies.
| v. | Mortgage-Related Securities Risk |
Certain Funds may invest in mortgage-related securities. Rising interest rates may cause an issuer to exercise its right to pay principal later than expected which tends to extend the duration of mortgage-related securities, making them more sensitive to changes in interest rates. As a result, in a period of rising interest rates, a Fund that holds mortgage-related securities may exhibit additional volatility. This is known as extension risk. In addition, mortgage-related securities are subject to prepayment risk. When interest rates decline, borrowers may pay off their mortgages sooner than expected. This can reduce the returns of a Fund because the Fund will have to reinvest that money at the lower prevailing interest rates.
| w. | Municipal Securities Risk |
Certain Funds may invest in municipal bonds which may be significantly affected by political and economic changes, including inflation, as well as uncertainties in the municipal market related to taxation, legislative changes, or the rights of municipal security holders. Municipal Bonds have varying levels of sensitivity to changes in interest rates. In general, the price of a Municipal Bond can fall when interest rates rise and can rise when interest rates fall. Interest rate risk is generally lower for shorter-term Municipal Bonds and higher for long term Municipal Bonds. Under certain market conditions, the Adviser may purchase Municipal Bonds that the Adviser perceives are undervalued. Undervalued Municipal Bonds are subject to the same market volatility and principal and interest rate risks described above. Lower quality Municipal Bonds involve greater risk of default or price changes due to changes in the credit quality of the issuer. The value of lower quality Municipal Bonds often fluctuates in response to political or economic developments and can decline significantly over short periods of time or during periods of general or regional economic difficulty. In the case of tax-exempt Municipal Bonds, if the Internal Revenue Service or state tax authorities determine that an issuer of a tax-exempt Municipal Bond has not complied with applicable tax requirements, interest from the security could become taxable at the federal, state and/or local level, and the security could decline significantly in value. Municipal Bonds are subject to credit or default risk. Credit risk is the risk that the issuer of a municipal security might not make interest and principal payments on the security as they become due.
| x. | Prepayment Risk |
As interest rates decline, debt issuers may repay or refinance their loans or obligations earlier than anticipated. The issuers of fixed income securities may, therefore, repay principal in advance. This forces a Fund to reinvest the proceeds from the principal prepayments at lower rates, which reduces the Fund’s income.
| y. | Private Placements and Other Restricted Securities Risk |
Investments in private placements and other restricted securities, including Regulation S Securities and Rule 144A Securities, could have the effect of increasing a Fund’s level of illiquidity. Private placements and restricted securities may be less liquid than other investments because such securities may not always be readily sold in broad public markets and a Fund might be unable to dispose of such securities promptly or at prices reflecting their true value.
| z. | Management Risk |
Each Fund is subject to the risk that the Adviser may make poor security selections. The Adviser and its portfolio managers apply their own investment techniques and risk analyses in making investment decisions for the Funds, and there can be no guarantee that these decisions will achieve the desired results for the Funds. In addition, the Adviser may select securities that underperform the relevant market of other funds with similar investment objectives and strategies.
| 2018 Semi-Annual Report | 67 |
Notes to Financial Statements (continued)
April 30, 2018 (Unaudited)
| aa. | Small-Cap Securities Risk |
Securities of smaller companies are usually less stable in price and less liquid than those of larger, more established companies. Therefore, they generally involve greater risk.
| bb. | Sovereign Debt Risk |
Periods of economic and political uncertainty may result in the illiquidity and increased price volatility of a foreign government’s debt securities held by a Fund and impact an issuer’s ability and willingness to pay interest or repay principal when due. A Fund may have limited recourse to compel payment in the event of a default. A foreign government’s default on its debt securities may cause the value of securities held by a Fund to decline significantly.
| cc. | Valuation Risk |
The price that a Fund could receive upon the sale of any particular portfolio investment may differ from the Fund’s valuation of the investment, particularly for securities that trade in thin or volatile markets or that are valued using a fair valuation methodology or a price provided by an independent pricing service. As a result, the price received upon the sale of an investment may be less than the value ascribed by a Fund, and such Fund could realize a greater than expected loss or lesser than expected gain upon the sale of the investment. A Fund’s ability to value its investments may also be impacted by technological issues and/or errors by pricing services or other third-party service providers.
| dd. | Variable and Floating Rate Securities Risk |
For floating and variable rate obligations, there may be a lag between an actual change in the underlying interest rate benchmark and the reset time for an interest payment of such an obligation, which could harm or benefit a Fund, depending on the interest rate environment or other circumstances.
Please read the prospectus for more detailed information regarding these and other risks.
7. Contingencies
In the normal course of business, the Funds may provide general indemnifications pursuant to certain contracts and organizational documents. The Funds’ maximum exposure under these arrangements is dependent on future claims that may be made against the Funds, and therefore, cannot be estimated; however, based on experience, the risk of loss from such claims is considered remote.
8. Tax Information
As of April 30, 2018, the tax cost of securities and the breakdown of unrealized appreciation/(depreciation) for each Fund were as follows:
| Tax Cost of Securities | Unrealized Appreciation | Unrealized Depreciation | Net Unrealized Appreciation/ (Depreciation) | |||||||||||||
Select International Equity Fund | $ | 218,808,340 | $ | 27,074,313 | $ | 46,453,409 | $ | (19,379,096 | ) | |||||||
Select International Equity Fund II | 81,941,159 | 11,521,966 | (10,680,532 | ) | 841,434 | |||||||||||
Total Return Bond Fund | 287,392,017 | 3,360,981 | (8,636,336 | ) | (5,275,355 | ) | ||||||||||
Global High Income Fund | 279,443,684 | 8,502,787 | (10,016,138 | ) | (1,513,351 | ) | ||||||||||
The tax character of distributions paid during the fiscal year ended October 31, 2017 was as follows (total distributions paid may differ from the Statements of Changes in Net Assets because for tax purposes dividends are recognized when actually paid):
| Distributions paid from | ||||||||||||||||||||||||
| Fund | Ordinary Income* | Net Long Term Capital Gains* | Total Taxable Distributions | Tax Exempt Distributions | Return of Capital | Total Distributions Paid | ||||||||||||||||||
Select International Equity Fund | $ | 2,113,668 | $ | – | $ | 2,113,668 | $ | – | $ | – | $ | 2,113,668 | ||||||||||||
Select International Equity Fund II | 1,598,604 | – | 1,598,604 | – | – | 1,598,604 | ||||||||||||||||||
Total Return Bond Fund | 17,888,949 | 4,921,076 | 22,810,025 | – | – | 22,810,025 | ||||||||||||||||||
Global High Income Fund | 22,863,640 | – | 22,863,640 | – | 1,756,718 | 24,620,358 | ||||||||||||||||||
Amounts listed as “–” are $0 or round to $0.
| 68 | Semi-Annual Report 2018 |
Notes to Financial Statements (continued)
April 30, 2018 (Unaudited)
As of October 31, 2017, the components of accumulated earnings/(deficit) on a tax basis were as follows:
| Fund | Undistributed Tax Exempt Income | Undistributed Ordinary Income | Undistributed Long-Term Capital Gains | Accumulated Earnings | Distributions Payable | Late Year Ordinary and Post- October Capital Loss Deferrals | Other Temporary Differences | Unrealized Appreciation/ (Depreciation)* | Accumulated Capital and Other Losses** | Total Accumulated Earnings/ (Deficit) | ||||||||||||||||||||||||||||||
Select International Equity Fund | $ | – | $ | 8,331,714 | $ | – | $ | – | $ | – | $ | – | $ | – | $ | (24,593,768 | ) | $ | (389,010,013 | ) | $ | (405,272,067 | ) | |||||||||||||||||
Select International Equity Fund II | – | 2,365,288 | – | – | – | – | (9,965 | ) | 2,897,779 | (145,555,235 | ) | (140,302,133 | ) | |||||||||||||||||||||||||||
Total Return Bond Fund | – | 2,610,005 | 1,637,864 | – | – | – | (207,910 | ) | 1,051,916 | – | 5,091,875 | |||||||||||||||||||||||||||||
Global High Income Fund | – | – | – | – | – | – | – | 6,289,184 | (223,674,012 | ) | (217,384,828 | ) | ||||||||||||||||||||||||||||
| * | The difference between the book-basis and tax-basis unrealized appreciation/(depreciation) is attributable primarily to tax deferral of losses on wash sales. |
| ** | As of October 31, 2017, for Federal income tax purposes, the following Funds have capital loss carryforwards available to offset capital gains, if any, to the extent provided by the Treasury regulations, with no expiration. |
As of October 31, 2017, for federal tax purposes, as shown in the table below, were available to the extent provided by the regulations to offset future realized gains on each respective fund throughout the years indicated.
| Fund | Amount | Expires | ||||||
Select International Equity Fund | $ | 17,328,351 | Unlimited (Short-Term) | |||||
Select International Equity Fund | 371,681,662 | Unlimited (Long-Term) | ||||||
Select International Equity Fund II | 121,152,924 | 2018 (Short-Term) | ||||||
Select International Equity Fund II | 2,256,662 | Unlimited (Short-Term) | ||||||
Select International Equity Fund II | 22,145,649 | Unlimited (Long-Term) | ||||||
Global High Income Fund | 52,103,754 | Unlimited (Short-Term) | ||||||
Global High Income Fund | 171,570,258 | Unlimited (Long-Term) | ||||||
Under the Regulated Investment Company Modernization Act of 2010, the Funds are permitted to carry forward capital losses incurred in taxable years beginning after December 22, 2010 for an unlimited period. However, any losses incurred during those taxable years will be required to be utilized prior to the losses incurred in pre-enactment taxable years. As a result of this ordering rule, pre-enactment capital loss carryforwards may be more likely to expire unused. Additionally, post-enactment capital losses that are carried forward will retain their character as either short-term or long-term capital losses rather than being considered all short-term as under previous law.
9. Significant Shareholders
As of April 30, 2018, the following Funds had shareholders with the percentage ownership indicated, which are considered significant shareholders (holdings greater than 5.0%) for financial reporting purposes:
| Fund | Record Ownership % | Number of Account Owners | ||||
Select International Equity Fund | 62.6 | % | 2 | |||
Select International Equity Fund II | 52.2 | 4 | ||||
Total Return Bond Fund | 69.7 | 6 | ||||
Global High Income Fund | 58.8 | 5 | ||||
Amounts listed as “–” are $0 or round to $0.
| 2018 Semi-Annual Report | 69 |
Notes to Financial Statements (concluded)
April 30, 2018 (Unaudited)
10. Line of Credit
Aberdeen Investment Funds (the “Borrowers”) entered into a Credit Agreement (the “Agreement”) with State Street Bank and Trust Company (the “Bank”). The Agreement provides for a revolving credit facility (the “Credit Facility”) to be utilized for temporary or emergency purposes to Fund shareholder redemptions or for other short-term liquidity purposes. The amount of the Credit Facility was $25,000,000 for the six-month period ended April 30, 2018. The Funds may draw up to their stated sublimit (subject to certain other limitations therein):
| Sublimit Amount | Average Outstanding Daily Balance | Average Weighted Interest Rate | Days Utilized | |||||||||||||
Select International Equity | $ | 25,000,000 | $ | 440,613 | 2.856 | % | 11 | |||||||||
Select International Equity II | $ | 25,000,000 | 1,960,000 | 2.856 | % | 5 | ||||||||||
Total Return Bond Fund | $ | 25,000,000 | 1,037,335 | 2.856 | % | 4 | ||||||||||
In addition, the Global High Income Fund entered into a separate Credit Agreement (the “Global High Income Fund Credit Agreement”) with the Bank. The Global High Income Fund Credit Agreement provides for a revolving credit facility (the “Global High Income Fund Credit Facility”) to be utilized for temporary or emergency purposes to Fund shareholder redemptions or for other short-term liquidity purposes. The amount of the Global High Income Fund Credit Facility was $50,000,000 for the six-month period ended April 30, 2018. The Global High Income Fund may draw the entire $50,000,000 (subject to certain limitations).
| Sublimit Amount | Average Outstanding Daily Balance | Average Weighted Interest Rate | Days Utilized | |||||||||||||
Global High Income Fund | $ | 50,000,000 | $ | 2,905,000 | | 2.856 | % | 5 | ||||||||
Principal on each outstanding loan made under the Agreement and the Global High Income Fund Credit Agreement bears the interest at a variable rate per annum equal to the higher of (a) the Federal Funds Rate as in effect on that day (not less than zero) plus 1.25% or (b) the One-Month London Interbank Offered Rate as in effect on that day (not less than zero) plus 1.25%. In addition, the Borrowers shall pay to the Bank a commitment fee at the rate of 0.25% per annum on the daily unused portion of each of the Credit Facility or Global High Income Fund Credit Facility, as applicable, which is allocated among the Borrowers in such manner as is determined by the Board to be reasonable.
11. Subsequent Events
Management has evaluated the need for disclosures and/or adjustments resulting from subsequent events through the date the financial statements were issued. Based on this evaluation, no disclosures and/or adjustments were required to the financial statements as of April 30, 2018.
| 70 | Semi-Annual Report 2018 |
Shareholder Expense Examples (Unaudited)
As a shareholder of the Aberdeen Investment Funds you incur ongoing costs, including investment advisory fees, shareholder service fees, distribution fees and other Fund expenses. The examples below are intended to help you understand your ongoing costs (in dollars) of investing in the Funds and to compare these costs with the ongoing costs of investing in other mutual funds.
The examples assume that you had a $1,000 investment in the Class at the beginning of the reporting period, November 1, 2017 and continued to hold your shares at the end of the reporting period, April 30, 2018.
Actual Expenses
The table below provides information about actual account values and actual expenses. You may use the information together with the amount you invested, to estimate the expenses that you paid over the period. Simply divide your account value by $1,000 (for example, an $8,600 account value divided by $1,000 = 8.6), then multiply the result by the number under the heading entitled “Actual Expenses Paid During Period” for the class of a Fund that you own to estimate the expenses you paid on your account during the period.
Hypothetical Example for Comparison Purposes
The table below provides information about hypothetical account values and hypothetical expenses based on the Class’ actual expense ratio and an assumed rate of return of 5% per year before expenses, which is not the Class’ actual return. The hypothetical account values and expenses may not be used to estimate the actual ending account balance or expenses you paid for the period. You may use this information to compare the ongoing costs of investing in the Class of a Fund and other funds. To do so, compare the 5% hypothetical example with the 5% hypothetical examples that appear in the shareholder reports of the other funds.
| Beginning Account Value, November 1, 2017 | Actual Ending Account Value, April 30, 2018 | Hypothetical Ending Account Value | Actual Expenses Paid During Period* | Hypothetical Expenses Paid During Period*1 | Annualized Expense Ratio | |||||||||||||||||||||
Select International Equity Fund** | Class A | $ | 1,000.00 | $ | 1,005.20 | $ | 1,017.56 | $ | 7.26 | $ | 7.30 | 1.46% | ||||||||||||||
Institutional Class | 1,000.00 | 1,006.60 | 1,018.79 | 6.02 | 6.06 | 1.21% | ||||||||||||||||||||
Select International Equity Fund II** | Class A | 1,000.00 | 1,006.50 | 1,016.61 | 8.21 | 8.25 | 1.65% | |||||||||||||||||||
Institutional Class | 1,000.00 | 1,000.00 | 1,017.85 | 6.94 | 7.00 | 1.40% | ||||||||||||||||||||
Total Return Bond Fund | Class A | 1,000.00 | 982.90 | 1,021.37 | 3.39 | 3.46 | 0.69% | |||||||||||||||||||
Institutional Class | 1,000.00 | 983.90 | 1,022.61 | 2.16 | 2.21 | 0.44% | ||||||||||||||||||||
Global High Income Fund | Class A | 1,000.00 | 998.30 | 1,019.84 | 4.95 | 5.01 | 1.00% | |||||||||||||||||||
Institutional Class | 1,000.00 | 999.50 | 1,021.08 | 3.72 | 3.76 | 0.75% | ||||||||||||||||||||
| * | Expenses are equal to the Fund’s annualized expense ratio multiplied by the average account value over the period multiplied by 181/365 (to reflect the one-half year period). |
| 1 | Represents the hypothetical 5% return before expenses. |
| ** | Uncertain taxes and costs associated with Article 63 EU Tax Reclaims are not included in the expense table above for Select International Equity Fund and Select International Equity Fund II. In addition to the operating expenses shown in the table above and based on the information available as of the date of this Report, the Fund has accrued an estimated tax expense for the potential taxes and costs of the Article 63 EU Tax Reclaims, which is not included in the table above. If these taxes and costs were included in the table above, the annualized expense ratio and actual expenses paid would materially increase. |
| 2018 Semi-Annual Report | 71 |
Rev. 09/2017
FACTS | WHAT DOES ABERDEEN ASSET MANAGEMENT DO WITH YOUR PERSONAL INFORMATION? |  | ||||||
Why? | Financial companies choose how they share your personal information. Applicable US and Canadian law gives consumers the right to limit some but not all sharing. These also require us to tell you how we collect, share, and protect your personal information. Please read this notice carefully to understand what we do. | |||||||
What? | The types of personal information we collect and share depend on the product or service you have with us. This information can include:
· Social Security/ Social Insurance number and account balances
· Transaction history and assets
· Account transactions and wire transfer instructions |
| ||||||
How? | All financial companies need to share customers’ personal information to run their everyday business. In the section below, we list the reasons financial companies can share their customers’ personal information; the reasons Aberdeen Asset Management chooses to share; and whether you can limit this sharing. Where Aberdeen does share personal information with a trusted third party, it does so under strict terms that require the information to be used only for the purpose for which it was disclosed, kept confidential and protected by appropriate security safeguards. | |||||||
Reasons we can share your personal information | Does Aberdeen Asset Management share? | | Can you limit this sharing? | | ||||
For our everyday business purposes— such as to process your transactions, maintain your account(s), respond to court orders and legal investigations, or report to credit bureaus | Yes | No | ||||||
For our marketing purposes— to offer our products and services to you | Yes | Yes | ||||||
For joint marketing with other financial companies | No | We don’t share | ||||||
For our affiliates’ everyday business purposes— information about your transactions and experiences | Yes | Opt out available | ||||||
For our affiliates’ everyday business purposes— information about your creditworthiness | No | We don’t share | ||||||
For our affiliates to market to you | No | We don’t share | ||||||
For nonaffiliates to market to you | No | We don’t share | ||||||
To limit our sharing | · Call 215-405-5735
Please note:
If you are a new customer, we can begin sharing your information 30 days from the date we sent this notice. When you are no longer our customer, we continue to share your information as described in this notice until this information is no longer required.
However, you can contact us at any time to limit our sharing. |
| ||||||
Questions? | www.aberdeen-asset.us | |||||||
| Page 2 | |
Who we are | ||
Who is providing this notice? | Aberdeen U.S. Registered Investment Advisers (collectively referred to as “Aberdeen Asset Management”) | |
What we do | ||
How does Aberdeen Asset Management protect my personal information? | To protect your personal information from unauthorized access and use, we use security measures that comply with applicable laws. These measures include computer safeguards and secured files and buildings. | |
How does Aberdeen Asset Management collect my personal information? | We collect your personal information, for example, when you:
· Open an account or give us your contact information
· Seek advice about your investments or make deposits or withdrawals from your account
· Enter into an investment advisory contract
We also collect your personal information from others, such as credit bureaus, affiliates, or other companies. | |
Why can’t I limit all sharing? | In order to provide you with the services for which you have engaged Aberdeen, the company relies on a number of third parties to provide support services, including profession, legal, accounting and technical support. Provincial laws and individual companies may give you additional rights to limit sharing.
US Federal law gives you the right to limit only:
· Sharing for Aberdeen and affiliates’ everyday business purposes—information about your creditworthiness
· Aberdeen and Affiliates from using your information to market to you
· Sharing for nonaffiliates to market to you
State laws and individual companies may give you additional rights to limit sharing. | |
What happens when I limit sharing for an account I hold jointly with someone else? | Your choices will apply to everyone on your account. | |
Definitions | ||
Affiliates | Companies related by common ownership or control. They can be financial and nonfinancial companies.
· Our affiliates include companies with an Aberdeen Asset Management name and wholly-owned subsidiaries of Aberdeen Asset Management PLC, a global financial services company. | |
Nonaffiliates | Companies not related by common ownership or control. They can be financial and nonfinancial companies.
· Aberdeen Asset Management does not share personal information with nonaffiliates so they can market to you. | |
Joint marketing | A formal agreement between nonaffiliated financial companies that together market financial products or services to you.
· Aberdeen Asset Management doesn’t jointly market. | |
Other important information | ||
| This Privacy Notice is being provided by Aberdeen Asset Management, namely Aberdeen Asset Management Inc, Aberdeen Asset Managers Limited, Aberdeen Asset Management Limited, Aberdeen Asset Management Asia Limited, Aberdeen Capital Management LLC, and Arden Asset Management LLC. | ||
Management Information
Trustees
Antoine Bernheim, Chairman
Thomas Gibbons
Bev Hendry
Robert S. Matthews
Peter Wolfram
Officers
Bev Hendry, President and Chief Executive Officer
Jeffrey Cotton, Chief Compliance Officer, Vice President and Anti-Money Laundering and Identity Theft Officer
Andrea Melia, Treasurer and Chief Financial Officer
Brian Link, Secretary
Megan Kennedy, Assistant Secretary and Vice President
Lucia Sitar, Chief Legal Officer and Vice President
Joseph Andolina, Vice President – Compliance
Lynn Chen, Vice President
Alan Goodson, Vice President
Stephen Docherty, Vice President
Steven Logan, Vice President
Jennifer Nichols, Vice President
Hugh Young, Vice President
Brian O’Neill, Assistant Treasurer
Eric Olsen, Assistant Treasurer
Andrew Kim, Assistant Secretary Stephen Varga, Assistant Secretary
Investment Adviser
Aberdeen Asset Management Inc.
1735 Market Street, 32nd Floor
Philadelphia, PA 19103
Transfer Agent
DST Asset Manager Solutions, Inc. (formerly, Boston Financial Data Services, Inc.)
333 West 11th Street,
Kansas City, MO 64105
Distributor
Aberdeen Fund Distributors LLC
1735 Market Street, 32nd Floor
Philadelphia, PA 19103
Fund Administrator, Custodian & Fund Accountant
State Street Bank and Trust Company
1 Heritage Drive, 3rd Floor
North Quincy, MA 02171
Independent Registered Public Accounting Firm
KPMG LLP
1601 Market Street
Philadelphia, PA 19103
Fund Counsel
Shearman & Sterling LLP
599 Lexington Avenue
New York, NY 10022
Aberdeen Asset Management Inc. 1735 Market Street, 32nd Floor Philadelphia, PA 19103 aberdeen-asset.us | |
AOE-0377-SAR
| Item | 2. Code of Ethics. |
Not applicable – for annual reports only.
| Item | 3. Audit Committee Financial Expert. |
Not applicable – for annual reports only.
| Item | 4. Principal Accountant Fees and Services. |
Not applicable – for annual reports only.
| Item | 5. Audit Committee of Listed Registrants. |
Not applicable – for annual reports only.
| Item | 6. Schedule of Investments |
| (a) | Included as part of the Reports to Shareholders filed under Item 1 of this Form N-CSR. |
| (b) | Not applicable. |
| Item | 7. Disclosure of Proxy Voting Policies and Procedures for Closed-End Management Investment Companies. |
Not applicable.
| Item | 8. Portfolio Managers of Closed-end Management Investment Companies. |
Not applicable.
| Item | 9. Purchases of Equity Securities by Closed-End Management Investment Company and Affiliated Purchasers. |
Not applicable.
| Item | 10. Submission of Matters to a Vote of Security Holders. |
During the period ended April 30, 2018, there were no material changes to the procedures by which shareholders may recommend nominees to the Registrant’s Board of Trustees.
| Item | 11. Controls and Procedures. |
| (a) | The Registrant’s principal executive and principal financial officers, or persons performing similar functions, have concluded that the Registrant’s disclosure controls and procedures (as defined in Rule 30a-3(c) under the Investment Company Act of 1940 (the “Act”) (17 CFR 270.30a-3(c))) are effective, as of a date within 90 days of the filing date of the report that includes the disclosure required by this paragraph, based on the evaluation of these controls and procedures required by Rule 30a-3(b) under the Act (17 CFR 270.30a3(b)) and Rule 13a-15(b) or 15d-15(b) under the Securities Exchange Act of 1934 (17 CFR 240.13a-15(b) or 240.15d15(b)). |
| (b) | There were no changes in the Registrant’s internal control over financial reporting (as defined in Rule 30a-3(d) under the Act (17 CFR 270.30a-3(d)) that occurred during the second fiscal quarter of the period covered by this report that has materially affected, or are reasonably likely to materially affect, the Registrant’s internal control over financial reporting. |
| Item | 12. Disclosure of Securities Lending Activities for Closed-End Management Investment Companies. |
Not applicable.
| Item | 13. Exhibits. |
(a)(1) Not applicable.
(a)(2) Certifications pursuant to Rule 30a-2(a) under the Act and Section 302 of the Sarbanes-Oxley Act of 2002 are attached hereto.
(a)(3) Not applicable.
(b) Certifications pursuant to Rule 30a-2(b) under the Act and Section 906 of the Sarbanes-Oxley Act of 2002 are attached hereto.
SIGNATURES
Pursuant to the requirements of the Securities Exchange Act of 1934 and the Investment Company Act of 1940, as amended, the Registrant has duly caused this report to be signed on its behalf by the undersigned, thereunto duly authorized.
| Aberdeen Investment Funds | ||||
| BY: | /s/ Bev Hendry | |||
Bev Hendry Principal Executive Officer of Aberdeen Investment Funds | ||||
| Date: July 6, 2018 | ||||
Pursuant to the requirements of the Securities Exchange Act of 1934 and the Investment Company Act of 1940, as amended, this report has been signed below by the following persons on behalf of the Registrant and in the capacities and on the dates indicated.
| BY: | /s/ Bev Hendry | |||
Bev Hendry Principal Executive Officer of Aberdeen Investment Funds | ||||
| Date: July 6, 2018 | ||||
| BY: | /s/ Andrea Melia | |||
Andrea Melia Principal Financial Officer of Aberdeen Investment Funds | ||||
| Date: July 6, 2018 | ||||