UNITED STATES
SECURITIES AND EXCHANGE COMMISSION
Washington, D.C. 20549
FORM N-CSR
CERTIFIED SHAREHOLDER REPORT OF REGISTERED
MANAGEMENT INVESTMENT COMPANIES
Investment Company Act file number: 811-06652
Exact name of registrant as specified in charter:
Aberdeen Investment Funds
Address of principal executive offices:
1735 Market Street, 32nd Floor
Philadelphia, PA 19103
Name and address of agent for service:
Ms. Andrea Melia
Aberdeen Asset Management Inc.
1735 Market Street, 32nd Floor
Philadelphia, PA 19103
Registrant’s telephone number, including area code: 866-667-9231
Date of fiscal year end: October 31
Date of reporting period: April 30, 2015
Item 1. Reports to Shareholders.

Aberdeen Investment Funds
Semi-Annual Report
April 30, 2015
Aberdeen Select International Equity Fund
Aberdeen Select International Equity Fund II
Aberdeen Total Return Bond Fund
Aberdeen Global High Income Fund

| Page 1 | ||||
| Page 2 | ||||
| Page 3 | ||||
| Page 9 | ||||
| Page 15 | ||||
| Page 28 | ||||
| Page 39 | ||||
| Page 54 | ||||
| Page 73 | ||||
Investors should carefully consider a fund’s investment objectives, risks, fees, and expenses before investing any money. To obtain this and other fund information, please call 1-866-667-9231 to request a prospectus, or download a prospectus at www.aberdeen-asset.us. Please read it carefully before investing any money.
Investing in mutual funds involves risk, including possible loss of principal.
Aberdeen Select International Equity Fund, Aberdeen Select International Equity Fund II, Aberdeen Total Return Bond Fund, and Aberdeen Global High Income Fund, (collectively the “Aberdeen Investment Funds”) are distributed by Aberdeen Fund Distributors, LLC, Member FINRA, 1735 Market Street, 32nd Floor, Philadelphia, PA 19103.
Aberdeen Asset Management Inc. (AAMI) has been registered as an investment adviser under the Investment Advisers Act of 1940 since August 23,1995.
Statement Regarding Availability of Quarterly Portfolio Schedule.
The complete schedule of portfolio holdings for Aberdeen Investment Funds is included in the Funds’ semi-annual and annual reports to shareholders. Aberdeen Investment Funds file complete schedules of portfolio holdings for each Fund with the Securities and Exchange Commission (the “SEC”) for the first and third quarters of each fiscal year on Form N-Q. The Funds’ Forms N-Q are available on the SEC’s website at http://www.sec.gov. The Funds’ Forms N-Q may be reviewed and copied at the SEC’s Public Reference Room in Washington, DC, and information on the operation of the Public Reference Room may be obtained by calling 800-SEC-0330. The Funds make their most recent Forms N-Q available to shareholders on www.aberdeen-asset.us or upon request without charge.
Statement Regarding Availability of Proxy Voting Record.
Information regarding the policies and procedures that the Funds use to determine how to vote proxies relating to portfolio securities is available without charge, upon request, by calling 1-866-667-9231. The information is also included in the Funds’ Statement of Additional Information, which is available on the Funds’ website at www.aberdeen-asset.us and on the SEC’s website at www.sec.gov.
Information relating to how each Fund voted proxies relating to portfolio securities held during the most recent twelve months ended June 30 is available by August 30 of the relevant year: (i) upon request and without charge by calling 1-866-667-9231; and (ii) on the SEC’s website at www.sec.gov.
April 30, 2015
Dear Valued Shareholder,
Welcome to the Aberdeen Investment Funds Semi-Annual Report covering the activities for the six-month period ended April 30, 2015.
Market overview
There were numerous global market gyrations during the period in response to economic data releases, declining energy prices and ongoing U.S. dollar strength. However, no single global entity generated more interest than the U.S. Federal Reserve (Fed). Investors worldwide seemed to hang on every word from Fed Chair Janet Yellen and the Federal Open Market Committee (FOMC) in an effort to gauge the direction of U.S. interest rates. By the end of the period, the consensus was that the Fed would delay increasing the federal funds rate until later in the year, given the less-than-robust economic data reports.
In Aberdeen’s view, U.S. equities remain underpinned by justifiable valuations and reasonable corporate performance. Low interest rates continue to provide support to the broader asset class given what should prove a measured – if not protracted – rise in interest rates over the next several years. We think that the outlook for the Eurozone has brightened, underpinned by still-low commodity prices and a weak euro. Although valuations have started to appear full, loose monetary policies and historically low bond yields are likely to continue supporting stock markets. Finally, the normalization of Fed policy is based on the assumption of a sustainable U.S. recovery, which we think should bode well for export-led economies in Asia. The Asia region still boasts some of the world’s fastest-growing economies, despite slower expansion. At the corporate level, there are few signs of an earnings recovery, but companies are making progress in cutting costs to operate more efficiently.
Anne Richards, Aberdeen’s Chief Investment Officer, provides you with a detailed insight on the investment marketplace in the Global Market Review and Outlook on the following page.
Thank you for choosing Aberdeen Investment Funds. We value your investment with us.
Kind Regards,
Bev Hendry
President
Aberdeen Investment Funds
2015 Semi-Annual Report
1
There were divergent performances among geographical regions and asset classes within global financial markets for the six-month reporting period ended April 30, 2015. Regarding stocks, the MSCI World Index, the global large-cap equity market benchmark, gained 5.4% for the period. In a reversal of an earlier trend in the developed markets, U.S. equities underperformed relative to shares of European and Asian large-cap companies. The U.S broad-market S&P 500 Index returned 4.4% for the period versus the 5.8% gain of the MSCI All-Country (AC) World ex U.S. Index. The emerging markets lagged their developed peers during the reporting period due largely to the sharp downturn in the Latin American stock market. Nonetheless, the MSCI Emerging Markets Index rose 4.0% mainly on the strong performance of Chinese equities. The global markets encountered several bouts of volatility amid the rise in oil and commodity prices for much of the period; varying economic news; concerns about ongoing geopolitical tensions in the Middle East; worries over slowing growth in Europe and Asia; and the beginning of aggressive quantitative easing (QE) programs from the European Central Bank (ECB) and the Bank of Japan. Additionally, there was much speculation throughout the period regarding U.S. Federal Reserve (Fed) monetary policy and the timing of any interest rate increases.
U.S. stocks benefited from generally positive economic data and corporate earnings reports over the period. These positive factors offset pressure on companies with significant international exposure, which were negatively affected by the ongoing strength in the U.S. dollar – making U.S. exports relatively less attractive to overseas consumers. This factor had a negative impact on the nation’s gross domestic product (GDP), which declined 0.7% in the first quarter of 2015, attributable mainly to an upturn in imports. GDP grew by a more robust, albeit still below historical trend, rate of 2.2% quarter-over-quarter for the last three months of 2014. At its meeting towards the end of the reporting period in April 2015, the Fed acknowledged the slowdown in economic growth and maintained the federal funds rate near 0%.
UK stocks posted gains over the six-month period but underperformed their European counterparts. UK economic growth did not meet expectations while inflation was virtually flat over the period. The European market benefited from generally positive economic data and an improving outlook for Eurozone manufacturing. Furthermore, the ECB began its larger-than-expected QE program. However, investor confidence was dampened by worries about a possible Greek exit from the Eurozone. Shortly after the close of the reporting period in early May, UK Prime Minister David Cameron’s Conservative Party won a majority in the House of Commons, significantly outpolling the opposition Labor Party. The victory ensures that Cameron will be able to form a new government without the need for a coalition or a formal agreement with other parties.
There were particular deviations in performance in the global emerging equity markets during the reporting period, as strength in China offset a notable decline in Latin America. Expectations of looser monetary policy, as well as the decision to allow Chinese funds to invest in Hong Kong-listed shares without a special license, were the primary drivers of the market in China. Following an earlier downturn, Russian stocks rallied in the second half of the reporting period, buoyed by steadier oil prices and the ceasefire with Ukraine, which alleviated fears of further Western sanctions. Conversely, the slump in Latin American stocks over the period was attributable largely to lower oil prices, which weighed on net energy exporters such as Colombia and Mexico. Brazilian equities and the real, the national currency unit, lost ground due to dissatisfaction over the state of the economy and the unfolding corruption scandal of Petrobras, the state-owned oil company. This culminated in mass demonstrations calling for President Dilma Rousseff’s impeachment during the reporting period.
The global fixed income markets encountered mixed performance over the period, but ended with an overall negative return, as measured by the benchmark Barclays Global Aggregate Bond Index. The performance of the asset class was hampered mainly by European bonds, which declined amid concerns regarding Greece’s future in the Eurozone. U.S. investment-grade securities recorded modest gains and outperformed their international counterparts, as yields declined in all but the shortest segments of the U.S. Treasury yield curve. The overall returns of investment-grade corporate bonds exceeded those of high yield issues, with the Bank of America Merrill Lynch (BofA ML) Global Broad Market Corporate Index advancing 2.4% versus the 2.0% return of the BofA ML Global High Yield Constrained Index for the period. In the emerging markets, the direction of oil prices negatively drove investor sentiment in certain credits. However, the J.P. Morgan EMBI Global Diversified Index rose 1.4% as those countries less affected by the volatility of commodity prices benefited from yield-hungry investors looking to diversify away from developed markets.
Outlook
Hopes of continued loose monetary policy have provided some relief to global stock markets. However, we think that the effect is likely to be temporary, especially in economies where structural weaknesses persist. We believe that stock prices are starting to appear frothy, especially against the backdrop of a global economic slowdown. Consequently, we think that share prices may be due for a correction when the Fed eventually decides to hike interest rates. Within the global fixed income universe, we foresee broad-based yield-curve flattening across core markets, while the levels of nominal yields remain depressed due to weak inflation and large-scale asset purchase programs in Europe and Japan. Even as the Fed moves towards hiking interest rates in the U.S., we think that it is unlikely that the U.S. – European yield spread will widen materially as higher U.S. Treasury yields most likely will attract demand.
Anne Richards
Chief Investment Officer
Aberdeen Asset Management
Indexes are unmanaged and have been provided for comparison purposes only. No fees or expenses are reflected. You cannot invest directly in an index.
Semi-Annual Report 2015
2
Aberdeen Select International Equity Fund (Unaudited)
Aberdeen Select International Equity Fund (Class A shares at net asset value net of fees) returned -0.48% for the six-month period ended April 30, 2015, versus 5.78% for its benchmark, the MSCI All Country World ex U.S. Index, during the same period. For broader comparison, the average return of the Fund’s Lipper peer category of International Multi-Cap Growth Funds (consisting of 113 funds) was 5.97% for the period.
International equities rose during the six-month review period, buoyed by loose global monetary policy. Although the U.S. Federal Reserve (Fed) officially ended its bond-buying program, the Bank of Japan’s increased stimulus, along with the launch of the European Central Bank’s quantitative easing, kept markets awash with liquidity. China also continued to lower benchmark rates and lenders’ reserve ratios in a bid to spur economic growth, after 2014 gross domestic product (GDP) missed official targets for the first time in 17 years. However, Brent crude oil prices sank to a five-year low after the Organization of the Petroleum Exporting Countries (OPEC), following Saudi Arabia’s lead, resisted calls for a cut in output and left production targets unchanged. The sustained drop in oil prices caused turmoil in Russia’s financial markets and the rouble’s collapse, which reverberated worldwide. Sentiment was further dampened by escalating instability in the Middle East and growing doubts that Greece would reach an agreement with creditors in time to unlock about €7 billion (roughly US$7.8 billion) in bailout funds. Nonetheless, international equities rebounded towards the end of the period, as weaker-than-expected U.S. economic activity sparked hopes of a delayed interest rate hike.
Brazilian miner Vale was a key detractor from Fund performance for the reporting period. Its credit rating was downgraded by Standard and Poor’s (S&P), reflecting the credit rating agency’s expectations that it will be hampered in the near term by depressed iron ore prices. Another Brazilian holding, Banco Bradesco, also hindered Fund performance as dissatisfaction over the state of the economy and the unfolding corruption scandal of state-owned oil company Petrobras weighed on the broader market. Despite reporting decent quarterly results that were driven by healthy interest and fee income, shares of the lender fell along with other local banks on worries that the government’s decision to hike taxes on personal loans may slow lending growth. Stock selection in the UK also hindered Fund performance. Utility company Centrica underperformed its peers due to weak full-year 2014 results and management’s decision to cut dividends by a third in order to maintain the group’s investment-grade rating. Engineering services provider Weir Group’s share price fell after analyst downgrades on the back of lower commodity prices.
Meanwhile, falling crude prices have curtailed capital expenditure in the energy sector, which has in turn hurt the bottom lines of oil services companies such as Tenaris. Reduced U.S. drilling activity, as well as de-stocking in the Middle East and Africa, also weighed on the steel pipe-maker’s results. The oil price slump affected holdings such as Royal Dutch Shell and Tenaris. Shell announced plans to cut spending by US$15 billion over the next three years amid a decline in earnings, while oil and gas pipe-maker Tenaris posted weaker-than-expected results because of lower sales of its premium pipes. Reduced U.S. drilling activity, as well as de-stocking in the Middle East and Africa, weighed on the steel pipe-maker’s results.
Conversely, top contributors to Fund performance included Japanese robot-maker Fanuc, Hong Kong-based insurance company AIA, and Swiss drug-maker Novartis. Fanuc’s shares rose after management announced plans to set up a shareholder relations department, in the wake of the government’s new corporate governance rules. The company subsequently released full-year 2014 results that generally met the market’s expectations, raised its dividend payout ratio1 from 30% to 60%, and adopted a flexible share-buyback policy. AIA delivered excellent full-year results on the back of resilient volumes and widening margins. Swiss pharmaceutical firm Novartis reported virtually flat year-over-year sales and operating income for its full-year results, but proposed a 6% dividend increase and indicated a positive outlook for 2015 as a result of recent drug successes and a portfolio overhaul.
During the reporting period, we initiated positions in three stocks: Israel-based IT services company Check Point Software, German healthcare services provider Fresenius Medical Care, and Singapore lender OCBC. In our view, Check Point Software has a strong market position within infrastructure software and network security, while we believe that Fresenius Medical Care is well placed to benefit from aging population trends and steady growth in the global dialysis market. We believe that OCBC is a well-managed bank with a solid capital base and good cost-to-income ratio. In contrast, we sold the Fund’s shares in Petrobras because of the deterioration in its business quality. We also exited the positions in UK utility company Centrica due to increased regulatory and political interference; integrated energy company Eni on our concerns over the sustainability of its dividend and PetroChina following a period of relative share price strength.
Hopes of continued loose monetary policy have provided some relief to global stock markets. However, we think that the effect is likely to be temporary, especially in economies where structural weaknesses persist. While some of the Fund’s holdings have benefited from the run-up in the global equity markets, we believe that stock prices are starting to appear frothy, especially against the backdrop of a global economic slowdown. Consequently, we believe that share prices may be due for a correction when the Fed eventually decides to hike interest rates. Despite the challenging operating environment, however, results from the Fund’s holdings have been relatively resilient, in our view. We remain confident in their ability to grow earnings over the long term.
Portfolio Management:
Aberdeen Global Equity Team
PAST PERFORMANCE DOES NOT GUARANTEE FUTURE RESULTS.
The performance quoted represents past performance, which does not guarantee future results. Class A shares have up to a 0.25% 12b-1 fee. The investment return and principal value of an investment will fluctuate so that
| 1 | The dividend payout ratio represents the percentage of earnings paid to shareholders in dividends. |
2015 Semi-Annual Report
3
Aberdeen Select International Equity Fund (Unaudited) (concluded)
an investor’s shares, when redeemed, may be worth more or less than their original cost. Current performance of the Fund may be lower or higher than the performance quoted. Performance data current to the most recent month-end may be obtained by calling 866-667-9231 or visiting www.aberdeen-asset.us.
Investing in mutual funds involves risk, including the possible loss of principal. There is no assurance that the investment objective of any fund will be achieved. Indexes are unmanaged and have been provided for comparison purposes only. No fees or expenses are reflected. You cannot invest directly in an index.
Lipper is a leading global provider of mutual fund information and analysis to fund companies, financial intermediaries and media organizations.
Risk Considerations
Foreign securities are more volatile, harder to price and less liquid than U.S. securities. They are subject to different accounting and regulatory standards, and political and economic risks. These risks are enhanced in emerging markets countries.
Equity stocks of small and mid-cap companies carry greater risk, and more volatility than equity stocks of larger, more established companies.
Please read the prospectus for more detailed information regarding these and other risks.
Semi-Annual Report 2015
4
Aberdeen Select International Equity Fund (Unaudited)
Average Annual Total Return (For periods ended April 30, 2015) | Six Month† | 1 Yr. | 5 Yr. | 10 Yr. | ||||||||||
Class A | (0.48%) | (4.73% | ) | 1.32% | 3.31% | |||||||||
Institutional Class1 | (0.35%) | (4.51% | ) | 1.56% | 3.57% | |||||||||
| † | Not Annualized |
| 1 | Formerly Class I |
2015 Semi-Annual Report
5
Aberdeen Select International Equity Fund (Unaudited)
Performance of a $10,000 Investment (as of April 30, 2015)

Comparative performance of $10,000 invested in Class A shares of the Aberdeen Select International Equity Fund, Morgan Stanley Capital International All Country World ex-U.S. Index (MSCI ACWI ex-U.S. Index), and the Consumer Price Index (CPI) over a 10-year period ended April 30, 2015. Unlike the Fund’s returns, the returns for these unmanaged indexes do not reflect any fees or expenses. Investors cannot invest directly in market indexes.
The MSCI ACWI ex-U.S. Index captures large, mid, small and micro cap respresentation across 22 of 23 Developed Markets (DM) countries* (excluding the United States). With 8,059 constituents, the index covers approximately 99% of the free float-adjusted market capitalization in each country.
The CPI is a measure of the average change over time in the prices paid by urban consumers for a market basket of consumer goods and services.
Investment return and principal value will fluctuate, and when redeemed, shares may be worth more or less than original cost. Past performance is no guarantee of future results. The Average Annual Total Return table and performance graph do not reflect the deduction of taxes that a shareholder would pay on Fund distributions or the redemption of Fund shares. Investing in mutual funds involves market risk, including loss of principal. Performance returns assume the reinvestment of all distributions. Performance returns reflect fee waivers and reimbursements in effect without which returns would have been lower.
Portfolio Summary (as a percentage of net assets)
April 30, 2015 (Unaudited)
| Asset Allocation | ||||
Common Stocks | 85.2% | |||
Preferred Stocks | 10.4% | |||
Repurchase Agreement | 3.1% | |||
Government Bonds | 0.1% | |||
Exchange Traded Funds | 0.0% | 1 | ||
Other assets in excess of liabilities | 1.2% | |||
| 100.0% | ||||
| 1 | Represents a security that is fair valued at zero pursuant to procedures approved by the Fund’s Board of Trustees. See Note 2(a) of the accompanying Notes to Financial Statements. |
The following table summarizes the composition of the Fund’s portfolio, in Standard & Poor’s Global Industry Classification Standard (GICS) sectors, expressed as a percentage of net assets. The GICS structure consists of 10 sectors, 24 industry groups, 68 industries and 154 sub-industries. As of April 30, 2015, the Fund did not have more than 25% of its assets invested in any industry group.
| Top Sectors | ||||
Financials | 18.4% | |||
Industrials | 17.5% | |||
Consumer Staples | 15.0% | |||
Materials | 10.9% | |||
Health Care | 9.9% | |||
Information Technology | 9.7% | |||
Telecommunication Services | 6.8% | |||
Energy | 6.4% | |||
Utilities | 1.0% | |||
Other | 4.4% | |||
| 100.0% | ||||
| Top Holdings* | ||||
Roche Holding AG | 4.5% | |||
Novartis AG | 4.4% | |||
Samsung Electronics Co. Ltd., Preferred Shares | 3.7% | |||
Taiwan Semiconductor Manufacturing Co. Ltd. | 3.7% | |||
Nestle SA | 3.6% | |||
Japan Tobacco, Inc. | 3.5% | |||
British American Tobacco PLC | 3.4% | |||
Royal Dutch Shell PLC, B Shares | 3.0% | |||
FANUC Corp. | 2.9% | |||
Shin-Etsu Chemical Co. Ltd. | 2.8% | |||
Other | 64.5% | |||
| 100.0% | ||||
| Top Countries | ||||
United Kingdom | 22.2% | |||
Switzerland | 16.5% | |||
Japan | 10.3% | |||
Hong Kong | 5.3% | |||
Singapore | 5.2% | |||
Canada | 4.9% | |||
France | 4.6% | |||
Brazil | 4.6% | |||
Sweden | 4.4% | |||
Republic of South Korea | 3.7% | |||
Other | 18.3% | |||
| 100.0% | ||||
| * | For the purpose of listing top holdings, repurchase agreements are included as part of Other. |
Semi-Annual Report 2015
6
Statement of Investments
April 30, 2015 (Unaudited)
Aberdeen Select International Equity Fund
| Shares or Principal Amount | Value | |||||||
COMMON STOCKS (85.2%) | ||||||||
BULGARIA (0.4%) | ||||||||
Financials (0.4%) | ||||||||
LEV Insurance (a)(b)(c)(d) | $ | 4,078,860 | $ | 1,596,422 | ||||
CANADA (4.9%) | ||||||||
Industrials (1.9%) | ||||||||
Canadian National Railway Co. | 112,400 | 7,257,323 | ||||||
Materials (2.0%) | ||||||||
Potash Corp. of Saskatchewan, Inc. | 232,400 | 7,589,358 | ||||||
Telecommunication Services (1.0%) | ||||||||
TELUS Corp. | 117,400 | 4,060,590 | ||||||
| 18,907,271 | ||||||||
FRANCE (4.6%) | ||||||||
Consumer Staples (2.1%) | ||||||||
Casino Guichard-Perrachon SA (d) | 92,100 | 8,144,172 | ||||||
Industrials (1.5%) | ||||||||
Schneider Electric SE (d) | 80,200 | 5,994,820 | ||||||
Utilities (1.0%) | ||||||||
GDF Suez (d) | 181,300 | 3,688,800 | ||||||
| 17,827,792 | ||||||||
GERMANY (2.4%) | ||||||||
Health Care (1.0%) | ||||||||
Fresenius Medical Care AG & Co. KGaA (d) | 45,300 | 3,807,085 | ||||||
Materials (1.4%) | ||||||||
Linde AG (d) | 29,000 | 5,666,878 | ||||||
| 9,473,963 | ||||||||
HONG KONG (5.3%) | ||||||||
Financials (3.4%) | ||||||||
AIA Group Ltd. (d) | 1,394,600 | 9,274,752 | ||||||
Swire Pacific Ltd., Class A (d) | 288,500 | 3,894,776 | ||||||
| 13,169,528 | ||||||||
Industrials (1.9%) | ||||||||
Jardine Matheson Holdings Ltd. (d) | 118,200 | 7,302,741 | ||||||
| 20,472,269 | ||||||||
ISRAEL (1.0%) | ||||||||
Information Technology (1.0%) | ||||||||
Check Point Software Technologies Ltd. (c) | 44,700 | 3,731,556 | ||||||
ITALY (1.9%) | ||||||||
Energy (1.9%) | ||||||||
Tenaris SA, ADR | 244,800 | 7,527,600 | ||||||
JAPAN (10.3%) | ||||||||
Consumer Staples (3.5%) | ||||||||
Japan Tobacco, Inc. (d) | 388,900 | 13,580,724 | ||||||
Financials (1.1%) | ||||||||
Daito Trust Construction Co. Ltd. (d) | 35,700 | 4,157,287 | ||||||
Industrials (2.9%) | ||||||||
FANUC Corp. (d) | $ | 51,200 | 11,262,089 | |||||
Materials (2.8%) | ||||||||
Shin-Etsu Chemical Co. Ltd. (d) | 174,100 | 10,642,523 | ||||||
| 39,642,623 | ||||||||
LATVIA (0.0%) | ||||||||
Financials (0.0%) | ||||||||
AS Parex Banka (b)(c)(d) | 1,424,182 | 2 | ||||||
MEXICO (2.4%) | ||||||||
Consumer Staples (2.4%) | ||||||||
Fomento Economico Mexicano SAB de CV, ADR | 102,900 | 9,311,421 | ||||||
SERBIA (0.0%) | ||||||||
Industrials (0.0%) | ||||||||
Toza Markovic ad Kikinda (a)(b)(c)(d) | 78,160 | 0 | ||||||
SINGAPORE (5.2%) | ||||||||
Financials (2.6%) | ||||||||
City Developments Ltd. (d) | 739,000 | 5,945,955 | ||||||
Oversea-Chinese Banking Corp. Ltd. (d) | 519,500 | 4,183,468 | ||||||
| 10,129,423 | ||||||||
Telecommunication Services (2.6%) | ||||||||
Singapore Telecommunications Ltd. (d) | 2,936,600 | 9,812,931 | ||||||
| 19,942,354 | ||||||||
SOUTH AFRICA (2.1%) | ||||||||
Telecommunication Services (2.1%) | ||||||||
MTN Group Ltd. (d) | 413,600 | 8,304,638 | ||||||
SWEDEN (4.4%) | ||||||||
Financials (1.5%) | ||||||||
Nordea Bank AB (d) | 447,900 | 5,690,634 | ||||||
Industrials (1.6%) | ||||||||
Atlas Copco AB, A Shares (d) | 198,462 | 6,194,591 | ||||||
Information Technology (1.3%) | ||||||||
Telefonaktiebolaget LM Ericsson, B Shares (d) | 458,600 | 5,015,606 | ||||||
| 16,900,831 | ||||||||
SWITZERLAND (16.5%) | ||||||||
Consumer Staples (3.6%) | ||||||||
Nestle SA (d) | 178,400 | 13,841,023 | ||||||
Financials (2.4%) | ||||||||
Zurich Insurance Group AG (c)(d) | 30,100 | 9,290,460 | ||||||
Health Care (8.9%) | ||||||||
Novartis AG (d) | 168,800 | 17,229,773 | ||||||
Roche Holding AG (d) | 60,400 | 17,283,768 | ||||||
| 34,513,541 | ||||||||
Industrials (1.6%) | ||||||||
Schindler Holding AG (d) | 36,500 | 6,174,627 | ||||||
| 63,819,651 | ||||||||
See accompanying Notes to Financial Statements.
2015 Semi-Annual Report
7
Statement of Investments (concluded)
April 30, 2015 (Unaudited)
Aberdeen Select International Equity Fund
| Shares or Principal Amount | Value | |||||||
TAIWAN (3.7%) | ||||||||
Information Technology (3.7%) | ||||||||
Taiwan Semiconductor Manufacturing Co. Ltd. (d) | $ | 2,944,000 | $ | 14,173,215 | ||||
UNITED KINGDOM (20.1%) | ||||||||
Consumer Staples (3.4%) | ||||||||
British American Tobacco PLC (d) | 239,300 | 13,147,998 | ||||||
Energy (4.5%) | ||||||||
John Wood Group PLC (d) | 570,412 | 6,010,111 | ||||||
Royal Dutch Shell PLC, B Shares (d) | 360,000 | 11,525,684 | ||||||
| 17,535,795 | ||||||||
Financials (4.4%) | ||||||||
HSBC Holdings PLC (d) | 860,967 | 8,600,628 | ||||||
Standard Chartered PLC (d) | 500,000 | 8,186,099 | ||||||
| 16,786,727 | ||||||||
Industrials (4.0%) | ||||||||
Experian PLC (d) | 449,000 | 8,019,262 | ||||||
Rolls-Royce Holdings PLC (c) | 73,785,300 | 113,260 | ||||||
Weir Group PLC (The) (d) | 253,600 | 7,291,118 | ||||||
| 15,423,640 | ||||||||
Materials (2.7%) | ||||||||
BHP Billiton PLC (d) | 432,700 | 10,400,577 | ||||||
Telecommunication Services (1.1%) | ||||||||
Vodafone Group PLC (d) | 1,247,298 | 4,394,488 | ||||||
| 77,689,225 | ||||||||
VENEZUELA (0.0%) | ||||||||
Financials (0.0%) | ||||||||
Banco Provincial SA-Banco Universal (b) | 18,422 | 108,100 | ||||||
Banco Venezolano de Credito SA (b)(c)(d) | 156 | 0 | ||||||
| 108,100 | ||||||||
Industrials (0.0%) | ||||||||
Cemex Venezuela SACA-I (b)(c)(d) | 15,843,815 | 0 | ||||||
| 108,100 | ||||||||
Total Common Stocks | 329,428,933 | |||||||
EXCHANGE TRADED FUNDS (0.0%) | ||||||||
RUSSIA (0.0%) | ||||||||
Renaissance Pre-IPO Fund (b)(c)(d) | 92,634 | 0 | ||||||
Total Exchange Traded Funds | 0 | |||||||
GOVERNMENT BONDS (0.1%) | ||||||||
VENEZUELA (0.1%) | ||||||||
Bonos de la Deuda Publica Nacional (VEF), 17.25%, 12/31/2015 (b) | 10,000,000 | 40,086 | ||||||
Bonos de la Deuda Publica Nacional (VEF), 16.00%, 08/23/2018 (b) | 49,500,000 | 231,284 | ||||||
Bonos de la Deuda Publica Nacional (VEF), 18.00%, 04/12/2018 (b) | 20,000,000 | 96,455 | ||||||
| 367,825 | ||||||||
Total Government Bonds | 367,825 | |||||||
PREFERRED STOCKS (10.4%) | ||||||||
BRAZIL (4.6%) | ||||||||
Financials (2.6%) | ||||||||
Banco Bradesco SA, ADR, Preferred Shares | 957,200 | 10,232,468 | ||||||
Materials (2.0%) | ||||||||
Vale SA, ADR, Preferred Shares | 1,248,400 | 7,552,820 | ||||||
| 17,785,288 | ||||||||
REPUBLIC OF SOUTH KOREA (3.7%) | ||||||||
Information Technology (3.7%) | ||||||||
Samsung Electronics Co. Ltd., Preferred Shares (d) | 14,000 | 14,205,679 | ||||||
UNITED KINGDOM (2.1%) | ||||||||
Industrials (2.1%) | ||||||||
Rolls-Royce Holdings PLC (c)(d) | 523,300 | 8,342,919 | ||||||
Total Preferred Stocks | 40,333,886 | |||||||
REPURCHASE AGREEMENT (3.1%) | ||||||||
UNITED STATES (3.1%) | ||||||||
Repurchase Agreement, Fixed Income Clearing Corp., 0.00%, dated 04/30/2015, due 05/01/2015, repurchase price $11,864,599 collateralized by U.S. Treasury Note, maturing 12/31/2021; total market value of $12,102,500 | 11,864,599 | 11,864,599 | ||||||
Total Repurchase Agreement | 11,864,599 | |||||||
Total Investments | 381,995,243 | |||||||
Other assets in excess of liabilities—1.2% | 4,491,385 | |||||||
Net Assets—100.0% | $ | 386,486,628 | ||||||
| (a) | Investment in affiliate. |
| (b) | The Fund’s adviser has deemed this security to be illiquid based upon procedures approved by the Board of Trustees. Illiquid securities held by the Fund represent 0.54% of net assets as of April 30, 2015. |
| (c) | Non-income producing security. |
| (d) | Fair Valued Security. Fair Values are determined pursuant to procedures approved by the Fund’s Board of Trustees. See Note 2(a) of the accompanying Notes to Financial Statements. |
| (e) | See Notes to Financial Statements for tax unrealized appreciation/depreciation of securities. |
| ADR | American Depositary Receipt |
See accompanying Notes to Financial Statements.
Semi-Annual Report 2015
8
Aberdeen Select International Equity Fund II (Unaudited)
Aberdeen Select International Equity Fund II (Class A shares at net asset value net of fees) returned -0.12% for the six-month period ended April 30, 2015, versus 5.78% for its benchmark, the MSCI All Country World ex U.S. Index, during the same period. For broader comparison, the average return of the Fund’s Lipper peer category of International Multi-Cap Growth Funds (consisting of 113 funds) was 5.97% for the period.
International equities rose during the six-month review period, buoyed by loose global monetary policy. Although the U.S. Federal Reserve (Fed) officially ended its bond-buying program, the Bank of Japan’s increased stimulus, along with the launch of the European Central Bank’s quantitative easing, kept markets awash with liquidity. China also continued to lower benchmark rates and lenders’ reserve ratios in a bid to spur economic growth, after 2014 gross domestic product (GDP) missed official targets for the first time in 17 years. However, Brent crude oil prices sank to a five-year low after the Organization of the Petroleum Exporting Countries (OPEC), following Saudi Arabia’s lead, resisted calls for a cut in output and left production targets unchanged. The sustained drop in oil prices caused turmoil in Russia’s financial markets and the rouble’s collapse, which reverberated worldwide. Sentiment was further dampened by escalating instability in the Middle East and growing doubts that Greece would reach an agreement with creditors in time to unlock about €7 billion (roughly US$7.8 billion) in bailout funds. Nonetheless, international equities rebounded towards the end of the period, as weaker-than-expected U.S. economic activity sparked hopes of a delayed interest rate hike.
Brazilian miner Vale was a key detractor from Fund performance for the reporting period. Its credit rating was downgraded by Standard and Poor’s (S&P), reflecting the credit rating agency’s expectations that it will be hampered in the near term by depressed iron ore prices. Another Brazilian holding, Banco Bradesco, also hindered Fund performance as dissatisfaction over the state of the economy and the unfolding corruption scandal of state-owned oil company Petrobras weighed on the broader market. Despite reporting decent quarterly results that were driven by healthy interest and fee income, shares of the lender fell along with other local banks on worries that the government’s decision to hike taxes on personal loans may slow lending growth. Stock selection in the UK also hindered Fund performance. Utility company Centrica underperformed its peers due to weak full-year 2014 results and management’s decision to cut dividends by a third in order to maintain the group’s investment-grade rating. Engineering services provider Weir Group’s share price fell after analyst downgrades on the back of lower commodity prices.
Meanwhile, falling crude prices have curtailed capital expenditure in the energy sector, which has in turn hurt the bottom lines of oil services companies such as Tenaris. Reduced U.S. drilling activity, as well as de-stocking in the Middle East and Africa, also weighed on the steel pipe-maker’s results. The oil price slump affected holdings such as Royal Dutch Shell and Tenaris. Shell announced plans to cut spending by US$15 billion over the next three years amid a decline in earnings, while oil and gas pipe-maker Tenaris posted weaker-than-expected results because of lower sales of its premium pipes. Reduced U.S. drilling activity, as well as de-stocking in the Middle East and Africa, weighed on the steel pipe-maker’s results.
Conversely, top contributors to Fund performance included Japanese robot-maker Fanuc, Hong Kong-based insurance company AIA, and Swiss drug-maker Novartis. Fanuc’s shares rose after management announced plans to set up a shareholder relations department, in the wake of the government’s new corporate governance rules. The company subsequently released full-year 2014 results that generally met the market’s expectations, raised its dividend payout ratio1 from 30% to 60%, and adopted a flexible share-buyback policy. AIA delivered excellent full-year results on the back of resilient volumes and widening margins. Swiss pharmaceutical firm Novartis reported virtually flat year-over-year sales and operating income for its full-year results, but proposed a 6% dividend increase and indicated a positive outlook for 2015 as a result of recent drug successes and a portfolio overhaul.
During the reporting period, we initiated positions in three stocks: Israel-based IT services company Check Point Software, German healthcare services provider Fresenius Medical Care, and Singapore lender OCBC. In our view, Check Point Software has a strong market position within infrastructure software and network security, while we believe that Fresenius Medical Care is well placed to benefit from aging population trends and steady growth in the global dialysis market. We believe that OCBC is a well-managed bank with a solid capital base and good cost-to-income ratio. In contrast, we sold the Fund’s shares in Petrobras because of the deterioration in its business quality. We also exited the positions in UK utility company Centrica due to increased regulatory and political interference; integrated energy company Eni on our concerns over the sustainability of its dividend and PetroChina following a period of relative share price strength.
Hopes of continued loose monetary policy have provided some relief to global stock markets. However, we think that the effect is likely to be temporary, especially in economies where structural weaknesses persist. While some of the Fund’s holdings have benefited from the run-up in the global equity markets, we believe that stock prices are starting to appear frothy, especially against the backdrop of a global economic slowdown. Consequently, we believe that share prices may be due for a correction when the Fed eventually decides to hike interest rates. Despite the challenging operating environment, however, results from the Fund’s holdings have been relatively resilient, in our view. We remain confident in their ability to grow earnings over the long term.
Portfolio Management:
Aberdeen Global Equity Team
PAST PERFORMANCE DOES NOT GUARANTEE FUTURE RESULTS.
The performance quoted represents past performance, which does not guarantee future results. Class A Shares have up to a 0.25% 12b-1 fee. The investment return and principal value of an investment will fluctuate so that
| 1 | The dividend payout ratio represents the percentage of earnings paid to shareholders in dividends. |
2015 Semi-Annual Report
9
Aberdeen Select International Equity Fund II (Unaudited) (concluded)
an investor’s shares, when redeemed, may be worth more or less than their original cost. Current performance of the Fund may be lower or higher than the performance quoted. Performance data current to the most recent month-end may be obtained by calling 866-667-9231 or visiting www.aberdeen-asset.us.
Investing in mutual funds involves risk, including the possible loss of principal. There is no assurance that the investment objective of any fund will be achieved. Indexes are unmanaged and have been provided for comparison purposes only. No fees or expenses are reflected. You cannot invest directly in an index.
Lipper is a leading global provider of mutual fund information and analysis to fund companies, financial intermediaries and media organizations.
Risk Considerations
Foreign securities are more volatile, harder to price and less liquid than U.S. securities. They are subject to different accounting and regulatory standards, and political and economic risks. These risks are enhanced in emerging markets countries.
Equity stocks of small- and mid-cap companies carry greater risk, and more volatility than equity stocks of larger, more established companies.
Please read the prospectus for more detailed information regarding these and other risks.
Semi-Annual Report 2015
10
Aberdeen Select International Equity Fund II (Unaudited)
Average Annual Total Return (For periods ended April 30, 2015) | Six Month† | 1 Yr. | 5 Yr. | Inception1 | ||||||||||
Class A | (0.12%) | (4.05%) | 2.11% | 3.73% | ||||||||||
Institutional Class2 | 0.01% | (3.84%) | 2.36% | 4.01% | ||||||||||
| † | Not Annualized |
| 1 | Fund commenced operations on May 04, 2005. |
| 2 | Formerly Class I |
2015 Semi-Annual Report
11
Aberdeen Select International Equity Fund II (Unaudited)
Performance of a $10,000 Investment (as of April 30, 2015)

Comparative performance of $10,000 invested in Class A shares of the Aberdeen Select International Equity Fund II, Morgan Stanley Capital International All Country World ex-U.S. Index (MSCI ACWI ex-U.S. Index), and the Consumer Price Index (CPI) since inception. Unlike the Fund’s returns, the returns for these unmanaged indexes do not reflect any fees or expenses. Investors cannot invest directly in market indexes.
The MSCI ACWI ex-U.S. Index captures large, mid, small and micro cap respresentation across 22 of 23 Developed Markets (DM) countries* (excluding the United States). With 8,059 constituents, the index covers approximately 99% of the free float-adjusted market capitalization in each country.
The CPI is a measure of the average change over time in the prices paid by urban consumers for a market basket of consumer goods and services.
Investment return and principal value will fluctuate, and when redeemed, shares may be worth more or less than original cost. Past performance is no guarantee of future results. The Average Annual Total Return table and performance graph do not reflect the deduction of taxes that a shareholder would pay on Fund distributions or the redemption of Fund shares. Investing in mutual funds involves market risk, including loss of principal. Performance returns assume the reinvestment of all distributions. Performance returns reflect fee waivers and reimbursements in effect without which returns would have been lower.
Portfolio Summary (as a percentage of net assets)
April 30, 2015 (Unaudited)
| Asset Allocation | ||||
Common Stocks | 86.9% | |||
Preferred Stocks | 10.6% | |||
Repurchase Agreement | 0.2% | |||
Other assets in excess of liabilities | 2.3% | |||
| 100.0% | ||||
The following table summarizes the composition of the Fund’s portfolio, in Standard & Poor’s Global Industry Classification Standard (GICS) sectors, expressed as a percentage of net assets. The GICS structure consists of 10 sectors, 24 industry groups, 68 industries and 154 sub-industries. As of April 30, 2015, the Fund did not have more than 25% of its assets invested in any industry group.
| Top Sectors | ||||
Financials | 18.7% | |||
Industrials | 17.6% | |||
Consumer Staples | 15.1% | |||
Materials | 10.8% | |||
Health Care | 10.1% | |||
Information Technology | 9.8% | |||
Telecommunication Services | 7.4% | |||
Energy | 7.0% | |||
Utilities | 1.0% | |||
Other | 2.5% | |||
| 100.0% | ||||
| Top Holdings* | ||||
Roche Holding AG | 4.6% | |||
Novartis AG | 4.5% | |||
Japan Tobacco, Inc. | 3.8% | |||
Samsung Electronics Co. Ltd., Preferred Shares | 3.8% | |||
Taiwan Semiconductor Manufacturing Co. Ltd. | 3.6% | |||
Nestle SA | 3.6% | |||
British American Tobacco PLC | 3.3% | |||
Royal Dutch Shell PLC, B Shares | 2.9% | |||
Singapore Telecommunications Ltd. | 2.7% | |||
Shin-Etsu Chemical Co. Ltd. | 2.7% | |||
Other | 64.5% | |||
| 100.0% | ||||
| Top Countries | ||||
United Kingdom | 22.3% | |||
Switzerland | 16.6% | |||
Japan | 10.4% | |||
Hong Kong | 5.5% | |||
Singapore | 5.4% | |||
Canada | 5.2% | |||
Sweden | 5.1% | |||
France | 4.5% | |||
Brazil | 4.4% | |||
Republic of South Korea | 3.8% | |||
Other | 16.8% | |||
| 100.0% | ||||
| * | For the purpose of listing top holdings, repurchase agreements are included as part of Other. |
Semi-Annual Report 2015
12
Statement of Investments
April 30, 2015 (Unaudited)
Aberdeen Select International Equity Fund II
| Shares or Principal Amount | Value | |||||||
COMMON STOCKS (86.9%) | ||||||||
CANADA (5.2%) | ||||||||
Industrials (1.9%) | ||||||||
Canadian National Railway Co. | $ | 60,300 | $ | 3,893,386 | ||||
Materials (2.1%) | ||||||||
Potash Corp. of Saskatchewan, Inc. | 126,000 | 4,114,712 | ||||||
Telecommunication Services (1.2%) | ||||||||
TELUS Corp. | 70,700 | 2,445,347 | ||||||
| 10,453,445 | ||||||||
FRANCE (4.5%) | ||||||||
Consumer Staples (2.0%) | ||||||||
Casino Guichard-Perrachon SA (a) | 44,000 | 3,890,810 | ||||||
Industrials (1.5%) | ||||||||
Schneider Electric SE (a) | 39,500 | 2,952,561 | ||||||
Utilities (1.0%) | ||||||||
GDF Suez (a) | 99,400 | 2,022,431 | ||||||
| 8,865,802 | ||||||||
GERMANY (2.6%) | ||||||||
Health Care (1.0%) | ||||||||
Fresenius Medical Care AG & Co. KGaA (a) | 23,000 | 1,932,957 | ||||||
Materials (1.6%) | ||||||||
Linde AG (a) | 16,300 | 3,185,176 | ||||||
| 5,118,133 | ||||||||
HONG KONG (5.5%) | ||||||||
Financials (3.6%) | ||||||||
AIA Group Ltd. (a) | 707,800 | 4,707,206 | ||||||
Swire Pacific Ltd., Class A (a) | 188,000 | 2,538,017 | ||||||
| 7,245,223 | ||||||||
Industrials (1.9%) | ||||||||
Jardine Matheson Holdings Ltd. (a) | 61,200 | 3,781,114 | ||||||
| 11,026,337 | ||||||||
ISRAEL (1.0%) | ||||||||
Information Technology (1.0%) | ||||||||
Check Point Software Technologies Ltd. (b) | 24,600 | 2,053,608 | ||||||
ITALY (2.5%) | ||||||||
Energy (2.5%) | ||||||||
Tenaris SA, ADR | 159,400 | 4,901,550 | ||||||
JAPAN (10.4%) | ||||||||
Consumer Staples (3.8%) | ||||||||
Japan Tobacco, Inc. (a) | 219,600 | 7,668,622 | ||||||
Financials (1.2%) | ||||||||
Daito Trust Construction Co. Ltd. (a) | 20,500 | 2,387,237 | ||||||
Industrials (2.7%) | ||||||||
FANUC Corp. (a) | 24,300 | 5,345,093 | ||||||
Materials (2.7%) | ||||||||
Shin-Etsu Chemical Co. Ltd. (a) | $ | 87,900 | 5,373,221 | |||||
| 20,774,173 | ||||||||
MEXICO (2.4%) | ||||||||
Consumer Staples (2.4%) | ||||||||
Fomento Economico Mexicano SAB de CV, ADR | 52,600 | 4,759,774 | ||||||
SINGAPORE (5.4%) | ||||||||
Financials (2.7%) | ||||||||
City Developments Ltd. (a) | 395,000 | 3,178,149 | ||||||
Oversea-Chinese Banking Corp. Ltd. (a) | 259,700 | 2,091,332 | ||||||
| 5,269,481 | ||||||||
Telecommunication Services (2.7%) | ||||||||
Singapore Telecommunications Ltd. (a) | 1,624,000 | 5,426,752 | ||||||
| 10,696,233 | ||||||||
SOUTH AFRICA (2.2%) | ||||||||
Telecommunication Services (2.2%) | ||||||||
MTN Group Ltd. (a) | 220,100 | 4,419,369 | ||||||
SWEDEN (5.1%) | ||||||||
Financials (1.8%) | ||||||||
Nordea Bank AB (a) | 286,600 | 3,641,294 | ||||||
Industrials (1.9%) | ||||||||
Atlas Copco AB, A Shares (a) | 121,200 | 3,783,014 | ||||||
Information Technology (1.4%) | ||||||||
Telefonaktiebolaget LM Ericsson, B Shares (a) | 250,900 | 2,744,037 | ||||||
| 10,168,345 | ||||||||
SWITZERLAND (16.6%) | ||||||||
Consumer Staples (3.6%) | ||||||||
Nestle SA (a) | 91,800 | 7,122,231 | ||||||
Financials (2.4%) | ||||||||
Zurich Insurance Group AG (a)(b) | 15,300 | 4,722,393 | ||||||
Health Care (9.1%) | ||||||||
Novartis AG (a) | 88,500 | 9,033,382 | ||||||
Roche Holding AG (a) | 32,100 | 9,185,579 | ||||||
| 18,218,961 | ||||||||
Industrials (1.5%) | ||||||||
Schindler Holding AG (a) | 18,200 | 3,078,855 | ||||||
| 33,142,440 | ||||||||
TAIWAN (3.6%) | ||||||||
Information Technology (3.6%) | ||||||||
Taiwan Semiconductor Manufacturing Co. Ltd. (a) | 1,498,000 | 7,211,779 | ||||||
UNITED KINGDOM (19.9%) | ||||||||
Consumer Staples (3.3%) | ||||||||
British American Tobacco PLC (a) | 120,400 | 6,615,207 | ||||||
See accompanying Notes to Financial Statements.
2015 Semi-Annual Report
13
Statement of Investments (concluded)
April 30, 2015 (Unaudited)
Aberdeen Select International Equity Fund II
| Shares or Principal Amount | Value | |||||||
Energy (4.5%) | ||||||||
John Wood Group PLC (a) | $ | 294,800 | $ | 3,106,142 | ||||
Royal Dutch Shell PLC, B Shares (a) | 183,400 | 5,871,696 | ||||||
| 8,977,838 | ||||||||
Financials (4.5%) | ||||||||
HSBC Holdings PLC (a) | 436,213 | 4,357,549 | ||||||
Standard Chartered PLC (a) | 276,603 | 4,528,599 | ||||||
| 8,886,148 | ||||||||
Industrials (3.8%) | ||||||||
Experian PLC (a) | 229,200 | 4,093,574 | ||||||
Rolls-Royce Holdings PLC (b) | 41,778,300 | 64,130 | ||||||
Weir Group PLC (The) (a) | 119,300 | 3,429,930 | ||||||
| 7,587,634 | ||||||||
Materials (2.5%) | ||||||||
BHP Billiton PLC (a) | 210,500 | 5,059,675 | ||||||
Telecommunication Services (1.3%) | ||||||||
Vodafone Group PLC (a) | 730,300 | 2,572,997 | ||||||
| 39,699,499 | ||||||||
Total Common Stocks | 173,290,487 | |||||||
PREFERRED STOCKS (10.6%) | ||||||||
BRAZIL (4.4%) | ||||||||
Financials (2.5%) | ||||||||
Banco Bradesco SA, ADR, Preferred Shares | 462,600 | 4,945,194 | ||||||
Materials (1.9%) | ||||||||
Vale SA, ADR, Preferred Shares | 628,900 | 3,804,845 | ||||||
| 8,750,039 | ||||||||
REPUBLIC OF SOUTH KOREA (3.8%) | ||||||||
Information Technology (3.8%) | ||||||||
Samsung Electronics Co. Ltd., Preferred Shares (a) | $ | 7,500 | 7,610,185 | |||||
UNITED KINGDOM (2.4%) | ||||||||
Industrials (2.4%) | ||||||||
Rolls-Royce Holdings PLC (a)(b) | 296,300 | 4,723,881 | ||||||
Total Preferred Stocks | 21,084,105 | |||||||
REPURCHASE AGREEMENT (0.2%) | ||||||||
UNITED STATES (0.2%) | ||||||||
Repurchase Agreement, Fixed Income Clearing Corp., 0.00%, dated 04/30/2015, due 05/01/2015, repurchase price $452,675, collateralized by U.S. Treasury Note, maturing 12/31/2021; total market value of $463,500 | 452,675 | 452,675 | ||||||
Total Repurchase Agreement | 452,675 | |||||||
Total Investments | 194,827,267 | |||||||
Other assets in excess of liabilities—2.3% | 4,585,488 | |||||||
Net Assets—100.0% | $ | 199,412,755 | ||||||
| (a) | Fair Valued Security. Fair Values are determined pursuant to procedures approved by the Fund’s Board of Trustees. See Note 2(a) of the accompanying Notes to Financial Statements. |
| (b) | Non-income producing security. |
| (c) | See Notes to Financial Statements for tax unrealized appreciation/depreciation of securities. |
| ADR | American Depositary Receipt |
See accompanying Notes to Financial Statements.
Semi-Annual Report 2015
14
Aberdeen Total Return Bond Fund (Unaudited)
The Aberdeen Total Return Bond Fund (Class A shares at net asset value net of fees) returned 1.66% for the six-month period ended April 30, 2015, versus the 2.06% return of its benchmark, the Barclays U.S. Aggregate Bond Index, for the same period. For broader comparison, the average return of the Fund’s Lipper peer category of Core Bond Funds (consisting of 169 funds) was 1.80% for the period.
The combination of a strengthening U.S. dollar, falling oil prices, economic growth concerns in Europe and Asia, and rolling troubled hotspots caused volatility to spike in global risk markets during the reporting period. Nonetheless, the U.S. broader-market Barclays U.S. Aggregate Bond Index recorded a gain of 2.06% for the six-month period ended April 30, 2015, as yields declined in all but the shortest segments of the U.S. Treasury yield curve. The yields on the one-year Treasury bill and two-year note rose 13 and 8 basis points (bps) – or 0.13% and 0.08% – to 0.24% and 0.58%, respectively, over the period. At the same time, yields on the three-, five- and ten-year notes decreased by corresponding margins of 4, 19 and 30 bps, ending the period at 0.91%, 1.43% and 2.05%, respectively. Consequently, the two- to ten-year yield curve narrowed over the period.
Despite the reversal of the prolonged decline in oil and commodity prices late in the reporting period, the energy sector was the weakest performer within the benchmark Barclays U.S. Corporate Index,1 which we typically use as a proxy for spread sectors. U.S. energy bonds have grown to become the largest component of the corporate market, representing 14% of the benchmark Barclays U.S. Aggregate Bond Index – doubling over the last 10 years. This growth in debt issuance has helped to fund an ambitious expansion plan over the past several years as U.S. energy companies have been aggressively issuing debt to fund capital expenditures.
There was much speculation regarding the direction of the Fed’s monetary policy throughout the reporting period. At its December 2014 meeting, the Federal Open Market Committee (FOMC) removed the reference to “considerable time” from its forward guidance. However, its overall statement was balanced; citing healthy U.S. growth tempered with below–historical-trend inflation due to declining energy prices. New Fed Chair Janet Yellen spoke favorably about the U.S. economic outlook in her testimony before the Senate Banking committee in late February. However, in a statement issued following its meeting on March 17-18, the FOMC commented that it expects inflation to “rise gradually toward 2 percent over the medium term as the labor market improves further and the transitory effects of energy price declines and other factors dissipate.” Finally, in April, the Fed acknowledged the slowdown in economic growth, but noted that “with appropriate policy accommodation, economic activity will expand at a moderate pace.” The FOMC maintained the fed funds rate near 0% while reiterating its position that it will increase the federal funds rate when it believes that there is further improvement in the labor market and a modest decline in the inflation rate to its 2% target.
The upturn in the U.S. economy paused in the first quarter of the year. The Commerce Department’s initial estimate of gross domestic product (GDP) growth came in at an annualized rate of 0.2% – well below the 2.2% gain seen in the fourth quarter of 2014. An uptick in consumer spending was offset by a sharp decline in exports, which continued to face headwinds from a strong U.S. dollar. In early May, the U.S. Department of Labor reported that non-farm payrolls expanded by 223,000 in April, while the unemployment rate dipped marginally to 5.4% – its lowest level in seven years. Tempering the outlook somewhat, however, the job gains for March were adjusted significantly downward and the labor force participation rate2 remained near its 37-year trough.
The Fund’s short duration3 in the U.S. relative to that of the benchmark Barclays U.S. Aggregate Bond Index detracted from performance for the reporting period. We have positioned the Fund with a negative bias toward the short-to-intermediate sector of the U.S. Treasury yield curve (two-to-eight-year duration), while we maintain the modest overweight in the sector of the curve beyond eight years. We continue to believe that the yield curve will flatten as long-term rates will be anchored by the low inflationary backdrop and the higher yields in the U.S. that should continue to entice foreign capital to the U.S. from abroad. The Fund’s exposure to both Mexico and Brazil also had a negative impact on performance. The majority of the Fund’s foreign currency exposure from these bond holdings is hedged back to the U.S. dollar. We had been maintaining unhedged positions in both the Brazilian real and the Mexican peso. However, we believed that these two countries were somewhat vulnerable to declining oil prices and decided to fully hedge these two foreign exchange (FX) positions.
On the positive side, Fund performance was bolstered by the overweight exposure versus the benchmark to the long end of the U.S. Treasury yield curve. Both security selection and an overweight allocation in commercial mortgage-backed securities (MBS), as well as security selection in the non-agency MBS sector, also contributed positively to the Fund’s relative return.
Regarding the use of derivatives during the reporting period, we employed U.S. Treasury futures to manage the Fund’s overall curve and interest rate exposure, and we used currency forwards to hedge some of the Fund’s foreign exchange holdings. This resulted in a contribution of approximately 0.70% to the Fund’s total return for the period.
The biggest change to the Fund’s positioning over the reporting period was the reduction in the global duration underweight relative
| 1 | The Barclays U.S. Corporate Index tracks the performance of publicly issued U.S. corporate and specified foreign debentures that are registered with the Securities and Exchange Commission and meet specific maturity, liquidity, and quality requirements. Indexes are unmanaged and have been provided for comparison purposes only. No fees or expenses are reflected. You cannot invest directly in an index. |
| 2 | The labor force participation rate is expressed as a percentage of the U.S. population aged 16 years and older working or actively seeking work. |
| 3 | Duration is an estimate of bond price sensitivity to changes in interest rates. The higher the duration, the greater the change (i.e., higher risk) in relation to interest-rate movements. |
2015 Semi-Annual Report
15
Aberdeen Total Return Bond Fund (Unaudited) (concluded)
to the benchmark Barclays U.S. Aggregate Bond Index. As yields declined towards the end of 2014, we decreased the underweight duration because the market was not performing as we expected, and we chose to control risk in case rates continued to fall.
At the end of the period on April 30, 2015, the Fund’s largest holdings were in the corporate and MBS sectors. Relative to the benchmark, the most notable overweight positions included non-U.S. dollar assets (which are not represented in the index), asset-backed securities (ABS) and commercial MBS. In contrast, the Fund was most underweight in U.S. Treasuries and MBS.
In our view, whether U.S. growth rebounds in the second quarter of the year is of more importance than a reading of a single quarter. It is somewhat alarming that, after a disappointing first-quarter GDP number, the growth indicators for the second quarter are well below both previous consensus expectations and the rebound that we’ve experienced over the last several years following a poor GDP reporting period. Reactions by consumers and businesses to lower energy prices diverged rather significantly in both speed and scale than economists had predicted. We also wonder if the growth and inflation responses to a stronger U.S. dollar substantially differ from historical patterns. We will be monitoring data closely going forward to determine if we are on a new “slower growth path” from the already disappointing 2.2% average rate that we’ve seen since 2009.
We continue to believe that a secular stagnation theme will be the most likely scenario dominating economic growth prospects. The consequences of the global financial crises, combined with too much debt, a slowdown in productivity growth, and demographic trends all point to a growth trend below historical average. We come to this conclusion because after approximately six years of unprecedented monetary stimulus that essentially has produced an effective federal funds rate of minus 2-3%, real GDP has still disappointed and has continued below trend. We have had some bright spots over the last several years where growth accelerated; however, the long-awaited lift above the “escape velocity” has not occurred.
Portfolio Management:
Aberdeen North American Fixed Income Team
PAST PERFORMANCE DOES NOT GUARANTEE FUTURE RESULTS.
The performance quoted represents past performance, which does not guarantee future results. Class A shares have up to a 0.25% 12b-1 fee. The investment return and principal value of an investment will fluctuate so that an investor’s shares, when redeemed, may be worth more or less than their original cost. Current performance of the Fund may be lower or higher than the performance quoted. Performance data current to the most recent month-end may be obtained by calling 866-667-9231 or visiting www.aberdeen-asset.us.
Investing in mutual funds involves risk, including possible loss of principal. There is no assurance that the investment objective of any fund will be achieved. Indexes are unmanaged and have been provided for comparison purposes only. No fees or expenses are reflected. You cannot invest directly in an index.
Lipper is a leading global provider of mutual fund information and analysis to fund companies, financial intermediaries and media organizations.
Risk Considerations
Fixed income securities are subject to certain risks including, but not limited to: interest rate (changes in interest rates may cause a decline in the market value of an investment), credit (changes in the financial condition of the issuer, borrower, counterparty, or underlying collateral), prepayment (debt issuers may repay or refinance their loans or obligations earlier than anticipated), and extension (principal repayments may not occur as quickly as anticipated, causing the expected maturity of a security to increase).
Investments in asset-backed and mortgage-backed securities include additional risks that investors should be aware which include those associated with fixed income securities, as well as increased susceptibility to adverse economic developments.
Derivatives are speculative and may hurt the Fund’s performance. They present the risk of disproportionately increased losses and/or reduced gains when the financial asset or measure to which the derivative is linked changes in unexpected ways.
Foreign securities are more volatile, harder to price and less liquid than U.S. securities and are subject to different accounting and regulatory standards, and political and economic risks. These risks are enhanced in emerging markets countries.
Municipal securities can be affected by adverse tax, legislative or political changes and the financial condition of the issuers of municipal securities.
Please read the prospectus for more detailed information regarding these and other risks.
Semi-Annual Report 2015
16
Aberdeen Total Return Bond Fund (Unaudited)
Average Annual Total Return (For periods ended April 30, 2015) | Six Month† | 1 Yr. | 5 Yr. | 10 Yr. | ||||||||||
Class A | 1.66% | 3.69% | 4.25% | 4.91% | ||||||||||
Institutional Class1 | 1.74% | 3.92% | 4.52% | 5.17% | ||||||||||
| † | Not Annualized |
| 1 | Formerly Class I |
2015 Semi-Annual Report
17
Aberdeen Total Return Bond Fund (Unaudited)
Performance of a $10,000 Investment (as of April 30, 2015)
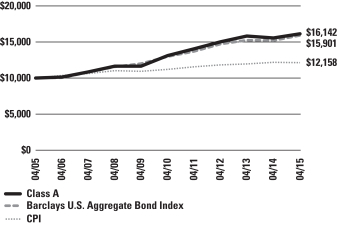
Comparative performance of $10,000 invested in Class A shares of the Aberdeen Total Return Bond Fund, Barclays U.S. Aggregate Bond Index and the Consumer Price Index (CPI) over a 10-year period ended April 30, 2015. Unlike the Fund’s returns, the returns for these unmanaged indexes do not reflect any fees or expenses. Investors cannot invest directly in market indexes.
The Barclays U.S. Aggregate Bond Index is a broad-based flagship benchmark that measures the investment grade, U.S. Dollar-denominated, fixed-rate taxable bond market. The index includes Treasuries, government-related and corporate securities, MBS (agency fixed-rate and hybrid ARM pass-throughs), ABS and CMBS (agency and non-agency).
The CPI is a measure of the average change over time in the prices paid by urban consumers for a market basket of consumer goods and services.
Investment return and principal value will fluctuate, and when redeemed, shares may be worth more or less than original cost. Past performance is no guarantee of future results. The Average Annual Total Return table and performance graph do not reflect the deduction of taxes that a shareholder would pay on Fund distributions or the redemption of Fund shares. Investing in mutual funds involves market risk, including loss of principal. Performance returns assume the reinvestment of all distributions. Performance returns reflect fee waivers and reimbursements in effect without which returns would have been lower.
Portfolio Summary (as a percentage of net assets)
April 30, 2015 (Unaudited)
| Asset Allocation | ||||
Corporate Bonds | 31.5% | |||
Commercial Mortgage-Backed Securities | 20.2% | |||
Government Bonds | 10.8% | |||
U.S. Agencies | 10.5% | |||
U.S. Treasuries | 9.9% | |||
Asset-Backed Securities | 9.0% | |||
Municipal Bonds | 4.6% | |||
Repurchase Agreement | 3.9% | |||
Government Agencies | 0.2% | |||
Liabilities in excess of other assets | (0.6% | ) | ||
| 100.0% | ||||
The following chart summarizes the composition of the Fund’s portfolio, expressed as a percentage of net assets. The industries listed below may include more than one industry group. As of April 30, 2015, the Fund did not have more than 25% of its assets invested in any industry group.
| Top Industries | ||||
Commercial Banks | 9.5% | |||
Diversified Financial Services | 2.0% | |||
Banks | 1.9% | |||
Oil, Gas & Consumable Fuels | 1.7% | |||
Energy Equipment & Services | 1.6% | |||
Electric Utilities | 1.6% | |||
Media | 1.3% | |||
Pharmaceutical | 1.2% | |||
Transportation | 1.2% | |||
Beverages | 1.1% | |||
Other | 76.9% | |||
| 100.0% | ||||
| Top Holdings* | ||||
U.S. Treasury Inflation Index Notes 04/15/2019 | 2.1% | |||
Italy Buoni Poliennali Del Tesoro 03/01/2024 | 1.9% | |||
U.S. Treasury Bonds 08/15/2044 | 1.9% | |||
U.S. Treasury Notes 02/15/2025 | 1.7% | |||
U.S. Treasury Notes 05/15/2015 | 1.4% | |||
Spain Government Bond 04/30/2025 | 1.0% | |||
Italy Buoni Poliennali Del Tesoro 03/01/2030 | 1.0% | |||
International Finance Corp. 05/15/2015 | 1.0% | |||
National Australia Bank Ltd. 03/08/2018 | 1.0% | |||
Brazil Letras do Tesouro Nacional 01/01/2017 | 1.0% | |||
Other | 86.0% | |||
| 100.0% | ||||
| Top Countries | ||||
United States | 76.6% | |||
Italy | 3.4% | |||
Australia | 2.9% | |||
Canada | 2.2% | |||
Supranational | 1.9% | |||
Mexico | 1.9% | |||
Netherlands | 1.8% | |||
Brazil | 1.7% | |||
New Zealand | 1.7% | |||
Spain | 1.0% | |||
Other | 4.9% | |||
| 100.0% | ||||
| * | For the purpose of listing top holdings, repurchase agreements are included as part of Other. |
Semi-Annual Report 2015
18
Statement of Investments
April 30, 2015 (Unaudited)
Aberdeen Total Return Bond Fund
| Shares or Principal Amount | Value (US$) | |||||||
ASSET-BACKED SECURITIES (9.0%) | ||||||||
CANADA (0.7%) | ||||||||
Ford Auto Securitization Trust, Series 2014-R2, Class A1 (CAD), 1.35%, 03/15/2016 (a) | $ | 149,237 | $ | 123,953 | ||||
Golden Credit Card Trust, Series 2012-5A, Class A (USD), 0.79%, 09/15/2017 (b) | 5,970,000 | 5,975,272 | ||||||
Master Credit Card Trust II, Series 2012-2A, Class A (USD), 0.78%, 04/21/2017 (b) | 4,640,000 | 4,642,684 | ||||||
| 10,741,909 | ||||||||
UNITED STATES (8.3%) | ||||||||
Ally Auto Recivables Trust | ||||||||
Series 2012-3, Class A3 (USD), 0.85%, 08/15/2016 | 770,504 | 770,794 | ||||||
Series 2013-1, Class A3, ABS (USD), 0.63%, 05/15/2017 | 6,105,219 | 6,108,122 | ||||||
American Homes 4 Rent, Series 2015-SFR1, Class A, ABS (USD), 3.47%, 04/17/2052 (b) | 4,480,000 | 4,604,806 | ||||||
Barclays Dryrock Issuance Trust, Series 2015-1, Class A (USD), 2.20%, 12/15/2022 | 3,860,000 | 3,894,037 | ||||||
BMW Floorplan Master Owner Trust, Series 2012-1A, Class A (USD), 0.58%, 09/15/2017 (b)(c) | 6,170,000 | 6,184,537 | ||||||
Chase Issuance Trust, Series 2007-B1, | 5,210,000 | 5,185,714 | ||||||
Chesapeake Funding LLC, Series 2013-1A, Class A (USD), 0.63%, 01/07/2025 (b)(c) | 2,321,162 | 2,322,632 | ||||||
Citibank Credit Card Issuance Trust, Series 2013-A10, Class A10, ABS (USD), 0.73%, 02/07/2018 | 4,970,000 | 4,976,739 | ||||||
CNH Equipment Trust, Series 2013-A, | 1,430,411 | 1,431,614 | ||||||
CNH Wholesale Master Note Trust, Series 2013-2A, Class A (USD), 0.78%, 08/15/2019 (b)(c) | 7,530,000 | 7,538,460 | ||||||
Dryrock Issuance Trust, Series 2012-2, | 4,290,000 | 4,291,083 | ||||||
Ford Credit Auto Lease Trust, Series 2013-A, Class A4 (USD), 0.78%, 04/15/2016 | 4,405,000 | 4,408,343 | ||||||
Ford Credit Auto Owner Trust | ||||||||
Series 2013-B, Class A3 (USD), 0.57%, 10/15/2017 | 1,421,107 | 1,421,462 | ||||||
Series 2015-1, Class A, ABS (USD), 2.12%, 07/15/2026 (b) | 5,540,000 | 5,587,417 | ||||||
GE Dealer Floorplan Master Note Trust | ||||||||
Series 2012-4, Class A (USD), 0.62%, 10/20/2017 (c) | 3,210,000 | 3,210,472 | ||||||
Series 2013-1, Class A (USD), 0.58%, 04/20/2018 (c) | 1,970,000 | 1,970,921 | ||||||
Series 2015-2, Class A (USD), 0.83%, 01/20/2022 (c) | 6,610,000 | 6,603,212 | ||||||
GM Financial Automobile Leasing Trust, Series 2014-2A, Class A3 (USD), 1.22%, 01/22/2018 (b) | 4,380,000 | 4,380,039 | ||||||
Mercedes Benz Auto Lease Trust, Series 2014-A, Class A2A, ABS (USD), 0.48%, 06/15/2016 | 3,022,549 | 3,022,709 | ||||||
Navistar Financial Dealer Note Master Trust | ||||||||
Series 2013-2, Class A (USD), 0.86%, 09/25/2018 (b)(c) | 4,170,000 | 4,173,474 | ||||||
Series 2014-1, Class A (USD), 0.93%, 10/25/2019 (b)(c) | 4,570,000 | 4,576,720 | ||||||
Nissan Auto Receivables Owner Trust, Series 2013-B, Class A3 (USD), 0.84%, 11/15/2017 | 2,223,044 | 2,227,284 | ||||||
SLM Student Loan Trust | ||||||||
Series 2011-1, Class A1 (USD), 0.70%, 03/25/2026 (c) | 1,851,727 | 1,860,004 | ||||||
Series 2011-2, Class A1 (USD), 0.78%, 11/25/2027 (c) | 4,780,644 | 4,779,870 | ||||||
Series 2013-2, Class A (USD), 0.63%, 09/25/2026 (c) | 3,290,052 | 3,282,769 | ||||||
Synchrony Credit Card Master Note Trust, Series 2015-1, Class A, ABS (USD), 2.37%, 03/15/2023 | 4,560,000 | 4,631,904 | ||||||
United States Small Business Administration | ||||||||
Series 2005-P10B, Class 1 (USD), 4.94%, 08/10/2015 | 763,788 | 772,554 | ||||||
Series 2006-P10A, Class 1 (USD), 5.41%, 02/10/2016 | 14,512 | 14,861 | ||||||
Series 2007-P10A, Class 1 (USD), 5.46%, 02/10/2017 | 855,596 | 906,117 | ||||||
Volkswagen Auto Lease Trust, Series 2013-A, Class A3 (USD), 0.84%, 07/20/2016 | 3,147,390 | 3,149,812 | ||||||
Volkswagen Auto Loan Enhanced Trust | ||||||||
Series 2013-1, Class A3 (USD), 0.56%, 08/21/2017 | 2,595,152 | 2,595,318 | ||||||
Series 2013-2, Class A3 (USD), 0.70%, 04/20/2018 | 4,970,000 | 4,966,054 | ||||||
Series 2014-1, Class A2 (USD), 0.42%, 03/20/2017 | 4,073,863 | 4,073,578 | ||||||
Volvo Financial Equipment LLC, Series 2013-1A, Class A3 (USD), 0.74%, 03/15/2017 (b) | 4,260,678 | 4,260,880 | ||||||
| 124,184,312 | ||||||||
Total Asset-Backed Securities | 134,926,221 | |||||||
COMMERCIAL MORTGAGE-BACKED SECURITIES (20.2%) |
| |||||||
UNITED STATES (20.2%) | ||||||||
Alternative Loan Trust | ||||||||
Series 2004-28CB, Class 3A1 (USD), 6.00%, 01/25/2035 | 3,395,435 | 3,351,846 | ||||||
Series 2005-86CB, Class A8 (USD), 5.50%, 02/25/2036 | 3,033,116 | 2,879,415 | ||||||
Avenue of Americas Mortgage Trust, Series 2015-1177, Class A (USD), 2.96%, 12/13/2029 (b)(c) | 3,080,000 | 3,156,241 | ||||||
Banc of America Commercial Mortgage Trust, Series 2006-5, Class AM (USD), 5.45%, 09/10/2047 | 3,550,000 | 3,722,177 | ||||||
Banc of America Merrill Lynch Trust, Series 2015-200, Class A (USD), 3.22%, 04/14/2033 (b)(c) | 2,780,000 | 2,851,023 | ||||||
See accompanying Notes to Financial Statements.
2015 Semi-Annual Report
19
Statement of Investments (continued)
April 30, 2015 (Unaudited)
Aberdeen Total Return Bond Fund
| Shares or Principal Amount | Value (US$) | |||||||
Banc of America Mortgage Trust, Series 2004-7, Class 2A3 (USD), 5.75%, 08/25/2034 | $ | 681,275 | $ | 711,800 | ||||
Barclays Commercial Mortgage Securities Trust, Series 2015-SLP, Class B (USD), 1.78%, 02/15/2028 (b)(c) | 3,760,000 | 3,772,583 | ||||||
Bear Stearns Adjustable Rate Mortgage Trust, Series 2004-3, Class 4A (USD), 2.63%, 07/25/2034 (c) | 1,051,220 | 1,035,676 | ||||||
Bear Stearns Commercial Mortgage Securities Trust | ||||||||
Series 2005-PW10, Class AM (USD), 5.45%, 12/11/2040 (c) | 4,082,000 | 4,164,281 | ||||||
Series 2007-PW17, Class AM (USD), 0.87%, 06/11/2050 (b)(c) | 6,054,750 | 5,960,402 | ||||||
CD Commercial Mortgage Trust, Series 2007-CD4, Class A4 (USD), 5.32%, 12/11/2049 | 4,435,000 | 4,659,588 | ||||||
CHL Mortgage Pass-Through Trust, Series 2005-21, Class A2 (USD), 5.50%, 10/25/2035 | 947,438 | 953,914 | ||||||
Citigroup Commercial Mortgage Trust, Series 2007-C6, Class AM (USD), 5.90%, 12/10/2049 (c) | 3,600,000 | 3,843,455 | ||||||
Citigroup Mortgage Loan Trust | ||||||||
Series 2014-A, Class A (USD), 4.00%, 01/25/2035 (b)(c) | 3,692,982 | 3,861,776 | ||||||
Series 2005-11, Class A3 (USD), 2.50%, 11/25/2035 (c) | 1,894,754 | 1,883,719 | ||||||
Series 2014-J1, Class A1 (USD), 3.50%, 06/25/2044 (b)(c) | 5,889,384 | 6,089,980 | ||||||
COMM 2013-300P Mortgage Trust, Series 2013-300P, Class A1, (USD), 4.35%, 08/10/2030 (b) | 5,790,000 | 6,443,459 | ||||||
COMM 2014-TWC Mortgage Trust, Series 2014-TWC, Class B (USD), 1.78%, 02/13/2032 (b)(c) | 3,810,000 | 3,815,149 | ||||||
Commercial Mortgage Pass Through Certificates | ||||||||
Series 2006-C4, Class A3 (USD), 5.47%, 09/15/2039 | 3,834,628 | 3,998,957 | ||||||
Series 2014-CR20, Class AM (USD), 3.94%, 11/10/2047 | 2,090,000 | 2,219,457 | ||||||
Commercial Mortgage Trust, Series 2007-GG11, Class A4 (USD), 5.74%, 12/10/2049 | 4,255,000 | 4,579,120 | ||||||
Credit Suisse First Boston Mortgage Securities Corp., Series 2004-8, Class 5A1 (USD), 6.00%, 12/25/2034 | 3,085,221 | 3,207,906 | ||||||
Credit Suisse Mortgage Capital Trust | ||||||||
Series 2013-6, Class2A1 (USD), 3.50%, 08/25/2043 (b)(c) | 5,267,978 | 5,401,427 | ||||||
Series 2013-7, Class A11 (USD), 3.50%, 08/25/2043 (b)(c) | 5,934,758 | 6,074,667 | ||||||
Credit Suisse Mortgage Trust | ||||||||
Series 2013-7, Class A2 (USD), 3.00%, 08/25/2043 (b)(c) | 1,296,150 | 1,280,542 | ||||||
Series 2015-WIN1 (USD), 3.50%, 12/25/2044 (b)(c) | 4,850,751 | 4,968,515 | ||||||
EverBank Mortgage Loan Trust, Series 2013-2, Class A (USD), 3.00%, 06/25/2043 (b)(c) | 5,172,964 | 5,169,932 | ||||||
FDIC Guaranteed Notes Trust | ||||||||
Series 2010-C1, Class A (USD), 2.98%, 12/06/2020 (b) | 2,456,412 | 2,519,680 | ||||||
Series 2010-S2, Class 2A (USD), 2.57%, 07/29/2047 (b) | 2,621,974 | 2,658,537 | ||||||
FDIC Trust, Series 2010-R1, Class A (USD), 2.18%, 05/25/2050 (b) | 2,080,187 | 2,097,876 | ||||||
FREMF Mortgage Trust | ||||||||
Series 2011-K704, Class B (USD), 4.69%, 10/25/2030 (b)(c) | 5,730,000 | 6,134,527 | ||||||
Series 2011-K703, Class B (USD), 5.05%, 07/25/2044 (b)(c) | 5,270,000 | 5,687,221 | ||||||
Series 2011-K11, Class B (USD), 4.42%, 12/25/2048 (b)(c) | 1,821,000 | 1,976,960 | ||||||
GRACE Mortgage Trust, Series 2014, Class A (USD), 3.37%, 06/10/2028 (b) | 3,990,000 | 4,200,636 | ||||||
GS Mortgage Securites Corp. Trust | ||||||||
Series 2012-SHOP, Class A (USD), 2.93%, 06/05/2031 (b) | 5,740,000 | 5,961,001 | ||||||
Series 2012-ALOH, Class A (USD), 3.55%, 04/10/2034 (b) | 2,830,000 | 3,011,716 | ||||||
GSR Mortgage Loan Trust, Series 2005-6F, Class 1A6 (USD), 5.25%, 07/25/2035 | 2,181,617 | 2,263,466 | ||||||
Hilton USA Trust 2013-HLT, Series 2013-HLT, Class CFX, (USD), 3.71%, 11/05/2030 (b)(c) | 2,845,000 | 2,894,671 | ||||||
IndyMac INDA Mortgage Loan Trust | ||||||||
Series 2005-AR2, Class 3A1 (USD), 2.65%, 01/25/2036 (c) | 2,955,249 | 2,648,566 | ||||||
Series 2006-AR1, Class A1 (USD), 4.77%, 08/25/2036 (c) | 407,541 | 398,252 | ||||||
JP Morgan Chase Commercial Mortgage Securities Trust, Series 2014-INN, Class A (USD), 1.10%, 06/15/2029 (b)(c) | 5,420,000 | 5,408,686 | ||||||
JP Morgan Mortgage Trust | ||||||||
Series 2005-A2, Class 3A2 (USD), 2.40%, 04/25/2035 (c) | 1,869,070 | 1,819,746 | ||||||
Series 2005-A4, Class 3A1 (USD), 2.26%, 07/25/2035 (c) | 2,220,671 | 2,217,041 | ||||||
Series 2005-A5, Class 2A2 (USD), 2.54%, 08/25/2035 (c) | 1,538,108 | 1,542,776 | ||||||
Series 2006-S1, Class 2A6 (USD), 6.00%, 04/25/2036 | 2,414,661 | 2,553,715 | ||||||
Series 2013-1, Class 1A2 (USD), 3.00%, 03/25/2043 (b)(c) | 6,438,472 | 6,406,531 | ||||||
Series 2013-1, Class B1 (USD), 3.54%, 03/25/2043 (b)(c) | 3,033,009 | 3,022,757 | ||||||
Series 2013-2, Class A2 (USD), 3.50%, 05/25/2043 (b)(c) | 3,886,832 | 3,990,198 | ||||||
Series 2013-3, Class A3 (USD), 3.47%, 07/25/2043 (b)(c) | 4,678,607 | 4,755,364 | ||||||
Series 2014-1, Class 2A2 (USD), 3.50%, 01/25/2044 (b)(c) | 6,946,201 | 7,171,807 | ||||||
Series 2014-IVR6, Class AM, CMO (USD), 2.91%, 07/25/2044 (b)(c) | 4,892,728 | 4,929,326 | ||||||
JPMBB Commercial Mortgage Securities Trust | ||||||||
Series 2014-C26, Class AS (USD), 3.80%, 01/15/2048 | 3,290,000 | 3,475,895 | ||||||
Series 2015-C28, Class A3 (USD), 2.91%, 10/15/2048 | 4,890,000 | 4,873,174 | ||||||
See accompanying Notes to Financial Statements.
Semi-Annual Report 2015
20
Statement of Investments (continued)
April 30, 2015 (Unaudited)
Aberdeen Total Return Bond Fund
| Shares or Principal Amount | Value (US$) | |||||||
LB-UBS Commercial Mortgage Trust | ||||||||
Series 2006-C4, Class AM (USD), 6.05%, 06/15/2038 (c) | $ | 2,320,000 | $ | 2,435,700 | ||||
Series 2007-C7, Class AM (USD), 6.37%, 09/15/2045 (c) | 3,080,000 | 3,396,595 | ||||||
MASTR Adjustable Rate Mortgages Trust, Series 2006-2, Class 4A1 (USD), 2.64%, 02/25/2036 (c) | 1,070,934 | 1,055,233 | ||||||
MASTR Alternative Loan Trust, Series 2004-3, Class 4A1 (USD), 5.50%, 04/25/2034 | 2,554,816 | 2,702,557 | ||||||
Merrill Lynch Mortgage Investors Trust | ||||||||
Series 2006-1, Class 2A1 (USD), 2.12%, 02/25/2036 (c) | 2,100,755 | 2,079,784 | ||||||
Series 2007-2, Class 2A1 (USD), 2.53%, 06/25/2037 (c) | 1,588,127 | 1,528,949 | ||||||
Series 2007-3, Class 2A2 (USD), 2.46%, 09/25/2037 (c) | 1,473,139 | 1,415,027 | ||||||
Morgan Stanley Capital I Trust | ||||||||
Series 2013-WLSR, Class A (USD), 2.70%, 01/11/2032 (b) | 4,310,000 | 4,432,173 | ||||||
Series 2006-IQ12, Class AM (USD), 5.37%, 12/15/2043 | 4,030,000 | 4,263,103 | ||||||
Series 2007-IQ16, Class A4 (USD), 5.81%, 12/12/2049 | 3,507,354 | 3,800,912 | ||||||
NCUA Guaranteed Notes Trust | ||||||||
Series 2010-R2, Class 1A (USD), 0.55%, 11/06/2017 (c) | 2,863,447 | 2,870,977 | ||||||
Series 2010-R3, Class 1A (USD), 0.74%, 12/08/2020 (c) | 4,562,213 | 4,605,616 | ||||||
New Residential Mortgage Loan Trust | ||||||||
Series 2014-1A, Class A (USD), 3.75%, 01/25/2054 (b)(c) | 1,412,910 | 1,465,417 | ||||||
Series 2014-2A, Class A3 (USD), 3.75%, 05/25/2054 (b)(c) | 4,696,792 | 4,850,743 | ||||||
PHH Mortgage Trust, Series 2008-CIM1, Class 21A1 (USD), 6.00%, 05/25/2038 | 2,282,151 | 2,390,013 | ||||||
Sequoia Mortgage Trust | ||||||||
Series 2013-4, Class A2 (USD), 2.50%, 04/25/2043 (c) | 4,776,706 | 4,642,663 | ||||||
Series 2013-5, Class A1 (USD), 2.50%, 05/25/2043 (b)(c) | 5,371,651 | 5,133,622 | ||||||
Series 2013-6, Class A1 (USD), 2.50%, 05/25/2043 (c) | 4,893,754 | 4,684,243 | ||||||
Series 2014-3, Class A8 (USD), 4.00%, 10/25/2044 (b)(c) | 3,218,648 | 3,398,628 | ||||||
Series 2015-1, Class A1 (USD), 3.50%, 01/25/2045 (b)(c) | 5,019,722 | 5,100,996 | ||||||
Series 2015-2, Class A1 (USD), 3.50%, 05/25/2045 (a)(b)(c) | 6,180,000 | 6,322,912 | ||||||
SFAVE Commercial Mortgage Securities Trust, Series 2015-5AVE, Class C (USD), 4.53%, 01/05/2035 (b)(c) | 3,460,000 | 3,521,576 | ||||||
Structured Agency Credit Risk | ||||||||
Series 2015-HQ1, Class M2, CMO (USD), 2.38%, 03/25/2025 (c) | 4,900,000 | 4,950,967 | ||||||
Series 2015-DNA1, Class M2 (USD), 2.03%, 10/25/2027 (c) | 2,940,000 | 2,948,575 | ||||||
Structured Asset Securities Corp., Series 2004-18H, Class A5 (USD), 4.75%, 10/25/2034 | 3,736,230 | 3,752,740 | ||||||
Thornburg Mortgage Securities Trust | ||||||||
Series 2007-4, Class 2A1 (USD), 2.50%, 09/25/2037 (c) | 3,365,022 | 3,316,633 | ||||||
Series 2007-4, Class 3A1 (USD), 6.21%, 09/25/2037 (c) | 345,800 | 356,740 | ||||||
Wachovia Bank Commercial Mortgage Trust, Series 2006-C28, Class AM (USD), 5.60%, 10/15/2048 (c) | 5,195,000 | 5,485,003 | ||||||
WaMu Mortgage Pass Through Certificates, Series 2005-AR7, Class A3 (USD), 2.36%, 08/25/2035 (c) | 4,680,000 | 4,677,880 | ||||||
Wells Fargo Mortgage Backed Securities Trust | ||||||||
Series 2005-AR13, Class 4A1 (USD), 5.40%, 05/25/2035 (c) | 2,875,185 | 2,843,921 | ||||||
Series 2006-5, Class 1A5 (USD), 5.25%, 04/25/2036 | 2,340,626 | 2,347,940 | ||||||
Series 2006-10, Class A4 (USD), 6.00%, 08/25/2036 | 1,263,099 | 1,299,154 | ||||||
Series 2006-19, Class A4 (USD), 5.25%, 12/26/2036 | 618,270 | 621,737 | ||||||
| 303,375,861 | ||||||||
Total Commercial Mortgage-Backed Securities | 303,375,861 | |||||||
CORPORATE BONDS (31.5%) | ||||||||
AUSTRALIA (2.0%) | ||||||||
Commercial Banks (2.0%) | ||||||||
Australia & New Zealand Banking Group Ltd. (USD), 1.00%, 10/06/2015 (b) | 7,360,000 | 7,375,493 | ||||||
National Australia Bank Ltd. (USD), 1.25%, 03/08/2018 (b) | 15,100,000 | 15,068,652 | ||||||
Westpac Banking Corp. (USD), 1.38%, 07/17/2015 (b) | 7,320,000 | 7,332,151 | ||||||
| 29,776,296 | ||||||||
CANADA (0.8%) | ||||||||
Commercial Banks (0.8%) | ||||||||
National Bank of Canada (USD), 1.45%, 11/07/2017 | 3,860,000 | 3,858,769 | ||||||
Toronto-Dominion Bank (USD), 2.20%, 07/29/2015 (b) | 8,130,000 | 8,163,081 | ||||||
| 12,021,850 | ||||||||
CHINA (0.2%) | ||||||||
Commercial Banks (0.2%) | ||||||||
Industrial & Commercial Bank of China Ltd. (USD), 3.23%, 11/13/2019 | 2,280,000 | 2,339,886 | ||||||
FRANCE (0.9%) | ||||||||
Apparel (0.3%) | ||||||||
LVMH Moet Hennessy Louis Vuitton SE (USD), 1.63%, 06/29/2017 (b) | 4,250,000 | 4,292,415 | ||||||
See accompanying Notes to Financial Statements.
2015 Semi-Annual Report
21
Statement of Investments (continued)
April 30, 2015 (Unaudited)
Aberdeen Total Return Bond Fund
| Shares or Principal Amount | Value (US$) | |||||||
Beverages (0.6%) | ||||||||
Pernod-Ricard SA (USD), 4.25%, 07/15/2022 (b) | $ | 8,280,000 | $ | 8,850,451 | ||||
| 13,142,866 | ||||||||
GUERNSEY (0.2%) | ||||||||
Commercial Banks (0.2%) | ||||||||
Credit Suisse Group Funding Guernsey Ltd. (USD), 2.75%, 03/26/2020 (b) | 3,010,000 | 3,024,000 | ||||||
HONG KONG (0.4%) | ||||||||
Holding Companies-Diversified Operations (0.4%) |
| |||||||
Hutchison Whampoa International 14 Ltd. (USD), 3.63%, 10/31/2024 (b) | 5,200,000 | 5,300,157 | ||||||
ITALY (0.5%) | ||||||||
Commercial Banks (0.5%) | ||||||||
Intesa Sanpaolo SpA (USD), 3.13%, 01/15/2016 | 8,040,000 | 8,137,372 | ||||||
LUXEMBOURG (0.6%) | ||||||||
Healthcare Products (0.2%) | ||||||||
Covidien International Finance SA (USD), 1.35%, 05/29/2015 | 3,310,000 | 3,312,539 | ||||||
Miscellaneous Manufacturing (0.4%) | ||||||||
Ingersoll-Rand Luxembourg Finance SA (USD), 4.65%, 11/01/2044 | 2,990,000 | 3,059,428 | ||||||
Pentair Finance SA (USD), 3.15%, 09/15/2022 | 2,628,000 | 2,598,824 | ||||||
| 5,658,252 | ||||||||
| 8,970,791 | ||||||||
NETHERLANDS (1.8%) | ||||||||
Auto Manufacturers (0.3%) | ||||||||
Volkswagen International Finance (USD), 1.15%, 11/20/2015 (b) | 4,650,000 | 4,667,772 | ||||||
Beverages (0.1%) | ||||||||
Diageo Finance BV (USD), 5.30%, 10/28/2015 | 1,610,000 | 1,648,774 | ||||||
Commercial Banks (0.8%) | ||||||||
ABN AMRO Bank (USD), 2.50%, 10/30/2018 (b) | 4,750,000 | 4,850,600 | ||||||
Cooperatieve Centrale Raiffeisen-Boerenleenbank BA (USD), 2.13%, 10/13/2015 | 550,000 | 554,314 | ||||||
ING Bank (USD), 2.50%, 01/14/2016 (b) | 6,330,000 | 6,415,866 | ||||||
| 11,820,780 | ||||||||
Electric Utilities (0.5%) | ||||||||
Enel Finance International (USD), 6.00%, 10/07/2039 (b) | 6,080,000 | 7,155,935 | ||||||
Oil, Gas & Consumable Fuels (0.1%) | ||||||||
Shell International Finance BV (USD), 3.25%, 09/22/2015 | 2,340,000 | 2,364,666 | ||||||
| 27,657,927 | ||||||||
NORWAY (0.5%) | ||||||||
Commercial Banks (0.5%) | ||||||||
DNB Bank ASA (USD), 3.20%, 04/03/2017 (b) | 7,220,000 | 7,470,693 | ||||||
PANAMA (0.8%) | ||||||||
Leisure Time (0.8%) | ||||||||
Carnival Corp. (USD), 3.95%, 10/15/2020 | 10,830,000 | 11,526,466 | ||||||
SUPRANATIONAL (1.9%) | ||||||||
Banks (1.9%) | ||||||||
International Bank for Reconstruction & Development | ||||||||
Series GDIF (AUD), 3.50%, 04/29/2019 | 8,110,000 | 6,657,570 | ||||||
(NZD), 4.63%, 02/26/2019 | 8,530,000 | 6,726,859 | ||||||
International Finance Corp. (USD), 0.50%, 05/15/2015 | 15,150,000 | 15,150,212 | ||||||
| 28,534,641 | ||||||||
SWEDEN (0.8%) | ||||||||
Commercial Banks (0.8%) | ||||||||
Nordea Bank AB (USD), 3.13%, 03/20/2017 (b) | 7,040,000 | 7,288,765 | ||||||
Svenska Handelsbanken AB (USD), 2.50%, 01/25/2019 | 4,970,000 | 5,091,452 | ||||||
| 12,380,217 | ||||||||
UNITED KINGDOM (0.9%) | ||||||||
Aerospace & Defense (0.3%) | ||||||||
BAE Systems PLC (USD), 4.75%, 10/11/2021 (b) | 4,095,000 | 4,562,645 | ||||||
Commercial Banks (0.3%) | ||||||||
Barclays Bank PLC (USD), 2.50%, 09/21/2015 (b) | 4,370,000 | 4,407,032 | ||||||
Oil, Gas & Consumable Fuels (0.3%) | ||||||||
BP Capital Markets PLC (USD), 0.70%, 11/06/2015 | 4,631,000 | 4,635,677 | ||||||
| 13,605,354 | ||||||||
UNITED STATES (19.2%) | ||||||||
Aerospace & Defense (0.3%) | ||||||||
United Technologies Corp. (USD), 4.15%, 05/15/2045 | 4,870,000 | 4,915,388 | ||||||
Auto Manufacturers (0.6%) | ||||||||
American Honda Finance Corp. (USD), 1.00%, 08/11/2015 (b) | 4,650,000 | 4,658,807 | ||||||
Toyota Motor Credit Corp. (USD), 2.80%, 01/11/2016 | 4,845,000 | 4,922,288 | ||||||
| 9,581,095 | ||||||||
Beverages (0.4%) | ||||||||
Anheuser-Busch InBev Worldwide, Inc. (USD), 2.50%, 07/15/2022 | 6,860,000 | 6,770,319 | ||||||
Biotechnology (0.2%) | ||||||||
Gilead Sciences, Inc. (USD), 4.80%, 04/01/2044 | 2,320,000 | 2,555,431 | ||||||
Commercial Banks (3.4%) | ||||||||
Bank of America Corp. (USD), 4.20%, 08/26/2024 | 5,390,000 | 5,455,736 | ||||||
Citigroup, Inc. (USD), 2.50%, 09/26/2018 | 9,210,000 | 9,394,025 | ||||||
First Tennessee Bank NA (USD), 2.95%, 12/01/2019 | 5,770,000 | 5,832,380 | ||||||
Goldman Sachs Group, Inc. (The) (USD), 4.00%, 03/03/2024 | 6,790,000 | 7,113,591 | ||||||
See accompanying Notes to Financial Statements.
Semi-Annual Report 2015
22
Statement of Investments (continued)
April 30, 2015 (Unaudited)
Aberdeen Total Return Bond Fund
| Shares or Principal Amount | Value (US$) | |||||||
JPMorgan Chase & Co. (USD), 4.35%, 08/15/2021 | $ | 9,720,000 | $ | 10,635,585 | ||||
Morgan Stanley (USD), 5.63%, 09/23/2019 | 3,300,000 | 3,740,540 | ||||||
Wells Fargo & Co. (USD), 4.10%, 06/03/2026 | 9,150,000 | 9,496,108 | ||||||
| 51,667,965 | ||||||||
Computers & Peripherals (0.3%) | ||||||||
International Business Machines Corp. (USD), 6.22%, 08/01/2027 | 3,400,000 | 4,346,951 | ||||||
Diversified Financial Services (2.0%) | ||||||||
American Express Co. (USD), 4.05%, 12/03/2042 | 3,270,000 | 3,166,341 | ||||||
American Express Credit Corp. (USD), 2.75%, 09/15/2015 | 2,965,000 | 2,987,887 | ||||||
Apollo Management Holdings LP (USD), 4.00%, 05/30/2024 (b) | 4,720,000 | 4,833,332 | ||||||
Blackstone Holdings Finance Co. LLC (USD), 4.45%, 07/15/2045 (b) | 2,380,000 | 2,334,735 | ||||||
Harley-Davidson Financial Services, Inc. (USD), 3.88%, 03/15/2016 (b) | 5,260,000 | 5,401,336 | ||||||
KKR Group Finance Co. III LLC (USD), 5.13%, 06/01/2044 (b) | 3,340,000 | 3,410,341 | ||||||
Legg Mason, Inc. (USD), 5.63%, 01/15/2044 | 4,290,000 | 4,936,902 | ||||||
PACCAR Financial Corp. (USD), 0.80%, 02/08/2016 | 2,710,000 | 2,717,463 | ||||||
| 29,788,337 | ||||||||
Diversified Telecommunication Services (0.4%) |
| |||||||
Verizon Communications, Inc. (USD), 4.86%, 08/21/2046 | 6,470,000 | 6,549,225 | ||||||
Electric Utilities (1.1%) | ||||||||
Duke Energy Carolinas LLC, Series A (USD), 6.00%, 12/01/2028 | 8,243,000 | 10,361,352 | ||||||
Edison International (USD), 3.75%, 09/15/2017 | 5,515,000 | 5,835,659 | ||||||
| 16,197,011 | ||||||||
Energy Equipment & Services (1.6%) | ||||||||
Enable Midstream Partners LP (USD), 5.00%, 05/15/2044 (b) | 4,200,000 | 3,820,555 | ||||||
Energy Transfer Partners LP (USD), 4.15%, 10/01/2020 | 7,400,000 | 7,840,108 | ||||||
Plains All American Pipeline LP / PAA Finance Corp. (USD), 3.65%, 06/01/2022 | 6,622,000 | 6,842,075 | ||||||
Williams Partners LP (USD), 3.90%, 01/15/2025 | 5,940,000 | 5,863,784 | ||||||
| 24,366,522 | ||||||||
Food Products (0.1%) | ||||||||
JM Smucker Co. (The) (USD), 4.38%, 03/15/2045 (b) | 1,650,000 | 1,649,748 | ||||||
Healthcare Products (0.1%) | ||||||||
Becton Dickinson and Co. (USD), 4.69%, 12/15/2044 | 1,380,000 | 1,452,163 | ||||||
Healthcare Providers & Services (0.6%) | ||||||||
Anthem, Inc. (USD), 5.10%, 01/15/2044 | 4,650,000 | 5,213,524 | ||||||
Quest Diagnostics, Inc. (USD), 4.70%, 03/30/2045 | 3,230,000 | 3,211,363 | ||||||
| 8,424,887 | ||||||||
Insurance (1.0%) | ||||||||
American International Group, Inc. | ||||||||
(USD), 4.13%, 02/15/2024 | 2,380,000 | 2,564,067 | ||||||
(USD), 4.50%, 07/16/2044 | 3,420,000 | 3,554,604 | ||||||
Metropolitan Life Global Funding I (USD), 2.50%, 09/29/2015 (b) | 4,600,000 | 4,638,521 | ||||||
Travelers Property Casualty Corp. (USD), 7.75%, 04/15/2026 | 3,308,000 | 4,292,206 | ||||||
| 15,049,398 | ||||||||
Iron/Steel (0.1%) | ||||||||
Glencore Funding LLC (USD), 4.00%, 04/16/2025 (b) | 1,790,000 | 1,759,550 | ||||||
Media (1.3%) | ||||||||
21st Century Fox America, Inc. | ||||||||
(USD), 7.75%, 01/20/2024 | 530,000 | 682,987 | ||||||
(USD), 8.50%, 02/23/2025 | 350,000 | 473,405 | ||||||
(USD), 7.43%, 10/01/2026 | 3,902,000 | 4,892,768 | ||||||
CBS Corp. (USD), 2.30%, 08/15/2019 | 4,690,000 | 4,696,932 | ||||||
Time Warner Cos., Inc. (USD), 7.57%, 02/01/2024 | 6,627,000 | 8,600,951 | ||||||
| 19,347,043 | ||||||||
Miscellaneous Manufacturing (0.6%) | ||||||||
General Electric Co. (USD), 0.85%, 10/09/2015 | 4,339,000 | 4,348,867 | ||||||
Pentair Finance SA (USD), 1.88%, 09/15/2017 | 4,260,000 | 4,282,761 | ||||||
| 8,631,628 | ||||||||
Oil, Gas & Consumable Fuels (1.3%) | ||||||||
Chevron Corp. (USD), 0.36%, 02/22/2017 (c) | 4,870,000 | 4,880,504 | ||||||
Marathon Petroleum Corp. (USD), 4.75%, 09/15/2044 | 3,450,000 | 3,465,653 | ||||||
Noble Energy, Inc. (USD), 5.25%, 11/15/2043 | 4,560,000 | 4,894,978 | ||||||
Valero Energy Corp. (USD), 9.38%, 03/15/2019 | 5,524,000 | 6,909,132 | ||||||
| 20,150,267 | ||||||||
Pharmaceutical (1.2%) | ||||||||
Bristol-Myers Squibb Co. (USD), 6.80%, 11/15/2026 | 5,280,000 | 7,081,689 | ||||||
Wyeth LLC (USD), 6.45%, 02/01/2024 | 8,320,000 | 10,511,080 | ||||||
| 17,592,769 | ||||||||
Retail (0.3%) | ||||||||
Tiffany & Co. (USD), 4.90%, 10/01/2044 (b) | 1,770,000 | 1,784,786 | ||||||
Wal-Mart Stores, Inc. (USD), 0.60%, 04/11/2016 | 2,110,000 | 2,115,134 | ||||||
| 3,899,920 | ||||||||
Software (1.1%) | ||||||||
Microsoft Corp. (USD), 3.75%, 02/12/2045 | 5,960,000 | 5,661,273 | ||||||
Oracle Corp. (USD), 2.80%, 07/08/2021 | 10,450,000 | 10,722,202 | ||||||
| 16,383,475 | ||||||||
See accompanying Notes to Financial Statements.
2015 Semi-Annual Report
23
Statement of Investments (continued)
April 30, 2015 (Unaudited)
Aberdeen Total Return Bond Fund
| Shares or Principal Amount | Value (US$) | |||||||
Transportation (1.2%) | ||||||||
Burlington Northern Santa Fe LLC (USD), 4.90%, 04/01/2044 | $ | 6,830,000 | $ | 7,736,041 | ||||
CSX Corp. (USD), 3.95%, 05/01/2050 | 2,520,000 | 2,420,810 | ||||||
FedEx Corp. (USD), 4.90%, 01/15/2034 | 6,680,000 | 7,321,467 | ||||||
| 17,478,318 | ||||||||
| 288,557,410 | ||||||||
Total Corporate Bonds | 472,445,926 | |||||||
MUNICIPAL BONDS (4.6%) | ||||||||
UNITED STATES (4.6%) | ||||||||
CALIFORNIA (2.0%) | ||||||||
Los Angeles Unified School District General Obligation Unlimited Bonds | ||||||||
(USD), 5.76%, 07/01/2029 | 2,185,000 | 2,652,088 | ||||||
(USD), 6.76%, 07/01/2034 | 10,380,000 | 14,191,847 | ||||||
San Francisco City & County Public Utilities Commission Water, Revenue Bonds (USD), 6.00%, 11/01/2040 | 3,370,000 | 4,306,220 | ||||||
State of California General Obligation Unlimited Bonds | ||||||||
(USD), 7.55%, 04/01/2039 | 4,000,000 | 6,152,320 | ||||||
(USD), 7.35%, 11/01/2039 | 2,195,000 | 3,232,379 | ||||||
| 30,534,854 | ||||||||
CONNECTICUT (0.5%) | ||||||||
State of Connecticut General Obligation Unlimited Bonds | ||||||||
(USD), 5.09%, 10/01/2030 | 1,225,000 | 1,391,563 | ||||||
Series A (USD), 5.85%, 03/15/2032 | 4,770,000 | 5,918,425 | ||||||
| 7,309,988 | ||||||||
FLORIDA (0.2%) | ||||||||
Florida Hurricane Catastrophe Fund Finance Corp., Revenue Bonds, Series A (USD), 1.30%, 07/01/2016 | 2,370,000 | 2,385,855 | ||||||
MASSACHUSETTS (0.5%) | ||||||||
Commonwealth of Massachusetts General Obligation Limited Bonds | ||||||||
Series E (USD), 4.20%, 12/01/2021 | 4,975,000 | 5,522,797 | ||||||
(USD), 4.91%, 05/01/2029 | 1,810,000 | 2,118,895 | ||||||
| 7,641,692 | ||||||||
NEW YORK (1.1%) | ||||||||
New York City Municipal Water Finance Authority Revenue Bonds (Build America Bonds) (USD), 5.44%, 06/15/2043 | 5,910,000 | 7,491,102 | ||||||
New York City Transitional Finance Authority Revenue Bonds (Qualified School Construction BD) | ||||||||
(USD), 5.27%, 05/01/2027 | 3,360,000 | 3,963,658 | ||||||
(USD), 5.01%, 08/01/2027 | 3,780,000 | 4,291,623 | ||||||
New York State Dormitory Authority Revenue Bonds (Build America Bonds) (USD), 5.50%, 03/15/2030 | 810,000 | 954,374 | ||||||
| 16,700,757 | ||||||||
PENNSYLVANIA (0.3%) | ||||||||
Pennsylvania State General Obligation Unlimited Bonds (Build America Bonds), Series B (USD), 4.65%, 02/15/2026 | 4,360,000 | 4,836,897 | ||||||
| 69,410,043 | ||||||||
Total Municipal Bonds | 69,410,043 | |||||||
GOVERNMENT BONDS (10.8%) | ||||||||
AUSTRALIA (0.9%) | ||||||||
Australia Government Bond (AUD), 1.25%, 02/21/2022 (b)(d) | 6,870,000 | 6,211,065 | ||||||
Queensland Treasury Corp. (AUD), 4.75%, 07/21/2025 (b) | 8,350,000 | 7,499,157 | ||||||
| 13,710,222 | ||||||||
BRAZIL (1.7%) | ||||||||
Brazil Letras do Tesouro Nacional (BRL), 0.00%, 01/01/2017 (e) | 53,964,000 | 14,504,091 | ||||||
Brazil Notas do Tesouro Nacional, Series F (BRL), 10.00%, 01/01/2017 | 35,217,000 | 11,109,893 | ||||||
| 25,613,984 | ||||||||
CANADA (0.7%) | ||||||||
Canada Housing Trust No 1 (CAD), 1.20%, 06/15/2020 (b) | 9,330,000 | 7,658,720 | ||||||
Province of British Columbia (USD), 2.85%, 06/15/2015 | 2,080,000 | 2,086,215 | ||||||
| 9,744,935 | ||||||||
ITALY (2.9%) | ||||||||
Italy Buoni Poliennali Del Tesoro | ||||||||
(EUR), 4.50%, 03/01/2024 | 20,220,000 | 28,527,380 | ||||||
(EUR), 3.50%, 03/01/2030 (b) | 11,380,000 | 15,339,260 | ||||||
| 43,866,640 | ||||||||
MEXICO (1.7%) | ||||||||
Mexican Bonos (MXN), 7.75%, 05/29/2031 | 163,790,000 | 12,213,565 | ||||||
Mexico Fixed Rate Bonds, Series M20 (MXN), 10.00%, 12/05/2024 | 160,118,400 | 13,542,779 | ||||||
| 25,756,344 | ||||||||
NEW ZEALAND (1.7%) | ||||||||
New Zealand Government Bond | ||||||||
(NZD), 5.00%, 03/15/2019 (b) | 14,650,000 | 11,947,125 | ||||||
Series 423 (NZD), 5.50%, 04/15/2023 (b) | 15,030,000 | 13,225,304 | ||||||
| 25,172,429 | ||||||||
REPUBLIC OF SOUTH KOREA (0.2%) | ||||||||
Korea Housing Finance Corp. (USD), 1.63%, 09/15/2018 (b) | 3,230,000 | 3,203,365 | ||||||
SPAIN (1.0%) | ||||||||
Spain Government Bond (EUR), 1.60%, 04/30/2025 (b) | 13,820,000 | 15,716,475 | ||||||
Total Government Bonds | 162,784,394 | |||||||
See accompanying Notes to Financial Statements.
Semi-Annual Report 2015
24
Statement of Investments (continued)
April 30, 2015 (Unaudited)
Aberdeen Total Return Bond Fund
| Shares or Principal Amount | Value (US$) | |||||||
GOVERNMENT AGENCIES (0.2%) | ||||||||
MEXICO (0.2%) | ||||||||
Petroleos Mexicanos (USD), 6.38%, 01/23/2045 | $ | 2,480,000 | $ | 2,736,680 | ||||
Total Government Agencies | 2,736,680 | |||||||
U.S. AGENCIES (10.5%) | ||||||||
UNITED STATES (10.5%) | ||||||||
Federal Home Loan Mortgage Corp. | ||||||||
(USD), 6.50%, 05/01/2022 | 1,450 | 1,667 | ||||||
TBA (USD), 2.50%, 05/01/2030 | 7,420,000 | 7,605,790 | ||||||
(USD), 6.50%, 08/01/2036 | 518,711 | 599,641 | ||||||
(USD), 6.50%, 09/01/2037 | 62,988 | 72,412 | ||||||
(USD), 6.50%, 12/01/2037 | 134,405 | 154,533 | ||||||
(USD), 6.50%, 05/01/2038 | 1,444,721 | 1,661,436 | ||||||
(USD), 6.50%, 09/01/2038 | 120,197 | 138,153 | ||||||
(USD), 6.50%, 10/01/2038 | 1,027,291 | 1,181,011 | ||||||
(USD), 6.50%, 10/01/2038 | 2,498 | 2,872 | ||||||
(USD), 6.50%, 11/01/2038 | 947,302 | 1,145,355 | ||||||
(USD), 6.50%, 12/01/2038 | 442,638 | 516,829 | ||||||
(USD), 5.00%, 10/01/2041 | 7,828,219 | 8,775,682 | ||||||
(USD), 3.00%, 02/01/2043 | 6,863,558 | 6,990,622 | ||||||
(USD), 3.00%, 04/01/2043 | 5,638,860 | 5,741,970 | ||||||
(USD), 4.50%, 10/01/2043 | 4,431,091 | 4,818,114 | ||||||
(USD), 4.50%, 10/01/2043 | 4,271,119 | 4,647,421 | ||||||
(USD), 4.50%, 07/01/2044 | 5,034,770 | 5,482,008 | ||||||
(USD), 4.00%, 11/01/2044 | 8,785,708 | 9,428,019 | ||||||
(USD), 4.00%, 11/01/2044 | 4,426,407 | 4,749,999 | ||||||
Federal National Mortgage Association | ||||||||
(USD), 3.50%, 10/01/2023 | 9,164,697 | 9,742,970 | ||||||
(USD), 3.50%, 10/01/2023 | 4,230,898 | 4,496,683 | ||||||
(USD), 5.00%, 05/01/2035 | 2,747,897 | 3,067,256 | ||||||
(USD), 2.51%, 02/01/2036 (c) | 295,551 | 315,692 | ||||||
(USD), 5.50%, 03/01/2038 | 7,485,960 | 8,571,626 | ||||||
(USD), 5.00%, 04/01/2040 | 1,410,118 | 1,577,927 | ||||||
(USD), 5.00%, 05/01/2040 | 1,421,692 | 1,582,949 | ||||||
(USD), 4.50%, 12/01/2040 | 4,019,682 | 4,392,914 | ||||||
(USD), 5.00%, 02/01/2041 | 1,417,817 | 1,586,558 | ||||||
(USD), 5.00%, 04/01/2041 | 1,493,153 | 1,670,862 | ||||||
(USD), 4.00%, 10/01/2041 | 12,653,535 | 13,602,633 | ||||||
(USD), 3.50%, 03/01/2042 | 1,851,749 | 1,943,570 | ||||||
(USD), 3.50%, 06/01/2042 | 5,569,033 | 5,843,673 | ||||||
(USD), 4.00%, 06/01/2043 | 4,819,529 | 5,205,030 | ||||||
(USD), 4.50%, 03/01/2044 | 3,482,466 | 3,795,131 | ||||||
(USD), 4.50%, 04/01/2044 | 6,389,009 | 7,007,196 | ||||||
(USD), 4.50%, 08/01/2044 | 3,299,426 | 3,599,302 | ||||||
(USD), 3.07%, 01/01/2045 (c) | 6,427,593 | 6,667,623 | ||||||
(USD), 3.50%, 02/01/2045 | 5,657,283 | 5,950,592 | ||||||
Government National Mortgage Association | ||||||||
(USD), 6.00%, 04/15/2037 | 172,150 | 196,816 | ||||||
(USD), 6.00%, 06/15/2037 | 172,235 | 196,050 | ||||||
(USD), 6.00%, 09/15/2037 | 254,562 | 289,947 | ||||||
(USD), 6.00%, 11/15/2037 | 752,104 | 856,096 | ||||||
(USD), 6.00%, 11/15/2037 | 169,515 | 192,960 | ||||||
(USD), 6.00%, 12/15/2037 | 194,927 | 221,951 | ||||||
(USD), 6.00%, 12/15/2037 | 65,748 | 74,839 | ||||||
(USD), 6.00%, 01/15/2038 | 136,819 | 155,737 | ||||||
(USD), 6.00%, 04/15/2038 | 241,288 | 274,650 | ||||||
(USD), 6.00%, 07/15/2038 | 91,987 | 104,706 | ||||||
(USD), 6.00%, 08/15/2038 | 33,306 | 37,911 | ||||||
(USD), 6.00%, 09/15/2038 | 334,321 | 380,547 | ||||||
(USD), 6.00%, 09/15/2038 | 95,987 | 109,259 | ||||||
| 157,425,190 | ||||||||
Total U.S. Agencies | 157,425,190 | |||||||
U.S. TREASURIES (9.9%) | ||||||||
UNITED STATES (9.9%) | ||||||||
U.S. Treasury Bonds | ||||||||
(USD), 3.75%, 11/15/2043 | 5,000 | 6,018 | ||||||
(USD), 3.63%, 02/15/2044 | 3,250,000 | 3,828,653 | ||||||
(USD), 3.38%, 05/15/2044 | 2,340,000 | 2,638,350 | ||||||
(USD), 3.13%, 08/15/2044 | 26,240,000 | 28,263,340 | ||||||
(USD), 3.00%, 11/15/2044 | 100,000 | 105,242 | ||||||
U.S. Treasury Inflation Index Bonds (USD), 0.63%, 02/15/2043 (d) | 8,043,746 | 7,808,089 | ||||||
U.S. Treasury Inflation Index Notes (USD), 0.13%, 04/15/2019 (d) | 31,329,110 | 32,056,038 | ||||||
U.S. Treasury Notes | ||||||||
(USD), 4.13%, 05/15/2015 | 21,580,000 | 21,614,571 | ||||||
(USD), 0.38%, 08/31/2015 | 4,370,000 | 4,374,781 | ||||||
(USD), 0.07%, 01/31/2016 (c) | 8,000,000 | 7,999,848 | ||||||
(USD), 0.88%, 08/15/2017 | 2,500,000 | 2,509,570 | ||||||
(USD), 1.50%, 12/31/2018 | 820,000 | 830,122 | ||||||
(USD), 1.25%, 01/31/2020 | 10,260,000 | 10,183,050 | ||||||
(USD), 2.00%, 02/15/2025 | 26,350,000 | 26,245,022 | ||||||
| 148,462,694 | ||||||||
Total U.S. Treasuries | 148,462,694 | |||||||
REPURCHASE AGREEMENT (3.9%) | ||||||||
UNITED STATES (3.9%) | ||||||||
Repurchase Agreement, Fixed Income Clearing Corp., 0.00%, dated 04/30/2015, due 05/01/2015, repurchase price $58,382,459, Collateralized by U.S. Treasury Note, maturing ranging 12/31/2021; total market value of $59,554,600 | 58,382,459 | 58,382,459 | ||||||
Total Repurchase Agreement | 58,382,459 | |||||||
Total Investments | 1,509,949,468 | |||||||
Liabilities in excess of other assets—(0.6)% | (9,697,561 | ) | ||||||
Net Assets—100.0% | $ | 1,500,251,907 | ||||||
| (a) | Fair Valued Security. Fair Values are determined pursuant to procedures approved by the Fund’s Board of Trustees. See Note 2(a) of the accompanying Notes to Financial Statements. |
| (b) | Denotes a security issued under Regulation S or Rule 144A. |
| (c) | Variable or Floating Rate Security. Rate disclosed is as of April 30, 2015. |
| (d) | Inflation linked security. |
| (e) | Issued with a zero coupon. |
| (f) | See Notes to Financial Statements for tax unrealized appreciation/depreciation of securities. |
See accompanying Notes to Financial Statements.
2015 Semi-Annual Report
25
Statement of Investments (continued)
April 30, 2015 (Unaudited)
Aberdeen Total Return Bond Fund
| AUD | Australian Dollar |
| BRL | Brazilian Real |
| CAD | Canadian Dollar |
| EUR | Euro Currency |
| GBP | British Pound Sterling |
| IDR | Indonesian Rupiah |
| JPY | Japanese Yen |
| MXN | Mexican Peso |
| NZD | New Zealand Dollar |
| TBA | Securities purchased on a forward commitment basis with an appropriate principal amount and no definitive maturity date. The actual principal and maturity date will be determined upon settlement date. |
| USD | U.S. Dollar |
At April 30, 2015, the Fund held the following futures contracts:
| Futures Contracts | Counterparty | Number of Contracts Long (Short) | Expiration Date | Unrealized Depreciation | ||||||||||||
United States Treasury Note 6%-5 year | JPMorgan Chase Bank N.A. | 142 | 06/30/2015 | $ | (7,766 | ) | ||||||||||
United States Treasury Note 6%-10 year | JPMorgan Chase Bank N.A. | (231 | ) | 06/19/2015 | (119,109 | ) | ||||||||||
United States Treasury Bond 6%-Ultra Long | JPMorgan Chase Bank N.A. | 50 | 06/19/2015 | (139,844 | ) | |||||||||||
| $ | (266,719 | ) | ||||||||||||||
At April 30, 2015, the Fund’s open forward foreign currency exchange contracts were as follows:
| Purchase Contracts Settlement Date* | Counterparty | Amount | Amount | Fair Value | Unrealized Appreciation/ (Depreciation) | |||||||||||||||||||||
| British Pound/United States Dollar | ||||||||||||||||||||||||||
05/29/2015 | Deutsche Bank AG | GBP | 800,000 | USD | 1,202,925 | $ | 1,227,785 | $ | 24,860 | |||||||||||||||||
| Indonesian Rupiah/United States Dollar | ||||||||||||||||||||||||||
05/18/2015 | JPMorgan Chase Bank N.A. | IDR | 285,424,273,308 | USD | 21,859,866 | 21,961,837 | 101,971 | |||||||||||||||||||
| Japanese Yen/United States Dollar | ||||||||||||||||||||||||||
05/07/2015 | Westpac Banking Corp. | JPY | 1,713,313,082 | USD | 14,194,945 | 14,349,357 | 154,412 | |||||||||||||||||||
| Mexican Peso/United States Dollar | ||||||||||||||||||||||||||
05/18/2015 | Citibank N.A. | MXN | 161,563,950 | USD | 10,545,418 | 10,521,029 | (24,389 | ) | ||||||||||||||||||
05/18/2015 | Deutsche Bank AG | MXN | 209,972,695 | USD | 13,688,636 | 13,673,402 | (15,234 | ) | ||||||||||||||||||
| New Zealand Dollar/United States Dollar | ||||||||||||||||||||||||||
05/04/2015 | Deutsche Bank AG | NZD | 12,405,131 | USD | 9,441,545 | 9,468,214 | 26,669 | |||||||||||||||||||
| 05/04/2015 | Westpac Banking Corp. | NZD | 22,574,118 | USD | 17,150,499 | 17,229,692 | 79,193 | |||||||||||||||||||
| $ | 88,431,316 | $ | 347,482 | |||||||||||||||||||||||
| Sale Contracts Settlement Date* | Counterparty | Amount | Amount | Fair Value | Unrealized Appreciation/ (Depreciation) | |||||||||||||||||||||
| United States Dollar/Australian Dollar | ||||||||||||||||||||||||||
07/21/2015 | Westpac Banking Corp. | USD | 18,885,686 | AUD | 24,405,471 | $ | 19,230,983 | $ | (345,297 | ) | ||||||||||||||||
| United States Dollar/Brazilian Real | ||||||||||||||||||||||||||
07/23/2015 | Credit Suisse International | USD | 20,633,928 | BRL | 65,203,211 | 21,070,882 | (436,954 | ) | ||||||||||||||||||
07/23/2015 | JPMorgan Chase Bank N.A. | USD | 3,356,675 | BRL | 10,601,390 | 3,425,914 | (69,239 | ) | ||||||||||||||||||
| United States Dollar/British Pound | ||||||||||||||||||||||||||
05/29/2015 | Deutsche Bank AG | USD | 1,228,343 | GBP | 800,000 | 1,227,786 | 557 | |||||||||||||||||||
| United States Dollar/Canadian Dollar | ||||||||||||||||||||||||||
06/18/2015 | Royal Bank of Canada | USD | 7,286,469 | CAD | 9,314,768 | 7,715,437 | (428,968 | ) | ||||||||||||||||||
| United States Dollar/Euro | ||||||||||||||||||||||||||
05/19/2015 | Deutsche Bank AG | USD | 21,922,125 | EUR | 19,325,232 | 21,703,240 | 218,885 | |||||||||||||||||||
05/19/2015 | JPMorgan Chase Bank N.A. | USD | 26,626,833 | EUR | 23,781,158 | 26,707,476 | (80,643 | ) | ||||||||||||||||||
05/19/2015 | Royal Bank of Canada | USD | 15,280,060 | EUR | 14,155,387 | 15,897,234 | (617,174 | ) | ||||||||||||||||||
| United States Dollar/Japanese Yen | ||||||||||||||||||||||||||
05/07/2015 | Citibank N.A. | USD | 14,704,991 | JPY | 1,725,921,894 | 14,454,957 | 250,034 | |||||||||||||||||||
05/07/2015 | Westpac Banking Corp. | USD | 22,172,083 | JPY | 2,623,720,377 | 21,974,207 | 197,876 | |||||||||||||||||||
See accompanying Notes to Financial Statements.
Semi-Annual Report 2015
26
Statement of Investments (concluded)
April 30, 2015 (Unaudited)
Aberdeen Total Return Bond Fund
| Sale Contracts Settlement Date* | Counterparty | Amount | Amount | Fair Value | Unrealized Appreciation/ (Depreciation) | |||||||||||||||||||||
| United States Dollar/Mexican Peso | ||||||||||||||||||||||||||
05/18/2015 | Citibank N.A. | USD | 38,909,074 | MXN | 587,250,660 | $ | 38,241,708 | $ | 667,366 | |||||||||||||||||
05/18/2015 | Deutsche Bank AG | USD | 12,343,986 | MXN | 185,739,963 | 12,095,369 | 248,617 | |||||||||||||||||||
| United States Dollar/New Zealand Dollar | ||||||||||||||||||||||||||
05/04/2015 | Deutsche Bank AG | USD | 8,910,779 | NZD | 12,405,131 | 9,468,214 | (557,435 | ) | ||||||||||||||||||
05/04/2015 | Westpac Banking Corp. | USD | 23,808,782 | NZD | 33,012,598 | 25,196,860 | (1,388,078 | ) | ||||||||||||||||||
08/04/2015 | Deutsche Bank AG | USD | 9,356,756 | NZD | 12,405,131 | 9,385,100 | (28,344 | ) | ||||||||||||||||||
| 08/04/2015 | Westpac Banking Corp. | USD | 7,744,015 | NZD | 10,245,031 | 7,750,877 | (6,862 | ) | ||||||||||||||||||
| $ | 255,546,244 | $ | (2,375,659 | ) | ||||||||||||||||||||||
| * | Certain contracts with different trade dates and like characteristics have been shown net. |
See accompanying Notes to Financial Statements.
2015 Semi-Annual Report
27
Aberdeen Global High Income Fund (Unaudited)
The Aberdeen Global High Income Fund (Class A shares at net asset value net of fees) returned -0.06% for the six-month period ended April 30, 2015, versus the 1.99% return of its benchmark, the Bank of America Merrill Lynch (BofA ML) Global High Yield Constrained Index (hedged to U.S. dollars), during the same period. For broader comparison, the average return of the Fund’s Lipper peer category of High Yield Funds (consisting of 212 funds) was 1.00% for the period.
The global high yield markets experienced several bouts of volatility during the six-month period ended April 30, 2015, but finished with modest gains. The BofA ML Global High Yield Constrained Index (hedged to U.S. dollars) recorded a total return of 1.99%, outperforming global investment-grade bonds, as represented by the Barclays Global Aggregate Bond Index, and the U.S. high yield market, as measured by the BofA ML U.S. High Yield Master II Index, which returned -1.92% and 1.51, respectively, for the same period. However, the global high yield sector lagged both the 4.40% advance of the broader U.S. equity market benchmark, the S&P 500 Index, and the 5.38% return of the global equity market, as measured by the MSCI World Index, for the reporting period. Developed-market high yield sectors outside the U.S., such as those in Europe/UK and Canada, saw mixed performance over the reporting period. The Europe/UK high yield market posted a gain of 4.03%, while the Canadian high yield sector returned -2.89% for the period. Emerging markets (EM) sovereigns and EM corporates posted corresponding returns of -1.50% and -0.52% for the six-month period.1
The global high yield markets performed relatively well amid volatility in both the U.S. and European Treasury markets over the period. The market reacted to every wrinkle in the Federal Reserve’s (Fed) thinking around the ultimate timing of interest rate increases. Yields on the three-, five- and ten-year notes decreased by corresponding margins of 4, 19 and 30 bps, ending the period at 0.91%, 1.43% and 2.05%, respectively. Nonetheless, the option-adjusted spread (OAS)2 on the benchmark BofA ML Global High Yield Constrained Index rose by a relatively modest margin of 17 bps, ending the reporting period at 479 bps over comparable-duration3 U.S. Treasuries.
The underperformance of the U.S. high yield market versus its global peers during the reporting period was attributable in part to the relatively heavier weighting of energy in the BofA ML U.S High Yield Master II Index. U.S. energy bonds have grown to become the largest component of the U.S. high yield universe, representing nearly 14% of the index. In contrast, energy represents roughly 6% and 27% of the European and EM indices, respectively. Many U.S. issuers have been smaller exploration and production companies concentrating on
domestic fields and using fracking technology. Among these issuers the high cost producers in the sector suffered disproportionately with
the precipitous decline in oil prices in November through January. With a stabilization of oil prices towards the end of the reporting period, energy credits recovered from their low levels reached in December 2014. We increasingly see a tiering of credits in this realm that may potentially become sharper as more data are available.
Default activity in the global high yield market over the reporting period remained relatively benign until January 2015, when U.S. resort and casino operator Caesars Entertainment (which the Fund does not hold) missed a coupon payment in December 2014, leading to a temporary spike in the U.S. high yield default rate. However, the par-weighted default rate4 decreased sharply in April 2015, as the effect of the March 2014 TXU Energy default rolled off. At the end of the reporting period, the par-weighted default rate stood at 1.86%, down 59 bps from its level six months earlier. The issuer-weighted default rate5 was 1.52%, rising 11 bps over the period.6
The Fund’s underperformance versus the benchmark BofA ML Global High Yield Constrained Index for the reporting period was attributable mainly to the underperformance of two holdings in the coal industry. By geographic region, we maintain an underweight relative to the benchmark in Europe, which benefited during the period from both rumors of and actual quantitative easing. We view this outperformance as being driven in large part by accommodative policy from the European Central Bank. Our strategic focus on bottom-up credit selection and relative value led us away from the European market during the reporting period, causing us to miss what was, in hindsight, a stimulus-fueled rally. We continue to monitor the European market for what we view as attractive relative value opportunities and are selectively investing as we identify them. Overall security selection in Europe contributed to Fund performance over the period, and we are seeking to maintain this positive impact going forward.
Amid the ongoing weakness in energy and commodity prices, the most notable issue-specific detractors from performance among individual holdings for the period included securities of Arch Coal and Alpha Natural Resources. We owned the securities of these coal companies primarily on our belief that metallurgical coal prices (as opposed to thermal coal prices) will eventually recover and that these companies have sufficiently strong financial positions to survive. We still believe in this thesis, but we also recognize that the cycle may be longer than we first anticipated and longer than these issuers may be able to hold their financial breath. Therefore, we moved most of the Fund’s positioning in these companies to more senior, first lien loans and to bonds which have covenants7 that we believe may force the issuers to offer some type of exchange that could be positive for holders at current market prices.
| 1 | European/UK high yield is represented by the BofA ML Global High Yield European Issuers Constrained Index; Canadian high yield is represented by the BofA ML Canada High Yield Index; emerging markets sovereigns are represented by the BofA ML Global High Yield & Emerging Markets Sovereign Index; and emerging markets high yield corporates are represented by the BofA ML High Yield U.S. Emerging Markets Liquid Corporate Plus Index. |
| 2 | The option-adjusted spread (OAS) is a calculation of the relative value of a fixed-income security containing an embedded option, such as a borrower’s option to prepay a loan. The spread is measured relative to comparable-duration Treasury securities. A larger OAS implies a greater return for greater risks. |
| 3 | Duration is an estimate of bond price sensitivity to changes in interest rates. The higher the duration, the greater the change (i.e., high risk) in relation to interest-rate movements. |
| 4 | The par-weighted default rate is calculated by dividing the dollar value of high yield issues in default by the total dollar value of the overall market. |
| 5 | The issuer-weighted default rate is expressed as a percentage of high yield debt issuers defaulting relative to the total number of issuers in the market. |
| 6 | Source: JPMorgan Default Monitor, May 2015. |
| 7 | A bond covenant is a legally binding term of an agreement between a bond issuer and a bond holder. Bond covenants are designed to protect the interests of both parties. |
Semi-Annual Report 2015
28
Aberdeen Global High Income Fund (Unaudited) (concluded)
Fund performance was bolstered primarily by an underweight versus the benchmark to BB rated credits and an overweight to single Bs with an overweight to higher-beta8 credits, which underperformed the overall asset class during the quarter. The Fund’s overweight in single-B issues had a more significant impact in Europe, where the differentiation by quality was more pronounced, than in the U.S., where the differences were relatively minor.
Regarding the use of derivatives during the reporting period, we employed credit default swaps9 to hedge certain positions, as well as to gain long credit exposure. We believe that in certain situations credit default swaps provide a more efficient hedge relative to cash bonds. Additionally, we used currency forwards to hedge some of the Fund’s foreign exchange holdings. Overall, the use of derivatives contributed approximately 1.6% to Fund performance for the six-month period ended April 30, 2015.
We initiated several holdings during the reporting period, including Continental Resources, a BBB rated U.S. energy company; Crown Castle, a BB rated U.S. cell phone tower company that we believe may be upgraded relatively soon; and Valaent Pharmaceuticals, an acquisitive pharmaceutical company that we believe has built itself a strong position within the industry. We also established a new position in long-dated issues of packaged foods maker H.J. Heinz as we believe that the credit rating of the company’s debt may be upgraded. We offset these additions with reductions or outright sales of a number of positions. Among the issues we sold were Garda, a Canadian securities company; River Cree, a Canadian gaming company; and Banco Credito, a Peruvian bank. These sales were based on our analysis of relative valuations.
At the end of the reporting period, the Fund’s largest sector overweights included basic industry, transportation and sovereign credits (each at 5% above the benchmark’s allocation). The main underweights were energy and banking (each at -5%). Regarding credit quality positioning, the Fund was underweight BBs (-36%) and maintained overweights to CCCs (+13%) and single Bs (+13%), and BBBs (+5%).
Among the largest sector positions, 16% of the Fund’s assets were invested in bank loans. The EM exposure stood at 14% – comprising mostly hard currency corporate bonds. At the end of the period, the Fund had a modified duration of 4.14 years and 30-day SEC yields of 6.12% and 6.11% (Institutional shares, subsidized and unsubsidized, respectively).10
Credit fundamentals, as reflected in fourth-quarter 2014 earnings released during the first quarter of 2015, generally remained positive, but contained a few instances that we think may be described as “robust” and some that could be characterized as “worrisome.” There
were pockets of strength in business services, U.S. building materials, and airlines. Most of the worrisome earnings releases were issued by commodity producers and retailers.
Portfolio Management:
Aberdeen North American Fixed Income Team
PAST PERFORMANCE DOES NOT GUARANTEE FUTURE RESULTS.
The performance quoted represents past performance, which does not guarantee future results. Class A shares have up to a 0.25% 12b-1 fee. The investment return and principal value of an investment will fluctuate so that an investor’s shares, when redeemed, may be worth more or less than their original cost. Current performance of the Fund may be lower or higher than the performance quoted. Performance data current to the most recent month-end may be obtained by calling 866-667-9231 or visiting www.aberdeen-asset.us.
Investing in mutual funds involves risk, including the possible loss of principal. There is no assurance that the investment objective of any fund will be achieved. Indexes are unmanaged and have been provided for comparison purposes only. No fees or expenses are reflected. You cannot invest directly in an index.
Lipper is a leading global provider of mutual fund information and analysis to fund companies, financial intermediaries and media organizations.
Risk Considerations
Fixed income securities are subject to certain risks including, but not limited to: interest rate (changes in interest rates may cause a decline in the market value of an investment), credit (changes in the financial condition of the issuer, borrower, counterparty, or underlying collateral), prepayment (debt issuers may repay or refinance their loans or obligations earlier than anticipated), and extension (principal repayments may not occur as quickly as anticipated, causing the expected maturity of a security to increase).
The Fund’s investments in high-yield bonds (commonly referred to as “junk bonds”) and other lower-rated securities will subject the Fund to substantial risk of loss. Investments in high-yield bonds are speculative and issuers of these securities are generally considered to be less financially secure and less able to repay interest and principal than issuers of investment-grade securities. Prices of high-yield bonds tend to be very volatile. These securities are less liquid than investment-grade debt securities and may be difficult to price or sell, particularly in times of negative sentiment toward high-yield securities.
Derivatives are speculative and may hurt the Fund’s performance. They present the risk of disproportionately increased losses and/or reduced gains when the financial asset or measure to which the derivative is linked changes in unexpected ways.
Foreign securities are more volatile, harder to price and less liquid than U.S. securities; and are subject to different accounting and regulatory standards, and political and economic risks. These risks are enhanced in emerging markets countries.
Please read the prospectus for more detailed information regarding these and other risks.
| 8 | Beta is a measure of the volatility, or systematic risk, of a security or a portfolio in comparison to the market as a whole. |
| 9 | A credit default swap is a type of contract that offers a guarantee against the non-payment of a loan. |
| 10 | The SEC yield is an annualized yield based on the most recent 30-day period. The subsidized 30-day SEC yield generally includes the impact of contractual advisory fee waivers for the Fund while the unsubsidized 30-day SEC yield excludes the benefit of these waivers. The subsidized and unsubsidized 30-day SEC yields will equal each other if the contractual advisory fee waivers have not been triggered during the most recent 30-day period. |
2015 Semi-Annual Report
29
Aberdeen Global High Income Fund (Unaudited)
Average Annual Total Return (For periods ended April 30, 2015) | Six Month† | 1 Yr. | 5 Yr. | 10 Yr. | ||||||||||
Class A | (0.06%) | (0.53% | ) | 6.41% | 7.75% | |||||||||
Institutional Class1 | (0.02%) | (0.28% | ) | 6.67% | 8.02% | |||||||||
| † | Not Annualized |
| 1 | Formerly Class I |
Semi-Annual Report 2015
30
Aberdeen Global High Income Fund (Unaudited)
Performance of a $10,000 Investment (as of April 30, 2015)

Comparative performance of $10,000 invested in Class A shares of the Aberdeen Global High Income Fund, BofA ML Global High Yield Constrained Index (hedged to the U.S. Dollar) and the Consumer Price Index (CPI) over a 10-year period ended April 30, 2015. Unlike the Fund’s returns, the returns for these unmanaged indexes do not reflect any fees or expenses. Investors cannot invest directly in market indexes.
The BofA ML Global High Yield Constrained Index (hedged to the U.S. Dollar) tracks the performance of USD, CAD, GBP and EUR denominated below investment grade corporate debt publicly issued in the major domestic or eurobond markets but caps issuer exposure at 2%.
The CPI is a measure of the average change over time in the prices paid by urban consumers for a market basket of consumer goods and services.
Investment return and principal value will fluctuate, and when redeemed, shares may be worth more or less than original cost. Past performance is no guarantee of future results. The Average Annual Total Return table and performance graph do not reflect the deduction of taxes that a shareholder would pay on Fund distributions or the redemption of Fund shares. Investing in mutual funds involves market risk, including loss of principal. Performance returns assume the reinvestment of all distributions. Performance returns reflect fee waivers and reimbursements in effect without which returns would have been lower.
Portfolio Summary (as a percentage of net assets)
April 30, 2015 (Unaudited)
| Asset Allocation | ||||
Corporate Bonds | 74.3% | |||
Bank Loans | 15.5% | |||
Government Bonds | 4.1% | |||
Repurchase Agreement | 3.1% | |||
Common Stocks | 1.6% | |||
Government Agencies | 0.8% | |||
Preferred Stocks | 0.6% | |||
Other assets in excess of liabilities | —% | |||
| 100.0% | ||||
| Amounts listed as “-” are 0% or round to 0% |
The following chart summarizes the composition of the Fund’s portfolio, expressed as a percentage of net assets. The industries listed below may include more than one industry group. As of April 30, 2015, the Fund did not have more than 25% of its assets invested in any industry group.
| Top Industries | ||||
Diversified Telecommunication Services | 8.2% | |||
Oil, Gas & Consumable Fuels | 6.0% | |||
Commercial Banks | 5.5% | |||
Diversified Financial Services | 4.1% | |||
Media | 3.4% | |||
Metals & Mining | 2.9% | |||
Chemicals | 2.9% | |||
Commercial Services & Supplies | 2.8% | |||
Real Estate | 2.5% | |||
Transportation | 2.1% | |||
Other | 59.6% | |||
| 100.0% | ||||
| Top Holdings* | ||||
Unique Pub Finance Co. PLC, Series M 03/28/2024 | 1.5% | |||
Asurion LLC 03/03/2021 | 1.4% | |||
Deep Ocean | 1.3% | |||
Mexico Fixed Rate Bonds, Series M10 12/17/2015 | 1.3% | |||
Avanti Communications Group PLC 10/01/2019 | 1.3% | |||
Cengage Learning, Inc. 03/31/2020 | 1.3% | |||
Kinder Morgan, Inc. 08/01/2031 | 1.2% | |||
Annington Finance No 5 PLC, PIK 01/15/2023 | 1.2% | |||
Isola USA Corp. 11/29/2018 | 1.2% | |||
Palace Entertainment Holdings LLC/Palace Entertainment Holdings Corp. 04/15/2017 | 1.1% | |||
Other | 87.2% | |||
| 100.0% | ||||
| Top Countries | ||||
United States | 57.3% | |||
United Kingdom | 7.0% | |||
Canada | 5.2% | |||
Indonesia | 3.4% | |||
Mexico | 3.3% | |||
Luxembourg | 3.2% | |||
Brazil | 1.9% | |||
France | 1.8% | |||
Italy | 1.7% | |||
Sweden | 1.5% | |||
Other | 13.7% | |||
| 100.0% | ||||
| * | For the purpose of listing top holdings, repurchase agreements are included as part of Other. |
2015 Semi-Annual Report
31
Statement of Investments
April 30, 2015 (Unaudited)
Aberdeen Global High Income Fund
| Shares or Principal Amount | Value (US$) | |||||||
CORPORATE BONDS (74.3%) | ||||||||
AUSTRALIA (0.3%) | ||||||||
QBE Insurance Group Ltd. (USD), 6.75%, 12/02/2044 (a)(b) | $ | 5,281,000 | $ | 5,729,885 | ||||
BRAZIL (1.1%) | ||||||||
Banco do Brasil SA (USD), 9.00%, 06/18/2024 (a)(b)(c) | 7,210,000 | 6,705,300 | ||||||
Petrobras Global Finance BV (USD), 6.25%, 03/17/2024 | 9,180,000 | 9,144,198 | ||||||
Petrobras International Finance Co. SA (USD), 7.88%, 03/15/2019 | 2,416,000 | 2,634,672 | ||||||
Tonon Bioenergia SA (USD), 9.25%, 01/24/2020 (a)(d) | 9,920,000 | 2,033,600 | ||||||
| 20,517,770 | ||||||||
CANADA (5.2%) | ||||||||
Air Canada | ||||||||
(USD), 8.75%, 04/01/2020 (a) | 2,080,000 | 2,319,200 | ||||||
(USD), 7.75%, 04/15/2021 (a) | 15,485,000 | 16,685,088 | ||||||
First Quantum Minerals Ltd. | ||||||||
(USD), 7.25%, 10/15/2019 (a) | 12,320,000 | 11,888,800 | ||||||
(USD), 7.25%, 05/15/2022 (a) | 5,690,000 | 5,320,150 | ||||||
Gateway Casinos & Entertainment Ltd. (CAD), 8.50%, 11/26/2020 (a) | 13,460,000 | 11,100,456 | ||||||
Kissner Milling Co. Ltd. (USD), 7.25%, 06/01/2019 (a) | 11,480,000 | 11,838,750 | ||||||
MEG Energy Corp. (USD), 6.38%, 01/30/2023 (a) | 17,610,000 | 17,257,800 | ||||||
Northgroup Preferred Capital Corp. (USD), 6.38%, 10/15/2017 (a)(b)(c) | 7,970,000 | 8,288,800 | ||||||
SCM Insurance Services, Inc. (CAD), 9.25%, 08/22/2019 (e) | 18,600,000 | 15,262,329 | ||||||
Seven Generations Energy Ltd. (USD), 6.75%, 05/01/2023 (a) | 1,145,000 | 1,169,331 | ||||||
| 101,130,704 | ||||||||
COLOMBIA (0.6%) | ||||||||
Pacific Rubiales Energy Corp. | ||||||||
(USD), 5.13%, 03/28/2023 (a) | 6,471,000 | 4,610,588 | ||||||
(USD), 5.63%, 01/19/2025 (a) | 10,227,000 | 7,184,467 | ||||||
| 11,795,055 | ||||||||
FRANCE (1.8%) | ||||||||
Credit Agricole SA (USD), 7.88%, 01/23/2024 (a)(b)(c) | 3,640,000 | 3,903,729 | ||||||
Magnolia BC SA (EUR), 9.00%, 08/01/2020 (a) | 9,405,000 | 11,352,644 | ||||||
Numericable-SFR SAS (USD), 6.00%, 05/15/2022 (a) | 9,486,000 | 9,729,079 | ||||||
Societe Generale SA (USD), 7.88%, 12/18/2023 (a)(b)(c) | 8,760,000 | 9,110,400 | ||||||
| 34,095,852 | ||||||||
GERMANY (0.7%) | ||||||||
ALBA Group PLC & Co. KG (EUR), 8.00%, 05/15/2018 (a) | 4,375,000 | 4,568,596 | ||||||
Safari Holding Verwaltungs GmbH (EUR), 8.25%, 02/15/2021 (a) | 7,435,000 | 8,829,256 | ||||||
| 13,397,852 | ||||||||
GUATEMALA (0.8%) | ||||||||
Cementos Progreso Trust (USD), 7.13%, 11/06/2023 (a) | 7,385,000 | 8,012,725 | ||||||
Comunicaciones Celulares SA (USD), 6.88%, 02/06/2024 (a) | 7,205,000 | 7,745,375 | ||||||
| 15,758,100 | ||||||||
INDONESIA (1.7%) | ||||||||
Ottawa Holdings Pte Ltd. (USD), 5.88%, 05/16/2018 (a) | 12,050,000 | 10,363,000 | ||||||
Pelabuhan Indonesia II PT (USD), 4.25%, 05/05/2025 (a) | 22,398,000 | 21,873,887 | ||||||
| 32,236,887 | ||||||||
ITALY (0.9%) | ||||||||
Wind Acquisition Finance SA (USD), 7.38%, 04/23/2021 (a) | 18,080,000 | 18,554,600 | ||||||
LUXEMBOURG (3.2%) | ||||||||
Altice SA (USD), 7.75%, 05/15/2022 (a) | 10,030,000 | 10,155,475 | ||||||
ArcelorMittal (USD), 7.75%, 10/15/2039 | 14,100,000 | 14,628,750 | ||||||
Bank of New York Mellon Luxembourg SA (The), Series PRX (EUR), 4.55%, 12/15/2050 (b) | 9,600,000 | 7,263,132 | ||||||
Coveris Holdings SA (USD), 7.88%, 11/01/2019 (a) | 1,525,000 | 1,555,500 | ||||||
Intelsat Jackson Holdings SA (USD), 6.63%, 12/15/2022 | 9,995,000 | 9,920,038 | ||||||
Intelsat Luxembourg SA (USD), 7.75%, 06/01/2021 | 11,415,000 | 10,530,337 | ||||||
Matterhorn Telecom Holding SA (EUR), 4.88%, 05/01/2023 (a) | 1,882,000 | 2,103,694 | ||||||
Matterhorn Telecom SA | ||||||||
(CHF), 3.63%, 05/01/2022 (a) | 2,034,000 | 2,167,863 | ||||||
(EUR), 3.88%, 05/01/2022 (a) | 1,820,000 | 2,015,487 | ||||||
Trinseo Materials Operating SCA / Trinseo Materials Finance, Inc. | ||||||||
(EUR), 6.38%, 05/01/2022 (a) | 745,000 | 846,980 | ||||||
(USD), 6.75%, 05/01/2022 (a) | 770,000 | 781,069 | ||||||
| 61,968,325 | ||||||||
MEXICO (2.0%) | ||||||||
Alfa SAB de CV | ||||||||
(USD), 5.25%, 03/25/2024 (a) | 2,730,000 | 2,962,050 | ||||||
(USD), 6.88%, 03/25/2044 (a) | 6,935,000 | 7,783,497 | ||||||
Axtel SAB de CV (USD), 9.00%, 01/31/2020 (a)(f) | 10,482,000 | 10,115,130 | ||||||
Cobre Del Mayo SA de CV (USD), 10.75%, 11/15/2018 (a) | 11,616,000 | 9,757,440 | ||||||
Sixsigma Networks Mexico SA de CV (USD), 8.25%, 11/07/2021 (a) | 7,810,000 | 8,259,075 | ||||||
| 38,877,192 | ||||||||
NETHERLANDS (0.9%) | ||||||||
Constellium NV | ||||||||
(EUR), 4.63%, 05/15/2021 (a) | 4,135,000 | 4,496,730 | ||||||
(USD), 8.00%, 01/15/2023 (a) | 4,980,000 | 5,397,075 | ||||||
(USD), 5.75%, 05/15/2024 (a) | 1,204,000 | 1,164,870 | ||||||
See accompanying Notes to Financial Statements.
Semi-Annual Report 2015
32
Statement of Investments (continued)
April 30, 2015 (Unaudited)
Aberdeen Global High Income Fund
| Shares or Principal Amount | Value (US$) | |||||||
ING Groep NV (USD), 6.50%, 04/16/2025 (b)(c) | $ | 6,000,000 | $ | 5,996,250 | ||||
| 17,054,925 | ||||||||
PARAGUAY (0.3%) | ||||||||
Banco Regional SAECA (USD), 8.13%, 01/24/2019 (a) | 5,755,000 | 6,215,400 | ||||||
PERU (0.5%) | ||||||||
Corp. Lindley SA (USD), 4.63%, 04/12/2023 (a) | 10,060,000 | 9,833,650 | ||||||
REPUBLIC OF IRELAND (1.2%) | ||||||||
Ardagh Packaging Finance PLC / Ardagh Holdings USA, Inc. (USD), 6.75%, 01/31/2021 (a) | 3,600,000 | 3,753,000 | ||||||
Argon Capital PLC for Royal Bank of Scotland (GBP), 2.90%, 06/30/2015 (b)(c) | 3,203,000 | 4,302,028 | ||||||
Fly Leasing Ltd. (USD), 6.38%, 10/15/2021 | 15,015,000 | 15,127,613 | ||||||
| 23,182,641 | ||||||||
RUSSIA (0.2%) | ||||||||
Lukoil International Finance BV (USD), 4.56%, 04/24/2023 (a) | 3,940,000 | 3,526,300 | ||||||
SOUTH AFRICA (1.0%) | ||||||||
Sappi Papier Holding GmbH | ||||||||
(USD), 6.63%, 04/15/2021 (a) | 700,000 | 735,000 | ||||||
(USD), 7.50%, 06/15/2032 (a) | 19,492,000 | 19,102,160 | ||||||
| 19,837,160 | ||||||||
SWEDEN (0.5%) | ||||||||
Verisure Holding AB (EUR), | 7,890,000 | 9,472,880 | ||||||
SWITZERLAND (1.1%) | ||||||||
Credit Suisse Group AG (USD), 7.50%, 12/11/2023 (a)(b)(c) | 7,335,000 | 7,866,788 | ||||||
UBS Group AG (USD), 7.00%, 02/19/2025 (a)(b)(c) | 2,410,000 | 2,520,214 | ||||||
Unilabs Subholding AB (EUR), 8.50%, 07/15/2018 (a) | 9,405,000 | 11,062,022 | ||||||
| 21,449,024 | ||||||||
UKRAINE (0.1%) | ||||||||
Mriya Agro Holding PLC (USD), 9.45%, 04/19/2018 (a)(d) | 10,755,000 | 1,344,375 | ||||||
UNITED KINGDOM (7.0%) | ||||||||
Annington Finance No 5 PLC, PIK (GBP), 13.00%, 01/15/2023 (a) | 12,184,937 | 23,566,879 | ||||||
Avanti Communications Group PLC (USD), 10.00%, 10/01/2019 (a) | 25,880,000 | 24,715,400 | ||||||
Barclays Bank PLC (GBP), | 6,586,000 | 10,688,276 | ||||||
Galaxy Bidco Ltd. | ||||||||
(GBP), 5.56%, 11/15/2019 (a)(b) | 2,025,000 | 3,116,145 | ||||||
(GBP), 6.38%, 11/15/2020 (a) | 7,950,000 | 12,393,861 | ||||||
Galaxy Finco Ltd. (GBP), 7.88%, 11/15/2021 (a) | 1,600,000 | 2,461,108 | ||||||
Hastings Insurance Group Finance PLC | ||||||||
(GBP), 6.57%, 10/21/2019 (a)(b) | 3,680,000 | 5,681,991 | ||||||
(GBP), 8.00%, 10/21/2020 (a) | 4,375,000 | 7,203,345 | ||||||
HBOS Sterling Finance Jersey LP (GBP), 7.88%, 12/09/2031 (b)(c) | 285,000 | 575,717 | ||||||
Lloyds Bank PLC (GBP), 13.00%, 01/22/2029 (b)(c) | 4,475,000 | 12,262,422 | ||||||
Unique Pub Finance Co. PLC, Series M (GBP), 7.40%, 03/28/2024 | 17,840,000 | 28,479,767 | ||||||
Virgin Media Secured Finance PLC (GBP), 5.50%, 01/15/2025 (a) | 3,440,021 | 5,436,626 | ||||||
| 136,581,537 | ||||||||
UNITED STATES (42.6%) | ||||||||
AAF Holdings LLC/AAF Finance Co., PIK (USD), 12.00%, 07/01/2019 (a)(e) | 14,115,059 | 12,985,854 | ||||||
Alcoa, Inc. (USD), 5.95%, 02/01/2037 | 11,740,000 | 12,532,450 | ||||||
Ally Financial, Inc. (USD), | 5,845,000 | 6,086,106 | ||||||
Alpha Natural Resources, Inc. | ||||||||
(USD), 3.75%, 12/15/2017 | 15,030,000 | 5,260,500 | ||||||
(USD), 6.00%, 06/01/2019 | 11,220,000 | 2,412,300 | ||||||
(USD), 6.25%, 06/01/2021 | 10,405,000 | 2,028,975 | ||||||
Arch Coal, Inc. (USD), 7.25%, 10/01/2020 | 16,310,000 | 5,749,275 | ||||||
Bank of America Corp., Series AA (USD), 6.10%, 03/17/2025 (b)(c) | 5,920,000 | 6,053,200 | ||||||
Blue Racer Midstream LLC / Blue Racer Finance Corp. (USD), 6.13%, 11/15/2022 (a) | 2,235,000 | 2,335,575 | ||||||
Building Materials Corp. of America (USD), 5.38%, 11/15/2024 (a) | 11,145,000 | 11,479,350 | ||||||
Building Materials Holding Corp. (USD), 9.00%, 09/15/2018 (a) | 9,280,000 | 10,068,800 | ||||||
California Resources Corp. | ||||||||
(USD), 5.50%, 09/15/2021 | 5,375,000 | 5,119,688 | ||||||
(USD), 6.00%, 11/15/2024 | 15,270,000 | 14,430,150 | ||||||
Calpine Corp. (USD), 5.75%, 01/15/2025 | 8,895,000 | 8,973,276 | ||||||
Carrizo Oil & Gas, Inc. | ||||||||
(USD), 7.50%, 09/15/2020 | 4,453,000 | 4,708,157 | ||||||
(USD), 6.25%, 04/15/2023 | 5,190,000 | 5,280,825 | ||||||
CCO Holdings LLC / CCO Holdings Capital Corp. (USD), 5.25%, 03/15/2021 | 9,577,000 | 9,708,684 | ||||||
CenturyLink, Inc. | ||||||||
Series W (USD), 6.75%, 12/01/2023 | 1,265,000 | 1,373,170 | ||||||
Series P (USD), 7.60%, 09/15/2039 | 10,137,000 | 10,187,685 | ||||||
Series U (USD), 7.65%, 03/15/2042 | 4,460,000 | 4,504,600 | ||||||
Cenveo Corp. (USD), 6.00%, 08/01/2019 (a) | 21,065,000 | 19,695,775 | ||||||
CHS/Community Health Systems, Inc. (USD), 6.88%, 02/01/2022 | 13,510,000 | 14,405,037 | ||||||
Continental Resources, Inc. (USD), 4.90%, 06/01/2044 | 5,930,000 | 5,542,012 | ||||||
Crown Castle International Corp. | ||||||||
(USD), 4.88%, 04/15/2022 | 3,845,000 | 4,018,025 | ||||||
(USD), 5.25%, 01/15/2023 | 13,971,000 | 14,817,643 | ||||||
CrownRock LP / CrownRock Finance, Inc. | ||||||||
(USD), 7.13%, 04/15/2021 (a) | 4,250,000 | 4,420,000 | ||||||
(USD), 7.75%, 02/15/2023 (a) | 3,370,000 | 3,589,050 | ||||||
DPH Holdings Corp. (USD), | 1,500,000 | 63,375 | ||||||
See accompanying Notes to Financial Statements.
2015 Semi-Annual Report
33
Statement of Investments (continued)
April 30, 2015 (Unaudited)
Aberdeen Global High Income Fund
| Shares or Principal Amount | Value (US$) | |||||||
DR Horton, Inc. | ||||||||
(USD), 4.75%, 02/15/2023 | $ | 2,070,000 | $ | 2,132,100 | ||||
(USD), 5.75%, 08/15/2023 | 9,880,000 | 10,769,200 | ||||||
Dynegy, Inc. (USD), 7.63%, 11/01/2024 (a) | 18,525,000 | 20,007,000 | ||||||
Energy Future Intermediate Holding Co. LLC / EFIH Finance, Inc. (USD), 11.75%, 03/01/2022 (a)(d) | 7,204,310 | 8,140,870 | ||||||
Evolution Escrow Issuer LLC (USD), 7.50%, 03/15/2022 (a) | 13,945,000 | 14,154,175 | ||||||
First Data Corp. | ||||||||
(USD), 12.63%, 01/15/2021 | 2,885,000 | 3,412,955 | ||||||
(USD), 10.63%, 06/15/2021 | 7,000,000 | 7,977,830 | ||||||
(USD), 11.75%, 08/15/2021 | 7,822,000 | 9,014,855 | ||||||
First Maryland Capital I (USD), 1.28%, 01/15/2027 (b) | 8,420,000 | 7,493,800 | ||||||
Florida East Coast Holdings Corp. | ||||||||
(USD), 6.75%, 05/01/2019 (a) | 8,085,000 | 8,064,787 | ||||||
(USD), 9.75%, 05/01/2020 (a) | 12,485,000 | 12,079,237 | ||||||
Freeport-McMoRan, Inc. (USD), 5.45%, 03/15/2043 | 6,770,000 | 5,941,636 | ||||||
Frontier Communications Corp. | ||||||||
(USD), 6.88%, 01/15/2025 | 5,080,000 | 4,932,629 | ||||||
(USD), 9.00%, 08/15/2031 | 14,340,000 | 15,164,550 | ||||||
General Motors (Escrow Shares) | ||||||||
(USD), 7.13%, 07/15/2013 (e)(g) | 2,240,000 | – | ||||||
(USD), 8.25%, 07/15/2023 (e)(g) | 35,495,000 | – | ||||||
(USD), 8.10%, 06/15/2024 (e)(g) | 2,485,000 | – | ||||||
(USD), 7.38%, 05/23/2048 (e)(g) | 3,460,000 | – | ||||||
(USD), 8.80%, 03/01/2049 (e)(g) | 7,200,000 | – | ||||||
(USD), 8.38%, 07/15/2049 (e)(g) | 3,550,000 | – | ||||||
GenOn Americas Generation LLC (USD), 8.50%, 10/01/2021 | 3,961,000 | 3,881,780 | ||||||
Hardwoods Acquisition, Inc. (USD), 7.50%, 08/01/2021 (a) | 11,011,000 | 10,598,087 | ||||||
HCA, Inc. | ||||||||
(USD), 5.38%, 02/01/2025 | 1,675,000 | 1,767,125 | ||||||
(USD), 5.25%, 04/15/2025 | 8,605,000 | 9,336,425 | ||||||
HJ Heinz Finance Co. (USD), 7.13%, 08/01/2039 (a) | 7,266,000 | 9,781,852 | ||||||
Horizon Pharma Financing, Inc. (USD), 6.63%, 05/01/2023 (a) | 5,629,000 | 5,734,544 | ||||||
iHeartCommunications, Inc. (USD), 9.00%, 09/15/2022 | 8,510,000 | 8,169,600 | ||||||
Immucor, Inc. (USD), 11.13%, 08/15/2019 | 9,385,000 | 10,135,800 | ||||||
Jefferies Finance LLC / JFIN Co-Issuer Corp. | ||||||||
(USD), 7.38%, 04/01/2020 (a) | 1,010,000 | 1,002,425 | ||||||
(USD), 6.88%, 04/15/2022 (a) | 5,195,000 | 4,987,200 | ||||||
Kinder Morgan, Inc. (USD), 7.80%, 08/01/2031 | 19,834,000 | 23,848,897 | ||||||
Kratos Defense & Security Solutions, Inc. (USD), 7.00%, 05/15/2019 | 7,679,000 | 6,872,705 | ||||||
Landry’s Holdings II, Inc. (USD), 10.25%, 01/01/2018 (a) | 10,515,000 | 10,988,175 | ||||||
Landry’s, Inc. (USD), | 11,840,000 | 12,728,000 | ||||||
MHGE Parent LLC / MHGE Parent Finance, Inc. (USD), 8.50%, 08/01/2019 (a) | 18,495,000 | 19,026,731 | ||||||
Micron Technology, Inc. (USD), 5.63%, 01/15/2026 (a) | 9,673,000 | 9,576,270 | ||||||
Momentive Performance Materials, Inc. | ||||||||
(USD), 8.88%, 10/15/2020 (g) | 18,590,000 | – | ||||||
(USD), 3.88%, 10/24/2021 | 18,590,000 | 16,731,000 | ||||||
Mythen Re Ltd., Series 2012-2, Class A (USD), 8.56%, 01/05/2017 (a)(b)(e) | 6,030,000 | 6,313,109 | ||||||
New Enterprise Stone & Lime Co Inc., PIK (USD), 13.00%, 03/15/2018 | 16,942,036 | 18,233,866 | ||||||
NewStar Financial, Inc. (USD), 7.25%, 05/01/2020 (a) | 6,810,000 | 6,912,150 | ||||||
NWH Escrow Corp. (USD), | 7,710,000 | 7,305,225 | ||||||
Oasis Petroleum, Inc. (USD), 6.88%, 01/15/2023 | 10,000,000 | 10,200,000 | ||||||
OneMain Financial Holdings, Inc. (USD), 7.25%, 12/15/2021 (a) | 4,925,000 | 5,226,410 | ||||||
Palace Entertainment Holdings LLC / Palace Entertainment Holdings Corp. (USD), 8.88%, 04/15/2017 (a) | 21,975,000 | 22,235,953 | ||||||
PNC Preferred Funding Trust I (USD), 1.92%, 03/15/2017 (a)(b)(c) | 7,510,000 | 6,946,750 | ||||||
Residential Reinsurance 2013 Ltd. (USD), 8.00%, 06/06/2019 (a)(b)(e) | 5,380,000 | 5,668,099 | ||||||
Rosetta Resources, Inc. | ||||||||
(USD), 5.63%, 05/01/2021 | 2,765,000 | 2,782,281 | ||||||
(USD), 5.88%, 06/01/2022 | 3,920,000 | 3,929,800 | ||||||
(USD), 5.88%, 06/01/2024 | 4,545,000 | 4,533,638 | ||||||
Sabine Pass Liquefaction LLC | ||||||||
(USD), 5.75%, 05/15/2024 | 8,105,000 | 8,226,575 | ||||||
(USD), 5.63%, 03/01/2025 (a) | 3,125,000 | 3,154,063 | ||||||
Sanchez Energy Corp. (USD), 6.13%, 01/15/2023 | 19,645,000 | 19,350,325 | ||||||
SandRidge Energy, Inc. (USD), 7.50%, 03/15/2021 (a) | 250 | 173 | ||||||
Service Corp. International (USD), 5.38%, 05/15/2024 | 11,420,000 | 12,190,850 | ||||||
Sinclair Television Group, Inc. | ||||||||
(USD), 6.13%, 10/01/2022 | 2,510,000 | 2,660,600 | ||||||
(USD), 5.63%, 08/01/2024 (a) | 17,175,000 | 17,561,437 | ||||||
Sprint Corp. (USD), 7.88%, 09/15/2023 | 20,315,000 | 20,441,969 | ||||||
Standard Pacific Corp. | ||||||||
(USD), 8.38%, 01/15/2021 | 9,786,000 | 11,498,550 | ||||||
(USD), 5.88%, 11/15/2024 | 5,710,000 | 5,952,675 | ||||||
State Street Capital Trust IV (USD), 1.27%, 06/01/2077 (b) | 5,740,000 | 4,965,100 | ||||||
Successor X Ltd. (USD), 11.25%, 11/10/2015 (a)(b)(e) | 6,095,000 | 6,237,014 | ||||||
Sun Products Corp. (USD), 7.75%, 03/15/2021 (a) | 11,595,000 | 10,276,069 | ||||||
TransDigm, Inc. | ||||||||
(USD), 6.00%, 07/15/2022 | 2,770,000 | 2,801,163 | ||||||
(USD), 6.50%, 07/15/2024 | 9,795,000 | 9,989,431 | ||||||
United Continental Holdings, Inc., Series B (USD), 6.00%, 07/15/2028 | 10,890,000 | 10,890,000 | ||||||
United Rentals North America, Inc. | ||||||||
(USD), 6.13%, 06/15/2023 | 2,190,000 | 2,306,618 | ||||||
(USD), 5.75%, 11/15/2024 | 5,470,000 | 5,647,775 | ||||||
(USD), 5.50%, 07/15/2025 | 4,725,000 | 4,804,380 | ||||||
See accompanying Notes to Financial Statements.
Semi-Annual Report 2015
34
Statement of Investments (continued)
April 30, 2015 (Unaudited)
Aberdeen Global High Income Fund
| Shares or Principal Amount | Value (US$) | |||||||
Valeant Pharmaceuticals International, Inc. | ||||||||
(EUR), 4.50%, 05/15/2023 (a) | $ | 7,105,000 | $ | 8,049,649 | ||||
(USD), 6.13%, 04/15/2025 (a) | 7,085,000 | 7,328,547 | ||||||
Verso Paper Holdings LLC / Verso Paper, Inc. (USD), 11.75%, 01/15/2019 | 23,527,000 | 20,716,105 | ||||||
Wise Metals Group LLC / Wise Alloys Finance Corp. (USD), 8.75%, 12/15/2018 (a) | 5,680,000 | 6,177,000 | ||||||
WR Grace & Co-Conn | ||||||||
(USD), 5.13%, 10/01/2021 (a) | 6,330,000 | 6,614,850 | ||||||
(USD), 5.63%, 10/01/2024 (a) | 6,330,000 | 6,828,488 | ||||||
Zayo Group LLC / Zayo Capital, Inc. (USD), 6.00%, 04/01/2023 (a) | 9,485,000 | 9,579,850 | ||||||
| 826,818,314 | ||||||||
VIETNAM (0.6%) | ||||||||
Vingroup JSC (USD), 11.63%, 05/07/2018 (a) | 10,730,000 | 11,709,273 | ||||||
Total Corporate Bonds | 1,441,087,701 | |||||||
GOVERNMENT BONDS (4.1%) | ||||||||
ARGENTINA (0.6%) | ||||||||
Argentina Bonar Bonds (USD), 8.75%, 05/07/2024 (e) | 11,325,000 | 11,251,309 | ||||||
BRAZIL (0.8%) | ||||||||
Brazil Notas do Tesouro Nacional, Series F (BRL), 10.00%, 01/01/2023 | 56,735,000 | 16,391,737 | ||||||
INDONESIA (0.9%) | ||||||||
Indonesia Government International Bond | ||||||||
(USD), 5.88%, 01/15/2024 (a) | 6,910,000 | 7,955,138 | ||||||
(USD), 6.75%, 01/15/2044 (a) | 7,100,000 | 8,999,250 | ||||||
| 16,954,388 | ||||||||
MEXICO (1.3%) | ||||||||
Mexico Fixed Rate Bonds, Series M10 (MXN), 8.00%, 12/17/2015 | 368,500,000 | 24,755,360 | ||||||
MOZAMBIQUE (0.5%) | ||||||||
Mozambique EMATUM Finance 2020 BV (USD), 6.31%, 09/11/2020 (a) | 10,560,000 | 10,343,520 | ||||||
Total Government Bonds | 79,696,314 | |||||||
GOVERNMENT AGENCIES (0.8%) | ||||||||
INDONESIA (0.8%) | ||||||||
Pertamina Persero PT | ||||||||
(USD), 4.30%, 05/20/2023 (a) | 10,705,000 | 10,678,237 | ||||||
(USD), 6.00%, 05/03/2042 (a) | 4,450,000 | 4,477,813 | ||||||
| 15,156,050 | ||||||||
Total Government Agencies | 15,156,050 | |||||||
BANK LOANS (15.5%) | ||||||||
ETHIOPIA (0.4%) | ||||||||
Ethiopian Railways (USD), 3.38%, 08/02/2021 (b)(e) | 8,991,474 | 8,407,028 | ||||||
GERMANY (0.5%) | ||||||||
Colouroz Investment (Flint) (USD), 8.25%, 09/06/2022 | 7,095,000 | 6,979,706 | ||||||
Klockner-Pentaplast of America, Inc. (USD), 5.00%, 04/10/2020 | 2,358,916 | 2,376,240 | ||||||
KP Germany Erste GmbH (USD), 5.00%, 04/22/2020 | 1,008,084 | 1,015,487 | ||||||
| 10,371,433 | ||||||||
ITALY (0.8%) | ||||||||
Inter Media Communication (FCE) (EUR), 5.56%, 06/05/2019 | 14,070,000 | 14,890,084 | ||||||
NETHERLANDS (0.6%) | ||||||||
Intertrust Group Holding (USD), 8.00%, 04/16/2022 | 10,950,000 | 10,985,927 | ||||||
SPAIN (1.5%) | ||||||||
IDCSalud Holding S.L.U. (EUR), 8.25%, 11/28/2022 | 16,100,000 | 18,142,439 | ||||||
Telepizza SA (TPZM) (EUR), 7.00%, 10/20/2020 | 9,320,000 | 10,483,767 | ||||||
| 28,626,206 | ||||||||
SWEDEN (1.0%) | ||||||||
Dream Secured BondCo AB (Verisure) (EUR), 10.48%, 08/15/2019 | 17,096,846 | 20,229,041 | ||||||
UNITED STATES (10.7%) | ||||||||
Arch Coal, Inc. (USD), 6.25%, 05/16/2018 (b) | 16,490,412 | 12,354,072 | ||||||
Asurion LLC (USD), 8.50%, 03/03/2021 (b) | 26,625,000 | 27,024,375 | ||||||
Birch Communications, Inc. (USD), 7.75%, 07/17/2020 (b) | 14,378,611 | 14,342,665 | ||||||
Cengage Learning, Inc. (USD), 7.00%, 03/31/2020 (b) | 24,396,106 | 24,591,787 | ||||||
Commercial Barge Line Co. (USD), 7.50%, 09/23/2019 (b) | 17,613,330 | 17,668,372 | ||||||
Del Monte Foods, Inc. (USD), 8.25%, 08/18/2021 (b) | 12,970,000 | 11,770,275 | ||||||
Isola USA Corp. (USD), 9.25%, 11/29/2018 (e) | 23,467,898 | 23,057,210 | ||||||
Newpage Corp. (USD), 9.50%, 02/11/2021 (b) | 20,286,028 | 18,574,404 | ||||||
SkillSoft Corp. (USD), 9.25%, 04/28/2022 (b) | 12,360,000 | 11,973,758 | ||||||
Sun Products Corp. (USD), | 10,769,492 | 10,406,022 | ||||||
Texas Competitive Electric Co. (USD), 4.67%, 10/10/2015 | 12,583,011 | 7,687,439 | ||||||
Visant Corp. (USD), 7.00%, 09/23/2021 (b) | 9,203,750 | 9,269,327 | ||||||
YRC Worldwide, Inc. (USD), 8.25%, 02/13/2019 (b) | 19,825,532 | 19,714,013 | ||||||
| 208,433,719 | ||||||||
Total Bank Loans | 301,943,438 | |||||||
COMMON STOCKS (1.6%) | ||||||||
NORWAY (1.3%) | ||||||||
Deep Ocean (e)(g)(h) | 1,427,968 | 25,062,519 | ||||||
See accompanying Notes to Financial Statements.
2015 Semi-Annual Report
35
Statement of Investments (continued)
April 30, 2015 (Unaudited)
Aberdeen Global High Income Fund
| Shares or Principal Amount | Value (US$) | |||||||
UNITED STATES (0.3%) | ||||||||
Cengage Learning Holdings II LP (i) | $ | 226,414 | $ | 5,773,557 | ||||
Total Common Stocks | 30,836,076 | |||||||
PREFERRED STOCKS (0.6%) | ||||||||
UNITED STATES (0.6%) | ||||||||
Ally Financial, Inc., Preferred Shares (c) | 4,451 | 4,557,268 | ||||||
GMAC Capital Trust I, Preferred Shares, Series 2 | 258,150 | 6,784,182 | ||||||
Merrill Lynch Capital Trust II, Preferred Shares | 1,600 | 40,768 | ||||||
| 11,382,218 | ||||||||
Total Preferred Stocks | 11,382,218 | |||||||
REPURCHASE AGREEMENT (3.1%) | ||||||||
UNITED STATES (3.1%) | ||||||||
Repurchase Agreement, Fixed Income Clearing Corp., 0.00%, dated 04/30/2015, due 05/01/2015, repurchase price $60,402,103 collateralized by U.S. Treasury Note, maturing 12/31/2021; total market value of $61,614,600 | 60,402,103 | 60,402,103 | ||||||
Total Repurchase Agreement | 60,402,103 | |||||||
Total Investments | 1,940,503,900 | |||||||
Other assets in excess of liabilities—0.0% | 70,454 | |||||||
Net Assets—100.0% | $ | 1,940,574,354 | ||||||
| (a) | Denotes a security issued under Regulation S or Rule 144A. |
| (b) | Variable or Floating Rate Security. Rate disclosed is as of April 30, 2015. |
| (c) | Perpetual bond. This is a bond that has no maturity date, is redeemable and pays a steady stream of interest indefinitely. |
| (d) | Security is in default. |
| (e) | The Fund’s adviser has deemed this security to be illiquid based upon procedures approved by the Board of Trustees. Illiquid securities held by the Fund represent 6.38% of net assets as of April 30, 2015. |
| (f) | Indicates a stepped coupon bond. This bond was issued with a low coupon that gradually increases over the life of the bond. |
| (g) | This security was fair valued by the Fund’s pricing committee as approved by the Fund’s Board of Trustees. See Note 1(a) of the accompanying Notes to Statements of Investments. |
| (h) | Investment in affiliate. |
| (i) | Non-income producing security. |
| (j) | See Notes to Financial Statements for tax unrealized appreciation/depreciation of securities. |
| BRL | Brazilian Real |
| CAD | Canadian Dollar |
| CHF | Swiss Franc |
| GBP | British Pound Sterling |
| MXN | Mexican Peso |
| NOK | Norwegian Krone |
| PIK | Payment In Kind |
| USD | U.S. Dollar |
See accompanying Notes to Financial Statements.
Semi-Annual Report 2015
36
Statement of Investments (continued)
April 30, 2015 (Unaudited)
Aberdeen Global High Income Fund
At April 30, 2015, the Fund’s open forward foreign currency exchange contracts were as follows:
| Purchase Contracts Settlement Date* | Counterparty | Amount Purchased | Amount Sold | Fair Value | Unrealized Appreciation | |||||||||||||||||||||||
| British Pound/United States Dollar | ||||||||||||||||||||||||||||
05/18/2015 | Westpac Banking Corp. | GBP | 5,000,000 | USD | 7,371,270 | $ | 7,674,235 | $ | 302,965 | |||||||||||||||||||
| Euro/United States Dollar | ||||||||||||||||||||||||||||
05/12/2015 | JPMorgan Chase Bank N.A. | EUR | 19,361,000 | USD | 20,960,219 | 21,741,433 | 781,214 | |||||||||||||||||||||
| Norwegian Krone/United States Dollar | ||||||||||||||||||||||||||||
| 05/13/2015 | JPMorgan Chase Bank N.A. | NOK | 68,840,500 | USD | 9,136,943 | 9,140,305 | 3,362 | |||||||||||||||||||||
| $ | 38,555,973 | $ | 1,087,541 | |||||||||||||||||||||||||
| Sale Contracts Settlement Date* | Counterparty | Amount Purchased | Amount Sold | Fair Value | Unrealized Appreciation/ (Depreciation) | |||||||||||||||||||||
| United States Dollar/Brazilian Real | ||||||||||||||||||||||||||
07/20/2015 | JPMorgan Chase Bank N.A. | USD | 15,717,612 | BRL | 49,949,000 | $ | 16,157,979 | $ | (440,367 | ) | ||||||||||||||||
| United States Dollar/British Pound | ||||||||||||||||||||||||||
05/18/2015 | Westpac Banking Corp. | USD | 125,026,500 | GBP | 81,353,500 | 124,865,177 | 161,323 | |||||||||||||||||||
| United States Dollar/Canadian Dollar | ||||||||||||||||||||||||||
06/05/2015 | JPMorgan Chase Bank N.A. | USD | 28,350,059 | CAD | 35,344,500 | 29,281,094 | (931,035 | ) | ||||||||||||||||||
| United States Dollar/Euro | ||||||||||||||||||||||||||
05/12/2015 | JPMorgan Chase Bank N.A. | USD | 21,920,834 | EUR | 19,361,000 | 21,741,433 | 179,401 | |||||||||||||||||||
06/29/2015 | Deutsche Bank AG | USD | 63,539,864 | EUR | 58,645,000 | 65,896,805 | (2,356,941 | ) | ||||||||||||||||||
07/13/2015 | JPMorgan Chase Bank N.A. | USD | 68,144,227 | EUR | 62,837,000 | 70,620,735 | (2,476,508 | ) | ||||||||||||||||||
| United States Dollar/Mexican Peso | ||||||||||||||||||||||||||
07/07/2015 | JPMorgan Chase Bank N.A. | USD | 25,178,166 | MXN | 381,171,000 | 24,733,991 | 444,175 | |||||||||||||||||||
| United States Dollar/Norwegian Krone | ||||||||||||||||||||||||||
05/13/2015 | JPMorgan Chase Bank N.A. | USD | 33,522,873 | NOK | 256,631,000 | 34,074,211 | (551,338 | ) | ||||||||||||||||||
| United States Dollar/Swiss Franc | ||||||||||||||||||||||||||
| 07/21/2015 | Deutsche Bank AG | USD | 2,141,100 | CHF | 2,034,000 | 2,186,591 | (45,491 | ) | ||||||||||||||||||
| $ | 389,558,016 | $ | (6,016,781 | ) | ||||||||||||||||||||||
| * | Certain contracts with different trade dates and like characteristics have been shown net. |
At April 30, 2015, the Fund held the following credit default swaps:
Buy Protection:
| Counterparty | Expiration Date | Notional Amount | Swap Details | Unrealized Appreciation/ (Depreciation) | Implied Credit Spread* | |||||||||||||
| Credit Suisse International | 6/20/2015 | 9,885,000 | Reveive: Chesapeake Energy(T) Pay: Fixed rate equal to 5.00% | (73,179 | ) | 3.95% | ||||||||||||
| Goldman Sachs | 3/20/2020 | 15,935,000 | Receive: Transocean, Inc.(T) Pay: Fixed rate equal to 5.00% | (544,130 | ) | 7.00% | ||||||||||||
| (617,309 | ) | |||||||||||||||||
See accompanying Notes to Financial Statements.
2015 Semi-Annual Report
37
Statement of Investments (concluded)
April 30, 2015 (Unaudited)
Aberdeen Global High Income Fund
Sell Protection:
| Counterparty | Expiration Date | Notional Amount | Swap Details | Unrealized Appreciation/ (Depreciation) | Implied Credit Spread* | |||||||||||||
| Goldman Sachs International | 03/20/2018 | 1,265,000 | Pay: Rite Aid(T) Receive: Fixed rate equal to 5.00% | $ | 190,533 | 1.05% | ||||||||||||
| Deutsche Bank | 03/20/2018 | 3,460,000 | Pay: Rite Aid(T) Receive: Fixed rate equal to 5.00% | 512,491 | 1.05% | |||||||||||||
| Goldman Sachs International | 03/20/2018 | 5,000,000 | Pay: Rite Aid(T) Receive: Fixed rate equal to 5.00% | 740,594 | 1.05% | |||||||||||||
| Morgan Stanley | 06/20/2018 | 450,000 | Pay: New Albertsons(T) Receive: Fixed rate equal to 5.00% | 82,779 | 1.64% | |||||||||||||
| Morgan Stanley | 06/20/2018 | 4,515,000 | Pay: New Albertsons(T) Receive: Fixed rate equal to 5.00% | 841,833 | 1.64% | |||||||||||||
| $ | 2,368,230 | |||||||||||||||||
| * | Implied credit spreads, represented in absolute terms, are utilized in determining the market value of credit default swaps agreements on corporate issues or sovereign issues and serve as an indicator of the current status of the payment/performance risk and represent the likelihood or risk of default for the credit derivative. The implied credit spread of particular referenced entity reflects the cost of buying/selling protection and may include upfront payments required to be made prior to entering into the agreement. For credit default swap with asset-backed securities or credit indices as the underlying assets, the quoted market prices and resulting market values serve as an indicator of the current status of the payment/performance risk. Wider credit spreads and increasing market values, in absolute terms when compared to the notional amount of the swap, represent a deterioration of the reference entity’s credit soundness and a greater likelihood or risk of default or other credit event occurring as defined under the terms of the agreement. |
See accompanying Notes to Financial Statements.
Semi-Annual Report 2015
38
Statements of Assets and Liabilities (Unaudited)
April 30, 2015
| Aberdeen Select International Equity Fund | Aberdeen Select International Equity Fund II | Aberdeen Total Return Bond Fund | Aberdeen Global High Income Fund | |||||||||||||
Assets: | ||||||||||||||||
Investments in securities, at fair value | $ | 368,534,222 | $ | 194,374,592 | $ | 1,451,567,009 | $ | 1,855,039,277 | ||||||||
Affiliated securities, at fair value (Note 6) | 1,596,422 | – | – | 25,062,520 | ||||||||||||
Repurchase agreements | 11,864,599 | 452,675 | 58,382,459 | 60,402,103 | ||||||||||||
|
|
|
|
|
|
|
| |||||||||
Total investments | 381,995,243 | 194,827,267 | 1,509,949,468 | 1,940,503,900 | ||||||||||||
|
|
|
|
|
|
|
| |||||||||
Foreign currency, at fair value | 170,998 | 131,511 | 922,931 | 7,081,930 | ||||||||||||
Cash collateral pledged for futures | – | – | 112,469 | – | ||||||||||||
Cash | – | – | 24,335 | 65,209 | ||||||||||||
Receivable for investments sold | 1,560,443 | 1,911,817 | 6,896,903 | 41,436,038 | ||||||||||||
Interest and dividends receivable | 3,769,631 | 3,157,910 | 8,325,063 | 29,686,154 | ||||||||||||
Unrealized appreciation on forward foreign currency exchange contracts | – | – | 1,970,440 | 1,872,440 | ||||||||||||
Receivable for capital shares issued | 5,575 | 75,678 | 949,644 | 870,368 | ||||||||||||
Variation margin receivable for futures contracts | – | – | 34,359 | – | ||||||||||||
Variation margin receivable for centrally cleared swaps | – | – | – | 5,162 | ||||||||||||
Open credit default swap contracts, at value | – | – | – | 3,846,701 | ||||||||||||
Prepaid expenses | 24,608 | 11,681 | 81,912 | 127,328 | ||||||||||||
|
|
|
|
|
|
|
| |||||||||
Total assets | 387,526,498 | 200,115,864 | 1,529,267,524 | 2,025,495,230 | ||||||||||||
|
|
|
|
|
|
|
| |||||||||
Liabilities: | ||||||||||||||||
Payable for investments purchased | 113,260 | 64,130 | 22,668,041 | 68,493,677 | ||||||||||||
Unrealized depreciation on forward foreign currency exchange contracts | – | – | 3,998,616 | 6,801,680 | ||||||||||||
Open credit default swap contracts, at value | – | – | – | 1,747,054 | ||||||||||||
Payable for capital shares redeemed | 387,210 | 372,295 | 1,641,892 | 3,434,792 | ||||||||||||
Unfunded loan commitments (Note 2) | – | – | – | 146,804 | ||||||||||||
Collateral due to broker for centrally cleared swaps | – | – | – | 2,849,999 | ||||||||||||
Accrued expenses and other payables: | ||||||||||||||||
Investment advisory fees | 286,391 | 146,721 | 428,556 | 1,025,001 | ||||||||||||
Distribution fees | 68,320 | 21,607 | 29,462 | 137,528 | ||||||||||||
Legal fees | 16,157 | 6,344 | 61,178 | 86,639 | ||||||||||||
Transfer agent fees | 9,816 | 17,291 | 11,291 | 57,636 | ||||||||||||
Custodian fees | 8,647 | 3,626 | 19,101 | 61,358 | ||||||||||||
Other | 150,069 | 71,095 | 157,480 | 78,708 | ||||||||||||
|
|
|
|
|
|
|
| |||||||||
Total liabilities | 1,039,870 | 703,109 | 29,015,617 | 84,920,876 | ||||||||||||
|
|
|
|
|
|
|
| |||||||||
Net Assets | $ | 386,486,628 | $ | 199,412,755 | $ | 1,500,251,907 | $ | 1,940,574,354 | ||||||||
|
|
|
|
|
|
|
| |||||||||
Cost: | ||||||||||||||||
Investments in securities, at cost | $ | 406,792,047 | $ | 197,224,795 | $ | 1,441,604,334 | $ | 1,912,060,661 | ||||||||
Affiliated securities, at cost (Note 6) | 27,205,984 | – | – | 30,083,125 | ||||||||||||
Repurchase agreements | 11,864,599 | 452,675 | 58,382,459 | 60,402,103 | ||||||||||||
Up-front payments made on open credit default swap | – | – | – | (1,129,746 | ) | |||||||||||
Up-front payments received on open credit default swap | – | – | – | 1,478,471 | ||||||||||||
Foreign currency | 1,574,880 | 129,918 | 874,910 | 7,002,575 | ||||||||||||
Net Assets Consist of: | ||||||||||||||||
Par value | $ | 14,484 | $ | 17,085 | $ | 112,399 | $ | 205,570 | ||||||||
Paid in capital in excess of par value | 2,734,094,300 | 2,916,352,657 | 1,479,888,739 | 2,009,526,889 | ||||||||||||
Accumulated net investment income/(loss) | 4,777,311 | 2,082,945 | 253,750 | 89,304 | ||||||||||||
Accumulated net realized gain/(loss) from investments and foreign currency transactions | (2,287,105,911 | ) | (2,716,171,973 | ) | 12,325,717 | (4,979,093 | ) | |||||||||
Net unrealized appreciation/(depreciation) on investments and translation of assets and liabilities denominated in foreign currencies | (65,293,556 | ) | (2,867,959 | ) | 7,671,302 | (64,268,316 | ) | |||||||||
|
|
|
|
|
|
|
| |||||||||
Net Assets | $ | 386,486,628 | $ | 199,412,755 | $ | 1,500,251,907 | $ | 1,940,574,354 | ||||||||
|
|
|
|
|
|
|
| |||||||||
Net Assets | ||||||||||||||||
Class A Shares | $ | 329,742,645 | $ | 105,232,911 | $ | 141,378,023 | $ | 666,006,550 | ||||||||
Institutional Class Shares (a) | 56,743,983 | 94,179,844 | 1,358,873,884 | 1,274,567,804 | ||||||||||||
|
|
|
|
|
|
|
| |||||||||
Total | $ | 386,486,628 | $ | 199,412,755 | $ | 1,500,251,907 | $ | 1,940,574,354 | ||||||||
|
|
|
|
|
|
|
| |||||||||
| (a) | Formerly Class I shares. |
Amounts listed as “–” are $0 or round to $0.
See accompanying Notes to Financial Statements.
2015 Semi-Annual Report
39
Statements of Assets and Liabilities (Unaudited) (concluded)
April 30, 2015
| Aberdeen Select International Equity Fund | Aberdeen Select International Equity Fund II | Aberdeen Total Return Bond Fund | Aberdeen Global High Income Fund | |||||||||||||
Shares Outstanding | ||||||||||||||||
Class A Shares | 12,400,660 | 9,014,837 | 10,464,217 | 67,961,157 | ||||||||||||
Institutional Class Shares (a) | 2,083,723 | 8,070,470 | 101,934,759 | 137,609,274 | ||||||||||||
|
|
|
|
|
|
|
| |||||||||
Total | 14,484,383 | 17,085,307 | 112,398,976 | 205,570,431 | ||||||||||||
|
|
|
|
|
|
|
| |||||||||
Net asset value and redemption price per share | ||||||||||||||||
Class A Shares | $ | 26.59 | (b) | $ | 11.67 | (b) | $ | 13.51 | (b) | $ | 9.80 | |||||
Institutional Class Shares (a) | $ | 27.23 | (b) | $ | 11.67 | (b) | $ | 13.33 | (b) | $ | 9.26 | |||||
| (a) | Formerly Class I shares. |
| (b) | The NAV shown above differs from the traded NAV on April 30, 2015 due to financial statement adjustments. |
Amounts listed as “–” are $0 or round to $0.
See accompanying Notes to Financial Statements.
Semi-Annual Report 2015
40
Statements of Operations (Unaudited)
For the Six Months Ended April 30, 2015
| Aberdeen Select International Equity Fund | Aberdeen Select International Equity Fund II | Aberdeen Total Return Bond Fund | Aberdeen Global High Income Fund | |||||||||||||
INVESTMENT INCOME: | ||||||||||||||||
Dividend income | $ | 7,779,088 | $ | 3,903,466 | $ | – | $ | 1,414,317 | ||||||||
Interest income | 707,386 | – | 21,746,985 | 77,971,438 | ||||||||||||
Foreign tax withholding | (648,497 | ) | (324,536 | ) | (3,458 | ) | – | |||||||||
Other income | – | – | 1,427,025 | 84,347 | ||||||||||||
|
|
|
|
|
|
|
| |||||||||
| 7,837,977 | 3,578,930 | 23,170,552 | 79,470,102 | |||||||||||||
|
|
|
|
|
|
|
| |||||||||
Expenses: | ||||||||||||||||
Investment advisory fees | 1,888,773 | 918,207 | 2,601,754 | 6,881,207 | ||||||||||||
Distribution fees Class A | 416,074 | 127,330 | 188,739 | 920,836 | ||||||||||||
Transfer agent fees | 31,308 | 43,665 | 31,387 | 177,814 | ||||||||||||
Trustee fees | 38,661 | 18,653 | 132,383 | 186,483 | ||||||||||||
Legal fees | 28,349 | 14,393 | 93,248 | 132,315 | ||||||||||||
Printing fees | 36,763 | 29,637 | 97,079 | 104,124 | ||||||||||||
Custodian fees | 65,443 | 40,032 | 131,856 | 244,650 | ||||||||||||
Registration and filing fees | 18,136 | 19,567 | 18,731 | 48,491 | ||||||||||||
Audit fees | 31,280 | 27,246 | 25,177 | 30,243 | ||||||||||||
Other | 86,373 | 50,928 | 160,539 | 288,945 | ||||||||||||
|
|
|
|
|
|
|
| |||||||||
Total expenses before reimbursed/waived expenses, excluding interest expense | 2,641,160 | 1,289,658 | 3,480,893 | 9,015,108 | ||||||||||||
Interest expense (Note 12) | 2,859 | 1,136 | – | 13,361 | ||||||||||||
|
|
|
|
|
|
|
| |||||||||
Total operating expenses before reimbursed/waived expenses | 2,644,019 | 1,290,794 | 3,480,893 | 9,028,469 | ||||||||||||
Expenses reimbursed (Note 3) | – | – | (9,519 | ) | (116,916 | ) | ||||||||||
Expenses waived by investment adviser (Note 3) | (10,493 | ) | (5,101 | ) | (37,168 | ) | (52,932 | ) | ||||||||
|
|
|
|
|
|
|
| |||||||||
Total operating expenses | 2,633,526 | 1,285,693 | 3,434,206 | 8,858,621 | ||||||||||||
|
|
|
|
|
|
|
| |||||||||
Net Investment Income | 5,204,451 | 2,293,237 | 19,736,346 | 70,611,481 | ||||||||||||
|
|
|
|
|
| �� |
|
| ||||||||
REALIZED/UNREALIZED GAIN/(LOSS) FROM INVESTMENTS: | ||||||||||||||||
Realized gain/(loss) on investment transactions | (16,501,007 | ) | (2,364,177 | ) | 704,589 | (43,787,536 | ) | |||||||||
Realized gain/(loss) on credit default swap contracts | – | – | – | 3,880,105 | ||||||||||||
Realized gain/(loss) on futures contracts | – | – | (673,619 | ) | – | |||||||||||
Realized gain/(loss) on foreign currency transactions | (860,760 | ) | (49,818 | ) | 15,721,213 | 51,381,096 | ||||||||||
|
|
|
|
|
|
|
| |||||||||
Net realized gain/(loss) from investments and foreign currency transactions | (17,361,767 | ) | (2,413,995 | ) | 15,752,183 | 11,473,665 | ||||||||||
|
|
|
|
|
|
|
| |||||||||
Net change in unrealized appreciation/(depreciation) from investment transactions | 6,757,191 | (1,207,079 | ) | (4,334,815 | ) | (66,905,807 | ) | |||||||||
Net change in unrealized appreciation/(depreciation) on credit default swap contracts | – | – | – | (5,957,463 | ) | |||||||||||
Net change in unrealized appreciation/(depreciation) on futures contracts | – | – | (199,875 | ) | – | |||||||||||
Net change in unrealized appreciation/(depreciation) on translation of assets and liabilities denominated in foreign currencies | (133,717 | ) | 17,375 | (5,105,826 | ) | (19,864,729 | ) | |||||||||
|
|
|
|
|
|
|
| |||||||||
Net change in unrealized appreciation/(depreciation) from investments and translation of assets and liabilities denominated in foreign currencies | 6,623,474 | (1,189,704 | ) | (9,640,516 | ) | (92,727,999 | ) | |||||||||
|
|
|
|
|
|
|
| |||||||||
Net realized/unrealized gain/(loss) from investments and foreign currency transactions | (10,738,293 | ) | (3,603,699 | ) | 6,111,667 | (81,254,334 | ) | |||||||||
|
|
|
|
|
|
|
| |||||||||
CHANGE IN NET ASSETS RESULTING FROM OPERATIONS | $ | (5,533,842 | ) | $ | (1,310,462 | ) | $ | 25,848,013 | $ | (10,642,853 | ) | |||||
|
|
|
|
|
|
|
| |||||||||
Amounts listed as “–” are $0 or round to $0.
See accompanying Notes to Financial Statements.
2015 Semi-Annual Report
41
Statements of Changes in Net Assets
| Aberdeen Select International Equity Fund | Aberdeen Select International Equity Fund II | |||||||||||||||
| Six Months Ended April 30, 2015 (Unaudited) | Year Ended October 31, 2014 | Six Months Ended April 30, 2015 (Unaudited) | Year Ended October 31, 2014 | |||||||||||||
FROM INVESTMENT ACTIVITIES: | ||||||||||||||||
Operations: | ||||||||||||||||
Net investment income | $ | 5,204,451 | $ | 21,948,903 | $ | 2,293,237 | $ | 9,720,569 | ||||||||
Net realized gain/(loss) from investments and foreign currency transactions | (17,361,767 | ) | (11,605,199 | ) | (2,413,995 | ) | 6,540,721 | |||||||||
Net change in unrealized appreciation/(depreciation) on investments and translation of assets and liabilities denominated in foreign currencies | 6,623,474 | (8,857,908 | ) | (1,189,704 | ) | (14,526,993 | ) | |||||||||
|
|
|
|
|
|
|
| |||||||||
Changes in net assets resulting from operations | (5,533,842 | ) | 1,485,796 | (1,310,462 | ) | 1,734,297 | ||||||||||
|
|
|
|
|
|
|
| |||||||||
Distributions to Shareholders From: | ||||||||||||||||
Net investment income: | ||||||||||||||||
Class A | (16,428,379 | ) | (11,058,718 | ) | (4,809,380 | ) | (69,226 | ) | ||||||||
Institutional Class(a) | (3,496,500 | ) | (2,430,830 | ) | (4,729,021 | ) | (331,201 | ) | ||||||||
|
|
|
|
|
|
|
| |||||||||
Change in net assets from shareholder distributions | (19,924,879 | ) | (13,489,548 | ) | (9,538,401 | ) | (400,427 | ) | ||||||||
|
|
|
|
|
|
|
| |||||||||
Change in net assets from capital transactions | (67,979,108 | ) | (173,886,783 | ) | (18,790,177 | ) | (98,186,443 | ) | ||||||||
|
|
|
|
|
|
|
| |||||||||
Change in net assets | (93,437,829 | ) | (185,890,535 | ) | (29,639,040 | ) | (96,852,573 | ) | ||||||||
|
|
|
|
|
|
|
| |||||||||
Net Assets: | ||||||||||||||||
Beginning of period | 479,924,457 | 665,814,992 | 229,051,795 | 325,904,368 | ||||||||||||
|
|
|
|
|
|
|
| |||||||||
End of period | $ | 386,486,628 | $ | 479,924,457 | $ | 199,412,755 | $ | 229,051,795 | ||||||||
|
|
|
|
|
|
|
| |||||||||
Accumulated net investment income/(loss) at end of period | $ | 4,777,311 | $ | 19,497,739 | $ | 2,082,945 | $ | 9,328,109 | ||||||||
|
|
|
|
|
|
|
| |||||||||
CAPITAL TRANSACTIONS: | ||||||||||||||||
Class A Shares | ||||||||||||||||
Proceeds from shares issued | $ | 3,161,662 | $ | 8,706,701 | $ | 5,776,599 | $ | 9,367,139 | ||||||||
Dividends reinvested | 16,112,995 | 10,795,351 | 4,669,220 | 66,355 | ||||||||||||
Cost of shares redeemed | (66,761,479 | ) | (166,295,966 | ) | (20,147,580 | ) | (57,833,700 | ) | ||||||||
|
|
|
|
|
|
|
| |||||||||
Total Class A | (47,486,822 | ) | (146,793,914 | ) | (9,701,761 | ) | (48,400,206 | ) | ||||||||
|
|
|
|
|
|
|
| |||||||||
Institutional Class Shares(a) | ||||||||||||||||
Proceeds from shares issued | 1,027,491 | 4,143,592 | 3,149,585 | 7,838,242 | ||||||||||||
Dividends reinvested | 3,368,549 | 2,318,673 | 4,113,653 | 283,163 | ||||||||||||
Cost of shares redeemed | (24,888,326 | ) | (33,555,134 | ) | (16,351,654 | ) | (57,907,642 | ) | ||||||||
|
|
|
|
|
|
|
| |||||||||
Total Institutional Class | (20,492,286 | ) | (27,092,869 | ) | (9,088,416 | ) | (49,786,237 | ) | ||||||||
|
|
|
|
|
|
|
| |||||||||
Change in net assets from capital transactions: | $ | (67,979,108 | ) | $ | (173,886,783 | ) | $ | (18,790,177 | ) | $ | (98,186,443 | ) | ||||
|
|
|
|
|
|
|
| |||||||||
| (a) | Formerly Class I shares. |
Amounts listed as “–” are $0 or round to $0.
See accompanying Notes to Financial Statements.
Semi-Annual Report 2015
42
Statements of Changes in Net Assets (continued)
| Aberdeen Select International Equity Fund | Aberdeen Select International Equity Fund II | |||||||||||||||
| Six Months Ended April 30, 2015 (Unaudited) | Year Ended October 31, 2014 | Six Months Ended April 30, 2015 (Unaudited) | Year Ended October 31, 2014 | |||||||||||||
SHARE TRANSACTIONS: | ||||||||||||||||
Class A Shares | ||||||||||||||||
Issued | 122,146 | 308,600 | 511,889 | 759,666 | ||||||||||||
Reinvested | 637,886 | 397,912 | 422,554 | 5,628 | ||||||||||||
Redeemed | (2,570,389 | ) | (5,876,767 | ) | (1,760,597 | ) | (4,714,982 | ) | ||||||||
|
|
|
|
|
|
|
| |||||||||
Total Class A Shares | (1,810,357 | ) | (5,170,255 | ) | (826,154 | ) | (3,949,688 | ) | ||||||||
|
|
|
|
|
|
|
| |||||||||
Institutional Class Shares(a) | ||||||||||||||||
Issued | 38,622 | 141,870 | 275,035 | 624,839 | ||||||||||||
Reinvested | 130,311 | 83,556 | 372,614 | 24,017 | ||||||||||||
Redeemed | (943,459 | ) | (1,147,728 | ) | (1,446,608 | ) | (4,722,115 | ) | ||||||||
|
|
|
|
|
|
|
| |||||||||
Total Institutional Class Shares | (774,526 | ) | (922,302 | ) | (798,959 | ) | (4,073,259 | ) | ||||||||
|
|
|
|
|
|
|
| |||||||||
Total change in shares: | (2,584,883 | ) | (6,092,557 | ) | (1,625,113 | ) | (8,022,947 | ) | ||||||||
|
|
|
|
|
|
|
| |||||||||
| (a) | Formerly Class I shares. |
Amounts listed as “–” are $0 or round to $0.
See accompanying Notes to Financial Statements.
2015 Semi-Annual Report
43
Statements of Changes in Net Assets (continued)
| Aberdeen Total Return Bond Fund | Aberdeen Global High Income Fund | |||||||||||||||
| Six Months Ended April 30, 2015 (Unaudited) | Year Ended October 31, 2014 | Six Months Ended April 30, 2015 (Unaudited) | Year Ended October 31, 2014 | |||||||||||||
FROM INVESTMENT ACTIVITIES: | ||||||||||||||||
Operations: | ||||||||||||||||
Net investment income | $ | 19,736,346 | $ | 42,952,619 | $ | 70,611,481 | $ | 158,294,160 | ||||||||
Net realized gain/(loss) from investments and foreign currency transactions | 15,752,183 | 2,177,584 | 11,473,665 | 45,226,698 | ||||||||||||
Net change in unrealized appreciation/(depreciation) on investments and translation of assets and liabilities denominated in foreign currencies | (9,640,516 | ) | 17,723,993 | (92,727,999 | ) | (73,457,477 | ) | |||||||||
|
|
|
|
|
|
|
| |||||||||
Changes in net assets resulting from operations | 25,848,013 | 62,854,196 | (10,642,853 | ) | 130,063,381 | |||||||||||
|
|
|
|
|
|
|
| |||||||||
Distributions to Shareholders From: | ||||||||||||||||
Net investment income: | ||||||||||||||||
Class A | (1,638,705 | ) | (2,317,155 | ) | (22,393,288 | ) | (58,784,001 | ) | ||||||||
Institutional Class(a) | (16,562,449 | ) | (26,727,765 | ) | (46,941,126 | ) | (104,537,053 | ) | ||||||||
Net realized gains: | ||||||||||||||||
Class A | (1,774,676 | ) | – | (19,357,727 | ) | (10,366,807 | ) | |||||||||
Institutional Class(a) | (16,506,438 | ) | – | (37,810,111 | ) | (16,935,520 | ) | |||||||||
|
|
|
|
|
|
|
| |||||||||
Change in net assets from shareholder distributions | (36,482,268 | ) | (29,044,920 | ) | (126,502,252 | ) | (190,623,381 | ) | ||||||||
|
|
|
|
|
|
|
| |||||||||
Change in net assets from capital transactions | (2,561,423 | ) | (123,507,424 | ) | (307,381,638 | ) | (107,132,402 | ) | ||||||||
|
|
|
|
|
|
|
| |||||||||
Change in net assets | (13,195,678 | ) | (89,698,148 | ) | (444,526,743 | ) | (167,692,402 | ) | ||||||||
|
|
|
|
|
|
|
| |||||||||
Net Assets: | ||||||||||||||||
Beginning of period | 1,513,447,585 | 1,603,145,733 | 2,385,101,097 | 2,552,793,499 | ||||||||||||
|
|
|
|
|
|
|
| |||||||||
End of period | $ | 1,500,251,907 | $ | 1,513,447,585 | $ | 1,940,574,354 | $ | 2,385,101,097 | ||||||||
|
|
|
|
|
|
|
| |||||||||
Accumulated net investment income/(loss) at end of period | $ | 253,750 | $ | (1,281,442 | ) | $ | 89,304 | $ | (1,187,763 | ) | ||||||
|
|
|
|
|
|
|
| |||||||||
CAPITAL TRANSACTIONS: | ||||||||||||||||
Class A Shares | ||||||||||||||||
Proceeds from shares issued | $ | 32,565,319 | $ | 66,730,738 | $ | 186,101,638 | $ | 491,906,310 | ||||||||
Dividends reinvested | 3,365,163 | 2,258,635 | 38,687,457 | 65,307,706 | ||||||||||||
Cost of shares redeemed | (45,827,730 | ) | (72,960,043 | ) | (336,072,174 | ) | (716,052,886 | ) | ||||||||
|
|
|
|
|
|
|
| |||||||||
Total Class A | (9,897,248 | ) | (3,970,670 | ) | (111,283,079 | ) | (158,838,870 | ) | ||||||||
|
|
|
|
|
|
|
| |||||||||
Institutional Class Shares(a) | ||||||||||||||||
Proceeds from shares issued | 186,864,299 | 337,708,864 | 424,622,974 | 857,985,100 | ||||||||||||
Dividends reinvested | 31,337,264 | 24,841,421 | 56,485,381 | 75,297,454 | ||||||||||||
Cost of shares redeemed | (210,865,738 | ) | (482,087,039 | ) | (677,206,914 | ) | (881,576,086 | ) | ||||||||
|
|
|
|
|
|
|
| |||||||||
Total Institutional Class | 7,335,825 | (119,536,754 | ) | (196,098,559 | ) | 51,706,468 | ||||||||||
|
|
|
|
|
|
|
| |||||||||
Change in net assets from capital transactions: | $ | (2,561,423 | ) | $ | (123,507,424 | ) | $ | (307,381,638 | ) | $ | (107,132,402 | ) | ||||
|
|
|
|
|
|
|
| |||||||||
| (a) | Formerly Class I shares. |
Amounts listed as “–” are $0 or round to $0.
See accompanying Notes to Financial Statements.
Semi-Annual Report 2015
44
Statements of Changes in Net Assets (concluded)
| Aberdeen Total Return Bond Fund | Aberdeen Global High Income Fund | |||||||||||||||
| Six Months Ended April 30, 2015 (Unaudited) | Year Ended October 31, 2014 | Six Months Ended April 30, 2015 (Unaudited) | Year Ended October 31, 2014 | |||||||||||||
SHARE TRANSACTIONS: | ||||||||||||||||
Class A Shares | ||||||||||||||||
Issued | 2,408,294 | 4,920,576 | 18,575,373 | 46,021,750 | ||||||||||||
Reinvested | 249,048 | 168,402 | 3,944,432 | 6,129,870 | ||||||||||||
Redeemed | (3,381,585 | ) | (5,434,499 | ) | (33,898,870 | ) | (66,959,027 | ) | ||||||||
|
|
|
|
|
|
|
| |||||||||
Total Class A Shares | (724,243 | ) | (345,521 | ) | (11,379,065 | ) | (14,807,407 | ) | ||||||||
|
|
|
|
|
|
|
| |||||||||
Institutional Class Shares(a) | ||||||||||||||||
Issued | 13,933,488 | 25,459,872 | 45,209,745 | 84,457,459 | ||||||||||||
Reinvested | 2,349,301 | 1,875,489 | 6,084,033 | 7,443,445 | ||||||||||||
Redeemed | (15,729,299 | ) | (36,390,145 | ) | (72,241,479 | ) | (87,153,414 | ) | ||||||||
|
|
|
|
|
|
|
| |||||||||
Total Institutional Class Shares | 553,490 | (9,054,784 | ) | (20,947,701 | ) | 4,747,490 | ||||||||||
|
|
|
|
|
|
|
| |||||||||
Total change in shares: | (170,753 | ) | (9,400,305 | ) | (32,326,766 | ) | (10,059,917 | ) | ||||||||
|
|
|
|
|
|
|
| |||||||||
| (a) | Formerly Class I shares. |
Amounts listed as “–” are $0 or round to $0.
See accompanying Notes to Financial Statements.
2015 Semi-Annual Report
45
Financial Highlights
Selected Data for Each Share of Capital Outstanding Throughout the Periods Indicated
Aberdeen Select International Equity Fund
| Investment Activities | Distributions | |||||||||||||||||||||||||||||||
| Net Asset Value, Beginning of Period | Net Investment Income (a) | Net Realized and Unrealized Gains (Losses) on Invest- ments | Total from Invest- ment Activities | Net Invest- ment Income | Tax Return of Capital | Total Distri- butions | Net Asset Value, End of Period | |||||||||||||||||||||||||
Class A Shares | ||||||||||||||||||||||||||||||||
Six Months Ended April 30, 2015* | $ | 28.00 | $ | 0.32 | $ | (0.53 | ) | $ | (0.21 | ) | $ | (1.20 | ) | $ | – | $ | (1.20 | ) | $ | 26.59 | ||||||||||||
Year Ended October 31, 2014 | 28.63 | 1.09 | (1.12 | ) | (0.03 | ) | (0.60 | ) | – | (0.60 | ) | 28.00 | ||||||||||||||||||||
Year Ended October 31, 2013 | 23.84 | 0.37 | 4.55 | 4.92 | (0.13 | ) | – | (0.13 | ) | 28.63 | ||||||||||||||||||||||
Year Ended October 31, 2012 | 24.55 | 0.30 | (0.62 | ) | (0.32 | ) | (0.39 | ) | – | (0.39 | ) | 23.84 | ||||||||||||||||||||
Year Ended October 31, 2011 | 28.87 | 0.19 | (4.00 | ) | (3.81 | ) | (0.51 | ) | – | (0.51 | ) | 24.55 | ||||||||||||||||||||
Year Ended October 31, 2010 | 28.20 | 0.27 | 2.48 | 2.75 | (2.08 | ) | – | (2.08 | ) | 28.87 | ||||||||||||||||||||||
Institutional Class Shares(h) | ||||||||||||||||||||||||||||||||
Six Months Ended April 30, 2015* | 28.69 | 0.33 | (0.51 | ) | (0.18 | ) | (1.28 | ) | – | (1.28 | ) | 27.23 | ||||||||||||||||||||
Year Ended October 31, 2014 | 29.33 | 1.19 | (1.16 | ) | 0.03 | (0.67 | ) | – | (0.67 | ) | 28.69 | |||||||||||||||||||||
Year Ended October 31, 2013 | 24.44 | 0.31 | 4.80 | 5.11 | (0.22 | ) | – | (0.22 | ) | 29.33 | ||||||||||||||||||||||
Year Ended October 31, 2012 | 25.20 | 0.36 | (0.64 | ) | (0.28 | ) | (0.48 | ) | – | (0.48 | ) | 24.44 | ||||||||||||||||||||
Year Ended October 31, 2011 | 29.64 | 0.28 | (4.13 | ) | (3.85 | ) | (0.59 | ) | – | (0.59 | ) | 25.20 | ||||||||||||||||||||
Year Ended October 31, 2010 | 28.89 | 0.35 | 2.55 | 2.90 | (2.15 | ) | – | (2.15 | ) | 29.64 | ||||||||||||||||||||||
| * | Unaudited |
| (a) | Net investment income (loss) is based on average shares outstanding during the period. |
| (b) | Not annualized for periods less than one year. |
| (c) | Annualized for periods less than one year. |
| (d) | Includes interest expense that amounts to less than 0.01%. |
Amounts listed as “–” are $0 or round to $0.
See accompanying Notes to Financial Statements.
Semi-Annual Report 2015
46
Financial Highlights (continued)
Selected Data for Each Share of Capital Outstanding Throughout the Periods Indicated
Aberdeen Select International Equity Fund (concluded)
| Ratios/Supplemental Data | ||||||||||||||||||||||
| Total Return (b) | Net Assets at End of Period (000’s) | Ratio of Expenses to Average Net Assets (c)(d) | Ratio of Net Investment Income to Average Net Assets (c) | Ratio of Expenses (Prior to Reimbursed/ Waived Expenses) to Average Net Assets (c)(d)(e) | Portfolio Turnover (b)(f) | |||||||||||||||||
| (0.52 | %)(g) | $ | 329,743 | 1.30 | % | 2.48 | % | 1.30 | % | 6 | % | |||||||||||
| (0.04 | %) | 397,911 | 1.26 | % | 3.83 | % | 1.26 | % | 12 | % | ||||||||||||
| 20.70 | % | 554,922 | 1.25 | % | 1.39 | % | 1.26 | % | 94 | % | ||||||||||||
| (1.14 | %) | 877,738 | 1.23 | % | 1.30 | % | 1.24 | % | 35 | % | ||||||||||||
| (13.49 | %) | 2,059,255 | 1.29 | % | 0.65 | % | 1.30 | % | 41 | % | ||||||||||||
| 10.06 | % | 3,692,638 | 1.28 | % | 1.00 | % | 1.28 | % | 105 | % | ||||||||||||
| (0.39 | %)(g) | 56,744 | 1.06 | % | 2.50 | % | 1.06 | % | 6 | % | ||||||||||||
| 0.19 | % | 82,014 | 1.02 | % | 4.06 | % | 1.03 | % | 12 | % | ||||||||||||
| 21.04 | % | 110,893 | 1.03 | % | 1.15 | % | 1.04 | % | 94 | % | ||||||||||||
| (0.93 | %) | 1,138,838 | 1.00 | % | 1.51 | % | 1.01 | % | 35 | % | ||||||||||||
| (13.31 | %) | 3,687,999 | 1.05 | % | 0.95 | % | 1.05 | % | 41 | % | ||||||||||||
| 10.37 | % | 5,790,307 | 1.02 | % | 1.26 | % | 1.02 | % | 105 | % | ||||||||||||
| (e) | During the period, certain fees were waived and/or reimbursed. If such waivers/reimbursements had not occurred, the ratios would have been as indicated. |
| (f) | Portfolio turnover is calculated on the basis of the Fund as a whole without distinguishing among the classes of shares. |
| (g) | The total return shown includes the impact of financial statement rounding of the NAV per share and/or financial statement adjustments. |
| (h) | Formerly Class I shares. |
2015 Semi-Annual Report
47
Financial Highlights (continued)
Selected Data for Each Share of Capital Outstanding Throughout the Periods Indicated
Aberdeen Select International Equity Fund II
| Investment Activities | Distributions | |||||||||||||||||||||||||||||||
| Net Asset Value, Beginning of Period | Net Investment Income (a) | Net | Total from Invest- ment Activities | Net Invest- ment Income | Tax Return of Capital | Total Distri- butions | Net Asset Value, End of Period | |||||||||||||||||||||||||
Class A Shares | ||||||||||||||||||||||||||||||||
Six Months Ended April 30, 2015* | $ | 12.23 | $ | 0.12 | $ | (0.16 | ) | $ | (0.04 | ) | $ | (0.52 | ) | $ | – | $ | (0.52 | ) | $ | 11.67 | ||||||||||||
Year Ended October 31, 2014 | 12.18 | 0.42 | (0.36 | ) | 0.06 | (0.01 | ) | – | (0.01 | ) | 12.23 | |||||||||||||||||||||
Year Ended October 31, 2013 | 10.38 | 0.13 | 1.92 | 2.05 | (0.25 | ) | – | (0.25 | ) | 12.18 | ||||||||||||||||||||||
Year Ended October 31, 2012 | 10.46 | 0.12 | (0.05 | ) | 0.07 | (0.15 | ) | – | (0.15 | ) | 10.38 | |||||||||||||||||||||
Year Ended October 31, 2011 | 12.18 | 0.07 | (1.56 | ) | (1.49 | ) | (0.23 | ) | – | (0.23 | ) | 10.46 | ||||||||||||||||||||
Year Ended October 31, 2010 | 11.62 | 0.11 | 1.00 | 1.11 | (0.55 | ) | – | (0.55 | ) | 12.18 | ||||||||||||||||||||||
Institutional Class Shares(g) | ||||||||||||||||||||||||||||||||
Six Months Ended April 30, 2015* | 12.25 | 0.13 | (0.16 | ) | (0.03 | ) | (0.55 | ) | – | (0.55 | ) | 11.67 | ||||||||||||||||||||
Year Ended October 31, 2014 | 12.20 | 0.46 | (0.38 | ) | 0.08 | (0.03 | ) | – | (0.03 | ) | 12.25 | |||||||||||||||||||||
Year Ended October 31, 2013 | 10.45 | 0.11 | 1.97 | 2.08 | (0.33 | ) | – | (0.33 | ) | 12.20 | ||||||||||||||||||||||
Year Ended October 31, 2012 | 10.54 | 0.14 | (0.04 | ) | 0.10 | (0.19 | ) | – | (0.19 | ) | 10.45 | |||||||||||||||||||||
Year Ended October 31, 2011 | 12.27 | 0.10 | (1.57 | ) | (1.47 | ) | (0.26 | ) | – | (0.26 | ) | 10.54 | ||||||||||||||||||||
Year Ended October 31, 2010 | 11.70 | 0.14 | 1.01 | 1.15 | (0.58 | ) | – | (0.58 | ) | 12.27 | ||||||||||||||||||||||
| * | Unaudited |
| (a) | Net investment income (loss) is based on average shares outstanding during the period. |
| (b) | Not annualized for periods less than one year. |
| (c) | Annualized for periods less than one year. |
Amounts listed as “–” are $0 or round to $0.
See accompanying Notes to Financial Statements.
Semi-Annual Report 2015
48
Financial Highlights (continued)
Selected Data for Each Share of Capital Outstanding Throughout the Periods Indicated
Aberdeen Select International Equity Fund II (concluded)
| Ratios/Supplemental Data | ||||||||||||||||||||||
| Total Return (b) | Net Assets at End of Period (000’s) | Ratio of Expenses to Average Net Assets (c)(d) | Ratio of Net Investment Income to Average Net Assets (c) | Ratio of Expenses (Prior to Reimbursed/ Waived Expenses) to Average Net Assets (c)(d)(e) | Portfolio Turnover (b)(f) | |||||||||||||||||
| (0.12 | %) | $ | 105,233 | 1.37 | % | 2.15 | % | 1.37 | % | 6 | % | |||||||||||
| 0.46 | % | 120,387 | 1.32 | % | 3.41 | % | 1.33 | % | 11 | % | ||||||||||||
| 20.00 | % | 168,028 | 1.21 | % | 1.19 | % | 1.23 | % | 97 | % | ||||||||||||
| 0.91 | % | 278,360 | 1.30 | % | 1.21 | % | 1.32 | % | 34 | % | ||||||||||||
| (12.61 | %) | 1,310,435 | 1.28 | % | 0.54 | % | 1.28 | % | 51 | % | ||||||||||||
| 9.75 | % | 2,156,072 | 1.28 | % | 0.98 | % | 1.29 | % | 123 | % | ||||||||||||
| 0.01 | % | 94,180 | 1.14 | % | 2.36 | % | 1.14 | % | 6 | % | ||||||||||||
| 0.64 | % | 108,665 | 1.10 | % | 3.69 | % | 1.11 | % | 11 | % | ||||||||||||
| 20.36 | % | 157,876 | 1.04 | % | 1.02 | % | 1.04 | % | 97 | % | ||||||||||||
| 1.11 | % | 806,052 | 1.01 | % | 1.33 | % | 1.02 | % | 34 | % | ||||||||||||
| (12.31 | %) | 3,666,631 | 1.04 | % | 0.79 | % | 1.04 | % | 51 | % | ||||||||||||
| 9.99 | % | 6,355,205 | 1.04 | % | 1.23 | % | 1.05 | % | 123 | % | ||||||||||||
| (d) | Includes interest expense that amounts to less than 0.01%. |
| (e) | During the period, certain fees were waived and/or reimbursed. If such waivers/reimbursements had not occurred, the ratios would have been as indicated. |
| (f) | Portfolio turnover is calculated on the basis of the Fund as a whole without distinguishing among the classes of shares. |
| (g) | Formerly Class I shares. |
2015 Semi-Annual Report
49
Financial Highlights (continued)
Selected Data for Each Share of Capital Outstanding Throughout the Periods Indicated
Aberdeen Total Return Bond Fund
| Investment Activities | Distributions | |||||||||||||||||||||||||||||||||||
| Net Asset Value, Beginning of Period | Net Investment Income (a) | Net | Total from Invest- ment Activities | Net Invest- ment Income | Net Realized Gains | Tax Return of Capital | Total Distri- butions | Net Asset Value, End of Period | ||||||||||||||||||||||||||||
Class A Shares | ||||||||||||||||||||||||||||||||||||
Six Months Ended April 30, 2015* | $ | 13.60 | $ | 0.16 | $ | 0.07 | $ | 0.23 | $ | (0.15 | ) | $ | (0.17 | ) | $ | – | $ | (0.32 | ) | $ | 13.51 | |||||||||||||||
Year Ended October 31, 2014 | 13.30 | 0.34 | 0.18 | 0.52 | (0.22 | ) | – | – | (0.22 | ) | 13.60 | |||||||||||||||||||||||||
Year Ended October 31, 2013 | 14.17 | 0.31 | (0.56 | ) | (0.25 | ) | (0.29 | ) | (0.30 | ) | (0.03 | ) | (0.62 | ) | 13.30 | |||||||||||||||||||||
Year Ended October 31, 2012 | 14.02 | 0.34 | 0.56 | 0.90 | (0.49 | ) | (0.26 | ) | – | (0.75 | ) | 14.17 | ||||||||||||||||||||||||
Year Ended October 31, 2011 | 14.24 | 0.55 | 0.18 | 0.73 | (0.47 | ) | (0.48 | ) | – | (0.95 | ) | 14.02 | ||||||||||||||||||||||||
Year Ended October 31, 2010 | 13.51 | 0.52 | 0.69 | 1.21 | (0.48 | ) | – | – | (0.48 | ) | 14.24 | |||||||||||||||||||||||||
Institutional Class Shares(f) | ||||||||||||||||||||||||||||||||||||
Six Months Ended April 30, 2015* | 13.43 | 0.18 | 0.05 | 0.23 | (0.16 | ) | (0.17 | ) | – | (0.33 | ) | 13.33 | ||||||||||||||||||||||||
Year Ended October 31, 2014 | 13.13 | 0.37 | 0.18 | 0.55 | (0.25 | ) | – | – | (0.25 | ) | 13.43 | |||||||||||||||||||||||||
Year Ended October 31, 2013 | 14.03 | 0.35 | (0.56 | ) | (0.21 | ) | (0.36 | ) | (0.30 | ) | (0.03 | ) | (0.69 | ) | 13.13 | |||||||||||||||||||||
Year Ended October 31, 2012 | 13.91 | 0.38 | 0.55 | 0.93 | (0.55 | ) | (0.26 | ) | – | (0.81 | ) | 14.03 | ||||||||||||||||||||||||
Year Ended October 31, 2011 | 14.16 | 0.58 | 0.18 | 0.76 | (0.53 | ) | (0.48 | ) | – | (1.01 | ) | 13.91 | ||||||||||||||||||||||||
Year Ended October 31, 2010 | 13.47 | 0.55 | 0.69 | 1.24 | (0.55 | ) | – | – | (0.55 | ) | 14.16 | |||||||||||||||||||||||||
| * | Unaudited |
| (a) | Net investment income (loss) is based on average shares outstanding during the period. |
| (b) | Not annualized for periods less than one year. |
| (c) | Annualized for periods less than one year. |
Amounts listed as “–” are $0 or round to $0.
See accompanying Notes to Financial Statements.
Semi-Annual Report 2015
50
Financial Highlights (continued)
Selected Data for Each Share of Capital Outstanding Throughout the Periods Indicated
Aberdeen Total Return Bond Fund (concluded)
| Ratios/Supplemental Data | ||||||||||||||||||||||
| Total Return (b) | Net Assets at End of Period (000’s) | Ratio of Expenses to Average Net Assets (c) | Ratio of Net Investment Income to Average Net Assets (c) | Ratio of Expenses (Prior to Reimbursed/ Waived Expenses) to Average Net Assets (c)(d) | Portfolio Turnover (b)(e) | |||||||||||||||||
| 1.66 | % | $ | 141,378 | 0.69 | % | 2.41 | % | 0.71 | % | 36 | % | |||||||||||
| 3.96 | % | 152,196 | 0.68 | % | 2.56 | % | 0.69 | % | 128 | % | ||||||||||||
| (1.81 | %) | 153,370 | 0.68 | % | 2.29 | % | 0.70 | % | 265 | % | ||||||||||||
| 6.64 | % | 247,217 | 0.69 | % | 2.47 | % | 0.69 | % | 236 | % | ||||||||||||
| 5.49 | % | 271,444 | 0.69 | % | 3.96 | % | 0.71 | % | 219 | % | ||||||||||||
| 9.16 | % | 319,782 | 0.69 | % | 3.77 | % | 0.70 | % | 193 | % | ||||||||||||
| 1.74 | % | 1,358,874 | 0.44 | % | 2.68 | % | 0.44 | % | 36 | % | ||||||||||||
| 4.25 | % | 1,361,252 | 0.42 | % | 2.81 | % | 0.43 | % | 128 | % | ||||||||||||
| (1.59 | %) | 1,449,776 | 0.42 | % | 2.56 | % | 0.43 | % | 265 | % | ||||||||||||
| 6.97 | % | 1,849,138 | 0.41 | % | 2.73 | % | 0.41 | % | 236 | % | ||||||||||||
| 5.79 | % | 1,498,733 | 0.44 | % | 4.20 | % | 0.45 | % | 219 | % | ||||||||||||
| 9.39 | % | 1,305,839 | 0.44 | % | 4.01 | % | 0.44 | % | 193 | % | ||||||||||||
| (d) | During the period, certain fees were waived and/or reimbursed. If such waivers/reimbursements had not occurred, the ratios would have been as indicated. |
| (e) | Portfolio turnover is calculated on the basis of the Fund as a whole without distinguishing among the classes of shares. |
| (f) | Formerly Class I shares. |
2015 Semi-Annual Report
51
Financial Highlights (continued)
Selected Data for Each Share of Capital Outstanding Throughout the Periods Indicated
Aberdeen Global High Income Fund
| Investment Activities | Distributions | |||||||||||||||||||||||||||||||||||
| Net Asset Value, Beginning of Period | Net Investment Income (a) | Net | Total from Invest- ment Activities | Net Invest- ment Income | Net Realized Gains | Tax Return of Capital | Total Distri- butions | Net Asset Value, End of Period | ||||||||||||||||||||||||||||
Class A Shares | ||||||||||||||||||||||||||||||||||||
Six Months Ended April 30, 2015* | $ | 10.38 | $ | 0.32 | $ | (0.34 | ) | $ | (0.02 | ) | $ | (0.31 | ) | $ | (0.25 | ) | $ | – | $ | (0.56 | ) | $ | 9.80 | |||||||||||||
Year Ended October 31, 2014 | 10.61 | 0.62 | (0.13 | ) | 0.49 | (0.61 | ) | (0.11 | ) | – | (0.72 | ) | 10.38 | |||||||||||||||||||||||
Year Ended October 31, 2013 | 10.30 | 0.72 | 0.30 | 1.02 | (0.71 | ) | – | – | (0.71 | ) | 10.61 | |||||||||||||||||||||||||
Year Ended October 31, 2012 | 10.14 | 0.73 | 0.34 | 1.07 | (0.74 | ) | (0.16 | ) | (0.01 | ) | (0.91 | ) | 10.30 | |||||||||||||||||||||||
Year Ended October 31, 2011 | 11.06 | 0.77 | (0.62 | ) | 0.15 | (0.79 | ) | (0.28 | ) | – | (1.07 | ) | 10.14 | |||||||||||||||||||||||
Year Ended October 31, 2010 | 10.28 | 0.82 | 0.77 | 1.59 | (0.81 | ) | – | – | (0.81 | ) | 11.06 | |||||||||||||||||||||||||
Institutional Class Shares(g) | ||||||||||||||||||||||||||||||||||||
Six Months Ended April 30, 2015* | 9.85 | 0.32 | (0.34 | ) | (0.02 | ) | (0.32 | ) | (0.25 | ) | – | (0.57 | ) | 9.26 | ||||||||||||||||||||||
Year Ended October 31, 2014 | 10.10 | 0.61 | (0.11 | ) | 0.50 | (0.64 | ) | (0.11 | ) | – | (0.75 | ) | 9.85 | |||||||||||||||||||||||
Year Ended October 31, 2013 | 9.84 | 0.71 | 0.29 | 1.00 | (0.74 | ) | – | – | (0.74 | ) | 10.10 | |||||||||||||||||||||||||
Year Ended October 31, 2012 | 9.72 | 0.73 | 0.31 | 1.04 | (0.74 | ) | (0.16 | ) | (0.02 | ) | (0.92 | ) | 9.84 | |||||||||||||||||||||||
Year Ended October 31, 2011 | 10.64 | 0.76 | (0.59 | ) | 0.17 | (0.81 | ) | (0.28 | ) | – | (1.09 | ) | 9.72 | |||||||||||||||||||||||
Year Ended October 31, 2010 | 9.90 | 0.82 | 0.74 | 1.56 | (0.82 | ) | – | – | (0.82 | ) | 10.64 | |||||||||||||||||||||||||
| * | Unaudited |
| (a) | Net investment income (loss) is based on average shares outstanding during the period. |
| (b) | Not annualized for periods less than one year. |
| (c) | Annualized for periods less than one year. |
Amounts listed as “–” are $0 or round to $0.
See accompanying Notes to Financial Statements.
Semi-Annual Report 2015
52
Financial Highlights (concluded)
Selected Data for Each Share of Capital Outstanding Throughout the Periods Indicated
Aberdeen Global High Income Fund (concluded)
| Ratios/Supplemental Data | ||||||||||||||||||||||
| Total Return (b) | Net Assets at End of Period (000’s) | Ratio of Expenses to Average Net Assets (c) | Ratio of Net Investment Income to Average Net Assets (c) | Ratio of Expenses (Prior to Reimbursed/ Waived Expenses) to Average Net Assets (c)(d) | Portfolio Turnover (b)(e) | |||||||||||||||||
| (0.06 | %) | $ | 666,007 | 1.00 | %(f) | 6.50 | % | 1.04 | %(f) | 41 | % | |||||||||||
| 4.70 | % | 823,808 | 1.00 | %(f) | 5.76 | % | 1.01 | %(f) | 96 | % | ||||||||||||
| 10.20 | % | 999,250 | 0.99 | %(f) | 6.83 | % | 1.00 | %(f) | 57 | % | ||||||||||||
| 11.22 | % | 1,066,487 | 0.99 | %(f) | 7.26 | % | 1.01 | %(f) | 62 | % | ||||||||||||
| 1.30 | % | 1,308,597 | 0.99 | %(f) | 7.19 | % | 1.00 | %(f) | 78 | % | ||||||||||||
| 16.08 | % | 1,222,933 | 1.00 | % | 7.70 | % | 1.00 | % | 57 | % | ||||||||||||
| (0.02 | %) | 1,274,568 | 0.75 | %(f) | 6.76 | % | 0.75 | %(f) | 41 | % | ||||||||||||
| 5.01 | % | 1,561,293 | 0.74 | %(f) | 6.01 | % | 0.75 | %(f) | 96 | % | ||||||||||||
| 10.53 | % | 1,553,543 | 0.75 | %(f) | 7.10 | % | 0.75 | %(f) | 57 | % | ||||||||||||
| 11.49 | % | 2,130,565 | 0.73 | %(f) | 7.53 | % | 0.74 | %(f) | 62 | % | ||||||||||||
| 1.52 | % | 2,077,865 | 0.73 | %(f) | 7.44 | % | 0.74 | %(f) | 78 | % | ||||||||||||
| 16.39 | % | 1,873,539 | 0.75 | % | 7.96 | % | 0.74 | % | 57 | % | ||||||||||||
| (d) | During the period, certain fees were waived and/or reimbursed. If such waivers/reimbursements had not occurred, the ratios would have been as indicated. |
| (e) | Portfolio turnover is calculated on the basis of the Fund as a whole without distinguishing among the classes of shares. |
| (f) | Includes interest expense that amounts to less than 0.01%. |
| (g) | Formerly Class I shares. |
2015 Semi-Annual Report
53
April 30, 2015 (Unaudited)
1. Organization
Aberdeen Investment Funds (each, a “Fund” and collectively, the “Trust”) was organized as a business trust under the laws of the State of Massachusetts by a Master Trust Agreement adopted on April 30, 1992 and is registered with the U.S. Securities and Exchange Commission (“SEC”) under the Investment Company Act of 1940, as amended (the “1940 Act”) as an open-end management investment company. As of April 30, 2015, the Trust offered four diversified, open-ended investment funds: Aberdeen Select International Equity Fund (the “Select International Equity Fund”), Aberdeen Select International Equity Fund II (the “Select International Equity Fund II”), Aberdeen Total Return Bond Fund (the “Total Return Bond Fund”), and Aberdeen Global High Income Fund (the “Global High Income Fund”).
Each of the Funds offers multiple share classes. As of April 30, 2015, all of the Funds offered Class A and Institutional Class shares. The classes of shares are offered to different types of investors and have different expense structures, as outlined in the Funds’ prospectus. Each class of shares has exclusive voting rights with respect to matters that affect that class. Income, realized gains and losses, unrealized appreciation and depreciation, and expenses that are not attributable to a specific class are allocated daily to each class based on its relative net assets. Expenses directly attributable to a Fund are charged to that Fund. Other expenses are allocated to the respective Fund based on average daily net assets.
Each Fund has distinct investment objectives. Following are the objectives for the Funds:
| Fund Name | Investment Objective | |
Select International Equity Fund | Seeks long-term growth of capital. | |
Select International Equity Fund II | Seeks long-term growth of capital. | |
Total Return Bond Fund | Seeks to provide total return, which consists of two components: (1) changes in the market value of the Fund’s portfolio securities (both realized and unrealized appreciation/depreciation) and (2) income received from its portfolio securities. | |
Global High Income Fund | Seeks to maximize total return, principally through a high level of current income, and secondarily through capital appreciation. |
2. Summary of Significant Accounting Policies
The following is a summary of significant accounting policies followed by the Funds in the preparation of their financial statements. The policies conform to accounting principles generally accepted in the United States of America (GAAP). The preparation of financial statements requires management to make estimates and assumptions that affect the reported amounts of assets and liabilities, disclosure of contingent assets and liabilities at the date of the financial statements, and the reported amounts of income and expenses for the period. Actual results could differ from those estimates. The books and records of the Funds are maintained in U.S. Dollars.
| a. | Security Valuation |
The Funds value their securities at current market value or fair value consistent with the Funds’ valuation procedures “Valuation Procedures” and regulatory requirements.
Each Fund’s assets for which market quotations are readily available are valued at fair value on the basis of quotations furnished by a pricing service or provided by securities dealers. Equity investments are generally valued using the last sale price or official closing price taken from the primary market in which each security trades, or if no sales occurred during the day, at the mean of the current quoted bid and ask prices.
Foreign equity securities that are traded on foreign exchanges that close prior to the Valuation Time are valued by applying valuation factors to the last sale price or the mean price as noted above. Valuation factors are provided by an independent pricing service provider. These valuation factors are used when pricing a Fund’s portfolio holdings to estimate market movements between the time foreign markets close and the time a Fund values such foreign securities. These valuation factors are based on inputs such as depositary receipts, indices, futures, sector indices/ETFs, exchange rates, and local exchange opening and closing prices of each security. When prices with the application of valuation factors are utilized, the value assigned to the foreign securities may not be the same as quoted or published prices of the securities on their primary markets. Valuation factors are not utilized if the independent pricing service provider is unable to provide a valuation factor or if the valuation factor falls below a predetermined threshold.
Fixed income securities are generally valued using prices provided directly by independent third party services or provided directly from one or more broker dealers or market makers, each in accordance with the Valuation Procedures approved the Trust’s Board of Trustees (the “Board”). The pricing services may use valuation models or matrix pricing, which consider yield or prices with respect to comparable bond
Semi-Annual Report 2015
54
Notes to Financial Statements (continued)
April 30, 2015 (Unaudited)
quotations from bond dealers or by reference to other securities that are considered comparable in such characteristics as credit rating, interest rates and maturity date, to determine current fair value.
Assets and liabilities initially expressed in foreign currency will be converted into U.S. Dollar values. Short-term debt securities (such as commercial paper, and U.S. treasury bills) having a remaining maturity of 60 days or less are valued at the last quoted or evaluated bid price on the valuation date provided by an independent pricing service, or on the basis of amortized cost if it represents the best approximation for fair value. To the extent each Fund invests in other open-ended funds, the Fund will calculate its Net Asset Value (“NAV”) based upon the NAV of the underlying funds in which it invests. The prospectuses of these underlying funds explain the circumstances under which they will use good faith fair value pricing and the effects of such fair value pricing.
When market quotations or exchange rates are not readily available, or if the Funds’ investment adviser, Aberdeen Asset Management Inc. (the “Adviser”), concludes that such market quotations do not accurately reflect fair value, the fair value of a Fund’s assets are determined in good faith in accordance with the Valuation Procedures. For options, swaps and warrants, a fair value price may be determined using readily available market quotations, prices provided by independent pricing services, or by using modeling tools provided by industry accepted financial data service providers. Key inputs to such tools may include yield and prices from comparable or reference assets, maturity or expiration dates, ratings, and interest rates. In addition, the Adviser, through its pricing committee, may determine the fair value price in accordance with the Valuation Procedures approved by the Board.
In accordance with the authoritative guidance on fair value measurements and disclosures under GAAP, the Funds disclose the fair value of their investments using a three-level hierarchy that classifies the inputs to valuation techniques used to measure the fair value. The hierarchy assigns Level 1 measurements to valuations based upon unadjusted quoted prices in active markets for identical assets, Level 2 measurements to valuations based upon significant observable inputs, including adjusted quoted prices in active markets for identical assets, and Level 3 measurements to valuations based upon unobservable inputs that are significant to the valuation. Inputs refer broadly to the assumptions that market participants would use in pricing the asset or liability, including assumptions about risk, for example, the risk inherent in a particular valuation technique used to measure fair value including a pricing model and/or the risk inherent in the inputs to the valuation technique. Inputs may be observable or unobservable. Observable inputs are inputs that reflect the assumptions market participants would use in pricing the asset or liability, which are based on market data obtained from sources independent of the reporting entity. Unobservable inputs are inputs that reflect the reporting entity’s own assumptions about the assumptions market participants would use in pricing the asset or liability developed based on the best information available in the circumstances. A financial instrument’s level within the fair value hierarchy is based upon the lowest level of any input that is significant to the fair value measurement. The three-level hierarchy of inputs is summarized below:
| • | Level 1- quoted prices in active markets for identical investments; |
| • | Level 2- other significant observable inputs (including quoted prices for similar securities, interest rates, prepayment speeds, and credit risk); or |
| • | Level 3- significant unobservable inputs (including the Fund’s own assumptions in determining the fair value of investments). |
For movements between the Levels with the fair value hierarchy, the Funds have adopted a policy of recognizing transfers at the end of each period. As described above, certain foreign securities are valued utilizing valuation factors provided by an independent pricing service to reflect any significant market movements between the time foreign markets close and the time the Fund values such foreign securities. The utilization of valuation factors may result in transfers between Level 1 and Level 2. During the period ended April 30, 2015, Select International Equity Fund, Select International Equity Fund II and Total Return Bond Fund had no transfers between levels.
The following is a summary of significant transfers during the period ended April 30, 2015:
| Fund | Transfer from Level 1 | Transfer from Level 2 | Transfer from Level 3 | |||||||||
Global High Income Fund | $ | 5,773,557 | $ | 32,032,409 | $ | 7,687,439 | ||||||
2015 Semi-Annual Report
55
Notes to Financial Statements (continued)
April 30, 2015 (Unaudited)
The following is a summary of the inputs used as of April 30, 2015 in valuing the Funds’ investments and other financial instruments at fair value. The inputs or methodology used for valuing securities are not necessarily an indication of the risk associated with investing in those securities.
| Investments, at Value | LEVEL 1–Quoted Prices ($) | LEVEL 2–Other Significant Observable Inputs ($) | LEVEL 3–Significant Unobservable Inputs ($) | Total ($) | ||||||||||||
| Select International Equity Fund | ||||||||||||||||
| Investments in Securities | ||||||||||||||||
Common Stocks | 39,699,208 | 288,133,301 | 1,596,424 | 329,428,933 | ||||||||||||
Government Bonds | – | – | 367,825 | 367,825 | ||||||||||||
Preferred Stocks | 17,785,288 | 22,548,598 | – | 40,333,886 | ||||||||||||
Repurchase Agreement | – | 11,864,599 | – | 11,864,599 | ||||||||||||
|
|
|
|
|
|
|
| |||||||||
| 57,484,496 | 322,546,498 | 1,964,249 | 381,995,243 | |||||||||||||
|
|
|
|
|
|
|
| |||||||||
| Select International Equity Fund II | ||||||||||||||||
| Investments in Securities | ||||||||||||||||
Common Stocks | 22,232,507 | 151,057,980 | – | 173,290,487 | ||||||||||||
Preferred Stocks | 8,750,039 | 12,334,066 | – | 21,084,105 | ||||||||||||
Repurchase Agreement | – | 452,675 | – | 452,675 | ||||||||||||
|
|
|
|
|
|
|
| |||||||||
| 30,982,546 | 163,844,721 | – | 194,827,267 | |||||||||||||
|
|
|
|
|
|
|
| |||||||||
| Total Return Bond Fund | ||||||||||||||||
| Investments in Securities | ||||||||||||||||
Asset-Backed Securities | – | 134,926,221 | – | 134,926,221 | ||||||||||||
Commercial Mortgage-Backed Securities | – | 303,375,861 | – | 303,375,861 | ||||||||||||
Corporate Bonds | – | 472,445,926 | – | 472,445,926 | ||||||||||||
Municipal Bonds | – | 69,410,043 | – | 69,410,043 | ||||||||||||
Government Bonds | – | 162,784,394 | – | 162,784,394 | ||||||||||||
Government Agencies | – | 2,736,680 | – | 2,736,680 | ||||||||||||
U.S. Agencies | – | 157,425,190 | – | 157,425,190 | ||||||||||||
U.S. Treasuries | – | 148,462,694 | – | 148,462,694 | ||||||||||||
Repurchase Agreement | – | 58,382,459 | – | 58,382,459 | ||||||||||||
| Other Financial Instruments | ||||||||||||||||
| Assets | ||||||||||||||||
Forward Foreign Currency Exchange Contracts | – | 1,970,440 | – | 1,970,440 | ||||||||||||
| Liabilities | ||||||||||||||||
Futures Contracts | (266,719 | ) | – | – | (266,719 | ) | ||||||||||
Forward Foreign Currency Exchange Contracts | – | (3,998,617 | ) | – | (3,998,617 | ) | ||||||||||
|
|
|
|
|
|
|
| |||||||||
| (266,719 | ) | 1,507,921,291 | – | 1,507,654,572 | ||||||||||||
|
|
|
|
|
|
|
| |||||||||
Semi-Annual Report 2015
56
Notes to Financial Statements (continued)
April 30, 2015 (Unaudited)
| Investments, at Value | LEVEL 1–Quoted Prices ($) | LEVEL 2–Other Significant Observable Inputs ($) | LEVEL 3–Significant Unobservable Inputs ($) | Total ($) | ||||||||||||
| Global High Income Fund | ||||||||||||||||
| Investments in Securities | ||||||||||||||||
Corporate Bonds | – | 1,425,761,997 | 15,325,704 | 1,441,087,701 | ||||||||||||
Government Bonds | – | 79,696,314 | – | 79,696,314 | ||||||||||||
Government Agencies | – | 15,156,050 | – | 15,156,050 | ||||||||||||
Bank Loans | – | 200,036,936 | 101,906,502 | 301,943,438 | ||||||||||||
Common Stocks | – | – | 30,836,076 | 30,836,076 | ||||||||||||
Preferred Stocks | 11,382,218 | – | – | 11,382,218 | ||||||||||||
Repurchase Agreement | – | 60,402,103 | – | 60,402,103 | ||||||||||||
| Other Financial Instruments | ||||||||||||||||
| Assets | ||||||||||||||||
Forward Foreign Currency Exchange Contracts | – | 1,872,440 | – | 1,872,440 | ||||||||||||
Credit Default Swap Contracts | – | 2,368,230 | – | 2,368,230 | ||||||||||||
| Liabilities | ||||||||||||||||
Forward Foreign Currency Exchange Contract | – | (6,801,680 | ) | – | (6,801,680 | ) | ||||||||||
Credit Default Swap Contracts | – | (617,309 | ) | – | (617,309 | ) | ||||||||||
|
|
|
|
|
|
|
| |||||||||
| 11,382,218 | 1,777,875,081 | 148,068,282 | 1,937,325,581 | |||||||||||||
|
|
|
|
|
|
|
| |||||||||
| Amounts | listed as “–” are $0 or round to $0. |
Select International Equity Fund Rollforward of Level 3 Fair Value Measurement For the Period Ended April 30, 2015 | ||||||||||||||||||||||||||||||||||||||||
| Investments in Securities | Balance as of October 31, 2014 | Accrued Discounts (Premiums) | Realized Gain (Loss) | Change in Unrealized Appreciation (Depreciation) | Net Purchases | Net Sales | Net Transfers in to Level 3 | Net Transfers out of Level 3 | Balance as of April 30, 2015 | Change in Unrealized Appreciation (Depreciation) from Investments Held at April 30, 2015 | ||||||||||||||||||||||||||||||
COMMON STOCK | ||||||||||||||||||||||||||||||||||||||||
Bulgaria | $ | 1,780,964 | $ | – | $ | – | $ | (184,540 | ) | $ | – | $ | – | $ | – | $ | – | $ | 1,596,424 | $ | (184,540 | ) | ||||||||||||||||||
Latvia | – | – | – | – | – | – | – | – | – | – | ||||||||||||||||||||||||||||||
Serbia | – | – | – | – | – | – | – | – | – | – | ||||||||||||||||||||||||||||||
Venezuela | – | – | (11,054,568 | ) | 11,566,770 | – | (512,202 | ) | – | – | – | – | ||||||||||||||||||||||||||||
EXCHANGE TRADED FUNDS | – | – | – | – | – | – | – | – | – | – | ||||||||||||||||||||||||||||||
Russia | – | – | – | – | – | – | – | – | – | – | ||||||||||||||||||||||||||||||
GOVERNMENT BONDS | – | – | – | – | – | – | – | – | – | – | ||||||||||||||||||||||||||||||
Venezuela | 968,864 | (3,595 | ) | – | (597,444 | ) | – | – | – | – | 367,825 | (597,444 | ) | |||||||||||||||||||||||||||
TOTAL | $ | 2,749,828 | $ | (3,595 | ) | $ | (11,054,568 | ) | $ | 10,784,786 | $ | – | $ | (512,202 | ) | $ | – | $ | – | $ | 1,964,249 | $ | (781,984 | ) | ||||||||||||||||
2015 Semi-Annual Report
57
Notes to Financial Statements (continued)
April 30, 2015 (Unaudited)
Global High Income Fund Rollforward of Level 3 Fair Value Measurement For the Period Ended April 30, 2015 | ||||||||||||||||||||||||||||||||||||||||
| Investments in Securities | Balance as of October 31, 2014 | Accrued Discounts (Premiums) | Realized Gain (Loss) | Change in Unrealized Appreciation (Depreciation) | Net Purchases | Net Sales | Net Transfers in to Level 3 | Net Transfers out of Level 3 | Balance as of April 30, 2015 | Change in Unrealized Appreciation (Depreciation) from Investments Held at April 30, 2015 | ||||||||||||||||||||||||||||||
BANK LOANS | ||||||||||||||||||||||||||||||||||||||||
Ethiopia | $ | 6,754,979 | $ | – | $ | – | $ | 1,652,049 | $ | – | $ | – | $ | – | $ | – | $ | 8,407,028 | $ | 1,652,049 | ||||||||||||||||||||
Germany | – | – | – | 33,144 | 3,358,583 | – | – | – | 3,391,727 | 33,144 | ||||||||||||||||||||||||||||||
Italy | 17,323,265 | 29,979 | – | (2,463,160 | ) | – | – | – | – | 14,890,084 | (2,463,160 | ) | ||||||||||||||||||||||||||||
Spain | – | – | – | – | – | – | 18,142,439 | – | 18,142,439 | – | ||||||||||||||||||||||||||||||
United States | 72,391,303 | 99,712 | (4,595,802 | ) | 2,890,212 | – | (15,292,089 | ) | 9,269,327 | (7,687,439 | ) | 57,075,224 | 1,250,156 | |||||||||||||||||||||||||||
COMMON STOCK | ||||||||||||||||||||||||||||||||||||||||
Norway | 37,722,113 | – | – | (12,659,594 | ) | – | – | 5,773,557 | – | 30,836,076 | (12,659,594 | ) | ||||||||||||||||||||||||||||
CORPORATE BONDS | ||||||||||||||||||||||||||||||||||||||||
Canada | 16,420,744 | 15,266 | – | (1,173,681 | ) | – | – | – | – | 15,262,329 | (1,173,681 | ) | ||||||||||||||||||||||||||||
United States | – | – | – | (161 | ) | 161 | – | 63,375 | – | 63,375 | (161 | ) | ||||||||||||||||||||||||||||
TOTAL | $ | 150,612,404 | $ | 144,957 | $ | (4,595,802 | ) | $ | (11,721,191 | ) | $ | 3,358,744 | $ | (15,292,089 | ) | $ | 33,248,698 | $ | (7,687,439 | ) | $ | 148,068,282 | $ | (13,361,247 | ) | |||||||||||||||
The following is quantitative information about level 3 fair value measurements:
| Description | Fair Value at 4/30/15 ($) | Valuation Technique (s) | Unobservable Inputs | Range | Weighted Average | |||||||
Global High Income Fund | ||||||||||||
Bank Loans | $ | 101,906,501 | Broker Pricing | Bid/Ask Spread | $93.5 – 112.7 | $101.4 | ||||||
Common Stocks | 30,836,076 | Evaluated Pricing | Bid/Ask Spread | 17.6 – 25.5 | $18.6 | |||||||
Corporate Bonds | 15,325,704 | Broker Pricing | Bid/Ask Spread | 4.2 – 82.1 | $76.2 | |||||||
Evaluated Pricing: In determining the fair value of the Common Stock as of April 30, 2015, the Global High Income Fund took an average of the values calculated using the Income Approach – Discounted Cash Flow Method and the Market Approach – Guideline Public Company Method, weighted equally, to derive an evaluated price.
Income Approach: A well-established technique used to estimate the equity value of a company through an analysis of projected income, such as using the Discounted Cash Flow Method. Using this analysis, value is indicated from all of the future cash flows attributable to the subject company discounted to present value at a required rate of return. If debt free cash flows are used, any long-term debt is deducted from the indicated value of the invested capital to determine equity value.
Market Approach: References actual transactions in the equity of the enterprise being valued or transactions in similar enterprises that are traded in private and public markets. Third-party transactions in the equity of an entity generally represent the best estimate of fair value if they are completed at arm’s length. The Guideline Public Company Method involves identifying and selecting publicly traded companies with financial and operating characteristics similar to the company being valued. Once publicly traded companies are identified, valuation multiples can be derived, adjusted for comparability, and then applied to the subject company to estimate the value of its equity or invested capital. Similarly, the Comparable Transactions Method analyzes transactions involving target companies operating in industries similar to the subject company. While it is known that no two companies are exactly alike, nor are any two transactions structured identically, consideration is given to comparisons of the capital structure, operations, size, and profitability, as well as other operating characteristics of the target companies. Once comparable transactions for reasonable targets are identified, valuation multiples can be derived, adjusted for comparability, and then applied to the subject company to estimate the value of its equity or invested capital.
| b. | Repurchase Agreements |
The Funds may enter into repurchase agreements, under the terms of a Master Repurchase Agreement. It is each Fund’s policy that its custodian/counterparty segregate the underlying collateral securities, consisting of government securities, the value of which exceeds the principal amount of the repurchase transaction, including accrued interest. The repurchase price generally equals the price paid by a Fund
Semi-Annual Report 2015
58
Notes to Financial Statements (continued)
April 30, 2015 (Unaudited)
plus interest negotiated on the basis of current short-term rates. To the extent that any repurchase transaction exceeds one business day, the collateral is valued on a daily basis to determine its adequacy. If the counterparty defaults and the value of the collateral declines or if bankruptcy proceedings are commenced with respect to the counterparty of the security, realization of the collateral by the Funds may be delayed or limited. Repurchase agreements are subject to contractual netting arrangements with the counterparty, Fixed Income Clearing Corp. For additional information on individual repurchase agreements, see the Statements of Investments.
| c. | Restricted Securities |
Restricted securities are privately-placed securities whose resale is restricted under U.S. securities laws. The Funds may invest in restricted securities, including unregistered securities eligible for resale without registration pursuant to Rule 144A and privately-placed securities of U.S. and non-U.S. issuers offered outside the U.S. without registration pursuant to Regulation S under the Securities Act of 1933, as amended. Rule 144A securities may be freely traded among certain qualified institutional investors, such as the Funds, but resale of such securities in the U.S. is permitted only in limited circumstances.
| d. | Foreign Currency Translation |
Foreign currency amounts are translated into U.S. Dollars at the current rate of exchange as of 4:00 pm Eastern time (“Valuation Time”), to determine the value of investments, assets and liabilities. Purchases and sales of securities, and income and expenses are translated at the prevailing rate of exchange on the respective date of these transactions. The Funds do not isolate that portion of the results of operations resulting from changes in foreign exchange rates on investments from fluctuations arising from changes in market prices of securities held. These fluctuations are included with the net realized and unrealized gain or loss from investments and foreign currencies within the Statements of Operations.
Foreign securities, currencies, and other assets and liabilities denominated in foreign currencies are translated into U.S. Dollars at the exchange rate of said currencies against the U.S. Dollar, as of the Valuation Time, as provided by an independent pricing service.
Investments in emerging markets can be riskier and more volatile than investments in the United States and other developed markets. Adverse political and economic developments can make it more difficult for the Select International Equity Fund and Select International Equity Fund II to sell foreign securities which could reduce the NAV of the Funds. In contrast to more established markets, emerging markets may have governments that are less stable and markets that are less liquid, increasing your investment risk. At April 30, 2015, the Select International Equity Fund had 0.1% of its net assets invested in Venezuelan securities and held Venezuelan Bolivar valued at 0.0% of the Fund’s net assets. Venezuela currently imposes foreign exchange controls which prohibit the Select International Equity Fund from repatriating dividends, interest, or other income from investments or proceeds from the sale of Venezuelan securities.
| e. | Derivative Financial Instruments |
Certain Funds are authorized to use derivatives to manage currency risk, credit risk, and interest rate risk and to replicate, or use as a substitute for, physical securities. Losses may arise due to changes in the value of the contract or if the counterparty does not perform under the contract. The use of derivative instruments involves, to varying degrees, elements of market risk in excess of the amount recognized in the Statements of Assets and Liabilities.
Forward Foreign Currency Exchange Contracts
A forward foreign currency exchange contract (“forward contract”) involves an obligation to purchase and sell a specific currency at a future date, which may be any fixed number of days from the date of the contract agreed upon by the parties, at a price set at the time of the contract. Forward contracts are used to manage a Fund’s currency exposure in an efficient manner. They are used to sell unwanted currency exposure that comes with holding securities in a market, or to buy currency exposure where the exposure from holding securities is insufficient to give the desired currency exposure either in absolute terms or relative to the benchmark. The use of forward contracts allows the separation of decision-making between markets and their currencies. The forward contract is marked-to-market daily and the change in market value is recorded by a Fund as unrealized appreciation or depreciation. Forward contracts’ prices are received daily from an independent pricing provider. When the forward contract is closed, a Fund records a realized gain or loss equal to the difference between the value at the time it was opened and the value at the time it was closed. These realized and unrealized gains and losses are reported on the Statements of Operations. During the period ended April 30, 2015, the Funds used forward contracts to hedge some of the Funds’ foreign currency holdings. Managing active currency risk involves both hedging currency risk and adding currency risk in excess of underlying bond positions. A Fund may also enter into forward contracts to obtain potential appreciation of a foreign currency, which also adds currency risk.
Futures Contracts
Certain Funds may invest in financial futures contracts (“futures contracts”) for the purpose of hedging their existing portfolio securities, or securities that a Fund intends to purchase, against fluctuations in value caused by changes in prevailing market interest rates or
2015 Semi-Annual Report
59
Notes to Financial Statements (continued)
April 30, 2015 (Unaudited)
prices. Futures contracts may also be entered into for non-hedging purposes; however, in those instances, the aggregate initial margin and premiums required to establish a Fund’s positions may not exceed 5% of a Fund’s NAV after taking into account unrealized profits and unrealized losses on any such contract it has entered.
Upon entering into a futures contract, a Fund is required to pledge to the broker an amount of cash and/or other assets equal to a certain percentage of the contract amount. This payment is known as “initial margin”. Subsequent payments, known as “variation margin,” are calculated each day, depending on the daily fluctuations in the fair value/market value of the underlying assets. An unrealized gain/(loss) equal to the variation margin is recognized on a daily basis. When the contract expires or is closed, the gain/(loss) is realized and is presented in the Statements of Operations as a net realized gain/(loss) on futures contracts. Futures contracts are valued daily at their last quoted sale price on the exchange on which they are traded.
A “sale” of a futures contract means a contractual obligation to deliver the securities or foreign currency called for by the contract at a fixed price at a specified time in the future. A “purchase” of a futures contract means a contractual obligation to acquire the securities or foreign currency at a fixed price at a specified time in the future.
Should market conditions change unexpectedly, a Fund may not achieve the anticipated benefits of the futures contracts and may realize a loss. The use of futures transactions for hedging purposes involves the risk of imperfect correlation in movements in the price of futures contracts, interest rates and the value/market value of the underlying hedged assets. During the period ended April 30, 2015, U.S. Treasury futures contracts were used to manage Total Return Bond Fund’s overall curve and interest rate exposure.
Swaps
Certain Funds enter into swaps to efficiently gain or hedge interest rate or currency risk. A swap is an agreement that obligates two parties to exchange a series of cash flows at specified intervals based upon or calculated by reference to changes in specified prices or rates for a specified amount of an underlying asset or notional principal amount. A Fund will enter into swaps only on a net basis, which means that the two payment streams are netted out, with a Fund receiving or paying, as the case may be, only the net amount of the difference between the two payments. Risks may arise as a result of the failure of the counterparty to the swap contract to comply with the terms of the swap contract. The loss incurred by the failure of a counterparty is generally limited to the net interest payment to be received by a Fund, and/or the termination value at the end of the contract. Therefore, a Fund considers the creditworthiness of each counterparty to a swap contract in evaluating potential credit risk. Additionally, risks may arise from unanticipated movements in interest rates or in the value of the underlying reference asset or index. A Fund records unrealized gains/(losses) on a daily basis representing the value and the current net receivable or payable relating to open swap contracts. Net amounts received or paid on the swap contract are recorded as realized gains/(losses). Fluctuations in the value of swap contracts are recorded for financial statement purposes as unrealized appreciation or depreciation of swap contracts. Realized gains/(losses) from terminated swaps are included in net realized gains/(losses) on swap contracts transactions.
Certain Funds are a party to International Swap Dealers Association, Inc. Master Agreements (“ISDA Master Agreements”). These agreements are with select counterparties and they govern transactions, including certain over-the-counter derivative and foreign exchange contracts, entered into by certain Funds and the counterparty. The ISDA Master Agreements maintain provisions for general obligations, representations, agreements, collateral, and events of default or termination. The occurrence of a specified event of termination may give a counterparty the right to terminate all of its contracts and affect settlement of all outstanding transactions under the applicable ISDA Master Agreement. To the extent a Fund engages in transactions under these agreements, it is subject to counterparty risk, which is described with respect to swaps both above and below.
Certain swaps entered into after June 10, 2013, including some interest rate swaps and credit default swaps, must be cleared pursuant to U.S. Commodity Futures Trading Commission (“CFTC”) regulations. As a result, these swaps can no longer be traded over-the-counter and are subject to various regulations and rules of the CFTC.
Entering into swap agreements involves, to varying degrees, elements of credit and market risk in excess of the amounts recognized on the Statements of Assets and Liabilities. Such risks involve the possibility that there will be no liquid market for these agreements, that the counterparty to the agreements may default on its obligation to perform and that there may be unfavorable changes in the value of the index or securities underlying the agreement. The Funds’ maximum risk of loss from counterparty risk related to swaps is the fair value of the contract. This risk is mitigated by having a master netting agreement between the Funds and the counterparties and by the posting of collateral by the counterparties to the Funds to cover the Funds’ exposure to the counterparty. A Fund must also segregate liquid assets to “cover” its obligations under the swap.
Credit Default Swaps
A credit default swap is a credit derivative contract between two counterparties. The buyer makes periodic payments to the seller, and in return receives protection if an underlying financial instrument defaults. A Fund might use credit default swap contracts to limit or to
Semi-Annual Report 2015
60
Notes to Financial Statements (continued)
April 30, 2015 (Unaudited)
reduce risk exposure of the Fund to defaults of corporate and sovereign issuers (i.e., to reduce risk when the Fund owns or has exposure to such issuers). A Fund also might use credit default swap contracts, to create direct or synthetic short or long exposure to domestic or foreign corporate debt securities or certain sovereign debt securities to which the Fund is not otherwise exposed. As the seller in a credit default swap contract, a Fund would be required to pay the par (or other agreed-upon) value of a referenced debt obligation to the counterparty in the event of a default (or similar event) by a third party, such as a U.S. or foreign issuer, on the debt obligation. In return, a Fund would receive from the counterparty a periodic stream of payments over the term of the contract, provided that no event of default (or similar event) occurs. If no event of default (or similar event) occurs, a Fund would keep the stream of payments and would have no payment of obligations. As the seller in a credit default swap contract, a Fund effectively would add economic leverage to its portfolio because, in addition to its total net assets, a Fund would be subject to investment exposure on the notional amount of the swap. As the purchaser in a credit default swap contract, a Fund would function as the counterparty referenced in the preceding paragraph. This would involve the risk that the investment might expire worthless. It also would involve credit risk that the seller may fail to satisfy its payment obligations to a Fund in the event of a default (or similar event). As the purchaser in a credit default swap contract, a Fund’s investment would generate income only in the event of an actual default (or similar event) by the issuer of the underlying obligation. During the period ended April 30, 2015, Global High Income Fund employed CDX (a basket of credit derivatives) to hedge overall beta risk, a measure of the volatility, or systematic risk, of a security or a portfolio in comparison to the market as a whole. The Global High Income Fund also employed individual credit default swaps to hedge individual exposures as well as to initiate new long positions that are more efficient than the cash market.
Summary of Derivative Instruments
Certain Funds may use derivatives for various purposes as noted above.
| Location on the Statement of Assets and Liabilities | ||||||
| Derivative Instrument Risk Type | Asset Derivatives | Liability Derivatives | ||||
Interest Rate Risk | Unrealized appreciation on futures contracts | | Unrealized depreciation on futures contracts | | ||
| Variation margin receivable for futures contracts | | Variation margin payable for futures contracts | | |||
Foreign Exchange Risk | Unrealized appreciation on forward foreign currency exchange contracts | | Unrealized depreciation on forward foreign currency exchange contracts | | ||
Credit Risk | Unrealized appreciation on swap contracts | | Unrealized depreciation on swap contracts | | ||
The following is a summary of the fair value of Derivative Instruments, not accounted for as hedging instruments, as of April 30, 2015:
| Asset Derivatives | ||||||||||||||||
| Funds | Total Value at April 30, 2015 | Credit Default Swaps (credit risk) | Forward Foreign Exchange Contracts (Foreign Exchange Risk) | Futures Contracts (interest rate risk) | ||||||||||||
Total Return Bond Fund | $ | 1,970,440 | $ | – | $ | 1,970,440 | $ | – | ||||||||
Global High Income Fund | 4,240,670 | 2,368,230 | 1,872,440 | – | ||||||||||||
| Liabilities Derivatives | ||||||||||||||||
| Funds | Total Value at April 30, 2015 | Credit Default Swaps (credit risk) | Forward Foreign Exchange Contracts (Foreign Exchange Risk) | Futures Contracts (interest rate risk) | ||||||||||||
Total Return Bond Fund | $ | 4,265,335 | $ | – | $ | 3,998,616 | $ | 266,719 | ||||||||
Global High Income Fund | 7,418,989 | 617,309 | 6,801,680 | – | ||||||||||||
2015 Semi-Annual Report
61
Notes to Financial Statements (continued)
April 30, 2015 (Unaudited)
A reconciliation of the gross amounts on the Statements of Assets and Liabilities to the net amounts by broker and derivative type, including any collateral received or pledged, is included in the following tables:
Gross Amounts Not Offset in Statement of Assets & Liabilities | ||||||||||||||||||||||||||||||||
| Gross Amounts of Assets | Gross Amounts of Liabilities | |||||||||||||||||||||||||||||||
| Description | Financial Position | Financial Instruments | Collateral Received(1) | Net Amount(3) | Financial Position | Financial Instruments | Collateral Pledged(1) | Net Amount(3) | ||||||||||||||||||||||||
| Total Return Bond Fund | ||||||||||||||||||||||||||||||||
Forward foreign currency | ||||||||||||||||||||||||||||||||
Citibank N.A.(2) | $ | 931,612 | $ | (38,600 | ) | $ | – | $ | 893,012 | $ | 38,600 | $ | (38,600 | ) | $ | – | $ | – | ||||||||||||||
Credit Suisse International(2) | – | – | – | – | 436,954 | – | – | 436,954 | ||||||||||||||||||||||||
Deutsche Bank AG(2) | 634,903 | (634,903 | ) | – | – | 716,327 | (634,903 | ) | – | 81,424 | ||||||||||||||||||||||
JPMorgan Chase Bank N.A. | 101,971 | (101,971 | ) | – | – | 149,881 | (101,971 | ) | – | 47,910 | ||||||||||||||||||||||
Royal Bank of Canada(2) | – | – | – | – | 1,046,142 | – | – | 1,046,142 | ||||||||||||||||||||||||
Westpac Banking Corp. | 431,481 | (431,481 | ) | – | – | 1,740,237 | (431,481 | ) | – | 1,308,756 | ||||||||||||||||||||||
| 1. | In some instances, the actual collateral received and/or pledged may be more than the amount shown here due to overcollateralization. |
| 2. | Includes financial instrument (swaps and forwards ) which are not subject to master netting arrangement, or other another similar arrangement. |
| 3. | Net amounts represent the net receivable/(payable) that would be due from/to the counterparty in the event of default. Exposure from financial derivative instruments can only be netted across transactions governed under the same master agreement with the same legal entity. |
Gross Amounts Not Offset in Statement of Assets & Liabilities | ||||||||||||||||||||||||||||||||
| Gross Amounts of Assets | Gross Amounts of Liabilities | |||||||||||||||||||||||||||||||
| Description | Financial Position | Financial Instruments | Collateral Received(1) | Net Amount(3) | Financial Position | Financial Instruments | Collateral Pledged(1) | Net Amount(3) | ||||||||||||||||||||||||
| Global High Income Fund | ||||||||||||||||||||||||||||||||
Forward foreign currency | ||||||||||||||||||||||||||||||||
Deutsche Bank AG(2) | $ | – | $ | – | $ | – | $ | – | $ | 2,402,432 | $ | – | $ | – | $ | 2,402,432 | ||||||||||||||||
JPMorgan Chase Bank N.A. | 1,408,152 | (1,408,152 | ) | – | – | 4,399,248 | (1,408,152 | ) | – | 2,991,096 | ||||||||||||||||||||||
Westpac Banking Corp. | 464,288 | – | – | 464,288 | – | – | – | – | ||||||||||||||||||||||||
Credit default swaps(2) | ||||||||||||||||||||||||||||||||
Goldman Sachs | $ | – | $ | – | $ | – | $ | – | $ | 544,130 | $ | – | $ | – | $ | 544,130 | ||||||||||||||||
Credit Suisse International | – | – | – | – | 73,179 | – | – | 73,179 | ||||||||||||||||||||||||
Deutsche Bank | 512,491 | – | – | 512,491 | – | – | – | – | ||||||||||||||||||||||||
Goldman Sachs International | 931,127 | – | – | 931,127 | – | – | – | – | ||||||||||||||||||||||||
Morgan Stanley | 924,612 | – | – | 924,612 | – | – | – | – | ||||||||||||||||||||||||
| 1. | In some instances, the actual collateral received and/or pledged may be more than the amount shown here due to overcollateralization. |
| 2. | Includes financial instrument (swaps and forwards ) which are not subject to master netting arrangement, or other another similar arrangement. |
| 3. | Net amounts represent the net receivable/(payable) that would be due from/to the counterparty in the event of default. Exposure from financial derivative instruments can only be netted across transactions governed under the same master agreement with the same legal entity. |
Semi-Annual Report 2015
62
Notes to Financial Statements (continued)
April 30, 2015 (Unaudited)
The Effect of Derivative Instruments on the Statement of Operations for the six months ended April 30, 2015:
| Realized Gain or (Loss) on Derivatives Recognized in the Statement of Operations | ||||||||||||||||
| Funds | Total | Credit Default Swaps (credit risk) | Forward Foreign Exchange Contracts (Foreign Exchange Risk) | Futures Contracts (interest rate risk) | ||||||||||||
Total Return Bond Fund | $ | 15,918,937 | $ | – | $ | 16,592,556 | $ | (673,619 | ) | |||||||
Global High Income Fund | 61,206,442 | 3,880,105 | 57,326,337 | – | ||||||||||||
| Change in Unrealized Appreciation (Depreciation) on Derivatives Recognized in the Statement of Operations | ||||||||||||||||
| Funds | Total | Credit Default Swaps (credit risk) | Forward Foreign Exchange Contracts (Foreign Exchange Risk) | Futures Contracts (interest rate risk) | ||||||||||||
Total Return Bond Fund | $ | (5,373,551 | ) | $ | – | $ | (5,173,676 | ) | $ | (199,875 | ) | |||||
Global High Income Fund | (26,884,052 | ) | (5,957,463 | ) | (20,926,589 | ) | – | |||||||||
Information about derivatives reflected as of the date of this report is generally indicative of the type of activity for the six months ended April 30, 2015. The table below summarizes the weighted average values of derivatives holdings by fund during the six months ended April 30, 2015.
| Fund | Forward foreign exchange contracts (Average Notional Value) | Futures contracts (Average Notional Value) | Swap contracts (Average Notional Value) | |||||||||
Total Return Bond Fund | $ | 338,404,927 | $ | (7,688,370 | ) | $ | – | |||||
Global High Income Fund | 508,929,690 | – | 55,285,833 | |||||||||
The Funds value derivatives at fair value, as described in the results of operations. Accordingly, the Funds do not follow hedge accounting even for derivatives employed as economic hedges.
| f. | Bank Loans |
The Global High Income Fund may invest in bank loans. Bank loans include floating and fixed-rate debt obligations. Floating rate loans are debt obligations issued by companies or other entities with floating interest rates that reset periodically. Bank loans may include, but are not limited to, term loans, delayed funding loans, bridge loans and revolving credit facilities. Loan interest will primarily take the form of assignments purchased in the primary or secondary market but may include participants. Floating rate loans are secured by specific collateral of the borrower and are senior to most other securities of the borrower (e.g., common stock or debt instruments) in the event of bankruptcy. Floating rate loans are often issued in connection with recapitalizations, acquisitions, leveraged buyouts, and refinancings. Floating rate loans are typically structured and administered by a financial institution that acts as the agent of the lenders participating in the floating rate loan. Floating rate loans may be acquired directly through the agent, as an assignment from another lender who holds a direct interest in the floating rate loan, or as a participation interest in another lender’s portion of the floating rate loan.
The Global High Income Fund may enter into, or acquire participation in, delayed funding loans and revolving credit facilities. Delayed funding loans and revolving credit facilities are borrowings in which the Global High Income Fund agrees to make loans up to a maximum amount upon demand by the borrowing issuer for a specified term. A revolving credit facility differs from a delayed funding loan in that as the borrowing issuer repays the loan, an amount equal to the repayment is again made available to the borrowing issuer under the facility. The borrowing issuer may at any time borrow and repay amounts so long as, in the aggregate, at any given time the amount borrowed does not exceed the maximum amount established by the loan agreement. Delayed funding loans and revolving credit facilities usually provide for floating or variable rates of interest.
There are a number of risks associated with an investment in delayed funding loans and revolving credit facilities including credit, interest rate and liquidity risk and the risks of being a lender. There may be circumstances under which the borrowing issuer’s credit risk may be deteriorating and yet the Global High Income Fund may be obligated to make loans to the borrowing issuer as the borrowing issuer’s credit continues to deteriorate, including at a time when the borrowing issuer’s financial condition makes it unlikely that such amounts will be repaid. Delayed funding loans and revolving credit facilities may be subject to restrictions on transfer, and only limited opportunities may
2015 Semi-Annual Report
63
Notes to Financial Statements (continued)
April 30, 2015 (Unaudited)
exist to resell such instruments. As a result, the Global High Income Fund may be unable to sell such investments at an opportune time or may have to resell them at less than fair market value. These risks could cause the Global High Income Fund to lose money on its investment, which in turn could affect its returns. The Global High Income Fund currently intends to treat delayed funding loans and revolving credit facilities for which there is no readily available market as illiquid for purposes of its limitation on illiquid investments. Delayed funding loans and revolving credit facilities are considered to be debt obligations for purposes of the Trust’s investment restriction relating to the lending of funds or assets by the Global High Income Fund.
As of April 30, 2015, Global High Income Fund held three unfunded commitments with a cost and fair value of $4,158,242 and $2,111,722, respectively (par of 2,258,526 USD). The Fund also held four bridge term loans which amounted to $31,651,000 of par that remained unfunded as of April 30, 2015. There was no cost or fair value assigned to these bridge term loans.
| g. | Security Transactions, Investment Income and Expenses |
Security transactions are recorded on the trade date. Realized and unrealized gains/(losses) from security and currency transactions are calculated on the identified cost basis. Dividend income is recorded on the ex-dividend date except for certain dividends on foreign securities, which are recorded as soon as a Fund is informed after the ex-dividend date. Interest income is recorded on an accrual basis using the effective interest method. Expenses are recorded on an accrual basis. Expenses directly attributable to a Fund are charged to that Fund. Expenses not directly attributable to a Fund are allocated proportionately among all Funds of the Trust. For each of the Funds, the method for allocating income, fund level expenses, and realized and unrealized gains or losses among classes is based on the total net asset value of each class’s shares in proportion to the total net assets of the relevant Fund. Expenses specific to a class (such as Rule 12b-1 and Transfer Agent fees) are charged to that class.
| h. | Foreign Taxes |
Funds that invest in foreign securities are subject to foreign taxes that may be imposed by certain countries in which the Funds invest. The Funds generally record foreign taxes based on applicable foreign tax law. The Funds incur withholding taxes on certain foreign dividends and interest, and those taxes are accrued at the time the associated income is recorded. The Funds file withholding tax reclaims in certain jurisdictions to recover a portion of amounts previously withheld. The Funds record a reclaim receivable based on, among other things, a jurisdiction’s legal obligation to pay reclaims as well as payment history and market convention. In consideration of recent decisions rendered by European courts, the Aberdeen Select International Equity Fund and Aberdeen Select International Equity Fund II (the “International Equity Funds”) have filed for additional reclaims related to prior years in accordance with European Union law. However, consistent with US GAAP accrual requirements, the International Equity Funds have not recorded a corresponding receivable amount because there is limited historical precedent for US funds collecting reclaims of this magnitude and the total amount of the reclaims that these funds may receive in the future is uncertain. Any amounts to which the International Equity Funds may be entitled, if and when recorded, likely would result in an increase in the net asset value per share of each fund at that time. As of April 30, 2015, the total amount of reclaims filed for the International Equity Funds in the countries that may be affected by the European courts’ decisions (namely, Spain, Finland (see Note 13), France, Germany, The Netherlands, and Poland) represents approximately 6% of the net asset value per share for each of the International Equity Funds; however, the recovery of any or all of this amount and timing of recovery, if any, is uncertain.
| i. | Distributions |
Distributions from net investment income, if any, are declared and paid monthly for the Total Return Bond Fund and Global High Income Fund. Distributions from net investment income, if any, are declared and paid annually for the Select International Equity Fund and Select International Equity Fund II. The Funds will also declare and pay distributions annually from net realized gains on investment transactions and net realized foreign exchange gains, if any. Dividends and distributions to shareholders are recorded on the ex-dividend date. Additional distributions of net investment income and capital gains may be made at the discretion of the Board to avoid the application of the excise tax imposed under Section 4982 of the Internal Revenue Code of 1986, as amended (the “Code”), for certain undistributed amounts.
Dividends and distributions to shareholders are determined in accordance with federal income tax regulations, which may differ from GAAP. These differences are primarily due to differing treatments of income and gains on various investment securities held by the Funds, timing differences and differing characterization of distributions made by the Funds as a whole.
| j. | Federal Income Taxes |
Each Fund intends to continue to qualify as a “regulated investment company” by complying with the provisions available to certain investment companies, as defined in Subchapter M of the Code, and to make distributions of net investment income and net realized capital gains sufficient to relieve the Funds from all, federal income taxes. Therefore, no federal income tax provision is required.
Management of the Funds has concluded that there are no significant uncertain tax positions that would require recognition in the financial statements. Since tax authorities can examine previously filed tax returns, the Funds’ U.S. federal and state tax returns for each of the four fiscal years up to the most recent fiscal year ended October 31 are subject to such review.
Semi-Annual Report 2015
64
Notes to Financial Statements (continued)
April 30, 2015 (Unaudited)
3. Agreements and Transactions with Affiliates
| a. | Investment Adviser |
Under the Investment Advisory Agreements with the Funds, effective May 22, 2013, Aberdeen Asset Management Inc. (“Aberdeen” or the “Adviser”) manages the Funds in accordance with the policies and procedures established by the Board. Prior to May 22, 2013, the Funds were managed by Artio Global Management LLC (the “Predecessor Adviser”).
For services provided under the terms of the current Investment Advisory Agreement, each Fund pays the Adviser an annual management fee paid monthly based on that Fund’s average daily net assets according to the following schedule:
| Fund | Fee Schedule | |||||||
Select International Equity Fund | Of the first $5 billion | 0.900% | ||||||
| On the next $2.5 billion | 0.880% | |||||||
| Over $7.5 billion | 0.850% | |||||||
Select International Equity Fund II | Of the first $5 billion | 0.900% | ||||||
| On the next $2.5 billion | 0.880% | |||||||
| Over $7.5 billion | 0.850% | |||||||
Total Return Bond Fund | On all assets | 0.350% | ||||||
Global High Income Fund | Of the first $5 billion | 0.650% | ||||||
| On the next $2.5 billion | 0.630% | |||||||
| On the next $2.5 billion | 0.600% | |||||||
| Over $10 billion | 0.590% | |||||||
The Adviser has engaged the services of Aberdeen Asset Managers Limited (the “Subadviser”), an affiliate, pursuant to the subadvisory agreements. The Subadviser manages a portion of certain of the Funds’ investments and has responsibility for making all investment decisions for the portion of a Fund’s assets that it manages. Pursuant to the subadvisory agreements, the Adviser pays fees to the Subadviser. For the six months ended April 30, 2015, the Adviser paid the following amounts to the Subadviser for its services to the respective Funds:
| Fund | Amount | |||
Select International Equity Fund | 1,888,772 | |||
Select International Equity Fund II | 918,207 | |||
Certain of the Funds and Aberdeen have entered into written contracts (“Expense Limitation Agreements”) limiting operating expenses for all classes of each Fund from exceeding the amounts listed below. This contractual limitation may not be terminated without the approval of the Board until the earlier of (a) the termination of the Investment Advisory Agreement or (b) the end of February, 2016. This limit excludes certain expenses, including taxes, interest, brokerage commissions, and other expenditures which are capitalized in accordance with U.S. GAAP, and other extraordinary expenses not incurred in the ordinary course of the Fund’s business.
| Fund | Class A Limit | Institutional Class Limit | ||||||
Total Return Bond Fund | 0.69% | 0.44% | ||||||
Global High Income Fund | 1.00% | 0.75% | ||||||
The Adviser has agreed to continue to waive a portion of its management fee for each of the Funds at the annual rate of 0.005% of the respective Funds’ average daily assets. The waiver may be terminated at any time by the Board.
Aberdeen may request and receive reimbursement from a Fund of the advisory fees waived and other expenses reimbursed pursuant to the Expense Limitation Agreements at a later date not to exceed three years from the fiscal year in which the corresponding reimbursement to the Funds was made. However, no reimbursement will be made for fees waived prior to May 21, 2013 by the Predecessor Adviser.
For fees waived on or after May 22, 2013, no reimbursement will be made unless:
(i) the total annual expense ratio of the class making such reimbursement is less than the limit set forth above; and
(ii) the payment of such reimbursement is approved by the Board on a quarterly basis (the “Reimbursement Requirements”).
If the Board approves any changes in the waiver terms or limitations, reimbursements are only permitted to the extent that the terms of the Expense Limitation Agreements in effect at the time of the waiver are met at the time that reimbursement is approved. Except as provided for in the Expense Limitation Agreements, reimbursement of amounts previously waived or assumed by Aberdeen is not permitted.
2015 Semi-Annual Report
65
Notes to Financial Statements (continued)
April 30, 2015 (Unaudited)
As of April 30, 2015, to the extent the Reimbursement Requirements are met, the cumulative potential reimbursements for each Fund, based on expenses reimbursed by Aberdeen would be:
| Fund | Amount Fiscal Year 2012 (Expires 10/31/15) | Amount Fiscal Year 2013 (Expires 10/31/16) | Amount Fiscal Year 2014 (Expires 10/31/17) | Amount Six Months Ended April 30, 2015 (Expires 4/30/18) | Total* | |||||||||||||||
Select International Equity Fund | $ | – | $ | – | $ | – | $ | – | $ | – | ||||||||||
Select International Equity Fund II | – | – | – | – | – | |||||||||||||||
Total Return Bond Fund | – | 11,826 | 22,047 | 9,519 | 43,392 | |||||||||||||||
Global High Income Fund | – | – | 75,716 | 116,916 | 192,632 | |||||||||||||||
| * | Amounts reported are due to expire throughout the respective 3-year expiration period presented above. |
| Amounts | listed as “–” are $0 or round to $0. |
4. Distributor and Shareholder Services
The Funds and Aberdeen Fund Distributors, LLC (the “Distributor” or “AFD”) are parties to the current Underwriting Agreement (the “Underwriting Agreement”) whereby the Distributor acts as principal underwriter for the Funds’ shares. Prior to May 22, 2013, Quasar Distributors, LLC (“Quasar”) was the Distributor of the Funds.
The Funds have adopted a Distribution and Shareholder Services Plan (the “Plan”), pursuant to Rule 12b-1 under the 1940 Act. Under the Plan, each Fund’s Class A shares may compensate certain financial institutions, including the Distributor, for certain distribution, shareholder servicing, administrative and accounting services. The Funds’ Class A shares may expend an aggregate amount, on an annual basis, not to exceed 0.25% of the value of the average daily net assets of a Fund attributable to Class A shares. The Funds will adjust accruals accordingly for any unused or surplus balances on an annual basis. The Adviser may pay additional marketing and other distribution costs out of its profits.
Under its terms, the Funds’ Plan shall remain in effect from year to year, provided such continuance is approved annually by a vote of a majority of the Board members and a majority of those Board members who are not “interested persons” of the Funds and who have no direct or indirect financial interest in the operation of the Plan or in any agreement related to the Plan.
5. Investment Transactions
Purchases and sales of securities (excluding short-term securities) for the six months ended April 30, 2015, were as follows:
| Fund | Purchases | Sales | ||||||
Select International Equity Fund | $ | 23,580,663 | $ | 118,155,684 | ||||
Select International Equity Fund II | 11,663,085 | 37,363,348 | ||||||
Total Return Bond Fund | 676,734,499 | 520,326,903 | ||||||
Global High Income Fund | 815,701,882 | 954,397,537 | ||||||
6. Investments in Affiliated Issuers
An affiliated issuer, as defined under the Investment Company Act of 1940, as amended ( the “1940 Act”), includes, an issuer in which a Fund holds 5% or more of the issuer’s outstanding voting securities. A summary of the Funds’ investments in securities of these issuers for the period ended April 30, 2015 is set forth below:
| Affiliate | Shares Held April 30, 2015 | Purchases (Cost) | Sales (Proceeds) | Dividend Income | Fair Value April 30, 2015 | |||||||||||||||
| Aberdeen Select International Equity Fund | ||||||||||||||||||||
LEV Insurance | 4,078,860 | $ | – | $ | – | $ | – | $ | 1,596,422 | |||||||||||
Toza Markovic ad Kikinda | 78,160 | – | – | – | – | |||||||||||||||
| $ | 1,596,422 | |||||||||||||||||||
Semi-Annual Report 2015
66
Notes to Financial Statements (continued)
April 30, 2015 (Unaudited)
| Affiliate | Shares Held April 30, 2015 | Purchases (Cost) | Sales (Proceeds) | Dividend Income | Fair Value April 30, 2015 | |||||||||||||||
| Aberdeen Global High Income Fund | ||||||||||||||||||||
Deep Ocean | 1,427,968 | $ | – | $ | – | $ | – | $ | 25,062,519 | |||||||||||
7. Portfolio Investment Risks
| a. | Market Risk |
Deteriorating market conditions might cause a general weakness in the market that reduces the prices of securities in that market in which a Fund invests.
| b. | Foreign Securities Risk |
Foreign securities may be more volatile, harder to price and less liquid than U.S. securities. Foreign securities also may involve risks relating to the impact of currency exchange rate fluctuations; such risks may impact the Funds more greatly to the extent a Fund does not hedge its currency risk, or hedging techniques used by the Adviser are unsucessful.
| c. | Foreign Currency Transaction Risk |
As foreign securities are usually denominated in foreign currencies, a Fund may employ strategies intended to protect the Fund’s portfolio from adverse currency fluctuations. A Fund may also employ strategies intended to increase exposure to certain currencies. Such currency transactions involve additional risks, and a Fund’s strategies, if unsuccessful, may decrease the value of a Fund.
| d. | Mortgage-Related Securities Risk |
A Fund may invest in mortgage-related securities. Rising interest rates may cause an issuer to exercise its right to pay principal later than expected which tends to extend the duration of mortgage-related securities, making them more sensitive to changes in interest rates. As a result, in a period of rising interest rates, a Fund that holds mortgage-related securities may exhibit additional volatility. This is known as extension risk. In addition, mortgage-related securities are subject to prepayment risk. When interest rates decline, borrowers may pay off their mortgages sooner than expected. This can reduce the returns of a Fund because the Fund will have to reinvest that money at the lower prevailing interest rates.
| e. | Asset-Backed Securities Risk |
Like traditional fixed income securities, the value of asset-backed securities typically increases when interest rates fall and decreases when interest rates rise. Certain asset-backed securities may also be subject to the risk of prepayment.
| f. | Emerging Markets Risk |
A magnification of the risks that apply to foreign securities. These risks are greater for securities of companies in emerging market countries because the countries may have less stable governments, more volatile currencies and less established markets (see “Foreign Securities Risk” above).
| g. | Securities Selection Risk |
The investment team may select securities that underperform the stock market or other funds with similar investment objectives and strategies.
| h. | Mid-Cap Securities Risk |
In general, stocks of mid-cap companies may be more volatile and less liquid than larger company stocks.
| i. | Small-Cap Securities Risk |
Smaller companies are usually less stable in price, less liquid and harder to price than those of larger, more established companies. Therefore, they generally involve greater risk.
| j. | Active Trading Risk |
A Fund may engage in active and frequent trading of portfolio securities to achieve its investment objective. If a Fund does trade this way, it may incur increased costs, which can lower the actual return of the Fund.
| k. | Derivatives Risk |
Derivatives can be highly volatile and involve risks in addition to the risks of the underlying investment, index or rate. Derivatives involve special risks including correlation, counterparty, liquidity, operational, accounting and tax risks. Investing in derivatives also requires a specific skill set and may result in losses. Derivatives may be illiquid, difficult to price and leveraged so that small changes may produce disproportionate losses. Gains or losses from derivatives can be substantially greater than the derivatives’ original cost.
2015 Semi-Annual Report
67
Notes to Financial Statements (continued)
April 30, 2015 (Unaudited)
| l. | Interest Rate Risk |
A Fund’s fixed income investments are subject to interest rate risk, which generally causes the value of a fixed income portfolio to decrease when interest rates rise resulting in a decrease in the Fund’s net assets. The Fund may be subject to a greater risk of rising interest rates due to the current period of historically low rates and the effect of potential government fiscal policy initiatives and resulting market reaction to those initiatives. Interest rate fluctuations tend to have a greater impact on fixed income-securities with a greater time to maturity and/or lower coupon. In periods of market volatility, the market values of fixed income securities may be more sensitive to changes in interest rates.
| m. | Leverage Risk |
Certain transactions may give rise to a form of leverage. Such transactions may include, among others, loans of securities, and the use of when-issued, delayed delivery or forward commitment transactions. The use of derivatives may also cause leveraging risk.
| n. | Illiquid Securities Risk |
Illiquid securities are assets which may not be sold or disposed of in the ordinary course of business within seven days at approximately the price at which the Fund has valued the investment on its books and may include such securities as those not registered under U.S. securities laws or securities that cannot be sold in public transactions. An inability to sell a portfolio position can adversely affect the Fund’s value or prevent the Fund from being able to take advantage of other investment opportunities. Illiquid securities and relatively less liquid securities may also be difficult to value. Over recent years, the capacity of dealers to make markets in fixed income securities have been outpaced by the growth in the size of the fixed income markets. Liquidity risk may be magnified in a rising interest rate environment or when investor redemptions from fixed income funds may be higher than normal, due to the increased supply in the market that would result from selling activity.
| o. | Municipal Securities Risk |
A Fund may invest in municipal bonds which may be significantly affected by political and economic changes, including inflation, as well as uncertainties in the municipal market related to taxation, legislative changes, or the rights of municipal security holders. Municipal Bonds have varying levels of sensitivity to changes in interest rates. In general, the price of a Municipal Bond can fall when interest rates rise and can rise when interest rates fall. Interest rate risk is generally lower for shorter-term Municipal Bonds and higher for long term Municipal Bonds. Under certain market conditions, the Adviser may purchase Municipal Bonds that the Adviser perceives are undervalued. Undervalued Municipal Bonds are subject to the same market volatility and principal and interest rate risks described above. Lower quality Municipal Bonds involve greater risk of default or price changes due to changes in the credit quality of the issuer. The value of lower quality Municipal Bonds often fluctuates in response to political or economic developments and can decline significantly over short periods of time or during periods of general or regional economic difficulty. In the case of tax-exempt Municipal Bonds, if the Internal Revenue Service or state tax authorities determine that an issuer of a tax-exempt Municipal Bond has not complied with applicable tax requirements, interest from the security could become taxable at the federal, state and/or local level, and the security could decline significantly in value. Municipal Bonds are subject to credit or default risk. Credit risk is the risk that the issuer of a municipal security might not make interest and principal payments on the security as they become due.
| p. | Private Placements and Other Restricted Securities Risk |
Investments in private placements and other restricted securities, including Regulation S Securities and Rule 144A Securities, could have the effect of increasing a Fund’s level of illiquidity. Private placements and restricted securities may be less liquid than other investments because such securities may not always be readily sold in broad public markets and a Fund might be unable to dispose of such securities promptly or at prices reflecting their true value.
| q. | Bank Loan Risk |
There are a number of risks associated with an investment in bank loans including credit risk, interest rate risk, illiquid securities risk, and prepayment risk. There is also the possibility that the collateral securing a loan, if any, may be difficult to liquidate or be insufficient to cover the amount owed under the loan. These risks could cause a Fund to lose income or principal on a particular investment, which in turn could affect a Fund’s returns.
| r. | Credit Risk |
Fixed income securities are subject to credit risk, which is the risk that an issuer of a bond may default on its obligation to pay or repay interest and principal. In the event of an unanticipated default, a Fund would experience a reduction in its income and could expect a decline in the market value of the securities so affected.
| s. | Delayed Funding Loans and Revolving Credit Facilities Risk |
There are a number of risks associated with an investment in delayed funding loans and revolving credit facilities including credit, interest rate and liquidity risk and the risks of being a lender. There may be circumstances under which the borrowing issuer’s credit risk may be
Semi-Annual Report 2015
68
Notes to Financial Statements (continued)
April 30, 2015 (Unaudited)
deteriorating and yet a Fund may be obligated to make loans to the borrowing issuer as the borrowing issuer’s credit continues to deteriorate, including at a time when the borrowing issuer’s financial condition makes it unlikely that such amounts will be repaid. Delayed funding loans and revolving credit facilities may be subject to restrictions on transfer, and only limited opportunities may exist to resell such instruments.
| t. | High-Yield Bonds and Other Lower-Rated Securities Risk |
A Fund’s investments in high-yield bonds (commonly referred to as “junk bonds”) and other lower-rated securities will subject the Fund to substantial risk of loss. Investments in high-yield bonds are speculative and issuers of these securities are generally considered to be less financially secure and less able to repay interest and principal than issuers of investment-grade securities. Prices of high-yield bonds tend to be very volatile. These securities are less liquid than investment-grade debt securities and may be difficult to price or sell, particularly in times of negative sentiment toward high-yield securities.
| u. | Prepayment Risk |
As interest rates decline, debt issuers may repay or refinance their loans or obligations earlier than anticipated. The issuers of fixed income securities may, therefore, repay principal in advance. This forces a Fund to reinvest the proceeds from the principal prepayments at lower rates, which reduces the Fund’s income.
| v. | Impact of Large Redemptions and Purchases of Fund Shares |
Occasionally, shareholders may make large redemptions or purchases of a Fund’s shares, which may cause the Fund to have to sell securities or invest additional cash. These transactions may adversely affect the Fund’s performance and increase transaction costs. In addition, large redemption requests may exceed the cash balance of the Fund and result in credit line borrowing fees or overdraft charges to the Fund until the sale of portfolio securities to cover the redemption request settle.
| w. | Large-Cap Securities Risk |
Stocks issued by large cap companies subject the Fund to the risk that those stocks may underperform stocks issued by companies with smaller capitalizations or the market as a whole.
| x. | Credit Default Swap Risk |
Credit default swap contracts, a type of derivative instrument, involve special risks and may result in losses to the Fund. Credit default swaps may in some cases be illiquid, and they increase credit risk since the Fund has exposure to both the issuer of the referenced obligation and the counterparty to the credit default swap. Swaps may be difficult to unwind or terminate. The swap market could be disrupted or limited as a result of recent legislation, and these changes could adversely affect the Fund. Additionally, to the extent the Fund sells credit default swap contracts, the Fund effectively adds economic leverage to its portfolio because, in addition to its total net assets, the Fund is subject to investment exposure on the notional amount of the swap in the event of a default of the referenced debt obligation.
| y. | Structured Notes Risk |
Structured notes are specially-designed derivative debt instruments in which the terms may be structured by the purchaser and the issuer of the note. The amount of principal repayments and/or interest payments is based upon the movement of one or more “factors,” such as currency or interest rates. In some cases, the impact of the movements of these factors may increase or decrease through the use of multipliers or deflators. Structured notes may vary from money market quality to below investment grade. Depending on the factor used and use of multipliers or deflators, however, changes in interest rates and movement of the factor may cause significant price fluctuations or may cause particular structured notes to become illiquid.
Please read the prospectus for more detailed information regarding these and other risks.
8. Contingencies
In the normal course of business, the Funds may provide general indemnifications pursuant to certain contracts and organizational documents. The Funds’ maximum exposure under these arrangements is dependent on future claims that may be made against the Funds, and therefore, cannot be estimated; however, based on experience, the risk of loss from such claims is considered remote.
2015 Semi-Annual Report
69
Notes to Financial Statements (continued)
April 30, 2015 (Unaudited)
9. Tax Information
As of April 30, 2015, the tax cost of securities and the breakdown of unrealized appreciation/(depreciation) for each Fund were as follows:
| Tax Cost of Securities | Unrealized Appreciation | Unrealized Depreciation | Net Unrealized Appreciation (Depreciation) | |||||||||||||
Aberdeen Select International Equity Fund | $ | 445,862,630 | $ | 32,173,020 | $ | (96,040,407 | ) | $ | (63,867,387 | ) | ||||||
Aberdeen Select International Equity Fund II | 197,677,470 | 17,259,891 | (20,110,094 | ) | (2,850,203 | ) | ||||||||||
Aberdeen Total Return Bond Fund | 1,499,986,793 | 30,689,643 | (20,726,968 | ) | 9,962,675 | |||||||||||
Aberdeen Global High Income Fund | 2,002,545,889 | 54,415,042 | (116,457,031 | ) | (62,041,989 | ) | ||||||||||
The tax character of distributions paid during the fiscal year ended October 31, 2014 was as follows (total distributions paid may differ from the Statements of Changes in Net Assets because for tax purposes dividends are recognized when actually paid):
| Distributions paid from | ||||||||||||||||||||||||
| Fund | Ordinary Income | Net Long Term Capital Gains | Total Taxable Distributions | Tax Exempt Distributions | Return of Capital | Total Distributions Paid | ||||||||||||||||||
Select International Equity Fund | $ | 13,489,548 | $ | – | $ | 13,489,548 | $ | – | $ | – | $ | 13,489,548 | ||||||||||||
Select International Equity Fund II | 400,427 | – | 400,427 | – | – | 400,427 | ||||||||||||||||||
Total Return Bond Fund | 29,044,920 | – | 29,044,920 | – | – | 29,044,920 | ||||||||||||||||||
Global High Income Fund | 163,321,054 | 27,302,327 | 190,623,381 | – | – | 190,623,381 | ||||||||||||||||||
As of October 31, 2014, the components of accumulated earnings (deficit) on a tax basis were as follows:
| Fund | Undistributed Tax Exempt Income | Undistributed Ordinary Income | Undistributed Long-Term Capital Gains | Accumulated Earnings | Distributions Payable | Late Year Ordinary and Post- October Capital Loss Deferrals | Other Temporary Differences | Accumulated Capital and Other Losses** | Unrealized Appreciation/ Depreciation* | Total Accumulated Earnings (Deficit) | ||||||||||||||||||||||||||||||
Select International Equity Fund | $ | – | $ | 19,497,739 | $ | – | $ | 19,497,739 | $ | – | $ | – | $ | – | $ | (2,269,715,906 | ) | $ | (71,945,268 | ) | $ | (2,322,163,435 | ) | |||||||||||||||||
Select International Equity Fund II | – | 9,350,035 | – | 9,350,035 | – | – | (21,927 | ) | (2,713,739,819 | ) | (1,696,413 | ) | (2,706,108,124 | ) | ||||||||||||||||||||||||||
Total Return Bond Fund | – | 8,740,721 | 9,538,891 | 18,279,612 | – | – | (3,165,198 | ) | – | 15,770,610 | 30,885,024 | |||||||||||||||||||||||||||||
Global High Income Fund | – | 10,710,831 | 46,453,836 | 57,164,667 | – | – | (1,187,763 | ) | – | 12,010,096 | 67,987,000 | |||||||||||||||||||||||||||||
| * | The difference between the book-basis and tax-basis unrealized appreciation/(depreciation) is attributable primarily to passive foreign investment companies and tax deferral of losses on wash sales. |
| ** | As of October 31, 2014, for Federal income tax purposes, the following Funds have capital loss carryforwards available to offset capital gains, if any, to the extent provided by the Treasury regulations, which expire in the years set forth below: |
| Fund | Amount | Expires | ||||||
Select International Equity Fund | $ | 314,780,611 | 2016 (short-term) | |||||
Select International Equity Fund | 1,643,693,179 | 2017 (short-term) | ||||||
Select International Equity Fund | 17,599,661 | unlimited (short-term) | ||||||
Select International Equity Fund | 293,642,455 | unlimited (long-term) | ||||||
Select International Equity Fund II | 1,379,336,238 | 2016 (short-term) | ||||||
Select International Equity Fund II | 1,211,390,775 | 2017 (short-term) | ||||||
Select International Equity Fund II | 121,152,924 | 2018 (short-term) | ||||||
Select International Equity Fund II | 1,859,882 | unlimited (short-term) | ||||||
Semi-Annual Report 2015
70
Notes to Financial Statements (continued)
April 30, 2015 (Unaudited)
Under the Regulated Investment Company Modernization Act of 2010, the Funds are permitted to carry forward capital losses incurred in taxable years beginning after December 22, 2010 for an unlimited period. However, any losses incurred during those taxable years will be required to be utilized prior to the losses incurred in pre-enactment taxable years. As a result of this ordering rule, pre-enactment capital loss carryforwards may be more likely to expire unused. Additionally, post-enactment capital losses that are carried forward will retain their character as either short-term or long-term capital losses rather than being considered all short-term as under previous law.
10. Significant Shareholders
As of April 30, 2015, the following Funds had shareholders with the percentage ownership indicated, which are considered significant shareholders (holdings greater than 5.0%) for financial reporting purposes:
| Fund | Record Ownership % | Number of Account Owners | ||||
Select International Equity Fund | 62.5 | % | 2 | |||
Select International Equity Fund II | 58.9 | 3 | ||||
Total Return Bond Fund | 71.0 | 2 | ||||
Global High Income Fund | 70.8 | 6 | ||||
11. Line of Credit
Aberdeen Investment Funds (the “Borrowers”) entered into a Credit Agreement (the “Agreement”) with State Street Bank and Trust Company (the “Bank”). The Agreement provides for a revolving credit facility (the “Credit Facility”) to be utilized for temporary or emergency purposes to fund shareholder redemptions or for other short-term liquidity purposes. The amount of the Credit Facility was $100,000,000* for the period ended April 30, 2015. The Funds may draw up to their stated sublimit (subject to certain other limitations therein):
| Sublimit Amount | Average Outstanding Daily Balance | Average Weighted Interest Rate | ||||||||||
Select International Equity | $ | 100,000,000 | $ | 1,864,971 | 1.380 | % | ||||||
Select International Equity II | 100,000,000 | 1,309,942 | 1.383 | % | ||||||||
Total Return Bond Fund | 100,000,000 | – | – | |||||||||
| * | The Credit Facility was reduced from $175,000,000 to $100,000,000 on April 20, 2015. |
In addition, the Global High Income Fund entered into a separate Credit Agreement (the “Global High Income Fund Credit Agreement”) with the Bank. The Global High Income Fund Credit Agreement provides for a revolving credit facility (the “Global High Income Fund Credit Facility”) to be utilized for temporary or emergency purposes to fund shareholder redemptions or for other short-term liquidity purposes. The amount of the Global High Income Fund Credit Facility was $150,000,000** for the period ended April 30, 2015. The Global High Income Fund may draw the entire $150,000,000 (subject to certain limitations).
| Sublimit Amount | Average Outstanding Daily Balance | Average Weighted Interest Rate | ||||||||||
Global High Income Fund | $ | 150,000,000 | $ | 14,572,080 | 1.380 | % | ||||||
| ** | The Global High Income Fund Credit Facility was reduced from $250,000,000 to $150,000,000 on April 20, 2015. |
Principal on each outstanding loan made under the Agreement and the Global High Income Fund Credit Agreement shall bear the interest at a variable rate per annum equal to the higher of (a) the Federal Funds Rate as in effect on that day plus 1.25% and (b) the Overnight London Interbank Offered Rate (“LIBOR”) as in effect on that day plus 1.25%. In addition, the Borrowers shall pay to the Bank a commitment fee at the rate of 0.18% per annum on the daily unused portion of each of the Credit Facility or Global High Income Fund Credit Facility, as applicable, which is allocated among the Borrowers in such manner as is determined by the Board to be reasonable. The commitment fee was increased from 0.10% to 0.18% per annum on the daily unused portion of each of the Credit Facility or Global High Income Credit Facility on April 20, 2015.
2015 Semi-Annual Report
71
Notes to Financial Statements (concluded)
April 30, 2015 (Unaudited)
12. Recent Accounting Pronouncements
In June 2014, the Financial Accounting Standards Board issued guidance to improve the financial reporting of repurchase agreements and other similar transactions. The guidance includes expanded disclosure requirements for entities that enter into repurchase agreements and similar transactions accounted for as secured borrowings. The guidance is effective for financial statements with fiscal years beginning on or after December 15, 2014 and interim periods within those fiscal years. Management is evaluating the impact, if any, of this guidance on the Funds’ financial statement disclosures.
13. Subsequent Events
Management has evaluated the need for disclosures and/or adjustments resulting from subsequent events through the date the Financial Statements were issued. Based on this evaluation, no disclosures and/or adjustments other than those described above were required to the Financial Statements as of April 30, 2015, except as noted below.
On May 21, the Select International Equity Fund and the Select International Equity Fund II (collectively “the Funds”) received withholding tax refunds of $1,355,000 (0.35% of total net assets) and $500,000 (0.25% of total net assets), respectively, from the Finnish Tax Authority (FTA) in connection with the Funds’ filing of withholding tax reclaims for taxes that were previously paid by the Funds to the FTA. See Note 2(h) for more information.
Semi-Annual Report 2015
72
Shareholder Expense Examples (Unaudited)
As a shareholder of the Aberdeen Investment Funds you incur ongoing costs, including investment advisory fees, shareholder service fees, distribution fees and other Fund expenses. The examples below are intended to help you understand your ongoing costs (in dollars) of investing in the Funds and to compare these costs with the ongoing costs of investing in other mutual funds.
The examples assume that you had a $1,000 investment in the Class at the beginning of the reporting period, November 1, 2014 and continued to hold your shares at the end of the reporting period, April 30, 2015.
Actual Expenses
The table below provides information about actual account values and actual expenses. You may use the information together with the amount you invested, to estimate the expenses that you paid over the period. Simply divide your account value by $1,000 (for example, an $8,600 account value divided by $1,000 = 8.6), then multiply the result by the number under the heading entitled “Actual Expenses Paid During Period” for the class of a Fund that you own to estimate the expenses you paid on your account during the period.
Hypothetical Example for Comparison Purposes
The table below provides information about hypothetical account values and hypothetical expenses based on the Class’ actual expense ratio and an assumed rate of return of 5% per year before expenses, which is not the Class’ actual return. The hypothetical account values and expenses may not be used to estimate the actual ending account balance or expenses you paid for the period. You may use this information to compare the ongoing costs of investing in the Class of a Fund and other funds. To do so, compare the 5% hypothetical example with the 5% hypothetical examples that appear in the shareholder reports of the other funds.
| Beginning Account Value, November 1, 2014 | Actual Ending Account Value, April 30, 2015 | Hypothetical Ending Account Value | Actual Expenses Paid During Period* | Hypothetical Expenses Paid During Period*1 | Annualized Expense Ratio** | |||||||||||||||||||||
Aberdeen Select International Equity Fund | Class A | $ | 1,000.00 | $ | 994.80 | $ | 1,018.35 | $ | 6.43 | $ | 6.51 | 1.30% | ||||||||||||||
Institutional Class2 | 1,000.00 | 996.10 | 1,019.54 | 5.25 | 5.31 | 1.06% | ||||||||||||||||||||
Aberdeen Select International Equity Fund II | Class A | 1,000.00 | 998.80 | 1,018.00 | 6.79 | 6.85 | 1.37% | |||||||||||||||||||
Institutional Class2 | 1,000.00 | 1,000.10 | 1,019.14 | 5.65 | 5.71 | 1.14% | ||||||||||||||||||||
Aberdeen Total Return Bond Fund | Class A | 1,000.00 | 1,016.60 | 1,021.37 | 3.45 | 3.46 | 0.69% | |||||||||||||||||||
Institutional Class2 | 1,000.00 | 1,017.40 | 1,022.61 | 2.20 | 2.21 | 0.44% | ||||||||||||||||||||
Aberdeen Global High Income Fund | Class A | 1,000.00 | 999.40 | 1,019.84 | 4.96 | 5.01 | 1.00% | |||||||||||||||||||
Institutional Class2 | 1,000.00 | 999.80 | 1,021.08 | 3.72 | 3.76 | 0.75% | ||||||||||||||||||||
| * | Expenses are equal to the Fund’s annualized expense ratio multiplied by the average account value over the period multiplied by 181/365 (to reflect the one-half year period). |
| ** | The expense ratio presented represents a six-month, annualized ratio. |
| 1 | Represents the hypothetical 5% return before expenses. |
| 2 | Formerly Class I |
2015 Semi-Annual Report
73
FACTS | WHAT DO ABERDEEN INVESTMENT FUNDS DO WITH YOUR PERSONAL INFORMATION? |  | ||||||
Why? | Financial companies choose how they share your personal information. Federal law gives consumers the right to limit some but not all sharing. Federal law also requires us to tell you how we collect, share, and protect your personal information. Please read this notice carefully to understand what we do. | |||||||
What? | The types of personal information we collect and share depend on the product or service you have with us. This information can include:
· Social Security number and account balances
· Transaction history and assets
· Checking account information and wire transfer instructions |
| ||||||
How? | All financial companies need to share customers’ personal information to run their everyday business. In the section below, we list the reasons financial companies can share their customers’ personal information; the reasons Aberdeen Investment Funds choose to share; and whether you can limit this sharing. | |||||||
Reasons we can share your personal information | Do Aberdeen Investment Funds share? | | Can you limit this sharing? | | ||||
For our everyday business purposes— such as to process your transactions, maintain your account(s), respond to court orders and legal investigations, or report to credit bureaus | Yes | No | ||||||
For our marketing purposes— to offer our products and services to you | Yes | Yes | ||||||
For joint marketing with other financial companies | No | We don’t share | ||||||
For our affiliates’ everyday business purposes— information about your transactions and experiences | Yes | No | ||||||
For our affiliates’ everyday business purposes— information about your creditworthiness | No | We don’t share | ||||||
For our affiliates to market to you | No | We don’t share | ||||||
For nonaffiliates to market to you | No | We don’t share | ||||||
To limit our sharing | · Call 1-800-522-5465
Please note:
If you are a new customer, we can begin sharing your information 30 days from the date we sent this notice. When you are no longer our customer, we continue to share your information as described in this notice.
However, you can contact us at any time to limit our sharing. |
| ||||||
Questions? | www.aberdeen-asset.us | |||||||
| Page 2 |
Who we are | ||
Who is providing this notice? | Aberdeen’s North American Funds (collectively referred to as “Aberdeen Investment Funds”) | |
What we do | ||
| How do Aberdeen Investment Funds protect my personal information? | To protect your personal information from unauthorized access and use, we use security measures that comply with federal law. These measures include computer safeguards and secured files and buildings. | |
| How do Aberdeen Investment Funds collect my personal information? | We collect your personal information, for example, when you:
· Open an account or give us your contact information
· Provide account information or make wire transfers
· Make deposits or withdrawals from your account | |
Why can’t I limit all sharing? | Federal law gives you the right to limit only:
· Sharing for affiliates’ everyday business purposes—information about your creditworthiness
· Affiliates from using your information to market to you
· Sharing for nonaffiliates to market to you
State laws and individual companies may give you additional rights to limit sharing. | |
What happens when I limit sharing for an account I hold jointly with someone else? | Your choices will apply to everyone on your account. | |
Definitions | ||
Affiliates | Companies related by common ownership or control. They can be financial and nonfinancial companies.
· Our affiliates include companies with an Aberdeen Asset Management name and wholly-owned subsidiaries of Aberdeen Asset Management PLC, a global financial services company. | |
Nonaffiliates | Companies not related by common ownership or control. They can be financial and nonfinancial companies.
· Aberdeen Investment Funds do not share personal information with nonaffiliates so they can market to you. | |
Joint marketing | A formal agreement between nonaffiliated financial companies that together market financial products or services to you.
· Aberdeen Investment Funds don’t jointly market. | |
Other important information | ||
| This Privacy Notice is being provided by Aberdeen Funds and Aberdeen Investment Funds, each a U.S.-registered open-end investment company, and North-American-registered closed-end investment companies managed by Aberdeen Asset Management Inc. or its affiliates. | ||
Management Information
Trustees
Antoine Bernheim, Chairman
Thomas Gibbons
Cynthia Hostetler
Robert S. Matthews
Andrew Smith
Peter Wolfram
Officers
Bev Hendry, President and Chief Executive Officer
Jeffrey Cotton, Chief Compliance Officer, Vice President and Anti-Money Laundering and Identity Theft Officer
Sofia Rosala, Deputy Chief Compliance Officer and Vice President
Andrea Melia, Treasurer and Chief Financial Officer
Brian Link, Secretary
Megan Kennedy, Assistant Secretary and Vice President
Lucia Sitar, Chief Legal Officer and Vice President
Alan Goodson, Vice President
Stephen Docherty, Vice President
Greg Hopper, Vice President
Jennifer Nichols, Vice President
Donald Quigley, Vice President
Andrew Smith, Vice President
Hugh Young, Vice President
Pamela Wade, Assistant Secretary
Brian O’Neill, Assistant Treasurer
Investment Manager
Aberdeen Asset Management Inc.
1735 Market Street, 32nd Floor
Philadelphia, PA 19103
Transfer Agent
Boston Financial Data Services, Inc.
30 Dan Road
Canton, MA 02021
Distributor
Aberdeen Fund Distributors LLC
1735 Market Street, 32nd Floor
Philadelphia, PA 19103
Fund Administrator, Custodian & Fund Accountant
State Street Bank and Trust Company
1 Iron Street 5th Floor
Boston, MA 02210
Independent Registered Public Accounting Firm
KPMG LLP
1601 Market Street
Philadelphia, PA 19103
Fund Counsel
Morrison & Foerster LLP
250 West 55th Street
New York, NY 10019-9601
Aberdeen Asset Management Inc. 1735 Market Street, 32nd Floor Philadelphia, PA 19103 aberdeen-asset.us | |
AOE-0377-SAR
Item 2. Code of Ethics.
Not applicable – for annual reports only.
Item 3. Audit Committee Financial Expert.
Not applicable – for annual reports only.
Item 4. Principal Accountant Fees and Services.
Not applicable – for annual reports only.
Item 5. Audit Committee of Listed Registrants.
Not applicable – for annual reports only.
Item 6. Schedule of Investments
| (a) | Schedule of Investments in securities of unaffiliated issuers as of close of the reporting period is included as part of the Reports to Shareholders filed under Item 1 of this Form N-CSR. |
| (b) | Not applicable. |
Item 7. Disclosure of Proxy Voting Policies and Procedures for Closed-End Management Investment Companies.
Not applicable.
Item 8. Portfolio Managers of Closed-end Management Investment Companies.
Not applicable.
Item 9. Purchases of Equity Securities by Closed-End Management Investment Company and Affiliated Purchasers.
Not applicable.
Item 10. Submission of Matters to a Vote of Security Holders.
During the period ended April 30, 2015, there were no material changes to the procedures by which shareholders may recommend nominees to the registrant’s Board of Trustees.
Item 11. Controls and Procedures.
(a) The registrant’s principal executive and principal financial officers, or persons performing similar functions, have concluded that the registrant’s disclosure controls and procedures (as defined in Rule 30a-3(c) under the Investment Company Act of 1940 (the “Act”) (17 CFR 270.30a-3(c))) are effective, as of a date within 90 days of the filing date of the report that includes the disclosure required by this paragraph, based on the evaluation of these controls and procedures required by Rule 30a-3(b) under the Act (17 CFR 270.30a3(b)) and Rule 13a-15(b) or 15d-15(b) under the Securities Exchange Act of 1934 (17 CFR 240.13a-15(b) or 240.15d15(b)).
(b) There were no changes in the registrant’s internal control over financial reporting (as defined in Rule 30a-3(d) under the Act (17 CFR 270.30a-3(d)) that occurred during the second fiscal quarter of the period covered by this report that has materially affected, or is reasonably likely to materially affect, the registrant’s internal control over financial reporting.
Item 12. Exhibits.
(a)(1) Not applicable.
(a)(2) Certifications pursuant to Rule 30a-2(a) under the Act and Section 302 of the Sarbanes-Oxley Act of 2002 are attached hereto.
(a)(3) Not applicable.
(b) Certifications pursuant to Rule 30a-2(b) under the Act and Section 906 of the Sarbanes-Oxley Act of 2002 are attached hereto.
SIGNATURES
Pursuant to the requirements of the Securities Exchange Act of 1934 and the Investment Company Act of 1940, the registrant has duly caused this report to be signed on its behalf by the undersigned, thereunto duly authorized.
| Aberdeen Investment Funds | ||
| By: | /s/ Bev Hendry | |
| Bev Hendry | ||
Principal Executive Officer of Aberdeen Investment Funds | ||
Date: July 2, 2015
Pursuant to the requirements of the Securities Exchange Act of 1934 and the Investment Company Act of 1940, this report has been signed below by the following persons on behalf of the registrant and in the capacities and on the dates indicated.
| By: | /s/ Bev Hendry | |
| Bev Hendry | ||
Principal Executive Officer of Aberdeen Investment Funds | ||
Date: July 2, 2015
| By: | /s/ Andrea Melia | |
| Andrea Melia | ||
Principal Financial Officer of Aberdeen Investment Funds | ||
Date: July 2, 2015