UNITED STATES
SECURITIES AND EXCHANGE COMMISSION
Washington, D.C. 20549
FORM N-CSR
CERTIFIED SHAREHOLDER REPORT OF REGISTERED
MANAGEMENT INVESTMENT COMPANIES
Investment Company Act file number: | 811-06652 | |
Exact name of registrant as specified in charter: | Aberdeen Investment Funds | |
Address of principal executive offices: | 1735 Market Street, 32nd Floor Philadelphia, PA 19103 | |
Name and address of agent for service: | Ms. Andrea Melia Aberdeen Asset Management Inc. 1735 Market Street, 32nd Floor Philadelphia, PA 19103 | |
Registrant’s telephone number, including area code: | 866-667-9231 | |
Date of fiscal year end: | October 31 | |
Date of reporting period: | April 30, 2016 | |
Item 1. Reports to Shareholders.

Aberdeen Investment Funds
Semi-Annual Report
April 30, 2016
Aberdeen Select International Equity Fund
Aberdeen Select International Equity Fund II
Aberdeen Total Return Bond Fund
Aberdeen Global High Income Fund

| Page 1 | ||||
| Page 2 | ||||
| Page 8 | ||||
| Page 14 | ||||
| Page 26 | ||||
| Page 37 | ||||
| Page 52 | ||||
| Page 72 | ||||
Investors should carefully consider a fund’s investment objectives, risks, fees, and expenses before investing any money. To obtain this and other fund information, please call 866-667-9231 to request a prospectus, or download a prospectus at www.aberdeen-asset.us. Please read it carefully before investing any money.
Investing in mutual funds involves risk, including possible loss of principal.
Aberdeen Select International Equity Fund, Aberdeen Select International Equity Fund II, Aberdeen Total Return Bond Fund, and Aberdeen Global High Income Fund, (each a “Fund” and collectively the “Funds”) are distributed by Aberdeen Fund Distributors, LLC, Member FINRA, 1735 Market Street, 32nd Floor, Philadelphia, PA 19103.
Aberdeen Asset Management Inc. (AAMI) has been registered as an investment adviser under the Investment Advisers Act of 1940 since August 23,1995. Registration with the Securities and Exchange Commission does not imply any certain level of skill or training.
Statement Regarding Availability of Quarterly Portfolio Schedule.
The complete schedule of portfolio holdings for the Funds is included in the Funds’ semi-annual and annual reports to shareholders. The Funds file complete schedules of portfolio holdings for each Fund with the Securities and Exchange Commission (the “SEC”) for the first and third quarters of each fiscal year on Form N-Q. The Funds’ Forms N-Q are available on the SEC’s website at http://www.sec.gov. The Funds’ Forms N-Q may be reviewed and copied at the SEC’s Public Reference Room in Washington, DC, and information on the operation of the Public Reference Room may be obtained by calling 800-SEC-0330. The Funds make their most recent Forms N-Q available to shareholders on www.aberdeen-asset.us or upon request without charge.
Statement Regarding Availability of Proxy Voting Record.
Information regarding the policies and procedures that the Funds use to determine how to vote proxies relating to portfolio securities is available without charge, upon request, by calling 866-667-9231. The information is also included in the Funds’ Statement of Additional Information, which is available on the Funds’ website at www.aberdeen-asset.us and on the SEC’s website at www.sec.gov.
Information relating to how each Fund voted proxies relating to portfolio securities held during the most recent twelve months ended June 30 is available by August 30 of the relevant year: (i) upon request and without charge by calling 866-667-9231; and (ii) on the SEC’s website at www.sec.gov.
The performance of the global financial markets varied during the six-month period ended April 30, 2016. There were disparate returns among some of the various regional market indices—even within asset classes. There were several periods of volatility, attributable partly to investors’ concerns regarding the direction of U.S. Federal Reserve (Fed) monetary policy, economic growth in China and the ongoing slump in global oil and commodity prices. However, global equities rallied towards the end of the reporting period amid an upturn in the oil and commodity markets, more clarity on U.S. monetary policy, as well as the European Central Bank’s (ECB’s) introduction of fresh economic stimulus measures.
The Morgan Stanley Capital International (MSCI) World Index, a global equity market benchmark, returned -0.7% for the reporting period. Large-cap U.S. stocks finished in positive territory and outperformed their developed-market peers in Europe and Asia. The U.S. broader-market S&P 500 Index rose 0.4%, versus the -3.9% and -1.3% returns of the FTSE Europe Index and the MSCI All Country (AC) Asia-Pacific Index, respectively, for the period. Emerging markets stocks, as represented by the MSCI Emerging Markets Index, posted a virtually flat return for the period. The strong rebound in commodity prices propelled the S&P Global Natural Resources Index to a gain of 11.3%, with particular strength in the previously beaten-down metals and mining sector.
The U.S. equity market provided mixed performance over the reporting period, with shares of mid- and large-cap companies finishing modestly higher. Small-cap stocks produced negative returns, as their strong performance in March and April 2016 could not offset steep losses earlier in the reporting period. U.S. employment and personal income data were generally upbeat during the period; however, there was a notable slowdown in economic growth despite an increase in consumer spending. On the corporate earnings front, we believe that the persistently low interest rate environment and revised market expectations that the Fed may proceed more cautiously with future rate increases may lead banks to moderate their expectations for earnings later in 2016. In contrast, energy and industrial companies reported first-quarter 2016 results that may signal that their businesses are stabilizing—perhaps even improving in some cases.
Shares of European companies were the weakest global equity performers over the reporting period. In addition to investors’ concerns about global growth and declining oil prices, these stocks were exposed to several negative catalysts unique to the market—most notably the UK’s referendum on European Union (EU) membership and lingering geopolitical worries resulting from the terror attacks in Paris and Brussels. However, equity prices gained ground late in the period, as the ECB’s aggressive monetary easing, including a reduction in its deposit rate to -0.4%, buoyed investor sentiment. The uncertainty surrounding the EU membership referendum and relatively sluggish economic data hindered the performance of UK stocks, which ended the reporting period with a virtually flat return, as measured by the FTSE All Share Index.
Similar to many of their global market peers, Asian equities partially counterbalanced losses earlier in the reporting period with a turnaround in March and April 2016 on investors’ optimism regarding rising oil and commodity prices and global central bank monetary policy. The Bank of Japan’s surprise move to impose negative interest rates also had a positive impact. Market sentiment in India initially waned after the government failed to implement two key reforms—one on land acquisition and the other, a nationwide goods-and-services tax. However, losses subsequently were trimmed after the release of the latest budget, as the government appeared to stay on course with fiscal consolidation and increased its efforts to boost the rural economy. The upturn in commodity prices in the second half of the reporting period also improved the outlook for oil-exporting nations such as Malaysia and helped their market benchmark indices to stage a recovery. The Singapore stock market’s rebound was attributable in part to better-than-expected operating results in the banking sector. Although domestic lenders reported higher loan loss provisions, they made significant efforts to disclose details of their exposure to both China and the commodities market.
Although the MSCI Emerging Markets Index was basically unchanged during the reporting period, this was not indicative of the substantial dichotomy in performance among individual emerging market countries. Weakness in China and India offset notable strength in Brazil and Turkey. A sharp sell-off in Chinese stocks in response to slowing growth and the government’s devaluation of the yuan against the U.S. dollar, along with the continued decline in oil prices, initially triggered bouts of investor risk aversion. However, markets reversed direction and moved higher in the latter half of the reporting period. People’s Bank of China Governor Zhou Xiaochuan subsequently downplayed the continued depreciation of the yuan and refuted speculation of tighter capital controls. Other contributors to the rally included a rebound in commodity prices, as well as the Brazilian Senate’s much-anticipated vote to impeach troubled President Dilma Rousseff amid accusations of fiscal mismanagement and her alleged ties to the ongoing scandal at state-owned oil company Petrobras.
Global fixed-income securities significantly outperformed their equity counterparts in an environment of generally low investor risk appetite over the reporting period. Investment-grade bonds, as measured by the Barclays Global Aggregate Bond Index, gained 6.1%. Although investors questioned the effectiveness of negative interest rates imposed by the central banks in Europe and Japan, they appeared to be encouraged that monetary policy generally remained loose, as Asian central banks continued to reduce interest rates and the Fed adopted a more dovish monetary policy stance. The performance of global high-yield securities lagged that of investment-grade credits over the period, as the asset class has greater exposure to the volatility of commodity prices. The Bank of America Merrill Lynch Global High Yield Constrained Index returned 2.9%, led by emerging markets debt.
Outlook
During the six-month reporting period, we saw significant volatility and strong rallies in certain regions and sectors which do not necessarily reflect a corresponding positive change in fundamentals. We remain mindful of slowing global growth and uncertainty over monetary policymakers’ next steps, particularly in the U.S., where dollar strength weighs on corporate profitability. The risk of acceleration in China’s slowdown, or of a poor policy response to prevent it, also seems critical, in our view. In such an unstable environment, we advocate caution in setting expectations for corporate earnings, but we believe that we are also poised to take advantage of opportunities that market uncertainty creates.
We anticipate that global equities may remain volatile in the near term. Specifically, we believe that investors may return to a more cautious mood, given the highly anticipated Fed meeting in June, followed by the referendum on EU membership in the UK. Many unknowns remain, in our view: investors are wary of the effectiveness of central bank action; governments need to implement more proactive reforms; and there does not appear to be a sustained demand for commodities. We believe that all of these factors raise the specter of a protracted slump in the global financial markets. Notwithstanding the unpredictable climate, we maintain confidence in our equity investment process of bottom-up, fundamental research, choosing stocks of companies that we believe are well-managed market-leaders with efficient operations.
Hugh Young
Managing Director
Aberdeen Asset Management
Indexes are unmanaged and have been provided for comparison purposes only. No fees or expenses are reflected. You cannot invest directly in an index.
2016 Semi-Annual Report
1
Aberdeen Select International Equity Fund (Unaudited)
Aberdeen Select International Equity Fund (Institutional Class shares net of fees) returned -1.76% for the six-month period ended April 30, 2016, versus -1.51% for its benchmark, the MSCI All Country (AC) World ex USA Index, during the same period. For broader comparison, the average return of the Fund’s peer category of International Multi-Cap Growth Funds (comprising 134 funds), as measured by Lipper, Inc., was -2.57% for the period.
International equities fell during the six-month period ended April 30, 2016. Markets initially faced intense volatility, brought on partly by uncertainty over the timing of monetary policy normalization in the U.S. The Federal Reserve (Fed) finally raised its benchmark interest rate by 25 basis points in December 2015, amid a more upbeat U.S. employment outlook. Markets were also spooked by China’s monetary policy gaffes, yuan volatility and a stuttering economy, which triggered a sell-off in A-shares. This coincided with a low point in the ongoing rout in commodity prices that saw oil tumble to under US$30 a barrel in early February 2016. Investor sentiment picked up dramatically soon thereafter. Central banks in Japan and parts of Europe unexpectedly imposed negative interest rates in a bid to combat low inflation and boost consumer spending, while the European Central Bank introduced a bolder-than-expected package of fresh stimulus. The Fed lowered expectations for the number of rate hikes for the remainder of the 2016 calendar year amid growing caution over the fragile global recovery and deflationary pressures. The change in tone resulted in U.S. dollar weakness, which provided relief to commodities and commodity-related emerging markets such as Brazil.
The Fund’s holding in Japan Tobacco was a key contributor to Fund performance for the reporting period. The company’s shares rose on news that it was seeking government approval to raise cigarette prices, which could boost operating profits. This was the first time since its 1985 initial public offering (IPO) that the company hiked prices when the tax laws had not changed. Shares of Banco Bradesco moved higher on increasing optimism about Brazilian President Dilma Rousseff’s impeachment and a regime change, which may potentially spur reforms to improve the ailing economy. The Brazilian Senate subsequently voted to impeach Rousseff and suspended her from the presidency on May 12, 2016, amid accusations that she lied about the country’s fiscal condition. Furthermore, Banco Bradesco’s operating results over the period were boosted by higher interest income and improved efficiency. While we believe that the company maintains good asset quality, bad-debt provisions have increased on the back of worsening loan delinquencies. Taiwan Semiconductor Manufacturing Co.’s fourth-quarter 2015 results reached the higher end of management’s forecast, supported by robust demand in the communications and computing sectors. The company expects revenue growth of 5% to 10% for 2016 and higher profits, driven by growing demand and foreign-exchange gains.*
Conversely, the Fund’s position in Standard Chartered detracted from performance for the reporting period as the lender continued to be weighed down by higher loan loss provisions, a slowing Chinese economy and global economic growth concerns. This was compounded by the uncertainty created by the Bank of Japan’s imposition of negative interest rates. Despite these uncertainties, the lender has continued to strengthen its capital position by reducing exposure to riskier assets and streamlining its balance sheet, supported by focused, competent and professional management, in our opinion. The position in Swiss drug-maker Novartis lagged the overall market along with the wider healthcare sector. Its share price also was hamstrung by the company’s weaker-than-expected results in February 2016, particularly with regard to its eye-care division. We remain comfortable with its business prospects and have been selectively adding to the position on recent share price weakness. Finally, the Fund’s holding in Samsung Electronics hindered performance as shares of the Korean consumer electronics manufacturer underperformed the overall market despite the company reporting generally better-than-expected first-quarter 2016 operating profits.
During the reporting period, we initiated a position in Australian biotechnology company CSL, which holds a solid market position in its core plasma business; UK satellite telecommunications company Inmarsat, which benefits from high barriers to entry and a pool of loyal customers, in our opinion; MTR Corporation, which in our view has robust city-rail operations in Hong Kong and China, with a strong business model that also allows it to develop property; consumer products maker L’Oreal, which generates relatively stable returns and free cash-flows; restaurant, coffee shop and budget hotel group Whitbread, as we are impressed by its competitive positions and brands in its key UK markets; German pharmaceutical company Bayer, which has healthy returns on investment and holds steady margins; Hong Kong exchange-listed luggage-maker Samsonite, as we feel that it has strong brands, a solid balance sheet and a management team with a good track record of execution; Kasikornbank, a leading Thai commercial lender; diversified Philippines property business Ayala Land, which has residential developments and recurring income from office and mall rentals, as well as from hotels and resorts; and Japan’s Keyence, a market leader that taps into growing demand for factory automation.
Conversely, we exited positions in Swedish telecom Ericsson, French natural gas and electricity supplier Engie, French energy management company Schneider Electric, and Zurich Insurance, to fund what we believed were better opportunities elsewhere. We also sold the Fund’s shares in financial services company Nordea, as we feel that its growth potential seems limited; Brazilian miner Vale due to our concerns about market imbalances between supply and demand; HSBC, given our worries about the continuing drag on the company’s performance from regulatory and compliance requirements; and French retailer Casino Guichard after it divested its Thai business, which we regarded as one of the attractive growth drivers of the company.
We expect global equities to remain volatile in the near term. Despite recent relief rallies, there has been no extended market turnaround, as economic fundamentals have not changed substantially. Many unknowns remain—investors are wary of the effectiveness of central bank action, governments need to implement more proactive reforms, and there does not appear to be a sustained demand for commodities. We think that all of these factors raise the specter of a protracted global slump. Many of the companies that the Fund holds
Semi-Annual Report 2016
2
Aberdeen Select International Equity Fund (Unaudited)
are taking the opportunity to strengthen their balance sheets. Notwithstanding the unpredictable climate, we maintain our confidence in our investment process, picking stocks that we believe are well-managed market leaders with efficient operations. We take advantage of market turbulence to add to these high-quality holdings, which we feel can bolster the Fund’s performance.
| * | Forecasts and estimates are offered as opinion and are not reflective of potential performance, are not guaranteed and actual events or results may differ materially. |
Portfolio Management:
Aberdeen Global Equity Team
PAST PERFORMANCE DOES NOT GUARANTEE FUTURE RESULTS.
The performance quoted represents past performance, which does not guarantee future results. Class A shares have up to a 0.25% 12b-1 fee. The investment return and principal value of an investment will fluctuate so that an investor’s shares, when redeemed, may be worth more or less than their original cost. Current performance of the Fund may be lower or higher than the performance quoted. Performance data current to the most recent month-end may be obtained by calling 866-667-9231 or visiting www.aberdeen-asset.us.
Investing in mutual funds involves risk, including the possible loss of principal. There is no assurance that the investment objective of any fund will be achieved. Indexes are unmanaged and have been provided for comparison purposes only. No fees or expenses are reflected. You cannot invest directly in an index.
Lipper is a leading global provider of mutual fund information and analysis to fund companies, financial intermediaries and media organizations.
Risk Considerations
Foreign securities may be more volatile, harder to price and less liquid than U.S. securities. They are subject to different accounting and regulatory standards and currency exchange rate, political and economic risks. Fluctuation in currency exchange rates may impact a Fund’s returns more greatly to the extent a Fund does not hedge currency exposure or hedging techniques are unsuccessful. The foregoing risks are enhanced in emerging market countries.
Equity stocks of small and mid-cap companies carry greater risk and more volatility than equity stocks of larger, more established companies.
Stocks issued by large cap companies subject the Fund to the risk that those stocks may underperform stocks issued by companies with smaller capitalizations or the market as a whole.
Investing a significant portion of the Fund’s assets in securities of companies conducting business in a broadly related group of industries within an economic sector may make the Fund more vulnerable to unfavorable developments in that sector.
Please read the prospectus for more detailed information regarding these and other risks.
Semi-Annual Report 2016
3
Aberdeen Select International Equity Fund (Unaudited)
Average Annual Total Return (For periods ended April 30, 2016) | Six Month† | 1 Yr. | 5 Yr. | 10 Yr. | ||||||||||
Class A | (1.96%)* | (15.89% | ) | (4.86% | ) | (2.06% | ) | |||||||
Institutional Class | (1.76%) | (15.61% | ) | (4.61% | ) | (1.81% | ) | |||||||
| † | Not Annualized |
| * | The Fund’s total return for the six-month period ended April 30, 2016 is based on the published NAV. |
2016 Semi-Annual Report
4
Aberdeen Select International Equity Fund (Unaudited)
Performance of a $10,000 Investment (as of April 30, 2016)
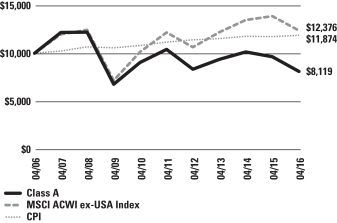
Comparative performance of $10,000 invested in Class A shares of the Aberdeen Select International Equity Fund, Morgan Stanley Capital International All Country World ex-USA Index (MSCI ACWI ex-USA Index), and the Consumer Price Index (CPI) over a 10-year period ended April 30, 2016. Unlike the Fund’s returns, the returns for these unmanaged indexes do not reflect any fees or expenses. Investors cannot invest directly in market indexes.
The MSCI ACWI ex-USA Index captures large and mid cap representation across 22 of 23 Developed Markets (DM) countries (excluding the United States (U.S.) and 23 Emerging Markets (EM) countries). DM countries include: Australia, Austria, Belgium, Canada, Denmark, Finland, France, Germany, Hong Kong, Ireland, Israel, Italy, Japan, Netherlands, New Zealand, Norway, Portugal, Singapore, Spain, Sweden, Switzerland and the UK. EM countries include: Brazil, Chile, China, Columbia, Czech Republic, Egypt, Greece, Hungary, India, Indonesia, Korea, Malaysia, Mexico, Peru, Philippines, Poland, Russia, Qatar, South Africa, Taiwan, Thailand, Turkey and United Arab Emirates. With 1,855 constituents, the index covers approximately 85% of the global equity opportunity set outside the U.S.
The CPI is a measure of the average change over time in the prices paid by urban consumers for a market basket of consumer goods and services.
Investment return and principal value will fluctuate, and when redeemed, shares may be worth more or less than original cost. Past performance is no guarantee of future results. The Average Annual Total Return table and performance graph do not reflect the deduction of taxes that a shareholder would pay on Fund distributions or the redemption of Fund shares. Investing in mutual funds involves market risk, including loss of principal. Performance returns assume the reinvestment of all distributions. Performance returns reflect fee waivers and reimbursements in effect without which returns would have been lower.
Portfolio Summary (as a percentage of net assets)
April 30, 2016 (Unaudited)
| Asset Allocation | ||||
Common Stocks | 90.6% | |||
Preferred Stocks | 7.7% | |||
Repurchase Agreement | 1.7% | |||
Exchange Traded Funds | —% | 1 | ||
Government Bonds | —% | 1 | ||
Liabilities in excess of other assets | —% | |||
| 100.0% | ||||
| 1 | Represents a security that is fair valued at zero pursuant to procedures approved by the Fund’s Board of Trustees. See Note 2(a) of the accompanying Notes to Financial Statements. |
Amounts listed as “–” are 0% or round to 0%
The following table summarizes the composition of the Fund’s portfolio, in Standard & Poor’s Global Industry Classification Standard (GICS) sectors, expressed as a percentage of net assets. The GICS structure consists of 10 sectors, 24 industry groups, 67 industries and 156 sub-industries. As of April 30, 2016, the Fund did not have more than 25% of its assets invested in any industry group.
| Top Sectors | ||||
Consumer Staples | 17.2% | |||
Financials | 16.8% | |||
Industrials | 13.9% | |||
Health Care | 12.4% | |||
Information Technology | 11.1% | |||
Telecommunication Services | 10.4% | |||
Energy | 6.7% | |||
Materials | 6.6% | |||
Consumer Discretionary | 3.2% | |||
Other | 1.7% | |||
| 100.0% | ||||
| Top Holdings* | ||||
Novartis AG | 4.1% | |||
Roche Holding AG | 3.9% | |||
Samsung Electronics Co. Ltd., Preferred Shares | 3.9% | |||
Japan Tobacco, Inc. | 3.8% | |||
Taiwan Semiconductor Manufacturing Co. Ltd. | 3.8% | |||
Nestle SA | 3.7% | |||
British American Tobacco PLC | 3.6% | |||
AIA Group Ltd. | 3.3% | |||
Royal Dutch Shell PLC, B Shares | 3.3% | |||
Singapore Telecommunications Ltd. | 2.6% | |||
Other | 64.0% | |||
| 100.0% | ||||
| * | For the purpose of listing top holdings, repurchase agreements are included as part of Other. |
| Top Countries | ||||
United Kingdom | 24.5% | |||
Switzerland | 11.7% | |||
Japan | 10.7% | |||
Hong Kong | 8.5% | |||
Germany | 7.2% | |||
Singapore | 5.9% | |||
Canada | 5.1% | |||
Republic of South Korea | 3.9% | |||
Taiwan | 3.8% | |||
Mexico | 2.5% | |||
Other | 16.2% | |||
| 100.0% | ||||
Semi-Annual Report 2016
5
Statement of Investments
April 30, 2016 (Unaudited)
Aberdeen Select International Equity Fund
| Shares or Principal Amount | Value | |||||||
COMMON STOCKS (90.6%) | ||||||||
AUSTRALIA (1.0%) | ||||||||
Health Care (1.0%) | ||||||||
CSL Ltd. (a) | $ | 31,200 | $ | 2,486,274 | ||||
CANADA (5.1%) | ||||||||
Industrials (1.9%) | ||||||||
Canadian National Railway Co. | 75,600 | 4,655,181 | ||||||
Materials (1.4%) | ||||||||
Potash Corp. of Saskatchewan, Inc. | 187,600 | 3,319,296 | ||||||
Telecommunication Services (1.8%) | ||||||||
TELUS Corp. | 133,700 | 4,238,930 | ||||||
| 12,213,407 | ||||||||
FRANCE (1.5%) | ||||||||
Consumer Staples (1.5%) | ||||||||
L’Oreal SA (a) | 19,500 | 3,542,091 | ||||||
GERMANY (5.1%) | ||||||||
Health Care (3.4%) | ||||||||
Bayer AG (a) | 30,200 | 3,490,119 | ||||||
Fresenius Medical Care AG & Co. KGaA (a) | 52,000 | 4,525,928 | ||||||
| 8,016,047 | ||||||||
Materials (1.7%) | ||||||||
Linde AG (a) | 26,200 | 4,008,650 | ||||||
| 12,024,697 | ||||||||
HONG KONG (8.5%) | ||||||||
Consumer Discretionary (1.1%) | ||||||||
Samsonite International SA (a) | 787,500 | 2,527,586 | ||||||
Financials (4.3%) | ||||||||
AIA Group Ltd. (a) | 1,308,600 | 7,814,678 | ||||||
Swire Pacific Ltd., Class A (a) | 219,500 | 2,379,859 | ||||||
| 10,194,537 | ||||||||
Industrials (3.1%) | ||||||||
Jardine Matheson Holdings Ltd. (a) | 93,400 | 5,151,209 | ||||||
MTR Corp. Ltd. (a) | 466,500 | 2,309,340 | ||||||
| 7,460,549 | ||||||||
| 20,182,672 | ||||||||
ISRAEL (2.3%) | ||||||||
Information Technology (2.3%) | ||||||||
Check Point Software Technologies Ltd. (b) | 67,000 | 5,552,290 | ||||||
ITALY (1.8%) | ||||||||
Energy (1.8%) | ||||||||
Tenaris SA, ADR | 161,700 | 4,377,219 | ||||||
JAPAN (10.7%) | ||||||||
Consumer Staples (3.8%) | ||||||||
Japan Tobacco, Inc. (a) | 223,100 | 9,115,402 | ||||||
Financials (2.0%) | ||||||||
Daito Trust Construction Co. Ltd. (a) | 33,200 | 4,695,550 | ||||||
Industrials (1.3%) | ||||||||
FANUC Corp. (a) | $ | 21,500 | 3,176,021 | |||||
Information Technology (1.1%) | ||||||||
Keyence Corp. (a) | 4,200 | 2,517,450 | ||||||
Materials (2.5%) | ||||||||
Shin-Etsu Chemical Co. Ltd. (a) | 108,300 | 6,065,750 | ||||||
| 25,570,173 | ||||||||
LATVIA (0.0%) | ||||||||
Financials (0.0%) | ||||||||
AS Parex Banka (a)(b)(c) | 1,424,182 | 2 | ||||||
MEXICO (2.5%) | ||||||||
Consumer Staples (2.5%) | ||||||||
Fomento Economico Mexicano SAB de CV, ADR | 63,700 | 5,937,477 | ||||||
PHILIPPINES (0.9%) | ||||||||
Financials (0.9%) | ||||||||
Ayala Land, Inc. (a) | 2,983,700 | 2,201,444 | ||||||
SERBIA (0.0%) | ||||||||
Industrials (0.0%) | ||||||||
Toza Markovic ad Kikinda (a)(b)(c)(d) | 78,160 | 0 | ||||||
SINGAPORE (5.9%) | ||||||||
Financials (3.3%) | ||||||||
City Developments Ltd. (a) | 706,000 | 4,366,869 | ||||||
Oversea-Chinese Banking Corp. Ltd. (a) | 540,229 | 3,509,378 | ||||||
| 7,876,247 | ||||||||
Telecommunication Services (2.6%) | ||||||||
Singapore Telecommunications Ltd. (a) | 2,132,900 | 6,100,923 | ||||||
| 13,977,170 | ||||||||
SOUTH AFRICA (2.1%) | ||||||||
Telecommunication Services (2.1%) | ||||||||
MTN Group Ltd. (a) | 475,800 | 4,980,912 | ||||||
SWEDEN (2.2%) | ||||||||
Industrials (2.2%) | ||||||||
Atlas Copco AB, A Shares (a) | 198,462 | 5,141,604 | ||||||
SWITZERLAND (11.7%) | ||||||||
Consumer Staples (3.7%) | ||||||||
Nestle SA (a) | 118,300 | 8,829,871 | ||||||
Health Care (8.0%) | ||||||||
Novartis AG (a) | 128,900 | 9,809,574 | ||||||
Roche Holding AG (a) | 36,700 | 9,285,437 | ||||||
| 19,095,011 | ||||||||
| 27,924,882 | ||||||||
TAIWAN (3.8%) | ||||||||
Information Technology (3.8%) | ||||||||
Taiwan Semiconductor Manufacturing Co. Ltd. (a) | 1,976,000 | 9,078,471 | ||||||
THAILAND (1.0%) | ||||||||
Financials (1.0%) | ||||||||
Kasikornbank PCL (a) | 480,300 | 2,291,616 | ||||||
See accompanying Notes to Financial Statements.
2016 Semi-Annual Report
6
Statement of Investments (concluded)
April 30, 2016 (Unaudited)
Aberdeen Select International Equity Fund
| Shares or Principal Amount | Value | |||||||
UNITED KINGDOM (24.5%) | ||||||||
Consumer Discretionary (2.1%) | ||||||||
Whitbread PLC (a) | $ | 89,500 | $ | 5,073,030 | ||||
Consumer Staples (3.6%) | ||||||||
British American Tobacco PLC (a) | 140,400 | 8,560,482 | ||||||
Energy (4.9%) | ||||||||
John Wood Group PLC (a) | 430,200 | 3,935,501 | ||||||
Royal Dutch Shell PLC, B Shares (a) | 296,100 | 7,774,068 | ||||||
| 11,709,569 | ||||||||
Financials (3.6%) | ||||||||
Prudential PLC (a) | 246,000 | 4,855,924 | ||||||
Standard Chartered PLC (a) | 458,000 | 3,701,835 | ||||||
| 8,557,759 | ||||||||
Industrials (5.4%) | ||||||||
Experian PLC (a) | 290,100 | 5,316,015 | ||||||
Rolls-Royce Holdings PLC (a)(b) | 464,900 | 4,560,783 | ||||||
Rolls-Royce Holdings PLC, C Shares (b) | 33,007,900 | 48,229 | ||||||
Weir Group PLC (The) (a) | 164,100 | 2,882,521 | ||||||
| 12,807,548 | ||||||||
Materials (1.0%) | ||||||||
BHP Billiton PLC (a) | 174,300 | 2,381,722 | ||||||
Telecommunication Services (3.9%) | ||||||||
Inmarsat PLC (a) | 247,400 | 3,366,139 | ||||||
Vodafone Group PLC (a) | 1,859,300 | 5,990,363 | ||||||
| 9,356,502 | ||||||||
| 58,446,612 | ||||||||
VENEZUELA (0.0%) | ||||||||
Financials (0.0%) | ||||||||
Banco Provincial SA-Banco Universal (a)(b)(c) | 18,422 | 0 | ||||||
Banco Venezolano de Credito SA (a)(b)(c) | 156 | 0 | ||||||
| — | ||||||||
Industrials (0.0%) | ||||||||
Cemex Venezuela SACA-I (a)(b)(c) | 15,843,815 | 0 | ||||||
| — | ||||||||
Total Common Stocks |
| 215,929,013 | ||||||
EXCHANGE TRADED FUNDS (0.0%) | ||||||||
RUSSIA (0.0%) | ||||||||
Renaissance Pre-IPO Fund ETF (a)(b)(c) | 92,634 | 0 | ||||||
Total Exchange Traded Funds |
| 0 | ||||||
GOVERNMENT BONDS (0.0%) | ||||||||
VENEZUELA (0.0%) | ||||||||
Bonos de la Deuda Publica Nacional (VEF), 16.00%, 08/23/2018 (a)(c) | 49,500,000 | — | ||||||
Bonos de la Deuda Publica Nacional (VEF), 18.00%, 04/12/2018 (a)(c) | 20,000,000 | — | ||||||
| — | ||||||||
Total Government Bonds |
| 0 | ||||||
PREFERRED STOCKS (7.7%) | ||||||||
BRAZIL (1.7%) | ||||||||
Financials (1.7%) | ||||||||
Banco Bradesco SA, ADR, Preferred Shares | $ | 559,020 | 4,175,879 | |||||
GERMANY (2.1%) | ||||||||
Consumer Staples (2.1%) | ||||||||
Henkel AG & Co. KGaA, Preferred Shares (a) | 44,500 | 5,082,739 | ||||||
REPUBLIC OF SOUTH KOREA (3.9%) | ||||||||
Information Technology (3.9%) | ||||||||
Samsung Electronics Co. Ltd., Preferred Shares (a) | 10,100 | 9,224,216 | ||||||
Total Preferred Stocks |
| 18,482,834 | ||||||
REPURCHASE AGREEMENT (1.7%) | ||||||||
UNITED STATES (1.7%) | ||||||||
Repurchase Agreement, Fixed Income Clearing Corp., 0.03%, dated 04/29/2016, | 4,001,323 | 4,001,323 | ||||||
Total Repurchase Agreement |
| 4,001,323 | ||||||
Total Investments |
| 238,413,170 | ||||||
Liabilities in excess of other assets—0.0% |
| (26,103 | ) | |||||
Net Assets—100.0% |
| $ | 238,387,067 | |||||
| (a) | Fair Valued Security. Fair Values are determined pursuant to procedures approved by the Fund’s Board of Trustees. See Note 2(a) of the accompanying Notes to Financial Statements. |
| (b) | Non-income producing security. |
| (c) | The Fund’s adviser has deemed this security to be illiquid based upon procedures approved by the Board of Trustees. Illiquid securities held by the Fund represent 0.00% of net assets as of April 30, 2016. |
| (d) | Investment in affiliate. |
| (e) | See accompanying Notes to Financial Statements for tax unrealized appreciation/depreciation of securities. |
| ADR | American Depositary Receipt |
| ETF | Exchange-Traded Fund |
| VEF | Venezuelan Bolivar |
See accompanying Notes to Financial Statements.
Semi-Annual Report 2016
7
Aberdeen Select International Equity Fund II (Unaudited)
Aberdeen Select International Equity Fund II (Institutional Class shares net of fees) returned -2.44% for the six-month period ended April 30, 2016, versus -1.51% for its benchmark, the MSCI All Country (AC) World ex USA. Index, during the same period. For broader comparison, the average return of the Fund’s peer category of International Multi-Cap Growth Funds (comprising 134 funds), as measured by Lipper, Inc., was -2.57% for the period.
International equities fell during the six-month period ended April 30, 2016. Markets initially faced intense volatility, brought on partly by uncertainty over the timing of monetary policy normalization in the U.S. The Federal Reserve (Fed) finally raised its benchmark interest rate by 25 basis points in December 2015, amid a more upbeat U.S. employment outlook. Markets were also spooked by China’s monetary policy gaffes, yuan volatility and a stuttering economy, which triggered a sell-off in A-shares. This coincided with a low point in the ongoing rout in commodity prices that saw oil tumble to under US$30 a barrel in early February 2016. Investor sentiment picked up dramatically soon thereafter. Central banks in Japan and parts of Europe unexpectedly imposed negative interest rates in a bid to combat low inflation and boost consumer spending, while the European Central Bank introduced a bolder-than-expected package of fresh stimulus. The Fed lowered expectations for the number of rate hikes for the remainder of the 2016 calendar year amid growing caution over the fragile global recovery and deflationary pressures. The change in tone resulted in U.S. dollar weakness, which provided relief to commodities and commodity-related emerging markets such as Brazil.
The Fund’s holding in Japan Tobacco was a key contributor to Fund performance for the reporting period. The company’s shares rose on news that it was seeking government approval to raise cigarette prices, which could boost operating profits. This was the first time since its 1985 initial public offering (IPO) that the company hiked prices when the tax laws had not changed. Shares of Banco Bradesco moved higher on increasing optimism about Brazilian President Dilma Rousseff’s impeachment and a regime change, which may potentially spur reforms to improve the ailing economy. The Brazilian Senate subsequently voted to impeach Rousseff and suspended her from the presidency on May 12, 2016, amid accusations that she lied about the country’s fiscal condition. Furthermore, Banco Bradesco’s operating results over the period were boosted by higher interest income and improved efficiency. While we believe that the company maintains good asset quality, bad-debt provisions have increased on the back of worsening loan delinquencies. Taiwan Semiconductor Manufacturing Co.’s fourth-quarter 2015 results reached the higher end of management’s forecast, supported by robust demand in the communications and computing sectors. The company expects revenue growth of 5% to 10% for 2016 and higher profits, driven by growing demand and foreign-exchange gains.*
Conversely, the Fund’s holding in Samsung Electronics hindered performance as shares of the Korean consumer electronics manufacturer underperformed the overall market despite the company reporting generally better-than-expected first-quarter 2016 operating profits. Brazilian miner Vale was another key detractor from Fund performance, with the ongoing low iron-ore price environment compounding difficulties. Furthermore, its share price fell following an accident at Samarco, its joint-venture operation with BHP Billiton. We subsequently exited the position. The Fund’s holding in Swiss drug-maker Novartis lagged the overall market along with the wider healthcare sector. Its share price also was hamstrung by the company’s weaker-than-expected results in February 2016, particularly with regard to its eye-care division. We remain comfortable with its business prospects and have been selectively adding to the position on recent share price weakness.
During the reporting period, we initiated a position in Australian biotechnology company CSL, which holds a solid market position in its core plasma business; UK satellite telecommunications company Inmarsat, which benefits from high barriers to entry and a pool of loyal customers, in our opinion; MTR Corporation, which in our view has robust city-rail operations in Hong Kong and China, with a strong business model that also allows it to develop property; consumer products maker L’Oreal, which generates relatively stable returns and free cash-flows; restaurant, coffee shop and budget hotel group Whitbread, as we are impressed by its competitive positions and brands in its key UK markets; German pharmaceutical company Bayer, which has healthy returns on investment and holds steady margins; Hong Kong exchange-listed luggage-maker Samsonite, as we feel that it has strong brands, a solid balance sheet and a management team with a good track record of execution; Kasikornbank, a leading Thai commercial lender; diversified Philippines property business Ayala Land, which has residential developments and recurring income from office and mall rentals, as well as from hotels and resorts; and Japan’s Keyence, a market leader that taps into growing demand for factory automation.
Conversely, we exited positions in Swedish telecom Ericsson, French natural gas and electricity supplier Engie, French energy management company Schneider Electric, and Zurich Insurance, to fund what we believed were better opportunities elsewhere. We also sold the Fund’s shares in financial services company Nordea, as we feel that its growth potential seems limited; Brazilian miner Vale due to our concerns about market imbalances between supply and demand; HSBC, given our worries about the continuing drag on the company’s performance from regulatory and compliance requirements; and French retailer Casino Guichard after it divested its Thai business, which we regarded as one of the attractive growth drivers of the company.
We expect global equities to remain volatile in the near term. Despite recent relief rallies, there has been no extended market turnaround, as economic fundamentals have not changed substantially. Many unknowns remain—investors are wary of the effectiveness of central bank action, governments need to implement more proactive reforms, and there does not appear to be a sustained demand for commodities. We think that all of these factors raise the specter of a protracted global slump. Many of the companies that the Fund holds are taking the opportunity to strengthen their balance sheets. Notwithstanding the unpredictable climate, we maintain our confidence in our investment process, picking stocks that we believe
2016 Semi-Annual Report
8
Aberdeen Select International Equity Fund II (Unaudited)
are well-managed market leaders with efficient operations. We take advantage of market turbulence to add to these high-quality holdings, which we feel can bolster the Fund’s performance.
| * | Forecasts and estimates are offered as opinion and are not reflective of potential performance, are not guaranteed and actual events or results may differ materially. |
Portfolio Management:
Aberdeen Global Equity Team
PAST PERFORMANCE DOES NOT GUARANTEE FUTURE RESULTS.
The performance quoted represents past performance, which does not guarantee future results. Class A Shares have up to a 0.25% 12b-1 fee. The investment return and principal value of an investment will fluctuate so that an investor’s shares, when redeemed, may be worth more or less than their original cost. Current performance of the Fund may be lower or higher than the performance quoted. Performance data current to the most recent month-end may be obtained by calling 866-667-9231 or visiting www.aberdeen-asset.us.
Investing in mutual funds involves risk, including the possible loss of principal. There is no assurance that the investment objective of any fund will be achieved. Indexes are unmanaged and have been provided for comparison purposes only. No fees or expenses are reflected. You cannot invest directly in an index.
Lipper is a leading global provider of mutual fund information and analysis to fund companies, financial intermediaries and media organizations.
Risk Considerations
Foreign securities may be more volatile, harder to price and less liquid than U.S. securities. They are subject to different accounting and regulatory standards and currency exchange rate, political and economic risks. Fluctuation in currency exchange rates may impact a Fund’s returns more greatly to the extent a Fund does not hedge currency exposure or hedging techniques are unsuccessful. The foregoing risks are enhanced in emerging market countries.
Equity stocks of small- and mid-cap companies carry greater risk and more volatility than equity stocks of larger, more established companies.
Stocks issued by large cap companies subject the Fund to the risk that those stocks may underperform stocks issued by companies with smaller capitalizations or the market as a whole.
Investing a significant portion of the Fund’s assets in securities of companies conducting business in a broadly related group of industries within an economic sector may make the Fund more vulnerable to unfavorable developments in that sector.
Please read the prospectus for more detailed information regarding these and other risks.
2016 Semi-Annual Report
9
Aberdeen Select International Equity Fund II (Unaudited)
Average Annual Total Return (For periods ended April 30, 2016) | Six Month† | 1 Yr. | 5 Yr. | 10 Yr. | ||||||||||
Class A | (2.64%) | (15.91%) | (4.23% | ) | (1.37% | ) | ||||||||
Institutional Class | (2.44%) | (15.64% | ) | (3.98% | ) | (1.10% | ) | |||||||
| † | Not Annualized |
Semi-Annual Report 2016
10
Aberdeen Select International Equity Fund II (Unaudited)
Performance of a $10,000 Investment (as of April 30, 2016)

Comparative performance of $10,000 invested in Class A shares of the Aberdeen Select International Equity Fund II, Morgan Stanley Capital International All Country World ex-USA Index (MSCI ACWI ex-USA Index), and the Consumer Price Index (CPI) over a 10-year period ended April 30, 2016. Unlike the Fund’s returns, the returns for these unmanaged indexes do not reflect any fees or expenses. Investors cannot invest directly in market indexes.
The MSCI ACWI ex-USA Index captures large and mid cap representation across 22 of 23 Developed Markets (DM) countries (excluding the United States (U.S.) and 23 Emerging Markets (EM) countries). DM countries include: Australia, Austria, Belgium, Canada, Denmark, Finland, France, Germany, Hong Kong, Ireland, Israel, Italy, Japan, Netherlands, New Zealand, Norway, Portugal, Singapore, Spain, Sweden, Switzerland and the UK. EM countries include: Brazil, Chile, China, Columbia, Czech Republic, Egypt, Greece, Hungary, India, Indonesia, Korea, Malaysia, Mexico, Peru, Philippines, Poland, Russia, Qatar, South Africa, Taiwan, Thailand, Turkey and United Arab Emirates. With 1,855 constituents, the index covers approximately 85% of the global equity opportunity set outside the U.S.
The CPI is a measure of the average change over time in the prices paid by urban consumers for a market basket of consumer goods and services.
Investment return and principal value will fluctuate, and when redeemed, shares may be worth more or less than original cost. Past performance is no guarantee of future results. The Average Annual Total Return table and performance graph do not reflect the deduction of taxes that a shareholder would pay on Fund distributions or the redemption of Fund shares. Investing in mutual funds involves market risk, including loss of principal. Performance returns assume the reinvestment of all distributions. Performance returns reflect fee waivers and reimbursements in effect without which returns would have been lower.
Portfolio Summary (as a percentage of net assets)
April 30, 2016 (Unaudited)
| Asset Allocation | ||||
Common Stocks | 90.7% | |||
Preferred Stocks | 7.8% | |||
Repurchase Agreement | 1.6% | |||
Liabilities in excess of other assets | (0.1% | ) | ||
| 100.0% | ||||
The following table summarizes the composition of the Fund’s portfolio, in Standard & Poor’s Global Industry Classification Standard (GICS) sectors, expressed as a percentage of net assets. The GICS structure consists of 10 sectors, 24 industry groups, 67 industries and 156 sub-industries. As of April 30, 2016, the Fund did not have more than 25% of its assets invested in any industry group.
| Top Sectors | ||||
Consumer Staples | 17.5% | |||
Financials | 17.0% | |||
Industrials | 14.1% | |||
Health Care | 12.5% | |||
Information Technology | 11.1% | |||
Telecommunication Services | 10.0% | |||
Materials | 6.6% | |||
Energy | 6.5% | |||
Consumer Discretionary | 3.2% | |||
Other | 1.5% | |||
| 100.0% | ||||
| Top Holdings* | ||||
Novartis AG | 4.1% | |||
Taiwan Semiconductor Manufacturing Co. Ltd. | 3.9% | |||
Roche Holding AG | 3.9% | |||
Japan Tobacco, Inc. | 3.9% | |||
Samsung Electronics Co. Ltd., Preferred Shares | 3.9% | |||
Nestle SA | 3.8% | |||
British American Tobacco PLC | 3.6% | |||
Royal Dutch Shell PLC, B Shares | 3.3% | |||
AIA Group Ltd. | 3.2% | |||
Vodafone Group PLC | 2.6% | |||
Other | 63.8% | |||
| 100.0% | ||||
| * | For the purpose of listing top holdings, repurchase agreements are included as part of Other. |
| Top Countries | ||||
United Kingdom | 24.3% | |||
Switzerland | 11.8% | |||
Japan | 10.8% | |||
Hong Kong | 8.6% | |||
Germany | 7.3% | |||
Singapore | 6.0% | |||
Canada | 4.9% | |||
Taiwan | 3.9% | |||
Republic of South Korea | 3.9% | |||
Mexico | 2.6% | |||
Other | 15.9% | |||
| 100.0% | ||||
2016 Semi-Annual Report
11
Statement of Investments
April 30, 2016 (Unaudited)
Aberdeen Select International Equity Fund II
| Shares or Principal Amount | Value | |||||||
COMMON STOCKS (90.7%) | ||||||||
AUSTRALIA (1.1%) | ||||||||
Health Care (1.1%) | ||||||||
CSL Ltd. (a) | $ | 16,300 | $ | 1,298,919 | ||||
CANADA (4.9%) | ||||||||
Industrials (2.1%) | ||||||||
Canadian National Railway Co. | 38,600 | 2,376,852 | ||||||
Materials (1.4%) | ||||||||
Potash Corp. of Saskatchewan, Inc. | 91,300 | 1,615,414 | ||||||
Telecommunication Services (1.4%) | ||||||||
TELUS Corp. | 52,800 | 1,674,013 | ||||||
| 5,666,279 | ||||||||
FRANCE (1.5%) | ||||||||
Consumer Staples (1.5%) | ||||||||
L’Oreal SA (a) | 9,500 | 1,725,634 | ||||||
GERMANY (5.2%) | ||||||||
Health Care (3.4%) | ||||||||
Bayer AG (a) | 14,600 | 1,687,276 | ||||||
Fresenius Medical Care AG & Co. KGaA (a) | 26,200 | 2,280,371 | ||||||
| 3,967,647 | ||||||||
Materials (1.8%) | ||||||||
Linde AG (a) | 13,400 | 2,050,226 | ||||||
| 6,017,873 | ||||||||
HONG KONG (8.6%) | ||||||||
Consumer Discretionary (1.1%) | ||||||||
Samsonite International SA (a) | 391,500 | 1,256,571 | ||||||
Financials (4.3%) | ||||||||
AIA Group Ltd. (a) | 617,000 | 3,684,592 | ||||||
Swire Pacific Ltd., Class A (a) | 125,000 | 1,355,273 | ||||||
| 5,039,865 | ||||||||
Industrials (3.2%) | ||||||||
Jardine Matheson Holdings Ltd. (a) | 45,800 | 2,525,967 | ||||||
MTR Corp. Ltd. (a) | 237,500 | 1,175,709 | ||||||
| 3,701,676 | ||||||||
| 9,998,112 | ||||||||
ISRAEL (2.3%) | ||||||||
Information Technology (2.3%) | ||||||||
Check Point Software Technologies Ltd. (b) | 32,600 | 2,701,562 | ||||||
ITALY (1.7%) | ||||||||
Energy (1.7%) | ||||||||
Tenaris SA, ADR | 70,800 | 1,916,556 | ||||||
JAPAN (10.8%) | ||||||||
Consumer Staples (3.9%) | ||||||||
Japan Tobacco, Inc. (a) | 110,100 | 4,498,457 | ||||||
Financials (2.0%) | ||||||||
Daito Trust Construction Co. Ltd. (a) | 16,200 | 2,291,202 | ||||||
Industrials (1.3%) | ||||||||
FANUC Corp. (a) | $ | 10,400 | 1,536,308 | |||||
Information Technology (1.0%) | ||||||||
Keyence Corp. (a) | 2,000 | 1,198,786 | ||||||
Materials (2.6%) | ||||||||
Shin-Etsu Chemical Co. Ltd. (a) | 52,500 | 2,940,460 | ||||||
| 12,465,213 | ||||||||
MEXICO (2.6%) | ||||||||
Consumer Staples (2.6%) | ||||||||
Fomento Economico Mexicano SAB de CV, ADR | 31,700 | 2,954,757 | ||||||
PHILIPPINES (0.9%) | ||||||||
Financials (0.9%) | ||||||||
Ayala Land, Inc. (a) | 1,449,400 | 1,069,401 | ||||||
SINGAPORE (6.0%) | ||||||||
Financials (3.4%) | ||||||||
City Developments Ltd. (a) | 349,100 | 2,159,311 | ||||||
Oversea-Chinese Banking Corp. Ltd. (a) | 270,062 | 1,754,348 | ||||||
| 3,913,659 | ||||||||
Telecommunication Services (2.6%) | ||||||||
Singapore Telecommunications Ltd. (a) | 1,037,900 | 2,968,798 | ||||||
| 6,882,457 | ||||||||
SOUTH AFRICA (2.0%) | ||||||||
Telecommunication Services (2.0%) | ||||||||
MTN Group Ltd. (a) | 221,900 | 2,322,960 | ||||||
SWEDEN (2.1%) | ||||||||
Industrials (2.1%) | ||||||||
Atlas Copco AB, A Shares (a) | 92,200 | 2,388,648 | ||||||
SWITZERLAND (11.8%) | ||||||||
Consumer Staples (3.8%) | ||||||||
Nestle SA (a) | 58,900 | 4,396,275 | ||||||
Health Care (8.0%) | ||||||||
Novartis AG (a) | 62,800 | 4,779,219 | ||||||
Roche Holding AG (a) | 17,800 | 4,503,563 | ||||||
| 9,282,782 | ||||||||
| 13,679,057 | ||||||||
TAIWAN (3.9%) | ||||||||
Information Technology (3.9%) | ||||||||
Taiwan Semiconductor Manufacturing Co. Ltd. (a) | 981,000 | 4,507,075 | ||||||
THAILAND (1.0%) | ||||||||
Financials (1.0%) | ||||||||
Kasikornbank PCL (a) | 241,700 | 1,153,204 | ||||||
UNITED KINGDOM (24.3%) | ||||||||
Consumer Discretionary (2.1%) | ||||||||
Whitbread PLC (a) | 43,400 | 2,459,995 | ||||||
Consumer Staples (3.6%) | ||||||||
British American Tobacco PLC (a) | 68,400 | 4,170,491 | ||||||
See accompanying Notes to Financial Statements.
Semi-Annual Report 2016
12
Statement of Investments (concluded)
April 30, 2016 (Unaudited)
Aberdeen Select International Equity Fund II
| Shares or Principal Amount | Value | |||||||
Energy (4.8%) | ||||||||
John Wood Group PLC (a) | $ | 197,600 | $ | 1,807,659 | ||||
Royal Dutch Shell PLC, B Shares (a) | 144,100 | 3,783,327 | ||||||
| 5,590,986 | ||||||||
Financials (3.6%) | ||||||||
Prudential PLC (a) | 119,800 | 2,364,795 | ||||||
Standard Chartered PLC (a) | 227,300 | 1,837,177 | ||||||
| 4,201,972 | ||||||||
Industrials (5.4%) | ||||||||
Experian PLC (a) | 142,400 | 2,609,447 | ||||||
Rolls-Royce Holdings PLC (a)(b) | 219,900 | 2,157,273 | ||||||
Rolls-Royce Holdings PLC, C Shares (b) | 15,612,900 | 22,813 | ||||||
Weir Group PLC (The) (a) | 83,300 | 1,463,217 | ||||||
| 6,252,750 | ||||||||
Materials (0.8%) | ||||||||
BHP Billiton PLC (a) | 62,600 | 855,398 | ||||||
Telecommunication Services (4.0%) | ||||||||
Inmarsat PLC (a) | 120,500 | 1,639,530 | ||||||
Vodafone Group PLC (a) | 926,000 | 2,983,422 | ||||||
| 4,622,952 | ||||||||
| 28,154,544 | ||||||||
Total Common Stocks | 104,902,251 | |||||||
PREFERRED STOCKS (7.8%) | ||||||||
BRAZIL (1.8%) | ||||||||
Financials (1.8%) | ||||||||
Banco Bradesco SA, ADR, Preferred Shares | 272,250 | 2,033,708 | ||||||
GERMANY (2.1%) | ||||||||
Consumer Staples (2.1%) | ||||||||
Henkel AG & Co. KGaA, Preferred Shares (a) | 21,700 | 2,478,549 | ||||||
REPUBLIC OF SOUTH KOREA (3.9%) | ||||||||
Information Technology (3.9%) | ||||||||
Samsung Electronics Co. Ltd., Preferred Shares (a) | 4,900 | 4,475,114 | ||||||
Total Preferred Stocks |
| 8,987,371 | ||||||
REPURCHASE AGREEMENT (1.6%) | ||||||||
UNITED STATES (1.6%) | ||||||||
Repurchase Agreement, Fixed Income Clearing Corp., 0.03%, dated 04/29/2016, | $ | 1,916,947 | $ | 1,916,947 | ||||
Total Repurchase Agreement |
| 1,916,947 | ||||||
Total Investments |
| 115,806,569 | ||||||
Liabilities in excess of other assets—(0.1)% |
| (160,589 | ) | |||||
Net Assets—100.0% |
| $ | 115,645,980 | |||||
| (a) | Fair Valued Security. Fair Values are determined pursuant to procedures approved by the Fund’s Board of Trustees. See Note 2(a) of the accompanying Notes to Financial Statements. |
| (b) | Non-income producing security. |
| (c) | See accompanying Notes to Financial Statements for tax unrealized appreciation/depreciation of securities. |
| ADR | American Depositary Receipt |
See accompanying Notes to Financial Statements.
2016 Semi-Annual Report
13
Aberdeen Total Return Bond Fund (Unaudited)
The Aberdeen Total Return Bond Fund (Institutional Class shares net of fees) returned 3.01% for the six-month period ended April 30, 2016, versus the 2.82% return of its benchmark, the Barclays U.S. Aggregate Bond Index, for the same period. For broader comparison, the average return of the Fund’s Lipper peer category of Core Bond Funds (consisting of 145 funds) was 2.45% for the period.
Despite navigating some rough patches, the U.S. investment-grade fixed-income market ended the reporting period in positive territory. Corporate bonds1 outperformed versus comparable-duration2 U.S. Treasury securities3 over the period. Yields declined in all but the shortest segments of the U.S. Treasury yield curve. The yield on the two-year Treasury note rose 2 basis points (bps) to 0.77%, while those on the three-, five- and ten-year Treasuries declined by 13, 24 and 33 bps, ending the period at 0.92%, 1.28% and 1.83%, respectively. Consequently, the two- to ten-year Treasury yield curve narrowed by 35 bps, ending the reporting period at +106 bps (1.06%).
U.S. economic data reports released over the reporting period were generally mixed, in our view. Gross domestic product (GDP) expanded by 1.4% in the fourth quarter of 2015, but subsequently decelerated to a 0.5% rate in the first quarter of 2016. The U.S. Department of Commerce attributed the slowdown to a decline in nonresidential fixed investment and a rise in imports, which offset the positive impact of increases in consumer spending and residential fixed investment for the quarter. According to the U.S. Department of Labor, the U.S. economy added an average of nearly 190,000 jobs per month over the six-month reporting period, and the unemployment rate was unchanged at 5.0%. The labor force participation rate4 rose steadily for most of the reporting period before dipping slightly in April, ending 0.3% higher at 62.8%. Additionally, average hourly earnings rose 2.5% year-over-year for the period ended April 30, 2016, modestly outpacing the core inflation rate (which excludes food and energy costs) of 2.2%.
The two stories that dominated the emerging markets (EMs) during the reporting period were the U.S. Federal Reserve’s (Fed’s) rate hike and the ongoing decline in oil and commodity prices. EM debt remained under pressure over the quarter as the Fed finally raised the federal funds target rate by 25 basis points (bps) to a range of 0.25% to 0.50%, seven years after cutting rates to near zero, and subsequently left the benchmark interest rate unchanged following its meetings in January and March 2016. Towards the end of the reporting period in April, the Fed announced its intention to maintain the federal funds rate at a range of 0.25%-0.50% for the foreseeable future. The central bank noted that, while household spending growth has moderated, real income has increased and consumer sentiment remains high.
Oil prices continued their steep downturn and were also a key driver of performance in the emerging markets for the first three months of the reporting period. The Organization of the Petroleum Exporting Countries (OPEC) declined to cut production during its meeting in December 2015, causing the West Texas Intermediate (WTI) crude oil price to fall by over 16% for the month to end 2015 at around $37 per barrel. However, the WTI price climbed nearly 75% between mid-February and April 30, 2016, and ended the reporting period at just below $46 per barrel–its highest level since September 2015–while gold and silver prices each reached 15-month highs in April.
In early March 2016, the European Central Bank (ECB) reduced its benchmark interest rate to 0%, cut the deposit rate further into negative territory at -0.4%, and trimmed the marginal lending rate charged to banks for loans from 0.30% to 0.25%. Furthermore, the central bank expanded both the size and breadth of its quantitative easing, involving the inclusion of corporate securities in the program. This resulted in increased demand for eligible European corporate debt as it appeared that investors were seeking to “front-run” the ECB’s scheduled purchases.
The Fund’s overall positioning within the U.S. fixed-income markets was the largest contributor to its performance relative to the benchmark Barclays U.S. Aggregate Bond Index for the reporting period, while the allocation to the international markets was a detractor. Within the U.S., Fund performance was bolstered by security selection in the corporate sector, most notably in industrials, as well as an overweight position in the sector versus the benchmark index. In our view, long–duration corporate bonds currently offer the most value in the sector, and we maintain the Fund’s overweight in the 30-year segment of the yield curve. Going forward, however, we intend to be more opportunistic in taking profits if valuations exceed our fair-value targets. The Fund’s positioning in structured products was a slight detractor from the overall performance in the U.S., as an overweight allocation to non-agency mortgage-backed securities (MBS) underperformed that sector within the benchmark Barclays U.S. Aggregate Bond Index for the quarter.
Within the developed international markets, the Fund’s positions in Japan and Canada detracted modestly from performance over the reporting period, while positioning in New Zealand had a positive impact. Within the EM sector over the quarter, Fund performance was hindered by the exposure to the Mexican peso after our stop loss5 level was triggered and we needed to sell the position at a loss. We increased the Fund’s exposure to India, Turkey and Colombia through the initiation of currency positions; all three positions contributed to performance late in the reporting period. Going forward, we feel that the deterioration in EM fundamentals appear to have bottomed along with commodity prices. However, we think that the upside seems limited, as emerging markets still face many fundamental issues such as low economic growth, high leverage and political uncertainty. On the other hand, we feel that the benign external environment, which includes a relatively dovish Fed and fading concerns of a hard economic landing in China, puts EMs in a “sweet spot” and may lead to a further rally in the asset class in the near term.
Regarding the use of derivatives during the reporting period, we employed U.S. Treasury futures to manage the Fund’s overall curve and interest rate exposure, and we used currency forwards7 to hedge some of the Fund’s foreign exchange holdings. This resulted in a subtraction of approximately 0.70% from the Fund’s total return for the period.
The Fund’s positioning at the end of the reporting period reflected the impact of a more cautious Fed. Within the U.S. market, we continue to favor the spread sectors over U.S. Treasuries. We currently have positioned the Fund with an overweight relative to the benchmark Barclays U.S. Aggregate Bond Index in corporate bonds of around 140% in terms of its contribution to the Fund’s duration. We
Semi-Annual Report 2016
14
Aberdeen Total Return Bond Fund (Unaudited)
are still avoiding the riskier credit structures in favor of conservatism on individual names, as we maintain our concerns about poor liquidity at various times over the next several years. The Fund has a substantial position in highly rated taxable municipal bonds that we think should have a lower sensitivity to spread-widening compared to other spread product. Commercial mortgage-backed securities (CMBS) continue to offer value relative to comparable-duration Treasuries, in our opinion, as reflected by the Fund’s overweight allocation versus the benchmark of nearly 600%. We have positioned the Fund with an underweight allocation to agency MBS in favor of non-agency MBS due to their lower sensitivity to prepayment risk and the strength in the overall housing market.
The Fund’s overseas positioning includes significant exposure to Mexican and Canadian bonds, since we think that they may outperform comparable-duration Treasuries as these countries’ economies slow down more than that of the U.S. Within the foreign exchange space, the Fund’s largest position is in the Mexican peso, where we believe the currency may show some improvement given the weakness over the last several quarters.
In its April 2016 comments, the Fed removed risk language referencing concerns about global economic and financial developments from its statement, which we believe may leave a June 2016 interest rate hike on the table. If the central bank begins to signal that it may look to tighten in the near future, we think that the markets will likely react to that with a widespread sale of “risky” assets. We think that this sell-off may signal that the markets are unsettled, causing the Fed to cancel, postpone or hesitate in making a move. In our view, this may lead to behavior similar to that of a “spoiled child.” When a parent tells a child he cannot have a lollipop, he stomps his feet and screams until his parent gives in. Whenever the Fed signals that it wants to “take away the candy” (i.e., tighten monetary policy), market participants often stomp their investing feet and the Fed backs down. Each time this action and reaction occurs, the behavior is reinforced, making it even more difficult for the central bank to tighten the next time it has the inclination to do so. In our opinion, this may continue until the Fed becomes desperate, most likely when inflation is a very big issue, in our opinion. Consequently, we believe that the risk that the Fed normalizes policy too slowly has increased.
| 1 | The Barclays U.S. Corporate Investment Grade Index tracks the performance of publicly issued U.S. corporate bonds that are rated as investment-grade (Baa3/BBB- or higher by Moody’s Investors Service and Standard and Poor’s, respectively) and have remaining maturities of one year or more. Indexes are unmanaged and have been provided for comparison purposes only. No fees or expenses are reflected. You cannot invest directly in an index. |
| 2 | Duration is an estimate of bond price sensitivity to changes in interest rates. The higher the duration, the greater the change (i.e., higher risk) in relation to interest-rate movements. |
| 3 | The Barclays U.S. Treasury Index tracks the performance of public obligations of the U.S. Treasury with remaining maturities of one year or more. |
| 4 | The labor force participation rate is expressed as a percentage of the U.S. population aged 16 years and older working or actively seeking work. |
| 5 | Under a stop loss provision, a security is sold when it reaches a certain price. It is designed to limit an investor’s loss on a position in a security. |
| 6 | A currency forward is a binding contract in the foreign exchange market that locks in the exchange rate for the purchase or sale of a currency on a future date. |
Portfolio Management:
Aberdeen North American Fixed Income Team
PAST PERFORMANCE DOES NOT GUARANTEE FUTURE RESULTS.
The performance quoted represents past performance, which does not guarantee future results. Class A shares have up to a 0.25% 12b-1 fee. The investment return and principal value of an investment will fluctuate so that an investor’s shares, when redeemed, may be worth more or less than their original cost. Current performance of the Fund may be lower or higher than the performance quoted. Performance data current to the most recent month-end may be obtained by calling 866-667-9231 or visiting www.aberdeen-asset.us.
Investing in mutual funds involves risk, including possible loss of principal. There is no assurance that the investment objective of any fund will be achieved. Indexes are unmanaged and have been provided for comparison purposes only. No fees or expenses are reflected. You cannot invest directly in an index.
Lipper is a leading global provider of mutual fund information and analysis to fund companies, financial intermediaries and media organizations.
Risk Considerations
Fixed income securities are subject to certain risks including, but not limited to: interest rate (changes in interest rates may cause a decline in the market value of an investment), credit (changes in the financial condition of the issuer, borrower, counterparty, or underlying collateral), prepayment (debt issuers may repay or refinance their loans or obligations earlier than anticipated), and extension (principal repayments may not occur as quickly as anticipated, causing the expected maturity of a security to increase).
Investments in asset-backed and mortgage-backed securities include additional risks that investors should be aware which include those associated with fixed income securities, as well as increased susceptibility to adverse economic developments.
Derivatives are speculative and may hurt the Fund’s performance. They present the risk of disproportionately increased losses and/or reduced gains when the financial asset or measure to which the derivative is linked changes in unexpected ways.
Foreign securities may be more volatile, harder to price and less liquid than U.S. securities. They are subject to different accounting and regulatory standards and currency exchange rate, political and economic risks. Fluctuation in currency exchange rates may impact a Fund’s returns more greatly to the extent a Fund does not hedge currency exposure or hedging techniques are unsuccessful. The foregoing risks are enhanced in emerging market countries.
Municipal securities can be affected by adverse tax, legislative or political changes and the financial condition of the issuers of municipal securities.
Investing a significant portion of the Fund’s assets in securities of companies conducting business in a broadly related group of industries within an economic sector may make the Fund more vulnerable to unfavorable developments in that sector.
Please read the prospectus for more detailed information regarding these and other risks.
2016 Semi-Annual Report
15
Aberdeen Total Return Bond Fund (Unaudited)
Average Annual Total Return (For periods ended April 30, 2016) | Six Month† | 1 Yr. | 5 Yr. | 10 Yr. | ||||||||||
Class A | 2.83% | 2.08% | 3.25% | 4.98% | ||||||||||
Institutional Class | 3.01% | 2.38% | 3.52% | 5.25% | ||||||||||
| † | Not Annualized |
2016 Semi-Annual Report
16
Aberdeen Total Return Bond Fund (Unaudited)
Performance of a $10,000 Investment (as of April 30, 2016)

Comparative performance of $10,000 invested in Class A shares of the Aberdeen Total Return Bond Fund, Barclays U.S. Aggregate Bond Index and the Consumer Price Index (CPI) over a 10-year period ended April 30, 2016. Unlike the Fund’s returns, the returns for these unmanaged indexes do not reflect any fees or expenses. Investors cannot invest directly in market indexes.
The Barclays U.S. Aggregate Bond Index is a broad-based flagship benchmark that measures the investment grade, U.S. Dollar-denominated, fixed-rate taxable bond market. The index includes Treasuries, government-related and corporate securities, MBS (agency fixed-rate and hybrid ARM pass-throughs), ABS and CMBS (agency and non-agency). Provided the necessary inclusion rules are met, U.S. Aggregate eligible securities also contribute to the multi-currency Global Aggregate Index and the U.S. Universal Index, which includes high yield and emerging markets debt.
The CPI is a measure of the average change over time in the prices paid by urban consumers for a market basket of consumer goods and services.
Investment return and principal value will fluctuate, and when redeemed, shares may be worth more or less than original cost. Past performance is no guarantee of future results. The Average Annual Total Return table and performance graph do not reflect the deduction of taxes that a shareholder would pay on Fund distributions or the redemption of Fund shares. Investing in mutual funds involves market risk, including loss of principal. Performance returns assume the reinvestment of all distributions. Performance returns reflect fee waivers and reimbursements in effect without which returns would have been lower.
Portfolio Summary (as a percentage of net assets)
April 30, 2016 (Unaudited)
| Asset Allocation | ||||
Corporate Bonds | 31.2% | |||
Non-Agency Mortgage-Backed Securities | 13.1% | |||
U.S. Agencies | 12.7% | |||
Commercial Mortgage-Backed Securities | 11.4% | |||
Government Bonds | 10.8% | |||
Asset-Backed Securities | 9.7% | |||
U.S. Treasuries | 5.0% | |||
Repurchase Agreement | 4.4% | |||
Municipal Bonds | 4.0% | |||
Liabilities in excess of other assets | (2.3%) | |||
| 100.0% | ||||
The following chart summarizes the composition of the Fund’s portfolio, expressed as a percentage of net assets. The industries listed below may include more than one industry group. As of April 30, 2016, the Fund did not have more than 25% of its assets invested in any industry group.
| Top Industries | ||||
Commercial Banks | 8.3% | |||
Oil, Gas & Consumable Fuels | 3.2% | |||
Electric Utilities | 2.0% | |||
Media | 1.8% | |||
Computers & Peripherals | 1.5% | |||
Auto Manufacturers | 1.4% | |||
Software | 1.4% | |||
Banks | 1.3% | |||
Leisure Time | 1.2% | |||
Beverages | 1.0% | |||
Other | 76.9% | |||
| 100.0% | ||||
| Top Holdings* | ||||
Canadian Government Bond 03/01/2021 | 2.0% | |||
U.S. Treasury Bonds 11/15/2045 | 1.8% | |||
Mexican Bonos, Series M 05/29/2031 | 1.3% | |||
New Zealand Government Bond 03/15/2019 | 1.1% | |||
Apple, Inc. 02/23/2046 | 1.1% | |||
State of California General Obligation Unlimited Bonds 04/01/2039 | 1.0% | |||
Federal Home Loan Mortgage Corp. 02/01/2044 | 1.0% | |||
Federal National Mortgage Association, TBA 05/01/2031 | 1.0% | |||
Microsoft Corp. 11/03/2045 | 0.9% | |||
Mexican Bonos, Series M 11/23/2034 | 0.9% | |||
Other | 87.9% | |||
| 100.0% | ||||
| * | For the purpose of listing top holdings, repurchase agreements are included as part of Other. |
| Top Countries | ||||
United States | 83.1% | |||
Canada | 3.3% | |||
Mexico | 3.0% | |||
Australia | 2.4% | |||
New Zealand | 1.7% | |||
Sweden | 1.6% | |||
Supranational | 1.6% | |||
Netherlands | 1.0% | |||
Indonesia | 1.0% | |||
Panama | 0.8% | |||
Other | 0.5% | |||
| 100.0% | ||||
Semi-Annual Report 2016
17
Statement of Investments
April 30, 2016 (Unaudited)
Aberdeen Total Return Bond Fund
| Shares or Principal Amount | Value (US$) | |||||||
ASSET-BACKED SECURITIES (9.7%) | ||||||||
UNITED STATES (9.7%) | ||||||||
Ally Auto Receivables Trust | ||||||||
Series 2015-2, Class A3 (USD), 1.49%, 11/15/2019 | $ | 2,620,000 | $ | 2,626,297 | ||||
Series 2016-2, Class A3 (USD), 1.35%, 05/15/2020 | 3,581,000 | 3,575,467 | ||||||
Ally Master Owner Trust | ||||||||
Series 2014-1, Class A1 (USD), 0.90%, 01/15/2019 (a) | 3,105,000 | 3,101,559 | ||||||
Series 2014-5, Class A2, ABS (USD), 1.60%, 10/15/2019 | 4,017,000 | 4,021,394 | ||||||
Avis Budget Rental Car Funding AESOP LLC, | 2,890,000 | 2,894,671 | ||||||
BMW Vehicle Lease Trust, Series 2015-2, | 3,870,000 | 3,874,618 | ||||||
Chase Issuance Trust | ||||||||
Series 2007-B1, Class B1, ABS (USD), 0.68%, 04/15/2019 (a) | 3,640,000 | 3,626,956 | ||||||
Series 2007-C1, Class C1, ABS (USD), 0.89%, 04/15/2019 (a) | 2,960,000 | 2,950,328 | ||||||
Series 2015-A5, Class A5, ABS (USD), 1.36%, 04/15/2020 | 4,483,000 | 4,498,291 | ||||||
Chesapeake Funding LLC, Series 2013-1A, Class A (USD), 0.89%, 01/07/2025 (a)(b) | 835,559 | 835,164 | ||||||
Citibank Credit Card Issuance Trust, | 4,184,000 | 4,386,710 | ||||||
CNH Equipment Trust, | 99,622 | 99,600 | ||||||
CNH Wholesale Master Note Trust, | 4,940,000 | 4,938,900 | ||||||
Ford Credit Auto Owner Trust | ||||||||
Series 2013-B, Class A3 (USD), | 109,822 | 109,802 | ||||||
Series 2016-1, Class A (USD), | 3,966,000 | 3,995,887 | ||||||
Ford Credit Floorplan Master Owner Trust, | 3,990,000 | 3,976,005 | ||||||
GE Dealer Floorplan Master Note Trust | ||||||||
Series 2014-2, Class A, ABS (USD), | 3,940,000 | 3,925,786 | ||||||
Series 2015-2, Class A (USD), | 4,640,000 | 4,619,117 | ||||||
GM Financial Automobile Leasing Trust | ||||||||
Series 2014-2A, Class A3 (USD), 1.22%, 01/22/2018 (b) | 2,871,017 | 2,872,212 | ||||||
Series 2015-2, Class A2B (USD), 0.86%, 04/20/2018 (a) | 2,876,140 | 2,875,118 | ||||||
Honda Auto Receivables Owner Trust, Series 2014-1, Class A3 (USD), 0.67%, 11/21/2017 | 2,383,551 | 2,381,242 | ||||||
Mercedes-Benz Auto Receivables Trust, Series 2015-1, Class A2B (USD), 0.71%, 06/15/2018 (a) | 3,430,032 | 3,430,657 | ||||||
Navistar Financial Dealer Note Master Trust, Series 2014-1, Class A (USD), 1.19%, 10/25/2019 (a)(b) | 3,120,000 | 3,107,581 | ||||||
Navistar Financial Dealer Note Master Trust II, Series 2015-1, Class A (USD), 1.84%, 06/25/2020 (a)(b) | 3,750,000 | 3,718,108 | ||||||
Nissan Auto Receivables Owner Trust, Series 2013-B, Class A3 (USD), 0.84%, 11/15/2017 | 590,118 | 590,109 | ||||||
SLM Student Loan Trust | ||||||||
Series 2011-1, Class A1 (USD), 0.96%, 03/25/2026 (a) | 1,280,316 | 1,260,805 | ||||||
Series 2011-2, Class A1 (USD), 1.04%, 11/25/2027 (a) | 2,333,643 | 2,300,293 | ||||||
Series 2013-2, Class A (USD), 0.89%, 09/25/2026 (a) | 2,806,431 | 2,671,895 | ||||||
Synchrony Credit Card Master Note Trust, Series 2016-1, Class A (USD), 2.04%, 03/15/2022 | 5,928,000 | 5,972,371 | ||||||
United States Small Business Administration, Series 2007-P10A, Class 1 (USD), 5.46%, 02/10/2017 | 494,435 | 511,089 | ||||||
Volkswagen Auto Loan Enhanced Trust | ||||||||
Series 2013-1, Class A3 (USD), 0.56%, 08/21/2017 | 435,273 | 434,703 | ||||||
Series 2013-2, Class A3 (USD), 0.70%, 04/20/2018 | 1,652,131 | 1,647,641 | ||||||
Volvo Financial Equipment LLC, Series 2016-1A, Class A3 (USD), 1.67%, 02/18/2020 (b) | 1,330,000 | 1,329,877 | ||||||
| 93,160,253 | ||||||||
Total Asset-Backed Securities | 93,160,253 | |||||||
COMMERCIAL MORTGAGE-BACKED SECURITIES (11.4%) |
| |||||||
UNITED STATES (11.4%) | ||||||||
Banc of America Commercial Mortgage Trust, Series 2006-5, Class AM (USD), 5.45%, 09/10/2047 | 1,950,000 | 1,970,166 | ||||||
Barclays Commercial Mortgage Securities Trust, Series 2015-SLP, Class B (USD), 2.03%, 02/15/2028 (a)(b) | 3,040,000 | 3,016,924 | ||||||
Bear Stearns Commercial Mortgage Securities Trust | ||||||||
Series 2006-PW13, Class A4, CMO (USD), 5.54%, 09/11/2041 | 2,101,262 | 2,105,909 | ||||||
Series 2007-PW17, Class AM (USD), 1.13%, 06/11/2050 (a)(b) | 6,054,750 | 5,827,699 | ||||||
CD Commercial Mortgage Trust, Series 2007-CD4, Class A4 (USD), 5.32%, 12/11/2049 | 3,406,420 | 3,464,576 | ||||||
CGRBS Commercial Motgage Trust, Series 2013-VN05, Class B (USD), 3.70%, 03/13/2035 (a)(b) | 3,160,000 | 3,317,431 | ||||||
Citigroup Commercial Mortgage Trust, Series 2007-C6, Class AM (USD), 5.90%, 12/10/2049 (a) | 2,500,000 | 2,515,566 | ||||||
Citigroup Mortgage Loan Trust, Series 2015-PS1, Class A1 (USD), 3.75%, 09/25/2042 (b) | 2,202,164 | 2,253,745 | ||||||
See accompanying Notes to Financial Statements.
2016 Semi-Annual Report
18
Statement of Investments (continued)
April 30, 2016 (Unaudited)
Aberdeen Total Return Bond Fund
| Shares or Principal Amount | Value (US$) | |||||||
COMM 2014-TWC Mortgage Trust, Series 2014-TWC, Class B (USD), 2.04%, 02/13/2032 (a)(b) | $ | 2,720,000 | $ | 2,685,169 | ||||
COMM 2015-DC1 Mortgage Trust, Series 2015-DC1, Class ASB (USD), 3.14%, 02/10/2048 | 3,300,000 | 3,419,249 | ||||||
COMM 2015-PC1 Mortgage Trust, Series 2015-PC1, Class A5 (USD), 3.90%, 07/10/2050 | 3,110,000 | 3,388,487 | ||||||
Commercial Mortgage Pass Through Certificates, Series 2006-C4, Class A3 (USD), 5.47%, 09/15/2039 | 2,052,309 | 2,058,233 | ||||||
Commercial Mortgage Trust, Series 2007-GG11, Class A4 (USD), 5.74%, 12/10/2049 | 2,034,223 | 2,123,488 | ||||||
CSAIL Commercial Mortgage Trust, Series 2015-C3, Class A4 (USD), 3.72%, 08/15/2048 | 3,260,000 | 3,509,095 | ||||||
Deutsche Bank Commercial Mortgage Trust, Series 2016-C1, Class B (USD), 4.20%, 05/10/2049 | 3,250,500 | 3,428,148 | ||||||
FDIC Guaranteed Notes Trust, Series 2010-C1, Class A (USD), 2.98%, 12/06/2020 (b) | 1,800,395 | 1,830,161 | ||||||
Federal Home Loan Mortgage Corp. | ||||||||
Series 2015-DNA3, Class M2, CMO, | 2,500,000 | 2,547,415 | ||||||
Series 2016-DNA1, Class M2, CMO, | 1,860,000 | 1,894,265 | ||||||
FREMF Mortgage Trust | ||||||||
Series 2011-K704, Class B (USD), 4.69%, 10/25/2030 (a)(b) | 4,030,000 | 4,198,348 | ||||||
Series 2011-K703, Class B (USD), 5.05%, 07/25/2044 (a)(b) | 3,500,000 | 3,657,896 | ||||||
Series 2013-K29, Class B (USD), 3.60%, 05/25/2046 (a)(b) | 1,890,000 | 1,907,720 | ||||||
Series 2011-K11, Class B (USD), 4.57%, 12/25/2048 (a)(b) | 1,221,000 | 1,308,753 | ||||||
GS Mortgage Securites Corp. Trust, Series 2012-SHOP, Class A (USD), 2.93%, 06/05/2031 (b) | 4,030,000 | 4,144,098 | ||||||
GS Mortgage Securities Trust, Series 2015-GC32, Class A4 (USD), 3.76%, 07/10/2048 | 1,630,000 | 1,760,070 | ||||||
GSCCRE Commercial Mortgage Trust, Series 2015-HULA, Class B (USD), 2.74%, 08/15/2032 (a)(b) | 3,780,000 | 3,715,600 | ||||||
Hilton USA Trust 2013-HLT, Series 2013-HLT, Class CFX, (USD), 3.71%, 11/05/2030 (b) | 2,845,000 | 2,859,055 | ||||||
JP Morgan Chase Commercial Mortgage Securities Trust | ||||||||
Series 2014-INN, Class A (USD), 1.35%, 06/15/2029 (a)(b) | 3,850,000 | 3,807,207 | ||||||
Series 2015-UES, Class C (USD), 3.74%, 09/05/2032 (a)(b) | 3,915,000 | 3,978,768 | ||||||
JPMBB Commercial Mortgage Securities Trust | ||||||||
Series 2015-C31, Class A3 (USD), 3.80%, 08/15/2048 | 2,400,000 | 2,597,868 | ||||||
Series 2015-C28, Class A3 (USD), 2.91%, 10/15/2048 | $ | 3,510,000 | $ | 3,560,603 | ||||
LB-UBS Commercial Mortgage Trust, Series 2006-C4, Class AM (USD), 6.12%, 06/15/2038 (a) | 2,320,000 | 2,325,716 | ||||||
ML-CFC Commercial Mortgage Trust, Series 2006-3, Class A4 (USD), 5.41%, 07/12/2046 (a) | 2,860,745 | 2,870,911 | ||||||
Morgan Stanley Capital I Trust | ||||||||
Series 2006-IQ12, Class AM (USD), 5.37%, 12/15/2043 | 2,360,000 | 2,377,581 | ||||||
Series 2007-IQ16, Class A4 (USD), 5.81%, 12/12/2049 | 2,433,310 | 2,537,462 | ||||||
SFAVE Commercial Mortgage Securities Trust, Series 2015-5AVE, Class C (USD), 4.53%, 01/05/2043 (a)(b) | 3,460,000 | 2,971,037 | ||||||
Wachovia Bank Commercial Mortgage Trust, Series 2006-C28, Class AM (USD), 5.60%, 10/15/2048 (a) | 3,115,000 | 3,150,088 | ||||||
Wells Fargo Commercial Mortgage Trust | ||||||||
Series 2015-C29, Class ASB (USD), 3.40%, 06/15/2048 | 1,870,000 | 1,975,085 | ||||||
Series 2015-LC22, Class ASB (USD), 3.57%, 09/15/2058 | 2,080,000 | 2,217,574 | ||||||
| 109,277,166 | ||||||||
Total Commercial Mortgage-Backed Securities | 109,277,166 | |||||||
NON-AGENCY MORTGAGE-BACKED SECURITIES (13.1%) | ||||||||
UNITED STATES (13.1%) | ||||||||
Alternative Loan Trust | ||||||||
Series 2004-28CB, Class 3A1 (USD), 6.00%, 01/25/2035 | 2,896,197 | 2,799,156 | ||||||
Series 2005-86CB, Class A8 (USD), 5.50%, 02/25/2036 | 2,483,633 | 2,195,749 | ||||||
Banc of America Mortgage Trust, Series 2004-7, Class 2A3 (USD), 5.75%, 08/25/2034 | 522,395 | 541,176 | ||||||
Bear Stearns Adjustable Rate Mortgage Trust, Series 2004-3, Class 4A (USD), 2.86%, 07/25/2034 (a) | 840,555 | 824,214 | ||||||
CHL Mortgage Pass-Through Trust, Series 2005-21, Class A2 (USD), 5.50%, 10/25/2035 | 708,641 | 697,304 | ||||||
Citigroup Mortgage Loan Trust | ||||||||
Series 2005-11, Class A3 (USD), 2.74%, 11/25/2035 (a) | 1,520,449 | 1,450,668 | ||||||
Series 2014-A, Class A (USD), 4.00%, 01/25/2035 (b) | 1,598,958 | 1,647,770 | ||||||
Series 2014-J1, Class A1 (USD), 3.50%, 06/25/2044 (a)(b) | 3,005,129 | 3,054,210 | ||||||
Credit Suisse Mortgage Capital Trust | ||||||||
Series 2013-6, Class2A1 (USD), 3.50%, 08/25/2043 (a)(b) | 2,812,794 | 2,863,994 | ||||||
Series 2013-7, Class A11 (USD), 3.50%, 08/25/2043 (a)(b) | 5,013,341 | 5,027,474 | ||||||
See accompanying Notes to Financial Statements.
Semi-Annual Report 2016
19
Statement of Investments (continued)
April 30, 2016 (Unaudited)
Aberdeen Total Return Bond Fund
| Shares or Principal Amount | Value (US$) | |||||||
Credit Suisse Mortgage Trust | ||||||||
Series 2013-7, Class A2 (USD), 3.00%, 08/25/2043 (b) | $ | 1,094,913 | $ | 1,072,922 | ||||
Series 2015-WIN1, Class A6 (USD), 3.50%, 12/25/2044 (b) | 2,741,729 | 2,779,483 | ||||||
EverBank Mortgage Loan Trust, Series 2013-2, Class A (USD), 3.00%, 06/25/2043 (a)(b) | 2,889,573 | 2,888,900 | ||||||
FDIC Guaranteed Notes Trust, Series 2010-S2, Class 2A (USD), 2.57%, 07/29/2047 (b) | 1,214,094 | 1,232,263 | ||||||
FDIC Trust, Series 2010-R1, Class A (USD), 2.18%, 05/25/2050 (b) | 1,526,848 | 1,529,049 | ||||||
Federal Home Loan Mortgage Corp., Series 2015-HQA1, Class M2, CMO (USD), 3.09%, 03/25/2028 (a) | 4,290,000 | 4,370,486 | ||||||
GSR Mortgage Loan Trust, Series 2005-6F, Class 1A6 (USD), 5.25%, 07/25/2035 | 1,723,770 | 1,782,187 | ||||||
IndyMac INDA Mortgage Loan Trust | ||||||||
Series 2005-AR2, Class 3A1 (USD), 2.82%, 01/25/2036 (a) | 2,501,617 | 2,227,187 | ||||||
Series 2006-AR1, Class A1 (USD), 4.61%, 08/25/2036 (a) | 362,507 | 339,254 | ||||||
JP Morgan Mortgage Trust | ||||||||
Series 2005-A2, Class 3A2 (USD), 2.72%, 04/25/2035 (a) | 1,372,700 | 1,325,266 | ||||||
Series 2005-A4, Class 3A1 (USD), 2.44%, 07/25/2035 (a) | 1,531,974 | 1,523,000 | ||||||
Series 2005-A5, Class 2A2 (USD), 2.77%, 08/25/2035 (a) | 1,250,451 | 1,250,668 | ||||||
Series 2006-S1, Class 2A6 (USD), 6.00%, 04/25/2036 | 1,895,803 | 1,979,521 | ||||||
Series 2013-1, Class 1A2 (USD), 3.00%, 03/25/2043 (a)(b) | 2,830,564 | 2,838,249 | ||||||
Series 2013-1, Class B1 (USD), 3.52%, 03/25/2043 (a)(b) | 2,886,017 | 2,877,797 | ||||||
Series 2013-2, Class A2 (USD), 3.50%, 05/25/2043 (a)(b) | 3,072,038 | 3,129,544 | ||||||
Series 2013-3, Class A3 (USD), 3.45%, 07/25/2043 (a)(b) | 4,051,997 | 4,111,030 | ||||||
Series 2014-1, Class 2A2 (USD), 3.50%, 01/25/2044 (b) | 3,672,692 | 3,751,607 | ||||||
Series 2014-IVR3, Class 3A1 (USD), 3.00%, 09/25/2044 (b) | 3,205,221 | 3,174,004 | ||||||
Series 2014-IVR6, Class AM, CMO (USD), 2.88%, 07/25/2044 (a)(b) | 4,051,699 | 4,039,073 | ||||||
MASTR Adjustable Rate Mortgages Trust, Series 2006-2, Class 4A1 (USD), 2.79%, 02/25/2036 (a) | 727,177 | 703,407 | ||||||
Merrill Lynch Mortgage Investors Trust | ||||||||
Series 2006-1, Class 2A1 (USD), 2.30%, 02/25/2036 (a) | 1,678,730 | 1,655,557 | ||||||
Series 2007-2, Class 2A1 (USD), 2.80%, 06/25/2037 (a) | 1,382,227 | 1,328,282 | ||||||
Series 2007-3, Class 2A2 (USD), 2.71%, 09/25/2037 (a) | 1,331,203 | 1,299,957 | ||||||
NCUA Guaranteed Notes Trust | ||||||||
Series 2010-R2, Class 1A (USD), 0.80%, 11/06/2017 (a) | 1,321,145 | 1,320,047 | ||||||
Series 2010-R3, Class 1A (USD), 1.00%, 12/08/2020 (a) | 2,461,986 | 2,467,669 | ||||||
New Residential Mortgage Loan Trust | ||||||||
Series 2014-1A, Class A (USD), 3.75%, 01/25/2054 (a)(b) | 1,065,813 | 1,103,694 | ||||||
Series 2014-2A, Class A3 (USD), 3.75%, 05/25/2054 (a)(b) | 2,806,058 | 2,912,586 | ||||||
PHH Mortgage Trust, Series 2008-CIM1, Class 21A1 (USD), 6.00%, 05/25/2038 | 1,477,622 | 1,540,627 | ||||||
Sequoia Mortgage Trust | ||||||||
Series 2013-4, Class A2 (USD), 2.50%, 04/25/2043 (a) | 2,772,992 | 2,707,311 | ||||||
Series 2013-5, Class A1 (USD), 2.50%, 05/25/2043 (a)(b) | 4,790,482 | 4,677,015 | ||||||
Series 2013-6, Class A1 (USD), 2.50%, 05/25/2043 (a) | 1,540,050 | 1,505,967 | ||||||
Series 2014-3, Class A8 (USD), 4.00%, 10/25/2044 (a)(b) | 2,625,188 | 2,720,183 | ||||||
Series 2015-1, Class A1 (USD), 3.50%, 01/25/2045 (a)(b) | 2,225,774 | 2,262,595 | ||||||
Series 2015-2, Class A1 (USD), 3.50%, 05/25/2045 (b) | 2,083,887 | 2,145,514 | ||||||
Structured Agency Credit Risk | ||||||||
Series 2014-HQ2, Class M2, CMO (USD), 2.64%, 09/25/2024 (a) | 3,480,000 | 3,464,954 | ||||||
Series 2015-DNA1, Class M2 (USD), 2.28%, 10/25/2027 (a) | 3,320,000 | 3,300,331 | ||||||
Series 2015-DNA2, Class M2, CMO (USD), 3.04%, 12/25/2027 (a) | 3,330,000 | 3,354,388 | ||||||
Series 2015-HQ1, Class M2, CMO (USD), 2.64%, 03/25/2025 (a) | 2,850,000 | 2,876,830 | ||||||
Structured Asset Securities Corp., Series 2004-18H, Class A5 (USD), 4.75%, 10/25/2034 | 3,084,111 | 3,103,380 | ||||||
Thornburg Mortgage Securities Trust | ||||||||
Series 2007-4, Class 2A1 (USD), 2.42%, 09/25/2037 (a) | 2,875,660 | 2,811,675 | ||||||
Series 2007-4, Class 3A1 (USD), 6.06%, 09/25/2037 (a) | 162,522 | 164,765 | ||||||
WaMu Mortgage Pass Through Certificates, Series 2005-AR7, Class A3 (USD), 2.50%, 08/25/2035 (a) | 3,582,712 | 3,522,009 | ||||||
Wells Fargo Mortgage Backed Securities Trust | ||||||||
Series 2005-AR13, Class 4A1 (USD), 2.74%, 05/25/2035 (a) | 2,154,967 | 2,113,305 | ||||||
Series 2006-10, Class A4 (USD), 6.00%, 08/25/2036 | 965,641 | 979,483 | ||||||
Series 2006-19, Class A4 (USD), 5.25%, 12/26/2036 | 360,269 | 360,297 | ||||||
| 125,725,033 | ||||||||
Total Non-Agency Mortgage-Backed Securities |
| 125,725,033 | ||||||
CORPORATE BONDS (31.2%) | ||||||||
AUSTRALIA (1.2%) | ||||||||
Commercial Banks (1.2%) | ||||||||
Commonwealth Bank of Australia (USD), 4.50%, 12/09/2025 (b) | 4,025,000 | 4,142,900 | ||||||
See accompanying Notes to Financial Statements.
2016 Semi-Annual Report
20
Statement of Investments (continued)
April 30, 2016 (Unaudited)
Aberdeen Total Return Bond Fund
| Shares or Principal Amount | Value (US$) | |||||||
National Australia Bank Ltd. (USD), 1.25%, 03/08/2018 (b) | $ | 6,780,000 | $ | 6,775,268 | ||||
| 10,918,168 | ||||||||
CANADA (0.2%) | ||||||||
Commercial Banks (0.2%) | ||||||||
National Bank of Canada (USD), 1.45%, 11/07/2017 | 2,110,000 | 2,109,146 | ||||||
FRANCE (0.3%) | ||||||||
Apparel (0.3%) | ||||||||
LVMH Moet Hennessy Louis Vuitton SE (USD), 1.63%, 06/29/2017 (b) | 2,950,000 | 2,969,039 | ||||||
GUERNSEY (0.7%) | ||||||||
Commercial Banks (0.7%) | ||||||||
Credit Suisse Group Funding Guernsey Ltd. (USD), 3.80%, 09/15/2022 | 6,240,000 | 6,320,103 | ||||||
LUXEMBOURG (0.2%) | ||||||||
Miscellaneous Manufacturing (0.2%) | ||||||||
Pentair Finance SA (USD), 3.15%, 09/15/2022 | 1,800,000 | 1,728,734 | ||||||
NETHERLANDS (1.0%) | ||||||||
Commercial Banks (0.5%) | ||||||||
ABN AMRO Bank (USD), 4.75%, 07/28/2025 (b) | 2,420,000 | 2,482,605 | ||||||
Cooperatieve Centrale Raiffeisen-Boerenleenbank BA (USD), 4.38%, 08/04/2025 | 2,630,000 | 2,755,817 | ||||||
| 5,238,422 | ||||||||
Electric Utilities (0.5%) | ||||||||
Enel Finance International (USD), 6.00%, 10/07/2039 (b) | 3,820,000 | 4,626,715 | ||||||
| 9,865,137 | ||||||||
NORWAY (0.5%) | ||||||||
Commercial Banks (0.5%) | ||||||||
DNB Bank ASA (USD), 3.20%, 04/03/2017 (b) | 5,020,000 | 5,105,787 | ||||||
PANAMA (0.8%) | ||||||||
Leisure Time (0.8%) | ||||||||
Carnival Corp. (USD), 3.95%, 10/15/2020 | 6,790,000 | 7,253,900 | ||||||
SUPRANATIONAL (1.6%) | ||||||||
Banks (1.3%) | ||||||||
International Bank for Reconstruction & Development | ||||||||
(NZD), 4.63%, 02/26/2019 | 8,530,000 | 6,269,260 | ||||||
Series GDIF (AUD), 3.50%, 04/29/2019 | 8,110,000 | 6,370,164 | ||||||
| 12,639,424 | ||||||||
Commercial Banks (0.3%) | ||||||||
KfW (AUD), 6.00%, 08/20/2020 (c) | 3,000,000 | 2,596,321 | ||||||
| 15,235,745 | ||||||||
SWEDEN (1.6%) | ||||||||
Commercial Banks (1.6%) | ||||||||
Nordea Bank AB (USD), 3.13%, 03/20/2017 (b) | 4,300,000 | 4,377,249 | ||||||
Skandinaviska Enskilda Banken AB (USD), 2.63%, 03/15/2021 | 5,824,000 | 5,961,184 | ||||||
Svenska Handelsbanken AB (USD), 2.45%, 03/30/2021 | 5,258,000 | 5,354,185 | ||||||
| 15,692,618 | ||||||||
UNITED KINGDOM (0.3%) | ||||||||
Oil, Gas & Consumable Fuels (0.3%) | ||||||||
BP Capital Markets PLC (USD), 3.12%, 05/04/2026 | 3,183,000 | 3,219,929 | ||||||
UNITED STATES (22.8%) | ||||||||
Aerospace & Defense (0.3%) | ||||||||
United Technologies Corp. (USD), 4.15%, 05/15/2045 | 2,980,000 | 3,172,591 | ||||||
Auto Manufacturers (1.4%) | ||||||||
Ford Motor Credit Co. LLC | ||||||||
(USD), 3.34%, 03/18/2021 | 4,654,000 | 4,825,384 | ||||||
(USD), 3.10%, 05/04/2023 | 3,517,000 | 3,517,000 | ||||||
General Motors Co. (USD), 6.75%, 04/01/2046 | 1,492,000 | 1,806,873 | ||||||
General Motors Financial Co., Inc. (USD), 5.25%, 03/01/2026 | 2,979,000 | 3,274,222 | ||||||
| 13,423,479 | ||||||||
Beverages (1.0%) | ||||||||
Anheuser-Busch InBev Finance, Inc. | ||||||||
(USD), 3.30%, 02/01/2023 | 4,367,000 | 4,555,283 | ||||||
(USD), 4.90%, 02/01/2046 | 4,358,000 | 4,954,349 | ||||||
| 9,509,632 | ||||||||
Commercial Banks (3.3%) | ||||||||
Bank of America Corp. (USD), | 6,070,000 | 6,192,602 | ||||||
Capital One NA (USD), 1.77%, 08/17/2018 (a) | 3,300,000 | 3,320,899 | ||||||
Goldman Sachs Group, Inc. (The) | ||||||||
(USD), 4.25%, 10/21/2025 | 2,250,000 | 2,301,865 | ||||||
(USD), 4.75%, 10/21/2045 | 2,180,000 | 2,329,249 | ||||||
JPMorgan Chase & Co. | ||||||||
(USD), 4.35%, 08/15/2021 | 6,120,000 | 6,704,160 | ||||||
(USD), 3.90%, 07/15/2025 | 2,260,000 | 2,397,878 | ||||||
Morgan Stanley (USD), 4.00%, 07/23/2025 | 1,880,000 | 1,981,761 | ||||||
Wells Fargo & Co. (USD), 4.10%, 06/03/2026 | 6,440,000 | 6,783,052 | ||||||
| 32,011,466 | ||||||||
Computers & Peripherals (1.5%) | ||||||||
Apple, Inc. (USD), 4.65%, 02/23/2046 | 9,697,000 | 10,675,437 | ||||||
Hewlett Packard Enterprise Co. (USD), 3.60%, 10/15/2020 (b) | 3,610,000 | 3,748,328 | ||||||
| 14,423,765 | ||||||||
Diversified Financial Services (0.5%) | ||||||||
KKR Group Finance Co. III LLC (USD), 5.13%, 06/01/2044 (b) | 2,540,000 | 2,499,050 | ||||||
Legg Mason, Inc. (USD), 5.63%, 01/15/2044 (d) | 2,590,000 | 2,588,571 | ||||||
| 5,087,621 | ||||||||
See accompanying Notes to Financial Statements.
Semi-Annual Report 2016
21
Statement of Investments (continued)
April 30, 2016 (Unaudited)
Aberdeen Total Return Bond Fund
| Shares or Principal Amount | Value (US$) | |||||||
Diversified Telecommunication Services (0.4%) |
| |||||||
AT&T, Inc. (USD), 4.75%, 05/15/2046 | $ | 3,810,000 | $ | 3,854,291 | ||||
Electric Utilities (1.5%) | ||||||||
Duke Energy Carolinas LLC | ||||||||
Series A (USD), 6.00%, 12/01/2028 | 4,203,000 | 5,364,142 | ||||||
(USD), 6.45%, 10/15/2032 | 1,440,000 | 1,889,091 | ||||||
Edison International (USD), 3.75%, 09/15/2017 | 3,915,000 | 4,036,710 | ||||||
Exelon Corp. (USD), 3.40%, 04/15/2026 | 2,898,000 | 2,979,529 | ||||||
| 14,269,472 | ||||||||
Energy Equipment & Services (0.9%) | ||||||||
Energy Transfer Partners LP (USD), 4.15%, 10/01/2020 | 4,700,000 | 4,649,000 | ||||||
Plains All American Pipeline LP / PAA Finance Corp. (USD), 3.65%, 06/01/2022 | 4,660,000 | 4,417,885 | ||||||
| 9,066,885 | ||||||||
Food & Staples (0.3%) | ||||||||
Tiffany & Co. (USD), 4.90%, 10/01/2044 (d) | 2,601,000 | 2,540,181 | ||||||
Health Care Equipment & Supplies (0.3%) | ||||||||
Thermo Fisher Scientific, Inc. (USD), 3.00%, 04/15/2023 | 2,985,000 | 3,029,960 | ||||||
Healthcare Products (0.4%) | ||||||||
Medtronic, Inc. (USD), 4.38%, 03/15/2035 | 3,273,000 | 3,652,164 | ||||||
Healthcare Providers & Services (0.3%) | ||||||||
Quest Diagnostics, Inc. (USD), 4.70%, 03/30/2045 | 2,430,000 | 2,493,477 | ||||||
Insurance (0.8%) | ||||||||
American International Group, Inc. (USD), 4.50%, 07/16/2044 | 4,553,000 | 4,416,059 | ||||||
Berkshire Hathaway, Inc. (USD), 2.75%, 03/15/2023 | 2,825,000 | 2,916,451 | ||||||
| 7,332,510 | ||||||||
Internet (0.5%) | ||||||||
eBay, Inc. (USD), 3.80%, 03/09/2022 | 4,371,000 | 4,576,441 | ||||||
Leisure Time (0.4%) | ||||||||
Harley-Davidson, Inc. (USD), 4.63%, 07/28/2045 | 3,531,000 | 3,738,517 | ||||||
Media (1.8%) | ||||||||
21st Century Fox America, Inc. | ||||||||
(USD), 7.75%, 01/20/2024 | 530,000 | 645,217 | ||||||
(USD), 7.43%, 10/01/2026 (d) | 2,647,000 | 3,390,399 | ||||||
(USD), 7.30%, 04/30/2028 | 4,231,000 | 5,506,998 | ||||||
Time Warner Cos., Inc. (USD), 7.57%, 02/01/2024 | 5,875,000 | 7,391,049 | ||||||
| 16,933,663 | ||||||||
Metals & Mining (0.5%) | ||||||||
Glencore Funding LLC | ||||||||
(USD), 4.63%, 04/29/2024 (b) | 2,880,000 | 2,625,840 | ||||||
(USD), 4.00%, 04/16/2025 (b) | 2,440,000 | 2,126,667 | ||||||
| 4,752,507 | ||||||||
Miscellaneous Manufacturing (0.3%) | ||||||||
Pentair Finance SA (USD), 1.88%, 09/15/2017 | 3,190,000 | 3,180,411 | ||||||
Oil, Gas & Consumable Fuels (2.9%) | ||||||||
Anadarko Petroleum Corp. (USD), 4.85%, 03/15/2021 | 3,544,000 | 3,700,613 | ||||||
Chevron Corp. (USD), 0.72%, 02/22/2017 (a) | 3,370,000 | 3,368,436 | ||||||
Devon Energy Corp. (USD), 7.95%, 04/15/2032 | 5,880,000 | 6,347,019 | ||||||
Exxon Mobil Corp. (USD), 4.11%, 03/01/2046 | 3,042,000 | 3,249,291 | ||||||
Marathon Petroleum Corp. (USD), 4.75%, 09/15/2044 | 2,476,000 | 2,076,884 | ||||||
Noble Energy, Inc. (USD), 5.25%, 11/15/2043 | 2,880,000 | 2,736,340 | ||||||
Occidental Petroleum Corp. (USD), 3.40%, 04/15/2026 | 2,290,000 | 2,372,035 | ||||||
Valero Energy Corp. (USD), 9.38%, 03/15/2019 | 3,774,000 | 4,493,162 | ||||||
| 28,343,780 | ||||||||
Pharmaceutical (0.3%) | ||||||||
Baxalta, Inc. (USD), 5.25%, 06/23/2045 (b) | 2,710,000 | 2,932,426 | ||||||
Retail (0.6%) | ||||||||
Lowe’s Cos., Inc. (USD), 3.70%, 04/15/2046 | 5,785,000 | 5,742,260 | ||||||
Semiconductors (0.5%) | ||||||||
Intel Corp. (USD), 3.10%, 07/29/2022 | 4,320,000 | 4,588,920 | ||||||
Software (1.4%) | ||||||||
Electronic Arts, Inc. (USD), 3.70%, 03/01/2021 | 4,383,000 | 4,587,537 | ||||||
Microsoft Corp. (USD), 4.45%, 11/03/2045 | 7,820,000 | 8,700,298 | ||||||
| 13,287,835 | ||||||||
Transportation (0.7%) | ||||||||
FedEx Corp. | ||||||||
(USD), 4.90%, 01/15/2034 | 4,550,000 | 5,034,316 | ||||||
(USD), 4.55%, 04/01/2046 | 2,092,000 | 2,237,262 | ||||||
| 7,271,578 | ||||||||
| 219,215,832 | ||||||||
Total Corporate Bonds | 299,634,138 | |||||||
MUNICIPAL BONDS (4.0%) | ||||||||
UNITED STATES (4.0%) | ||||||||
CALIFORNIA (2.0%) | ||||||||
Los Angeles Unified School District General Obligation Unlimited Bonds | ||||||||
(USD), 5.76%, 07/01/2029 | 1,425,000 | 1,757,424 | ||||||
(USD), 6.76%, 07/01/2034 | 5,337,000 | 7,389,077 | ||||||
State of California General Obligation Unlimited Bonds (USD), 7.55%, 04/01/2039 | 6,170,000 | 9,574,421 | ||||||
| 18,720,922 | ||||||||
CONNECTICUT (0.6%) | ||||||||
State of Connecticut General Obligation Unlimited Bonds | ||||||||
(USD), 5.09%, 10/01/2030 | 855,000 | 987,593 | ||||||
Series A (USD), 5.85%, 03/15/2032 | 3,530,000 | 4,337,417 | ||||||
| 5,325,010 | ||||||||
See accompanying Notes to Financial Statements.
2016 Semi-Annual Report
22
Statement of Investments (continued)
April 30, 2016 (Unaudited)
Aberdeen Total Return Bond Fund
| Shares or Principal Amount | Value (US$) | |||||||
FLORIDA (0.2%) | ||||||||
Florida Hurricane Catastrophe Fund Finance Corp., Revenue Bonds, Series A (USD), 1.30%, 07/01/2016 | $ | 2,370,000 | $ | 2,373,247 | ||||
MASSACHUSETTS (0.5%) | ||||||||
Commonwealth of Massachusetts General Obligation Limited Bonds | ||||||||
Series E (USD), 4.20%, 12/01/2021 | 3,280,000 | 3,626,631 | ||||||
(USD), 4.91%, 05/01/2029 | 1,160,000 | 1,388,485 | ||||||
| 5,015,116 | ||||||||
NEW YORK (0.5%) | ||||||||
New York City Transitional Finance Authority Revenue Bonds (Qualified School Construction BD) | ||||||||
(USD), 5.27%, 05/01/2027 | 2,150,000 | 2,542,439 | ||||||
(USD), 5.01%, 08/01/2027 | 1,190,000 | 1,388,087 | ||||||
New York State Dormitory Authority Revenue Bonds (Build America Bonds) (USD), 5.50%, 03/15/2030 | 810,000 | 999,581 | ||||||
| 4,930,107 | ||||||||
PENNSYLVANIA (0.2%) | ||||||||
Pennsylvania State General Obligation Unlimited Bonds (Build America Bonds), Series B (USD), 4.65%, 02/15/2026 | 1,980,000 | 2,177,564 | ||||||
| 38,541,966 | ||||||||
Total Municipal Bonds | 38,541,966 | |||||||
GOVERNMENT BONDS (10.8%) | ||||||||
AUSTRALIA (1.2%) | ||||||||
Australia Government Bond | ||||||||
(AUD), 1.25%, 02/21/2022 (b)(e) | 4,730,000 | 4,067,716 | ||||||
Series 139 (AUD), 3.25%, 04/21/2025 (b) | 2,940,000 | 2,375,387 | ||||||
International Bank for Reconstruction & Development (NZD), 3.50%, 01/22/2021 | 7,350,000 | 5,251,536 | ||||||
| 11,694,639 | ||||||||
CANADA (3.1%) | ||||||||
Canada Housing Trust No 1 (CAD), 1.25%, 06/15/2021 (b)(c) | 6,296,000 | 5,004,685 | ||||||
Canadian Government Bond | ||||||||
(CAD), 0.75%, 03/01/2021 | 24,738,000 | 19,609,799 | ||||||
(CAD), 2.25%, 06/01/2025 | 6,120,000 | 5,223,681 | ||||||
| 29,838,165 | ||||||||
INDONESIA (1.0%) | ||||||||
Indonesia Treasury Bond | ||||||||
Series FR56 (IDR), 8.38%, 09/15/2026 | 59,395,000,000 | 4,712,400 | ||||||
Series FR73 (IDR), 8.75%, 05/15/2031 | 57,549,000,000 | 4,705,870 | ||||||
| 9,418,270 | ||||||||
MEXICO (3.0%) | ||||||||
Mexican Bonos | ||||||||
Series M (MXN), 7.75%, 05/29/2031 | 184,570,000 | 12,250,291 | ||||||
Series M (MXN), 7.75%, 11/23/2034 | 124,760,000 | 8,343,231 | ||||||
Series M (MXN), 7.75%, 11/13/2042 | 121,040,000 | 8,165,297 | ||||||
| 28,758,819 | ||||||||
NEW ZEALAND (1.7%) | ||||||||
New Zealand Government Bond | ||||||||
(NZD), 5.00%, 03/15/2019 (b) | 14,260,000 | 10,754,672 | ||||||
Series 423 (NZD), 5.50%, 04/15/2023 (b) | 6,340,000 | 5,294,343 | ||||||
| 16,049,015 | ||||||||
REPUBLIC OF SOUTH KOREA (0.3%) | ||||||||
Korea Housing Finance Corp. (USD), 1.63%, 09/15/2018 (b) | 3,230,000 | 3,227,545 | ||||||
SPAIN (0.5%) | ||||||||
Spain Government Bond (EUR), 1.95%, 04/30/2026 (b) | 4,033,000 | 4,767,145 | ||||||
Total Government Bonds | 103,753,598 | |||||||
U.S. AGENCIES (12.7%) | ||||||||
UNITED STATES (12.7%) | ||||||||
Federal Home Loan Mortgage Corp. | ||||||||
(USD), 6.50%, 05/01/2022 | 1,047 | 1,193 | ||||||
TBA (USD), 2.50%, 05/01/2031 | 7,130,000 | 7,331,088 | ||||||
(USD), 6.50%, 08/01/2036 | 383,136 | 446,140 | ||||||
(USD), 6.50%, 05/01/2038 | 1,009,081 | 1,166,000 | ||||||
(USD), 6.50%, 09/01/2038 | 75,171 | 85,685 | ||||||
(USD), 6.50%, 10/01/2038 | 642,760 | 738,894 | ||||||
(USD), 6.50%, 11/01/2038 | 90,349 | 102,928 | ||||||
(USD), 6.50%, 12/01/2038 | 282,698 | 322,090 | ||||||
(USD), 5.00%, 10/01/2041 | 3,875,713 | 4,287,864 | ||||||
(USD), 4.00%, 03/01/2042 | 6,784,030 | 7,285,621 | ||||||
(USD), 3.00%, 02/01/2043 | 2,677,548 | 2,748,832 | ||||||
(USD), 4.50%, 10/01/2043 | 3,368,696 | 3,669,839 | ||||||
(USD), 4.50%, 10/01/2043 | 1,832,654 | 1,996,753 | ||||||
(USD), 3.50%, 02/01/2044 | 9,026,923 | 9,467,347 | ||||||
(USD), 4.50%, 07/01/2044 | 1,926,595 | 2,097,338 | ||||||
(USD), 4.00%, 11/01/2044 | 4,410,130 | 4,719,300 | ||||||
(USD), 4.00%, 11/01/2044 | 2,805,971 | 3,002,517 | ||||||
(USD), 3.10%, 02/01/2045 (a) | 4,050,344 | 4,208,476 | ||||||
Federal National Mortgage Association | ||||||||
(USD), 3.00%, 09/01/2030 | 4,392,218 | 4,619,324 | ||||||
(USD), 3.00%, 10/01/2030 | 4,282,044 | 4,500,299 | ||||||
TBA (USD), 3.50%, 05/01/2031 | 8,836,000 | 9,342,689 | ||||||
(USD), 5.00%, 04/01/2040 | 1,106,702 | 1,232,414 | ||||||
(USD), 5.00%, 05/01/2040 | 1,061,889 | 1,178,446 | ||||||
(USD), 4.50%, 12/01/2040 | 2,014,766 | 2,198,384 | ||||||
(USD), 5.00%, 02/01/2041 | 1,015,962 | 1,124,230 | ||||||
(USD), 5.00%, 04/01/2041 | 1,145,914 | 1,277,145 | ||||||
(USD), 3.50%, 03/01/2042 | 1,598,825 | 1,678,901 | ||||||
(USD), 3.50%, 06/01/2042 | 1,984,149 | 2,083,588 | ||||||
(USD), 4.00%, 06/01/2043 | 2,896,995 | 3,119,774 | ||||||
(USD), 4.00%, 11/01/2043 | 4,344,180 | 4,642,535 | ||||||
(USD), 4.50%, 03/01/2044 | 1,720,467 | 1,873,471 | ||||||
(USD), 4.50%, 04/01/2044 | 3,935,777 | 4,301,490 | ||||||
(USD), 4.50%, 05/01/2044 | 3,977,606 | 4,338,636 | ||||||
(USD), 4.50%, 08/01/2044 | 1,739,009 | 1,893,774 | ||||||
(USD), 3.07%, 01/01/2045 (a) | 6,128,405 | 6,370,138 | ||||||
(USD), 3.50%, 02/01/2045 | 3,487,820 | 3,671,099 | ||||||
See accompanying Notes to Financial Statements.
Semi-Annual Report 2016
23
Statement of Investments (continued)
April 30, 2016 (Unaudited)
Aberdeen Total Return Bond Fund
| Shares or Principal Amount | Value (US$) | |||||||
(USD), 3.00%, 06/01/2045 | $ | 3,830,717 | $ | 3,935,928 | ||||
TBA (USD), 4.00%, 05/01/2046 | 3,380,000 | 3,610,988 | ||||||
Government National Mortgage Association | ||||||||
(USD), 6.00%, 04/15/2037 | 141,066 | 159,722 | ||||||
(USD), 6.00%, 06/15/2037 | 139,987 | 157,808 | ||||||
(USD), 6.00%, 09/15/2037 | 208,843 | 235,432 | ||||||
(USD), 6.00%, 11/15/2037 | 432,609 | 493,308 | ||||||
(USD), 6.00%, 11/15/2037 | 148,320 | 167,394 | ||||||
(USD), 6.00%, 12/15/2037 | 50,646 | 57,162 | ||||||
(USD), 6.00%, 04/15/2038 | 155,065 | 174,885 | ||||||
(USD), 6.00%, 07/15/2038 | 71,232 | 80,336 | ||||||
(USD), 6.00%, 09/15/2038 | 328,013 | 369,677 | ||||||
| 122,566,882 | ||||||||
Total U.S. Agencies | 122,566,882 | |||||||
U.S. TREASURIES (5.0%) | ||||||||
UNITED STATES (5.0%) | ||||||||
Treasury Inflation Protected Security | ||||||||
(USD), 0.63%, 01/15/2026 (e) | 4,769,819 | 5,012,845 | ||||||
(USD), 0.75%, 02/15/2045 (e) | 5,739,273 | 5,592,164 | ||||||
U.S. Treasury Bonds | ||||||||
(USD), 2.88%, 08/15/2045 | 1,435,400 | 1,497,751 | ||||||
(USD), 3.00%, 11/15/2045 | 16,254,900 | 17,394,645 | ||||||
U.S. Treasury Inflation Index Bonds (USD), 0.63%, 02/15/2043 (e) | 5,032,695 | 4,764,679 | ||||||
U.S. Treasury Notes | ||||||||
(USD), 1.13%, 02/28/2021 | 7,218,500 | 7,172,258 | ||||||
(USD), 1.25%, 03/31/2021 | 5,252,100 | 5,244,306 | ||||||
(USD), 1.63%, 02/15/2026 | 1,762,100 | 1,731,607 | ||||||
| 48,410,255 | ||||||||
Total U.S. Treasuries | 48,410,255 | |||||||
REPURCHASE AGREEMENT (4.4%) | ||||||||
UNITED STATES (4.4%) | ||||||||
Repurchase Agreement, Fixed Income Clearing Corp., 0.03%, dated 04/29/2016, due 05/02/2016, repurchase price $41,984,396, Collateralized by U.S. Treasury Note, maturing 08/15/2024; total market value of $42,824,400 | 41,984,291 | 41,984,291 | ||||||
Total Repurchase Agreement | 41,984,291 | |||||||
Total Investments | 983,053,582 | |||||||
Liabilities in excess of other assets—(2.3)% | (21,800,193 | ) | ||||||
Net Assets—100.0% | $ | 961,253,389 | ||||||
| (a) | Variable or Floating Rate Security. Rate disclosed is as of April 30, 2016. |
| (b) | Denotes a security issued under Regulation S or Rule 144A. |
| (c) | This security is government guaranteed. |
| (d) | The Fund’s adviser has deemed this security to be illiquid based upon procedures approved by the Board of Trustees. Illiquid securities held by the Fund represent 0.89% of net assets as of April 30, 2016. |
| (e) | Inflation linked security. |
| (f) | See accompanying Notes to Financial Statements for tax unrealized appreciation/depreciation of securities. |
| AUD | Australian Dollar |
| CAD | Canadian Dollar |
| COP | Colombian Peso |
| EUR | Euro Currency |
| IDR | Indonesian Rupiah |
| INR | Indian Rupee |
| JPY | Japanese Yen |
| MXN | Mexican Peso |
| NOK | Norwegian Krone |
| NZD | New Zealand Dollar |
| TBA | Securities purchased on a forward commitment basis with an appropriate principal amount and no definitive maturity date. The actual principal and maturity date will be determined upon settlement date. |
| USD | U.S. Dollar |
At April 30, 2016, the Fund held the following futures contracts:
| Futures Contracts | Counterparty | Number of Contracts Long (Short) | Expiration Date | Unrealized Appreciation/ (Depreciation) | ||||||||||||
Australian 3 Year Bond Futures | UBS | 202 | 06/15/2016 | $ | 40,579 | |||||||||||
Euro BTP Futures | UBS | 80 | 06/08/2016 | (93,894 | ) | |||||||||||
United States Treasury Note 6%-5 year | UBS | (74 | ) | 06/30/2016 | 35,266 | |||||||||||
United States Treasury Note 6%-10 year | UBS | (236 | ) | 06/21/2016 | (30,609 | ) | ||||||||||
United States Treasury Note 6%-Ultra Bond | UBS | 30 | 06/21/2016 | (75,150 | ) | |||||||||||
| United States Treasury Note 6%-Ultra Long | UBS | (109 | ) | 06/21/2016 | 105,467 | |||||||||||
| $ | (18,341 | ) | ||||||||||||||
See accompanying Notes to Financial Statements.
2016 Semi-Annual Report
24
Statement of Investments (concluded)
April 30, 2016 (Unaudited)
Aberdeen Total Return Bond Fund
At April 30, 2016, the Fund’s open forward foreign currency exchange contracts were as follows:
| Purchase Contracts Settlement Date* | Counterparty | Amount Purchased | Amount Sold | Fair Value | Unrealized Appreciation | |||||||||||||||||||||
| Canadian Dollar/United States Dollar | ||||||||||||||||||||||||||
05/16/2016 | Westpac Banking Corp. | CAD | 4,804,739 | USD | 3,669,757 | $ | 3,829,380 | $ | 159,623 | |||||||||||||||||
05/17/2016 | Citibank N.A. | CAD | 2,916,793 | USD | 2,186,388 | 2,324,688 | 138,300 | |||||||||||||||||||
05/17/2016 | Westpac Banking Corp. | CAD | 21,344,994 | USD | 16,458,617 | 17,011,985 | 553,368 | |||||||||||||||||||
| Colombian Peso/United States Dollar | ||||||||||||||||||||||||||
05/23/2016 | Citibank N.A. | COP | 14,451,290,000 | USD | 4,941,034 | 5,057,749 | 116,715 | |||||||||||||||||||
| Indian Rupee/United States Dollar | ||||||||||||||||||||||||||
05/20/2016 | Barclays Bank PLC | INR | 318,358,893 | USD | 4,776,578 | 4,783,890 | 7,312 | |||||||||||||||||||
05/20/2016 | JPMorgan Chase Bank N.A. | INR | 319,852,008 | USD | 4,786,054 | 4,806,326 | 20,272 | |||||||||||||||||||
| Japanese Yen/United States Dollar | ||||||||||||||||||||||||||
05/11/2016 | Westpac Banking Corp. | JPY | 1,031,029,471 | USD | 9,525,244 | 9,691,090 | 165,846 | |||||||||||||||||||
| Mexican Peso/United States Dollar | ||||||||||||||||||||||||||
05/31/2016 | Citibank N.A. | MXN | 84,144,886 | USD | 4,808,439 | 4,877,321 | 68,882 | |||||||||||||||||||
| New Zealand Dollar/United States Dollar | ||||||||||||||||||||||||||
05/02/2016 | Westpac Banking Corp. | NZD | 39,504,374 | USD | 27,581,598 | 27,583,925 | 2,327 | |||||||||||||||||||
| Norwegian Krone/United States Dollar | ||||||||||||||||||||||||||
| 06/01/2016 | Barclays Bank PLC | NOK | 79,743,315 | USD | 9,570,060 | 9,902,543 | 332,483 | |||||||||||||||||||
| $ | 89,868,897 | $ | 1,565,128 | |||||||||||||||||||||||
| Sale Contracts Settlement Date* | Counterparty | Amount Purchased | Amount Sold | Fair Value | Unrealized Appreciation/ (Depreciation) | |||||||||||||||||||||
| United States Dollar/Australian Dollar | ||||||||||||||||||||||||||
07/27/2016 | Westpac Banking Corp. | USD | 16,006,453 | AUD | 20,829,125 | $ | 15,782,322 | $ | 224,131 | |||||||||||||||||
| United States Dollar/Canadian Dollar | ||||||||||||||||||||||||||
05/17/2016 | Barclays Bank PLC | USD | 13,668,065 | CAD | 17,847,093 | 14,224,154 | (556,089 | ) | ||||||||||||||||||
05/17/2016 | Citibank N.A. | USD | 9,714,881 | CAD | 13,143,385 | 10,475,293 | (760,412 | ) | ||||||||||||||||||
05/17/2016 | Westpac Banking Corp. | USD | 26,256,369 | CAD | 35,688,974 | 28,444,153 | (2,187,784 | ) | ||||||||||||||||||
| United States Dollar/Colombian Peso | ||||||||||||||||||||||||||
05/23/2016 | Citibank N.A. | USD | 4,874,946 | COP | 14,451,290,000 | 5,057,749 | (182,803 | ) | ||||||||||||||||||
| United States Dollar/Euro | ||||||||||||||||||||||||||
06/29/2016 | Citibank N.A. | USD | 895,119 | EUR | 800,000 | 917,643 | (22,524 | ) | ||||||||||||||||||
06/29/2016 | Westpac Banking Corp. | USD | 4,773,065 | EUR | 4,182,189 | 4,797,194 | (24,129 | ) | ||||||||||||||||||
| United States Dollar/Japanese Yen | ||||||||||||||||||||||||||
05/11/2016 | Barclays Bank PLC | USD | 9,547,161 | JPY | 1,031,029,471 | 9,691,089 | (143,928 | ) | ||||||||||||||||||
| United States Dollar/Mexican Peso | ||||||||||||||||||||||||||
07/08/2016 | Citibank N.A. | USD | 13,756,024 | MXN | 247,098,091 | 14,270,685 | (514,661 | ) | ||||||||||||||||||
| United States Dollar/New Zealand Dollar | ||||||||||||||||||||||||||
05/02/2016 | Westpac Banking Corp. | USD | 27,297,483 | NZD | 39,504,374 | 27,583,925 | (286,442 | ) | ||||||||||||||||||
06/03/2016 | Westpac Banking Corp. | USD | 27,533,482 | NZD | 39,504,374 | 27,537,705 | (4,223 | ) | ||||||||||||||||||
| United States Dollar/Norwegian Krone | ||||||||||||||||||||||||||
06/01/2016 | Barclays Bank PLC | USD | 4,820,495 | NOK | 39,871,659 | 4,951,272 | (130,777 | ) | ||||||||||||||||||
| 06/01/2016 | Citibank N.A. | USD | 4,776,792 | NOK | 39,871,656 | 4,951,271 | (174,479 | ) | ||||||||||||||||||
| $ | 168,684,455 | $ | (4,764,120 | ) | ||||||||||||||||||||||
| * | Certain contracts with different trade dates and like characteristics have been shown net. |
See accompanying Notes to Financial Statements.
Semi-Annual Report 2016
25
Aberdeen Global High Income Fund (Unaudited)
The Aberdeen Global High Income Fund (Institutional Class shares net of fees) returned -2.67% for the six-month period ended April 30, 2016, versus the 2.92% return of its benchmark, the Bank of America Merrill Lynch (BofA ML) Global High Yield Constrained Index (hedged to U.S. dollars), during the same period. For broader comparison, the average return of the peer category of High Yield Funds (comprising 223 funds), as measured by Lipper, Inc., was 0.83% for the period.
We view the six-month period ended April 30, 2016, as “a tale of two halves” for the global high-yield markets. The primary factors driving the downturn over the first three-and-a-half months of the period included the ongoing slump in oil and commodity prices exacerbated by the Organization of the Petroleum Exporting Countries’ (OPEC’s) decision in November 2015 to maintain its oil production at current levels; uncertainty regarding U.S. Federal Reserve (Fed) and European Central Bank (ECB) monetary policy; the slowing Chinese economy; and the troubled political situation in Brazil. However, a sharp rally beginning in mid-February 2016 lifted the global high-yield markets into positive territory for the six-month reporting period. A recovery in global oil and commodity prices, the ECB’s expansion of its quantitative easing (QE) policy, Fed Chair Janet Yellen’s dovish tone on future interest-rate increases, and positive political developments in Brazil drove the turnaround.
All three segments of the global high-yield asset class recorded positive returns for the reporting period. Below-investment-grade emerging-market (EM) corporate bonds1 were the strongest performers, gaining 5.64% versus the respective 2.51% and 2.25% returns of their European2 and U.S.3 high-yield counterparts, respectively. Latin America led the upturn in EMs, as shares of commodity-related companies rose sharply. Positive political developments added to the rally in Brazil and Argentina. In Brazil, the pressure on President Dilma Rousseff mounted and impeachment odds increased, boosting the domestic market as investors anticipated the installation of a more market-friendly, reform-minded government. The Brazilian Senate voted to impeach Rousseff and suspended her from the presidency on May 12, 2016, amid accusations that she lied about the country’s fiscal condition. In Argentina, the new administration led by President Mauricio Macri reached a deal with debt holdouts more quickly than expected, heightening expectations that the administration would be market-friendly going forward.
In early March 2016, the ECB reduced its benchmark interest rate to 0%, cut the deposit rate further into negative territory at -0.4%, and trimmed the marginal lending rate charged to banks for loans from 0.30% to 0.25%. Furthermore, the central bank expanded both the size and breadth of its QE, involving the inclusion of corporate securities in the program. This resulted in increased demand for eligible European corporate debt as it appeared that investors were seeking to “front-run” the ECB’s upcoming purchases.
The underperformance of the U.S. high-yield market during the reporting period was attributable mainly to its greater exposure to oil and commodity prices relative to that of other global high-yield markets. Basic materials (which includes the coal-related and metals and mining industries) and energy are the two largest sectors within the benchmark BofA ML U.S. High Yield Master II Index. Significant declines in these sectors in the beginning of the reporting period weighed heavily on the U.S. high-yield market even after energy and commodity prices experienced strong rallies to close the period. Consequently, the upturn in oil and commodity prices over the second half of the reporting period led to the outperformance of the U.S. high-yield asset class versus the overall global high-yield market in March and April 2016.
The Fund’s underperformance relative to its benchmark, the BofA ML Global High Yield Constrained Index (hedged to U.S. dollars), for the reporting period was attributable to a combination of macroeconomic and individual security selection factors, as well as higher transaction costs incurred over the period due to increasing market volatility.
Macroeconomic factors played an unusually large role in driving the performance of the global high-yield asset class over the reporting period. The markets saw the continuation central bank intervention on an unprecedented scale, heightened fears of hard economic landing in China, severe commodity price volatility and turmoil in many of the emerging markets during the reporting period. These factors combined to prompt wide moves in various sectors of global credit markets over the reporting period. We believe that these market conditions work against the Fund’s traditional bottom-up approach to investing. Fund performance for the reporting period was hampered from being “offside” with respect to a number of these trends. For example, the Fund’s underweight to Emerging European credits was a significant detractor from performance over the period, with Russian credits substantially recovering as concerns over the geopolitical situation in Ukraine receded. Similarly the Fund’s underweight allocation to BB rated4 credits had a negative impact on performance as global central banks continued to keep rates artificially low, thereby supporting more interest-rate-sensitive credits such as BB rated issues.
Elevated levels of volatility in the global high-yield markets attributable largely to the previously cited macroeconomic factors and investors’ concerns about liquidity in the high-yield sector drove substantial fund outflows from the asset class for much of the reporting period. Against this backdrop, the Fund held unusually high cash positions through much of the reporting period to take advantage of market opportunities and to ensure shareholders that the Fund had the required liquidity levels. This higher cash position proved to be a drag on Fund performance when markets ultimately recovered toward the end of the reporting period. Extreme levels of volatility across credit markets combined with increased flows in the Fund drove an abnormally high level of trading in the reporting period as we sought to take advantage opportunities, mitigate risk and raise liquidity for fund flows. One consequence of this elevated trading level was that the Fund bore unusually high level of transaction costs in the quarter, which had a negative impact on Fund performance.
While macroeconomic factors certainly played a role in the Fund’s underperformance relative to the benchmark index over the reporting period, security selection also had a significant negative impact. Fund
2016 Semi-Annual Report
26
Aberdeen Global High Income Fund (Unaudited)
performance was hampered by security selection in some of the most troubled segments of the market—specifically, the energy and basic industry (commodity-related) sectors. Certain individual investments in these sectors drove a significant portion of the Fund’s performance versus the benchmark for the reporting period.
On the positive side, Fund performance for the reporting period benefited from security selection in BBB rated credits, which are not represented in the benchmark index, as well as an underweight position in riskier CCC-rated securities. To a lesser extent, the Fund’s relative performance for the reporting period also was enhanced by underweight allocations to the services industry of the industrials sector and the telecommunications segment of the technology, media and telecommunications sector.
During the reporting period, we employed derivatives in several capacities in the Fund. We believe that in certain situations, credit default swaps7 provide a more efficient hedge relative to cash bonds. Additionally, we used currency forwards8 to hedge some of the Fund’s foreign exchange holdings. The use of derivatives contributed 33 bps to the Fund’s total return for the reporting period.
While we believe that some of the challenges that we faced over the reporting period were attributable to the bottom-up nature of our investment approach to the high-yield asset class, others stemmed from our own misjudgements. An important part of our investment approach is broad diversification5 geographically; by moving up and down the balance sheet; and by making use of what we call “allied” asset classes, such as investment-grade corporate bonds, loans, convertible bonds, preferred stock and sovereign debt, among others. Most of the issues in which we invest are historically more volatile than the securities that are constituents of the benchmark BofA ML Global High Yield Constrained Index, but we maintain our belief that an active global approach can offset this increase in volatility with a higher-than-proportionate increase in investment returns. In fact, we think that the Fund’s higher longer-run Sharpe ratio6 relative to its competitors still appears to be proof of this conviction, despite the difficulty of recent periods. Nonetheless, we are not surprised that there are periods when this added volatility is more difficult to overcome, and the past few years have served as an example of this.
We have been working diligently to address the challenges that have been hampering the Fund’s more recent performance and adjust our approach as needed without altering our underlying, bottom-up-oriented and global approach to the asset class.
Across credit rating categories, domicile, and industry sectors, the changes to the Fund during the six-month reporting period were related mostly to the reduction and redeployment of historically large cash balances the Fund carried at the beginning of 2016. This process increased the Fund’s exposure to U.S.-domiciled credits and in auto, capital goods, media, and telecommunications companies, as well as a broad array of other industries. From a ratings perspective, we deployed cash mostly into single B and BB rated issuers. While our changes across these conventional measures were relatively small, the Fund changed more significantly across broader risk-based measures.
Although this effort has been ongoing for several quarters, we believe that it most likely reached a crescendo in the first three months of 2016. We have worked to increase the Fund’s liquidity profile by reducing positions that are less easily traded, while not eliminating the exposure to credits that we believe represent real long-term value. Furthermore, while the number of Fund holdings at the end of the reporting period remained slightly above its historical average, at 172, the issuers in which we are invested are more evenly distributed. The Fund’s industry positioning has also become more uniform, with only two “level” (sub-industry) sectors, insurance and restaurants, overweighted relative to the benchmark BofA ML Global High Yield Constrained Index by more than 2%.
In late 2015 and early 2016, we incurred the costs of increasing the Fund’s diversification among its historically smaller issuer count by lowering the industry concentrations and reducing the aggregate weighting of the Fund’s 10 largest positions. We believe that, in March and April 2016, the Fund’s performance began to reap the benefits of the stability we seek to garner from this repositioning. We have not abandoned our historic bottom-up investing approach. In fact, we very deliberately “planted our flags” in a few specific names, including energy- and commodity-related issuers. These were not “easy” positions, in our opinion, but they benefited Fund performance over the last three months of the reporting period.
Finally, and perhaps most importantly, in our view, we are asking more questions, seeking to defeat the strain of consensus that can ossify any organization. In this effort, it is especially important that we pull more upon Aberdeen’s global reach. While our broad purview has exposed the Fund to more volatility, we think that it should also expose it to more opportunity. We are increasing our efforts to find that opportunity on a day-to-day basis within the team and as part of the Aberdeen organization worldwide.
At the end of the reporting period on April 30, 2016, the Fund’s most significant overweight allocations relative to the benchmark BofA ML Global High Yield Constrained Index were in loans (which are not represented in the index) and U.S. bonds (which is also the largest absolute position). The Fund’s most notable underweight positions included emerging-market corporate bonds and euro- and British pound-denominated credits.
In the current environment of relatively slow global economic growth, default expectations for both the high-yield market and specific issues within the asset class are subject to much greater uncertainty. Additionally, recovery values appear to be declining, political uncertainty abounds, and concerns around liquidity remain. Investors are seeking compensation for these additional risks. We believe that current credit spreads in the market compensate for these concerns, especially relative to the equity and investment-grade bond asset classes. Beyond these broad outlines, however, we believe that there currently are pockets of both greater risk and greater opportunity in the market. We are somewhat more cautious on European high yield than we were at the beginning of 2016. We expect volatility leading up to the British vote on European Union membership in late June and the return of Greek credit headline risk as the summer progresses. As we have learned from past episodes,
2016 Semi-Annual Report
27
Aberdeen Global High Income Fund (Unaudited)
the market no longer looks beyond these macroeconomic events, at least in the short term. Consequently, we believe that there may be opportunities to buy securities of high-quality European issuers at cheaper price points in the months to come.
In the emerging markets, the opportunities remain very specific to geography and issuer, in our view. We have added marginally to our emerging markets positions over the past few months, but the Fund remains underweight relative to the benchmark and is fairly conservatively positioned. By default, therefore, we think that the U.S. high-yield market seems relatively more attractive in the near term.
Away from geographical regions, we are focusing on companies that may benefit from lower commodity prices or an improving U.S. consumer; exporters that are producing in countries that have experienced substantial currency depreciation; and companies that we believe are being incorrectly viewed by investors as cyclical or commodity-oriented. Therefore, we have built positions in a U.S. airline, a U.S. auto leasing company, and a Brazilian meat-packer over the past several months. We intend to continue to search for these and other types of opportunities going forward. We hope to gradually improve the Fund’s performance over the coming months.
Portfolio Management:
Aberdeen North American Fixed Income Team
PAST PERFORMANCE DOES NOT GUARANTEE FUTURE RESULTS.
The performance quoted represents past performance, which does not guarantee future results. Class A shares have up to a 0.25% 12b-1 fee. The investment return and principal value of an investment will fluctuate so that an investor’s shares, when redeemed, may be worth more or less than their original cost. Current performance of the Fund may be lower or higher than the performance quoted. Performance data current to the most recent month-end may be obtained by calling 866-667-9231 or visiting www.aberdeen-asset.us.
Investing in mutual funds involves risk, including the possible loss of principal. There is no assurance that the investment objective of any fund will be achieved. Indexes are unmanaged and have been provided for comparison purposes only. No fees or expenses are reflected. You cannot invest directly in an index.
Lipper is a leading global provider of mutual fund information and analysis to fund companies, financial intermediaries and media organizations.
Risk Considerations
Fixed income securities are subject to certain risks including, but not limited to: interest rate (changes in interest rates may cause a decline in the market value of an investment), credit (changes in the financial condition of the issuer, borrower, counterparty, or underlying collateral), prepayment (debt issuers may repay or refinance their loans or obligations earlier than anticipated), and extension (principal repayments may not occur as quickly as anticipated, causing the expected maturity of a security to increase).
Non-investment-grade debt securities (high yield/junk bonds) may be subject to greater market fluctuations, risk of default or loss of income and principal than higher-rated securities.
Derivatives are speculative and may hurt the Fund’s performance. They present the risk of disproportionately increased losses and/or reduced gains when the financial asset or measure to which the derivative is linked changes in unexpected ways.
Foreign securities may be more volatile, harder to price and less liquid than U.S. securities. They are subject to different accounting and regulatory standards and currency exchange rate, political and economic risks. Fluctuation in currency exchange rates may impact a Fund’s returns more greatly to the extent a Fund does not hedge currency exposure or hedging techniques are unsuccessful. The foregoing risks are enhanced in emerging market countries.
Investing a significant portion of the Fund’s assets in securities of companies conducting business in a broadly related group of industries within an economic sector may make the Fund more vulnerable to unfavorable developments in that sector.
Please read the prospectus for more detailed information regarding these and other risks.
| 1 | The Bank of America Merrill Lynch (BofA ML) High Yield US Emerging Markets Corporate Plus Index tracks the performance of US dollar denominated below investment grade emerging markets corporate debt publicly issued in the US domestic or Eurobond market. |
| 2 | The BofA ML Global High Yield European Issuers Constrained Index contains all securities in the BofA ML Global High Yield European Issuers High Yield Index but caps issuer exposure at 3%. Index constituents are capitalization-weighted, based on their current amount outstanding, provided the total allocation to an individual issuer does not exceed 3%. Indexes are unmanaged and have been provided for comparison purposes only. No fees or expenses are reflected. You cannot invest directly in an index. |
| 3 | The BofA ML U.S. High Yield Master II Index tracks the performance of below-investment-grade U.S. dollar-denominated corporate bonds issued in the U.S. domestic market. |
| 4 | Standard & Poor’s is an international credit rating agency that evaluates credit risk. Agency credit ratings are expressed as letter grades that range from “AAA” to “D” to communicate the respective agency’s opinion of relative level of credit risk. |
| 5 | Diversification does not ensure a profit or protect against a loss in a declining market. |
| 6 | Sharpe ratio measures risk-adjusted performance. |
| 7 | A credit default swap is a type of contract that offers a guarantee against the non-payment of a loan. |
| 8 | A currency forward is a binding contract in the foreign exchange market that locks in the exchange rate for the purchase or sale of a currency on a future date. |
2016 Semi-Annual Report
28
Aberdeen Global High Income Fund (Unaudited)
Average Annual Total Return (For periods ended April 30, 2016) | Six Month† | 1 Yr. | 5 Yr. | 10 Yr. | ||||||||||
Class A | (2.78%)* | (8.67%) | 2.17% | 5.60% | ||||||||||
Institutional Class | (2.67%) | (8.35%) | 2.45% | 5.88% | ||||||||||
| † | Not Annualized |
| * | The Fund’s total return for the six-month period ended April 30, 2016 is based on the published NAV. |
Semi-Annual Report 2016
29
Aberdeen Global High Income Fund (Unaudited)
Performance of a $10,000 Investment (as of April 30, 2016)
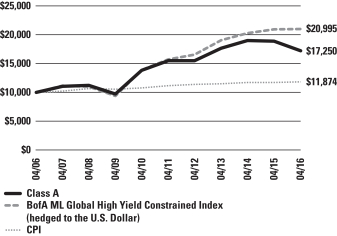
Comparative performance of $10,000 invested in Class A shares of the Aberdeen Global High Income Fund, BofA ML Global High Yield Constrained Index (hedged to the U.S. Dollar) and the Consumer Price Index (CPI) over a 10-year period ended April 30, 2016. Unlike the Fund’s returns, the returns for these unmanaged indexes do not reflect any fees or expenses. Investors cannot invest directly in market indexes.
The BofA ML Global High Yield Constrained Index (hedged to the U.S. Dollar) tracks the performance of USD, CAD, GBP and EUR denominated below investment grade corporate debt publicly issued in the major domestic or eurobond markets but caps issuer exposure at 2%.
The CPI is a measure of the average change over time in the prices paid by urban consumers for a market basket of consumer goods and services.
Investment return and principal value will fluctuate, and when redeemed, shares may be worth more or less than original cost. Past performance is no guarantee of future results. The Average Annual Total Return table and performance graph do not reflect the deduction of taxes that a shareholder would pay on Fund distributions or the redemption of Fund shares. Investing in mutual funds involves market risk, including loss of principal. Performance returns assume the reinvestment of all distributions. Performance returns reflect fee waivers and reimbursements in effect without which returns would have been lower.
Portfolio Summary (as a percentage of net assets)
April 30, 2016 (Unaudited)
| Asset Allocation | ||||
Corporate Bonds | 79.5% | |||
Bank Loans | 6.3% | |||
Exchange Traded Funds | 6.3% | |||
Government Bonds | 3.2% | |||
Government Agencies | 1.6% | |||
Preferred Stocks | 0.5% | |||
Common Stocks | 0.5% | |||
Repurchase Agreement | 0.2% | |||
Other assets in excess of liabilities | 1.9% | |||
| 100.0% | ||||
The following chart summarizes the composition of the Fund’s portfolio, expressed as a percentage of net assets. The industries listed below may include more than one industry group. As of April 30, 2016, the Fund did not have more than 25% of its assets invested in any industry group.
| Top Industries | ||||
Diversified Telecommunication Services | 8.7% | |||
Commercial Banks | 6.3% | |||
Oil, Gas & Consumable Fuels | 5.3% | |||
Diversified Financial Services | 4.5% | |||
Media | 3.9% | |||
Healthcare Providers & Services | 3.5% | |||
Retail | 3.3% | |||
Chemicals | 2.8% | |||
Electric Utilities | 2.5% | |||
Commercial Services & Supplies | 2.4% | |||
Other | 56.8% | |||
| 100.0% | ||||
| Top Holdings* | ||||
iShares iBoxx $ High Yield Corporate Bond ETF | 3.6% | |||
SPDR Barclays High Yield Bond ETF | 2.7% | |||
Pertamina Persero PT 05/20/2023 | 1.1% | |||
Sprint Corp. 09/15/2023 | 1.1% | |||
Del Monte Foods, Inc. 08/18/2021 | 1.1% | |||
Oasis Petroleum, Inc. 01/15/2023 | 1.0% | |||
Lloyds Bank PLC 01/21/2029 | 1.0% | |||
Rite Aid Corp. 04/01/2023 | 1.0% | |||
Scientific Games International, Inc. 01/01/2022 | 0.9% | |||
Sinclair Television Group, Inc. 08/01/2024 | 0.9% | |||
Other | 85.6% | |||
| 100.0% | ||||
| * | For the purpose of listing top holdings, repurchase agreements are included as part of Other. |
| Top Countries | ||||
United States | 61.0% | |||
United Kingdom | 8.2% | |||
Canada | 5.3% | |||
Indonesia | 2.9% | |||
Luxembourg | 2.2% | |||
Germany | 2.2% | |||
France | 1.7% | |||
Italy | 1.5% | |||
Netherlands | 1.4% | |||
Argentina | 1.4% | |||
Other | 12.2% | |||
| 100.0% | ||||
2016 Semi-Annual Report
30
Statement of Investments
April 30, 2016 (Unaudited)
Aberdeen Global High Income Fund
Shares or Principal Amount | Value (US$) | |||||||
CORPORATE BONDS (79.5%) | ||||||||
AUSTRALIA (0.8%) | ||||||||
QBE Insurance Group Ltd. (USD), 6.75%, 12/02/2044 (a)(b) | $ | 6,511,000 | $ | 7,015,602 | ||||
BELGIUM (0.4%) | ||||||||
KBC Groep NV (EUR), | 3,455,000 | 3,822,629 | ||||||
BRAZIL (1.3%) | ||||||||
Banco do Brasil SA (USD), | 5,250,000 | 3,793,125 | ||||||
Petrobras Global Finance BV (USD), 6.25%, 03/17/2024 | 1,785,000 | 1,561,875 | ||||||
Petrobras International Finance Co. (USD), 5.38%, 01/27/2021 | 6,905,000 | 6,154,081 | ||||||
| 11,509,081 | ||||||||
CANADA (5.3%) | ||||||||
Air Canada (USD), 6.75%, 10/01/2019 (a) | 3,970,000 | 4,168,500 | ||||||
First Quantum Minerals Ltd. (USD), 7.25%, 10/15/2019 (a) | 3,971,000 | 3,395,205 | ||||||
Gateway Casinos & Entertainment Ltd. (CAD), 8.50%, 11/26/2020 (a) | 6,837,000 | 5,149,410 | ||||||
GFL Environmental, Inc. (USD), 9.88%, 02/01/2021 (a) | 3,235,000 | 3,429,100 | ||||||
Kissner Milling Co. Ltd. (USD), 7.25%, 06/01/2019 (a) | 4,670,000 | 4,623,300 | ||||||
MEG Energy Corp. | ||||||||
(USD), 6.38%, 01/30/2023 (a) | 7,944,000 | 6,092,095 | ||||||
(USD), 7.00%, 03/31/2024 (a) | 3,666,000 | 2,896,140 | ||||||
Northgroup Preferred Capital Corp. (USD), 6.38%, 10/15/2017 (a)(b)(c) | 5,890,000 | 5,948,900 | ||||||
SCM Insurance Services, Inc. (CAD), 9.25%, 08/22/2019 (d) | 7,230,000 | 4,667,490 | ||||||
Valeant Pharmaceuticals International, Inc. (EUR), 4.50%, 05/15/2023 (a) | 6,150,000 | 5,651,253 | ||||||
| 46,021,393 | ||||||||
CHINA (0.6%) | ||||||||
Country Garden Holdings Co. Ltd. (USD), 7.50%, 01/10/2023 (a) | 2,611,000 | 2,684,573 | ||||||
Wanda Properties International Co. Ltd. (USD), 7.25%, 01/29/2024 (a) | 2,050,000 | 2,121,444 | ||||||
| 4,806,017 | ||||||||
FRANCE (1.7%) | ||||||||
Credit Agricole SA (USD), | 1,825,000 | 1,760,676 | ||||||
Magnolia BC SA (EUR), 9.00%, 08/01/2020 (a) | 2,915,000 | 3,565,121 | ||||||
Numericable-SFR SAS | ||||||||
(USD), 4.88%, 05/15/2019 (a) | 1,369,000 | 1,419,790 | ||||||
(USD), 6.00%, 05/15/2022 (a) | 6,718,000 | 6,751,926 | ||||||
(USD), 7.38%, 05/01/2026 (a) | 978,000 | 993,893 | ||||||
Societe Generale SA (USD), 4.75%, 11/24/2025 (a) | 646,000 | 649,888 | ||||||
| 15,141,294 | ||||||||
GERMANY (1.1%) | ||||||||
ALBA Group PLC & Co. KG (EUR), | 4,375,000 | 4,678,962 | ||||||
Safari Holding Verwaltungs GmbH (EUR), 8.25%, 02/15/2021 (a) | 3,685,000 | 4,443,989 | ||||||
| 9,122,951 | ||||||||
INDONESIA (0.7%) | ||||||||
Pelabuhan Indonesia II PT (USD), 4.25%, 05/05/2025 (a) | 6,326,000 | 6,159,943 | ||||||
ITALY (0.9%) | ||||||||
LKQ Italia Bondco SpA (EUR), 3.88%, 04/01/2024 (a) | 1,221,000 | 1,462,769 | ||||||
Wind Acquisition Finance SA | ||||||||
(USD), 4.75%, 07/15/2020 (a) | 2,235,000 | 2,144,482 | ||||||
(USD), 7.38%, 04/23/2021 (a) | 4,623,000 | 4,137,585 | ||||||
| 7,744,836 | ||||||||
JERSEY (0.3%) | ||||||||
Lincoln Finance Ltd. | ||||||||
(EUR), 6.88%, 04/15/2021 (a) | 942,000 | 1,160,209 | ||||||
(USD), 7.38%, 04/15/2021 (a) | 467,000 | 498,523 | ||||||
TVL Finnace PLC (GBP), 8.50%, 05/15/2023 (a) | 892,000 | 1,303,347 | ||||||
| 2,962,079 | ||||||||
LUXEMBOURG (2.2%) | ||||||||
Altice Financing SA (USD), 7.50%, 05/15/2026 (a) | 1,840,000 | 1,846,900 | ||||||
ArcelorMittal (USD), 6.50%, 03/01/2021 | 3,010,000 | 3,092,775 | ||||||
Bank of New York Mellon Luxembourg SA (The), Series PRX (EUR), 4.30%, 12/15/2050 (b) | 4,100,000 | 1,737,041 | ||||||
Coveris Holdings SA (USD), 7.88%, 11/01/2019 (a) | 1,525,000 | 1,471,625 | ||||||
Globe Luxembourg SCA (USD), 9.63%, 05/01/2018 (a) | 422,000 | 331,270 | ||||||
Intelsat Jackson Holdings SA (USD), 8.00%, 02/15/2024 (a) | 4,229,000 | 4,387,588 | ||||||
OHL Investments SA, Series OHL, (EUR), 4.00%, 04/25/2018 (a) | 4,700,000 | 4,994,252 | ||||||
Trinseo Materials Operating SCA / Trinseo Materials Finance, Inc. (EUR), 6.38%, 05/01/2022 (a) | 745,000 | 875,455 | ||||||
| 18,736,906 | ||||||||
MEXICO (0.8%) | ||||||||
Alfa SAB de CV | ||||||||
(USD), 5.25%, 03/25/2024 (a) | 2,730,000 | 2,904,038 | ||||||
(USD), 6.88%, 03/25/2044 (a) | 3,563,000 | 3,687,705 | ||||||
| 6,591,743 | ||||||||
NETHERLANDS (1.4%) | ||||||||
Constellium NV (USD), 8.00%, 01/15/2023 (a) | 4,980,000 | 4,295,250 | ||||||
ING Groep NV (USD), 6.50%, 04/16/2025 (b)(c) | 3,689,000 | 3,414,630 | ||||||
VTR Finance BV (USD), 6.88%, 01/15/2024 (a) | 4,435,000 | 4,440,544 | ||||||
| 12,150,424 | ||||||||
See accompanying Notes to Financial Statements.
Semi-Annual Report 2016
31
Statement of Investments (continued)
April 30, 2016 (Unaudited)
Aberdeen Global High Income Fund
Shares or Principal Amount | Value (US$) | |||||||
REPUBLIC OF IRELAND (1.3%) | ||||||||
Ardagh Packaging Finance PLC / Ardagh Holdings USA, Inc. (USD), 7.25%, 05/15/2024 (a) | $ | 678,000 | $ | 678,000 | ||||
Argon Capital PLC for Royal Bank of Scotland (GBP), 2.92%, 06/30/2016 (b)(c) | 3,203,000 | 3,954,656 | ||||||
Endo Ltd. / Endo Finance LLC / Endo Finco, Inc. (USD), 6.00%, 07/15/2023 (a) | 6,327,000 | 6,240,004 | ||||||
| 10,872,660 | ||||||||
RUSSIA (0.2%) | ||||||||
Lukoil International Finance BV (USD), 4.56%, 04/24/2023 (a) | 2,164,000 | 2,113,958 | ||||||
SOUTH AFRICA (0.5%) | ||||||||
Sappi Papier Holding GmbH (USD), 7.50%, 06/15/2032 (a)(d) | 4,647,000 | 4,275,240 | ||||||
SWEDEN (0.3%) | ||||||||
Corral Petroleum Holdings (EUR), 11.75%, 05/15/2021 (a) | 2,290,000 | 2,584,878 | ||||||
SWITZERLAND (0.9%) | ||||||||
UBS Group AG (USD), | 3,374,000 | 3,495,427 | ||||||
Unilabs Subholding AB (EUR), 8.50%, 07/15/2018 (a) | 3,700,000 | 4,405,624 | ||||||
| 7,901,051 | ||||||||
UNITED KINGDOM (8.2%) | ||||||||
Annington Finance No 5 PLC (GBP), 13.00%, 01/15/2023 (a)(e) | 1,971,255 | 3,258,770 | ||||||
Avanti Communications Group PLC (USD), 10.00%, 10/01/2019 (a) | 9,083,000 | 6,766,835 | ||||||
British Telecommunications PLC (USD), 5.95%, 01/15/2018 | 1,407,000 | 1,516,119 | ||||||
Ensco PLC (USD), 5.20%, 03/15/2025 | 4,123,000 | 3,009,790 | ||||||
Galaxy Finco Ltd. (GBP), 7.88%, 11/15/2021 (a) | 1,600,000 | 2,312,125 | ||||||
Inmarsat Finance PLC (USD), 4.88%, 05/15/2022 (a) | 7,917,000 | 7,560,735 | ||||||
International Personal Finance PLC (EUR), 5.75%, 04/07/2021 (a) | 4,313,000 | 4,518,821 | ||||||
Jaguar Land Rover Automotive PLC (GBP), 3.88%, 03/01/2023 (a) | 2,930,000 | 4,120,628 | ||||||
Lloyds Bank PLC (GBP), 13.00%, 01/21/2029 (b)(c) | 3,638,000 | 8,861,286 | ||||||
Matalan Finance PLC (GBP), 6.88%, 06/01/2019 (a) | 2,480,000 | 2,968,226 | ||||||
Nationwide Building Society (GBP), 6.88%, 06/20/2019 (a)(b)(c) | 2,475,000 | 3,433,723 | ||||||
Pizzaexpress Financing 2 PLC (GBP), 6.63%, 08/01/2021 (a) | 2,235,000 | 3,324,539 | ||||||
Rexam PLC (EUR), 6.75%, 06/29/2067 (a)(b) | 5,175,000 | 6,003,428 | ||||||
Royal Bank of Scotland Group PLC (USD), 5.13%, 05/28/2024 | 2,060,000 | 2,019,649 | ||||||
Unique Pub Finance Co. PLC (The), Series M (GBP), 7.40%, 03/28/2024 (a) | 5,506,000 | 7,887,115 | ||||||
Virgin Media Secured Finance PLC (GBP), 5.50%, 01/15/2025 (a) | 2,784,600 | 4,038,206 | ||||||
| 71,599,995 | ||||||||
UNITED STATES (50.1%) | ||||||||
Ally Financial, Inc. (USD), 5.13%, 09/30/2024 | 5,845,000 | 6,144,556 | ||||||
Altice US Finance I Corp. (USD), 5.38%, 07/15/2023 (a) | 7,773,000 | 7,965,770 | ||||||
Avis Budget Car Rental LLC / Avis Budget Finance, Inc. | ||||||||
(USD), 5.50%, 04/01/2023 | 2,427,000 | 2,328,828 | ||||||
(USD), 6.38%, 04/01/2024 (a) | 978,000 | 975,555 | ||||||
(USD), 5.25%, 03/15/2025 (a) | 423,000 | 389,689 | ||||||
Bank of America Corp., Series X (USD), 6.25%, 09/05/2024 (b)(c) | 1,725,000 | 1,733,625 | ||||||
Blue Racer Midstream LLC / Blue Racer Finance Corp. (USD), 6.13%, 11/15/2022 (a) | 4,944,000 | 4,400,160 | ||||||
Building Materials Holding Corp. (USD), 9.00%, 09/15/2018 (a) | 4,140,000 | 4,350,941 | ||||||
CalAtlantic Group, Inc. (USD), 5.88%, 11/15/2024 | 4,250,000 | 4,515,625 | ||||||
Calpine Corp. (USD), 5.75%, 01/15/2025 | 6,830,000 | 6,923,912 | ||||||
CCO Holdings LLC / CCO Holdings Capital Corp. (USD), 5.50%, 05/01/2026 (a) | 1,182,000 | 1,208,595 | ||||||
CCOH Safari LLC (USD), 5.75%, 02/15/2026 (a) | 7,558,000 | 7,822,530 | ||||||
CenturyLink, Inc. | ||||||||
Series W (USD), 6.75%, 12/01/2023 | 1,265,000 | 1,250,769 | ||||||
Series Y (USD), 7.50%, 04/01/2024 | 1,483,000 | 1,490,415 | ||||||
Series P (USD), 7.60%, 09/15/2039 | 2,830,000 | 2,419,650 | ||||||
Series U (USD), 7.65%, 03/15/2042 | 4,460,000 | 3,813,300 | ||||||
Cenveo Corp. (USD), 6.00%, 08/01/2019 (a) | 3,257,000 | 2,540,460 | ||||||
CHS/Community Health Systems, Inc. (USD), 6.88%, 02/01/2022 | 2,442,000 | 2,222,220 | ||||||
Citigroup, Inc., Series T, FRN (USD), 6.25%, 08/15/2026 (b)(c) | 2,000,000 | 2,060,000 | ||||||
Constellation Brands, Inc. (USD), 4.75%, 12/01/2025 | 4,912,000 | 5,237,420 | ||||||
Continental Resources, Inc. (USD), 3.80%, 06/01/2024 | 3,952,000 | 3,388,840 | ||||||
Daimler Finance North America LLC (USD), 2.70%, 08/03/2020 (a) | 2,200,000 | 2,253,002 | ||||||
Dana Holding Corp. (USD), 6.00%, 09/15/2023 | 2,570,000 | 2,608,550 | ||||||
DPH Holdings Corp. (USD), 6.55%, 06/15/2006 (d)(f) | 1,500,000 | 43,125 | ||||||
DR Horton, Inc. (USD), 5.75%, 08/15/2023 | 5,870,000 | 6,457,000 | ||||||
Dynegy, Inc. | ||||||||
(USD), 7.38%, 11/01/2022 | 7,155,000 | 7,103,341 | ||||||
(USD), 7.63%, 11/01/2024 | 1,641,000 | 1,612,283 | ||||||
Eagle Spinco, Inc. (USD), 4.63%, 02/15/2021 | 407,000 | 406,491 | ||||||
Energy Future Intermediate Holding Co. LLC / EFIH Finance, Inc. (USD), 11.75%, 03/01/2022 (a)(f) | 3,567,244 | 3,825,869 | ||||||
Energy Transfer Partners LP (USD), 5.20%, 02/01/2022 | 3,279,000 | 3,316,610 | ||||||
Equinix, Inc. (USD), 5.88%, 01/15/2026 | 4,405,000 | 4,672,031 | ||||||
See accompanying Notes to Financial Statements.
2016 Semi-Annual Report
32
Statement of Investments (continued)
April 30, 2016 (Unaudited)
Aberdeen Global High Income Fund
Shares or Principal Amount | Value (US$) | |||||||
First Data Corp. | ||||||||
(USD), 7.00%, 12/01/2023 (a) | $ | 3,311,000 | $ | 3,414,469 | ||||
(USD), 5.00%, 01/15/2024 (a) | 6,064,000 | 6,147,380 | ||||||
First Maryland Capital I (USD), 1.63%, 01/15/2027 (b) | 3,113,000 | 2,505,965 | ||||||
Florida East Coast Holdings Corp. | ||||||||
(USD), 6.75%, 05/01/2019 (a) | 2,395,000 | 2,430,925 | ||||||
(USD), 9.75%, 05/01/2020 (a)(d) | 3,595,000 | �� | 2,822,075 | |||||
Freeport-McMoRan, Inc. (USD), 3.55%, 03/01/2022 | 6,355,000 | 5,338,200 | ||||||
Fresh Market, Inc. (The) (USD), 9.75%, 05/01/2023 (a) | 3,025,000 | 2,987,188 | ||||||
Frontier Communications Corp. (USD), 10.50%, 09/15/2022 (a) | 4,514,000 | 4,661,247 | ||||||
GCP Applied Technologies, Inc. (USD), 9.50%, 02/01/2023 (a) | 529,000 | 580,578 | ||||||
General Motors (Escrow Shares) | ||||||||
(USD), 8.80%, 03/01/2049 (g) | 7,200,000 | – | ||||||
(USD), 8.38%, 07/15/2049 (g) | 3,550,000 | – | ||||||
GenOn Energy, Inc. (USD), 7.88%, 06/15/2017 | 1,110,000 | 965,700 | ||||||
Goldman Sachs Group, Inc. (The), Series M, (USD), 5.38%, 05/10/2020 (b)(c) | 1,960,000 | 1,894,830 | ||||||
Goodyear Tire & Rubber Co. (The) (USD), 5.13%, 11/15/2023 | 7,383,000 | 7,659,862 | ||||||
Hardwoods Acquisition, Inc. (USD), 7.50%, 08/01/2021 (a) | 5,385,000 | 4,281,075 | ||||||
HCA, Inc. | ||||||||
(USD), 5.25%, 04/15/2025 | 5,435,000 | 5,638,812 | ||||||
(USD), 5.88%, 02/15/2026 | 5,923,000 | 6,159,920 | ||||||
(USD), 5.25%, 06/15/2026 | 260,000 | 270,725 | ||||||
HD Supply, Inc. (USD), 5.75%, 04/15/2024 (a) | 4,621,000 | 4,857,826 | ||||||
Hilcorp Energy I LP / Hilcorp Finance Co. (USD), 5.75%, 10/01/2025 (a) | 733,000 | 694,518 | ||||||
Hornbeck Offshore Services, Inc. (USD), 5.00%, 03/01/2021 | 3,788,000 | 2,429,055 | ||||||
International Lease Finance Corp. (USD), 6.25%, 05/15/2019 | 7,160,000 | 7,786,500 | ||||||
JBS USA LLC / JBS USA Finance, Inc. (USD), 5.75%, 06/15/2025 (a) | 4,652,000 | 4,303,100 | ||||||
Jefferies Finance LLC / JFIN Co-Issuer Corp. | ||||||||
(USD), 7.38%, 04/01/2020 (a) | 1,010,000 | 936,775 | ||||||
(USD), 6.88%, 04/15/2022 (a) | 1,287,000 | 1,132,560 | ||||||
JPMorgan Chase & Co., Series X (USD), 6.10%, 10/01/2024 (b)(c) | 1,850,000 | 1,905,500 | ||||||
Kinder Morgan, Inc. (USD), 7.80%, 08/01/2031 | 6,744,000 | 7,323,424 | ||||||
Kindred Healthcare, Inc. (USD), 8.75%, 01/15/2023 | 2,360,000 | 2,354,100 | ||||||
Kratos Defense & Security Solutions, Inc. (USD), 7.00%, 05/15/2019 | 5,165,000 | 4,106,175 | ||||||
Landry’s Holdings II, Inc. (USD), 10.25%, 01/01/2018 (a) | 5,714,000 | 5,771,140 | ||||||
Landry’s, Inc. (USD), 9.38%, 05/01/2020 (a) | 2,486,000 | 2,616,515 | ||||||
Lennar Corp. (USD), 4.88%, 12/15/2023 | 4,696,000 | 4,789,920 | ||||||
Level 3 Communications, Inc. (USD), 5.75%, 12/01/2022 | 1,151,000 | 1,186,117 | ||||||
Level 3 Financing, Inc. | ||||||||
(USD), 5.38%, 08/15/2022 | 4,504,000 | 4,622,230 | ||||||
(USD), 5.38%, 01/15/2024 (a) | 1,000,000 | 1,017,500 | ||||||
(USD), 5.25%, 03/15/2026 (a) | 1,791,000 | 1,822,343 | ||||||
Shares or Principal Amount | Value (US$) | |||||||
Marathon Petroleum Corp. (USD), 3.63%, 09/15/2024 | $ | 1,785,000 | $ | 1,712,606 | ||||
Meritor, Inc. (USD), 6.25%, 02/15/2024 | 2,580,000 | 2,315,550 | ||||||
MGM Resorts International (USD), 6.00%, 03/15/2023 | 5,210,000 | 5,424,912 | ||||||
MHGE Parent LLC / MHGE Parent Finance, Inc. (USD), 8.50%, 08/01/2019 (a) | 3,336,000 | 3,369,360 | ||||||
Micron Technology, Inc. (USD), 5.25%, 01/15/2024 (a) | 1,716,000 | 1,385,670 | ||||||
Momentive Performance Materials, Inc. | ||||||||
(USD), 8.88%, 10/15/2020 (g) | 14,578,000 | – | ||||||
(USD), 3.88%, 10/24/2021 | 6,475,000 | 4,985,750 | ||||||
Morgan Stanley, Series J, (USD), 5.55%, 07/15/2020 (b)(c) | 1,964,000 | 1,946,815 | ||||||
Nationstar Mortgage LLC / Nationstar Capital Corp. (USD), 6.50%, 07/01/2021 | 3,475,000 | 3,066,688 | ||||||
Neiman Marcus Group Ltd., LLC (USD), 8.00%, 10/15/2021 (a) | 3,958,000 | 3,463,250 | ||||||
New Enterprise Stone & Lime Co., Inc. (USD), 12.00%, 03/15/2018 (e) | 4,468,239 | 4,624,627 | ||||||
NewStar Financial, Inc. (USD), 7.25%, 05/01/2020 | 6,093,000 | 5,689,339 | ||||||
NRG Energy, Inc. | ||||||||
(USD), 6.63%, 03/15/2023 | 1,074,000 | 1,060,575 | ||||||
(USD), 6.25%, 05/01/2024 | 875,000 | 857,500 | ||||||
Oasis Petroleum, Inc. |
| |||||||
(USD), 6.50%, 11/01/2021 | 993,000 | 913,560 | ||||||
(USD), 6.88%, 03/15/2022 | 706,000 | 633,635 | ||||||
(USD), 6.88%, 01/15/2023 | 10,000,000 | 9,025,000 | ||||||
Palace Entertainment Holdings LLC / Palace Entertainment Holdings Corp. (USD), 8.88%, 04/15/2017 (a) | 6,379,000 | 6,379,000 | ||||||
PBF Logistics LP / PBF Logistics Finance Corp. (USD), 6.88%, 05/15/2023 | 1,767,000 | 1,718,408 | ||||||
PNC Preferred Funding Trust I (USD), 2.28%, 03/15/2017 (a)(b)(c) | 7,510,000 | 6,477,375 | ||||||
PQ Corp. (USD), 6.75%, 11/15/2022 (a) | 1,250,000 | 1,292,188 | ||||||
QVC, Inc. | ||||||||
(USD), 4.38%, 03/15/2023 | 505,000 | 504,983 | ||||||
(USD), 4.45%, 02/15/2025 | 2,300,000 | 2,287,380 | ||||||
Rite Aid Corp. (USD), 6.13%, 04/01/2023 (a) | 8,100,000 | 8,661,978 | ||||||
Sabine Pass Liquefaction LLC | ||||||||
(USD), 5.63%, 04/15/2023 | 1,380,000 | 1,359,300 | ||||||
(USD), 5.75%, 05/15/2024 | 7,529,000 | 7,321,952 | ||||||
Scientific Games International, Inc. (USD), 7.00%, 01/01/2022 (a) | 7,822,000 | 8,012,661 | ||||||
Sealed Air Corp. | ||||||||
(USD), 5.25%, 04/01/2023 (a) | 270,000 | 286,538 | ||||||
(USD), 5.50%, 09/15/2025 (a) | 3,780,000 | 4,020,975 | ||||||
Service Corp. International (USD), 5.38%, 05/15/2024 | 5,504,000 | 5,889,280 | ||||||
Sinclair Television Group, Inc. | ||||||||
(USD), 5.63%, 08/01/2024 (a) | 7,760,000 | 8,002,500 | ||||||
(USD), 5.88%, 03/15/2026 (a) | 573,000 | 594,488 | ||||||
Spectrum Brands, Inc. (USD), 5.75%, 07/15/2025 | 1,704,000 | 1,815,868 | ||||||
Springs Industries, Inc. (USD), 6.25%, 06/01/2021 | 4,607,000 | 4,710,657 | ||||||
Sprint Corp. (USD), 7.88%, 09/15/2023 | 12,010,000 | 9,427,850 | ||||||
See accompanying Notes to Financial Statements.
Semi-Annual Report 2016
33
Statement of Investments (continued)
April 30, 2016 (Unaudited)
Aberdeen Global High Income Fund
Shares or Principal Amount | Value (US$) | |||||||
Standard Industries, Inc. (USD), 5.38%, 11/15/2024 (a) | $ | 4,625,000 | $ | 4,844,687 | ||||
State Street Capital Trust IV (USD), 1.63%, 06/01/2077 (b) | 4,064,000 | 2,981,960 | ||||||
Sun Products Corp. (The) (USD), 7.75%, 03/15/2021 (a) | 6,806,000 | 6,448,685 | ||||||
Sunoco LP / Sunoco Finance Corp. (USD), 6.25%, 04/15/2021 (a) | 4,339,000 | 4,404,085 | ||||||
T-Mobile USA, Inc. | ||||||||
(USD), 6.00%, 04/15/2024 | 756,000 | 792,855 | ||||||
(USD), 6.50%, 01/15/2026 | 5,276,000 | 5,612,345 | ||||||
Tenet Healthcare Corp. | ||||||||
(USD), 4.13%, 06/15/2020 (a)(b) | 3,614,000 | 3,636,587 | ||||||
(USD), 6.75%, 06/15/2023 | 5,506,000 | 5,457,822 | ||||||
TransDigm, Inc. | ||||||||
(USD), 6.50%, 07/15/2024 | 3,115,000 | 3,153,938 | ||||||
(USD), 6.50%, 05/15/2025 | 2,129,000 | 2,147,629 | ||||||
Triumph Group, Inc. (USD), 5.25%, 06/01/2022 | 4,260,000 | 3,983,100 | ||||||
Tronox Finance LLC (USD), 7.50%, 03/15/2022 (a) | 3,506,000 | 2,927,510 | ||||||
United Continental Holdings, Inc. (USD), 6.00%, 12/01/2020 | 3,499,000 | 3,691,445 | ||||||
United Rentals North America, Inc. | ||||||||
(USD), 5.75%, 11/15/2024 | 4,470,000 | 4,553,812 | ||||||
(USD), 5.50%, 07/15/2025 | 4,725,000 | 4,716,561 | ||||||
WR Grace & Co-Conn | ||||||||
(USD), 5.13%, 10/01/2021 (a) | 4,926,000 | 5,169,837 | ||||||
(USD), 5.63%, 10/01/2024 (a) | 4,080,000 | 4,329,900 | ||||||
XPO Logistics, Inc. (USD), | 5,523,000 | 5,806,054 | ||||||
Zayo Group LLC / Zayo Capital, Inc. | ||||||||
(USD), 6.00%, 04/01/2023 | 7,503,000 | 7,746,847 | ||||||
(USD), 6.38%, 05/15/2025 | 1,090,000 | 1,137,688 | ||||||
| 435,676,976 | ||||||||
VIETNAM (0.5%) |
| |||||||
Vingroup JSC (USD), 11.63%, 05/07/2018 (a) | 4,230,000 | 4,621,275 | ||||||
Total Corporate Bonds | 691,430,931 | |||||||
GOVERNMENT BONDS (3.2%) | ||||||||
ARGENTINA (1.4%) |
| |||||||
Argentina Bonar Bonds | ||||||||
Series X (USD), 7.00%, 04/17/2017 | 4,357,558 | 4,441,329 | ||||||
(USD), 8.75%, 05/07/2024 | 2,672,897 | 2,918,748 | ||||||
Argentine Republic Government International Bond (USD), 7.50%, 04/22/2026 (a) | 4,585,000 | 4,665,238 | ||||||
| 12,025,315 | ||||||||
GHANA (0.4%) |
| |||||||
Republic of Ghana (USD), | 4,560,000 | 3,648,000 | ||||||
INDONESIA (0.9%) |
| |||||||
Indonesia Government International Bond (USD), 5.88%, 01/15/2024 (a) | 6,910,000 | 7,880,613 | ||||||
MEXICO (0.3%) |
| |||||||
Mexican Bonos, Series M (MXN), 7.75%, 05/29/2031 | 42,200,000 | 2,800,901 | ||||||
PARAGUAY (0.2%) |
| |||||||
Paraguay Government International Bond (USD), 5.00%, 04/15/2026 (a) | 1,620,000 | 1,656,450 | ||||||
Total Government Bonds | 28,011,279 | |||||||
GOVERNMENT AGENCIES (1.6%) | ||||||||
INDONESIA (1.3%) |
| |||||||
Pertamina Persero PT | ||||||||
(USD), 4.30%, 05/20/2023 (a) | 9,532,000 | 9,511,430 | ||||||
(USD), 6.00%, 05/03/2042 (a) | 2,165,000 | 2,088,736 | ||||||
| 11,600,166 | ||||||||
MEXICO (0.3%) |
| |||||||
Petroleos Mexicanos (USD), 6.88%, 08/04/2026 (a) | 1,935,000 | 2,140,110 | ||||||
Total Government Agencies | 13,740,276 | |||||||
BANK LOANS (6.3%) | ||||||||
GERMANY (1.1%) |
| |||||||
Colouroz Investment (Flint) (USD), 8.25%, 09/06/2022 | 6,595,000 | 6,149,837 | ||||||
Klockner-Pentaplast of America, Inc. (USD), 5.00%, 04/28/2020 | 2,341,225 | 2,347,077 | ||||||
KP Germany Erste GmbH (USD), 5.00%, 04/28/2020 | 1,000,523 | 1,003,025 | ||||||
| 9,499,939 | ||||||||
ITALY (0.6%) |
| |||||||
Inter Media Communication (FCE) (EUR), 5.50%, 05/28/2019 | 4,884,493 | 5,313,341 | ||||||
SPAIN (0.7%) |
| |||||||
IDCSalud Holding S.L.U. (EUR), 8.25%, 11/28/2022 | 5,283,000 | 5,958,599 | ||||||
UNITED STATES (3.9%) |
| |||||||
Asurion LLC (USD), 8.50%, 03/03/2021 (b) | 7,056,000 | 6,815,658 | ||||||
Birch Communications, Inc. (USD), 7.75%, 07/17/2020 (b) | 4,451,522 | 3,895,082 | ||||||
Cengage Learning, Inc. (USD), 7.00%, 03/31/2020 (b) | 6,597,261 | 6,570,872 | ||||||
Del Monte Foods, Inc. (USD), 8.25%, 08/18/2021 (b) | 12,470,000 | 9,383,675 | ||||||
New Lightsquared LLC (USD), 9.75%, 06/15/2020 | 4,637,646 | 4,208,664 | ||||||
New Media Holdings II, LLC (USD), 7.25%, 06/04/2020 | 3,383,811 | 3,316,135 | ||||||
| 34,190,086 | ||||||||
Total Bank Loans | 54,961,965 | |||||||
See accompanying Notes to Financial Statements.
2016 Semi-Annual Report
34
Statement of Investments (continued)
April 30, 2016 (Unaudited)
Aberdeen Global High Income Fund
Shares or Principal Amount | Value (US$) | |||||||
COMMON STOCKS (0.5%) | ||||||||
NORWAY (0.5%) | ||||||||
Deep Ocean (NOK) (d)(g)(h) | $ | 1,427,968 | $ | 4,282,760 | ||||
UNITED STATES (0.0%) | ||||||||
Lear Corp (USD). | 1 | 115 | ||||||
Total Common Stocks | 4,282,875 | |||||||
PREFERRED STOCKS (0.5%) | ||||||||
UNITED STATES (0.5%) | ||||||||
GMAC Capital Trust I, Preferred Shares, Series 2 (USD) | 176,738 | 4,430,822 | ||||||
Merrill Lynch Capital Trust II, Preferred Shares (USD) | 1,600 | 41,600 | ||||||
| 4,472,422 | ||||||||
Total Preferred Stocks | 4,472,422 | |||||||
EXCHANGE TRADED FUNDS (6.3%) | ||||||||
UNITED STATES (6.3%) | ||||||||
iShares iBoxx $ High Yield Corporate Bond ETF (USD) | 378,115 | 31,704,943 | ||||||
SPDR Barclays High Yield Bond ETF (USD) | 665,395 | 23,488,443 | ||||||
| 55,193,386 | ||||||||
Total Exchange Traded Funds | 55,193,386 | |||||||
REPURCHASE AGREEMENT (0.2%) | ||||||||
UNITED STATES (0.2%) | ||||||||
Repurchase Agreement, Fixed Income Clearing Corp., 0.03%, dated 04/29/2016, due 05/02/2016, repurchase price $1,417,612, collateralized by U.S. Treasury Note, maturing 08/15/2024; total market value of $1,448,906 | 1,417,608 | 1,417,608 | ||||||
Total Repurchase Agreement | 1,417,608 | |||||||
Total Investments | 853,510,742 | |||||||
Other assets in excess of liabilities—1.9% | 16,540,172 | |||||||
Net Assets—100.0% | $ | 870,050,914 | ||||||
| (a) | Denotes a security issued under Regulation S or Rule 144A. |
| (b) | Variable or Floating Rate Security. Rate disclosed is as of April 30, 2016. |
| (c) | Perpetual bond. This is a bond that has no maturity date, is redeemable and pays a steady stream of interest indefinitely. |
| (d) | The Fund’s adviser has deemed this security to be illiquid based upon procedures approved by the Board of Trustees. Illiquid securities held by the Fund represent 1.85% of net assets as of April 30, 2016. |
| (e) | Payment-in-kind. This is a type of bond that pays interest in additional bonds rather than in cash. |
| (f) | Security is in default. |
| (g) | This security was fair valued by the Fund’s pricing committee as approved by the Fund’s Board of Trustees. See Note 2(a) of the accompanying Notes to Financial Statements |
| (h) | Investment in affiliate. |
| (i) | See accompanying Notes to Financial Statements for tax unrealized appreciation/depreciation of securities. |
| CAD | Canadian Dollar |
| ETF | Exchange-Traded Fund |
| EUR | Euro Currency |
| GBP | British Pound Sterling |
| MXN | Mexican Peso |
| NOK | Norwegian Krone |
| USD | U.S. Dollar |
See accompanying Notes to Financial Statements.
Semi-Annual Report 2016
35
Statement of Investments (concluded)
April 30, 2016 (Unaudited)
Aberdeen Global High Income Fund
At April 30, 2016, the Fund’s open forward foreign currency exchange contracts were as follows:
| Purchase Contracts Settlement Date* | Counterparty | Amount Purchased | Amount Sold | Fair Value | Unrealized Appreciation | |||||||||||||||||||||
| British Pound/United States Dollar | ||||||||||||||||||||||||||
03/01/2017 | Barclays Bank PLC | GBP | 7,158,000 | USD | 10,436,930 | $ | 10,478,355 | $ | 41,425 | |||||||||||||||||
| Euro/United States Dollar | ||||||||||||||||||||||||||
02/10/2017 | Barclays Bank PLC | EUR | 8,387,000 | USD | 9,397,994 | 9,701,087 | 303,093 | |||||||||||||||||||
02/10/2017 | Deutsche Bank AG | EUR | 9,000,000 | USD | 10,017,423 | 10,410,132 | 392,709 | |||||||||||||||||||
| Norwegian Krone/United States Dollar | ||||||||||||||||||||||||||
| 02/13/2017 | Barclays Bank PLC | NOK | 30,667,000 | USD | 3,589,113 | 3,810,001 | 220,888 | |||||||||||||||||||
| $ | 34,399,575 | $ | 958,115 | |||||||||||||||||||||||
| Sale Contracts Settlement Date* | Counterparty | Amount Purchased | Amount Sold | Fair Value | Unrealized Depreciation | |||||||||||||||||||||
| United States Dollar/British Pound | ||||||||||||||||||||||||||
03/01/2017 | Royal Bank of Canada | USD | 52,923,650 | GBP | 37,904,000 | $ | 55,486,388 | $ | (2,562,738 | ) | ||||||||||||||||
| United States Dollar/Canadian Dollar | ||||||||||||||||||||||||||
02/10/2017 | Citibank N.A. | USD | 8,414,825 | CAD | 11,726,000 | 9,345,428 | (930,603 | ) | ||||||||||||||||||
| United States Dollar/Euro | ||||||||||||||||||||||||||
02/10/2017 | Barclays Bank PLC | USD | 8,882,924 | EUR | 7,721,000 | 8,930,737 | (47,813 | ) | ||||||||||||||||||
02/10/2017 | Citibank N.A. | USD | 40,955,795 | EUR | 37,275,000 | 43,115,298 | (2,159,503 | ) | ||||||||||||||||||
02/10/2017 | Westpac Banking Corp. | USD | 34,112,365 | EUR | 29,645,500 | 34,290,397 | (178,032 | ) | ||||||||||||||||||
| United States Dollar/Norwegian Krone | ||||||||||||||||||||||||||
| 02/13/2017 | Royal Bank of Canada | USD | 5,789,181 | NOK | 49,552,500 | 6,156,294 | (367,113 | ) | ||||||||||||||||||
| $ | 157,324,542 | $ | (6,245,802 | ) | ||||||||||||||||||||||
| * | Certain contracts with different trade dates and like characteristics have been shown net. |
At April 30, 2016, the Fund held the following centrally cleared credit default swap contracts:
Sell Protection:
| Counterparty | Expiration Date | Notional Amount | Swap Details | Unrealized Appreciation/ (Depreciation) | Implied Credit Spread* | |||||||||||||
| JPMorgan Chase Bank N.A. | 12/20/2020 | 1,849,000 | Receive: Markit CDX North America High Yield (S25V1) 5 Year Pay: Fixed rate equal to 5.00% | $ | 57,382 | 4.29% | ||||||||||||
| $ | 57,382 | |||||||||||||||||
| * | Implied credit spreads, represented in absolute terms, are utilized in determining the market value of credit default swap contracts agreements on corporate issues or sovereign issues and serve as an indicator of the current status of the payment/performance risk and represent the likelihood or risk of default for the credit derivative. The implied credit spread of particular referenced entity reflects the cost of buying/selling protection and may include upfront payments required to be made prior to entering into the agreement. For credit default swap contracts with asset-backed securities or credit indices as the underlying assets, the quoted market prices and resulting market values serve as an indicator of the current status of the payment/performance risk. Wider credit spreads and increasing market values, in absolute terms when compared to the notional amount of the swap, represent a deterioration of the reference entity’s credit soundness and a greater likelihood or risk of default or other credit event occurring as defined under the terms of the agreement. |
See accompanying Notes to Financial Statements.
2016 Semi-Annual Report
36
Statements of Assets and Liabilities (Unaudited)
April 30, 2016
| Aberdeen Select International Equity Fund | Aberdeen Select International Equity Fund II | Aberdeen Total Return Bond Fund | Aberdeen Global High Income Fund | |||||||||||||
Assets: | ||||||||||||||||
Investments in securities, at fair value | $ | 234,411,847 | $ | 113,889,622 | $ | 941,069,291 | $ | 847,810,374 | ||||||||
Affiliated securities, at fair value (Note 6) | – | – | – | 4,282,760 | ||||||||||||
Repurchase agreements | 4,001,323 | 1,916,947 | 41,984,291 | 1,417,608 | ||||||||||||
|
|
|
|
|
|
|
| |||||||||
Total investments | 238,413,170 | 115,806,569 | 983,053,582 | 853,510,742 | ||||||||||||
|
|
|
|
|
|
|
| |||||||||
Foreign currency, at fair value | 33,275 | 15,503 | 1,131,984 | 3,099,444 | ||||||||||||
Cash at broker for futures contracts | – | – | 880,965 | – | ||||||||||||
Cash | – | – | – | 169,824 | ||||||||||||
Cash at broker for credit default swap contracts | – | – | – | 114,378 | ||||||||||||
Receivable for investments sold | – | – | 7,659,672 | 23,882,547 | ||||||||||||
Interest and dividends receivable | 1,157,880 | 567,613 | 5,326,253 | 13,471,540 | ||||||||||||
Unrealized appreciation on forward foreign currency exchange contracts | – | – | 1,789,259 | 958,115 | ||||||||||||
Receivable for capital shares issued | 2,787 | 63,884 | 817,646 | 665,047 | ||||||||||||
Variation margin receivable for futures contracts | – | – | 447,913 | – | ||||||||||||
Tax reclaim receivable | 979,850 | 518,234 | – | – | ||||||||||||
Prepaid expenses | 10,280 | 5,675 | 38,935 | 44,968 | ||||||||||||
|
|
|
|
|
|
|
| |||||||||
Total assets | 240,597,242 | 116,977,478 | 1,001,146,209 | 895,916,605 | ||||||||||||
|
|
|
|
|
|
|
| |||||||||
Liabilities: | ||||||||||||||||
Payable for investments purchased | 1,683,266 | 736,929 | 33,306,920 | 15,543,474 | ||||||||||||
Unrealized depreciation on forward foreign currency exchange contracts | – | – | 4,988,251 | 6,245,802 | ||||||||||||
Payable for capital shares redeemed | 145,691 | 385,310 | 939,126 | 3,144,289 | ||||||||||||
Collateral due to broker | 1,504 | – | – | – | ||||||||||||
Variation margin payable for centrally cleared credit default swap contracts | – | – | – | 6,061 | ||||||||||||
Accrued expenses and other payables: | ||||||||||||||||
Investment advisory fees | 175,716 | 85,396 | 265,054 | 442,698 | ||||||||||||
Legal fees | 41,790 | 36,958 | 105,303 | 75,183 | ||||||||||||
Distribution fees | 42,120 | 13,446 | 14,754 | 67,879 | ||||||||||||
Custodian fees | 10,834 | 4,859 | 41,814 | 61,713 | ||||||||||||
Audit fees | 24,850 | 21,571 | 34,555 | 33,712 | ||||||||||||
Transfer agent fees | 8,566 | 9,851 | 16,089 | 64,972 | ||||||||||||
Other | 75,838 | 37,178 | 180,954 | 179,908 | ||||||||||||
|
|
|
|
|
|
|
| |||||||||
Total liabilities | 2,210,175 | 1,331,498 | 39,892,820 | 25,865,691 | ||||||||||||
|
|
|
|
|
|
|
| |||||||||
Net Assets | $ | 238,387,067 | $ | 115,645,980 | $ | 961,253,389 | $ | 870,050,914 | ||||||||
|
|
|
|
|
|
|
| |||||||||
Cost: | ||||||||||||||||
Investments in securities, at cost | $ | 300,009,431 | $ | 130,016,817 | $ | 921,936,677 | $ | 866,673,349 | ||||||||
Affiliated securities, at cost (Note 6) | 4,264,296 | – | – | 30,083,125 | ||||||||||||
Repurchase agreements | 4,001,323 | 1,916,947 | 41,984,291 | 1,417,608 | ||||||||||||
Up-front payments made on open credit default swap contracts | – | – | – | 5,342 | ||||||||||||
Foreign currency | 1,614,657 | 14,979 | 1,173,232 | 3,059,872 | ||||||||||||
Net Assets Consist of: | ||||||||||||||||
Par value | $ | 10,991 | $ | 12,172 | $ | 71,559 | $ | 105,692 | ||||||||
Paid in capital in excess of par value | 2,653,507,453 | 2,867,747,955 | 940,628,123 | 1,129,459,610 | ||||||||||||
Accumulated net investment income/(loss) | 1,330,240 | (1,000,806 | ) | 4,506,451 | 268,819 | |||||||||||
Accumulated net realized gain/(loss) from investments and foreign currency transactions | (2,344,976,094 | ) | (2,734,971,198 | ) | 103,614 | (209,992,105 | ) | |||||||||
Net unrealized appreciation/(depreciation) on investments and translation of assets and liabilities denominated in foreign currencies | (71,485,523 | ) | (16,142,143 | ) | 15,943,642 | (49,791,102 | ) | |||||||||
|
|
|
|
|
|
|
| |||||||||
Net Assets | $ | 238,387,067 | $ | 115,645,980 | $ | 961,253,389 | $ | 870,050,914 | ||||||||
|
|
|
|
|
|
|
| |||||||||
Net Assets | ||||||||||||||||
Class A Shares | $ | 204,430,993 | $ | 65,172,029 | $ | 71,903,017 | $ | 330,061,107 | ||||||||
Institutional Class Shares | 33,956,074 | 50,473,951 | 889,350,372 | 539,989,807 | ||||||||||||
|
|
|
|
|
|
|
| |||||||||
Total | $ | 238,387,067 | $ | 115,645,980 | $ | 961,253,389 | $ | 870,050,914 | ||||||||
|
|
|
|
|
|
|
| |||||||||
Amounts listed as “–” are $0 or round to $0.
See accompanying Notes to Financial Statements.
Semi-Annual Report 2016
37
Statements of Assets and Liabilities (Unaudited) (concluded)
April 30, 2016
| Aberdeen Select International Equity Fund | Aberdeen Select International Equity Fund II | Aberdeen Total Return Bond Fund | Aberdeen Global High Income Fund | |||||||||||||
Shares Outstanding | ||||||||||||||||
Class A Shares | 9,457,814 | 6,860,444 | 5,285,346 | 38,619,785 | ||||||||||||
Institutional Class Shares | 1,533,308 | 5,311,836 | 66,274,040 | 67,072,521 | ||||||||||||
|
|
|
|
|
|
|
| |||||||||
Total | 10,991,122 | 12,172,280 | 71,559,386 | 105,692,306 | ||||||||||||
|
|
|
|
|
|
|
| |||||||||
Net asset value and redemption price per share | ||||||||||||||||
Class A Shares | $ | 21.62 | (a) | $ | 9.50 | $ | 13.60 | $ | 8.55 | (a) | ||||||
Institutional Class Shares | $ | 22.15 | $ | 9.50 | $ | 13.42 | $ | 8.05 | ||||||||
| (a) | The NAV shown above differs from the traded NAV on April 30, 2016 due to financial statement rounding and/or financial statement adjustments. |
Amounts listed as “–” are $0 or round to $0.
See accompanying Notes to Financial Statements.
2016 Semi-Annual Report
38
Statements of Operations (Unaudited)
For the Six-Month Period Ended April 30, 2016
| Aberdeen Select International Equity Fund | Aberdeen Select International Equity Fund II | Aberdeen Total Return Bond Fund | Aberdeen Global High Income Fund | |||||||||||||
INVESTMENT INCOME: | ||||||||||||||||
Dividend income | $ | 3,537,945 | $ | 323,513 | $ | – | $ | 1,035,529 | ||||||||
Interest income | 692,675 | 137 | 15,353,140 | 32,578,616 | ||||||||||||
Foreign tax withholding | (378,905 | ) | – | (45,177 | ) | – | ||||||||||
Other income | – | 5,906 | – | – | ||||||||||||
|
|
|
|
|
|
|
| |||||||||
| 3,851,715 | 329,556 | 15,307,963 | 33,614,145 | |||||||||||||
|
|
|
|
|
|
|
| |||||||||
EXPENSES: | ||||||||||||||||
Investment advisory fees | 1,089,252 | 545,879 | 1,689,632 | 3,176,146 | ||||||||||||
Distribution fees Class A | 258,875 | 84,823 | 90,406 | 481,053 | ||||||||||||
Transfer agent fees | 26,638 | 28,191 | 44,204 | 106,142 | ||||||||||||
Trustee fees | 35,736 | 18,554 | 142,965 | 163,022 | ||||||||||||
Legal fees | 23,600 | 15,898 | 79,385 | 90,179 | ||||||||||||
Printing fees | 27,549 | 22,762 | 85,672 | 82,447 | ||||||||||||
Custodian fees | 49,563 | 36,251 | 97,974 | 134,776 | ||||||||||||
Registration and filing fees | 36,268 | 23,076 | 29,487 | 48,572 | ||||||||||||
Audit fees | 20,588 | 17,788 | 26,143 | 30,838 | ||||||||||||
Other | 62,823 | 41,786 | 144,661 | 264,209 | ||||||||||||
|
|
|
|
|
|
|
| |||||||||
Total expenses before reimbursed/waived expenses | 1,630,892 | 835,008 | 2,430,529 | 4,577,384 | ||||||||||||
Interest expense (Note 11) | 260 | 185 | – | – | ||||||||||||
|
|
|
|
|
|
|
| |||||||||
Total operating expenses before reimbursed/waived expenses | 1,631,152 | 835,193 | 2,430,529 | 4,577,384 | ||||||||||||
Expenses reimbursed (Note 3) | – | – | (191,333 | ) | (407,114 | ) | ||||||||||
Expenses waived by investment adviser (Note 3) | (6,051 | ) | (3,033 | ) | (24,138 | ) | (24,432 | ) | ||||||||
|
|
|
|
|
|
|
| |||||||||
Total operating expenses | 1,625,101 | 832,160 | 2,215,058 | 4,145,838 | ||||||||||||
|
|
|
|
|
|
|
| |||||||||
Net Investment Income/(Loss) | 2,226,614 | (502,604 | ) | 13,092,905 | 29,468,307 | |||||||||||
|
|
|
|
|
|
|
| |||||||||
Realized gain/(loss) on investment transactions | (33,981,742 | ) | (16,825,914 | ) | 5,116,664 | (141,055,360 | ) | |||||||||
Realized gain on credit default swap contracts | – | – | – | 3,456,773 | ||||||||||||
Realized loss on futures contracts | – | – | (301,813 | ) | – | |||||||||||
Realized loss on futures options | – | – | (15,469 | ) | – | |||||||||||
Realized gain/(loss) on foreign currency transactions | (702,469 | ) | (321,951 | ) | (4,331,753 | ) | 11,793,188 | |||||||||
|
|
|
|
|
|
|
| |||||||||
Net realized gain/(loss) from investments and foreign currency transactions | (34,684,211 | ) | (17,147,865 | ) | 467,629 | (125,805,399 | ) | |||||||||
|
|
|
|
|
|
|
| |||||||||
Net change in unrealized appreciation on investment transactions | 25,056,678 | 12,014,771 | 16,364,470 | 65,269,040 | ||||||||||||
Net change in unrealized depreciation on credit default swap contracts | – | – | – | (3,216,707 | ) | |||||||||||
Net change in unrealized appreciation on futures contracts | – | – | 153,332 | – | ||||||||||||
Net change in unrealized appreciation/(depreciation) on translation of assets and liabilities denominated in foreign currencies | 39,153 | 973,057 | (2,345,096 | ) | (9,725,808 | ) | ||||||||||
|
|
|
|
|
|
|
| |||||||||
Net change in unrealized appreciation from investments and translation of assets and liabilities denominated in foreign currencies | 25,095,831 | 12,987,828 | 14,172,706 | 52,326,525 | ||||||||||||
|
|
|
|
|
|
|
| |||||||||
Net realized/unrealized gain/(loss) from investments and foreign currency transactions | (9,588,380 | ) | (4,160,037 | ) | 14,640,335 | (73,478,874 | ) | |||||||||
|
|
|
|
|
|
|
| |||||||||
CHANGE IN NET ASSETS RESULTING FROM OPERATIONS | $ | (7,361,766 | ) | $ | (4,662,641 | ) | $ | 27,733,240 | $ | (44,010,567 | ) | |||||
|
|
|
|
|
|
|
| |||||||||
Amounts listed as “–” are $0 or round to $0.
See accompanying Notes to Financial Statements.
Semi-Annual Report 2016
39
Statements of Changes in Net Assets
| Aberdeen Select International Equity Fund | Aberdeen Select International Equity Fund II | |||||||||||||||
| Six-Month Period Ended April 30, 2016 (Unaudited) | Year Ended October 31, 2015 | Six-Month Period Ended April 30, 2016 (Unaudited) | Year Ended October 31, 2015 | |||||||||||||
FROM INVESTMENT ACTIVITIES: | ||||||||||||||||
Operations: | ||||||||||||||||
Net investment income/(loss) | $ | 2,226,614 | $ | 9,327,807 | $ | (502,604 | ) | $ | 3,821,302 | |||||||
Net realized loss from investments and foreign currency transactions | (34,684,211 | ) | (41,765,286 | ) | (17,147,865 | ) | (3,888,799 | ) | ||||||||
Net change in unrealized appreciation/(depreciation) on investments and translation of assets and liabilities denominated in foreign currencies | 25,095,831 | (24,664,324 | ) | 12,987,828 | (27,451,716 | ) | ||||||||||
|
|
|
|
|
|
|
| |||||||||
Changes in net assets resulting from operations | (7,361,766 | ) | (57,101,803 | ) | (4,662,641 | ) | (27,519,213 | ) | ||||||||
|
|
|
|
|
|
|
| |||||||||
Distributions to Shareholders From: | ||||||||||||||||
Net investment income: | ||||||||||||||||
Class A | (7,266,740 | ) | (16,428,379 | ) | (2,281,685 | ) | (4,809,380 | ) | ||||||||
Institutional Class | (1,312,755 | ) | (3,496,500 | ) | (2,004,083 | ) | (4,729,021 | ) | ||||||||
|
|
|
|
|
|
|
| |||||||||
Change in net assets from shareholder distributions | (8,579,495 | ) | (19,924,879 | ) | (4,285,768 | ) | (9,538,401 | ) | ||||||||
|
|
|
|
|
|
|
| |||||||||
Common Stock Transactions: | ||||||||||||||||
Change in net assets from capital transactions | (31,749,310 | ) | (116,820,137 | ) | (23,669,129 | ) | (43,730,663 | ) | ||||||||
|
|
|
|
|
|
|
| |||||||||
Change in net assets | (47,690,571 | ) | (193,846,819 | ) | (32,617,538 | ) | (80,788,277 | ) | ||||||||
|
|
|
|
|
|
|
| |||||||||
Net Assets: | ||||||||||||||||
Beginning of period | 286,077,638 | 479,924,457 | 148,263,518 | 229,051,795 | ||||||||||||
|
|
|
|
|
|
|
| |||||||||
End of period | $ | 238,387,067 | $ | 286,077,638 | $ | 115,645,980 | $ | 148,263,518 | ||||||||
|
|
|
|
|
|
|
| |||||||||
Accumulated net investment income/(loss) at end of period | $ | 1,330,240 | $ | 7,683,121 | $ | (1,000,806 | ) | $ | 3,787,566 | |||||||
|
|
|
|
|
|
|
| |||||||||
CAPITAL TRANSACTIONS: | ||||||||||||||||
Class A Shares | ||||||||||||||||
Proceeds from shares issued | $ | 2,325,873 | $ | 4,811,603 | $ | 1,839,493 | $ | 11,051,363 | ||||||||
Dividends reinvested | 7,047,478 | 16,112,995 | 2,211,187 | 4,669,220 | ||||||||||||
Cost of shares redeemed | (33,932,090 | ) | (111,824,230 | ) | (13,352,397 | ) | (37,598,671 | ) | ||||||||
|
|
|
|
|
|
|
| |||||||||
Total Class A | (24,558,739 | ) | (90,899,632 | ) | (9,301,717 | ) | (21,878,088 | ) | ||||||||
|
|
|
|
|
|
|
| |||||||||
Institutional Class Shares | ||||||||||||||||
Proceeds from shares issued | 351,264 | 1,723,909 | 1,084,956 | 4,387,592 | ||||||||||||
Dividends reinvested | 1,259,027 | 3,368,549 | 1,788,327 | 4,113,653 | ||||||||||||
Cost of shares redeemed | (8,800,862 | ) | (31,012,963 | ) | (17,240,695 | ) | (30,353,820 | ) | ||||||||
|
|
|
|
|
|
|
| |||||||||
Total Institutional Class | (7,190,571 | ) | (25,920,505 | ) | (14,367,412 | ) | (21,852,575 | ) | ||||||||
|
|
|
|
|
|
|
| |||||||||
Change in net assets from capital transactions: | $ | (31,749,310 | ) | $ | (116,820,137 | ) | $ | (23,669,129 | ) | $ | (43,730,663 | ) | ||||
|
|
|
|
|
|
|
| |||||||||
Amounts listed as “–” are $0 or round to $0.
See accompanying Notes to Financial Statements.
2016 Semi-Annual Report
40
Statements of Changes in Net Assets (continued)
| Aberdeen Select International Equity Fund | Aberdeen Select International Equity Fund II | |||||||||||||||
| Six-Month Period Ended April 30, 2016 (Unaudited) | Year Ended October 31, 2015 | Six-Month Period Ended April 30, 2016 (Unaudited) | Year Ended October 31, 2015 | |||||||||||||
SHARE TRANSACTIONS: | ||||||||||||||||
Class A Shares | ||||||||||||||||
Issued | 111,534 | 189,629 | 183,297 | 1,026,899 | ||||||||||||
Reinvested | 345,804 | 637,886 | 244,619 | 422,554 | ||||||||||||
Redeemed | (1,624,227 | ) | (4,413,829 | ) | (1,466,542 | ) | (3,391,374 | ) | ||||||||
|
|
|
|
|
|
|
| |||||||||
Total Class A Shares | (1,166,889 | ) | (3,586,314 | ) | (1,038,626 | ) | (1,941,921 | ) | ||||||||
|
|
|
|
|
|
|
| |||||||||
Institutional Class Shares | ||||||||||||||||
Issued | 15,173 | 66,093 | 98,963 | 391,640 | ||||||||||||
Reinvested | 60,385 | 130,311 | 198,089 | 372,614 | ||||||||||||
Redeemed | (406,973 | ) | (1,189,930 | ) | (1,855,856 | ) | (2,763,043 | ) | ||||||||
|
|
|
|
|
|
|
| |||||||||
Total Institutional Class Shares | (331,415 | ) | (993,526 | ) | (1,558,804 | ) | (1,998,789 | ) | ||||||||
|
|
|
|
|
|
|
| |||||||||
Total change in shares: | (1,498,304 | ) | (4,579,840 | ) | (2,597,430 | ) | (3,940,710 | ) | ||||||||
|
|
|
|
|
|
|
| |||||||||
Amounts listed as “–” are $0 or round to $0.
See accompanying Notes to Financial Statements.
Semi-Annual Report 2016
41
Statements of Changes in Net Assets (continued)
| Aberdeen Total Return Bond Fund | Aberdeen Global High Income Fund | |||||||||||||||
| Six-Month Period Ended April 30, 2016 (Unaudited) | Year Ended 2015 | Six-Month Period Ended April 30, 2016 (Unaudited) | Year Ended October 31, 2015 | |||||||||||||
FROM INVESTMENT ACTIVITIES: | ||||||||||||||||
Operations: | ||||||||||||||||
Net investment income | $ | 13,092,905 | $ | 35,694,768 | $ | 29,468,307 | $ | 123,705,167 | ||||||||
Net realized gain/(loss) from investments and foreign currency transactions | 467,629 | (5,075,598 | ) | (125,805,399 | ) | (104,791,545 | ) | |||||||||
Net change in unrealized appreciation/(depreciation) on investments and translation of assets and liabilities denominated in foreign currencies | 14,172,706 | (15,540,882 | ) | 52,326,525 | (130,577,310 | ) | ||||||||||
|
|
|
|
|
|
|
| |||||||||
Changes in net assets resulting from operations | 27,733,240 | 15,078,288 | (44,010,567 | ) | (111,663,688 | ) | ||||||||||
|
|
|
|
|
|
|
| |||||||||
Distributions to Shareholders From: | ||||||||||||||||
Net investment income: | ||||||||||||||||
Class A | (513,441 | ) | (2,128,685 | ) | (8,057,132 | ) | (29,921,233 | ) | ||||||||
Institutional Class | (7,674,020 | ) | (24,545,585 | ) | (14,166,215 | ) | (62,514,715 | ) | ||||||||
Net realized gains: | ||||||||||||||||
Class A | – | (1,774,676 | ) | – | (19,357,727 | ) | ||||||||||
Institutional Class | – | (16,506,438 | ) | – | (37,810,111 | ) | ||||||||||
Tax return of capital: | ||||||||||||||||
Class A | – | (139,855 | ) | – | (7,343,917 | ) | ||||||||||
Institutional Class | – | (1,437,186 | ) | – | (13,557,044 | ) | ||||||||||
|
|
|
|
|
|
|
| |||||||||
Change in net assets from shareholder distributions | (8,187,461 | ) | (46,532,425 | ) | (22,223,347 | ) | (170,504,747 | ) | ||||||||
|
|
|
|
|
|
|
| |||||||||
Common Stock Transactions: | ||||||||||||||||
Change in net assets from capital transactions | (61,274,459 | ) | (479,011,379 | ) | (384,172,974 | ) | (782,474,860 | ) | ||||||||
|
|
|
|
|
|
|
| |||||||||
Change in net assets | (41,728,680 | ) | (510,465,516 | ) | (450,406,888 | ) | (1,064,643,295 | ) | ||||||||
|
|
|
|
|
|
|
| |||||||||
Net Assets: | ||||||||||||||||
Beginning of period | 1,002,982,069 | 1,513,447,585 | 1,320,457,802 | 2,385,101,097 | ||||||||||||
|
|
|
|
|
|
|
| |||||||||
End of period | $ | 961,253,389 | $ | 1,002,982,069 | $ | 870,050,914 | $ | 1,320,457,802 | ||||||||
|
|
|
|
|
|
|
| |||||||||
Accumulated net investment income/(loss) at end of period | $ | 4,506,451 | $ | (398,993 | ) | $ | 268,819 | $ | (6,976,141 | ) | ||||||
|
|
|
|
|
|
|
| |||||||||
CAPITAL TRANSACTIONS: | ||||||||||||||||
Class A Shares | ||||||||||||||||
Proceeds from shares issued | $ | 10,350,153 | $ | 37,097,408 | $ | 40,310,109 | $ | 263,981,338 | ||||||||
Dividends reinvested | 473,500 | 3,949,037 | 7,747,446 | 51,945,174 | ||||||||||||
Cost of shares redeemed | (16,024,555 | ) | (114,703,680 | ) | (214,775,003 | ) | (519,101,949 | ) | ||||||||
|
|
|
|
|
|
|
| |||||||||
Total Class A | (5,200,902 | ) | (73,657,235 | ) | (166,717,448 | ) | (203,175,437 | ) | ||||||||
|
|
|
|
|
|
|
| |||||||||
Institutional Class Shares | ||||||||||||||||
Proceeds from shares issued | 77,269,092 | 303,606,043 | 104,599,042 | 515,517,331 | ||||||||||||
Dividends reinvested | 7,254,662 | 40,271,196 | 9,045,902 | 75,342,754 | ||||||||||||
Cost of shares redeemed | (140,597,311 | ) | (749,231,383 | ) | (331,100,470 | ) | (1,170,159,508 | ) | ||||||||
|
|
|
|
|
|
|
| |||||||||
Total Institutional Class | (56,073,557 | ) | (405,354,144 | ) | (217,455,526 | ) | (579,299,423 | ) | ||||||||
|
|
|
|
|
|
|
| |||||||||
Change in net assets from capital transactions: | $ | (61,274,459 | ) | $ | (479,011,379 | ) | $ | (384,172,974 | ) | $ | (782,474,860 | ) | ||||
|
|
|
|
|
|
|
| |||||||||
Amounts listed as “–” are $0 or round to $0.
See accompanying Notes to Financial Statements.
2016 Semi-Annual Report
42
Statements of Changes in Net Assets (concluded)
| Aberdeen Total Return Bond Fund | Aberdeen Global High Income Fund | |||||||||||||||
| Six-Month Period Ended April 30, 2016 (Unaudited) | Year Ended 2015 | Six-Month Period Ended April 30, 2016 (Unaudited) | Year Ended October 31, 2015 | |||||||||||||
SHARE TRANSACTIONS: | ||||||||||||||||
Class A Shares | ||||||||||||||||
Issued | 778,752 | 2,748,452 | 4,807,219 | 26,975,595 | ||||||||||||
Reinvested | 35,702 | 292,904 | 918,369 | 5,371,018 | ||||||||||||
Redeemed | (1,202,922 | ) | (8,556,002 | ) | (25,367,039 | ) | (53,425,599 | ) | ||||||||
|
|
|
|
|
|
|
| |||||||||
Total Class A Shares | (388,468 | ) | (5,514,646 | ) | (19,641,451 | ) | (21,078,986 | ) | ||||||||
|
|
|
|
|
|
|
| |||||||||
Institutional Class Shares | ||||||||||||||||
Issued | 5,876,037 | 22,822,380 | 13,233,655 | 55,398,609 | ||||||||||||
Reinvested | 554,088 | 3,029,667 | 1,136,922 | 8,227,773 | ||||||||||||
Redeemed | (10,707,590 | ) | (56,681,811 | ) | (41,467,167 | ) | (128,014,246 | ) | ||||||||
|
|
|
|
|
|
|
| |||||||||
Total Institutional Class Shares | (4,277,465 | ) | (30,829,764 | ) | (27,096,590 | ) | (64,387,864 | ) | ||||||||
|
|
|
|
|
|
|
| |||||||||
Total change in shares: | (4,665,933 | ) | (36,344,410 | ) | (46,738,041 | ) | (85,466,850 | ) | ||||||||
|
|
|
|
|
|
|
| |||||||||
Amounts listed as “–” are $0 or round to $0.
See accompanying Notes to Financial Statements.
Semi-Annual Report 2016
43
Financial Highlights
Selected Data for Each Share of Capital Outstanding Throughout the Periods Indicated
Aberdeen Select International Equity Fund
| Investment Activities | Distributions | |||||||||||||||||||||||||||||||
| Net Asset Value, Beginning of Period | Net Investment Income (a) | Net Realized and Unrealized Gains (Losses) on Invest- ments | Total from Invest- ment Activities | Net Invest- ment Income | Tax Return of Capital | Total Distri- butions | Net Asset Value, End of Period | |||||||||||||||||||||||||
Class A Shares | ||||||||||||||||||||||||||||||||
Six-Month Period Ended April 30, 2016* | $ | 22.82 | $ | 0.19 | $ | (0.67 | ) | $ | (0.48 | ) | $ | (0.72 | ) | $ | – | $ | (0.72 | ) | $ | 21.62 | ||||||||||||
Year Ended October 31, 2015 | 28.00 | 0.62 | (h) | (4.60 | ) | (3.98 | ) | (1.20 | ) | – | (1.20 | ) | 22.82 | |||||||||||||||||||
Year Ended October 31, 2014 | 28.63 | 1.09 | (1.12 | ) | (0.03 | ) | (0.60 | ) | – | (0.60 | ) | 28.00 | ||||||||||||||||||||
Year Ended October 31, 2013 | 23.84 | 0.37 | 4.55 | 4.92 | (0.13 | ) | – | (0.13 | ) | 28.63 | ||||||||||||||||||||||
Year Ended October 31, 2012 | 24.55 | 0.30 | (0.62 | ) | (0.32 | ) | (0.39 | ) | – | (0.39 | ) | 23.84 | ||||||||||||||||||||
Year Ended October 31, 2011 | 28.87 | 0.19 | (4.00 | ) | (3.81 | ) | (0.51 | ) | – | (0.51 | ) | 24.55 | ||||||||||||||||||||
Institutional Class Shares | ||||||||||||||||||||||||||||||||
Six-Month Period Ended April 30, 2016* | 23.40 | 0.22 | (0.68 | ) | (0.46 | ) | (0.79 | ) | – | (0.79 | ) | 22.15 | ||||||||||||||||||||
Year Ended October 31, 2015 | 28.69 | 0.67 | (h) | (4.68 | ) | (4.01 | ) | (1.28 | ) | – | (1.28 | ) | 23.40 | |||||||||||||||||||
Year Ended October 31, 2014 | 29.33 | 1.19 | (1.16 | ) | 0.03 | (0.67 | ) | – | (0.67 | ) | 28.69 | |||||||||||||||||||||
Year Ended October 31, 2013 | 24.44 | 0.31 | 4.80 | 5.11 | (0.22 | ) | – | (0.22 | ) | 29.33 | ||||||||||||||||||||||
Year Ended October 31, 2012 | 25.20 | 0.36 | (0.64 | ) | (0.28 | ) | (0.48 | ) | – | (0.48 | ) | 24.44 | ||||||||||||||||||||
Year Ended October 31, 2011 | 29.64 | 0.28 | (4.13 | ) | (3.85 | ) | (0.59 | ) | – | (0.59 | ) | 25.20 | ||||||||||||||||||||
| * | Unaudited |
| (a) | Net investment income/(loss) is based on average shares outstanding during the period. |
| (b) | Not annualized for periods less than one year. |
| (c) | Annualized for periods less than one year. |
| (d) | Includes interest expense that amounts to less than 0.01%. |
Amounts listed as “–” are $0 or round to $0.
See accompanying Notes to Financial Statements.
Semi-Annual Report 2016
44
Financial Highlights (continued)
Selected Data for Each Share of Capital Outstanding Throughout the Periods Indicated
Aberdeen Select International Equity Fund (concluded)
| Ratios/Supplemental Data | ||||||||||||||||||||||
| Total Return (b) | Net Assets at End of Period (000’s) | Ratio of Expenses (Net of Waivers) to Average Net Assets (c)(d) | Ratio of Net Investment Income to Average Net Assets (c) | Ratio of Expenses (Prior to Waivers) to Average Net Assets (c)(d)(e) | Portfolio Turnover (b)(f) | |||||||||||||||||
| (1.92 | %)(g) | $ | 204,431 | 1.38 | % | 1.81 | % | 1.38 | % | 16 | % | |||||||||||
| (14.62 | %)(h) | 242,444 | 1.28 | % | 2.47 | %(h) | 1.28 | % | 11 | % | ||||||||||||
| (0.04 | %) | 397,911 | 1.26 | % | 3.83 | % | 1.26 | % | 12 | % | ||||||||||||
| 20.70 | % | 554,922 | 1.25 | % | 1.39 | % | 1.26 | % | 94 | % | ||||||||||||
| (1.14 | %) | 877,738 | 1.23 | % | 1.30 | % | 1.24 | % | 35 | % | ||||||||||||
| (13.49 | %) | 2,059,255 | 1.29 | % | 0.65 | % | 1.30 | % | 41 | % | ||||||||||||
| (1.76 | %) | 33,956 | 1.13 | % | 2.03 | % | 1.13 | % | 16 | % | ||||||||||||
| (14.40 | %)(h) | 43,633 | 1.04 | % | 2.56 | %(h) | 1.04 | % | 11 | % | ||||||||||||
| 0.19 | % | 82,014 | 1.02 | % | 4.06 | % | 1.03 | % | 12 | % | ||||||||||||
| 21.04 | % | 110,893 | 1.03 | % | 1.15 | % | 1.04 | % | 94 | % | ||||||||||||
| (0.93 | %) | 1,138,838 | 1.00 | % | 1.51 | % | 1.01 | % | 35 | % | ||||||||||||
| (13.31 | %) | 3,687,999 | 1.05 | % | 0.95 | % | 1.05 | % | 41 | % | ||||||||||||
| (e) | During the period, certain fees were waived. If such waivers had not occurred, the ratios would have been as indicated. |
| (f) | Portfolio turnover is calculated on the basis of the Fund as a whole without distinguishing among the classes of shares. |
| (g) | The total return shown above includes the impact of financial statement adjustments to the NAV per share. |
| (h) | Included within Net Investment Income per share, Total Return, and Ratio of Net Investment Income to Average Net Assets are the effects of withholding tax refunds (Note 2h of the Notes to Financial Statements). If such amounts were excluded, the Net Investment Income per share, Total Return, and Ratio of Net Investment Income to Average Net Assets for Class A Shares would have been $0.53, (15.03%), and 2.11%, respectively. For Institutional Class Shares, these amounts would have been $0.58, (14.80%), and 2.20%, respectively. |
2016 Semi-Annual Report
45
Financial Highlights (continued)
Selected Data for Each Share of Capital Outstanding Throughout the Periods Indicated
Aberdeen Select International Equity Fund II
| Investment Activities | Distributions | |||||||||||||||||||||||||||||||
| Net Asset Value, Beginning of Period | Net Investment Income (Loss) (a) | Net Realized and Unrealized Gains (Losses) on Invest- ments | Total from Invest- ment Activities | Net Invest- ment Income | Tax Return of Capital | Total Distri- butions | Net Asset Value, End of Period | |||||||||||||||||||||||||
Class A Shares | ||||||||||||||||||||||||||||||||
Six-Month Period Ended April 30, 2016* | $ | 10.03 | $ | (0.04 | ) | $ | (0.19 | ) | $ | (0.23 | ) | $ | (0.30 | ) | $ | – | $ | (0.30 | ) | $ | 9.50 | |||||||||||
Year Ended October 31, 2015 | 12.23 | 0.21 | (g) | (1.89 | )(h) | (1.68 | ) | (0.52 | ) | – | (0.52 | ) | 10.03 | |||||||||||||||||||
Year Ended October 31, 2014 | 12.18 | 0.42 | (0.36 | ) | 0.06 | (0.01 | ) | – | (0.01 | ) | 12.23 | |||||||||||||||||||||
Year Ended October 31, 2013 | 10.38 | 0.13 | 1.92 | 2.05 | (0.25 | ) | – | (0.25 | ) | 12.18 | ||||||||||||||||||||||
Year Ended October 31, 2012 | 10.46 | 0.12 | (0.05 | ) | 0.07 | (0.15 | ) | – | (0.15 | ) | 10.38 | |||||||||||||||||||||
Year Ended October 31, 2011 | 12.18 | 0.07 | (1.56 | ) | (1.49 | ) | (0.23 | ) | – | (0.23 | ) | 10.46 | ||||||||||||||||||||
Institutional Class Shares | ||||||||||||||||||||||||||||||||
Six-Month Period Ended April 30, 2016* | 10.04 | (0.03 | ) | (0.18 | ) | (0.21 | ) | (0.33 | ) | – | (0.33 | ) | 9.50 | |||||||||||||||||||
Year Ended October 31, 2015 | 12.25 | 0.24 | (g) | (1.90 | )(h) | (1.66 | ) | (0.55 | ) | – | (0.55 | ) | 10.04 | |||||||||||||||||||
Year Ended October 31, 2014 | 12.20 | 0.46 | (0.38 | ) | 0.08 | (0.03 | ) | – | (0.03 | ) | 12.25 | |||||||||||||||||||||
Year Ended October 31, 2013 | 10.45 | 0.11 | 1.97 | 2.08 | (0.33 | ) | – | (0.33 | ) | 12.20 | ||||||||||||||||||||||
Year Ended October 31, 2012 | 10.54 | 0.14 | (0.04 | ) | 0.10 | (0.19 | ) | – | (0.19 | ) | 10.45 | |||||||||||||||||||||
Year Ended October 31, 2011 | 12.27 | 0.10 | (1.57 | ) | (1.47 | ) | (0.26 | ) | – | (0.26 | ) | 10.54 | ||||||||||||||||||||
| * | Unaudited |
| (a) | Net investment income/(loss) is based on average shares outstanding during the period. |
| (b) | Not annualized for periods less than one year. |
| (c) | Annualized for periods less than one year. |
| (d) | During the period, certain fees were waived. If such waivers had not occurred, the ratios would have been as indicated. |
Amounts listed as “–” are $0 or round to $0.
See accompanying Notes to Financial Statements.
Semi-Annual Report 2016
46
Financial Highlights (continued)
Selected Data for Each Share of Capital Outstanding Throughout the Periods Indicated
Aberdeen Select International Equity Fund II (concluded)
| Ratios/Supplemental Data | ||||||||||||||||||||||
| TotalReturn (b) | Net Assets at End of Period (000’s) | Ratio of Expenses (Net of Waivers) to Average Net Assets (c)(d) | Ratio of Net Investment Income (Loss) to Average Net Assets (c) | Ratio of Expenses (Prior to Waivers) to Average Net Assets (c)(d)(e) | PortfolioTurnover (b)(f) | |||||||||||||||||
| (2.64 | %) | $ | 65,172 | 1.48 | % | (0.94 | %) | 1.48 | % | 16 | % | |||||||||||
| (14.16 | %)(g)(h) | 79,263 | 1.38 | % | 1.93 | %(g) | 1.38 | % | 12 | % | ||||||||||||
| 0.46 | % | 120,387 | 1.32 | % | 3.41 | % | 1.33 | % | 11 | % | ||||||||||||
| 20.00 | % | 168,028 | 1.21 | % | 1.19 | % | 1.23 | % | 97 | % | ||||||||||||
| 0.91 | % | 278,360 | 1.30 | % | 1.21 | % | 1.32 | % | 34 | % | ||||||||||||
| (12.61 | %) | 1,310,435 | 1.28 | % | 0.54 | % | 1.28 | % | 51 | % | ||||||||||||
| (2.44 | %) | 50,474 | 1.24 | % | (0.69 | %) | 1.24 | % | 16 | % | ||||||||||||
| (13.96 | %)(g)(h) | 69,000 | 1.13 | % | 2.16 | %(g) | 1.13 | % | 12 | % | ||||||||||||
| 0.64 | % | 108,665 | 1.10 | % | 3.69 | % | 1.11 | % | 11 | % | ||||||||||||
| 20.36 | % | 157,876 | 1.04 | % | 1.02 | % | 1.04 | % | 97 | % | ||||||||||||
| 1.11 | % | 806,052 | 1.01 | % | 1.33 | % | 1.02 | % | 34 | % | ||||||||||||
| (12.31 | %) | 3,666,631 | 1.04 | % | 0.79 | % | 1.04 | % | 51 | % | ||||||||||||
| (e) | Includes interest expense that amounts to less than 0.01%. |
| (f) | Portfolio turnover is calculated on the basis of the Fund as a whole without distinguishing among the classes of shares. |
| (g) | Included within Net Investment Income per share, Total Return, and Ratio of Net Investment Income to Average Net Assets are the effects of withholding tax refunds (Note 2h of the Notes to Financial Statements). If such amounts were excluded, the Net Investment Income per share, Total Return, and Ratio of Net Investment Income to Average Net Assets for Class A Shares would have been $0.18, (14.42%), and 1.66%, respectively. For Institutional Class Shares, these amounts would have been $0.21, (14.22%), and 1.89%, respectively. |
| (h) | Included within Net Realized and Unrealized Gains (Losses) on Investment per share is a payment from affiliate (See Note 3). If such payment was excluded, the total return would have been (14.33%) for Class A Shares and (14.13%) for Institutional Class Shares. |
2016 Semi-Annual Report
47
Financial Highlights (continued)
Selected Data for Each Share of Capital Outstanding Throughout the Periods Indicated
Aberdeen Total Return Bond Fund
| Investment Activities | Distributions | |||||||||||||||||||||||||||||||||||
| Net Asset Value, Beginning of Period | Net Investment Income (a) | Net Realized and Unrealized Gains (Losses) on Invest- ments | Total from Invest- ment Activities | Net Invest- ment Income | Net Realized Gains | Tax Return of Capital | Total Distri- butions | Net Asset Value, End of Period | ||||||||||||||||||||||||||||
Class A Shares | ||||||||||||||||||||||||||||||||||||
Six-Month Period Ended April 30, 2016* | $ | 13.32 | $ | 0.16 | $ | 0.21 | $ | 0.37 | $ | (0.09 | ) | $ | – | $ | – | $ | (0.09 | ) | $ | 13.60 | ||||||||||||||||
Year Ended October 31, 2015 | 13.60 | 0.32 | (0.19 | ) | 0.13 | (0.22 | ) | (0.17 | ) | (0.02 | ) | (0.41 | ) | 13.32 | ||||||||||||||||||||||
Year Ended October 31, 2014 | 13.30 | 0.34 | 0.18 | 0.52 | (0.22 | ) | – | – | (0.22 | ) | 13.60 | |||||||||||||||||||||||||
Year Ended October 31, 2013 | 14.17 | 0.31 | (0.56 | ) | (0.25 | ) | (0.29 | ) | (0.30 | ) | (0.03 | ) | (0.62 | ) | 13.30 | |||||||||||||||||||||
Year Ended October 31, 2012 | 14.02 | 0.34 | 0.56 | 0.90 | (0.49 | ) | (0.26 | ) | – | (0.75 | ) | 14.17 | ||||||||||||||||||||||||
Year Ended October 31, 2011 | 14.24 | 0.55 | 0.18 | 0.73 | (0.47 | ) | (0.48 | ) | – | (0.95 | ) | 14.02 | ||||||||||||||||||||||||
Institutional Class Shares | ||||||||||||||||||||||||||||||||||||
Six-Month Period Ended April 30, 2016* | 13.14 | 0.18 | 0.21 | 0.39 | (0.11 | ) | – | – | (0.11 | ) | 13.42 | |||||||||||||||||||||||||
Year Ended October 31, 2015 | 13.43 | 0.35 | (0.20 | ) | 0.15 | (0.25 | ) | (0.17 | ) | (0.02 | ) | (0.44 | ) | 13.14 | ||||||||||||||||||||||
Year Ended October 31, 2014 | 13.13 | 0.37 | 0.18 | 0.55 | (0.25 | ) | – | – | (0.25 | ) | 13.43 | |||||||||||||||||||||||||
Year Ended October 31, 2013 | 14.03 | 0.35 | (0.56 | ) | (0.21 | ) | (0.36 | ) | (0.30 | ) | (0.03 | ) | (0.69 | ) | 13.13 | |||||||||||||||||||||
Year Ended October 31, 2012 | 13.91 | 0.38 | 0.55 | 0.93 | (0.55 | ) | (0.26 | ) | – | (0.81 | ) | 14.03 | ||||||||||||||||||||||||
Year Ended October 31, 2011 | 14.16 | 0.58 | 0.18 | 0.76 | (0.53 | ) | (0.48 | ) | – | (1.01 | ) | 13.91 | ||||||||||||||||||||||||
| * | Unaudited |
| (a) | Net investment income/(loss) is based on average shares outstanding during the period. |
| (b) | Not annualized for periods less than one year. |
| (c) | Annualized for periods less than one year. |
Amounts listed as “–” are $0 or round to $0.
See accompanying Notes to Financial Statements.
Semi-Annual Report 2016
48
Financial Highlights (continued)
Selected Data for Each Share of Capital Outstanding Throughout the Periods Indicated
Aberdeen Total Return Bond Fund (concluded)
| Ratios/Supplemental Data | ||||||||||||||||||||||
| Total Return (b) | Net Assets at End of Period (000’s) | Ratio of Expenses (Net of Reimbursements /Waivers) to Average Net Assets (c) | Ratio of Net Investment Income to Average Net Assets (c) | Ratio of Expenses (Prior to Reimbursements /Waivers) to Average Net Assets (c)(d) | Portfolio Turnover (b)(e) | |||||||||||||||||
| 2.83 | % | $ | 71,903 | 0.69 | % | 2.48 | % | 0.75 | % | 73 | % | |||||||||||
| 0.91 | % | 75,595 | 0.69 | % | 2.37 | % | 0.71 | % | 102 | % | ||||||||||||
| 3.96 | % | 152,196 | 0.68 | % | 2.56 | % | 0.69 | % | 128 | % | ||||||||||||
| (1.81 | %) | 153,370 | 0.68 | % | 2.29 | % | 0.70 | % | 265 | % | ||||||||||||
| 6.64 | % | 247,217 | 0.69 | % | 2.47 | % | 0.69 | % | 236 | % | ||||||||||||
| 5.49 | % | 271,444 | 0.69 | % | 3.96 | % | 0.71 | % | 219 | % | ||||||||||||
| 3.01 | % | 889,350 | 0.44 | % | 2.73 | % | 0.48 | % | 73 | % | ||||||||||||
| 1.12 | % | 927,387 | 0.44 | % | 2.62 | % | 0.45 | % | 102 | % | ||||||||||||
| 4.25 | % | 1,361,252 | 0.42 | % | 2.81 | % | 0.43 | % | 128 | % | ||||||||||||
| (1.59 | %) | 1,449,776 | 0.42 | % | 2.56 | % | 0.43 | % | 265 | % | ||||||||||||
| 6.97 | % | 1,849,138 | 0.41 | % | 2.73 | % | 0.41 | % | 236 | % | ||||||||||||
| 5.79 | % | 1,498,733 | 0.44 | % | 4.20 | % | 0.45 | % | 219 | % | ||||||||||||
| (d) | During the period, certain fees were waived and/or reimbursed. If such waivers/reimbursements had not occurred, the ratios would have been as indicated. |
| (e) | Portfolio turnover is calculated on the basis of the Fund as a whole without distinguishing among the classes of shares. |
2016 Semi-Annual Report
49
Financial Highlights (continued)
Selected Data for Each Share of Capital Outstanding Throughout the Periods Indicated
Aberdeen Global High Income Fund
| Investment Activities | Distributions | |||||||||||||||||||||||||||||||||||
| Net Asset Value, Beginning of Period | Net Investment Income (a) | Net Realized and Unrealized Gains (Losses) on Invest- ments | Total from Invest- ment Activities | Net Invest- ment Income | Net Realized Gains | Tax Return of Capital | Total Distri- butions | Net Asset Value, End of Period | ||||||||||||||||||||||||||||
Class A Shares | ||||||||||||||||||||||||||||||||||||
Six-Month Period Ended April 30, 2016* | $ | 8.98 | $ | 0.25 | $ | (0.50 | ) | $ | (0.25 | ) | $ | (0.18 | ) | $ | – | $ | – | $ | (0.18 | ) | $ | 8.55 | ||||||||||||||
Year Ended October 31, 2015 | 10.38 | 0.62 | (1.22 | ) | (0.60 | ) | (0.44 | ) | (0.25 | ) | (0.11 | ) | (0.80 | ) | 8.98 | |||||||||||||||||||||
Year Ended October 31, 2014 | 10.61 | 0.62 | (0.13 | ) | 0.49 | (0.61 | ) | (0.11 | ) | – | (0.72 | ) | 10.38 | |||||||||||||||||||||||
Year Ended October 31, 2013 | 10.30 | 0.72 | 0.30 | 1.02 | (0.71 | ) | – | – | (0.71 | ) | 10.61 | |||||||||||||||||||||||||
Year Ended October 31, 2012 | 10.14 | 0.73 | 0.34 | 1.07 | (0.74 | ) | (0.16 | ) | (0.01 | ) | (0.91 | ) | 10.30 | |||||||||||||||||||||||
Year Ended October 31, 2011 | 11.06 | 0.77 | (0.62 | ) | 0.15 | (0.79 | ) | (0.28 | ) | – | (1.07 | ) | 10.14 | |||||||||||||||||||||||
Institutional Class Shares | ||||||||||||||||||||||||||||||||||||
Six-Month Period Ended April 30, 2016* | 8.47 | 0.24 | (0.47 | ) | (0.23 | ) | (0.19 | ) | – | – | (0.19 | ) | 8.05 | |||||||||||||||||||||||
Year Ended October 31, 2015 | 9.85 | 0.61 | (1.16 | ) | (0.55 | ) | (0.47 | ) | (0.25 | ) | (0.11 | ) | (0.83 | ) | 8.47 | |||||||||||||||||||||
Year Ended October 31, 2014 | 10.10 | 0.61 | (0.11 | ) | 0.50 | (0.64 | ) | (0.11 | ) | – | (0.75 | ) | 9.85 | |||||||||||||||||||||||
Year Ended October 31, 2013 | 9.84 | 0.71 | 0.29 | 1.00 | (0.74 | ) | – | – | (0.74 | ) | 10.10 | |||||||||||||||||||||||||
Year Ended October 31, 2012 | 9.72 | 0.73 | 0.31 | 1.04 | (0.74 | ) | (0.16 | ) | (0.02 | ) | (0.92 | ) | 9.84 | |||||||||||||||||||||||
Year Ended October 31, 2011 | 10.64 | 0.76 | (0.59 | ) | 0.17 | (0.81 | ) | (0.28 | ) | – | (1.09 | ) | 9.72 | |||||||||||||||||||||||
| * | Unaudited |
| (a) | Net investment income/(loss) is based on average shares outstanding during the period. |
| (b) | Not annualized for periods less than one year. |
| (c) | Annualized for periods less than one year. |
| (d) | During the period, certain fees were waived and/or reimbursed. If such waivers/reimbursements had not occurred, the ratios would have been as indicated. |
Amounts listed as “–” are $0 or round to $0.
See accompanying Notes to Financial Statements.
Semi-Annual Report 2016
50
Financial Highlights (concluded)
Selected Data for Each Share of Capital Outstanding Throughout the Periods Indicated
Aberdeen Global High Income Fund (concluded)
| Ratios/Supplemental Data | ||||||||||||||||||||||
| Total Return (b) | Net Assets at End of Period (000’s) | Ratio of Expenses (Net of Reimbursements /Waivers) to Average Net Assets (c) | Ratio of Net Investment Income to Average Net Assets (c) | Ratio of Expenses (Prior to Reimbursements /Waivers) to Average Net Assets (c)(d) | Portfolio Turnover (b)(e) | |||||||||||||||||
| (2.77 | %)(f) | $ | 330,061 | 1.00 | % | 5.88 | % | 1.12 | % | 42 | % | |||||||||||
| (6.01 | %)(f) | 522,964 | 1.00 | %(g) | 6.43 | % | 1.04 | %(g) | 79 | % | ||||||||||||
| 4.70 | % | 823,808 | 1.00 | %(g) | 5.76 | % | 1.01 | %(g) | 96 | % | ||||||||||||
| 10.20 | % | 999,250 | 0.99 | %(g) | 6.83 | % | 1.00 | %(g) | 57 | % | ||||||||||||
| 11.22 | % | 1,066,487 | 0.99 | %(g) | 7.26 | % | 1.01 | %(g) | 62 | % | ||||||||||||
| 1.30 | % | 1,308,597 | 0.99 | %(g) | 7.19 | % | 1.00 | %(g) | 78 | % | ||||||||||||
| (2.67 | %) | 539,990 | 0.75 | % | 6.13 | % | 0.84 | % | 42 | % | ||||||||||||
| (5.85 | %) | 797,494 | 0.75 | %(g) | 6.68 | % | 0.76 | %(g) | 79 | % | ||||||||||||
| 5.01 | % | 1,561,293 | 0.74 | %(g) | 6.01 | % | 0.75 | %(g) | 96 | % | ||||||||||||
| 10.53 | % | 1,553,543 | 0.75 | %(g) | 7.10 | % | 0.75 | %(g) | 57 | % | ||||||||||||
| 11.49 | % | 2,130,565 | 0.73 | %(g) | 7.53 | % | 0.74 | %(g) | 62 | % | ||||||||||||
| 1.52 | % | 2,077,865 | 0.73 | %(g) | 7.44 | % | 0.74 | %(g) | 78 | % | ||||||||||||
| (e) | Portfolio turnover is calculated on the basis of the Fund as a whole without distinguishing among the classes of shares. |
| (f) | The total return shown above includes the impact of financial statement adjustments to the NAV per share. |
| (g) | Includes interest expense that amounts to less than 0.01%. |
2016 Semi-Annual Report
51
April 30, 2016 (Unaudited)
1. Organization
Aberdeen Investment Funds (the “Trust”) was organized as a business trust under the laws of the State of Massachusetts by a Master Trust Agreement adopted on April 30, 1992 and is registered with the U.S. Securities and Exchange Commission (“SEC”) under the Investment Company Act of 1940, as amended (the “1940 Act”) as an open-end management investment company. As of April 30, 2016, the Trust offered four diversified, open-ended investment funds: Aberdeen Select International Equity Fund (the “Select International Equity Fund”), Aberdeen Select International Equity Fund II (the “Select International Equity Fund II”), Aberdeen Total Return Bond Fund (the “Total Return Bond Fund”), and Aberdeen Global High Income Fund (the “Global High Income Fund”). Each series of the Trust are also referred to herein as a “Fund” or collectively, the “Funds”.
Each of the Funds offers multiple share classes. As of April 30, 2016, all of the Funds offered Class A and Institutional Class shares. The classes of shares are offered to different types of investors and have different expense structures, as outlined in the Funds’ prospectus. Each class of shares has exclusive voting rights with respect to matters that affect that class. Income, realized gains and losses, unrealized appreciation and depreciation, and expenses that are not attributable to a specific class are allocated daily to each class based on its relative net assets. Expenses directly attributable to a Fund are charged to that Fund. Other expenses are allocated to the respective Fund based on average daily net assets.
Each Fund has distinct investment objectives. Following are the objectives for the Funds:
| Fund Name | Investment Objective | |
Select International Equity Fund | Seeks long-term growth of capital. | |
Select International Equity Fund II | Seeks long-term growth of capital. | |
Total Return Bond Fund | Seeks to provide total return, which consists of two components: (1) changes in the market value of the Fund’s portfolio securities (both realized and unrealized appreciation/depreciation) and (2) income received from its portfolio securities. | |
Global High Income Fund | Seeks to maximize total return, principally through a high level of current income, and secondarily through capital appreciation. |
2. Summary of Significant Accounting Policies
The following is a summary of significant accounting policies followed by the Funds in the preparation of their financial statements. The policies conform to accounting principles generally accepted in the United States of America (“GAAP”). The preparation of financial statements requires management to make estimates and assumptions that affect the reported amounts of assets and liabilities, disclosure of contingent assets and liabilities at the date of the financial statements, and the reported amounts of income and expenses for the period. Actual results could differ from those estimates. The books and records of the Funds are maintained in U.S. Dollars.
| a. | Security Valuation |
The Funds value their securities at current market value or fair value, consistent with the Funds’ valuation procedures (the “Valuation Procedures”) and regulatory requirements.
Each Fund’s assets for which market quotations are readily available are valued at fair value on the basis of quotations furnished by a pricing service or provided by securities dealers. Equity investments are generally valued using the last sale price or official closing price taken from the primary market in which each security trades, or if no sales occurred during the day, at the mean of the current quoted bid and ask prices.
Foreign equity securities that are traded on foreign exchanges that close prior to 4:00 p.m. Eastern time are valued by applying valuation factors to the last sale price or the mean price as noted above. Valuation factors are provided by an independent pricing service provider. These valuation factors are used when pricing a Fund’s portfolio holdings to estimate market movements between the time foreign markets close and the time a Fund values such foreign securities. These valuation factors are based on inputs such as depositary receipts, indices, futures, sector indices/ETFs, exchange rates, and local exchange opening and closing prices of each security. When prices with the application of valuation factors are utilized, the value assigned to the foreign securities may not be the same as quoted or published prices of the securities on their primary markets. Valuation factors are not utilized if the independent pricing service provider is unable to provide a valuation factor or if the valuation factor falls below a predetermined threshold.
Fixed income securities are generally valued using prices provided directly by independent third party services or provided directly from one or more broker dealers or market makers, each in accordance with the Valuation Procedures approved by the Trust’s Board of Trustees (the “Board”). The pricing services may use valuation models or matrix pricing, which consider yield or prices with respect to comparable bond quotations from bond dealers or by reference to other securities that are considered comparable in such characteristics as credit rating,
Semi-Annual Report 2016
52
Notes to Financial Statements (continued)
April 30, 2016 (Unaudited)
interest rates and maturity date, to determine current fair value. Pricing services generally price debt securities assuming orderly transactions of an institutional “round lot” size, but some trades occur in smaller “odd lot” size that may be affected at lower prices than institutional round lot trades.
Assets and liabilities initially expressed in foreign currency will be converted into U.S. Dollar values. Short-term debt securities (such as commercial paper and U.S. treasury bills) having a remaining maturity of 60 days or less are valued at the last quoted or evaluated bid price on the valuation date provided by an independent pricing service, or on the basis of amortized cost if it represents the best approximation for fair value. To the extent each Fund invests in other open-ended funds, the Fund will calculate its net asset value (“NAV”) based upon the NAV of the underlying funds in which it invests. The prospectuses of these underlying funds explain the circumstances under which they will use good faith fair value pricing and the effects of such fair value pricing.
Derivative instruments are generally valued according to the following procedures. For forward currency exchange contracts the market value is interpolated by the pricing agent by using forward spot points obtained from an authorized pricing service. Futures contracts are generally valued at the most recent settlement price as of net asset value (“NAV”) determination. Generally for swap agreements, if quotes are unavailable from authorized pricing services swap pricing is determined using a modelling tool which considers and forecasts the impact of cash flow projections, prevailing and expected interest rate movements, and potential credit events. Swap prices are generally evaluated based upon the latest available data provided by the counterparty and rely upon an industry accepted modelling tool.
When market quotations or exchange rates are not readily available, or if the Funds’ investment adviser, Aberdeen Asset Management Inc. (the “Adviser”), concludes that such market quotations do not accurately reflect fair value, the fair value of a Fund’s assets are determined in good faith in accordance with the Valuation Procedures. For options, swaps and warrants, a fair value price may be determined using readily available market quotations, prices provided by independent pricing services, or by using modelling tools provided by industry accepted financial data service providers. Key inputs to such tools may include yield and prices from comparable or reference assets, maturity or expiration dates, ratings and interest rates. In addition, the Adviser, through its pricing committee, may determine the fair value price in accordance with the Valuation Procedures approved by the Board.
In accordance with the authoritative guidance on fair value measurements and disclosures under GAAP, the Funds disclose the fair value of their investments using a three-level hierarchy that classifies the inputs to valuation techniques used to measure the fair value. The hierarchy assigns Level 1 measurements to valuations based upon unadjusted quoted prices in active markets for identical assets, Level 2 measurements to valuations based upon significant observable inputs, including adjusted quoted prices in active markets for similar assets, and Level 3 measurements to valuations based upon unobservable inputs that are significant to the valuation. Inputs refer broadly to the assumptions that market participants would use in pricing the asset or liability, including assumptions about risk, for example, the risk inherent in a particular valuation technique used to measure fair value including a pricing model and/or the risk inherent in the inputs to the valuation technique. Inputs may be observable or unobservable. Observable inputs are inputs that reflect the assumptions market participants would use in pricing the asset or liability, which are based on market data obtained from sources independent of the reporting entity. Unobservable inputs are inputs that reflect the reporting entity’s own assumptions about the assumptions market participants would use in pricing the asset or liability developed based on the best information available in the circumstances. A financial instrument’s level within the fair value hierarchy is based upon the lowest level of any input that is significant to the fair value measurement. The three-level hierarchy of inputs is summarized below:
| • | Level 1- quoted prices in active markets for identical investments; |
| • | Level 2- other significant observable inputs (including quoted prices for similar securities, interest rates, prepayment speeds, and credit risk); or |
| • | Level 3- significant unobservable inputs (including the Fund’s own assumptions in determining the fair value of investments). |
For movements between the Levels with the fair value hierarchy, the Funds have adopted a policy of recognizing transfers at the end of each period. As described above, certain foreign securities are valued utilizing valuation factors provided by an independent pricing service to reflect any significant market movements between the time foreign markets close and the time the Fund values such foreign securities. The utilization of valuation factors may result in transfers between Level 1 and Level 2. During the six-month period ended April 30, 2016, there were no transfers between levels.
2016 Semi-Annual Report
53
Notes to Financial Statements (continued)
April 30, 2016 (Unaudited)
The following is a summary of the inputs used as of April 30, 2016 in valuing the Funds’ investments and other financial instruments at fair value. The inputs or methodology used for valuing securities are not necessarily an indication of the risk associated with investing in those securities.
| Investments, at Value | LEVEL 1–Quoted Prices ($) | LEVEL 2–Other Significant Observable Inputs ($) | LEVEL 3–Significant Unobservable Inputs ($) | Total ($) | ||||||||||||
| Select International Equity Fund | ||||||||||||||||
| Investments in Securities | ||||||||||||||||
Common Stocks | 28,128,622 | 187,800,391 | – | 215,929,013 | ||||||||||||
Preferred Stocks | 4,175,879 | 14,306,955 | – | 18,482,834 | ||||||||||||
Exchange Traded Funds1 | – | – | – | – | ||||||||||||
Government Bonds1 | – | – | – | – | ||||||||||||
Repurchase Agreement | – | 4,001,323 | – | 4,001,323 | ||||||||||||
|
|
|
|
|
|
|
| |||||||||
| 32,304,501 | 206,108,669 | – | 238,413,170 | |||||||||||||
|
|
|
|
|
|
|
| |||||||||
| Select International Equity Fund II | ||||||||||||||||
| Investments in Securities | ||||||||||||||||
Common Stocks | 13,261,967 | 91,640,284 | – | 104,902,251 | ||||||||||||
Preferred Stocks | 2,033,708 | 6,953,663 | – | 8,987,371 | ||||||||||||
Repurchase Agreement | – | 1,916,947 | – | 1,916,947 | ||||||||||||
|
|
|
|
|
|
|
| |||||||||
| 15,295,675 | 100,510,894 | – | 115,806,569 | |||||||||||||
|
|
|
|
|
|
|
| |||||||||
| Total Return Bond Fund | ||||||||||||||||
| Investments in Securities | ||||||||||||||||
Asset-Backed Securities | – | 93,160,253 | – | 93,160,253 | ||||||||||||
Commercial Mortgage-Backed Securities | – | 109,277,166 | – | 109,277,166 | ||||||||||||
Non-Agency Mortgage-Backed Securities | – | 125,725,033 | – | 125,725,033 | ||||||||||||
Corporate Bonds | – | 299,634,138 | – | 299,634,138 | ||||||||||||
Municipal Bonds | – | 38,541,966 | – | 38,541,966 | ||||||||||||
Government Bonds | – | 103,753,598 | – | 103,753,598 | ||||||||||||
U.S. Agencies | – | 122,566,882 | – | 122,566,882 | ||||||||||||
U.S. Treasuries | – | 48,410,255 | – | 48,410,255 | ||||||||||||
Repurchase Agreement | – | 41,984,291 | – | 41,984,291 | ||||||||||||
| Other Financial Instruments | ||||||||||||||||
| Assets | ||||||||||||||||
Futures Contracts | 181,312 | – | – | 181,312 | ||||||||||||
Forward Foreign Currency Exchange Contracts | – | 1,789,259 | – | 1,789,259 | ||||||||||||
| Liabilities | ||||||||||||||||
Futures Contracts | (199,653 | ) | – | – | (199,653 | ) | ||||||||||
Forward Foreign Currency Exchange Contracts | – | (4,988,251 | ) | – | (4,988,251 | ) | ||||||||||
|
|
|
|
|
|
|
| |||||||||
| (18,341 | ) | 979,854,590 | – | 979,836,249 | ||||||||||||
|
|
|
|
|
|
|
| |||||||||
| 1 | Represents a security that is fair valued at zero pursuant to procedures approved by the Fund’s Board of Trustees. |
Semi-Annual Report 2016
54
Notes to Financial Statements (continued)
April 30, 2016 (Unaudited)
| Investments, at Value | LEVEL 1–Quoted Prices ($) | LEVEL 2–Other Significant Observable Inputs ($) | LEVEL 3–Significant Unobservable Inputs ($) | Total ($) | ||||||||||||
| Global High Income Fund | ||||||||||||||||
| Investments in Securities | ||||||||||||||||
Corporate Bonds | – | 686,720,316 | 4,710,615 | 691,430,931 | ||||||||||||
Government Bonds | – | 28,011,279 | – | 28,011,279 | ||||||||||||
Government Agencies | – | 13,740,276 | – | 13,740,276 | ||||||||||||
Bank Loans | – | 42,437,407 | 12,524,558 | 54,961,965 | ||||||||||||
Common Stocks | 115 | – | 4,282,760 | 4,282,875 | ||||||||||||
Preferred Stocks | 4,472,422 | – | – | 4,472,422 | ||||||||||||
Exchange Traded Funds | 55,193,386 | – | – | 55,193,386 | ||||||||||||
Repurchase Agreement | – | 1,417,608 | – | 1,417,608 | ||||||||||||
| Other Financial Instruments | ||||||||||||||||
| Assets | ||||||||||||||||
Forward Foreign Currency Exchange Contracts | – | 958,115 | – | 958,115 | ||||||||||||
Credit Default Swap Contracts | – | 57,382 | – | 57,382 | ||||||||||||
| Liabilities | ||||||||||||||||
Forward Foreign Currency Exchange Contracts | – | (6,245,802 | ) | – | (6,245,802 | ) | ||||||||||
|
|
|
|
|
|
|
| |||||||||
| 59,665,923 | 767,096,581 | 21,517,933 | 848,280,437 | |||||||||||||
|
|
|
|
|
|
|
| |||||||||
| Amounts | listed as “–” are $0 or round to $0. |
Select International Equity Fund Rollforward of Level 3 Fair Value Measurement For the Period Ended April 30, 2016 | ||||||||||||||||||||||||||||||||||||||||
| Investments in Securities | Balance as of October 31, 2015 | Accrued Discounts (Premiums) | Realized Gain (Loss) | Change in Unrealized Appreciation (Depreciation) | Net Purchases | Net Sales | Net Transfers in to Level 3 | Net Transfers out of Level 3 | Balance as of April 30, 2016 | Change in April 30, 2016 | ||||||||||||||||||||||||||||||
COMMON STOCK | ||||||||||||||||||||||||||||||||||||||||
Latvia | – | – | – | – | – | – | – | – | – | – | ||||||||||||||||||||||||||||||
Serbia | – | – | – | – | – | – | – | – | – | – | ||||||||||||||||||||||||||||||
Venezuela | – | – | – | – | – | – | – | – | – | – | ||||||||||||||||||||||||||||||
GOVERNMENT BONDS | ||||||||||||||||||||||||||||||||||||||||
Venezuela | – | 39,738 | (1,203,226 | ) | 1,163,498 | – | (10 | ) | – | – | – | – | ||||||||||||||||||||||||||||
EXCHANGE TRADED FUNDS | ||||||||||||||||||||||||||||||||||||||||
Russia | – | – | – | – | – | – | – | – | – | – | ||||||||||||||||||||||||||||||
TOTAL | – | 39,738 | (1,203,226 | ) | 1,163,498 | – | (10 | ) | – | – | – | – | ||||||||||||||||||||||||||||
2016 Semi–Annual Report
55
Notes to Financial Statements (continued)
April 30, 2016 (Unaudited)
Global High Income Fund Rollforward of Level 3 Fair Value Measurement For the Six-Month Period Ended April 30, 2016 | ||||||||||||||||||||||||||||||||||||||||
| Investments in Securities | Balance as of October 31, 2015 | Accrued Discounts (Premiums) | Realized Gain (Loss) | Change in Unrealized Appreciation (Depreciation) | Net Purchases | Net Sales | Net Transfers in to Level 3 | Net Transfers out of Level 3 | Balance as of April 30, 2016 | Change in Unrealized Appreciation (Depreciation) from Investments Held at April 30, 2016 | ||||||||||||||||||||||||||||||
BANK LOANS | ||||||||||||||||||||||||||||||||||||||||
Italy | $ | 9,993,061 | $ | 20,868 | $ | (1,682,702 | ) | $ | 1,975,814 | $ | – | $ | (4,993,700 | ) | $ | – | $ | – | $ | 5,313,341 | $ | 1,975,814 | ||||||||||||||||||
United States | 21,298,070 | 110,030 | (3,932,360 | ) | 2,586,682 | – | (12,851,205 | ) | – | – | 7,211,217 | (644,152 | ) | |||||||||||||||||||||||||||
COMMON STOCK | ||||||||||||||||||||||||||||||||||||||||
Norway | 11,244,457 | – | – | (6,961,697 | ) | – | – | – | – | 4,282,760 | (6,961,697 | ) | ||||||||||||||||||||||||||||
United States | 3,380,976 | – | (1,494,392 | ) | 792,243 | – | (2,678,827 | ) | – | – | – | – | ||||||||||||||||||||||||||||
CORPORATE BONDS | ||||||||||||||||||||||||||||||||||||||||
Canada | 10,244,723 | 6,642 | (2,540,163 | ) | 190,494 | – | (3,234,206 | ) | – | – | 4,667,490 | 190,494 | ||||||||||||||||||||||||||||
United States | 45,188 | – | – | (2,063 | ) | – | – | – | – | 43,125 | (2,063 | ) | ||||||||||||||||||||||||||||
TOTAL | $ | 56,206,475 | $ | 137,540 | $ | (9,649,617 | ) | $ | (1,418,527 | ) | $ | – | $ | (23,757,938 | ) | $ | – | $ | – | $ | 21,517,933 | $ | (5,441,604 | ) | ||||||||||||||||
The following is quantitative information about level 3 fair value measurements:
| Description | Fair Value at 4/30/16 ($) | Valuation Technique(s) | Unobservable Inputs | Range | Weighted Average | |||||||
Global High Income Fund | ||||||||||||
Bank Loans | $ | 12,524,558 | Broker Pricing | Bid/Ask Spread | $87.5 – 108.8 | $98.5 | ||||||
Common Stocks | 4,282,760 | Evaluated Pricing | Bid/Ask Spread | 3.0 | 3.0 | |||||||
Corporate Bonds | 4,710,615 | Broker Pricing | Bid/Ask Spread | 2.9 – 64.6 | 54.0 | |||||||
Evaluated Pricing: In determining the fair value of the Common Stock as of April 30, 2016, the Global High Income Fund took an average of the values calculated using the Income Approach – Discounted Cash Flow Method and the Market Approach – Guideline Public Company Method, weighted equally, to derive an evaluated price.
Income Approach: A well-established technique used to estimate the equity value of a company through an analysis of projected income, such as using the Discounted Cash Flow Method. Using this analysis, value is indicated from all of the future cash flows attributable to the subject company discounted to present value at a required rate of return. If debt free cash flows are used, any long-term debt is deducted from the indicated value of the invested capital to determine equity value.
Market Approach: References actual transactions in the equity of the enterprise being valued or transactions in similar enterprises that are traded in private and public markets. Third-party transactions in the equity of an entity generally represent the best estimate of fair value if they are completed at arm’s length. The Guideline Public Company Method involves identifying and selecting publicly traded companies with financial and operating characteristics similar to the company being valued. Once publicly traded companies are identified, valuation multiples can be derived, adjusted for comparability, and then applied to the subject company to estimate the value of its equity or invested capital. Similarly, the Comparable Transactions Method analyzes transactions involving target companies operating in industries similar to the subject company. While it is known that no two companies are exactly alike, nor are any two transactions structured identically, consideration is given to comparisons of the capital structure, operations, size, and profitability, as well as other operating characteristics of the target companies. Once comparable transactions for reasonable targets are identified, valuation multiples can be derived, adjusted for comparability, and then applied to the subject company to estimate the value of its equity or invested capital.
| b. | Repurchase Agreements |
The Funds may enter into repurchase agreements under the terms of a Master Repurchase Agreement. It is each Fund’s policy that its custodian/counterparty segregate the underlying collateral securities, consisting of government securities, the value of which exceeds the principal amount of the repurchase transaction, including accrued interest. The repurchase price generally equals the price paid by a Fund plus interest negotiated on the basis of current short-term rates. To the extent that any repurchase transaction exceeds one business day, the collateral is valued on a daily basis to determine its adequacy. If the counterparty defaults and the value of the collateral declines or if
2016 Semi–Annual Report
56
Notes to Financial Statements (continued)
April 30, 2016 (Unaudited)
bankruptcy proceedings are commenced with respect to the counterparty of the security, realization of the collateral by the Funds may be delayed or limited. Repurchase agreements are subject to contractual netting arrangements with the counterparty, Fixed Income Clearing Corp. For additional information on individual repurchase agreements, see the Statements of Investments.
| c. | Restricted Securities |
Restricted securities are privately-placed securities whose resale is restricted under U.S. securities laws. The Funds may invest in restricted securities, including unregistered securities eligible for resale without registration pursuant to Rule 144A and privately-placed securities of U.S. and non-U.S. issuers offered outside the U.S. without registration pursuant to Regulation S under the Securities Act of 1933, as amended. Rule 144A securities may be freely traded among certain qualified institutional investors, such as the Funds, but resale of such securities in the U.S. is permitted only in limited circumstances.
| d. | Foreign Currency Translation |
Foreign currency amounts are translated into U.S. Dollars at the current rate of exchange as of Valuation Time to determine the value of investments, assets and liabilities. Purchases and sales of securities, and income and expenses are translated at the prevailing rate of exchange on the respective date of these transactions. The Funds do not isolate that portion of the results of operations resulting from changes in foreign exchange rates on investments from fluctuations arising from changes in market prices of securities held. These fluctuations are included with the net realized and unrealized gain or loss from investments and foreign currencies within the Statements of Operations.
Foreign securities, currencies, and other assets and liabilities denominated in foreign currencies are translated into U.S. Dollars at the exchange rate of said currencies against the U.S. Dollar, as of the Valuation Time, as provided by an independent pricing service.
Investments in emerging markets can be riskier and more volatile than investments in the United States and other developed markets. Adverse political and economic developments can make it more difficult for the Select International Equity Fund and Select International Equity Fund II to sell foreign securities which could reduce the NAV of the Funds. In contrast to more established markets, emerging markets may have governments that are less stable and markets that are less liquid, increasing your investment risk. At April 30, 2016, the Select International Equity Fund had 0.00% of its net assets invested in Venezuelan securities and held Venezuelan Bolivar valued at 0.00% of the Fund’s net assets. Venezuela currently imposes foreign exchange controls which prohibit the Select International Equity Fund from repatriating dividends, interest, or other income from investments or proceeds from the sale of Venezuelan securities.
| e. | Derivative Financial Instruments |
Certain Funds are authorized to use derivatives to manage currency risk, credit risk, and interest rate risk and to replicate, or use as a substitute for, physical securities. Losses may arise due to changes in the value of the contract or if the counterparty does not perform under the contract. The use of derivative instruments involves, to varying degrees, elements of market risk in excess of the amount recognized in the Statements of Assets and Liabilities.
Forward Foreign Currency Exchange Contracts
A forward foreign currency exchange contract (“forward contract”) involves an obligation to purchase and sell a specific currency at a future date, which may be any fixed number of days from the date of the contract agreed upon by the parties, at a price set at the time of the contract. Forward contracts are used to manage a Fund’s currency exposure in an efficient manner. They are used to sell unwanted currency exposure that comes with holding securities in a market, or to buy currency exposure where the exposure from holding securities is insufficient to give the desired currency exposure either in absolute terms or relative to the benchmark. The use of forward contracts allows the separation of decision-making between markets and their currencies. The forward contract is marked-to-market daily and the change in market value is recorded by a Fund as unrealized appreciation or depreciation. Forward contracts’ prices are received daily from an independent pricing provider. When the forward contract is closed, a Fund records a realized gain or loss equal to the difference between the value at the time it was opened and the value at the time it was closed. These realized and unrealized gains and losses are reported on the Statements of Operations. During the six-month period ended April 30, 2016, the Funds used forward contracts to hedge some of the Funds’ foreign currency holdings. Managing active currency risk involves both hedging currency risk and adding currency risk in excess of underlying bond positions. A Fund may also enter into forward contracts to obtain potential appreciation of a foreign currency, which also adds currency risk.
Futures Contracts
Certain Funds may invest in financial futures contracts (“futures contracts”) for the purpose of hedging their existing portfolio securities, or securities that a Fund intends to purchase, against fluctuations in value caused by changes in prevailing market interest rates or prices. Futures contracts may also be entered into for non-hedging purposes; however, in those instances the aggregate initial margin and premiums required to establish a Fund’s positions may not exceed 5% of a Fund’s NAV after taking into account unrealized profits and unrealized losses on any such contract it has entered.
Semi-Annual Report 2016
57
Notes to Financial Statements (continued)
April 30, 2016 (Unaudited)
Upon entering into a futures contract, a Fund is required to pledge to the broker an amount of cash and/or other assets equal to a certain percentage of the contract amount. This payment is known as “initial margin”. Subsequent payments, known as “variation margin,” are calculated each day, depending on the daily fluctuations in the fair value/market value of the underlying assets. An unrealized gain/(loss) equal to the variation margin is recognized on a daily basis. When the contract expires or is closed, the gain/(loss) is realized and is presented in the Statements of Operations as a net realized gain/(loss) on futures contracts. Futures contracts are valued daily at their last quoted sale price on the exchange on which they are traded.
A “sale” of a futures contract means a contractual obligation to deliver the securities or foreign currency called for by the contract at a fixed price at a specified time in the future. A “purchase” of a futures contract means a contractual obligation to acquire the securities or foreign currency at a fixed price at a specified time in the future.
Should market conditions change unexpectedly, a Fund may not achieve the anticipated benefits of the futures contracts and may realize a loss. The use of futures transactions for hedging purposes involves the risk of imperfect correlation in movements in the price of futures contracts, interest rates and the value/market value of the underlying hedged assets. During the six-month period ended April 30, 2016, U.S. Treasury futures contracts were used to manage Total Return Bond Fund’s overall curve and interest rate exposure.
Swaps
Certain Funds enter into swaps to efficiently gain or hedge interest rate or currency risk. A swap is an agreement that obligates two parties to exchange a series of cash flows at specified intervals based upon or calculated by reference to changes in specified prices or rates for a specified amount of an underlying asset or notional principal amount. A Fund will enter into swaps only on a net basis, which means that the two payment streams are netted out, with a Fund receiving or paying, as the case may be, only the net amount of the difference between the two payments. Risks may arise as a result of the failure of the counterparty to the swap contract to comply with the terms of the swap contract. The loss incurred by the failure of a counterparty is generally limited to the net interest payment to be received by a Fund, and/or the termination value at the end of the contract. Therefore, a Fund considers the creditworthiness of each counterparty to a swap contract in evaluating potential credit risk. Additionally, risks may arise from unanticipated movements in interest rates or in the value of the underlying reference asset or index. A Fund records unrealized gains/(losses) on a daily basis representing the value and the current net receivable or payable relating to open swap contracts. Net amounts received or paid on the swap contract are recorded as realized gains/(losses). Fluctuations in the value of swap contracts are recorded for financial statement purposes as unrealized appreciation or depreciation of swap contracts. Realized gains/(losses) from terminated swaps are included in net realized gains/(losses) on swap contracts transactions.
Certain Funds are a party to International Swap Dealers Association, Inc. Master Agreements (“ISDA Master Agreements”). These agreements are with select counterparties and they govern transactions, including certain over-the-counter derivative and foreign exchange contracts, entered into by certain Funds and the counterparty. The ISDA Master Agreements maintain provisions for general obligations, representations, agreements, collateral, and events of default or termination. The occurrence of a specified event of termination may give a counterparty the right to terminate all of its contracts and affect settlement of all outstanding transactions under the applicable ISDA Master Agreement. To the extent a Fund engages in transactions under these agreements, it is subject to counterparty risk, which is described with respect to swaps both above and below.
Certain swaps entered into after June 10, 2013, including some interest rate swaps and credit default swap contracts, must be cleared pursuant to U.S. Commodity Futures Trading Commission (“CFTC”) regulations. As a result, these swaps can no longer be traded over-the-counter and are subject to various regulations and rules of the CFTC.
Entering into swap agreements involves, to varying degrees, elements of credit and market risk in excess of the amounts recognized on the Statements of Assets and Liabilities. Such risks involve the possibility that there will be no liquid market for these agreements, that the counterparty to the agreements may default on its obligation to perform and that there may be unfavorable changes in the value of the index or securities underlying the agreement. The Funds’ maximum risk of loss from counterparty risk related to swaps is the fair value of the contract. This risk is mitigated by having a master netting agreement between the Funds and the counterparties and by the posting of collateral by the counterparties to the Funds to cover the Funds’ exposure to the counterparty. A Fund must also segregate liquid assets to “cover” its obligations under the swap.
Credit Default Swap
A credit default swap is a credit derivative contract between two counterparties. The buyer makes periodic payments to the seller, and in return receives protection if an underlying financial instrument defaults. A Fund might use credit default swap contracts to limit or to reduce risk exposure of the Fund to defaults of corporate and sovereign issuers (i.e., to reduce risk when the Fund owns or has exposure to such issuers). A Fund also might use credit default swap contracts, to create direct or synthetic short or long exposure to domestic or foreign corporate debt securities or certain sovereign debt securities to which the Fund is not otherwise exposed. As the seller in a credit
2016 Semi-Annual Report
58
Notes to Financial Statements (continued)
April 30, 2016 (Unaudited)
default swap contract, a Fund would be required to pay the par (or other agreed-upon) value of a referenced debt obligation to the counterparty in the event of a default (or similar event) by a third party, such as a U.S. or foreign issuer, on the debt obligation. In return, a Fund would receive from the counterparty a periodic stream of payments over the term of the contract, provided that no event of default (or similar event) occurs. If no event of default (or similar event) occurs, a Fund would keep the stream of payments and would have no payment of obligations. As the seller in a credit default swap contract, a Fund effectively would add economic leverage to its portfolio because, in addition to its total net assets, a Fund would be subject to investment exposure on the notional amount of the swap. As the purchaser in a credit default swap contract, a Fund would function as the counterparty referenced in the preceding paragraph. This would involve the risk that the investment might expire worthless. It also would involve credit risk that the seller may fail to satisfy its payment obligations to a Fund in the event of a default (or similar event). As the purchaser in a credit default swap contract, a Fund’s investment would generate income only in the event of an actual default (or similar event) by the issuer of the underlying obligation. During the six-month period ended April 30, 2016, Global High Income Fund employed CDX (a basket of credit derivatives) to hedge overall beta risk, a measure of the volatility, or systematic risk, of a security or a portfolio in comparison to the market as a whole. The Global High Income Fund unwound its individual credit default swaps that were used to hedge individual exposures as well as to initiate new long positions that are more efficient than the cash market.
Summary of Derivative Instruments
Certain Funds may use derivatives for various purposes as noted above.
| Location on the Statement of Assets and Liabilities | ||||||
| Derivative Instrument Risk Type | Asset Derivatives | Liability Derivatives | ||||
Interest Rate Risk | Variation margin receivable for futures contracts | | Variation margin payable for futures contracts | | ||
Foreign Exchange Risk | Unrealized appreciation on forward foreign currency exchange contracts | | Unrealized depreciation on forward foreign currency exchange contracts | | ||
Credit Risk | Variation margin receivable for centrally cleared credit default swap contracts | | Variation margin payable for centrally cleared credit default swap contracts | | ||
The following is a summary of the fair value of Derivative Instruments, not accounted for as hedging instruments, as of April 30, 2016:
| Total Return Bond Fund | Asset Derivatives | Liability Derivatives | ||||||||||
| Period Ended April 30, 2016 | Period Ended April 30, 2016 | |||||||||||
| Derivatives not accounted for as hedging instruments and risk exposure | Statement of Assets and Liabilities Location | Fair Value | Statement of Assets and Liabilities Location | Fair Value | ||||||||
| Forward foreign exchange contracts | ||||||||||||
(foreign exchange risk) | Unrealized appreciation on forward currency exchange contracts | $ | 1,789,259 | Unrealized depreciation on forward currency exchange contracts | $ | 4,988,251 | ||||||
| Futures contracts | ||||||||||||
(Interest Rate Risk) | Variation margin receivable for futures contracts | $ | 447,913 | Variation margin payable for futures contracts | $ | – | ||||||
Total | $ | 2,237,172 | $ | 4,988,251 | ||||||||
Semi-Annual Report 2016
59
Notes to Financial Statements (continued)
April 30, 2016 (Unaudited)
| Global High Income Fund | Asset Derivatives | Liability Derivatives | ||||||||||
| Period Ended April 30, 2016 | Period Ended April 30, 2016 | |||||||||||
| Derivatives not accounted for as hedging instruments and risk exposure | Statement of Assets and Liabilities Location | Fair Value | Statement of Assets and Liabilities Location | Fair Value | ||||||||
| Credit default swap contracts | ||||||||||||
(credit risk) | Variation margin receivable for centrally cleared credit default swap contracts | $ | – | Variation margin payable for centrally cleared credit default swap contracts | $ | 6,061 | ||||||
| Forward foreign exchange contracts | ||||||||||||
(foreign exchange risk) | Unrealized appreciation on forward currency exchange contracts | $ | 958,115 | Unrealized depreciation on forward currency exchange contracts | $ | 6,245,802 | ||||||
Total | $ | 958,115 | $ | 6,251,863 | ||||||||
| Amounts | listed as “–” are $0 or round to $0. |
A reconciliation of the gross amounts on the Statements of Assets and Liabilities as of April 30, 2016 to the net amounts by broker and derivative type, including any collateral received or pledged, is included in the following tables:
Gross Amounts Not Offset | ||||||||||||||||||||||||||||||||
| Description | Gross Amounts of Assets Presented in Statement of Financial Position | Financial Instruments | Collateral Received (1) | Net Amount (3) | Gross Amounts of Liabilities Presented in Statement of Financial Position | Financial Instruments | Collateral Pledged (1) | Net Amount (3) | ||||||||||||||||||||||||
| Assets | Liabilities | |||||||||||||||||||||||||||||||
| Total Return Bond Fund | ||||||||||||||||||||||||||||||||
Forward foreign currency | ||||||||||||||||||||||||||||||||
Barclays Bank PLC (2) | $ | 339,795 | $ | (339,795 | ) | $ | — | $ | — | $ | 830,794 | $ | (339,795 | ) | $ | — | $ | 490,999 | ||||||||||||||
Citibank N.A. (2) | 323,897 | (323,897 | ) | — | — | 1,654,879 | (323,897 | ) | — | 1,330,982 | ||||||||||||||||||||||
JPMorgan Chase Bank N.A. | 20,272 | — | — | 20,272 | — | — | — | — | ||||||||||||||||||||||||
Westpac Banking Corp. | 1,105,295 | (1,105,295 | ) | — | — | 2,502,578 | (1,105,295 | ) | — | 1,397,283 | ||||||||||||||||||||||
| 1. | In some instances, the actual collateral received and/or pledged may be more than the amount shown here due to overcollateralization. |
| 2. | Includes financial instruments (forwards) which are not subject to a master netting arrangement across funds, or other another similar arrangement. |
| 3. | Net amounts represent the net receivables/(payable) that would be due from/to the counterparty in the event of default. Exposure from financial derivative instruments can only be netted across transactions governed under the same master netting agreement with the same legal entity. |
Amounts listed as “–” are $0 or round to $0.
2016 Semi-Annual Report
60
Notes to Financial Statements (continued)
April 30, 2016 (Unaudited)
Gross Amounts Not Offset | ||||||||||||||||||||||||||||||||
| Description | Gross Amounts of Assets Presented in Statement of Financial Position | Financial Instruments | Collateral Received (1) | Net Amount (3) | Gross Amounts of Liabilities Presented in Statement of Financial Position | Financial Instruments | Collateral Pledged (1) | Net Amount (3) | ||||||||||||||||||||||||
| Assets | Liabilities | |||||||||||||||||||||||||||||||
| Global High Income Fund | ||||||||||||||||||||||||||||||||
Forward foreign currency | ||||||||||||||||||||||||||||||||
Barclays Bank PLC (2) | $ | 565,406 | $ | (47,813 | ) | $ | — | $ | 517,593 | $ | 47,813 | $ | (47,813 | ) | $ | — | $ | — | ||||||||||||||
Citibank N.A. (2) | — | — | — | — | 3,090,106 | — | — | 3,090,106 | ||||||||||||||||||||||||
Deutsche Bank AG (2) | 392,709 | — | — | 392,709 | — | — | — | — | ||||||||||||||||||||||||
Royal Bank of Canada (2) | — | — | — | — | 2,929,851 | — | — | 2,929,851 | ||||||||||||||||||||||||
Westpac Banking Corp. | — | — | — | — | 178,032 | — | — | 178,032 | ||||||||||||||||||||||||
| 1. | In some instances, the actual collateral received and/or pledged may be more than the amount shown here due to overcollateralization. |
| 2. | Includes financial instruments (forwards) which are not subject to a master netting arrangement across funds, or other another similar arrangement. |
| 3. | Net amounts represent the net receivables/(payable) that would be due from/to the counterparty in the event of default. Exposure from financial derivative instruments can only be netted across transactions governed under the same master netting agreement with the same legal entity. |
Amounts listed as “–” are $0 or round to $0.
The Effect of Derivative Instruments on the Statement of Operations for the six-month period ended April 30, 2016:
| Total Return Bond Fund | ||||||||||
| Derivatives not accounted for as hedging instruments under Statement 133(a) | Location of Gain or (Loss) on Derivatives | Realized Gain or (Loss) on Derivatives | Change in Unrealized Appreciation/ (Depreciation) on Derivatives | |||||||
| Realized/Unrealized Gain/(Loss) from Investments, Futures Contracts, Futures Options Contracts and Foreign Currency Transactions | ||||||||||
| Forward foreign exchange contracts | ||||||||||
(foreign exchange risk) | $ | (4,206,519 | ) | $ | (2,377,558 | ) | ||||
| Futures contracts | ||||||||||
(Interest Rate Risk) | $ | (301,813 | ) | $ | 153,332 | |||||
| Futures options contracts | ||||||||||
(Interest Rate Risk) | $ | (15,469 | ) | $ | – | |||||
Total | $ | (4,523,801 | ) | $ | (2,224,226 | ) | ||||
| Amounts | listed as “–” are $0 or round to $0. |
Semi-Annual Report 2016
61
Notes to Financial Statements (continued)
April 30, 2016 (Unaudited)
| Global High Income Fund | ||||||||||
| Derivatives not accounted for as hedging instruments under Statement 133(a) | Location of Gain or (Loss) on Derivatives | Realized Gain or (Loss) on Derivatives | Change in Unrealized Appreciation/ (Depreciation) on Derivatives | |||||||
| Realized/Unrealized Gain/(Loss) from Investments, Credit Default Swap Contracts and Foreign Currency Transactions | ||||||||||
| Credit default swap contracts | ||||||||||
(credit risk) | $ | 3,456,773 | $ | (3,216,707 | ) | |||||
| Forward foreign exchange contracts | ||||||||||
(foreign exchange risk) | $ | 13,131,871 | $ | (10,161,999 | ) | |||||
Total | $ | 16,588,644 | $ | (13,378,706 | ) | |||||
| Amounts | listed as “–” are $0 or round to $0. |
Information about derivatives reflected as of the date of this report is generally indicative of the type of activity for the six-month period ended April 30, 2016. The table below summarizes the weighted average values of derivatives holdings by the Funds during the six-month period ended April 30, 2016.
| Fund | Forward foreign exchange contracts (Average Notional Value) | Futures contracts (Average Notional Value) | Credit default swap contracts (Average Notional Value) | |||||||
Total Return Bond Fund | $241,895,105 | $ | (351,525 | ) | $ | – | ||||
Global High Income Fund | 268,385,812 | – | 22,670,500 | |||||||
| Amounts | listed as “–” are $0 or round to $0. |
The Funds value derivatives at fair value, as described in the results of operations. Accordingly, the Funds do not follow hedge accounting even for derivatives employed as economic hedges.
| f. | Bank Loans |
Global High Income Fund may invest in bank loans. Bank loans include floating and fixed-rate debt obligations. Floating rate loans are debt obligations issued by companies or other entities with floating interest rates that reset periodically. Bank loans may include, but are not limited to, term loans, delayed funding loans, bridge loans and revolving credit facilities. Loan interest will primarily take the form of assignments purchased in the primary or secondary market but may include participants. Floating rate loans are secured by specific collateral of the borrower and are senior to most other securities of the borrower (e.g., common stock or debt instruments) in the event of bankruptcy. Floating rate loans are often issued in connection with recapitalizations, acquisitions, leveraged buyouts, and refinancings. Floating rate loans are typically structured and administered by a financial institution that acts as the agent of the lenders participating in the floating rate loan. Floating rate loans may be acquired directly through the agent, as an assignment from another lender who holds a direct interest in the floating rate loan, or as a participation interest in another lender’s portion of the floating rate loan.
Global High Income Fund may enter into, or acquire participation in, delayed funding loans and revolving credit facilities. Delayed funding loans and revolving credit facilities are borrowings in which the Global High Income Fund agrees to make loans up to a maximum amount upon demand by the borrowing issuer for a specified term. A revolving credit facility differs from a delayed funding loan in that as the borrowing issuer repays the loan, an amount equal to the repayment is again made available to the borrowing issuer under the facility. The borrowing issuer may at any time borrow and repay amounts so long as, in the aggregate, at any given time the amount borrowed does not exceed the maximum amount established by the loan agreement. Delayed funding loans and revolving credit facilities usually provide for floating or variable rates of interest.
There are a number of risks associated with an investment in bank loans including credit risk, interest rate risk, illiquid securities risk, and prepayment risk. There is also the possibility that the collateral securing a loan, if any, may be difficult to liquidate or be insufficient to cover the amount owed under the loan. These risks could cause a Fund to lose income or principal on a particular investment, which in turn could affect the Fund’s returns. In addition, bank loans may settle on a delayed basis, resulting in the proceeds from the sale of such loans not
2016 Semi-Annual Report
62
Notes to Financial Statements (continued)
April 30, 2016 (Unaudited)
being readily available to make additional investments or to meet a Fund’s redemption obligations. To the extent the extended settlement process gives rise to short-term liquidity needs, a Fund may hold additional cash, sell investments or temporarily borrow from banks or other lenders.
As of April 30, 2016, Global High Income Fund held no unfunded commitments or bridge loans.
| g. | Security Transactions, Investment Income and Expenses |
Security transactions are recorded on the trade date. Realized and unrealized gains/(losses) from security and currency transactions are calculated on the identified cost basis. Dividend income is recorded on the ex-dividend date except for certain dividends on foreign securities, which are recorded as soon as a Fund is informed after the ex-dividend date. Interest income is recorded on an accrual basis using the effective interest method. Expenses are recorded on an accrual basis. Expenses directly attributable to a Fund are charged to that Fund. Expenses not directly attributable to a Fund are allocated proportionately among all Funds of the Trust. For each of the Funds, the method for allocating income, fund level expenses, and realized and unrealized gains or losses among classes is based on the total net asset value of each class’s shares in proportion to the total net assets of the relevant Fund. Expenses specific to a class (such as Rule 12b-1 and Transfer Agent fees) are charged to that class.
| h. | Foreign Taxes |
Funds that invest in foreign securities are subject to foreign taxes that may be imposed by certain countries in which the Funds invest. The Funds generally record foreign taxes based on applicable foreign tax law. The Funds incur withholding taxes on certain foreign dividends and interest, and those taxes are accrued at the time the associated income is recorded. The Funds file withholding tax reclaims in certain jurisdictions to recover a portion of amounts previously withheld. The Funds record a reclaim receivable based on, among other things, a jurisdiction’s legal obligation to pay reclaims as well as payment history and market convention. In consideration of recent decisions rendered by European courts, the Select International Equity Fund and Select International Equity Fund II (the “International Equity Funds”) have filed for additional reclaims related to prior years in accordance with European Union law. However, consistent with U.S. GAAP accrual requirements, the International Equity Funds have not recorded a corresponding receivable amount because there is limited historical precedent for U.S. funds collecting reclaims of this magnitude and the total amount of the reclaims that these funds may receive in the future is uncertain. Any amounts to which the International Equity Funds may be entitled, if and when recorded, likely would result in an increase in the net asset value per share of each fund at that time. As of April 30, 2016, the total amount of reclaims filed for the International Equity Funds in the countries that may be affected by the European courts’ decisions (namely, Spain, France, Germany, The Netherlands, and Poland) represents approximately 10% of the net asset value per share for each of the International Equity Funds; however, the recovery of any or all of this amount and timing of recovery, if any, is uncertain. On May 21, 2015, the Select International Equity Fund and the Select International Equity Fund II (collectively “the Funds”) received withholding tax refunds of $1,355,000 (0.57% of total net assets) and $500,000 (0.43% of total net assets), respectively, from the Finnish Tax Authority (FTA) in connection with the Funds’ filing of withholding tax reclaims for taxes that were previously paid by the Funds to the FTA.
| i. | Distributions |
Distributions from net investment income, if any, are declared and paid monthly for the Total Return Bond Fund and Global High Income Fund. Distributions from net investment income, if any, are declared and paid annually for the Select International Equity Fund and Select International Equity Fund II. The Funds will also declare and pay distributions annually from net realized gains on investment transactions and net realized foreign exchange gains, if any. Dividends and distributions to shareholders are recorded on the ex-dividend date. Additional distributions of net investment income and capital gains may be made at the discretion of the Board to avoid the application of the excise tax imposed under Section 4982 of the Internal Revenue Code of 1986, as amended (the “Code”), for certain undistributed amounts.
Dividends and distributions to shareholders are determined in accordance with federal income tax regulations, which may differ from GAAP. These differences are primarily due to differing treatments of income and gains on various investment securities held by the Funds, timing differences and differing characterization of distributions made by the Funds as a whole.
| j. | Federal Income Taxes |
Each Fund intends to continue to qualify as a “regulated investment company” by complying with the provisions available to certain investment companies, as defined in Subchapter M of the Code, and to make distributions of net investment income and net realized capital gains sufficient to relieve the Funds from all federal income taxes. Therefore, no federal income tax provision is required.
Management of the Funds has concluded that there are no significant uncertain tax positions that would require recognition in the financial statements. Since tax authorities can examine previously filed tax returns, the Funds’ U.S. federal and state tax returns for each of the four fiscal years up to the most recent fiscal year ended October 31 are subject to such review.
Semi-Annual Report 2016
63
Notes to Financial Statements (continued)
April 30, 2016 (Unaudited)
3. Agreements and Transactions with Affiliates
| a. | Investment Adviser |
Under the Investment Advisory Agreements with the Funds, effective May 22, 2013, Aberdeen Asset Management Inc. (“Aberdeen” or the “Adviser”) manages the Funds in accordance with the policies and procedures established by the Board. Prior to May 22, 2013, the Funds were managed by Artio Global Management LLC (the “Predecessor Adviser”).
For services provided under the terms of the current Investment Advisory Agreement, each Fund pays the Adviser an annual management fee (as a percentage of its average daily net assets) paid monthly according to the following schedule:
| Fund | Fee Schedule | |||||||
Select International Equity Fund | Of the first $5 billion | 0.900% | ||||||
| On the next $2.5 billion | 0.880% | |||||||
| Over $7.5 billion | 0.850% | |||||||
Select International Equity Fund II | Of the first $5 billion | 0.900% | ||||||
| On the next $2.5 billion | 0.880% | |||||||
| Over $7.5 billion | 0.850% | |||||||
Total Return Bond Fund | On all assets | 0.350% | ||||||
Global High Income Fund | Of the first $5 billion | 0.650% | ||||||
| On the next $2.5 billion | 0.630% | |||||||
| On the next $2.5 billion | 0.600% | |||||||
| Over $10 billion | 0.590% | |||||||
The Adviser has engaged the services of Aberdeen Asset Managers Limited (the “Subadviser”), an affiliate, pursuant to the subadvisory agreements. The Subadviser manages a portion of the International Equity Funds’ investments and has responsibility for making all investment decisions for the portion of a Fund’s assets that it manages. Pursuant to the subadvisory agreements, the Adviser pays fees to the Subadviser. For the six-month period ended April 30, 2016, the Adviser paid the following amounts to the Subadviser for its services to the respective Funds:
| Fund | Amount | |||
Select International Equity Fund | 708,014 | |||
Select International Equity Fund II | 354,821 | |||
Certain of the Funds and Aberdeen have entered into written contracts (“Expense Limitation Agreements”) limiting operating expenses for all classes of each Fund from exceeding the amounts listed below. This contractual limitation may not be terminated without the approval of the Board until the earlier of (a) the termination of the Investment Advisory Agreement or (b) the end of February, 2017. This limit excludes certain expenses, including taxes, interest, brokerage commissions, and other expenditures which are capitalized in accordance with GAAP, and other extraordinary expenses not incurred in the ordinary course of the Fund’s business.
| Fund | Class A Limit | Institutional Class Limit | ||||||
Total Return Bond Fund | 0.69% | 0.44% | ||||||
Global High Income Fund | 1.00% | 0.75% | ||||||
The Adviser has agreed to continue to waive a portion of its management fee for each of the Funds at the annual rate of 0.005% of the respective Funds’ average daily assets. The waiver may be terminated at any time by the Board.
Aberdeen may request and receive reimbursement from a Fund of the advisory fees waived and other expenses reimbursed pursuant to the Expense Limitation Agreements at a later date not to exceed three years from the fiscal year in which the corresponding reimbursement to the Funds was made.
However, no reimbursement will be made for fees waived unless:
(i) the total annual expense ratio of the class making such reimbursement is less than the limit set forth above; and
(ii) the payment of such reimbursement is approved by the Board on a quarterly basis (the “Reimbursement Requirements”).
2016 Semi-Annual Report
64
Notes to Financial Statements (continued)
April 30, 2016 (Unaudited)
If the Board approves any changes in the waiver terms or limitations, reimbursements are only permitted to the extent that the terms of the Expense Limitation Agreements in effect at the time of the waiver are met at the time that reimbursement is approved. Except as provided for in the Expense Limitation Agreements, reimbursement of amounts previously waived or assumed by Aberdeen is not permitted.
As of April 30, 2016, to the extent the Reimbursement Requirements are met, the cumulative potential reimbursements for each Fund, based on expenses reimbursed by Aberdeen would be:
| Fund | Amount 2013 | Amount 2014 | Amount Fiscal Year 2015 | Amount Six-Month Period Ended April 30, 2016 (Expires 4/30/19) | Total* | |||||||||||||||
Select International Equity Fund | $ | – | $ | – | $ | – | $ | – | $ | – | ||||||||||
Select International Equity Fund II | – | – | – | – | – | |||||||||||||||
Total Return Bond Fund | 11,826 | 22,047 | 82,622 | 191,333 | 307,828 | |||||||||||||||
Global High Income Fund | – | 75,716 | 198,764 | 407,114 | 681,594 | |||||||||||||||
| * | Amounts reported are due to expire throughout the respective 3-year expiration period presented above. |
| Amounts | listed as “–” are $0 or round to $0. |
During the year ended October 31, 2015 an accounting correction to reflect an aged dividend receivable for an ADR at its net realizable value inclusive of currency fluctuations resulted in an amount due to the Select International Equity Fund II. To rectify the matter, the Adviser agreed to contribute $305,291 to the Select International Equity Fund II.
4. Distributor and Shareholder Services
The Funds and Aberdeen Fund Distributors, LLC (the “Distributor” or “AFD”) are parties to the current Underwriting Agreement (the “Underwriting Agreement”) whereby the Distributor acts as principal underwriter for the Funds’ shares. Prior to May 22, 2013, Quasar Distributors, LLC (“Quasar”) was the distributor of the Funds.
The Funds have adopted a Distribution and Shareholder Services Plan (the “Plan”), pursuant to Rule 12b-1 under the 1940 Act. Under the Plan, each Fund’s Class A shares may compensate certain financial institutions, including the Distributor, for certain distribution, shareholder servicing, administrative and accounting services. The Funds’ Class A shares may expend an aggregate amount, on an annual basis, not to exceed 0.25% of the value of the average daily net assets of a Fund attributable to Class A shares. The Funds will adjust accruals accordingly for any unused or surplus balances on an annual basis. The Adviser may pay additional marketing and other distribution costs out of its profits.
Under its terms, the Funds’ Plan shall remain in effect from year to year, provided such continuance is approved annually by a vote of a majority of the Board members and a majority of those Board members who are not “interested persons” of the Funds and who have no direct or indirect financial interest in the operation of the Plan or in any agreement related to the Plan.
5. Investment Transactions
Purchases and sales of securities (excluding short-term securities) for the six-month period ended April 30, 2016, were as follows:
| Fund | Purchases | Sales | ||||||
Select International Equity Fund | $ | 39,762,637 | $ | 77,488,392 | ||||
Select International Equity Fund II | 19,281,843 | 42,160,302 | ||||||
Total Return Bond Fund | 685,554,851 | 695,894,720 | ||||||
Global High Income Fund | 388,797,242 | 711,338,948 | ||||||
Semi-Annual Report 2016
65
Notes to Financial Statements (continued)
April 30, 2016 (Unaudited)
6. Investments in Affiliated Issuers
An affiliated issuer, as defined under the Investment Company Act of 1940, as amended includes, an issuer in which a Fund holds 5% or more of the issuer’s outstanding voting securities. A summary of the Funds’ investments in securities of these issuers for the six-month period ended April 30, 2016 is set forth below:
| Affiliate | Shares Held April 30, 2016 | Purchases (Cost) | Sales (Proceeds) | Dividend Income | Fair Value April 30, 2016 | |||||||||||||||
| Select International Equity Fund | ||||||||||||||||||||
Toza Markovic ad Kikinda | 78,160 | $ | – | $ | – | $ | – | $ | – | |||||||||||
| Global High Income Fund | ||||||||||||||||||||
Deep Ocean | 1,427,968 | $ | – | $ | – | $ | – | $ | 4,282,760 | |||||||||||
Amounts listed as “–” are $0 or round to $0.
7. Portfolio Investment Risks
| a. | Active Trading Risk |
A Fund may engage in active and frequent trading of portfolio securities to achieve its investment objective. If a Fund does trade this way, it may incur increased costs, which can lower the actual return of the Fund.
| b. | Asset-Backed Securities Risk |
Like traditional fixed income securities, the value of asset-backed securities typically increases when interest rates fall and decreases when interest rates rise. Certain asset-backed securities may also be subject to the risk of prepayment.
| c. | Bank Loan Risk |
There are a number of risks associated with an investment in bank loans including credit risk, interest rate risk, illiquid securities risk, and prepayment risk. There is also the possibility that the collateral securing a loan, if any, may be difficult to liquidate or be insufficient to cover the amount owed under the loan. These risks could cause a Fund to lose income or principal on a particular investment, which in turn could affect a Fund’s returns.
| d. | Credit Default Swap Risk |
Credit default swap contracts, a type of derivative instrument, involve special risks and may result in losses to the Fund. Credit default swap contracts may in some cases be illiquid, and they increase credit risk since the Fund has exposure to both the issuer of the referenced obligation and the counterparty to the credit default swap contracts. Swaps may be difficult to unwind or terminate. The swap market could be disrupted or limited as a result of recent legislation, and these changes could adversely affect the Fund. Additionally, to the extent the Fund sells credit default swap contracts, the Fund effectively adds economic leverage to its portfolio because, in addition to its total net assets, the Fund is subject to investment exposure on the notional amount of the swap in the event of a default of the referenced debt obligation.
| e. | Credit Risk |
A debt instrument’s price depends, in part, on the credit quality of the issuer, borrower, counterparty, or underlying collateral and can decline in response to changes in the financial condition of the issuer, borrower, counterparty, or underlying collateral, or changes in specific or general market, economic, industry, political, regulatory, geopolitical, or other conditions.
| f. | Delayed Funding Loans and Revolving Credit Facilities Risk |
There are a number of risks associated with an investment in delayed funding loans and revolving credit facilities including credit, interest rate and liquidity risk and the risks of being a lender. There may be circumstances under which the borrowing issuer’s credit risk may be deteriorating and yet a Fund may be obligated to make loans to the borrowing issuer as the borrowing issuer’s credit continues to deteriorate, including at a time when the borrowing issuer’s financial condition makes it unlikely that such amounts will be repaid. Delayed funding loans and revolving credit facilities may be subject to restrictions on transfer, and only limited opportunities may exist to resell such instruments.
| g. | Derivatives Risk (Including Options, Futures and Swaps) |
Derivatives are speculative and may hurt the Fund’s performance. Derivatives present the risk of disproportionately increased losses and/or reduced opportunities for gains when the financial asset or measure to which the derivative is linked changes in unexpected ways. The potential benefits to be derived from the Fund’s derivatives strategy are dependent upon the portfolio managers’ ability to discern pricing
2016 Semi-Annual Report
66
Notes to Financial Statements (continued)
April 30, 2016 (Unaudited)
inefficiencies and predict trends in markets, which decisions could prove to be inaccurate. This requires different skills and techniques than predicting changes in the price of individual securities, and there can be no assurance that the use of this strategy will be successful.
Hedged Exposure Risk – Losses generated by a derivative or practice used by the Fund for hedging purposes should be offset in part by gains on the hedged investment depending on the degree of correlation between the hedging instrument and the assets hedged. However, while hedging can reduce or eliminate losses, it can also reduce or eliminate gains.
Correlation Risk – The Fund is exposed to the risk that changes in the value of a hedging instrument will not match those of the investment being hedged.
Counterparty Risk – Derivative transactions depend on the creditworthiness of the counterparty and the counterparty’s ability to fulfill its contractual obligations.
Speculative Exposure Risk – To the extent that a derivative or practice is not used as a hedge, the Fund is directly exposed to its risks. Gains or losses from speculative positions in a derivative may be much greater than the derivative’s original cost. For example, potential losses from writing uncovered call options and from speculative short sales are unlimited.
| h. | Emerging Markets Risk |
A magnification of the risks that apply to foreign investments. These risks are greater for securities of companies in emerging market countries because the countries may have less stable governments, more volatile currencies and less established markets (see “Foreign Securities Risk” below).
| i. | Foreign Currency Exposure Risk |
The value of foreign currencies relative to the U.S. Dollar fluctuates in response to market, economic, political, regulatory, geopolitical or other conditions. A decline in the value of a foreign currency versus the U.S. Dollar reduces the value in U.S. Dollars of investments denominated in that foreign currency. This risk may impact the Funds more greatly to the extent the Funds do not hedge its currency risk, or hedging techniques used by the Adviser are unsuccessful.
| j. | Foreign Securities Risk |
Foreign securities may be more volatile, harder to price and less liquid than U.S. securities.
| k. | High-Yield Bonds and Other Lower-Rated Securities Risk |
A Fund’s investments in high-yield bonds (commonly referred to as “junk bonds”) and other lower-rated securities will subject the Fund to substantial risk of loss. Investments in high-yield bonds are speculative and issuers of these securities are generally considered to be less financially secure and less able to repay interest and principal than issuers of investment-grade securities. Prices of high-yield bonds tend to be very volatile. These securities are less liquid than investment-grade debt securities and may be difficult to price or sell, particularly in times of negative sentiment toward high-yield securities.
| l. | Illiquid Securities Risk |
Illiquid securities are assets which may not be sold or disposed of in the ordinary course of business within seven days at approximately the price at which the Fund has valued the investment on its books and may include such securities as those not registered under U.S. securities laws or securities that cannot be sold in public transactions. An inability to sell a portfolio position can adversely affect the Fund’s value or prevent the Fund from being able to take advantage of other investment opportunities. Illiquid securities and relatively less liquid securities may also be difficult to value. Over recent years, the capacity of dealers to make markets in fixed income securities has been outpaced by the growth in the size of the fixed income markets. Liquidity risk may be magnified in a rising interest rate environment or when investor redemptions from fixed income funds may be higher than normal, due to the increased supply in the market that would result from selling activity.
The Fund employs proprietary procedures and tests using third-party and internal data inputs that seek to assess and manage the liquidity of its portfolio holdings. The Fund’s procedures and tests take into account relevant market, trading and other factors, and monitor whether liquidity assessments should be adjusted based on changed market conditions. These procedures and tests are designed to assist the Fund in determining its ability to meet redemption requests in various market conditions. In light of the dynamic nature of markets, there can be no assurance that these procedures and tests will enable the Fund to ensure that it has sufficient liquidity to meet redemption requests.
| m. | Impact of Large Redemptions and Purchases of Fund Shares |
Occasionally, shareholders may make large redemptions or purchases of a Fund’s shares, which may cause the Fund to have to sell securities or invest additional cash. These transactions may adversely affect the Fund’s performance and increase transaction costs. In addition, large redemption requests may exceed the cash balance of the Fund and result in credit line borrowing fees or overdraft charges to the Fund until the sale of portfolio securities to cover the redemption request settle.
Semi-Annual Report 2016
67
Notes to Financial Statements (continued)
April 30, 2016 (Unaudited)
| n. | Interest Rate Risk |
A Fund’s fixed income investments are subject to interest rate risk, which generally causes the value of a fixed income portfolio to decrease when interest rates rise resulting in a decrease in the Fund’s net assets. The Fund may be subject to a greater risk of rising interest rates due to the current period of historically low rates and the effect of potential government fiscal policy initiatives and resulting market reaction to those initiatives. Interest rate fluctuations tend to have a greater impact on fixed income-securities with a greater time to maturity and/or lower coupon. In periods of market volatility, the market values of fixed income securities may be more sensitive to changes in interest rates.
| o. | Large-Cap Securities Risk |
Stocks issued by large cap companies subject the Fund to the risk that those stocks may underperform stocks issued by companies with smaller capitalizations or the market as a whole.
| p. | Leverage Risk |
Certain transactions may give rise to a form of leverage. Such transactions may include, among others, loans of securities, and the use of when-issued, delayed delivery or forward commitment transactions. The use of derivatives may also cause leveraging risk.
| q. | Market Risk |
Deteriorating market conditions might cause a general weakness in the market that reduces the prices of securities in that market in which a Fund invests.
| r. | Mid-Cap Securities Risk |
Stocks of mid-cap companies tend to be more volatile and less liquid than larger company stocks of larger companies.
| s. | Mortgage-Related Securities Risk |
A Fund may invest in mortgage-related securities. Rising interest rates may cause an issuer to exercise its right to pay principal later than expected which tends to extend the duration of mortgage-related securities, making them more sensitive to changes in interest rates. As a result, in a period of rising interest rates, a Fund that holds mortgage-related securities may exhibit additional volatility. This is known as extension risk. In addition, mortgage-related securities are subject to prepayment risk. When interest rates decline, borrowers may pay off their mortgages sooner than expected. This can reduce the returns of a Fund because the Fund will have to reinvest that money at the lower prevailing interest rates.
| t. | Municipal Securities Risk |
A Fund may invest in municipal bonds which may be significantly affected by political and economic changes, including inflation, as well as uncertainties in the municipal market related to taxation, legislative changes, or the rights of municipal security holders. Municipal Bonds have varying levels of sensitivity to changes in interest rates. In general, the price of a Municipal Bond can fall when interest rates rise and can rise when interest rates fall. Interest rate risk is generally lower for shorter-term Municipal Bonds and higher for long term Municipal Bonds. Under certain market conditions, the Adviser may purchase Municipal Bonds that the Adviser perceives are undervalued. Undervalued Municipal Bonds are subject to the same market volatility and principal and interest rate risks described above. Lower quality Municipal Bonds involve greater risk of default or price changes due to changes in the credit quality of the issuer. The value of lower quality Municipal Bonds often fluctuates in response to political or economic developments and can decline significantly over short periods of time or during periods of general or regional economic difficulty. In the case of tax-exempt Municipal Bonds, if the Internal Revenue Service or state tax authorities determine that an issuer of a tax-exempt Municipal Bond has not complied with applicable tax requirements, interest from the security could become taxable at the federal, state and/or local level, and the security could decline significantly in value. Municipal Bonds are subject to credit or default risk. Credit risk is the risk that the issuer of a municipal security might not make interest and principal payments on the security as they become due.
| u. | Prepayment Risk |
As interest rates decline, debt issuers may repay or refinance their loans or obligations earlier than anticipated. The issuers of fixed income securities may, therefore, repay principal in advance. This forces a Fund to reinvest the proceeds from the principal prepayments at lower rates, which reduces the Fund’s income.
| v. | Private Placements and Other Restricted Securities Risk |
Investments in private placements and other restricted securities, including Regulation S Securities and Rule 144A Securities, could have the effect of increasing a Fund’s level of illiquidity. Private placements and restricted securities may be less liquid than other investments because such securities may not always be readily sold in broad public markets and a Fund might be unable to dispose of such securities promptly or at prices reflecting their true value.
2016 Semi-Annual Report
68
Notes to Financial Statements (continued)
April 30, 2016 (Unaudited)
| w. | Sector Risk |
To the extent that a Fund has a significant portion of its assets invested in securities of companies conducting business in a broadly related group of industries within an economic sector, the Fund may be more vulnerable to unfavorable developments in that economic sector than funds that invest more broadly.
| x. | Securities Selection Risk |
The investment team may select securities that underperform the stock market or other funds with similar investment objectives and strategies.
| y. | Small-Cap Securities Risk |
Stocks of smaller companies are usually less stable in price and less liquid than those of larger, more established companies. Therefore, they generally involve greater risk.
| z. | Sovereign Debt Risk |
Periods of economic and political uncertainty may result in the illiquidity and increased price volatility of a foreign government’s debt securities held by the Fund and impact an issuer’s ability and willingness to pay interest or repay principal when due. The Fund may have limited recourse to compel payment in the event of a default. A foreign government’s default on its debt securities may cause the value of securities held by the Fund to decline significantly.
Please read the prospectus for more detailed information regarding these and other risks.
8. Contingencies
In the normal course of business, the Funds may provide general indemnifications pursuant to certain contracts and organizational documents. The Funds’ maximum exposure under these arrangements is dependent on future claims that may be made against the Funds, and therefore, cannot be estimated; however, based on experience, the risk of loss from such claims is considered remote.
9. Tax Information
As of April 30, 2016, the tax cost of securities and the breakdown of unrealized appreciation/(depreciation) for each Fund were as follows:
| Tax Cost of Securities | Unrealized Appreciation | Unrealized (Depreciation) | Net Unrealized Appreciation (Depreciation) | |||||||||||||
Select International Equity Fund | $ | 308,275,050 | $ | 10,871,464 | $ | (80,733,344 | ) | $ | (69,861,880 | ) | ||||||
Select International Equity Fund II | 131,993,764 | 5,326,817 | (21,454,012 | ) | (16,127,195 | ) | ||||||||||
Total Return Bond Fund | 963,920,968 | 27,375,271 | (8,242,657 | ) | 19,132,614 | |||||||||||
Global High Income Fund | 898,174,082 | 23,366,453 | (68,029,793 | ) | (44,663,340 | ) | ||||||||||
The tax character of distributions paid during the fiscal year ended October 31, 2015 was as follows (total distributions paid may differ from the Statements of Changes in Net Assets because for tax purposes dividends are recognized when actually paid):
| Distributions paid from | ||||||||||||||||||||||||||||
| Fund | Ordinary Income | Net Long Term Capital Gains | Total Taxable Distributions | Taxable Over- distribution | Tax Exempt Distributions | Return of Capital | Total Distributions Paid | |||||||||||||||||||||
Select International Equity Fund | $ | 19,924,879 | $ | – | $ | 19,924,879 | $ | – | $ | – | $ | – | $ | 19,924,879 | ||||||||||||||
Select International Equity Fund II | 9,538,401 | – | 9,538,401 | – | – | – | 9,538,401 | |||||||||||||||||||||
Total Return Bond Fund | 23,348,183 | 21,607,201 | 44,955,384 | – | – | 1,577,041 | 46,532,425 | |||||||||||||||||||||
Global High Income Fund | 103,149,950 | 46,453,836 | 149,603,786 | – | – | 20,900,961 | 170,504,747 | |||||||||||||||||||||
Amounts listed as “–” are $0 or round to $0.
Semi-Annual Report 2016
69
Notes to Financial Statements (continued)
April 30, 2016 (Unaudited)
As of October 31, 2015, the components of accumulated earnings/(deficit) on a tax basis were as follows:
| Fund | Undistributed Tax Exempt Income | Undistributed Ordinary Income | Undistributed Long-Term Capital Gains | Accumulated Earnings | Distributions Payable | Late Year Ordinary and Post- October Capital Loss Deferrals | Other Temporary Differences | Unrealized Appreciation/ (Depreciation)* | Accumulated Capital and Other Losses** | Total Accumulated Earnings (Deficit) | ||||||||||||||||||||||||||||||
Select International Equity Fund | $ | – | $ | 7,467,582 | $ | – | $ | – | $ | – | $ | – | $ | 500,761 | $ | (96,868,717 | ) | $ | (2,310,289,742 | ) | $ | (2,399,190,116 | ) | |||||||||||||||||
Select International Equity Fund II | – | 3,882,372 | – | – | – | – | 50,871 | (29,289,596 | ) | (2,717,809,385 | ) | (2,743,165,738 | ) | |||||||||||||||||||||||||||
Total Return Bond Fund | – | – | – | – | – | – | (1,350,902 | ) | 2,358,830 | – | 1,007,928 | |||||||||||||||||||||||||||||
Global High Income Fund | – | – | – | – | – | – | (6,903,383 | ) | (102,543,582 | ) | (83,833,509 | ) | (193,280,474 | ) | ||||||||||||||||||||||||||
| * | The difference between the book-basis and tax-basis unrealized appreciation/(depreciation) is attributable primarily to tax deferral of losses on wash sales. |
| ** | As of October 31, 2015, for Federal income tax purposes, the following Funds have capital loss carryforwards available to offset capital gains, if any, to the extent provided by the Treasury regulations, which expire in the years set forth below. |
Amounts listed as “–” are $0 or round to $0.
| Fund | Amount | Expires | ||||||
Select International Equity Fund | $ | 314,780,611 | 2016 (Short-Term) | |||||
Select International Equity Fund | 1,643,693,179 | 2017 (Short-Term) | ||||||
Select International Equity Fund | 18,624,351 | Unlimited (Short-Term) | ||||||
Select International Equity Fund | 333,191,601 | Unlimited (Long-Term) | ||||||
Select International Equity Fund II | 1,379,336,238 | 2016 (Short-Term) | ||||||
Select International Equity Fund II | 1,211,390,775 | 2017 (Short-Term) | ||||||
Select International Equity Fund II | 121,152,924 | 2018 (Short-Term) | ||||||
Select International Equity Fund II | 1,419,889 | Unlimited (Short-Term) | ||||||
Select International Equity Fund II | 4,509,559 | Unlimited (Long-Term) | ||||||
Global High Income Fund | 23,104,660 | Unlimited (Short-Term) | ||||||
Global High Income Fund | 60,728,849 | Unlimited (Long-Term) | ||||||
Under the Regulated Investment Company Modernization Act of 2010, the Funds are permitted to carry forward capital losses incurred in taxable years beginning after December 22, 2010 for an unlimited period. However, any losses incurred during those taxable years will be required to be utilized prior to the losses incurred in pre-enactment taxable years. As a result of this ordering rule, pre-enactment capital loss carryforwards may be more likely to expire unused. Additionally, post-enactment capital losses that are carried forward will retain their character as either short-term or long-term capital losses rather than being considered all short-term as under previous law.
10. Significant Shareholders
As of April 30, 2016, the following Funds had shareholders with the percentage ownership indicated, which are considered significant shareholders (holdings greater than 5.0%) for financial reporting purposes:
| Fund | Record Ownership % | Number of Account Owners | ||||
Select International Equity Fund | 64.1 | % | 2 | |||
Select International Equity Fund II | 57.3 | 3 | ||||
Total Return Bond Fund | 69.8 | 2 | ||||
Global High Income Fund | 67.8 | 5 | ||||
2016 Semi-Annual Report
70
Notes to Financial Statements (concluded)
April 30, 2016 (Unaudited)
11. Line of Credit
Aberdeen Investment Funds (the “Borrowers”) entered into a Credit Agreement (the “Agreement”) with State Street Bank and Trust Company (the “Bank”). The Agreement provides for a revolving credit facility (the “Credit Facility”) to be utilized for temporary or emergency purposes to fund shareholder redemptions or for other short-term liquidity purposes. The amount of the Credit Facility was $100,000,000 for the six-month period ended April 30, 2016. The Funds may draw up to their stated sublimit (subject to certain other limitations therein):
| Sublimit Amount | Average Outstanding Daily Balance | Average Weighted Interest Rate | Days Utilized | |||||||||||||
Select International Equity | $ | 100,000,000.00 | $ | 1,228,700 | 1.49 | % | 5 | |||||||||
Select International Equity II | $ | 100,000,000.00 | $ | 584,551 | 1.63 | % | 7 | |||||||||
Total Return Bond Fund | $ | 100,000,000.00 | – | – | – | |||||||||||
Amounts listed as “–” are $0 or round to $0.
In addition, the Global High Income Fund entered into a separate Credit Agreement (the “Global High Income Fund Credit Agreement”) with the Bank. The Global High Income Fund Credit Agreement provides for a revolving credit facility (the “Global High Income Fund Credit Facility”) to be utilized for temporary or emergency purposes to fund shareholder redemptions or for other short-term liquidity purposes. The amount of the Global High Income Fund Credit Facility was $150,000,000 for the six-month period ended April 30, 2016. The Global High Income Fund may draw the entire $150,000,000 (subject to certain limitations).
| Sublimit Amount | Average Outstanding Daily Balance | Average Weighted Interest Rate | Days Utilized | |||||||||||||
Global High Income Fund | $ | 150,000,000 | – | – | – | |||||||||||
Amounts listed as “–” are $0 or round to $0.
Principal on each outstanding loan made under the Agreement and the Global High Income Fund Credit Agreement shall bear the interest at a variable rate per annum equal to the higher of (a) the Federal Funds Rate as in effect on that day plus 1.25% and (b) the Overnight London Interbank Offered Rate (“LIBOR”) as in effect on that day plus 1.25%. In addition, the Borrowers shall pay to the Bank a commitment fee at the rate of 0.18% per annum on the daily unused portion of each of the Credit Facility or Global High Income Fund Credit Facility, as applicable, which is allocated among the Borrowers in such manner as is determined by the Board to be reasonable.
12. Subsequent Events
Management has evaluated the need for disclosures and/or adjustments resulting from subsequent events through the date the financial statements were issued. Based on this evaluation, no disclosures and/or adjustments other than those described above were required to the financial statements as of April 30, 2016.
Semi-Annual Report 2016
71
Shareholder Expense Examples (Unaudited)
As a shareholder of the Aberdeen Investment Funds you incur ongoing costs, including investment advisory fees, shareholder service fees, distribution fees and other Fund expenses. The examples below are intended to help you understand your ongoing costs (in dollars) of investing in the Funds and to compare these costs with the ongoing costs of investing in other mutual funds.
The examples assume that you had a $1,000 investment in the Class at the beginning of the reporting period, November 1, 2015 and continued to hold your shares at the end of the reporting period, April 30, 2016.
Actual Expenses
The table below provides information about actual account values and actual expenses. You may use the information together with the amount you invested, to estimate the expenses that you paid over the period. Simply divide your account value by $1,000 (for example, an $8,600 account value divided by $1,000 = 8.6), then multiply the result by the number under the heading entitled “Actual Expenses Paid During Period” for the class of a Fund that you own to estimate the expenses you paid on your account during the period.
Hypothetical Example for Comparison Purposes
The table below provides information about hypothetical account values and hypothetical expenses based on the Class’ actual expense ratio and an assumed rate of return of 5% per year before expenses, which is not the Class’ actual return. The hypothetical account values and expenses may not be used to estimate the actual ending account balance or expenses you paid for the period. You may use this information to compare the ongoing costs of investing in the Class of a Fund and other funds. To do so, compare the 5% hypothetical example with the 5% hypothetical examples that appear in the shareholder reports of the other funds.
| Beginning Account Value, November 1, 2015 | Actual Ending Account Value, April 30, 2016 | Hypothetical Ending Account Value | Actual Expenses Paid During Period* | Hypothetical Expenses Paid During Period*1 | Annualized Expense Ratio** | |||||||||||||||||||
Select International Equity Fund | Class A | $1,000.00 | $ | 980.80 | $ | 1,018.00 | $ | 6.80 | $ | 6.92 | 1.38% | |||||||||||||
Institutional Class | $1,000.00 | $ | 982.40 | $ | 1,019.24 | $ | 5.57 | $ | 5.67 | 1.13% | ||||||||||||||
Select International Equity Fund II | Class A | $1,000.00 | $ | 973.60 | $ | 1,017.50 | $ | 7.26 | $ | 7.42 | 1.48% | |||||||||||||
Institutional Class | $1,000.00 | $ | 975.60 | $ | 1,018.70 | $ | 6.09 | $ | 6.22 | 1.24% | ||||||||||||||
Total Return Bond | Class A | $1,000.00 | $ | 1,028.30 | $ | 1,021.43 | $ | 3.48 | $ | 3.47 | 0.69% | |||||||||||||
Institutional Class | $1,000.00 | $ | 1,030.10 | $ | 1,022.68 | $ | 2.22 | $ | 2.21 | 0.44% | ||||||||||||||
Global High Income Fund | Class A | $1,000.00 | $ | 972.30 | $ | 1,019.89 | $ | 4.90 | $ | 5.02 | 1.00% | |||||||||||||
Institutional Class | $1,000.00 | $ | 973.30 | $ | 1,021.13 | $ | 3.68 | $ | 3.77 | 0.75% | ||||||||||||||
| * | Expenses are equal to the Fund’s annualized expense ratio multiplied by the average account value over the period multiplied by 182/366 (to reflect the one-half year period |
| ** | The expense ratio presented represents a six-month, annualized ratio. |
| 1 | Represents the hypothetical 5% return before expenses. |
2016 Semi-Annual Report
72
FACTS | WHAT DO ABERDEEN FUNDS DO WITH YOUR PERSONAL INFORMATION? |  | ||||||
Why? | Financial companies choose how they share your personal information. Federal law gives consumers the right to limit some but not all sharing. Federal law also requires us to tell you how we collect, share, and protect your personal information. Please read this notice carefully to understand what we do. | |||||||
What? | The types of personal information we collect and share depend on the product or service you have with us. This information can include:
· Social Security number and account balances
· Transaction history and assets
· Checking account information and wire transfer instructions |
| ||||||
How? | All financial companies need to share customers’ personal information to run their everyday business. In the section below, we list the reasons financial companies can share their customers’ personal information; the reasons Aberdeen Funds choose to share; and whether you can limit this sharing. | |||||||
Reasons we can share your personal information | Do Aberdeen Funds share? | | Can you limit this sharing? | | ||||
For our everyday business purposes— such as to process your transactions, maintain your account(s), respond to court orders and legal investigations, or report to credit bureaus | Yes | No | ||||||
For our marketing purposes— to offer our products and services to you | Yes | Yes | ||||||
For joint marketing with other financial companies | No | We don’t share | ||||||
For our affiliates’ everyday business purposes— information about your transactions and experiences | Yes | No | ||||||
For our affiliates’ everyday business purposes— information about your creditworthiness | No | We don’t share | ||||||
For our affiliates to market to you | No | We don’t share | ||||||
For nonaffiliates to market to you | No | We don’t share | ||||||
To limit our sharing | · Call 1-800-522-5465
Please note:
If you are a new customer, we can begin sharing your information 30 days from the date we sent this notice. When you are no longer our customer, we continue to share your information as described in this notice.
However, you can contact us at any time to limit our sharing. |
| ||||||
Questions? | www.aberdeen-asset.us | |||||||
| Page 2 |  |
Who we are | ||
Who is providing this notice? | Aberdeen’s North American Funds (collectively referred to as “Aberdeen Funds”) | |
What we do | ||
| How do Aberdeen Investment Funds protect my personal information? | To protect your personal information from unauthorized access and use, we use security measures that comply with federal law. These measures include computer safeguards and secured files and buildings. | |
| How do Aberdeen Investment Funds collect my personal information? | We collect your personal information, for example, when you:
· Open an account or give us your contact information
· Provide account information or make wire transfers
· Make deposits or withdrawals from your account | |
Why can’t I limit all sharing? | Federal law gives you the right to limit only:
· Sharing for affiliates’ everyday business purposes—information about your creditworthiness
· Affiliates from using your information to market to you
· Sharing for nonaffiliates to market to you
State laws and individual companies may give you additional rights to limit sharing. | |
What happens when I limit sharing for an account I hold jointly with someone else? | Your choices will apply to everyone on your account. | |
Definitions | ||
Affiliates | Companies related by common ownership or control. They can be financial and nonfinancial companies.
· Our affiliates include companies with an Aberdeen Asset Management name and wholly-owned subsidiaries of Aberdeen Asset Management PLC, a global financial services company. | |
Nonaffiliates | Companies not related by common ownership or control. They can be financial and nonfinancial companies.
· Aberdeen Funds do not share personal information with nonaffiliates so they can market to you. | |
Joint marketing | A formal agreement between nonaffiliated financial companies that together market financial products or services to you.
· Aberdeen Funds don’t jointly market. | |
Other important information | ||
| This Privacy Notice is being provided by Aberdeen Funds and Aberdeen Investment Funds, each a U.S.-registered open-end investment company, and North-American-registered closed-end investment companies managed by Aberdeen Asset Management Inc. or its affiliates (collectively, North American Funds). | ||
Management Information
Trustees
Antoine Bernheim, Chairman
Thomas Gibbons
Cynthia Hostetler
Robert S. Matthews
Andrew Smith
Peter Wolfram
Officers
Bev Hendry, President and Chief Executive Officer
Jeffrey Cotton, Chief Compliance Officer, Vice President
and Anti-Money Laundering and Identity Theft Officer
Andrea Melia, Treasurer and Chief Financial Officer
Brian Link, Secretary
Megan Kennedy, Assistant Secretary and Vice President
Lucia Sitar, Chief Legal Officer and Vice President
Alan Goodson, Vice President
Stephen Docherty, Vice President
Greg Hopper, Vice President
Jennifer Nichols, Vice President
Donald Quigley, Vice President
Andrew Smith, Vice President
Hugh Young, Vice President
Brian O’Neill, Assistant Treasurer
Eric Olsen, Assistant Treasurer
Investment Adviser
Aberdeen Asset Management Inc.
1735 Market Street, 32nd Floor
Philadelphia, PA 19103
Transfer Agent
Boston Financial Data Services, Inc.
30 Dan Road
Canton, MA 02021
Distributor
Aberdeen Fund Distributors LLC
1735 Market Street, 32nd Floor
Philadelphia, PA 19103
Fund Administrator, Custodian & Fund Accountant
State Street Bank and Trust Company
1 Iron Street 5th Floor
Boston, MA 02210
Independent Registered Public Accounting Firm
KPMG LLP
1601 Market Street
Philadelphia, PA 19103
Fund Counsel
Morrison & Foerster LLP
250 West 55th Street
New York, NY 10019-9601
Aberdeen Asset Management Inc. 1735 Market Street, 32nd Floor Philadelphia, PA 19103 aberdeen-asset.us | |
AOE-0377-SAR
Item 2. Code of Ethics.
Not applicable – for annual reports only.
Item 3. Audit Committee Financial Expert.
Not applicable – for annual reports only.
Item 4. Principal Accountant Fees and Services.
Not applicable – for annual reports only.
Item 5. Audit Committee of Listed Registrants.
Not applicable – for annual reports only.
Item 6. Schedule of Investments
| (a) | Schedule of Investments in securities of unaffiliated issuers as of close of the reporting period is included as part of the Reports to Shareholders filed under Item 1 of this Form N-CSR. |
| (b) | Not applicable. |
Item 7. Disclosure of Proxy Voting Policies and Procedures for Closed-End Management Investment Companies.
Not applicable.
Item 8. Portfolio Managers of Closed-end Management Investment Companies.
Not applicable.
Item 9. Purchases of Equity Securities by Closed-End Management Investment Company and Affiliated Purchasers.
Not applicable.
Item 10. Submission of Matters to a Vote of Security Holders.
During the period ended April 30, 2016, there were no material changes to the procedures by which shareholders may recommend nominees to the registrant’s Board of Trustees.
Item 11. Controls and Procedures.
(a) The Registrant’s principal executive and principal financial officers, or persons performing similar functions, have concluded that the Registrant’s disclosure controls and procedures (as defined in Rule 30a-3(c) under the Investment Company Act of 1940 (the “Act”) (17 CFR 270.30a-3(c))) are effective, as of a date within 90 days of the filing date of the report that includes the disclosure required by this paragraph, based on the evaluation of these controls and procedures required by Rule 30a-3(b) under the Act (17 CFR 270.30a3(b)) and Rule 13a-15(b) or 15d-15(b) under the Securities Exchange Act of 1934 (17 CFR 240.13a-15(b) or 240.15d15(b)).
(b) There were no changes in the Registrant’s internal control over financial reporting (as defined in Rule 30a-3(d) under the Act (17 CFR 270.30a-3(d)) that occurred during the second fiscal quarter of the period covered by this report that has materially affected, or is reasonably likely to materially affect, the Registrant’s internal control over financial reporting.
Item 12. Exhibits.
(a)(1) Not applicable.
(a)(2) Certifications pursuant to Rule 30a-2(a) under the Act and Section 302 of the Sarbanes-Oxley Act of 2002 are attached hereto.
(a)(3) Not applicable.
(b) Certifications pursuant to Rule 30a-2(b) under the Act and Section 906 of the Sarbanes-Oxley Act of 2002 are attached hereto.
SIGNATURES
Pursuant to the requirements of the Securities Exchange Act of 1934 and the Investment Company Act of 1940, as amended, the registrant has duly caused this report to be signed on its behalf by the undersigned, thereunto duly authorized.
Aberdeen Investment Funds | ||
| By: | /s/ Bev Hendry | |
| Bev Hendry | ||
| Principal Executive Officer of | ||
| Aberdeen Investment Funds | ||
Date: July 7, 2016
Pursuant to the requirements of the Securities Exchange Act of 1934 and the Investment Company Act of 1940, as amended, this report has been signed below by the following persons on behalf of the registrant and in the capacities and on the dates indicated.
| By: | /s/ Bev Hendry | |
| Bev Hendry | ||
| Principal Executive Officer of | ||
| Aberdeen Investment Funds | ||
Date: July 7, 2016
| By: | /s/ Andrea Melia | |
| Andrea Melia | ||
| Principal Financial Officer of | ||
| Aberdeen Investment Funds | ||
Date: July 7, 2016