Table of Contents
UNITED STATES
SECURITIES AND EXCHANGE COMMISSION
Washington, D.C. 20549
FORM N-CSR
CERTIFIED SHAREHOLDER REPORT OF REGISTERED
MANAGEMENT INVESTMENT COMPANIES
| Investment Company Act file number: | 811-06652 | |||
| Exact name of registrant as specified in charter: | Aberdeen Investment Funds | |||
| Address of principal executive offices: | 1735 Market Street, 32nd Floor Philadelphia, PA 19103 | |||
| Name and address of agent for service: | Ms. Andrea Melia Aberdeen Asset Management Inc. 1735 Market Street, 32nd Floor Philadelphia, PA 19103 | |||
| Registrant’s telephone number, including area code: | 877-332-7806 | |||
| Date of fiscal year end: | October 31 | |||
| Date of reporting period: | April 30, 2014 | |||
Table of Contents
Item 1. Reports to Shareholders.
Table of Contents

Aberdeen Investment Funds
Aberdeen Global Select Opportunities Fund Inc.
Semi-Annual Report
April 30, 2014
Aberdeen Global Select Opportunities Fund Inc.
Aberdeen Select International Equity Fund
Aberdeen Select International Equity Fund II
Aberdeen Total Return Bond Fund
Aberdeen Global High Income Fund

Table of Contents
| Page 1 | ||||
| Page 2 | ||||
| Page 3 | ||||
| Page 8 | ||||
| Page 13 | ||||
| Page 19 | ||||
| Page 31 | ||||
| Page 42 | ||||
| Page 60 | ||||
| Page 80 | ||||
Investors should carefully consider a fund’s investment objectives, risks, fees, and expenses before investing any money. To obtain this and other fund information, please call 1-800-387-6977 to request a prospectus, or download a prospectus at www.aberdeen-asset.us. Please read it carefully before investing any money.
Investing in mutual funds involves risk, including possible loss of principal.
Aberdeen Select International Equity Fund, Aberdeen Select International Equity Fund II, Aberdeen Total Return Bond Fund, and Aberdeen Global High Income Fund, (collectively the “Aberdeen Investment Funds”) and Aberdeen Global Select Opportunities Fund Inc. (with the Aberdeen Investment Funds the “Funds”) are distributed by Aberdeen Fund Distributors, LLC, Member FINRA, 1735 Market Street, 32nd Floor, Philadelphia, PA 19103.
Aberdeen Asset Management Inc. (AAMI) has been registered as an investment adviser under the Investment Advisers Act of 1940 since August 23,1995.
Statement Regarding Availability of Quarterly Portfolio Schedule.
Aberdeen Investment Funds and Aberdeen Global Select Opportunities Fund Inc. file complete schedules of portfolio holdings for each Fund with the Securities and Exchange Commission (the “SEC”) for the first and third quarters of each fiscal year on Form N-Q. The Funds’ Forms N-Q are available on the SEC’s website at http://www.sec.gov. The Funds’ Forms N-Q may be reviewed and copied at the SEC’s Public Reference Room in Washington, DC, and information on the operation of the Public Reference Room may be obtained by calling 800-SEC-0330. The Funds make their most recent Forms N-Q available to shareholders on www.aberdeen-asset.us or upon request without charge.
Statement Regarding Availability of Proxy Voting Record.
Information regarding the policies and procedures that the Funds use to determine how to vote proxies relating to portfolio securities is available without charge, upon request, by calling 1-800-387-6977. The information is also included in the Funds’ Statement of Additional Information, which is available on the Funds’ website at www.aberdeen-asset.us and on the SEC’s website at www.sec.gov.
Information relating to how each Fund voted proxies relating to portfolio securities held during the most recent twelve months ended June 30 is available by August 30 of the relevant year: (i) upon request and without charge by calling 1-800-387-6977; and (ii) on the SEC’s website at www.sec.gov.
Table of Contents
April 30, 2014
Dear Valued Shareholder,
Welcome to the Aberdeen Investment Funds and Aberdeen Global Select Opportunities Fund Inc. Semi-Annual Report covering the activities for the six-month period ended April 30, 2014.
Market overview
During the reporting period, global securities markets experienced volatility as the performance of equities in developed markets and emerging markets (EM) diverged significantly. Developed market equity market performance was underpinned by improving sentiment on the back of the European Central Bank’s (ECB) interest rate cut and continued strong performance in U.S. equities. The U.S. broader-market S&P 500® Index and the MSCI World Index continued to post sizeable gains. Conversely, the sell-off in EM slowed as investors turned back to opportunities in the asset class, although risk aversion remains. Within the fixed income universe, both investment-grade and high yield bond markets gained ground during the period, while local currency debt in the emerging markets declined and was the primary global market laggard for the period.
Markets braced in the spring of 2014 as the world headed to the polls in mid-term and general elections – more than 40% of the world’s population is eligible to vote in elections in 2014. Notable was India’s general election, which saw 550 million citizens hit the polls in the largest election in world history. In the U.S., voters have been hitting the polls in primaries for mid-term elections as Republican-backed political action committees spend record amounts on congressional elections in an effort to divert support from reactionary Tea Party candidates. In Europe, tensions over Russian President Vladimir Putin’s aggressive annexation of the Crimean Peninsula in Ukraine added to uncertainty over European and EM equities. Likewise, implications for Asian markets after the military coup d’état in Thailand have yet to become entirely clear.
Anne Richards, Aberdeen Asset Management PLC’s (Aberdeen) Chief Investment Officer, provides you with a detailed insight on the investment marketplace in the Market Review on the following page.
Aberdeen developments
As of April 1, 2014, Aberdeen completed the acquisition of Scottish Widows Investment Partnership (SWIP) from Lloyds Banking Group in the UK. The addition of SWIP’s approximately $230 billion of assets under management resulted in Aberdeen becoming the leading European independent asset management business, with $541 billion under management(1). The acquisition combines Aberdeen and SWIP’s strengths across fixed income, real estate, active and quantitative equities, investment solutions and alternatives. The acquisition of SWIP will not directly impact any funds in the Aberdeen Investment Funds and Aberdeen Global Select Opportunities Fund Inc. family but will significantly add to Aberdeen’s global capabilities.
Aberdeen received several industry awards during the period, including six Financial Communications Society (FCS) Portfolio Awards in the Business to Business, Corporate and Consumer categories for Aberdeen’s marketing initiatives in the U.S.
Since the six months ended April 30, 2014, Aberdeen launched two Brazil-domiciled funds establishing our new fund family “Aberdeen Brasil,” alongside Aberdeen Funds, Aberdeen Investment Funds, Aberdeen Global Select Opportunities Fund Inc., and the range of Aberdeen closed-end funds in the U.S. The funds are the Aberdeen Brasil Equity Fund(2) and Aberdeen Strategic Brasil Multimarket Fund(2) and they target both retail and institutional clients. Business Development efforts for the funds are being led by Aberdeen’s newly established Brazilian Business development team in São Paulo.
Thank you for choosing Aberdeen Investment Funds and Aberdeen Global Select Opportunities Fund Inc. We value your investment with us.
Kind Regards,

Gary Marshall
President
Aberdeen Investment Funds
Aberdeen Global Select Opportunities Fund Inc.
| (1) | Credit Suisse Asset Management Weekly Review (March 21, 2014). |
| (2) | Not available for sale in the U.S. |
2014 Semi-Annual Report
1
Table of Contents
There was a notable divergence in performance among major global equity markets during the six-month period ended April 30, 2014. Developed market indices generally moved higher over the period, significantly outperforming their emerging markets counterparts. The U.S. broader-market S&P 500® Index and the MSCI All Country World ex-U.S. Index gained 8.4% and 3.1%, respectively, versus the -2.9% return of the MSCI Emerging Markets Index over the semiannual period. Sentiment in the developed markets was lifted by the European Central Bank’s (ECB) unexpected benchmark interest rate cut by 25 basis points to 0.25%, as well as generally improving economic data. The middle of the period saw increased risk-aversion, fueled by renewed turmoil in emerging economies, mixed U.S. and Chinese economic data, and the start of the U.S. Federal Reserve’s (Fed) tapering of its asset purchase program in January 2014. In particular, emerging markets currencies suffered a sharp sell-off. However, investor confidence appeared to strengthen after the ECB signaled that it was open to further monetary policy easing.
The strength in the U.S. equity market was attributable mainly to generally positive corporate earnings reports and steady but moderate overall improvement in economic data for much of the reporting period. This offset some uncertainty late in the period resulting from Russia’s expansion of its military presence in the Crimea region of Ukraine. Shortly after the end of the reporting period in late May, the estimate of first-quarter U.S. gross domestic product (GDP) was adjusted downward to a 1.0% decrease–a sharp drop from the 2.6% expansion in the fourth quarter of 2013–as a decline in private inventory investment outpaced the increase in consumer spending. The harsh winter weather in much of the country contributed to the contraction in GDP.
European and UK equities also posted gains during the reporting period, but underperformed relative to U.S. stocks. Initial concerns over the Fed’s tapering of quantitative easing gave way to hope that economic recovery in the U.S. appeared more sustainable. Markets were subsequently hampered by worries of an economic hard landing in China and the growing crisis in Ukraine. Towards the end of the period, market sentiment recovered somewhat on increased merger-and-acquisition activity and the ECB’s pledge to use unconventional measures to avert potential deflation. On the economic front, the Eurozone’s recovery was lackluster amid still-elevated unemployment, but the UK economy continued to gain momentum with GDP growth of 3.1% reported for the first quarter of 2014—the quickest pace of activity since 2008. Japan was the main overall global stock market laggard for the reporting period, a reversal of its strong performance for the 2013 calendar year. The Japanese market was weighed down primarily by concerns over the impact of the consumption tax hike on domestic demand, as well as sluggish fourth-quarter 2013 GDP growth.
The global emerging stock markets declined over the reporting period, encountering several stretches of volatility. Ongoing anxiety about the impact of the Fed’s tapering, along with resurgent fears of a substantial economic slowdown in China, initially drove stock prices lower, but markets later rebounded as these concerns eased. Nonetheless, the upturn did not mitigate the earlier losses. Central and Eastern Europe were the primary overall market laggards, dragged down by heightened political tension over Russia’s intervention in Ukraine and its subsequent annexation of Crimea. Among emerging Asian markets, China and Thailand lagged their peers. Chinese equities were weak as soft economic data and worries over bank runs and looming bankruptcies of real estate firms dampened on investor sentiment.
Within the global fixed income universe, high yield securities outperformed investment-grade bonds for the semiannual period, with the Bank of America Merrill Lynch (BofA ML) Global High Yield Constrained Index gaining 5.1% versus the 2.1% return of the Barclays Global Aggregate Bond Index. All sectors within the BofA ML U.S. High Yield Master II Index recorded positive returns for the reporting period, led by banking and insurance. Developed market high yield sectors outside the U.S., including those in Europe/UK and Canada, as measured by the BofA ML European Issuers Constrained Index and the BofA ML Canada High Yield Index, respectively, also recorded positive returns over the reporting period. Within the global investment-grade fixed income universe, developed market government bonds broadly sold off in November and December 2013 in response to stronger U.S. economic data, a bipartisan budget deal in the U.S. Congress to avert another government shutdown, and the Fed’s surprise decision to begin tapering. The first quarter of 2014, however, marked a reversal in trend as core government bonds strengthened due to concerns over the tightening of global liquidity, weaker U.S. economic data, and fears of the conflict in Ukraine.
Outlook
In our opinion, “rotation” may be an accurate one-word description of the current global investment environment. Over the first several months of 2014, investors rotated away from developed markets and into emerging markets, and switched out of the big gainers from 2013 and into the current market laggards. Bond markets have regained some of last year’s losses at the expense of equities. The pursuit of growth has been replaced by the search for value and quality income. Similar trends can be seen at a sector level within equity markets. Last year’s highly sought-after biotechnology and smaller companies eventually hit valuations that prompted investors to switch into other less fashionable and less expensive sectors. Overall, we believe recent trends are a healthy response to pockets of overvaluation where prices became disconnected from the fundamental outlook. We think that the nature of expanding equity valuations that are not supported by earnings growth is unsustainable. Many of the trends we are seeing come back to the unusual monetary conditions we have lived through since the financial crisis of 2008. Ultra-low interest rates in the U.S., UK and Europe, along with the use of quantitative easing, have led to distortions in asset prices and investment behavior, in our view. Withdrawing such massive stimuli and returning to more normal monetary conditions is proving a slow, grinding process. Given that background, we believe that equity and bond markets could churn around at these levels in the near term, especially given the ongoing uncertainty over the political situation in Ukraine.
Anne Richards
Chief Investment Officer
Aberdeen Asset Management PLC
Semi-Annual Report 2014
2
Table of Contents
Aberdeen Global Select Opportunities Fund Inc. (Unaudited)
The Aberdeen Global Select Opportunities Fund Inc. (Class A shares at net asset value (NAV) net of fees) returned 5.24% for the six-month period ended April 30, 2014, versus the 5.28% return of its primary benchmark, the MSCI All Country World Index, during the same period. The MSCI World Index, the Fund’s secondary benchmark, returned 6.61% for the six-month period ended April 30, 2014. For broader comparison, the average return of the Fund’s Lipper peer category of Global Large-Cap Growth Funds (consisting of 103 funds) was 4.44% for the period.
Global equities, as measured by the MSCI World Index, rose during the reporting period, with developed markets generally outperforming their emerging market peers, as represented by the MSCI Emerging Markets Index. Market sentiment was lifted by the European Central Bank’s (ECB) unexpected benchmark interest rate cut by 25 basis points to 0.25%, as well as improved economic data. The middle of the period saw increased risk aversion, fueled by renewed turmoil in emerging economies, mixed U.S. and Chinese data, and the start of the U.S. Federal Reserve’s (Fed) continued tapering of its asset purchase program. In particular, emerging markets currencies suffered a sharp sell-off. The commitment by Fed Chairperson Janet Yellen to maintain loose monetary policy reassured investors to an extent, though that gave way to fears that the Fed may hike interest rates earlier than expected. However, confidence strengthened after the ECB signalled that it was open to further monetary policy easing. Overall, Japan was the main global market laggard, a contrast to its stellar performance in 2013. The Japanese stock market was largely weighed down by concerns over the impact of the consumption tax hike on domestic demand. The nation’s lackluster fourth-quarter 2013 gross domestic product (GDP) growth of 0.3% gave rise to growth fears as well. Investors were also disappointed that the central bank kept its monetary policy stance unchanged and refrained from increasing economic stimulus.
The Fund’s holding in Royal Dutch Shell was among the main contributors to Fund performance for the reporting period. The energy group posted solid first-quarter 2014 results, boosted by its gas division, while shareholders were rewarded with a higher dividend. Additionally, investors were relieved when the energy group cancelled its plan to build a plant in the U.S., which was seen as capital-intensive and risky. Retail drugstore operator and pharmacy benefit manager (PBM) CVS Caremark’s shares rallied after the company boosted its dividend and approved a share buyback for as much as $6 billion. Separately, CVS secured several new contracts for its PBM business, while its purchase of drug-infusion company Coram was generally viewed by investors as a positive for its competiveness. Enterprise software company Oracle Corp. released consistently healthy results during the reporting period, bolstered by good growth in software licenses and engineered systems, while business was robust in North America and Europe, the Middle East and Africa (EMEA) region.
The top detractors from Fund performance for the reporting period included Brazilian miner Vale, which was hurt by lower iron ore prices, while shares of QBE Insurance fell after the company forecast a net loss of US$250 million for calendar year 2013. This followed a strategic review of its North American operations, which resulted in additional provisions for claims, restructuring charges and a goodwill write-down, which totalled US$1.93 billion. The stock later recouped earlier losses after the company’s first-quarter 2014 results presented no surprises. Lender Standard Chartered’s full-year 2013 profits fell for the first time in over a decade on the back of a write-down in its South Korean business, slowing growth in emerging markets and rising bad loans. Reassuringly, in our opinion, the bank’s capital adequacy ratio remains robust, allaying for now market worries over its capital position. Over the long term, we believe that its prospects in emerging markets remain bright.
During the reporting period, we exited the position in Verizon Communications, which the Fund received from the return of cash and shares from Vodafone after it sold its stake in the Verizon Wireless joint venture.
As we move into the second quarter of 2014, we feel that little has changed at the corporate level. In our opinion, the absence of revenue growth, a lack of internal investment and signs that productivity gains are rolling over raises the question of the sustainability of above-average operating margins. While uncertainty remains, we are focused on managing capital conservatively by investing in what we believe are well-managed businesses at attractive valuations.
Portfolio Management:
Aberdeen Global Equity Team
PAST PERFORMANCE DOES NOT GUARANTEE FUTURE RESULTS.
The performance quoted represents past performance, which does not guarantee future results. Class A shares have up to a 0.25% 12b-1 fee. The investment return and principal value of an investment will fluctuate so that an investor’s shares, when redeemed, may be worth more or less than their original cost. Current performance of the Fund may be lower or higher than the performance quoted. Performance data current to the most recent month-end may be obtained by calling 800-387-6977 or visiting www.aberdeen-asset.us.
Total returns assume the reinvestment of all distributions. Investment performance reflects fee waivers and, in the absence of such waivers, returns would have been lower. Indexes are unmanaged and have been provided for comparison purposes only. No fees or expenses are reflected. You cannot invest directly in an index.
Lipper is a leading global provider of mutual fund information and analysis to fund companies, financial intermediaries and media organizations.
Risk Considerations
Investing in mutual funds involves risk, including the possible loss of principal. There is no assurance that the investment objective of any fund will be achieved.
Foreign securities are more volatile, harder to price and less liquid than U.S. securities. They are subject to different accounting and regulatory standards, and political and economic risks. These risks are enhanced in emerging markets countries.
Equity stocks of small and mid-cap companies carry greater risk, and more volatility than equity stocks of larger, more established companies.
Please read the prospectus for more detailed information regarding these and other risks.
2014 Semi-Annual Report
3
Table of Contents
Aberdeen Global Select Opportunities Fund Inc. (Unaudited)
Average Annual Total Return (For periods ended April 30, 2014) | Six Month† | 1 Yr. | 5 Yr. | Inception | ||||||||||
Class A1 | 5.24% | 11.31% | 10.86% | 5.62% | ||||||||||
Institutional Class2,3 | 5.35% | 11.53% | 11.11% | 4.25% | ||||||||||
| † | Not Annualized |
| 1 | Class commenced operations on July 01, 2004. |
| 2 | Class commenced operations on March 14, 2005. |
| 3 | Formerly Class I. |
Semi-Annual Report 2014
4
Table of Contents
Aberdeen Global Select Opportunities Fund Inc. (Unaudited)
Performance of a $10,000 Investment (as of April 30, 2014)
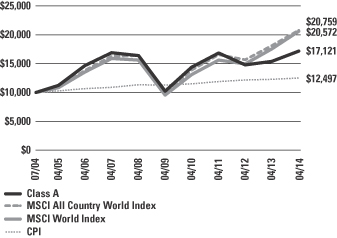
Comparative performance of $10,000 invested in Class A shares of the Aberdeen Global Select Opportunities Fund Inc., Morgan Stanley Capital International (MSCI) All Country World Index, the MSCI World Index and the Consumer Price Index (CPI) over a 10-year period ended April 30, 2014. Unlike the Fund, the returns for these unmanaged indexes do not reflect any fees or expenses. Investors cannot invest directly in market indexes.
The MSCI All Country World Index is a free float-adjusted market capitalization-weighed index that is designed to measure the equity market performance of 46 country indexes comprising 23 developed and 23 emerging market country indexes. The developed market country indexes included are: Australia, Austria, Belgium, Canada, Denmark, Finland, France, Germany, Hong Kong, Ireland, Israel, Italy, Japan, Netherlands, New Zealand, Norway, Portugal, Singapore, Spain, Sweden, Switzerland, the United Kingdom and the United States. The emerging market country indexes included are: Brazil, Chile, China, Colombia, Czech Republic, Egypt, Greece, Hungary, India, Indonesia, Korea, Malaysia, Mexico, Peru, Philippines, Poland, Qatar, Russia, South Africa, Taiwan, Thailand, Turkey and United Arab Emirates.
The MSCI World Index is a free float-adjusted market capitalization weighted index that is designed to measure the equity market performance of developed markets. The MSCI World Index consists of the following 23 developed market country indexes: Australia, Austria, Belgium, Canada, Denmark, Finland, France, Germany, Hong Kong, Ireland, Israel, Italy, Japan, Netherlands, New Zealand, Norway, Portugal, Singapore, Spain, Sweden, Switzerland, the United Kingdom, and the United States.
The CPI represents changes in prices of all goods and services purchased for consumption by urban households.
Investment return and principal value will fluctuate, and when redeemed, shares may be worth more or less than original cost. Past performance is no guarantee of future results. The Average Annual Total Return table and performance graph do not reflect the deduction of taxes that a shareholder would pay on Fund distributions or the redemption of Fund shares. Investing in mutual funds involves market risk, including loss of principal. Performance returns assume the reinvestment of all distributions. Performance returns reflect fee waivers and reimbursements in effect without which returns would have been lower.
Portfolio Summary (as a percentage of net assets)
April 30, 2014 (Unaudited)
| Asset Allocation | ||||
Common Stocks | 87.1% | |||
Preferred Stocks | 8.7% | |||
Other assets in excess of liabilities | 4.2% | |||
| 100.0% | ||||
The following chart summarizes the composition of the Fund’s portfolio, in Standard & Poor’s Global Industry Classification Standard (GICS) sectors, expressed as a percentage of net assets. The GICS structure consists of 10 sectors, 24 industry groups, 68 industries and 154 sub-industries. As of April 30, 2014, the Fund did not have more than 25% of its assets invested in any single industry group.
| Top Sectors | ||||
Energy | 17.4% | |||
Financials | 16.7% | |||
Consumer Staples | 15.5% | |||
Health Care | 13.1% | |||
Materials | 9.4% | |||
Information Technology | 8.9% | |||
Industrials | 8.5% | |||
Telecommunication Services | 3.3% | |||
Utilities | 1.5% | |||
Consumer Discretionary | 1.5% | |||
Other | 4.2% | |||
| 100.0% | ||||
| Top Holdings | ||||
Roche Holding AG | 4.0% | |||
British American Tobacco PLC | 3.4% | |||
Royal Dutch Shell PLC, B Shares | 3.1% | |||
Johnson & Johnson | 3.1% | |||
Novartis AG | 3.1% | |||
Taiwan Semiconductor Manufacturing Co. Ltd., ADR | 3.0% | |||
Banco Bradesco SA, ADR, Preferred Shares | 3.0% | |||
CVS Caremark Corp. | 2.9% | |||
Philip Morris International, Inc. | 2.9% | |||
Tenaris SA, ADR | 2.9% | |||
Other | 68.6% | |||
| 100.0% | ||||
| Top Countries | ||||
United States | 27.6% | |||
United Kingdom | 16.1% | |||
Switzerland | 11.6% | |||
Brazil | 6.2% | |||
Italy | 5.3% | |||
Japan | 4.9% | |||
Sweden | 4.1% | |||
Canada | 4.1% | |||
Taiwan | 3.0% | |||
Hong Kong | 2.6% | |||
Other | 14.5% | |||
| 100.0% | ||||
2014 Semi-Annual Report
5
Table of Contents
Statement of Investments
April 30, 2014 (Unaudited)
Aberdeen Global Select Opportunities Fund Inc.
| Shares or Principal Amount | Value | |||||||
COMMON STOCKS (87.1%) | ||||||||
AUSTRALIA (0.7%) | ||||||||
Financials (0.7%) | ||||||||
QBE Insurance Group Ltd. | 5,400 | $ | 57,939 | |||||
CANADA (4.1%) | ||||||||
Industrials (2.1%) | ||||||||
Canadian National Railway Co. | 2,800 | 163,798 | ||||||
Materials (2.0%) | ||||||||
Potash Corp. of Saskatchewan, Inc. | 4,400 | 158,848 | ||||||
| 322,646 | ||||||||
CHINA (1.5%) |
| |||||||
Energy (1.5%) | ||||||||
PetroChina Co. Ltd., H Shares | 106,000 | 122,505 | ||||||
FRANCE (1.2%) | ||||||||
Industrials (1.2%) | ||||||||
Schneider Electric SA | 1,000 | 93,661 | ||||||
HONG KONG (2.6%) | ||||||||
Financials (2.6%) | ||||||||
AIA Group Ltd. | 25,500 | 123,670 | ||||||
Swire Pacific Ltd., Class A | 7,000 | 80,764 | ||||||
| 204,434 | ||||||||
ITALY (5.3%) |
| |||||||
Energy (5.3%) | ||||||||
Eni SpA | 7,600 | 197,162 | ||||||
Tenaris SA, ADR | 5,200 | 229,060 | ||||||
| 426,222 | ||||||||
JAPAN (4.9%) |
| |||||||
Financials (1.0%) | ||||||||
Daito Trust Construction Co. Ltd. | 800 | 81,371 | ||||||
Industrialsc (1.4%) |
| |||||||
FANUC Corp. | 600 | 108,076 | ||||||
Materials (2.5%) |
| |||||||
Shin-Etsu Chemical Co. Ltd. | 3,400 | 199,640 | ||||||
| 389,087 | ||||||||
MEXICO (1.8%) |
| |||||||
Consumer Staples (1.8%) | ||||||||
Fomento Economico Mexicano SAB de CV, ADR | 1,600 | 145,232 | ||||||
SINGAPORE (1.1%) | ||||||||
Financials (1.1%) | ||||||||
City Developments Ltd. | 10,000 | 86,271 | ||||||
SOUTH AFRICA (1.5%) | ||||||||
Telecommunication Services (1.5%) | ||||||||
MTN Group Ltd. | 5,800 | 116,103 | ||||||
SWEDEN (4.1%) | ||||||||
Financials (1.5%) | ||||||||
Nordea Bank AB | 8,300 | 119,656 | ||||||
Industrials (1.7%) | ||||||||
Atlas Copco AB, A Shares | 4,737 | 136,799 | ||||||
Information Technology (0.9%) | ||||||||
Telefonaktiebolaget LM Ericsson, B Shares | 6,000 | 72,273 | ||||||
| 328,728 | ||||||||
SWITZERLAND (11.6%) |
| |||||||
Consumer Staples (2.0%) | ||||||||
Nestle SA | 2,100 | 162,070 | ||||||
Financials (2.5%) | ||||||||
Zurich Insurance Group AG* | 700 | 200,432 | ||||||
Health Care (7.1%) |
| |||||||
Novartis AG | 2,800 | 242,649 | ||||||
Roche Holding AG | 1,100 | 322,334 | ||||||
| 564,983 | ||||||||
| 927,485 | ||||||||
TAIWAN (3.0%) | ||||||||
Information Technology (3.0%) | ||||||||
Taiwan Semiconductor Manufacturing Co. Ltd., ADR | 11,800 | 237,180 | ||||||
UNITED KINGDOM (16.1%) |
| |||||||
Consumer Staples (3.4%) | ||||||||
British American Tobacco PLC | 4,700 | 271,179 | ||||||
Energy (3.1%) |
| |||||||
Royal Dutch Shell PLC, B Shares | 5,800 | 246,799 | ||||||
Financials (4.3%) |
| |||||||
HSBC Holdings PLC | 14,500 | 147,908 | ||||||
Standard Chartered PLC | 9,000 | 194,749 | ||||||
| 342,657 | ||||||||
Materials (2.0%) |
| |||||||
BHP Billiton PLC | 4,900 | 158,776 | ||||||
Telecommunication Services (1.8%) |
| |||||||
Vodafone Group PLC | 38,618 | 146,034 | ||||||
Utilities (1.5%) |
| |||||||
Centrica PLC | 21,500 | 119,803 | ||||||
| 1,285,248 | ||||||||
UNITED STATES (27.6%) | ||||||||
Consumer Discretionary (1.5%) | ||||||||
Comcast Corp., Class A | 2,300 | 119,048 | ||||||
Consumer Staples (8.3%) | ||||||||
CVS Caremark Corp. | 3,200 | 232,704 | ||||||
PepsiCo, Inc. | 2,300 | 197,547 | ||||||
Philip Morris International, Inc. | 2,700 | 230,661 | ||||||
| 660,912 | ||||||||
See accompanying notes to financial statements.
Semi-Annual Report 2014
6
Table of Contents
Statement of Investments (concluded)
April 30, 2014 (Unaudited)
Aberdeen Global Select Opportunities Fund Inc.
| Shares or Principal Amount | Value | |||||||
Energy (6.2%) | ||||||||
Chevron Corp. | 900 | $ | 112,968 | |||||
EOG Resources, Inc. | 2,000 | 196,000 | ||||||
Schlumberger Ltd. | 1,800 | 182,790 | ||||||
| 491,758 | ||||||||
Health Care (6.0%) | ||||||||
Baxter International, Inc. | 2,200 | 160,138 | ||||||
Johnson & Johnson | 2,400 | 243,096 | ||||||
Quest Diagnostics, Inc. | 1,300 | 72,709 | ||||||
| 475,943 | ||||||||
Industrials (2.1%) | ||||||||
United Technologies Corp. | 1,400 | 165,662 | ||||||
Information Technology (2.5%) | ||||||||
Oracle Corp. | 5,000 | 204,400 | ||||||
Materials (1.0%) | ||||||||
Praxair, Inc. | 600 | 78,330 | ||||||
| 2,196,053 | ||||||||
Total Common Stocks | 6,938,794 | |||||||
PREFERRED STOCKS (8.7%) | ||||||||
BRAZIL (6.2%) | ||||||||
Energy (1.3%) | ||||||||
Petroleo Brasileiro SA, ADR, Preferred Shares | 7,200 | 106,560 | ||||||
Financials (3.0%) | ||||||||
Banco Bradesco SA, ADR, Preferred Shares | 15,900 | 236,433 | ||||||
Materials (1.9%) | ||||||||
Vale SA, ADR, Preferred Shares | 12,800 | 151,936 | ||||||
| 494,929 | ||||||||
REPUBLIC OF SOUTH KOREA (2.5%) | ||||||||
Information Technology (2.5%) | ||||||||
Samsung Electronics Co. Ltd., GDR, Preferred Shares (a) | 400 | 198,840 | ||||||
Total Preferred Stocks | 693,769 | |||||||
Total Investments | 7,632,563 | |||||||
Other assets in excess of liabilities—4.2% | 337,408 | |||||||
Net Assets—100.0% | $ | 7,969,971 | ||||||
| * | Non-income producing security. |
| (a) | Denotes a security issued under Regulation S or Rule 144A. |
| (b) | See notes to financial statements for tax unrealized appreciation/depreciation of securities. |
| ADR | American Depositary Receipt |
| GDR | Global Depositary Receipt |
See accompanying notes to financial statements.
2014 Semi-Annual Report
7
Table of Contents
Aberdeen Select International Equity Fund (Unaudited)
Aberdeen Select International Equity Fund (Class A shares at net asset value net of fees) returned 4.43% for the 12-month period ended October 31, 2013, versus 2.91% for its benchmark, the MSCI All Country World ex-U.S. Index, during the same period. For broader comparison, the average return of the Fund’s Lipper peer category of International Multi-Cap Growth Funds (consisting of 160 funds) was 2.64% for the period.
International equities, as measured by the MSCI All Country World ex-U.S. Index, rose during the reporting period, with developed markets generally outperforming their emerging market peers, as represented by the MSCI Emerging Markets Index. Market sentiment was lifted by the European Central Bank (ECB)’s unexpected benchmark interest rate cut by 25 basis points to 0.25%, as well as improved economic data. The middle of the period saw increased risk aversion, fuelled by renewed turmoil in emerging economies, mixed U.S. and Chinese data, and the start of the U.S. Federal Reserve’s (Fed) continued tapering of its asset purchase program. In particular, emerging markets currencies suffered a sharp sell-off. The commitment by Fed Chairperson Janet Yellen to maintain loose monetary policy reassured investors to an extent, though that gave way to fears that the Fed may hike interest rates earlier than expected. However, confidence strengthened after the ECB signalled that it was open to further monetary policy easing. Overall, Japan was the main global market laggard, a contrast to its stellar performance in 2013. The Japanese stock market was largely weighed down by concerns over the impact of the consumption tax hike on domestic demand. The nation’s lackluster fourth-quarter 2013 gross domestic product (GDP) growth of 0.3% gave rise to growth fears as well. Investors were also disappointed that the central bank kept its monetary policy stance unchanged and refrained from increasing economic stimulus.
The main contributors to Fund performance for the reporting period were engineering solutions provider Weir Group, Royal Dutch Shell and Swiss drugmaker Novartis. Weir Group was buoyed by results that highlighted margin support from the aftermarket business, coupled with improving prospects in the units serving the oil and gas markets. Royal Dutch Shell posted solid first-quarter 2014 results, boosted by its gas division, while shareholders were rewarded with a higher dividend. Additionally, investors were relieved when the energy group cancelled its plan to build a plant in the U.S., which was seen as capital-intensive and risky. Shares of Novartis climbed after the company announced a significant three-way transaction with GlaxoSmithKline (GSK): GSK will sell its oncology portfolio to Novartis for US$16 billion, acquire Novartis’s vaccines business for US$5.25 billion, and both companies will combine their consumer health and over-the-counter drug businesses under a new company. Novartis will also sell its animal health business to Eli Lilly for roughly US$5.4 billion. We feel that these transactions should allow Novartis to bolster its best businesses and exit weaker ones.
The top detractors from Fund performance included Brazilian miner Vale, which was hurt by lower iron ore prices, while shares of QBE Insurance fell after the company forecast a net loss of US$250 million for calendar year 2013. This followed a strategic review of its North American operations, which resulted in additional loan loss provisions, restructuring charges and a goodwill* write-down, which totalled US$1.93 billion. The stock later recouped earlier losses after the company’s first-quarter 2014 results presented no surprises. Lender Standard Chartered’s full-year 2013 profits fell for the first time in over a decade on the back of a write-down in its South Korean business, slowing growth in emerging markets and rising bad loans. Reassuringly, in our view, the bank’s capital adequacy ratio remains robust, allaying for now market worries over its capital position. Over the long term, we believe that its prospects in emerging markets remain bright.
During the reporting period, we initiated a position in Singapore conglomerate Jardine Matheson, which we feel has an attractive collection of assets, as well as UK credit and marketing services company Experian, the largest international operator in a growing industry. Conversely, we sold Verizon Communications, which the Fund received as a spin-off from holding Vodafone.
As we move into the second quarter of 2014, we feel that little has changed at the corporate level. In our opinion, the absence of revenue growth, a lack of internal investment and signs that productivity gains are rolling over raises the question of the sustainability of above-average operating margins. While uncertainty remains, we are focused on managing capital conservatively by investing in what we believe are well-managed businesses at attractive valuations.
Portfolio Management:
Aberdeen Global Equity Team
PAST PERFORMANCE DOES NOT GUARANTEE FUTURE RESULTS.
The performance quoted represents past performance, which does not guarantee future results. Class A shares have up to a 0.25% 12b-1 fee. The investment return and principal value of an investment will fluctuate so that an investor’s shares, when redeemed, may be worth more or less than their original cost. Current performance of the Fund may be lower or higher than the performance quoted. Performance data current to the most recent month-end may be obtained by calling 800-387-6977 or visiting www.aberdeen-asset.us.
Total returns assume the reinvestment of all distributions. Investment performance reflects fee waivers and, in the absence of such waivers, returns would have been lower. Indexes are unmanaged and have been provided for comparison purposes only. No fees or expenses are reflected. You cannot invest directly in an index.
Lipper is a leading global provider of mutual fund information and analysis to fund companies, financial intermediaries and media organizations.
Risk Considerations
Investing in mutual funds involves risk, including the possible loss of principal. There is no assurance that the investment objective of any fund will be achieved.
Foreign securities are more volatile, harder to price and less liquid than U.S. securities. They are subject to different accounting and regulatory standards, and political and economic risks. These risks are enhanced in emerging markets countries.
Equity stocks of small and mid-cap companies carry greater risk, and more volatility than equity stocks of larger, more established companies.
Please read the prospectus for more detailed information regarding these and other risks.
Semi-Annual Report 2014
8
Table of Contents
Aberdeen Select International Equity Fund (Unaudited)
Average Annual Total Return (For periods ended April 30, 2014) | Six Month† | 1 Yr. | 5 Yr. | 10 Yr. | ||||||||||
Class A | 4.43% | 8.21% | 8.37% | 5.53% | ||||||||||
Institutional Class1 | 4.56% | 8.48% | 8.64% | 5.79% | ||||||||||
| † | Not Annualized |
| 1 | Formerly Class I. |
2014 Semi-Annual Report
9
Table of Contents
Aberdeen Select International Equity Fund (Unaudited)
Performance of a $10,000 Investment (as of April 30, 2014)
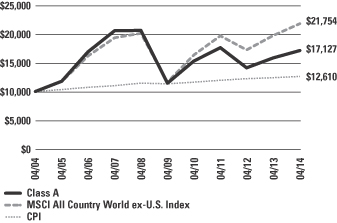
Comparative performance of $10,000 invested in Class A shares of the Aberdeen Select International Equity Fund, Morgan Stanley Capital International All Country World ex-U.S. Index (MSCI ACWI ex-U.S.), and the Consumer Price Index (CPI) over a 10-year period ended April 30, 2014. Unlike the Fund, the returns for these unmanaged indexes do not reflect any fees or expenses. Investors cannot invest directly in market indexes.
The MSCI ACWI ex-U.S. is a free float-adjusted market capitalization index that is designed to measure the equity market performance of developed and emerging markets excluding the U.S.
The CPI represents changes in prices of all goods and services purchased for consumption by urban households.
Investment return and principal value will fluctuate, and when redeemed, shares may be worth more or less than original cost. Past performance is no guarantee of future results. The Average Annual Total Return table and performance graph do not reflect the deduction of taxes that a shareholder would pay on Fund distributions or the redemption of Fund shares. Investing in mutual funds involves market risk, including loss of principal. Performance returns assume the reinvestment of all distributions. Performance returns reflect fee waivers and reimbursements in effect without which returns would have been lower.
Portfolio Summary (as a percentage of net assets)
April 30, 2014 (Unaudited)
| Asset Allocation | ||||
Common Stocks | 85.2% | |||
Preferred Stocks | 11.4% | |||
Exchange Traded Funds | 0.2% | |||
Government Bonds | 0.2% | |||
Other assets in excess of liabilities | 3.0% | |||
| 100.0% | ||||
The following chart summarizes the composition of the Fund’s portfolio, in Standard & Poor’s Global Industry Classification Standard (GICS) sectors, expressed as a percentage of net assets. The GICS structure consists of 10 sectors, 24 industry groups, 68 industries and 154 sub-industries. As of April 30, 2014, the Fund did not have more than 25% of its assets invested in any single industry group.
| Top Sectors | ||||
Financials | 18.4% | |||
Consumer Staples | 13.9% | |||
Energy | 13.8% | |||
Industrials | 11.5% | |||
Materials | 11.5% | |||
Information Technology | 8.9% | |||
Health Care | 8.5% | |||
Telecommunication Services | 6.7% | |||
Utilities | 2.4% | |||
Consumer Services | 1.0% | |||
Other | 3.4% | |||
| 100.0% | ||||
| Top Holdings | ||||
Roche Holding AG | 4.4% | |||
Samsung Electronics Co. Ltd., Preferred Shares | 4.4% | |||
Novartis AG | 4.1% | |||
British American Tobacco PLC | 4.0% | |||
Taiwan Semiconductor Manufacturing Co. Ltd. | 3.6% | |||
Nestle SA | 3.6% | |||
Royal Dutch Shell PLC, B Shares | 3.1% | |||
Eni SpA | 3.0% | |||
Banco Bradesco SA, ADR, Preferred Shares | 3.0% | |||
Tenaris SA, ADR | 3.0% | |||
Other | 63.8% | |||
| 100.0% | ||||
| Top Countries | ||||
United Kingdom | 22.2% | |||
Switzerland | 15.5% | |||
Japan | 7.6% | |||
Brazil | 7.0% | |||
Italy | 6.0% | |||
Canada | 5.1% | |||
Sweden | 4.4% | |||
Republic of South Korea | 4.4% | |||
France | 4.3% | |||
Hong Kong | 4.2% | |||
Other | 19.3% | |||
| 100.0% | ||||
Semi-Annual Report 2014
10
Table of Contents
Statement of Investments
April 30, 2014 (Unaudited)
Aberdeen Select International Equity Fund
| Shares or Principal Amount | Value | |||||||
COMMON STOCKS (85.2%) | ||||||||
AUSTRALIA (0.7%) | ||||||||
Financials (0.7%) | ||||||||
QBE Insurance Group Ltd. | 396,500 | $ | 4,254,230 | |||||
BULGARIA (0.3%) | ||||||||
Financials (0.3%) | ||||||||
LEV Insurance (a)(b) | 4,078,860 | 1,971,338 | ||||||
CANADA (5.1%) | ||||||||
Industrials (2.0%) | ||||||||
Canadian National Railway Co. | 203,000 | 11,875,347 | ||||||
Materials (2.1%) | ||||||||
Potash Corp. of Saskatchewan, Inc. | 330,400 | 11,928,059 | ||||||
Telecommunication Services (1.0%) | ||||||||
TELUS Corp. | 163,500 | 5,753,674 | ||||||
| 29,557,080 | ||||||||
CHINA (1.7%) | ||||||||
Energy (1.7%) | ||||||||
PetroChina Co. Ltd., H Shares | 8,589,200 | 9,926,573 | ||||||
FRANCE (4.3%) | ||||||||
Consumer Staples (2.1%) | ||||||||
Casino Guichard-Perrachon SA* | 92,100 | 11,716,582 | ||||||
Industrials (1.3%) | ||||||||
Schneider Electric SA | 80,200 | 7,511,644 | ||||||
Utilities (0.9%) | ||||||||
GDF Suez | 209,100 | 5,269,431 | ||||||
| 24,497,657 | ||||||||
GERMANY (1.5%) | ||||||||
Materials (1.5%) | ||||||||
Linde AG | 42,600 | 8,827,562 | ||||||
HONG KONG (4.2%) | ||||||||
Financials (3.1%) | ||||||||
AIA Group Ltd. | 2,476,200 | 12,009,148 | ||||||
Swire Pacific Ltd., Class A | 536,900 | 6,194,587 | ||||||
| 18,203,735 | ||||||||
Industrials (1.1%) | ||||||||
Jardine Matheson Holdings Ltd. | 98,800 | 6,155,240 | ||||||
| 24,358,975 | ||||||||
ITALY (6.0%) | ||||||||
Energy (6.0%) | ||||||||
Eni SpA | 671,100 | 17,409,900 | ||||||
Tenaris SA, ADR | 385,053 | 16,961,585 | ||||||
| 34,371,485 | ||||||||
JAPAN (7.6%) | ||||||||
Consumer Staples (1.6%) | ||||||||
Japan Tobacco, Inc. | 284,700 | 9,353,433 | ||||||
Financials (1.1%) | ||||||||
Daito Trust Construction Co. Ltd. | 59,200 | 6,021,419 | ||||||
Industrials (2.1%) | ||||||||
FANUC Corp. | 68,100 | 12,266,667 | ||||||
Materials (2.8%) | ||||||||
Shin-Etsu Chemical Co. Ltd. | 269,700 | 15,836,129 | ||||||
| 43,477,648 | ||||||||
LATVIA (0.0%) | ||||||||
Financials (0.0%) | ||||||||
AS Parex Banka (b) | 1,424,182 | – | ||||||
MEXICO (2.6%) | ||||||||
Consumer Staples (2.6%) | ||||||||
Fomento Economico Mexicano SAB de CV, ADR | 162,100 | 14,713,817 | ||||||
SERBIA (0.0%) | ||||||||
Industrials (0.0%) | ||||||||
Toza Markovic ad Kikinda *(a)(b) | 78,160 | 80,592 | ||||||
SINGAPORE (4.0%) | ||||||||
Financials (1.8%) | ||||||||
City Developments Ltd. | 1,186,000 | 10,231,712 | ||||||
Telecommunication Services (2.2%) | ||||||||
Singapore Telecommunications Ltd. | 4,124,600 | 12,551,059 | ||||||
| 22,782,771 | ||||||||
SOUTH AFRICA (1.5%) | ||||||||
Telecommunication Services (1.5%) | ||||||||
MTN Group Ltd. | 428,900 | 8,585,616 | ||||||
SWEDEN (4.4%) | ||||||||
Financials (1.5%) | ||||||||
Nordea Bank AB | 589,900 | 8,504,213 | ||||||
Industrials (2.0%) | ||||||||
Atlas Copco AB, A Shares | 392,262 | 11,328,041 | ||||||
Information Technology (0.9%) | ||||||||
Telefonaktiebolaget LM Ericsson, B Shares | 441,100 | 5,313,316 | ||||||
| 25,145,570 | ||||||||
SWITZERLAND (15.5%) | ||||||||
Consumer Staples (3.6%) | ||||||||
Nestle SA | 267,300 | 20,629,263 | ||||||
Financials (2.4%) | ||||||||
Zurich Insurance Group AG* | 47,700 | 13,657,982 | ||||||
Health Care (8.5%) | ||||||||
Novartis AG | 271,600 | 23,536,918 | ||||||
Roche Holding AG | 86,600 | 25,376,569 | ||||||
| 48,913,487 | ||||||||
Industrials (1.0%) | ||||||||
Schindler Holding AG | 38,000 | 5,878,358 | ||||||
| 89,079,090 | ||||||||
See accompanying notes to financial statements.
2014 Semi-Annual Report
11
Table of Contents
Statement of Investments (concluded)
April 30, 2014 (Unaudited)
Aberdeen Select International Equity Fund
| Shares or Principal Amount | Value | |||||||
TAIWAN (3.6%) | ||||||||
Information Technology (3.6%) | ||||||||
Taiwan Semiconductor Manufacturing Co. Ltd. | 5,327,000 | $ | 20,903,686 | |||||
UNITED KINGDOM (22.2%) | ||||||||
Consumer Services (1.0%) | ||||||||
Experian PLC | 303,600 | 5,823,634 | ||||||
Consumer Staples (4.0%) | ||||||||
British American Tobacco PLC | 397,000 | 22,906,012 | ||||||
Energy (4.6%) | ||||||||
John Wood Group PLC | 638,100 | 8,441,930 | ||||||
Royal Dutch Shell PLC, B Shares | 427,100 | 18,173,731 | ||||||
| 26,615,661 | ||||||||
Financials (4.5%) | ||||||||
HSBC Holdings PLC | 1,132,600 | 11,553,123 | ||||||
Standard Chartered PLC | 663,000 | 14,346,505 | ||||||
| 25,899,628 | ||||||||
Industrials (2.0%) | ||||||||
Weir Group PLC (The) | 253,600 | 11,519,020 | ||||||
Materials (2.6%) | ||||||||
BHP Billiton PLC | 450,800 | 14,607,399 | ||||||
Telecommunication Services (2.0%) | ||||||||
Vodafone Group PLC | 3,028,200 | 11,451,164 | ||||||
Utilities (1.5%) | ||||||||
Centrica PLC | 1,560,000 | 8,692,657 | ||||||
| 127,515,175 | ||||||||
VENEZUELA (0.0%) | ||||||||
Financials (0.0%) | ||||||||
Banco Provincial SA-Banco Universal (b) | 18,422 | 188,914 | ||||||
Banco Venezolano de Credito SA* (b) | 156 | – | ||||||
| 188,914 | ||||||||
Industrials (0.0%) | ||||||||
Cemex Venezuela SACA-I* (b) | 15,843,815 | – | ||||||
Materials (0.0%) | ||||||||
Siderurgica Venezolana Sivensa SACA, ADR* (b) | 2,847,910 | – | ||||||
| 188,914 | ||||||||
Total Common Stocks | 490,237,779 | |||||||
EXCHANGE TRADED FUNDS (0.2%) | ||||||||
RUSSIA (0.2%) | ||||||||
Renaissance Pre-IPO Fund* (b) | 92,634 | 1,389,510 | ||||||
Total Exchange Traded Funds | 1,389,510 | |||||||
GOVERNMENT BONDS (0.2%) | ||||||||
VENEZUELA (0.2%) | ||||||||
Bonos de la Deuda Publica Nacional (VEF), 17.25%, 12/31/2015 (b) | 10,000,000 | 164,407 | ||||||
Bonos de la Deuda Publica Nacional (VEF), 16.00%, 08/23/2018 (b) | 49,500,000 | 839,827 | ||||||
Bonos de la Deuda Publica Nacional (VEF), 18.00%, 04/12/2018 (b) | 20,000,000 | 357,341 | ||||||
| 1,361,575 | ||||||||
Total Government Bonds | 1,361,575 | |||||||
PREFERRED STOCKS (11.4%) | ||||||||
BRAZIL (7.0%) | ||||||||
Energy (1.5%) | ||||||||
Petroleo Brasileiro SA, ADR, Preferred Shares | 576,600 | 8,533,680 | ||||||
Financials (3.0%) | ||||||||
Banco Bradesco SA, ADR, Preferred Shares | 1,165,200 | 17,326,524 | ||||||
Materials (2.5%) | ||||||||
Vale SA, ADR, Preferred Shares | 1,223,400 | 14,521,758 | ||||||
| 40,381,962 | ||||||||
REPUBLIC OF SOUTH KOREA (4.4%) | ||||||||
Information Technology (4.4%) | ||||||||
Samsung Electronics Co. Ltd., Preferred Shares | 24,800 | 24,888,803 | ||||||
Total Preferred Stocks | 65,270,765 | |||||||
Total Investments | 558,259,629 | |||||||
Other assets in excess of liabilities—3.0% | 17,059,744 | |||||||
Net Assets—100.0% | $ | 575,319,373 | ||||||
| * | Non-income producing security. |
| (a) | Investment in affiliate. |
| (b) | The Fund’s adviser has deemed this security to be illiquid based upon procedures approved by the Board of Trustees. Illiquid securities held by the Fund represent 0.9% of net assets as of April 30, 2014. |
| (c) | See notes to financial statements for tax unrealized appreciation/depreciation of securities. |
| ADR | American Depositary Receipt |
See accompanying notes to financial statements.
Semi-Annual Report 2014
12
Table of Contents
Aberdeen Select International Equity Fund II (Unaudited)
The Aberdeen Select International Equity Fund II (Class A shares at net asset value net of fees) returned 4.56% for the six-month period ended April 30, 2014, versus the 2.91% return of its benchmark, the MSCI All Country World ex-U.S. Index, during the same period. For broader comparison, the average return of the Fund’s Lipper peer category of International Large-Cap Growth Funds (consisting of 160 funds) was 2.64% for the period.
International equities, as measured by the MSCI All Country World ex-U.S. Index, rose during the reporting period, with developed markets generally outperforming their emerging market peers, as represented by the MSCI Emerging Markets Index. Market sentiment was lifted by the European Central Bank’s (ECB) unexpected benchmark interest rate cut by 25 basis points to 0.25%, as well as improved economic data. The middle of the period saw increased risk aversion, fueled by renewed turmoil in emerging economies, mixed U.S. and Chinese data, and the start of the U.S. Federal Reserve’s (Fed) continued tapering of its asset purchase program. In particular, emerging markets currencies suffered a sharp sell-off. The commitment by Fed Chairperson Janet Yellen to maintain loose monetary policy reassured investors to an extent, though that gave way to fears that the Fed may hike interest rates earlier than expected. However, confidence strengthened after the ECB signalled that it was open to further monetary policy easing. Overall, Japan was the main global market laggard, a contrast to its stellar performance in 2013. The Japanese stock market was largely weighed down by concerns over the impact of the consumption tax hike on domestic demand. The nation’s lackluster fourth-quarter 2013 gross domestic product (GDP) growth of 0.3% gave rise to growth fears as well. Investors were also disappointed that the central bank kept its monetary policy stance unchanged and refrained from increasing economic stimulus.
The main contributors to Fund performance for the reporting period were engineering solutions provider Weir Group, Royal Dutch Shell and Swiss drug-maker Novartis. Weir Group was buoyed by results that highlighted margin support from the aftermarket business, coupled with improving prospects in the units serving the oil and gas markets. Royal Dutch Shell posted solid first-quarter 2014 results, boosted by its gas division, while shareholders were rewarded with a higher dividend. Additionally, investors were relieved when the energy group cancelled its plan to build a plant in the U.S., which was seen as capital-intensive and risky. Shares of Novartis climbed after the company announced a significant three-way transaction with GlaxoSmithKline (GSK): GSK will sell its oncology portfolio to Novartis for US$16 billion, acquire Novartis’s vaccines business for US$5.25 billion, and both companies will combine their consumer health and over-the-counter drug businesses under a new company. Novartis will also sell its animal health business to Eli Lilly for roughly US$5.4 billion. We feel that these transactions should allow Novartis to bolster its best businesses and exit weaker ones.
The top detractors from Fund performance included Brazilian miner Vale, which was hurt by lower iron ore prices, while shares of QBE Insurance fell after the company forecast a net loss of US$250 million for calendar year 2013. This followed a strategic review of its North American operations, which resulted in additional loan loss provisions, restructuring charges and a goodwill write-down, which totalled US$1.93 billion. The stock later recouped earlier losses after the company’s first-quarter 2014 results presented no surprises. Lender Standard Chartered’s full-year 2013 profits fell for the first time in over a decade on the back of a write-down in its South Korean business, slowing growth in emerging markets and rising bad loans. Reassuringly, in our view, the bank’s capital adequacy ratio remains robust, allaying for now market worries over its capital position. Over the long term, we believe that its prospects in emerging markets remain bright.
During the reporting period, we initiated a position in Singapore conglomerate Jardine Matheson, which we feel has an attractive collection of assets, as well as UK credit and marketing services company Experian, the largest international operator in a growing industry. Conversely, we sold Verizon Communications, which the Fund received as a spin-off from holding Vodafone.
As we move into the second quarter of 2014, we feel that little has changed at the corporate level. In our opinion, the absence of revenue growth, a lack of internal investment and signs that productivity gains are rolling over raises the question of the sustainability of above-average operating margins. While uncertainty remains, we are focused on managing capital conservatively by investing in what we believe are well-managed businesses at attractive valuations.
Portfolio Management:
Aberdeen Global Equity Team
PAST PERFORMANCE DOES NOT GUARANTEE FUTURE RESULTS.
The performance quoted represents past performance, which does not guarantee future results. Class A shares have up to a 0.25% 12b-1 fee. The investment return and principal value of an investment will fluctuate so that an investor’s shares, when redeemed, may be worth more or less than their original cost. Current performance of the Fund may be lower or higher than the performance quoted. Performance data current to the most recent month-end may be obtained by calling 800-387-6977 or visiting www.aberdeen-asset.us.
Total returns assume the reinvestment of all distributions. Investment performance reflects fee waivers and, in the absence of such waivers, returns would have been lower. Indexes are unmanaged and have been provided for comparison purposes only. No fees or expenses are reflected. You cannot invest directly in an index.
Lipper is a leading global provider of mutual fund information and analysis to fund companies, financial intermediaries and media organizations.
Risk Considerations
Investing in mutual funds involves risk, including the possible loss of principal. There is no assurance that the investment objective of any fund will be achieved.
2014 Semi-Annual Report
13
Table of Contents
Aberdeen Select International Equity Fund II (Unaudited) (concluded)
Foreign securities are more volatile, harder to price and less liquid than U.S. securities. They are subject to different accounting and regulatory standards, and political and economic risks. These risks are enhanced in emerging markets countries.
Equity stocks of mid-cap companies carry greater risk, and more volatility than equity stocks of larger, more established companies.
Please read the prospectus for more detailed information regarding these and other risks.
Semi-Annual Report 2014
14
Table of Contents
Aberdeen Select International Equity Fund II (Unaudited)
Average Annual Total Return (For periods ended April 30, 2014) | Six Month† | 1 Yr. | 5 Yr. | Inception1 | ||||||||||
Class A | 4.56% | 8.30% | 8.89% | 4.63% | ||||||||||
Institutional Class2 | 4.67% | 8.68% | 9.15% | 4.92% | ||||||||||
| † | Not Annualized |
| 1 | Fund commenced operations on May 04, 2005. |
| 2 | Formerly Class I. |
2014 Semi-Annual Report
15
Table of Contents
Aberdeen Select International Equity Fund II (Unaudited)
Performance of a $10,000 Investment (as of April 30, 2014)
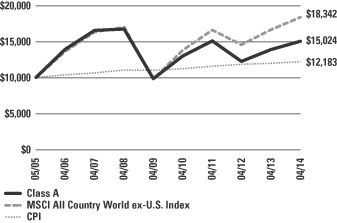
Comparative performance of $10,000 invested in Class A shares of the Aberdeen Select International Equity Fund II, Morgan Stanley Capital International All Country World ex-U.S. Index (MSCI ACWI ex-U.S.), and the Consumer Price Index (CPI) over a 10-year period ended April 30, 2014. Unlike the Fund, the returns for these unmanaged indexes do not reflect any fees or expenses. Investors cannot invest directly in market indexes.
The MSCI ACWI ex-U.S. is a free float-adjusted market capitalization index that is designed to measure the equity market performance of developed and emerging markets excluding the U.S.
The CPI represents changes in prices of all goods and services purchased for consumption by urban households.
Investment return and principal value will fluctuate, and when redeemed, shares may be worth more or less than original cost. Past performance is no guarantee of future results. The Average Annual Total Return table and performance graph do not reflect the deduction of taxes that a shareholder would pay on Fund distributions or the redemption of Fund shares. Investing in mutual funds involves market risk, including loss of principal. Performance returns assume the reinvestment of all distributions. Performance returns reflect fee waivers and reimbursements in effect without which returns would have been lower.
Portfolio Summary (as a percentage of net assets)
April 30, 2014 (Unaudited)
| Asset Allocation | ||||
Common Stocks | 82.9% | |||
Preferred Stocks | 10.6% | |||
Repurchase Agreement | 4.7% | |||
Other assets in excess of liabilities | 1.8% | |||
| 100.0% | ||||
The following chart summarizes the composition of the Fund’s portfolio, in Standard & Poor’s Global Industry Classification Standard (GICS) sectors, expressed as a percentage of net assets. The GICS structure consists of 10 sectors, 24 industry groups, 68 industries and 154 sub-industries. As of April 30, 2014, the Fund did not have more than 25% of its assets invested in any single industry group.
| Top Sectors | ||||
Financials | 17.3% | |||
Energy | 13.7% | |||
Consumer Staples | 13.5% | |||
Industrials | 11.5% | |||
Materials | 10.8% | |||
Health Care | 8.7% | |||
Information Technology | 8.1% | |||
Telecommunication Services | 6.4% | |||
Utilities | 2.4% | |||
Consumer Services | 1.1% | |||
Other | 6.5% | |||
| 100.0% | ||||
| Top Holdings* | ||||
Roche Holding AG | 4.6% | |||
Novartis AG | 4.1% | |||
British American Tobacco PLC | 4.0% | |||
Samsung Electronics Co. Ltd., Preferred Shares | 3.8% | |||
Nestle SA | 3.6% | |||
Taiwan Semiconductor Manufacturing Co. Ltd. | 3.4% | |||
Royal Dutch Shell PLC, B Shares | 3.1% | |||
Eni SpA | 3.0% | |||
Banco Bradesco SA, ADR, Preferred Shares | 2.9% | |||
Tenaris SA, ADR | 2.9% | |||
Other | 64.6% | |||
| 100.0% | ||||
| Top Countries | ||||
United Kingdom | 22.3% | |||
Switzerland | 15.7% | |||
Japan | 7.0% | |||
Brazil | 6.8% | |||
Italy | 5.9% | |||
Canada | 5.1% | |||
United States | 4.7% | |||
Sweden | 4.3% | |||
France | 4.3% | |||
Hong Kong | 3.9% | |||
Other | 20.0% | |||
| 100.0% | ||||
| * | For the purpose of listing top holdings, repurchase agreements included as part of “Other” holdings. |
Semi-Annual Report 2014
16
Table of Contents
Statement of Investments
April 30, 2014 (Unaudited)
Aberdeen Select International Equity Fund II
| Shares or Principal Amount | Value | |||||||
COMMON STOCKS (82.9%) | ||||||||
AUSTRALIA (0.7%) | ||||||||
Financials (0.7%) | ||||||||
QBE Insurance Group Ltd. | 183,900 | $ | 1,973,145 | |||||
CANADA (5.1%) | ||||||||
Industrials (2.1%) | ||||||||
Canadian National Railway Co. | 98,200 | 5,744,626 | ||||||
Materials (2.0%) | ||||||||
Potash Corp. of Saskatchewan, Inc. | 152,700 | 5,512,756 | ||||||
Telecommunication Services (1.0%) | ||||||||
TELUS Corp. | 77,600 | 2,730,796 | ||||||
| 13,988,178 | ||||||||
CHINA (1.5%) | ||||||||
Energy (1.5%) | ||||||||
PetroChina Co. Ltd., H Shares | 3,582,000 | 4,139,732 | ||||||
FRANCE (4.3%) | ||||||||
Consumer Staples (2.0%) | ||||||||
Casino Guichard-Perrachon SA | 44,000 | 5,597,499 | ||||||
Industrials (1.4%) | ||||||||
Schneider Electric SA | 39,500 | 3,699,625 | ||||||
Utilities (0.9%) | ||||||||
GDF Suez | 99,400 | 2,504,932 | ||||||
| 11,802,056 | ||||||||
GERMANY (1.6%) | ||||||||
Materials (1.6%) | ||||||||
Linde AG | 20,600 | 4,268,727 | ||||||
HONG KONG (3.9%) | ||||||||
Financials (2.9%) | ||||||||
AIA Group Ltd. | 1,073,800 | 5,207,747 | ||||||
Swire Pacific Ltd., Class A | 230,000 | 2,653,669 | ||||||
| 7,861,416 | ||||||||
Industrials (1.0%) | ||||||||
Jardine Matheson Holdings Ltd. | 46,000 | 2,865,800 | ||||||
| 10,727,216 | ||||||||
ITALY (5.9%) | ||||||||
Energy (5.9%) | ||||||||
Eni SpA | 312,500 | 8,106,979 | ||||||
Tenaris SA, ADR | 181,717 | 8,004,634 | ||||||
| 16,111,613 | ||||||||
JAPAN (7.0%) | ||||||||
Consumer Staples (1.6%) | ||||||||
Japan Tobacco, Inc. | 134,100 | 4,405,674 | ||||||
Financials (1.0%) | ||||||||
Daito Trust Construction Co. Ltd. | 27,600 | 2,807,283 | ||||||
Industrials (2.0%) | ||||||||
FANUC Corp. | 30,000 | 5,403,818 | ||||||
Materials (2.4%) | ||||||||
Shin-Etsu Chemical Co. Ltd. | 112,600 | 6,611,599 | ||||||
| 19,228,374 | ||||||||
MEXICO (2.3%) | ||||||||
Consumer Staples (2.3%) | ||||||||
Fomento Economico Mexicano SAB de CV, ADR | 71,200 | 6,462,824 | ||||||
SINGAPORE (3.5%) | ||||||||
Financials (1.5%) | ||||||||
City Developments Ltd. | 482,000 | 4,158,251 | ||||||
Telecommunication Services (2.0%) | ||||||||
Singapore Telecommunications Ltd. | 1,821,000 | 5,541,259 | ||||||
| 9,699,510 | ||||||||
SOUTH AFRICA (1.4%) | ||||||||
Telecommunication Services (1.4%) | ||||||||
MTN Group Ltd. | 197,100 | 3,945,500 | ||||||
SWEDEN (4.3%) | ||||||||
Financials (1.5%) | ||||||||
Nordea Bank AB | 286,600 | 4,131,730 | ||||||
Industrials (1.9%) | ||||||||
Atlas Copco AB, A Shares | 183,670 | 5,304,162 | ||||||
Information Technology (0.9%) | ||||||||
Telefonaktiebolaget LM Ericsson, B Shares | 202,300 | 2,436,826 | ||||||
| 11,872,718 | ||||||||
SWITZERLAND (15.7%) | ||||||||
Consumer Staples (3.6%) | ||||||||
Nestle SA | 127,300 | 9,824,561 | ||||||
Financials (2.4%) | ||||||||
Zurich Insurance Group AG * | 22,900 | 6,556,977 | ||||||
Health Care (8.7%) | ||||||||
Novartis AG | 129,900 | 11,257,164 | ||||||
Roche Holding AG | 43,100 | 12,629,678 | ||||||
| 23,886,842 | ||||||||
Industrials (1.0%) | ||||||||
Schindler Holding AG | 18,200 | 2,815,424 | ||||||
| 43,083,804 | ||||||||
TAIWAN (3.4%) | ||||||||
Information Technology (3.4%) | ||||||||
Taiwan Semiconductor Manufacturing Co. Ltd. | 2,354,000 | 9,237,333 | ||||||
UNITED KINGDOM (22.3%) | ||||||||
Consumer Services (1.1%) | ||||||||
Experian PLC | 155,500 | 2,982,790 | ||||||
Consumer Staples (4.0%) | ||||||||
British American Tobacco PLC | 188,900 | 10,899,107 | ||||||
See accompanying notes to financial statements.
2014 Semi-Annual Report
17
Table of Contents
Statement of Investments (concluded)
April 30, 2014 (Unaudited)
Aberdeen Select International Equity Fund II
| Shares or Principal Amount | Value | |||||||
Energy (4.7%) | ||||||||
John Wood Group PLC | 319,300 | $ | 4,224,272 | |||||
Royal Dutch Shell PLC, B Shares | 201,800 | 8,586,886 | ||||||
| 12,811,158 | ||||||||
Financials (4.4%) | ||||||||
HSBC Holdings PLC | 544,000 | 5,549,090 | ||||||
Standard Chartered PLC | 303,500 | 6,567,367 | ||||||
| 12,116,457 | ||||||||
Industrials (2.1%) | ||||||||
Weir Group PLC (The) | 129,600 | 5,886,692 | ||||||
Materials (2.5%) | ||||||||
BHP Billiton PLC | 213,200 | 6,908,379 | ||||||
Telecommunication Services (2.0%) | ||||||||
Vodafone Group PLC | 1,452,272 | 5,491,779 | ||||||
Utilities (1.5%) | ||||||||
Centrica PLC | 729,800 | 4,066,603 | ||||||
| 61,162,965 | ||||||||
Total Common Stocks | 227,703,695 | |||||||
PREFERRED STOCKS (10.6%) | ||||||||
BRAZIL (6.8%) | ||||||||
Energy (1.6%) | ||||||||
Petroleo Brasileiro SA, ADR, Preferred Shares | 288,300 | 4,266,840 | ||||||
Financials (2.9%) | ||||||||
Banco Bradesco SA, ADR, Preferred Shares | 545,200 | 8,107,124 | ||||||
Materials (2.3%) | ||||||||
Vale SA, ADR, Preferred Shares | 537,400 | 6,378,938 | ||||||
| 18,752,902 | ||||||||
REPUBLIC OF SOUTH KOREA (3.8%) | ||||||||
Information Technology (3.8%) | ||||||||
Samsung Electronics Co. Ltd., Preferred Shares | 10,400 | 10,437,241 | ||||||
Total Preferred Stocks | 29,190,143 | |||||||
REPURCHASE AGREEMENT (4.7%) | ||||||||
UNITED STATES (4.7%) | ||||||||
Fixed Income Clearing Corp., 0.00%, dated 04/30/2014, due 05/01/2014, repurchase price $13,018,077, collateralized by a Federal Home Loan Bank, maturing 09/28/2016; total market value of $13,282,769 | $ | 13,018,077 | 13,018,077 | |||||
Total Repurchase Agreement | 13,018,077 | |||||||
Total Investments (Cost $258,951,789) (a)—98.2% | 269,911,915 | |||||||
Other assets in excess of liabilities—1.8% |
| 4,958,917 | ||||||
Net Assets—100.0% | $ | 274,870,832 | ||||||
| * | Non-income producing security. |
| (a) | See notes to financial statements for tax unrealized appreciation/depreciation of securities. |
| ADR | American Depositary Receipt |
See accompanying notes to financial statements.
Semi-Annual Report 2014
18
Table of Contents
Aberdeen Total Return Bond Fund (Unaudited)
The Aberdeen Total Return Bond Fund (Class A shares at net asset value net of fees) returned 1.92% for the six-month period ended April 30, 2014, versus the 1.74% return of its benchmark, the Barclays U.S. Aggregate Bond Index, for the same period. For broader comparison, the average return of the Fund’s Lipper peer category of Core Bond Funds (consisting of 536 funds) was 2.07% for the period.
The U.S. investment-grade fixed income market, as measured by the Barclays U.S. Aggregate Bond Index, produced positive returns over the reporting period. Spreads tightened across all spread sectors which helped to offset some of the negative drag from slightly higher rates. Interest rates generally tracked investor expectations concerning the tapering of the Federal Reserve’s (Fed) quantitative easing program. In December 2013, the Fed began to reduce its purchases of U.S. Treasury and agency mortgage-backed securities by $10 billion ($5 billion each). The market’s initial reaction was to ratchet rates higher in late 2013. However, once investors began to assess the predictability and impact of the taper approach, rate volatility subsided. By the end of the reporting period, rates were modestly higher compared to their levels on October 31, 2013 for all maturities of the U.S. Treasury yield curve, with the exception of the 30-year bond, which was incrementally lower. The 10- and 30-year Treasury yields stood at 2.65% and 3.46%, respectively, at April 30, 2014. At the end of the reporting period, all of the yields along the curve were substantially higher than their levels 12 months earlier. Corporate balance sheets and income statements remain strong. There was continued strength in the U.S. housing market, although the pricing growth curve moderated over the reporting period.
Fund performance for the reporting period was bolstered by overall positioning in the U.S. market, particularly overweights relative to the benchmark Barclays U.S. Aggregate Bond Index in investment-grade corporate bonds, non-agency mortgages and commercial mortgaged-backed securities (CMBS). These sectors performed well as credit spreads tightened relative to their respective comparable-duration U.S. Treasury counterparts during the period. The Fund’s duration underweight relative to the benchmark in the U.S. also contributed to performance. More importantly, in our opinion, the underweight in the U.S. is in the part of the yield curve that historically will underperform in a rising rate environment: the “belly” of the yield curve.
The most notable detractor from Fund performance for the period was our currency-hedged bond position in Brazil. The foreign government bond positioning in countries such as Mexico and Brazil also experienced some underperformance as yields moved wider relative to comparable-duration U.S. Treasuries over the period.
Regarding the use of derivatives during the reporting period, we used Treasury futures to manage the Fund’s overall curve and interest rate exposure, and we employed currency forwards to hedge some of the Fund’s foreign exchange holdings. While the Fund used derivatives during the six months ended April 30, 2014, they had minimal impact on performance.
During the reporting period, we reduced the Fund’s positions in non-dollar assets and CMBS. We increased the exposure to U.S. Treasuries and Treasury Inflation-Protected Securities. At the end of the period on April 30, 2014, the Fund was most overweight relative to the benchmark the Barclays U.S. Aggregate Bond Index in ABS, CMBS and non-agency mortgages. Additionally, there was a sizeable position in non-dollar assets, which are not represented in the Barclays U.S. Aggregate Bond Index. Conversely, the most notable underweights included U.S. Treasuries and agency mortgage-backed securities. Our view is that rates should drift upward as the Fed continues on its path of reducing bond purchases. We believe that slowly removing the largest buyer of both U.S. Treasuries and mortgages should be the main catalyst for higher rates – a more likely scenario than the robust recovery that will force rates higher.1
The most recent economic data continue to point to a mixed picture for the U.S. economy but one that seems to be improving…a little bit. At times it exhibits some real progress, while at other times the data continue to show some real weakness that we believe may point to structural issues this recovery is experiencing as a result of the credit crisis. These include the retirement of the “Baby Boomers,” women dropping out of the labor force, too much debt, and underemployment. Even if we get a rebound in gross domestic product (GDP) growth to 4% in the second quarter of 2014, as some optimistic economists suggest, that still means that growth in the first six months of 2014 will be only 2%.1 In our view, this still appears to be a subpar recovery since the first quarter of 2009. Nonetheless, we believe that global economic growth may pick up in the second half of 2014, and volatility may potentially increase from policy uncertainty.1
Despite the fact that we believe the U.S. economy feels like it is improving, there does appear to be a disconnect between what the equity market and the bond market are telling us. We think that something has to give. Either the bond market is right with 10-year U.S. Treasury yields at 2.6% and yields will stay low and possibly move lower, or the equity market at new highs are right, and growth will accelerate as we move through the summer months and into year–end, in our opinion. We think that this conundrum may be resolved in the next few months as more data are released and we move through earnings season. We continue to favor spread sectors in the current market environment.
Portfolio Management:
Donald Quigley, CFA
PAST PERFORMANCE DOES NOT GUARANTEE FUTURE RESULTS.
The performance quoted represents past performance, which does not guarantee future results. Class A shares have up to a 0.25% 12b-1 fee. The investment return and principal value of an investment will fluctuate so that an investor’s shares, when redeemed, may be worth more or less than their original cost. Current performance of the Fund may be lower or higher than the performance quoted. Performance data current to the most recent month-end may be obtained by calling 800-387-6977 or visiting www.aberdeen-asset.us.
| 1 | Forecasts and estimates are offered as opinion and are not reflective of potential performance, are not guaranteed and actual events or results may differ materially. |
2014 Semi-Annual Report
19
Table of Contents
Aberdeen Total Return Bond Fund (Unaudited) (concluded)
Total returns assume the reinvestment of all distributions. Investment performance reflects fee waivers and, in the absence of such waivers, returns would have been lower. Indexes are unmanaged and have been provided for comparison purposes only. No fees or expenses are reflected. You cannot invest directly in an index.
Lipper is a leading global provider of mutual fund information and analysis to fund companies, financial intermediaries and media organizations.
Risk Considerations
Investing in mutual funds involves risk, including possible loss of principal. There is no assurance that the investment objective of any fund will be achieved.
Fixed income securities are subject to certain risks including, but not limited to: interest rate (changes in interest rates may cause a decline in the market value of an investment), credit (changes in the financial condition of the issuer, borrower, counterparty, or underlying collateral), prepayment (debt issuers may repay or refinance their loans or obligations earlier than anticipated), and extension (principal repayments may not occur as quickly as anticipated, causing the expected maturity of a security to increase).
Investments in asset-backed and mortgage-backed securities include additional risks of which investors should be aware including those associated with fixed income securities, as well as increased susceptibility to adverse economic developments.
Derivatives are speculative and may hurt the Fund’s performance. They present the risk of disproportionately increased losses and/or reduced gains when the financial asset or measure to which the derivative is linked changes in unexpected ways.
Foreign securities are more volatile, harder to price and less liquid than U.S. securities and are subject to different accounting and regulatory standards, and political and economic risks. These risks are enhanced in emerging markets countries.
Municipal securities can be affected by adverse tax, legislative or political changes and the financial condition of the issuers of municipal securities.
Please read the prospectus for more detailed information regarding these and other risks.
Semi-Annual Report 2014
20
Table of Contents
Aberdeen Total Return Bond Fund (Unaudited)
Average Annual Total Return (For periods ended April 30, 2014) | Six Month† | 1 Yr. | 5 Yr. | 10 Yr. | ||||||||||
Class A | 1.92% | -1.71% | 5.99% | 5.33% | ||||||||||
Institutional Class1 | 2.07% | -1.45% | 6.27% | 5.61% | ||||||||||
| † | Not Annualized |
| 1 | Formerly Class I. |
2014 Semi-Annual Report
21
Table of Contents
Aberdeen Total Return Bond Fund (Unaudited)
Performance of a $10,000 Investment (as of April 30, 2014)
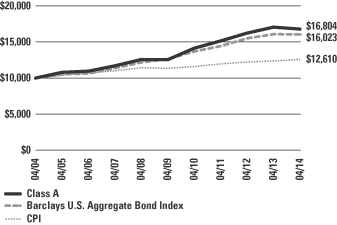
Comparative performance of $10,000 invested in Class A shares of the Aberdeen Total Return Bond Fund, Barclays U.S. Aggregate Bond Index and the Consumer Price Index (CPI) over a 10-year period ended April 30, 2014. Unlike the Fund, the returns for these unmanaged indexes do not reflect any fees or expenses. Investors cannot invest directly in market indexes.
The Barclays U.S. Aggregate Bond Index is a broad-based flagship benchmark that measures the investment grade, U.S. Dollar-denominated, fixed-rate taxable bond market. The index includes Treasuries, government-related and corporate securities, MBS (agency fixed-rate and hybrid ARM pass-throughs), ABS and CMBS (agency and non-agency).
The CPI represents changes in prices of all goods and services purchased for consumption by urban households.
Investment return and principal value will fluctuate, and when redeemed, shares may be worth more or less than original cost. Past performance is no guarantee of future results. The Average Annual Total Return table and performance graph do not reflect the deduction of taxes that a shareholder would pay on Fund distributions or the redemption of Fund shares. Investing in mutual funds involves market risk, including loss of principal. Performance returns assume the reinvestment of all distributions. Performance returns reflect fee waivers and reimbursements in effect without which returns would have been lower.
Portfolio Summary (as a percentage of net assets)
April 30, 2014 (Unaudited)
| Asset Allocation | ||||
Corporate Bonds | 28.2% | |||
Commercial Mortgage-Backed Securities | 19.8% | |||
U.S. Agencies | 13.5% | |||
Government Bonds | 13.0% | |||
U.S. Treasuries | 9.6% | |||
Asset-Backed Securities | 9.0% | |||
Repurchase Agreement | 4.6% | |||
Municipal Bonds | 3.6% | |||
Government Agencies | 0.2% | |||
Liabilities in excess of other assets | (1.5% | ) | ||
| 100.0% | ||||
The following chart summarizes the composition of the Fund’s portfolio, in Bloomberg Industry Classification System (BICS) sectors, expressed as a percentage of net assets. The industries listed below may include more than one industry group. As of April 30, 2014, the Fund did not have more than 25% of its assets invested in any single industry group.
| Top Industries | ||||
Commercial Banks | 6.9% | |||
Aerospace & Defense | 2.3% | |||
Diversified Financial Services | 1.9% | |||
Oil, Gas & Consumable Fuels | 1.8% | |||
Beverages | 1.8% | |||
Electric Utilities | 1.5% | |||
Advertising | 1.4% | |||
Diversified Telecommunication Services | 1.0% | |||
Pharmaceutical | 0.9% | |||
Computers & Peripherals | 0.9% | |||
Other | 79.6% | |||
| 100.0% | ||||
| Top Holdings* | ||||
Brazil Notas do Tesouro Nacional, Serie F 01/01/2017 | 2.8% | |||
Mexico Fixed Rate Bonds, Series M20 12/05/2024 | 2.0% | |||
Federal National Mortgage Association, TBA 05/01/2044 | 1.5% | |||
U.S. Treasury Notes 05/15/2015 | 1.5% | |||
Australia Government Bond 03/15/2019 | 1.4% | |||
Mexican Bonos 05/29/2031 | 1.4% | |||
U.S. Treasury Bonds 11/15/2043 | 1.3% | |||
U.S. Treasury Notes 03/31/2019 | 1.3% | |||
Brazil Letras do Tesouro Nacional 01/01/2017 | 1.1% | |||
Federal National Mortgage Association 03/01/2044 | 1.1% | |||
Other | 84.6% | |||
| 100.0% | ||||
| Top Countries | ||||
United States | 76.7% | |||
Brazil | 4.5% | |||
Mexico | 3.6% | |||
Australia | 2.5% | |||
Canada | 2.5% | |||
Netherlands | 1.9% | |||
United Kingdom | 1.8% | |||
Sweden | 1.7% | |||
Norway | 1.1% | |||
France | 1.1% | |||
Other | 2.6% | |||
| 100.0% | ||||
| * | For the purpose of listing top holdings, repurchase agreements included as part of “Other” holdings. |
2014 Semi-Annual Report
22
Table of Contents
Statement of Investments
April 30, 2014 (Unaudited)
Aberdeen Total Return Bond Fund
Shares or Principal | Value | |||||||
ASSET-BACKED SECURITIES (9.0%) | ||||||||
CANADA (1.0%) | ||||||||
Ford Auto Securitization Trust, Series 2014-R2, Class A1 (CAD), 1.35%, 03/15/2016 | $ | 2,366,466 | $ | 2,160,598 | ||||
Golden Credit Card Trust, Series 2012-5A, Class A (USD), 0.79%, 09/15/2017 (a) | 7,470,000 | 7,485,623 | ||||||
Master Credit Card Trust II, Series 2012-2A, Class A (USD), 0.78%, 04/21/2017 (a) | 5,690,000 | 5,702,797 | ||||||
| 15,349,018 | ||||||||
UNITED STATES (8.0%) | ||||||||
Ally Auto Receivables Trust, Series 2011-4, Class A3 (USD), 0.79%, 09/15/2015 | 223,620 | 223,688 | ||||||
Ally Master Owner Trust | ||||||||
Series 2011-3, Class A1 (USD), 0.79%, 05/15/2016 | 3,830,000 | 3,830,747 | ||||||
Series 2012-1, Class A2 (USD), 1.44%, 02/15/2017 | 4,160,000 | 4,189,076 | ||||||
BMW Floorplan Master Owner Trust, Series 2012-1A, Class A (USD), 0.56%, 09/15/2017 (a)(b) | 6,170,000 | 6,192,156 | ||||||
Chase Issuance Trust, Series 2013-A2, Class A2 (USD), 0.26%, 02/15/2017 (b) | 6,240,000 | 6,239,314 | ||||||
Chesapeake Funding LLC, Series 2013-1A, Class A (USD), 0.61%, 01/07/2025 (a)(b) | 3,510,000 | 3,515,348 | ||||||
Citibank Credit Card Issuance Trust | ||||||||
Series 2002-A4, Class A4 (USD), 0.41%, 06/07/2016 (b) | 2,770,000 | 2,770,362 | ||||||
Series 2005-A2, Class A2 (USD), 4.85%, 03/10/2017 | 2,800,000 | 2,907,803 | ||||||
CNH Equipment Trust | ||||||||
Series 2012-A, Class A3 (USD), 0.94%, 05/15/2017 | 1,141,560 | 1,144,814 | ||||||
Series 2013-A, Class A2 (USD), 0.44%, 07/15/2016 | 1,239,145 | 1,239,376 | ||||||
Series 2013-A, Class A3 (USD), 0.69%, 06/15/2018 | 2,595,000 | 2,600,784 | ||||||
Discover Card Execution Note Trust, Series 2012-A1, Class A1 (USD), 0.81%, 08/15/2017 | 6,630,000 | 6,655,048 | ||||||
Dryrock Issuance Trust, Series 2012-2, Class A (USD), 0.64%, 08/15/2018 | 4,890,000 | 4,889,756 | ||||||
Ford Credit Auto Owner Trust, Series 2013-C, Class A2 (USD), 0.55%, 04/15/2016 | 2,495,859 | 2,498,148 | ||||||
Ford Credit Floorplan Master Owner Trust, Series 2010-3, Class A1 (USD), 4.20%, 02/15/2017 (a) | 8,140,000 | 8,381,388 | ||||||
GE Capital Credit Card Master Note Trust, Series 2012-1, Class A (USD), 1.03%, 01/15/2018 | 4,765,000 | 4,782,907 | ||||||
GE Dealer Floorplan Master Note Trust | ||||||||
Series 2012-4, Class A (USD), 0.60%, 10/20/2017 (b) | 3,810,000 | 3,820,466 | ||||||
Series 2013-1, Class A (USD), 0.56%, 04/20/2018 (b) | 3,180,000 | 3,190,381 | ||||||
GE Equipment Transportation LLC | ||||||||
Series 2012-1, Class A3 (USD), 0.99%, 11/23/2015 | 677,388 | 678,553 | ||||||
Series 2012-2, Class A2 (USD), 0.47%, 04/24/2015 | 42,093 | 42,093 | ||||||
Honda Auto Receivables Owner Trust, Series 2012-4, Class A2 (USD), 0.40%, 04/20/2015 | 1,237,607 | 1,237,763 | ||||||
Mercedes-Benz Master Owner Trust, Series 2012-BA, Class A (USD), 0.43%, 11/15/2016 (a)(b) | 4,620,000 | 4,621,811 | ||||||
Navistar Financial Dealer Note Master Trust | ||||||||
Series 2013-1, Class A (USD), 0.83%, 01/25/2018 | 3,910,000 | 3,911,318 | ||||||
Series 2013-2, Class A (USD), 0.84%, 09/25/2018 (a)(b) | 4,170,000 | 4,185,012 | ||||||
Nissan Auto Lease Trust, Series 2012-A, Class A3 (USD), 0.98%, 05/15/2015 | 1,795,904 | 1,796,860 | ||||||
Nissan Auto Receivables Owner Trust | ||||||||
Series 2013-B, Class A2 (USD), 0.52%, 04/15/2016 | 2,842,489 | 2,844,598 | ||||||
Series 2013-B, Class A3 (USD), 0.84%, 11/15/2017 | 2,400,000 | 2,412,505 | ||||||
SLM Student Loan Trust | ||||||||
Series 2011-1, Class A1 (USD), 0.68%, 03/25/2026 (b) | 2,407,547 | 2,415,879 | ||||||
Series 2011-2, Class A1 (USD), 0.76%, 11/25/2027 (b) | 5,959,847 | 6,013,080 | ||||||
Series 2013-1, Class A1 (USD), 0.31%, 02/27/2017 (b) | 1,332,529 | 1,332,072 | ||||||
Series 2013-2, Class A (USD), 0.61%, 09/25/2026 (b) | 3,794,430 | 3,809,452 | ||||||
United States Small Business Administration | ||||||||
Series 2005-P10B, Class 1 (USD), 4.94%, 08/10/2015 | 944,887 | 980,991 | ||||||
Series 2006-P10A, Class 1 (USD), 5.41%, 02/10/2016 | 44,754 | 46,514 | ||||||
Series 2007-P10A, Class 1 (USD), 5.46%, 02/10/2017 | 1,156,168 | 1,243,386 | ||||||
Volkswagen Auto Lease Trust, Series 2013-A, Class A3 (USD), 0.84%, 07/20/2016 | 3,620,000 | 3,635,588 | ||||||
Volkswagen Auto Loan Enhanced Trust | ||||||||
Series 2012-2, Class A2 (USD), 0.33%, 07/20/2015 | 736,803 | 736,853 | ||||||
Series 2014-1, Class A2 (USD), 0.42%, 03/20/2017 | 6,140,000 | 6,139,891 | ||||||
Volvo Financial Equipment LLC, Series 2013-1A, Class A3 (USD), 0.74%, 03/15/2017 (a) | 5,845,000 | 5,858,712 | ||||||
| 123,014,493 | ||||||||
Total Asset-Backed Securities | 138,363,511 | |||||||
COMMERCIAL MORTGAGE-BACKED SECURITIES (19.8%) | ||||||||
UNITED STATES (19.8%) | ||||||||
Alternative Loan Trust | ||||||||
Series 2004-2CB, Class 1A2 (USD), 5.13%, 03/25/2034 | 591,593 | 595,104 | ||||||
Series 2004-28CB, Class 3A1 (USD), 6.00%, 01/25/2035 | 3,982,893 | 3,929,385 | ||||||
Series 2005-86CB, Class A8 (USD), 5.50%, 02/25/2036 | 3,357,323 | 3,141,427 | ||||||
See accompanying notes to financial statements.
2014 Semi-Annual Report
23
Table of Contents
Statement of Investments (continued)
April 30, 2014 (Unaudited)
Aberdeen Total Return Bond Fund
Shares or Principal | Value | |||||||
Banc of America Commercial Mortgage Trust | ||||||||
Series 2006-4, Class AM (USD), 5.68%, 07/10/2046 | $ | 2,580,000 | $ | 2,823,655 | ||||
Series 2006-5, Class AM (USD), 5.45%, 09/10/2047 | 3,550,000 | 3,812,862 | ||||||
Banc of America Mortgage Trust, Series 2004-7, Class 2A3 (USD), 5.75%, 08/25/2034 | 783,427 | 818,328 | ||||||
Bear Stearns Adjustable Rate Mortgage Trust, Series 2004-3, Class 4A (USD), 4.59%, 07/25/2034 (b) | 1,178,393 | 1,165,463 | ||||||
Bear Stearns Commercial Mortgage Securities Trust, Series 2005-PW10, Class AM (USD), 5.45%, 12/11/2040 (b) | 4,082,000 | 4,339,303 | ||||||
CD Commercial Mortgage Trust, Series 2007-CD4, Class A4 (USD), 5.32%, 12/11/2049 | 4,995,000 | 5,466,483 | ||||||
CHL Mortgage Pass-Through Trust, Series 2005-21, Class A2 (USD), 5.50%, 10/25/2035 | 1,166,452 | 1,173,136 | ||||||
Citigroup Commercial Mortgage Trust | ||||||||
(USD), 2.11%, 01/12/2018 (a) | 2,495,266 | 2,521,601 | ||||||
Series 2013-375P, Class A, (USD), 3.25%, 05/10/2035 | 4,750,000 | 4,674,152 | ||||||
Series 2007-C6, Class AM (USD), 5.71%, 12/10/2049 (b) | 4,150,000 | 4,584,708 | ||||||
Citigroup Mortgage Loan Trust | ||||||||
Series 2014-A, Class A (USD), 4.00%, 01/25/2035 (a)(b) | 5,201,348 | 5,434,192 | ||||||
Series 2005-11, Class A3 (USD), 2.50%, 11/25/2035 (b) | 2,125,312 | 2,102,741 | ||||||
COMM 2013-300P Mortgage Trust, Series 2013-300P, Class A1, (USD), 4.35%, 08/10/2030 (a) | 4,970,000 | 5,304,894 | ||||||
COMM 2014-TWC Mortgage Trust, Series 2014-TWC, Class B (USD), 1.75%, 02/13/2032 (a)(b) | 3,810,000 | 3,817,841 | ||||||
Commercial Mortgage Pass Through Certificates | ||||||||
Series 2006-C4, Class A3 (USD), 5.47%, 09/15/2039 | 5,097,128 | 5,520,826 | ||||||
Series 2013-CR9, Class A1 (USD), 1.34%, 07/10/2045 | 2,786,746 | 2,800,910 | ||||||
Commercial Mortgage Trust | ||||||||
Series 2014-LC15, Class A4 (USD), 4.01%, 04/10/2047 | 6,630,000 | 6,903,332 | ||||||
Series 2007-GG11, Class A4 (USD), 5.74%, 12/10/2049 | 4,255,000 | 4,749,731 | ||||||
Credit Suisse First Boston Mortgage Securities Corp., Series 2004-8, Class 5A1 (USD), 6.00%, 12/25/2034 | 3,791,799 | 3,950,307 | ||||||
Credit Suisse Mortgage Capital Trust | ||||||||
Series 2013-TH1, Class A1 (USD), 2.13%, 02/25/2043 (a)(b) | 3,956,743 | 3,611,106 | ||||||
Series 2013-IVR1, Class A1 (USD), 2.50%, 03/25/2043 (a)(b) | 5,838,532 | 5,327,999 | ||||||
Series 2013-IVR2, Class A1 (USD), 2.50%, 04/25/2043 (a)(b) | 7,826,232 | 7,306,320 | ||||||
Series 2013-IVR3, ClassA1 (USD), 2.50%, 05/25/2043 (a)(b) | 5,961,148 | 5,498,939 | ||||||
Series 2013-6, Class2A1 (USD), 3.50%, 08/25/2043 (a)(b) | 5,740,822 | 5,715,040 | ||||||
CSMC Trust, Series 2013-7, Class A11 (USD), | 12,994,176 | 12,922,462 | ||||||
EverBank Mortgage Loan Trust, Series 2013-2, Class A (USD), 3.00%, 06/25/2043 (a)(b) | 5,617,267 | 5,283,119 | ||||||
FDIC Guaranteed Notes Trust | ||||||||
Series 2010-C1, Class A (USD), | 3,148,618 | 3,276,284 | ||||||
Series 2010-S2, Class 2A (USD), | 3,213,937 | 3,273,483 | ||||||
FDIC Trust, Series 2010-R1, Class A (USD), | 2,713,927 | 2,734,331 | ||||||
GS Mortgage Securites Corp. Trust | ||||||||
Series 2013-NYC5, Class A (USD), | 4,740,000 | 4,780,970 | ||||||
Series 2012-SHOP, Class A (USD), | 6,330,000 | 6,466,649 | ||||||
GS Mortgage Securities Corp. II, Series 2013-KYO, Class A (USD), 1.01%, 11/08/2029 (a)(b) | 6,940,000 | 6,969,752 | ||||||
GSR Mortgage Loan Trust, Series 2005-6F, Class 1A6 (USD), 5.25%, 07/25/2035 | 2,977,118 | 3,093,920 | ||||||
Hilton USA Trust 2013-HLT, Series 2013-HLT, Class CFX, (USD), 3.71%, 11/05/2030 (a) | 6,325,000 | 6,433,825 | ||||||
IndyMac INDA Mortgage Loan Trust | ||||||||
Series 2005-AR2, Class 3A1 (USD), | 3,414,505 | 3,029,731 | ||||||
Series 2006-AR1, Class A1 (USD), 5.21%, 08/25/2036 (b) | 483,275 | 475,854 | ||||||
JP Morgan Chase Commercial Mortgage Securities Corp., Series 2013-C13, Class A1 (USD), 1.30%, 01/15/2046 | 2,562,331 | 2,581,074 | ||||||
JP Morgan Mortgage Trust | ||||||||
Series 2005-A2, Class 3A2 (USD), 2.55%, 04/25/2035 (b) | 2,155,277 | 2,164,704 | ||||||
Series 2005-A5, Class 2A2 (USD), 2.74%, 08/25/2035 (b) | 1,811,268 | 1,814,896 | ||||||
Series 2006-S1, Class 2A6 (USD), 6.00%, 04/25/2036 | 2,878,259 | 3,023,416 | ||||||
Series 2013-1, Class 1A2 (USD), 3.00%, 03/25/2043 | 7,757,943 | 7,316,105 | ||||||
Series 2013-1, Class B1 (USD), 3.56%, 03/25/2043 (a)(b) | 3,168,017 | 3,114,536 | ||||||
Series 2013-2, Class A2 (USD), 3.50%, 05/25/2043 (a)(b) | 4,743,624 | 4,728,317 | ||||||
Series 2013-3, Class A3 (USD), 3.49%, 07/25/2043 | 5,096,767 | 5,063,919 | ||||||
Series 2014-1, Class 2A2 (USD), 3.50%, 01/25/2044 | 7,685,209 | 7,643,010 | ||||||
LB-UBS Commercial Mortgage Trust | ||||||||
Series 2006-C4, Class AM (USD), 5.86%, 06/15/2038 (b) | 3,040,000 | 3,316,290 | ||||||
Series 2007-C7, Class AM (USD), 6.17%, 09/15/2045 (b) | 3,760,000 | 4,297,926 | ||||||
Madison Avenue Trust, Series 2013-650M, Class A (USD), 3.84%, 10/12/2032 | 2,610,000 | 2,753,567 | ||||||
MASTR Adjustable Rate Mortgages Trust, Series 2006-2, Class 4A1 (USD), 2.63%, 02/25/2036 (b) | 1,388,248 | 1,358,480 | ||||||
See accompanying notes to financial statements.
Semi-Annual Report 2014
24
Table of Contents
Statement of Investments (continued)
April 30, 2014 (Unaudited)
Aberdeen Total Return Bond Fund
Shares or Principal | Value | |||||||
MASTR Alternative Loan Trust, Series 2004-3, Class 4A1 (USD), 5.50%, 04/25/2034 | $ | 2,961,654 | $ | 3,184,603 | ||||
Merrill Lynch Mortgage Investors Trust | ||||||||
Series 2006-1, Class 2A1 (USD), 2.14%, 02/25/2036 (b) | 2,527,035 | 2,459,923 | ||||||
Series 2007-2, Class 2A1 (USD), 2.77%, 06/25/2037 (b) | 1,692,890 | 1,629,377 | ||||||
Series 2007-3, Class 2A2 (USD), 2.76%, 09/25/2037 (b) | 1,677,329 | 1,605,845 | ||||||
Morgan Stanley Capital I Trust | ||||||||
Series 2013-WLSR, Class A (USD), 2.70%, 01/11/2032 (a) | 4,590,000 | 4,606,460 | ||||||
Series 2006-IQ12, Class AM (USD), 5.37%, 12/15/2043 | 3,870,000 | 4,215,545 | ||||||
Series 2007-IQ16, Class A4 (USD), 5.81%, 12/12/2049 | 4,130,000 | 4,604,991 | ||||||
NCUA Guaranteed Notes Trust | ||||||||
Series 2010-R2, Class 1A (USD), 0.53%, 11/06/2017 (b) | 3,535,931 | 3,544,341 | ||||||
Series 2010-R3, Class 1A (USD), 0.72%, 12/08/2020 (b) | 5,084,709 | 5,131,989 | ||||||
PHH Mortgage Trust, Series 2008-CIM1, Class 21A1 (USD), 6.00%, 05/25/2038 | 2,870,590 | 3,003,176 | ||||||
Sequoia Mortgage Trust | ||||||||
Series 2013-4, Class A2 (USD), 2.50%, 04/25/2043 (b) | 5,230,557 | 4,791,195 | ||||||
Series 2013-5, Class A1 (USD), 2.50%, 05/25/2043 (a)(b) | 5,893,112 | 5,398,096 | ||||||
Series 2013-6, Class A1 (USD), 2.50%, 05/25/2043 (b) | 5,279,519 | 4,827,629 | ||||||
Series 2013-7, Class A1 (USD), 2.50%, 06/25/2043 (b) | 6,043,466 | 5,535,808 | ||||||
Structured Asset Securities Corp., Series 2004-18H, Class A5 (USD), 4.75%, 10/25/2034 | 4,457,780 | 4,478,099 | ||||||
Thornburg Mortgage Securities Trust | ||||||||
Series 2007-4, Class 2A1 (USD), 6.07%, 09/25/2037 (b) | 3,884,106 | 3,812,566 | ||||||
Series 2007-4, Class 3A1 (USD), 6.09%, 09/25/2037 (b) | 272,963 | 287,506 | ||||||
Wachovia Bank Commercial Mortgage Trust, Series 2006-C28, Class AM (USD), 5.60%, 10/15/2048 (b) | 5,325,000 | 5,804,032 | ||||||
WaMu Mortgage Pass Through Certificates | ||||||||
Series 2005-AR5, Class A5 (USD), 2.40%, 05/25/2035 (b) | 1,308,019 | 1,309,413 | ||||||
Series 2005-AR7, Class A3 (USD), 2.41%, 08/25/2035 (b) | 4,680,000 | 4,543,594 | ||||||
Wells Fargo Commercial Mortgage Trust, Series 2010-C1, Class A2 (USD), | 3,100,000 | 3,373,305 | ||||||
Wells Fargo Mortgage Backed Securities Trust | ||||||||
Series 2005-AR13, Class 4A1 (USD), | 3,378,456 | 3,434,419 | ||||||
Series 2006-5, Class 1A5 (USD), | 3,524,354 | 3,649,650 | ||||||
Series 2006-10, Class A4 (USD), | 1,697,565 | 1,803,375 | ||||||
Series 2006-19, Class A4 (USD), | 1,039,760 | 1,046,009 | ||||||
Series 2007-12, Class A13 (USD), | 53,004 | 53,109 | ||||||
| 303,140,460 | ||||||||
Total Commercial Mortgage-Backed Securities | 303,140,460 | |||||||
CORPORATE BONDS (28.2%) | ||||||||
BRAZIL (0.6%) | ||||||||
Aerospace & Defense (0.1%) | ||||||||
Embraer SA (USD), 5.15%, 06/15/2022 | 740,000 | 782,550 | ||||||
Oil, Gas & Consumable Fuels (0.5%) | ||||||||
Petrobras International Finance Co. (USD), | 7,373,000 | 8,003,244 | ||||||
| 8,785,794 | ||||||||
CANADA (0.5%) | ||||||||
Commercial Banks (0.3%) | ||||||||
National Bank of Canada (USD), GMTN, | 3,860,000 | 3,827,487 | ||||||
Oil, Gas & Consumable Fuels (0.2%) | ||||||||
CNOOC Nexen Finance 2014 ULC (USD), | 3,510,000 | 3,517,715 | ||||||
| 7,345,202 | ||||||||
FRANCE (1.1%) | ||||||||
Apparel (0.5%) | ||||||||
LVMH Moet Hennessy Louis Vuitton SA (USD), 1.63%, 06/29/2017 (a) | 6,650,000 | 6,720,876 | ||||||
Beverages (0.6%) | ||||||||
Pernod-Ricard SA (USD), | 9,080,000 | 9,467,216 | ||||||
| 16,188,092 | ||||||||
GERMANY (0.2%) | ||||||||
Commercial Banks (0.2%) | ||||||||
Norddeutsche Landesbank Girozentrale (USD), 0.88%, 10/16/2015 (a) | 3,780,000 | 3,799,584 | ||||||
HONG KONG (0.4%) | ||||||||
Holding Companies-Diversified Operations (0.4%) |
| |||||||
Hutchison Whampoa International 11 Ltd. (USD), 3.50%, 01/13/2017 (a) | 5,710,000 | 6,015,045 | ||||||
ITALY (0.6%) | ||||||||
Commercial Banks (0.6%) | ||||||||
Intesa Sanpaolo SpA (USD), 3.13%, 01/15/2016 | 9,340,000 | 9,614,577 | ||||||
NETHERLANDS (1.9%) | ||||||||
Beverages (0.4%) | ||||||||
Diageo Finance BV (USD), 3.25%, 01/15/2015 | 6,300,000 | 6,430,057 | ||||||
Commercial Banks (0.4%) | ||||||||
ABN AMRO Bank (USD), | 5,550,000 | 5,593,068 | ||||||
See accompanying notes to financial statements.
2014 Semi-Annual Report
25
Table of Contents
Statement of Investments (continued)
April 30, 2014 (Unaudited)
Aberdeen Total Return Bond Fund
Shares or Principal | Value | |||||||
Electric Utilities (0.5%) | ||||||||
Enel Finance International (USD), 6.00%, 10/07/2039 (a) | $ | 6,870,000 | $ | 7,433,745 | ||||
Oil, Gas & Consumable Fuels (0.6%) | ||||||||
Shell International Finance BV (USD), 3.40%, 08/12/2023 | 9,772,000 | 9,878,232 | ||||||
| 29,335,102 | ||||||||
NORWAY (0.6%) | ||||||||
Commercial Banks (0.6%) | ||||||||
DNB Bank ASA (USD), 3.20%, 04/03/2017 (a) | 8,220,000 | 8,657,255 | ||||||
PANAMA (0.3%) | ||||||||
Leisure Time (0.3%) | ||||||||
Carnival Corp. (USD), 3.95%, 10/15/2020 | 5,220,000 | 5,413,714 | ||||||
REPUBLIC OF IRELAND (0.4%) | ||||||||
Electric Utilities (0.4%) | ||||||||
Iberdrola Finance Ltd. (USD), 5.00%, 09/11/2019 (a) | 5,690,000 | 6,313,636 | ||||||
SUPRANATIONAL (0.5%) | ||||||||
Banks (0.5%) | ||||||||
International Bank for Reconstruction & Development, Series GDIF (AUD), MTN, 3.50%, 04/29/2019 | 8,110,000 | 7,456,190 | ||||||
SWEDEN (0.9%) | ||||||||
Commercial Banks (0.9%) | ||||||||
Nordea Bank AB (USD), 3.13%, 03/20/2017 (a) | 7,040,000 | 7,409,353 | ||||||
Svenska Handelsbanken AB (USD), 2.50%, 01/25/2019 | 5,570,000 | 5,660,613 | ||||||
| 13,069,966 | ||||||||
SWITZERLAND (0.8%) | ||||||||
Diversified Financial Services (0.8%) | ||||||||
Credit Suisse AG (USD), 1.63%, 03/06/2015 (a) | 12,870,000 | 13,009,009 | ||||||
UNITED KINGDOM (1.8%) | ||||||||
Advertising (0.9%) | ||||||||
WPP Finance 2010 | ||||||||
(USD), 4.75%, 11/21/2021 | 9,345,000 | 10,150,492 | ||||||
(USD), 5.63%, 11/15/2043 | 3,490,000 | 3,776,034 | ||||||
| 13,926,526 | ||||||||
Aerospace & Defense (0.5%) | ||||||||
BAE Systems PLC (USD), 4.75%, 10/11/2021 (a) | 6,852,000 | 7,397,597 | ||||||
Commercial Banks (0.3%) | ||||||||
HSBC Holdings PLC (USD), 5.25%, 03/14/2044 | 2,000,000 | 2,056,288 | ||||||
Standard Chartered PLC (USD), 5.70%, 03/26/2044 (a) | 3,020,000 | 3,048,476 | ||||||
| 5,104,764 | ||||||||
Oil, Gas & Consumable Fuels (0.1%) | ||||||||
BP Capital Markets PLC (USD), 1.70%, 12/05/2014 | 1,220,000 | 1,230,164 | ||||||
| 27,659,051 | ||||||||
UNITED STATES (17.6%) | ||||||||
Advertising (0.5%) | ||||||||
Omnicom Group, Inc. (USD), 6.25%, 07/15/2019 | 6,198,000 | 7,288,451 | ||||||
Aerospace & Defense (1.7%) | ||||||||
Boeing Co. (The) | ||||||||
(USD), 3.50%, 02/15/2015 | 12,524,000 | 12,833,756 | ||||||
(USD), 7.95%, 08/15/2024 | 6,559,000 | 9,133,965 | ||||||
United Technologies Corp. (USD), 8.75%, 03/01/2021 | 2,700,000 | 3,613,118 | ||||||
| 25,580,839 | ||||||||
Beverages (0.8%) | ||||||||
Anheuser-Busch InBev Worldwide, Inc. (USD), 2.50%, 07/15/2022 | 7,760,000 | 7,374,918 | ||||||
PepsiCo, Inc. (USD), 0.75%, 03/05/2015 | 4,948,530 | 4,968,977 | ||||||
| 12,343,895 | ||||||||
Biotechnology (0.5%) | ||||||||
Gilead Sciences, Inc. | ||||||||
(USD), 2.40%, 12/01/2014 | 4,745,000 | 4,799,093 | ||||||
(USD), 4.80%, 04/01/2044 | 2,320,000 | 2,449,992 | ||||||
| 7,249,085 | ||||||||
Chemicals (0.5%) | ||||||||
Dow Chemical Co. (The) (USD), 4.38%, 11/15/2042 | 2,770,000 | 2,626,952 | �� | |||||
FMC Corp. (USD), 4.10%, 02/01/2024 | 4,860,000 | 5,028,987 | ||||||
| 7,655,939 | ||||||||
Commercial Banks (3.6%) | ||||||||
Bank of America Corp. | ||||||||
(USD), 2.60%, 01/15/2019 | 9,540,000 | 9,600,531 | ||||||
(USD), MTN, 5.00%, 01/21/2044 | 5,140,000 | 5,338,348 | ||||||
(USD), MTN, 4.88%, 04/01/2044 | 710,000 | 724,558 | ||||||
Citigroup, Inc. (USD), 2.50%, 09/26/2018 | 11,050,000 | 11,180,677 | ||||||
Goldman Sachs Group, Inc. (The) | ||||||||
(USD), 2.90%, 07/19/2018 | 4,740,000 | 4,856,040 | ||||||
(USD), 4.00%, 03/03/2024 | 4,380,000 | 4,403,639 | ||||||
JPMorgan Chase & Co. | ||||||||
(USD), 2.00%, 08/15/2017 | 6,680,000 | 6,784,549 | ||||||
(USD), 4.35%, 08/15/2021 | 4,630,000 | 4,990,922 | ||||||
Morgan Stanley (USD), GMTN, 5.55%, 04/27/2017 | 6,050,000 | 6,757,469 | ||||||
| 54,636,733 | ||||||||
Computers & Peripherals (0.9%) | ||||||||
Hewlett-Packard Co. (USD), 2.63%, 12/09/2014 | 3,403,000 | 3,443,550 | ||||||
International Business Machines Corp. | ||||||||
(USD), 7.00%, 10/30/2025 | 3,610,000 | 4,727,338 | ||||||
(USD), 6.22%, 08/01/2027 | 4,306,000 | 5,380,550 | ||||||
| 13,551,438 | ||||||||
Diversified Financial Services (1.1%) | ||||||||
BlackRock, Inc. (USD), 3.50%, 12/10/2014 | 7,422,000 | 7,569,237 | ||||||
See accompanying notes to financial statements.
Semi-Annual Report 2014
26
Table of Contents
Statement of Investments (continued)
April 30, 2014 (Unaudited)
Aberdeen Total Return Bond Fund
Shares or Principal | Value | |||||||
Harley-Davidson Financial Services, Inc. (USD), MTN, 3.88%, 03/15/2016 (a) | $ | 5,260,000 | $ | 5,540,784 | ||||
Legg Mason, Inc. (USD), 5.63%, 01/15/2044 | 3,640,000 | 3,852,962 | ||||||
| 16,962,983 | ||||||||
Diversified Telecommunication Services (1.0%) |
| |||||||
Juniper Networks, Inc. (USD), 4.50%, 03/15/2024 | 2,060,000 | 2,118,951 | ||||||
Verizon Communications, Inc. (USD), 6.40%, 09/15/2033 | 10,530,000 | 12,734,603 | ||||||
| 14,853,554 | ||||||||
Electric Utilities (0.6%) | ||||||||
Edison International (USD), 3.75%, 09/15/2017 | 6,715,000 | 7,167,638 | ||||||
Public Service Electric & Gas Co., Series G, (USD), MTN, 0.85%, 08/15/2014 | 1,555,000 | 1,557,614 | ||||||
| 8,725,252 | ||||||||
Electronics (0.3%) | ||||||||
Thermo Fisher Scientific, Inc. (USD), 3.25%, 11/20/2014 | 4,740,000 | 4,815,276 | ||||||
Energy Equipment & Services (0.6%) | ||||||||
Energy Transfer Partners LP (USD), 4.15%, 10/01/2020 | 8,348,000 | 8,732,901 | ||||||
Food & Staples (0.2%) | ||||||||
CVS Caremark Corp. (USD), 5.75%, 05/15/2041 | 3,051,000 | 3,635,459 | ||||||
Gas Utilities (0.6%) | ||||||||
Sempra Energy (USD), 9.80%, 02/15/2019 | 6,687,000 | 8,894,954 | ||||||
Healthcare Providers & Services (0.3%) | ||||||||
WellPoint, Inc. (USD), 5.10%, 01/15/2044 | 4,650,000 | 4,980,308 | ||||||
Insurance (0.8%) | ||||||||
American International Group, Inc. (USD), 4.13%, 02/15/2024 | 4,770,000 | 5,001,660 | ||||||
Berkshire Hathaway, Inc. (USD), 4.50%, 02/11/2043 | 2,720,000 | 2,748,108 | ||||||
Metropolitan Life Global Funding I (USD), 2.50%, 09/29/2015 (a) | 4,600,000 | 4,728,621 | ||||||
| 12,478,389 | ||||||||
Media (0.8%) | ||||||||
21st Century Fox America, Inc. | ||||||||
(USD), 8.88%, 04/26/2023 | 845,000 | 1,133,874 | ||||||
(USD), 7.75%, 01/20/2024 | 530,000 | 668,876 | ||||||
(USD), 8.50%, 02/23/2025 | 350,000 | 461,854 | ||||||
(USD), 7.43%, 10/01/2026 | 3,902,000 | 4,927,180 | ||||||
NBCUniversal Media LLC (USD), 3.65%, 04/30/2015 | 1,275,000 | 1,316,341 | ||||||
Time Warner Cos., Inc. (USD), 7.57%, 02/01/2024 | 1,770,000 | 2,265,049 | ||||||
Viacom, Inc. (USD), 5.25%, 04/01/2044 | 1,710,000 | 1,795,490 | ||||||
| 12,568,664 | ||||||||
Metals & Mining (0.2%) | ||||||||
Freeport-McMoRan Copper & Gold, Inc. (USD), 3.55%, 03/01/2022 | 3,360,000 | 3,254,170 | ||||||
Miscellaneous Manufacturing (0.4%) | ||||||||
Ingersoll-Rand Global Holding Co. Ltd. (USD), 5.75%, 06/15/2043 (a) | 2,430,000 | 2,779,155 | ||||||
Pentair Finance SA (USD), 1.88%, 09/15/2017 | 4,260,000 | 4,303,950 | ||||||
| 7,083,105 | ||||||||
Oil, Gas & Consumable Fuels (0.4%) | ||||||||
Noble Energy, Inc. (USD), 5.25%, 11/15/2043 | 5,210,000 | 5,686,387 | ||||||
Pharmaceutical (0.9%) | ||||||||
Bristol-Myers Squibb Co. (USD), 4.50%, 03/01/2044 | 4,990,000 | 5,108,323 | ||||||
Pfizer, Inc. (USD), 5.35%, 03/15/2015 | 4,190,000 | 4,361,916 | ||||||
Wyeth LLC (USD), 6.45%, 02/01/2024 | 3,747,000 | 4,609,593 | ||||||
| 14,079,832 | ||||||||
Software (0.1%) |
| |||||||
Oracle Corp. (USD), 3.75%, 07/08/2014 | 1,315,000 | 1,322,825 | ||||||
Transportation (0.8%) |
| |||||||
Burlington Northern Santa Fe LLC | ||||||||
(USD), 4.40%, 03/15/2042 | 2,570,000 | 2,519,016 | ||||||
(USD), 4.90%, 04/01/2044 | 4,580,000 | 4,888,271 | ||||||
FedEx Corp. (USD), 4.90%, 01/15/2034 | 4,940,000 | 5,238,821 | ||||||
| 12,646,108 | ||||||||
| 269,026,547 | ||||||||
Total Corporate Bonds | 431,688,764 | |||||||
MUNICIPAL BONDS (3.6%) | ||||||||
UNITED STATES (3.6%) | ||||||||
CALIFORNIA (1.2%) | ||||||||
Los Angeles Unified School District General Obligation Unlimited Bonds | ||||||||
(USD), 5.76%, 07/01/2029 | 2,185,000 | 2,607,470 | ||||||
(USD), 6.76%, 07/01/2034 | 2,430,000 | 3,200,213 | ||||||
San Francisco City & County Public Utilities Commission Water, Revenue Bonds (USD), 6.00%, 11/01/2040 | 3,370,000 | 4,132,968 | ||||||
State of California General Obligation Unlimited Bonds | ||||||||
(USD), 7.55%, 04/01/2039 | 4,000,000 | 5,670,160 | ||||||
(USD), 7.35%, 11/01/2039 | 2,195,000 | 3,004,296 | ||||||
| 18,615,107 | ||||||||
CONNECTICUT (0.3%) | ||||||||
State of Connecticut General Obligation Unlimited Bonds, Series A (USD), 5.85%, 03/15/2032 | 4,420,000 | 5,212,992 | ||||||
FLORIDA (0.2%) | ||||||||
Florida Hurricane Catastrophe Fund Finance Corp., Revenue Bonds, Series A (USD), 1.30%, 07/01/2016 | 2,370,000 | 2,400,763 | ||||||
See accompanying notes to financial statements.
2014 Semi-Annual Report
27
Table of Contents
Statement of Investments (continued)
April 30, 2014 (Unaudited)
Aberdeen Total Return Bond Fund
Shares or Principal | Value | |||||||
MASSACHUSETTS (0.5%) | ||||||||
Commonwealth of Massachusetts General Obligation Limited Bonds | ||||||||
Series E (USD), 4.20%, 12/01/2021 | $ | 4,975,000 | $ | 5,380,313 | ||||
(USD), 4.91%, 05/01/2029 | 1,810,000 | 1,993,643 | ||||||
| 7,373,956 | ||||||||
NEW YORK (0.9%) | ||||||||
New York City Municipal Water Finance Authority Revenue Bonds (Build America Bonds) (USD), 5.44%, 06/15/2043 | 5,355,000 | 6,283,557 | ||||||
New York City Transitional Finance Authority Revenue Bonds (Qualified School Construction BD) | ||||||||
(USD), 5.27%, 05/01/2027 | 2,865,000 | 3,310,565 | ||||||
(USD), 5.01%, 08/01/2027 | 3,780,000 | 4,175,879 | ||||||
| 13,770,001 | ||||||||
OREGON (0.5%) | ||||||||
State of Oregon General Obligation Unlimited Bonds (USD), 5.89%, 06/01/2027 | 6,100,000 | 7,379,841 | ||||||
| 54,752,660 | ||||||||
Total Municipal Bonds | 54,752,660 | |||||||
GOVERNMENT BONDS (13.0%) | ||||||||
AUSTRALIA (2.5%) | ||||||||
Australia Government Bond | ||||||||
(AUD), 5.25%, 03/15/2019 | 21,580,000 | 21,782,924 | ||||||
(AUD), 1.25%, 02/21/2022 (a) | 8,801,110 | 8,515,661 | ||||||
New South Wales Treasury Corp. (AUD), 6.00%, 04/01/2019 (c) | 7,400,000 | 7,655,117 | ||||||
| 37,953,702 | ||||||||
BAHAMAS (0.1%) | ||||||||
Commonwealth of the Bahamas (USD), 5.75%, 01/16/2024 (a) | 2,140,000 | 2,213,830 | ||||||
BRAZIL (3.9%) | ||||||||
Brazil Letras do Tesouro Nacional (BRL), 0.00%, 01/01/2017 (d) | 51,874,000 | 17,045,148 | ||||||
Brazil Notas do Tesouro Nacional, Serie F (BRL), 10.00%, 01/01/2017 | 99,852,000 | 42,752,031 | ||||||
| 59,797,179 | ||||||||
CANADA (1.0%) | ||||||||
Province of British Columbia (USD), | 2,080,000 | 2,140,659 | ||||||
Province of Ontario (USD), | 12,630,000 | 12,687,201 | ||||||
| 14,827,860 | ||||||||
MEXICO (3.4%) | ||||||||
Mexican Bonos (MXN), | 259,510,000 | 21,406,404 | ||||||
Mexico Fixed Rate Bonds, Series M20 (MXN), 10.00%, 12/05/2024 | 308,628,400 | 30,465,788 | ||||||
| 51,872,192 | ||||||||
NORWAY (0.5%) | ||||||||
Norway Government Bond (NOK), | 44,970,000 | 7,707,722 | ||||||
QATAR (0.6%) | ||||||||
Qatar Government International Bond (USD), 4.00%, 01/20/2015 (a) | 9,310,000 | 9,549,267 | ||||||
REPUBLIC OF SOUTH KOREA (0.2%) | ||||||||
Korea Housing Finance Corp. (USD), | 3,230,000 | 3,123,171 | ||||||
SWEDEN (0.8%) | ||||||||
Sweden Government International Bond (USD), 1.00%, 06/03/2014 (a) | 12,070,000 | 12,082,698 | ||||||
Total Government Bonds | 199,127,621 | |||||||
GOVERNMENT AGENCIES (0.2%) | ||||||||
MEXICO (0.2%) | ||||||||
Petroleos Mexicanos (USD), | 2,480,000 | 2,721,800 | ||||||
Total Government Agencies | 2,721,800 | |||||||
U.S. AGENCIES (13.5%) | ||||||||
UNITED STATES (13.5%) | ||||||||
Federal Home Loan Mortgage Corp. | ||||||||
(USD), 6.50%, 05/01/2022 | 1,825 | 2,071 | ||||||
(USD), 6.50%, 08/01/2036 | 710,845 | 799,466 | ||||||
(USD), 6.50%, 09/01/2037 | 118,304 | 133,886 | ||||||
(USD), 6.50%, 12/01/2037 | 136,686 | 154,132 | ||||||
(USD), 6.50%, 05/01/2038 | 2,624,542 | 2,979,151 | ||||||
(USD), 6.50%, 09/01/2038 | 192,240 | 216,251 | ||||||
(USD), 6.50%, 10/01/2038 | 1,870,530 | 2,105,367 | ||||||
(USD), 6.50%, 10/01/2038 | 20,962 | 23,634 | ||||||
(USD), 6.50%, 11/01/2038 | 1,049,009 | 1,179,788 | ||||||
(USD), 6.50%, 12/01/2038 | 724,466 | 814,785 | ||||||
(USD), 4.50%, 11/01/2039 | 2,627,090 | 2,827,575 | ||||||
(USD), 4.50%, 09/01/2040 | 11,842 | 12,743 | ||||||
(USD), 4.50%, 04/01/2041 | 12,131 | 13,060 | ||||||
(USD), 4.50%, 05/01/2041 | 708,341 | 762,754 | ||||||
(USD), 4.50%, 06/01/2041 | 1,383,158 | 1,490,155 | ||||||
(USD), 5.00%, 10/01/2041 | 11,114,301 | 12,200,090 | ||||||
(USD), 4.50%, 11/01/2041 | 2,477,863 | 2,665,942 | ||||||
(USD), 3.00%, 02/01/2043 | 7,708,592 | 7,516,557 | ||||||
(USD), 3.00%, 04/01/2043 | 7,776,691 | 7,595,111 | ||||||
Federal National Mortgage Association | ||||||||
(USD), 4.50%, 10/01/2019 | 3,147,810 | 3,347,239 | ||||||
(USD), 3.50%, 10/01/2023 | 13,787,851 | 14,600,930 | ||||||
(USD), 3.50%, 10/01/2023 | 5,200,631 | 5,506,168 | ||||||
(USD), 5.00%, 05/01/2035 | 3,541,322 | 3,903,668 | ||||||
(USD), 2.76%, 02/01/2036 (b) | 349,196 | 372,000 | ||||||
(USD), 5.50%, 11/01/2036 | 402,111 | 444,708 | ||||||
(USD), 5.50%, 05/01/2037 | 12,345,099 | 13,720,405 | ||||||
(USD), 5.50%, 02/01/2038 | 2,285,709 | 2,526,165 | ||||||
(USD), 5.50%, 11/01/2038 | 4,799,845 | 5,309,462 | ||||||
See accompanying notes to financial statements.
Semi-Annual Report 2014
28
Table of Contents
Statement of Investments (continued)
April 30, 2014 (Unaudited)
Aberdeen Total Return Bond Fund
Shares or Principal | Value | |||||||
(USD), 5.50%, 02/01/2041 | $ | 647,532 | $ | 715,214 | ||||
(USD), 4.00%, 10/01/2041 | 14,888,532 | 15,629,663 | ||||||
(USD), 3.00%, 02/01/2043 | 15,452,686 | 15,139,557 | ||||||
(USD), 3.00%, 03/01/2043 | 2,191,766 | 2,122,310 | ||||||
(USD), 3.00%, 06/01/2043 | 2,463,895 | 2,386,194 | ||||||
(USD), 4.00%, 06/01/2043 | 8,101,768 | 8,502,223 | ||||||
(USD), 3.00%, 07/01/2043 | 2,034,804 | 1,970,631 | ||||||
(USD), 3.00%, 10/01/2043 | 5,944,813 | 5,756,693 | ||||||
(USD), 4.00%, 03/01/2044 | 16,122,570 | 16,931,325 | ||||||
TBA (USD), 3.50%, 05/01/2044 | 5,020,000 | 5,096,477 | ||||||
TBA (USD), 4.50%, 05/01/2044 | 21,290,000 | 22,863,465 | ||||||
Government National Mortgage Association | ||||||||
(USD), 6.00%, 04/15/2037 | 203,276 | 228,354 | ||||||
(USD), 6.00%, 06/15/2037 | 175,718 | 197,140 | ||||||
(USD), 6.00%, 09/15/2037 | 259,639 | 291,535 | ||||||
(USD), 6.00%, 11/15/2037 | 812,692 | 911,983 | ||||||
(USD), 6.00%, 11/15/2037 | 222,097 | 249,261 | ||||||
(USD), 6.00%, 12/15/2037 | 246,083 | 276,241 | ||||||
(USD), 6.00%, 12/15/2037 | 90,116 | 101,143 | ||||||
(USD), 6.00%, 01/15/2038 | 185,374 | 207,931 | ||||||
(USD), 6.00%, 04/15/2038 | 386,160 | 433,293 | ||||||
(USD), 5.00%, 06/15/2038 | 95,934 | 105,632 | ||||||
(USD), 6.00%, 07/15/2038 | 140,716 | 157,752 | ||||||
(USD), 6.00%, 08/15/2038 | 64,089 | 71,991 | ||||||
(USD), 6.00%, 09/15/2038 | 462,825 | 524,164 | ||||||
(USD), 6.00%, 09/15/2038 | 253,458 | 284,628 | ||||||
(USD), 5.00%, 03/15/2039 | 870,705 | 958,733 | ||||||
(USD), 5.00%, 04/15/2039 | 290,442 | 319,837 | ||||||
(USD), 5.00%, 06/15/2039 | 288,645 | 320,702 | ||||||
(USD), 4.50%, 04/15/2040 | 2,048,365 | 2,231,047 | ||||||
(USD), 4.50%, 07/15/2040 | 2,921,065 | 3,181,071 | ||||||
(USD), 4.50%, 04/15/2041 | 3,896,180 | 4,243,322 | ||||||
(USD), 5.00%, 05/15/2041 | 427,754 | 470,460 | ||||||
(USD), 5.00%, 06/15/2041 | 342,336 | 376,274 | ||||||
(USD), 5.00%, 10/15/2041 | 14,003 | 15,408 | ||||||
| 206,494,917 | ||||||||
Total U.S. Agencies | 206,494,917 | |||||||
U.S. TREASURIES (9.6%) | ||||||||
UNITED STATES (9.6%) | ||||||||
U.S. Treasury Bonds (USD), | 19,005,000 | 20,056,205 | ||||||
U.S. Treasury Inflation Index Bonds (USD), 0.63%, 02/15/2043 | 11,619,663 | 10,108,653 | ||||||
U.S. Treasury Inflation Index Notes (USD), 0.13%, 04/15/2019 | 7,874,541 | 8,041,875 | ||||||
U.S. Treasury Notes | ||||||||
(USD), 4.13%, 05/15/2015 | 21,580,000 | 22,479,023 | ||||||
(USD), 0.38%, 08/31/2015 | 4,370,000 | 4,381,948 | ||||||
(USD), 0.10%, 01/31/2016 (b) | 8,000,000 | 7,997,368 | ||||||
(USD), 0.63%, 10/15/2016 | 13,010,000 | 13,008,478 | ||||||
(USD), 0.75%, 03/15/2017 | 5,360,000 | 5,350,577 | ||||||
(USD), 0.88%, 04/15/2017 | 380,000 | 380,252 | ||||||
(USD), 1.25%, 11/30/2018 | 3,380,000 | 3,332,866 | ||||||
(USD), 1.50%, 02/28/2019 | 7,110,000 | 7,065,008 | ||||||
(USD), 1.63%, 03/31/2019 | 19,900,000 | 19,866,568 | ||||||
(USD), 1.75%, 10/31/2020 | 9,730,000 | 9,504,235 | ||||||
(USD), 2.00%, 02/28/2021 | 7,060,000 | 6,967,337 | ||||||
(USD), 2.25%, 03/31/2021 | 4,330,000 | 4,338,963 | ||||||
(USD), 2.75%, 02/15/2024 | 4,520,000 | 4,559,903 | ||||||
| 147,439,259 | ||||||||
Total U.S. Treasuries | 147,439,259 | |||||||
REPURCHASE AGREEMENT (4.6%) | ||||||||
UNITED STATES (4.6%) | ||||||||
Fixed Income Clearing Corp., 0.00%, dated 04/30/2014, due 05/01/2014, repurchase price $70,129,972, Collateralized by a Federal Home Loan Bank, maturing 09/28/2016; total market value of $71,535,825 | 70,129,972 | 70,129,972 | ||||||
Total Repurchase Agreement | 70,129,972 | |||||||
Total Investments (Cost $1,538,079,413) (e)—101.5% | 1,553,858,964 | |||||||
Liabilities in excess of other assets—(1.5)% |
| (23,205,975 | ) | |||||
Net Assets—100.0% | $ | 1,530,652,989 | ||||||
| (a) | Denotes a security issued under Regulation S or Rule 144A. |
| (b) | Variable or Floating Rate Security. Rate disclosed is as of April 30, 2014. |
| (c) | This security is government guaranteed. |
| (d) | Issued with a zero coupon. |
| (e) | See notes to financial statements for tax unrealized appreciation/depreciation of securities. |
| AUD | Australian Dollar |
| BRL | Brazilian Real |
| CAD | Canadian Dollar |
| CLP | Chilean Peso |
| COP | Colombian Peso |
| GMTN | Global Medium Term Note |
| MTN | Medium Term Note |
| MXN | Mexican Peso |
| NOK | Norwegian Krone |
| REIT | Real Estate Investment Trust |
| TBA | Securities purchased on a forward commitment basis with an appropriate principal amount and no definitive maturity date. The actual principal and maturity date will be determined upon settlement date. |
| USD | U.S. Dollar |
See accompanying notes to financial statements.
2014 Semi-Annual Report
29
Table of Contents
Statement of Investments (concluded)
April 30, 2014 (Unaudited)
Aberdeen Total Return Bond Fund
At April 30, 2014, the Fund’s open forward foreign currency exchange contracts were as follows:
| Purchase Contracts Settlement Date* | Counterparty | Amount Purchased | Amount Sold | Fair Value | Unrealized Appreciation/ (Depreciation) | |||||||||||||||||||||
| Canadian Dollar/United States Dollar | ||||||||||||||||||||||||||
06/20/2014 | Deutsche Bank AG | CAD | 2,590,000 | USD | 2,355,320 | $ | 2,360,257 | $ | 4,937 | |||||||||||||||||
| Chilean Peso/United States Dollar | ||||||||||||||||||||||||||
07/08/2014 | Deutsche Bank AG | CLP | 4,179,127,623 | USD | 7,485,452 | 7,355,804 | (129,648 | ) | ||||||||||||||||||
07/08/2014 | JPMorgan Chase Bank N.A. | CLP | 4,179,127,623 | USD | 7,561,295 | 7,355,804 | (205,491 | ) | ||||||||||||||||||
| Colombian Peso/United States Dollar | ||||||||||||||||||||||||||
06/25/2014 | JPMorgan Chase Bank N.A. | COP | 15,295,073,032 | USD | 7,631,363 | 7,860,078 | 228,715 | |||||||||||||||||||
| Mexican Peso/United States Dollar | ||||||||||||||||||||||||||
05/27/2014 | Credit Suisse International | MXN | 224,870,676 | USD | 16,859,147 | 17,157,713 | 298,566 | |||||||||||||||||||
| 05/27/2014 | Deutsche Bank AG | MXN | 85,400,172 | USD | 6,398,934 | 6,516,064 | 117,130 | |||||||||||||||||||
| $ | 48,605,720 | $ | 314,209 | |||||||||||||||||||||||
| Sale Contracts Settlement Date* | Counterparty | Amount Purchased | Amount Sold | Fair Value | Unrealized Appreciation/ (Depreciation) | |||||||||||||||||||||
| United States Dollar/Australian Dollar | ||||||||||||||||||||||||||
07/28/2014 | Westpac Banking Corp. | USD | 43,328,084 | AUD | 47,095,744 | $ | 43,491,502 | $ | (163,418 | ) | ||||||||||||||||
| United States Dollar/Brazilian Real | ||||||||||||||||||||||||||
07/29/2014 | Credit Suisse International | USD | 35,169,138 | BRL | 80,408,960 | 35,188,164 | (19,026 | ) | ||||||||||||||||||
07/29/2014 | JPMorgan Chase Bank N.A. | USD | 25,399,265 | BRL | 58,113,518 | 25,431,345 | (32,080 | ) | ||||||||||||||||||
| United States Dollar/Canadian Dollar | ||||||||||||||||||||||||||
06/20/2014 | Deutsche Bank AG | USD | 2,342,281 | CAD | 2,590,000 | 2,360,258 | (17,977 | ) | ||||||||||||||||||
| United States Dollar/Colombian Peso | ||||||||||||||||||||||||||
06/25/2014 | JPMorgan Chase Bank N.A. | USD | 7,771,887 | COP | 15,295,073,032 | 7,860,078 | (88,191 | ) | ||||||||||||||||||
| United States Dollar/Mexican Peso | ||||||||||||||||||||||||||
05/27/2014 | Credit Suisse International | USD | 16,749,070 | MXN | 224,040,581 | 17,094,377 | (345,307 | ) | ||||||||||||||||||
05/27/2014 | Deutsche Bank AG | USD | 21,194,767 | MXN | 279,435,554 | 21,321,033 | (126,266 | ) | ||||||||||||||||||
| United States Dollar/Norwegian Krone | ||||||||||||||||||||||||||
| 07/24/2014 | Deutsche Bank AG | USD | 7,637,277 | NOK | 45,832,069 | 7,685,436 | (48,159 | ) | ||||||||||||||||||
| $ | 160,432,193 | $ | (840,424 | ) | ||||||||||||||||||||||
| * | Certain contracts with different trade dates and like characteristics have been shown net. |
See accompanying notes to financial statements.
Semi-Annual Report 2014
30
Table of Contents
Aberdeen Global High Income Fund (Unaudited)
The Aberdeen Global High Income Fund (Class A shares at NAV net of fees) returned 5.19% for the six-month period ended April 30, 2013, versus the 4.71% return of its benchmark, the Bank of America (BofA) Merrill Lynch Global High Yield Constrained Index (hedged to U.S. Dollars), during the same period. The BofA Merrill Lynch Global High Yield Constrained Index (not hedged to U.S. Dollars), the Fund’s prior benchmark, returned 5.23% for the six-month period ended April 30, 2014. For broader comparison, the average return of the Fund’s Lipper peer category of High Yield Funds (consisting of 609 funds) was 4.09% for the period.
The global high yield market performed well for the six-month period ended April 30, 2014. The BofA Merrill Lynch Global High Yield Constrained Index (hedged to U.S. Dollars) recorded a total return of 5.19%, outperforming global investment-grade bonds, as represented by the Barclays Global Aggregate Bond Index,1 and the U.S. high yield market, as measured by the BofA Merrill Lynch U.S. High Yield Master II Index,2 which returned 2.10% and 4.76%, respectively, for the same period. However, the global high yield sector underperformed relative to the U.S. broader equity market benchmark, the S&P 500® Index,3 which returned 8.36% for the six-month period. High yield sectors outside the U.S. in developed markets, such as those in Europe/United Kingdom (UK) and Canada, also recorded positive returns over the reporting period. The Europe/UK and Canadian high yield sectors posted corresponding gains of 4.49% and 6.34%, respectively, for the period, while the U.S. market returned 4.76%.4 Emerging markets (EM) sovereigns and EM corporates returned 2.69% and 5.56%, respectively.4
The global high yield market generated this strong performance despite the fact that the U.S. Federal Reserve (Fed) announced in December 2013 that it would begin reducing its purchases of government and mortgage-backed bonds by $10 million ($5 million for each asset class) in January. The market’s initial reaction was to ratchet rates higher in late 2013. However, once investors began to assess the predictability and impact of the taper approach, rate volatility subsided. By the end of the reporting period, rates were modestly higher compared to their levels on October 31, 2013 for all maturities of the U.S. Treasury yield curve, with the exception of the 30-year bond, which was incrementally lower.
Default activity in the global high yield market over the reporting period remained relatively benign until April 2014, when electric utility TXU’s much-anticipated default finally occurred, affecting $16.6 billion in bonds and $19.5 billion in institutional loans. This caused the U.S. high yield par-weighted default rate to surge from 0.61% to 2.15%. On an issuer-weighted basis, however, defaults in the U.S. market moved up slightly in April, from 1.61% to 1.75%. Default rates in both Europe and in emerging markets continued to trend lower.
During the reporting period, Fund performance benefited mainly from positive security selection across all sectors. Some specific areas that contributed to results would include an Irish telecom company, a European satellite company and an Australian Uranium miner. There was particular strength in the Fund’s positions in U.S. high yield loans and European high yield bonds, as well as the relatively small position in emerging market sovereigns. Fund performance also was bolstered by our continued underweight of BB rated issues in favor of both B and CCC rated issues.5
Conversely, there were several detractors from Fund performance for the period. Firstly, the underweight to the developed European high yield sector was a slight drag on results as rates moved sharply lower across Europe, driving investors into “risk assets” such as the high yield market. In addition, our hedge of euros in this sector, which is denominated in local currency, also was a slight detractor. Secondly, holdings in Russia also had a negative impact on Fund performance amid a downturn in that market attributable to fears of a wider economic fallout from an extended standoff between Russia and the West over Ukraine. We subsequently reduced the Fund’s exposure to Russia late in the period.
| 1 | The Barclays Global Aggregate Bond Index provides a broad-based measure of the global investment-grade fixed-rate debt markets. The Barclays Global Aggregate Index comprises primarily three major components: the U.S. Aggregate Bond Index, the Pan-European Aggregate Index, and the Asian-Pacific Aggregate Index. In addition to securities from these three benchmarks, the Barclays Global Aggregate Bond Index includes Global Treasury, Eurodollar, Euro-Yen, Canadian, and Investment-Grade 144A index-eligible securities not already in the three regional aggregate indexes. Indexes are unmanaged and have been provided for comparison purposes only. No fees or expenses are reflected. You cannot invest directly in an index. |
| 2 | The BofA ML U.S. High Yield Master II Index tracks the performance of below-investment-grade U.S. Dollar-denominated corporate bonds issued in the U.S. domestic market. |
| 3 | The S&P 500 Index is an index of 500 selected common stocks, most of which are listed on the New York Stock Exchange, that is a measure of the U.S. stock market as a whole. |
| 4 | European/UK high yield is represented by the BofA Merrill Lynch Global High Yield European Issuers Constrained Index; Canadian high yield is represented by the BofA Merrill Lynch Canada High Yield Index; emerging markets sovereigns are represented by the BofA Merrill Lynch Global Emerging Markets Sovereign Index; and emerging markets high yield corporates are represented by the BofA Merrill Lynch U.S. High Yield Emerging Markets Corporate Plus Index. |
| The BofA Merrill Lynch Global High Yield European Issuers Constrained Index contains all securities in the BofA Merrill Lynch Global High Yield European Issuers High Yield Index but caps issuer exposure at 3%. Index constituents are capitalization-weighted, based on their current amount outstanding, provided the total allocation to an individual issuer does not exceed 3%. |
| The BofA Merrill Lynch Canada High Yield Index tracks the performance of Canadian dollar-denominated below-investment-grade corporate debt publicly issued in the Canadian domestic market. Qualifying securities must have a below-investment-grade rating (based on an average of Moody’s, S&P and Fitch). Credit ratings, which typically range from AAA/Aaa (highest) to D (lowest), are assigned by credit rating agencies such as Standard & Poor’s, Moody’s and/or Fitch, as an indication of the ability of an issuer, such as a corporation or state or city government, to meet its financial obligations in full and on time. |
| The BofA Merrill Lynch Global Emerging Markets Sovereign Index tracks the performance of U.S. Dollar- and euro-denominated below-investment-grade sovereign debt. |
| The BofA Merrill Lynch High Yield U.S. Emerging Markets Corporate Plus Index tracks the performance of U.S. dollar-denominated below investment grade emerging markets corporate debt publicly issued in the U.S. domestic or eurobond market. |
| 5 | Standard & Poor’s credit ratings express the agency’s opinion about the ability and willingness of an issuer, such as a corporation or state or city government, to meet its financial obligations in full and on time. Typically, ratings are expressed as letter grades that range, for example, from “AAA” to “D” to communicate the agency’s opinion of relative level of credit risk. Ratings from “AA” to “CCC” may be modified by the addition of a plU.S. (+) or minU.S. (-) sign to show relative standing within the major rating categories. |
2014 Semi-Annual Report
31
Table of Contents
Aberdeen Global High Income Fund (Unaudited) (concluded)
Regarding the use of derivatives during the reporting period, the fund used CDX (a basket of credit derivatives) to hedge overall beta risk. We also employed individual credit default swaps to hedge individual exposures as well as to initiate new long positions that are more efficient than the cash market.
During the reporting period, we increased the Fund’s exposure to the media sector and reduced the positions in the basic industry and automotive sectors. Regarding geographic allocations, we expanded the Fund’s positions in the Developed Europe region and EM, while decreasing the exposure to the U.S. At the end of the reporting period, the Fund’s largest absolute regional weightings were in the U.S., EM and Developed Europe, and in the energy, media and basic industry sectors. We believe that BB rated credits in the long end of the yield curve, as well as senior secured exit financings of restructured companies, are offering value along with pockets of industries and credits where market sentiment is overly negative. We maintain our focus on emerging market credits despite the difficult macroeconomic and political environments.
The most recent economic data continue to point to a mixed picture for the U.S. economy but one that seems to be improving…a little bit. At times it exhibits some real progress while at other times the data continues to show some real weakness that we believe may point to structural issues that this recovery is experiencing as a result of the credit crisis. These include retiring of the “Baby Boomers,” women dropping out of the labor force, too much debt, and underemployment. Even if we get a rebound in gross domestic product (GDP) growth to 4% in the second quarter of 2014, as some optimistic economists suggest, that still means that growth in the first six months of 2014 will be only 2%.6 In our view, this continues to look like a subpar recovery by any measure. However, we think that this subpar recovery will continue to produce good results for the global high yield sector relative to other asset classes.6
Portfolio Management:
Greg Hopper
PAST PERFORMANCE DOES NOT GUARANTEE FUTURE RESULTS.
The performance quoted represents past performance, which does not guarantee future results. Class A shares have up to a 0.25% 12b-1 fee. The investment return and principal value of an investment will fluctuate so that an investor’s shares, when redeemed, may be worth more or less than their original cost. Current performance of the Fund may be lower or higher than the performance quoted. Performance data current to the most recent month-end may be obtained by calling 800-387-6977 or visiting www.aberdeen-asset.us.
Total returns assume the reinvestment of all distributions. Investment performance reflects fee waivers and, in the absence of such waivers, returns would have been lower. Indexes are unmanaged and have been provided for comparison purposes only. No fees or expenses are reflected. You cannot invest directly in an index.
Lipper is a leading global provider of mutual fund information and analysis to fund companies, financial intermediaries and media organizations.
Risk Considerations
Investing in mutual funds involves risk, including the possible loss of principal. There is no assurance that the investment objective of any fund will be achieved.
Fixed income securities are subject to certain risks including, but not limited to: interest rate (changes in interest rates may cause a decline in the market value of an investment), credit (changes in the financial condition of the issuer, borrower, counterparty, or underlying collateral), prepayment (debt issuers may repay or refinance their loans or obligations earlier than anticipated), and extension (principal repayments may not occur as quickly as anticipated, causing the expected maturity of a security to increase).
Additionally, high-yield securities may face additional risks, including economic growth; inflation; liquidity; supply; and externally generated shocks (stress factors emanating from outside the U.S. market).
The Fund’s investments in high-yield bonds (commonly referred to as “junk bonds”) and other lower-rated securities will subject the Fund to substantial risk of loss. Investments in high-yield bonds are speculative and issuers of these securities are generally considered to be less financially secure and less able to repay interest and principal than issuers of investment-grade securities. Prices of high-yield bonds tend to be very volatile. These securities are less liquid than investment-grade debt securities and may be difficult to price or sell, particularly in times of negative sentiment toward high-yield securities.
Derivatives are speculative and may hurt the Fund’s performance. They present the risk of disproportionately increased losses and/or reduced gains when the financial asset or measure to which the derivative is linked changes in unexpected ways.
Foreign securities are more volatile, harder to price and less liquid than U.S. securities; and are subject to different accounting and regulatory standards, and political and economic risks. These risks are enhanced in emerging markets countries.
Please read the prospectus for more detailed information regarding these and other risks.
| 6 | Forecasts and estimates are offered as opinion and are not reflective of potential performance, are not guaranteed and actual events or results may differ materially. |
Semi-Annual Report 2014
32
Table of Contents
Aberdeen Global High Income Fund (Unaudited)
Average Annual Total Return (For periods ended April 30, 2014) | Six Month† | 1 Yr. | 5 Yr. | 10 Yr. | ||||||||||
Class A | 5.19% | 7.52% | 14.28% | 8.62% | ||||||||||
Institutional Class1 | 5.32% | 7.83% | 14.59% | 8.88% | ||||||||||
| † | Not Annualized |
| 1 | Formerly Class I. |
2014 Semi-Annual Report
33
Table of Contents
Aberdeen Global High Income Fund (Unaudited)
Performance of a $10,000 Investment (as of April 30, 2014)
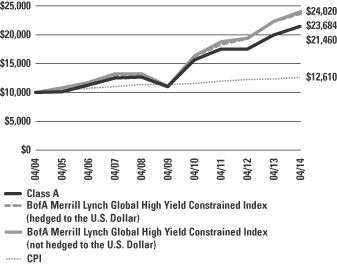
Comparative performance of $10,000 invested in Class A shares of the Aberdeen Global High Income Fund, BofA Merrill Lynch Global High Yield Constrained Index (hedged to the U.S. Dollar), the BofA Merrill Lynch Global High Yield Constrained Index (not hedged to the U.S. Dollar) and the Consumer Price Index (CPI) over a 10-year period ended April 30, 2014. Unlike the Fund, the returns for these unmanaged indexes do not reflect any fees or expenses. Investors cannot invest directly in market indexes.
The BofA Merrill Lynch Global High Yield Constrained Index (hedged to the U.S. Dollar) tracks the performance of below investment grade bonds of corporate issuers domiciled in countries having an investment grade foreign currency long term debt rating (based on a composite of Moody’s and S&P). The BofA Merrill Lynch Global High Yield Constrained Index (not hedged to the U.S. Dollar) tracks the performance of below investment grade bonds of corporate issuers domiciled in countries having an investment grade foreign currency long-term debt rating (based on a composite of Moody’s, S&P and Fitch). The indexes are weighted by outstanding issuance, but constrained such that the percentage of any one issuer may not represent more than 2% of the indexes. Effective with the 2014 prospectus, the BofA Merrill Lynch Global High Yield Constrained Index (hedged to the U.S. Dollar) became the Fund’s primary benchmark. Previously, the Fund’s average annual total returns were compared to the returns of the same index without hedging to the U.S. Dollar. The Adviser believes that the average annual total returns of the BofA Merrill Lynch Global High Yield Constrained Index (hedged to the U.S. Dollar) makes a more meaningful comparison index given the Fund’s investment strategy and composition.
The CPI represents changes in prices of all goods and services purchased for consumption by urban households.
Investment return and principal value will fluctuate, and when redeemed, shares may be worth more or less than original cost. Past performance is no guarantee of future results. The Average Annual Total Return table and performance graph do not reflect the deduction of taxes that a shareholder would pay on Fund distributions or the redemption of Fund shares. Investing in mutual funds involves market risk, including loss of principal. Performance returns assume the reinvestment of all distributions. Performance returns reflect fee waivers and reimbursements in effect without which returns would have been lower.
Portfolio Summary (as a percentage of net assets)
April 30, 2014 (Unaudited)
| Asset Allocation | ||||
Corporate Bonds | 65.0% | |||
Bank Loans | 16.6% | |||
Repurchase Agreement | 11.7% | |||
Government Bonds | 3.9% | |||
Common Stocks | 1.6% | |||
Preferred Stocks | 1.1% | |||
Warrants | 0.3% | |||
Government Agencies | 0.1% | |||
Liabilities in excess of other assets | (0.3% | ) | ||
| 100.0% | ||||
The following chart summarizes the composition of the Fund’s portfolio, in Bloomberg Industry Classification System (BICS) sectors, expressed as a percentage of net assets. The industries listed below may include more than one industry group. As of April 30, 2014, the Fund did not have more than 25% of its assets invested in any single industry group.
| Top Industries | ||||
Oil, Gas & Consumable Fuels | 7.9% | |||
Diversified Telecommunication Services | 6.6% | |||
Media | 5.4% | |||
Commercial Banks | 4.7% | |||
Diversified Financial Services | 4.8% | |||
Commercial Services & Supplies | 3.2% | |||
Transportation | 2.6% | |||
Retail | 2.1% | |||
Insurance | 2.0% | |||
Entertainment | 1.7% | |||
Other | 59.0% | |||
| 100.0% | ||||
| Top Holdings* | ||||
Deep Ocean | 1.5% | |||
Eircom Finco S.A.R.L. 03/17/2021 | 1.2% | |||
Spanish Broadcasting System, Inc. 04/15/2017 | 1.2% | |||
Isola USA Corp. 11/23/2018 | 1.2% | |||
YRC Worldwide, Inc. 02/12/2019 | 1.1% | |||
Postmedia Network, Inc. 08/16/2017 | 1.1% | |||
Mexico Fixed Rate Bonds, Series M10 12/17/2015 | 1.1% | |||
Neiman Marcus Group Ltd., Inc 10/25/2020 | 1.0% | |||
Midstates Petroleum Co., Inc. / Midstates Petroleum Co. LLC 06/01/2021 | 1.0% | |||
Texas Competitive Electric Co. 10/10/2014 | 1.0% | |||
Other | 88.6% | |||
| 100.0% | ||||
| Top Countries | ||||
United States | 64.9% | |||
United Kingdom | 5.2% | |||
Luxembourg | 4.8% | |||
Canada | 4.4% | |||
Mexico | 3.4% | |||
Republic of Ireland | 1.5% | |||
Indonesia | 1.5% | |||
Norway | 1.5% | |||
Netherlands | 1.3% | |||
Brazil | 1.3% | |||
Other | 10.2% | |||
| 100.0% | ||||
| * | For the purpose of listing top holdings, repurchase agreements included as part of Other. |
Semi-Annual Report 2014
34
Table of Contents
Statement of Investments
April 30, 2014 (Unaudited)
Aberdeen Global High Income Fund
| Shares or Principal Amount | Value | |||||||
CORPORATE BONDS (65.0%) | ||||||||
AUSTRALIA (0.5%) | ||||||||
Paladin Energy Ltd. (USD), | $ | 16,580,000 | $ | 14,051,550 | ||||
AUSTRIA (0.2%) | ||||||||
Sappi Papier Holding GmbH | ||||||||
(USD), 6.63%, 04/15/2021 (a) | 700,000 | 731,500 | ||||||
(USD), 7.50%, 06/15/2032 (a) | 6,672,000 | 5,637,840 | ||||||
| 6,369,340 | ||||||||
BERMUDA (0.6%) | ||||||||
Seadrill Ltd. (USD), | 16,650,000 | 16,733,250 | ||||||
BRAZIL (0.5%) | ||||||||
Samarco Mineracao SA (USD), | 3,845,000 | 3,580,656 | ||||||
Tonon Bioenergia SA (USD), | 11,375,000 | 10,351,250 | ||||||
| 13,931,906 | ||||||||
CANADA (4.4%) | ||||||||
Air Canada | ||||||||
(CAD), 7.63%, 10/01/2019 (a) | 12,530,000 | 12,317,937 | ||||||
(USD), 8.75%, 04/01/2020 (a) | 2,080,000 | 2,282,800 | ||||||
(USD), 7.75%, 04/15/2021 (a) | 3,420,000 | 3,492,675 | ||||||
Bombardier, Inc. | ||||||||
(USD), 6.00%, 10/15/2022 (a) | 1,350,000 | 1,375,313 | ||||||
(USD), 6.13%, 01/15/2023 (a) | 8,080,000 | 8,302,200 | ||||||
(USD), 7.45%, 05/01/2034 (a) | 4,170,000 | 4,149,150 | ||||||
First Quantum Minerals Ltd. (USD), | 12,320,000 | 12,720,400 | ||||||
Garda World Security Corp. (USD), | 5,340,000 | 5,653,725 | ||||||
Gateway Casinos & Entertainment Ltd. (CAD), 8.50%, 11/26/2020 (a)(b) | 13,460,000 | 12,453,493 | ||||||
MEG Energy Corp. (USD), | 2,150,000 | 2,284,375 | ||||||
Postmedia Network, Inc. (CAD), | 31,820,923 | 30,157,368 | ||||||
River Cree Enterprises LP (CAD), | 13,885,000 | 13,332,919 | ||||||
Uranium One Investments, Inc. (USD), | 14,535,000 | 13,811,157 | ||||||
| 122,333,512 | ||||||||
CHINA (0.6%) | ||||||||
MIE Holdings Corp. (USD), | 15,290,000 | 16,073,612 | ||||||
CZECH REPUBLIC (0.3%) | ||||||||
CET 21 spol sro (EUR), | 6,327,000 | 9,414,147 | ||||||
FRANCE (0.4%) | ||||||||
Credit Agricole SA (USD), | 1,940,000 | 2,089,671 | ||||||
Societe Generale SA (USD), | 8,760,000 | 9,159,894 | ||||||
| 11,249,565 | ||||||||
GERMANY (0.7%) | ||||||||
ALBA Group PLC & Co. KG (EUR), | 4,375,000 | 6,024,131 | ||||||
Safari Holding Verwaltungs GmbH (EUR), 8.25%, 02/15/2021 (a) | 7,435,000 | 11,088,563 | ||||||
Unitymedia Hessen GmbH & Co. KG / Unitymedia NRW GmbH (EUR), 5.13%, 01/21/2023 (a) | 770,000 | 1,132,087 | ||||||
| 18,244,781 | ||||||||
GUATEMALA (0.6%) | ||||||||
Cementos Progreso Trust (USD), 7.13%, 11/06/2023 (a) | 7,385,000 | 7,865,025 | ||||||
Comunicaciones Celulares SA (USD), 6.88%, 02/06/2024 (a) | 7,205,000 | 7,556,244 | ||||||
| 15,421,269 | ||||||||
HONG KONG (0.4%) | ||||||||
MIE Holdings Corp. (USD), | 11,525,000 | 11,641,057 | ||||||
INDONESIA (0.8%) | ||||||||
Gajah Tunggal Tbk PT (USD), 7.75%, 02/06/2018 (a) | 12,880,000 | 13,324,360 | ||||||
Pertamina Persero PT (USD), MTN, 4.30%, 05/20/2023 (a) | 10,705,000 | 9,781,694 | ||||||
| 23,106,054 | ||||||||
JERSEY (1.3%) | ||||||||
Galaxy Bidco Ltd. | ||||||||
(GBP), 5.52%, 11/15/2019 (a)(c) | 2,025,000 | 3,461,746 | ||||||
(GBP), 6.38%, 11/15/2020 (a) | 7,950,000 | 13,859,014 | ||||||
Galaxy Finco Ltd. (GBP), 7.88%, 11/15/2021 (a) | 1,600,000 | 2,795,989 | ||||||
Hastings Insurance Group Finance PLC | ||||||||
(GBP), 6.52%, 10/21/2019 (a)(c) | 3,680,000 | 6,264,879 | ||||||
(GBP), 8.00%, 10/21/2020 (a) | 4,375,000 | 7,719,150 | ||||||
HBOS Sterling Finance Jersey LP (GBP), 7.88%, 12/29/2049 (c)(d) | 285,000 | 569,252 | ||||||
| 34,670,030 | ||||||||
LUXEMBOURG (4.8%) | ||||||||
ArcelorMittal (USD), 7.50%, 10/15/2039 | 13,225,000 | 13,919,313 | ||||||
ARD Finance SA | ||||||||
(USD), 11.13%, 06/01/2018 (a) | 1,455,000 | 1,607,775 | ||||||
PIK (EUR), 11.13%, 06/01/2018 (a) | 15,275,000 | 23,500,603 | ||||||
Bank of New York Mellon Luxembourg SA (The), Series PRX (EUR), MTN, | 7,300,000 | 6,418,398 | ||||||
Exopack Holdings SA (USD), | 1,525,000 | 1,624,125 | ||||||
Far East Capital Ltd. SA (USD), 8.00%, 05/02/2018 (a) | 2,335,000 | 1,657,850 | ||||||
INEOS Group Holdings SA | ||||||||
(USD), 6.13%, 08/15/2018 (a) | 1,935,000 | 2,012,400 | ||||||
(EUR), 6.50%, 08/15/2018 (a) | 13,715,000 | 20,097,792 | ||||||
See accompanying notes to financial statements.
2014 Semi-Annual Report
35
Table of Contents
Statement of Investments (continued)
April 30, 2014 (Unaudited)
Aberdeen Global High Income Fund
| Shares or Principal Amount | Value | |||||||
Intelsat Jackson Holdings SA (USD), 5.50%, 08/01/2023 (a) | $ | 20,930,000 | $ | 20,563,725 | ||||
Magnolia BC SA (EUR), 9.00%, 08/01/2020 (a) | 9,405,000 | 13,995,307 | ||||||
Mobile Challenger Intermediate Group SA | ||||||||
(CHF), 8.75%, 03/15/2019 (a) | 5,450,000 | 6,424,696 | ||||||
(EUR), 8.75%, 03/15/2019 (a) | 4,390,000 | 6,303,630 | ||||||
Wind Acquisition Finance SA | ||||||||
(EUR), 7.00%, 04/23/2021 (a) | 5,075,000 | 7,296,027 | ||||||
(USD), 7.38%, 04/23/2021 (a) | 6,555,000 | 6,751,650 | ||||||
Xella Holdco Finance SA (EUR), 9.13%, 09/15/2018 (a) | 1,070,000 | 1,605,076 | ||||||
| 133,778,367 | ||||||||
MARSHALL ISLAND (0.4%) | ||||||||
Navios Maritime Acquisition Corp. / Navios Acquisition Finance US, Inc. (USD), 8.13%, 11/15/2021 (a) | 11,720,000 | 12,276,700 | ||||||
MEXICO (2.3%) | ||||||||
Alfa SAB de CV | ||||||||
(USD), 5.25%, 03/25/2024 (a) | 2,730,000 | 2,781,188 | ||||||
(USD), 6.88%, 03/25/2044 (a) | 6,935,000 | 7,169,056 | ||||||
Axtel SAB de CV (USD), | 13,865,000 | 14,142,300 | ||||||
Credito Real SAB de CV (USD), | 9,955,000 | 10,502,525 | ||||||
Trust F/1401 (USD), | 14,405,000 | 14,855,156 | ||||||
TV Azteca SAB de CV (USD), MTN, | 12,480,000 | 13,338,000 | ||||||
| 62,788,225 | ||||||||
NETHERLANDS (1.3%) | ||||||||
Adria Bidco BV (EUR), | 9,150,000 | 13,614,579 | ||||||
Metinvest BV (USD), | 15,315,000 | 13,441,516 | ||||||
Petrobras Global Finance BV (USD), | 9,180,000 | 9,665,659 | ||||||
| 36,721,754 | ||||||||
PARAGUAY (0.2%) | ||||||||
Banco Regional SAECA (USD), | 5,755,000 | 6,193,819 | ||||||
PERU (0.8%) | ||||||||
Banco de Credito del Peru (USD), | 7,170,000 | 7,542,840 | ||||||
Corp. Lindley SA (USD), | 13,810,000 | 13,340,460 | ||||||
| 20,883,300 | ||||||||
REPUBLIC OF IRELAND (0.3%) | ||||||||
Ardagh Packaging Finance PLC / Ardagh Holdings USA, Inc. (USD), | 3,600,000 | 3,762,000 | ||||||
Argon Capital PLC for Royal Bank of Scotland (GBP), EMTN, | 3,203,000 | 4,462,964 | ||||||
| 8,224,964 | ||||||||
RUSSIA (0.3%) | ||||||||
Far Eastern Shipping Co. (USD), | 10,485,000 | 7,444,350 | ||||||
SINGAPORE (0.2%) | ||||||||
Ottawa Holdings Pte Ltd. (USD), | 6,475,000 | 5,568,500 | ||||||
SWEDEN (0.4%) | ||||||||
Verisure Holding AB (EUR), MTN, | 7,890,000 | 11,941,632 | ||||||
SWITZERLAND (0.3%) | ||||||||
Credit Suisse Group AG (USD), | 7,135,000 | 7,759,384 | ||||||
UKRAINE (0.5%) | ||||||||
Mriya Agro Holding PLC (USD), | 18,125,000 | 14,228,125 | ||||||
UNITED KINGDOM (5.2%) | ||||||||
Avanti Communications Group PLC (USD), 10.00%, 10/01/2019 (a) | 24,975,000 | 26,973,000 | ||||||
Barclays Bank PLC (GBP), | 6,586,000 | 11,272,694 | ||||||
Barclays PLC (USD), | 10,640,000 | 11,351,390 | ||||||
Lloyds Bank PLC (GBP), EMTN, | 8,010,000 | 22,625,781 | ||||||
National Westminster Bank PLC (GBP), EMTN, 5.98%, 01/29/2049 (c)(d) | 2,815,000 | 4,634,023 | ||||||
Pearl Group Holdings No 1 Ltd. (GBP), | 8,491,500 | 13,822,772 | ||||||
Royal Bank of Scotland Group PLC (EUR), | 4,353,000 | 5,506,178 | ||||||
Unique Pub Finance Co. PLC | ||||||||
Series M (GBP), 7.40%, 03/28/2024 | 7,715,000 | 13,481,910 | ||||||
Series A4 (GBP), 5.66%, 06/30/2027 | 10,357,606 | 17,620,681 | ||||||
Virgin Media Secured Finance PLC | ||||||||
(GBP), 5.50%, 01/15/2025 (a) | 7,070,000 | 11,981,746 | ||||||
(USD), 5.50%, 01/15/2025 (a) | 3,828,000 | 3,861,495 | ||||||
| 143,131,670 | ||||||||
UNITED STATES (36.3%) | ||||||||
AES Corp. | ||||||||
(USD), 8.00%, 06/01/2020 | 20,670,000 | 24,752,325 | ||||||
(USD), 5.50%, 03/15/2024 | 1,025,000 | 1,027,563 | ||||||
Alpha Natural Resources, Inc. | ||||||||
(USD), 6.00%, 06/01/2019 | 11,220,000 | 8,583,300 | ||||||
(USD), 6.25%, 06/01/2021 | 3,485,000 | 2,587,613 | ||||||
American Achievement Corp. (USD), | 9,170,000 | 9,594,112 | ||||||
American International Group, Inc., Series A2 (GBP), 5.75%, 03/15/2067 (c) | 4,000,000 | 6,962,958 | ||||||
APX Group, Inc. | ||||||||
(USD), 6.38%, 12/01/2019 | 6,265,000 | 6,405,963 | ||||||
(USD), 8.75%, 12/01/2020 | 10,085,000 | 10,337,125 | ||||||
Arch Coal, Inc. | ||||||||
(USD), 8.00%, 01/15/2019 (a) | 2,665,000 | 2,665,000 | ||||||
(USD), 7.00%, 06/15/2019 | 5,415,000 | 4,196,625 | ||||||
(USD), 7.25%, 06/15/2021 | 25,130,000 | 18,910,325 | ||||||
See accompanying notes to financial statements.
Semi-Annual Report 2014
36
Table of Contents
Statement of Investments (continued)
April 30, 2014 (Unaudited)
Aberdeen Global High Income Fund
| Shares or Principal Amount | Value | |||||||
Blue Danube Ltd. (USD), | $ | 9,355,000 | $ | 9,838,653 | ||||
Building Materials Holding Corp. (USD), | 7,715,000 | 8,428,637 | ||||||
CBC Ammo LLC / CBC FinCo, Inc. (USD), | 7,290,000 | 7,444,912 | ||||||
CCO Holdings LLC / CCO Holdings Capital Corp. (USD), 5.13%, 02/15/2023 | 18,610,000 | 18,237,800 | ||||||
CenturyLink, Inc., Series W (USD), | 5,860,000 | 6,314,150 | ||||||
Cenveo Corp. (USD), 8.88%, 02/01/2018 | 13,440,000 | 13,960,800 | ||||||
Chaparral Energy, Inc. (USD), | 7,545,000 | 8,073,150 | ||||||
CHS/Community Health Systems, Inc. (USD), 6.88%, 02/01/2022 (a) | 13,510,000 | 14,067,287 | ||||||
Clayton Williams Energy, Inc. (USD), | 24,450,000 | 26,161,500 | ||||||
Clear Channel Worldwide Holdings, Inc. (USD), 6.50%, 11/15/2022 | 11,665,000 | 12,524,125 | ||||||
Clearwire Communications LLC (USD), | 710,000 | 937,200 | ||||||
Compass Re Ltd., Series CL3 (USD), | 7,245,000 | 7,435,544 | ||||||
DPH Holdings Corp. (USD), | 1,500,000 | 50,063 | ||||||
Drill Rigs Holdings, Inc. (USD), | 15,595,000 | 16,179,812 | ||||||
El Paso LLC | ||||||||
(USD), GMTN, 8.05%, 10/15/2030 | 1,330,000 | 1,444,415 | ||||||
(USD), GMTN, 7.80%, 08/01/2031 | 23,249,000 | 25,083,858 | ||||||
Everglades Re Ltd. (USD), | 2,452,000 | 2,600,714 | ||||||
First Data Corp. (USD), | 23,345,000 | 25,270,962 | ||||||
Florida East Coast Holdings Corp. | ||||||||
(USD), 6.75%, 05/01/2019 (a) | 10,845,000 | 11,170,350 | ||||||
(USD), 9.75%, 05/01/2020 (a) | 10,845,000 | 11,224,575 | ||||||
Frontier Communications Corp. | ||||||||
(USD), 8.75%, 04/15/2022 | 10,283,000 | 11,774,035 | ||||||
(USD), 9.00%, 08/15/2031 | 7,195,000 | 7,482,800 | ||||||
GenCorp, Inc. (USD), 7.13%, 03/15/2021 | 13,010,000 | 14,180,900 | ||||||
General Motors (Escrow Shares) | ||||||||
(USD), 7.13%, 07/15/2013 (b) | 2,240,000 | – | ||||||
(USD), 8.25%, 07/15/2023 (b) | 35,495,000 | – | ||||||
(USD), 8.10%, 06/15/2024 (b) | 2,485,000 | – | ||||||
(USD), 7.38%, 05/23/2048 (b) | 3,460,000 | – | ||||||
(USD), 8.80%, 03/01/2049 (b) | 7,200,000 | – | ||||||
(USD), 8.38%, 07/15/2049 (b) | 3,550,000 | – | ||||||
General Motors Co. (USD), | 18,855,000 | 20,740,500 | ||||||
GenOn Americas Generation LLC | ||||||||
(USD), 8.50%, 10/01/2021 | 295,000 | 301,638 | ||||||
(USD), 9.13%, 05/01/2031 | 14,180,650 | 14,074,295 | ||||||
Greektown Holdings LLC/Greektown Mothership Corp. (USD), 8.88%, 03/15/2019 (a) | 13,760,000 | 14,241,600 | ||||||
Gymboree Corp. (The) (USD), 9.13%, 12/01/2018 | 6,195,000 | 4,739,175 | ||||||
Halcon Resources Corp. (USD), | 13,160,000 | 13,702,850 | ||||||
HCA Holdings, Inc. (USD), | 14,920,000 | 16,430,650 | ||||||
HCA, Inc. | ||||||||
(USD), 7.50%, 02/15/2022 | 6,645,000 | 7,595,235 | ||||||
(USD), 5.88%, 05/01/2023 | 2,350,000 | 2,397,000 | ||||||
Hercules Offshore, Inc. | ||||||||
(USD), 8.75%, 07/15/2021 (a) | 4,120,000 | 4,459,900 | ||||||
(USD), 7.50%, 10/01/2021 (a) | 6,955,000 | 7,041,938 | ||||||
(USD), 6.75%, 04/01/2022 (a) | 8,520,000 | 8,253,750 | ||||||
Immucor, Inc. (USD), 11.13%, 08/15/2019 | 9,385,000 | 10,651,975 | ||||||
IMS Health, Inc. (USD), 12.50%, 03/01/2018 (a) | 6,398,000 | 7,038,395 | ||||||
Jefferies Finance LLC / JFIN Co-Issuer Corp. | ||||||||
(USD), 7.38%, 04/01/2020 (a) | 6,260,000 | 6,588,650 | ||||||
(USD), 6.88%, 04/15/2022 (a) | 6,925,000 | 6,959,625 | ||||||
Jurassic Holdings III, Inc. (USD), 6.88%, 02/15/2021 (a) | 7,195,000 | 7,464,812 | ||||||
KCG Holdings, Inc. (USD), 8.25%, 06/15/2018 (a) | 6,790,000 | 7,197,400 | ||||||
Landry’s Holdings II, Inc. (USD), 10.25%, 01/01/2018 (a) | 10,515,000 | 11,303,625 | ||||||
Landry’s, Inc. (USD), 9.38%, 05/01/2020 (a) | 11,840,000 | 13,112,800 | ||||||
Lynx I Corp. (GBP), 6.00%, 04/15/2021 (a) | 7,940,000 | 14,126,456 | ||||||
Marquette Transportation Co LLC / Marquette Transportation Finance Corp. (USD), 10.88%, 01/15/2017 (b) | 25,125,000 | 26,726,719 | ||||||
Masco Corp. (USD), 6.50%, 08/15/2032 | 1,380,000 | 1,414,500 | ||||||
McGraw-Hill Global Education Holdings LLC / McGraw-Hill Global Education Finance (USD), 10.00%, 04/01/2021 (a) | 10,275,000 | 11,816,250 | ||||||
Mellon Capital III (GBP), 6.37%, 09/05/2066 (c) | 7,650,000 | 13,541,400 | ||||||
MetroPCS Wireless, Inc. (USD), | 4,915,000 | 5,265,194 | ||||||
Midstates Petroleum Co., Inc. / Midstates Petroleum Co. LLC (USD), 9.25%, 06/01/2021 | 27,360,000 | 28,112,400 | ||||||
Mythen Re Ltd., Series 2012-2, Class A (USD), 8.55%, 01/05/2017 (a)(b)(c) | 5,875,000 | 6,254,231 | ||||||
Neiman Marcus Group Ltd., LLC | ||||||||
(USD), 8.00%, 10/15/2021 (a) | 2,400,000 | 2,640,000 | ||||||
PIK (USD), 8.75%, 10/15/2021 (a) | 600,000 | 666,000 | ||||||
New Albertsons, Inc. | ||||||||
(USD), 7.75%, 06/15/2026 | 8,644,000 | 7,390,620 | ||||||
Series C (USD), MTN, 6.63%, 06/01/2028 | 2,160,000 | 1,636,200 | ||||||
(USD), 7.45%, 08/01/2029 | 7,615,000 | 6,434,675 | ||||||
New Enterprise Stone & Lime Co Inc. (USD), | 11,669,869 | 13,391,175 | ||||||
Northgroup Preferred Capital Corp. (USD), | 7,970,000 | 8,169,250 | ||||||
Palace Entertainment Holdings LLC / Palace Entertainment Holdings Corp. (USD), | 21,470,000 | 22,369,056 | ||||||
PHH Corp. (USD), 6.38%, 08/15/2021 | 14,430,000 | 15,007,200 | ||||||
PNC Preferred Funding Trust I (USD), | 16,215,000 | 15,140,756 | ||||||
See accompanying notes to financial statements.
2014 Semi-Annual Report
37
Table of Contents
Statement of Investments (continued)
April 30, 2014 (Unaudited)
Aberdeen Global High Income Fund
| Shares or Principal Amount | Value | |||||||
Quad/Graphics, Inc. (USD), | $ | 3,160,000 | $ | 3,183,700 | ||||
Residential Reinsurance 2011 Ltd. (USD), | 10,790,000 | 11,348,922 | ||||||
Residential Reinsurance 2013 Ltd. (USD), | 5,380,000 | 5,690,157 | ||||||
Samson Investment Co. (USD), 10.75%, 02/15/2020 (a) | 10,750,000 | 11,395,000 | ||||||
SandRidge Energy, Inc. | ||||||||
(USD), 8.75%, 01/15/2020 | 5,573,000 | 6,053,671 | ||||||
(USD), 7.50%, 03/15/2021 | 6,675,000 | 7,125,563 | ||||||
(USD), 7.50%, 03/15/2021 (a) | 250 | 267 | ||||||
Spanish Broadcasting System, Inc. (USD), | 30,120,000 | 33,583,800 | ||||||
Standard Pacific Corp. (USD), 8.38%, 01/15/2021 | 18,035,000 | 21,461,650 | ||||||
Successor X Ltd. (USD), | 6,845,000 | 7,293,348 | ||||||
SUPERVALU, Inc. (USD), 8.00%, 05/01/2016 | 13,125,000 | 14,585,156 | ||||||
T-Mobile USA, Inc. | ||||||||
(USD), 6.13%, 01/15/2022 | 9,645,000 | 10,175,475 | ||||||
(USD), 6.84%, 04/28/2023 | 1,090,000 | 1,177,200 | ||||||
(USD), 6.50%, 01/15/2024 | 10,745,000 | 11,295,681 | ||||||
Townsquare Radio LLC / Townsquare Radio, Inc. (USD), 9.00%, 04/01/2019 (a) | 17,550,000 | 19,436,625 | ||||||
United Rentals North America, Inc. | ||||||||
(USD), 6.13%, 06/15/2023 | 2,190,000 | 2,365,200 | ||||||
(USD), 5.75%, 11/15/2024 | 7,290,000 | 7,572,487 | ||||||
Verso Paper Holdings LLC / Verso Paper, Inc. (USD), 11.75%, 01/15/2019 | 23,760,000 | 25,779,600 | ||||||
Windstream Corp. (USD), | 13,080,000 | 12,785,700 | ||||||
WPX Energy, Inc. (USD), 6.00%, 01/15/2022 | 25,877,000 | 26,879,734 | ||||||
Wyle Services Corp. (USD), | 12,315,000 | 12,992,325 | ||||||
Zayo Group LLC / Zayo Capital, Inc. (USD), 10.13%, 07/01/2020 | 14,095,000 | 16,367,819 | ||||||
| 1,008,856,126 | ||||||||
VIETNAM (0.4%) | ||||||||
Vingroup JSC (USD), | 10,730,000 | 11,829,825 | ||||||
Total Corporate Bonds | 1,804,866,814 | |||||||
GOVERNMENT BONDS (3.9%) | ||||||||
BRAZIL (0.8%) | ||||||||
Brazil Notas do Tesouro Nacional, Serie F (BRL), 10.00%, 01/01/2023 | 56,735,000 | 22,358,496 | ||||||
HONDURAS (0.5%) | ||||||||
Republic of Honduras (USD), | 12,855,000 | 14,172,638 | ||||||
INDONESIA (0.6%) | ||||||||
Indonesia Government International Bond | ||||||||
(USD), 5.88%, 01/15/2024 (a) | 6,910,000 | 7,497,350 | ||||||
(USD), 6.75%, 01/15/2044 (a) | 7,100,000 | 7,898,750 | ||||||
| 15,396,100 | ||||||||
MEXICO (1.1%) | ||||||||
Mexico Fixed Rate Bonds, Series M10 (MXN), 8.00%, 12/17/2015 | 368,500,000 | 29,953,682 | ||||||
MONGOLIA (0.2%) | ||||||||
Development Bank of Mongolia LLC (USD), MTN, 5.75%, 03/21/2017 (a) | 7,240,000 | 6,887,050 | ||||||
MOZAMBIQUE (0.4%) | ||||||||
Mozambique EMATUM Finance 2020 BV (USD), 6.31%, 09/11/2020 (a) | 10,560,000 | 10,232,640 | ||||||
ZAMBIA (0.3%) | ||||||||
Zambia Government International Bond (USD), 8.50%, 04/14/2024 (a) | 7,930,000 | 8,281,894 | ||||||
Total Government Bonds | 107,282,500 | |||||||
GOVERNMENT AGENCIES (0.1%) | ||||||||
INDONESIA (0.1%) | ||||||||
Pertamina Persero PT (USD), | 4,450,000 | 3,982,750 | ||||||
Total Government Agencies | 3,982,750 | |||||||
BANK LOANS (16.6%) | ||||||||
REPUBLIC OF IRELAND (1.2%) | ||||||||
Eircom Finco S.A.R.L. (EUR), | 25,552,416 | 34,282,187 | ||||||
UNITED STATES (15.4%) | ||||||||
Asurion LLC (USD), 8.50%, 03/03/2021 (c) | 26,625,000 | 27,301,728 | ||||||
Cenevo Corp. (USD), 6.25%, 02/13/2017 (c) | 14,736,457 | 14,773,298 | ||||||
Cengage Learning, Inc. | ||||||||
(USD), 0.00%, 07/03/2014 (c) | 10,905,000 | 10,387,013 | ||||||
(USD), 0.00%, 07/05/2017 (c) | 4,125,351 | 3,924,240 | ||||||
(USD), 7.00%, 03/31/2020 (c) | 6,210,000 | 6,305,479 | ||||||
Commercial Barge Line Co. (USD), | 24,141,150 | 24,261,856 | ||||||
Del Monte Foods, Inc. (USD), | 12,970,000 | 12,864,619 | ||||||
Dream Secured BondCo AB (EUR), | 13,926,846 | 20,516,912 | ||||||
Expera Specialty Solutions (USD), | 9,969,662 | 10,094,283 | ||||||
FMG Resources August 2006 Pty Ltd. (USD), 0.00%, 06/28/2019 (c) | 18,154,386 | 18,167,149 | ||||||
Garda World Security Corp. (CAD), | 4,298,400 | 3,928,256 | ||||||
Gardner Denver, Inc. (USD), | 4,345,000 | 4,342,037 | ||||||
Industrial Packaging Group (USD), | 7,455,000 | 7,455,000 | ||||||
Intertrust Group Holding (USD), | 11,630,000 | 11,688,150 | ||||||
Isola USA Corp. (USD), | 31,824,844 | 32,620,465 | ||||||
Kate Spade & Co. (USD), | 3,640,000 | 3,640,000 | ||||||
McGraw-Hill Global Holdings (USD), | 13,606,424 | 13,722,650 | ||||||
Neiman Marcus Group Ltd., Inc (USD), 4.25%, 10/25/2020 (c) | 28,453,740 | 28,430,038 | ||||||
See accompanying notes to financial statements.
Semi-Annual Report 2014
38
Table of Contents
Statement of Investments (continued)
April 30, 2014 (Unaudited)
Aberdeen Global High Income Fund
| Shares or Principal Amount | Value | |||||||
Newpage Corp. (USD), | $ | 20,715,000 | $ | 20,960,991 | ||||
Pacific Industrial Services US Finco LLC (USD), 8.75%, 04/02/2019 (c) | 7,920,000 | 8,122,950 | ||||||
Pinnacle Operating Corp. (USD), | 11,047,336 | 11,061,145 | ||||||
Redtop Acquisitions, Ltd. | ||||||||
(USD), 8.25%, 06/03/2021 (c) | 902,738 | 934,333 | ||||||
(EUR), 8.50%, 06/03/2021 (c) | 1,135,000 | 1,598,261 | ||||||
Rexam PLC (USD), 0.00%, 03/21/2021 (c) | 9,305,000 | 9,299,184 | ||||||
Reynolds Group Holdings, Inc. (USD), | 3,455,000 | 3,461,748 | ||||||
Telx Group, Inc. (The) (USD), | 1,735,000 | 1,735,000 | ||||||
Texas Competitive Electric Co. (USD), | 36,981,952 | 27,921,374 | ||||||
Van Wagner Communications LLC (USD), 6.27%, 08/03/2018 (b)(c) | 16,078,317 | 16,332,885 | ||||||
Virgin Media Secured Finance PLC (GBP), 0.00%, 06/05/2023 (c) | 13,030,000 | 22,009,653 | ||||||
YPSO France SAS (EUR), | 13,015,000 | 18,011,210 | ||||||
YRC Worldwide, Inc. (USD), | 30,184,350 | 30,467,328 | ||||||
| 426,339,235 | ||||||||
Total Bank Loans | 460,621,422 | |||||||
COMMON STOCKS (1.6%) | ||||||||
NORWAY (1.5%) | ||||||||
Deep Ocean (b)(f) | 1,427,968 | 41,936,347 | ||||||
UNITED STATES (0.1%) | ||||||||
General Motors Co. * | 48,313 | 1,665,832 | ||||||
Motors Liquidation Co. GUC Trust * | 59,350 | 1,635,093 | ||||||
| 3,300,925 | ||||||||
Total Common Stocks | 45,237,272 | |||||||
PREFERRED STOCKS (1.1%) | ||||||||
UNITED STATES (1.1%) | ||||||||
Ally Financial, Inc., Preferred Shares (a)(d) | 22,432 | 22,328,252 | ||||||
GMAC Capital Trust I, Preferred Shares, Series 2 (c) | 255,875 | 7,034,004 | ||||||
Merrill Lynch Capital Trust II, Preferred Shares (c) | 1,600 | 40,672 | ||||||
| 29,402,928 | ||||||||
Total Preferred Stocks | 29,402,928 | |||||||
WARRANTS (0.3%) | ||||||||
UNITED STATES (0.3%) | ||||||||
General Motors Co. * | 452,664 | 9,465,204 | ||||||
Total Warrants | 9,465,204 | |||||||
REPURCHASE AGREEMENT (11.7%) | ||||||||
UNITED STATES (11.7%) | ||||||||
Fixed Income Clearing Corp., 0.00%, dated 04/30/2014, due 05/01/2014, repurchase price $325,401,936 collateralized by U.S. Treasury Note, maturing 12/31/2018 and Government Agencies, maturing ranging 09/28/2016-05/15/2029; total market value of $331,913,690 | $ | 325,401,936 | $ | 325,401,936 | ||||
Total Repurchase Agreement | 325,401,936 | |||||||
Total Investments | 2,786,260,826 | |||||||
Liabilities in excess of other assets—(0.3)% |
| (9,152,626 | ) | |||||
Net Assets—100.0% | $ | 2,777,108,200 | ||||||
| * | Non-income producing security. |
| (a) | Denotes a security issued under Regulation S or Rule 144A. |
| (b) | The Fund’s adviser has deemed this security to be illiquid based upon procedures approved by the Board of Trustees. Illiquid securities held by the Fund represent 6.6% of net assets as of April 30, 2014. |
| (c) | Variable or Floating Rate Security. Rate disclosed is as of April 30, 2014. |
| (d) | Perpetual bond. This is a bond that has no maturity date, is redeemable and pays a steady stream of interest indefinitely. |
| (e) | Security is in default. |
| (f) | Investment in affiliate. |
| (g) | See notes to financial statements for tax unrealized appreciation/depreciation of securities. |
| BRL | Brazilian Real |
| CAD | Canadian Dollar |
| CHF | Swiss Franc |
| EMTN | Euro Medium Term Note |
| EUR | Euro Currency |
| GBP | British Pound Sterling |
| GMTN | Global Medium Term Note |
| MTN | Medium Term Note |
| MXN | Mexican Peso |
| NOK | Norwegian Krone |
| PIK | Payment In Kind |
| USD | U.S. Dollar |
See accompanying notes to financial statements.
2014 Semi-Annual Report
39
Table of Contents
Statement of Investments (continued)
April 30, 2014 (Unaudited)
Aberdeen Global High Income Fund
At April 30, 2014, the Fund’s open forward foreign currency exchange contracts were as follows:
| Purchase Contracts Settlement Date* | Counterparty | Amount Purchased | Amount Sold | Fair Value | Unrealized Appreciation | |||||||||||||||||||||||
| Norwegian Krone/United States Dollar | ||||||||||||||||||||||||||||
| 05/13/2014 | JPMorgan Chase Bank N.A | NOK | 39,311,000 | USD | 6,598,544 | $ | 6,611,125 | $ | 12,581 | |||||||||||||||||||
| Sale Contracts Settlement Date* | Counterparty | Amount Purchased | Amount Sold | Fair Value | Unrealized Depreciation | |||||||||||||||||||||||
| United States Dollar/Brazilian Real | ||||||||||||||||||||||||||||
07/22/2014 | JPMorgan Chase Bank N.A | USD | 23,419,512 | BRL | 53,626,000 | $ | 23,514,734 | $ | (95,222 | ) | ||||||||||||||||||
| United States Dollar/British Pound | ||||||||||||||||||||||||||||
05/23/2014 | Westpac Banking Corp. | USD | 187,926,447 | GBP | 112,867,500 | 190,534,044 | (2,607,597 | ) | ||||||||||||||||||||
| United States Dollar/Canadian Dollar | ||||||||||||||||||||||||||||
06/05/2014 | JPMorgan Chase Bank N.A | USD | 71,585,139 | CAD | 79,490,500 | 72,465,149 | (880,010 | ) | ||||||||||||||||||||
| United States Dollar/Euro | ||||||||||||||||||||||||||||
05/12/2014 | JPMorgan Chase Bank N.A | USD | 55,957,107 | EUR | 41,164,000 | 57,107,918 | (1,150,811 | ) | ||||||||||||||||||||
07/28/2014 | JPMorgan Chase Bank N.A | USD | 6,433,622 | EUR | 4,655,500 | 6,457,646 | (24,024 | ) | ||||||||||||||||||||
07/29/2014 | Deutsche Bank AG | USD | 77,046,499 | EUR | 55,693,500 | 77,252,396 | (205,897 | ) | ||||||||||||||||||||
| United States Dollar/Norwegian Krone | ||||||||||||||||||||||||||||
| 05/13/2014 | JPMorgan Chase Bank N.A | USD | 44,586,915 | NOK | 273,835,000 | 46,052,185 | (1,465,270 | ) | ||||||||||||||||||||
| $ | 473,384,072 | $ | (6,428,831 | ) | ||||||||||||||||||||||||
| * | Certain contracts with different trade dates and like characteristics have been shown net. |
At April 30, 2014, the Fund held the following credit default swap contracts:
Sell Protection:
| Counterparty | Expiration Date | Notional Amount | Swap Details | Unrealized Appreciation/ (Depreciation) | Implied Credit Spread* | |||||||||||||
| UBS AG | 12/20/2016 | 4,320,000 | Pay: Grohe Holding Gmbh(T) Receive: Fixed rate equal to 5.00% | $ | 750,855 | 0.25% | ||||||||||||
| Deutsche Bank | 12/20/2016 | 4,320,000 | Pay: Grohe Holding Gmbh(T) Receive: Fixed rate equal to 5.00% | 1,413,735 | 0.25% | |||||||||||||
| Goldman Sachs International | 12/20/2017 | 8,440,000 | Pay: Chesapeake Energy(T) Receive: Fixed rate equal to 5.00% | 1,184,413 | 1.10% | |||||||||||||
| Goldman Sachs International | 12/20/2017 | 9,935,000 | Pay: Chesapeake Energy(T) Receive: Fixed rate equal to 5.00% | 2,064,823 | 1.10% | |||||||||||||
| Goldman Sachs International | 12/20/2017 | 9,940,000 | Pay: Chesapeake Energy(T) Receive: Fixed rate equal to 5.00% | 2,065,862 | 1.10% | |||||||||||||
| Deutsche Bank | 03/20/2018 | 3,460,000 | Pay: Rite Aid(T) Receive: Fixed rate equal to 5.00% | 562,640 | 1.62% | |||||||||||||
| Goldman Sachs International | 03/20/2018 | 5,000,000 | Pay: Rite Aid(T) Receive: Fixed rate equal to 5.00% | 813,063 | 1.62% | |||||||||||||
| Goldman Sachs International | 03/20/2018 | 5,000,000 | Pay: Rite Aid(T) Receive: Fixed rate equal to 5.00% | 825,563 | 1.62% | |||||||||||||
| Morgan Stanley | 06/20/2018 | 4,500,000 | Pay: New Albertsons(T) Receive: Fixed rate equal to 5.00% | 225,418 | 5.99% | |||||||||||||
| Morgan Stanley | 06/20/2018 | 4,515,000 | Pay: New Albertsons(T) Receive: Fixed rate equal to 5.00% | 237,457 | 5.99% | |||||||||||||
| $ | 10,143,829 | |||||||||||||||||
| * | Implied credit spreads, represented in absolute terms, are utilized in determining the market value of credit default swaps agreements on corporate issues or sovereign issues and serve as an indicator of the current status of the payment/performance risk and represent the likelihood or risk of default for the credit derivative. The implied credit spread of a particular referenced entity reflects the cost of buying/selling protection and may include upfront payments required to be made prior to entering into the agreement. For credit default swaps with asset-backed securities or credit indices as the underlying assets, the quoted market prices and resulting market values serve as an indicator of the current status of the payment/performance risk. Wider credit spreads and increasing market values, in absolute terms when compared to the notional amount of the swap, represent a deterioration of the reference entity’s credit soundness and a greater likelihood or risk of default or other credit event occurring as defined under the terms of the agreement. |
See accompanying notes to financial statements.
Semi-Annual Report 2014
40
Table of Contents
Statement of Investments (concluded)
April 30, 2014 (Unaudited)
Aberdeen Global High Income Fund
Centrally cleared credit default swap contracts:
| Pay/Receive Floating Rate | Floating Rate Index | Fixed Rate | Maturity Date | Notional Amount | Unrealized Appreciation/ (Depreciation) | |||||||||||||
| Pay | Markit CDX North America High Yield (S20) | 5.00% | 6/20/2018 | USD50,600,000 | $ | 1,442,619 | ||||||||||||
| Pay | Markit CDX North America High Yield (S20) | 5.00% | 12/20/2018 | USD31,660,000 | 105,284 | |||||||||||||
| $ | 1,547,903 | |||||||||||||||||
See accompanying notes to financial statements.
2014 Semi-Annual Report
41
Table of Contents
Statements of Assets and Liabilities (Unaudited)
April 30, 2014
| Aberdeen Global Select Opportunities Fund | Aberdeen Select International Equity Fund | Aberdeen Select International Equity Fund II | Aberdeen Total Return Bond Fund | Aberdeen Global High Income Fund | ||||||||||||||||
Assets: | ||||||||||||||||||||
Investments in securities, at fair value | $ | 7,632,563 | $ | 556,207,699 | $ | 256,893,838 | $ | 1,483,728,992 | $ | 2,418,922,543 | ||||||||||
Affiliated securities, at fair value (Note 7) | – | 2,051,930 | – | – | 41,936,347 | |||||||||||||||
Repurchase agreements | – | – | 13,018,077 | 70,129,972 | 325,401,936 | |||||||||||||||
|
|
|
|
|
|
|
|
|
| |||||||||||
Total investments | 7,632,563 | 558,259,629 | 269,911,915 | 1,553,858,964 | 2,786,260,826 | |||||||||||||||
|
|
|
|
|
|
|
|
|
| |||||||||||
Foreign currency, at fair value | 2,765 | 718,079 | 467,646 | 227,852 | 57,361,913 | |||||||||||||||
Cash on deposit for broker | – | – | – | – | 4,360,048 | |||||||||||||||
Cash | 34,296 | – | – | – | 641,626 | |||||||||||||||
Receivable for investments sold | 277,971 | 11,324,453 | – | 3,611,395 | 50,270,560 | |||||||||||||||
Interest and dividends receivable | 53,128 | 7,002,027 | 5,196,433 | 10,365,923 | 36,807,438 | |||||||||||||||
Receivable for capital shares issued | – | 124,055 | 82,821 | 2,445,302 | 7,314,442 | |||||||||||||||
Unrealized appreciation on forward foreign currency exchange contracts | – | – | – | 649,348 | 12,581 | |||||||||||||||
Variation margin receivable for centrally cleared credit default swap contracts | – | – | – | – | 14,689 | |||||||||||||||
Receivable from advisor (Note 3) | 877 | – | – | – | – | |||||||||||||||
Open credit default swap contracts, at value | – | – | – | – | 7,335,570 | |||||||||||||||
Prepaid expenses | 585 | 47,088 | 19,289 | 127,108 | 217,978 | |||||||||||||||
|
|
|
|
|
|
|
|
|
| |||||||||||
Total assets | 8,002,185 | 577,475,331 | 275,678,104 | 1,571,285,892 | 2,950,597,671 | |||||||||||||||
|
|
|
|
|
|
|
|
|
| |||||||||||
Liabilities: | ||||||||||||||||||||
Payable for investments purchased | 8,278 | 343,890 | 153,670 | 31,491,708 | 154,538,572 | |||||||||||||||
Collateral from broker | – | – | – | – | 7,880,000 | |||||||||||||||
Unrealized depreciation on forward foreign currency exchange contracts | – | – | – | 1,175,563 | 6,428,831 | |||||||||||||||
Due to custodian | – | – | – | 6,274,377 | – | |||||||||||||||
Payable for capital shares redeemed | – | 605,075 | 140,037 | 938,326 | 2,209,452 | |||||||||||||||
Open credit default swap contracts, at value | – | – | – | – | 247,075 | |||||||||||||||
Unfunded loan commitments (Note 2) | – | – | – | – | 104,936 | |||||||||||||||
Distributions payable | – | – | – | – | 171 | |||||||||||||||
Accrued expenses and other payables: | ||||||||||||||||||||
Investment advisory fees | – | 423,483 | 203,050 | 429,410 | 1,470,788 | |||||||||||||||
Distribution fees | 3,387 | 123,784 | 50,069 | 48,327 | 282,641 | |||||||||||||||
Transfer agent fees | 1,492 | 22,639 | 63,434 | 18,697 | 91,173 | |||||||||||||||
Legal fees | 272 | 23,944 | 12,160 | 56,235 | 73,172 | |||||||||||||||
Custodian fees | 4,460 | 35,646 | 18,564 | 21,852 | 178 | |||||||||||||||
Other | 14,325 | 577,497 | 166,288 | 178,408 | 162,482 | |||||||||||||||
|
|
|
|
|
|
|
|
|
| |||||||||||
Total liabilities | 32,214 | 2,155,958 | 807,272 | 40,632,903 | 173,489,471 | |||||||||||||||
|
|
|
|
|
|
|
|
|
| |||||||||||
Net Assets | $ | 7,969,971 | $ | 575,319,373 | $ | 274,870,832 | $ | 1,530,652,989 | $ | 2,777,108,200 | ||||||||||
|
|
|
|
|
|
|
|
|
| |||||||||||
Cost: | ||||||||||||||||||||
Investments in securities, at cost | $ | 7,257,860 | $ | 573,660,412 | $ | 245,933,712 | $ | 1,467,949,441 | $ | 2,319,246,361 | ||||||||||
Affiliated securities, at cost (Note 7) | – | 27,205,984 | – | – | 30,083,125 | |||||||||||||||
Repurchase agreements | – | – | 13,018,077 | 70,129,972 | 325,401,936 | |||||||||||||||
Up-front payments made on open credit default swap contracts | – | – | – | – | 5,492,785 | |||||||||||||||
Up-front payments received on open credit default swap contracts | – | – | – | – | (3,095,251 | ) | ||||||||||||||
Foreign currency | 2,765 | 1,719,858 | 468,080 | 226,396 | 57,031,958 | |||||||||||||||
Net Assets Consist of: | ||||||||||||||||||||
Par value | $ | 191 | $ | 19,586 | $ | 21,583 | $ | 115,246 | $ | 266,839 | ||||||||||
Paid in capital in excess of par value | 35,251,126 | 2,876,622,201 | 2,971,581,382 | 1,517,839,032 | 2,619,989,360 | |||||||||||||||
Accumulated net investment income/(loss) | 211,047 | 16,446,701 | 7,548,125 | 7,631,380 | (697,530 | ) | ||||||||||||||
Accumulated net realized gain/(loss) from investments and foreign currency transactions | (27,867,417 | ) | (2,274,240,672 | ) | (2,715,308,268 | ) | (10,255,277 | ) | 40,919,378 | |||||||||||
Net unrealized appreciation/(depreciation) on investments and translation of assets and liabilities denominated in foreign currencies | 375,024 | (43,528,443 | ) | 11,028,010 | 15,322,608 | 116,630,153 | ||||||||||||||
|
|
|
|
|
|
|
|
|
| |||||||||||
Net Assets | $ | 7,969,971 | $ | 575,319,373 | $ | 274,870,832 | $ | 1,530,652,989 | $ | 2,777,108,200 | ||||||||||
|
|
|
|
|
|
|
|
|
| |||||||||||
Net Assets | ||||||||||||||||||||
Class A Shares | $ | 6,434,026 | $ | 474,089,042 | $ | 149,301,796 | $ | 132,150,526 | $ | 1,102,519,851 | ||||||||||
Institutional Class Shares (a) | 1,535,945 | 101,230,331 | 125,569,036 | 1,398,502,463 | 1,674,588,349 | |||||||||||||||
|
|
|
|
|
|
|
|
|
| |||||||||||
Total | $ | 7,969,971 | $ | 575,319,373 | $ | 274,870,832 | $ | 1,530,652,989 | $ | 2,777,108,200 | ||||||||||
|
|
|
|
|
|
|
|
|
| |||||||||||
| (a) | Formerly Class I shares. |
Amounts listed as “–” are $0 or round to $0.
See accompanying notes to financial statements.
Semi-Annual Report 2014
42
Table of Contents
Statements of Assets and Liabilities (Unaudited) (concluded)
April 30, 2014
| Aberdeen Global Select Opportunities Fund | Aberdeen Select International Equity Fund | Aberdeen Select International Equity Fund II | Aberdeen Total Return Bond Fund | Aberdeen Global High Income Fund | ||||||||||||||||
Shares Outstanding | ||||||||||||||||||||
Class A Shares | 154,788 | 16,205,504 | 11,724,866 | 9,833,095 | 102,660,210 | |||||||||||||||
Institutional Class Shares (a) | 36,665 | 3,380,791 | 9,857,780 | 105,412,980 | 164,179,158 | |||||||||||||||
|
|
|
|
|
|
|
|
|
| |||||||||||
Total | 191,453 | 19,586,295 | 21,582,646 | 115,246,075 | 266,839,368 | |||||||||||||||
|
|
|
|
|
|
|
|
|
| |||||||||||
Net asset value and redemption price per share | ||||||||||||||||||||
Class A Shares | $ | 41.57 | (b) | $ | 29.25 | $ | 12.73 | $ | 13.44 | $ | 10.74 | |||||||||
Institutional Class Shares (a) | $ | 41.89 | (b) | $ | 29.94 | $ | 12.74 | $ | 13.27 | $ | 10.20 | |||||||||
| (a) | Formerly Class I shares. |
| (b) | The NAV shown above differs from the traded NAV on April 30, 2014 due to financial statement rounding and/or financial statement adjustments. |
Amounts listed as “–” are $0 or round to $0.
See accompanying notes to financial statements.
2014 Semi-Annual Report
43
Table of Contents
Statements of Operations
For the Six Months Ended April 30, 2014 (Unaudited)
| Aberdeen Global Select Opportunities Fund | Aberdeen Select International Equity Fund | Aberdeen Select International Equity Fund II | Aberdeen Total Return Bond Fund | Aberdeen Global High Income Fund | ||||||||||||||||
INVESTMENT INCOME: | ||||||||||||||||||||
Dividend income | $ | 271,115 | $ | 21,527,819 | $ | 10,273,581 | $ | – | $ | 1,140,414 | ||||||||||
Interest income | 177 | 703,129 | 157 | 26,062,773 | 90,817,880 | |||||||||||||||
Foreign tax withholding | (8,552 | ) | (873,655 | ) | (425,233 | ) | – | – | ||||||||||||
Other income | – | 575 | – | 365,851 | – | |||||||||||||||
|
|
|
|
|
|
|
|
|
| |||||||||||
| 262,740 | 21,357,868 | 9,848,505 | 26,428,624 | 91,958,294 | ||||||||||||||||
|
|
|
|
|
|
|
|
|
| |||||||||||
Expenses: | ||||||||||||||||||||
Investment advisory fees | 35,199 | 2,655,737 | 1,291,337 | 2,684,833 | 8,629,239 | |||||||||||||||
Distribution fees Class A | 6,688 | 574,070 | 175,633 | 168,400 | 1,240,385 | |||||||||||||||
Custodian fees | 17,322 | 99,717 | 53,999 | 159,163 | 247,869 | |||||||||||||||
Printing fees | 1,460 | 69,300 | 54,545 | 147,007 | 190,941 | |||||||||||||||
Transfer agent fees | 3,701 | 52,691 | 69,386 | 46,428 | 283,765 | |||||||||||||||
Trustee fees | 674 | 53,466 | 28,470 | 120,431 | 189,138 | |||||||||||||||
Legal fees | 436 | 36,126 | 18,017 | 87,726 | 130,884 | |||||||||||||||
Audit fees | 22,198 | 36,574 | 29,716 | 24,811 | 28,073 | |||||||||||||||
Registration and filing fees | 15,753 | 22,527 | 24,759 | 21,501 | 52,249 | |||||||||||||||
Other | 5,214 | 160,437 | 133,072 | 130,405 | 326,165 | |||||||||||||||
|
|
|
|
|
|
|
|
|
| |||||||||||
Total expenses before reimbursed/waived expenses | 108,645 | 3,760,645 | 1,878,934 | 3,590,705 | 11,318,708 | |||||||||||||||
Interest expense (Note 12) | 28 | 3,235 | 2,280 | – | – | |||||||||||||||
|
|
|
|
|
|
|
|
|
| |||||||||||
Total operating expenses before reimbursed/waived expenses | 108,673 | 3,763,880 | 1,881,214 | 3,590,705 | 11,318,708 | |||||||||||||||
Expenses reimbursed (Note 3) | (56,785 | ) | – | – | (24,265 | ) | (55,131 | ) | ||||||||||||
Expenses waived by investment adviser | (195 | ) | (14,754 | ) | (7,174 | ) | (38,355 | ) | (66,379 | ) | ||||||||||
|
|
|
|
|
|
|
|
|
| |||||||||||
Net expenses | 51,693 | 3,749,126 | 1,874,040 | 3,528,085 | 11,197,198 | |||||||||||||||
|
|
|
|
|
|
|
|
|
| |||||||||||
Net Investment Income | 211,047 | 17,608,742 | 7,974,465 | 22,900,539 | 80,761,096 | |||||||||||||||
|
|
|
|
|
|
|
|
|
| |||||||||||
REALIZED/UNREALIZED GAIN/(LOSS) FROM INVESTMENTS: | ||||||||||||||||||||
Realized gain/(loss) on investment transactions | 71,059 | (14,204,925 | ) | 4,897,875 | (9,355,586 | ) | 41,925,525 | |||||||||||||
Realized gain on swap contracts | – | – | – | – | 3,195,759 | |||||||||||||||
Realized gain/(loss) on foreign currency transactions | 104 | (607,679 | ) | 58,676 | 1,417,811 | (4,752,463 | ) | |||||||||||||
|
|
|
|
|
|
|
|
|
| |||||||||||
Net realized gain/(loss) from investments and foreign currency transactions | 71,163 | (14,812,604 | ) | 4,956,551 | (7,937,775 | ) | 40,368,821 | |||||||||||||
|
|
|
|
|
|
|
|
|
| |||||||||||
Net change in unrealized appreciation/depreciation on investment transactions | 117,576 | 19,570,491 | (1,859,062 | ) | 17,981,889 | 19,689,721 | ||||||||||||||
Net change in unrealized appreciation/depreciation on credit default swap contracts | – | – | – | – | 471,637 | |||||||||||||||
Net change in unrealized appreciation/depreciation on translation of assets and liabilities denominated in foreign currencies | 309 | (39,812 | ) | 38,334 | (2,247,106 | ) | (5,448,365 | ) | ||||||||||||
|
|
|
|
|
|
|
|
|
| |||||||||||
Net change in unrealized appreciation/depreciation from investments and translation of assets and liabilities denominated in foreign currencies | 117,885 | 19,530,679 | (1,820,728 | ) | 15,734,783 | 14,712,993 | ||||||||||||||
|
|
|
|
|
|
|
|
|
| |||||||||||
Net realized/unrealized gain from investments and foreign currency transactions | 189,048 | 4,718,075 | 3,135,823 | 7,797,008 | 55,081,814 | |||||||||||||||
|
|
|
|
|
|
|
|
|
| |||||||||||
CHANGE IN NET ASSETS RESULTING FROM OPERATIONS | $ | 400,095 | $ | 22,326,817 | $ | 11,110,288 | $ | 30,697,547 | $ | 135,842,910 | ||||||||||
|
|
|
|
|
|
|
|
|
| |||||||||||
Amounts listed as “–” are $0 or round to $0.
See accompanying notes to financial statements.
Semi-Annual Report 2014
44
Table of Contents
Statements of Changes in Net Assets
| Aberdeen Global Select Opportunities Fund | Aberdeen Select International Equity Fund | Aberdeen Select International Equity Fund II | ||||||||||||||||||||||
| Six Months Ended April 30, 2014 (Unaudited) | Year Ended October 31, 2013 | Six Months Ended April 30, 2014 (Unaudited) | Year Ended October 31, 2013 | Six Months Ended April 30, 2014 (Unaudited) | Year Ended October 31, 2013 | |||||||||||||||||||
FROM INVESTMENT ACTIVITIES: | ||||||||||||||||||||||||
Operations: | ||||||||||||||||||||||||
Net investment income | $ | 211,047 | $ | 104,524 | $ | 17,608,742 | $ | 12,704,084 | $ | 7,974,465 | $ | 6,359,673 | ||||||||||||
Net realized gain/(loss) from investments and foreign currency transactions | 71,163 | 2,113,010 | (14,812,604 | ) | (5,332,048 | ) | 4,956,551 | 113,329,080 | ||||||||||||||||
Net change in unrealized appreciation/depreciation on investments and translation of assets and liabilities denominated in foreign currencies | 117,885 | (450,542 | ) | 19,530,679 | 185,149,413 | (1,820,728 | ) | 10,445,083 | ||||||||||||||||
|
|
|
|
|
|
|
|
|
|
|
| |||||||||||||
Changes in net assets resulting from operations | 400,095 | 1,766,992 | 22,326,817 | 192,521,449 | 11,110,288 | 130,133,836 | ||||||||||||||||||
|
|
|
|
|
|
|
|
|
|
|
| |||||||||||||
Distributions to Shareholders From: | ||||||||||||||||||||||||
Net investment income: | ||||||||||||||||||||||||
Class A | (81,732 | ) | (66,027 | ) | (11,058,718 | ) | (4,106,087 | ) | (69,226 | ) | (5,866,610 | ) | ||||||||||||
Institutional Class(a) | (25,288 | ) | (121,751 | ) | (2,430,830 | ) | (3,400,872 | ) | (331,201 | ) | (19,825,207 | ) | ||||||||||||
Tax return of capital: | ||||||||||||||||||||||||
Class A | – | – | – | – | – | (19,892 | ) | |||||||||||||||||
Institutional Class(a) | – | – | – | – | – | (67,223 | ) | |||||||||||||||||
|
|
|
|
|
|
|
|
|
|
|
| |||||||||||||
Change in net assets from shareholder distributions | (107,020 | ) | (187,778 | ) | (13,489,548 | ) | (7,506,959 | ) | (400,427 | ) | (25,778,932 | ) | ||||||||||||
|
|
|
|
|
|
|
|
|
|
|
| |||||||||||||
Change in net assets from capital transactions | (601,329 | ) | (13,423,051 | ) | (99,332,888 | ) | (1,535,775,674 | ) | (61,743,397 | ) | (862,862,469 | ) | ||||||||||||
|
|
|
|
|
|
|
|
|
|
|
| |||||||||||||
Change in net assets | (308,254 | ) | (11,843,837 | ) | (90,495,619 | ) | (1,350,761,184 | ) | (51,033,536 | ) | (758,507,565 | ) | ||||||||||||
|
|
|
|
|
|
|
|
|
|
|
| |||||||||||||
Net Assets: | ||||||||||||||||||||||||
Beginning of period | 8,278,225 | 20,122,062 | 665,814,992 | 2,016,576,176 | 325,904,368 | 1,084,411,933 | ||||||||||||||||||
|
|
|
|
|
|
|
|
|
|
|
| |||||||||||||
End of period | $ | 7,969,971 | $ | 8,278,225 | $ | 575,319,373 | $ | 665,814,992 | $ | 274,870,832 | $ | 325,904,368 | ||||||||||||
|
|
|
|
|
|
|
|
|
|
|
| |||||||||||||
Accumulated net investment income/(loss) at end of period | $ | 211,047 | $ | 107,020 | $ | 16,446,701 | $ | 12,327,507 | $ | 7,548,125 | $ | (25,913 | ) | |||||||||||
|
|
|
|
|
|
|
|
|
|
|
| |||||||||||||
CAPITAL TRANSACTIONS: | ||||||||||||||||||||||||
Class A Shares | ||||||||||||||||||||||||
Proceeds from shares issued | $ | 215,611 | $ | 301,623 | $ | 5,198,575 | $ | 23,630,146 | $ | 5,468,460 | $ | 19,819,098 | ||||||||||||
Dividends reinvested | 68,591 | 56,726 | 10,795,351 | 3,990,997 | 66,355 | 5,697,322 | ||||||||||||||||||
Cost of shares redeemed | (626,102 | ) | (3,407,856 | ) | (104,005,137 | ) | (483,590,343 | ) | (30,146,249 | ) | (172,267,934 | ) | ||||||||||||
|
|
|
|
|
|
|
|
|
|
|
| |||||||||||||
Total Class A | (341,900 | ) | (3,049,507 | ) | (88,011,211 | ) | (455,969,200 | ) | (24,611,434 | ) | (146,751,514 | ) | ||||||||||||
|
|
|
|
|
|
|
|
|
|
|
| |||||||||||||
Institutional Class Shares(a) | ||||||||||||||||||||||||
Proceeds from shares issued | 71,537 | 795,739 | 2,018,347 | 31,099,736 | 2,215,225 | 44,087,986 | ||||||||||||||||||
Dividends reinvested | 9,372 | 106,344 | 2,318,673 | 3,218,155 | 283,163 | 15,429,334 | ||||||||||||||||||
Cost of shares redeemed | (340,338 | ) | (11,275,627 | ) | (15,658,697 | ) | (1,114,124,365 | ) | (39,630,351 | ) | (775,628,275 | ) | ||||||||||||
|
|
|
|
|
|
|
|
|
|
|
| |||||||||||||
Total Institutional Class | (259,429 | ) | (10,373,544 | ) | (11,321,677 | ) | (1,079,806,474 | ) | (37,131,963 | ) | (716,110,955 | ) | ||||||||||||
|
|
|
|
|
|
|
|
|
|
|
| |||||||||||||
Change in net assets from capital transactions: | $ | (601,329 | ) | $ | (13,423,051 | ) | $ | (99,332,888 | ) | $ | (1,535,775,674 | ) | $ | (61,743,397 | ) | $ | (862,862,469 | ) | ||||||
|
|
|
|
|
|
|
|
|
|
|
| |||||||||||||
| (a) | Formerly Class I shares. |
Amounts listed as “–” are $0 or round to $0.
See accompanying notes to financial statements.
2014 Semi-Annual Report
45
Table of Contents
Statements of Changes in Net Assets (continued)
| Aberdeen Global Select Opportunities Fund | Aberdeen Select International Equity Fund | Aberdeen Select International Equity Fund II | ||||||||||||||||||||||
| Six Months Ended April 30, 2014 (Unaudited) | Year Ended October 31, 2013 | Six Months Ended April 30, 2014 (Unaudited) | Year Ended October 31, 2013 | Six Months Ended April 30, 2014 (Unaudited) | Year Ended October 31, 2013 | |||||||||||||||||||
SHARE TRANSACTIONS: | ||||||||||||||||||||||||
Class A Shares | ||||||||||||||||||||||||
Issued | 5,506 | 8,287 | 188,811 | 897,457 | 456,011 | 1,781,931 | ||||||||||||||||||
Reinvested | 1,772 | 1,608 | 397,912 | 158,310 | 5,628 | 526,555 | ||||||||||||||||||
Redeemed | (15,875 | ) | (94,032 | ) | (3,762,491 | ) | (18,499,520 | ) | (2,527,452 | ) | (15,339,291 | ) | ||||||||||||
|
|
|
|
|
|
|
|
|
|
|
| |||||||||||||
Total Class A Shares | (8,597 | ) | (84,137 | ) | (3,175,768 | ) | (17,443,753 | ) | (2,065,813 | ) | (13,030,805 | ) | ||||||||||||
|
|
|
|
|
|
|
|
|
|
|
| |||||||||||||
Institutional Class Shares(a) | ||||||||||||||||||||||||
Issued | 1,815 | 21,588 | 71,543 | 1,169,982 | 185,935 | 3,954,574 | ||||||||||||||||||
Reinvested | 240 | 2,992 | 83,556 | 124,880 | 24,017 | 1,427,320 | ||||||||||||||||||
Redeemed | (8,475 | ) | (303,630 | ) | (554,860 | ) | (44,111,272 | ) | (3,294,860 | ) | (69,588,993 | ) | ||||||||||||
|
|
|
|
|
|
|
|
|
|
|
| |||||||||||||
Total Institutional Class Shares | (6,420 | ) | (279,050 | ) | (399,761 | ) | (42,816,410 | ) | (3,084,908 | ) | (64,207,099 | ) | ||||||||||||
|
|
|
|
|
|
|
|
|
|
|
| |||||||||||||
Total change in shares: | (15,017 | ) | (363,187 | ) | (3,575,529 | ) | (60,260,163 | ) | (5,150,721 | ) | (77,237,904 | ) | ||||||||||||
|
|
|
|
|
|
|
|
|
|
|
| |||||||||||||
| (a) | Formerly Class I shares. |
Amounts listed as “–” are $0 or round to $0.
See accompanying notes to financial statements.
Semi-Annual Report 2014
46
Table of Contents
Statements of Changes in Net Assets (continued)
| Aberdeen Total Return Bond Fund | Aberdeen Global High Income Fund | |||||||||||||||
| Six Months Ended April 30, 2014 (Unaudited) | Year Ended October 31, 2013 | Six Months Ended April 30, 2014 (Unaudited) | Year Ended October 31, 2013 | |||||||||||||
FROM INVESTMENT ACTIVITIES: | ||||||||||||||||
Operations: | ||||||||||||||||
Net investment income | $ | 22,900,539 | $ | 47,923,641 | $ | 80,761,096 | $ | 189,157,865 | ||||||||
Net realized gain/(loss) from investments and foreign currency transactions | (7,937,775 | ) | (1,523,542 | ) | 40,368,821 | 45,790,862 | ||||||||||
Net change in unrealized appreciation/depreciation on investments and translation of assets and liabilities denominated in foreign currencies | 15,734,783 | (77,068,769 | ) | 14,712,993 | 41,270,309 | |||||||||||
|
|
|
|
|
|
|
| |||||||||
Changes in net assets resulting from operations | 30,697,547 | (30,668,670 | ) | 135,842,910 | 276,219,036 | |||||||||||
|
|
|
|
|
|
|
| |||||||||
Distributions to Shareholders From: | ||||||||||||||||
Net investment income: | ||||||||||||||||
Class A | (1,207,900 | ) | (4,299,327 | ) | (30,201,787 | ) | (65,954,427 | ) | ||||||||
Institutional Class(a) | (13,866,684 | ) | (44,687,602 | ) | (50,033,795 | ) | (125,993,854 | ) | ||||||||
Net realized gains: | ||||||||||||||||
Class A | – | (5,210,543 | ) | (10,366,807 | ) | – | ||||||||||
Institutional Class(a) | – | (38,408,459 | ) | (16,935,520 | ) | – | ||||||||||
Tax return of capital: | ||||||||||||||||
Class A | – | (297,269 | ) | – | – | |||||||||||
Institutional Class(a) | – | (3,004,325 | ) | – | – | |||||||||||
|
|
|
|
|
|
|
| |||||||||
Change in net assets from shareholder distributions | (15,074,584 | ) | (95,907,525 | ) | (107,537,909 | ) | (191,948,281 | ) | ||||||||
|
|
|
|
|
|
|
| |||||||||
Change in net assets from capital transactions | (88,115,707 | ) | (366,632,551 | ) | 196,009,700 | (728,529,427 | ) | |||||||||
|
|
|
|
|
|
|
| |||||||||
Change in net assets | (72,492,744 | ) | (493,208,746 | ) | 224,314,701 | (644,258,672 | ) | |||||||||
|
|
|
|
|
|
|
| |||||||||
Net Assets: | ||||||||||||||||
Beginning of period | 1,603,145,733 | 2,096,354,479 | 2,552,793,499 | 3,197,052,171 | ||||||||||||
|
|
|
|
|
|
|
| |||||||||
End of period | $ | 1,530,652,989 | $ | 1,603,145,733 | $ | 2,777,108,200 | $ | 2,552,793,499 | ||||||||
|
|
|
|
|
|
|
| |||||||||
Accumulated net investment income/(loss) at end of period | $ | 7,631,380 | $ | (194,575 | ) | $ | (697,530 | ) | $ | (1,223,044 | ) | |||||
|
|
|
|
|
|
|
| |||||||||
CAPITAL TRANSACTIONS: | ||||||||||||||||
Class A Shares | ||||||||||||||||
Proceeds from shares issued | $ | 9,528,648 | $ | 52,159,444 | $ | 307,642,118 | $ | 527,872,170 | ||||||||
Dividends reinvested | 1,166,958 | 9,308,255 | 38,430,057 | 61,441,634 | ||||||||||||
Cost of shares redeemed | (33,206,092 | ) | (141,400,907 | ) | (255,380,475 | ) | (688,395,319 | ) | ||||||||
|
|
|
|
|
|
|
| |||||||||
Total Class A | (22,510,486 | ) | (79,933,208 | ) | 90,691,700 | (99,081,515 | ) | |||||||||
|
|
|
|
|
|
|
| |||||||||
Institutional Class Shares(a) | ||||||||||||||||
Proceeds from shares issued | 164,646,718 | 631,907,782 | 343,007,625 | 601,335,385 | ||||||||||||
Dividends reinvested | 12,751,439 | 76,876,705 | 40,691,411 | 73,429,672 | ||||||||||||
Cost of shares redeemed | (243,003,378 | ) | (995,483,830 | ) | (278,381,036 | ) | (1,304,212,969 | ) | ||||||||
|
|
|
|
|
|
|
| |||||||||
Total Institutional Class | (65,605,221 | ) | (286,699,343 | ) | 105,318,000 | (629,447,912 | ) | |||||||||
|
|
|
|
|
|
|
| |||||||||
Change in net assets from capital transactions: | $ | (88,115,707 | ) | $ | (366,632,551 | ) | $ | 196,009,700 | $ | (728,529,427 | ) | |||||
|
|
|
|
|
|
|
| |||||||||
| (a) | Formerly Class I shares. |
Amounts listed as “–” are $0 or round to $0.
See accompanying notes to financial statements.
2014 Semi-Annual Report
47
Table of Contents
Statements of Changes in Net Assets (concluded)
| Aberdeen Total Return Bond Fund | Aberdeen Global High Income Fund | |||||||||||||||
| Six Months Ended April 30, 2014 (Unaudited) | Year Ended October 31, 2013 | Six Months Ended April 30, 2014 (Unaudited) | Year Ended October 31, 2013 | |||||||||||||
SHARE TRANSACTIONS: | ||||||||||||||||
Class A Shares | ||||||||||||||||
Issued | 717,547 | 3,797,927 | 28,806,569 | 50,013,584 | ||||||||||||
Reinvested | 88,112 | 676,714 | 3,610,165 | 5,837,364 | ||||||||||||
Redeemed | (2,506,545 | ) | (10,383,334 | ) | (23,904,153 | ) | (65,272,510 | ) | ||||||||
|
|
|
|
|
|
|
| |||||||||
Total Class A Shares | (1,700,886 | ) | (5,908,693 | ) | 8,512,581 | (9,421,562 | ) | |||||||||
|
|
|
|
|
|
|
| |||||||||
Institutional Class Shares(a) | ||||||||||||||||
Issued | 12,564,942 | 46,775,581 | 33,784,153 | 59,865,847 | ||||||||||||
Reinvested | 974,782 | 5,669,319 | 4,021,060 | 7,331,410 | ||||||||||||
Redeemed | (18,562,798 | ) | (73,808,272 | ) | (27,435,540 | ) | (129,908,352 | ) | ||||||||
|
|
|
|
|
|
|
| |||||||||
Total Institutional Class Shares | (5,023,074 | ) | (21,363,372 | ) | 10,369,673 | (62,711,095 | ) | |||||||||
|
|
|
|
|
|
|
| |||||||||
Total change in shares: | (6,723,960 | ) | (27,272,065 | ) | 18,882,254 | (72,132,657 | ) | |||||||||
|
|
|
|
|
|
|
| |||||||||
| (a) | Formerly Class I shares. |
Amounts listed as “–” are $0 or round to $0.
See accompanying notes to financial statements.
Semi-Annual Report 2014
48
Table of Contents
This page intentionally left blank.
Table of Contents
Financial Highlights
Selected Data for Each Share of Capital Outstanding Throughout the Periods Indicated
Aberdeen Global Select Opportunities Fund Inc.
| Investment Activities | Distributions | |||||||||||||||||||||||||||
| Net Asset Value, Beginning of Period | Net Investment Income (Loss) (a) | Net Realized and Unrealized Gains (Losses) on Investments | Total from Investment Activities | Net Investment Income | Tax Return of Capital | Total Distributions | ||||||||||||||||||||||
Class A Shares | ||||||||||||||||||||||||||||
Six Months Ended April 30, 2014* | $ | 40.02 | $ | 1.05 | $ | 1.01 | $ | 2.06 | $ | (0.51 | ) | $ | – | $ | (0.51 | ) | ||||||||||||
Year Ended October 31, 2013 | 35.11 | 0.32 | 4.91 | 5.23 | (0.32 | ) | – | (0.32 | ) | |||||||||||||||||||
Year Ended October 31, 2012 | 33.90 | 0.17 | 1.04 | 1.21 | – | – | – | |||||||||||||||||||||
Year Ended October 31, 2011 | 36.70 | (0.08 | ) | (2.72 | ) | (2.80 | ) | – | – | – | ||||||||||||||||||
Year Ended October 31, 2010 | 32.55 | (0.01 | ) | 5.05 | 5.04 | (0.89 | ) | – | (0.89 | ) | ||||||||||||||||||
Year Ended October 31, 2009 | 27.23 | 0.27 | 5.15 | 5.42 | (0.10 | ) | – | (0.10 | ) | |||||||||||||||||||
Institutional Class Shares(g) | ||||||||||||||||||||||||||||
Six Months Ended April 30, 2014* | 40.39 | 1.09 | 1.02 | 2.11 | (0.61 | ) | – | (0.61 | ) | |||||||||||||||||||
Year Ended October 31, 2013 | 35.48 | 0.30 | 5.04 | 5.34 | (0.43 | ) | – | (0.43 | ) | |||||||||||||||||||
Year Ended October 31, 2012 | 34.20 | 0.25 | 1.05 | 1.30 | (0.02 | ) | – | (0.02 | ) | |||||||||||||||||||
Year Ended October 31, 2011 | 37.01 | 0.01 | (2.74 | ) | (2.73 | ) | (0.08 | ) | – | (0.08 | ) | |||||||||||||||||
Year Ended October 31, 2010 | 32.80 | 0.07 | 5.09 | 5.16 | (0.95 | ) | – | (0.95 | ) | |||||||||||||||||||
Year Ended October 31, 2009 | 27.55 | 0.35 | 5.17 | 5.52 | (0.27 | ) | – | (0.27 | ) | |||||||||||||||||||
| * | Unaudited |
| (a) | Net investment income (loss) is based on average shares outstanding during the period. |
| (b) | Not annualized for periods less than one year. |
| (c) | Annualized for periods less than one year. |
Amounts listed as “–” are $0 or round to $0.
See accompanying notes to financial statements.
Semi-Annual Report 2014
50
Table of Contents
Financial Highlights
Selected Data for Each Share of Capital Outstanding Throughout the Periods Indicated
Aberdeen Global Select Opportunities Fund Inc. (concluded)
Ratios/Supplemental Data | ||||||||||||||||||||||||||
| Net Asset Value, End of Period | Total Return (b) | Net Assets at End of Period (000’s) | Ratio of Expenses to Average Net Assets (c) | Ratio of Net Investment Income (Loss) to Average Net Assets (c) | Ratio of Expenses (Prior to Reimbursements) to Average Net Assets (c)(d) | Portfolio Turnover (b)(e) | ||||||||||||||||||||
| $ | 41.57 | 5.24 | % | $ | 6,434 | 1.37 | %(f) | 5.37 | % | 2.84 | %(f) | 5 | % | |||||||||||||
| 40.02 | 15.02 | % | 6,538 | 1.36 | %(f) | 0.86 | % | 2.54 | %(f) | 253 | % | |||||||||||||||
| 35.11 | 3.54 | % | 8,691 | 1.39 | %(f) | 0.49 | % | 2.32 | %(f) | 182 | % | |||||||||||||||
| 33.90 | (7.60 | %) | 10,223 | 1.40 | %(f) | (0.21 | %) | 1.79 | %(f) | 147 | % | |||||||||||||||
| 36.70 | 15.65 | % | 12,302 | 1.40 | %(f) | (0.04 | %) | 1.78 | %(f) | 195 | % | |||||||||||||||
| 32.55 | 19.94 | % | 17,703 | 1.40 | % | 0.99 | % | 1.89 | % | 320 | % | |||||||||||||||
| 41.89 | 5.35 | % | 1,536 | 1.15 | %(f) | 5.52 | % | 2.53 | %(f) | 5 | % | |||||||||||||||
| 40.39 | 15.23 | % | 1,740 | 1.15 | %(f) | 0.82 | % | 2.25 | %(f) | 253 | % | |||||||||||||||
| 35.48 | 3.82 | % | 11,431 | 1.14 | %(f) | 0.73 | % | 1.76 | %(f) | 182 | % | |||||||||||||||
| 34.20 | (7.40 | %) | 36,851 | 1.15 | %(f) | 0.04 | % | 1.42 | %(f) | 147 | % | |||||||||||||||
| 37.01 | 15.94 | % | 63,354 | 1.15 | %(f) | 0.21 | % | 1.44 | %(f) | 195 | % | |||||||||||||||
| 32.80 | 20.23 | % | 50,021 | 1.15 | % | 1.27 | % | 1.50 | % | 320 | % | |||||||||||||||
| (d) | During the period, certain fees were waived and/or reimbursed. If such waivers/reimbursements had not occurred, the ratios would have been as indicated. |
| (e) | Portfolio turnover is calculated on the basis of the Fund as a whole without distinguishing among the classes of shares. |
| (f) | Includes interest expense that amounts to less than 0.01%. |
| (g) | Formerly Class I shares. |
2014 Semi-Annual Report
51
Table of Contents
Financial Highlights
Selected Data for Each Share of Capital Outstanding Throughout the Periods Indicated
Aberdeen Select International Equity Fund
| Investment Activities | Distributions | |||||||||||||||||||||||||||
| Net Asset Value, Beginning of Period | Net Investment Income (a) | Net Realized and Unrealized Gains (Losses) on Investments | Total from Investment Activities | Net Investment Income | Tax Return of Capital | Total Distributions | ||||||||||||||||||||||
Class A Shares | ||||||||||||||||||||||||||||
Six Months Ended April 30, 2014* | $ | 28.63 | $ | 0.81 | $ | 0.41 | $ | 1.22 | $ | (0.60 | ) | $ | – | $ | (0.60 | ) | ||||||||||||
Year Ended October 31, 2013 | 23.84 | 0.37 | 4.55 | 4.92 | (0.13 | ) | – | (0.13 | ) | |||||||||||||||||||
Year Ended October 31, 2012 | 24.55 | 0.30 | (0.62 | ) | (0.32 | ) | (0.39 | ) | – | (0.39 | ) | |||||||||||||||||
Year Ended October 31, 2011 | 28.87 | 0.19 | (4.00 | ) | (3.81 | ) | (0.51 | ) | – | (0.51 | ) | |||||||||||||||||
Year Ended October 31, 2010 | 28.20 | 0.27 | 2.48 | 2.75 | (2.08 | ) | – | (2.08 | ) | |||||||||||||||||||
Year Ended October 31, 2009 | 24.46 | (g) | 0.26 | 3.94 | 4.20 | (0.46 | ) | – | (0.46 | ) | ||||||||||||||||||
Institutional Class Shares(h) | ||||||||||||||||||||||||||||
Six Months Ended April 30, 2014* | 29.33 | 0.88 | 0.40 | 1.28 | (0.67 | ) | – | (0.67 | ) | |||||||||||||||||||
Year Ended October 31, 2013 | 24.44 | 0.31 | 4.80 | 5.11 | (0.22 | ) | – | (0.22 | ) | |||||||||||||||||||
Year Ended October 31, 2012 | 25.20 | 0.36 | (0.64 | ) | (0.28 | ) | (0.48 | ) | – | (0.48 | ) | |||||||||||||||||
Year Ended October 31, 2011 | 29.64 | 0.28 | (4.13 | ) | (3.85 | ) | (0.59 | ) | – | (0.59 | ) | |||||||||||||||||
Year Ended October 31, 2010 | 28.89 | 0.35 | 2.55 | 2.90 | (2.15 | ) | – | (2.15 | ) | |||||||||||||||||||
Year Ended October 31, 2009 | 25.09 | (g) | 0.33 | 4.03 | 4.36 | (0.56 | ) | – | (0.56 | ) | ||||||||||||||||||
| * | Unaudited |
| (a) | Net investment income (loss) is based on average shares outstanding during the period. |
| (b) | Not annualized for periods less than one year. |
| (c) | Annualized for periods less than one year. |
| (d) | During the period, certain fees were waived and/or reimbursed. If such waivers/reimbursements had not occurred, the ratios would have been as indicated. |
Amounts listed as “–” are $0 or round to $0.
See accompanying notes to financial statements.
Semi-Annual Report 2014
52
Table of Contents
Financial Highlights
Selected Data for Each Share of Capital Outstanding Throughout the Periods Indicated
Aberdeen Select International Equity Fund (concluded)
| Ratios/Supplemental Data | ||||||||||||||||||||||||||
| Net Asset Value, End of Period | Total Return (b) | Net Assets at End of Period (000’s) | Ratio of Expenses (c) | Ratio of Net (c) | Ratio of Expenses (c)(d) | Portfolio Turnover (b)(e) | ||||||||||||||||||||
| $ | 29.25 | 4.43 | % | $ | 474,089 | 1.31 | %(f) | 5.92 | % | 1.32 | %(f) | 5 | % | |||||||||||||
| 28.63 | 20.70 | % | 554,922 | 1.25 | %(f) | 1.39 | % | 1.26 | %(f) | 94 | % | |||||||||||||||
| 23.84 | (1.14 | %) | 877,738 | 1.23 | %(f) | 1.30 | % | 1.24 | %(f) | 35 | % | |||||||||||||||
| 24.55 | (13.49 | %) | 2,059,255 | 1.29 | %(f) | 0.65 | % | 1.30 | %(f) | 41 | % | |||||||||||||||
| 28.87 | 10.06 | % | 3,692,638 | 1.28 | %(f) | 1.00 | % | 1.28 | %(f) | 105 | % | |||||||||||||||
| 28.20 | 17.62 | % | 4,368,400 | 1.21 | % | 1.09 | % | 1.21 | % | 201 | % | |||||||||||||||
| 29.94 | 4.56 | % | 101,230 | 1.08 | %(f) | 6.22 | % | 1.08 | %(f) | 5 | % | |||||||||||||||
| 29.33 | 21.04 | % | 110,893 | 1.03 | %(f) | 1.15 | % | 1.04 | %(f) | 94 | % | |||||||||||||||
| 24.44 | (0.93 | %) | 1,138,838 | 1.00 | %(f) | 1.51 | % | 1.01 | %(f) | 35 | % | |||||||||||||||
| 25.20 | (13.31 | %) | 3,687,999 | 1.05 | %(f) | 0.95 | % | 1.05 | %(f) | 41 | % | |||||||||||||||
| 29.64 | 10.37 | % | 5,790,307 | 1.02 | %(f) | 1.26 | % | 1.02 | %(f) | 105 | % | |||||||||||||||
| 28.89 | 17.91 | % | 6,389,926 | 0.95 | % | 1.36 | % | 0.95 | % | 201 | % | |||||||||||||||
| (e) | Portfolio turnover is calculated on the basis of the Fund as a whole without distinguishing among the classes of shares. |
| (f) | Includes interest expense that amounts to less than 0.01%. |
| (g) | The financial statements are prepared to conform to U.S. generally accepted accounting principles. As a result, the NAVs for certain funds reported in the financial statements may differ from the NAV used to process shareholder transactions. The reported NAV for shareholder transaction activity for the Aberdeen Select International Equity Fund Class A shares was $24.44 and Institutional Class shares was $25.07. The NAV above was restated to correct an error which was identified subsequent to the close of the fiscal year end. |
| (h) | Formerly Class I shares. |
2014 Semi-Annual Report
53
Table of Contents
Financial Highlights
Selected Data for Each Share of Capital Outstanding Throughout the Periods Indicated
Aberdeen Select International Equity Fund II
| Investment Activities | Distributions | |||||||||||||||||||||||||||
| Net Asset Value, Beginning of Period | Net Investment Income (a) | Net Realized and Unrealized Gains (Losses) on Investments | Total from Investment Activities | Net Investment Income | Tax Return of Capital | Total Distributions | ||||||||||||||||||||||
Class A Shares | ||||||||||||||||||||||||||||
Six Months Ended April 30, 2014* | $ | 12.18 | $ | 0.33 | $ | 0.23 | $ | 0.56 | $ | (0.01 | ) | $ | – | $ | (0.01 | ) | ||||||||||||
Year Ended October 31, 2013 | 10.38 | 0.13 | 1.92 | 2.05 | (0.25 | ) | – | (0.25 | ) | |||||||||||||||||||
Year Ended October 31, 2012 | 10.46 | 0.12 | (0.05 | ) | 0.07 | (0.15 | ) | – | (0.15 | ) | ||||||||||||||||||
Year Ended October 31, 2011 | 12.18 | 0.07 | (1.56 | ) | (1.49 | ) | (0.23 | ) | – | (0.23 | ) | |||||||||||||||||
Year Ended October 31, 2010 | 11.62 | 0.11 | 1.00 | 1.11 | (0.55 | ) | – | (0.55 | ) | |||||||||||||||||||
Year Ended October 31, 2009 | 10.15 | (g) | 0.09 | 1.71 | 1.80 | (0.33 | ) | – | (0.33 | ) | ||||||||||||||||||
Institutional Class Shares(h) | ||||||||||||||||||||||||||||
Six Months Ended April 30, 2014* | 12.20 | 0.33 | 0.24 | 0.57 | (0.03 | ) | – | (0.03 | ) | |||||||||||||||||||
Year Ended October 31, 2013 | 10.45 | 0.11 | 1.97 | 2.08 | (0.33 | ) | – | (0.33 | ) | |||||||||||||||||||
Year Ended October 31, 2012 | 10.54 | 0.14 | (0.04 | ) | 0.10 | (0.19 | ) | – | (0.19 | ) | ||||||||||||||||||
Year Ended October 31, 2011 | 12.27 | 0.10 | (1.57 | ) | (1.47 | ) | (0.26 | ) | – | (0.26 | ) | |||||||||||||||||
Year Ended October 31, 2010 | 11.70 | 0.14 | 1.01 | 1.15 | (0.58 | ) | – | (0.58 | ) | |||||||||||||||||||
Year Ended October 31, 2009 | 10.22 | (g) | 0.12 | 1.72 | 1.84 | (0.36 | ) | – | (0.36 | ) | ||||||||||||||||||
| * | Unaudited |
| (a) | Net investment income (loss) is based on average shares outstanding during the period. |
| (b) | Not annualized for periods less than one year. |
| (c) | Annualized for periods less than one year. |
| (d) | During the period, certain fees were waived and/or reimbursed. If such waivers/reimbursements had not occurred, the ratios would have been as indicated. |
Amounts listed as “–” are $0 or round to $0.
See accompanying notes to financial statements.
Semi-Annual Report 2014
54
Table of Contents
Financial Highlights
Selected Data for Each Share of Capital Outstanding Throughout the Periods Indicated
Aberdeen Select International Equity Fund II (concluded)
Ratios/Supplemental Data | ||||||||||||||||||||||||||
| Net Asset Value, End of Period | Total Return (b) | Net Assets at End of Period (000’s) | Ratio of Expenses to Average Net Assets (c) | Ratio of Net Investment Income to Average Net Assets (c) | Ratio of Expenses (Prior to Reimbursements) to Average Net Assets (c)(d) | Portfolio Turnover (b)(e) | ||||||||||||||||||||
| $ | 12.73 | 4.56 | % | $ | 149,302 | 1.41 | %(f) | 5.49 | % | 1.41 | %(f) | 5 | % | |||||||||||||
| 12.18 | 20.00 | % | 168,028 | 1.21 | %(f) | 1.19 | % | 1.23 | %(f) | 97 | % | |||||||||||||||
| 10.38 | 0.91 | % | 278,360 | 1.30 | %(f) | 1.21 | % | 1.32 | %(f) | 34 | % | |||||||||||||||
| 10.46 | (12.61 | %) | 1,310,435 | 1.28 | %(f) | 0.54 | % | 1.28 | %(f) | 51 | % | |||||||||||||||
| 12.18 | 9.75 | % | 2,156,072 | 1.28 | %(f) | 0.98 | % | 1.29 | %(f) | 123 | % | |||||||||||||||
| 11.62 | 18.23 | % | 2,146,222 | 1.24 | % | 0.87 | % | 1.27 | % | 205 | % | |||||||||||||||
| 12.74 | 4.67 | % | 125,569 | 1.19 | %(f) | 5.64 | % | 1.20 | %(f) | 5 | % | |||||||||||||||
| 12.20 | 20.36 | % | 157,876 | 1.04 | %(f) | 1.02 | % | 1.04 | %(f) | 97 | % | |||||||||||||||
| 10.45 | 1.11 | % | 806,052 | 1.01 | %(f) | 1.33 | % | 1.02 | %(f) | 34 | % | |||||||||||||||
| 10.54 | (12.31 | %) | 3,666,631 | 1.04 | %(f) | 0.79 | % | 1.04 | %(f) | 51 | % | |||||||||||||||
| 12.27 | 9.99 | % | 6,355,205 | 1.04 | %(f) | 1.23 | % | 1.05 | %(f) | 123 | % | |||||||||||||||
| 11.70 | 18.59 | % | 6,985,273 | 0.98 | % | 1.18 | % | 1.02 | % | 205 | % | |||||||||||||||
| (e) | Portfolio turnover is calculated on the basis of the Fund as a whole without distinguishing among the classes of shares. |
| (f) | Includes interest expense that amounts to less than 0.01%. |
| (g) | The financial statements are prepared to conform to U.S. generally accepted accounting principles. As a result, the NAVs for certain funds reported in the financial statements may differ from the NAV used to process shareholder transactions. The reported NAV for shareholder transaction activity for the Aberdeen Select International Equity Fund II Class A shares was $10.16 and Institutional Class shares was $10.23. |
| (h) | Formerly Class I shares. |
2014 Semi-Annual Report
55
Table of Contents
Financial Highlights
Selected Data for Each Share of Capital Outstanding Throughout the Periods Indicated
Aberdeen Total Return Bond Fund
| Investment Activities | Distributions | |||||||||||||||||||||||||||||||
| Net Asset Value, Beginning of Period | Net Investment Income (a) | Net Realized and Unrealized Gains (Losses) on Investments | Total from Investment Activities | Net Investment Income | Net Realized Gains | Tax Return of Capital | Total Distributions | |||||||||||||||||||||||||
Class A Shares | ||||||||||||||||||||||||||||||||
Six Months Ended April 30, 2014* | $ | 13.30 | $ | 0.18 | $ | 0.07 | $ | 0.25 | $ | (0.11 | ) | $ | – | $ | – | $ | (0.11 | ) | ||||||||||||||
Year Ended October 31, 2013 | 14.17 | 0.31 | (0.56 | ) | (0.25 | ) | (0.29 | ) | (0.30 | ) | (0.03 | ) | (0.62 | ) | ||||||||||||||||||
Year Ended October 31, 2012 | 14.02 | 0.34 | 0.56 | 0.90 | (0.49 | ) | (0.26 | ) | – | (0.75 | ) | |||||||||||||||||||||
Year Ended October 31, 2011 | 14.24 | 0.55 | 0.18 | 0.73 | (0.47 | ) | (0.48 | ) | – | (0.95 | ) | |||||||||||||||||||||
Year Ended October 31, 2010 | 13.51 | 0.52 | 0.69 | 1.21 | (0.48 | ) | – | – | (0.48 | ) | ||||||||||||||||||||||
Year Ended October 31, 2009 | 12.21 | 0.51 | 1.54 | 2.05 | (0.62 | ) | (0.13 | ) | – | (0.75 | ) | |||||||||||||||||||||
Institutional Class Shares(f) | ||||||||||||||||||||||||||||||||
Six Months Ended April 30, 2014* | 13.13 | 0.20 | 0.07 | 0.27 | (0.13 | ) | – | – | (0.13 | ) | ||||||||||||||||||||||
Year Ended October 31, 2013 | 14.03 | 0.35 | (0.56 | ) | (0.21 | ) | (0.36 | ) | (0.30 | ) | (0.03 | ) | (0.69 | ) | ||||||||||||||||||
Year Ended October 31, 2012 | 13.91 | 0.38 | 0.55 | 0.93 | (0.55 | ) | (0.26 | ) | – | (0.81 | ) | |||||||||||||||||||||
Year Ended October 31, 2011 | 14.16 | 0.58 | 0.18 | 0.76 | (0.53 | ) | (0.48 | ) | – | (1.01 | ) | |||||||||||||||||||||
Year Ended October 31, 2010 | 13.47 | 0.55 | 0.69 | 1.24 | (0.55 | ) | – | – | (0.55 | ) | ||||||||||||||||||||||
Year Ended October 31, 2009 | 12.20 | 0.54 | 1.53 | 2.07 | (0.67 | ) | (0.13 | ) | – | (0.80 | ) | |||||||||||||||||||||
| * | Unaudited |
| (a) | Net investment income (loss) is based on average shares outstanding during the period. |
| (b) | Not annualized for periods less than one year. |
| (c) | Annualized for periods less than one year. |
Amounts listed as “–” are $0 or round to $0.
See accompanying notes to financial statements.
Semi-Annual Report 2014
56
Table of Contents
Financial Highlights
Selected Data for Each Share of Capital Outstanding Throughout the Periods Indicated
Aberdeen Total Return Bond Fund (concluded)
| Ratios/Supplemental Data | ||||||||||||||||||||||||||
| Net Asset Value, End of Period | Total Return (b) | Net Assets at End of Period (000’s) | Ratio of Expenses to Average Net Assets (c) | Ratio of Net Investment Income to Average Net Assets (c) | Ratio of Expenses (Prior to Reimbursements) to Average Net Assets (c)(d) | Portfolio Turnover (b)(e) | ||||||||||||||||||||
| $ | 13.44 | 1.92 | % | $ | 132,151 | 0.68 | % | 2.76 | % | 0.72 | % | 61 | % | |||||||||||||
| 13.30 | (1.81 | %) | 153,370 | 0.68 | % | 2.29 | % | 0.70 | % | 265 | % | |||||||||||||||
| 14.17 | 6.64 | % | 247,217 | 0.69 | % | 2.47 | % | 0.69 | % | 236 | % | |||||||||||||||
| 14.02 | 5.49 | % | 271,444 | 0.69 | % | 3.96 | % | 0.71 | % | 219 | % | |||||||||||||||
| 14.24 | 9.16 | % | 319,782 | 0.69 | % | 3.77 | % | 0.70 | % | 193 | % | |||||||||||||||
| 13.51 | 17.27 | % | 331,224 | 0.69 | % | 3.98 | % | 0.69 | % | 289 | % | |||||||||||||||
| 13.27 | 2.07 | % | 1,398,502 | 0.44 | % | 3.01 | % | 0.44 | % | 61 | % | |||||||||||||||
| 13.13 | (1.59 | %) | 1,449,776 | 0.42 | % | 2.56 | % | 0.43 | % | 265 | % | |||||||||||||||
| 14.03 | 6.97 | % | 1,849,138 | 0.41 | % | 2.73 | % | 0.41 | % | 236 | % | |||||||||||||||
| 13.91 | 5.79 | % | 1,498,733 | 0.44 | % | 4.20 | % | 0.45 | % | 219 | % | |||||||||||||||
| 14.16 | 9.39 | % | 1,305,839 | 0.44 | % | 4.01 | % | 0.44 | % | 193 | % | |||||||||||||||
| 13.47 | 17.56 | % | 1,238,512 | 0.44 | % | 4.26 | % | 0.43 | % | 289 | % | |||||||||||||||
| (d) | During the period, certain fees were waived and/or reimbursed. If such waivers/reimbursements had not occurred, the ratios would have been as indicated. |
| (e) | Portfolio turnover is calculated on the basis of the Fund as a whole without distinguishing among the classes of shares. |
| (f) | Formerly Class I shares. |
2014 Semi-Annual Report
57
Table of Contents
Financial Highlights
Selected Data for Each Share of Capital Outstanding Throughout the Periods Indicated
Aberdeen Global High Income Fund
| Investment Activities | Distributions | |||||||||||||||||||||||||||||||
| Net Asset Value, Beginning of Period | Net Investment Income (a) | Net Realized and Unrealized Gains (Losses) on Investments | Total from Investment Activities | Net Investment Income | Net Realized Gains | Tax Return of Capital | Total Distributions | |||||||||||||||||||||||||
Class A Shares | ||||||||||||||||||||||||||||||||
Six Months Ended April 30, 2014* | $ | 10.61 | $ | 0.31 | $ | 0.23 | $ | 0.54 | $ | (0.30 | ) | $ | (0.11 | ) | $ | – | $ | (0.41 | ) | |||||||||||||
Year Ended October 31, 2013 | 10.30 | 0.72 | 0.30 | 1.02 | (0.71 | ) | – | – | (0.71 | ) | ||||||||||||||||||||||
Year Ended October 31, 2012 | 10.14 | 0.73 | 0.34 | 1.07 | (0.74 | ) | (0.16 | ) | (0.01 | ) | (0.91 | ) | ||||||||||||||||||||
Year Ended October 31, 2011 | 11.06 | 0.77 | (0.62 | ) | 0.15 | (0.79 | ) | (0.28 | ) | – | (1.07 | ) | ||||||||||||||||||||
Year Ended October 31, 2010 | 10.28 | 0.82 | 0.77 | 1.59 | (0.81 | ) | – | – | (0.81 | ) | ||||||||||||||||||||||
Year Ended October 31, 2009 | 8.08 | 0.71 | 2.42 | 3.13 | (0.78 | ) | – | (0.15 | ) | (0.93 | ) | |||||||||||||||||||||
Institutional Class Shares(g) | ||||||||||||||||||||||||||||||||
Six Months Ended April 30, 2014* | 10.10 | 0.31 | 0.21 | 0.52 | (0.31 | ) | (0.11 | ) | – | (0.42 | ) | |||||||||||||||||||||
Year Ended October 31, 2013 | 9.84 | 0.71 | 0.29 | 1.00 | (0.74 | ) | – | – | (0.74 | ) | ||||||||||||||||||||||
Year Ended October 31, 2012 | 9.72 | 0.73 | 0.31 | 1.04 | (0.74 | ) | (0.16 | ) | (0.02 | ) | (0.92 | ) | ||||||||||||||||||||
Year Ended October 31, 2011 | 10.64 | 0.76 | (0.59 | ) | 0.17 | (0.81 | ) | (0.28 | ) | – | (1.09 | ) | ||||||||||||||||||||
Year Ended October 31, 2010 | 9.90 | 0.82 | 0.74 | 1.56 | (0.82 | ) | – | – | (0.82 | ) | ||||||||||||||||||||||
Year Ended October 31, 2009 | 7.82 | 0.70 | 2.33 | 3.03 | (0.79 | ) | – | (0.16 | ) | (0.95 | ) | |||||||||||||||||||||
| * | Unaudited |
| (a) | Net investment income (loss) is based on average shares outstanding during the period. |
| (b) | Not annualized for periods less than one year. |
| (c) | Annualized for periods less than one year. |
Amounts listed as “–” are $0 or round to $0.
See accompanying notes to financial statements.
Semi-Annual Report 2014
58
Table of Contents
Financial Highlights (concluded)
Selected Data for Each Share of Capital Outstanding Throughout the Periods Indicated
Aberdeen Global High Income Fund (concluded)
Ratios/Supplemental Data | ||||||||||||||||||||||||||
| Net Asset Value, End of Period | Total Return (b) | Net Assets at End of Period (000’s) | Ratio of Expenses to Average Net Assets (c) | Ratio of Net Investment Income to Average Net Assets (c) | Ratio of Expenses (Prior to Reimbursements) to Average Net Assets (c)(d) | Portfolio Turnover (b)(e) | ||||||||||||||||||||
| $ | 10.74 | 5.19 | % | $ | 1,102,520 | 0.99 | %(f) | 5.94 | % | 1.00 | %(f) | 41 | % | |||||||||||||
| 10.61 | 10.20 | % | 999,250 | 0.99 | %(f) | 6.83 | % | 1.00 | %(f) | 57 | % | |||||||||||||||
| 10.30 | 11.22 | % | 1,066,487 | 0.99 | %(f) | 7.26 | % | 1.01 | %(f) | 62 | % | |||||||||||||||
| 10.14 | 1.30 | % | 1,308,597 | 0.99 | %(f) | 7.19 | % | 1.00 | %(f) | 78 | % | |||||||||||||||
| 11.06 | 16.08 | % | 1,222,933 | 1.00 | % | 7.70 | % | 1.00 | % | 57 | % | |||||||||||||||
| 10.28 | 42.71 | % | 715,541 | 1.00 | % | 7.83 | % | 1.01 | % | 43 | % | |||||||||||||||
| 10.20 | 5.28 | % | 1,674,588 | 0.75 | %(f) | 6.18 | % | 0.76 | %(f) | 41 | % | |||||||||||||||
| 10.10 | 10.53 | % | 1,553,543 | 0.75 | %(f) | 7.10 | % | 0.75 | %(f) | 57 | % | |||||||||||||||
| 9.84 | 11.49 | % | 2,130,565 | 0.73 | %(f) | 7.53 | % | 0.74 | %(f) | 62 | % | |||||||||||||||
| 9.72 | 1.52 | % | 2,077,865 | 0.73 | %(f) | 7.44 | % | 0.74 | %(f) | 78 | % | |||||||||||||||
| 10.64 | 16.39 | % | 1,873,539 | 0.75 | % | 7.96 | % | 0.74 | % | 57 | % | |||||||||||||||
| 9.90 | 42.99 | % | 934,054 | 0.75 | % | 8.10 | % | 0.74 | % | 43 | % | |||||||||||||||
| (d) | During the period, certain fees were waived and/or reimbursed. If such waivers/reimbursements had not occurred, the ratios would have been as indicated. |
| (e) | Portfolio turnover is calculated on the basis of the Fund as a whole without distinguishing among the classes of shares. |
| (f) | Includes interest expense that amounts to less than 0.01%. |
| (g) | Formerly Class I shares. |
2014 Semi-Annual Report
59
Table of Contents
April 30, 2014 (Unaudited)
1. Organization
Aberdeen Investment Funds (the “Trust”) was organized as a business trust under the laws of the State of Massachusetts by a Master Trust Agreement adopted on April 30, 1992 and is registered with the U.S. Securities and Exchange Commission (“SEC”) under the Investment Company Act of 1940, as amended (the “1940 Act”) as an open-end management investment company. As of April 30, 2014, the Trust offered four diversified, open-ended investment funds: Aberdeen Select International Equity Fund (the “Select International Equity Fund”), Aberdeen Select International Equity Fund II (the “Select International Equity Fund II”), Aberdeen Total Return Bond Fund (the “Total Return Bond Fund”), and Aberdeen Global High Income Fund (the “Global High Income Fund”).
Aberdeen Global Select Opportunities Fund Inc. (the “Global Select Opportunities Fund”) was incorporated under the laws of the State of Maryland on May 23, 1990 and is registered with the SEC under the 1940 Act as a diversified, open-end management investment company.
Each of the Funds offers multiple share classes. As of April 30, 2014, all of the Funds offered Class A and Institutional Class shares. The classes of shares are offered to different types of investors and have different expense structures, as outlined in the Funds’ prospectus. Each class of shares has exclusive voting rights with respect to matters that affect that class. Income, realized gains and losses, unrealized appreciation and depreciation, and expenses that are not attributable to a specific class are allocated daily to each class based on its relative net assets. Expenses directly attributable to a Fund are charged to that Fund. Other expenses are allocated to the respective Fund based on average daily net assets.
On December 12, 2013, the Funds’ Board of Trustees and Board of Directors approved changing the name of Class I Shares of the Trust and the Global Select Opportunities Fund to Institutional Class Shares, effective with the 2014 prospectus. Fees and expenses associated with Class I Shares were not impacted as a result of the change in name to Institutional Class Shares.
Each Fund has distinct investment objectives. Following are the objectives for the Funds:
| Fund Name | Investment Objective | |
Global Select Opportunities Fund | Seeks to maximize total return, principally through capital appreciation. | |
Select International Equity Fund | Seeks long term growth of capital. | |
Select International Equity Fund II | Seeks long term growth of capital. | |
Total Return Bond Fund | Seeks to provide total return, which consists of two components: (1) changes in the market value of the Fund’s portfolio securities (both realized and unrealized appreciation/depreciation) and (2) income received from its portfolio securities. | |
Global High Income Fund | Seeks to maximize total return, principally through a high level of current income, and secondarily through capital appreciation. |
2. Summary of Significant Accounting Policies
The following is a summary of significant accounting policies followed by the Funds in the preparation of their financial statements. The policies conform to accounting principles generally accepted in the United States of America (GAAP). The preparation of financial statements requires management to make estimates and assumptions that affect the reported amounts of assets and liabilities, disclosure of contingent assets and liabilities at the date of the financial statements, and the reported amounts of income and expenses for the period. Actual results could differ from those estimates. The books and records of the Funds are maintained in U.S. Dollars.
| (a) | Security Valuation |
The Funds value their securities at current market value or fair value consistent with the Funds’ valuation procedures and regulatory requirements.
Each Fund’s assets for which market quotations are readily available are valued at fair value on the basis of quotations furnished by a pricing service or provided by securities dealers. Equity investments are generally valued using the last sale price or official closing price taken from the primary market in which each security trades, or if no sales occurred during the day, at the mean of the current quoted bid and ask prices.
Fixed income securities are generally valued using prices provided directly by independent third party services or provided directly from one or more broker dealers or market makers, each in accordance with valuation procedures (“Valuation Procedures”) approved by the Global Select Opportunities Fund’s Board of Directors, and the Trust’s Board of Trustees (each, a “Board” and collectively, the “Boards”), as applicable. The pricing services may use valuation models or matrix pricing, which consider yield or prices with respect to comparable bond
Semi-Annual Report 2014
60
Table of Contents
Notes to Financial Statements (continued)
April 30, 2014 (Unaudited)
quotations from bond dealers or by reference to other securities that are considered comparable in such characteristics as credit rating, interest rates and maturity date, to determine current fair value.
Assets and liabilities initially expressed in foreign currency will be converted into U.S. Dollar values. Short-term dollar-denominated investments of appropriate credit quality that mature in 60 days or less are valued on the basis of amortized cost, which approximates fair value. To the extent each Fund invests in other open-end funds, the Fund will calculate its Net Asset Value (“NAV”) based upon the NAV of the underlying funds in which it invests. The prospectuses of these underlying funds explain the circumstances under which they will use good faith fair value pricing and the effects of such fair value pricing.
When market quotations or exchange rates are not readily available, or if the Funds’ investment adviser, Aberdeen Asset Management Inc. (the “Adviser”), concludes that such market quotations do not accurately reflect fair value, the fair value of a Fund’s assets are determined in good faith in accordance with the Valuation Procedures. For options, swaps and warrants, a fair value price may be determined using readily available market quotations, prices provided by independent pricing services, or by using modeling tools provided by industry accepted financial data service providers. Key inputs to such tools may include yield and prices from comparable or reference assets, maturity or expiration dates, ratings, and interest rates. In addition, the Adviser, through its pricing committee, may determine the fair value price based upon multiple factors as set forth in the Valuation Procedures approved by the Boards.
The closing prices of domestic or foreign securities may not reflect their market values at the time the Funds calculate their respective NAVs if an event that materially affects the value of those securities has occurred since the closing prices were established on the domestic or foreign exchange market, but before the Funds’ NAV calculations. Under certain conditions, the Boards have approved an independent pricing service to fair value foreign securities. This is generally accomplished by adjusting the closing price for movements in correlated indices, securities or derivatives. Fair value pricing may cause the value of the security on the books of the Funds to be different from the closing value on the non-U.S. exchange and may affect the calculation of a Fund’s NAV. Certain Funds may fair value securities in other situations, for example, when a particular foreign market is closed but the Funds are pricing their shares.
In accordance with the authoritative guidance on fair value measurements and disclosures under GAAP, the Funds disclose the fair value of their investments using a three-level hierarchy that classifies the inputs to valuation techniques used to measure the fair value. The hierarchy assigns Level 1 measurements to valuations based upon unadjusted quoted prices in active markets for identical assets, Level 2 measurements to valuations, based upon significant observable inputs, including adjusted quoted prices in active markets for identical assets, and Level 3 measurements to valuations based upon unobservable inputs that are significant to the valuation. Inputs refer broadly to the assumptions that market participants would use in pricing the asset or liability, including assumptions about risk, for example, the risk inherent in a particular valuation technique used to measure fair value including a pricing model and/or the risk inherent in the inputs to the valuation technique. Inputs may be observable or unobservable. Observable inputs are inputs that reflect the assumptions market participants would use in pricing the asset or liability, which are based on market data obtained from sources independent of the reporting entity. Unobservable inputs are inputs that reflect the reporting entity’s own assumptions about the assumptions market participants would use in pricing the asset or liability developed based on the best information available in the circumstances. A financial instrument’s level within the fair value hierarchy is based upon the lowest level of any input that is significant to the fair value measurement. The three-tier hierarchy of inputs is summarized below:
| • | Level 1- quoted prices in active markets for identical investments; |
| • | Level 2- other significant observable inputs (including quoted prices for similar securities, interest rates, prepayment speeds, and credit risk); or |
| • | Level 3- significant unobservable inputs (including the Fund’s own assumptions in determining the fair value of investments). |
For movements between the levels within the fair value hierarchy, the Funds have adopted a policy of recognizing transfers at the end of each period.
The Funds will fair value foreign securities when the Adviser does not believe that the closing prices are reflective of fair value due to significant events that occurred subsequent to the close of the foreign markets but before the Funds’ NAV calculations. When securities are fair valued under this method, they will be classified as Level 2 which may result in significant transfers between Level 1 and Level 2. The number of days on which fair value prices will be used depends on market activity. It is possible that fair value prices will be used by the Funds to a significant extent. Foreign securities in the Global Select Opportunities Fund, Select International Equity Fund and Select International Equity Fund II were not fair valued under this method at October 31, 2013 or April 30, 2014, resulting in no significant transfers from Level 1 to Level 2 in the fair value hierarchy.
2014 Semi-Annual Report
61
Table of Contents
Notes to Financial Statements (continued)
April 30, 2014 (Unaudited)
The following is a summary of the inputs used as of April 30, 2014 in valuing the Funds’ investments at fair value. The inputs or methodologies used for valuing securities are not necessarily an indication of the risk associated with investing in those securities.
LEVEL 1–Quoted Prices ($) | LEVEL 2–Other Observable Inputs ($) | LEVEL 3– Significant | Total ($) | |||||||||||||
| Global Select Opportunities Fund | ||||||||||||||||
| Investments in Securities | ||||||||||||||||
Common Stocks | 6,938,794 | – | – | 6,938,794 | ||||||||||||
Preferred Stocks | 693,769 | – | – | 693,769 | ||||||||||||
|
|
|
|
|
|
|
| |||||||||
| 7,632,563 | – | – | 7,632,563 | |||||||||||||
|
|
|
|
|
|
|
| |||||||||
| Select International Equity Fund | ||||||||||||||||
| Investments in Securities | ||||||||||||||||
Common Stocks | 488,185,846 | – | 2,051,930 | 490,237,776 | ||||||||||||
Exchange Traded Funds | – | – | 1,389,510 | 1,389,510 | ||||||||||||
Government Bonds | – | – | 1,361,575 | 1,361,575 | ||||||||||||
Preferred Stocks | 65,270,765 | – | – | 65,270,765 | ||||||||||||
|
|
|
|
|
|
|
| |||||||||
| 553,456,611 | – | 4,803,015 | 558,259,626 | |||||||||||||
|
|
|
|
|
|
|
| |||||||||
Asset Valuation Inputs
Select International Equity Fund Rollforward of Level 3 Fair Value Measurement For the Period Ended April 30, 2014 | ||||||||||||||||||||||||||||||||||||||||
| Investments in Securities | Balance as of October 31, 2013 | Accrued Discounts (Premiums) | Realized Gain (Loss) | Change in Unrealized Appreciation (Depreciation) | Net Purchases | Net Sales | Net Transfers in to Level 3 | Net Transfers out of Level 3 | Balance as of April 30, 2014 | Change in Unrealized Appreciation (Depreciation) from Investments Held at April 30, 2014 | ||||||||||||||||||||||||||||||
COMMON STOCKS | ||||||||||||||||||||||||||||||||||||||||
Bulgaria | $ | 2,291,326 | $ | – | $ | (15,802,654 | ) | $ | 15,867,038 | $ | – | $ | (384,372 | ) | $ | – | $ | – | $ | 1,971,338 | $ | 38,232 | ||||||||||||||||||
Latvia | – | – | – | – | 8,354,908 | (8,354,908 | ) | – | – | – | – | |||||||||||||||||||||||||||||
Serbia | 80,145 | – | – | 447 | – | – | – | – | 80,592 | 447 | ||||||||||||||||||||||||||||||
Venezuela | – | – | – | – | – | – | – | – | – | – | ||||||||||||||||||||||||||||||
EXCHANGE TRADED FUNDS | ||||||||||||||||||||||||||||||||||||||||
Russia | 1,389,510 | – | – | – | – | – | – | – | 1,389,510 | – | ||||||||||||||||||||||||||||||
GOVERNMENT BONDS | ||||||||||||||||||||||||||||||||||||||||
Venezuela | 1,849,035 | (7,795 | ) | – | (479,665 | ) | – | – | – | – | 1,361,575 | (479,665 | ) | |||||||||||||||||||||||||||
TOTAL | $ | 5,610,016 | $ | (7,795 | ) | $ | (15,802,654 | ) | $ | 15,387,820 | $ | 8,354,908 | $ | (8,739,280 | ) | $ | – | $ | – | $ | 4,803,015 | $ | (440,986 | ) | ||||||||||||||||
Semi-Annual Report 2014
62
Table of Contents
Notes to Financial Statements (continued)
April 30, 2014 (Unaudited)
LEVEL 1–Quoted Prices ($) | LEVEL 2–Other Significant | LEVEL 3– Significant Unobservable | Total ($) | |||||||||||||
| Select International Equity Fund II | ||||||||||||||||
| Investments in Securities | ||||||||||||||||
Common Stocks | 227,703,695 | – | – | 227,703,695 | ||||||||||||
Preferred Stocks | 29,190,143 | – | – | 29,190,143 | ||||||||||||
Repurchase Agreement | – | 13,018,077 | – | 13,018,077 | ||||||||||||
|
|
|
|
|
|
|
| |||||||||
| 256,893,838 | 13,018,077 | – | 269,911,915 | |||||||||||||
|
|
|
|
|
|
|
| |||||||||
| Total Return Bond Fund | ||||||||||||||||
| Investments in Securities | ||||||||||||||||
Asset-Backed Securities | – | 138,363,511 | – | 138,363,511 | ||||||||||||
Commercial Mortgage-Backed Securities | – | 303,140,460 | – | 303,140,460 | ||||||||||||
Corporate Bonds | – | 431,688,764 | – | 431,688,764 | ||||||||||||
Municipal Bonds | – | 54,752,660 | – | 54,752,660 | ||||||||||||
Government Bonds | – | 199,127,621 | – | 199,127,621 | ||||||||||||
Government Agencies | – | 2,721,800 | – | 2,721,800 | ||||||||||||
U.S. Agencies | – | 206,494,917 | – | 206,494,917 | ||||||||||||
U.S. Treasuries | – | 147,439,259 | – | 147,439,259 | ||||||||||||
Repurchase Agreement | – | 70,129,972 | – | 70,129,972 | ||||||||||||
| Other Financial Instruments | ||||||||||||||||
| Assets | ||||||||||||||||
Forward Foreign Currency Exchange Contracts | – | 649,348 | – | 649,348 | ||||||||||||
| Liabilities | ||||||||||||||||
Forward Foreign Currency Exchange Contracts | – | (1,175,563 | ) | – | (1,175,563 | ) | ||||||||||
|
|
|
|
|
|
|
| |||||||||
| – | 1,553,332,749 | – | 1,553,332,749 | |||||||||||||
|
|
|
|
|
|
|
| |||||||||
Asset Valuation Inputs
Total Return Bond Fund Rollforward of Level 3 Fair Value Measurement For the Period Ended April 30, 2014 | ||||||||||||||||||||||||||||||||||||||||
| Investments in Securities | Balance as of October 31, 2013 | Accrued Discounts (Premiums) | Realized Gain (Loss) | Change in Unrealized Appreciation (Depreciation) | Net Purchases | Net Sales | Net Transfers in to Level 3 | Net Transfers out of Level 3 | Balance as of April 30, 2014 | Change in Unrealized Appreciation (Depreciation) from Investments Held at April 30, 2014 | ||||||||||||||||||||||||||||||
ASSET-BACKED SECURITIES | ||||||||||||||||||||||||||||||||||||||||
United States | $12,663,773 | $ – | $(24) | $177,724 | $ – | $(891,660) | $ – | $(11,949,813) | $ – | $ – | ||||||||||||||||||||||||||||||
TOTAL | $ | 12,663,773 | $ | – | $ | (24 | ) | $ | 177,724 | $ | – | $ | (891,660 | ) | $ | – | $ | (11,949,813 | ) | $ | – | $ | – | |||||||||||||||||
2014 Semi-Annual Report
63
Table of Contents
Notes to Financial Statements (continued)
April 30, 2014 (Unaudited)
| LEVEL 1–Quoted Prices ($) | LEVEL 2–Other Observable | LEVEL 3– Significant Unobservable Inputs ($) | Total ($) | |||||||||||||
| Global High Income Fund | ||||||||||||||||
| Investments in Securities | ||||||||||||||||
Corporate Bonds | – | 1,795,035,057 | 50,063 | 1,795,085,120 | ||||||||||||
Government Bonds | – | 107,282,500 | – | 107,282,500 | ||||||||||||
Government Agencies | – | 13,764,444 | – | 13,764,444 | ||||||||||||
Bank Loans | – | 399,390,529 | 61,230,893 | 460,621,422 | ||||||||||||
Common Stocks | 3,300,925 | – | 41,936,347 | 45,237,272 | ||||||||||||
Preferred Stocks | 7,074,676 | 22,328,252 | – | 29,402,928 | ||||||||||||
Warrants | 9,465,204 | – | – | 9,465,204 | ||||||||||||
Repurchase Agreement | – | 325,401,936 | – | 325,401,936 | ||||||||||||
| Other Financial Instruments | ||||||||||||||||
| Assets | ||||||||||||||||
Forward Foreign Currency Exchange Contracts | – | 12,581 | – | 12,581 | ||||||||||||
Credit Default Swap Contracts | – | 11,691,732 | – | 11,691,732 | ||||||||||||
| Liabilities | ||||||||||||||||
Forward Foreign Currency Exchange Contracts | – | (6,428,831 | ) | – | (6,428,831 | ) | ||||||||||
|
|
|
|
|
|
|
| |||||||||
| 19,840,805 | 2,668,478,200 | 103,217,303 | 2,791,536,308 | |||||||||||||
|
|
|
|
|
|
|
| |||||||||
Asset Valuation Inputs
Global High Income Fund Rollforward of Level 3 Fair Value Measurement For the Period Ended April 30, 2014 | ||||||||||||||||||||||||||||||||||||||||
| Investments in Securities | Balance as of October 31, 2013 | Accrued Discounts (Premiums) | Realized Gain (Loss) | Change in Unrealized Appreciation (Depreciation) | Net Purchases | Net Sales | Net Transfers in to Level 3 | Net Transfers out of Level 3 | Balance as of April 30, 2014 | Change in Unrealized Appreciation (Depreciation) from Investments Held at April 30, 2014 | ||||||||||||||||||||||||||||||
BANK LOANS | ||||||||||||||||||||||||||||||||||||||||
United States | $ | 50,905,340 | $ | 69,245 | $ | (1,595 | ) | $ | 936,130 | $ | 39,167,450 | $ | (306,176 | ) | $ | 11,195,653 | $ | (40,735,154 | ) | $ | 61,230,893 | $ | 936,130 | |||||||||||||||||
COMMON STOCK | ||||||||||||||||||||||||||||||||||||||||
Norway | 32,749,750 | – | – | 9,186,597 | – | – | – | – | 41,936,347 | 9,186,597 | ||||||||||||||||||||||||||||||
CORPORATE BONDS | ||||||||||||||||||||||||||||||||||||||||
United States | 78,069,504 | – | 896,825 | (1,179,662 | ) | – | (27,381,825 | ) | – | (50,354,779 | ) | 50,063 | 6,187 | |||||||||||||||||||||||||||
TOTAL | $ | 161,724,594 | $ | 69,245 | $ | 895,230 | $ | 8,943,065 | $ | 39,167,450 | $ | (27,688,001 | ) | $ | 11,195,653 | $ | (91,089,933 | ) | $ | 103,217,303 | $ | 10,128,914 | ||||||||||||||||||
Amounts listed as “–” are $0 or round to $0.
The following is quantitative information about level 3 fair value measurements:
| Description | Fair Value at 4/30/14 ($) | Valuation Technique(s) | Unobservable Inputs | Range | Weighted Average | |||||||
Global High Income Fund | ||||||||||||
Bank Loans | 61,230,893 | Broker Pricing | Bid/Ask Spread | $100 – $102.5 | $101.5 | |||||||
Common Stocks | 41,936,347 | Evaluated Pricing | Bid/Ask Spread | $29.4 | $29.4 | |||||||
Corporate Bonds | 50,063 | Broker Pricing | Bid/Ask Spread | $3.3 | $3.3 | |||||||
Semi-Annual Report 2014
64
Table of Contents
Notes to Financial Statements (continued)
April 30, 2014 (Unaudited)
Evaluated Pricing: In determining the fair value of the Common Stock as of April 30, 2014, the Fund took an average of the values calculated using the Income Approach – Discounted Cash Flow Method and the Market Approach – Guideline Public Company Method, weighted equally, to derive an evaluated price.
Income Approach: A well-established technique used to estimate the equity value of a company through an analysis of projected income, such as using the Discounted Cash Flow Method. Using this analysis, value is indicated from all of the future cash flows attributable to the subject company discounted to present value at a required rate of return. If debt free cash flows are used, any long-term debt is deducted from the indicated value of the invested capital to determine equity value.
Market Approach: References actual transactions in the equity of the enterprise being valued or transactions in similar enterprises that are traded in private and public markets. Third-party transactions in the equity of an entity generally represent the best estimate of fair value if they are completed at arm’s length. The Guideline Public Company Method involves identifying and selecting publicly traded companies with financial and operating characteristics similar to the company being valued. Once publicly traded companies are identified, valuation multiples can be derived, adjusted for comparability, and then applied to the subject company to estimate the value of its equity or invested capital. Similarly, the Comparable Transactions Method analyzes transactions involving target companies operating in industries similar to the subject company. While it is known that no two companies are exactly alike, nor are any two transactions structured identically, consideration is given to comparisons of the capital structure, operations, size, and profitability, as well as other operating characteristics of the target companies. Once comparable transactions for reasonable targets are identified, valuation multiples can be derived, adjusted for comparability, and then applied to the subject company to estimate the value of its equity or invested capital.
| (b) | Repurchase Agreements |
The Funds may enter into repurchase agreements, under the terms of a Master Repurchase Agreement. It is each Fund’s policy that its custodian/counterparty segregate the underlying collateral securities, the value of which exceeds the principal amount of the repurchase transaction, including accrued interest. The repurchase price generally equals the price paid by a Fund plus interest negotiated on the basis of current short-term rates. To the extent that any repurchase transaction exceeds one business day, the collateral is valued on a daily basis to determine its adequacy. If the counterparty defaults and the value of the collateral declines or if bankruptcy proceedings are commenced with respect to the counterparty of the security, realization of the collateral by the Funds may be delayed or limited. Repurchase agreements are subject to contractual netting arrangements with the counterparty, Fixed Income Clearing Corp. For additional information on individual repurchase agreements, see the schedules of investments.
| (c) | Restricted Securities |
Restricted securities are privately-placed securities whose resale is restricted under U.S. securities laws. The Funds may invest in restricted securities, including unregistered securities eligible for resale without registration pursuant to Rule 144A and privately-placed securities of U.S. and non-U.S. issuers offered outside the U.S. without registration pursuant to Regulation S under the Securities Act of 1933, as amended. Rule 144A securities may be freely traded among certain qualified institutional investors, such as the Funds, but resale of such securities in the U.S. is permitted only in limited circumstances.
| (d) | Foreign Currency Translation |
Foreign currency amounts are translated into U.S. Dollars at the current rate of exchange as of 11:00am Eastern time for Global Select Opportunities Fund, Select International Equity Fund, and Select International Equity Fund II and as of 4:00pm Eastern time for Global High Income Fund and Total Return Bond (“Valuation Time”), to determine the value of investments, assets and liabilities. Purchases and sales of securities, and income and expenses are translated at the prevailing rate of exchange on the respective date of these transactions. The Funds do not isolate that portion of the results of operations resulting from changes in foreign exchange rates on investments from fluctuations arising from changes in market prices of securities held. These fluctuations are included with the net realized and unrealized gain or loss from investments and foreign currencies within the Statements of Operations.
Foreign securities, currencies, and other assets and liabilities denominated in foreign currencies are translated into U.S. Dollars at the exchange rate of said currencies against the U.S. Dollar, as of the Valuation Time, as provided by an independent pricing service.
Investments in emerging markets can be riskier and more volatile than investments in the United States and other developed markets. Adverse political and economic developments can make it more difficult for the Global Select Opportunities Fund, Select International Equity Fund, and Select International Equity Fund II to sell foreign securities which could reduce the NAV of the Funds. In contrast to more established markets, emerging markets may have governments that are less stable and markets that are less liquid, increasing your investment risk. At April 30, 2014, the Select International Equity Fund had 0.2% of its net assets invested in Venezuelan securities and held Venezuelan Bolivar valued at 0.1% of the Select International Equity Fund’s net assets. Venezuela currently imposes foreign exchange controls which prohibit the Select International Equity Fund from repatriating dividends, interest, or other income from investments or proceeds from the sale of Venezuelan securities.
2014 Semi-Annual Report
65
Table of Contents
Notes to Financial Statements (continued)
April 30, 2014 (Unaudited)
| (e) | Derivative Financial Instruments |
The Funds are authorized to use derivatives to manage currency risk, credit risk, and interest rate risk and to replicate, or use as a substitute for, physical securities. Losses may arise due to changes in the value of the contract or if the counterparty does not perform under the contract. The use of derivative instruments involves, to varying degrees, elements of market risk in excess of the amount recognized in the Statements of Assets and Liabilities.
Forward Foreign Currency Exchange Contracts
A forward foreign currency exchange contract (“forward contract”) involves an obligation to purchase and sell a specific currency at a future date, which may be any fixed number of days from the date of the contract agreed upon by the parties, at a price set at the time of the contract. Forward contracts are used to manage a Fund’s currency exposure in an efficient manner. They are used to sell unwanted currency exposure that comes with holding securities in a market, or to buy currency exposure where the exposure from holding securities is insufficient to give the desired currency exposure either in absolute terms or relative to the benchmark. The use of forward contracts allows the separation of decision-making between markets and their currencies. The forward contract is marked-to-market daily and the change in market value is recorded by a Fund as unrealized appreciation or depreciation. Forward contracts’ prices are received daily from an independent pricing provider. When the forward contract is closed, a Fund records a realized gain or loss equal to the difference between the value at the time it was opened and the value at the time it was closed. These realized and unrealized gains and losses are reported on the Statements of Operations. During the six months ended April 30, 2014, the Funds used forward contracts for the purposes of efficient portfolio management and managing active currency risk relative to the benchmark. Managing active currency risk involves both hedging currency risk and adding currency risk in excess of underlying bond positions. A Fund may also enter into forward currency transactions to obtain potential appreciation of a foreign currency, which also adds currency risk.
Swaps
Certain Funds enter into swaps to efficiently gain or hedge interest rate or currency risk. A swap is an agreement that obligates two parties to exchange a series of cash flows at specified intervals based upon or calculated by reference to changes in specified prices or rates for a specified amount of an underlying asset or notional principal amount. A Fund will enter into swaps only on a net basis, which means that the two payment streams are netted out, with a Fund receiving or paying, as the case may be, only the net amount of the difference between the two payments. Risks may arise as a result of the failure of the counterparty to the swap contract to comply with the terms of the swap contract. The loss incurred by the failure of a counterparty is generally limited to the net interest payment to be received by a Fund, and/or the termination value at the end of the contract. Therefore, a Fund considers the creditworthiness of each counterparty to a swap contract in evaluating potential credit risk. Additionally, risks may arise from unanticipated movements in interest rates or in the value of the underlying reference asset or index. A Fund records unrealized gains/(losses) on a daily basis representing the value and the current net receivable or payable relating to open swap contracts. Net amounts received or paid on the swap contract are recorded as realized gains/(losses). Fluctuations in the value of swap contracts are recorded for financial statement purposes as unrealized appreciation or depreciation of swap contracts. Realized gains/(losses) from terminated swaps are included in net realized gains/(losses) on swap contracts transactions.
Certain Funds are a party to International Swap Dealers Association, Inc. Master Agreements (“ISDA Master Agreements”). These agreements are with select counterparties and they govern transactions, including certain over-the-counter derivative and foreign exchange contracts, entered into by certain Funds and the counterparty. The ISDA Master Agreements maintain provisions for general obligations, representations, agreements, collateral, and events of default or termination. The occurrence of a specified event of termination may give a counterparty the right to terminate all of its contracts and affect settlement of all outstanding transactions under the applicable ISDA Master Agreement. To the extent a Fund engages in transactions under these agreements, it is subject to counterparty risk, which is described with respect to swaps both above and below.
Effective June 10, 2013, certain swaps, including interest rate swaps, must be cleared pursuant to U.S. Commodity Futures Trading Commission (“CFTC”) regulations. As a result, interest rate swaps entered into by a Fund after June 10, 2013 can no longer be traded over-the-counter and became subject to various regulations and rules of the CFTC.
Credit Default Swaps
A credit default swap is a credit derivative contract between two counterparties. The buyer makes periodic payments to the seller, and in return receives protection if an underlying financial instrument defaults. A Fund might use credit default swap contracts to limit or to reduce risk exposure of the Fund to defaults of corporate and sovereign issuers (i.e., to reduce risk when the Fund owns or has exposure to such issuers). A Fund also might use credit default swap contracts to create direct or synthetic short or long exposure to domestic or foreign corporate debt securities or certain sovereign debt securities to which the Fund is not otherwise exposed. As the seller in a credit default swap contract, a Fund would be required to pay the par (or other agreed-upon) value of a referenced debt obligation to the counterparty in the event of a default (or similar event) by a third party, such as a U.S. or foreign issuer, on the debt obligation. In return, a Fund would receive from the counterparty a periodic stream of payments over the term of the contract, provided that no event
Semi-Annual Report 2014
66
Table of Contents
Notes to Financial Statements (continued)
April 30, 2014 (Unaudited)
of default (or similar event) occurs. If no event of default (or similar event) occurs, a Fund would keep the stream of payments and would have no payment of obligations. As the seller in a credit default swap contract, a Fund effectively would add economic leverage to its portfolio because, in addition to its total net assets, a Fund would be subject to investment exposure on the notional amount of the swap. As the purchaser in a credit default swap contract, a Fund would function as the counterparty referenced in the preceding paragraph. This would involve the risk that the investment might expire worthless. It also would involve credit risk that the seller may fail to satisfy its payment obligations to a Fund in the event of a default (or similar event). As the purchaser in a credit default swap contract, a Fund’s investment would generate income only in the event of an actual default (or similar event) by the issuer of the underlying obligation. During the six month period ended April 30, 2014, credit default swaps were used in the Global High Income Fund for multiple reasons. The most common use was to gain long credit exposure via credit default swaps when the relative value of credit default swaps looks attractive versus the valuation of the corporate bonds or loans in the capital structure. The Global High Income Fund also used credit default swaps to temporarily hedge portfolio positions when necessary and permitted within the Fund guidelines. In some cases the liquidity and valuation of credit default swaps allows the Global High Income Fund to protect the downside risk of long corporate bond positions at more attractive values than if the Fund sold out of the corporate bond position and then attempted to buy the bonds back in the future.
Entering into swap agreements involves, to varying degrees, elements of credit and market risk in excess of the amounts recognized on the Statements of Assets and Liabilities. Such risks involve the possibility that there will be no liquid market for these agreements, that the counterparty to the agreements may default on its obligation to perform and that there may be unfavorable changes in the value of the index or securities underlying the agreement. The Funds’ maximum risk of loss from counterparty risk related to swaps is the fair value of the contract. This risk is mitigated by having a master netting agreement between the Funds and the counterparties and by the posting of collateral by the counterparties to the Funds to cover the Funds’ exposure to the counterparty.
Summary of Derivative Instruments
Certain Funds may use derivatives for various purposes as noted above. The following is a summary of the fair value of Derivative Instruments, not accounted for as hedging instruments, as of April 30, 2014:
| Total Return Bond Fund | Asset Derivatives | Liability Derivatives | ||||||||||
| Period Ended April 30, 2014 | Period Ended April 30, 2014 | |||||||||||
| Derivatives not accounted for as hedging instruments and risk exposure | Statement of Assets and Liabilities Location | Fair Value | Statement of Assets and Liabilities Location | Fair Value | ||||||||
| Forward foreign exchange contracts | ||||||||||||
(foreign exchange risk) | Unrealized appreciation on forward currency exchange contracts | $ | 649,348 | Unrealized depreciation on forward currency exchange contracts | $ | 1,175,563 | ||||||
Total | $ | 649,348 | $ | 1,175,563 | ||||||||
Total Return Bond Fund has transactions that may be subject to enforceable master netting agreements. A reconciliation of the gross amounts on the Statements of Assets and Liabiilities to the net amounts by broker and derivative type, including any collateral received or pledged, is included in the following tables:
Financial Assets, Derivative Assets, and Collateral Held by Counterparty as of April 30, 2014:
| Gross Amounts Not Offset in the Statement of Assets & Liabilities | ||||||||||||||||||
| Derivative | Counterparty | Gross Amounts of Assets Presented in Statement of Financial Position | Financial Instruments | Collateral Received (1) | Net Amount | |||||||||||||
Forward foreign currency contracts | Credit Suisse International (2) | $ | 298,566 | $ | (298,566 | ) | $ | – | $ | – | ||||||||
Deutsche Bank AG (2) | 122,067 | (122,067 | ) | – | – | |||||||||||||
JPMorgan Chase Bank N.A | 228,715 | (228,715 | ) | – | – | |||||||||||||
Westpac Banking Corp | – | – | – | – | ||||||||||||||
| $ | 649,348 | $ | (649,348 | ) | $ | – | $ | – | ||||||||||
2014 Semi-Annual Report
67
Table of Contents
Notes to Financial Statements (continued)
April 30, 2014 (Unaudited)
Financial Liabilities, Derivative Liabilities, and Collateral Pledged by Counterparty as of April 30, 2014:
| Gross Amounts Not Offset in the Statement of Assets & Liabilities | ||||||||||||||||||
| Derivative | Counterparty | Gross Amounts of Liabilities Presented in Statement of Financial Position | Financial Instruments | Collateral Pledged (1) | Net Amount | |||||||||||||
Forward foreign currency contracts | Credit Suisse International (2) | $ | 364,333 | $ | (298,566 | ) | $ | – | $ | 65,767 | ||||||||
Deutsche Bank AG (2) | 322,050 | (122,067 | ) | – | 199,983 | |||||||||||||
JPMorgan Chase Bank N.A | 325,762 | (228,715 | ) | – | 97,047 | |||||||||||||
Westpac Banking Corp | 163,418 | – | – | 163,418 | ||||||||||||||
| $ | 1,175,563 | $ | (649,348 | ) | $ | – | $ | 526,215 | ||||||||||
| (1) | In some instances, the actual collateral received and/or pledged may be more than the amount shown here due to overcollateralization. |
| (2) | Includes financial instrument (forwards) which are not subject to master netting arrangement, or other another similar arrangement. |
The Effect of Derivative Instruments on the Statement of Operations for the Six Months Ended April 30, 2014:
| Derivatives not accounted for as hedging instruments under Statement 133(a) | Location of Gain or (Loss) on Derivatives | Realized Gain or (Loss) on Derivatives | Change in Unrealized Appreciation/ Depreciation on Derivatives | |||||||
| Realized/Unrealized Gain/(Loss) from Investments, Futures Contracts and Foreign Currency Transactions | ||||||||||
| Forward foreign exchange contracts | ||||||||||
(foreign exchange risk) | $ | 2,359,742 | $ | (2,338,221 | ) | |||||
Total | $ | 2,359,742 | $ | (2,338,221 | ) | |||||
For the Total Return Bond Fund, information about forward currency contracts reflected as of the date of this report is generally indicative of the type of activity for the month ended April 30, 2014. The Fund sold out of its Canadian Dollar forward contracts in December 2013 then began investing again in April 2014. In March 2014, the Fund began investing in Colombian Peso forward contracts. The volume of forward contracts varied throughout the period with an average notional value of $(150,298). The quarterly average notional values for the Fund’s forward contracts were as follows:
| Quarter | Weighted Average Notional Value | |||
1st Quarter | $ | 3,776,060 | ||
2nd Quarter | (4,076,655 | ) | ||
Semi-Annual Report 2014
68
Table of Contents
Notes to Financial Statements (continued)
April 30, 2014 (Unaudited)
| Global High Income Fund | Asset Derivatives | Liability Derivatives | ||||||||||
| Period Ended April 30, 2014 | Period Ended April 30, 2014 | |||||||||||
| Derivatives not accounted for as hedging instruments and risk exposure | Statement of Assets and Liabilities Location | Fair Value | Statement of Assets and Liabilities Location | Fair Value | ||||||||
| Credit default swap contracts | ||||||||||||
(credit rate risk) | Unrealized appreciation on credit default swap contracts | $ | 7,335,570 | Unrealized depreciation on credit default swap contracts | $ | 247,075 | ||||||
| Centrally cleared credit default swap contracts | ||||||||||||
(credit rate risk)* | Variation margin receivable for centrally cleared swap contracts | $ | 14,689 | Variation margin payable for centrally cleared swap contracts | $ | – | ||||||
| Forward foreign exchange contracts | ||||||||||||
(foreign exchange risk) | Unrealized appreciation on forward currency exchange contracts | $ | 12,581 | Unrealized depreciation on forward currency exchange contracts | $ | 6,428,831 | ||||||
Total | $ | 7,348,151 | $ | 6,675,906 | ||||||||
| * | Includes cumulative appreciation/depreciation on centrally cleared credit default swap contracts as reported in the Portfolio of Investments. Only current days variation margin is reported within the Statement of Assets and Liabilities. |
The Global High Income Fund has transactions that may be subject to enforceable master netting agreements. A reconciliation of the gross amounts on the Statements of Assets and Liabilities to the net amounts by broker and derivative type, including any collateral received or pledged, is included in the following tables:
Financial Assets, Derivative Assets, and Collateral Held by Counterparty as of April 30, 2014:
| Gross Amounts Not Offset in the Statement of Assets & Liabilities | ||||||||||||||||||
| Derivative | Counterparty | Gross Amounts | Financial | Collateral | Net Amount (not less than 0) | |||||||||||||
Credit Default Swaps (2) | Deutsche Bank | $ | 1,976,375 | $ | – | $ | (1,220,000 | ) | $ | 756,375 | ||||||||
| Goldman Sachs International | 6,953,724 | – | (5,310,000 | ) | 1,643,724 | |||||||||||||
| JPMorgan Chase Bank N.A. | 1,547,903 | – | (1,547,903 | ) | – | |||||||||||||
| Morgan Stanley | 462,875 | – | (462,875 | ) | – | |||||||||||||
| UBS AG | 750,855 | – | (750,855 | ) | – | |||||||||||||
Forward foreign currency contracts | Deutsche Bank (2) | – | – | – | – | |||||||||||||
| JPMorgan Chase Bank N.A | 12,581 | (12,581 | ) | – | – | |||||||||||||
| Westpac Banking Corp. | – | – | – | – | ||||||||||||||
| $ | 11,704,313 | $ | (12,581 | ) | $ | (9,291,633 | ) | $ | 2,400,099 | |||||||||
2014 Semi-Annual Report
69
Table of Contents
Notes to Financial Statements (continued)
April 30, 2014 (Unaudited)
Financial Assets, Derivative Liabilities, and Collateral Held by Counterparty as of April 30, 2014:
| Gross Amounts Not Offset in the Statement of Assets & Liabilities | ||||||||||||||||||
| Derivative | Counterparty | Gross Amounts of Liabilities Presented in Statement of Financial Position | Financial Instrument | Collateral Received (1) | Net Amount (not less than 0) | |||||||||||||
Credit Default Swaps (2) | Deutsche Bank | $ | – | $ | – | $ | – | $ | – | |||||||||
| Goldman Sachs International | – | – | – | – | ||||||||||||||
| JPMorgan Chase Bank N.A. | – | – | – | – | ||||||||||||||
| Morgan Stanley | – | – | – | – | ||||||||||||||
| UBS AG | – | – | – | – | ||||||||||||||
Forward foreign currency contracts | Deutsche Bank (2) | 205,897 | – | – | 205,897 | |||||||||||||
| JPMorgan Chase Bank N.A | 3,615,337 | (12,581 | ) | – | 3,602,756 | |||||||||||||
| Westpac Banking Corp. | 2,607,597 | – | – | 2,607,597 | ||||||||||||||
| $ | 6,428,831 | $ | (12,581 | ) | $ | 0 | $ | 6,416,250 | ||||||||||
| (1) | In some instances, the actual collateral received and/or pledged may be more than the amount shown here due to overcollateralization. |
| (2) | Includes financial instrument (swaps and forwards) which are not subject to master netting arrangement, or other another similar arrangement. |
The Effect of Derivative Instruments on the Statement of Operations for the Six Months Ended April 30, 2014
| Derivatives not accounted for as hedging instruments under Statement 133(a) | Location of Gain or (Loss) on Derivatives | Realized Gain or (Loss) on Derivatives | Change in Unrealized Appreciation/ Depreciation on Derivatives | |||||||
| Realized/Unrealized Gain/(Loss) from Investments, Futures Contracts and Foreign Currency Transactions | ||||||||||
| Credit default swaps | ||||||||||
(credit risk) | $ | 3,195,759 | $ | 471,637 | ||||||
| Forward foreign exchange contracts | ||||||||||
(foreign exchange risk) | $ | (5,319,765 | ) | $ | (5,268,469 | ) | ||||
Total | $ | (2,124,006 | ) | $ | (4,796,832 | ) | ||||
For the Global High Income Fund, information about forward currency contracts reflected as of the date of this report is generally indicative of the type of activity for the six months ended April 30, 2014. The volume of forward contracts varied throughout the period with an average notional value of $(2,096,169). The quarterly average notional values for the Fund’s forward contracts were as follows:
| Quarter | Weighted Average Notional Value | |||
1st Quarter | $ | (65,612 | ) | |
2nd Quarter | (4,126,726 | ) | ||
Semi-Annual Report 2014
70
Table of Contents
Notes to Financial Statements (continued)
April 30, 2014 (Unaudited)
For the Global High Income Fund, information about credit default swaps reflected as of the date of this report is generally indicative of the type and volume of activity for the five months ended April 30, 2014. In December 2013, the Fund entered into a credit default swap with a notional value of 31,660,000. The quarterly average notional values for the Fund’s credit default swaps were as follows:
| Quarter | Weighted Average Notional Value | |||
1st Quarter | $ | 131,136,667 | ||
2nd Quarter | 141,690,000 | |||
The Funds value derivatives at fair value, as described in this note, and recognize changes in fair value currently in the results of operations. Accordingly, the Funds do not follow hedge accounting even for derivatives employed as economic hedges.
| (f) | Bank Loans |
The Global High Income Fund may invest in bank loans. Bank loans include floating and fixed-rate debt obligations. Floating rate loans are debt obligations issued by companies or other entities with floating interest rates that reset periodically. Floating rate loans are secured by specific collateral of the borrower and are senior to most other securities of the borrower (e.g., common stock or debt instruments) in the event of bankruptcy. Floating rate loans are often issued in connection with recapitalizations, acquisitions, leveraged buyouts, and refinancings. Floating rate loans are typically structured and administered by a financial institution that acts as the agent of the lenders participating in the floating rate loan. Floating rate loans may be acquired directly through the agent, as an assignment from another lender who holds a direct interest in the floating rate loan, or as a participation interest in another lender’s portion of the floating rate loan.
The Global High Income Fund may enter into, or acquire participation in, delayed funding loans and revolving credit facilities. Delayed funding loans and revolving credit facilities are borrowings in which the Global High Income Fund agrees to make loans up to a maximum amount upon demand by the borrowing issuer for a specified term. A revolving credit facility differs from a delayed funding loan in that as the borrowing issuer repays the loan, an amount equal to the repayment is again made available to the borrowing issuer under the facility. The borrowing issuer may at any time borrow and repay amounts so long as, in the aggregate, at any given time the amount borrowed does not exceed the maximum amount established by the loan agreement. Delayed funding loans and revolving credit facilities usually provide for floating or variable rates of interest.
There are a number of risks associated with an investment in delayed funding loans and revolving credit facilities including credit, interest rate and liquidity risk and the risks of being a lender. There may be circumstances under which the borrowing issuer’s credit risk may be deteriorating and yet the Global High Income Fund may be obligated to make loans to the borrowing issuer as the borrowing issuer’s credit continues to deteriorate, including at a time when the borrowing issuer’s financial condition makes it unlikely that such amounts will be repaid. Delayed funding loans and revolving credit facilities may be subject to restrictions on transfer, and only limited opportunities may exist to resell such instruments. As a result, the Global High Income Fund may be unable to sell such investments at an opportune time or may have to resell them at less than fair market value. These risks could cause the Global High Income Fund to lose money on its investment, which in turn could affect its returns. The Global High Income Fund currently intends to treat delayed funding loans and revolving credit facilities for which there is no readily available market as illiquid for purposes of its limitation on illiquid investments. Delayed funding loans and revolving credit facilities are considered to be debt obligations for purposes of the Trust’s investment restriction relating to the lending of funds or assets by the Global High Income Fund.
At April 30, 2014, there was one unfunded commitment which amounted to $4,418,367 of par and had cost and fair value of $4,418,367 and $4,313,431, respectively.
| (g) | Security Transactions, Investment Income and Expenses |
Security transactions are recorded on the trade date. Realized and unrealized gains/(losses) from security and currency transactions are calculated on the identified cost basis. Dividend income is recorded on the ex-dividend date except for certain dividends on foreign securities, which are recorded as soon as a Fund is informed after the ex-dividend date. Interest income is recorded on an accrual basis using the effective interest method. Expenses are recorded on an accrual basis. Expenses directly attributable to a Fund are charged to that Fund. Expenses not directly attributable to a Fund are allocated proportionately among all Funds of the Trust. For each of the Funds, the method for allocating income, fund level expenses, and realized and unrealized gains or losses among classes is based on the total net asset value of each class’s shares in proportion to the total net assets of the Fund. Expenses specific to a class (such as Rule 12b-1 and Transfer Agent fees) are charged to that class.
| (h) | Foreign taxes |
Funds that invest in foreign securities are subject to foreign taxes that may be imposed by certain countries in which the Funds invest. The Funds generally record foreign taxes based on applicable foreign tax law. The Funds incur withholding taxes on certain foreign dividends and
2014 Semi-Annual Report
71
Table of Contents
Notes to Financial Statements (continued)
April 30, 2014 (Unaudited)
interest, and those taxes are accrued at the time the associated income is recorded. The Funds file withholding tax reclaims in certain jurisdictions to recover a portion of amounts previously withheld. The Funds record a reclaim receivable based on, among other things, a jurisdiction’s legal obligation to pay reclaims as well as payment history and market convention. In consideration of recent decisions rendered by European courts, the Aberdeen Select International Equity Fund and Aberdeen Select International Equity Fund II (the “International Equity Funds”) have filed for additional reclaims related to prior years in accordance with European Union law. However, consistent with US GAAP accrual requirements, the International Equity Funds have not recorded a corresponding receivable amount because there is limited historical precedent for US funds collecting reclaims of this magnitude and the amount of the reclaims that these funds may receive in the future, if any, is uncertain. Any amounts to which the International Equity Funds may be entitled, if and when recorded, likely would result in an increase in the net asset value per share of each fund at that time. As of April 30, 2014, the total amount of reclaims filed for the International Equity Funds in the countries that may be affected by the European courts’ decisions (namely, Spain, Finland, France, Germany, The Netherlands, and Poland) represents approximately 5% of the net asset value per share for each of the International Equity Funds; however, the recovery of any or all of this amount and timing of recovery, if any, is uncertain.
| (i) | Distributions |
Distributions from net investment income, if any, are declared and paid monthly for the Total Return Bond Fund and Global High Income Fund. Distributions from net investment income, if any, are declared and paid annually for the Global Select Opportunities Fund, Select International Equity Fund, and Select International Equity Fund II. The Funds will also declare and pay distributions annually from net realized gains on investment transactions and net realized foreign exchange gains, if any. Dividends and distributions to shareholders are recorded on the ex-dividend date. Additional distributions of net investment income and capital gains may be made at the discretion of the Boards of the Funds to avoid the application of the excise tax imposed under Section 4982 of the Internal Revenue Code of 1986, as amended (the “Code”), for certain undistributed amounts.
Dividends and distributions to shareholders are determined in accordance with federal income tax regulations, which may differ from GAAP. These differences are primarily due to differing treatments of income and gains on various investment securities held by the Funds, timing differences and differing characterization of distributions made by the Funds as a whole.
| (j) | Federal Income Taxes |
Each Fund intends to continue to qualify as a “regulated investment company” by complying with the provisions available to certain investment companies, as defined in Subchapter M of the Code, and to make distributions of net investment income and net realized capital gains sufficient to relieve the Funds from all, or substantially all, federal income taxes. Therefore, no federal income tax provision is required.
Management of the Funds has concluded that there are no significant uncertain tax positions that would require recognition in the financial statements. Since tax authorities can examine previously filed tax returns, the Funds’ U.S. federal and state tax returns for each of the four fiscal years up to the most recent fiscal year ended October 31, 2013 are subject to such review.
3. Agreements and Transactions with Affiliates
| (a) | Investment Adviser |
Under the Investment Advisory Agreements with the Funds, effective May 22, 2013, Aberdeen Asset Management Inc. (“Aberdeen” or the “Adviser”) manages the Funds in accordance with the policies and procedures established by the Boards. Prior to May 22, 2013, the Funds were managed by Artio Global Management LLC.
For services provided under the terms of the current Investment Advisory Agreements, each Fund pays the Adviser an annual management fee paid monthly based on that Fund’s average daily net assets according to the following schedule:
| Fund | Fee Schedule | |||||||
Global Select Opportunities Fund | On all assets | 0.900% | ||||||
Select International Equity Fund | Of the first $5 billion | 0.900% | ||||||
| On the next $2.5 billion | 0.880% | |||||||
| Over $7.5 billion | 0.850% | |||||||
Select International Equity Fund II | Of the first $5 billion | 0.900% | ||||||
| On the next $2.5 billion | 0.880% | |||||||
| Over $7.5 billion | 0.850% | |||||||
Total Return Bond Fund | On all assets | 0.350% | ||||||
Global High Income Fund | Of the first $5 billion | 0.650% | ||||||
| On the next $2.5 billion | 0.630% | |||||||
| On the next $2.5 billion | 0.600% | |||||||
| Over $10 billion | 0.590% | |||||||
Semi-Annual Report 2014
72
Table of Contents
Notes to Financial Statements (continued)
April 30, 2014 (Unaudited)
The Adviser has engaged the services of Aberdeen Asset Managers Limited (the “Subadviser”), an affiliate, pursuant to the subadvisory agreements. The Subadviser manages a portion of certain of the Funds’ investments and has responsibility for making all investment decisions for the portion of a Fund’s assets that it manages. Pursuant to the subadvisory agreements, the Adviser pays fees to the Subadviser. For the six months ended April 30, 2014, the Adviser paid the following amounts to the Subadviser for its services to the respective Funds:
| Fund | Amount | |||
Global Select Opportunities Fund | $ | 22,879 | ||
Select International Equity Fund | 1,726,229 | |||
Select International Equity Fund II | 839,369 | |||
Certain of the Funds and Aberdeen have entered into written contracts (“Expense Limitation Agreements”) limiting operating expenses for all classes of each Fund from exceeding the amounts listed below. This limit excludes certain expenses, including taxes, interest, brokerage commissions, and other expenditures which are capitalized in accordance with U.S. GAAP, and other extraordinary expenses not incurred in the ordinary course of the Fund’s business. These contracts are in effect until the earlier of (a) the termination of the Investment Advisory Agreement or (b) February 28, 2015.
| Fund | Class A Limit | Institutional Class Limit | ||||
Global Select Opportunities Fund | 1.40% | 1.15 | % | |||
Total Return Bond Fund | 0.69% | 0.44 | % | |||
Global High Income Fund | 1.00% | 0.75 | % | |||
The Adviser has agreed to continue to waive a portion of its management fee for each of the Funds at the annual rate of 0.005% of the respective Funds’ average daily assets. The waiver may be terminated at any time by the Funds’ Boards.
Aberdeen may request and receive reimbursement from a Fund of the advisory fees waived and other expenses reimbursed pursuant to the Expense Limitation Agreements at a later date not to exceed three years from the fiscal year in which the corresponding reimbursement to the Funds was made.
For fees waived, no reimbursement will be made unless:
(i) the total annual expense ratio of the class making such reimbursement is less than the limit set forth above; and
(ii) the payment of such reimbursement is approved by the Boards on a quarterly basis (the “Reimbursement Requirements”).
If the Boards approve any changes in the waiver terms or limitations, reimbursements are only permitted to the extent that the terms of the Expense Limitation Agreements in effect at the time of the waiver are met at the time that reimbursement is approved. Except as provided for in the Expense Limitation Agreements, reimbursement of amounts previously waived or assumed by Aberdeen is not permitted.
As of April 30, 2014, to the extent the Reimbursement Requirements are met, the cumulative potential reimbursements for each Fund, based on expenses reimbursed by Aberdeen would be:
| Fund | Amount Fiscal Year 2011 (Expires 10/31/14) | Amount Fiscal Year 2012 (Expires 10/31/15) | Amount Fiscal Year 2013 (Expires 10/31/16) | Amount Six Months Ended April 30, 2014 (Expires 10/31/17) | Total* | |||||||||||||||
Global Select Opportunities Fund | $ | 116,491 | $ | 206,366 | $ | 141,446 | $ | 56,785 | $ | 521,088 | ||||||||||
Select International Equity Fund | – | – | – | – | – | |||||||||||||||
Select International Equity Fund II | – | – | – | – | – | |||||||||||||||
Total Return Bond Fund | 7,002 | 11,864 | 29,356 | 24,265 | 72,487 | |||||||||||||||
Global High Income Fund | 129,674 | 13,138 | 67,765 | 55,131 | 265,708 | |||||||||||||||
| * | Amounts reported are due to expire throughout the respective 3-year expiration period presented above. |
| Amounts | listed as “–” are $0 or round to $0. |
4. Distributor and Shareholder Services
The Funds and Aberdeen Fund Distributors, LLC (the “Distributor” or “AFD”) are parties to the current Underwriting Agreement (the “Underwriting Agreement”) whereby the Distributor acts as principal underwriter for the Funds’ shares. Prior to May 22, 2013, Quasar Distributors, LLC (“Quasar”) was the Distributor of the Funds.
2014 Semi-Annual Report
73
Table of Contents
Notes to Financial Statements (continued)
April 30, 2014 (Unaudited)
The Funds have adopted a Distribution and Shareholder Services Plan (the “Plan”), pursuant to Rule 12b-1 under the 1940 Act. Under the Plan, each Fund’s Class A shares may compensate certain financial institutions, including the Distributor, for certain distribution, shareholder servicing, administrative and accounting services. The Funds’ Class A shares may expend an aggregate amount, on an annual basis, not to exceed 0.25% of the value of the average daily net assets of a Fund attributable to Class A shares. The Funds will adjust accruals accordingly for any unused or surplus balances on an annual basis. The Adviser may pay additional marketing and other distribution costs out of its profits.
Under its terms, the Funds’ Plan shall remain in effect from year to year, provided such continuance is approved annually by a vote of a majority of the Boards’ members and a majority of those Boards’ members who are not “interested persons” of the Funds and who have no direct or indirect financial interest in the operation of the Plan or in any agreement related to the Plan.
5. Investment Transactions
Purchases and sales of securities (excluding short-term securities) for the six months ended April 30, 2014, were as follows:
| Fund | Purchases | Sales | ||||||
Global Select Opportunities Fund | $ | 410,687 | $ | 1,108,709 | ||||
Select International Equity Fund | 30,920,324 | 148,128,688 | ||||||
Select International Equity Fund II | 12,944,602 | 79,922,021 | ||||||
Total Return Bond Fund | 912,788,098 | 1,013,377,710 | ||||||
Global High Income Fund | 1,182,922,974 | 1,018,318,029 | ||||||
6. Shares of Beneficial Interest
The Global Select Opportunities Fund may issue 50 billion shares of beneficial interest with a par value of $0.001 per share. The Trust may issue an unlimited number of shares of beneficial interest of each Fund, with a par value of $0.001 per share.
7. Investments in Affiliated Issuers
An affiliated issuer, as defined under the 1940 Act, includes an issuer in which a Fund holds 5% or more of the issuer’s outstanding voting securities. A summary of the Funds’ investments in securities of these issuers for the period ended April 30, 2014 is set forth below:
| Affiliate | Shares Held April 30, 2014 | Purchases (Cost) | Sales (Proceeds) | Dividend Income | Fair Value April 30, 2014 | |||||||||||||||
| Aberdeen Select International Equity Fund | ||||||||||||||||||||
LEV Insurance | 4,078,860 | $ | – | $ | – | $ | – | $ | 1,971,338 | |||||||||||
Toza Markovic ad Kikinda | 78,160 | – | – | – | 80,592 | |||||||||||||||
| $ | 2,051,930 | |||||||||||||||||||
| Affiliate | Shares Held April 30, 2014 | Purchases (Cost) | Sales (Proceeds) | Dividend Income | Fair Value April 30, 2014 | |||||||||||||||
| Aberdeen Global High Income Fund | ||||||||||||||||||||
Deep Ocean | 1,427,968 | $ | – | $ | – | $ | – | $ | 41,936,347 | |||||||||||
8. Portfolio Investment Risks
| (a) | Market Risk |
The Fund could lose value if the individual securities in which it invests or overall markets in which such securities trade decrease in value.
| (b) | Foreign Securities Risk (Equity Funds) |
Foreign securities may be more volatile, harder to price and less liquid than U.S. securities.
| (c) | Foreign Securities Risk (Fixed Income Funds) |
A Fund may invest in foreign securities which lose value because of fluctuations in currency exchange rates and market liquidity, price volatility, uncertain political and legal conditions, lack of reliable financial information and other factors. Foreign securities of certain countries are subject to political instability, which may result in potential revolts and the confiscation of assets by governments. As a result, a Fund’s returns and net asset value may be affected to a large degree by fluctuations in currency exchange rates or political or economic
Semi-Annual Report 2014
74
Table of Contents
Notes to Financial Statements (continued)
April 30, 2014 (Unaudited)
conditions in a particular country or region. In the event of nationalization, default, debt restructuring, capital controls, expropriation or other confiscation, a Fund could lose its entire investment in foreign securities. Adverse conditions in a certain region can adversely affect securities of other countries whose economies appear to be unrelated. To the extent that a Fund invests a significant portion of its assets in a specific geographic region, a Fund will generally have more exposure to regional economic risks associated with foreign investments.
| (d) | Foreign Currency Transaction Risk |
As foreign securities are usually denominated in foreign currencies, a Fund may employ strategies intended to protect the Fund’s portfolio from adverse currency fluctuations. A Fund may also employ strategies intended to increase exposure to certain currencies. Such currency transactions involve additional risks, and a Fund’s strategies, if unsuccessful, may decrease the value of a Fund.
| (e) | Mortgage-Related Securities Risk |
A Fund may invest in mortgage-related securities. Rising interest rates may cause an issuer to exercise its right to pay principal later than expected which tends to extend the duration of mortgage-related securities, making them more sensitive to changes in interest rates. As a result, in a period of rising interest rates, a Fund that holds mortgage-related securities may exhibit additional volatility. This is known as extension risk. In addition, mortgage-related securities are subject to prepayment risk. When interest rates decline, borrowers may pay off their mortgages sooner than expected. This can reduce the returns of a Fund because the Fund will have to reinvest that money at the lower prevailing interest rates.
| (f) | Asset-Backed Securities Risk |
Like traditional fixed income securities, the value of asset-backed securities typically increases when interest rates fall and decreases when interest rates rise. Certain asset-backed securities may also be subject to the risk of prepayment.
| (g) | Emerging Markets Risk |
A magnification of the risks that apply to foreign investments. These risks are greater for securities of companies in emerging market countries because the countries may have less stable governments, more volatile currencies and less established markets (see “Foreign Securities Risk” above).
| (h) | Impact of Large Redemptions and Purchases of Fund Shares |
Occasionally, shareholders may make large redemptions or purchases of Fund shares, which may cause a Fund to have to sell securities or invest additional cash. These transactions may adversely affect the Fund’s performance and increase transaction costs. In addition, large redemption requests may exceed the cash balance of a Fund and result in credit line borrowing fees or overdraft charges to the Fund until the sale of portfolio securities to cover the redemption request settle.
| (i) | Securities Selection Risk |
The investment team may select securities that underperform the stock market or other funds with similar investment objectives and strategies.
| (j) | Mid-Cap Securities Risk |
In general, stocks of mid-cap companies may be more volatile and less liquid than larger company stocks.
| (k) | Small- and Mid-Cap Securities Risk |
In general, stocks of small- and mid-cap companies may be more volatile and less liquid than larger company stocks.
| (l) | Active Trading Risk |
A Fund may engage in active and frequent trading of portfolio securities to achieve its investment objective. If a Fund does trade this way, it may incur increased costs, which can lower the actual return of the Fund. Active trading may also increase short term gains and losses, which may affect taxes that must be paid.
| (m) | Derivatives Risk |
Derivatives can be highly volatile and involve risks in addition to the risks of the underlying investment, index or rate. Derivatives involve special risks including correlation, counterparty, liquidity, operational, accounting and tax risks. Investing in derivatives also requires a specific skill set and may result in losses. Derivatives may be illiquid, difficult to price and leveraged so that small changes may produce disproportionate losses. Gains or losses from derivatives can be substantially greater than the derivatives’ original cost.
| (n) | Interest Rate Risk |
A Fund’s fixed income investments are subject to interest rate risk, which generally causes the value of a fixed income portfolio to decrease when interest rates rise resulting in a decrease in the Fund’s net assets. The Fund may be subject to a greater risk of rising interest rates due to the current period of historically low rates and the effect of potential government fiscal policy initiatives and resulting market reaction to
2014 Semi-Annual Report
75
Table of Contents
Notes to Financial Statements (continued)
April 30, 2014 (Unaudited)
those initiatives. Interest rate fluctuations tend to have a greater impact on fixed income-securities with a greater time to maturity and/or lower coupon. In periods of market volatility, the market values of fixed income securities may be more sensitive to changes in interest rates.
| (o) | Leverage Risk |
Certain transactions may give rise to a form of leverage. Such transactions may include, among others, loans of securities, and the use of when-issued, delayed delivery or forward commitment transactions. The use of derivatives may also cause leveraging risk.
| (p) | Liquidity Risk |
Particular investments may be difficult to purchase or sell such as fixed income securities which have not received any credit ratings, below investment grade securities (i.e., “junk bonds”) or securities that are not widely held. A Fund may make investments that may become less liquid in response to market developments or adverse investor perceptions, which may reduce the returns of the Fund because it may be unable to sell the illiquid securities at an advantageous time or price. Increased market volatility may adversely affect the liquidity of the Fund’s portfolio securities. From time to time, as a result of significant adverse market conditions, some investments a Fund may purchase may become illiquid which may cause the Fund difficulty in meeting redemptions.
| (q) | Municipal Securities Risk |
A Fund may invest in municipal bonds which may be significantly affected by political and economic changes, including inflation, as well as uncertainties in the municipal market related to taxation, legislative changes, or the rights of municipal security holders. Municipal Bonds have varying levels of sensitivity to changes in interest rates. In general, the price of a Municipal Bond can fall when interest rates rise and can rise when interest rates fall. Interest rate risk is generally lower for shorter-term Municipal Bonds and higher for long term Municipal Bonds. Under certain market conditions, the Adviser may purchase Municipal Bonds that the Adviser perceives are undervalued. Undervalued Municipal Bonds are subject to the same market volatility and principal and interest rate risks described above. Lower quality Municipal Bonds involve greater risk of default or price changes due to changes in the credit quality of the issuer. The value of lower quality Municipal Bonds often fluctuates in response to political or economic developments and can decline significantly over short periods of time or during periods of general or regional economic difficulty. In the case of tax-exempt Municipal Bonds, if the Internal Revenue Service or state tax authorities determine that an issuer of a tax-exempt Municipal Bond has not complied with applicable tax requirements, interest from the security could become taxable at the federal, state and/or local level, and the security could decline significantly in value. Municipal Bonds are subject to credit or default risk. Credit risk is the risk that the issuer of a municipal security might not make interest and principal payments on the security as they become due.
| (r) | Private Placements and Other Restricted Securities Risk |
Investments in private placements and other restricted securities, including Regulation S Securities and Rule 144A Securities, could have the effect of increasing a Fund’s level of illiquidity. Private placements and restricted securities may be less liquid than other investments because such securities may not always be readily sold in broad public markets and a Fund might be unable to dispose of such securities promptly or at prices reflecting their true value.
| (s) | Bank Loan Risk |
There are a number of risks associated with an investment in bank loans including credit risk, interest rate risk, illiquid securities risk, and prepayment risk. There is also the possibility that the collateral securing a loan, if any, may be difficult to liquidate or be insufficient to cover the amount owed under the loan. These risks could cause a Fund to lose income or principal on a particular investment, which in turn could affect a Fund’s returns.
| (t) | Credit Risk |
Fixed income securities are subject to credit risk, which is the risk that an issuer of a bond may default on its obligation to pay or repay interest and principal. In the event of an unanticipated default, a Fund would experience a reduction in its income and could expect a decline in the market value of the securities so affected.
| (u) | Delayed Funding Loans and Revolving Credit Facilities Risk |
There are a number of risks associated with an investment in delayed funding loans and revolving credit facilities including credit, interest rate and liquidity risk and the risks of being a lender. There may be circumstances under which the borrowing issuer’s credit risk may be deteriorating and yet a Fund may be obligated to make loans to the borrowing issuer as the borrowing issuer’s credit continues to deteriorate, including at a time when the borrowing issuer’s financial condition makes it unlikely that such amounts will be repaid. Delayed funding loans and revolving credit facilities may be subject to restrictions on transfer, and only limited opportunities may exist to resell such instruments.
| (v) | High-Yield Bonds and Other Lower-Rated Securities Risk |
A Fund’s investments in high-yield bonds (commonly referred to as “junk bonds”) and other lower-rated securities will subject the Fund to substantial risk of loss. Investments in high-yield bonds are speculative and issuers of these securities are generally considered to be less
Semi-Annual Report 2014
76
Table of Contents
Notes to Financial Statements (continued)
April 30, 2014 (Unaudited)
financially secure and less able to repay interest and principal than issuers of investment-grade securities. Prices of high-yield bonds tend to be very volatile. These securities are less liquid than investment-grade debt securities and may be difficult to price or sell, particularly in times of negative sentiment toward high-yield securities.
| (w) | Prepayment Risk |
The principal amount of the mortgages underlying a Fund’s investments in mortgage-related securities may be prepaid, generally when interest rates fall, which may cause the Fund’s income to decline.
Please read the prospectus for more detailed information regarding these and other risks.
9. Contingencies
In the normal course of business, the Funds may provide general indemnifications pursuant to certain contracts and organizational documents. The Funds’ maximum exposure under these arrangements is dependent on future claims that may be made against the Funds, and therefore, cannot be estimated; however, based on experience, the risk of loss from such claims is considered remote.
10. Tax Information
As of April 30, 2014, the tax cost of securities and the breakdown of unrealized appreciation/(depreciation) for each Fund were as follows:
| Tax Cost of Securities | Unrealized Appreciation | Unrealized Depreciation | Net Unrealized Appreciation (Depreciation) | |||||||||||||
Global Select Opportunities Fund | $ | 7,257,860 | $ | 654,153 | $ | (279,450 | ) | $ | 374,703 | |||||||
Select International Equity Fund | 600,866,396 | 46,523,690 | (89,130,457 | ) | (42,606,767 | ) | ||||||||||
Select International Equity Fund II | 258,951,789 | 21,632,283 | (10,672,157 | ) | 10,960,126 | |||||||||||
Total Return Bond Fund | 1,538,079,413 | 31,827,214 | (16,047,663 | ) | 15,779,551 | |||||||||||
Global High Income Fund | 2,674,731,422 | 146,920,578 | (35,391,174 | ) | 111,529,404 | |||||||||||
The tax character of distributions paid during the fiscal year ended October 31, 2013 was as follows (total distributions paid differ from the Statements of Changes in Net Assets because for tax purposes dividends are recognized when actually paid):
| Distributions paid from | ||||||||||||||||||||||||
| Fund | Ordinary Income | Net Long Term Capital Gain | Total Taxable Distributions | Tax Exempt Distributions | Return of Capital | Total Distributions Paid | ||||||||||||||||||
Global Select Opportunities Fund | $ | 187,778 | $ | – | $ | 187,778 | $ | – | $ | – | $ | 187,778 | ||||||||||||
Select International Equity Fund | 7,506,959 | – | 7,506,959 | – | – | 7,506,959 | ||||||||||||||||||
Select International Equity Fund II | 25,691,817 | – | 25,691,817 | – | 87,115 | 25,778,932 | ||||||||||||||||||
Total Return Bond Fund | 60,478,188 | 32,127,743 | 92,605,931 | – | 3,301,594 | 95,907,525 | ||||||||||||||||||
Global High Income Fund | 181,064,496 | 10,883,785 | 191,948,281 | – | – | 191,948,281 | ||||||||||||||||||
2014 Semi-Annual Report
77
Table of Contents
Notes to Financial Statements (continued)
April 30, 2014 (Unaudited)
As of October 31, 2013, the components of accumulated earnings (deficit) on a tax basis were as follows:
| Fund | Undistributed Tax Exempt Income | Undistributed Ordinary Income | Undistributed Long-Term Capital Gains | Accumulated Earnings | Distributions Payable | Late Year Ordinary and Post- October Capital Loss Deferrals | Other Temporary Differences | Accumulated Capital and Other Losses** | Unrealized Appreciation/ Depreciation* | Total Accumulated Earnings (Deficit) | ||||||||||||||||||||||||||||||
Global Select Opportunities Fund | $ | – | $ | 107,020 | $ | – | $ | 107,020 | $ | – | $ | – | $ | – | $ | (27,937,000 | ) | $ | 255,559 | $ | (27,574,421 | ) | ||||||||||||||||||
Select International Equity Fund | – | 12,327,507 | – | 12,327,507 | – | – | – | (2,259,312,281 | ) | (63,174,909 | ) | (2,310,159,683 | ) | |||||||||||||||||||||||||||
Select International Equity Fund II | – | – | – | – | – | – | (25,913 | ) | (2,720,144,132 | ) | 12,728,051 | (2,707,441,994 | ) | |||||||||||||||||||||||||||
Total Return Bond Fund | – | – | – | – | – | – | (1,812,006 | ) | – | (1,112,246 | ) | (2,924,251 | ) | |||||||||||||||||||||||||||
Global High Income Fund | – | – | 27,301,497 | 27,301,497 | – | – | (1,223,044 | ) | – | 102,488,547 | 128,547,000 | |||||||||||||||||||||||||||||
| * | The difference between the book-basis and tax-basis unrealized appreciation/(depreciation) is attributable primarily to passive foreign investment companies and tax deferral of losses on wash sales, the difference between book and tax amortization methods for premium and market discounts. |
| ** | As of October 31, 2013, for Federal income tax purposes, the following Funds have capital loss carryforwards available to offset capital gains, if any, to the extent provided by the Treasury regulations, which expire in the years set forth below: |
| Fund | Amount | Expires | ||||||
Global Select Opportunities Fund | $ | 17,909,743 | 2016 | |||||
Global Select Opportunities Fund | 10,012,137 | 2017 | ||||||
Global Select Opportunities Fund | 15,120 | Unlimited Short-Term | ||||||
Select International Equity Fund | 314,780,611 | 2016 | ||||||
Select International Equity Fund | 1,643,693,179 | 2017 | ||||||
Select International Equity Fund | 279,988,563 | Unlimited Long-Term | ||||||
Select International Equity Fund | 20,849,928 | Unlimited Short-Term | ||||||
Select International Equity Fund II | 1,379,336,238 | 2016 | ||||||
Select International Equity Fund II | 1,211,390,775 | 2017 | ||||||
Select International Equity Fund II | 121,152,924 | 2018 | ||||||
Select International Equity Fund II | 8,264,195 | Unlimited Short-Term | ||||||
Under the Regulated Investment Company Modernization Act of 2010, the Funds are permitted to carry forward capital losses incurred in taxable years beginning after December 22, 2010 for an unlimited period. However, any losses incurred during those taxable years will be required to be utilized prior to the losses incurred in pre-enactment taxable years. As a result of this ordering rule, pre-enactment capital loss carryforwards may be more likely to expire unused. Additionally, post-enactment capital losses that are carried forward will retain their character as either short-term or long-term capital losses rather than being considered all short-term as under previous law.
Semi-Annual Report 2014
78
Table of Contents
Notes to Financial Statements (concluded)
April 30, 2014 (Unaudited)
11. Significant Shareholders
As of April 30, 2014, the following Funds had shareholders with the percentage ownership indicated, which are considered significant shareholders (holdings greater than 5.0%) for financial reporting purposes:
| Fund | Record Ownership % | Number of Account Owners | ||
Global Select Opportunities Fund | 57.8% | 5 | ||
Select International Equity Fund | 63.6 | 2 | ||
Select International Equity Fund II | 57.6 | 5 | ||
Total Return Bond Fund | 71.1 | 3 | ||
Global High Income Fund | 74.4 | 8 |
12. Line of Credit
Aberdeen Global Select Opportunities Fund Inc. and Aberdeen Investment Funds (the “Borrowers”) entered into a Credit Agreement (the “Agreement”) with State Street Bank and Trust Company (the “Bank”). The Agreement provides for a revolving credit facility (the “Facility Amount”) to be utilized for temporary or emergency purposes to fund shareholder redemptions or for other short-term liquidity purposes. The Facility Amount was $175,000,000 for the period ending April 30, 2014. The Funds may draw up to their stated sublimit (subject to certain other limitations therein):
| Sublimit Amount | Average Outstanding Daily Balance | Average Weighted Interest Rate | ||||||||||
Aberdeen Global Select Opportunities Fund | $ | 5,000,000.00 | $ | 336,357.99 | 1.344 | % | ||||||
Aberdeen Select International Equity | 175,000,000.00 | 338,002.39 | 1.344 | % | ||||||||
Aberdeen Select International Equity II | 175,000,000.00 | 344,047.19 | 1.342 | % | ||||||||
Aberdeen Total Return Bond Fund | 50,000,000.00 | – | – | |||||||||
In addition, the Global High Income Fund entered into a separate Credit Agreement (the “Global High Income Fund Credit Agreement”) with the Bank. The Global High Income Fund Credit Agreement provides for a revolving credit facility (the “Global High Income Fund Facility Amount”) to be utilized for temporary or emergency purposes to fund shareholder redemptions or for other short-term liquidity purposes. The Global High Income Fund Facility Amount was $250,000,000 for the period ended April 30, 2014. The Global High Income Fund may draw the entire $250,000,000 (subject to certain limitations).
| Amount | Average Outstanding Daily Balance | Average Weighted Interest Rate | ||||||||||
Aberdeen Global High Income Fund | $ | 250,000,000.00 | $ | 401,232.64 | 0.100 | % | ||||||
Principal on each outstanding loan made under the Agreement and the Global High Income Fund Credit Agreement shall bear the interest at a variable rate per annum equal to the higher of (a) the Federal Funds Rate as in effect on that day plus 1.25% and (b) the Overnight LIBOR Rate as in effect on that day plus 1.25%. In addition, the Borrowers shall pay to the Bank a commitment fee at the rate of 0.10% per annum on the daily unused portion of each of the Facility Amount or Global High Income Fund Facility Amount, as applicable.
13. Subsequent Events
Management has evaluated the need for disclosures and/or adjustments resulting from subsequent events through the date the Financial Statements were issued. Based on this evaluation, no disclosures and/or adjustments were required to the Financial Statements as of April 30, 2014.
2014 Semi-Annual Report
79
Table of Contents
Shareholder Expense Examples (Unaudited)
As a shareholder of a Fund, you incur ongoing costs, including investment advisory fees, shareholder service fees, distribution fees and other Fund expenses. The examples below are intended to help you understand your ongoing costs (in dollars) of investing in the Funds and to compare these costs with the ongoing costs of investing in other mutual funds.
The examples assume that you had a $1,000 investment in the Class at the beginning of the reporting period, May 1, 2013 and continued to hold your shares at the end of the reporting period, April 30, 2014.
Actual Expenses
The table below provides information about actual account values and actual expenses. You may use the information together with the amount you invested, to estimate the expenses that you paid over the period. Simply divide your account value by $1,000 (for example, an $8,600 account value divided by $1,000 = 8.6), then multiply the result by the number under the heading entitled “Actual Expenses Paid During Period” for the class of a Fund that you own to estimate the expenses you paid on your account during the period.
Hypothetical Example for Comparison Purposes
The table below provides information about hypothetical account values and hypothetical expenses based on the actual expense ratio of each Class of each Fund and an assumed rate of return of 5% per year before expenses, which is not the Class’ actual return. The hypothetical account values and expenses may not be used to estimate the actual ending account balance or expenses you paid for the period. You may use this information to compare the ongoing costs of investing in a Class of a Fund and other funds. To do so, compare the 5% hypothetical example with the 5% hypothetical examples that appear in the shareholder reports of the other funds.
| Beginning Account Value, November 1, 2013 | Actual Ending Account Value, April 30, 2014 | Hypothetical Ending Account Value | Actual Expenses Paid During Period* | Hypothetical Expenses Paid During Period*1 | Annualized Expense Ratio** | |||||||||||||||||||||
Aberdeen Global Select Opportunities Fund Inc. | Class A | $ | 1,000.00 | $ | 1,052.40 | $ | 1,018.00 | $ | 6.97 | $ | 6.85 | 1.37% | ||||||||||||||
Institutional Class2 | $ | 1,000.00 | $ | 1,053.50 | $ | 1,019.09 | $ | 5.86 | $ | 5.76 | 1.15% | |||||||||||||||
Aberdeen Select International Equity Fund | Class A | $ | 1,000.00 | $ | 1,044.30 | $ | 1,018.30 | $ | 6.64 | $ | 6.56 | 1.31% | ||||||||||||||
Institutional Class2 | $ | 1,000.00 | $ | 1,045.60 | $ | 1,019.44 | $ | 5.48 | $ | 5.41 | 1.08% | |||||||||||||||
Aberdeen Select International Equity Fund II | Class A | $ | 1,000.00 | $ | 1,045.60 | $ | 1,017.80 | $ | 7.15 | $ | 7.05 | 1.41% | ||||||||||||||
Institutional Class2 | $ | 1,000.00 | $ | 1,046.70 | $ | 1,018.89 | $ | 6.04 | $ | 5.96 | 1.19% | |||||||||||||||
Aberdeen Total Return Bond Fund | Class A | $ | 1,000.00 | $ | 1,019.20 | $ | 1,021.42 | $ | 3.40 | $ | 3.41 | 0.68% | ||||||||||||||
Institutional Class2 | $ | 1,000.00 | $ | 1,020.70 | $ | 1,022.61 | $ | 2.20 | $ | 2.21 | 0.44% | |||||||||||||||
Aberdeen Global High Income Fund | Class A | $ | 1,000.00 | $ | 1,051.90 | $ | 1,019.89 | $ | 5.04 | $ | 4.96 | 0.99% | ||||||||||||||
Institutional Class2 | $ | 1,000.00 | $ | 1,052.80 | $ | 1,021.08 | $ | 3.82 | $ | 3.76 | 0.75% | |||||||||||||||
| * | Expenses are equal to the Fund’s annualized expense ratio multiplied by the average account value over the period multiplied by 181/365 (to reflect the one-half year period). |
| ** | The expense ratio presented represents a six-month, annualized ratio. |
| 1 | Represents the hypothetical 5% return before expenses. |
| 2 | Formerly Class I shares. |
Semi-Annual Report 2014
80
Table of Contents
Rev. 09/2012
FACTS | WHAT DOES ABERDEEN DO WITH YOUR PERSONAL INFORMATION? |  | ||||||
Why? | Financial companies choose how they share your personal information. Federal law gives consumers the right to limit some but not all sharing. Federal law also requires us to tell you how we collect, share, and protect your personal information. Please read this notice carefully to understand what we do. | |||||||
What? | The types of personal information we collect and share depend on the product or service you have with us. This information can include:
· Social Security number and account balances
· Transaction history and assets
· Checking account information and wire transfer instructions |
| ||||||
How? | All financial companies need to share customers’ personal information to run their everyday business. In the section below, we list the reasons financial companies can share their customers’ personal information; the reasons the Funds choose to share; and whether you can limit this sharing. | |||||||
Reasons we can share your personal information | Does Aberdeen share? | | Can you limit this sharing? | | ||||
For our everyday business purposes— such as to process your transactions, maintain your account(s), respond to court orders and legal investigations, or report to credit bureaus | Yes | No | ||||||
For our marketing purposes— to offer our products and services to you | Yes | Yes | ||||||
For joint marketing with other financial companies | No | We don’t share | ||||||
For our affiliates’ everyday business purposes— information about your transactions and experiences | Yes | No | ||||||
For our affiliates’ everyday business purposes— information about your creditworthiness | No | We don’t share | ||||||
For our affiliates to market to you | No | We don’t share | ||||||
For nonaffiliates to market to you | No | We don’t share | ||||||
To limit our sharing | · Call 1-877-332-7806
Please note:
If you are a new customer, we can begin sharing your information 30 days from the date we sent this notice. When you are no longer our customer, we continue to share your information as described in this notice.
However, you can contact us at any time to limit our sharing. |
| ||||||
Questions? | www.aberdeen-asset.us | |||||||
Table of Contents
| Page 2 |
Who we are | ||
Who is providing this notice? | Aberdeen Select International Equity Fund, Aberdeen Select International Equity Fund II, Aberdeen Total Return Bond Fund, and Aberdeen Global High Income Fund, (collectively the “Aberdeen Investment Funds”) and Aberdeen Global Select Opportunities Fund Inc. (with the Aberdeen Investment Funds the “Funds”). | |
What we do | ||
How do Aberdeen Funds protect my personal information? | To protect your personal information from unauthorized access and use, we use security measures that comply with federal law. These measures include computer safeguards and secured files and buildings. | |
How do Aberdeen Funds collect my personal information? | We collect your personal information, for example, when you:
· Open an account or give us your contact information
· Provide account information or make wire transfers
· Make deposits or withdrawals from your account | |
Why can’t I limit all sharing? | Federal law gives you the right to limit only:
· Sharing for affiliates’ everyday business purposes—information about your creditworthiness
· Affiliates from using your information to market to you
· Sharing for nonaffiliates to market to you
State laws and individual companies may give you additional rights to limit sharing. | |
What happens when I limit sharing for an account I hold jointly with someone else? | Your choices will apply to everyone on your account. | |
Definitions | ||
Affiliates | Companies related by common ownership or control. They can be financial and nonfinancial companies.
· Our affiliates include companies with an Aberdeen Asset Management name and wholly-owned subsidiaries of Aberdeen Asset Management PLC, a global financial services company. | |
Nonaffiliates | Companies not related by common ownership or control. They can be financial and nonfinancial companies.
· The Funds do not share personal information with nonaffiliates so they can market to you. | |
Joint marketing | A formal agreement between nonaffiliated financial companies that together market financial products or services to you.
· The Funds do not jointly market. | |
Other important information | ||
| This Privacy Notice is being provided by the Funds, each of which is a U.S.-registered open-end investment company, and other North-American-registered closed-end investment companies managed by Aberdeen Asset Management Inc. or its affiliates. | ||
Table of Contents
Management Information
Trustees/Directors
Antoine Bernheim, Chairman
Thomas Gibbons
Cynthia Hostetler
Robert S. Matthews
Peter Wolfram
Gary Marshall
Officers
Gary Marshall, President and Chief Executive Officer
Jeffrey Cotton, Chief Compliance Officer and Vice President
Sofia Rosala, Deputy Chief Compliance Officer and Vice President
Andrea Melia, Treasurer and Chief Financial Officer
Megan Kennedy, Assistant Secretary and Vice President
Lucia Sitar, Chief Legal Officer and Vice President
Alan Goodson, Vice President
Stephen Docherty, Vice President
Greg Hopper, Vice President
Jennifer Nichols, Vice President
Donald Quigley, Vice President
Andrew Smith, Vice President
Hugh Young, Vice President
Michael McVoy, Anti-Money Laundering and Identity Theft Officer
Julie Tedesco, Secretary
Pamela Wade, Assistant Secretary
Brian O’Neill, Assistant Treasurer
Investment Manager
Aberdeen Asset Management Inc.
1735 Market Street, 32nd Floor
Philadelphia, PA 19103
Transfer Agent
U.S. Bancorp Fund Services, LLC
615 E. Michigan Street
Milwaukee, WI 53202
Distributor
Aberdeen Fund Distributors LLC
1735 Market Street, 32nd Floor
Philadelphia, PA 19103
Fund Administrator, Custodian & Fund Accountant
State Street Bank and Trust Company
1 Lincoln Street
Boston, MA 02111
Independent Registered Public Accounting Firm
KPMG LLP
1601 Market Street
Philadelphia, PA 19103-2499
Fund Counsel
Morrison & Foerster LLP
250 West 55th Street
New York, NY 10019-9601
Table of Contents
Aberdeen Asset Management Inc. 1735 Market Street, 32nd Floor Philadelphia, PA 19103 aberdeen-asset.us | |
AOE-0377-SAR
Table of Contents
Item 2. Code of Ethics.
Not applicable – for annual reports only.
Item 3. Audit Committee Financial Expert.
Not applicable – for annual reports only.
Item 4. Principal Accountant Fees and Services.
Not applicable – for annual reports only.
Item 5. Audit Committee of Listed Registrants.
Not applicable – for annual reports only.
Item 6. Schedule of Investments
(a) Included as part of the Reports to Shareholders under Item 1 of this Form N-CSR.
(b) Not applicable.
Item 7. Disclosure of Proxy Voting Policies and Procedures for Closed-End Management Investment Companies.
Not applicable.
Item 8. Portfolio Managers of Closed-end Management Investment Companies.
Not applicable.
Item 9. Purchases of Equity Securities by Closed-End Management Investment Company and Affiliated Purchasers.
Not applicable.
Item 10. Submission of Matters to a Vote of Security Holders.
During the period ended April 30, 2014, there were no material changes to the procedures by which shareholders may recommend nominees to the registrant’s Board of Trustees.
Item 11. Controls and Procedures.
(a) The registrant’s principal executive and principal financial officers, or persons performing similar functions, have concluded that the registrant’s disclosure controls and procedures (as defined in Rule 30a-3(c) under the Investment Company Act of 1940 (the “Act”) (17 CFR 270.30a-3(c)))
Table of Contents
are effective, as of a date within 90 days of the filing date of the report that includes the disclosure required by this paragraph, based on the evaluation of these controls and procedures required by Rule 30a-3(b) under the Act (17 CFR 270.30a3(b)) and Rule 13a-15(b) or 15d-15(b) under the Securities Exchange Act of 1934 (17 CFR 240.13a-15(b) or 240.15d15(b)).
(b) There were no changes in the registrant’s internal control over financial reporting (as defined in Rule 30a-3(d) under the Act (17 CFR 270.30a-3(d)) that occurred during the second fiscal quarter of the period covered by this report that has materially affected, or is reasonably likely to materially affect, the registrant’s internal control over financial reporting.
Item 12. Exhibits.
(a)(1) Not applicable.
(a)(2) Certifications of the registrant pursuant to Rule 30a-2(a) under the Act are exhibits to this report.
(a)(3) Not applicable.
(b) Certifications of the registrant pursuant to Rule 30a-2(b) under the Act are exhibits to this report.
Table of Contents
SIGNATURES
Pursuant to the requirements of the Securities Exchange Act of 1934 and the Investment Company Act of 1940, the registrant has duly caused this report to be signed on its behalf by the undersigned, thereunto duly authorized.
Aberdeen Investment Funds
| By: | /s/ Gary Marshall | |
| Gary Marshall | ||
| Principal Executive Officer of | ||
| Aberdeen Investment Funds | ||
| Date: July 3, 2014 | ||
Pursuant to the requirements of the Securities Exchange Act of 1934 and the Investment Company Act of 1940, this report has been signed below by the following persons on behalf of the registrant and in the capacities and on the dates indicated.
| By: | /s/ Gary Marshall | |
| Gary Marshall | ||
| Principal Executive Officer of | ||
| Aberdeen Investment Funds | ||
| Date: July 3, 2014 | ||
| By: | /s/ Andrea Melia | |
| Andrea Melia | ||
| Principal Financial Officer of | ||
| Aberdeen Investment Funds | ||
| Date: July 3, 2014 | ||