UNITED STATES
SECURITIES AND EXCHANGE COMMISSION
Washington, D.C. 20549
FORM N-CSR
CERTIFIED SHAREHOLDER REPORT
OF REGISTERED MANAGEMENT INVESTMENT COMPANIES
| Investment Company Act file number: | 811-06652 | |
| Exact name of registrant as specified in charter: | Aberdeen Investment Funds | |
| Address of principal executive offices: | 1735 Market Street, 32nd Floor | |
| Philadelphia, PA 19103 | ||
| Name and address of agent for service: | Ms. Andrea Melia | |
| Aberdeen Asset Management Inc. | ||
| 1735 Market Street, 32nd Floor | ||
| Philadelphia, PA 19103 | ||
| Registrant’s telephone number, including area code: | 866-667-9231 | |
| Date of fiscal year end: | October 31 | |
| Date of reporting period: | April 30, 2017 | |
Item 1. Reports to Shareholders.

Aberdeen Investment Funds
Semi-Annual Report
April 30, 2017
Aberdeen Select International Equity Fund
Aberdeen Select International Equity Fund II
Aberdeen Total Return Bond Fund
Aberdeen Global High Income Fund

| Page 1 | ||||
| Page 2 | ||||
| Page 8 | ||||
| Page 14 | ||||
| Page 27 | ||||
| Page 37 | ||||
| Page 52 | ||||
| Page 73 | ||||
Investors should carefully consider a fund’s investment objectives, risks, fees, and expenses before investing any money. To obtain this and other fund information, please call 866-667-9231 to request a prospectus, or download a prospectus at www.aberdeen-asset.us. Please read it carefully before investing any money.
Investing in mutual funds involves risk, including possible loss of principal.
Aberdeen Select International Equity Fund, Aberdeen Select International Equity Fund II, Aberdeen Total Return Bond Fund, and Aberdeen Global High Income Fund, (each a “Fund” and collectively the “Funds”) are distributed by Aberdeen Fund Distributors, LLC, Member FINRA, 1735 Market Street, 32nd Floor, Philadelphia, PA 19103.
Aberdeen Asset Management Inc. (AAMI) has been registered as an investment adviser under the Investment Advisers Act of 1940 since August 23,1995. Registration with the Securities and Exchange Commission does not imply any certain level of skill or training.
Statement Regarding Availability of Quarterly Portfolio Schedule.
The complete schedule of portfolio holdings for the Funds is included in the Funds’ semi-annual and annual reports to shareholders. The Funds file complete schedules of portfolio holdings for each Fund with the Securities and Exchange Commission (the “SEC”) for the first and third quarters of each fiscal year on Form N-Q. The Funds’ Forms N-Q are available on the SEC’s website at http://www.sec.gov. The Funds’ Forms N-Q may be reviewed and copied at the SEC’s Public Reference Room in Washington, DC, and information on the operation of the Public Reference Room may be obtained by calling 800-SEC-0330. The Funds make their most recent Forms N-Q available to shareholders on www.aberdeen-asset.us or upon request without charge.
Statement Regarding Availability of Proxy Voting Record.
Information regarding the policies and procedures that the Funds use to determine how to vote proxies relating to portfolio securities is available without charge, upon request, by calling 866-667-9231. The information is also included in the Funds’ Statement of Additional Information, which is available on the Funds’ website at www.aberdeen-asset.us and on the SEC’s website at www.sec.gov.
Information relating to how each Fund voted proxies relating to portfolio securities held during the most recent twelve months ended June 30 is available by August 30 of the relevant year: (i) upon request and without charge by calling 866-667-9231; and (ii) on the SEC’s website at www.sec.gov.
The vicissitudes of global financial markets over the six-month period ended April 30, 2017 appeared to be slotted between a pair of opposite political bookends. Early in the period in November 2016, Republican Donald Trump surprisingly won the U.S. presidential election, defeating his Democratic party opponent, former U.S. Senator and Secretary of State Hillary Clinton. Trump’s victory seemed to be a continuation of the populist political movement that led to the UK’s vote to leave the European Union (Brexit) five months earlier. Trump had promoted a generally populist message aimed at garnering support from working-class Americans in rural areas in the South and Midwest regions of the U.S. Indeed, his campaign’s promise to “drain the swamp” in the nation’s capital, Washington, D.C., appealed to disaffected blue-collar voters who expressed frustration at being “left behind” during the U.S. economic recovery. However, the new president soon faced numerous political challenges – most notably the ongoing investigation of several members of his administration into possible collusion with the Russian government during the presidential election. Consequently, the myriad distractions hindered Trump’s ability to carry out his policy initiatives over the first four months of his term. Fast-forwarding to the end of the reporting period, the French presidential election took center stage. Global markets were bolstered when independent centrist candidate Emmanuel Macron was the top vote-getter in the first round of the election in late April 2017. Macron subsequently won the final round of the presidential election in early May by a nearly two-to-one margin over far-right candidate Marine Le Pen, who – mirroring Trump – had campaigned on a populist agenda.
The Morgan Stanley Capital International (MSCI) World Index,1 a global equity market benchmark, rose 12.4% for the reporting period. Shares of U.S. large-cap companies significantly outperformed their Asian counterparts for the period, but lagged the performance of large-cap European stocks. The U.S. broader-market Standard & Poor’s (S&P) 500 Index was up 13.3% for the period, while the MSCI Europe and MSCI All Country (AC) Asia Pacific indices returned 14.5% and 8.1%, respectively. Global emerging markets, as measured by the MSCI Emerging Markets Index, advanced 9.0% for the reporting period, but underperformed their developed-market peers.
Major U.S. equity market indices moved sharply higher over the reporting period despite numerous stretches of uncertainty spurred by investors’ concerns regarding the policies and controversial political developments surrounding the Trump administration. In this “risk-on” environment over the six-month period, shares of small-cap companies, as represented by the Russell 2000 Index, climbed 18.4%, considerably outpacing the 13.3% return of the S&P 500 Index. While the period was marked by mixed economic news – improving employment data but more modest economic growth – most U.S. companies reported strong operating results and generally upbeat outlooks. During the first quarter 2017 earnings reporting season, 75% of S&P 500 Index companies exceeded consensus earnings estimates, and 54% posted better-than-expected revenue.2
UK and European stocks rebounded from the sell-off following the Brexit vote in mid-2016, with both markets posting double-digit gains over the reporting period. Early in the period, markets were rattled by UK Prime Minister Theresa May’s announcement of a hard deadline to begin formal negotiations for the country to exit the European Union, which sent the British pound tumbling to a 31-year low. Article 503 was triggered near the end of the reporting period. The regional markets subsequently rallied late in the period following the results of the French presidential election.
Asian equity markets also saw strong performance over the reporting period. Investor risk appetite initially was weak due to uncertainty over Trump’s surprising U.S. presidential election win, a hard Brexit for the UK, and the U.S. Federal Reserve’s (Fed) hint at three more interest-rate hikes after raising its benchmark rate in December 2016. These issues deepened investors’ concerns over increased volatility across Asian markets. China initially faced headwinds amid worries regarding the weakening yuan, accelerating capital outflows and tightening regulations. However, the market rallied soon thereafter, buttressed by positive economic data reports. At the start of 2017, a strengthening global economy and expectations of a gradual Fed tightening of monetary policy buoyed investor sentiment. Asian markets rebounded swiftly from a sell-off late in the reporting period caused by doubts over Trump’s proposed tax reforms, bolstered by upbeat earnings momentum and exports across the region. The Fed maintained a cautious outlook after it again tightened monetary policy, as widely expected, in March 2017. The Bank of Japan (BoJ) left its benchmark interest rate unchanged at -0.1% during the reporting period, and maintained its 80 trillion yen (approximately US$716 billion) asset-purchase program.
Performance in emerging stock markets was mixed during the six-month reporting period. India was a strong performer, as investors grew more confident that the ruling government’s recent election wins in four out of five states, particularly the country’s largest state, Uttar Pradesh, would provide Prime Minister Narendra Modi the necessary mandate to implement his reform agenda. In the Europe, Middle East and Africa (EMEA) region, Russia was buoyed by stabilizing energy prices and a return to economic growth for the first time in two years. There was weakness in the Latin American stock market over the period. Brazilian equities seesawed on anxiety over whether President Michel Temer’s proposed pension reforms would garner Parliamentary approval, while the central bank continued to cut interest rates. Conversely, Mexico’s central bank raised rates for a fifth consecutive time in March 2017, in an effort to combat inflation.
Global fixed-income markets were volatile over the reporting period. Investment-grade bonds, as represented by the Bloomberg Barclays Global Aggregate Bond Index, declined 1.6% for the period. However, high-yield issues significantly outperformed their investment-grade counterparts, with the Bank of America Merrill Lynch Global High Yield Constrained Index gaining 5.5% for the period. Events in the U.S. dominated the news, most notably Trump’s presidential election victory. This halted the global bond market rally in late 2016, as investors considered the possibility that Trump would increase fiscal spending and lift the inflation outlook. Investors subsequently rotated back into bonds amid growing uncertainty over U.S. trade policies and their potential impact on the global recovery. Towards the end of the reporting period, Asian government bonds rallied further as political tensions escalated following U.S. military strikes in Syria and several botched missile tests by North Korea.
Outlook
We remain generally bullish on the global economy. The politically charged environment in the U.S. notwithstanding, we believe that global gross domestic product growth will accelerate over the remainder of 2017 and remain stable in 2018. In our opinion, the most powerful dynamic is the self-fueling, synchronized and thoroughly virtuous global economic recovery. After dragging each other down after 2008, global economies now appear to be pulling each other up as stronger growth, higher inflation, and – most importantly, in our view – improving confidence whet investors’ risk appetite. We are more optimistic about the outlook for global trade, as data for the start of 2017 indicated a pickup in activity in several regions. Nevertheless, in our view, this trade recovery partially reflects temporary factors such as economic stimulus measures in China, while policy uncertainty in the U.S. is elevated. Consequently, we do not think that the outlook is without risks. Although global inflation pressures recently have weakened, we still anticipate that the Fed will raise its benchmark interest rate twice more in 2017, and three times in 2018, and may begin tapering reinvestments of portfolio holdings around the beginning of next year. However, we think that the European Central Bank (ECB) and the BoJ are a long way from meaningful monetary policy tightening. We believe that the ECB may taper quantitative easing in 2018, while the BoJ most likely will maintain its 0% target for 10-year government bond yields.
Aberdeen Asset Management
| 1 | Indexes are unmanaged and have been provided for comparison purposes only. No fees or expenses are reflected. You cannot invest directly in an index. |
| 2 | Source: FactSet, “Earnings Insight,” May 2017. |
| 3 | Article 50 contains the procedures to be followed by a country seeking to leave the European Union voluntarily. |
| 2017 Semi-Annual Report | 1 |
Aberdeen Select International Equity Fund (Unaudited)
The Aberdeen Select International Equity Fund (Institutional Class shares net of fees) returned 16.78%1 for the six-month period ended April 30, 2017, versus 10.62% for its benchmark, the MSCI All Country (AC) World ex USA Index, during the same period. For broader comparison, the average return of the Fund’s peer category of International Large-Cap Growth Funds (comprising 41 funds), as measured by Lipper, Inc., was 10.22% for the period.
Global equities rose during the six-month period ended April 30, 2017. Initial uncertainty over the U.S. presidential election in November 2016 gave way to bullishness after Donald Trump’s surprising victory. Several major global equity market indices reached record highs and the U.S. dollar rallied on speculation over potential fiscal stimulus from the incoming Trump administration. Investors’ risk appetite for emerging markets was also renewed. However, the “Trump trade” tapered somewhat by the end of the reporting period amid concerns that political wrangling would hamstring U.S. policymakers, particularly after the failed bill to reform healthcare and uncertainty over a tax overhaul. Supported by firmer economic data, the U.S. Federal Reserve (Fed) raised its benchmark interest rate twice, in December 2016 and in March 2017. Elsewhere, investor sentiment was buoyed by the European Central Bank’s decision to extend its bond-buying program through 2017, albeit at a smaller magnitude after March. Early in the reporting period, markets were rattled by UK Prime Minister Theresa May’s announcement of a hard deadline to begin formal negotiations for the country to exit the European Union (EU), which sent the sterling tumbling to a 31-year low. Article 501 was triggered near the end of the period. Global markets rallied after independent French presidential election candidate Emannuel Macron won the first round of voting in April 2017, with far-right Marine Le Pen placing second. Macron subsequently defeated Le Pen in the final round of the election in May 2017.
Among the Fund’s individual holdings, Prudential was a key contributor to performance for the reporting period, as the UK-based insurer delivered healthy growth in its Asian business and is also a beneficiary of rising global interest rates. Shares of Samsung Electronics performed well despite the arrest of corporate heir-apparent Lee Jae-Yong, which we feel reflects investors’ confidence in the quality of its management. The company posted its best quarterly earnings in over three years for the fourth quarter of its 2016 fiscal year, and announced a share buyback totalling 2.3 trillion won (roughly US$2.0 billion). Additionally, industrial equipment maker Atlas Copco benefited from the recovery in commodity prices and a general improvement in market sentiment for the sector overall.
Conversely, the Fund’s position in Japan Tobacco was a notable detractor from performance, as the company was hampered by strong competition from Philip Morris International (which the Fund does not hold) with regard to “heat-not-burn” products in Japan. Daito Trust Construction’s shares fell on investors’ concerns about the company’s earnings release for the third quarter of its 2017 fiscal year, due to a trend of declining orders for rental apartments. Shares of soft-drink maker Fomento Economico Mexicano (FEMSA) sold off sharply along with the wider Mexican market, which was bogged down by the ”Trump effect” given its extensive trade linkages with its northern neighbor. However, investor sentiment has improved since the start of 2017.
During the reporting period, we initiated a position in Ultrapar, a well-managed and attractively-valued Brazilian chemicals and fuel distribution company, in our view. We also established a new position in India’s HDFC Bank, a conservatively-managed and well-financed lender that we believe has a solid position in a relatively underdeveloped banking market.
The Fund’s receipt of payment of Article 63 European Union (EU) Tax Reclaims related to prior years (2005-2008), the receipt of which was uncertain, was a significant contributor to Fund performance during the reporting period. The receipt of these extraordinary payments increased the Fund’s performance during the period in a manner that may not recur in the future. There can be no assurance that the Fund will receive additional Article 63 EU Tax Reclaim payments or maintain this level of performance in the future. In the tax years for which the Fund filed Article 63 EU Tax Reclaims, certain shareholders were able to reduce their federal income taxes based upon the amount of taxes that these Funds paid to foreign jurisdictions. The receipt by the Fund of the Article 63 EU Tax Reclaim payments will also result in tax liability to the relevant Fund to offset the tax benefits that shareholders received in the past. The precise amount of the tax is uncertain and subject to settlement negotiations with the U.S. Internal Revenue Service (IRS). An estimated tax amount was accrued during the period and detracted from the Fund’s performance. A final determination by the U.S. IRS that the actual tax payable exceeds the amount currently accrued may have a significantly negative impact on the Fund’s expenses, net asset value and performance.
Volatility in global markets remains alarmingly low with the Chicago Board Options Exchange (CBOE) Volatility Index (VIX)2 near record lows as of the end of the reporting period. While Emannuel Macron’s victory in the French presidential election has removed a degree of uncertainty, across the Atlantic, the waters remain muddied by the lack of clarity in U.S. President Trump’s policy initiatives. On the economic front, the latest data coming out of the U.S. and Europe have been positive, and Asian exports continue to show signs of improvement. We think that all of this suggests a more concerted revival in economic growth than was earlier hoped. Nonetheless, we feel that investors are still wary of record- high valuations in many parts of the world, with geopolitical risks and oil price uncertainty likely to persist in the near future. Nevertheless, we remain committed to our fundamentals-focused stock-picking approach, building and maintaining a portfolio of companies that we believe can reap rewards over the long term.
| 1 | Article 50 includes the procedures to be followed by a country seeking to leave the European Union voluntarily. |
| 2 | The CBOE Volatility Index is a measure of market expectations of near-term volatility conveyed by S&P 500 stock index option prices. |
| 2 | Semi-Annual Report 2017 |
Aberdeen Select International Equity Fund (Unaudited) (concluded)
Portfolio Management:
Aberdeen Global Equity Team
PAST PERFORMANCE DOES NOT GUARANTEE FUTURE RESULTS.
The performance quoted represents past performance, which does not guarantee future results. Class A shares have up to a 0.25% 12b-1 fee. The investment return and principal value of an investment will fluctuate so that an investor’s shares, when redeemed, may be worth more or less than their original cost. Current performance of the Fund may be lower or higher than the performance quoted. Performance data current to the most recent month-end may be obtained by calling 866-667-9231 or visiting www.aberdeen-asset.us.
Investing in mutual funds involves risk, including the possible loss of principal. There is no assurance that the investment objective of any fund will be achieved. Indexes are unmanaged and have been provided for comparison purposes only. No fees or expenses are reflected. You cannot invest directly in an index.
Lipper is a leading global provider of mutual fund information and analysis to fund companies, financial intermediaries and media organizations.
Risk Considerations
Foreign securities may be more volatile, harder to price and less liquid than U.S. securities. They are subject to different accounting and regulatory standards and currency exchange rate, political and economic risks. Fluctuation in currency exchange rates may impact a Fund’s returns more greatly to the extent a Fund does not hedge currency exposure or hedging techniques are unsuccessful. The foregoing risks are enhanced in emerging market countries.
Equity stocks of small and mid-cap companies carry greater risk and more volatility than equity stocks of larger, more established companies.
Stocks issued by large cap companies subject the Fund to the risk that those stocks may underperform stocks issued by companies with smaller capitalizations or the market as a whole.
Investing a significant portion of the Fund’s assets in securities of companies conducting business in a broadly related group of industries within an economic sector may make the Fund more vulnerable to unfavorable developments in that sector.
Please read the prospectus for more detailed information regarding these and other risks.
| 2017 Semi-Annual Report | 3 |
Aberdeen Select International Equity Fund (Unaudited)
Average Annual Total Return* (For periods ended April 30, 2017) | Six Month† | 1 Yr. | 5 Yr. | 10 Yr. | ||||||||||
Class A | 16.65% | 20.16% | 3.15% | (2.18% | ) | |||||||||
Institutional Class | 16.78% | 20.41% | 3.41% | (1.94% | ) | |||||||||
| † | Not Annualized |
| * | Performance shown for periods after December 16, 2016 reflect the Fund’s receipt of payment from some European jurisdictions related to prior years (2005-2008) in accordance with European Union law under Article 63 of the Treaty on the Functioning of the European Union (the “Article 63 EU Tax Reclaims”), the receipt of which was uncertain. The receipt of these extraordinary payments increased the Fund’s performance for all periods that include December 2016 and February 2017 in a manner that may not recur in the future, and the Fund’s performance was significantly higher than it would have been absent receipt of the Article 63 EU Tax Reclaims. There can be no assurance that the Fund will receive additional Article 63 EU Tax Reclaim payments or maintain this level of performance in the future. Please see the Fund’s prospectus dated February 28, 2017, as amended May 17, 2017, for further information. |
| 4 | Semi-Annual Report 2017 |
Aberdeen Select International Equity Fund (Unaudited)
Performance of a $10,000 Investment (as of April 30, 2017)
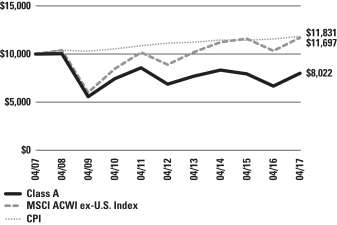
Comparative performance of $10,000 invested in Class A shares of the Aberdeen Select International Equity Fund, Morgan Stanley Capital International All Country World ex-USA Index (MSCI ACWI ex-USA Index), and the Consumer Price Index (CPI) over a 10-year period ended April 30, 2017. Unlike the Fund’s returns, the returns for these unmanaged indexes do not reflect any fees or expenses. Investors cannot invest directly in market indexes.
The MSCI ACWI ex-USA Index captures large and mid cap representation across 22 of 23 Developed Markets (DM) countries (excluding the United States (U.S.) and 23 Emerging Markets (EM) countries). With 1,852 constituents, the index covers approximately 85% of the global equity opportunity set outside the U.S.
The CPI is a measure of the average change over time in the prices paid by urban consumers for a market basket of consumer goods and services.
Investment return and principal value will fluctuate, and when redeemed, shares may be worth more or less than original cost. Past performance is no guarantee of future results. The Average Annual Total Return table and performance graph do not reflect the deduction of taxes that a shareholder would pay on Fund distributions or the redemption of Fund shares. Investing in mutual funds involves market risk, including loss of principal. Performance returns assume the reinvestment of all distributions. Performance returns reflect fee waivers and reimbursements in effect without which returns would have been lower.
Portfolio Summary (as a percentage of net assets)
April 30, 2017 (Unaudited)
| Asset Allocation | ||||
Common Stocks | 89.2% | |||
Preferred Stocks | 8.0% | |||
Short-Term Investment | 4.3% | |||
Closed-End Funds | –% | 1 | ||
Government Bonds | –% | 1 | ||
Liabilities in Excess of Other Assets | (1.5% | ) | ||
| 100.0% | ||||
| 1 | Represents a security that is fair valued at zero pursuant to procedures approved by the Fund’s Board of Trustees. See Note 2(a) of the accompanying Notes to Financial Statements. |
The following table summarizes the composition of the Fund’s portfolio, in Standard & Poor’s Global Industry Classification Standard (GICS) sectors, expressed as a percentage of net assets. The GICS structure consists of 11 sectors, 24 industry groups, 68 industries and 157 sub-industries. As of April 30, 2017, the Fund did not have more than 25% of its assets invested in any industry group.
| Top Sectors | ||||
Consumer Staples | 14.9% | |||
Health Care | 13.7% | |||
Financials | 12.6% | |||
Industrials | 11.7% | |||
Information Technology | 10.3% | |||
Telecommunication Services | 9.0% | |||
Materials | 6.8% | |||
Consumer Discretionary | 6.5% | |||
Energy | 6.2% | |||
Real Estate | 5.5% | |||
Other | 2.8% | |||
| 100.0% | ||||
| Top Holdings* | ||||
Roche Holding AG | 4.0% | |||
Novartis AG | 3.9% | |||
Taiwan Semiconductor Manufacturing Co. Ltd. | 3.5% | |||
Japan Tobacco, Inc. | 3.3% | |||
Samsung Electronics Co. Ltd., Preferred Shares | 3.0% | |||
AIA Group Ltd. | 3.0% | |||
Shin-Etsu Chemical Co. Ltd. | 2.9% | |||
Whitbread PLC | 2.6% | |||
Henkel AG & Co. KGaA, Preferred Shares | 2.6% | |||
Fomento Economico Mexicano SAB de CV, ADR | 2.5% | |||
Other | 68.7% | |||
| 100.0% | ||||
| * | For the purpose of listing top holdings, Short-Term Investments are included as part of Other. |
| Top Countries | ||||
United Kingdom | 21.7% | |||
Japan | 12.6% | |||
Switzerland | 10.4% | |||
Germany | 8.8% | |||
Hong Kong | 7.3% | |||
United States | 6.7% | |||
Singapore | 4.6% | |||
Taiwan | 3.5% | |||
Republic of South Korea | 3.4% | |||
Brazil | 3.4% | |||
Other | 17.6% | |||
| 100.0% | ||||
| 2017 Semi-Annual Report | 5 |
Statement of Investments
April 30, 2017 (Unaudited)
Aberdeen Select International Equity Fund
| Shares or Principal Amount | Value | |||||||
COMMON STOCKS (89.2%) | ||||||||
AUSTRALIA (1.2%) | ||||||||
Health Care (1.2%) | ||||||||
CSL Ltd. (a) | 26,700 | $ | 2,647,573 | |||||
BRAZIL (1.0%) | ||||||||
Energy (1.0%) | ||||||||
Ultrapar Participacoes SA, ADR | 103,300 | 2,291,194 | ||||||
CANADA (2.9%) | ||||||||
Materials (1.4%) | ||||||||
Potash Corp. of Saskatchewan, Inc. | 188,800 | 3,183,895 | ||||||
Telecommunication Services (1.5%) | ||||||||
TELUS Corp. | 101,900 | 3,390,570 | ||||||
| 6,574,465 | ||||||||
FRANCE (1.5%) | ||||||||
Consumer Staples (1.5%) | ||||||||
L’Oreal SA (a) | 17,300 | 3,445,288 | ||||||
GERMANY (6.2%) | ||||||||
Health Care (4.6%) | ||||||||
Bayer AG (a) | 38,100 | 4,714,229 | ||||||
Fresenius Medical Care AG & Co. KGaA (a) | 64,900 | 5,761,124 | ||||||
| 10,475,353 | ||||||||
Materials (1.6%) | ||||||||
Linde AG (a) | 19,900 | 3,575,800 | ||||||
| 14,051,153 | ||||||||
HONG KONG (7.3%) | ||||||||
Financials (3.0%) | ||||||||
AIA Group Ltd. (a) | 1,000,600 | 6,925,588 | ||||||
Industrials (3.4%) | ||||||||
Jardine Matheson Holdings Ltd. (a) | 84,600 | 5,444,252 | ||||||
MTR Corp. Ltd. (a) | 382,200 | 2,198,862 | ||||||
| 7,643,114 | ||||||||
Real Estate (0.9%) | ||||||||
Swire Pacific Ltd., Class A (a) | 201,000 | 1,938,211 | ||||||
| 16,506,913 | ||||||||
INDIA (1.0%) | ||||||||
Financials (1.0%) | ||||||||
HDFC Bank Ltd., ADR | 28,300 | 2,252,963 | ||||||
ISRAEL (2.4%) | ||||||||
Information Technology (2.4%) | ||||||||
Check Point Software Technologies Ltd. (b) | 53,500 | 5,564,535 | ||||||
ITALY (1.4%) | ||||||||
Energy (1.4%) | ||||||||
Tenaris SA, ADR | 102,900 | 3,213,567 | ||||||
JAPAN (12.6%) | ||||||||
Consumer Discretionary (1.5%) | ||||||||
Shimano, Inc. (a) | 21,500 | 3,290,444 | ||||||
Consumer Staples (3.3%) | ||||||||
Japan Tobacco, Inc. (a) | 227,400 | $ | 7,566,904 | |||||
Industrials (1.5%) | ||||||||
FANUC Corp. (a) | 16,700 | 3,400,054 | ||||||
Information Technology (1.4%) | ||||||||
Keyence Corp. (a) | 8,100 | 3,256,314 | ||||||
Materials (2.9%) | ||||||||
Shin-Etsu Chemical Co. Ltd. (a) | 76,100 | 6,614,431 | ||||||
Real Estate (2.0%) | ||||||||
Daito Trust Construction Co. Ltd. (a) | 31,500 | 4,635,321 | ||||||
| 28,763,468 | ||||||||
LATVIA (0.0%) | ||||||||
Financials (0.0%) | ||||||||
AS Parex Banka (a)(b)(c) | 1,424,182 | – | ||||||
MEXICO (2.5%) | ||||||||
Consumer Staples (2.5%) | ||||||||
Fomento Economico Mexicano SAB de CV, ADR | 64,200 | 5,780,568 | ||||||
PHILIPPINES (0.9%) | ||||||||
Real Estate (0.9%) | ||||||||
Ayala Land, Inc. (a) | 2,972,600 | 2,100,657 | ||||||
REPUBLIC OF SOUTH KOREA (0.4%) | ||||||||
Consumer Staples (0.4%) | ||||||||
Amorepacific Group (a) | 8,507 | 982,834 | ||||||
SINGAPORE (4.6%) | ||||||||
Financials (0.9%) | ||||||||
Oversea-Chinese Banking Corp. Ltd. (a) | 308,729 | 2,162,244 | ||||||
Real Estate (1.7%) | ||||||||
City Developments Ltd. (a) | 487,900 | 3,765,001 | ||||||
Telecommunication Services (2.0%) | ||||||||
Singapore Telecommunications Ltd. (a) | 1,686,100 | 4,514,161 | ||||||
| 10,441,406 | ||||||||
SOUTH AFRICA (1.4%) | ||||||||
Telecommunication Services (1.4%) | ||||||||
MTN Group Ltd. (a) | 340,700 | 3,222,109 | ||||||
SWEDEN (2.1%) | ||||||||
Industrials (2.1%) | ||||||||
Atlas Copco AB, A Shares (a) | 127,000 | 4,744,090 | ||||||
SWITZERLAND (10.4%) | ||||||||
Consumer Staples (2.5%) | ||||||||
Nestle SA (a) | 74,300 | 5,722,620 | ||||||
Health Care (7.9%) | ||||||||
Novartis AG (a) | 115,000 | 8,853,283 | ||||||
Roche Holding AG (a) | 34,500 | 9,027,420 | ||||||
| 17,880,703 | ||||||||
| 23,603,323 | ||||||||
See accompanying Notes to Financial Statements.
| 6 | Semi-Annual Report 2017 |
Statement of Investments (concluded)
April 30, 2017 (Unaudited)
Aberdeen Select International Equity Fund
| Shares or Principal Amount | Value | |||||||
TAIWAN (3.5%) | ||||||||
Information Technology (3.5%) | ||||||||
Taiwan Semiconductor Manufacturing Co. Ltd. (a) | 1,232,000 | $ | 7,936,414 | |||||
THAILAND (1.8%) | ||||||||
Financials (1.8%) | ||||||||
Kasikornbank PCL (a) | 767,400 | 4,100,327 | ||||||
UNITED KINGDOM (21.7%) | ||||||||
Consumer Discretionary (2.6%) | ||||||||
Whitbread PLC (a) | 114,600 | 5,987,514 | ||||||
Consumer Staples (2.1%) | ||||||||
British American Tobacco PLC (a) | 68,800 | 4,648,354 | ||||||
Energy (3.8%) | ||||||||
John Wood Group PLC (a) | 345,500 | 3,396,290 | ||||||
Royal Dutch Shell PLC, B Shares (a) | 197,000 | 5,241,571 | ||||||
| 8,637,861 | ||||||||
Financials (3.5%) | ||||||||
Prudential PLC (a) | 214,400 | 4,758,358 | ||||||
Standard Chartered PLC (a)(b) | 349,000 | 3,261,543 | ||||||
| 8,019,901 | ||||||||
Industrials (4.7%) | ||||||||
Experian PLC (a) | 216,400 | 4,655,359 | ||||||
Rolls-Royce Holdings PLC (b) | 24,963,600 | 32,333 | ||||||
Rolls-Royce Holdings PLC (a)(b) | 351,600 | 3,695,846 | ||||||
Weir Group PLC (The) (a) | 91,800 | 2,365,251 | ||||||
| 10,748,789 | ||||||||
Materials (0.9%) | ||||||||
BHP Billiton PLC (a) | 132,300 | 2,016,939 | ||||||
Telecommunication Services (4.1%) | ||||||||
Inmarsat PLC (a) | 354,100 | 3,744,921 | ||||||
Vodafone Group PLC (a) | 2,154,100 | 5,548,186 | ||||||
| 9,293,107 | ||||||||
| 49,352,465 | ||||||||
UNITED STATES (2.4%) | ||||||||
Consumer Discretionary (2.4%) | ||||||||
Samsonite International SA (a) | 1,401,800 | 5,400,209 | ||||||
VENEZUELA (0.0%) | ||||||||
Financials (0.0%) | ||||||||
Banco Venezolano de Credito SA (a)(b)(c) | 156 | – | ||||||
Industrials (0.0%) | ||||||||
Cemex Venezuela SACA-I (a)(b)(c) | 15,843,815 | – | ||||||
| – | ||||||||
Total Common Stocks | 202,975,521 | |||||||
CLOSED-END FUNDS (0.0%) | ||||||||
RUSSIA (0.0%) | ||||||||
Financials (0.0%) | ||||||||
Renaissance Pre-IPO Fund (a)(b)(c) | 92,634 | $ | – | |||||
Total Closed-End Funds | – | |||||||
GOVERNMENT BONDS (0.0%) | ||||||||
VENEZUELA (0.0%) | ||||||||
Bonos de la Deuda Publica Nacional (VEF), 16.00%, 08/23/2018 (a)(c) | 49,500,000 | – | ||||||
Bonos de la Deuda Publica Nacional (VEF), 18.00%, 04/12/2018 (a)(c) | 20,000,000 | – | ||||||
| – | ||||||||
Total Government Bonds | – | |||||||
PREFERRED STOCKS (8.0%) | ||||||||
BRAZIL (2.4%) | ||||||||
Financials (2.4%) | ||||||||
Banco Bradesco SA, ADR, Preferred Shares | 523,100 | 5,518,705 | ||||||
GERMANY (2.6%) | ||||||||
Consumer Staples (2.6%) | ||||||||
Henkel AG & Co. KGaA, Preferred Shares (a) | 42,700 | 5,809,916 | ||||||
REPUBLIC OF SOUTH KOREA (3.0%) | ||||||||
Information Technology (3.0%) | ||||||||
Samsung Electronics Co. Ltd., Preferred Shares (a) | 4,500 | 6,929,658 | ||||||
Total Preferred Stocks | 18,258,279 | |||||||
SHORT-TERM INVESTMENT (4.3%) | ||||||||
UNITED STATES (4.3%) | ||||||||
State Street Institutional U.S. Government Money Market Fund (d) | 9,815,448 | 9,815,448 | ||||||
Total Short-Term Investment | 9,815,448 | |||||||
Total Investments | 231,049,248 | |||||||
Liabilities in Excess of Other Assets—(1.5)% | (3,304,302 | ) | ||||||
Net Assets—100.0% | $ | 227,744,946 | ||||||
| (a) | Fair Valued Security. Fair Values are determined pursuant to procedures approved by the Fund’s Board of Trustees. See Note 2(a) of the accompanying Notes to Financial Statements. |
| (b) | Non-income producing security. |
| (c) | The Fund’s adviser has deemed this security to be illiquid based upon procedures approved by the Board of Trustees. Illiquid securities held by the Fund represent 0.00% of net assets as of April 30, 2017. |
| (d) | Registered investment company advised by State Street Global Advisors. |
| (e) | See accompanying Notes to Financial Statements for tax unrealized appreciation/(depreciation) of securities. |
| ADR | American Depositary Receipt |
| VEF | Venezuelan Bolivar |
See accompanying Notes to Financial Statements.
| 2017 Semi-Annual Report | 7 |
Aberdeen Select International Equity Fund II (Unaudited)
The Aberdeen Select International Equity Fund II (Institutional Class shares net of fees) returned 14.14% for the six-month period ended April 30, 2017, versus 10.62% for its benchmark, the MSCI All Country (AC) World ex USA Index, during the same period. For broader comparison, the average return of the Fund’s peer category of International Large-Cap Growth Funds (comprising 41 funds), as measured by Lipper, Inc., was 10.22% for the period.
Global equities rose during the six-month period ended April 30, 2017. Initial uncertainty over the U.S. presidential election in November 2016 gave way to bullishness after Donald Trump’s surprising victory. Several major global equity market indices reached record highs and the U.S. dollar rallied on speculation over potential fiscal stimulus from the incoming Trump administration. Investors’ risk appetite for emerging markets was also renewed. However, the “Trump trade” tapered somewhat by the end of the reporting period amid concerns that political wrangling would hamstring U.S. policymakers, particularly after the failed bill to reform healthcare and uncertainty over a tax overhaul. Supported by firmer economic data, the U.S. Federal Reserve (Fed) raised its benchmark interest rate twice, in December 2016 and in March 2017. Elsewhere, investor sentiment was buoyed by the European Central Bank’s decision to extend its bond-buying program through 2017, albeit at a smaller magnitude after March. Early in the reporting period, markets were rattled by UK Prime Minister Theresa May’s announcement of a hard deadline to begin formal negotiations for the country to exit the European Union (EU), which sent the sterling tumbling to a 31-year low. Article 501 was triggered near the end of the period. Global markets rallied after independent French presidential election candidate Emannuel Macron won the first round of voting in April 2017, with far-right Marine Le Pen placing second. Macron subsequently defeated Le Pen in the final round of the election in May 2017.
Among the Fund’s individual holdings, Prudential was a key contributor to performance for the reporting period, as the UK-based insurer delivered healthy growth in its Asian business and is also a beneficiary of rising global interest rates. Shares of Samsung Electronics performed well despite the arrest of corporate heir-apparent Lee Jae-Yong, which we feel reflects investors’ confidence in the quality of its management. The company posted its best quarterly earnings in over three years for the fourth quarter of its 2016 fiscal year, and announced a share buyback totalling 2.3 trillion won (roughly US$2.0 billion). Additionally, industrial equipment maker Atlas Copco benefited from the recovery in commodity prices and a general improvement in market sentiment for the sector overall.
Conversely, the Fund’s position in Japan Tobacco was a notable detractor from performance, as the company was hampered by strong competition from Philip Morris International (which the Fund does not hold) with regard to “heat-not-burn” products in Japan. Daito Trust Construction’s shares fell on investors’ concerns about the company’s earnings release for the third quarter of its 2017 fiscal year, due to a trend of declining orders for rental apartments. Shares of soft-drink maker Fomento Economico Mexicano (FEMSA) sold off sharply along with the wider Mexican market, which was bogged down by the ”Trump effect” given its extensive trade linkages with its northern neighbor. However, investor sentiment has improved since the start of 2017.
During the reporting period, we initiated a position in Ultrapar, a well-managed and attractively-valued Brazilian chemicals and fuel distribution company, in our view. We also established a new position in India’s HDFC Bank, a conservatively-managed and well-financed lender that we believe has a solid position in a relatively underdeveloped banking market.
The Fund’s receipt of payment of Article 63 European Union (EU) Tax Reclaims related to prior years (2005-2008), the receipt of which was uncertain, was a significant contributor to Fund performance during the reporting period. The receipt of these extraordinary payments increased the Fund’s performance during the period in a manner that may not recur in the future. There can be no assurance that the Fund will receive additional Article 63 EU Tax Reclaim payments or maintain this level of performance in the future. In the tax years for which the Fund filed Article 63 EU Tax Reclaims, certain shareholders were able to reduce their federal income taxes based upon the amount of taxes that these Funds paid to foreign jurisdictions. The receipt by the Fund of the Article 63 EU Tax Reclaim payments will also result in tax liability to the relevant Fund to offset the tax benefits that shareholders received in the past. The precise amount of the tax is uncertain and subject to settlement negotiations with the U.S. Internal Revenue Service (IRS). An estimated tax amount was accrued during the period and detracted from the Fund’s performance. A final determination by the U.S. IRS that the actual tax payable exceeds the amount currently accrued may have a significantly negative impact on the Fund’s expenses, net asset value and performance.
Volatility in global markets remains alarmingly low with the Chicago Board Options Exchange (CBOE) Volatility Index (VIX)2 near record lows as of the end of the reporting period. While Emannuel Macron’s victory in the French presidential election has removed a degree of uncertainty, across the Atlantic, the waters remain muddied by the lack of clarity in U.S. President Trump’s policy initiatives. On the economic front, the latest data coming out of the U.S. and Europe have been positive, and Asian exports continue to show signs of improvement. We think that all of this suggests a more concerted revival in economic growth than was earlier hoped. Nonetheless, we feel that investors are still wary of record- high valuations in many parts of the world, with geopolitical risks and oil price uncertainty likely to persist in the near future. Nevertheless, we remain committed to our fundamentals-focused stock-picking approach, building and maintaining a portfolio of companies that we believe can reap rewards over the long term.
| 1 | Article 50 includes the procedures to be followed by a country seeking to leave the European Union voluntarily. |
| 2 | The CBOE Volatility Index is a measure of market expectations of near-term volatility conveyed by S&P 500 stock index option prices. |
| 8 | Semi-Annual Report 2017 |
Aberdeen Select International Equity Fund II (Unaudited) (concluded)
Portfolio Management:
Aberdeen Global Equity Team
PAST PERFORMANCE DOES NOT GUARANTEE FUTURE RESULTS.
The performance quoted represents past performance, which does not guarantee future results. Class A Shares have up to a 0.25% 12b-1 fee. The investment return and principal value of an investment will fluctuate so that an investor’s shares, when redeemed, may be worth more or less than their original cost. Current performance of the Fund may be lower or higher than the performance quoted. Performance data current to the most recent month-end may be obtained by calling 866-667-9231 or visiting www.aberdeen-asset.us.
Investing in mutual funds involves risk, including the possible loss of principal. There is no assurance that the investment objective of any fund will be achieved. Indexes are unmanaged and have been provided for comparison purposes only. No fees or expenses are reflected. You cannot invest directly in an index.
Lipper is a leading global provider of mutual fund information and analysis to fund companies, financial intermediaries and media organizations.
Risk Considerations
Foreign securities may be more volatile, harder to price and less liquid than U.S. securities. They are subject to different accounting and regulatory standards and currency exchange rate, political and economic risks. Fluctuation in currency exchange rates may impact a Fund’s returns more greatly to the extent a Fund does not hedge currency exposure or hedging techniques are unsuccessful. The foregoing risks are enhanced in emerging market countries.
Equity stocks of small- and mid-cap companies carry greater risk and more volatility than equity stocks of larger, more established companies.
Stocks issued by large cap companies subject the Fund to the risk that those stocks may underperform stocks issued by companies with smaller capitalizations or the market as a whole.
Investing a significant portion of the Fund’s assets in securities of companies conducting business in a broadly related group of industries within an economic sector may make the Fund more vulnerable to unfavorable developments in that sector.
Please read the prospectus for more detailed information regarding these and other risks.
| 2017 Semi-Annual Report | 9 |
Aberdeen Select International Equity Fund II (Unaudited)
Average Annual Total Return* (For periods ended April 30, 2017) | Six Month† | 1 Yr. | 5 Yr. | 10 Yr. | ||||||||||
Class A | 14.13% | 17.61% | 3.10% | (1.46% | ) | |||||||||
Institutional Class | 14.14% | 17.86% | 3.36% | (1.21% | ) | |||||||||
| † | Not Annualized |
| * | Performance shown for periods after February 1, 2017 reflect the Fund’s receipt of payment from some European jurisdictions related to prior years (2005-2009) in accordance with European Union law under Article 63 of the Treaty on the Functioning of the European Union (the “Article 63 EU Tax Reclaims”), the receipt of which was uncertain. The receipt of these extraordinary payments increased the Fund’s performance for all periods that include February 2017 in a manner that may not recur in the future, and the Fund’s performance was significantly higher than it would have been absent receipt of the Article 63 EU Tax Reclaims. There can be no assurance that the Fund will receive additional Article 63 EU Tax Reclaim payments or maintain this level of performance in the future. Please see the Fund’s prospectus dated February 28, 2017, as amended May 17, 2017, for further information. |
| 10 | Semi-Annual Report 2017 |
Aberdeen Select International Equity Fund II (Unaudited)
Performance of a $10,000 Investment (as of April 30, 2017)
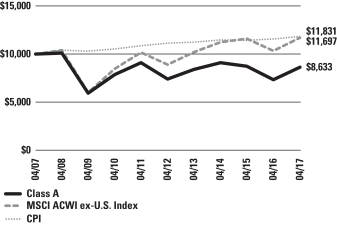
Comparative performance of $10,000 invested in Class A shares of the Aberdeen Select International Equity Fund II, Morgan Stanley Capital International All Country World ex-USA Index (MSCI ACWI ex-USA Index), and the Consumer Price Index (CPI) over a 10-year period ended April 30, 2017. Unlike the Fund’s returns, the returns for these unmanaged indexes do not reflect any fees or expenses. Investors cannot invest directly in market indexes.
The MSCI ACWI ex-USA Index captures large and mid cap representation across 22 of 23 Developed Markets (DM) countries (excluding the United States (U.S.) and 23 Emerging Markets (EM) countries). With 1,852 constituents, the index covers approximately 85% of the global equity opportunity set outside the U.S.
The CPI is a measure of the average change over time in the prices paid by urban consumers for a market basket of consumer goods and services.
Investment return and principal value will fluctuate, and when redeemed, shares may be worth more or less than original cost. Past performance is no guarantee of future results. The Average Annual Total Return table and performance graph do not reflect the deduction of taxes that a shareholder would pay on Fund distributions or the redemption of Fund shares. Investing in mutual funds involves market risk, including loss of principal. Performance returns assume the reinvestment of all distributions. Performance returns reflect fee waivers and reimbursements in effect without which returns would have been lower.
Portfolio Summary (as a percentage of net assets)
April 30, 2017 (Unaudited)
| Asset Allocation | ||||
Common Stocks | 90.2% | |||
Preferred Stocks | 7.7% | |||
Short-Term Investment | 2.7% | |||
Liabilities in Excess of Other Assets | (0.6% | ) | ||
| 100.0% | ||||
The following table summarizes the composition of the Fund’s portfolio, in Standard & Poor’s Global Industry Classification Standard (GICS) sectors, expressed as a percentage of net assets. The GICS structure consists of 11 sectors, 24 industry groups, 68 industries and 157 sub-industries. As of April 30, 2017, the Fund did not have more than 25% of its assets invested in any industry group.
| Top Sectors | ||||
Consumer Staples | 15.3% | |||
Health Care | 14.0% | |||
Financials | 12.7% | |||
Industrials | 12.3% | |||
Information Technology | 10.6% | |||
Telecommunication Services | 8.8% | |||
Materials | 6.7% | |||
Consumer Discretionary | 6.3% | |||
Energy | 5.6% | |||
Real Estate | 5.6% | |||
Other | 2.1% | |||
| 100.0% | ||||
| Top Holdings* | ||||
Roche Holding AG | 4.2% | |||
Novartis AG | 4.0% | |||
Taiwan Semiconductor Manufacturing Co. Ltd. | 3.6% | |||
Japan Tobacco, Inc. | 3.4% | |||
AIA Group Ltd. | 3.3% | |||
Samsung Electronics Co. Ltd., Preferred Shares | 3.1% | |||
Shin-Etsu Chemical Co. Ltd. | 3.0% | |||
Fomento Economico Mexicano SAB de CV, ADR | 2.7% | |||
Henkel AG & Co. KGaA, Preferred Shares | 2.6% | |||
Jardine Matheson Holdings Ltd. | 2.5% | |||
Other | 67.6% | |||
| 100.0% | ||||
| * | For the purpose of listing top holdings, Short-Term Investments are included as part of Other. |
| Top Countries | ||||
United Kingdom | 21.1% | |||
Japan | 13.0% | |||
Switzerland | 10.7% | |||
Germany | 8.7% | |||
Hong Kong | 7.8% | |||
United States | 5.0% | |||
Singapore | 4.7% | |||
Taiwan | 3.6% | |||
Republic of South Korea | 3.5% | |||
Brazil | 3.0% | |||
Other | 18.9% | |||
| 100.0% | ||||
| 2017 Semi-Annual Report | 11 |
Statement of Investments
April 30, 2017 (Unaudited)
Aberdeen Select International Equity Fund II
| Shares or Principal Amount | Value | |||||||
COMMON STOCKS (90.2%) | ||||||||
AUSTRALIA (1.2%) | ||||||||
Health Care (1.2%) | ||||||||
CSL Ltd. (a) | 12,000 | $ | 1,189,921 | |||||
BRAZIL (1.0%) | ||||||||
Energy (1.0%) | ||||||||
Ultrapar Participacoes SA, ADR | 44,100 | 978,138 | ||||||
CANADA (2.8%) | ||||||||
Materials (1.4%) | ||||||||
Potash Corp. of Saskatchewan, Inc. | 81,400 | 1,372,717 | ||||||
Telecommunication Services (1.4%) | ||||||||
TELUS Corp. | 40,700 | 1,354,232 | ||||||
| 2,726,949 | ||||||||
FRANCE (1.6%) | ||||||||
Consumer Staples (1.6%) | ||||||||
L’Oreal SA (a) | 7,500 | 1,493,622 | ||||||
GERMANY (6.1%) | ||||||||
Health Care (4.6%) | ||||||||
Bayer AG (a) | 16,100 | 1,992,103 | ||||||
Fresenius Medical Care AG & Co. KGaA (a) | 27,400 | 2,432,277 | ||||||
| 4,424,380 | ||||||||
Materials (1.5%) | ||||||||
Linde AG (a) | 8,000 | 1,437,507 | ||||||
| 5,861,887 | ||||||||
HONG KONG (7.8%) | ||||||||
Financials (3.3%) | ||||||||
AIA Group Ltd. (a) | 452,200 | 3,129,873 | ||||||
Industrials (3.6%) | ||||||||
Jardine Matheson Holdings Ltd. (a) | 38,200 | 2,458,279 | ||||||
MTR Corp. Ltd. (a) | 183,500 | 1,055,707 | ||||||
| 3,513,986 | ||||||||
Real Estate (0.9%) | ||||||||
Swire Pacific Ltd., Class A (a) | 91,000 | 877,499 | ||||||
| 7,521,358 | ||||||||
INDIA (1.0%) | ||||||||
Financials (1.0%) | ||||||||
HDFC Bank Ltd., ADR | 12,300 | 979,203 | ||||||
ISRAEL (2.4%) | ||||||||
Information Technology (2.4%) | ||||||||
Check Point Software Technologies Ltd. (b) | 22,500 | 2,340,225 | ||||||
ITALY (1.2%) | ||||||||
Energy (1.2%) | ||||||||
Tenaris SA, ADR | 38,200 | 1,192,986 | ||||||
JAPAN (13.0%) | ||||||||
Consumer Discretionary (1.5%) | ||||||||
Shimano, Inc. (a) | 9,500 | 1,453,917 | ||||||
Consumer Staples (3.4%) | ||||||||
Japan Tobacco, Inc. (a) | 98,900 | $ | 3,290,971 | |||||
Industrials (1.6%) | ||||||||
FANUC Corp. (a) | 7,600 | 1,547,330 | ||||||
Information Technology (1.5%) | ||||||||
Keyence Corp. (a) | 3,600 | 1,447,251 | ||||||
Materials (3.0%) | ||||||||
Shin-Etsu Chemical Co. Ltd. (a) | 33,100 | 2,876,973 | ||||||
Real Estate (2.0%) | ||||||||
Daito Trust Construction Co. Ltd. (a) | 13,400 | 1,971,851 | ||||||
| 12,588,293 | ||||||||
MEXICO (2.7%) | ||||||||
Consumer Staples (2.7%) | ||||||||
Fomento Economico Mexicano SAB de CV, ADR | 29,400 | 2,647,176 | ||||||
PHILIPPINES (1.0%) | ||||||||
Real Estate (1.0%) | ||||||||
Ayala Land, Inc. (a) | 1,342,300 | 948,567 | ||||||
REPUBLIC OF SOUTH KOREA (0.4%) | ||||||||
Consumer Staples (0.4%) | ||||||||
Amorepacific Group (a) | 3,562 | 411,526 | ||||||
SINGAPORE (4.7%) | ||||||||
Financials (1.0%) | ||||||||
Oversea-Chinese Banking Corp. Ltd. (a) | 138,362 | 969,045 | ||||||
Real Estate (1.7%) | ||||||||
City Developments Ltd. (a) | 220,300 | 1,700,000 | ||||||
Telecommunication Services (2.0%) | ||||||||
Singapore Telecommunications Ltd. (a) | 710,400 | 1,901,939 | ||||||
| 4,570,984 | ||||||||
SOUTH AFRICA (1.4%) | ||||||||
Telecommunication Services (1.4%) | ||||||||
MTN Group Ltd. (a) | 144,500 | 1,366,583 | ||||||
SWEDEN (2.3%) | ||||||||
Industrials (2.3%) | ||||||||
Atlas Copco AB, A Shares (a) | 58,600 | 2,189,005 | ||||||
SWITZERLAND (10.7%) | ||||||||
Consumer Staples (2.5%) | ||||||||
Nestle SA (a) | 31,300 | 2,410,741 | ||||||
Health Care (8.2%) | ||||||||
Novartis AG (a) | 50,200 | 3,864,650 | ||||||
Roche Holding AG (a) | 15,600 | 4,081,963 | ||||||
| 7,946,613 | ||||||||
| 10,357,354 | ||||||||
See accompanying Notes to Financial Statements.
| 12 | Semi-Annual Report 2017 |
Statement of Investments (concluded)
April 30, 2017 (Unaudited)
Aberdeen Select International Equity Fund II
| Shares or Principal Amount | Value | |||||||
TAIWAN (3.6%) | ||||||||
Information Technology (3.6%) | ||||||||
Taiwan Semiconductor Manufacturing Co. Ltd. (a) | 543,000 | $ | 3,497,949 | |||||
THAILAND (1.9%) | ||||||||
Financials (1.9%) | ||||||||
Kasikornbank PCL (a) | 346,500 | 1,851,398 | ||||||
UNITED KINGDOM (21.1%) | ||||||||
Consumer Discretionary (2.5%) | ||||||||
Whitbread PLC (a) | 45,411 | 2,372,592 | ||||||
Consumer Staples (2.1%) | ||||||||
British American Tobacco PLC (a) | 30,100 | 2,033,655 | ||||||
Energy (3.4%) | ||||||||
John Wood Group PLC (a) | 125,800 | 1,236,623 | ||||||
Royal Dutch Shell PLC, B Shares (a) | 78,700 | 2,093,968 | ||||||
| 3,330,591 | ||||||||
Financials (3.5%) | ||||||||
Prudential PLC (a) | 91,400 | 2,028,516 | ||||||
Standard Chartered PLC (a)(b) | 148,100 | 1,384,053 | ||||||
| 3,412,569 | ||||||||
Industrials (4.8%) | ||||||||
Experian PLC (a) | 93,200 | 2,004,988 | ||||||
Rolls-Royce Holdings PLC (a)(b) | 158,800 | 1,669,227 | ||||||
Rolls-Royce Holdings PLC (b) | 11,274,800 | 14,603 | ||||||
Weir Group PLC (The) (a) | 36,600 | 943,009 | ||||||
| 4,631,827 | ||||||||
Materials (0.8%) | ||||||||
BHP Billiton PLC (a) | 51,300 | 782,078 | ||||||
Telecommunication Services (4.0%) | ||||||||
Inmarsat PLC (a) | 146,900 | 1,553,598 | ||||||
Vodafone Group PLC (a) | 885,000 | 2,279,441 | ||||||
| 3,833,039 | ||||||||
| 20,396,351 | ||||||||
UNITED STATES (2.3%) | ||||||||
Consumer Discretionary (2.3%) | ||||||||
Samsonite International SA (a) | 574,600 | 2,213,554 | ||||||
Total Common Stocks | 87,323,029 | |||||||
PREFERRED STOCKS (7.7%) | ||||||||
BRAZIL (2.0%) | ||||||||
Financials (2.0%) | ||||||||
Banco Bradesco SA, ADR, Preferred Shares | 183,750 | 1,938,563 | ||||||
GERMANY (2.6%) | ||||||||
Consumer Staples (2.6%) | ||||||||
Henkel AG & Co. KGaA, Preferred Shares (a) | 18,600 | 2,530,783 | ||||||
REPUBLIC OF SOUTH KOREA (3.1%) | ||||||||
Information Technology (3.1%) | ||||||||
Samsung Electronics Co. Ltd., Preferred Shares (a) | 1,960 | $ | 3,018,251 | |||||
Total Preferred Stocks | 7,487,597 | |||||||
SHORT-TERM INVESTMENT (2.7%) | ||||||||
UNITED STATES (2.7%) | ||||||||
State Street Institutional U.S. Government Money Market Fund (c) | 2,583,165 | 2,583,165 | ||||||
Total Short-Term Investment | 2,583,165 | |||||||
Total Investments | 97,393,791 | |||||||
Liabilities in Excess of Other Assets—(0.6)% | (614,956 | ) | ||||||
Net Assets—100.0% | $ | 96,778,835 | ||||||
| (a) | Fair Valued Security. Fair Values are determined pursuant to procedures approved by the Fund’s Board of Trustees. See Note 2(a) of the accompanying Notes to Financial Statements. |
| (b) | Non-income producing security. |
| (c) | Registered investment company advised by State Street Global Advisors. |
| (d) | See accompanying Notes to Financial Statements for tax unrealized appreciation/(depreciation) of securities. |
| ADR | American Depositary Receipt |
See accompanying Notes to Financial Statements.
| 2017 Semi-Annual Report | 13 |
Aberdeen Total Return Bond Fund (Unaudited)
The Aberdeen Total Return Bond Fund (Institutional Class shares net of fees) returned -0.31% for the six-month period ended April 30, 2017, versus the -0.67% return of its benchmark, the Bloomberg Barclays U.S. Aggregate Bond Index, for the same period. For broader comparison, the average return of the Fund’s peer category of Core Bond Funds (consisting of 153 funds), as measured by Lipper, Inc., was -0.35% for the period.
The U.S. fixed-income market, as measured by the Bloomberg Barclays U.S. Aggregate Bond Index, finished in negative territory for the six-month period ended April 30, 2017. The reporting period was marked by numerous stretches of volatility in global financial markets in response to central bank monetary policy moves and political developments – most notably presidential elections in the U.S. and France. In the U.S., Treasury yields moved significantly higher over the period. The yields on the two-, five- and ten-year notes rose by corresponding margins of 42, 51 and 46 basis points (bps), ending the period at 1.26%, 1.82% and 2.28%, respectively. Consequently, the two- to ten-year yield curve widened just 3 bps over the period. The upswing in yields (and accompanying decline in bond prices) was attributable primarily to the U.S. Federal Reserve’s (Fed) gradual tightening of monetary policy and generally positive U.S. economic data reports.
Donald Trump’s victory in the U.S. presidential election in November 2016 surprised the global financial markets and created many uncertainties related to his policies and their implementation. In the run-up to the election, the markets tended to treat news that suggested a higher probability of a Trump victory as bond-bullish and risk-negative. However, this pattern quickly reversed after the election result, replaced by a bond-bearish, risk-positive trend. In our view, this suggested that investors were focused on the possibility of higher business confidence and fiscal policy easing boosting economic growth, while they viewed protectionism largely as inflationary. A reflation theme dominated, resulting in increases in U.S. yields, the U.S. dollar, global developed-market equities, commodities and a tightening of U.S. credit spreads.
In addition to investors’ persistent belief that the new Trump administration would aggressively pursue tax reform, there were several developments that provided a strong anchor for global fixed-income markets over the reporting period. First, the global synchronized economic recovery was supportive despite the mixed economic data in the U.S. According to the U.S. Department of Commerce, gross domestic product rose 1.2% for the first quarter of 2017, down from the 2.1% rate posted in the fourth quarter of 2016, as declines in private inventory investment and consumer spending offset increases in exports and nonresidential fixed investment. The U.S. Department of Labor reported that the U.S. economy added an average of 149,000 jobs per month over the six-month reporting period, down from the 163,000 average monthly increase for the same time frame a year earlier. Global trade was very strong over the reporting period, with growth in China, Europe and Japan all experiencing activity that surprised to the upside.
Additionally, the Fed raised its benchmark interest rate in two increments of 25 bps in December 2016 and March 2017, to a range of 0.75% to 1.00%. However, the central bank progressed along the normalization process without tightening financial conditions by skillfully managing market expectations. The Federal Open Market Committee (FOMC) noted the continued improvement in the economy and the labor market. Nonetheless, the FOMC commented that inflation recently has moved closer to its 2% target rate, but “longer-term inflation expectations are little changed, on balance.” All these statements appeared to reinforce the consensus market opinion that the Fed will take a path of gradual tightening of monetary policy.
On the international front, anti-European Union (EU) politicians did not make many inroads in Austria, the Netherlands or France during the reporting period. Centrist candidate Emmanuel Macron was the top vote-getter in the first round of the hotly contested French presidential election in April 2017. The election had been considered a referendum on the populist political movement that began with the UK’s approval of Brexit in June 2016, and continued with Trump’s victory in the U.S. five months later. Economic growth and improved investor sentiment not seen since the European sovereign debt crisis began in late 2009 were notable positive factors in the global fixed-income markets’ performance over the reporting period. Many emerging-market economies benefited from the uptrend in global markets over the period; even Brazil and Russia experienced a bottoming of growth and financial constraints. Consequently, over the first four months of 2017, European interest rates and currencies rose while emerging markets recorded one of their strongest performances since 2013 after having experienced some significant stress immediately following the U.S. presidential election.
Fund performance relative to its benchmark, the Bloomberg Barclays U.S. Aggregate Bond Index, for the reporting period benefited from strong results from most of its alpha1 sources in the Fund’s Core U.S. market segment.2 The most significant contributor to performance within the segment was strong results from security selection in nearly all sectors, particularly in investment-grade corporate bonds. Fund performance also was bolstered by positive security selection in U.S. agency mortgage-backed securities (MBS), commercial mortgage-backed securities (CMBS), asset-backed securities (ABS) and U.S. Treasuries. The Fund’s sector allocations also produced meaningful alpha for the reporting period. The underweight to U.S. Treasury securities and MBS enhanced Fund performance, as these sectors were the weakest performers within the Fund’s benchmark index over the period. Additionally, Fund performance benefited from the exposure to collateralized mortgage obligations (CMOs), which are not represented in the benchmark index, as these securities outperformed Treasuries as well as agency MBS over the reporting period. Conversely, the Fund’s large overweight position in ABS and a one-time accounting adjustment3 slightly detracted from performance.
Investments in markets outside the U.S. weighed on Fund performance for the reporting period, with losses stemming mostly from foreign currencies as the U.S. dollar strengthened. The Fund’s positions in Mexico were the primary detractors from performance, as the currency took the brunt of damage from fear of U.S.
| 14 | Semi-Annual Report 2017 |
Aberdeen Total Return Bond Fund (Unaudited) (continued)
protectionist trade policies under the Trump administration. Positions in Indonesian bonds and currency also experienced difficulties in the emerging market-related sell-off despite the Indonesian market’s strong fundamentals. The Fund’s holdings in Australian bonds lagged those in the U.S. when strong demand from China weighed on our currency-hedged interest-rate position. The Fund’s positions in its Satellite segment produced a positive absolute return for the reporting period. The holdings in currency-hedged Canadian and New Zealand government bonds collectively outperformed the return of the Bloomberg Barclays U.S. Aggregate Bond Index over the reporting period as their spreads compressed relative to comparable-duration4 U.S. Treasuries.
We employed derivatives over the reporting period, including U.S. Treasury futures, in an effort to manage the Fund’s overall yield-curve and interest-rate exposure, as well as foreign exchange forwards5 in an effort to gain exposure to foreign markets and to hedge risks from sovereign bond holdings. The performance of the Fund’s currency positions largely offset each other over the period, while our use of futures bolstered the Fund’s performance in global interest-rate allocation and yield-curve positioning. The derivatives positions did not have a significant impact on Fund performance for the reporting period.
We entered the reporting period with a cautious stance in anticipation of political risks. However, the Fund performed relatively well even when risk assets performed strongly in the immediate aftermath of Trump’s U.S. presidential election victory, attributable to the holdings in securities that we believe have attractive risk/reward profiles while hedging the macroeconomic risk. For example, the Fund’s holdings in high-beta6 corporate issues in the energy sector performed very well. The reason for us to invest with conviction was that Fund performance was counterbalanced by the exposure to Canadian government bonds, which tend to appreciate when crude oil prices decline. We also reduced the Fund’s duration in international markets and increased duration in the U.S. when U.S. rates rose sharply toward the end of the reporting period. We subsequently covered the Fund’s short duration position in the U.S when the 10-year U.S. Treasury yield rose to 2.6% in mid-March 2017.
With U.S. Treasury yields and the excess spreads provided by risk assets remaining relatively low, we believe that it is especially important to employ active management of the Fund’s global duration and asset allocation. At the end of the reporting period on April 30, 2017, the Fund was positioned with a short duration relative to that of its benchmark, the Bloomberg Barclays U.S. Aggregate Bond Index, in the U.S., while we have sought to cushion some risk by shifting assets to foreign currency bonds, particularly in commodity-exporting countries. Regarding sectors, we believe that securitized products continue to offer diverse opportunities, most notably non-U.S. agency MBS. In our view, high-quality ABS present a favorable risk/reward profile, and the key to the CMBS market is being selective. Corporate credit fundamentals remain sound, in our opinion, albeit with uncertainties relating to “Trumponomics.” We think that rising interest rates and tight credit spreads could drive a continuation in the increase in mergers-and-acquisitions activity that occurred in the first quarter of 2017. Finally, we believe that emerging markets as an asset class remain more resilient than they were during the “taper tantrum”8 in the U.S. in 2013. Current account and budget deficits have improved, real interest rates9 are higher, and central banks have more room to maneuver with inflation contained. However, we believe that higher leverage and dependence on cheap global capital could possibly create rapid adverse reactions to changes in investor sentiment. Consequently, we retain our selective and opportunistic investment approach.
Improving global trade is boosting economic growth, but we think that there are still reasons for caution. The U.S. economy had a weak first quarter of 2017, but most likely will pick up over the rest of the year, in our opinion. We expect the Trump administration’s fiscal stimulus package to be delayed, shifting some growth momentum toward 2018. We believe that a tight U.S. labor market, sound economic growth and supportive financial conditions may lead the Fed to continue normalizing monetary policy. In our judgment, the Fed will tighten monetary policy in two more increments of 25 bps over the remainder of 2017 by modestly increasing its benchmark interest rate and reducing its balance sheet. We feel that the European growth outlook is generally improving, but policies by European Central Bank (ECB) and Bank of England will remain supportive. Asia and the emerging markets should record positive returns, in our view, but the risks from protectionist U.S. policy have not receded. We think that stability will remain the Chinese government leaders’ top priority leading up to 19th Communist Party Congress in late 2017. While emerging markets may face pressure from rising U.S. Treasury yields, we think that the fortune of local
| 1 | Alpha is a measure of performance that takes the volatility of a mutual fund and compares its risk-adjusted performance to a benchmark index. |
| 2 | The Fund’s investment universe includes six global fixed-income market segments: Core (U.S. investment-grade fixed income); Major (Eurozone, Japan and the UK, among others); Satellites (including, but not limited to Canada, Hong Kong and Switzerland); Convergence (Czech Republic, Hungary and Poland, among others); Commodity (including, but not limited to, Australia, Chile and Russia); and Low Correlation (Brazil, China and Mexico, among others). |
| 3 | There was a $0.02 per share reduction in the daily net asset value from February 17 to February 21, 2017. In addition to reflecting normal market movements and Fund performance, this reduction reflected an accounting adjustment related to a change in the Fund’s valuation procedures, which now align with the valuation procedures across Aberdeen’s fund range. |
| 4 | Duration is an estimate of bond price sensitivity to changes in interest rates. The higher the duration, the greater the change (i.e., higher risk) in relation to interest-rate movements. |
| 5 | A foreign exchange forward is a binding contract in the foreign exchange market that locks in the exchange rate for the purchase or sale of a currency on a future date. |
| 6 | Beta is a measure of the volatility of a portfolio in comparison to a benchmark index. |
| 7 | “Taper tantrum” refers to the sharp rise in U.S. Treasury yields and concurrent decline in bond prices following then-U.S. Federal Reserve Chair Ben Bernanke’s suggestion that the central bank might begin to taper easing of monetary policy. |
| 8 | The real interest rate is the net interest rate after adjusting for the effects of inflation. |
| 2017 Semi-Annual Report | 15 |
Aberdeen Total Return Bond Fund (Unaudited) (concluded)
government bonds and currencies, especially those of commodity exporters, will depend on global growth and capital-flow momentum. In our view, the combined impact most likely will be a gradual rise in interest rates and a generally supportive risk environment.
However, we believe that there are both a downside and upside to this central case. We think that the ultimate outcome is dependent upon the resolution of the following issues. First, how will the growth gap between robust expectation and lackluster economic data reports be closed? Second, how will President Trump and the Republican-controlled Congress choose their priorities and implement their policies regarding tax, fiscal stimulus and regulatory reform given the ongoing investigation of Trump’s associates? Next, after defeating far-right candidate Marine Le Pen in the French presidential election in early May 2017, can Emmanuel Macron successfully implement his economic reform agenda? If so, we believe that Eurozone economic growth could be stronger than our already above-consensus forecast. However, will populist politics emerge in Italy, and where will the next geopolitical flashpoints emerge? Finally, how will global central banks proceed to reduce monetary accommodation? We feel that there are new complexities in addition to the consideration of the Fed’s monetary policy, such as fiscal policy, raising rates versus balance-sheet reduction, and the composition of the FOMC. We believe that the ECB may consider less expansionary monetary policy in light of stronger economic growth and higher inflation expectations. China, a key driver of the recent global economic improvement, is now experiencing tighter monetary conditions.
Portfolio Management:
Aberdeen North American Fixed Income Team
PAST PERFORMANCE DOES NOT GUARANTEE FUTURE RESULTS.
The performance quoted represents past performance, which does not guarantee future results. Class A shares have up to a 0.25% 12b-1 fee. The investment return and principal value of an investment will fluctuate so that an investor’s shares, when redeemed, may be worth more or less than their original cost. Current performance of the Fund may be lower or higher than the performance quoted. Performance data current to the most recent month-end may be obtained by calling 866-667-9231 or visiting www.aberdeen-asset.us.
Investing in mutual funds involves risk, including possible loss of principal. There is no assurance that the investment objective of any fund will be achieved. Indexes are unmanaged and have been provided for comparison purposes only. No fees or expenses are reflected. You cannot invest directly in an index.
Lipper is a leading global provider of mutual fund information and analysis to fund companies, financial intermediaries and media organizations.
Risk Considerations
Fixed income securities are subject to certain risks including, but not limited to: interest rate (changes in interest rates may cause a decline in the market value of an investment), credit (changes in the financial condition of the issuer, borrower, counterparty, or underlying collateral), prepayment (debt issuers may repay or refinance their loans or obligations earlier than anticipated), and extension (principal repayments may not occur as quickly as anticipated, causing the expected maturity of a security to increase).
Investments in asset-backed and mortgage-backed securities include additional risks that investors should be aware which include those associated with fixed income securities, as well as increased susceptibility to adverse economic developments.
Derivatives are speculative and may hurt the Fund’s performance. They present the risk of disproportionately increased losses and/or reduced gains when the financial asset or measure to which the derivative is linked changes in unexpected ways.
Foreign securities may be more volatile, harder to price and less liquid than U.S. securities. They are subject to different accounting and regulatory standards and currency exchange rate, political and economic risks. Fluctuation in currency exchange rates may impact a Fund’s returns more greatly to the extent a Fund does not hedge currency exposure or hedging techniques are unsuccessful. The foregoing risks are enhanced in emerging market countries.
Municipal securities can be affected by adverse tax, legislative or political changes and the financial condition of the issuers of municipal securities.
Investing a significant portion of the Fund’s assets in securities of companies conducting business in a broadly related group of industries within an economic sector may make the Fund more vulnerable to unfavorable developments in that sector.
Please read the prospectus for more detailed information regarding these and other risks.
| 16 | Semi-Annual Report 2017 |
Aberdeen Total Return Bond Fund (Unaudited)
Average Annual Total Return (For periods ended April 30, 2017) | Six Month† | 1 Yr. | 5 Yr. | 10 Yr. | ||||||||||
Class A | (0.51%) | 1.61% | 2.15% | 4.44% | ||||||||||
Institutional Class | (0.31%) | 1.90% | 2.43% | 4.71% | ||||||||||
| † | Not Annualized |
| 2017 Semi-Annual Report | 17 |
Aberdeen Total Return Bond Fund (Unaudited)
Performance of a $10,000 Investment (as of April 30, 2017)
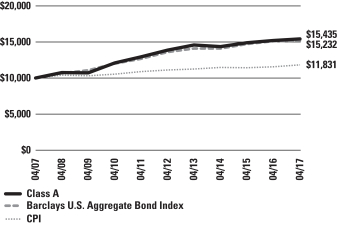
Comparative performance of $10,000 invested in Class A shares of the Aberdeen Total Return Bond Fund, Bloomberg Barclays U.S. Aggregate Bond Index and the Consumer Price Index (CPI) over a 10-year period ended April 30, 2017. Unlike the Fund’s returns, the returns for these unmanaged indexes do not reflect any fees or expenses. Investors cannot invest directly in market indexes.
The Bloomberg Barclays U.S. Aggregate Bond Index (the “U.S. Aggregate”) is a broad-based flagship benchmark that measures the investment grade, U.S. Dollar-denominated, fixed-rate taxable bond market. The index includes Treasuries, government-related and corporate securities, MBS (agency fixed-rate and hybrid ARM pass-throughs), ABS and CMBS (agency and non-agency). Provided the necessary inclusion rules are met, U.S. Aggregate eligible securities also contribute to the multi-currency Bloomberg Barclays Global Aggregate Bond Index and the Bloomberg Barclays U.S. Universal Index, which includes high yield and emerging markets debt.
The CPI is a measure of the average change over time in the prices paid by urban consumers for a market basket of consumer goods and services.
Investment return and principal value will fluctuate, and when redeemed, shares may be worth more or less than original cost. Past performance is no guarantee of future results. The Average Annual Total Return table and performance graph do not reflect the deduction of taxes that a shareholder would pay on Fund distributions or the redemption of Fund shares. Investing in mutual funds involves market risk, including loss of principal. Performance returns assume the reinvestment of all distributions. Performance returns reflect fee waivers and reimbursements in effect without which returns would have been lower.
Portfolio Summary (as a percentage of net assets)
April 30, 2017 (Unaudited)
| Asset Allocation | ||||
Corporate Bonds | 28.3% | |||
U.S. Agencies | 13.1% | |||
U.S. Treasuries | 11.0% | |||
Asset-Backed Securities | 10.9% | |||
Non-Agency Mortgage-Backed Securities | 9.6% | |||
Government Bonds | 9.0% | |||
Commercial Mortgage-Backed Securities | 8.9% | |||
Municipal Bonds | 4.4% | |||
Short-Term Investment | 2.3% | |||
Agency Mortgage-Backed Securities | 1.7% | |||
Other Assets in Excess of Liabilities | 0.8% | |||
| 100.0% | ||||
The following chart summarizes the composition of the Fund’s portfolio, expressed as a percentage of net assets. The industries listed below may include more than one industry group. As of April 30, 2017, the Fund did not have more than 25% of its assets invested in any industry group.
| Top Industries | ||||
Commercial Banks | 9.2% | |||
Electric Utilities | 1.8% | |||
Computers & Peripherals | 1.6% | |||
Media | 1.5% | |||
Software | 1.3% | |||
Miscellaneous Manufacturing | 1.2% | |||
Banks | 1.1% | |||
Energy Equipment & Services | 0.9% | |||
Internet | 0.9% | |||
Beverages | 0.9% | |||
Other | 79.6% | |||
| 100.0% | ||||
| Top Holdings* | ||||
U.S. Treasury Note 02/15/2027 | 2.7% | |||
U.S. Treasury Bond 08/15/2046 | 1.8% | |||
Norway Government Bond 02/17/2027 | 1.3% | |||
Canada Housing Trust No 1 12/15/2021 | 1.3% | |||
Edison International 09/15/2017 | 1.3% | |||
U.S. Treasury Bond 11/15/2046 | 1.3% | |||
U.S. Treasury Note 04/15/2020 | 1.2% | |||
Canada Housing Trust No 1 06/15/2022 | 1.2% | |||
U.S. Treasury Bond 05/15/2046 | 1.1% | |||
New Zealand Government Bond, Series 319 03/15/2019 | 1.0% | |||
Other | 85.8% | |||
| 100.0% | ||||
| * | For the purpose of listing top holdings, Short-Term Investments are included as part of Other. |
| Top Countries | ||||
United States | 80.4% | |||
Canada | 3.5% | |||
Supranational | 2.4% | |||
United Kingdom | 1.9% | |||
New Zealand | 1.7% | |||
Indonesia | 1.6% | |||
Norway | 1.3% | |||
Sweden | 1.2% | |||
Switzerland | 1.0% | |||
Belgium | 0.9% | |||
Other | 4.1% | |||
| 100.0% | ||||
| 18 | Semi-Annual Report 2017 |
Statement of Investments
April 30, 2017 (Unaudited)
Aberdeen Total Return Bond Fund
| Shares or Principal Amount | Value (US$) | |||||||
ASSET-BACKED SECURITIES (10.9%) | ||||||||
UNITED STATES (10.9%) | ||||||||
Ally Auto Receivables Trust, Series 2016-2, Class A3 (USD), 1.35%, 05/15/2020 | $ | 1,241,000 | $ | 1,238,786 | ||||
Ally Master Owner Trust, Series 2014-5, Class A2, (USD), 1.60%, 10/15/2019 | 727,000 | 727,696 | ||||||
American Express Credit Account Master Trust, Series 2017-1, Class A, (USD), 1.93%, 09/15/2022 | 2,042,000 | 2,048,576 | ||||||
Avis Budget Rental Car Funding AESOP LLC | ||||||||
Series 2013-2A, Class A, (USD), 2.97%, 02/20/2020 (a) | 1,238,000 | 1,256,031 | ||||||
Series 2015-2A, Class A (USD), 2.63%, 12/20/2021 (a) | 1,180,000 | 1,180,677 | ||||||
BMW Vehicle Lease Trust | ||||||||
Series 2015-2, Class A3 (USD), 1.40%, 09/20/2018 | 2,080,000 | 2,080,395 | ||||||
Series 2016-2, Class A3, (USD), 1.43%, 09/20/2019 | 758,000 | 755,740 | ||||||
Chase Issuance Trust | ||||||||
Series 2015-A5, Class A5, (USD), 1.36%, 04/15/2020 | 1,993,000 | 1,991,461 | ||||||
Series 2016-A5, Class A5, (USD), 1.27%, 07/15/2021 | 2,036,000 | 2,017,999 | ||||||
Citibank Credit Card Issuance Trust, Series 2014-A1, Class A1 (USD), 2.88%, 01/23/2023 | 1,834,000 | 1,890,359 | ||||||
Discover Card Execution Note Trust | ||||||||
Series 2016-A4, Class A4, (USD), 1.39%, 03/15/2022 | 2,415,000 | 2,394,698 | ||||||
Series 2017-A2, Class A2 (USD), 2.39%, 07/15/2024 | 2,118,000 | 2,141,752 | ||||||
Ford Credit Auto Owner Trust, Series 2017-1, Class A, (USD), 2.62%, 08/15/2028 (a) | 1,464,000 | 1,479,557 | ||||||
Ford Credit Floorplan Master Owner Trust A, Series 2012-5, Class A, (USD), 1.49%, 09/15/2019 | 1,520,000 | 1,520,693 | ||||||
GM Financial Automobile Leasing Trust | ||||||||
Series 2015-2, Class A2B (USD), 1.41%, 04/20/2018 (b) | 223,618 | 223,671 | ||||||
Series 2016-3, Class A3, (USD), 1.61%, 12/20/2019 | 861,000 | 859,347 | ||||||
Honda Auto Receivables Owner Trust | ||||||||
Series 2016-3, Class A2, (USD), 1.01%, 10/18/2018 | 1,552,706 | 1,551,431 | ||||||
Series 2016-4, Class A2, (USD), 1.04%, 04/18/2019 | 2,577,000 | 2,572,510 | ||||||
Mercedes-Benz Auto Lease Trust, Series 2016-B, Class A3, (USD), 1.35%, 08/15/2019 | 1,535,000 | 1,531,950 | ||||||
Mercedes-Benz Auto Receivables Trust, Series 2015-1, Class A2B (USD), 1.26%, 06/15/2018 (b) | 68,693 | 68,694 | ||||||
Navistar Financial Dealer Note Master Trust II, Series 2015-1, Class A (USD), 2.39%, 06/25/2020 (a)(b) | 1,990,000 | 1,992,324 | ||||||
SLM Student Loan Trust | ||||||||
Series 2011-1, Class A1 (USD), 1.51%, 03/25/2026 (b) | 428,987 | 430,022 | ||||||
Series 2011-2, Class A1 (USD), 1.59%, 11/25/2027 (b) | $ | 901,108 | $ | 904,644 | ||||
Series 2013-2, Class A (USD), 1.44%, 06/25/2043 (b) | 620,906 | 615,443 | ||||||
Synchrony Credit Card Master Note Trust, Series 2016-1, Class A (USD), 2.04%, 03/15/2022 | 1,308,000 | 1,314,479 | ||||||
Toyota Auto Receivables Owner Trust, Series 2016-D, Class A2A, (USD), 1.06%, 05/15/2019 | 1,867,000 | 1,864,172 | ||||||
Volvo Financial Equipment LLC, Series 2016-1A, Class A3 (USD), 1.67%, 02/18/2020 (a) | 1,080,000 | 1,080,377 | ||||||
Wells Fargo Dealer Floorplan Master Note Trust, Series 2014-2, Class A, (USD), 1.44%, 10/20/2019 (b) | 1,320,000 | 1,319,738 | ||||||
| 39,053,222 | ||||||||
Total Asset-Backed Securities | 39,053,222 | |||||||
COMMERCIAL MORTGAGE-BACKED SECURITIES (8.9%) |
| |||||||
UNITED STATES (8.9%) | ||||||||
BANK, Series 2017-BNK4, Class A4 (USD), 3.63%, 05/15/2050 | 1,783,000 | 1,850,983 | ||||||
Barclays Commercial Mortgage Securities Trust, Series 2015-SLP, Class B (USD), 2.59%, 02/15/2028 (a)(b) | 1,550,000 | 1,530,561 | ||||||
Bear Stearns Commercial Mortgage Securities Trust, Series 2007-PW17, Class AM (USD), 1.68%, 06/11/2050 (a)(b) | 1,644,750 | 1,644,900 | ||||||
Citigroup Commercial Mortgage Trust, Series 2007-C6, Class AM (USD), 5.92%, 12/10/2049 (b) | 1,270,000 | 1,285,120 | ||||||
Commercial Mortgage Trust | ||||||||
Series 2014-TWC, Class B (USD), 2.59%, 02/13/2032 (a)(b) | 1,110,000 | 1,115,224 | ||||||
Series 2015-DC1, Class ASB (USD), 3.14%, 02/10/2048 | 1,090,000 | 1,121,341 | ||||||
Series 2007-GG11, Class A4 (USD), 5.74%, 12/10/2049 | 385,632 | 386,767 | ||||||
FDIC Guaranteed Notes Trust, Series 2010-C1, Class A (USD), 2.98%, 12/06/2020 (a) | 1,358,569 | 1,365,287 | ||||||
FREMF Mortgage Trust, Series 2012-K23, Class C, (USD), 3.78%, 10/25/2045 (a)(b) | 721,000 | 723,544 | ||||||
GS Mortgage Securites Corp. Trust | ||||||||
Series 2012-SHOP, Class A (USD), 2.93%, 06/05/2031 (a) | 1,820,000 | 1,849,533 | ||||||
Series 2017-GPTX, Class A (USD), 2.86%, 05/10/2034 (a) | 925,714 | 925,714 | ||||||
Series 2017-GPTX, Class C (USD), 3.30%, 05/10/2034 (a) | 1,165,000 | 1,165,000 | ||||||
GSCCRE Commercial Mortgage Trust, Series 2015-HULA, Class B (USD), 3.29%, 08/15/2032 (a)(b) | 1,370,000 | 1,374,276 | ||||||
Hilton USA Trust, Series 2016-SFP, Class C, (USD), 4.12%, 11/05/2035 (a) | 1,509,000 | 1,529,962 | ||||||
JP Morgan Chase Commercial Mortgage Securities Trust, Series 2015-UES, Class C (USD), 3.74%, 09/05/2032 (a)(b) | 1,415,000 | 1,441,459 | ||||||
See accompanying Notes to Financial Statements.
| 2017 Semi-Annual Report | 19 |
Statement of Investments (continued)
April 30, 2017 (Unaudited)
Aberdeen Total Return Bond Fund
| Shares or Principal Amount | Value (US$) | |||||||
JP Morgan Mortgage Trust | ||||||||
Series 2016-5, Class A1 (USD), 2.60%, 12/25/2046 (a)(b) | $ | 1,360,994 | $ | 1,358,522 | ||||
Series 2017-1, Class A3, (USD), 3.50%, 01/25/2047 (a)(b) | 731,513 | 748,029 | ||||||
Morgan Stanley Capital Barclays Bank Trust, Series 2016-MART, Class A, (USD), 2.20%, 09/13/2031 (a) | 1,626,000 | 1,605,719 | ||||||
Morgan Stanley Capital I Trust, Series 2007-IQ16, Class A4 (USD), 5.81%, 12/12/2049 | 726,400 | 729,853 | ||||||
Sequoia Mortgage Trust, Series 2017-1, Class B2, (USD), 3.64%, 02/25/2047 (a)(b) | 696,079 | 661,060 | ||||||
SFAVE Commercial Mortgage Securities Trust | ||||||||
Series 2015-5AVE, Class B (USD), 4.53%, 01/05/2043 (a)(b) | 760,000 | 720,825 | ||||||
Series 2015-5AVE, Class C (USD), 4.53%, 01/05/2043 (a)(b) | 960,000 | 857,731 | ||||||
Shellpoint Co-Originator Trust, Series 2016-1, Class 1A10 (USD), 3.50%, 11/25/2046 (a)(b) | 916,590 | 936,819 | ||||||
Wells Fargo Commercial Mortgage Trust | ||||||||
Series 2015-C29, Class ASB (USD), 3.40%, 06/15/2048 | 1,220,000 | 1,266,597 | ||||||
Series 2015-LC22, Class ASB (USD), 3.57%, 09/15/2058 | 800,000 | 843,580 | ||||||
Series 2017-RC1, Class A4, (USD), 3.63%, 01/15/2060 | 1,696,000 | 1,758,786 | ||||||
WinWater Mortgage Loan Trust, Series 2015-1, Class A1, (USD), 3.50%, 01/20/2045 (a)(b) | 1,118,404 | 1,133,913 | ||||||
| 31,931,105 | ||||||||
Total Commercial Mortgage-Backed Securities |
| 31,931,105 | ||||||
NON-AGENCY MORTGAGE-BACKED SECURITIES (9.6%) |
| |||||||
UNITED STATES (9.6%) | ||||||||
Agate Bay Mortgage Trust, Series 2016-3, Class A5 (USD), 3.50%, 08/25/2046 (a)(b) | 1,277,297 | 1,302,943 | ||||||
Alternative Loan Trust, Series 2004-28CB, Class 3A1 (USD), 6.00%, 01/25/2035 | 717,763 | 712,158 | ||||||
Bear Stearns Adjustable Rate Mortgage Trust, Series 2004-3, Class 4A (USD), 3.26%, 07/25/2034 (b) | 662,653 | 646,865 | ||||||
CHL Mortgage Pass-Through Trust, Series 2005-21, Class A2 (USD), 5.50%, 10/25/2035 | 547,228 | 526,632 | ||||||
Citigroup Mortgage Loan Trust | ||||||||
Series 2005-11, Class A3 (USD), 2.99%, 11/25/2035 (b) | 709,924 | 701,426 | ||||||
Series 2014-A, Class A (USD), 4.00%, 01/25/2035 (a)(b) | 512,202 | 531,566 | ||||||
Series 2015-PS1, Class A1 (USD), 3.75%, 09/25/2042 (a)(b) | 863,908 | 885,371 | ||||||
Credit Suisse Mortgage Capital Trust | ||||||||
Series 2013-6, Class2A1 (USD), 3.50%, 08/25/2043 (a)(b) | 603,049 | 612,801 | ||||||
Series 2013-7, Class A11 (USD), 3.50%, 08/25/2043 (a)(b) | 1,073,367 | 1,086,239 | ||||||
Series 2013-7, Class A2 (USD), 3.00%, 08/25/2043 (a)(b) | $ | 866,482 | $ | 867,991 | ||||
EverBank Mortgage Loan Trust, Series 2013-2, Class A (USD), 3.00%, 06/25/2043 (a)(b) | 1,017,400 | 1,006,033 | ||||||
GSR Mortgage Loan Trust, Series 2005-6F, Class 1A6 (USD), 5.25%, 07/25/2035 | 719,178 | 746,429 | ||||||
IndyMac INDA Mortgage Loan Trust, Series 2005-AR2, Class 3A1 (USD), 3.33%, 01/25/2036 (b) | 661,481 | 610,354 | ||||||
JP Morgan Mortgage Trust | ||||||||
Series 15-6, Class A13 (USD), 3.50%, 10/25/2045 (a)(b) | 1,444,506 | 1,452,349 | ||||||
Series 16-1, Class A13 (USD), 3.50%, 05/25/2046 (a) | 817,126 | 822,839 | ||||||
Series 2005-A4, Class 3A1 (USD), 3.07%, 07/25/2035 (b) | 1,088,396 | 1,076,521 | ||||||
Series 2005-A5, Class 2A2 (USD), 3.25%, 08/25/2035 (b) | 970,107 | 974,414 | ||||||
Series 2006-S1, Class 2A6 (USD), 6.00%, 04/25/2036 | 836,805 | 864,536 | ||||||
Series 2013-1, Class 1A2 (USD), 3.00%, 03/25/2043 (a)(b) | 615,724 | 599,669 | ||||||
Series 2013-1, Class B1 (USD), 3.50%, 03/25/2043 (a)(b) | 974,603 | 985,283 | ||||||
Series 2014-IVR3, Class 3A1 (USD), 2.89%, 09/25/2044 (a)(b) | 836,130 | 830,457 | ||||||
Series 2014-IVR6, Class AM (USD), 2.82%, 07/25/2044 (a)(b) | 1,130,487 | 1,128,484 | ||||||
MASTR Adjustable Rate Mortgages Trust, Series 2006-2, Class 4A1 (USD), 3.08%, 02/25/2036 (b) | 522,159 | 480,098 | ||||||
Merrill Lynch Mortgage Investors Trust, Series 2007-3, Class 2A2 (USD), 3.22%, 09/25/2037 (b) | 1,071,303 | 1,044,580 | ||||||
NCUA Guaranteed Notes Trust, Series 2010-R3, Class 1A (USD), 1.54%, 12/08/2020 (b) | 862,308 | 865,740 | ||||||
New Residential Mortgage Loan Trust | ||||||||
Series 2014-2A, Class A3 (USD), 3.75%, 05/25/2054 (a)(b) | 908,967 | 928,449 | ||||||
Series 2017-1A, Class A1, (USD), 4.00%, 02/25/2057 (a)(b) | 1,871,337 | 1,937,541 | ||||||
Series 2017-2A, Class A3, (USD), 4.00%, 03/25/2057 (a)(b) | 1,469,650 | 1,528,296 | ||||||
PHH Mortgage Trust, Series 2008-CIM1, Class 21A1 (USD), 6.00%, 05/25/2038 | 1,047,060 | 1,087,238 | ||||||
Sequoia Mortgage Trust | ||||||||
Series 2013-4, Class A2 (USD), 2.50%, 04/25/2043 (b) | 960,413 | 931,192 | ||||||
Series 2013-5, Class A1 (USD), 2.50%, 05/25/2043 (a)(b) | 946,565 | 914,434 | ||||||
Series 2013-6, Class A1 (USD), 2.50%, 05/25/2043 (b) | 639,379 | 616,827 | ||||||
Series 2017-1, Class A4 (USD), 3.50%, 02/25/2047 (a)(b) | 1,169,609 | 1,197,903 | ||||||
Structured Asset Securities Corp., Series 2004-18H, Class A5 (USD), 4.75%, 10/25/2034 | 1,196,922 | 1,226,823 | ||||||
See accompanying Notes to Financial Statements.
| 20 | Semi-Annual Report 2017 |
Statement of Investments (continued)
April 30, 2017 (Unaudited)
Aberdeen Total Return Bond Fund
| Shares or Principal Amount | Value (US$) | |||||||
Thornburg Mortgage Securities Trust | ||||||||
Series 2007-4, Class 2A1 (USD), 2.87%, 09/25/2037 (b) | $ | 759,646 | $ | 755,265 | ||||
Series 2007-4, Class 3A1 (USD), 5.94%, 09/25/2037 (b) | 105,575 | 106,457 | ||||||
WaMu Mortgage Pass Through Certificates, Series 2005-AR7, Class A3 (USD), 2.82%, 08/25/2035 (b) | 840,510 | 842,283 | ||||||
Wells Fargo Mortgage Backed Securities Trust | ||||||||
Series 2006-10, Class A4 (USD), 6.00%, 08/25/2036 | 718,173 | 714,952 | ||||||
Series 2006-19, Class A4 (USD), 5.25%, 12/26/2036 | 235,034 | 234,585 | ||||||
| 34,384,023 | ||||||||
Total Non-Agency Mortgage-Backed Securities |
| 34,384,023 | ||||||
CORPORATE BONDS (28.3%) | ||||||||
AUSTRALIA (0.4%) | ||||||||
Commercial Banks (0.4%) | ||||||||
National Australia Bank Ltd. (USD), 1.25%, 03/08/2018 (a) | 1,363,000 | 1,359,220 | ||||||
BELGIUM (0.9%) | ||||||||
Beverages (0.9%) | ||||||||
Anheuser-Busch InBev Finance, Inc. (USD), 4.90%, 02/01/2046 | 1,556,000 | 1,699,857 | ||||||
Anheuser-Busch InBev Worldwide, Inc. (USD), 1.38%, 07/15/2017 | 1,495,000 | 1,495,175 | ||||||
| 3,195,032 | ||||||||
CANADA (0.6%) | ||||||||
Commercial Banks (0.6%) | ||||||||
National Bank of Canada (USD), 1.45%, 11/07/2017 | 2,110,000 | 2,110,840 | ||||||
FRANCE (0.8%) | ||||||||
Apparel (0.8%) | ||||||||
LVMH Moet Hennessy Louis Vuitton SE (USD), 1.63%, 06/29/2017 (a) | 2,950,000 | 2,950,313 | ||||||
GERMANY (0.6%) | ||||||||
Commercial Banks (0.6%) | ||||||||
KfW (AUD), 6.00%, 08/20/2020 (c) | 2,500,000 | 2,094,253 | ||||||
NETHERLANDS (0.9%) | ||||||||
Commercial Banks (0.9%) | ||||||||
Cooperatieve Centrale Raiffeisen-Boerenleenbank BA (USD), 4.38%, 08/04/2025 | 1,400,000 | 1,455,006 | ||||||
Cooperatieve Rabobank UA (USD), 3.95%, 11/09/2022 | 1,600,000 | 1,660,446 | ||||||
| 3,115,452 | ||||||||
SPAIN (0.4%) | ||||||||
Commercial Banks (0.4%) | ||||||||
Banco Santander SA (USD), 3.50%, 04/11/2022 | 1,400,000 | 1,414,328 | ||||||
SUPRANATIONAL (1.1%) | ||||||||
Banks (1.1%) | ||||||||
International Bank for Reconstruction & Development Series GDIF (AUD), 3.50%, 04/29/2019 | $ | 2,423,000 | $ | 1,866,280 | ||||
(NZD), 4.63%, 02/26/2019 | 3,140,000 | 2,234,975 | ||||||
| 4,101,255 | ||||||||
SWEDEN (1.2%) | ||||||||
Commercial Banks (1.2%) | ||||||||
Skandinaviska Enskilda Banken AB (USD), 2.63%, 03/15/2021 | 2,188,000 | 2,204,239 | ||||||
Svenska Handelsbanken AB (USD), 2.45%, 03/30/2021 | 1,977,000 | 1,978,576 | ||||||
| 4,182,815 | ||||||||
SWITZERLAND (1.0%) | ||||||||
Commercial Banks (0.5%) | ||||||||
Credit Suisse Group Funding Guernsey Ltd. (USD), 3.80%, 09/15/2022 | 1,860,000 | 1,914,297 | ||||||
Metals & Mining (0.5%) | ||||||||
Glencore Funding LLC (USD), 4.00%, 04/16/2025 (a) | 1,570,000 | 1,573,109 | ||||||
| 3,487,406 | ||||||||
UNITED KINGDOM (1.9%) | ||||||||
Commercial Banks (0.7%) | ||||||||
Santander UK Group Holdings PLC (USD), 3.57%, 01/10/2023 | 2,410,000 | 2,433,941 | ||||||
Miscellaneous Manufacturing (1.2%) | ||||||||
Pentair Finance SA | ||||||||
(USD), 1.88%, 09/15/2017 | 3,190,000 | 3,193,640 | ||||||
(USD), 3.15%, 09/15/2022 | 1,330,000 | 1,327,929 | ||||||
| 4,521,569 | ||||||||
| 6,955,510 | ||||||||
UNITED STATES (18.5%) | ||||||||
Aerospace & Defense (0.5%) | ||||||||
United Technologies Corp. (USD), 3.75%, 11/01/2046 | 1,920,000 | 1,845,045 | ||||||
Auto Manufacturers (0.8%) | ||||||||
Ford Motor Credit Co. LLC (USD), 3.10%, 05/04/2023 | 1,730,000 | 1,702,227 | ||||||
General Motors Co. (USD), 5.00%, 04/01/2035 | 1,380,000 | 1,365,441 | ||||||
| 3,067,668 | ||||||||
Biotechnology (0.5%) | ||||||||
Amgen, Inc. | ||||||||
(USD), 2.13%, 05/15/2017 | 1,231,000 | 1,231,293 | ||||||
(USD), 1.25%, 05/22/2017 | 495,000 | 494,984 | ||||||
| 1,726,277 | ||||||||
Commercial Banks (3.9%) | ||||||||
Bank of America Corp. (USD), 3.82%, 01/20/2028 (b) | 1,661,000 | 1,673,300 | ||||||
See accompanying Notes to Financial Statements.
| 2017 Semi-Annual Report | 21 |
Statement of Investments (continued)
April 30, 2017 (Unaudited)
Aberdeen Total Return Bond Fund
| Shares or Principal Amount | Value (US$) | |||||||
Citigroup, Inc. (USD), 4.45%, 09/29/2027 | $ | 1,870,000 | $ | 1,913,234 | ||||
Citizens Financial Group, Inc. (USD), 5.16%, 06/29/2023 (b) | 1,540,000 | 1,591,190 | ||||||
Goldman Sachs Group, Inc. (The) | ||||||||
(USD), 4.25%, 10/21/2025 | 1,245,000 | 1,281,552 | ||||||
(USD), 3.50%, 11/16/2026 | 1,033,000 | 1,020,245 | ||||||
JPMorgan Chase & Co. (USD), 4.35%, 08/15/2021 | 2,140,000 | 2,295,790 | ||||||
Morgan Stanley (USD), 4.00%, 07/23/2025 | 1,540,000 | 1,595,973 | ||||||
Wells Fargo & Co. (USD), 4.10%, 06/03/2026 | 2,410,000 | 2,497,905 | ||||||
| 13,869,189 | ||||||||
Computers & Peripherals (1.6%) | ||||||||
Apple, Inc. | ||||||||
(USD), 4.65%, 02/23/2046 | 2,509,000 | 2,733,829 | ||||||
(USD), 3.85%, 08/04/2046 | 1,390,000 | 1,347,032 | ||||||
(USD), 4.25%, 02/09/2047 | 1,610,000 | 1,660,680 | ||||||
| 5,741,541 | ||||||||
Diversified Financial Services (0.3%) | ||||||||
KKR Group Finance Co. III LLC (USD), 5.13%, 06/01/2044 (a) | 1,050,000 | 1,078,957 | ||||||
Diversified Telecommunication Services (0.4%) |
| |||||||
AT&T, Inc. (USD), 4.75%, 05/15/2046 | 1,420,000 | 1,330,132 | ||||||
Electric Utilities (1.8%) | ||||||||
Edison International (USD), 3.75%, 09/15/2017 | 4,470,000 | 4,507,168 | ||||||
Entergy Corp. (USD), 2.95%, 09/01/2026 | 903,000 | 865,007 | ||||||
Southern Power Co., Series F (USD), 4.95%, 12/15/2046 | 1,030,000 | 1,037,318 | ||||||
| 6,409,493 | ||||||||
Energy Equipment & Services (0.9%) | ||||||||
Energy Transfer Partners LP (USD), 4.15%, 10/01/2020 | 1,780,000 | 1,852,252 | ||||||
Plains All American Pipeline LP / PAA Finance Corp. (USD), 3.65%, 06/01/2022 | 1,420,000 | 1,437,557 | ||||||
| 3,289,809 | ||||||||
Healthcare Products (0.5%) |
| |||||||
Medtronic, Inc. (USD), 4.38%, 03/15/2035 | 1,870,000 | 1,978,941 | ||||||
Healthcare Providers & Services (0.6%) |
| |||||||
Quest Diagnostics, Inc. (USD), 3.45%, 06/01/2026 | 2,040,000 | 2,028,101 | ||||||
Insurance (0.6%) | ||||||||
American International Group, Inc. (USD), 6.25%, 05/01/2036 | 1,696,000 | 2,019,385 | ||||||
Internet (0.9%) | ||||||||
eBay, Inc. | ||||||||
(USD), 1.35%, 07/15/2017 | 1,586,000 | 1,585,610 | ||||||
(USD), 3.80%, 03/09/2022 | 1,566,000 | 1,636,399 | ||||||
| 3,222,009 | ||||||||
Media (1.5%) |
| |||||||
Comcast Corp. (USD), 6.45%, 03/15/2037 | 600,000 | 772,579 | ||||||
Time Warner Cos., Inc. | ||||||||
(USD), 7.57%, 02/01/2024 | $ | 2,720,000 | $ | 3,374,815 | ||||
(USD), 6.95%, 01/15/2028 | 990,000 | 1,234,412 | ||||||
| 5,381,806 | ||||||||
Oil, Gas & Consumable Fuels (0.7%) |
| |||||||
HollyFrontier Corp. (USD), 5.88%, 04/01/2026 | 1,523,000 | 1,623,880 | ||||||
Marathon Oil Corp. (USD), 5.20%, 06/01/2045 | 1,030,000 | 1,035,657 | ||||||
| 2,659,537 | ||||||||
Pharmaceutical (0.3%) |
| |||||||
AbbVie, Inc. (USD), 4.45%, 05/14/2046 | 973,000 | 948,431 | ||||||
Retail (0.3%) | ||||||||
Lowe’s Cos., Inc. (USD), 4.05%, 05/03/2047 | 989,000 | 985,473 | ||||||
Semiconductors (0.6%) | ||||||||
Broadcom Corp. / Broadcom Cayman Finance Ltd. (USD), 3.00%, 01/15/2022 (a) | 2,042,000 | 2,058,148 | ||||||
Software (1.3%) | ||||||||
Electronic Arts, Inc. (USD), 3.70%, 03/01/2021 | 1,562,000 | 1,624,791 | ||||||
Microsoft Corp. (USD), 4.45%, 11/03/2045 | 2,860,000 | 3,054,031 | ||||||
| 4,678,822 | ||||||||
Transportation (0.5%) |
| |||||||
FedEx Corp. (USD), 4.90%, 01/15/2034 | 1,620,000 | 1,764,449 | ||||||
| 66,083,213 | ||||||||
Total Corporate Bonds | 101,049,637 | |||||||
MUNICIPAL BONDS (4.4%) | ||||||||
UNITED STATES (4.4%) | ||||||||
CALIFORNIA (2.1%) | ||||||||
Los Angeles Unified School District General Obligation Unlimited Bonds | ||||||||
(USD), 5.76%, 07/01/2029 | 1,430,000 | 1,760,316 | ||||||
(USD), 6.76%, 07/01/2034 | 1,967,000 | 2,660,033 | ||||||
State of California General Obligation Unlimited Bonds (USD), 7.55%, 04/01/2039 | 2,110,000 | 3,113,642 | ||||||
| 7,533,991 | ||||||||
CONNECTICUT (0.2%) | ||||||||
State of Connecticut General Obligation Unlimited Bonds (USD), 5.09%, 10/01/2030 | 770,000 | 871,833 | ||||||
MASSACHUSETTS (0.4%) | ||||||||
Commonwealth of Massachusetts General Obligation Limited Bonds, Series E (USD), 4.20%, 12/01/2021 | 1,200,000 | 1,280,688 | ||||||
NEW YORK (1.4%) | ||||||||
New York City Transitional Finance Authority Revenue Bonds (Build America Bonds) (USD), 5.77%, 08/01/2036 | 940,000 | 1,152,591 | ||||||
New York City Transitional Finance Authority Revenue Bonds (Qualified School Construction BD) | ||||||||
(USD), 5.27%, 05/01/2027 | 1,020,000 | 1,175,152 | ||||||
(USD), 5.01%, 08/01/2027 | 810,000 | 928,876 | ||||||
See accompanying Notes to Financial Statements.
| 22 | Semi-Annual Report 2017 |
Statement of Investments (continued)
April 30, 2017 (Unaudited)
Aberdeen Total Return Bond Fund
| Shares or Principal Amount | Value (US$) | |||||||
New York State Dormitory Authority Revenue Bonds (Build America Bonds) (USD), 5.50%, 03/15/2030 | $ | 1,375,000 | $ | 1,627,546 | ||||
| 4,884,165 | ||||||||
PENNSYLVANIA (0.3%) |
| |||||||
Pennsylvania State General Obligation Unlimited Bonds (Build America Bonds), Series B (USD), 4.65%, 02/15/2026 | 960,000 | 1,051,603 | ||||||
| 15,622,280 | ||||||||
Total Municipal Bonds | 15,622,280 | |||||||
GOVERNMENT BONDS (9.0%) | ||||||||
CANADA (2.9%) | ||||||||
Canada Housing Trust No 1 | ||||||||
(CAD), 1.15%, 12/15/2021 (a)(c) | 6,210,000 | 4,508,886 | ||||||
(CAD), 1.50%, 12/15/2021 (a)(c) | 2,200,000 | 1,622,509 | ||||||
(CAD), 1.75%, 06/15/2022 (a)(c) | 5,745,000 | 4,278,669 | ||||||
| 10,410,064 | ||||||||
INDONESIA (1.6%) | ||||||||
Indonesia Treasury Bond | ||||||||
Series FR56 (IDR), 8.38%, 09/15/2026 | 42,449,000,000 | 3,461,780 | ||||||
Series FR72 (IDR), 8.25%, 05/15/2036 | 28,000,000,000 | 2,210,968 | ||||||
| 5,672,748 | ||||||||
NEW ZEALAND (1.7%) |
| |||||||
New Zealand Government Bond | ||||||||
(NZD), 5.00%, 03/15/2019 (a) | 854,000 | 617,313 | ||||||
Series 319 (NZD), 5.00%, 03/15/2019 (a) | 5,180,000 | 3,744,355 | ||||||
Series 423 (NZD), 5.50%, 04/15/2023 (a) | 2,140,000 | 1,691,456 | ||||||
| 6,053,124 | ||||||||
NORWAY (1.3%) |
| |||||||
Norway Government Bond (NOK), 1.75%, 02/17/2027 (a) | 40,010,000 | 4,710,239 | ||||||
REPUBLIC OF SOUTH KOREA (0.2%) | ||||||||
Korea Housing Finance Corp. (USD), 1.63%, 09/15/2018 (a) | 730,000 | 725,781 | ||||||
SUPRANATIONAL (1.3%) | ||||||||
International Bank for Reconstruction & Development | ||||||||
(NZD), 3.50%, 01/22/2021 | 3,445,000 | 2,404,354 | ||||||
(NZD), 3.38%, 01/25/2022 | 3,256,000 | 2,244,923 | ||||||
| 4,649,277 | ||||||||
Total Government Bonds | 32,221,233 | |||||||
U.S. AGENCIES (13.1%) | ||||||||
UNITED STATES (13.1%) | ||||||||
Federal Home Loan Mortgage Corp. | ||||||||
(USD), 5.00%, 10/01/2041 | 1,064,768 | 1,175,034 | ||||||
(USD), 4.00%, 03/01/2042 | 1,812,562 | 1,922,183 | ||||||
(USD), 4.50%, 07/01/2042 | 3,021,684 | 3,261,462 | ||||||
(USD), 3.00%, 02/01/2043 | $ | 1,157,759 | $ | 1,163,338 | ||||
(USD), 3.50%, 02/01/2044 | 3,109,560 | 3,211,645 | ||||||
(USD), 4.50%, 07/01/2044 | 1,403,088 | 1,510,588 | ||||||
(USD), 4.00%, 11/01/2044 | 1,463,908 | 1,542,290 | ||||||
(USD), 3.08%, 02/01/2045 (b) | 2,267,345 | 2,331,990 | ||||||
(USD), 4.00%, 02/01/2046 | 1,868,351 | 1,968,389 | ||||||
(USD), 3.50%, 03/01/2046 | 1,062,611 | 1,093,593 | ||||||
(USD), 3.50%, 05/01/2046 | 1,670,024 | 1,718,717 | ||||||
(USD), 4.00%, 06/01/2046 | 1,399,185 | 1,474,103 | ||||||
(USD), 3.00%, 11/01/2046 | 2,710,644 | 2,708,738 | ||||||
(USD), 4.00%, 05/01/2047 | 3,251,000 | 3,422,185 | ||||||
Federal National Mortgage Association | ||||||||
(USD), 3.00%, 09/01/2030 | 1,733,765 | 1,788,056 | ||||||
(USD), 3.00%, 10/01/2030 | 1,657,081 | 1,707,821 | ||||||
(USD), 3.50%, 06/01/2042 | 1,157,854 | 1,196,223 | ||||||
(USD), 4.00%, 06/01/2043 | 1,047,713 | 1,106,787 | ||||||
(USD), 4.00%, 11/01/2043 | 1,203,516 | 1,268,412 | ||||||
(USD), 4.50%, 03/01/2044 | 839,635 | 905,162 | ||||||
(USD), 4.50%, 08/01/2044 | 737,522 | 797,010 | ||||||
(USD), 3.07%, 01/01/2045 (b) | 1,534,009 | 1,580,861 | ||||||
(USD), 3.50%, 06/01/2045 | 1,194,921 | 1,235,004 | ||||||
(USD), 4.00%, 07/01/2046 | 1,916,083 | 2,019,402 | ||||||
(USD), 3.00%, 11/01/2046 | 1,539,308 | 1,538,579 | ||||||
(USD), 4.50%, 01/01/2047 | 1,509,367 | 1,624,928 | ||||||
(USD), 4.00%, 02/01/2047 | 1,415,162 | 1,491,470 | ||||||
| 46,763,970 | ||||||||
Total U.S. Agencies | 46,763,970 | |||||||
U.S. TREASURIES (11.0%) |
| |||||||
UNITED STATES (11.0%) | ||||||||
Treasury Inflation Protected Security (USD), 0.75%, 02/15/2045 (d) | 1,849,368 | 1,776,852 | ||||||
U.S. Treasury Bond | ||||||||
(USD), 2.50%, 05/15/2046 | 4,532,900 | 4,116,793 | ||||||
(USD), 2.25%, 08/15/2046 | 7,706,500 | 6,615,552 | ||||||
(USD), 2.88%, 11/15/2046 | 4,572,500 | 4,494,269 | ||||||
U.S. Treasury Note | ||||||||
(USD), 1.25%, 03/31/2019 | 1,001,600 | 1,001,366 | ||||||
(USD), 1.50%, 04/15/2020 | 4,292,700 | 4,298,903 | ||||||
(USD), 1.75%, 11/30/2021 | 2,917,300 | 2,914,109 | ||||||
(USD), 1.88%, 01/31/2022 | 700,200 | 702,443 | ||||||
(USD), 2.13%, 02/29/2024 | 1,577,500 | 1,581,505 | ||||||
(USD), 2.13%, 03/31/2024 | 2,322,800 | 2,327,518 | ||||||
(USD), 2.25%, 02/15/2027 | 9,524,200 | 9,496,294 | ||||||
| 39,325,604 | ||||||||
Total U.S. Treasuries | 39,325,604 | |||||||
AGENCY MORTGAGE-BACKED SECURITIES (1.7%) |
| |||||||
UNITED STATES (1.7%) | ||||||||
Federal Home Loan Mortgage Corp. | ||||||||
Series 2016-DNA1, Class M2, CMO, (USD), 3.89%, 07/25/2028 (b) | 1,330,000 | 1,387,207 | ||||||
Series 2016-DNA3, Class M2, CMO, (USD), 2.99%, 12/25/2028 (b) | 909,000 | 930,774 | ||||||
Series 2016-HQA2, Class M2, CMO, (USD), 3.24%, 11/25/2028 (b) | 1,386,000 | 1,433,090 | ||||||
See accompanying Notes to Financial Statements.
| 2017 Semi-Annual Report | 23 |
Statement of Investments (continued)
April 30, 2017 (Unaudited)
Aberdeen Total Return Bond Fund
| Shares or Principal Amount | Value (US$) | |||||||
Structured Agency Credit Risk | ||||||||
Series 2014-HQ2, Class M2, CMO (USD), 3.19%, 09/25/2024 (b) | $ | 1,400,000 | $ | 1,444,077 | ||||
Series 2015-DNA1, Class M2 (USD), 2.84%, 10/25/2027 (b) | 1,090,000 | 1,116,149 | ||||||
| 6,311,297 | ||||||||
Total Agency Mortgage-Backed Securities |
| 6,311,297 | ||||||
SHORT-TERM INVESTMENT (2.3%) | ||||||||
UNITED STATES (2.3%) | ||||||||
State Street Institutional U.S. Government Money Market Fund(e) | 8,073,154 | 8,073,154 | ||||||
Total Short-Term Investment | 8,073,154 | |||||||
Total Investments | 354,735,525 | |||||||
Other Assets in Excess of Liabilities—0.8% |
| 2,723,531 | ||||||
Net Assets—100.0% | $ | 357,459,056 | ||||||
| (a) | Denotes a security issued under Regulation S or Rule 144A. |
| (b) | Variable or Floating Rate Security. Rate disclosed is as of April 30, 2017. |
| (c) | This security is government guaranteed. |
| (d) | Inflation linked security. |
| (e) | Registered investment company advised by State Street Global Advisors. |
| (f) | See accompanying Notes to Financial Statements for tax unrealized appreciation/(depreciation) of securities. |
| AUD | Australian Dollar |
| CAD | Canadian Dollar |
| CLP | Chilean Peso |
| COP | Colombian Peso |
| EUR | Euro Currency |
| HKD | Hong Kong Dollar |
| IDR | Indonesian Rupiah |
| INR | Indian Rupee |
| KRW | South Korean Won |
| MXN | Mexican Peso |
| MYR | Malaysian Ringgit |
| NOK | Norwegian Krone |
| NZD | New Zealand Dollar |
| USD | U.S. Dollar |
| ZAR | South African Rand |
At April 30, 2017, the Fund held the following futures contracts:
| Futures Contracts | Number of Contracts Long/(Short) | Expiration Date | Unrealized Appreciation/ (Depreciation) | |||||||||
30 Day Federal Fund Futures | (17 | ) | 11/30/2017 | $ | 354 | |||||||
30 Day Federal Fund Futures | 23 | 05/31/2017 | (667 | ) | ||||||||
90 Day Euro Futures | 91 | 12/18/2017 | 15,952 | |||||||||
United States Treasury Note 6%-2 year | (1 | ) | 06/30/2017 | (16 | ) | |||||||
United States Treasury Note 6%-5 year | (52 | ) | 06/30/2017 | (3,906 | ) | |||||||
United States Treasury Note 6%-10 year | 113 | 06/21/2017 | (59,750 | ) | ||||||||
United States Treasury Note 6%-30 year | 30 | 06/21/2017 | 160,664 | |||||||||
United States Treasury Note 6%-Ultra Long | (36 | ) | 06/21/2017 | (16,875 | ) | |||||||
United States Treasury Note 6%-Ultra Long | (129 | ) | 06/21/2017 | (46,078 | ) | |||||||
| $ | 49,678 | |||||||||||
At April 30, 2017, the Fund’s open forward foreign currency exchange contracts were as follows:
| Purchase Contracts Settlement Date* | Counterparty | Amount Purchased | Amount Sold | Fair Value | Unrealized Appreciation/ (Depreciation) | |||||||||||||||||||||||
| Australian Dollar/United States Dollar | ||||||||||||||||||||||||||||
07/17/2017 | Goldman Sachs | AUD | 607,173 | USD | 451,791 | $ | 454,063 | $ | 2,272 | |||||||||||||||||||
| Canadian Dollar/United States Dollar | ||||||||||||||||||||||||||||
07/05/2017 | Goldman Sachs | CAD | 5,116,430 | USD | 3,751,874 | 3,751,709 | (165 | ) | ||||||||||||||||||||
07/05/2017 | HSBC Bank | CAD | 4,045,628 | USD | 3,011,745 | 2,966,525 | (45,220 | ) | ||||||||||||||||||||
| Chilean Peso/United States Dollar | ||||||||||||||||||||||||||||
06/19/2017 | Citibank | CLP | 3,094,050,000 | USD | 4,650,609 | 4,625,510 | (25,099 | ) | ||||||||||||||||||||
See accompanying Notes to Financial Statements.
| 24 | Semi-Annual Report 2017 |
Statement of Investments (continued)
April 30, 2017 (Unaudited)
Aberdeen Total Return Bond Fund
| Purchase Contracts Settlement Date* | Counterparty | Amount Purchased | Amount Sold | Fair Value | Unrealized Appreciation/ (Depreciation) | |||||||||||||||||||||||
| Colombian Peso/United States Dollar | ||||||||||||||||||||||||||||
05/05/2017 | Citibank | COP | 6,316,320,000 | USD | 2,196,217 | $ | 2,146,072 | $ | (50,145 | ) | ||||||||||||||||||
06/20/2017 | Citibank | COP | 13,775,810,000 | USD | 4,630,525 | 4,648,886 | 18,361 | |||||||||||||||||||||
| Euro/United States Dollar | ||||||||||||||||||||||||||||
05/22/2017 | UBS | EUR | 990,000 | USD | 1,076,191 | 1,079,389 | 3,198 | |||||||||||||||||||||
| Hong Kong Dollar/United States Dollar | ||||||||||||||||||||||||||||
05/22/2017 | Goldman Sachs | HKD | 36,240,000 | USD | 4,674,156 | 4,660,915 | (13,241 | ) | ||||||||||||||||||||
06/13/2017 | HSBC Bank | HKD | 36,152,000 | USD | 4,661,204 | 4,651,732 | (9,472 | ) | ||||||||||||||||||||
| Indian Rupee/United States Dollar | ||||||||||||||||||||||||||||
05/08/2017 | Barclays Bank | INR | 347,330,901 | USD | 5,114,577 | 5,394,713 | 280,136 | |||||||||||||||||||||
| Indonesian Rupiah/United States Dollar | ||||||||||||||||||||||||||||
06/13/2017 | HSBC Bank | IDR | 65,587,510,000 | USD | 4,877,120 | 4,898,638 | 21,518 | |||||||||||||||||||||
| Malaysian Ringgit/United States Dollar | ||||||||||||||||||||||||||||
05/22/2017 | Barclays Bank | MYR | 15,550,000 | USD | 3,577,591 | 3,578,820 | 1,229 | |||||||||||||||||||||
| Mexican Peso/United States Dollar | ||||||||||||||||||||||||||||
05/05/2017 | Goldman Sachs | MXN | 82,580,000 | USD | 4,414,166 | 4,385,064 | (29,102 | ) | ||||||||||||||||||||
06/23/2017 | Goldman Sachs | MXN | 90,530,000 | USD | 4,706,615 | 4,768,488 | 61,873 | |||||||||||||||||||||
| New Zealand Dollar/United States Dollar | ||||||||||||||||||||||||||||
06/01/2017 | Goldman Sachs | NZD | 277,456 | USD | 191,986 | 190,354 | (1,632 | ) | ||||||||||||||||||||
06/01/2017 | HSBC Bank | NZD | 7,757,118 | USD | 5,431,505 | 5,321,910 | (109,595 | ) | ||||||||||||||||||||
06/01/2017 | Royal Bank of Canada | NZD | 1,680,061 | USD | 1,174,891 | 1,152,636 | (22,255 | ) | ||||||||||||||||||||
06/01/2017 | UBS | NZD | 5,778,892 | USD | 3,957,159 | 3,964,712 | 7,553 | |||||||||||||||||||||
| Norwegian Krone/United States Dollar | ||||||||||||||||||||||||||||
06/12/2017 | UBS | NOK | 39,777,887 | USD | 4,706,344 | 4,635,062 | (71,282 | ) | ||||||||||||||||||||
| South African Rand/United States Dollar | ||||||||||||||||||||||||||||
05/05/2017 | Barclays Bank | ZAR | 89,235,000 | USD | 6,714,200 | 6,675,059 | (39,141 | ) | ||||||||||||||||||||
| South Korean Won/United States Dollar | ||||||||||||||||||||||||||||
| 05/22/2017 | HSBC Bank | KRW | 5,365,320,000 | USD | 4,731,323 | 4,716,022 | (15,301 | ) | ||||||||||||||||||||
| $ | 78,666,279 | $ | (35,510 | ) | ||||||||||||||||||||||||
| Sale Contracts Settlement Date* | Counterparty | Amount Purchased | Amount Sold | Fair Value | Unrealized Appreciation/ (Depreciation) | |||||||||||||||||||||||
| United States Dollar/Australian Dollar | ||||||||||||||||||||||||||||
07/17/2017 | HSBC Bank | USD | 4,525,960 | AUD | 5,976,877 | $ | 4,469,696 | $ | 56,264 | |||||||||||||||||||
| United States Dollar/Canadian Dollar | ||||||||||||||||||||||||||||
07/05/2017 | Barclays Bank | USD | 7,007,655 | CAD | 9,353,766 | 6,858,806 | 148,849 | |||||||||||||||||||||
07/05/2017 | Citibank | USD | 5,196,978 | CAD | 6,951,088 | 5,097,002 | 99,976 | |||||||||||||||||||||
07/05/2017 | Westpac Banking Corp. | USD | 5,196,842 | CAD | 6,951,088 | 5,097,002 | 99,840 | |||||||||||||||||||||
| United States Dollar/Chilean Peso | ||||||||||||||||||||||||||||
06/19/2017 | Citibank | USD | 6,413,645 | CLP | 4,280,380,000 | 6,399,037 | 14,608 | |||||||||||||||||||||
| United States Dollar/Colombian Peso | ||||||||||||||||||||||||||||
05/05/2017 | Citibank | USD | 2,193,166 | COP | 6,316,320,000 | 2,146,072 | 47,094 | |||||||||||||||||||||
06/20/2017 | Citibank | USD | 6,449,651 | COP | 19,031,840,000 | 6,422,624 | 27,027 | |||||||||||||||||||||
| United States Dollar/Euro | ||||||||||||||||||||||||||||
05/22/2017 | HSBC Bank | USD | 4,517,373 | EUR | 4,234,020 | 4,616,319 | (98,946 | ) | ||||||||||||||||||||
| United States Dollar/Indian Rupee | ||||||||||||||||||||||||||||
05/08/2017 | Barclays Bank | USD | 2,572,441 | INR | 173,665,451 | 2,697,357 | (124,916 | ) | ||||||||||||||||||||
05/08/2017 | Citibank | USD | 2,566,169 | INR | 173,665,450 | 2,697,357 | (131,188 | ) | ||||||||||||||||||||
See accompanying Notes to Financial Statements.
| 2017 Semi-Annual Report | 25 |
Statement of Investments (concluded)
April 30, 2017 (Unaudited)
Aberdeen Total Return Bond Fund
| Sale Contracts Settlement Date* | Counterparty | Amount Purchased | Amount Sold | Fair Value | Unrealized Appreciation/ (Depreciation) | |||||||||||||||||||||||
| United States Dollar/Indonesian Rupiah | ||||||||||||||||||||||||||||
06/13/2017 | Barclays Bank | USD | 4,835,054 | IDR | 65,587,510,000 | $ | 4,898,638 | $ | (63,584 | ) | ||||||||||||||||||
| United States Dollar/Mexican Peso | ||||||||||||||||||||||||||||
05/05/2017 | Goldman Sachs | USD | 4,371,734 | MXN | 82,580,000 | 4,385,064 | (13,330 | ) | ||||||||||||||||||||
06/23/2017 | Goldman Sachs | USD | 4,668,901 | MXN | 90,530,000 | 4,768,488 | (99,587 | ) | ||||||||||||||||||||
| United States Dollar/New Zealand Dollar | ||||||||||||||||||||||||||||
06/01/2017 | Goldman Sachs | USD | 1,569,531 | NZD | 2,179,087 | 1,495,002 | 74,529 | |||||||||||||||||||||
06/01/2017 | HSBC Bank | USD | 7,578,138 | NZD | 10,525,556 | 7,221,247 | 356,891 | |||||||||||||||||||||
06/01/2017 | Royal Bank of Canada | USD | 7,578,663 | NZD | 10,525,555 | 7,221,246 | 357,417 | |||||||||||||||||||||
06/01/2017 | Westpac Banking Corp. | USD | 7,578,663 | NZD | 10,525,555 | 7,221,246 | 357,417 | |||||||||||||||||||||
| United States Dollar/Norwegian Krone | ||||||||||||||||||||||||||||
06/12/2017 | Barclays Bank | USD | 4,625,546 | NOK | 39,777,887 | 4,635,062 | (9,516 | ) | ||||||||||||||||||||
06/12/2017 | UBS | USD | 4,737,734 | NOK | 40,000,000 | 4,660,944 | 76,790 | |||||||||||||||||||||
| United States Dollar/South African Rand | ||||||||||||||||||||||||||||
05/05/2017 | Barclays Bank | USD | 2,197,044 | ZAR | 29,745,000 | 2,225,020 | (27,976 | ) | ||||||||||||||||||||
05/05/2017 | UBS | USD | 4,365,070 | ZAR | 59,490,000 | 4,450,039 | (84,969 | ) | ||||||||||||||||||||
06/05/2017 | Barclays Bank | USD | 5,355,544 | ZAR | 71,564,000 | 5,324,702 | 30,842 | |||||||||||||||||||||
| United States Dollar/South Korean Won | ||||||||||||||||||||||||||||
05/22/2017 | Goldman Sachs | USD | 1,781,341 | KRW | 2,021,020,000 | 1,776,441 | 4,900 | |||||||||||||||||||||
05/22/2017 | HSBC Bank | USD | 4,745,173 | KRW | 5,365,320,000 | 4,716,022 | 29,151 | |||||||||||||||||||||
| 05/22/2017 | JPMorgan Chase | USD | 1,785,110 | KRW | 2,027,260,000 | 1,781,926 | 3,184 | |||||||||||||||||||||
| $ | 113,282,359 | $ | 1,130,767 | |||||||||||||||||||||||||
| * | Certain contracts with different trade dates and like characteristics have been shown net. |
At April 30, 2017, the Fund’s centrally cleared interest rate swaps were as follows:
| Currency | Notional Amount | Expiration Date | Receive (Pay) Floating Rate | Floating Rate Index | Fixed Rate | Unrealized Depreciation | ||||||||||||||||
| USD | $ | 22,950,000 | 09/06/2018 | Pay | 3-month LIBOR Index | 1.03% | $ | (134,775 | ) | |||||||||||||
| $ | (134,775 | ) | ||||||||||||||||||||
See accompanying Notes to Financial Statements.
| 26 | Semi-Annual Report 2017 |
Aberdeen Global High Income Fund (Unaudited)
The Aberdeen Global High Income Fund (Institutional Class shares net of fees) returned 5.43% for the six-month period ended April 30, 2017, versus the 5.45% return of its benchmark, the Bank of America Merrill Lynch (BofA ML) Global High Yield Constrained Index (hedged to U.S. dollars), during the same period. For broader comparison, the average return of the peer category of High Yield Funds (comprising 224 funds), as measured by Lipper, Inc., was 4.79% for the period.
Global high-yield markets experienced strong performance for the sixth-month period ended April 30, 2017, continuing a rally that began in early 2016. The U.S. high-yield market led the way, returning 5.49% for the period1. Investors’ enthusiasm for risk assets in the U.S. was stoked by the election of Donald Trump as president in November 2016, given heightened expectations for fiscal stimulus to support the U.S. economy. The rally was all the more impressive, in our view, as it occurred in the face of two hikes in the federal funds rate by the U.S. Federal Reserve (Fed) in December 2016 and March 2017, despite the threat of an impending unwinding of the Fed’s balance sheet.2 The yield on the five-year U.S. Treasury note rose by 50 basis points (bps) to 1.82% over the reporting period. Investors’ thirst for yield was clearly evident throughout the period, given the continued outperformance of lower-rated credits as CCC-rated3 issues notably outperformed their higher-rated counterparts, gaining 10.14% in the period as compared to 3.87% for more conservative BB-rated credit.4 Market strength was broad-based across industry sectors as the transportation, coal and telecommunications sectors were among the strongest performers, while retail, struggling with the damaging impact of online competition, was the sole sector to record a negative total return for the period. The U.S. high-yield market performance for the reporting period was further supported by a benign technical environment which saw a comparatively high percentage of new issuance earmarked for call5 and tender6 purposes as opposed to net new supply, slightly offset by somewhat negative flows out of the asset class over the reporting period. The market’s performance for the period also was bolstered by a relatively low “cost of default” as an open financing window and adequate macroeconomic backdrop buoyed issuers and drove the par-weighted default rate7 down to 1.4% versus 3.6% at the beginning of the period.8
High-yield markets outside the U.S. also performed well during the reporting period. European high yield returned 4.65%9 despite investors’ concerns over national elections in France and The Netherlands, which were widely viewed as referendums on the European Union, as well as higher government interest rates as the Eurozone economy improved and investors began to brace for the beginning of the European Central Bank’s (ECB) tapering of its bond purchase program. Emerging-market corporate credit maintained its strong performance, returning 5.82%10 over the reporting period as commodities, if not oil, rallied, as measured by the 5.20% return for the Commodity Research Bureau BLS/U.S. Spot All Commodities Index11 for the period.
The Fund performed in line with its benchmark, the BofA ML Global High Yield Constrained Index (hedged to U.S. dollars), for the reporting period. Overall sector allocation weighed on Fund performance while security selection was a positive contributor during the period in a reversal from Fund results for the 12-month period ended October 31, 2016. The Fund’s 3.8% average cash position over the period served as a significant drag on performance amid the strong market rally. Similarly, the Fund’s slight underweight relative to the benchmark index to the energy sector, one of the strongest market performers for the reporting period, detracted from performance. Additionally, a one-time pricing adjustment12 had a slightly negative impact on performance.
Fund performance benefited substantially from the holding of the stock of oil services company DeepOcean in the period as the company was purchased at $2.86 per share – a significant premium to the then-current share price. Fund performance also was bolstered
| 1 | As measured by the BofA ML CCC and Lower U.S. High Yield Constrained Index, which is a subset of the BofA Merrill Lynch U.S. High Yield Index and includes all securities in the BofA ML U.S. High Yield Index rated CCC and lower by Standard & Poor’s (or equivalent as rated by Moody’s or Fitch). The BofA ML U.S. High Yield Index tracks the performance of U.S. dollar-denominated below investment-grade corporate debt publicly issued in the U.S. domestic market. |
| 2 | Unwinding refers to the U.S. Federal Reserve’s process of reducing its balance sheet through the sale of securities. |
| 3 | Standard & Poor’s credit ratings express the agency’s opinion about the ability and willingness of an issuer, such as a corporation or state or city government, to meet its financial obligations in full and on time. Typically, ratings are expressed as letter grades that range, for example, from “AAA” to “D” to communicate the agency’s opinion of relative level of credit risk. Ratings from “AA” to “CCC” may be modified by the addition of a plus (+) or minus (-) sign to show relative standing within the major rating categories. |
| 4 | The performance of CCC rated securities is measured by the BofA ML CCC and Lower U.S. High Yield Constrained Index, which is a subset of the BofA Merrill Lynch U.S. High Yield Index and includes all securities in the BofA ML U.S. High Yield Index rated CCC and lower by Standard & Poor’s (or equivalent as rated by Moody’s or Fitch). The BofA ML U.S. High Yield Index tracks the performance of U.S. dollar-denominated below investment-grade corporate debt publicly issued in the U.S. domestic market. The performance of BB rated credit is measured by the BofA ML BB U.S. High Yield Constrained Index, which is a subset of the BofA Merrill Lynch U.S. High Yield Index and includes all securities in the BofA ML U.S. High Yield Index rated BB+ through BB- by Standard & Poor’s (or equivalent as rated by Moody’s or Fitch). |
| 5 | A call provision allows the original issuer of a bond to repurchase and retire the bonds within a specified time frame and price to be paid to bondholders. |
| 6 | A tender offer an offer provides an opportunity for debtholders to repurchase a predetermined number of bonds at a specified price during a specific period of time. |
| 7 | The par-weighted default rate is calculated by dividing the dollar value of high-yield issues in default by the total dollar value of the overall market. |
| 8 | Source: J.P. Morgan High Yield Market Monitor, May 1, 2017. |
| 9 | As measured by the BofA ML Euro High Yield Constrained Index (hedged to U.S. dollars), which tracks the performance of euro- and sterling-denominated below-investment-grade corporate debt publicly issued in the eurobond, sterling domestic or euro domestic markets. |
| 10 | As measured by the BofA ML High Yield US Emerging Markets Corporate Plus Index, which tracks the performance of U.S. dollar-denominated below investment grade emerging markets corporate debt publicly issued in the U.S. domestic or eurobond market. |
| 11 | The Commodity Research Bureau BLS/U.S. Spot All Commodities Index is a measure of price movements of 22 sensitive basic commodities whose markets typically are among the first to be influenced by changes in economic conditions. |
| 2017 Semi-Annual Report | 27 |
Aberdeen Global High Income Fund (Unaudited) (continued)
by bond holdings in Northwest Hardwoods, a lumber processing concern, as the company’s operations improved and liquidity returned to the market. New World Gaming, a Canadian casino operator, was another contributor to performance as its bonds were refinanced at a premium price. Major detractors from Fund performance included the overweight position relative to the benchmark in the distressed securities13 of healthcare company Valeant Pharmaceuticals, as well as holdings in upscale retailer Neiman Marcus and distressed bonds issued by the Eastern European retailer Agrokor.
During the reporting period, we initiated several new positions, including retail pharmacy operator Rite Aid, auto parts supplier American Axle, and energy company Cheniere Corpus Christi. We exited the Fund’s positions in financial services provider Ally Financial, Argentina government bonds, and perpetual securities14 issued by Royal Bank of Scotland. At the end of the reporting period on April 30, 2017, we maintained the Fund’s underweight allocation to BB rated issues relative to the benchmark BofA ML Global High Yield Constrained Index (hedged to U.S. dollars) and the overweight to B rated credits. The Fund was slightly overweight to CCC rated credit. By geographic regions, the Fund was slightly underweight to Eastern Europe and Asian credit versus the benchmark, while modestly overweight to Europe and Canada. The Fund’s cash position stood at 6.6% of net assets at the end of the period. Regarding sector allocations, the Fund was slightly underweight to the banking and basic industry and technology sectors, with marginal overweights in telecommunications and media.
The Fund employs derivatives, including foreign exchange forwards15 and credit default swaps.16 The Fund utilizes foreign exchange forwards to hedge its exposure to changes in the value of its holdings due to movements in currency exchange rates. The Fund uses credit default swaps to gain, or hedge, exposure to specific companies. The Fund also employs credit default swaps on indices primarily for the purpose of managing market exposure. The derivatives positions did not have a significant impact on Fund performance for the reporting period.
We believe that the global environment for credit is favorable, although valuations have moved quickly to discount the positive conditions. In our view, emerging markets continue to demonstrate a structurally higher economic growth rate than that of their developed-market counterparts, and U.S. interest-rate hikes are not causing the turmoil that some market observers had predicted. We feel that the recent credit default cycle in the U.S. energy and commodity sectors most likely will result in a cathartic cleansing of the weakest corporate balance sheets. While pockets of weakness exist (e.g., U.S. retailers), the bulk of the market remains in good shape, in our opinion. Europe maintains its overall economic recovery, and while the ECB would like to start to taper monetary policy, we think that low economic growth and high structural unemployment limit its ability to be too hawkish.
The global high-yield market recently has experienced strong performance. In the context of low and declining default rates, we believe that the asset class still provides investors with the ability to generate decent returns – especially in the context of an ongoing low-yielding environment.
Portfolio Management:
Aberdeen North American Fixed Income Team
PAST PERFORMANCE DOES NOT GUARANTEE FUTURE RESULTS.
The performance quoted represents past performance, which does not guarantee future results. Class A shares have up to a 0.25% 12b-1 fee. The investment return and principal value of an investment will fluctuate so that an investor’s shares, when redeemed, may be worth more or less than their original cost. Current performance of the Fund may be lower or higher than the performance quoted. Performance data current to the most recent month-end may be obtained by calling 866-667-9231 or visiting www.aberdeen-asset.us.
Investing in mutual funds involves risk, including the possible loss of principal. There is no assurance that the investment objective of any fund will be achieved. Indexes are unmanaged and have been provided for comparison purposes only. No fees or expenses are reflected. You cannot invest directly in an index.
Lipper is a leading global provider of mutual fund information and analysis to fund companies, financial intermediaries and media organizations.
Risk Considerations
Fixed income securities are subject to certain risks including, but not limited to: interest rate (changes in interest rates may cause a decline in the market value of an investment), credit (changes in the financial condition of the issuer, borrower, counterparty, or underlying collateral), prepayment (debt issuers may repay or refinance their loans or obligations earlier than anticipated), and extension (principal repayments may not occur as quickly as anticipated, causing the expected maturity of a security to increase).
Non-investment-grade debt securities (high yield/junk bonds) may be subject to greater market fluctuations, risk of default or loss of income and principal than higher-rated securities.
Derivatives are speculative and may hurt the Fund’s performance. They present the risk of disproportionately increased losses and/or reduced gains when the financial asset or measure to which the derivative is linked changes in unexpected ways.
Foreign securities may be more volatile, harder to price and less liquid than U.S. securities. They are subject to different accounting and regulatory standards and currency exchange rate, political and
| 12 | There was a $0.02 per share reduction in the daily net asset value from February 17 to February 21, 2017. In addition to reflecting normal market movements and Fund performance, this reduction reflected an accounting adjustment related to a change in the Fund’s valuation procedures, which now align with the valuation procedures across Aberdeen’s fund range. |
| 13 | Distressed securities are those issued by companies that are near to or currently going through bankruptcy. |
| 14 | Perpetual securities are bonds with no maturity date. |
| 15 | A foreign exchange forward is a binding contract in the foreign exchange market that locks in the exchange rate for the purchase or sale of a currency on a future date. |
| 16 | A credit default swap protects a lender in the event of default on the part of the borrower by transferring the associated risk in return for periodic income payments. |
| 28 | Semi-Annual Report 2017 |
Aberdeen Global High Income Fund (Unaudited) (concluded)
economic risks. Fluctuation in currency exchange rates may impact a Fund’s returns more greatly to the extent a Fund does not hedge currency exposure or hedging techniques are unsuccessful. The foregoing risks are enhanced in emerging market countries.
Investing a significant portion of the Fund’s assets in securities of companies conducting business in a broadly related group of industries within an economic sector may make the Fund more vulnerable to unfavorable developments in that sector.
Please read the prospectus for more detailed information regarding these and other risks.
| 2017 Semi-Annual Report | 29 |
Aberdeen Global High Income Fund (Unaudited)
| Average Annual Total Return (For periods ended April 30, 2017) | Six Month† | 1 Yr. | 5 Yr. | 10 Yr. | ||||||||||
Class A | 5.31% | 10.51% | 4.23% | 5.57% | ||||||||||
Institutional Class | 5.43% | 10.72% | 4.49% | 5.84% | ||||||||||
| † | Not Annualized |
| 30 | Semi-Annual Report 2017 |
Aberdeen Global High Income Fund (Unaudited)
Performance of a $10,000 Investment (as of April 30, 2017)

Comparative performance of $10,000 invested in Class A shares of the Aberdeen Global High Income Fund, Bank of America Merrill Lynch Global High Yield Constrained Index (hedged to the U.S. Dollar) and the Consumer Price Index (CPI) over a 10-year period ended April 30, 2017. Unlike the Fund’s returns, the returns for these unmanaged indexes do not reflect any fees or expenses. Investors cannot invest directly in market indexes.
The Bank of America Merrill Lynch Global High Yield Constrained Index (hedged to the U.S. Dollar) tracks the performance of USD, CAD, GBP and EUR denominated below investment grade corporate debt publicly issued in the major domestic or eurobond markets but caps issuer exposure at 2%.
The CPI is a measure of the average change over time in the prices paid by urban consumers for a market basket of consumer goods and services.
Investment return and principal value will fluctuate, and when redeemed, shares may be worth more or less than original cost. Past performance is no guarantee of future results. The Average Annual Total Return table and performance graph do not reflect the deduction of taxes that a shareholder would pay on Fund distributions or the redemption of Fund shares. Investing in mutual funds involves market risk, including loss of principal. Performance returns assume the reinvestment of all distributions. Performance returns reflect fee waivers and reimbursements in effect without which returns would have been lower.
Portfolio Summary (as a percentage of net assets)
April 30, 2017 (Unaudited)
| Asset Allocation | ||||
Corporate Bonds | 91.7% | |||
Short-Term Investment | 6.1% | |||
Bank Loans | 1.8% | |||
Government Bonds | 0.4% | |||
Liabilities in Excess of Other Assets | –% | |||
| 100.0% | ||||
| Amounts | listed as “–” are 0% or round to 0% |
The following chart summarizes the composition of the Fund’s portfolio, expressed as a percentage of net assets. The industries listed below may include more than one industry group. As of April 30, 2017, the Fund did not have more than 25% of its assets invested in any industry group.
| Top Industries | ||||
Oil, Gas & Consumable Fuels | 12.5% | |||
Diversified Telecommunication Services | 10.2% | |||
Media | 7.1% | |||
Commercial Banks | 5.4% | |||
Commercial Services & Supplies | 4.4% | |||
Entertainment | 3.6% | |||
Retail | 3.6% | |||
Food Products | 3.5% | |||
Diversified Financial Services | 3.5% | |||
Electric Utilities | 3.1% | |||
Other | 43.1% | |||
| 100.0% | ||||
| Top Holdings* | ||||
Petrobras Global Finance BV 01/27/2021 | 1.7% | |||
Ziggo Secured Finance BV 01/15/2027 | 1.6% | |||
CCO Holdings LLC / CCO Holdings Capital Corp. 02/15/2026 | 1.6% | |||
Cengage Learning, Inc. 06/15/2024 | 1.3% | |||
American Axle & Manufacturing, Inc. 04/01/2025 | 1.3% | |||
Tenet Healthcare Corp. 06/15/2023 | 1.3% | |||
Sprint Corp. 09/15/2023 | 1.3% | |||
Gardner Denver, Inc. 08/15/2021 | 1.2% | |||
Nemean Bondco PLC 02/01/2024 | 1.2% | |||
United Rentals North America, Inc. 07/15/2025 | 1.2% | |||
Other | 86.3% | |||
| 100.0% | ||||
| * | For the purpose of listing top holdings, Short-Term Investments are included as part of Other. |
| Top Countries | ||||
United States | 56.0% | |||
United Kingdom | 7.3% | |||
Canada | 5.2% | |||
Brazil | 3.8% | |||
Germany | 3.4% | |||
Netherlands | 3.2% | |||
France | 3.0% | |||
Italy | 2.5% | |||
Spain | 2.0% | |||
Russia | 1.6% | |||
Other | 12.0% | |||
| 100.0% | ||||
| 2017 Semi-Annual Report | 31 |
Statement of Investments
April 30, 2017 (Unaudited)
Aberdeen Global High Income Fund
| Shares or Principal Amount | Value (US$) | |||||||
CORPORATE BONDS (91.7%) | ||||||||
ARGENTINA (0.6%) | ||||||||
Banco de Galicia y Buenos Aires SA (USD), | $ | 550,000 | $ | 601,387 | ||||
Cablevision SA (USD), 6.50%, 06/15/2021 (a) | 1,031,000 | 1,098,015 | ||||||
IRSA Propiedades Comerciales SA (USD), | 535,000 | 599,200 | ||||||
| 2,298,602 | ||||||||
BRAZIL (3.8%) | ||||||||
Banco do Brasil SA (USD), 9.00%, 06/18/2024 (a)(b)(c) | 2,000,000 | 2,108,000 | ||||||
JBS USA LUX SA / JBS USA Finance, Inc. (USD), | 1,435,000 | 1,481,638 | ||||||
Petrobras Global Finance BV | ||||||||
(USD), 5.38%, 01/27/2021 | 6,905,000 | 7,093,852 | ||||||
(USD), 6.25%, 03/17/2024 | 1,785,000 | 1,846,582 | ||||||
(USD), 8.75%, 05/23/2026 | 2,000,000 | 2,332,000 | ||||||
QGOG Constellation SA (USD), | 1,140,000 | 826,500 | ||||||
| 15,688,572 | ||||||||
CANADA (5.2%) | ||||||||
Bombardier, Inc. (USD), 5.75%, 03/15/2022 (a) | 705,000 | 699,713 | ||||||
First Quantum Minerals Ltd. (USD), | 1,300,000 | 1,323,563 | ||||||
Gateway Casinos & Entertainment Ltd. (USD), | 4,725,000 | 4,831,312 | ||||||
GFL Environmental, Inc. (USD), | 3,235,000 | 3,477,625 | ||||||
MEG Energy Corp. | ||||||||
(USD), 6.38%, 01/30/2023(a) | 5,164,000 | 4,544,320 | ||||||
(USD), 6.50%, 01/15/2025(a) | 1,014,000 | 1,001,325 | ||||||
SCM Insurance Services, Inc. (CAD), | 7,230,000 | 1,853,778 | ||||||
Teine Energy Ltd. (USD), 6.88%, 09/30/2022 (a) | 526,000 | 536,520 | ||||||
Telesat Canada / Telesat LLC (USD), | 2,885,000 | 3,173,500 | ||||||
| 21,441,656 | ||||||||
CHILE (1.3%) | ||||||||
Latam Finance Ltd. (USD), 6.88%, 04/11/2024 (a) | 1,172,000 | 1,190,752 | ||||||
VTR Finance BV (USD), 6.88%, 01/15/2024 (a) | 3,935,000 | 4,180,938 | ||||||
| 5,371,690 | ||||||||
DOMINICAN REPUBLIC (0.5%) | ||||||||
AES Andres BV / Dominican Power Partners / Empresa Generadora de Electricidad It (USD), 7.95%, 05/11/2026 (a) | 1,765,000 | 1,900,340 | ||||||
EL SALVADOR (0.1%) | ||||||||
AES El Salvador Trust II (USD), 6.75%, 03/28/2023 (a) | 500,000 | 454,250 | ||||||
FRANCE (3.0%) | ||||||||
HomeVi SAS (EUR), 6.88%, 08/15/2021 (a) | 1,173,000 | 1,339,921 | ||||||
La Financiere Atalian SAS (EUR), 4.00%, 05/15/2024 (a) | $ | 1,642,000 | $ | 1,788,630 | ||||
SFR Group SA (USD), 6.00%, 05/15/2022 (a) | 3,983,000 | 4,152,277 | ||||||
SFR Group SA (USD), 7.38%, 05/01/2026 (a) | 978,000 | 1,028,123 | ||||||
SPCM SA (USD), 4.88%, 09/15/2025 (a) | 4,200,000 | 4,247,250 | ||||||
| 12,556,201 | ||||||||
GEORGIA (0.1%) | ||||||||
BGEO Group JSC (USD), 6.00%, 07/26/2023 (a) | 500,000 | 503,125 | ||||||
GERMANY (3.4%) | ||||||||
ALBA Group PLC & Co. KG (EUR), | 4,375,000 | 4,757,251 | ||||||
PrestigeBidCo GmbH (EUR), 6.25%, 12/15/2023 (a) | 837,000 | 966,448 | ||||||
Safari Holding Verwaltungs GmbH (EUR), | 1,970,458 | 2,226,696 | ||||||
Senvion Holding GmbH (EUR), 3.88%, 10/25/2022 (a) | 2,586,000 | 2,821,577 | ||||||
Unitymedia Hessen GmbH & Co. KG / Unitymedia NRW GmbH (USD), | 3,125,000 | 3,253,906 | ||||||
| 14,025,878 | ||||||||
GUATEMALA (0.3%) | ||||||||
Cementos Progreso Trust (USD), 7.13%, 11/06/2023 (a) | 545,000 | 577,700 | ||||||
Industrial Senior Trust (USD), 5.50%, 11/01/2022 (a) | 500,000 | 506,875 | ||||||
| 1,084,575 | ||||||||
HUNGARY (0.1%) | ||||||||
Nitrogenmuvek Vegyipari Zrt (USD), 7.88%, 05/21/2020 (a) | 500,000 | 527,350 | ||||||
ITALY (1.8%) | ||||||||
Snaitech SpA (EUR), 6.38%, 11/07/2021 (a) | 436,000 | 505,406 | ||||||
Wind Acquisition Finance SA | ||||||||
(USD), 4.75%, 07/15/2020(a) | 2,235,000 | 2,268,525 | ||||||
(USD), 7.38%, 04/23/2021(a) | 4,623,000 | 4,807,920 | ||||||
| 7,581,851 | ||||||||
JERSEY (1.2%) | ||||||||
Nemean Bondco PLC (GBP), 7.38%, 02/01/2024 (a) | 3,920,000 | 5,089,874 | ||||||
KAZAKHSTAN (0.3%) | ||||||||
KazMunayGas National Co. JSC (USD), | 500,000 | 548,887 | ||||||
Zhaikmunai LLP (USD), 6.38%, 02/14/2019 (a) | 620,000 | 604,809 | ||||||
| 1,153,696 | ||||||||
LUXEMBOURG (1.4%) | ||||||||
Accudyne Industries Borrower / Accudyne Industries LLC (USD), 7.75%, 12/15/2020 (a) | 856,000 | 858,140 | ||||||
Altice Financing SA (USD), 7.50%, 05/15/2026 (a) | 1,840,000 | 1,987,200 | ||||||
See accompanying Notes to Financial Statements.
| 32 | Semi-Annual Report 2017 |
Statement of Investments (continued)
April 30, 2017 (Unaudited)
Aberdeen Global High Income Fund
| Shares or Principal Amount | Value (US$) | |||||||
ARD Finance SA (USD), 7.13%, 09/15/2023 (a)(f) | $ | 1,200,000 | $ | 1,245,000 | ||||
Mitsubishi UFJ Investor Services & Banking Luxembourg SA, Series PRX (EUR), | 3,100,000 | 1,724,884 | ||||||
| 5,815,224 | ||||||||
MEXICO (1.1%) | ||||||||
Alfa SAB de CV (USD), 6.88%, 03/25/2044 (a) | 1,288,000 | 1,349,180 | ||||||
BBVA Bancomer SA (USD), 6.75%, 09/30/2022 (a) | 535,000 | 604,978 | ||||||
Cemex SAB de CV (USD), 7.75%, 04/16/2026 (a) | 903,000 | 1,029,420 | ||||||
Elementia SAB de CV (USD), 5.50%, 01/15/2025 (a) | 611,000 | 620,165 | ||||||
Grupo Posadas SAB de CV (USD), 7.88%, 06/30/2022 (a) | 575,000 | 594,406 | ||||||
Petroleos Mexicanos (USD), 5.38%, 03/13/2022 (a) | 560,000 | 588,700 | ||||||
| 4,786,849 | ||||||||
NETHERLANDS (3.2%) | ||||||||
Constellium NV | ||||||||
(USD), 8.00%, 01/15/2023(a) | 3,780,000 | 3,906,630 | ||||||
(USD), 6.63%, 03/01/2025(a) | 533,000 | 525,005 | ||||||
ING Groep NV (USD), 6.50%, 04/16/2025 (b)(c) | 2,027,000 | 2,080,209 | ||||||
Ziggo Secured Finance BV (USD), | 6,420,000 | 6,580,692 | ||||||
| 13,092,536 | ||||||||
NIGERIA (0.4%) | ||||||||
Ihs Netherlands Holdco BV (USD), | 1,075,000 | 1,121,527 | ||||||
Zenith Bank PLC (USD), 6.25%, 04/22/2019 (a) | 585,000 | 595,284 | ||||||
| 1,716,811 | ||||||||
PARAGUAY (0.1%) | ||||||||
Banco Regional SAECA (USD), 8.13%, 01/24/2019 (a) | 500,000 | 530,000 | ||||||
PERU (0.5%) | ||||||||
Banco Internacional del Peru SAA Interbank (USD), 6.63%, 03/19/2029 (a)(b) | 550,000 | 602,250 | ||||||
InRetail Consumer (USD), 5.25%, 10/10/2021 (a) | 1,290,000 | 1,309,950 | ||||||
InRetail Shopping Malls (USD), | 282,000 | 297,707 | ||||||
| 2,209,907 | ||||||||
REPUBLIC OF IRELAND (0.6%) | ||||||||
Ardagh Packaging Finance PLC / Ardagh Holdings USA, Inc. (USD), 7.25%, 05/15/2024 (a) | 2,235,000 | 2,433,356 | ||||||
RUSSIA (1.6%) | ||||||||
Credit Bank of Moscow Via CBOM Finance PLC (USD), 5.88%, 11/07/2021 (a) | 580,000 | 603,200 | ||||||
EDC Finance DAC (USD), 4.88%, 04/17/2020 (a) | 1,135,000 | 1,164,737 | ||||||
Evraz Group SA (USD), 6.50%, 04/22/2020 (a) | 1,100,000 | 1,175,625 | ||||||
Global Ports Finance PLC (USD), 6.87%, 01/25/2022 (a) | $ | 500,000 | $ | 523,625 | ||||
GTLK Europe DAC (USD), 5.95%, 07/19/2021 (a) | 500,000 | 523,020 | ||||||
Metalloinvest Finance DAC (USD), 5.63%, 04/17/2020 (a) | 500,000 | 530,240 | ||||||
Sberbank of Russia Via SB Capital SA (USD), | 1,030,000 | 1,127,850 | ||||||
Vimpel Communications Via VIP Finance Ireland Ltd. OJSC (USD), 7.75%, 02/02/2021 (a) | 1,035,000 | 1,171,053 | ||||||
| 6,819,350 | ||||||||
SOUTH AFRICA (1.2%) | ||||||||
MTN Mauritius Investment Ltd. (USD), | 1,600,000 | 1,644,800 | ||||||
Petra Diamonds US Treasury PLC (USD), | 1,265,000 | 1,321,925 | ||||||
Sappi Papier Holding GmbH (USD), | 2,017,000 | 2,052,298 | ||||||
| 5,019,023 | ||||||||
SPAIN (2.0%) | ||||||||
Codere Finance 2 Luxembourg SA (EUR), | 2,326,000 | 2,571,717 | ||||||
Obrascon Huarte Lain SA | ||||||||
(EUR), 4.75%, 03/15/2022(a) | 3,371,000 | 3,077,454 | ||||||
(EUR), 5.50%, 03/15/2023(a) | 629,000 | 574,224 | ||||||
OHL Investments SA, Series OHL, (EUR), | 2,000,000 | 2,110,518 | ||||||
| 8,333,913 | ||||||||
SWITZERLAND (0.4%) | ||||||||
UBS Group AG (USD), 7.00%, 02/19/2025 (a)(b)(c) | 1,339,000 | 1,473,235 | ||||||
TURKEY (1.3%) | ||||||||
Akbank T.A.S. (USD), 7.20%, 03/16/2027 (a)(b) | 949,000 | 1,001,814 | ||||||
Turkiye Garanti Bankasi A.S. (USD), | 2,715,000 | 2,883,873 | ||||||
Turkiye Halk Bankasi A.S. (USD), 5.00%, 07/13/2021 (a) | 500,000 | 490,000 | ||||||
Turkiye Sise ve Cam Fabrikalari A.S. (USD), | 500,000 | 500,025 | ||||||
Yasar Holding A.S. (USD), | 500,000 | 511,235 | ||||||
| 5,386,947 | ||||||||
UKRAINE (0.1%) | ||||||||
MHP SA (USD), 8.25%, 04/02/2020 (a) | 500,000 | 520,000 | ||||||
UNITED KINGDOM (7.3%) | ||||||||
Annington Finance No 5 PLC (GBP), 13.00%, 01/15/2023 (a)(f) | 1,867,527 | 2,702,126 | ||||||
Boparan Finance PLC (GBP), 5.50%, 07/15/2021 (a) | 1,995,000 | 2,583,922 | ||||||
Brighthouse Group PLC (GBP), 7.88%, 05/15/2018 (a) | 2,000,000 | 1,991,224 | ||||||
Corral Petroleum Holdings (EUR), 11.75%, 05/15/2021 (a)(f) | 2,290,000 | 2,631,394 | ||||||
See accompanying Notes to Financial Statements.
| 2017 Semi-Annual Report | 33 |
Statement of Investments (continued)
April 30, 2017 (Unaudited)
Aberdeen Global High Income Fund
| Shares or Principal Amount | Value (US$) | |||||||
CYBG PLC (GBP), 8.00%, 12/08/2022 (a)(b)(c) | $ | 2,640,000 | $ | 3,378,773 | ||||
Galaxy Finco Ltd. (GBP), 7.88%, 11/15/2021 (a) | 1,600,000 | 2,108,203 | ||||||
Inmarsat Finance PLC (USD), 4.88%, 05/15/2022 (a) | 3,717,000 | 3,754,170 | ||||||
Matalan Finance PLC (GBP), 6.88%, 06/01/2019 (a) | 2,480,000 | 2,794,252 | ||||||
Nationwide Building Society (GBP), 6.88%, 06/20/2019 (a)(b)(c) | 1,280,000 | 1,715,913 | ||||||
New Look Secured Issuer PLC (GBP), 6.50%, 07/01/2022 (a) | 1,264,000 | 1,432,490 | ||||||
Pizzaexpress Financing 2 PLC (GBP), 6.63%, 08/01/2021 (a) | 1,078,000 | 1,445,095 | ||||||
TVL Finnace PLC (GBP), 8.50%, 05/15/2023 (a) | 892,000 | 1,264,685 | ||||||
Virgin Media Secured Finance PLC (GBP), 5.50%, 01/15/2025 (a) | 1,754,100 | 2,396,864 | ||||||
| 30,199,111 | ||||||||
UNITED STATES (48.8%) | ||||||||
Adient Global Holdings Ltd. (USD), 4.88%, 08/15/2026 (a) | 3,753,000 | 3,762,383 | ||||||
Airxcel, Inc. (USD), 8.50%, 02/15/2022 (a) | 2,055,000 | 2,116,650 | ||||||
Albertsons Cos. LLC / Safeway, Inc. / New Albertson’s, Inc. / Albertson’s LLC | ||||||||
(USD), 6.63%, 06/15/2024(a) | 1,256,000 | 1,284,260 | ||||||
(USD), 5.75%, 03/15/2025(a) | 3,096,000 | 3,010,860 | ||||||
Alliance Data Systems Corp. (USD), 5.88%, 11/01/2021 (a) | 1,125,000 | 1,164,375 | ||||||
Altice US Finance I Corp. (USD), | 2,693,000 | 2,810,819 | ||||||
AMC Entertainment Holdings (GBP), | 1,234,000 | 1,702,583 | ||||||
American Axle & Manufacturing, Inc. (USD), 6.25%, 04/01/2025 (a) | 5,500,000 | 5,472,500 | ||||||
Avis Budget Car Rental LLC / Avis Budget Finance, Inc. |
| |||||||
(USD), 5.50%, 04/01/2023 | 2,427,000 | 2,390,595 | ||||||
(USD), 6.38%, 04/01/2024(a) | 978,000 | 976,778 | ||||||
(USD), 5.25%, 03/15/2025(a) | 423,000 | 398,678 | ||||||
Axalta Coating Systems LLC (USD), | 870,000 | 900,989 | ||||||
Blue Racer Midstream LLC / Blue Racer Finance Corp. (USD), 6.13%, 11/15/2022 (a) | 3,944,000 | 4,042,600 | ||||||
Calpine Corp. (USD), 5.75%, 01/15/2025 | 5,030,000 | 4,866,525 | ||||||
CCO Holdings LLC / CCO Holdings Capital Corp. | ||||||||
(USD), 5.75%, 02/15/2026(a) | 6,058,000 | 6,434,686 | ||||||
(USD), 5.50%, 05/01/2026(a) | 332,000 | 348,394 | ||||||
Cengage Learning, Inc. (USD), 9.50%, 06/15/2024 (a) | 6,071,000 | 5,479,077 | ||||||
CenturyLink, Inc. | ||||||||
Series W (USD), 6.75%, 12/01/2023 | 665,000 | 712,381 | ||||||
Series Y (USD), 7.50%, 04/01/2024 | 1,483,000 | 1,611,294 | ||||||
Cenveo Corp. (USD), 6.00%, 08/01/2019 (a) | 4,097,000 | 3,339,055 | ||||||
Change Healthcare Holdings LLC / Change Healthcare Finance, Inc. (USD), 5.75%, 03/01/2025 (a) | 1,647,000 | 1,690,234 | ||||||
Cheniere Corpus Christi Holdings LLC (USD), | 4,451,000 | 4,740,315 | ||||||
Citgo Holding, Inc. (USD), 10.75%, 02/15/2020 (a) | 2,925,000 | 3,137,063 | ||||||
Continental Resources, Inc. (USD), | $ | 3,952,000 | $ | 3,714,880 | ||||
DPH Holdings Corp. (USD), | 1,500,000 | 70,313 | ||||||
Dynegy, Inc. (USD), 7.38%, 11/01/2022 | 2,840,000 | 2,719,300 | ||||||
EMI Music Publishing Group North America Holdings, Inc. (USD), 7.63%, 06/15/2024 (a) | 3,130,000 | 3,458,650 | ||||||
Endo Dac / Endo Finance LLC / Endo Finco, Inc. | ||||||||
(USD), 6.00%, 07/15/2023(a) | 3,606,000 | 3,159,758 | ||||||
(USD), 5.88%, 10/15/2024(a) | 200,000 | 203,750 | ||||||
Equinix, Inc. (USD), 5.88%, 01/15/2026 | 4,405,000 | 4,746,387 | ||||||
Florida East Coast Holdings Corp. (USD), | 1,553,000 | 1,653,945 | ||||||
Fresh Market, Inc. (The) (USD), 9.75%, 05/01/2023 (a) | 3,025,000 | 2,513,624 | ||||||
Frontier Communications Corp. (USD), | 4,745,000 | 3,951,399 | ||||||
Gardner Denver, Inc. (USD), | 4,930,000 | 5,114,875 | ||||||
General Motors (Escrow Shares) | ||||||||
(USD), 8.80%, 03/01/2049(e) | 7,200,000 | – | ||||||
(USD), 8.38%, 07/15/2049(e) | 3,550,000 | – | ||||||
Goldman Sachs Group, Inc. (The), Series M, (USD), 5.38%, 05/10/2020 (b)(c) | 1,960,000 | 2,032,030 | ||||||
Grinding Media, Inc. / MC Grinding Media Canada, Inc. (USD), 7.38%, 12/15/2023 (a) | 400,000 | 426,720 | ||||||
Hardwoods Acquisition, Inc. (USD), | 3,430,000 | 3,121,300 | ||||||
HD Supply, Inc. (USD), 5.75%, 04/15/2024 (a) | 4,621,000 | 4,909,812 | ||||||
Hilcorp Energy I LP / Hilcorp Finance Co. (USD), | 2,628,000 | 2,549,160 | ||||||
Kratos Defense & Security Solutions, Inc. (USD), | 2,445,000 | 2,451,113 | ||||||
Landry’s, Inc. (USD), 6.75%, 10/15/2024 (a) | 4,185,000 | 4,383,787 | ||||||
Lennar Corp. (USD), 4.50%, 04/30/2024 | 624,000 | 630,240 | ||||||
Level 3 Financing, Inc. | ||||||||
(USD), 5.38%, 08/15/2022 | 2,729,000 | 2,818,238 | ||||||
(USD), 5.38%, 01/15/2024 | 1,000,000 | 1,039,340 | ||||||
Momentive Performance Materials, Inc. (USD), | 14,578,000 | — | ||||||
Nationstar Mortgage LLC / Nationstar Capital Corp. (USD), 6.50%, 07/01/2021 | 2,550,000 | 2,588,250 | ||||||
Neiman Marcus Group Ltd., LLC (USD), | 3,118,000 | 1,824,030 | ||||||
New Enterprise Stone & Lime Co., Inc. (USD), | 805,000 | 853,300 | ||||||
NewStar Financial, Inc. (USD), 7.25%, 05/01/2020 | 2,788,000 | 2,875,125 | ||||||
NRG Energy, Inc. | ||||||||
(USD), 6.63%, 03/15/2023 | 1,074,000 | 1,090,110 | ||||||
(USD), 7.25%, 05/15/2026 | 1,298,000 | 1,327,205 | ||||||
Oasis Petroleum, Inc. | ||||||||
(USD), 6.50%, 11/01/2021 | 993,000 | 1,002,930 | ||||||
(USD), 6.88%, 01/15/2023 | 4,270,000 | 4,312,700 | ||||||
Park-Ohio Industries, Inc. (USD), | 224,000 | 229,600 | ||||||
PBF Logistics LP / PBF Logistics Finance Corp. (USD), 6.88%, 05/15/2023 | 1,767,000 | 1,811,175 | ||||||
See accompanying Notes to Financial Statements.
| 34 | Semi-Annual Report 2017 |
Statement of Investments (continued)
April 30, 2017 (Unaudited)
Aberdeen Global High Income Fund
| Shares or Principal Amount | Value (US$) | |||||||
Post Holdings, Inc. (USD), 5.00%, 08/15/2026 (a) | $ | 3,410,000 | $ | 3,392,950 | ||||
Prestige Brands, Inc. (USD), 6.38%, 03/01/2024 (a) | 428,000 | 457,960 | ||||||
Rite Aid Corp. (USD), 6.13%, 04/01/2023 (a)(b) | 4,500,000 | 4,455,000 | ||||||
Scientific Games International, Inc. (USD), | 1,897,000 | 2,030,966 | ||||||
Service Corp. International (USD), 5.38%, 05/15/2024 | 3,904,000 | 4,123,600 | ||||||
Silgan Holdings, Inc. (EUR), | 2,126,000 | 2,339,010 | ||||||
Sprint Corp. (USD), 7.88%, 09/15/2023 | 4,635,000 | 5,202,787 | ||||||
Sunoco LP / Sunoco Finance Corp. (USD), | 4,339,000 | 4,583,025 | ||||||
T-Mobile USA, Inc. | ||||||||
(USD), 6.00%, 04/15/2024 | 756,000 | 819,126 | ||||||
(USD), 6.50%, 01/15/2026 | 1,876,000 | 2,080,015 | ||||||
Tenet Healthcare Corp. (USD), | 5,506,000 | 5,258,230 | ||||||
TerraForm Power Operating LLC (USD), | 4,732,000 | 4,891,705 | ||||||
Ultra Resources, Inc. (USD), | 2,180,000 | 2,204,525 | ||||||
United Rentals North America, Inc. (USD), | 4,725,000 | 4,942,019 | ||||||
Valeant Pharmaceuticals International, Inc. | ||||||||
(USD), 6.38%, 10/15/2020(a) | 1,745,000 | 1,498,519 | ||||||
(EUR), 4.50%, 05/15/2023(a) | 6,150,000 | 4,707,791 | ||||||
Vector Group Ltd. (USD), 6.13%, 02/01/2025 (a) | 1,885,000 | 1,950,975 | ||||||
Whiting Petroleum Corp. (USD), | 4,550,000 | 4,595,500 | ||||||
WR Grace & Co-Conn (USD), | 1,830,000 | 1,985,550 | ||||||
Zayo Group LLC / Zayo Capital, Inc. (USD), | 4,423,000 | 4,716,024 | ||||||
| 202,211,417 | ||||||||
Total Corporate Bonds | 380,225,339 | |||||||
GOVERNMENT BONDS (0.4%) | ||||||||
PARAGUAY (0.4%) | ||||||||
Paraguay Government International Bond (USD), 5.00%, 04/15/2026 (a) | 1,620,000 | 1,701,000 | ||||||
Total Government Bonds | 1,701,000 | |||||||
BANK LOANS (1.8%) | ||||||||
ITALY (0.7%) | ||||||||
Inter Media Communication (FCE) (EUR), | 2,595,769 | 2,806,364 | ||||||
UNITED STATES (1.1%) | ||||||||
Asurion LLC (USD), 8.50%, 03/03/2021 | 3,936,000 | 3,996,681 | ||||||
Lonestar Intermediate Super Holdings, LLC, Term Loan B (USD), | 800,000 | 830,000 | ||||||
| 4,826,681 | ||||||||
Total Bank Loans | 7,633,045 | |||||||
SHORT-TERM INVESTMENT (6.1%) | ||||||||
UNITED STATES (6.1%) | ||||||||
State Street Institutional U.S. Government Money Market Fund(i) | $ | 25,220,319 | $ | 25,220,319 | ||||
Total Short-Term Investment | 25,220,319 | |||||||
Total Investments | 414,779,703 | |||||||
Liabilities in Excess of Other Assets—0.0% | (88,059 | ) | ||||||
Net Assets—100.0% | $ | 414,691,644 | ||||||
| (a) | Denotes a security issued under Regulation S or Rule 144A. |
| (b) | Variable or Floating Rate Security. Rate disclosed is as of April 30, 2017. |
| (c) | Perpetual bond. This is a bond that has no maturity date, is redeemable and pays a steady stream of interest indefinitely. The maturity date presented for these instruments represents the next call/put date. |
| (d) | The Fund’s adviser has deemed this security to be illiquid based upon procedures approved by the Board of Trustees. Illiquid securities held by the Fund represent 1.36% of net assets as of April 30, 2017. |
| (e) | This security was fair valued by the Fund’s pricing committee as approved by the Fund’s Board of Trustees. See Note 2(a) of the accompanying Notes to Financial Statements. |
| (f) | Payment-in-kind. This is a type of bond that pays interest in additional bonds rather than in cash. |
| (g) | Security is in default. |
| (h) | Indicates a stepped coupon bond. This bond was issued with a low coupon that gradually increases over the life of the bond. |
| (i) | Registered investment company advised by State Street Global Advisors. |
| (j) | See accompanying Notes to Financial Statements for tax unrealized appreciation/(depreciation) of securities. |
| CAD | Canadian Dollar |
| EUR | Euro Currency |
| GBP | British Pound Sterling |
| USD | U.S. Dollar |
See accompanying Notes to Financial Statements.
| 2017 Semi-Annual Report | 35 |
Statement of Investments (concluded)
April 30, 2017 (Unaudited)
Aberdeen Global High Income Fund
At April 30, 2017, the Fund’s open forward foreign currency exchange contracts were as follows:
| Purchase Contracts Settlement Date* | Counterparty | Amount Purchased | Amount Sold | Fair Value | Unrealized Appreciation/ (Depreciation) | |||||||||||||||||||||||
| British Pound/United States Dollar | ||||||||||||||||||||||||||||
06/01/2017 | Citibank | GBP | 4,053,000 | USD | 5,083,609 | $ | 5,253,548 | $ | 169,939 | |||||||||||||||||||
06/01/2017 | HSBC Bank | GBP | 2,575,500 | USD | 3,140,514 | 3,338,395 | 197,881 | |||||||||||||||||||||
06/01/2017 | Royal Bank of Canada | GBP | 2,697,000 | USD | 3,290,105 | 3,495,884 | 205,779 | |||||||||||||||||||||
| Canadian Dollar/United States Dollar | ||||||||||||||||||||||||||||
05/10/2017 | Royal Bank of Canada | CAD | 5,214,000 | USD | 3,914,365 | 3,820,135 | (94,230 | ) | ||||||||||||||||||||
05/10/2017 | UBS | CAD | 167,000 | USD | 124,761 | 122,356 | (2,405 | ) | ||||||||||||||||||||
| Euro/United States Dollar | ||||||||||||||||||||||||||||
05/10/2017 | Citibank | EUR | 10,424,500 | USD | 11,168,747 | 11,359,262 | 190,515 | |||||||||||||||||||||
| 05/10/2017 | Goldman Sachs | EUR | 6,557,000 | USD | 7,042,835 | 7,144,964 | 102,129 | |||||||||||||||||||||
| $ | 34,534,544 | $ | 769,608 | |||||||||||||||||||||||||
| Sale Contracts Settlement Date* | Counterparty | Amount Purchased | Amount Sold | Fair Value | Unrealized Appreciation/ (Depreciation) | |||||||||||||||||||||||
| United States Dollar/British Pound | ||||||||||||||||||||||||||||
06/01/2017 | Citibank | USD | 41,150,457 | GBP | 32,941,000 | $ | 42,698,526 | $ | (1,548,069 | ) | ||||||||||||||||||
| United States Dollar/Canadian Dollar | ||||||||||||||||||||||||||||
05/10/2017 | Royal Bank of Canada | USD | 5,894,887 | CAD | 7,743,500 | 5,673,420 | 221,467 | |||||||||||||||||||||
| United States Dollar/Euro | ||||||||||||||||||||||||||||
05/10/2017 | Citibank | USD | 48,801,226 | EUR | 45,427,000 | 49,500,425 | (699,199 | ) | ||||||||||||||||||||
| 05/10/2017 | Royal Bank of Canada | USD | 1,497,403 | EUR | 1,408,500 | 1,534,800 | (37,397 | ) | ||||||||||||||||||||
| $ | 99,407,171 | $ | (2,063,198 | ) | ||||||||||||||||||||||||
| * | Certain contracts with different trade dates and like characteristics have been shown net. |
At April 30, 2017, the Fund held the following centrally cleared credit default swaps:
Buy Protection:
| Expiration Date | Notional Amount | Receive (Pay) Floating Rate | Credit Index | Fund Pays Fixed Rate | Premiums Paid (Received) | Unrealized Appreciation/ (Depreciation) | Implied Credit Spread* | |||||||||||||||||||||||
| 12/20/2021 | $ | 9,500,000 | Receive | Markit CDX 5-year | Equal to 5.00% | $ | (652,013 | ) | $ | (170,072 | ) | 3.27% | ||||||||||||||||||
| * | Implied credit spreads, represented in absolute terms, are utilized in determining the market value of credit default swap contracts agreements on credit indices and serve as an indicator of the current status of the payment/performance risk and represent the likelihood or risk of default for the credit derivative. The implied credit spread of particular referenced entity reflects the cost of buying/selling protection and may include upfront payments required to be made prior to entering into the agreement. For credit default swap contracts with credit indices as the underlying assets, the quoted market prices and resulting market values serve as an indicator of the current status of the payment/performance risk. Wider credit spreads and increasing market values, in absolute terms when compared to the notional amount of the swap, represent a deterioration of the reference entity’s credit soundness and a greater likelihood or risk of default or other credit event occurring as defined under the terms of the agreement. |
See accompanying Notes to Financial Statements.
| 36 | Semi-Annual Report 2017 |
Statements of Assets and Liabilities (Unaudited)
April 30, 2017
| Aberdeen Select International Equity Fund | Aberdeen Select International Equity Fund II | Aberdeen Total Return Bond Fund | Aberdeen Global High Income Fund | |||||||||||||
Assets: | ||||||||||||||||
Investments in securities, at fair value | $ | 221,233,800 | $ | 94,810,626 | $ | 346,662,371 | $ | 389,559,384 | ||||||||
Short-term investments | 9,815,448 | 2,583,165 | 8,073,154 | 25,220,319 | ||||||||||||
|
|
|
|
|
|
|
| |||||||||
Total investments | 231,049,248 | 97,393,791 | 354,735,525 | 414,779,703 | ||||||||||||
|
|
|
|
|
|
|
| |||||||||
Foreign currency, at fair value | 74,640 | 48,127 | 422,900 | 43,650 | ||||||||||||
Cash collateral pledged for swaps | – | – | 76,888 | 318,441 | ||||||||||||
Cash | – | – | 359,829 | 11,264 | ||||||||||||
Cash collateral pledged for futures | – | – | 291,111 | – | ||||||||||||
Receivable for investments sold | – | – | 11,599,475 | – | ||||||||||||
Interest and dividends receivable | 903,912 | 387,534 | 2,028,774 | 6,894,156 | ||||||||||||
Unrealized appreciation on forward foreign currency exchange contracts | – | – | 2,180,919 | 1,087,710 | ||||||||||||
Receivable for capital shares issued | 98,333 | 31,856 | 248,340 | 303,541 | ||||||||||||
Variation margin receivable for futures contracts | – | – | 455,033 | – | ||||||||||||
Tax reclaim receivable | 1,116,938 | 542,457 | – | – | ||||||||||||
Prepaid expenses | 13,379 | 6,218 | 29,007 | 28,103 | ||||||||||||
|
|
|
|
|
|
|
| |||||||||
Total assets | 233,256,450 | 98,409,983 | 372,427,801 | 423,466,568 | ||||||||||||
|
|
|
|
|
|
|
| |||||||||
Liabilities: | ||||||||||||||||
Payable for investments purchased | 214,403 | 90,801 | 13,167,873 | 5,489,045 | ||||||||||||
Unrealized depreciation on forward foreign currency exchange contracts | – | – | 1,085,662 | 2,381,300 | ||||||||||||
Variation margin payable on centally cleared interest rate swaps | – | – | 1,504 | – | ||||||||||||
Distributions payable | – | – | – | 1,602 | ||||||||||||
Payable for capital shares redeemed | 236,544 | 39,174 | 203,671 | 417,183 | ||||||||||||
Payable for income taxes (See note 2g of the Notes to Financial Statements) | 4,664,110 | 1,279,067 | 11,898 | – | ||||||||||||
Variation margin payable for centrally cleared credit default swap contracts | – | – | – | 4,535 | ||||||||||||
Accrued expenses and other payables: | ||||||||||||||||
Investment advisory fees | 161,032 | 69,583 | 113,214 | 168,149 | ||||||||||||
Custodian fees | 31,632 | 22,874 | 62,147 | 63,086 | ||||||||||||
Legal fees | 21,370 | 9,721 | 82,768 | 32,467 | ||||||||||||
Audit fees | 22,588 | 20,108 | 26,740 | 36,135 | ||||||||||||
Distribution fees | 37,355 | 10,326 | 13,343 | 40,331 | ||||||||||||
Transfer agent fees | 7,504 | 10,767 | 14,724 | 25,561 | ||||||||||||
Other | 114,966 | 78,727 | 185,201 | 115,530 | ||||||||||||
|
|
|
|
|
|
|
| |||||||||
Total liabilities | 5,511,504 | 1,631,148 | 14,968,745 | 8,774,924 | ||||||||||||
|
|
|
|
|
|
|
| |||||||||
Net Assets | $ | 227,744,946 | �� | $ | 96,778,835 | $ | 357,459,056 | $ | 414,691,644 | |||||||
|
|
|
|
|
|
|
| |||||||||
Cost: | ||||||||||||||||
Investments in securities, at cost | $ | 259,081,620 | $ | 98,748,549 | $ | 343,490,941 | $ | 393,671,927 | ||||||||
Short-term investments | 9,815,448 | 2,583,165 | 8,073,154 | 25,220,319 | ||||||||||||
Foreign currency | 1,715,228 | 47,137 | 421,104 | 43,729 | ||||||||||||
Net Assets Consist of: | ||||||||||||||||
Par value | $ | 8,821 | $ | 8,811 | $ | 27,375 | $ | 47,966 | ||||||||
Paid in capital in excess of par value | 2,291,593,443 | 1,455,525,464 | 353,953,736 | 645,515,939 | ||||||||||||
Accumulated net investment income/(loss) | 12,271,472 | 3,225,247 | 2,284,736 | (3,914,068 | ) | |||||||||||
Accumulated net realized loss from investments and foreign currency transactions | (2,036,580,700 | ) | (1,358,014,570 | ) | (2,967,685 | ) | (221,424,280 | ) | ||||||||
Net unrealized appreciation/(depreciation) on investments and translation of assets and liabilities denominated in foreign currencies | (39,548,090 | ) | (3,966,117 | ) | 4,160,894 | (5,533,913 | ) | |||||||||
|
|
|
|
|
|
|
| |||||||||
Net Assets | $ | 227,744,946 | $ | 96,778,835 | $ | 357,459,056 | $ | 414,691,644 | ||||||||
|
|
|
|
|
|
|
| |||||||||
Net Assets | ||||||||||||||||
Class A Shares | $ | 185,169,137 | $ | 51,398,222 | $ | 64,989,905 | $ | 196,587,356 | ||||||||
Institutional Class Shares | 42,575,809 | 45,380,613 | 292,469,151 | 218,104,288 | ||||||||||||
|
|
|
|
|
|
|
| |||||||||
Total | $ | 227,744,946 | $ | 96,778,835 | $ | 357,459,056 | $ | 414,691,644 | ||||||||
|
|
|
|
|
|
|
| |||||||||
Amounts listed as “–” are $0 or round to $0.
See accompanying Notes to Financial Statements.
| 2017 Semi-Annual Report | 37 |
Statements of Assets and Liabilities (Unaudited) (concluded)
April 30, 2017
| Aberdeen Select International Equity Fund | Aberdeen Select International Equity Fund II | Aberdeen Total Return Bond Fund | Aberdeen Global High Income Fund | |||||||||||||
Shares Outstanding | ||||||||||||||||
Class A Shares | 7,204,024 | 4,678,308 | 4,919,053 | 21,980,137 | ||||||||||||
Institutional Class Shares | 1,616,838 | 4,132,502 | 22,456,031 | 25,985,423 | ||||||||||||
|
|
|
|
|
|
|
| |||||||||
Total | 8,820,862 | 8,810,810 | 27,375,084 | 47,965,560 | ||||||||||||
|
|
|
|
|
|
|
| |||||||||
Net asset value and redemption price per share | ||||||||||||||||
Class A Shares | $ | 25.70 | $ | 10.99 | $ | 13.21 | $ | 8.94 | ||||||||
Institutional Class Shares | $ | 26.33 | $ | 10.98 | $ | 13.02 | (a) | $ | 8.39 | |||||||
| (a) | The NAV shown above differs from the traded NAV on April 30, 2017 due to financial statement rounding and/or financial statement adjustments. |
See accompanying Notes to Financial Statements.
| 38 | Semi-Annual Report 2017 |
Statements of Operations (Unaudited)
For the Six-Month Period Ended April 30, 2017
| Aberdeen Select International Equity Fund | Aberdeen Select International Equity Fund II | Aberdeen Total Return Bond Fund | Aberdeen Global High Income Fund | |||||||||||||
INVESTMENT INCOME: | ||||||||||||||||
Dividend income | $ | 18,917,662 | (a) | $ | 5,630,644 | (a) | $ | – | $ | – | ||||||
Interest income | 629,858 | 4,898 | 7,326,965 | 15,979,440 | ||||||||||||
Foreign tax withholding | (259,270 | ) | (116,448 | ) | (25,853 | ) | – | |||||||||
Other income | 5,147 | 423 | 99,239 | 72,719 | ||||||||||||
|
|
|
|
|
|
|
| |||||||||
| 19,293,397 | 5,519,517 | 7,400,351 | 16,052,159 | |||||||||||||
|
|
|
|
|
|
|
| |||||||||
EXPENSES: | ||||||||||||||||
Investment advisory fees | 927,661 | 420,368 | 814,308 | 1,537,612 | ||||||||||||
Distribution fees Class A | 217,543 | 63,639 | 79,945 | 259,514 | ||||||||||||
Income taxes on recovered tax refunds(b) | 4,495,897 | 1,231,800 | – | – | ||||||||||||
Transfer agent fees | 20,329 | 19,579 | 26,597 | 46,669 | ||||||||||||
Trustee fees | 45,795 | 23,317 | 136,102 | 134,748 | ||||||||||||
Legal fees | 26,752 | 12,506 | 78,414 | 77,940 | ||||||||||||
Printing fees | 24,861 | 21,057 | 46,120 | 43,698 | ||||||||||||
Custodian fees | 37,136 | 28,406 | 62,900 | 71,273 | ||||||||||||
Registration and filing fees | 39,679 | 17,161 | 33,371 | 32,770 | ||||||||||||
Audit fees | 19,588 | 17,108 | 23,690 | 26,335 | ||||||||||||
Other | 54,050 | 41,212 | 84,748 | 173,688 | ||||||||||||
|
|
|
|
|
|
|
| |||||||||
Total expenses before reimbursed/waived expenses | 5,909,291 | 1,896,153 | 1,386,195 | 2,404,247 | ||||||||||||
Interest expense (Note 11) | 482 | 1,354 | – | – | ||||||||||||
|
|
|
|
|
|
|
| |||||||||
Total operating expenses before reimbursed/waived expenses | 5,909,773 | 1,897,507 | 1,386,195 | 2,404,247 | ||||||||||||
Expenses reimbursed (Note 3) | – | – | (270,914 | ) | (358,737 | ) | ||||||||||
Expenses waived by investment adviser (Note 3) | (5,154 | ) | (2,336 | ) | (11,633 | ) | (11,828 | ) | ||||||||
|
|
|
|
|
|
|
| |||||||||
Total operating expenses | 5,904,619 | 1,895,171 | 1,103,648 | 2,033,682 | ||||||||||||
|
|
|
|
|
|
|
| |||||||||
Net Investment Income | 13,388,778 | 3,624,346 | 6,296,703 | 14,018,477 | ||||||||||||
|
|
|
|
|
|
|
| |||||||||
Realized loss on investment transactions | (2,726,997 | ) | (1,884,582 | ) | (825,684 | ) | (18,645,141 | ) | ||||||||
Realized gain on credit default swap contracts | – | – | 9,446 | (12,941 | ) | |||||||||||
Realized gain on futures contracts | – | – | 493,273 | – | ||||||||||||
Written options | – | – | (7,002 | ) | – | |||||||||||
Realized gain/(loss) on foreign currency transactions | (650,780 | ) | 4,686 | (837,916 | ) | 5,079,952 | ||||||||||
|
|
|
|
|
|
|
| |||||||||
Net realized loss from investments and foreign currency transactions | (3,377,777 | ) | (1,879,896 | ) | (1,167,883 | ) | (13,578,130 | ) | ||||||||
|
|
|
|
|
|
|
| |||||||||
Net change in unrealized appreciation/(depreciation) on investment transactions | 22,030,875 | 10,250,847 | (8,819,095 | ) | 29,584,638 | |||||||||||
Net change in unrealized appreciation/depreciation on credit default swap contracts | – | – | (125,242 | ) | (170,072 | ) | ||||||||||
Net change in unrealized appreciation/depreciation on futures contracts | – | – | (227,650 | ) | – | |||||||||||
Net change in unrealized appreciation/(depreciation) on translation of assets and liabilities denominated in foreign currencies | 10,582 | 6,154 | 904,531 | (5,614,007 | ) | |||||||||||
|
|
|
|
|
|
|
| |||||||||
Net change in unrealized appreciation/(depreciation) from investments and translation of assets and liabilities denominated in foreign currencies | 22,041,457 | 10,257,001 | (8,267,456 | ) | 23,800,559 | |||||||||||
|
|
|
|
|
|
|
| |||||||||
Net realized/unrealized gain/(loss) from investments and foreign currency transactions | 18,663,680 | 8,377,105 | (9,435,339 | ) | 10,222,429 | |||||||||||
|
|
|
|
|
|
|
| |||||||||
CHANGE IN NET ASSETS RESULTING FROM OPERATIONS | $ | 32,052,458 | $ | 12,001,451 | $ | (3,138,636 | ) | $ | 24,240,906 | |||||||
|
|
|
|
|
|
|
| |||||||||
| (a) | Dividend income includes one-time withholding tax refunds for prior periods. See note 2g of the Notes to Financial Statements |
| (b) | See note 2g of the Notes to Financial Statements |
Amounts listed as “–” are $0 or round to $0.
See accompanying Notes to Financial Statements.
| 2017 Semi-Annual Report | 39 |
Statements of Changes in Net Assets
| Aberdeen Select International Equity Fund | Aberdeen Select International Equity Fund II | |||||||||||||||
| Six-Month Period Ended April 30, 2017 (Unaudited) | Year Ended October 31, 2016 | Six-Month Period Ended April 30, 2017 (Unaudited) | Year Ended October 31, 2016 | |||||||||||||
FROM INVESTMENT ACTIVITIES: | ||||||||||||||||
Operations: | ||||||||||||||||
Net investment income | $ | 13,388,778 | $ | 4,991,754 | $ | 3,624,346 | $ | 1,849,446 | ||||||||
Net realized loss from investments and foreign currency transactions | (3,377,777 | ) | (40,289,908 | ) | (1,879,896 | ) | (17,730,507 | ) | ||||||||
Net change in unrealized appreciation/(depreciation) on investments and translation of assets and liabilities denominated in foreign currencies | 22,041,457 | 34,991,807 | 10,257,001 | 14,906,853 | ||||||||||||
|
|
|
|
|
|
|
| |||||||||
Changes in net assets resulting from operations | 32,052,458 | (306,347 | ) | 12,001,451 | (974,208 | ) | ||||||||||
|
|
|
|
|
|
|
| |||||||||
Distributions to Shareholders From: | ||||||||||||||||
Net investment income: | ||||||||||||||||
Class A | (1,729,501 | ) | (7,266,740 | ) | (794,000 | ) | (2,281,685 | ) | ||||||||
Institutional Class | (384,167 | ) | (1,312,755 | ) | (804,604 | ) | (2,004,083 | ) | ||||||||
|
|
|
|
|
|
|
| |||||||||
Change in net assets from shareholder distributions | (2,113,668 | ) | (8,579,495 | ) | (1,598,604 | ) | (4,285,768 | ) | ||||||||
|
|
|
|
|
|
|
| |||||||||
Common Stock Transactions: | ||||||||||||||||
Change in net assets from capital transactions | (16,381,475 | ) | (63,004,165 | ) | (17,204,194 | ) | (39,423,360 | ) | ||||||||
|
|
|
|
|
|
|
| |||||||||
Change in net assets | 13,557,315 | (71,890,007 | ) | (6,801,347 | ) | (44,683,336 | ) | |||||||||
|
|
|
|
|
|
|
| |||||||||
Net Assets: | ||||||||||||||||
Beginning of period | 214,187,631 | 286,077,638 | 103,580,182 | 148,263,518 | ||||||||||||
|
|
|
|
|
|
|
| |||||||||
End of period | $ | 227,744,946 | $ | 214,187,631 | $ | 96,778,835 | $ | 103,580,182 | ||||||||
|
|
|
|
|
|
|
| |||||||||
Accumulated net investment income at end of period | $ | 12,271,472 | $ | 996,362 | $ | 3,225,247 | $ | 1,199,505 | ||||||||
|
|
|
|
|
|
|
| |||||||||
CAPITAL TRANSACTIONS: | ||||||||||||||||
Class A Shares | ||||||||||||||||
Proceeds from shares issued | $ | 4,054,494 | $ | 3,520,938 | $ | 1,534,866 | $ | 3,302,327 | ||||||||
Dividends reinvested | 1,674,291 | 7,047,478 | 767,912 | 2,211,187 | ||||||||||||
Cost of shares redeemed | (27,839,735 | ) | (63,472,070 | ) | (15,823,384 | ) | (22,625,201 | ) | ||||||||
|
|
|
|
|
|
|
| |||||||||
Total Class A | (22,110,950 | ) | (52,903,654 | ) | (13,520,606 | ) | (17,111,687 | ) | ||||||||
|
|
|
|
|
|
|
| |||||||||
Institutional Class Shares | ||||||||||||||||
Proceeds from shares issued | 10,158,600 | 1,091,627 | 1,726,887 | 3,506,655 | ||||||||||||
Dividends reinvested | 369,916 | 1,259,027 | 716,119 | 1,788,327 | ||||||||||||
Cost of shares redeemed | (4,799,041 | ) | (12,451,165 | ) | (6,126,594 | ) | (27,606,655 | ) | ||||||||
|
|
|
|
|
|
|
| |||||||||
Total Institutional Class | 5,729,475 | (10,100,511 | ) | (3,683,588 | ) | (22,311,673 | ) | |||||||||
|
|
|
|
|
|
|
| |||||||||
Change in net assets from capital transactions: | $ | (16,381,475 | ) | $ | (63,004,165 | ) | $ | (17,204,194 | ) | $ | (39,423,360 | ) | ||||
|
|
|
|
|
|
|
| |||||||||
See accompanying Notes to Financial Statements.
| 40 | Semi-Annual Report 2017 |
Statements of Changes in Net Assets (continued)
| Aberdeen Select International Equity Fund | Aberdeen Select International Equity Fund II | |||||||||||||||
| Six-Month Period Ended April 30, 2017 (Unaudited) | Year Ended | Six-Month Period Ended April 30, 2017 (Unaudited) | Year Ended | |||||||||||||
SHARE TRANSACTIONS: | ||||||||||||||||
Class A Shares | ||||||||||||||||
Issued | 164,872 | 169,839 | 148,837 | 336,523 | ||||||||||||
Reinvested | 77,802 | 345,804 | 81,867 | 244,619 | ||||||||||||
Redeemed | (1,218,311 | ) | (2,960,685 | ) | (1,616,793 | ) | (2,415,815 | ) | ||||||||
|
|
|
|
|
|
|
| |||||||||
Total Class A Shares | (975,637 | ) | (2,445,042 | ) | (1,386,089 | ) | (1,834,673 | ) | ||||||||
|
|
|
|
|
|
|
| |||||||||
Institutional Class Shares | ||||||||||||||||
Issued | 395,946 | 48,753 | 166,470 | 364,152 | ||||||||||||
Reinvested | 16,792 | 60,385 | 76,427 | 198,089 | ||||||||||||
Redeemed | (201,249 | ) | (568,512 | ) | (616,717 | ) | (2,926,559 | ) | ||||||||
|
|
|
|
|
|
|
| |||||||||
Total Institutional Class Shares | 211,489 | (459,374 | ) | (373,820 | ) | (2,364,318 | ) | |||||||||
|
|
|
|
|
|
|
| |||||||||
Total change in shares: | (764,148 | ) | (2,904,416 | ) | (1,759,909 | ) | (4,198,991 | ) | ||||||||
|
|
|
|
|
|
|
| |||||||||
Amounts listed as “–” are $0 or round to $0.
See accompanying Notes to Financial Statements.
| 2017 Semi-Annual Report | 41 |
Statements of Changes in Net Assets (continued)
| Aberdeen Total Return Bond Fund | Aberdeen Global High Income Fund | |||||||||||||||
| Six-Month Period Ended April 30, 2017 (Unaudited) | Year Ended | Six-Month Period Ended April 30, 2017 (Unaudited) | Year Ended | |||||||||||||
FROM INVESTMENT ACTIVITIES: | ||||||||||||||||
Operations: | ||||||||||||||||
Net investment income | $ | 6,296,703 | $ | 24,382,492 | $ | 14,018,477 | $ | 50,770,277 | ||||||||
Net realized gain/(loss) from investments and foreign currency transactions | (1,167,883 | ) | 13,262,791 | (13,578,130 | ) | (131,201,967 | ) | |||||||||
Net change in unrealized appreciation/(depreciation) on investments and translation of assets and liabilities denominated in foreign currencies | (8,267,456 | ) | 10,657,414 | 23,800,559 | 72,783,155 | |||||||||||
|
|
|
|
|
|
|
| |||||||||
Changes in net assets resulting from operations | (3,138,636 | ) | 48,302,697 | 24,240,906 | (7,648,535 | ) | ||||||||||
|
|
|
|
|
|
|
| |||||||||
Distributions to Shareholders From: | ||||||||||||||||
Net investment income: | ||||||||||||||||
Class A | (341,515 | ) | (804,456 | ) | (7,507,316 | ) | (12,940,756 | ) | ||||||||
Institutional Class | (2,656,105 | ) | (11,635,403 | ) | (10,352,149 | ) | (23,383,937 | ) | ||||||||
Net realized gains: | ||||||||||||||||
Class A | (2,234,881 | ) | – | – | – | |||||||||||
Institutional Class | (14,581,517 | ) | – | – | – | |||||||||||
|
|
|
|
|
|
|
| |||||||||
Change in net assets from shareholder distributions | (19,814,018 | ) | (12,439,859 | ) | (17,859,465 | ) | (36,324,693 | ) | ||||||||
|
|
|
|
|
|
|
| |||||||||
Common Stock Transactions: | ||||||||||||||||
Change in net assets from capital transactions | (139,165,304 | ) | (519,267,893 | ) | (176,524,365 | ) | (691,650,006 | ) | ||||||||
|
|
|
|
|
|
|
| |||||||||
Change in net assets | (162,117,958 | ) | (483,405,055 | ) | (170,142,924 | ) | (735,623,234 | ) | ||||||||
|
|
|
|
|
|
|
| |||||||||
Net Assets: | ||||||||||||||||
Beginning of period | 519,577,014 | 1,002,982,069 | 584,834,568 | 1,320,457,802 | ||||||||||||
|
|
|
|
|
|
|
| |||||||||
End of period | $ | 357,459,056 | $ | 519,577,014 | $ | 414,691,644 | $ | 584,834,568 | ||||||||
|
|
|
|
|
|
|
| |||||||||
Accumulated net investment income/(loss) at end of period | $ | 2,284,736 | $ | (1,014,347 | ) | $ | (3,914,068 | ) | $ | (73,080 | ) | |||||
|
|
|
|
|
|
|
| |||||||||
CAPITAL TRANSACTIONS: | ||||||||||||||||
Class A Shares | ||||||||||||||||
Proceeds from shares issued | $ | 9,263,424 | $ | 16,784,233 | $ | 28,824,816 | $ | 64,778,775 | ||||||||
Dividends reinvested | 2,404,197 | 741,485 | 7,208,336 | 12,438,271 | ||||||||||||
Cost of shares redeemed | (9,017,849 | ) | (30,570,235 | ) | (76,073,248 | ) | (349,375,916 | ) | ||||||||
|
|
|
|
|
|
|
| |||||||||
Total Class A | 2,649,772 | (13,044,517 | ) | (40,040,096 | ) | (272,158,870 | ) | |||||||||
|
|
|
|
|
|
|
| |||||||||
Institutional Class Shares | ||||||||||||||||
Proceeds from shares issued | 38,196,288 | 149,682,968 | 28,563,863 | 144,838,165 | ||||||||||||
Dividends reinvested | 15,688,205 | 10,951,764 | 5,863,416 | 14,661,454 | ||||||||||||
Cost of shares redeemed | (195,699,569 | ) | (666,858,108 | ) | (170,911,548 | ) | (578,990,755 | ) | ||||||||
|
|
|
|
|
|
|
| |||||||||
Total Institutional Class | (141,815,076 | ) | (506,223,376 | ) | (136,484,269 | ) | (419,491,136 | ) | ||||||||
|
|
|
|
|
|
|
| |||||||||
Change in net assets from capital transactions: | $ | (139,165,304 | ) | $ | (519,267,893 | ) | $ | (176,524,365 | ) | $ | (691,650,006 | ) | ||||
|
|
|
|
|
|
|
| |||||||||
Amounts listed as “–” are $0 or round to $0.
See accompanying Notes to Financial Statements.
| 42 | Semi-Annual Report 2017 |
Statements of Changes in Net Assets (concluded)
| Aberdeen Total Return Bond Fund | Aberdeen Global High Income Fund | |||||||||||||||
| Six-Month Period Ended April 30, 2017 (Unaudited) | Year Ended | Six-Month Period Ended April 30, 2017 (Unaudited) | Year Ended | |||||||||||||
SHARE TRANSACTIONS: | ||||||||||||||||
Class A Shares | ||||||||||||||||
Issued | 699,521 | 1,244,630 | 3,263,154 | 7,639,129 | ||||||||||||
Reinvested | 184,968 | 55,056 | 819,095 | 1,457,481 | ||||||||||||
Redeemed | (683,125 | ) | (2,255,811 | ) | (8,624,368 | ) | (40,835,590 | ) | ||||||||
|
|
|
|
|
|
|
| |||||||||
Total Class A Shares | 201,364 | (956,125 | ) | (4,542,119 | ) | (31,738,980 | ) | |||||||||
|
|
|
|
|
|
|
| |||||||||
Institutional Class Shares | ||||||||||||||||
Issued | 2,933,539 | 11,204,546 | 3,448,252 | 18,154,335 | ||||||||||||
Reinvested | 1,223,548 | 825,130 | 709,517 | 1,822,279 | ||||||||||||
Redeemed | (15,007,609 | ) | (49,274,628 | ) | (20,629,999 | ) | (71,688,072 | ) | ||||||||
|
|
|
|
|
|
|
| |||||||||
Total Institutional Class Shares | (10,850,522 | ) | (37,244,952 | ) | (16,472,230 | ) | (51,711,458 | ) | ||||||||
|
|
|
|
|
|
|
| |||||||||
Total change in shares: | (10,649,158 | ) | (38,201,077 | ) | (21,014,349 | ) | (83,450,438 | ) | ||||||||
|
|
|
|
|
|
|
| |||||||||
See accompanying Notes to Financial Statements.
| 2017 Semi-Annual Report | 43 |
Financial Highlights
Selected Data for Each Share of Capital Outstanding Throughout the Periods Indicated
Aberdeen Select International Equity Fund
| Investment Activities | Distributions | |||||||||||||||||||||||||||||||
| Net Asset Value, Beginning of Period | Net Investment Income (a) | Net Realized and Unrealized Gains (Losses) on Investments | Total from Investment Activities | Net Investment Income | Tax Return of Capital | Total Distributions | Net Asset Value, End of Period | |||||||||||||||||||||||||
Class A Shares | ||||||||||||||||||||||||||||||||
Six Months Ended April 30, 2017* | $ | 22.26 | $ | 1.49 | (g) | $ | 2.17 | $ | 3.66 | $ | (0.22 | ) | $ | – | $ | (0.22 | ) | $ | 25.70 | |||||||||||||
Year Ended October 31, 2016 | 22.82 | 0.45 | (h) | (0.29 | ) | 0.16 | (0.72 | ) | – | (0.72 | ) | 22.26 | ||||||||||||||||||||
Year Ended October 31, 2015 | 28.00 | 0.62 | (j) | (4.60 | ) | (3.98 | ) | (1.20 | ) | – | (1.20 | ) | 22.82 | |||||||||||||||||||
Year Ended October 31, 2014 | 28.63 | 1.09 | (1.12 | ) | (0.03 | ) | (0.60 | ) | – | (0.60 | ) | 28.00 | ||||||||||||||||||||
Year Ended October 31, 2013 | 23.84 | 0.37 | 4.55 | 4.92 | (0.13 | ) | – | (0.13 | ) | 28.63 | ||||||||||||||||||||||
Year Ended October 31, 2012 | 24.55 | 0.30 | (0.62 | ) | (0.32 | ) | (0.39 | ) | – | (0.39 | ) | 23.84 | ||||||||||||||||||||
Institutional Class Shares | ||||||||||||||||||||||||||||||||
Six Months Ended April 30, 2017* | 22.84 | 1.55 | (g) | 2.23 | 3.78 | (0.29 | ) | – | (0.29 | ) | 26.33 | |||||||||||||||||||||
Year Ended October 31, 2016 | 23.40 | 0.51 | (h) | (0.28 | ) | 0.23 | (0.79 | ) | – | (0.79 | ) | 22.84 | ||||||||||||||||||||
Year Ended October 31, 2015 | 28.69 | 0.67 | (j) | (4.68 | ) | (4.01 | ) | (1.28 | ) | – | (1.28 | ) | 23.40 | |||||||||||||||||||
Year Ended October 31, 2014 | 29.33 | 1.19 | (1.16 | ) | 0.03 | (0.67 | ) | – | (0.67 | ) | 28.69 | |||||||||||||||||||||
Year Ended October 31, 2013 | 24.44 | 0.31 | 4.80 | 5.11 | (0.22 | ) | – | (0.22 | ) | 29.33 | ||||||||||||||||||||||
Year Ended October 31, 2012 | 25.20 | 0.36 | (0.64 | ) | (0.28 | ) | (0.48 | ) | – | (0.48 | ) | 24.44 | ||||||||||||||||||||
| * | Unaudited |
| (a) | Net investment income/(loss) is based on average shares outstanding during the period. |
| (b) | Not annualized for periods less than one year. |
| (c) | Annualized for periods less than one year. |
| (d) | Includes interest expense that amounts to less than 0.01%. |
| (e) | During the period, certain fees were waived and/or reimbursed. If such waivers/reimbursements had not occurred, the ratios would have been as indicated. |
| (f) | Portfolio turnover is calculated on the basis of the Fund as a whole without distinguishing among the classes of shares. |
| (g) | Included within Net Investment Income per share, Total Return, and Ratio of Net Investment Income to Average Net Assets are the effects of withholding tax refunds (Note 2g of the Notes to Financial Statements). If such amounts were excluded, the Net Investment Loss per share, Total Return, and Ratio of Net Investment Loss to Average Net Assets for Class A Shares would have been $(0.29), 10.35%, and (1.25)%, respectively. For Institutional Class Shares, these amounts would have been $(0.27), 10.48%, and (1.16)%, respectively. |
Amounts listed as “–” are $0 or round to $0.
See accompanying Notes to Financial Statements.
| 44 | Semi-Annual Report 2017 |
Financial Highlights (continued)
Selected Data for Each Share of Capital Outstanding Throughout the Periods Indicated
Aberdeen Select International Equity Fund (concluded)
| Ratios/Supplemental Data | ||||||||||||||||||||||||||
| Total Return (b) | Net Assets at End of Period (000’s) | Ratio of Expenses (Net of Reimbursements/ Waivers) to Average Net Assets (c)(d) | Ratio of Expenses (Net of Reimbursement/ Waivers and Excluding Accruals for Estimated Tax Due on Foreign Tax Refund Recoveries) to Average Net Assets (c)(d) | Ratio of Net Investment Income to Average Net Assets (c) | Ratio of Expenses (Prior to Reimbursements) to Average Net Assets (c)(d)(e) | Portfolio Turnover (b)(f) | ||||||||||||||||||||
| 16.65 | %(g) | $ | 185,169 | 3.57 | % | 1.41 | % | 12.96 | %(g) | 3.58 | % | 11 | % | |||||||||||||
| 0.99 | %(h)(i) | 182,094 | 1.42 | % | 1.35 | % | 2.08 | %(h) | 1.42 | % | 23 | % | ||||||||||||||
| (14.62 | %)(j) | 242,444 | 1.28 | % | 1.28 | % | 2.47 | %(j) | 1.28 | % | 11 | % | ||||||||||||||
| (0.04 | %) | 397,911 | 1.26 | % | 1.26 | % | 3.83 | % | 1.26 | % | 12 | % | ||||||||||||||
| 20.70 | % | 554,922 | 1.25 | % | 1.25 | % | 1.39 | % | 1.26 | % | 94 | % | ||||||||||||||
| (1.14 | %) | 877,738 | 1.23 | % | 1.23 | % | 1.30 | % | 1.24 | % | 35 | % | ||||||||||||||
| 16.78 | %(g) | 42,576 | 3.30 | % | 1.16 | % | 13.16 | %(g) | 3.31 | % | 11 | % | ||||||||||||||
| 1.30 | %(h)(i) | 32,094 | 1.17 | % | 1.10 | % | 2.31 | %(h) | 1.17 | % | 23 | % | ||||||||||||||
| (14.40 | %)(j) | 43,633 | 1.04 | % | 1.04 | % | 2.56 | %(j) | 1.04 | % | 11 | % | ||||||||||||||
| 0.19 | % | 82,014 | 1.02 | % | 1.02 | % | 4.06 | % | 1.03 | % | 12 | % | ||||||||||||||
| 21.04 | % | 110,893 | 1.03 | % | 1.03 | % | 1.15 | % | 1.04 | % | 94 | % | ||||||||||||||
| (0.93 | %) | 1,138,838 | 1.00 | % | 1.00 | % | 1.51 | % | 1.01 | % | 35 | % | ||||||||||||||
| (h) | Included within Net Investment Income per share, Total Return, and Ratio of Net Investment Income to Average Net Assets are the effects of a one-time reimbursement for overbilling of prior years’ custodian out-of-pocket fees. If such amounts were excluded, the impact to the Net Investment Income per share, Total Return, and Ratio of Net Investment Income to Average Net Assets for Class A Shares would have been reduced by $0.03, 0.13%, and 0.13%, respectively. For Institutional Class Shares, these amounts would have been reduced by $0.03, 0.13%, and 0.13%, respectively. |
| (i) | Included within Net Realized and Unrealized Gains (Losses) on Investment per share is a payment from affiliate (See Note 3). If such payment was excluded, the total return would have been 0.94% for Class A Shares and 1.21% for Institutional Class Shares. |
| (j) | Included within Net Investment Income per share, Total Return, and Ratio of Net Investment Income to Average Net Assets are the effects of withholding tax refunds (Note 2g of the Notes to Financial Statements). If such amounts were excluded, the Net Investment Income per share, Total Return, and Ratio of Net Investment Income to Average Net Assets for Class A Shares would have been $0.53, (15.03%), and 2.11%, respectively. For Institutional Class Shares, these amounts would have been $0.58, (14.80%), and 2.20%, respectively. |
| 2017 Semi-Annual Report | 45 |
Financial Highlights (continued)
Selected Data for Each Share of Capital Outstanding Throughout the Periods Indicated
Aberdeen Select International Equity Fund II
| Investment Activities | Distributions | |||||||||||||||||||||||||||||||
| Net Asset Value, Beginning of Period | Net Investment Income (a) | Net Realized and Unrealized Gains (Losses) on Investments | Total from Investment Activities | Net Investment Income | Tax Return of Capital | Total Distributions | Net Asset Value, End of Period | |||||||||||||||||||||||||
Class A Shares | ||||||||||||||||||||||||||||||||
Six Months Ended April 30, 2017* | $ | 9.79 | $ | 0.37 | (g) | $ | 0.99 | $ | 1.36 | $ | (0.16 | ) | $ | – | $ | (0.16 | ) | $ | 10.99 | |||||||||||||
Year Ended October 31, 2016 | 10.03 | 0.14 | (h) | (0.08 | ) | 0.06 | (0.30 | ) | – | (0.30 | ) | 9.79 | ||||||||||||||||||||
Year Ended October 31, 2015 | 12.23 | 0.21 | (j) | (1.89 | )(k) | (1.68 | ) | (0.52 | ) | – | (0.52 | ) | 10.03 | |||||||||||||||||||
Year Ended October 31, 2014 | 12.18 | 0.42 | (0.36 | ) | 0.06 | (0.01 | ) | – | (0.01 | ) | 12.23 | |||||||||||||||||||||
Year Ended October 31, 2013 | 10.38 | 0.13 | 1.92 | 2.05 | (0.25 | ) | – | (0.25 | ) | 12.18 | ||||||||||||||||||||||
Year Ended October 31, 2012 | 10.46 | 0.12 | (0.05 | ) | 0.07 | (0.15 | ) | – | (0.15 | ) | 10.38 | |||||||||||||||||||||
Institutional Class Shares | ||||||||||||||||||||||||||||||||
Six Months Ended April 30, 2017* | 9.81 | 0.40 | (g) | 0.95 | 1.35 | (0.18 | ) | – | (0.18 | ) | 10.98 | |||||||||||||||||||||
Year Ended October 31, 2016 | 10.04 | 0.16 | (h) | (0.06 | ) | 0.10 | (0.33 | ) | – | (0.33 | ) | 9.81 | ||||||||||||||||||||
Year Ended October 31, 2015 | 12.25 | 0.24 | (j) | (1.90 | )(k) | (1.66 | ) | (0.55 | ) | – | (0.55 | ) | 10.04 | |||||||||||||||||||
Year Ended October 31, 2014 | 12.20 | 0.46 | (0.38 | ) | 0.08 | (0.03 | ) | – | (0.03 | ) | 12.25 | |||||||||||||||||||||
Year Ended October 31, 2013 | 10.45 | 0.11 | 1.97 | 2.08 | (0.33 | ) | – | (0.33 | ) | 12.20 | ||||||||||||||||||||||
Year Ended October 31, 2012 | 10.54 | 0.14 | (0.04 | ) | 0.10 | (0.19 | ) | – | (0.19 | ) | 10.45 | |||||||||||||||||||||
| * | Unaudited |
| (a) | Net investment income/(loss) is based on average shares outstanding during the period. |
| (b) | Not annualized for periods less than one year. |
| (c) | Annualized for periods less than one year. |
| (d) | Includes interest expense that amounts to 0.01% |
| (e) | During the period, certain fees were waived and/or reimbursed. If such waivers/reimbursements had not occurred, the ratios would have been as indicated. |
| (f) | Portfolio turnover is calculated on the basis of the Fund as a whole without distinguishing among the classes of shares. |
| (g) | Included within Net Investment Income per share, Total Return, and Ratio of Net Investment Income to Average Net Assets are the effects of withholding tax refunds (Note 2g of the Notes to Financial Statements). If such amounts were excluded, the Net Investment Loss per share, Total Return, and Ratio of Net Investment Loss to Average Net Assets for Class A Shares would have been $(0.08), 10.39%, and (0.83)%, respectively. For Institutional Class Shares, these amounts would have been $(0.06), 10.39%, and (0.58)%, respectively. |
Amounts listed as “–” are $0 or round to $0.
See accompanying Notes to Financial Statements.
| 46 | Semi-Annual Report 2017 |
Financial Highlights (continued)
Selected Data for Each Share of Capital Outstanding Throughout the Periods Indicated
Aberdeen Select International Equity Fund II (concluded)
| Ratios/Supplemental Data | ||||||||||||||||||||||||||
| Total Return (b) | Net Assets at End of Period (000’s) | Ratio of Expenses (Net of Reimbursements/ Waivers) to Average Net Assets (c)(d) | Ratio of Expenses Due on Foreign | Ratio of Net Investment Income to Average Net Assets (c) | Ratio of Expenses (Prior to Reimbursements) to Average Net Assets (c)(d)(e) | Portfolio Turnover (b)(f) | ||||||||||||||||||||
| 14.13 | %(g) | $ | 51,398 | 2.82 | % | 1.53 | % | 7.53 | %(g) | 2.82 | % | 5 | % | |||||||||||||
| 0.83 | %(h)(i) | 59,390 | 1.49 | % | 1.45 | % | 1.49 | %(h) | 1.50 | % | 23 | % | ||||||||||||||
| (14.16 | %)(j)(k) | 79,263 | 1.38 | % | 1.38 | % | 1.93 | %(j) | 1.38 | % | 12 | % | ||||||||||||||
| 0.46 | % | 120,387 | 1.32 | % | 1.32 | % | 3.41 | % | 1.33 | % | 11 | % | ||||||||||||||
| 20.00 | % | 168,028 | 1.21 | % | 1.21 | % | 1.19 | % | 1.23 | % | 97 | % | ||||||||||||||
| 0.91 | % | 278,360 | 1.30 | % | 1.30 | % | 1.21 | % | 1.32 | % | 34 | % | ||||||||||||||
| 14.14 | %(g) | 45,381 | 2.63 | % | 1.30 | % | 8.04 | %(g) | 2.63 | % | 5 | % | ||||||||||||||
| 1.25 | %(h)(i) | 44,191 | 1.26 | % | 1.22 | % | 1.71 | %(h) | 1.27 | % | 23 | % | ||||||||||||||
| (13.96 | %)(j)(k) | 69,000 | 1.13 | % | 1.13 | % | 2.16 | %(j) | 1.13 | % | 12 | % | ||||||||||||||
| 0.64 | % | 108,665 | 1.10 | % | 1.10 | % | 3.69 | % | 1.11 | % | 11 | % | ||||||||||||||
| 20.36 | % | 157,876 | 1.04 | % | 1.04 | % | 1.02 | % | 1.04 | % | 97 | % | ||||||||||||||
| 1.11 | % | 806,052 | 1.01 | % | 1.01 | % | 1.33 | % | 1.02 | % | 34 | % | ||||||||||||||
| (h) | Included within Net Investment Income per share, Total Return, and Ratio of Net Investment Income to Average Net Assets are the effects of a one-time reimbursement for overbilling of prior years’ custodian out-of-pocket fees. If such amounts were excluded, the impact to the Net Investment Income per share, Total Return, and Ratio of Net Investment Income to Average Net Assets for Class A Shares would have been reduced by $0.02, 0.21%, and 0.20%, respectively. For Institutional Class Shares, these amounts would have been by reduced $0.03, 0.31%, and 0.19%, respectively. |
| (i) | Included within Net Realized and Unrealized Gains (Losses) on Investment per share is a payment from affiliate (See Note 3). If such payment was excluded, the total return would have been 0.73% for Class A Shares and 1.04% for Institutional Class Shares. |
| (j) | Included within Net Investment Income per share, Total Return, and Ratio of Net Investment Income to Average Net Assets are the effects of withholding tax refunds (Note 2g of the Notes to Financial Statements). If such amounts were excluded, the Net Investment Income per share, Total Return, and Ratio of Net Investment Income to Average Net Assets for Class A Shares would have been $0.18, (14.42%), and 1.66%, respectively. For Institutional Class Shares, these amounts would have been $0.21, (14.22%), and 1.89%, respectively. |
| (k) | Included within Net Realized and Unrealized Gains (Losses) on Investment per share is a payment from affiliate (See Note 3). If such payment was excluded, the total return would have been (14.33%) for Class A Shares and (14.13%) for Institutional Class Shares. |
| 2017 Semi-Annual Report | 47 |
Financial Highlights (continued)
Selected Data for Each Share of Capital Outstanding Throughout the Periods Indicated
Aberdeen Total Return Bond Fund
| Investment Activities | Distributions | |||||||||||||||||||||||||||||||||||
| Net Asset Value, Beginning of Period | Net Investment Income (a) | Net Realized and Unrealized Gains (Losses) on Investments | Total from Investment Activities | Net Investment Income | Net Realized Gains | Tax Return of Capital | Total Distributions | Net Asset Value, End of Period | ||||||||||||||||||||||||||||
Class A Shares | ||||||||||||||||||||||||||||||||||||
Six Months Ended April 30, 2017* | $ | 13.83 | $ | 0.16 | $ | (0.24 | ) | $ | (0.08 | ) | $ | (0.07 | ) | $ | (0.47 | ) | $ | – | $ | (0.54 | ) | $ | 13.21 | |||||||||||||
Year Ended October 31, 2016 | 13.32 | 0.34 | 0.32 | 0.66 | (0.15 | ) | – | – | (0.15 | ) | 13.83 | |||||||||||||||||||||||||
Year Ended October 31, 2015 | 13.60 | 0.32 | (0.19 | ) | 0.13 | (0.22 | ) | (0.17 | ) | (0.02 | ) | (0.41 | ) | 13.32 | ||||||||||||||||||||||
Year Ended October 31, 2014 | 13.30 | 0.34 | 0.18 | 0.52 | (0.22 | ) | – | – | (0.22 | ) | 13.60 | |||||||||||||||||||||||||
Year Ended October 31, 2013 | 14.17 | 0.31 | (0.56 | ) | (0.25 | ) | (0.29 | ) | (0.30 | ) | (0.03 | ) | (0.62 | ) | 13.30 | |||||||||||||||||||||
Year Ended October 31, 2012 | 14.02 | 0.34 | 0.56 | 0.90 | (0.49 | ) | (0.26 | ) | – | (0.75 | ) | 14.17 | ||||||||||||||||||||||||
Institutional Class Shares | ||||||||||||||||||||||||||||||||||||
Six Months Ended April 30, 2017* | 13.64 | 0.18 | (0.24 | ) | (0.06 | ) | (0.09 | ) | (0.47 | ) | – | (0.56 | ) | 13.02 | ||||||||||||||||||||||
Year Ended October 31, 2016 | 13.14 | 0.36 | 0.33 | 0.69 | (0.19 | ) | – | – | (0.19 | ) | 13.64 | |||||||||||||||||||||||||
Year Ended October 31, 2015 | 13.43 | 0.35 | (0.20 | ) | 0.15 | (0.25 | ) | (0.17 | ) | (0.02 | ) | (0.44 | ) | 13.14 | ||||||||||||||||||||||
Year Ended October 31, 2014 | 13.13 | 0.37 | 0.18 | 0.55 | (0.25 | ) | – | – | (0.25 | ) | 13.43 | |||||||||||||||||||||||||
Year Ended October 31, 2013 | 14.03 | 0.35 | (0.56 | ) | (0.21 | ) | (0.36 | ) | (0.30 | ) | (0.03 | ) | (0.69 | ) | 13.13 | |||||||||||||||||||||
Year Ended October 31, 2012 | 13.91 | 0.38 | 0.55 | 0.93 | (0.55 | ) | (0.26 | ) | – | (0.81 | ) | 14.03 | ||||||||||||||||||||||||
| * | Unaudited |
| (a) | Net investment income/(loss) is based on average shares outstanding during the period. |
| (b) | Not annualized for periods less than one year. |
| (c) | Annualized for periods less than one year. |
Amounts listed as “–” are $0 or round to $0.
See accompanying Notes to Financial Statements.
| 48 | Semi-Annual Report 2017 |
Financial Highlights (continued)
Selected Data for Each Share of Capital Outstanding Throughout the Periods Indicated
Aberdeen Total Return Bond Fund (concluded)
| Ratios/Supplemental Data | ||||||||||||||||||||||
| Total Return (b) | Net Assets at End of Period (000’s) | Ratio of Expenses (Net of Reimbursements/ Waivers) to Average Net Assets (c) | Ratio of Net Investment Income to Average Net Assets (c) | Ratio of Expenses (Prior to Reimbursements) to Average Net Assets (c)(d) | Portfolio Turnover (b)(e) | |||||||||||||||||
| (0.51 | %) | $ | 64,990 | 0.69 | % | 2.50 | % | 0.82 | % | 70 | % | |||||||||||
| 5.02 | % | 65,242 | 0.69 | % | 2.47 | % | 0.74 | % | 151 | % | ||||||||||||
| 0.91 | % | 75,595 | 0.69 | % | 2.37 | % | 0.71 | % | 102 | % | ||||||||||||
| 3.96 | % | 152,196 | 0.68 | % | 2.56 | % | 0.69 | % | 128 | % | ||||||||||||
| (1.81 | %) | 153,370 | 0.68 | % | 2.29 | % | 0.70 | % | 265 | % | ||||||||||||
| 6.64 | % | 247,217 | 0.69 | % | 2.47 | % | 0.69 | % | 236 | % | ||||||||||||
| (0.39 | %) | 292,469 | 0.44 | % | 2.74 | % | 0.56 | % | 70 | % | ||||||||||||
| 5.29 | % | 454,335 | 0.44 | % | 2.72 | % | 0.47 | % | 151 | % | ||||||||||||
| 1.12 | % | 927,387 | 0.44 | % | 2.62 | % | 0.45 | % | 102 | % | ||||||||||||
| 4.25 | % | 1,361,252 | 0.42 | % | 2.81 | % | 0.43 | % | 128 | % | ||||||||||||
| (1.59 | %) | 1,449,776 | 0.42 | % | 2.56 | % | 0.43 | % | 265 | % | ||||||||||||
| 6.97 | % | 1,849,138 | 0.41 | % | 2.73 | % | 0.41 | % | 236 | % | ||||||||||||
| (d) | During the period, certain fees were waived and/or reimbursed. If such waivers/reimbursements had not occurred, the ratios would have been as indicated. |
| (e) | Portfolio turnover is calculated on the basis of the Fund as a whole without distinguishing among the classes of shares. |
| 2017 Semi-Annual Report | 49 |
Financial Highlights (continued)
Selected Data for Each Share of Capital Outstanding Throughout the Periods Indicated
Aberdeen Global High Income Fund
| Investment Activities | Distributions | |||||||||||||||||||||||||||||||||||
| Net Asset Value, Beginning of Period | Net Investment Income (a) | Net Realized and Unrealized Gains (Losses) on Investments | Total from Investment Activities | Net Investment Income | Net Realized Gains | Tax Return of Capital | Total Distributions | Net Asset Value, End of Period | ||||||||||||||||||||||||||||
Class A Shares | ||||||||||||||||||||||||||||||||||||
Six Months Ended April 30, 2017* | $ | 8.80 | $ | 0.25 | $ | 0.21 | $ | 0.46 | $ | (0.32 | ) | $ | – | $ | – | $ | (0.32 | ) | $ | 8.94 | ||||||||||||||||
Year Ended October 31, 2016 | 8.98 | 0.49 | (0.33 | ) | 0.16 | (0.34 | ) | – | – | (0.34 | ) | 8.80 | ||||||||||||||||||||||||
Year Ended October 31, 2015 | 10.38 | 0.62 | (1.22 | ) | (0.60 | ) | (0.44 | ) | (0.25 | ) | (0.11 | ) | (0.80 | ) | 8.98 | |||||||||||||||||||||
Year Ended October 31, 2014 | 10.61 | 0.62 | (0.13 | ) | 0.49 | (0.61 | ) | (0.11 | ) | – | (0.72 | ) | 10.38 | |||||||||||||||||||||||
Year Ended October 31, 2013 | 10.30 | 0.72 | 0.30 | 1.02 | (0.71 | ) | – | – | (0.71 | ) | 10.61 | |||||||||||||||||||||||||
Year Ended October 31, 2012 | 10.14 | 0.73 | 0.34 | 1.07 | (0.74 | ) | (0.16 | ) | (0.01 | ) | (0.91 | ) | 10.30 | |||||||||||||||||||||||
Institutional Class Shares | ||||||||||||||||||||||||||||||||||||
Six Months Ended April 30, 2017* | 8.28 | 0.25 | 0.19 | 0.44 | (0.33 | ) | – | – | (0.33 | ) | 8.39 | |||||||||||||||||||||||||
Year Ended October 31, 2016 | 8.47 | 0.48 | (0.31 | ) | 0.17 | (0.36 | ) | – | – | (0.36 | ) | 8.28 | ||||||||||||||||||||||||
Year Ended October 31, 2015 | 9.85 | 0.61 | (1.16 | ) | (0.55 | ) | (0.47 | ) | (0.25 | ) | (0.11 | ) | (0.83 | ) | 8.47 | |||||||||||||||||||||
Year Ended October 31, 2014 | 10.10 | 0.61 | (0.11 | ) | 0.50 | (0.64 | ) | (0.11 | ) | – | (0.75 | ) | 9.85 | |||||||||||||||||||||||
Year Ended October 31, 2013 | 9.84 | 0.71 | 0.29 | 1.00 | (0.74 | ) | – | – | (0.74 | ) | 10.10 | |||||||||||||||||||||||||
Year Ended October 31, 2012 | 9.72 | 0.73 | 0.31 | 1.04 | (0.74 | ) | (0.16 | ) | (0.02 | ) | (0.92 | ) | 9.84 | |||||||||||||||||||||||
| * | Unaudited |
| (a) | Net investment income/(loss) is based on average shares outstanding during the period. |
| (b) | Not annualized for periods less than one year. |
| (c) | Includes interest expense that amounts to less than 0.01%. |
| (d) | Annualized for periods less than one year. |
Amounts listed as “–” are $0 or round to $0.
See accompanying Notes to Financial Statements.
| 50 | Semi-Annual Report 2017 |
Financial Highlights (concluded)
Selected Data for Each Share of Capital Outstanding Throughout the Periods Indicated
Aberdeen Global High Income Fund (concluded)
| Ratios/Supplemental Data | ||||||||||||||||||||||
| Total Return (b) | Net Assets at End of Period (000’s) | Ratio of Expenses (Net of Reimbursements/Waivers) to Average Net Assets (c)(d) | Ratio of Net Investment Income to Average Net Assets (d) | Ratio of Expenses (Prior to Reimbursements) to Average Net Assets (c)(d)(e) | Portfolio Turnover (b)(f) | |||||||||||||||||
| 5.31 | % | $ | 196,587 | 1.00 | % | 5.80 | % | 1.17 | % | 23 | % | |||||||||||
| 1.91 | % | 233,369 | 1.00 | % | 5.76 | % | 1.06 | % | 72 | % | ||||||||||||
| (6.01 | %)(g) | 522,964 | 1.00 | % | 6.43 | % | 1.04 | % | 79 | % | ||||||||||||
| 4.70 | % | 823,808 | 1.00 | % | 5.76 | % | 1.01 | % | 96 | % | ||||||||||||
| 10.20 | % | 999,250 | 0.99 | % | 6.83 | % | 1.00 | % | 57 | % | ||||||||||||
| 11.22 | % | 1,066,487 | 0.99 | % | 7.26 | % | 1.01 | % | 62 | % | ||||||||||||
| 5.43 | % | 218,104 | 0.75 | % | 6.02 | % | 0.90 | % | 23 | % | ||||||||||||
| 2.21 | % | 351,466 | 0.75 | % | 6.00 | % | 0.79 | % | 72 | % | ||||||||||||
| (5.85 | %) | 797,494 | 0.75 | % | 6.68 | % | 0.76 | % | 79 | % | ||||||||||||
| 5.01 | % | 1,561,293 | 0.74 | % | 6.01 | % | 0.75 | % | 96 | % | ||||||||||||
| 10.53 | % | 1,553,543 | 0.75 | % | 7.10 | % | 0.75 | % | 57 | % | ||||||||||||
| 11.49 | % | 2,130,565 | 0.73 | % | 7.53 | % | 0.74 | % | 62 | % | ||||||||||||
| (e) | During the period, certain fees were waived and/or reimbursed. If such waivers/reimbursements had not occurred, the ratios would have been as indicated. |
| (f) | Portfolio turnover is calculated on the basis of the Fund as a whole without distinguishing among the classes of shares. |
| (g) | The total return shown above includes the impact of financial statement adjustments to the NAV per share. |
| 2017 Semi-Annual Report | 51 |
April 30, 2017 (Unaudited)
1. Organization
Aberdeen Investment Funds (the “Trust”) was organized as a business trust under the laws of the State of Massachusetts by a Master Trust Agreement adopted on April 30, 1992 and is registered with the U.S. Securities and Exchange Commission (“SEC”) under the Investment Company Act of 1940, as amended (the “1940 Act”) as an open-end management investment company. As of April 30, 2017, the Trust offered four diversified, open-ended investment funds: Aberdeen Select International Equity Fund (the “Select International Equity Fund”), Aberdeen Select International Equity Fund II (the “Select International Equity Fund II”), Aberdeen Total Return Bond Fund (the “Total Return Bond Fund”), and Aberdeen Global High Income Fund (the “Global High Income Fund”). Each series of the Trust are also referred to herein as a “Fund” or collectively, the “Funds”.
Each of the Funds offers multiple share classes. As of April 30, 2017, all of the Funds offered Class A and Institutional Class shares. The classes of shares are offered to different types of investors and have different expense structures, as outlined in the Funds’ prospectus. Each class of shares has exclusive voting rights with respect to matters that affect that class. Income, realized gains and losses, unrealized appreciation and depreciation, and expenses that are not attributable to a specific class are allocated daily to each class based on its relative net assets. Expenses directly attributable to a Fund are charged to that Fund. Other expenses are allocated to the respective Fund based on average daily net assets.
Each Fund has distinct investment objectives. Following are the objectives for the Funds:
| Fund Name | Investment Objective | |
Select International Equity Fund | Seeks long-term growth of capital. | |
Select International Equity Fund II | Seeks long-term growth of capital. | |
Total Return Bond Fund | Seeks to provide total return, which is derived from capital appreciation and income. | |
Global High Income Fund | Seeks to maximize total return, principally through a high level of current income, and secondarily through capital appreciation. |
2. Summary of Significant Accounting Policies
The following is a summary of significant accounting policies followed by the Funds in the preparation of their financial statements. The policies conform to accounting principles generally accepted in the United States of America (“GAAP”). The preparation of financial statements requires management to make estimates and assumptions that affect the reported amounts of assets and liabilities, disclosure of contingent assets and liabilities at the date of the financial statements, and the reported amounts of income and expenses for the period. Actual results could differ from those estimates. The books and records of the Funds are maintained in U.S. Dollars.
| a. | Security Valuation |
The Funds value their securities at current market value or fair value, consistent with the Funds’ valuation procedures (the “Valuation Procedures”) and regulatory requirements. Equity securities that are traded on an exchange are valued at the last quoted sale price on the principal exchange on which the security is traded at the “Valuation Time” subject to application, when appropriate, of the valuation factors described in the paragraph below. Under normal circumstances, the Valuation Time is as of the close of regular trading on the New York Stock Exchange (usually 4:00 p.m. Eastern Time).
Each Fund’s assets for which market quotations are readily available are valued at fair value on the basis of quotations furnished by a pricing service or provided by securities dealers. Equity investments are generally valued using the last sale price or official closing price taken from the primary market in which each security trades, or if no sales occurred during the day, at the mean of the current quoted bid and ask prices.
Foreign equity securities that are traded on foreign exchanges that close prior to 4:00 p.m. Eastern time are valued by applying valuation factors to the last sale price or the mean price as noted above. Valuation factors are provided by an independent pricing service provider. These valuation factors are used when pricing a Fund’s portfolio holdings to estimate market movements between the time foreign markets close and the time a Fund values such foreign securities. These valuation factors are based on inputs such as depositary receipts, indices, futures, sector indices/ETFs, exchange rates, and local exchange opening and closing prices of each security. When prices with the application of valuation factors are utilized, the value assigned to the foreign securities may not be the same as quoted or published prices of the securities on their primary markets. Valuation factors are not utilized if the independent pricing service provider is unable to provide a valuation factor or if the valuation factor falls below a predetermined confidence threshold.
| 52 | Semi-Annual Report 2017 |
Notes to Financial Statements (continued)
April 30, 2017 (Unaudited)
After February 21, 2017, fixed income securities are generally valued using bid prices provided directly by independent third party services or provided directly from one or more broker dealers or market makers, each in accordance with the Valuation Procedures approved by the Trust’s Board of Trustees (the “Board”). Per an amendment to the Valuation Procedures that became effective February 21, 2017, fixed income securities, which previously had been generally valued using mid prices, are now valued using bid prices. The pricing services may use valuation models or matrix pricing, which consider yield or prices with respect to comparable bond quotations from bond dealers or by reference to other securities that are considered comparable in such characteristics as credit rating, interest rates and maturity date, to determine current fair value. Pricing services generally price debt securities assuming orderly transactions of an institutional “round lot” size and strategies employed by the Adviser generally trade in round lot sizes. In certain circumstances, some trades may occur in smaller “odd lot” size that may be affected at lower or higher prices than institutional round lot trades. If there are no current day bids, the security is valued at the previously applied bid. Short-term Fixed Income securities (such as commercial paper and U.S. treasury bills) having a remaining maturity of 60 days or less are valued at the last quoted or evaluated bid price on the valuation date provided by an independent pricing service, or on the basis of amortized cost if it represents the best approximation for fair value.
Assets and liabilities initially expressed in foreign currency will be converted into U.S. Dollar values. Short-term debt securities (such as commercial paper and U.S. treasury bills) having a remaining maturity of 60 days or less are valued at the last quoted or evaluated bid price on the valuation date provided by an independent pricing service, or on the basis of amortized cost if it represents the best approximation for fair value. To the extent each Fund invests in other open-ended funds, the Fund will calculate its net asset value (“NAV”) based upon the NAV of the underlying funds in which it invests. The prospectuses of these underlying funds explain the circumstances under which they will use good faith fair value pricing and the effects of such fair value pricing.
Short-term investments are comprised of cash and cash equivalents invested in short-term investment funds which are redeemable daily. The Fund sweeps available cash into the State Street Institutional U.S. Government Money Market Fund, a “government money market fund” pursuant to Rule 2a-7 under the Investment Company Act of 1940, as amended, which has an objective to maintain a $1.00 NAV, which is not guaranteed. Registered investment companies are valued at their net asset value as reported by such company. Generally, these investment types are categorized as Level 1 investments.
Derivative instruments are generally valued according to the following procedures. For forward currency exchange contracts the market value is interpolated by the pricing agent by using forward spot points obtained from an authorized pricing service. Futures contracts are generally valued at the most recent settlement price as of NAV determination. Generally for swap agreements, if quotes are unavailable from authorized pricing services swap pricing is determined using a modelling tool which considers and forecasts the impact of cash flow projections, prevailing and expected interest rate movements, and potential credit events. Swap prices are generally evaluated based upon the latest available data provided by the counterparty and rely upon an industry accepted modelling tool.
When market quotations or exchange rates are not readily available, or if the Funds’ investment adviser, Aberdeen Asset Management Inc. (the “Adviser”), concludes that such market quotations do not accurately reflect fair value, the fair value of a Fund’s assets are determined in good faith in accordance with the Valuation Procedures. For options, swaps and warrants, a fair value price may be determined using readily available market quotations, prices provided by independent pricing services, or by using modeling tools provided by industry accepted financial data service providers. Key inputs to such tools may include yield and prices from comparable or reference assets, maturity or expiration dates, ratings and interest rates. In addition, the Adviser, through its pricing committee, may determine the fair value price in accordance with the Valuation Procedures approved by the Board.
In accordance with the authoritative guidance on fair value measurements and disclosures under GAAP, the Funds disclose the fair value of their investments using a three-level hierarchy that classifies the inputs to valuation techniques used to measure the fair value. The hierarchy assigns Level 1 measurements to valuations based upon unadjusted quoted prices in active markets for identical assets, Level 2 measurements to valuations based upon significant observable inputs, including adjusted quoted prices in active markets for similar assets, and Level 3 measurements to valuations based upon unobservable inputs that are significant to the valuation. Inputs refer broadly to the assumptions that market participants would use in pricing the asset or liability, including assumptions about risk, for example, the risk inherent in a particular valuation technique used to measure fair value including a pricing model and/or the risk inherent in the inputs to the valuation technique. Inputs may be observable or unobservable. Observable inputs are inputs that reflect the assumptions market participants would use in pricing the asset or liability, which are based on market data obtained from sources independent of the reporting entity. Unobservable inputs are inputs that reflect the reporting entity’s own assumptions about the assumptions market participants would use in pricing the asset or liability developed based on the best information available in the circumstances. A financial instrument’s level within the fair value hierarchy is based upon the lowest level of any input that is significant to the fair value measurement. The three-level hierarchy of inputs is summarized below:
| • | Level 1- quoted prices in active markets for identical investments; |
| 2017 Semi-Annual Report | 53 |
Notes to Financial Statements (continued)
April 30, 2017 (Unaudited)
| • | Level 2- other significant observable inputs (including quoted prices for similar securities, interest rates, prepayment speeds, and credit risk); or |
| • | Level 3- significant unobservable inputs (including the Fund’s own assumptions in determining the fair value of investments). |
For movements between the Levels within the fair value hierarchy, the Funds have adopted a policy of recognizing transfers at the end of each period. As described above, certain foreign securities are valued utilizing valuation factors provided by an independent pricing service to reflect any significant market movements between the time foreign markets close and the time the Fund values such foreign securities. The utilization of valuation factors may result in transfers between Level 1 and Level 2.
During the six-month period ended April 30, 2017, Select International Equity Fund and Select International Equity Fund II had transfers between Level 1 and Level 2 because there was a valuation factor applied at April 30, 2017 that had not been applied at a prior period end or a valuation factor applied at a prior period end that was not applied at April 30, 2017. During the six-month period ended April 30, 2017, Global High Income Fund and Total Return Bond Fund had no transfers between levels. For the six-month period ended April 30, 2017, other than a change to the general valuation of fixed income securities to use bid prices rather than mid prices effective February 21, 2017, there were no significant changes to the fair valuation methodologies. The following is a summary of Funds which had significant transfers:
| Fund | Transfer from Level 1 | Transfer from Level 2 | ||||||
Select International Equity Fund | $5,444,252 | $– | ||||||
Select International Equity Fund II | $2,458,279 | $– | ||||||
The following is a summary of the inputs used as of April 30, 2017 in valuing the Funds’ investments and other financial instruments at fair value. The inputs or methodology used for valuing securities are not necessarily an indication of the risk associated with investing in those securities.
| Investments, at Value | LEVEL 1–Quoted Prices ($) | LEVEL 2–Other Significant Observable Inputs ($) | LEVEL 3–Significant Unobservable Inputs ($) | Total ($) | ||||||||||||
| Select International Equity Fund | ||||||||||||||||
| Investments in Securities | ||||||||||||||||
Common Stocks | 25,709,625 | 177,265,896 | – | 202,975,521 | ||||||||||||
Closed-End Funds | – | (1) | – | – | – | |||||||||||
Government Bonds | – | (1) | – | – | – | |||||||||||
Preferred Stocks | 5,518,705 | 12,739,574 | – | 18,258,279 | ||||||||||||
Short-Term Investment | 9,815,448 | – | – | 9,815,448 | ||||||||||||
|
|
|
|
|
|
|
| |||||||||
| 41,043,778 | 190,005,470 | – | 231,049,248 | |||||||||||||
|
|
|
|
|
|
|
| |||||||||
1 Represents a security that is fair valued at zero pursuant to procedures approved by the Fund’s Board of Trustees. |
| |||||||||||||||
| Select International Equity Fund II | ||||||||||||||||
| Investments in Securities | ||||||||||||||||
Common Stocks | 10,879,280 | 76,443,749 | – | 87,323,029 | ||||||||||||
Preferred Stocks | 1,938,563 | 5,549,034 | – | 7,487,597 | ||||||||||||
Short-Term Investment | 2,583,165 | – | – | 2,583,165 | ||||||||||||
|
|
|
|
|
|
|
| |||||||||
| 15,401,008 | 81,992,783 | – | 97,393,791 | |||||||||||||
|
|
|
|
|
|
|
| |||||||||
| Total Return Bond Fund | ||||||||||||||||
| Investments in Securities | ||||||||||||||||
Asset-Backed Securities | – | 39,053,222 | – | 39,053,222 | ||||||||||||
Commercial Mortgage-Backed Securities | �� | – | 31,931,105 | – | 31,931,105 | |||||||||||
Non-Agency Mortgage-Backed Securities | – | 34,384,023 | – | 34,384,023 | ||||||||||||
Corporate Bonds | – | 101,049,637 | – | 101,049,637 | ||||||||||||
Municipal Bonds | – | 15,622,280 | – | 15,622,280 | ||||||||||||
Government Bonds | – | 32,221,233 | – | 32,221,233 | ||||||||||||
U.S. Agencies | – | 46,763,970 | – | 46,763,970 | ||||||||||||
| 54 | Semi-Annual Report 2017 |
Notes to Financial Statements (continued)
April 30, 2017 (Unaudited)
| Investments, at Value | LEVEL 1–Quoted Prices ($) | LEVEL 2–Other Significant Observable Inputs ($) | LEVEL 3–Significant Unobservable Inputs ($) | Total ($) | ||||||||||||
| Total Return Bond Fund (continued) | ||||||||||||||||
| Investments in Securities (continued) | ||||||||||||||||
U.S. Treasuries | – | 39,325,604 | – | 39,325,604 | ||||||||||||
Agency Mortgage-Backed Securities | – | 6,311,297 | – | 6,311,297 | ||||||||||||
Short-Term Investment | 8,073,154 | – | – | 8,073,154 | ||||||||||||
| Other Financial Instruments | ||||||||||||||||
| Assets: | ||||||||||||||||
Futures Contracts | 176,970 | – | – | 176,970 | ||||||||||||
Forward Foreign Currency Exchange Contracts | – | 2,180,919 | – | 2,180,919 | ||||||||||||
| Liabilities: | ||||||||||||||||
Futures Contracts | (127,292 | ) | – | – | (127,292 | ) | ||||||||||
Forward Foreign Currency Exchange Contracts | – | (1,085,662 | ) | – | (1,085,662 | ) | ||||||||||
Interest Rate Swap Agreements | – | (134,775 | ) | – | (134,775 | ) | ||||||||||
|
|
|
|
|
|
|
| |||||||||
| 8,122,832 | 347,622,853 | – | 355,745,685 | |||||||||||||
|
|
|
|
|
|
|
| |||||||||
| Global High Income Fund | ||||||||||||||||
| Investments in Securities | ||||||||||||||||
Corporate Bonds | – | 378,301,248 | 1,924,091 | 380,225,339 | ||||||||||||
Government Bonds | – | 1,701,000 | – | 1,701,000 | ||||||||||||
Bank Loans | – | 4,826,681 | 2,806,364 | 7,633,045 | ||||||||||||
Short-Term Investment | 25,220,319 | – | – | 25,220,319 | ||||||||||||
| Other Financial Instruments | ||||||||||||||||
| Assets: | ||||||||||||||||
Forward Foreign Currency Exchange Contracts | – | 1,087,710 | – | 1,087,710 | ||||||||||||
| Liabilities: | ||||||||||||||||
Forward Foreign Currency Exchange Contracts | – | (2,381,300 | ) | – | (2,381,300 | ) | ||||||||||
Credit Default Swap Contracts | – | (170,072 | ) | – | (170,072 | ) | ||||||||||
|
|
|
|
|
|
|
| |||||||||
| 25,220,319 | 383,365,267 | 4,730,455 | 413,316,041 | |||||||||||||
|
|
|
|
|
|
|
| |||||||||
| Amounts | listed as “–” are $0 or round to $0. |
Global High Income Fund Rollforward of Level 3 Fair Value Measurement For the Period Ended April 30, 2017 | ||||||||||||||||||||||||||||||||||||||||
| Investments in Securities | Balance as of October 31, 2016 | Accrued Discounts (Premiums) | Realized Gain (Loss) | Change in Unrealized Appreciation (Depreciation) | Net Purchases | Net Sales | Net Transfers in to Level 3 | Net Transfers out of Level 3 | Balance as of April 30, 2017 | Change in Unrealized Appreciation (Depreciation) from Investments Held at April 30, 2017 | ||||||||||||||||||||||||||||||
BANK LOANS | ||||||||||||||||||||||||||||||||||||||||
Italy | $ | 2,917,045 | $ | 6,209 | $ | (21,741 | ) | $ | (16,391 | ) | $ | – | (78,758 | ) | $ | – | $ | – | $ | 2,806,364 | $ | (16,391 | ) | |||||||||||||||||
COMMON STOCK | ||||||||||||||||||||||||||||||||||||||||
Norway | 1,071,207 | – | (25,999,162 | ) | 29,011,918 | – | (4,083,963 | ) | – | – | – | – | ||||||||||||||||||||||||||||
United States | – | – | – | – | – | – | – | – | – | – | ||||||||||||||||||||||||||||||
CORPORATE BONDS | ||||||||||||||||||||||||||||||||||||||||
Canada | 1,886,603 | 5,379 | – | (38,204 | ) | – | – | – | – | 1,853,778 | (38,203 | ) | ||||||||||||||||||||||||||||
United States | 56,250 | – | – | 14,063 | – | – | – | – | 70,313 | 14,063 | ||||||||||||||||||||||||||||||
TOTAL | $ | 5,931,105 | $ | 11,588 | $ | (26,020,903 | ) | $ | 28,971,386 | $ | – | $ | (4,162,721 | ) | $ | – | $ | – | $ | 4,730,455 | $ | (40,531 | ) | |||||||||||||||||
| 2017 Semi-Annual Report | 55 |
Notes to Financial Statements (continued)
April 30, 2017 (Unaudited)
The following is quantitative information about level 3 fair value measurements:
| Description | Fair Value at 4/30/17 ($) | Valuation Technique(s) | Unobservable Inputs | Range | Weighted Average | |||||||||||||||
Global High Income Fund | ||||||||||||||||||||
Bank Loans | $ | 2,806,364 | Broker Pricing | Bid/Ask Spread | $ | 108.1 | $ | 108.1 | ||||||||||||
Corporate Bonds | 1,924,091 | Broker Pricing/Last Sale | Bid/Ask Spread | 4.7 - 25.6 | 22 | |||||||||||||||
Broker Pricing: Includes indicative broker quotes that cannot be corroborated by observable market data.
| b. | Restricted Securities |
Restricted securities are privately-placed securities whose resale is restricted under U.S. securities laws. The Funds may invest in restricted securities, including unregistered securities eligible for resale without registration pursuant to Rule 144A and privately-placed securities of U.S. and non-U.S. issuers offered outside the U.S. without registration pursuant to Regulation S under the Securities Act of 1933, as amended. Rule 144A securities may be freely traded among certain qualified institutional investors, such as the Funds, but resale of such securities in the U.S. is permitted only in limited circumstances.
The following Fund owned private placement investments that were purchased through private offerings or acquired through initial public offerings and cannot be sold without prior registration under the Securities Act of 1933 or pursuant to an exemption therefrom. In addition, this Fund has generally agreed to further restrictions on the disposition of certain holdings as set forth in various agreements entered into in connection with the purchase of these private placement investments. The acquisition dates of these investments, the date the enforceable right to acquire these private placement investments was obtained, along with the cost and values at April 30, 2017, are as follows:
Shares/Face Amount | Acquisition Date | Right to Acquire Date | Cost | Market Value | Percentage of Net Assets | |||||||||||||||||||
Global High Income Fund | ||||||||||||||||||||||||
SCM Insurance Services, Inc. | 7,230,000 | 8/21/2014 | 8/21/2014 | $6,527,224 | $1,853,778 | 0.45% | ||||||||||||||||||
| c. | Foreign Currency Translation |
Foreign currency amounts are translated into U.S. Dollars at the current rate of exchange as of Valuation Time to determine the value of investments, assets and liabilities. Purchases and sales of securities, and income and expenses are translated at the prevailing rate of exchange on the respective date of these transactions. The Funds do not isolate that portion of the results of operations resulting from changes in foreign exchange rates on investments from fluctuations arising from changes in market prices of securities held. These fluctuations are included with the net realized and unrealized gain or loss from investments and foreign currencies within the Statements of Operations.
Foreign securities, currencies, and other assets and liabilities denominated in foreign currencies are translated into U.S. Dollars at the exchange rate of said currencies against the U.S. Dollar, as of the Valuation Time, as provided by an independent pricing service.
Investments in emerging markets can be riskier and more volatile than investments in the United States and other developed markets. Adverse political and economic developments can make it more difficult for the Select International Equity Fund and Select International Equity Fund II to sell foreign securities which could reduce the NAV of the Funds. In contrast to more established markets, emerging markets may have governments that are less stable and markets that are less liquid, increasing your investment risk. At April 30, 2017, the Select International Equity Fund held Venezuelan securities and held Venezuelan Bolivar. Venezuela currently imposes foreign exchange controls which prohibit the Select International Equity Fund from repatriating dividends, interest, or other income from investments or proceeds from the sale of Venezuelan securities. The Venezuelan securities and Venezuelan Bolivar have been fair valued at $0.00.
| d. | Derivative Financial Instruments |
Certain Funds are authorized to use derivatives to manage currency risk, credit risk, and interest rate risk and to replicate, or use as a substitute for, physical securities. Losses may arise due to changes in the value of the contract or if the counterparty does not perform under the contract. The use of derivative instruments involves, to varying degrees, elements of market risk in excess of the amount recognized in the Statements of Assets and Liabilities.
Forward Foreign Currency Exchange Contracts
A forward foreign currency exchange contract (“forward contract”) involves an obligation to purchase and sell a specific currency at a future date, which may be any fixed number of days from the date of the contract agreed upon by the parties, at a price set at the time of the contract. Forward contracts are used to manage a Fund’s currency exposure in an efficient manner. They are used to sell unwanted currency
| 56 | Semi-Annual Report 2017 |
Notes to Financial Statements (continued)
April 30, 2017 (Unaudited)
exposure that comes with holding securities in a market, or to buy currency exposure where the exposure from holding securities is insufficient to give the desired currency exposure either in absolute terms or relative to the benchmark. The use of forward contracts allows the separation of decision-making between markets and their currencies. The forward contract is marked-to-market daily and the change in market value is recorded by a Fund as unrealized appreciation or depreciation. Forward contracts’ prices are received daily from an independent pricing provider. When the forward contract is closed, a Fund records a realized gain or loss equal to the difference between the value at the time it was opened and the value at the time it was closed. These realized and unrealized gains and losses are reported on the Statements of Operations. During the six-month period ended April 30, 2017, the Funds used forward contracts to hedge some of the Funds’ foreign currency holdings. Managing active currency risk involves both hedging currency risk and adding currency risk in excess of underlying bond positions. A Fund may also enter into forward contracts to obtain potential appreciation of a foreign currency, which also adds currency risk.
Futures Contracts
Certain Funds may invest in financial futures contracts (“futures contracts”) for the purpose of hedging their existing portfolio securities, or securities that a Fund intends to purchase, against fluctuations in value caused by changes in prevailing market interest rates or prices. Futures contracts may also be entered into for non-hedging purposes; however, in those instances the aggregate initial margin and premiums required to establish a Fund’s positions may not exceed 5% of a Fund’s NAV after taking into account unrealized profits and unrealized losses on any such contract it has entered.
Upon entering into a futures contract, a Fund is required to pledge to the broker an amount of cash and/or other assets equal to a certain percentage of the contract amount. This payment is known as “initial margin”. Subsequent payments, known as “variation margin,” are calculated each day, depending on the daily fluctuations in the fair value/market value of the underlying assets. An unrealized gain/(loss) equal to the variation margin is recognized on a daily basis. When the contract expires or is closed, the gain/(loss) is realized and is presented in the Statements of Operations as a net realized gain/(loss) on futures contracts. Futures contracts are valued daily at their last quoted sale price on the exchange on which they are traded.
A “sale” of a futures contract means a contractual obligation to deliver the securities or foreign currency called for by the contract at a fixed price at a specified time in the future. A “purchase” of a futures contract means a contractual obligation to acquire the securities or foreign currency at a fixed price at a specified time in the future.
Should market conditions change unexpectedly, a Fund may not achieve the anticipated benefits of the futures contracts and may realize a loss. The use of futures transactions for hedging purposes involves the risk of imperfect correlation in movements in the price of futures contracts, interest rates and the value/market value of the underlying hedged assets. During the six-month period ended April 30, 2017, U.S. Treasury futures contracts were used to manage Total Return Bond Fund’s overall curve and interest rate exposure.
Options
Options are instruments that provide a right to buy (call) or sell (put) a particular security or an index of securities at a fixed price within a certain time period. Options differ from forward and futures contracts in that the buyer of the option has no obligation to perform under the contract. An option is out-of-the money if the exercise price of the option is above, in the case of a call option, or below, in the case of a put option, the current price (or interest rate or yield for certain options) of the referenced security or instrument. Use of put and call options may result in losses to a Fund, force the sale or purchase of portfolio securities at inopportune times or for prices higher than (in the case of put options) or lower than (in the case of call options) current market values, limit the amount of appreciation a Fund can realize on its investments or cause a Fund to hold a security it might otherwise sell. The Funds did not hold options as of April 30, 2017.
Swaps
The Total Return Bond Fund enters into interest rate swaps to manage interest-rate exposure. The Global High Income Fund uses credit default swaps to gain, or hedge, exposure to specific companies. A swap is an agreement that obligates two parties to exchange a series of cash flows and/or meet certain obligations at specified intervals based upon or calculated by reference to changes in specified prices or rates (interest rates in the case of interest rate swaps, currency exchange rates in the case of currency swaps) or the occurrence of a credit event with respect to an underlying reference obligation (in the case of a credit default swap) for a specified amount of an underlying asset or notional principal amount. The Fund will enter into swaps only on a net basis, which means that the two payment streams are netted out, with the Fund receiving or paying, as the case may be, only the amount of the difference between the two payments. Except for currency swaps and credit default swaps, the notional principal amount is used solely to calculate the payment streams but is not exchanged. With respect to currency swaps, actual principal amounts of currencies may be exchanged by the counterparties at the initiation, and again upon the termination of the transaction.
Traditionally, swaps were customized, privately negotiated agreements executed between two parties (“OTC Swaps”) but since 2013, certain swaps are required to be cleared pursuant to rules and regulations related to the Dodd–Frank Wall Street Reform and Consumer Protection
| 2017 Semi-Annual Report | 57 |
Notes to Financial Statements (continued)
April 30, 2017 (Unaudited)
Act (“Dodd Frank”) and/or Regulation (EU) No 648/2012 on OTC Derivatives, Central Counterparties and Trade Repositories (“EMIR”). (“Cleared Swaps”). Like OTC Swaps, Cleared Swaps are negotiated bilaterally. Unlike OTC Swaps, the act of clearing results in two swaps executed between each of the parties and a central counterparty (“CCP”), and thus the counterparty credit exposure of the parties is to the CCP rather than to one another. Upon entering into a Cleared Swap, a Fund is required to pledge an amount of cash and/or other assets equal to a certain percentage of the contract amount. This payment is known as “initial margin”. Subsequent payments, known as “variation margin,” are calculated each day, depending on the daily fluctuations in the fair value/market value of the underlying assets. An unrealized gain/(loss) equal to the variation margin is recognized on a daily basis. When the contract matures or is terminated, the gain or loss is realized and is presented in the Statements of Operations as a net realized gain or loss on swap contracts. As of March 2017, a Fund may be required to provide variation and/or initial margin for OTC Swaps pursuant to further rules and regulations related to Dodd Frank and EMIR. The margin requirements associated with OTC Swaps and Cleared Swaps may not be the same.
Entering into swap agreements involves, to varying degrees, elements of credit, market and interest risk in excess of the amounts reported on the Statement of Assets and Liabilities. Such risks involve the possibility that there will be no liquid market for these agreements, that the counterparty to the agreements may default on its obligation to perform and that there may be unfavorable changes in the value of the index or securities underlying the agreement. The Funds’ maximum risk of loss from counterparty risk related to swaps is the fair value of the contract. This risk is mitigated by the posting of collateral by the counterparties to the Funds to cover the Funds’ exposure to the counterparty.
Interest Rate Swaps
A Fund uses interest rate swap contracts to manage its exposure to interest rates. Interest rate swap contracts typically represent the exchange between a Fund and a counterparty of respective commitments to make variable rate and fixed rate payments with respect to a notional amount of principal. Interest rate swap contracts may have a term that is greater than one year, but typically require periodic interim settlement in cash, at which time the specified value of the variable interest rate is reset for the next settlement period. Net payments of interest are recorded as realized gains or losses. During the period that the swap contract is open, the contract is marked-to-market as the net amount due to or from a Fund and changes in the value of swap contracts are recorded as unrealized gains or losses.
Credit Default Swaps
A credit default swap is an agreement whereby one party, the buyer, is obligated to pay the other party, the seller, a periodic stream of payments over the term of the contract in return for a contingent payment upon the occurrence of a credit event with respect to an underlying reference obligation. A Fund might use credit default swap contracts to limit or to reduce risk exposure of the Fund to defaults of corporate and sovereign issues (i.e., to reduce risk when the Fund owns or has exposure to such issuers). A Fund also might use credit default swap contracts to create direct or synthetic short or long exposure to domestic or foreign corporate debt securities or certain sovereign debt securities to which the Fund is not otherwise exposed.
Summary of Derivative Instruments
The Fund may use derivatives for various purposes as noted above.
| Location on the Statement of Assets and Liabilities | ||||
| Derivative Instrument Risk Type | Asset Derivatives | Liability Derivatives | ||
Interest Rate Risk | Variation margin receivable for futures contracts Variation margin receivable for centrally cleared interest rate swap contracts | Variation margin payable for futures contracts Variation margin payable for centrally cleared interest rate swap contracts | ||
Foreign Exchange Risk | Unrealized appreciation on forward foreign currency exchange contracts | Unrealized depreciation on forward foreign currency exchange contracts | ||
Credit Risk | Variation margin receivable for centrally cleared credit default swap contracts | Variation margin payable for centrally cleared credit default swap contracts | ||
| 58 | Semi-Annual Report 2017 |
Notes to Financial Statements (continued)
April 30, 2017 (Unaudited)
The following is a summary of the fair value of Derivative Instruments, not accounted for as hedging instruments, as of April 30, 2017:
| Total Return Bond Fund | Asset Derivatives | Liability Derivatives | ||||||||||
| Period Ended April 30, 2017 | Period Ended April 30, 2017 | |||||||||||
| Derivatives not accounted for as hedging instruments and risk exposure | Statement of Assets and Liabilities Location | Fair Value | Statement of Assets and Liabilities Location | Fair Value | ||||||||
| Interest rate swaps | ||||||||||||
(interest rate risk) | Variation margin receivable for centrally cleared interest rate swaps | $ | – | Variation margin payable for centrally cleared interest rate swaps | $ | 1,504 | ||||||
| Forward foreign exchange contracts | ||||||||||||
(foreign exchange risk) | Unrealized appreciation on forward currency exchange contracts | 2,180,919 | Unrealized depreciation on forward currency exchange contracts | 1,085,662 | ||||||||
| Futures contracts | ||||||||||||
(interest rate risk) | Variation margin receivable for futures contracts | 455,033 | Variation margin payable for futures contracts | – | ||||||||
Total | $ | 2,635,952 | $ | 1,087,166 | ||||||||
| Global High Income Fund | Asset Derivatives | Liability Derivatives | ||||||||||
| Period Ended April 30, 2017 | Period Ended April 30, 2017 | |||||||||||
| Derivatives not accounted for as hedging instruments and risk exposure | Statement of Assets and Liabilities Location | Fair Value | Statement of Assets and Liabilities Location | Fair Value | ||||||||
| Credit default swaps | ||||||||||||
(credit risk) | Variation margin receivable for centrally cleared credit default swaps | $ | – | Variation margin payable for centrally cleared credit default swaps | $ | 4,535 | ||||||
| Forward foreign exchange contracts | ||||||||||||
(foreign exchange risk) | Unrealized appreciation on forward currency exchange contracts | 1,087,710 | Unrealized depreciation on forward currency exchange contracts | 2,381,300 | ||||||||
Total | $ | 1,087,710 | $ | 2,385,835 | ||||||||
| 2017 Semi-Annual Report | 59 |
Notes to Financial Statements (continued)
April 30, 2017 (Unaudited)
A reconciliation of the gross amounts on the Statements of Assets and Liabilities as of April 30, 2017 to the net amounts by broker and derivative type, including any collateral received or pledged, is included in the following tables:
| Gross Amounts Not Offset in Statement of Assets & Liabilities | Gross Amounts Not Offset in Statement of Assets and Liabilities | |||||||||||||||||||||||||||||||
| Description | Gross Amounts Position | Financial Instruments | Collateral Received (1) | Net Amount (3) | Gross Amounts of Liabilities Presented in Statement of Financial Position | Financial Instruments | Collateral Pledged (1) | Net Amount (3) | ||||||||||||||||||||||||
| Assets | Liabilities | |||||||||||||||||||||||||||||||
| Total Return Bond Fund | ||||||||||||||||||||||||||||||||
Forward foreign currency (2) | ||||||||||||||||||||||||||||||||
Barclays Bank | $ | 461,056 | $ | (265,133 | ) | $ | – | $ | 195,923 | $ | 265,133 | $ | (265,133 | ) | $ | – | $ | – | ||||||||||||||
Citibank | 207,066 | (206,432 | ) | – | 634 | 206,432 | (206,432 | ) | – | – | ||||||||||||||||||||||
Goldman Sachs | 143,574 | (143,574 | ) | – | – | 157,057 | (143,574 | ) | – | 13,483 | ||||||||||||||||||||||
HSBC Bank | 463,824 | (278,534 | ) | – | 185,290 | 278,534 | (278,534 | ) | – | – | ||||||||||||||||||||||
JPMorgan Chase | 3,184 | – | – | 3,184 | – | – | – | – | ||||||||||||||||||||||||
Royal Bank of Canada | 357,417 | (22,255 | ) | – | 335,162 | 22,255 | (22,255 | ) | – | – | ||||||||||||||||||||||
UBS | 87,541 | (87,541 | ) | – | – | 156,251 | (87,541 | ) | – | 68,710 | ||||||||||||||||||||||
Westpac Banking Corp. | 457,257 | – | – | 457,257 | – | – | – | – | ||||||||||||||||||||||||
| (1) | In some instances, the actual collateral received and/or pledged may be more than the amount shown here due to overcollateralization. |
| (2) | Includes financial instrument (forwards) which are not subject to a master netting arrangement across funds, or another similar arrangement. |
| (3) | Net amounts represent the net receivables/(payable) that would be due from/to the counterparty in the event of default. Exposure from financial derivative instruments can only be netted across transactions governed under the same master netting arrangements with the same legal entity. |
| Gross Amounts Not Offset in Statement of Assets & Liabilities | Gross Amounts Not Offset in Statement of Assets and Liabilities | |||||||||||||||||||||||||||||||
| Description | Gross Amounts of Assets Presented in Statement of Financial Position | Financial Instruments | Collateral Received (1) | Net Amount (3) | Gross Amounts of Liabilities Presented in Statement of Financial Position | Financial Instruments | Collateral Pledged (1) | Net Amount (3) | ||||||||||||||||||||||||
| Assets | Liabilities | |||||||||||||||||||||||||||||||
| Global High Income Fund | ||||||||||||||||||||||||||||||||
Forward foreign currency (2) | ||||||||||||||||||||||||||||||||
Citibank | $ | 360,454 | $ | (360,454 | ) | $ | – | $ | – | $ | 2,247,268 | $ | (360,454 | ) | $ | – | $ | 1,886,814 | ||||||||||||||
Goldman Sachs | 102,129 | – | – | 102,129 | – | – | – | – | ||||||||||||||||||||||||
HSBC Bank | 197,881 | – | – | 197,881 | – | – | – | – | ||||||||||||||||||||||||
Royal Bank of Canada | 427,246 | (131,627 | ) | – | 295,619 | 131,627 | (131,627 | ) | – | – | ||||||||||||||||||||||
UBS | – | – | – | – | 2,405 | – | – | 2,405 | ||||||||||||||||||||||||
| (1) | In some instances, the actual collateral received and/or pledged may be more than the amount shown here due to overcollateralization. |
| (2) | Includes financial instrument (forwards) which are not subject to a master netting arrangement across funds, or another similar arrangement. |
| (3) | Net amounts represent the net receivables/(payable) that would be due from/to the counterparty in the event of default. Exposure from financial derivative instruments can only be netted across transactions governed under the same master netting arrangements with the same legal entity. |
| 60 | Semi-Annual Report 2017 |
Notes to Financial Statements (continued)
April 30, 2017 (Unaudited)
The Effect of Derivative Instruments on the Statement of Operations for the six-month period ended April 30, 2017:
| Total Return Bond Fund | ||||||||||
| Derivatives not accounted for as hedging instruments | Location of Gain or (Loss) on Derivatives | Realized Gain or (Loss) on Derivatives | Change in Unrealized Appreciation/ (Depreciation) on Derivatives | |||||||
| Realized/Unrealized Gain/(Loss) from Investments, Futures Contracts and Foreign Currency Transactions | ||||||||||
| Interest rate swaps | ||||||||||
(interest rate risk) | $ | 9,446 | $ | (125,242 | ) | |||||
| Forward foreign exchange contracts | ||||||||||
(foreign exchange risk) | (745,815 | ) | 912,143 | |||||||
| Futures contracts | ||||||||||
(interest rate risk) | 493,273 | (227,650 | ) | |||||||
Total | $ | (243,096 | ) | $ | 559,251 | |||||
| Global High Income Fund | ||||||||||
| Derivatives not accounted for as hedging instruments | Location of Gain or (Loss) on Derivatives | Realized Gain or (Loss) on Derivatives | Change in Unrealized Appreciation/ (Depreciation) on Derivatives | |||||||
| Realized/Unrealized Gain/(Loss) from Investments, Futures Contracts and Foreign Currency Transactions | ||||||||||
| Credit default swaps | ||||||||||
(credit risk) | $ | (12,941 | ) | $ | (170,072 | ) | ||||
| Forward foreign exchange contracts | ||||||||||
(foreign exchange risk) | 5,419,720 | (5,722,236 | ) | |||||||
Total | $ | 5,406,779 | $ | (5,892,308 | ) | |||||
Information about derivatives reflected as of the date of this report is generally indicative of the type of activity for the six-month period ended April 30, 2017. The table below summarizes the weighted average values of derivatives holdings by the Funds during the six-month period ended April 30, 2017.
| Fund | Purchase Forward Foreign Currency Contracts (Average Notional Value) | Sale Forward | Long Futures Contracts (Average Notional Value) | Short Futures Contracts (Average Notional Value) | Credit Default Swaps (Average Notional Value) | Interest Rate Swaps (Average Notional Value) | ||||||||||||||||||
Total Return Bond Fund | $ | 110,143,419 | $ | 152,435,425 | $ | 41,178,033 | $ | 11,411,300 | $ | – | $ | 22,983,333 | ||||||||||||
Global High Income Fund | 95,752,509 | 179,778,440 | – | – | 4,702,500 | – | ||||||||||||||||||
The Funds value derivatives at fair value, as described in the results of operations. Accordingly, the Funds do not follow hedge accounting even for derivatives employed as economic hedges.
| 2017 Semi-Annual Report | 61 |
Notes to Financial Statements (continued)
April 30, 2017 (Unaudited)
| e. | Bank Loans |
Global High Income Fund may invest in bank loans. Bank loans include floating and fixed-rate debt obligations. Floating rate loans are debt obligations issued by companies or other entities with floating interest rates that reset periodically. Bank loans may include, but are not limited to, term loans, delayed funding loans, bridge loans and revolving credit facilities. Loan interest will primarily take the form of assignments purchased in the primary or secondary market but may include participants. Floating rate loans are secured by specific collateral of the borrower and are senior to most other securities of the borrower (e.g., common stock or debt instruments) in the event of bankruptcy. Floating rate loans are often issued in connection with recapitalizations, acquisitions, leveraged buyouts, and refinancings. Floating rate loans are typically structured and administered by a financial institution that acts as the agent of the lenders participating in the floating rate loan. Floating rate loans may be acquired directly through the agent, as an assignment from another lender who holds a direct interest in the floating rate loan, or as a participation interest in another lender’s portion of the floating rate loan.
Global High Income Fund may enter into, or acquire participation in, delayed funding loans and revolving credit facilities. Delayed funding loans and revolving credit facilities are borrowings in which the Global High Income Fund agrees to make loans up to a maximum amount upon demand by the borrowing issuer for a specified term. A revolving credit facility differs from a delayed funding loan in that as the borrowing issuer repays the loan, an amount equal to the repayment is again made available to the borrowing issuer under the facility. The borrowing issuer may at any time borrow and repay amounts so long as, in the aggregate, at any given time the amount borrowed does not exceed the maximum amount established by the loan agreement. Delayed funding loans and revolving credit facilities usually provide for floating or variable rates of interest.
There are a number of risks associated with an investment in bank loans including credit risk, interest rate risk, illiquid securities risk, and prepayment risk. There is also the possibility that the collateral securing a loan, if any, may be difficult to liquidate or be insufficient to cover the amount owed under the loan. These risks could cause a Fund to lose income or principal on a particular investment, which in turn could affect the Fund’s returns. In addition, bank loans may settle on a delayed basis, resulting in the proceeds from the sale of such loans not being readily available to make additional investments or to meet a Fund’s redemption obligations. To the extent the extended settlement process gives rise to short-term liquidity needs, a Fund may hold additional cash, sell investments or temporarily borrow from banks or other lenders.
As of April 30, 2017, none of the Funds held unfunded commitments or bridge loans.
| f. | Security Transactions, Investment Income and Expenses |
Security transactions are recorded on the trade date. Realized and unrealized gains/(losses) from security and currency transactions are calculated on the identified cost basis. Dividend income is recorded on the ex-dividend date except for certain dividends on foreign securities, which are recorded as soon as a Fund is informed after the ex-dividend date. Interest income is recorded on an accrual basis using the effective interest method. Expenses are recorded on an accrual basis. Expenses directly attributable to a Fund are charged to that Fund. Expenses not directly attributable to a Fund are allocated proportionately among all Funds of the Trust. For each of the Funds, the method for allocating income, fund level expenses, and realized and unrealized gains or losses among classes is based on the total net asset value of each class’s shares in proportion to the total net assets of the relevant Fund. Expenses specific to a class (such as Rule 12b-1 and Transfer Agent fees) are charged to that class.
| g. | Foreign Taxes |
Funds that invest in foreign securities are subject to foreign taxes that may be imposed by certain countries in which the Funds invest. The Funds generally record foreign taxes based on applicable foreign tax law. The Funds incur withholding taxes on certain foreign dividends and interest, and those taxes are accrued at the time the associated income is recorded. The Funds file withholding tax reclaims in certain jurisdictions to recover a portion of amounts previously withheld. The Funds record a reclaim receivable based on, among other things, a jurisdiction’s legal obligation to pay reclaims as well as payment history and market convention.
The Aberdeen Select International Equity Fund and Aberdeen Select International Equity Fund II (collectively, the “International Equity Funds”) have received payments for Article 63 EU Tax Reclaims related to prior years (2005-2015). The Article 63 EU Tax Reclaim payments received by the International Equity Funds from certain EU countries as of the date of this report significantly increased the Select International Equity Fund’s performance from December 16, 2016 and the Select International Equity Fund II’s performance from February 1, 2017. Without these payments, each International Equity Fund’s performance would have been lower during this period. In the tax years for which the International Equity Funds filed Article 63 EU Tax Reclaims, certain shareholders were able to reduce their federal income taxes based upon the amount of taxes that these Funds paid to foreign jurisdictions. The receipt by the International Equity Funds of the tax reclaims from these jurisdictions will also result in tax liability to the relevant Fund to offset the tax benefits that shareholders received in the past, the precise amount of the tax is uncertain and subject to settlement negotiations with the U.S. IRS. Based on information available as of the date of this report, an estimated tax amount has been accrued and is reflected within each International Equity Fund’s net asset value and performance. Furthermore, upon final determination of the U.S. IRS, if the actual tax payable is greater than the amount currently accrued, and subject to the level of assets under management at the time of any subsequent adjustments, the relevant International Equity Fund’s expenses, net asset value and performance may be materially adversely impacted.
| 62 | Semi-Annual Report 2017 |
Notes to Financial Statements (continued)
April 30, 2017 (Unaudited)
The International Equity Funds have Article 63 EU Tax Reclaims outstanding related to prior years (2005-2015). Consistent with U.S. GAAP accrual requirements, the International Equity Funds have recognized the Article 63 EU Tax Reclaims when a payment has been received, and have not recorded a receivable amount for any outstanding Article 63 EU Tax Reclaims because there is limited historical precedent for U.S. funds collecting reclaims of this magnitude and the total amount of the reclaims that these funds may receive in the future is uncertain. Any additional amounts to which the International Equity Funds may be entitled, if and when recorded, likely would result in an increase in the net asset value per share of each fund at that time. In addition, Article 63 EU Tax Reclaims amounts received will be subject to tax. The U.S. Internal Revenue Service has not yet determined the amount of taxes that the Fund must pay on these amounts. For tax accounting purposes, these payments are treated as income and will be distributed in due course. As of April 30, 2017, the total amount of reclaims filed for which no payments have been received by the International Equity Funds in the countries that may be affected by the European courts’ decisions (namely, The Netherlands, Spain, Germany, France, Poland, and Sweden) represents approximately 5.4% and 8.8%, respectively, of the net asset value per share of Select International Equity Fund and Select International Equity Fund II before the impact of interest or any tax or additional costs incurred in the pursuit of such reclaims.
The payments received on tax reclaims within the current period and from prior periods were as follows:
| Amount | Percent of Total Net Assets | Received Date Range | ||||||||
Select International Equity Fund | ||||||||||
Withholding Tax Refunds Received from Country: | ||||||||||
Finland | $1,355,000 | 0.35 | %* | 5/21/2015 | ||||||
Poland | 15,963,000 | 7.01 | %** | 12/16/17-2/24/17 | ||||||
Select International Equity Fund II | ||||||||||
Withholding Tax Refunds Received from Country: | ||||||||||
Finland | $500,000 | 0.25 | %* | 5/21/2015 | ||||||
Poland | 4,300,000 | 4.44 | %** | 2/1/2017-2/24/17 | ||||||
| * | As of October 31, 2015 |
| ** | As of April 30, 2017 |
| h. | Distributions |
Distributions from net investment income, if any, are declared and paid monthly for the Total Return Bond Fund and Global High Income Fund. Distributions from net investment income, if any, are declared and paid annually for the Select International Equity Fund and Select International Equity Fund II. The Funds will also declare and pay distributions annually from net realized gains on investment transactions and net realized foreign exchange gains, if any. Dividends and distributions to shareholders are recorded on the ex-dividend date. Additional distributions of net investment income and capital gains may be made at the discretion of the Board to avoid the application of the excise tax imposed under Section 4982 of the Internal Revenue Code of 1986, as amended (the “Code”), for certain undistributed amounts.
Dividends and distributions to shareholders are determined in accordance with federal income tax regulations, which may differ from GAAP. These differences are primarily due to differing treatments of income and gains on various investment securities held by the Funds, timing differences and differing characterization of distributions made by the Funds as a whole.
| i. | Federal Income Taxes |
Each Fund intends to continue to qualify as a “regulated investment company” by complying with the provisions available to certain investment companies, as defined in Subchapter M of the Code, and to make distributions of net investment income and net realized capital gains sufficient to relieve the Funds from all federal income taxes. Therefore, no federal income tax provision is required.
Management of the Funds has concluded that there are no significant uncertain tax positions that would require recognition in the financial statements. Since tax authorities can examine previously filed tax returns, the Funds’ U.S. federal and state tax returns for each of the four fiscal years up to the most recent fiscal year ended October 31 are subject to such review.
3. Agreements and Transactions with Affiliates
Merger of Aberdeen Asset Management PLC with Standard Life plc
The Funds’ investment adviser, sub-adviser and distributor are each a subsidiary of Aberdeen Asset Management PLC (“Aberdeen PLC”). On March 6, 2017, the Boards of Standard Life plc and Aberdeen PLC announced that they had reached an agreement on the terms of a merger
| 2017 Semi-Annual Report | 63 |
Notes to Financial Statements (continued)
April 30, 2017 (Unaudited)
(“Merger”). The Boards of each of Standard Life plc and Aberdeen PLC believe that the Merger has a compelling strategic and financial rationale through combining complementary strengths to create a world-class investment group. The Merger is expected to occur in the third quarter of 2017, subject to various conditions and terms, including regulatory approvals. The portfolio management team for each Fund is not expected to change as a result of the Merger. In addition, the agreements that the Trust, on behalf of the Funds, has with Aberdeen PLC’s subsidiary companies, the services provided by such companies, and the fees charged for those services are not expected to change as a result of the Merger.
| a. | Investment Adviser |
Under the Investment Advisory Agreements with the Funds, effective May 22, 2013, Aberdeen Asset Management Inc. (“Aberdeen” or the “Adviser”) manages the Funds in accordance with the policies and procedures established by the Board. Prior to May 22, 2013, the Funds were managed by Artio Global Management LLC (the “Predecessor Adviser”).
For services provided under the terms of the current Investment Advisory Agreement, each Fund pays the Adviser an annual management fee (as a percentage of its average daily net assets) paid monthly according to the following schedule:
| Fund | Fee Schedule | |||||||
Select International Equity Fund | Of the first $5 billion | 0.900% | ||||||
| On the next $2.5 billion | 0.880% | |||||||
| Over $7.5 billion | 0.850% | |||||||
Select International Equity Fund II | Of the first $5 billion | 0.900% | ||||||
| On the next $2.5 billion | 0.880% | |||||||
| Over $7.5 billion | 0.850% | |||||||
Total Return Bond Fund | On all assets | 0.350% | ||||||
Global High Income Fund | Of the first $5 billion | 0.650% | ||||||
| On the next $2.5 billion | 0.630% | |||||||
| On the next $2.5 billion | 0.600% | |||||||
| Over $10 billion | 0.590% | |||||||
The Adviser has engaged the services of Aberdeen Asset Managers Limited (the “Subadviser”), an affiliate, pursuant to the subadvisory agreements. The Subadviser manages a portion of the International Equity Funds’ investments and has responsibility for making all investment decisions for the portion of a Fund’s assets that it manages. Pursuant to the subadvisory agreements, the Adviser pays fees to the Subadviser.
Certain of the Funds and Aberdeen have entered into written contracts (“Expense Limitation Agreements”) limiting operating expenses for all classes of each Fund from exceeding the amounts listed below. This contractual limitation may not be terminated without the approval of the Board until the earlier of (a) the termination of the Investment Advisory Agreement or (b) the end of February, 2018. This limit excludes certain expenses, including taxes, interest, brokerage commissions, and other expenditures which are capitalized in accordance with GAAP, and other extraordinary expenses not incurred in the ordinary course of the Fund’s business.
| Fund | Class A Limit | Institutional Class Limit | ||||||
Total Return Bond Fund | 0.69% | 0.44% | ||||||
Global High Income Fund | 1.00% | 0.75% | ||||||
The Adviser has agreed to continue to waive a portion of its management fee for each of the Funds at the annual rate of 0.005% of the respective Funds’ average daily assets. The waiver may be terminated at any time by the Board.
Aberdeen may request and receive reimbursement from a Fund of the advisory fees waived and other expenses reimbursed pursuant to the Expense Limitation Agreements at a later date not to exceed three years from the fiscal year in which the corresponding reimbursement to the Funds was made.
However, no reimbursement will be made for fees waived unless:
(i) the total annual expense ratio of the class making such reimbursement is less than the limit set forth above; and
(ii) the payment of such reimbursement is approved by the Board on a quarterly basis (the “Reimbursement Requirements”).
If the Board approves any changes in the waiver terms or limitations, reimbursements are only permitted to the extent that the terms of the Expense Limitation Agreements in effect at the time of the waiver are met at the time that reimbursement is approved. Except as provided for in the Expense Limitation Agreements, reimbursement of amounts previously waived or assumed by Aberdeen is not permitted.
| 64 | Semi-Annual Report 2017 |
Notes to Financial Statements (continued)
April 30, 2017 (Unaudited)
As of April 30, 2017, to the extent the Reimbursement Requirements are met, the cumulative potential reimbursements for each Fund, based on expenses reimbursed by Aberdeen would be:
| Fund | Amount Fiscal Year 2014 (Expires 10/31/17) | Amount Fiscal Year 2015 (Expires 10/31/18) | Amount Fiscal Year 2016 (Expires 10/31/19) | Amount Six Months Ended April 30, 2017 (expires 4/30/20) | Total* | |||||||||||||||
Select International Equity Fund | $ | – | $ | – | $ | – | $ | – | $ | – | ||||||||||
Select International Equity Fund II | – | – | – | – | – | |||||||||||||||
Total Return Bond Fund | 22,047 | 82,622 | 262,142 | 270,914 | 637,725 | |||||||||||||||
Global High Income Fund | 75,716 | 198,764 | 367,227 | 358,739 | 1,000,446 | |||||||||||||||
| * | Amounts reported are due to expire throughout the respective 3-year expiration period presented above. |
| Amounts | listed as “–” are $0 or round to $0. |
During the year ended October 31, 2016, the Adviser contributed $127,579 to the Select International Equity Fund II, to correctly record an aged dividend receivable at its net realizable value inclusive of currency fluctuations.
During the year ended October 31, 2016, the Adviser contributed $113,111 to the Select International Equity Fund to correctly record an aged dividend receivable at its net realizable value inclusive of currency fluctuations.
| b. | Distributor and Shareholder Services |
The Funds and Aberdeen Fund Distributors, LLC (the “Distributor” or “AFD”) are parties to the current Underwriting Agreement (the “Underwriting Agreement”) whereby the Distributor acts as principal underwriter for the Funds’ shares. Prior to May 22, 2013, Quasar Distributors, LLC (“Quasar”) was the distributor of the Funds.
The Funds have adopted a Distribution Plan (the “Plan”) pursuant to Rule 12b-1 under the 1940 Act with respect to certain classes of shares. The Plan permits the Funds to compensate AFD, as the Funds’ Distributor, for expenses associated with the distribution-related and/or shareholder services provided by such entities. These fees are paid to the Funds’ Distributor and are either kept or paid to shareholders’ financial advisors or other intermediaries for distribution and shareholder services. Although actual distribution expenses may be more or less, under the Plan, the Funds pay the Distributor an annual fee of 0.25% for Class A shares.
Under its terms, the Funds’ Plan shall remain in effect from year to year, provided such continuance is approved annually by a vote of a majority of the Board members and a majority of those Board members who are not “interested persons” of the Funds and who have no direct or indirect financial interest in the operation of the Plan or in any agreement related to the Plan.
The Adviser or an affiliate of the Adviser may pay additional amounts from its own resources to dealers or other financial intermediaries, for aid in distribution or for aid in providing administrative services to shareholders.
4. Investment Transactions
Purchases and sales of securities (excluding short-term securities) for the six-month period ended April 30, 2017, were as follows:
| Fund | Purchases | Sales | ||||||
Select International Equity Fund | $ | 21,533,895 | $ | 32,504,481 | ||||
Select International Equity Fund II | 4,720,635 | 19,929,062 | ||||||
Total Return Bond Fund | 309,385,197 | 467,147,772 | ||||||
Global High Income Fund | 104,978,894 | 291,009,433 | ||||||
| 2017 Semi-Annual Report | 65 |
Notes to Financial Statements (continued)
April 30, 2017 (Unaudited)
5. Investments in Affiliated Issuers
An affiliated issuer, as defined under the Investment Company Act of 1940, as amended, includes an issuer in which a Fund holds 5% or more of the issuer’s outstanding voting securities. A summary of the Funds’ investments in securities of these issuers for the six-month period ended April 30, 2017 is set forth below:
| Affiliate | Shares Held April 30, | Purchases (Cost) | Sales (Proceeds) | Dividend Income | Fair Value April 30, 2017 | |||||||||||||||
| Global High Income Fund | ||||||||||||||||||||
Deep Ocean | – | $ | – | $ | (4,083,963) | $ | – | $ | – | |||||||||||
Amounts listed as “–” are $0 or round to $0.
6. Portfolio Investment Risks
| a. | Active Trading Risk |
A Fund may engage in active and frequent trading of portfolio securities to achieve its investment objective. If a Fund does trade this way, it may incur increased costs, which can lower the actual return of the Fund.
| b. | Asset-Backed Securities Risk |
Like traditional fixed income securities, the value of asset-backed securities typically increases when interest rates fall and decreases when interest rates rise. Certain asset-backed securities may also be subject to the risk of prepayment.
| c. | Bank Loan Risk |
There are a number of risks associated with an investment in bank loans including credit risk, interest rate risk, illiquid securities risk, and prepayment risk. There is also the possibility that the collateral securing a loan, if any, may be difficult to liquidate or be insufficient to cover the amount owed under the loan. Bank loans have significantly longer settlement periods (e.g., longer than seven days) than more traditional investments resulting in the proceeds from the sale of such loans not being readily available to make additional investments or to meet a Fund’s redemption obligations. In addition, loans are not registered under the federal securities laws like stocks and bonds, so investors in loans have less protection against improper practices than investors in registered securities. These risks could cause a Fund to lose income or principal on a particular investment, which in turn could affect a Fund’s returns.
| d. | Country/Regional Focus Risk |
Significant exposure to a single country or geographical region involves increased currency, political, regulatory and other risks. Market swings in the targeted country or geographical region likely will have a greater effect on portfolio performance than they would in a more geographically diversified fund.
| e. | Corporate Bonds |
Corporate bonds are debt instruments issued by domestic or foreign corporations or similar entities. Corporate bonds can decline in value in response to changes in the financial condition of the issuer and involve a risk of loss in case of issuer default or insolvency.
| f. | Credit Default Swap Risk |
Credit default swap contracts, a type of derivative instrument, involve special risks and may result in losses to the Fund. Credit default swap contracts may in some cases be illiquid, and they increase credit risk since the Fund has exposure to both the issuer of the referenced obligation and the counterparty to the credit default swap contracts. Swaps may be difficult to unwind or terminate. The swap market could be disrupted or limited as a result of recent legislation, and these changes could adversely affect the Fund. Additionally, to the extent the Fund sells credit default swap contracts, the Fund effectively adds economic leverage to its portfolio because, in addition to its total net assets, the Fund is subject to investment exposure on the notional amount of the swap in the event of a default of the referenced debt obligation.
| g. | Credit Risk |
A debt instrument’s price depends, in part, on the credit quality of the issuer, borrower, counterparty, or underlying collateral and can decline in response to changes in the financial condition of the issuer, borrower, counterparty, or underlying collateral, or changes in specific or general market, economic, industry, political, regulatory, geopolitical, or other conditions.
| 66 | Semi-Annual Report 2017 |
Notes to Financial Statements (continued)
April 30, 2017 (Unaudited)
| h. | Derivatives Risk (Including Options, Futures and Swaps) |
Derivatives are speculative and may hurt the Fund’s performance. Derivatives present the risk of disproportionately increased losses and/or reduced opportunities for gains when the financial asset or measure to which the derivative is linked changes in unexpected ways. The potential benefits to be derived from the Fund’s derivatives strategy are dependent upon the portfolio managers’ ability to discern pricing inefficiencies and predict trends in markets, which decisions could prove to be inaccurate. This requires different skills and techniques than predicting changes in the price of individual securities, and there can be no assurance that the use of this strategy will be successful.
Hedged Exposure Risk – Losses generated by a derivative or practice used by the Fund for hedging purposes should be offset in part by gains on the hedged investment depending on the degree of correlation between the hedging instrument and the assets hedged. However, while hedging can reduce or eliminate losses, it can also reduce or eliminate gains.
Correlation Risk – The Fund is exposed to the risk that changes in the value of a hedging instrument will not match those of the investment being hedged.
Counterparty Risk – Derivative transactions depend on the creditworthiness of the counterparty and the counterparty’s ability to fulfill its contractual obligations.
Speculative Exposure Risk – To the extent that a derivative or practice is not used as a hedge, the Fund is directly exposed to its risks. Gains or losses from speculative positions in a derivative may be much greater than the derivative’s original cost. For example, potential losses from writing uncovered call options and from speculative short sales are unlimited.
| i. | Emerging Markets Risk |
A magnification of the risks that apply to foreign investments. These risks are greater for securities of companies in emerging market countries because the countries may have less stable governments, more volatile currencies and less established markets (see “Foreign Securities Risk” below).
| j. | Extension Risk |
Principal repayments may not occur as quickly as anticipated, causing the expected maturity of a security to increase. Rapidly rising interest rates may cause prepayments to occur more slowly than expected, thereby lengthening the maturity of the securities held by the Fund and making their prices more sensitive to rate changes and more volatile.
| k. | Foreign Currency Exposure Risk |
The value of foreign currencies relative to the U.S. Dollar fluctuates in response to market, economic, political, regulatory, geopolitical or other conditions. A decline in the value of a foreign currency versus the U.S. Dollar reduces the value in U.S. Dollars of investments denominated in that foreign currency. This risk may impact a Fund more greatly to the extent the Fund does not hedge its currency risk, or hedging techniques used by the Adviser are unsuccessful.
| l. | Foreign Securities Risk |
Foreign securities may be more volatile, harder to price and less liquid than U.S. securities. They are subject to different accounting and regulatory standards, and political and economic risks.
| m. | High-Yield Bonds and Other Lower-Rated Securities Risk |
A Fund’s investments in high-yield bonds (commonly referred to as “junk bonds”) and other lower-rated securities will subject the Fund to substantial risk of loss. Investments in high-yield bonds are speculative and issuers of these securities are generally considered to be less financially secure and less able to repay interest and principal than issuers of investment-grade securities. Prices of high-yield bonds tend to be very volatile. These securities are less liquid than investment-grade debt securities and may be difficult to price or sell, particularly in times of negative sentiment toward high-yield securities.
| n. | Illiquid Securities Risk |
Illiquid securities are assets which may not be sold or disposed of in the ordinary course of business within seven days at approximately the price at which the Fund has valued the investment on its books and may include such securities as those not registered under U.S. securities laws or securities that cannot be sold in public transactions. An inability to sell a portfolio position can adversely affect the Fund’s value or prevent the Fund from being able to take advantage of other investment opportunities. Illiquid securities and relatively less liquid securities may also be difficult to value. Over recent years, the capacity of dealers to make markets in fixed income securities has been outpaced by the growth in the size of the fixed income markets. Liquidity risk may be magnified in a rising interest rate environment or when investor redemptions from fixed income funds may be higher than normal, due to the increased supply in the market that would result from selling activity.
| 2017 Semi-Annual Report | 67 |
Notes to Financial Statements (continued)
April 30, 2017 (Unaudited)
The Fund employs proprietary procedures and tests using third-party and internal data inputs that seek to assess and manage the liquidity of its portfolio holdings. The Fund’s procedures and tests take into account relevant market, trading and other factors, and monitor whether liquidity assessments should be adjusted based on changed market conditions. These procedures and tests are designed to assist the Fund in determining its ability to meet redemption requests in various market conditions. In light of the dynamic nature of markets, there can be no assurance that these procedures and tests will enable the Fund to ensure that it has sufficient liquidity to meet redemption requests.
| o. | Impact of Large Redemptions and Purchases of Fund Shares |
Occasionally, shareholders may make large redemptions or purchases of a Fund’s shares, which may cause the Fund to have to sell securities or invest additional cash. These transactions may adversely affect the Fund’s performance and increase transaction costs. In addition, large redemption requests may exceed the cash balance of the Fund and result in credit line borrowing fees and/or overdraft charges to the Fund until the sales of portfolio securities to cover the redemption request settle.
| p. | Interest Rate Risk |
A Fund’s fixed income investments are subject to interest rate risk, which generally causes the value of a fixed income portfolio to decrease when interest rates rise resulting in a decrease in the Fund’s net assets. The Fund may be subject to a greater risk of rising interest rates due to the current period of historically low rates and the effect of potential government fiscal policy initiatives and resulting market reaction to those initiatives. Interest rate fluctuations tend to have a greater impact on fixed income-securities with a greater time to maturity and/or lower coupon. A fund with a longer average portfolio duration will be more sensitive to changes in interest rates than a fund with a shorter average portfolio duration. In periods of market volatility, the market values of fixed income securities may be more sensitive to changes in interest rates.
| q. | Issuer Risk |
The value of a security may decline for reasons directly related to the issuer, such as management performance, financial leverage and reduced demand for the issuer’s goods or service.
| r. | Large-Cap Securities Risk |
Stocks issued by large cap companies subject the Fund to the risk that those stocks may underperform stocks issued by companies with smaller capitalizations or the market as a whole.
| s. | Leverage Risk |
Certain transactions may give rise to a form of leverage. Such transactions may include, among others, loans of securities, and the use of when-issued, delayed delivery or forward commitment transactions. The use of derivatives may also cause leveraging risk.
| t. | Market Risk |
Deteriorating market conditions might cause a general weakness in the market that reduces the prices of securities in that market in which a Fund invests.
| u. | Mid-Cap Securities Risk |
Stocks of mid-cap companies tend to be more volatile and less liquid than larger company stocks of larger companies.
| v. | Mortgage-Related Securities Risk |
A Fund may invest in mortgage-related securities. Rising interest rates may cause an issuer to exercise its right to pay principal later than expected which tends to extend the duration of mortgage-related securities, making them more sensitive to changes in interest rates. As a result, in a period of rising interest rates, a Fund that holds mortgage-related securities may exhibit additional volatility. This is known as extension risk. In addition, mortgage-related securities are subject to prepayment risk. When interest rates decline, borrowers may pay off their mortgages sooner than expected. This can reduce the returns of a Fund because the Fund will have to reinvest that money at the lower prevailing interest rates.
| w. | Municipal Securities Risk |
A Fund may invest in municipal bonds which may be significantly affected by political and economic changes, including inflation, as well as uncertainties in the municipal market related to taxation, legislative changes, or the rights of municipal security holders. Municipal Bonds have varying levels of sensitivity to changes in interest rates. In general, the price of a Municipal Bond can fall when interest rates rise and can rise when interest rates fall. Interest rate risk is generally lower for shorter-term Municipal Bonds and higher for long term Municipal Bonds. Under certain market conditions, the Adviser may purchase Municipal Bonds that the Adviser perceives are undervalued. Undervalued Municipal Bonds are subject to the same market volatility and principal and interest rate risks described above. Lower quality Municipal Bonds involve greater risk of default or price changes due to changes in the credit quality of the issuer. The value of lower quality Municipal Bonds often fluctuates in response to political or economic developments and can decline significantly over short periods of time or during
| 68 | Semi-Annual Report 2017 |
Notes to Financial Statements (continued)
April 30, 2017 (Unaudited)
periods of general or regional economic difficulty. In the case of tax-exempt Municipal Bonds, if the Internal Revenue Service or state tax authorities determine that an issuer of a tax-exempt Municipal Bond has not complied with applicable tax requirements, interest from the security could become taxable at the federal, state and/or local level, and the security could decline significantly in value. Municipal Bonds are subject to credit or default risk. Credit risk is the risk that the issuer of a municipal security might not make interest and principal payments on the security as they become due.
| x. | Prepayment Risk |
As interest rates decline, debt issuers may repay or refinance their loans or obligations earlier than anticipated. The issuers of fixed income securities may, therefore, repay principal in advance. This forces a Fund to reinvest the proceeds from the principal prepayments at lower rates, which reduces the Fund’s income.
| y. | Private Placements and Other Restricted Securities Risk |
Investments in private placements and other restricted securities, including Regulation S Securities and Rule 144A Securities, could have the effect of increasing a Fund’s level of illiquidity. Private placements and restricted securities may be less liquid than other investments because such securities may not always be readily sold in broad public markets and a Fund might be unable to dispose of such securities promptly or at prices reflecting their true value.
| z. | Securities Selection Risk |
The investment team may select securities that underperform the stock market or other funds with similar investment objectives and strategies.
| aa. | Small-Cap Securities Risk |
Stocks of smaller companies are usually less stable in price and less liquid than those of larger, more established companies. Therefore, they generally involve greater risk.
| bb. | Sovereign Debt Risk |
Periods of economic and political uncertainty may result in the illiquidity and increased price volatility of a foreign government’s debt securities held by the Fund and impact an issuer’s ability and willingness to pay interest or repay principal when due. The Fund may have limited recourse to compel payment in the event of a default. A foreign government’s default on its debt securities may cause the value of securities held by the Fund to decline significantly.
| cc. | Valuation Risk |
The price a Fund could receive upon the sale of any particular portfolio investment may differ from the Fund’s valuation of the investment, particularly for securities that trade in thin or volatile markets or that are valued using a fair valuation methodology or a price provided by an independent pricing service. As a result, the price received upon the sale of an investment may be less than the value ascribed by the Fund, and a Fund could realize a greater than expected loss or lesser than expected gain upon the sale of the investment. A Fund’s ability to value its investments may also be impacted by technological issues and/or errors by pricing services or other third-party service providers.
| dd. | Variable and Floating Rate Securities Risk |
For floating and variable rate obligations, there may be a lag between an actual change in the underlying interest rate benchmark and the reset time for an interest payment of such an obligation, which could harm or benefit the Fund, depending on the interest rate environment or other circumstances.
Please read the prospectus for more detailed information regarding these and other risks.
7. Contingencies
In the normal course of business, the Funds may provide general indemnifications pursuant to certain contracts and organizational documents. The Funds’ maximum exposure under these arrangements is dependent on future claims that may be made against the Funds, and therefore, cannot be estimated; however, based on experience, the risk of loss from such claims is considered remote.
| 2017 Semi-Annual Report | 69 |
Notes to Financial Statements (continued)
April 30, 2017 (Unaudited)
8. Tax Information
As of April 30, 2017, the tax cost of securities and the breakdown of unrealized appreciation/(depreciation) for each Fund were as follows:
| Tax Cost of Securities | Unrealized Appreciation | Unrealized Depreciation | Net Unrealized Appreciation/ (Depreciation) | |||||||||||||
Select International Equity Fund | $ | 268,897,068 | $ | 23,553,047 | $ | (61,400,867 | ) | $ | (37,847,820 | ) | ||||||
Select International Equity Fund II | 101,331,714 | 10,323,197 | (14,261,120 | ) | (3,937,923 | ) | ||||||||||
Total Return Bond Fund | 351,564,095 | 5,926,564 | (2,755,134 | ) | 3,171,430 | |||||||||||
Global High Income Fund | 418,892,246 | 15,073,442 | (19,185,985 | ) | (4,112,543 | ) | ||||||||||
The tax character of distributions paid during the fiscal year ended October 31, 2016 was as follows (total distributions paid may differ from the Statements of Changes in Net Assets because for tax purposes dividends are recognized when actually paid):
| Distributions paid from | ||||||||||||||||||||||||
| Fund | Ordinary Income | Net Long Term Capital Gains | Total Taxable Distributions | Tax Exempt Distributions | Return of Capital | Total Distributions Paid | ||||||||||||||||||
Select International Equity Fund | $ | 8,579,495 | $ | – | $ | 8,579,495 | $ | – | $ | – | $ | 8,579,495 | ||||||||||||
Select International Equity Fund II | 4,285,768 | – | 4,285,768 | – | – | 4,285,768 | ||||||||||||||||||
Total Return Bond Fund | 12,439,859 | – | 12,439,859 | – | – | 12,439,859 | ||||||||||||||||||
Global High Income Fund | 36,324,693 | – | 36,324,693 | �� | – | – | 36,324,693 | |||||||||||||||||
Amounts listed as “–” are $0 or round to $0.
As of October 31, 2016, the components of accumulated earnings/(deficit) on a tax basis were as follows:
| Fund | Undistributed Tax Exempt Income | Undistributed Ordinary Income | Undistributed Long-Term Capital Gains | Accumulated Earnings | Distributions Payable | Late Year Ordinary and Post- October Capital Loss Deferrals | Other Temporary Differences | Unrealized Appreciation/ (Depreciation)* | Accumulated Capital and Other Losses** | Total Accumulated Earnings/ (Deficit) | ||||||||||||||||||||||||||||||
Select International Equity Fund | $ | – | $ | 1,281,584 | $ | – | $ | – | $ | – | $ | – | $ | – | $ | (61,942,077 | ) | $ | (2,033,135,615 | ) | $ | (2,093,796,108 | ) | |||||||||||||||||
Select International Equity Fund II | – | 1,316,269 | – | – | – | – | (13,952 | ) | (14,343,853 | ) | (1,356,116,751 | ) | (1,369,158,287 | ) | ||||||||||||||||||||||||||
Total Return Bond Fund | – | 11,895,047 | 4,920,801 | – | – | – | (582,170 | ) | 10,196,921 | – | 26,430,599 | |||||||||||||||||||||||||||||
Global High Income Fund | – | 5,313,666 | – | – | – | – | (4,428,646 | ) | (30,503,736 | ) | (207,634,986 | ) | (237,253,702 | ) | ||||||||||||||||||||||||||
Amounts listed as “–” are $0 or round to $0.
| * | The difference between the book-basis and tax-basis unrealized appreciation/(depreciation) is attributable primarily to tax deferral of losses on wash sales. |
| ** | As of October 31, 2016, for Federal income tax purposes, the following Funds have capital loss carryforwards available to offset capital gains, if any, to the extent provided by the Treasury regulations, which expire in the years set forth below. |
| Fund | Amount | Expires | ||||||
Select International Equity Fund | $ | 1,643,693,179 | 2017 (Short-Term) | |||||
Select International Equity Fund | 19,115,447 | Unlimited (Short-Term) | ||||||
Select International Equity Fund | 370,326,989 | Unlimited (Long-Term) | ||||||
Select International Equity Fund II | 1,211,390,775 | 2017 (Short-Term) | ||||||
Select International Equity Fund II | 121,152,924 | 2018 (Short-Term) | ||||||
Select International Equity Fund II | 2,844,319 | Unlimited (Short-Term) | ||||||
Select International Equity Fund II | 20,728,733 | Unlimited (Long-Term) | ||||||
Global High Income Fund | 58,054,816 | Unlimited (Short-Term) | ||||||
Global High Income Fund | 149,580,170 | Unlimited (Long-Term) | ||||||
| 70 | Semi-Annual Report 2017 |
Notes to Financial Statements (continued)
April 30, 2017 (Unaudited)
Under the Regulated Investment Company Modernization Act of 2010, the Funds are permitted to carry forward capital losses incurred in taxable years beginning after December 22, 2010 for an unlimited period. However, any losses incurred during those taxable years will be required to be utilized prior to the losses incurred in pre-enactment taxable years. As a result of this ordering rule, pre-enactment capital loss carryforwards may be more likely to expire unused. Additionally, post-enactment capital losses that are carried forward will retain their character as either short-term or long-term capital losses rather than being considered all short-term as under previous law.
9. Significant Shareholders
As of April 30, 2017, the following Funds had shareholders with the percentage ownership indicated, which are considered significant shareholders (holdings greater than 5.0%) for financial reporting purposes:
| Fund | Record Ownership % | Number of Account Owners | ||||
Select International Equity Fund | 61.4 | % | 2 | |||
Select International Equity Fund II | 61.0 | 3 | ||||
Total Return Bond Fund | 62.0 | 5 | ||||
Global High Income Fund | 64.0 | 4 | ||||
10. Line of Credit
Aberdeen Investment Funds (the “Borrowers”) entered into a Credit Agreement (the “Agreement”) with State Street Bank and Trust Company (the “Bank”). The Agreement provides for a revolving credit facility (the “Credit Facility”) to be utilized for temporary or emergency purposes to fund shareholder redemptions or for other short-term liquidity purposes. The amount of the Credit Facility was reduced from $50,000,000 to $25,000,000 effective April 17, 2017. The Funds may draw up to their stated sublimit (subject to certain other limitations therein):
| Sublimit Amount | Average Outstanding Daily Balance | Average Weighted Interest Rate | Days Utilized | |||||||||||||
Select International Equity | $ | 25,000,000 | $ | 490,422 | 1.86 | % | 18 | |||||||||
Select International Equity II | $ | 25,000,000 | $ | 2,216,370 | 1.94 | % | 11 | |||||||||
Total Return Bond Fund | $ | 25,000,000 | – | – | – | |||||||||||
Amounts listed as “–” are $0 or round to $0.
In addition, the Global High Income Fund entered into a separate Credit Agreement (the “Global High Income Fund Credit Agreement”) with the Bank. The Global High Income Fund Credit Agreement provides for a revolving credit facility (the “Global High Income Fund Credit Facility”) to be utilized for temporary or emergency purposes to fund shareholder redemptions or for other short-term liquidity purposes. The amount of the Global High Income Fund Credit Facility was reduced from $100,000,000 to $50,000,000 effective April 17, 2017. The Global High Income Fund may draw the entire $50,000,000 (subject to certain limitations).
| Sublimit Amount | Average Outstanding Daily Balance | Average Weighted Interest Rate | Days Utilized | |||||||||||||
Global High Income Fund | $ | 50,000,000 | $ | – | – | % | – | |||||||||
Amounts listed as “–” are $0 or round to $0.
Principal on each outstanding loan made under the Agreement and the Global High Income Fund Credit Agreement shall bear the interest at a variable rate per annum equal to the higher of (a) the Federal Funds Rate as in effect on that day plus 1.25% and (b) the One-Month London Interbank Offered Rate as in effect on that day (not less than zero) plus 1.25%. In addition, the Borrowers shall pay to the Bank a commitment fee at the rate of 0.25% per annum on the daily unused portion of each of the Credit Facility or Global High Income Fund Credit Facility, as applicable, which is allocated among the Borrowers in such manner as is determined by the Board to be reasonable.
11. Recent Accounting Pronouncement
In December 2016, the Financial Accounting Standards Board issued Accounting Standards Update No. 2016-19 (“ASU 2016-19”), “Technical Corrections and Improvements”. The guidance includes an amendment to Topic 820, Fair Value Measurement, which clarifies the difference
| 2017 Semi-Annual Report | 71 |
Notes to Financial Statements (concluded)
April 30, 2017 (Unaudited)
between a valuation approach and a valuation technique when applying the guidance in that Topic. The amendment also requires an entity to disclose when there has been a change in either or both a valuation approach and/or a valuation technique. The transition guidance for the amendment must be applied prospectively because it could potentially involve the use of hindsight that includes fair value measurements. The guidance is effective for interim periods beginning after December 15, 2016. Management is currently evaluating the implication, if any, of the additional disclosure requirements and its impact on the Funds’ financial statements.
12. Subsequent Events
Management has evaluated the need for disclosures and/or adjustments resulting from subsequent events through the date the financial statements were issued. Based on this evaluation, no disclosures and/or adjustments other than those described above were required to the financial statements as of April 30, 2017.
| 72 | Semi-Annual Report 2017 |
Shareholder Expense Examples (Unaudited)
As a shareholder of the Aberdeen Investment Funds you incur ongoing costs, including investment advisory fees, shareholder service fees, distribution fees and other Fund expenses. The examples below are intended to help you understand your ongoing costs (in dollars) of investing in the Funds and to compare these costs with the ongoing costs of investing in other mutual funds.
The examples assume that you had a $1,000 investment in the Class at the beginning of the reporting period, November 1, 2016 and continued to hold your shares at the end of the reporting period, April 30, 2017.
Actual Expenses
The table below provides information about actual account values and actual expenses. You may use the information together with the amount you invested, to estimate the expenses that you paid over the period. Simply divide your account value by $1,000 (for example, an $8,600 account value divided by $1,000 = 8.6), then multiply the result by the number under the heading entitled “Actual Expenses Paid During Period” for the class of a Fund that you own to estimate the expenses you paid on your account during the period.
Hypothetical Example for Comparison Purposes
The table below provides information about hypothetical account values and hypothetical expenses based on the Class’ actual expense ratio and an assumed rate of return of 5% per year before expenses, which is not the Class’ actual return. The hypothetical account values and expenses may not be used to estimate the actual ending account balance or expenses you paid for the period. You may use this information to compare the ongoing costs of investing in the Class of a Fund and other funds. To do so, compare the 5% hypothetical example with the 5% hypothetical examples that appear in the shareholder reports of the other funds.
| Beginning Account Value, November 1, 2016 | Actual Ending Account Value, April 30, 2017 | Hypothetical Ending Account Value | Actual Expenses Paid During Period* | Hypothetical Expenses Paid During Period*1 | Annualized Expense Ratio | |||||||||||||||||||||
Select International Equity Fund | Class A | $ | 1,000.00 | $ | 1,166.50 | $ | 1,017.80 | $ | 7.57 | $ | 7.05 | 1.41% | 2 | |||||||||||||
Institutional Class | $ | 1,000.00 | $ | 1,167.80 | $ | 1,019.04 | $ | 6.23 | $ | 5.81 | 1.16% | 2 | ||||||||||||||
Select International Equity Fund II | Class A | $ | 1,000.00 | $ | 1,141.30 | $ | 1,017.21 | $ | 8.12 | $ | 7.65 | 1.53% | 2 | |||||||||||||
Institutional Class | $ | 1,000.00 | $ | 1,141.40 | $ | 1,018.35 | $ | 6.90 | $ | 6.51 | 1.30% | 2 | ||||||||||||||
Total Return Bond Fund | Class A | $ | 1,000.00 | $ | 994.90 | $ | 1,021.37 | $ | 3.41 | $ | 3.46 | 0.69% | ||||||||||||||
Institutional Class | $ | 1,000.00 | $ | 996.10 | $ | 1,022.61 | $ | 2.18 | $ | 2.21 | 0.44% | |||||||||||||||
Global High Income Fund | Class A | $ | 1,000.00 | $ | 1,053.10 | $ | 1,019.84 | $ | 5.09 | $ | 5.01 | 1.00% | ||||||||||||||
Institutional Class | $ | 1,000.00 | $ | 1,054.30 | $ | 1,021.08 | $ | 3.82 | $ | 3.76 | 0.75% | |||||||||||||||
| * | Expenses are equal to the Fund’s annualized expense ratio multiplied by the average account value over the period multiplied by 181/365 (to reflect the one-half year period). |
| 1 | Represents the hypothetical 5% return before expenses. |
| 2 | Uncertain taxes and costs associated with Article 63 EU Tax Reclaims are not included in the expense table above for Select International Equity Fund and Select International Equity Fund II. In addition to the operating expenses shown in the table above, the Fund has accrued a tax expense that if included in the table above, the annualized expense ratio and actual expenses paid would materially increase. |
| 2017 Semi-Annual Report | 73 |
FACTS | WHAT DOES ABERDEEN ASSET MANAGEMENT DO WITH YOUR PERSONAL INFORMATION? |  | ||||||
Why? | Financial companies choose how they share your personal information. Federal law gives consumers the right to limit some but not all sharing. Federal law also requires us to tell you how we collect, share, and protect your personal information. Please read this notice carefully to understand what we do. | |||||||
What? | The types of personal information we collect and share depend on the product or service you have with us. This information can include:
· Social Security number and account balances
· Transaction history and assets
· Account transactions and wire transfer instructions |
| ||||||
How? | All financial companies need to share customers’ personal information to run their everyday business. In the section below, we list the reasons financial companies can share their customers’ personal information; the reasons Aberdeen Asset Management chooses to share; and whether you can limit this sharing. | |||||||
Reasons we can share your personal information | Does Aberdeen Asset Management share? | | Can you limit this sharing? | | ||||
For our everyday business purposes— such as to process your transactions, maintain your account(s), respond to court orders and legal investigations, or report to credit bureaus | Yes | No | ||||||
For our marketing purposes— to offer our products and services to you | Yes | Yes | ||||||
For joint marketing with other financial companies | No | We don’t share | ||||||
For our affiliates’ everyday business purposes— information about your transactions and experiences | Yes | No | ||||||
For our affiliates’ everyday business purposes— information about your creditworthiness | No | We don’t share | ||||||
For our affiliates to market to you | No | We don’t share | ||||||
For nonaffiliates to market to you | No | We don’t share | ||||||
To limit our sharing | · Call 215-405-5735
Please note:
If you are a new customer, we can begin sharing your information 30 days from the date we sent this notice. When you are no longer our customer, we continue to share your information as described in this notice.
However, you can contact us at any time to limit our sharing. |
| ||||||
Questions? | www.aberdeen-asset.us | |||||||
| Page 2 |
Who we are | ||
Who is providing this notice? | Aberdeen U.S. Registered Investment Advisers (collectively referred to as “Aberdeen Asset Management”) | |
What we do | ||
How does Aberdeen Asset Management protect my personal information? | To protect your personal information from unauthorized access and use, we use security measures that comply with federal law. These measures include computer safeguards and secured files and buildings. | |
How does Aberdeen Asset Management collect my personal information? | We collect your personal information, for example, when you:
· Open an account or give us your contact information
· Seek advice about your investments or make deposits or withdrawals from your account
· Enter into an investment advisory contract
We also collect your personal information from others, such as credit bureaus, affiliates, or other companies. | |
Why can’t I limit all sharing? | Federal law gives you the right to limit only:
· Sharing for Aberdeen and Affiliates from using your information to market to you
· Aberdeen and Affiliates from using your information to market to you
· Sharing for nonaffiliates to market to you
State laws and individual companies may give you additional rights to limit sharing. | |
What happens when I limit sharing for an account I hold jointly with someone else? | Your choices will apply to everyone on your account. | |
Definitions | ||
Affiliates | Companies related by common ownership or control. They can be financial and nonfinancial companies.
· Our affiliates include companies with an Aberdeen Asset Management name and wholly-owned subsidiaries of Aberdeen Asset Management PLC, a global financial services company. | |
Nonaffiliates | Companies not related by common ownership or control. They can be financial and nonfinancial companies.
· Aberdeen Asset Management does not share personal information with nonaffiliates so they can market to you. | |
Joint marketing | A formal agreement between nonaffiliated financial companies that together market financial products or services to you.
· Aberdeen Asset Management doesn’t jointly market. | |
Other important information | ||
| This Privacy Notice is being provided by Aberdeen Asset Management, namely Aberdeen Asset Management Inc, Aberdeen Asset Management Limited, Aberdeen Asset Management Asia Limited, Aberdeen Capital Management LLC, and Arden Asset Management LLC. | ||
Management Information
Trustees
Antoine Bernheim, Chairman
Thomas Gibbons
Bev Hendry
Robert S. Matthews
Peter Wolfram
Officers
Bev Hendry, President and Chief Executive Officer
Jeffrey Cotton, Chief Compliance Officer, Vice President
and Anti-Money Laundering and Identity Theft Officer
Andrea Melia, Treasurer and Chief Financial Officer
Brian Link, Secretary
Megan Kennedy, Assistant Secretary and Vice President
Lucia Sitar, Chief Legal Officer and Vice President
Joseph Andolina, Vice President-Compliance
Lynn Chen, Vice President
Alan Goodson, Vice President
Stephen Docherty, Vice President
Steven Logan, Vice President
Jennifer Nichols, Vice President
Hugh Young, Vice President
Brian O’Neill, Assistant Treasurer
Eric Olsen, Assistant Treasurer
Andrew Kim, Assistant Secretary
Stephen Varga, Assistant Secretary
Investment Adviser
Aberdeen Asset Management Inc.
1735 Market Street, 32nd Floor
Philadelphia, PA 19103
Transfer Agent
Boston Financial Data Services, Inc.
30 Dan Road
Canton, MA 02021
Distributor
Aberdeen Fund Distributors LLC
1735 Market Street, 32nd Floor
Philadelphia, PA 19103
Fund Administrator, Custodian & Fund Accountant
State Street Bank and Trust Company
1 Heritage Drive, 3rd Floor
North Quincy, MA 02171
Independent Registered Public Accounting Firm
KPMG LLP
1601 Market Street
Philadelphia, PA 19103
Fund Counsel
Morrison & Foerster LLP
250 West 55th Street
New York, NY 10019-9601
Aberdeen Asset Management Inc. 1735 Market Street, 32nd Floor Philadelphia, PA 19103 aberdeen-asset.us | |
AOE-0377-SAR
Item 2. Code of Ethics.
Not applicable – for annual reports only.
Item 3. Audit Committee Financial Expert.
Not applicable – for annual reports only.
Item 4. Principal Accountant Fees and Services.
Not applicable – for annual reports only.
Item 5. Audit Committee of Listed Registrants.
Not applicable – for annual reports only.
Item 6. Schedule of Investments
| (a) | Included as part of the Reports to Shareholders filed under Item 1 of this Form N-CSR. |
| (b) | Not applicable. |
Item 7. Disclosure of Proxy Voting Policies and Procedures for Closed-End Management Investment Companies.
Not applicable.
Item 8. Portfolio Managers of Closed-end Management Investment Companies.
Not applicable.
Item 9. Purchases of Equity Securities by Closed-End Management Investment Company and Affiliated Purchasers.
Not applicable.
Item 10. Submission of Matters to a Vote of Security Holders.
During the period ended April 30, 2017, there were no material changes to the procedures by which shareholders may recommend nominees to the Registrant’s Board of Trustees.
Item 11. Controls and Procedures.
| (a) | The Registrant’s principal executive and principal financial officers, or persons performing similar functions, have concluded that the Registrant’s disclosure controls and procedures (as defined in Rule 30a-3(c) under the Investment Company Act of 1940 (the “Act”) (17 CFR 270.30a-3(c))) are effective, as of a date within 90 days of the filing date of the report that includes the disclosure required by this paragraph, based on the evaluation of these controls and procedures required by Rule 30a-3(b) under the Act (17 CFR 270.30a3(b)) and Rule 13a-15(b) or 15d-15(b) under the Securities Exchange Act of 1934 (17 CFR 240.13a-15(b) or 240.15d15(b)). |
| (b) | There were no changes in the Registrant’s internal control over financial reporting (as defined in Rule 30a-3(d) under the Act (17 CFR 270.30a-3(d)) that occurred during the second fiscal quarter of the period covered by this report that has materially affected, or are reasonably likely to materially affect, the Registrant’s internal control over financial reporting. |
Item 12. Exhibits.
| (a)(1) | Not applicable |
| (a)(2) | Certifications pursuant to Rule 30a-2(a) under the Act and Section 302 of the Sarbanes-Oxley Act of 2002 are attached hereto. |
| (a)(3) | Not applicable. |
| (b) | Certifications pursuant to Rule 30a-2(b) under the Act and Section 906 of the Sarbanes-Oxley Act of 2002 are attached hereto. |
SIGNATURES
Pursuant to the requirements of the Securities Exchange Act of 1934 and the Investment Company Act of 1940, as amended, the Registrant has duly caused this report to be signed on its behalf by the undersigned, thereunto duly authorized.
| Aberdeen Investment Funds | ||||
| By: | /s/ Bev Hendry | |||
Bev Hendry Principal Executive Officer of Aberdeen Investment Funds | ||||
| Date: July 6, 2017 | ||||
Pursuant to the requirements of the Securities Exchange Act of 1934 and the Investment Company Act of 1940, as amended, this report has been signed below by the following persons on behalf of the Registrant and in the capacities and on the dates indicated.
| By: | /s/ Bev Hendry | |||
Bev Hendry Principal Executive Officer of Aberdeen Investment Funds | ||||
| Date: July 6, 2017 | ||||
| By: | /s/ Andrea Melia | |||
Andrea Melia Principal Financial Officer of Aberdeen Investment Funds | ||||
| Date: July 6, 2017 | ||||