As filed with the Securities and Exchange Commission on August 8, 2008
UNITED STATES
SECURITIES AND EXCHANGE COMMISSION
Washington, D.C. 20549
FORM N-CSR
CERTIFIED SHAREHOLDER REPORT OF REGISTERED MANAGEMENT INVESTMENT COMPANIES
Investment Company Act file number 811-6653
The Jensen Portfolio, Inc.
(Exact name of registrant as specified in charter)
5300 Meadows Road, Suite 250
Lake Oswego, OR 97035
(Address of principal executive offices) (Zip code)
Robert McIver
5300 Meadows Road, Suite 250
Lake Oswego, OR 97035
(Name and address of agent for service)
(800) 221-4384
Registrant's telephone number, including area code
Date of fiscal year end: May 31
Date of reporting period: May 31, 2008
Item 1. Report to Stockholders.

the Jensen Portfolio
Letter from The Investment Adviser
DEAR FELLOW SHAREHOLDERS:
The Jensen Portfolio—Class J Shares—returned -4.08% for the year ended May 31, 2008, compared to a return of -6.70% for the Standard & Poor’s 500 Index for this period. Please see pages 4 through 6 of this report for complete standardized performance information for the Portfolio.
Our Top Market Performers
Key contributors to the market performance of The Jensen Portfolio during the year were Emerson Electric (which represented 5.42% of assets and returned 22.7%) and the T. Rowe Price Group (which represented 2.90% of assets and returned 14.5%).
Emerson continues to increase business performance by solving clients’ growing infrastructure needs, particularly in emerging markets where the infrastructure needs are largest. A consistent generator of free cash flow, Emerson has a record of returning more than half of these flows to shareholders through dividends and share repurchases.
T. Rowe Price is a solid investment as it is a major force in the retirement industry and has promising prospects overseas. The company has a deep pool of talent that allows it to continue to gather new assets even in difficult environments and the firm’s culture and long-term performance has been consistently successful.
Our Biggest Market Detractors
The McGraw Hill Companies (which represented 1.69% of assets and declined 39.8%) and General Electric (which represented 4.60% of assets and declined 15.6%) were the largest detractors from The Jensen Portfolio’s performance during the year.
Standard & Poor’s, a division within McGraw-Hill’s Financial Services business and the world’s leading provider of independent investment research, indexes and ratings, was criticized for its ratings of some collateralized debt obligations (CDOs) in light of the weakening sub-prime market. Although these ratings have historically been viewed as opinions and not endorsements, the market reacted unfavorably to the prospect of potential claims against Standard & Poor’s and/ or changes to the ratings agency’s business model and the resulting impact.
The market price on shares of General Electric fell over the last few weeks in reaction to a rare earnings miss by the company for the first quarter of its fiscal year. This shortfall in earnings relative to expectations can largely be attributed to the rapid deterioration in financial markets following the near collapse of Bear Stearns in March 2008. While GE entered the quarter with plans to complete the sale of certain segments of its financial services business, rapidly deteriorating conditions delayed many of those transactions.
Additionally, our intended lack of representation in the energy and utilities sectors impacted our performance, as compared to the performance of the S&P 500 Index. Companies within these sectors, although always steadfast components of the broadly diversified S&P 500, typically do not qualify for our investable universe; energy companies because of the commodity nature of their business and utility companies due to the regulatory nature of their business.
Portfolio Changes
During the year CDW Corporation was acquired and taken out of public ownership, while at the same time Waters Corporation was added. Separately, we recently added Praxair Corporation and Adobe Systems.
CDW Corporation, a high volume, low cost distributor of name brand computer hardware, software and accessory products—and an excellent example of what we look for in a quality growth company—was acquired by private equity firm Madison Dearborn Partners. That forced us to eliminate the company as a holding. While we were pleased by the gains we realized in the stock, we were disappointed to lose the long-term opportunity to hold this position.
We are pleased to have added Waters Corporation to The Jensen Portfolio during this period. The company is a technology leader with a 25% share of the liquid chromatography industry; the process of separating the chemical components of an unknown substance. Waters also engages in mass spectrometry, a technique used to identify molecules based on their mass. Pharmaceutical and biotechnology businesses rely on Waters’ products for ongoing quality control.
Waters is a geographically diverse company with significant sales in Europe, Asia and the United States. Nearly 45% of revenues come from recurring consumable sales and service contracts. This figure jumps to 75% of revenues when instrument replacement sales are added.
Free cash flow has grown at a compounded annual growth rate of more than 17% for the past ten years. We anticipate that both free cash flow and long-term earnings can continue to grow at rates in the mid-teens. Waters’ experienced management team has ably reinvested in the business, bought back shares and made incremental acquisitions. Jensen entered this position at what we believe to be a significant discount to the company’s intrinsic value.
1
the Jensen Portfolio
Praxair Inc. is the largest industrial gas producer in the Americas and the third largest in the world. We believe it benefits from solid entry barriers due to high customer switching costs related to contracted sales, with 15-20 year take-or-pay contracts in its on-site business and 3-5 year exclusivity contracts in its merchant business. Barriers to entry also include the time and capital required to build industrial gas production facilities.
Increasing demand for industrial gases, particularly in developing economies where energy and infrastructure are leading drivers of growth, are already proving to be a strong driver for Praxair. With a large backlog of projects either under construction or ready to begin construction, especially in emerging markets, future growth prospects for Praxair look robust.
Adobe Systems Inc.’s software is widely used by creative professionals, designers, developers and hobbyists, and we feel it benefits from increasing use of handheld devices, internet advertising, web conferencing and digital cameras. Users are fiercely loyal to Adobe’s products.
The new versions of software products that Adobe has taken to market combine the company’s traditional offerings along with products from the Flash suite of software acquired in 2005. These new products have been very well received by the marketplace and are providing even greater content development opportunities for creative professionals. Combining these opportunities with the explosive demand for web-based activities should provide Adobe with meaningful growth for the foreseeable future.
For the past six calendar years earnings growth of companies in the S&P 500 Index has averaged 13.8%; a greater rate than we believe is sustainable and higher than the index’s long-term historical, single-digit averages. Indeed, earnings showed significant slowing in 2007 and the first part of 2008 due to factors including the housing downturn, liquidity difficulties and the repricing of credit risk. This slowing is expected to continue throughout 2008 and potentially into 2009 to levels in the mid- to high-single digits. In contrast, the earnings growth outlook for companies in The Jensen Portfolio is in the range of 10% to 11%, a level that we believe will, if achieved, be attractive to investors.
The Jensen Market Commentary
The descent of the stock market into bear territory—characterized by a 20% or greater drop in the Dow Jones Industrial Average—caused an outpouring of data on prior bear markets. Some were short in duration, others longer. Some had insignificant further erosion in prices, others had a distance to go. For the short-term investor bear markets are rudderless and frustrating if for no other reason than picking a bottom defies rational thought.
Nor do we suspect the market’s drop is lost on long-term investors who no doubt wondered why it takes a 20% drop to alert them that the market has gone south.
Each downdraft brings its own set of problems and the Federal Reserve has spent much of its capital to get to this point. Its balance sheet is stuffed with assets that belonged to the now defunct Bear Stearns.
With the Fed funds’ target rate at a nominal 2.00% (down from 5.25% one year ago) there is little room to further stimulate the economy. Moreover, commodity and energy prices are on a tear suggesting that inflation is more than just waiting in the wings.
The Fed’s maintenance of cheap credit, while providing liquidity to all sorts of financial institutions, could be fueling yet another bubble. Our guess is that this is not likely since in this young century, we’ve already experienced three (the dot-com, real estate, and commodities bubbles) and there may be nothing left to bubble. The Fed’s conundrum is that while raising interest rates to calm inflation may indeed ease inflationary pressures, more expensive money may halt any nascent recovery.
As bleak as this scenario may sound, dour markets have always proven to offer windows of opportunity for long-term investors. There is nothing secret about this claim as investors can buy their chosen investment at a discount from earlier times.
The Jensen Investment Strategy
The current “lower stock price/greater value” ratio means that now may be a good time to buy or add to your commitment in The Jensen Portfolio. Our reason for that suggestion is based upon our investment strategy, which is fully described in our current prospectus.
In a nutshell, our strategy requires companies to meet several criteria to be considered for inclusion in The Portfolio. The most severe and most demanding criteria is the requirement that a firm must have had at least a 15% return on equity in its ten most recent years. We estimate that this single requirement casts out more than 98% of traded American securities.
In order to achieve this lofty return on equity target, The Jensen Portfolio’s list of companies have had to demonstrate that they have a sustainable competitive advantage. This is the “protective moat” that Warren Buffett seeks in Berkshire Hathaway’s own portfolio. Patents, creative advertising, and economies of scale are strategies that provide this protection. To name names, Johnson & Johnson, The Coca-Cola Company and Stryker Corporation are excellent examples of such companies.
The cash that is generated by such high returns then can be deployed to enhance the businesses’ owners—its shareholders. Emerson Electric captured this thought in its 2003 Annual Report:
2
the Jensen Portfolio
“Operating capital efficiency and cash flow have become key performance measurements for all business units. We have four areas in which to invest cash. First is to pay increased dividends to shareholders, as we have for 48 consecutive years. Second, we continue to reinvest in our businesses through capital and technology spending. Third, we continue to make strategic acquisitions to strengthen current platforms and possibly add new ones. Last, we will repurchase shares when it makes sense from a shareholder return standpoint.”
Thus the evidence of a successful company is obtained by examining its record of return on equity. But common stock investing is all about the future and companies need able management to lead and to maintain their competitive advantages. As William Fruhan wrote in his book, Financial Strategy: Studies in the Creation, Transfer, and Destruction of Shareholder Value:
“Managers who are successful in either shaping or simply taking advantage of the competitive environment so as to earn returns in excess of their capital costs create enormous wealth for their shareholders.”
Our firm is pledged to the belief that navigating the very tricky economic waters of the world economy is best left to the managers of companies that have created and are maintaining their competitive advantage.
We appreciate your continued support.
Cordially,

Val Jensen, Chairman The Jensen Portfolio
and
The Jensen Investment Committee
This discussion and analysis of the Fund is as of May 2008 and is subject to change, and any forecasts made cannot be guaranteed.
Past performance is no guarantee of future results. Fund holdings and sector weightings are subject to change and are not recommendations to buy or sell any security. For more complete information regarding performance and holdings, please refer to the financial statements and schedule of investments headings of this report.
The Fund is nondiversified, meaning that it may concentrate its assets in fewer individual holdings than a diversified fund and is therefore more exposed to individual stock volatility than a diversified fund.
Free Cash Flow: Is equal to the after-tax net income of a company plus depreciation and amortization less capital expenditures.
Return on Equity: Is equal to a company’s after-tax earnings (excluding non-recurring items) divided by its average stockholder equity for the year.
For use only when preceded or accompanied by a current prospectus for the Fund.
The Jensen Portfolio is distributed by Quasar Distributors, LLC (07/08).
3
the Jensen Portfolio
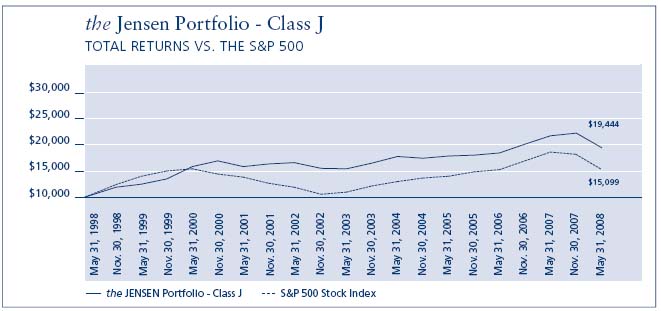
| Average Annual – FOR PERIODS ENDED May 31, 2008 | |||||
| 1 YEAR | 3 YEARS | 5 YEARS | 1O YEARS | ||
the Jensen Portfolio - Class J | -4.08% | 5.36% | 6.29% | 6.87% | |
| S&P 500 Stock Index | -6.70% | 7.57% | 9.77% | 4.21% | |
The S&P 500 Stock Index is an unmanaged but commonly used measure of common stock total return performance. This chart assumes an initial gross investment of $10,000 made on May 31, 1998 for Class J, the original share class of the fund. Returns shown include the reinvestment of all dividends. Returns shown do not reflect the deduction of taxes that a shareholder would pay on fund distributions or the redemption of fund shares.
Performance data shown represents past performance; Past performance does not guarantee future results. The investment return and principal value of an investment will fluctuate so that an investor’s shares, when redeemed, may be worth more or less than their original cost. Current performance of the fund may be lower or higher than the performance shown. Performance data current to the most recent month end may be obtained by calling 1-800-992-4144 or by visiting www.jenseninvestment.com.
4
the Jensen Portfolio
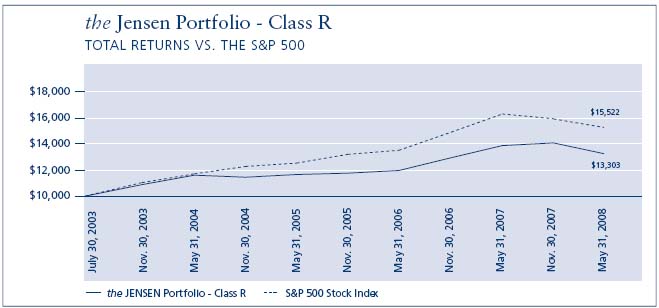
Average Annual – FOR PERIODS ENDED May 31, 2008 | ||||
| 1 YEAR | 3 YEARS | SINCE INCEPTION | ||
| JULY 30,2003 | ||||
the Jensen Portfolio - Class R | -4.34% | 5.10% | 6.07% | |
| S&P 500 Stock Index | -6.70% | 7.57% | 9.49% | |
The S&P 500 Stock Index is an unmanaged but commonly used measure of common stock total return performance. This chart assumes an initial gross investment of $10,000 made on July 30, 2003, the inception date for Class R shares. Returns shown include the reinvestment of all dividends. Returns shown do not reflect the deduction of taxes that a shareholder would pay on fund distributions or the redemption of fund shares.
Performance data shown represents past performance; Past performance does not guarantee future results. The investment return and principal value of an investment will fluctuate so that an investor’s shares, when redeemed, may be worth more or less than their original cost. Current performance of the fund may be lower or higher than the performance shown. Performance data current to the most recent month end may be obtained by calling 1-800-992-4144 or by visiting www.jenseninvestment.com.
5
the Jensen Portfolio
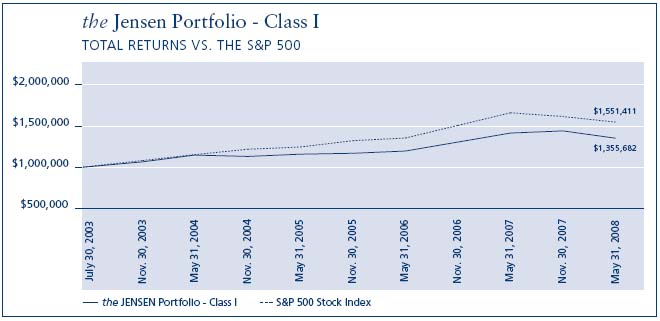
Average Annual – FOR PERIODS ENDED May 31, 2008 | ||||
| 1 YEAR | 3 YEARS | SINCE INCEPTION | ||
| JULY 30,2003 | ||||
the Jensen Portfolio - Class I | -3.86% | 5.59% | 6.54% | |
| S&P 500 Stock Index | -6.70% | 7.57% | 9.49% | |
The S&P 500 Stock Index is an unmanaged but commonly used measure of common stock total return performance. This chart assumes an initial gross investment of $1,000,000 made on July 30, 2003, the inception date for Class I shares. Returns shown include the reinvestment of all dividends. Returns shown do not reflect the deduction of taxes that a shareholder would pay on fund distributions or the redemption of fund shares.
Performance data shown represents past performance; Past performance does not guarantee future results. The investment return and principal value of an investment will fluctuate so that an investor’s shares, when redeemed, may be worth more or less than their original cost. Current performance of the fund may be lower or higher than the performance shown. Performance data current to the most recent month end may be obtained by calling 1-800-992-4144 or by visiting www.jenseninvestment.com.
6
the Jensen Portfolio
7
the Jensen Portfolio
| Statement of Assets & Liabilities | ||
| May 31, 2008 | ||
| Assets: | ||
| Investments, at value (cost $1,603,874,847) | $ | 2,067,146,871 |
| Income receivable | 3,273,530 | |
| Receivable for capital stock issued | 2,315,390 | |
| Other assets | 56,377 | |
| Total Assets | 2,072,792,168 | |
| Liabilities: | ||
| Payable to Investment Adviser | 991,118 | |
| Payable for capital stock redeemed | 1,973,535 | |
| Other accrued expenses | 1,150,739 | |
| Total Liabilities | 4,115,392 | |
| NET ASSETS | $ | 2,068,676,776 |
| NET ASSETS CONSIST OF: | ||
| Capital stock | 1,551,653,867 | |
| Unrealized appreciation on investments | 463,272,024 | |
| Accumulated undistributed net investment income | 3,063,026 | |
| Accumulated undistributed net realized gain | 50,687,859 | |
| Total Net Assets | $ | 2,068,676,776 |
| NET ASSETS CONSIST OF: | ||
| Class J Shares: | ||
| Net assets | $ | 1,706,765,116 |
| Shares outstanding | 63,431,453 | |
| Net Asset Value Per Share | ||
| (2,000,000,000 shares authorized, $.001 par value) | $ | 26.91 |
| Class R Shares: | ||
| Net assets | $ | 18,661,606 |
| Shares outstanding | 696,040 | |
| Net Asset Value Per Share | ||
| (1,000,000,000 shares authorized, $.001 par value) | $ | 26.81 |
| Class I Shares: | ||
| Net assets | $ | 343,250,054 |
| Shares outstanding | 12,755,510 | |
| Net Asset Value Per Share | ||
| (1,000,000,000 shares authorized, $.001 par value) | $ | 26.91 |
| 8 | THE ACCOMPANYING NOTES ARE AN INTEGRAL PART OF THESE FINANCIAL STATEMENTS. |
Jensen Portfolio
| Schedule of Investments | ||||
| May 31, 2008 | ||||
| SHARES | VALUE | |||
| Common Stock - 99.37% | ||||
| Beverages - 6.42% | ||||
| 805,000 | The Coca-Cola Company | $ | 46,094,300 | |
| 1,270,000 | PepsiCo, Inc. | 86,741,000 | ||
| 132,835,300 | ||||
| Capital Markets - 2.90% | ||||
| 1,034,000 | T. Rowe Price Group Inc. | 59,889,280 | ||
| Chemicals - 4.55% | ||||
| 1,173,000 | Ecolab, Inc. | 52,585,590 | ||
| 438,000 | Praxair, Inc. | 41,636,280 | ||
| 94,221,870 | ||||
| Commercial Banks - 3.63% | ||||
| 2,724,000 | Wells Fargo & Company | 75,100,680 | ||
| Commercial Services & Supplies - 4.00% | ||||
| 2,170,000 | Equifax, Inc. | 82,807,200 | ||
| Electrical Equipment - 5.42% | ||||
| 1,927,000 | Emerson Electric Co. | 112,112,860 | ||
| Food & Staples Retailing - 3.13% | ||||
| 2,097,000 | Sysco Corporation | 64,713,420 | ||
| Health Care Equipment & Supplies - 9.68% | ||||
| 1,821,400 | Medtronic, Inc. | 92,290,338 | ||
| 1,673,000 | Stryker Corporation | 107,992,150 | ||
| 200,282,488 | ||||
| Health Care Providers & Services - 2.23% | ||||
| 1,359,000 | Patterson Companies Inc. (a) | 46,219,590 | ||
| Household Products - 10.49% | ||||
| 524,000 | The Clorox Company | 29,936,120 | ||
| 1,002,000 | Colgate-Palmolive Company | 74,508,720 | ||
| 1,705,000 | The Procter & Gamble | |||
| Company | 112,615,250 | |||
| 217,060,090 | ||||
| Industrial Conglomerates - 9.41% | ||||
| 1,281,500 | 3M Co. | 99,393,140 | ||
| 3,098,800 | General Electric Company | 95,195,136 | ||
| 194,588,276 | ||||
| IT Services - 5.09% | ||||
| 1,477,500 | Automatic Data | |||
| Processing, Inc. | 63,606,375 | |||
| 1,203,000 | Paychex, Inc. | 41,563,650 | ||
| 105,170,025 | ||||
| SHARES | VALUE | |||
| Life Science Tools & Services - 3.37% | ||||
| 1,134,000 | Waters Corp. (a) | 69,763,680 | ||
| Machinery - 3.54% | ||||
| 936,000 | Danaher Corporation | 73,176,480 | ||
| Media - 6.55% | ||||
| 842,000 | The McGraw-Hill | |||
| Companies, Inc. | 34,934,580 | |||
| 2,051,000 | Omnicom Group Inc. | 100,519,510 | ||
| 135,454,090 | ||||
| Pharmaceuticals - 10.21% | ||||
| 1,911,000 | Abbott Laboratories | 107,684,850 | ||
| 1,551,500 | Johnson & Johnson | 103,547,110 | ||
| 211,231,960 | ||||
| Software - 6.71% | ||||
| 1,216,000 | Adobe Systems, Inc. (a) | 53,576,960 | ||
| 3,007,200 | Microsoft Corporation | 85,163,904 | ||
| 138,740,864 | ||||
| Specialty Retail - 2.04% | ||||
| 1,327,000 | Bed Bath & Beyond, Inc. (a) | 42,278,220 | ||
| Total Common Stock | ||||
| (Cost $1,592,374,349) | 2,055,646,373 | |||
| PRINCIPAL AMOUNT | ||||
| Short Term Investments - 0.56% | ||||
| Commercial Paper - 0.56% | ||||
| 11,462,000 | Prudential, 1.79%, 6/2/2008 | 11,461,442 | ||
| Variable Rate Demand Notes (b) - 0.00% | ||||
| 39,056 | Wisconsin Corporate Central | |||
| Credit Union, 4.99% | 39,056 | |||
| Total Short Term Investments - | ||||
| (Cost $11,500,498) | 11,500,498 | |||
| Total Investments - (Cost | ||||
| $1,603,874,847) - 99.93% | 2,067,146,871 | |||
| Other Assets in Excess of | ||||
| Liabilities - 0.07% | 1,529,905 | |||
| NET ASSETS - 100.00% | $ | 2,068,676,776 | ||
| (a) Non-Income Producing | ||||
| (b) Variable rate demand notes are considered short-term obligations and are payable on demand. Interest rates change periodically on specified dates. The rates shown are as of May 31, 2008. | ||||
| THE ACCOMPANYING NOTES ARE AN INTEGRAL PART OF THESE FINANCIAL STATEMENTS. | 9 |
Jensen Portfolio
| Statement of Operations | ||
| Year Ended May 31, 2008 | ||
| Investment Income: | ||
| Dividend income | $ | 38,728,055 |
| Interest income | 857,758 | |
| 39,585,813 | ||
| Expenses: | ||
| Investment advisory fees | 10,991,438 | |
| 12b-1 fees - Class J | 4,588,800 | |
| Administration fees | 849,344 | |
| Transfer agent fees - Class J | 226,973 | |
| Custody fees | 210,999 | |
| Directors’ fees and expenses | 121,653 | |
| Reports to shareholders - Class J | 165,523 | |
| Fund accounting fees | 146,012 | |
| Federal and state registration fees | 112,189 | |
| Professional fees | 155,837 | |
| 12b-1 fees - Class R | 100,375 | |
| Transfer agent expenses | 101,657 | |
| Shareholder servicing fees - Class I | 78,316 | |
| Reports to shareholders - Class I | 11,614 | |
| Reports to shareholders - Class R | 2,760 | |
| Transfer agent fees - Class I | 1,809 | |
| Transfer agent fees - Class R | 920 | |
| Other | 53,021 | |
| Total expenses | 17,919,240 | |
| NET INVESTMENT INCOME | 21,666,573 | |
| REALIZED AND UNREALIZED GAIN | ||
| ON INVESTMENTS: | ||
| Net realized gain on investment | ||
| transactions | 89,551,484 | |
| Change in unrealized appreciation on | ||
| investments | (201,296,791) | |
| Net loss on investments | (111,745,307) | |
| NET DECREASE IN NET ASSETS RESULTING | ||
| FROM OPERATIONS | ($90,078,734) |
| Statements of Changes in | ||||
| Net Assets | ||||
| YEAR ENDED | YEAR ENDED | |||
| MAY 31, ‘08 | MAY 31, ‘07 | |||
| Operations: | ||||
| Net investment income | $ | 21,666,573 | $ | 19,019,871 |
| Net realized gain on | ||||
| investment transactions | 89,551,484 | 38,884,573 | ||
| Change in unrealized | ||||
| appreciation (depreciation) | ||||
| on investments | (201,296,791) | 302,562,999 | ||
| Net increase (decrease) in | ||||
| net assets resulting from | ||||
| operations | (90,078,734) | 360,467,443 | ||
| Capital Share Transactions: | ||||
| Shares sold - Class J | 326,193,682 | 428,024,945 | ||
| Shares sold - Class R | 6,357,612 | 8,505,307 | ||
| Shares sold - Class I | 127,102,066 | 194,283,893 | ||
| Shares issued to holders in | ||||
| reinvestment of | ||||
| dividends - Class J | 29,935,277 | 13,964,384 | ||
| Shares issued to holders in | ||||
| reinvestment of | ||||
| dividends - Class R | 289,339 | 126,551 | ||
| Shares issued to holders in | ||||
| reinvestment of | ||||
| dividends - Class I | 6,125,614 | 3,653,721 | ||
| Shares redeemed - Class J | (505,722,375) | (525,071,602) | ||
| Shares redeemed - Class R | (9,094,633) | (10,918,934) | ||
| Shares redeemed - Class I | (111,653,034) | (221,507,714) | ||
| Net (decrease) | (130,466,452) | (108,939,449) | ||
| DIVIDENDS AND DISTRIBUTIONS | ||||
| TO SHAREHOLDERS: | ||||
| Net investment income - Class J | (17,371,282) | (14,846,342) | ||
| Net investment income - Class R | (139,969) | (126,551) | ||
| Net investment income - Class I | (4,034,303) | (4,072,037) | ||
| Net realized capital gains - Class J | (13,887,735) | — | ||
| Net realized capital gains - Class R | (149,385) | — | ||
| Net realized capital gains - Class I | (2,576,922) | — | ||
| Total dividends and | ||||
| distributions | (38,159,596) | (19,044,930) | ||
| INCREASE (DECREASE) IN | ||||
| NET ASSETS | (258,704,782) | 232,483,064 | ||
| NET ASSETS: | ||||
| Beginning of year | 2,327,381,558 | 2,094,898,494 | ||
| End of year (including | ||||
| undistributed net | ||||
| investment income of | ||||
| $3,063,026 and $2,942,007, | ||||
| respectively) | $ | 2,068,676,776 | $ | 2,327,381,558 |
| 10 | THE ACCOMPANYING NOTES ARE AN INTEGRAL PART OF THESE FINANCIAL STATEMENTS. |
Jensen Portfolio
| Financial Highlights | |||||||||||
| Class J | |||||||||||
| YEAR ENDED | YEAR ENDED | YEAR ENDED | YEAR ENDED | YEAR ENDED | |||||||
| MAY 31, ‘08 | MAY 31, ‘07 | MAY 31, ‘06 | MAY 31, ‘05 | MAY 31, ‘04 | |||||||
| Per Share Data: | |||||||||||
| Net asset value, beginning of year | $ | 28.53 | $ | 24.37 | $ | 23.79 | $ | 23.82 | $ | 20.80 | |
| Income from investment operations: | |||||||||||
| Net investment income | 0.27 | 0.22 | 0.22 | 0.18 | 0.16 | ||||||
| Net realized and unrealized gains | |||||||||||
| (losses) on investments | (1.42) | 4.16 | 0.56 | (0.03)(1) | 3.01 | ||||||
| Total from investment operations | (1.15) | 4.38 | 0.78 | 0.15 | 3.17 | ||||||
| Less distributions: | |||||||||||
| Dividends from net investment income | (0.26) | (0.22) | (0.20) | (0.18) | (0.15) | ||||||
| Dividends from net realized capital gains | (0.21) | — | — | — | — | ||||||
| Total distributions | (0.47) | (0.22) | (0.20) | (0.18) | (0.15) | ||||||
| Net asset value, end of year | $ | 26.91 | $ | 28.53 | $ | 24.37 | $ | 23.79 | $ | 23.82 | |
| Total return | -4.08 | % | 18.05 | % | 3.30 | % | 0.61 | % | 15.28 | % | |
| Supplemental data and ratios: | |||||||||||
| Net assets, end of year (000’s) | $ | 1,706,765 | $ | 1,963,520 | $ | 1,764,212 | $ | 2,680,169 | $ | 2,046,288 | |
| Ratio of expenses to average net assets | 0.85 | % | 0.85 | % | 0.85 | % | 0.85 | % | 0.88 | % | |
| Ratio of net investment income | |||||||||||
| to average net assets | 0.95 | % | 0.83 | % | 0.85 | % | 0.77 | % | 0.71 | % | |
| Portfolio turnover rate | 8.25 | % | 13.77 | % | 10.20 | % | 8.81 | % | 5.32 | % | |
(1) The amount shown may not correlate with the aggregate gains (losses) of portfolio securities due to timing of subscriptions and redemption of fund shares. | |||||||||||
| THE ACCOMPANYING NOTES ARE AN INTEGRAL PART OF THESE FINANCIAL STATEMENTS. | 11 |
Jensen Portfolio
| Financial Highlights | |||||||||||
| Class R | |||||||||||
| PERIOD FROM | |||||||||||
| YEAR ENDED | YEAR ENDED | YEAR ENDED | YEAR ENDED | JUL. 30, ‘03(1) | |||||||
| MAY 31, ‘08 | MAY 31, ‘07 | MAY 31, ‘06 | MAY 31, ‘05 | TO MAY 31, ‘04 | |||||||
| Per Share Data: | |||||||||||
| Net asset value, beginning of period | $ | 28.43 | $ | 24.29 | $ | 23.71 | $ | 23.76 | $ | 20.93 | |
| Income from investment operations: | |||||||||||
| Net investment income | 0.22 | 0.15 | 0.14 | 0.14 | 0.13 | ||||||
| Net realized and unrealized gains (losses) | |||||||||||
on investments | (1.44) | 4.14 | 0.59 | (0.05)(2) | 2.83 | ||||||
| Total from investment operations | (1.22) | 4.29 | 0.73 | 0.09 | 2.96 | ||||||
| Less distributions: | |||||||||||
| Dividends from net investment income | (0.19) | (0.15) | (0.15) | (0.14) | (0.13) | ||||||
| Dividends from net realized capital gains | (0.21) | 0.00 | 0.00 | 0.00 | 0.00 | ||||||
| Total distributions | (0.40) | (0.15) | (0.15) | (0.14) | (0.13) | ||||||
| Net asset value, end of period | $ | 26.81 | $ | 28.43 | $ | 24.29 | $ | 23.71 | $ | 23.76 | |
Total return(3) | -4.34 | % | 17.73 | % | 3.07 | % | 0.40 | % | 14.13 | % | |
| Supplemental data and ratios: | |||||||||||
| Net assets, end of period (000’s) | $ | 18,662 | $ | 22,272 | $ | 21,100 | $ | 23,884 | $ | 799 | |
Ratio of expenses to average net assets(4) | 1.10 | % | 1.10 | % | 1.10 | % | 1.10 | % | 1.12 | % | |
| Ratio of net investment income to | |||||||||||
average net assets(4) | 0.70 | % | 0.58 | % | 0.60 | % | 0.54 | % | 0.45 | % | |
Portfolio turnover rate(3) | 8.25 | % | 13.77 | % | 10.20 | % | 8.81 | % | 5.32 | % | |
| (1) Commencement of operations. | |||||||||||
| (2) The amount shown may not correlate with the aggregate gains (losses) of portfolio securities due to timing of subscriptions and redemption of fund shares. | |||||||||||
| (3) Not annualized for periods less than one year. | |||||||||||
| (4) Annualized for periods less than one year. | |||||||||||
| 12 | THE ACCOMPANYING NOTES ARE AN INTEGRAL PART OF THESE FINANCIAL STATEMENTS. |
Jensen Portfolio
| Financial Highlights | |||||||||||
| Class I | |||||||||||
| PERIOD FROM | |||||||||||
| YEAR ENDED | YEAR ENDED | YEAR ENDED | YEAR ENDED | JUL. 30, ‘03(1) | |||||||
| MAY 31, ‘08 | MAY 31, ‘07 | MAY 31, ‘06 | MAY 31, ‘05 | TO MAY 31, ‘04 | |||||||
| Per Share Data: | |||||||||||
| Net asset value, beginning of period | $ | 28.53 | $ | 24.38 | $ | 23.80 | $ | 23.82 | $ | 20.93 | |
| Income from investment operations: | |||||||||||
| Net investment income | 0.30 | 0.25 | 0.24 | 0.23 | 0.12 | ||||||
| Net realized and unrealized gains (losses) | |||||||||||
| on investments | (1.38) | 4.16 | 0.59 | (0.04) (2) | 2.92 | ||||||
| Total from investment operations | (1.08) | 4.41 | 0.83 | 0.19 | 3.04 | ||||||
| Less distributions: | |||||||||||
| Dividends from net investment income | (0.33) | (0.26) | (0.25) | (0.21) | (0.15) | ||||||
| Dividends from net realized capital gains | (0.21) | 0.00 | 0.00 | 0.00 | 0.00 | ||||||
| Total distributions | (0.54) | (0.26) | (0.25) | (0.21) | (0.15) | ||||||
| Net asset value, end of period | $ | 26.91 | $ | 28.53 | $ | 24.38 | $ | 23.80 | $ | 23.82 | |
Total return(3) | -3.86 | % | 18.23 | % | 3.56% | 0.77% | 14.54% | ||||
| Supplemental data and ratios: | |||||||||||
| Net assets, end of period (000’s) | $ | 343,250 | $ | 341,589 | $ | 309,587 | $ | 288,428 | $ | 227,561 | |
Ratio of expenses to average net assets(4) | 0.59 | % | 0.65 | % | 0.67 | % | 0.67 | % | 0.70 | % | |
| Ratio of net investment income to | |||||||||||
average net assets(4) | 1.20 | % | 1.03 | % | 1.03 | % | 0.95 | % | 0.87 | % | |
Portfolio turnover rate(3) | 8.25 | % | 13.77 | % | 10.20 | % | 8.81 | % | 5.32 | % | |
| (1) Commencement of operations. | |||||||||||
| (2) The amount shown may not correlate with the aggregate gains (losses) of portfolio securities due to timing of subscriptions and redemption of fund shares. | |||||||||||
| (3) Not annualized for periods less than one year. | |||||||||||
| (4) Annualized for periods less than one year. | |||||||||||
| THE ACCOMPANYING NOTES ARE AN INTEGRAL PART OF THESE FINANCIAL STATEMENTS. | 13 |
the Jensen Portfolio
Notes to the Financial Statements
May 31, 2008
1. Organization and Significant Accounting Policies
The Jensen Portfolio, Inc. (the “Fund”) was organized as an Oregon Corporation on April 17, 1992, and is registered as an open-end, nondiversified management investment company under the Investment Company Act of 1940 (the “1940 Act”). The Fund commenced operations on August 3, 1992. Effective July 30, 2003, the Fund issued two new classes of shares, Class R and Class I, and renamed the existing class as Class J. Class J shares are subject to a 0.25% 12b-1 fee; Class R shares are subject to a 0.50% 12b-1 fee and Class I shares are subject to a 0.10% shareholder servicing fee, as described in each Class’ prospectus. Each class of shares has identical rights and privileges except with respect to the 12b-1 fees and shareholder servicing fee, and voting rights on matters affecting a single class of shares. The principal investment objective of the Fund is long-term capital appreciation.
The following is a summary of significant accounting policies consistently followed by the Fund. The policies are in conformity with accounting principles generally accepted in the United States of America.
a) Investment Valuation – Securities that are listed on United States stock exchanges or the Nasdaq Stock Market are valued at the last sale price on the day the securities are valued or, if there has been no sale on that day, at their current bid price. Quotations are taken from the market in which the security is primarily traded. Over-the-counter securities are valued at current bid price. Securities for which market quotations are not readily available are valued at fair value as determined by the Investment Adviser at or under the direction of the Fund’s Board of Directors. There were no securities valued by the Board of Directors as of May 31, 2008. Variable rate demand notes are valued at cost which approximates fair value.
b) Federal Income Taxes – No provision for federal income taxes has been made since the Fund has complied to date with the requirements of Subchapter M of the Internal Revenue Code applicable to regulated investment companies and intends to continue to so comply in the future and to distribute substantially all of its net investment income and realized capital gains in order to relieve the Fund from all federal income taxes.
Effective November 30, 2007, the Fund adopted Financial Accounting Standards Board (FASB) Interpretation No. 48 (FIN 48), “Accounting for Uncertainty in Income Taxes”. FIN 48 requires the evaluation of tax positions taken on previously filed tax returns or expected to be taken on future returns. These positions must meet a “more-likely-than-not” standard that, based on the technical merits, have a more than fifty percent likelihood of being sustained by the applicable tax authority. In evaluating whether a tax position has met the recognition threshold, the Fund must presume that the position will be examined by the appropriate taxing authority that has full knowledge of all relevant information. Tax positions not deemed to meet the “more-likely-than-not” threshold are recorded as a tax expense in the current year.
FIN 48 requires the Fund to analyze all open tax years, as defined by the Statute of Limitations, for all major jurisdictions. Open tax years are those that are open for exam by taxing authorities. As of May 31, 2008, open Federal tax years include the tax years ended May 31, 2005 through 2007. The Fund has no examination in progress.
The Fund has reviewed all open tax years and major jurisdictions and concluded that the adoption of FIN 48 resulted in no effect to the Fund’s financial position or results of operations. There is no tax liability resulting from unrecognized tax benefits relating to uncertain income tax positions taken or expected to be taken for the period ended May 31, 2008. The Fund is also not aware of any tax positions for which it is reasonably possible that the total amounts of unrecognized tax benefits will significantly change in the next twelve months.
c) Accounting Pronouncements – In September 2006, the Financial Accounting Standards Board (FASB) issued Statement on Financial Accounting Standards (SFAS) No. 157, “Fair Value Measurements.” This standard establishes a single authoritative definition of fair value, sets out a framework for measuring fair value and requires additional disclosures about fair value measurements. SFAS No. 157 applies to fair value measurements already required or permitted by existing standards. SFAS No. 157 is effective for financial statements issued for fiscal years beginning after November 15, 2007 and interim periods within those fiscal years. The changes to current generally accepted accounting principles from the application of this Statement relate to the definition of fair value, the methods used to measure fair value, and the expanded disclosures about fair value measurements. Management believes the adoption of SFAS No. 157 will have no impact the financial statement amounts; however, additional disclosures will be required about the inputs used to develop the measurements and the effect of certain measurements on changes in net assets for the period.
In March 2008, Statement of Financial Accounting Standards No. 161, “Disclosures about Derivative Instruments and Hedging Activities” (“SFAS 161”) was issued and is effective for fiscal years beginning after November 15, 2008. SFAS 161 is intended to improve financial reporting for derivative instruments by requiring enhanced disclosure that enables investors to understand how and why an entity uses derivatives, how derivatives are accounted for, and how derivative instruments affect an entity’s results of operations and financial position. Management is currently evaluating the implications of SFAS 161. The impact on the Fund’s financial statement disclosures, if any, is currently being assessed.
d) Distributions to Shareholders – Dividends to shareholders are recorded on ex-dividend date. Dividends from net investment income are declared and paid quarterly by the Fund. Distributions of net realized capital gains, if any, will be declared and paid at least annually. Income and capital gain distributions are determined in accordance with income tax regulations which may differ from generally accepted accounting principles. Permanent differences between financial reporting and tax are reclassified to capital stock.
e) Use of Estimates – The preparation of financial statements in conformity with accounting principles generally accepted in the United States of America requires management to make estimates and assumptions that affect the reported amounts of assets and liabilities and disclosure of contingent assets and liabilities at the date of the financial statements and the reported amounts of revenues and expenses during the reporting period. Actual results could differ from those estimates.
14
the Jensen Portfolio
f) Guarantees and Indemnifications – Under the Fund’s organizational documents, each Director, officer, employee or other agent of the Fund is indemnified, to the extent permitted by the Act, against certain liabilities that may arise out of performance of their duties to the Fund. Additionally, in the normal course of business, the Fund enters into contracts that contain a variety of indemnification clauses. The Fund’s maximum exposure under these arrangements is unknown as this would involve future claims that may be made against the Fund that have not yet occurred. However, the Fund has not had prior claims or losses pursuant to these contracts and believes the risk of loss to be remote.
g) Other – Investment and shareholder transactions are recorded on trade date. Gains or losses from investment transactions are determined on the basis of identified carrying value. Dividend income is recognized on the ex-dividend date and interest income is recognized on an accrual basis. The Fund has investments in short-term variable rate demand notes, which are unsecured instruments. These notes may present credit risk to the extent the issuer defaults on its payment obligation. The credit-worthiness of the issuer is monitored, and these notes are considered to present minimal credit risk in the opinion of the Investment Adviser. Income, expenses (other than those deemed attributable to a specific share class), and gains and losses of the Fund are allocated daily to each class of shares based upon the ratio of net assets represented by each class as a percentage of the net assets of the Fund. Expenses deemed directly attributable to a specific class of shares are charged against the operations of such class.
2. Capital Share Transactions
| Transactions in shares of the Fund were as follows: | |||
| YEAR ENDED | YEAR ENDED | ||
| MAY 31, ‘08 | MAY 31, ‘07 | ||
| Class J | |||
| Shares sold | 11,906,634 | 16,272,974 | |
| Shares issued to holders in | |||
| reinvestment of dividends | 1,067,519 | 543,529 | |
| Shares redeemed | (18,374,345) | (20,364,667) | |
| Net (decrease) | (5,400,192) | (3,548,164) | |
| Shares outstanding: | |||
| Beginning of year | 68,831,645 | 72,379,809 | |
| End of year | 63,431,453 | 68,831,645 | |
| Class R | |||
| Shares sold | 230,410 | 328,331 | |
| Shares issued to holders in | |||
| reinvestment of dividends | 10,341 | 4,944 | |
| Shares redeemed | (328,249) | (418,468) | |
| Net (decrease) | (87,498) | (85,193) | |
| Shares outstanding: | |||
| Beginning of year | 783,538 | 868,731 | |
| End of year | 696,040 | 783,538 | |
| YEAR ENDED | YEAR ENDED | ||
| MAY 31, ‘08 | MAY 31, ‘07 | ||
| Class I | |||
| Shares sold | 4,611,371 | 7,479,267 | |
| Shares issued to holders in | |||
| reinvestment of dividends | 218,956 | 141,075 | |
| Shares redeemed | (4,049,823) | (8,346,303) | |
| Net increase (decrease) | 780,504 | (725,961) | |
| Shares outstanding: | |||
| Beginning of year | 11,975,006 | 12,700,967 | |
| End of year | 12,755,510 | 11,975,006 |
3. Investment Transactions
The aggregate purchases and aggregate sales of securities, excluding short-term investments, by the Fund for the year ended May 31, 2008, were $179,779,540 and 323,104,675 respectively.
4. Income Taxes
The cost of investments differ for financial statement and tax purposes primarily due to differing treatments of wash sales. The distributions of $21,545,554 and $19,044,930paid during the years ended May 31, 2008 and 2007, respectively, were classified as ordinary for income tax purposes. Distributions of $16,614,042 paid during the year ended May 31, 2008 were classified as long term capital gain for income tax purposes.
| At May 31, 2008, the cost of investments, net unrealized | ||
| appreciation (depreciation) and undistributed ordinary | ||
| income and undistributed long term capital gains for income | ||
| tax purposes were as follows: | ||
| Cost of investments | $ | 1,603,883,662 |
| Gross unrealized appreciation | 496,698,110 | |
| Gross unrealized depreciation | (33,434,901) | |
| Net unrealized appreciation | $ | 463,263,209 |
| Undistributed ordinary income | 3,063,026 | |
| Undistributed long-term capital gain | 50,696,674 | |
| Total distributable earnings | $ | 53,759,700 |
| Other accumulated losses | — | |
| Total accumulated earnings | $ | 517,022,909 |
5. Line of Credit
The Fund has a $250 million revolving credit facility for temporary emergency purposes, including the meeting of redemption requests that otherwise might require the untimely disposition of securities. The interest rate on the outstanding principal amount is equal to the prime rate less 1/2%. The Fund did not borrow on the line of credit during the year ended May 31, 2008.
6. Investment Advisory Agreement
The Fund has entered into an Investment Advisory and Service Contract with Jensen Investment Management, Inc. Pursuant to its advisory agreement with the Fund, the Investment Adviser is entitled to receive a fee, calculated daily and payable monthly, at the annual rate of 0.50% as applied to the Fund’s daily net assets.
Certain officers of the Fund are also officers and directors of the Investment Adviser.
15
the Jensen Portfolio
7. Distribution and Shareholder Servicing
The Fund has adopted a distribution and shareholder servicing plan pursuant to Rule 12b-1 under the 1940 Act (the “12b-1 Plan”), which provides that the Fund may make payment to the Fund’s distributor or others at an annual rate of up to 0.25% of the average daily net assets attributable to Class J shares and up to 0.50% of the average daily net assets attributable to Class R shares. Payments under the 12b-1 Plan shall be used to compensate or reimburse the Fund’s distributor or others for services provided and expenses incurred in connection with the sale and/or servicing of shares.
In addition, the Fund has adopted a Shareholder Servicing Plan (the “Servicing Plan”) under which the Fund can pay for shareholder support services from the Fund’s assets pursuant to a Shareholder Servicing Agreement in an amount not to exceed 0.10% of the Fund’s average daily net assets attributable to Class I shares.
16
the Jensen Portfolio
REPORT OF INDEPENDENT REGISTERED PUBLIC ACCOUNTING FIRM
To the Board of Directors and Shareholders of The Jensen Portfolio, Inc.
In our opinion, the accompanying statement of assets and liabilities, including the schedule of investments, and the related statements of operations and of changes in net assets and the financial highlights present fairly, in all material respects, the financial position of The Jensen Portfolio, Inc. (the “Fund”) at May 31, 2008, the results of its operations for the year then ended, the changes in its net assets for each of the two years in the period then ended and the financial highlights for the periods presented, in conformity with accounting principles generally accepted in the United States of America. These financial statements and financial highlights (hereafter referred to as “financial statements”) are the responsibility of the Fund’s management; our responsibility is to express an opinion on these financial statements based on our audits. We conducted our audits of these financial statements in accordance with the standards of the Public Company Accounting Oversight Board (United States). Those standards require that we plan and perform the audit to obtain reasonable assurance about whether the financial statements are free of material misstatement. An audit includes examining, on a test basis, evidence supporting the amounts and disclosures in the financial statements, assessing the accounting principles used and significant estimates made by management, and evaluating the overall financial statement presentation. We believe that our audits, which included confirmation of securities at May 31, 2008 by correspondence with the custodian, provide a reasonable basis for our opinion.

Milwaukee, Wisconsin July 23, 2008
17
the Jensen Portfolio
Expense Example – May 31, 2008 (Unaudited)
As a shareholder of The Jensen Portfolio (the “Fund”), you incur ongoing costs, including investment advisory fees, distribution and/or shareholder servicing fees, and other Fund expenses, which are indirectly paid by shareholders. This example is intended to help you understand your ongoing costs (in dollars) of investing in the Fund and to compare these costs with the ongoing costs of investing in other mutual funds.
The Example is based on an investment of $1,000 invested at the beginning of the period and held for the entire six month period (December 1, 2007 – May 31, 2008).
Actual Expenses
The first line of the table below for each share class of the Fund provides information about actual account values and actual expenses. However, the table does not include shareholder specific fees, such as the $15.00 fee charged to IRA accounts, or the $12.00 fee charged for wire redemptions. The table also does not include portfolio trading commissions and related trading costs. You may use the information in this line, together with the amount you invested, to estimate the expenses that you paid over the period. Simply divide your account value by $1,000 (for example, an $8,600 account value divided by $1,000 = 8.6), then multiply the result by the number in the first line under the heading entitled “Expenses Paid During Period” to estimate the expenses you paid on your account during this period.
Hypothetical Example for Comparison Purposes
The second line of the table below provides information about hypothetical account values and hypothetical expenses based on the actual expense ratios for each share class of the Fund and an assumed rate of return of 5%per year before expenses, which is not the Fund’s actual return. The hypothetical account values and expenses may not be used to estimate the actual ending account balance or expenses you paid for the period. You may use this information to compare the ongoing costs of investing in the Fund and other funds. To do so, compare this 5% hypothetical example with the 5% hypothetical examples that appear in the shareholder reports of the other funds.
Please note that the expenses shown in the table are meant to highlight your ongoing costs only and do not reflect any transactional costs, such as sales charges (loads), redemption fees, or exchange fees which, although not charged by the Fund, may be charged by other funds. Therefore, the second line of the table is useful in comparing ongoing costs only, and will not help you determine the relative total costs of owning different funds.
| Expense Example Tables | |||||
| The Jensen Portfolio–Class J | |||||
| BEGINNING | ENDING | EXPENSES PAID | |||
| ACCOUNT VALUE | ACCOUNT VALUE | DURING PERIOD* | |||
| DECEMBER 1, 2007 | MAY 31, 2008 | DECEMBER 1, 2007 – MAY 31, 2008 | |||
| Actual | $1,000.00 | $ 939.00 | $4.17 | ||
| Hypothetical (5% annual return before expenses) | 1,000.00 | 1,020.70 | 4.34 | ||
| * Expenses are equal to the Fund’s annualized expense ratio of 0.86%, multiplied by the average account value over the period, multiplied by 183/366 to reflect the one-half year period. | |||||
| The Jensen Portfolio–Class R | |||||
| BEGINNING | ENDING | EXPENSES PAID | |||
| ACCOUNT VALUE | ACCOUNT VALUE | DURING PERIOD* | |||
| DECEMBER 1, 2007 | MAY 31, 2008 | DECEMBER 1, 2007 – MAY 31, 2008 | |||
| Actual | $1,000.00 | $ 938.00 | $5.38 | ||
| Hypothetical (5% annual return before expenses) | 1,000.00 | 1,019.45 | 5.60 | ||
| * Expenses are equal to the Fund’s annualized expense ratio of 1.11%, multiplied by the average account value over the period, multiplied by 183/366 to reflect the one-half year period. | |||||
| The Jensen Portfolio–Class I | |||||
| BEGINNING | ENDING | EXPENSES PAID | |||
| ACCOUNT VALUE | ACCOUNT VALUE | DURING PERIOD* | |||
| DECEMBER 1, 2007 | MAY 31, 2008 | DECEMBER 1, 2007 – MAY 31, 2008 | |||
| Actual | $1,000.00 | $ 940.60 | $2.77 | ||
| Hypothetical (5% annual return before expenses) | 1,000.00 | 1,022.15 | 2.88 | ||
| * Expenses are equal to the Fund’s annualized expense ratio of 0.57%, multiplied by the average account value over the period, multiplied by 183/366 to reflect the one-half year period. | |||||
18
the Jensen Portfolio
Additional Information (Unaudited)
1. INVESTMENT ADVISORY AGREEMENT DISCLOSURE
Section 15(c) of the Investment Company Act of 1940 (the “1940 Act”) requires that a fund’s board of directors, including a majority of independent directors voting separately, approve any new investment advisory contract for the fund and thereafter to review and approve the terms of the fund’s investment advisory agreement on an annual basis. In addition, Section 15(a) of the 1940 Act requires that any new investment advisory agreement be approved by the fund’s shareholders.
In their most recent deliberations concerning whether to renew The Jensen Portfolio’s (the “Fund”) existing Investment Advisory Agreement (“Existing Agreement”) and whether to approve a proposed new Investment Advisory Agreement (“New Agreement”), the Fund’s Board of Directors, including the independent directors (the “Board”), conducted the review and made the determinations that are described below. During its deliberations, the Board requested from Jensen Investment Management, Inc., the Fund’s investment adviser (the “Adviser”), and the Adviser furnished, all information reasonably necessary for it to evaluate both the renewal of the Existing Agreement and the approval of the New Agreement.
The entire Board first met on October 12, 2005 and January 11 , 2006 to consider the planned retirement of Gary Hibler and the effects his retirement and the resulting change of control of the Adviser might have on the Fund’s and the Adviser’s operations. The entire Board met again on April 12, 2006 to consider the information provided by the Adviser in connection with the annual renewal of the Existing Agreement and the approval of the New Agreement. At the April 12 meeting, the independent directors (“Independent Directors”) met separately with their legal counsel to consider the information provided by the Adviser and identify additional information they needed to evaluate the Existing Agreement and the New Agreement. The entire Board then met again on July 19, 2006 to consider the annual continuation of the Existing Agreement and the approval of the New Agreement. At the July 19 meeting, the Independent Directors reconvened in a separate meeting with their legal counsel to consider the additional information provided by the Adviser and to consider the annual continuation of the Existing Agreement and the approval of the New Agreement. During those meetings, the Board considered the factors and reached the conclusions described below, among others. The Board did not identify any single factor as controlling. Moreover, not every factor was given the same weight by each Director.
Nature, Extent and Quality of Services
The Board of Directors, including the Independent Directors, considered the nature, extent and quality of services provided to the Fund by the Adviser under the Existing Agreement and the services proposed to be provided under the New Agreement. The Board reviewed the terms of the Existing Agreement and the New Agreement, as well as the history of the Adviser and its investment discipline, its investment performance, and its day to day management of the Fund. The Board noted the Adviser’s focus on the business of the Fund, the additions to the Adviser’s staff to support research activities, compliance and other servicing aspects of the Fund, and the Adviser’s oversight of the Fund’s service providers. In particular, the Board noted the Adviser’s recent addition of two research analysts and new investment research tools and analysis services to enhance the Adviser’s research capabilities.
The Board considered the proposed changes in the Adviser’s ownership and management and the potential impact on the Fund and the Adviser. The Board studied the Adviser’s succession plans, its organizational and ownership structure, and the composition of its five-person investment committee, which makes all investment decisions for the Fund. Based on these and other factors, including those referenced below, the Board concluded that the services provided to the Fund continued to be satisfactory and were not likely to change materially under the New Agreement.
Investment Performance
The Board examined the investment performance of the Fund compared to appropriate securities indices, to appropriate Lipper and Morningstar categories, and to other mutual funds of similar asset size and with similar investment objectives and strategies. Performance over one-, three-, five- and ten-year periods for the Fund was analyzed. The Board noted that the Fund outperformed its benchmark index and comparable funds for the five- and ten-year periods, but underperformed its benchmark index and comparable funds for the one- and three-year periods. Moreover, the Board found that redemptions of Fund shares during the last 12 months significantly exceeded sales of new Fund shares, resulting in lower overall assets in the Fund from the prior year. The Board understood, based on the data presented, that approximately 20% of the Fund’s underperformance compared to its benchmark index for the three-year period was due to the Fund’s lack of exposure to the energy and utility sectors, which contained no companies that qualified under the Fund’s investment criteria.
19
the Jensen Portfolio
The Board observed that the Adviser appeared to have adhered to its strict investment discipline. The Board also considered the Fund’s long-term investment strategy and the Adviser’s belief that over time the favorable business performance of the Fund’s portfolio companies would be reflected in similar market returns. As a result of these and other factors, although the Board encouraged the Adviser to take steps to ensure that the Fund’s short-term results were consistent with the Fund’s long-term investment objective and to address the net redemption of Fund shares, the Board concluded that the long term investment performance of the Fund continued to be satisfactory.
Advisory Fee and Expense Ratio
The Board compared the Fund’s advisory fee with those of other comparable mutual funds in the Fund’s Lipper category. The Board noted that the Fund’s advisory fee of 0.50% continued to be below the average and the median for the category. The Board also noted that the Fund is a single fund (as opposed to a larger complex of funds) and that, while the Adviser employs a relatively straightforward investment discipline, the Fund appeared to be an efficiently run operation with a high service component for shareholders.
The Board compared the fees charged to the Fund with the advisory fees charged to the non-Fund advisory clients of the Adviser. The Board observed that, with the exception of a few existing clients, the Adviser charges its separate accounts a minimum of 0.50%.
The Board considered the Fund’s expense ratio and the expense ratios of funds in the Fund’s Lipper category. The Board noted that the Fund’s expense ratio continued to be below the average and the median for the category and that the Fund had a low portfolio turnover rate.
The Board also noted that the advisory fee rate and the expenses for which the Fund would be responsible under the New Agreement would be unchanged from those under the Existing Agreement.
Based on these considerations and other factors, the Board concluded that the Fund’s advisory fee and expense ratio were reasonable relative to the Fund’s peer group.
Profitability of the Adviser
The Board considered the profitability of the Existing Agreement to the Adviser, including the methodology used to calculate the Adviser’s profitability, and compared the Adviser’s profitability with that of selected publicly traded mutual fund advisers. When adjusted for certain marketing revenues and expenses, it appeared that the Adviser’s pre-tax profit was not significantly higher than the average pre-tax profit margin of the group of publicly traded investment advisory firms. It was noted that the Adviser’s profitability may have been overstated due to the relatively low salaries and bonuses paid to its investment professionals, who may receive distributions of profits through their equity ownership in the firm. The Board also considered the facts that the Adviser pays certain administrative expenses of the Fund, including certain sub-transfer agency costs and the cost of the Fund’s Chief Compliance Officer, that the Fund had been subsidized by the Adviser during the early years of the Fund’s existence, and that only in the most recent four to five years, as the Fund’s assets under management have grown, has the Fund contributed significantly to the Adviser’s profits.
The Board also examined the Adviser’s profitability from the Fund on a stand-alone basis against the Adviser’s profitability from its separate account advisory business and found that the Fund provided a higher profit margin to the Adviser. The Board understood that economies of scale are realized from managing one fund compared to managing over 100 separate accounts and that the Adviser had been conservative in its method of allocating expenses to its Fund business relative to other acceptable allocation methodologies. The Board noted that the Adviser’s profitability from the Fund for 2006 was projected to be lower as a result of the declining asset levels of the Fund. The Board acknowledged the inherent limitations of profitability analyses, including the use of comparative data that is incomplete or dissimilar, such as financial information of publicly traded mutual fund advisers which have more diversified business lines and different cost structures than those of the Adviser, and the uncertainty of the various allocations and other assumptions used. Based on this and other information, the Board concluded that profits earned by the Adviser were not excessive.
20
the Jensen Portfolio
Economies of Scale
The Board considered whether there have been economies of scale with respect to the management of the Fund, whether the Fund has benefited from any such economies, and whether the implementation of breakpoints in the Fund’s advisory fee was appropriate. The Board observed that, during a period of rapid Fund growth, the Fund’s expense ratio (for the Class J shares) had fallen from about 1% for the fiscal year ended May 31, 2002 to 0.85% for the nine months ended February 28, 2006. Regarding the issue of breakpoints, the Board observed from the data presented that most funds with breakpoints below the Fund’s 0.50% advisory fee had higher overall advisory fees at the same asset levels. The Board acknowledged the significant decline in Fund assets in the past year, making economies of scale less likely since the last time the Board considered a breakpoint in the Fund’s advisory fee. Based on the data presented, the Board concluded that a breakpoint in the Fund’s advisory fee was not warranted at this time.
Other Benefits
The Board considered the potential fall-out benefits realized by the Adviser from services as investment manager of the Fund. The Board noted that the Adviser has no affiliated entities that provide services to the Fund and that the Adviser prohibits the receipt of third-party “soft dollars.” The Board understood that the Adviser’s non-Fund business was approximately 20% of the Adviser’s total business. The Board concluded that, while the Adviser’s non-Fund business might benefit from the Adviser’s association with the Fund, any such benefit was difficult to quantify and likely not significant.
Other Factors and Considerations
The Board periodically reviews and considers other material information throughout the year relating to the quality of services provided to the Fund, such as the allocation of Fund brokerage, the marketing, administration and compliance program of the Fund, the Adviser’s management of its relationship with the Fund’s administrator, custodian, transfer agent and other service providers, and the expenses paid to those service providers. At its regular meetings, the Board also reviews detailed information relating to the Fund’s portfolio and performance, and interviews the Fund’s portfolio managers.
Based on its evaluation of all material factors and the information provided to it, the Board of Directors, including all of the Independent Directors, voted unanimously on July 19, 2006 (i) to renew the Existing Agreement for a one-year period until July 31, 2007 and (ii) to approve the New Agreement and recommend that shareholders approve the New Agreement.
2. RESULTS OF SPECIAL MEETING OF SHAREHOLDERS
A Special Meeting of Shareholders of The Jensen Portfolio, Inc. (the “Fund”), adjourned on November 13, 2006, was held on December 13, 2006 (the “Special Meeting”) at the offices of Jensen Investment Management, Inc., the investment adviser to the Fund (the “Adviser”). The purpose of the Special Meeting was to approve the New Agreement between the Fund and the Adviser. The shareholders were required to approve the New Agreement because of a change in control of the Adviser caused by the planned retirement of Gary Hibler and the Adviser’s repurchase of Mr. Hibler’s controlling interest in the Adviser. Subsequent to the Special Meeting, as anticipated, Mr. Hibler retired and the Adviser repurchased his controlling interest in the Adviser on February 28,2007.
As of the record date, September 7, 2006, there were 81,890,299 shares issued and outstanding and entitled to vote at the Special Meeting. A total of 43,538,504.24 shares were present in person or by proxy at the Special Meeting.
| The results of the vote at the Special Meeting with respect to the new investment advisory agreement were as follows: | |||||
| NUMBER OF | PERCENT OF | PERCENT OF | |||
| SHARES VOTED | SHARES OUTSTANDING | SHARES PRESENT | |||
| For | 42,343,639.51 | 51.70% | 97.26% | ||
| Against | 457,985.13 | 0.56% | 1.05% | ||
| Withhold/ | |||||
| Abstain | 736,879.60 | 0.90% | 1.69% | ||
Accordingly, the proposal was approved by the Fund’s shareholders. The New Agreement approved by the Fund’s shareholders is effective from February 28, 2007 through the period ending August 1, 2008 (or sooner if terminated in accordance with the 1940 Act or as provided by the terms of the Advisory Agreement).
21
the Jensen Portfolio
3. SHAREHOLDER NOTIFICATION OF FEDERAL TAX STATUS
The Fund designates 100% of dividends declared during the fiscal year ended May 31, 2008 as dividends qualifying for the dividends received deduction available to corporate shareholders.
The Fund designates 100% of dividends declared from net investment income during the fiscal year ended May 31, 2008 as qualified dividend income under the Jobs and Growth Tax Relief Reconciliation Act of 2003.
Additional Information Applicable to Foreign Shareholders Only:
The Fund designates 2.13% of ordinary income distributions as interest-related dividends under Internal Revenue Code Section 871(k)(1)(c).
4. AVAILABILITY OF PROXY VOTING INFORMATION
Information regarding how the Fund votes proxies relating to portfolio securities is available without charge, upon request by calling toll-free, 1-800-221-4384, or by accessing the SEC’s website at www.sec.gov.
5. PORTFOLIO HOLDINGS
The Jensen Portfolio will file its complete schedule of portfolio holdings with the SEC for the first and third quarters of each fiscal year on Form N-Q. The Fund’s Form N-Q will be available on the EDGAR database on the SEC’s website at www.sec.gov. These Forms may also be reviewed and copied at the SEC’s Public Reference Room in Washington D.C. Information about the operation of the Public Reference Room may be obtained by calling 1-800-SEC-0330.
6. ADDITIONAL DISCLOSURE REGARDING FUND DIRECTORS AND OFFICERS
| Independent Directors | ||||||||||
| # OF | ||||||||||
| PORTFOLIOS | ||||||||||
| TERM OF | PRINCIPAL | IN FUND | OTHER | |||||||
| POSITION(S) | OFFICE AND | OCCUPATION | CO MPLEX | DIRECTORSHIPS | ||||||
| HELD WITH | LENGTH O F | DURING PAST | OVERSEEN | HELD BY | ||||||
| NAME, AGE AND ADDRESS | THE COMPANY | TIME SERVED** | FIVE YEARS | BY DIRECTOR | DIRECTOR | |||||
| Roger A. Cooke J.D., 59 | Independent | Indefinite Term; | Vice President – Regulatory | 1 | None | |||||
| The Jensen Portfolio, Inc. | Director | since June 1999. | and Legal Affairs of | |||||||
| 5300 Meadows Road | Precision Castparts Corp., | |||||||||
| Suite 250 | an investment casting and | |||||||||
| Lake Oswego, OR 97035 | forging company, | |||||||||
| (2000 – present); | ||||||||||
| Executive Vice President – | ||||||||||
| Regulatory and Legal | ||||||||||
| Affairs of Fred Meyer, Inc., | ||||||||||
| a grocery and general | ||||||||||
| merchandise company, | ||||||||||
| (1992 – 2000). | ||||||||||
22
the Jensen Portfolio
| # OF | ||||||||||
| PORTFOLIOS | ||||||||||
| TERM OF | PRINCIPAL | IN FUND | OTHER | |||||||
| POSITION(S) | OFFICE AND | OCCUPATION | CO MPLEX | DIRECTORSHIPS | ||||||
| HELD WITH | LENGTH O F | DURING PAST | OVERSEEN | HELD BY | ||||||
| NAME, AGE AND ADDRESS | THE COMPANY | TIME SERVED** | FIVE YEARS | BY DIRECTOR | DIRECTOR | |||||
| Robert E. Harold | Independent | Indefinite Term; | Senior Director of | 1 | Director of | |||||
| C.P.A. (Retired), 60 | Director | since | Financial Planning | StoriedLearning, | ||||||
| The Jensen Portfolio, Inc. | September | of Nike, Inc., a footwear | Inc. (2000 – 2003); | |||||||
| 5300 Meadows Road | 2000. | and apparel company | Director of St. Mary’s | |||||||
| Suite 250 | (2001 – 2002); Global | Academy, a non-profit | ||||||||
| Lake Oswego, OR 97035 | Brand Controller for Nike, | high school | ||||||||
| Inc. (1996, 1997, 2000 – | (2000 – present); | |||||||||
| 2001); Interim Chief | Director of Laika, Inc. | |||||||||
| Financial Officer for Nike, | (formerly Will Vinton | |||||||||
| Inc. (1998 – 1999); Interim | Studios), an animation | |||||||||
| Chief Executive Officer | studio (2002 – present); | |||||||||
| for Laika, Inc. (formerly | Director of The | |||||||||
| Will Vinton Studios), an | Sisters of the Holy | |||||||||
| animation studio (March | Names Foundation | |||||||||
| 2005 – October 2005). | (2004 – present). | |||||||||
| Thomas L. Thomsen, Jr., 64 | Independent | Indefinite Term; | Private rancher and | 1 | None | |||||
| The Jensen Portfolio, Inc. | Director | since | real estate investor | |||||||
| 5300 Meadows Road | December 2003 | (2002 – Present); | ||||||||
| Suite 250 | Chief Executive Officer | |||||||||
| Lake Oswego, OR 97035 | (2000 – 2002) | |||||||||
| and President (1998 – | ||||||||||
| 2000) of Columbia | ||||||||||
| Management Company | ||||||||||
| (now called Columbia | ||||||||||
| Management Advisors, | ||||||||||
| Inc.), investment adviser to | ||||||||||
| the Columbia Funds family | ||||||||||
| of mutual funds and to | ||||||||||
| institutional and individual | ||||||||||
| investors. | ||||||||||
| Kenneth Thrasher, 57 | Independent | Indefinite | Chairman and CEO | 1 | Northwest Natural Gas | |||||
| The Jensen Portfolio, Inc. | Director | Term; | of Complí, a web- | Company (a natural gas | ||||||
| 5300 Meadows Road | since July 2007. | based automotive | distribution and service | |||||||
| Suite 250 | dealership software | provider). | ||||||||
| Lake Oswego, OR 97035 | solution company | |||||||||
| (2002 – present). | ||||||||||
| DIRECTOR EMERITUS | ||||||||||
| Louis B. Perry, Ph.D, 90 | Director | Indefinite Term; | Retired | 1 | None | |||||
| The Jensen Portfolio, Inc. | Emeritus | Served since | ||||||||
| 5300 Meadows Road | inception | |||||||||
| Suite 250 | (at times as | |||||||||
| Lake Oswego, OR 97035 | Director | |||||||||
| Emeritus). |
23
the Jensen Portfolio
| Interested Directors and Officers | ||||||||||
| # OF | ||||||||||
| PORTFOLIOS | ||||||||||
| TERM OF | PRINCIPAL | IN FUND | OTHER | |||||||
| POSITION(S) | OFFICE AND | OCCUPATION | COMPLEX | DIRECTORSHIPS | ||||||
| HELD WITH | LENGTH OF | DURING PAST | OVERSEEN | HELD BY | ||||||
| NAME, AGE AND ADDRESS | THE COMPANY | TIME S ERVED** | FIVE YEARS | BY DIRECTOR | DIRECTOR | |||||
| Val E. Jensen,* 78 | Director and | Indefinite Term; | Chairman and Director | 1 | None | |||||
| The Jensen Portfolio, Inc. | Chairman | Served as | of Jensen Investment | |||||||
| 5300 Meadows Road | Director since | Management, Inc. | ||||||||
| Suite 250 | inception; Served as | (1988 – 2004). | ||||||||
| Lake Oswego, OR 97035 | President from inception | |||||||||
| to March 2002; | ||||||||||
| Served as Chairman since | ||||||||||
| March 2002. | ||||||||||
| Gary W. Hibler,* Ph.D., 64 | Director | Indefinite Term; | President and Director | 1 | None | |||||
| The Jensen Portfolio, Inc. | Served as Director since | of Jensen Investment | ||||||||
| 5300 Meadows Road | inception; Served as | Management, Inc. | ||||||||
| Suite 250 | Secretary from | (1999 – February 2007); | ||||||||
| Lake Oswego, OR 97035 | inception to | Secretary and Director | ||||||||
| March 2002; | of Jensen Investment | |||||||||
| Served as Treasurer | Management, Inc. | |||||||||
| from December 2002 | (1994 – 1999). | |||||||||
| to March 2004; | ||||||||||
| Served as | ||||||||||
| President from | ||||||||||
| March 2002 to | ||||||||||
| February 2007. | ||||||||||
| Robert D. McIver,* 42 | President | 1 Year Term; | President of Jensen | N/A | N/A | |||||
| Jensen Investment | Served as President since | Investment Management, | ||||||||
| Management, Inc. | February 2007. | Inc. (February 2007- | ||||||||
| 5300 Meadows Road | present); Director of | |||||||||
| Suite 250 | Operations of Jensen | |||||||||
| Lake Oswego, OR 97035 | Investment Management, | |||||||||
| Inc. (2004-February | ||||||||||
| 2007); General Manager | ||||||||||
| of Fairmont Villa | ||||||||||
| Management and Vice | ||||||||||
| President of Fairmont | ||||||||||
| Riverside Golf Estates Ltd | ||||||||||
| (2001-2004). | ||||||||||
| Robert F. Zagunis,* 54 | Vice President | 1 Year Term; | Vice President and | N/A | N/A | |||||
| Jensen Investment | Served since | Director of Jensen | ||||||||
| Management, Inc. | inception. | Investment Management, | ||||||||
| 5300 Meadows Road | Inc. (1993 – present). | |||||||||
| Suite 250 | ||||||||||
| Lake Oswego, OR 97035 | ||||||||||
24
the Jensen Portfolio
| # OF | ||||||||||
| PORTFOLIOS | ||||||||||
| TERM OF | PRINCIPAL | IN FUND | OTHER | |||||||
| POSITION(S) | OFFICE AND | OCCUPATION | COMPLEX | DIRECTORSHIPS | ||||||
| HELD WITH | LENGTH OF | DURING PAST | OVERSEEN | HELD BY | ||||||
| NAME, AGE AND ADDRESS | THE COMPANY | TIME SERVED** | FIVE YEARS | BY DIRECTOR | DIRECTOR | |||||
| Robert G. Millen,* 61 | Vice President | 1 Year Term; | Vice President and | N/A | N/A | |||||
| Jensen Investment | and Secretary | Served as Vice | Director of Jensen | |||||||
| Management, Inc. | President from July | Investment Management, | ||||||||
| 5300 Meadows Road | 2001 to March | Inc. (2000 – present); | ||||||||
| Suite 250 | 2002 and since June | Vice President of | ||||||||
| Lake Oswego, OR 97035 | 2005; Served as | Principal Financial | ||||||||
| Secretary since | Group, an insurance | |||||||||
| March 2002. | company (1997 – 2000). | |||||||||
| Brian S. Ferrie,* 49 | Treasurer and | 1 Year Term; Served | Vice President, Director | N/A | N/A | |||||
| Jensen Investment | Chief | since March 2004. | of Finance and Chief | |||||||
| Management, Inc. | Compliance | Compliance O fficer | ||||||||
| 5300 Meadows Road | Officer | for Jensen Investment | ||||||||
| Suite 250 | Management, Inc. | |||||||||
| Lake Oswego, OR 97035 | (2003 – present); Vice | |||||||||
| President and CFO of | ||||||||||
| Berger Financial Group | ||||||||||
| LLC (2001 – 2003); Vice | ||||||||||
| President and Chief | ||||||||||
| Compliance O fficer of | ||||||||||
| Berger Financial Group | ||||||||||
| LLC (1994 – 2001). | ||||||||||
| * This individual is an “interested person” of the Fund within the meaning of the 1940 Act. |
** Each Director serves for an indefinite term in accordance with the Bylaws of the Fund until the date a Director resigns, retires or is removed in accordance with the Bylaws of the Fund. |
25

Item 2. Code of Ethics.
The registrant has adopted a code of ethics that applies to the registrant’s principal executive officer and principal financial officer. The registrant has not made any amendments to its code of ethics during the period covered by this report. The registrant has not granted any waivers from any provisions of the code of ethics during the period covered by this report. A copy of the registrant’s Code of Ethics has previously been filed.
Item 3. Audit Committee Financial Expert.
The registrant’s board of directors has determined that there is at least one audit committee financial expert serving on its audit committee. Robert E. Harold, CPA (Retired), is the “audit committee financial expert” and is considered to be “independent” as each term is defined in Item 3 of Form N-CSR.
Item 4. Principal Accountant Fees and Services.
The registrant has engaged its principal accountant to perform audit services during the past two fiscal years. “Audit services” refer to performing an audit of the registrant's annual financial statements or services that are normally provided by the accountant in connection with statutory and regulatory filings or engagements for those fiscal years. “Audit-related services” refer to the assurance and related services by the principal accountant that are reasonably related to the performance of the audit. “Tax services” refer to professional services rendered by the principal accountant for tax compliance, tax advice, and tax planning. There were no “Other services” provided by the principal accountant during the last two fiscal years. The following table details the aggregate fees billed or expected to be billed for each of the last two fiscal years for audit fees, audit-related fees, tax fees and other fees by the principal accountant.
| FYE 5/31/2008 | FYE 5/31/2007 | |
| Audit Fees | $31,500 | $31,350 |
| Audit-Related Fees | 0 | 0 |
| Tax Fees | 0 | 0 |
| All Other Fees | 0 | 0 |
The audit committee has adopted pre-approval policies and procedures that require the audit committee to pre-approve all audit and non-audit services of the registrant, including services provided to any entity affiliated with the registrant.
The percentage of fees billed by PricewaterhouseCoopers LLP applicable to non-audit services pursuant to waiver of pre-approval requirement were as follows:
| FYE 5/31/2008 | FYE 5/31/2007 | |
| Audit-Related Fees | 0% | 0% |
| Tax Fees | 0% | 0% |
| All Other Fees | 0% | 0% |
All of the principal accountant’s hours spent on auditing the registrant’s financial statements were attributed to work performed by full-time permanent employees of the principal accountant.
The following table indicates the non-audit fees billed or expected to be billed by the registrant’s accountant for services to the registrant and to the registrant’s investment adviser (and any other controlling entity, etc.—not sub-adviser) for the last two years. The audit committee of the board of directors has considered whether the provision of non-audit services that were rendered to the registrant's investment adviser is compatible with maintaining the principal accountant's independence and has concluded that the provision of such non-audit services by the accountant has not compromised the accountant’s independence.
| Non-Audit Related Fees | FYE 5/31/2008 | FYE 5/31/2007 |
| Registrant | 0 | 0 |
| Registrant’s Investment Adviser | $11,323 | $19,375 |
Item 5. Audit Committee of Listed Registrants.
Not applicable to registrants who are not listed issuers (as defined in Rule 10A-3 under the Securities Exchange Act of 1934).
Item 6. Schedule of Investments.
Schedule of Investments is included as part of the report to shareholders filed under Item 1 of this Form.
Item 7. Disclosure of Proxy Voting Policies and Procedures for Closed-End Management Investment Companies.
Not applicable to open-end investment companies.
Item 8. Portfolio Managers of Closed-End Management Investment Companies.
Not applicable to open-end investment companies.
Item 9. Purchases of Equity Securities by Closed-End Management Investment Company and Affiliated Purchasers.
Not applicable to open-end investment companies.
Item 10. Submission of Matters to a Vote of Security Holders.
There have been no material changes to the procedures by which shareholders may recommend nominees to the registrant’s board of directors.
Item 11. Controls and Procedures.
| (a) | The Registrant’s President/Chief Executive Officer and Treasurer/Chief Financial Officer have reviewed the Registrant's disclosure controls and procedures (as defined in Rule 30a-3(c) under the Investment Company Act of 1940 (the “Act”)) as of a date within 90 days of the filing of this report, as required by Rule 30a-3(b) under the Act and Rules 13a-15(b) or 15d-15(b) under the Securities Exchange Act of 1934. Based on their review, such officers have concluded that the disclosure controls and procedures are effective in ensuring that information required to be disclosed in this report is appropriately recorded, processed, summarized and reported and made known to them by others within the Registrant and by the Registrant’s service provider. |
| (b) | There were no changes in the Registrant's internal control over financial reporting (as defined in Rule 30a-3(d) under the Act) that occurred during the Registrant’s last fiscal half-year that has materially affected, or is reasonably likely to materially affect, the Registrant's internal control over financial reporting. |
Item 12. Exhibits.
| (a) | (1) Any code of ethics or amendment thereto, that is subject of the disclosure required by Item 2, to the extent that the registrant intends to satisfy Item 2 requirements through filing an exhibit. Incorporated by reference to the Registrant’s Form N-CSR filed August 9, 2004. |
(2) Certifications pursuant to Section 302 of the Sarbanes-Oxley Act of 2002. Filed herewith.
(3) Any written solicitation to purchase securities under Rule 23c-1 under the Act sent or given during the period covered by the report by or on behalf of the registrant to 10 or more persons. Not applicable to open-end investment companies.
| (b) | Certification pursuant to Section 906 of the Sarbanes-Oxley Act of 2002. Furnished herewith. |
SIGNATURES
Pursuant to the requirements of the Securities Exchange Act of 1934 and the Investment Company Act of 1940, the registrant has duly caused this report to be signed on its behalf by the undersigned, thereunto duly authorized.
(Registrant) The Jensen Portfolio, Inc.
By (Signature and Title)* /s/Robert McIver
Robert McIver, President
Date August 8, 2008
Pursuant to the requirements of the Securities Exchange Act of 1934 and the Investment Company Act of 1940, this report has been signed below by the following persons on behalf of the registrant and in the capacities and on the dates indicated.
By (Signature and Title)* /s/Robert McIver
Robert McIver, President
Date August 8, 2008
By (Signature and Title)* /s/Brian Ferrie
Brian Ferrie, Treasurer
Date August 8, 2008
* Print the name and title of each signing officer under his or her signature.