UNITED STATES
SECURITIES AND EXCHANGE COMMISSION
Washington, D.C. 20549
FORM N-CSR
CERTIFIED SHAREHOLDER REPORT OF REGISTERED
MANAGEMENT INVESTMENT COMPANIES
Investment Company Act file number 811-6653
The Jensen Quality Growth Fund Inc.
(Exact name of registrant as specified in charter)
5500 Meadows Road, Suite 200
Lake Oswego, OR 97035-8234
(Address of principal executive offices) (Zip code)
Robert McIver
5500 Meadows Road, Suite 200
Lake Oswego, OR 97035-8234
(Name and address of agent for service)
(800) 221-4384
Registrant’s telephone number, including area code
Date of fiscal year end: May 31
Date of reporting period: November 30, 2024
Item 1. Reports to Stockholders.
| | |
| Jensen Quality Growth Fund | |
| Class J | JENSX |
| Semi-Annual Shareholder Report | November 30, 2024 |
This semi-annual shareholder report contains important information about the Jensen Quality Growth Fund for the period of June 1, 2024 to November 30, 2024. You can find additional information about the Fund at https://www.jenseninvestment.com/reg-docs/. You can also request this information by contacting us at 1-800-992-4144.
WHAT WERE THE FUND COSTS FOR THE LAST SIX MONTHS? (based on a hypothetical $10,000 investment)
| | |
Class Name | Costs of a $10,000 investment | Costs paid as a percentage of a $10,000 investment |
| Class J | $43 | 0.82% |
HOW DID THE FUND PERFORM OVER THE LAST SIX MONTHS AND WHAT AFFECTED ITS PERFORMANCE?
For the six-month period ended November 30, 2024, relative performance for the Jensen Quality Growth Fund was aided by overweight positions in the Information Technology and Industrials sectors and an underweight in the Energy sector. Stock selection benefited relative Fund performance in the Materials, Industrials and Health Care sectors. Relative performance was hindered by the Fund’s underweight positions in the Financials, Consumer Discretionary and Real Estate sectors and overweight positions in the Consumer Staples and Health Care sectors. Stock selection detracted from relative performance in the Consumer Discretionary, Consumer Staples, Financials, Information Technology and Communication Services sectors.
During the period, the Fund continued its high allocation to high-quality companies, defined as those rated A+, A and A- by the S&P Earnings and Dividend Quality Rankings. The Fund’s allocation to these highest-quality companies averaged 54.14% of Fund assets compared to 32.12% of the S&P 500 Index. This significant overweight to quality detracted from the Fund’s relative returns during the period, which we believe were driven by increased investor risk appetite following the reductions to the federal funds rate.
HOW DID THE FUND PERFORM FOR THE PAST 10 YEARS?*
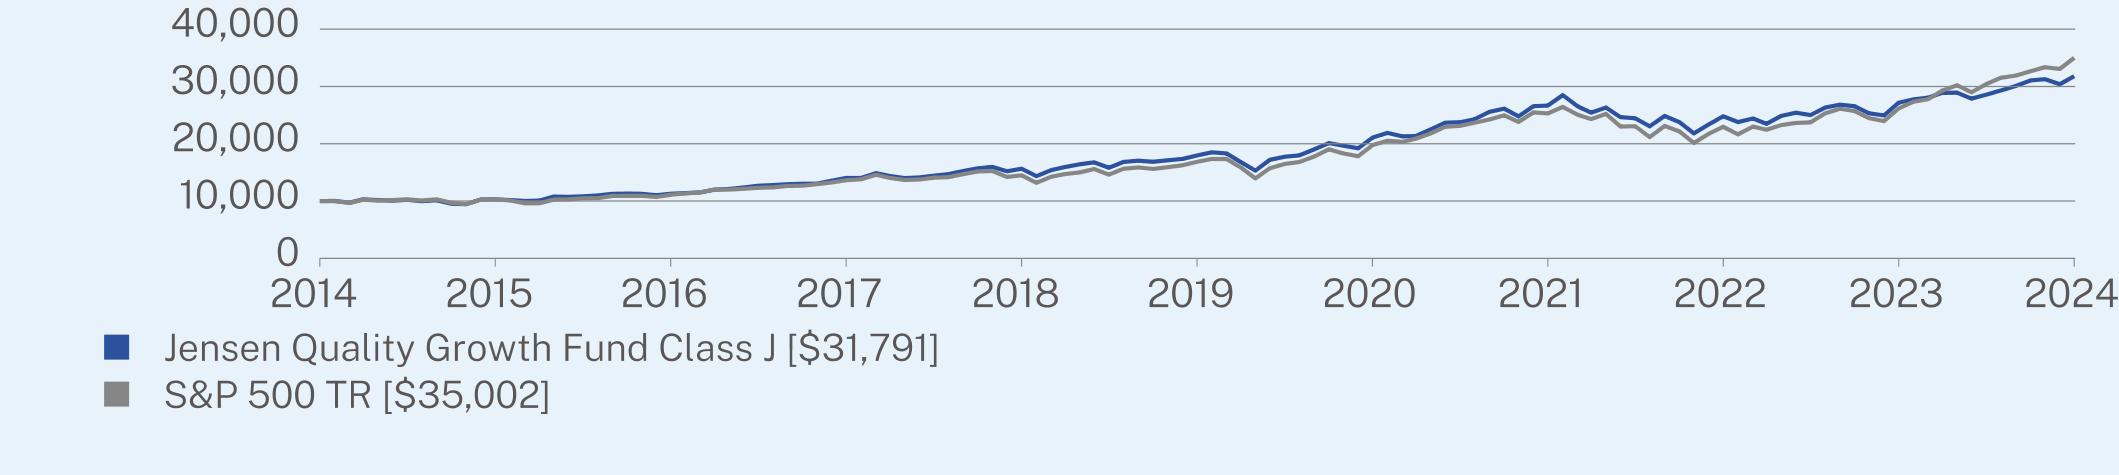
The $10,000 chart reflects a hypothetical $10,000 investment in the class of shares noted and assumes the maximum sales charge. The chart uses total return NAV performance and assumes reinvestment of dividends and capital gains. Fund expenses, including 12b-1 fees, management fees and other expenses were deducted.
CUMULATIVE PERFORMANCE (Initial Investment of $10,000)
ANNUAL AVERAGE TOTAL RETURN (%)
| | | |
| | 1 Year | 5 Year | 10 Year |
Class J | 17.09 | 12.11 | 12.26 |
S&P 500 TR | 33.89 | 15.77 | 13.35 |
| * | The Fund’s past performance is not a good predictor of the Fund’s future performance. The returns do not reflect the deduction of taxes that a shareholder would pay on Fund distributions or redemption of Fund shares. |
| Jensen Quality Growth Fund | PAGE 1 | TSR-SAR-476313101 |
KEY FUND STATISTICS (as of November 30, 2024)
| |
Net Assets | $8,710,153,553 |
Number of Holdings | 27 |
Net Advisory Fee | $22,052,194 |
Portfolio Turnover | 5% |
Visit https://www.jenseninvestment.com/reg-docs/ for more recent performance information.
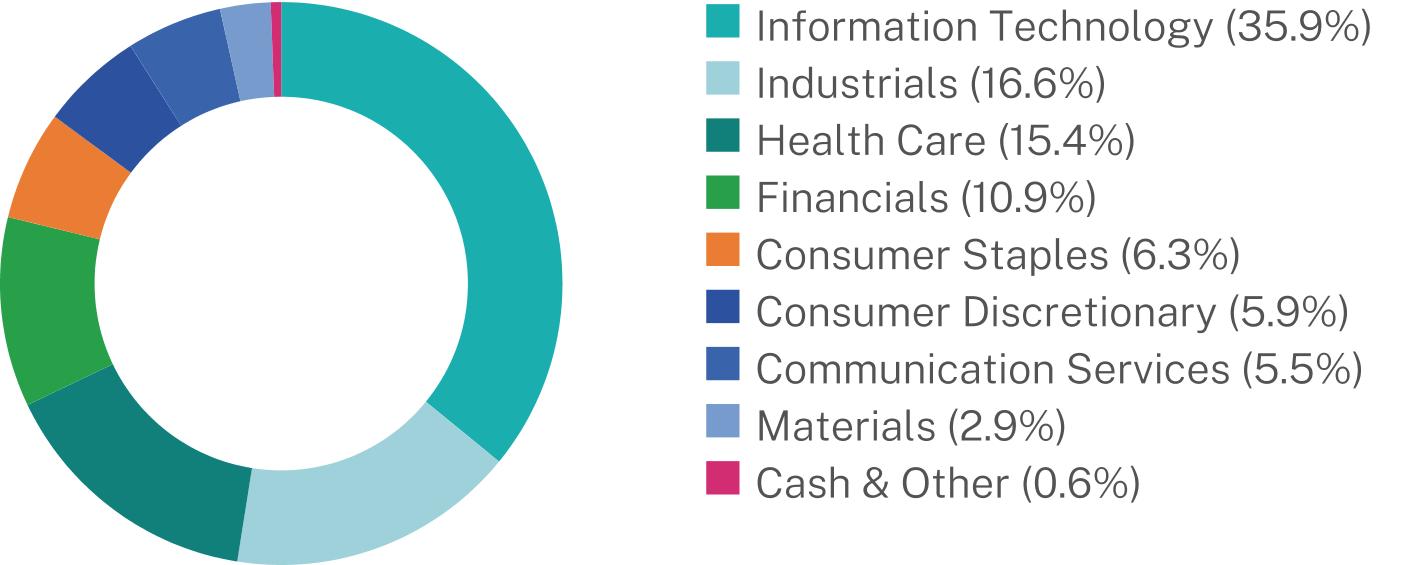
WHAT DID THE FUND INVEST IN? (% of net assets as of November 30, 2024)
| |
Top 10 Issuers | (%) |
Apple, Inc. | 7.6% |
Microsoft Corp. | 7.4% |
Accenture PLC | 7.3% |
Marsh & McLennan Cos., Inc. | 6.4% |
Stryker Corp. | 6.0% |
Intuit, Inc. | 5.6% |
Alphabet, Inc. | 5.5% |
Mastercard, Inc. | 4.5% |
Automatic Data Processing, Inc. | 4.4% |
UnitedHealth Group, Inc. | 3.9% |
| * | The Global Industry Classification Standard (“GICS®”) was developed by and/or is the exclusive property of MSCI, Inc. (“MSCI”) and Standard & Poor’s Financial Services LLC (“S&P”). GICS® is a service mark of MSCI and S&P and has been licensed for use by U.S. Bank Global Fund Services. |
For additional information about the Fund; including its prospectus, financial information, holdings and proxy information, scan the QR code or visit https://www.jenseninvestment.com/reg-docs/.
HOUSEHOLDING
To reduce Fund expenses, only one copy of most shareholder documents may be mailed to shareholders with multiple accounts at the same address (Householding). If you would prefer that your Jensen Investment Management documents not be householded, please contact Jensen Investment Management at 1-800-992-4144, or contact your financial intermediary. Your instructions will typically be effective within 30 days of receipt by Jensen Investment Management or your financial intermediary.
| Jensen Quality Growth Fund | PAGE 2 | TSR-SAR-476313101 |
1000010218108301268414431158131773423756244502500928583100001029710474123031407314605164802312523056237293041835.916.615.410.96.35.95.52.90.6
| | |
| Jensen Quality Growth Fund | |
| Class I | JENIX |
| Semi-Annual Shareholder Report | November 30, 2024 |
This semi-annual shareholder report contains important information about the Jensen Quality Growth Fund for the period of June 1, 2024 to November 30, 2024. You can find additional information about the Fund at https://www.jenseninvestment.com/reg-docs/. You can also request this information by contacting us at 1-800-992-4144.
WHAT WERE THE FUND COSTS FOR THE LAST SIX MONTHS? (based on a hypothetical $10,000 investment)
| | |
Class Name | Costs of a $10,000 investment | Costs paid as a percentage of a $10,000 investment |
| Class I | $31 | 0.59% |
HOW DID THE FUND PERFORM OVER THE LAST SIX MONTHS AND WHAT AFFECTED ITS PERFORMANCE?
For the six-month period ended November 30, 2024, relative performance for the Jensen Quality Growth Fund was aided by overweight positions in the Information Technology and Industrials sectors and an underweight in the Energy sector. Stock selection benefited relative Fund performance in the Materials, Industrials and Health Care sectors. Relative performance was hindered by the Fund’s underweight positions in the Financials, Consumer Discretionary and Real Estate sectors and overweight positions in the Consumer Staples and Health Care sectors. Stock selection detracted from relative performance in the Consumer Discretionary, Consumer Staples, Financials, Information Technology and Communication Services sectors.
During the period, the Fund continued its high allocation to high-quality companies, defined as those rated A+, A and A- by the S&P Earnings and Dividend Quality Rankings. The Fund’s allocation to these highest-quality companies averaged 54.14% of Fund assets compared to 32.12% of the S&P 500 Index. This significant overweight to quality detracted from the Fund’s relative returns during the period, which we believe were driven by increased investor risk appetite following the reductions to the federal funds rate.
HOW DID THE FUND PERFORM FOR THE PAST 10 YEARS?*
The $250,000 chart reflects a hypothetical $250,000 investment in the class of shares noted and assumes the maximum sales charge. The chart uses total return NAV performance and assumes reinvestment of dividends and capital gains. Fund expenses, including 12b-1 fees, management fees and other expenses were deducted.
CUMULATIVE PERFORMANCE (Initial Investment of $250,000)
ANNUAL AVERAGE TOTAL RETURN (%)
| | | |
| | 1 Year | 5 Year | 10 Year |
Class I | 17.36 | 12.35 | 12.52 |
S&P 500 TR | 33.89 | 15.77 | 13.35 |
| * | The Fund’s past performance is not a good predictor of the Fund’s future performance. The returns do not reflect the deduction of taxes that a shareholder would pay on Fund distributions or redemption of Fund shares. |
| Jensen Quality Growth Fund | PAGE 1 | TSR-SAR-476313309 |
KEY FUND STATISTICS (as of November 30, 2024)
| |
Net Assets | $8,710,153,553 |
Number of Holdings | 27 |
Net Advisory Fee | $22,052,194 |
Portfolio Turnover | 5% |
Visit https://www.jenseninvestment.com/reg-docs/ for more recent performance information.
WHAT DID THE FUND INVEST IN? (% of net assets as of November 30, 2024)
| |
Top 10 Issuers | (%) |
Apple, Inc. | 7.6% |
Microsoft Corp. | 7.4% |
Accenture PLC | 7.3% |
Marsh & McLennan Cos., Inc. | 6.4% |
Stryker Corp. | 6.0% |
Intuit, Inc. | 5.6% |
Alphabet, Inc. | 5.5% |
Mastercard, Inc. | 4.5% |
Automatic Data Processing, Inc. | 4.4% |
UnitedHealth Group, Inc. | 3.9% |
| * | The Global Industry Classification Standard (“GICS®”) was developed by and/or is the exclusive property of MSCI, Inc. (“MSCI”) and Standard & Poor’s Financial Services LLC (“S&P”). GICS® is a service mark of MSCI and S&P and has been licensed for use by U.S. Bank Global Fund Services. |
For additional information about the Fund; including its prospectus, financial information, holdings and proxy information, scan the QR code or visit https://www.jenseninvestment.com/reg-docs/.
HOUSEHOLDING
To reduce Fund expenses, only one copy of most shareholder documents may be mailed to shareholders with multiple accounts at the same address (Householding). If you would prefer that your Jensen Investment Management documents not be householded, please contact Jensen Investment Management at 1-800-992-4144, or contact your financial intermediary. Your instructions will typically be effective within 30 days of receipt by Jensen Investment Management or your financial intermediary.
| Jensen Quality Growth Fund | PAGE 2 | TSR-SAR-476313309 |
25000025792428330435351639511545455753470267805463177569318281353825000025687227757234106236246242085449432063233957410065355487505135.916.615.410.96.35.95.52.90.6
| | |
| Jensen Quality Growth Fund | |
| Class R | JENRX |
| Semi-Annual Shareholder Report | November 30, 2024 |
This semi-annual shareholder report contains important information about the Jensen Quality Growth Fund for the period of June 1, 2024 to November 30, 2024. You can find additional information about the Fund at https://www.jenseninvestment.com/reg-docs/. You can also request this information by contacting us at 1-800-992-4144.
WHAT WERE THE FUND COSTS FOR THE LAST SIX MONTHS? (based on a hypothetical $10,000 investment)
| | |
Class Name | Costs of a $10,000 investment | Costs paid as a percentage of a $10,000 investment |
| Class R | $65 | 1.23% |
HOW DID THE FUND PERFORM OVER THE LAST SIX MONTHS AND WHAT AFFECTED ITS PERFORMANCE?
For the six-month period ended November 30, 2024, relative performance for the Jensen Quality Growth Fund was aided by overweight positions in the Information Technology and Industrials sectors and an underweight in the Energy sector. Stock selection benefited relative Fund performance in the Materials, Industrials and Health Care sectors. Relative performance was hindered by the Fund’s underweight positions in the Financials, Consumer Discretionary and Real Estate sectors and overweight positions in the Consumer Staples and Health Care sectors. Stock selection detracted from relative performance in the Consumer Discretionary, Consumer Staples, Financials, Information Technology and Communication Services sectors.
During the period, the Fund continued its high allocation to high-quality companies, defined as those rated A+, A and A- by the S&P Earnings and Dividend Quality Rankings. The Fund’s allocation to these highest-quality companies averaged 54.14% of Fund assets compared to 32.12% of the S&P 500 Index. This significant overweight to quality detracted from the Fund’s relative returns during the period, which we believe were driven by increased investor risk appetite following the reductions to the federal funds rate.
HOW DID THE FUND PERFORM FOR THE PAST 10 YEARS?*
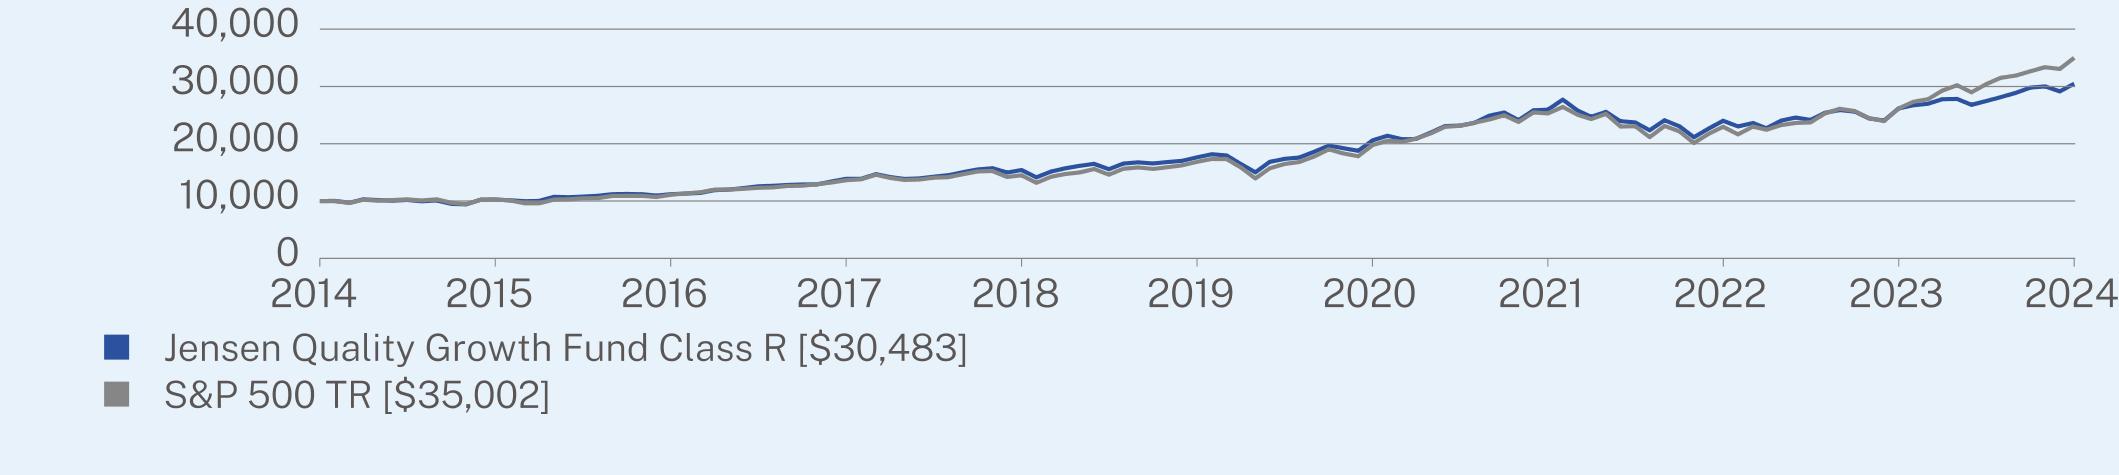
The $10,000 chart reflects a hypothetical $10,000 investment in the class of shares noted and assumes the maximum sales charge. The chart uses total return NAV performance and assumes reinvestment of dividends and capital gains. Fund expenses, including 12b-1 fees, management fees and other expenses were deducted.
CUMULATIVE PERFORMANCE (Initial Investment of $10,000)
ANNUAL AVERAGE TOTAL RETURN (%)
| | | |
| | 1 Year | 5 Year | 10 Year |
Class R | 16.55 | 11.58 | 11.79 |
S&P 500 TR | 33.89 | 15.77 | 13.35 |
| * | The Fund’s past performance is not a good predictor of the Fund’s future performance. The returns do not reflect the deduction of taxes that a shareholder would pay on Fund distributions or redemption of Fund shares. |
| Jensen Quality Growth Fund | PAGE 1 | TSR-SAR-476313200 |
KEY FUND STATISTICS (as of November 30, 2024)
| |
Net Assets | $8,710,153,553 |
Number of Holdings | 27 |
Net Advisory Fee | $22,052,194 |
Portfolio Turnover | 5% |
Visit https://www.jenseninvestment.com/reg-docs/ for more recent performance information.
WHAT DID THE FUND INVEST IN? (% of net assets as of November 30, 2024)
| |
Top 10 Issuers | (%) |
Apple, Inc. | 7.6% |
Microsoft Corp. | 7.4% |
Accenture PLC | 7.3% |
Marsh & McLennan Cos., Inc. | 6.4% |
Stryker Corp. | 6.0% |
Intuit, Inc. | 5.6% |
Alphabet, Inc. | 5.5% |
Mastercard, Inc. | 4.5% |
Automatic Data Processing, Inc. | 4.4% |
UnitedHealth Group, Inc. | 3.9% |
| * | The Global Industry Classification Standard (“GICS®”) was developed by and/or is the exclusive property of MSCI, Inc. (“MSCI”) and Standard & Poor’s Financial Services LLC (“S&P”). GICS® is a service mark of MSCI and S&P and has been licensed for use by U.S. Bank Global Fund Services. |
For additional information about the Fund; including its prospectus, financial information, holdings and proxy information, scan the QR code or visit https://www.jenseninvestment.com/reg-docs/.
HOUSEHOLDING
To reduce Fund expenses, only one copy of most shareholder documents may be mailed to shareholders with multiple accounts at the same address (Householding). If you would prefer that your Jensen Investment Management documents not be householded, please contact Jensen Investment Management at 1-800-992-4144, or contact your financial intermediary. Your instructions will typically be effective within 30 days of receipt by Jensen Investment Management or your financial intermediary.
| Jensen Quality Growth Fund | PAGE 2 | TSR-SAR-476313200 |
1000010254111951388315417176282058925941240132615430483100001027511103136421449816834197732529422964261423500235.916.615.410.96.35.95.52.90.6
| | |
| Jensen Quality Growth Fund | |
| Class Y | JENYX |
| Semi-Annual Shareholder Report | November 30, 2024 |
This semi-annual shareholder report contains important information about the Jensen Quality Growth Fund for the period of June 1, 2024 to November 30, 2024. You can find additional information about the Fund at https://www.jenseninvestment.com/reg-docs/. You can also request this information by contacting us at 1-800-992-4144.
WHAT WERE THE FUND COSTS FOR THE LAST SIX MONTHS? (based on a hypothetical $10,000 investment)
| | |
Class Name | Costs of a $10,000 investment | Costs paid as a percentage of a $10,000 investment |
| Class Y | $28 | 0.53% |
HOW DID THE FUND PERFORM OVER THE LAST SIX MONTHS AND WHAT AFFECTED ITS PERFORMANCE?
For the six-month period ended November 30, 2024, relative performance for the Jensen Quality Growth Fund was aided by overweight positions in the Information Technology and Industrials sectors and an underweight in the Energy sector. Stock selection benefited relative Fund performance in the Materials, Industrials and Health Care sectors. Relative performance was hindered by the Fund’s underweight positions in the Financials, Consumer Discretionary and Real Estate sectors and overweight positions in the Consumer Staples and Health Care sectors. Stock selection detracted from relative performance in the Consumer Discretionary, Consumer Staples, Financials, Information Technology and Communication Services sectors.
During the period, the Fund continued its high allocation to high-quality companies, defined as those rated A+, A and A- by the S&P Earnings and Dividend Quality Rankings. The Fund’s allocation to these highest-quality companies averaged 54.14% of Fund assets compared to 32.12% of the S&P 500 Index. This significant overweight to quality detracted from the Fund’s relative returns during the period, which we believe were driven by increased investor risk appetite following the reductions to the federal funds rate.
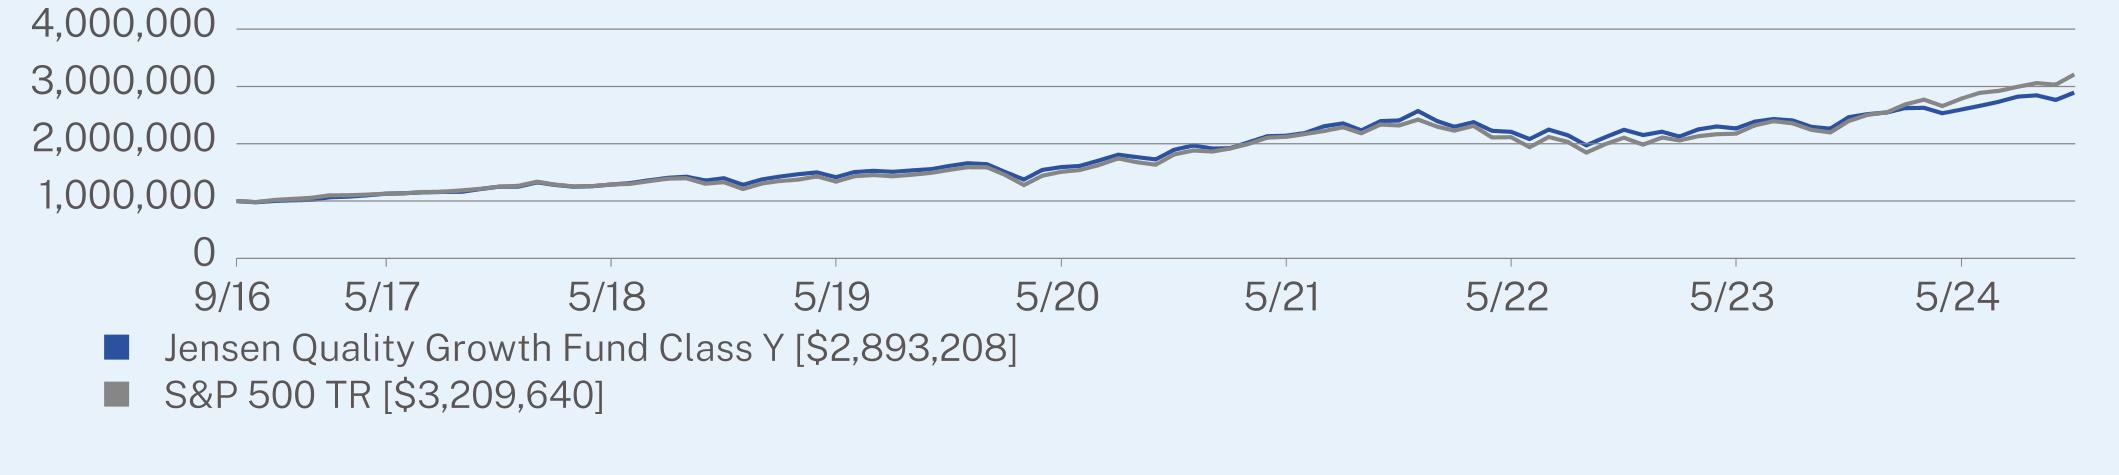
HOW DID THE FUND PERFORM FOR THE PAST 10 YEARS?*
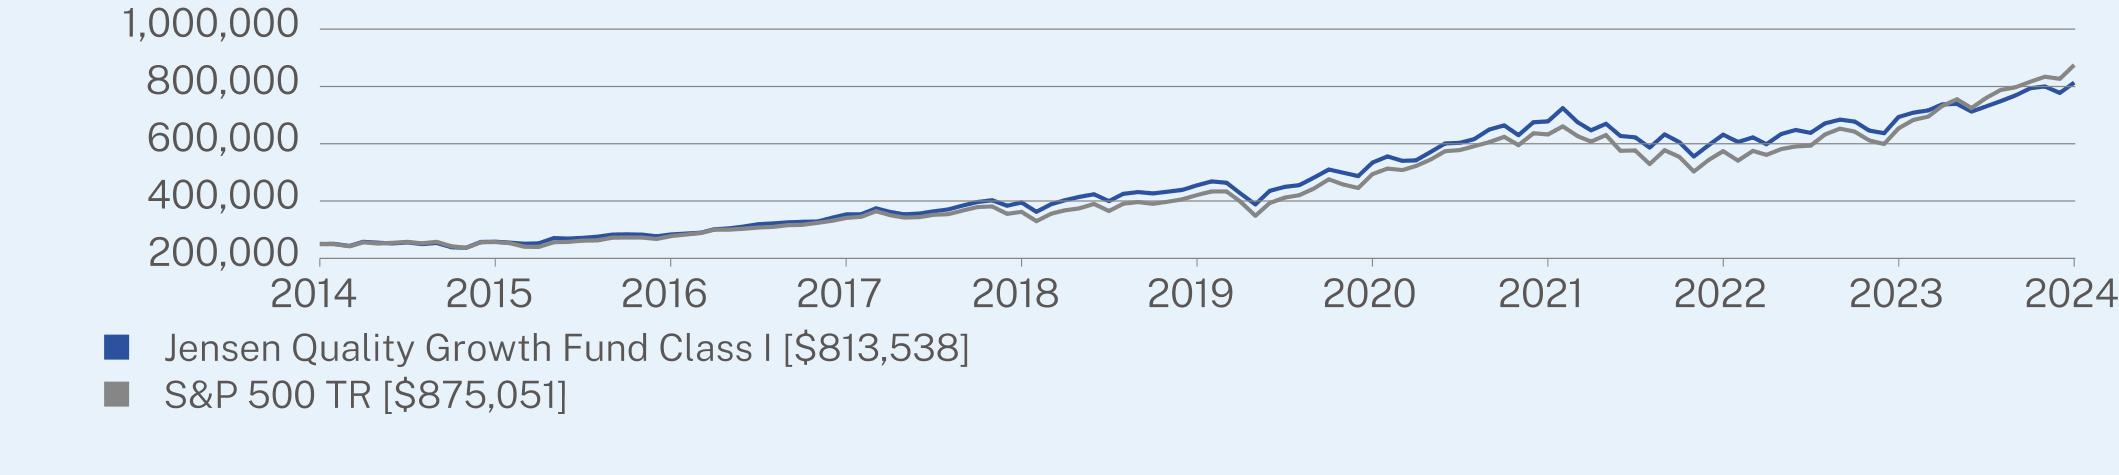
The $1,000,000 chart reflects a hypothetical $1,000,000 investment in the class of shares noted and assumes the maximum sales charge. The chart uses total return NAV performance and assumes reinvestment of dividends and capital gains. Fund expenses, including 12b-1 fees, management fees and other expenses were deducted.
CUMULATIVE PERFORMANCE (Initial Investment of $1,000,000)
ANNUAL AVERAGE TOTAL RETURN (%)
| | | |
| | 1 Year | 5 Year | Since Inception
(09/30/2016) |
Class Y | 17.43 | 12.44 | 13.89 |
S&P 500 TR | 33.89 | 15.77 | 15.35 |
| Jensen Quality Growth Fund | PAGE 1 | TSR-SAR-476313408 |
| * | The Fund’s past performance is not a good predictor of the Fund’s future performance. The returns do not reflect the deduction of taxes that a shareholder would pay on Fund distributions or redemption of Fund shares. |
KEY FUND STATISTICS (as of November 30, 2024)
| |
Net Assets | $8,710,153,553 |
Number of Holdings | 27 |
Net Advisory Fee | $22,052,194 |
Portfolio Turnover | 5% |
Visit https://www.jenseninvestment.com/reg-docs/ for more recent performance information.
WHAT DID THE FUND INVEST IN? (% of net assets as of November 30, 2024)
| |
Top 10 Issuers | (%) |
Apple, Inc. | 7.6% |
Microsoft Corp. | 7.4% |
Accenture PLC | 7.3% |
Marsh & McLennan Cos., Inc. | 6.4% |
Stryker Corp. | 6.0% |
Intuit, Inc. | 5.6% |
Alphabet, Inc. | 5.5% |
Mastercard, Inc. | 4.5% |
Automatic Data Processing, Inc. | 4.4% |
UnitedHealth Group, Inc. | 3.9% |
| * | The Global Industry Classification Standard (“GICS®”) was developed by and/or is the exclusive property of MSCI, Inc. (“MSCI”) and Standard & Poor’s Financial Services LLC (“S&P”). GICS® is a service mark of MSCI and S&P and has been licensed for use by U.S. Bank Global Fund Services. |
For additional information about the Fund; including its prospectus, financial information, holdings and proxy information, scan the QR code or visit https://www.jenseninvestment.com/reg-docs/.
HOUSEHOLDING
To reduce Fund expenses, only one copy of most shareholder documents may be mailed to shareholders with multiple accounts at the same address (Householding). If you would prefer that your Jensen Investment Management documents not be householded, please contact Jensen Investment Management at 1-800-992-4144, or contact your financial intermediary. Your instructions will typically be effective within 30 days of receipt by Jensen Investment Management or your financial intermediary.
| Jensen Quality Growth Fund | PAGE 2 | TSR-SAR-476313408 |
10000001128491128824214158251592921213988522089792266277259780510000001128189129046713392841511215212051321141632175933278925435.916.615.410.96.35.95.52.90.6
Item 2. Code of Ethics.
Not applicable for Semi-Annual Reports
Item 3. Audit Committee Financial Expert.
Not applicable for Semi-Annual Reports
Item 4. Principal Accountant Fees and Services.
Not applicable for Semi-Annual Reports
Item 5. Audit Committee of Listed Registrants.
Not applicable to registrants who are not listed issuers (as defined in Rule 10A-3 under the Securities Exchange Act of 1934).
Item 6. Investments.
| (a) | Schedule of Investments is included as part of the report to shareholders filed under Item 7 of this Form. |
| | |
Item 7. Financial Statements and Financial Highlights for Open-End Investment Companies.
| | | | | | | | |
| | | | | | Jensen Quality
Growth Fund | |
| | | | | | | | |
| | | | | | | | | | | | | | |
| | | Class J Shares | | | Class R Shares | | | Class I Shares | | | Class Y Shares | |
| | | | | | | | | | | | | | |
TABLE OF CONTENTS
Jensen Quality Growth Fund
Schedule of Investments
November 30, 2024 (Unaudited)
| | | | | | | |
COMMON STOCKS — 99.4%
|
Beverages — 3.6%
| | | | | | |
PepsiCo, Inc. | | | 1,913,000 | | | $312,679,850 |
Chemicals — 1.9%
| | | | | | |
Sherwin-Williams Co. | | | 421,000 | | | 167,305,400 |
Commercial Services & Supplies — 4.9%
| | | | | | |
Copart, Inc.(a) | | | 2,636,000 | | | 167,096,040 |
Waste Management, Inc. | | | 1,158,000 | | | 264,278,760 |
| | | | | | 431,374,800 |
Containers & Packaging — 1.0%
| | | | | | |
Ball Corp. | | | 1,369,000 | | | 85,097,040 |
Electronic Equipment, Instruments & Components — 1.6%
| | | | | | |
Amphenol Corp. - Class A | | | 1,875,000 | | | 136,218,750 |
Financial Services — 4.5%
| | | | | | |
Mastercard, Inc. - Class A | | | 734,000 | | | 391,177,960 |
Health Care Equipment & Supplies — 6.0%
| | | | | | |
Stryker Corp. | | | 1,342,000 | | | 526,265,300 |
Health Care Providers & Services — 3.9%
| | | | | | |
UnitedHealth Group, Inc. | | | 554,000 | | | 338,050,800 |
Hotels, Restaurants & Leisure — 1.6%
| | | | | | |
McDonald’s Corp. | | | 484,000 | | | 143,268,840 |
Household Products — 2.7%
| | | | | | |
Procter & Gamble Co. | | | 1,333,000 | | | 238,953,580 |
Insurance — 6.4%
| | | | | | |
Marsh & McLennan Cos., Inc. | | | 2,373,000 | | | 553,454,790 |
Interactive Media & Services — 5.5%
| | | | | | |
Alphabet, Inc. - Class A | | | 2,848,000 | | | 481,169,600 |
IT Services — 7.3%
| | | | | | |
Accenture PLC - Class A | | | 1,745,000 | | | 632,335,650 |
Pharmaceuticals — 5.5%
| | | | | | |
Johnson & Johnson | | | 1,204,000 | | | 186,632,040 |
Zoetis, Inc. | | | 1,673,000 | | | 293,193,250 |
| | | | | | 479,825,290 |
Professional Services — 11.7%
| | | | | | |
Automatic Data Processing, Inc. | | | 1,243,000 | | | 381,513,990 |
Broadridge Financial Solutions, Inc. | | | 1,247,000 | | | 294,316,940 |
Equifax, Inc. | | | 864,000 | | | 225,987,840 |
Verisk Analytics, Inc. | | | 401,000 | | | 117,978,210 |
| | | | | | 1,019,796,980 |
| | | | | | | |
The accompanying notes are an integral part of these financial statements.
TABLE OF CONTENTS
Jensen Quality Growth Fund
Schedule of Investments
November 30, 2024 (Unaudited)(Continued)
| | | | | | | |
COMMON STOCKS — (Continued)
|
Semiconductors & Semiconductor Equipment — 6.4%
| | | | | | |
KLA Corp. | | | 418,000 | | | $270,458,540 |
Texas Instruments, Inc. | | | 1,434,000 | | | 288,277,020 |
| | | | | | 558,735,560 |
Software — 13.0%
| | | | | | |
Intuit, Inc. | | | 760,000 | | | 487,714,800 |
Microsoft Corp. | | | 1,532,000 | | | 648,740,720 |
| | | | | | 1,136,455,520 |
Specialty Retail — 1.9%
| | | | | | |
Home Depot, Inc. | | | 379,000 | | | 162,640,270 |
Technology Hardware, Storage & Peripherals — 7.6%
| | | | | | |
Apple, Inc. | | | 2,783,000 | | | 660,489,390 |
Textiles, Apparel & Luxury Goods — 2.4%
| | | | | | |
NIKE, Inc. - Class B | | | 2,620,000 | | | 206,377,400 |
TOTAL COMMON STOCKS
(Cost $3,823,496,110) | | | | | | 8,661,672,770 |
SHORT-TERM INVESTMENTS — 0.6%
|
Money Market Funds — 0.6%
| | | | | | |
First American Treasury Obligations Fund - Class X, 4.55%(b) | | | 50,112,298 | | | 50,112,298 |
TOTAL SHORT-TERM INVESTMENTS
(Cost $50,112,298) | | | | | | 50,112,298 |
TOTAL INVESTMENTS — 100.0%
(Cost $3,873,608,408) | | | | | | 8,711,785,068 |
Liabilities in Excess of Other Assets — (0.0)%(c) | | | | | | (1,631,515) |
TOTAL NET ASSETS — 100.0% | | | | | | $8,710,153,553 |
| | | | | | | |
Percentages are stated as a percent of net assets.
The Global Industry Classification Standard (“GICS®”) was developed by and/or is the exclusive property of MSCI, Inc. (“MSCI”) and Standard & Poor’s Financial Services LLC (“S&P”). GICS® is a service mark of MSCI and S&P and has been licensed for use by U.S. Bank Global Fund Services.
PLC - Public Limited Company
(a)
| Non-income producing security. |
(b)
| The rate shown represents the 7-day annualized effective yield as of November 30, 2024. |
(c)
| Represents less than 0.05% of net assets. |
The accompanying notes are an integral part of these financial statements.
TABLE OF CONTENTS
Jensen Quality Growth Fund
Statement of Assets & Liabilities
As of November 30, 2024 (Unaudited)
| | | | |
Assets:
| | | |
Investment, at value (Cost $3,873,608,408) | | | $8,711,785,068 |
Dividend and interest income receivable | | | 5,975,155 |
Receivable for capital stock issued | | | 928,744 |
Other assets | | | 329,319 |
Total assets | | | 8,719,018,286 |
Liabilities:
| | | |
Payable to Investment Adviser | | | 3,473,525 |
Payable for capital stock redeemed | | | 3,146,463 |
Accrued distribution fees | | | 893,123 |
Accrued director fees | | | 897 |
Accrued expenses and other liabilities | | | 1,350,725 |
Total liabilities | | | 8,864,733 |
Total Net Assets | | | $ 8,710,153,553 |
Net Assets Consist of:
| | | |
Capital stock | | | 3,658,851,069 |
Total distributable earnings | | | 5,051,302,484 |
Total net assets | | | $ 8,710,153,553 |
Net Assets Consist of:
| | | |
Class J Shares
| | | |
Net Assets | | | $2,422,720,869 |
Shares outstanding | | | 39,965,007 |
Net Asset Value - Offering Price and Redemption Price Per Share (2,000,000,000 shares authorized) | | | $60.62 |
Class R Shares
| | | |
Net Assets | | | $14,679,812 |
Shares outstanding | | | 243,400 |
Net Asset Value - Offering Price and Redemption Price Per Share (1,000,000,000 shares authorized) | | | $60.31 |
Class I Shares
| | | |
Net Assets | | | $4,521,854,357 |
Shares outstanding | | | 74,742,525 |
Net Asset Value - Offering Price and Redemption Price Per Share (1,000,000,000 shares authorized) | | | $60.50 |
Class Y Shares
| | | |
Net Assets | | | $1,750,898,515 |
Shares outstanding | | | 28,953,848 |
Net Asset Value - Offering Price and Redemption Price Per Share (1,000,000,000 shares authorized) | | | $60.47 |
| | | | |
The accompanying notes are an integral part of these financial statements.
TABLE OF CONTENTS
Jensen Quality Growth Fund
Statement of Operations
Six Months Ended November 30, 2024 (Unaudited)
| | | | |
Investment Income:
| | | |
Dividend income | | | $59,139,431 |
Interest income | | | 1,717,233 |
Total investment income | | | 60,856,664 |
Expenses:
| | | |
Investment advisory fees | | | 22,052,194 |
12b-1 - Class J | | | 3,058,597 |
Shareholder servicing fees - Class I | | | 1,609,964 |
Administration fees | | | 690,358 |
Sub-transfer agent expenses - Class J | | | 484,664 |
Custody fees | | | 246,615 |
Directors’ fees and expenses | | | 229,627 |
Reports to shareholders - Class I | | | 130,203 |
Transfer agent expenses | | | 124,798 |
Federal and state registration fees | | | 113,037 |
Other | | | 107,773 |
Fund Accounting fees | | | 95,071 |
Reports to shareholders - Class Y | | | 70,803 |
Professional fees | | | 63,370 |
Chief Compliance Officer Fees | | | 50,050 |
Reports to shareholders - Class J | | | 39,067 |
12b-1 fees - Class R | | | 36,661 |
Transfer agent fees - Class J | | | 18,481 |
Transfer agent fees - Class I | | | 14,094 |
Shareholder servicing fees - Class R | | | 11,914 |
Transfer agent fees - Class Y | | | 9,598 |
Transfer agent fees - Class R | | | 3,208 |
Reports to shareholders - Class R | | | 366 |
Total expenses | | | 29,260,513 |
Net Investment Income | | | 31,596,151 |
Realized and Unrealized Gain (Loss) on Investments:
| | | |
Net realized gain on investment transactions | | | 812,553,635 |
Change in unrealized appreciation/depreciation on investments | | | 141,849,223 |
Net realized and unrealized gain on investments | | | 954,402,858 |
Net Increase in Net Assets Resulting from Operations | | | $985,999,009 |
| | | | |
The accompanying notes are an integral part of these financial statements.
TABLE OF CONTENTS
Jensen Quality Growth Fund
Statements of Changes in Net Assets
| | | | | | | |
Operations:
| | | | | | |
Net investment income | | | $31,596,151 | | | $94,146,393 |
Net realized gain on investment transactions | | | 812,553,635 | | | 804,236,239 |
Change in unrealized appreciation/depreciation on investments | | | 141,849,223 | | | 483,239,484 |
Net increase in net assets resulting from operations | | | 985,999,009 | | | 1,381,622,116 |
Capital Share Transactions:
| | | | | | |
Shares Sold - Class J | | | 36,028,162 | | | 141,966,666 |
Shares Sold - Class R | | | 664,480 | | | 2,185,506 |
Shares Sold - Class I | | | 238,478,774 | | | 735,476,591 |
Shares Sold - Class Y | | | 90,372,512 | | | 349,264,831 |
Shares issued in reinvestment of dividends - Class J | | | 255,538,975 | | | 178,973,032 |
Shares issued in reinvestment of dividends - Class R | | | 1,523,437 | | | 961,777 |
Shares issued in reinvestment of dividends - Class I | | | 471,321,515 | | | 378,940,634 |
Shares issued in reinvestment of dividends - Class Y | | | 175,552,674 | | | 165,966,595 |
Shares redeemed - Class J | | | (253,570,239) | | | (441,451,900) |
Shares redeemed - Class R | | | (1,872,100) | | | (3,154,969) |
Shares redeemed - Class I | | | (1,209,563,578) | | | (1,321,668,479) |
Shares redeemed - Class Y | | | (563,287,664) | | | (1,452,695,646) |
Net Increase | | | (758,813,052) | | | (1,265,235,362) |
Dividends and Distributions to Shareholders:
| | | | | | |
Net dividends and distributions to shareholders - Class J | | | (259,623,616) | | | (181,763,494) |
Net dividends and distributions to shareholders - Class R | | | (1,523,437) | | | (961,777) |
Net dividends and distributions to shareholders - Class I | | | (495,997,132) | | | (397,318,116) |
Net dividends and distributions to shareholders - Class Y | | | (198,227,126) | | | (206,955,087) |
Total dividends and distributions | | | (955,371,311) | | | (786,998,474) |
Increase (Decrease) in Net Assets | | | (728,185,354) | | | (670,611,720) |
Net Assets:
| | | | | | |
Beginning of Year | | | 9,438,338,907 | | | 10,108,950,627 |
End of Year | | | $8,710,153,553 | | | $9,438,338,907 |
| | | | | | | |
The accompanying notes are an integral part of these financial statements.
TABLE OF CONTENTS
Jensen Quality Growth Fund
Financial Highlights
Class J
| | | | | | | |
Per Share Data:
| | | | | | | | | | | | | | | | | | |
Net asset value, beginning of period | | | $60.86 | | | $57.43 | | | $57.86 | | | $60.00 | | | $49.46 | | | $47.79 |
Income from investment operations:
| | | | | | | | | | | | | | | | | | |
Net investment income(1) | | | 0.17 | | | 0.46 | | | 0.50 | | | 0.44 | | | 0.52 | | | 0.58 |
Net realized and unrealized gains on investments | | | 6.63 | | | 7.57 | | | 0.75 | | | 1.83 | | | 15.63 | | | 5.30 |
Total from investment operations | | | 6.80 | | | 8.03 | | | 1.25 | | | 2.27 | | | 16.15 | | | 5.88 |
Less distributions:
| | | | | | | | | | | | | | | | | | |
Dividends from net investment income | | | (0.27) | | | (0.46) | | | (0.49) | | | (0.40) | | | (0.52) | | | (0.54) |
Distributions from capital
gains | | | (6.77) | | | (4.14) | | | (1.19) | | | (4.01) | | | (5.09) | | | (3.67) |
Total distributions | | | $(7.04) | | | $(4.60) | | | $(1.68) | | | $(4.41) | | | $(5.61) | | | $(4.21) |
Net asset value, end of
period | | | $60.62 | | | $60.86 | | | $57.43 | | | $57.86 | | | $60.00 | | | $49.46 |
Total return(2) | | | 11.22% | | | 14.29% | | | 2.29% | | | 2.92% | | | 33.95% | | | 12.15% |
Supplemental data and ratios:
| | | | | | | | | | | | | | | | | | |
Net assets, end of period (000’s) | | | $2,422,721 | | | $2,385,457 | | | $2,363,726 | | | $2,455,146 | | | $2,549,594 | | | $2,422,553 |
Ratio of expenses to average net assets(3) | | | 0.82% | | | 0.81% | | | 0.82% | | | 0.81% | | | 0.82% | | | 0.84% |
Ratio of net investment income to average net assets(3) | | | 0.51% | | | 0.73% | | | 0.88% | | | 0.69% | | | 0.89% | | | 1.11% |
Porfolio turnover rate(2) | | | 5.44% | | | 10.46% | | | 15.67% | | | 10.87% | | | 12.33% | | | 23.38% |
| | | | | | | | | | | | | | | | | | | |
(1)
| Net investment income per share is calculated using the ending accumulated net investment income balances prior to consideration or adjustments for permanent book-to-tax differences. |
The accompanying notes are an integral part of these financial statements.
TABLE OF CONTENTS
Jensen Quality Growth Fund
Financial Highlights
Class R
| | | | | | | |
Per Share Data:
| | | | | | | | | | | | | | | | | | |
Net asset value, beginning of period | | | $60.50 | | | $57.10 | | | $57.49 | | | $59.66 | | | $49.18 | | | $47.53 |
Income from investment operations:
| | | | | | | | | | | | | | | | | | |
Net investment income(1) | | | 0.03 | | | 0.12 | | | 0.26 | | | 0.16 | | | 0.25 | | | 0.34 |
Net realized and unrealized gains on investments | | | 6.60 | | | 7.54 | | | 0.74 | | | 1.81 | | | 15.57 | | | 5.30 |
Total from investment operations | | | 6.63 | | | 7.66 | | | 1.00 | | | 1.97 | | | 15.82 | | | 5.64 |
Less distributions:
| | | | | | | | | | | | | | | | | | |
Dividends from net investment income | | | (0.05) | | | (0.12) | | | (0.20) | | | (0.13) | | | (0.25) | | | (0.32) |
Distributions from capital gains | | | (6.77) | | | (4.14) | | | (1.19) | | | (4.01) | | | (5.09) | | | (3.67) |
Total distributions | | | $(6.82) | | | $(4.26) | | | $(1.39) | | | $(4.14) | | | $(5.34) | | | $(3.99) |
Net asset value, end of period | | | $60.31 | | | $60.50 | | | $57.10 | | | $57.49 | | | $59.66 | | | $49.18 |
Total return(2) | | | 10.98% | | | 13.68% | | | 1.83% | | | 2.44% | | | 33.36% | | | 11.66% |
Supplemental data and ratios:
| | | | | | | | | | | | | | | | | | |
Net assets, end of period (000’s) | | | $14,680 | | | $14,366 | | | $13,531 | | | $17,801 | | | $26,380 | | | $23,995 |
Ratio of expenses to average net
assets(3) | | | 1.23% | | | 1.34% | | | 1.29% | | | 1.26% | | | 1.26% | | | 1.27% |
Ratio of net investment income to average net assets(3) | | | 0.10% | | | 0.20% | | | 0.41% | | | 0.23% | | | 0.44% | | | 0.68% |
Porfolio turnover rate(2) | | | 5.44% | | | 10.46% | | | 15.67% | | | 10.87% | | | 12.33% | | | 23.38% |
| | | | | | | | | | | | | | | | | | | |
(1)
| Net investment income per share is calculated using the ending accumulated net investment income balances prior to consideration or adjustments for permanent book-to-tax differences. |
The accompanying notes are an integral part of these financial statements.
TABLE OF CONTENTS
Jensen Quality Growth Fund
Financial Highlights
Class I
| | | | | | | |
Per Share Data:
| | | | | | | | | | | | | | | | | | |
Net asset value, beginning of period | | | $60.79 | | | $57.38 | | | $57.82 | | | $59.99 | | | $49.46 | | | $47.81 |
Income from investment operations:
| | | | | | | | | | | | | | | | | | |
Net investment income(1) | | | 0.24 | | | 0.57 | | | 0.61 | | | 0.57 | | | 0.61 | | | 0.66 |
Net realized and unrealized gains on investments | | | 6.62 | | | 7.58 | | | 0.76 | | | 1.84 | | | 15.65 | | | 5.34 |
Total from investment operations | | | 6.86 | | | 8.15 | | | 1.37 | | | 2.41 | | | 16.26 | | | 6.00 |
Less distributions:
| | | | | | | | | | | | | | | | | | |
Dividends from net investment income | | | (0.38) | | | (0.60) | | | (0.62) | | | (0.57) | | | (0.64) | | | (0.68) |
Distributions from capital
gains | | | (6.77) | | | (4.14) | | | (1.19) | | | (4.01) | | | (5.09) | | | (3.67) |
Total distributions | | | $(7.15) | | | $(4.74) | | | $(1.81) | | | $(4.58) | | | $(5.73) | | | $(4.35) |
Net asset value, end of
period | | | $60.50 | | | $60.79 | | | $57.38 | | | $57.82 | | | $59.99 | | | $49.46 |
Total return(2) | | | 11.34% | | | 14.53% | | | 2.51% | | | 3.14% | | | 34.24% | | | 12.41% |
Supplemental data and ratios:
| | | | | | | | | | | | | | | | | | |
Net assets, end of period (000’s) | | | $4,521,854 | | | $4,998,912 | | | $4,909,180 | | | $4,762,505 | | | $5,003,474 | | | $4,002,485 |
Ratio of expenses to average net assets(3) | | | 0.59% | | | 0.60% | | | 0.61% | | | 0.61% | | | 0.61% | | | 0.60% |
Ratio of net investment income to average net assets(3) | | | 0.74% | | | 0.95% | | | 1.09% | | | 0.89% | | | 1.10% | | | 1.37% |
Porfolio turnover rate(2) | | | 5.44% | | | 10.46% | | | 15.67% | | | 10.87% | | | 12.33% | | | 23.38% |
| | | | | | | | | | | | | | | | | | | |
(1)
| Net investment income per share is calculated using the ending accumulated net investment income balances prior to consideration or adjustments for permanent book-to-tax differences. |
The accompanying notes are an integral part of these financial statements.
TABLE OF CONTENTS
Jensen Quality Growth Fund
Financial Highlights
Class Y
| | | | | | | |
Per Share Data:
| | | | | | | | | | | | | | | | | | |
Net asset value, beginning of period | | | $60.78 | | | $57.37 | | | $57.82 | | | $59.98 | | | $49.46 | | | $47.80 |
Income from investment operations:
| | | | | | | | | | | | | | | | | | |
Net investment income(1) | | | 0.27 | | | 0.62 | | | 0.66 | | | 0.62 | | | 0.66 | | | 0.73 |
Net realized and unrealized gains on investments | | | 6.61 | | | 7.58 | | | 0.75 | | | 1.84 | | | 15.64 | | | 5.31 |
Total from investment operations | | | 6.88 | | | 8.20 | | | 1.41 | | | 2.46 | | | 16.30 | | | 6.04 |
Less distributions:
| | | | | | | | | | | | | | | | | | |
Dividends from net investment income | | | (0.42) | | | (0.65) | | | (0.67) | | | (0.61) | | | (0.69) | | | (0.71) |
Distributions from capital
gains | | | (6.77) | | | (4.14) | | | (1.19) | | | (4.01) | | | (5.09) | | | (3.67) |
Total distributions | | | $(7.19) | | | $(4.79) | | | $(1.86) | | | $(4.62) | | | $(5.78) | | | $(4.38) |
Net asset value, end of
period | | | $60.47 | | | $60.78 | | | $57.37 | | | $57.82 | | | $59.98 | | | $49.46 |
Total return(2) | | | 11.37% | | | 14.63% | | | 2.59% | | | 3.23% | | | 34.34% | | | 12.51% |
Supplemental data and ratios:
| | | | | | | | | | | | | | | | | | |
Net assets, end of period (000’s) | | | $1,750,899 | | | $2,039,604 | | | $2,822,513 | | | $2,756,312 | | | $2,755,356 | | | $2,306,038 |
Ratio of expenses to average net assets(3) | | | 0.53% | | | 0.52% | | | 0.52% | | | 0.52% | | | 0.52% | | | 0.54% |
Ratio of net investment income to average net assets(3) | | | 0.81% | | | 1.03% | | | 1.17% | | | 0.98% | | | 1.18% | | | 1.46% |
Porfolio turnover rate(2) | | | 5.44% | | | 10.46% | | | 15.67% | | | 10.87% | | | 12.33% | | | 23.38% |
| | | | | | | | | | | | | | | | | | | |
(1)
| Net investment income per share is calculated using the ending accumulated net investment income balances prior to consideration or adjustments for permanent book-to-tax differences. |
The accompanying notes are an integral part of these financial statements.
TABLE OF CONTENTS
JENSEN QUALITY GROWTH FUND
Notes to the Financial Statements
November 30, 2024
1. ORGANIZATION AND SIGNIFICANT ACCOUNTING POLICIES
The Jensen Quality Growth Fund Inc. (the “Fund”), was incorporated as an Oregon corporation on April 17, 1992, and is registered as an open-end, non-diversified management investment company under the Investment Company Act of 1940 (the “1940 Act”). The Fund commenced operations on August 3, 1992. Effective March 1, 2018, the name of the Fund was changed from The Jensen Portfolio, Inc. doing business as Jensen Quality Growth Fund to The Jensen Quality Growth Fund Inc. The Fund is authorized to issue 5,000,000,000 shares of common stock, all of which have been authorized for the existing share classes. The Fund currently offers four different classes of shares; Class J, Class R, Class I, and Class Y. Class J shares are subject to a 0.25% 12b-1 fee and a sub-transfer agency fee, Class R shares are subject to a 0.50% 12b-1 fee and up to a 0.25% shareholder servicing fee, Class I shares are subject to a shareholder servicing fee of up to 0.10%, and Class Y shares are not subject to any 12b-1, shareholder servicing or sub transfer agency fee as described in the separate prospectuses for each of the Fund’s share classes. Each class of shares has identical rights and privileges except with respect to the 12b-1 fees, sub-transfer agency fees, shareholder servicing fees, and voting rights on matters affecting a single class of shares. The principal investment objective of the Fund is long-term capital appreciation.
The Fund is an investment company and accordingly follows the investment company accounting and reporting guidance of the Financial Accounting Standards Board (“FASB”) Accounting Standards Codification Topic 946 “Financial Services Investment Companies”.
The following is a summary of significant accounting policies consistently followed by the Fund.
The policies are in conformity with accounting principles generally accepted in the United States of America (“GAAP”).
a)
Investment Valuation – Securities that are listed on United States stock exchanges are valued at the last sale price at the close of the exchange. Equity securities listed on the NASDAQ Stock Market are valued at the NASDAQ Official Closing Price or, if there has been no sale on that day, at their current bid price. Investments in open-end and closed-end registered investment companies, including money market funds, that do not trade on an exchange are valued at the end of day net asset value per share. Quotations are taken from the market in which the security is primarily traded. Over-the-counter securities are valued at the current bid price in the absence of a closing price. Securities for which market quotations are not readily available are valued at fair value as determined by Jensen Investment Management, Inc. (the “Investment Adviser”) at or under the direction of the Fund’s Board of Directors.
There is no definitive set of circumstances under which the Fund may elect to use fair value procedures to value a security. Although the Fund only invests in publicly traded securities, the large majority of which are large capitalization, highly liquid securities, they nonetheless may become securities for which market quotations are not readily available, such as in instances where the market quotation for a security has become stale, sales of a security have been infrequent, trading in the security has been suspended, or where there is a thin market in the security. Securities for which market quotations are not readily available will be valued at their fair value as determined under the Fund’s fair valuation procedures established by the Board of Directors. The Fund is prohibited from investing in restricted securities (securities issued in private placement transactions that may not be offered or sold to the public without registration under the securities laws); therefore, fair value pricing considerations for restricted securities are generally not applicable to the Fund.
Fair Value Measurement – The Fund has adopted authoritative fair valuation accounting standards which establish an authoritative definition of fair value and set out a hierarchy for measuring fair value. These standards require additional disclosures about the various inputs
TABLE OF CONTENTS
JENSEN QUALITY GROWTH FUND
Notes to the Financial Statements
November 30, 2024(Continued)
and valuation techniques used to develop the measurements of fair value and a discussion of changes in valuation techniques and related inputs during the year. The three levels of the fair value hierarchy are as follows:
Level 1 – Inputs that reflect unadjusted quoted prices in active markets for identical assets or liabilities that the Fund has the ability to access at the measurement date.
Level 2 – Inputs other than quoted prices that are observable for the asset or liability either directly or indirectly, including inputs in markets that are not considered to be active and prices for similar securities, interest rates, credit risk, etc.
Level 3 – Inputs that are unobservable (including the Fund’s own assumptions in determining the fair value of investments).
Inputs refer broadly to the assumptions that market participants use to make valuation decisions, including assumptions about risk. Inputs may include price information, volatility statistics, specific and broad credit data, liquidity statistics, and other factors. A financial instrument’s level within the fair value hierarchy is based on the lowest level of input that is significant to the fair value measurement. However, the determination of what constitutes “observable” requires significant judgment by the Fund. The Fund considers observable data to be that market data which is readily available, regularly distributed or updated, reliable and verifiable, not proprietary, and provided by independent sources that are actively involved in the relevant market. The categorization of a financial instrument within the hierarchy is based upon the pricing transparency of the instrument and does not necessarily correspond to the Fund’s perceived risk of that instrument.
Investments whose values are based on quoted market prices in active markets, include common stocks and certain money market securities, and are classified within Level 1. Investments that trade in markets that are not considered to be active, but are valued based on quoted market prices, dealer quotations or alternative pricing sources supported by observable inputs are classified within Level 2. Investments classified within Level 3 have significant unobservable inputs, as they trade infrequently or not at all.
The following is a summary of the inputs used, as of November 30, 2024, to value the Fund’s investments carried at fair value. The inputs and methodology used for valuing securities may not be an indication of the risk associated with investing in those securities.
| | | | | | | | | | | | | |
Total Common Stocks* | | | $8,661,672,770 | | | $8,661,672,770 | | | $ — | | | $ — |
Total Money Market Fund | | | 50,112,298 | | | 50,112,298 | | | — | | | — |
Total Investments | | | $8,711,785,068 | | | $8,711,785,068 | | | $— | | | $— |
| | | | | | | | | | | | | |
*
| For further information regarding security characteristics and industry classifications, please see the Schedule of Investments. |
The Fund did not hold any investments during the period ended November 30, 2024 with significant unobservable inputs which would be classified as Level 3. The Fund did not hold any derivative instruments during the reporting year.
b)
Federal Income Taxes – No provision has been made for Federal income taxes since the Fund has elected to be taxed as a “regulated investment company” and intends to distribute substantially all net investment company taxable income and net capital gains to its shareholders and otherwise comply with the provision of the Internal Revenue Code applicable to regulated investment companies.
TABLE OF CONTENTS
JENSEN QUALITY GROWTH FUND
Notes to the Financial Statements
November 30, 2024(Continued)
The Fund has reviewed all open tax years and major jurisdictions and concluded that there is no tax liability resulting from unrecognized tax benefits relating to uncertain income tax positions taken or expected to be taken as of and for the year ended May 31, 2024. The Fund recognizes interest and penalties, if any, related to uncertain tax benefits in the Statement of Operations. During the year, the Fund did not incur any interest or penalties. Open tax years are those that are open for exam by taxing authorities. The Fund has no examination in progress. The Fund is also not aware of any tax positions for which it is reasonably possible that the total amounts of unrecognized tax benefits will significantly change in the next twelve months.
c)
Distributions to Shareholders – Dividends to shareholders are recorded on the ex-dividend date. Dividends from net investment income are declared and paid quarterly by the Fund. Distributions of net realized capital gains, if any, will be declared and paid at least annually. Income and capital gain distributions are determined in accordance with income tax regulations which may differ from GAAP. The Fund may utilize earnings and profits distributed to shareholders on redemption of shares as part of the dividend paid deduction.
d)
Use of Estimates – The preparation of financial statements in conformity with GAAP requires management to make estimates and assumptions that affect the reported amounts of assets and liabilities and disclosure of contingent assets and liabilities at the date of the financial statements and the reported amounts of revenues and expenses during the reporting period. Actual results could differ from those estimates.
e)
Guarantees and Indemnifications – Under the Fund’s organizational documents, each director, officer, employee or other agent of the Fund is indemnified, to the extent permitted by the 1940 Act, against certain liabilities that may arise out of performance of their duties to the Fund. Additionally, in the normal course of business, the Fund enters into contracts that contain a variety of indemnification clauses. The Fund’s maximum exposure under these arrangements is unknown as this would involve future claims that may be made against the Fund that have not yet occurred. However, the Fund has not had prior claims or losses pursuant to these contracts and believes the risk of loss to be remote.
f)
Allocation of Income, Expenses and Gains/Losses – Income, expenses (other than those deemed attributable to a specific share class), and gains and losses of the Fund are allocated daily to each class of shares based upon the ratio of net assets represented by each class as a percentage of the net assets of the Fund. Expenses deemed directly attributable to a class of shares are recorded by the specific class. Most Fund expenses are allocated by class based on relative net assets. Transfer agent fees and reports to shareholders are allocated based on the number of shareholder accounts in each class. Sub-transfer agency fees are expensed and approved by the Fund’s Board of Directors to the Class J shares based on the yearly average of five published per-account rates from five known brokerages. 12b-1 fees are expensed at 0.25% of average daily net assets of Class J shares and 0.50% of average daily net assets of Class R shares. Shareholder servicing fees are expensed at up to 0.10% and up to 0.25% of the average daily net assets of Class I shares and Class R shares, respectively.
g)
Other – Investment and shareholder transactions are recorded on trade date. Gains or losses from investment transactions are determined on the basis of identified carrying value using the specific identification method. Dividend income is recognized on the ex-dividend date and interest income is recognized on an accrual basis.
TABLE OF CONTENTS
JENSEN QUALITY GROWTH FUND
Notes to the Financial Statements
November 30, 2024(Continued)
2. CAPITAL SHARE TRANSACTIONS
Transactions in shares of the Fund were as follows:
| | | | | | | |
Class R
| | | | | | |
Shares sold | | | 10,450 | | | 36,625 |
Shares issued in reinvestment of dividends | | | 25,322 | | | 16,432 |
Shares redeemed | | | (29,816) | | | (52,599) |
Net increase | | | 5,956 | | | 458 |
Shares outstanding:
| | | | | | |
Beginning of period | | | 237,444 | | | 236,986 |
End of period | | | 243,400 | | | 237,444 |
Class J
| | | | | | |
Shares sold | | | 565,787 | | | 2,365,586 |
Shares issued in reinvestment of dividends | | | 4,222,001 | | | 3,039,710 |
Shares redeemed | | | (4,015,925) | | | (7,367,350) |
Net increase (decrease) | | | 771,863 | | | (1,962,054) |
Shares outstanding:
| | | | | | |
Beginning of period | | | 39,193,144 | | | 41,155,198 |
End of period | | | 39,965,007 | | | 39,193,144 |
Class I
| | | | | | |
Shares sold | | | 3,777,361 | | | 12,274,794 |
Shares issued in reinvestment of dividends | | | 7,799,615 | | | 6,444,223 |
Shares redeemed | | | (19,065,420) | | | (22,044,809) |
Net decrease | | | (7,488,444) | | | (3,325,792) |
Shares outstanding:
| | | | | | |
Beginning of period | | | 82,230,969 | | | 85,556,761 |
End of period | | | 74,742,525 | | | 82,230,969 |
Class Y
| | | | | | |
Shares sold | | | 1,399,161 | | | 5,820,915 |
Shares issued in reinvestment of dividends | | | 2,906,387 | | | 2,822,846 |
Shares redeemed | | | (8,909,094) | | | (24,282,543) |
Net decrease | | | (4,603,546) | | | (15,638,782) |
Shares outstanding:
| | | | | | |
Beginning of period | | | 33,557,394 | | | 49,196,176 |
End of period | | | 28,953,848 | | | 33,557,394 |
| | | | | | | |
3. INVESTMENT TRANSACTIONS
The aggregate purchases and aggregate sales of securities, excluding short-term investments, by the Fund for the year ended November 30, 2024, were $491,767,858 and $2,195,543,239, respectively.
TABLE OF CONTENTS
JENSEN QUALITY GROWTH FUND
Notes to the Financial Statements
November 30, 2024(Continued)
4. INCOME TAXES
The distributions of $98,668,454 and $106,314,260 paid during the years ended May 31, 2024 and 2023, respectively, were classified as ordinary income for tax purposes. The distributions of $688,330,020 and $210,017,295 paid during the years ended May 31, 2024 and 2023, respectively, were classified as long-term capital gain for income tax purposes.
Additionally, U.S. generally accepted accounting principles require that certain components of net assets relating to permanent differences be reclassified between financial and tax reporting. These reclassifications have no effect on net assets or net asset value per share. For the year ended May 31, 2024, distributable earnings decreased by $96,115,083 and capital stock increased by $96,115,083. The permanent difference relates to tax equalization.
At May 31, 2024, the cost of investments, net unrealized appreciation (depreciation) and undistributed ordinary income and undistributed long term capital gains for income tax purposes were as follows:
| | | | |
Cost of investments | | | $4,751,974,079 |
Gross unrealized appreciation | | | $4,783,949,637 |
Gross unrealized depreciation | | | (95,904,737) |
Net unrealized appreciation | | | 4,688,044,900 |
Undistributed ordinary income | | | 11,429,364 |
Undistributed long-term capital gain | | | 321,200,523 |
Distributable earnings | | | 332,629,887 |
Other accumulated gains | | | (3) |
Total distributable earnings | | | $5,020,674,784 |
| | | | |
The cost of investments differ for financial statement and tax purposes primarily due to the deferral of losses on wash sales.
5. LINE OF CREDIT
The Fund has the lesser of (i) $400 million, (ii) 20% of the gross market value of the Fund, or
(iii) 33.33% of the net market value of the unencumbered assets of the Fund available under a revolving credit facility, subject to certain restrictions, for temporary emergency purposes, including the meeting of redemption requests that otherwise might require the untimely disposition of securities. The secured line of credit has a one-year term and is reviewed annually by the Board of Directors. The credit facility is with the Fund’s custodian, U.S. Bank. The current credit facility runs through December 8, 2025. The interest rate on the outstanding principal amount is equal to the prime rate less 1%. As of November 30, 2024 the interest rate on the Fund’s line of credit was 6.75%. During the period ended November 30, 2024, the Jensen Quality Growth Fund borrowed a total of three times in the year and had an average borrowings of $1,222,016 on those days. The Fund’s max borrowing was on July 25, 2024.
6. INVESTMENT ADVISORY AGREEMENT
The Fund is a party to an Investment Advisory and Service Contract with the Investment Adviser. Pursuant to the terms of the Investment Advisory and Service Contract approved by Fund shareholders, the Investment Adviser is entitled to receive a fee, calculated daily and payable monthly, at the annual rate of 0.50% as applied to the Fund’s average daily net assets of $4 billion or less, 0.475% as applied to the Fund’s average daily net assets of more than $4 billion and up to $8 billion, 0.45% as applied to the Fund’s average daily net assets of more than $8 billion and up to $12 billion, and 0.425% as applied to the Fund’s average daily net assets of more than $12 billion.
TABLE OF CONTENTS
JENSEN QUALITY GROWTH FUND
Notes to the Financial Statements
November 30, 2024(Continued)
Certain officers and a director of the Fund are also officers and directors of the Investment Adviser.
7. DISTRIBUTION AND SHAREHOLDER SERVICING
The Fund has adopted a distribution and shareholder servicing plan pursuant to Rule 12b-1 under the 1940 Act (the “12b-1 Plan”), which provides that the Fund make payments to the Fund’s distributor at an annual rate of 0.25% of average daily net assets attributable to Class J shares and 0.50% of the average daily net assets attributable to Class R shares. The Fund’s distributor may then make payments to financial intermediaries or others at an annual rate of up to 0.25% of the average daily net assets attributable to Class J shares and up to 0.50% of the average daily net assets attributable to Class R shares. Payments under the 12b-1 Plan shall be used to compensate the Fund’s distributor or others for services provided and expenses incurred in connection with the sale and/or servicing of shares. 12b-1 fees incurred for the period ended November 30, 2024, are disclosed on the Statement of Operations and the amount payable at year end is disclosed on the Statement of Assets and Liabilities.
In addition, the Fund has adopted a Shareholder Servicing Plan for Class I shares under which the Fund can pay for shareholder support services from the Fund’s assets pursuant to a Shareholder Servicing Agreement in an amount not to exceed 0.10% of the Fund’s average daily net assets attributable to Class I shares. The amount actually incurred for the year ended November 30, 2024,was 0.07% on an annualized basis.
The Fund has also adopted a Shareholder Servicing Plan for the Class R shares. Under the Shareholder Servicing Plan, the Fund can pay for shareholder support services, which include the recordkeeping and administrative services provided by retirement plan administrators to retirement plans (and their participants) that are shareholders of the class. Payments will be made pursuant to a Shareholder Servicing Agreement in an amount not to exceed 0.25% of the Fund’s average daily net assets attributable to Class R shares. The amount actually incurred for the year ended November 30, 2024 was 0.16% on an annualized basis.
8. BENEFICIAL OWNERSHIP
The beneficial ownership, either directly or indirectly, of more than 25% of the voting securities of a fund creates presumption of control of the fund, under Section 2(a)(9) of the 1940 Act. At November 30, 2024, Charles Schwab & Co., Inc., for the benefit of its customers, held 48.10% of the outstanding shares of the Class J share class and 27.09% of the outstanding shares of the Jensen Fund. At November 30, 2024, Wells Fargo Clearing Services LLC, for the benefit of its customers, held 37.29% of the outstanding shares of the Class I share class. At November 30, 2024, State Street Bank & Trust Co., for the benefit of its customers, hold 27.23% of the outstanding shares of the Class R share class, respectively. At November 30, 2024, Edward D Jones and Co., for the benefit of its customers, held 39.48% of the outstanding shares of the Class Y share class.
In preparing these financial statements, the Fund has evaluated events and transactions for potential recognition or disclosure resulting from subsequent events after the Statement of Assets and Liabilities as of November 30, 2024 through the date the financial statements were issued.
TABLE OF CONTENTS
| | |
| | Jensen Quality Growth Fund |
| | |
| | | | | | | | | | | |
Class J Shares | | | Class R Shares | | | Class I Shares | | | Class Y Shares | |
| | | | | | | | | | | |
| | |
| | Investment Adviser
Jensen Investment Management, Inc.
5500 Meadows Road, Suite 200
Lake Oswego, OR 97035
800.992.4144
Fund Administrator, Transfer Agent and Fund Accountant
U.S. Bancorp Fund Services, LLC doing business as
U.S. Bank Global Fund Services
615 East Michigan Street
Milwaukee, WI 53202
Custodian
U.S. Bank, N.A.
Custody Operations
1555 N. RiverCenter Drive, Suite 302
Milwaukee, WI 53212
Legal Counsel
Stoel Rives LLP
760 SW Ninth Avenue, Suite 3000
Portland, OR 97205
Independent Registered Public Accounting Firm
Cohen & Company, Ltd.
342 North Water Street, Suite 830
Milwaukee, WI 53202
Distributor
Quasar Distributors, LLC
Three Canal Plaza, Suite 100
Portland, ME 04101
This report has been prepared for shareholders and may be distributed to others only if preceded or accompanied by a current prospectus. |
| | |
| (b) | Financial Highlights are included within the financial statements filed under Item 7 of this Form. |
Item 8. Changes in and Disagreements with Accountants for Open-End Investment Companies.
There were no changes in or disagreements with accountants during the period covered by this report.
Item 9. Proxy Disclosure for Open-End Investment Companies.
There were no matters submitted to a vote of shareholders during the period covered by this report.
Item 10. Remuneration Paid to Directors, Officers, and Others of Open-End Investment Companies.
See Item 7(a).
Item 11. Statement Regarding Basis for Approval of Investment Advisory Contract.
See Item 7(a).
Item 12. Disclosure of Proxy Voting Policies and Procedures for Closed-End Management Investment Companies.
Not applicable to open-end investment companies.
Item 13. Portfolio Managers of Closed-End Management Investment Companies.
Not applicable to open-end investment companies.
Item 14. Purchases of Equity Securities by Closed-End Management Investment Company and Affiliated Purchasers.
Not applicable to open-end investment companies.
Item 15. Submission of Matters to a Vote of Security Holders.
There have been no material changes to the procedures by which shareholders may recommend nominees to the registrant’s board of directors.
Item 16. Controls and Procedures.
| (a) | The Registrant’s [Principal Executive Officer] and [Principal Financial Officer] have reviewed the Registrant’s disclosure controls and procedures (as defined in Rule 30a-3(c) under the Investment Company Act of 1940 (the “Act”)) as of a date within 90 days of the filing of this report, as required by Rule 30a-3(b) under the Act and Rules 13a-15(b) or 15d-15(b) under the Securities Exchange Act of 1934. Based on their review, such officers have concluded that the disclosure controls and procedures are effective in ensuring that information required to be disclosed in this report is appropriately recorded, processed, summarized and reported and made known to them by others within the Registrant and by the Registrant’s service provider. |
| (b) | There were no changes in the Registrant’s internal control over financial reporting (as defined in Rule 30a-3(d) under the Act) that occurred during the period covered by this report that have materially affected, or are reasonably likely to materially affect, the Registrant’s internal control over financial reporting. |
Item 17. Disclosure of Securities Lending Activities for Closed-End Management Investment Companies
Not applicable to open-end investment companies.
Item 18. Recovery of Erroneously Awarded Compensation.
Item 19. Exhibits.
(2) A separate certification for each principal executive officer and principal financial officer pursuant to Section 302 of the Sarbanes-Oxley Act of 2002. Filed herewith.
SIGNATURES
Pursuant to the requirements of the Securities Exchange Act of 1934 and the Investment Company Act of 1940, the registrant has duly caused this report to be signed on its behalf by the undersigned, thereunto duly authorized.
| | (Registrant) | The Jensen Quality Growth Fund Inc. | |
| | By (Signature and Title)* | /s/ Robert McIver | |
| | | Robert McIver, President | |
Pursuant to the requirements of the Securities Exchange Act of 1934 and the Investment Company Act of 1940, this report has been signed below by the following persons on behalf of the registrant and in the capacities and on the dates indicated.
| | By (Signature and Title)* | /s/ Robert McIver | |
| | | Robert McIver, President | |
| | By (Signature and Title)* | /s/ Shannon Contreras | |
| | | Shannon Contreras, Treasurer | |
* Print the name and title of each signing officer under his or her signature.