UNITED STATES
SECURITIES AND EXCHANGE COMMISSION
Washington, D.C. 20549
FORM N-CSR
CERTIFIED SHAREHOLDER REPORT OF REGISTERED
MANAGEMENT INVESTMENT COMPANIES
Investment Company Act file number 811-6653
The Jensen Quality Growth Fund Inc.
(Exact name of registrant as specified in charter)
5500 Meadows Road, Suite 200
Lake Oswego, OR 97035-8234
(Address of principal executive offices) (Zip code)
Robert McIver
5500 Meadows Road, Suite 200
Lake Oswego, OR 97035-8234
(Name and address of agent for service)
(800) 221-4384
Registrant’s telephone number, including area code
Date of fiscal year end: May 31, 2022
Date of reporting period: November 30, 2022
Item 1. Reports to Stockholders.
Letter from The Investment Adviser
Dear Fellow Shareholders,
The Jensen Quality Growth Fund—Class I Shares—returned 1.52% for the six-month period ended November 30, 2022, compared to a decline of -0.40% for the Standard & Poor’s 500 Index over the period. Please see pages 7 through 10 of this report for complete standardized performance information for the Fund.
After a difficult start to calendar year 2022 when investors reacted negatively to the substantial headwinds impacting global economies, the domestic stock markets struggled to find direction for the six-month period ending November 30, 2022. While the challenges facing companies and their investors remained constant, be they persistently high inflationary pressures, steadily rising interest rates, a less accommodative policy from the U.S. Federal Reserve, ongoing geopolitical risk, or the run-up to the mid-term elections in the United States., the impact on the stock markets was, overall, negative.
Over the same six-month period, the energy sector saw a substantial slowdown in returns after a remarkably strong start to the year. That slowdown, along with the other factors noted above, contributed to a decline in corporate earnings over the course of the calendar year. As investors, we seek companies that produce a level of earnings growth stability that we believe can help to dampen the volatility of stock returns during challenging periods. We view the Fund’s outperformance over the last six months as a reflection of reasonably solid business performance from the companies in which we invest, despite the challenges facing global economies.
The Jensen Quality Growth Fund also benefitted from its focus on higher-quality stocks during the period, as investment performance from higher-quality stocks (A+, A, and A-, as measured by the S&P Quality & Dividend Rankings) was stronger than that of lower-quality stocks (B+ and lower, as measured by the S&P Quality & Dividend Rankings).
During the review period, specific stock selection contributed positively to the Fund’s relative performance in the Information Technology and Consumer Discretionary sectors, while detracting from returns primarily in the Health Care and Industrials sectors. From a sector perspective, the Fund’s lack of exposure to the Energy sector and lesser exposure to Financials detracted from performance as those were among the stronger-performing sectors for the period. Conversely, our relative overweight in the Health Care sector and our relative underweight in the Communications Services sector benefitted the Fund’s relative performance. Typically, very few, if any, companies in the Energy and Financials sectors qualify for investment in the Fund due to our strict requirement for high and prolonged profitability, as measured by consistently strong return on equity (ROE).
| | |
Semi-Annual Report | The Jensen Quality Growth Fund Inc. | 1 |
Leading contributors to performance during the period were Starbucks (SBUX) and PepsiCo (PEP), both of which continued to provide solid earnings reports and positive forecasts for future quarters despite the uncertain economic climate. Starbucks is a global restaurant company and roaster, marketer, and retailer of specialty coffee. During the period, the company’s stock price reacted favorably to resilient financial results, a better-than-expected long-term financial outlook, and the resolution of senior leadership uncertainty. Our Starbucks ownership thesis remains predicated on its strong, globally recognized brand, favorable scale economics, and history of product innovation.
PepsiCo is a producer and marketer of a wide variety of branded beverages and snacks. Well-known brands include Frito-Lay, Pepsi, Mountain Dew, Sierra Mist, and Gatorade. During the period, the company reported consistent sales and earnings growth due to relatively inelastic product demand and price increases that mitigated heightened cost inflation. Pepsi remains one of the Fund’s top holdings due to the strength of its competitive advantages and its track record of consistent financial results.
Significant detractors from the Fund’s performance for the period included Alphabet Inc (GOOGL) and 3M (MMM). Alphabet Inc is a leading technology services and hardware company with well-known products including Google Search, Android, and YouTube. Weakness in the company’s shares has been influenced by a broad pullback among technology-centric businesses following positive multi-year stock performance for the group. We are also monitoring the potential for decelerating financial results due to advertising spending uncertainty and difficult year-over-year comparisons to the prior year. Fundamentally, we consider the company to be sound, with a robust network effect for its core search and YouTube offerings, strong innovation, and an ascendant enterprise cloud business.
3M is a diversified industrial conglomerate that manufactures products based on core material science, process technologies, and manufacturing expertise. The company’s products have applications in safety & industrial, transportation, healthcare, and consumer products. The reduction of the Fund’s position in 3M reflects our concern about deteriorating business fundamentals. We are also concerned about the negative cash flow implications stemming from mounting product liability and environmental claims. Further, we have questions about the viability of 3M’s historical competitive advantages—scale, innovation, and brand strength—due to an ongoing trend of growth below our expectations. We believe that these concerns also drove the weak stock performance during the period.
We are constantly evaluating all the businesses owned by the Fund, as well as other investment candidates, to determine whether better opportunities exist in our investable universe which comprises businesses that have delivered at least a 15% ROE for 10 consecutive years. Such determinations ultimately reflect a combination of fundamental considerations, valuation opportunities, and overall risk profiles for the companies.
| | |
2 | The Jensen Quality Growth Fund Inc. | Semi-Annual Report |
Fund Additions and Eliminations
During the period, the Jensen Investment Team added a new position in Ball Corporation (BALL) due to solid business fundamentals and an attractive valuation. A brief synopsis of this change follows.
Ball Corporation manufactures and sells aluminum beverage cans, aluminum aerosol cans, and a variety of aerospace products including satellites, sensors, and cameras for unmanned aerial systems. Aluminum beverage cans account for approximately 80% of the company’s sales. Ball Corporation and its two main competitors, Crown Holdings Inc and Ardagh Metal Packaging, dominate the aluminum beverage can market with a combined share of approximately 65%. Of the three, Ball is the largest, with a market share in excess of 40% in North America, Central America, Europe, and South America. Ball’s customers in this business include well-known beverage producers such as AB InBev, Molson Coors, PepsiCo, Coca-Cola, and Red Bull.
Owing to their attractive environmental profile, aluminum beverage cans are currently taking share from both plastic and glass containers. The collection and recycling of aluminum is higher than any other packaging material because it is infinitely recyclable and does not degrade. Seventy-five percent of all aluminum ever produced is still in use today, and the average aluminum can contains 73% recycled content. The same cannot be said for other substrates, such as plastic. Only 10% of all plastic ever produced since 1950 has been recycled, and most of the recycled content is used to make down-cycle products, such as shoes and carpet fibers, the vast majority of which are ultimately landfilled or discarded.
Ball Corporation is run by a well-tenured management team executing a strategy consisting of building new plants, adding production lines to existing facilities, developing new products, and expanding geographically. In our opinion, significant barriers to entry exist in the aluminum beverage can business. These include three-to-five-year contracts with customers, high contract renewal rates, significant economies of scale, and the time and capital required to construct new beverage can plants. Given these factors and our estimate of Ball’s stock valuation, we were pleased to add the name to the Portfolio.
In addition to adding BALL, the Investment Team remained active in trimming positions considered more fully valued or fundamentally challenged to reflect Jensen’s convictions in the businesses and relative valuation opportunities within the context of the ongoing economic volatility.
As we reflect on the market pullback in 2022 and look forward to 2023, we maintain a more cautious outlook for market returns in the coming year. We recognize that several factors make any forecast challenging. They include, but are not limited to, higher inflation, the specter of higher interest rates than have been seen for some time, the likelihood that rates will stay high for the foreseeable future, and ongoing cost pressures from the labor markets and supply chains.
| | |
Semi-Annual Report | The Jensen Quality Growth Fund Inc. | 3 |
In addition to these factors, we note that the business performance of companies and recent market return patterns could influence the outlook for the coming year. With one quarter left to be reported, earnings growth for S&P 500 Index companies is forecast to change dramatically in 2022, from a 70% increase in 2021 to a nearly 4% decline in 2022. Of note, and perhaps of greater importance, is that earnings are currently expected to increase in 2023 by a bit more than 13%. We acknowledge that the comparisons to 2022 are easier, but an earnings rebound of this magnitude, and the resulting investor expectations, may prove to be overly optimistic given the Fed’s goal of maintaining its tightening posture in its effort to reduce inflation.
At the same time, there are increasing concerns about a recession in the coming year. Of note, we believe the fixed income market is signaling a looming economic recession. The treasury yield curve – the yield difference between 10-year and 2-year treasury bonds – has been inverted since early July. Yield curve inversions occur when the yields on short-term bonds are higher than those on long-term bonds. Such occurrences are relatively rare and have accurately predicted the 10 most recent economic recessions. Indeed, recent debate seems to be more focused on the depth and length of a recession rather than whether one will occur.
Consequently, the path forward may continue to be uneven and thus potentially unnerving for investors, despite lofty expectations and the hope for a quick rebound in the stock markets. However, we believe uncertainty can provide opportunities for higher-quality, more resilient businesses to garner favor from investors looking for lower volatility in the face of the issues discussed here. We continue to have confidence in the high-quality businesses owned in the Fund because of our deep research that favors such characteristics as strong and resilient business models, durable competitive advantages, pricing power, steady operating margins, and strong free cash flow generation that is consistently reinvested into future growth opportunities.
While the economic uncertainty and the pullback in equity market prices in 2022 has tested the resolve of some investors, the Jensen Investment Team remains convinced that the strategy and process guiding our management of the Fund is sound. Our goal remains to be the ownership of a portfolio of companies positioned to grow and accrue business value. We seek to participate in this value creation as investors via the long-term ownership of fairly priced, high-quality stocks. We believe the attributes noted above allow quality companies to generate business returns consistently above their cost of capital, ultimately resulting in shareholder value creation.
Finally, we remain steadfast in our belief that paying attention to company fundamentals can help investors manage risk. This should offer a measure of capital protection in more volatile or generally lower market return environments and provide the opportunity for long-term capital appreciation.
| | |
4 | The Jensen Quality Growth Fund Inc. | Semi-Annual Report |
We are tremendously grateful for the ongoing support of our firm and investment strategies from our partners and fellow shareholders. Thank you.
We invite you to seek additional information about the Jensen Quality Growth Fund at www.jenseninvestment.com, where additional content, including updated holdings and performance information, is available. We take our investment responsibilities seriously and appreciate the trust you have placed in us. As always, we welcome your feedback.
The Jensen Investment Team
| | |
Semi-Annual Report | The Jensen Quality Growth Fund Inc. | 5 |
This discussion and analysis of the Fund is as of November 2022 and is subject to change, and any forecasts made cannot be guaranteed. Past performance is no guarantee of future results. Fund holdings and sector weightings are subject to change and are not recommendations to buy or sell any security. The S&P 500 Index is an unmanaged but commonly used measure of common stock total return performance. One cannot invest directly in an index. For more complete information regarding performance and holdings, please refer to the financial statements and schedule of investments headings of this report. Current and future portfolio holdings are subject to risk. The Fund is non-diversified, meaning that it may concentrate its assets in fewer individual holdings than a diversified fund and is therefore more exposed to individual stock volatility than a diversified fund. Return on Equity: Is equal to a company's after-tax earnings (excluding non-recurring items) divided by its average stockholder equity for the year. Free Cash Flow: Is equal to the after-tax net income of a company plus depreciation and amortization less capital expenditures. For use only when preceded or accompanied by a current prospectus for the Fund. The Jensen Quality Growth Fund is distributed by Quasar Distributors, LLC. |
| | |
6 | The Jensen Quality Growth Fund Inc. | Semi-Annual Report |
Jensen Quality Growth Fund Inc. - Class J (Unaudited)
| | | | |
For periods ended November 30, 2022 | | | | |
Jensen Quality Growth Fund - Class J | | | | |
| | | | |
The S&P 500 Stock Index is an unmanaged but commonly used measure of common stock total return performance. This chart assumes an initial gross investment of $10,000 made on November 30, 2012 for Class J. Returns shown include the reinvestment of all dividends. Returns shown do not reflect the deduction of taxes that a shareholder would pay on fund distributions or the redemption of fund shares.
Performance data shown represents past performance; Past performance does not guarantee future results. The investment return and principal value of an investment will fluctuate so that an investor’s shares, when redeemed, may be worth more or less than their original cost. Current performance of the fund may be lower or higher than the performance shown. Performance data current to the most recent month end may be obtained by calling 1-800-992-4144 or by visiting www.jenseninvestment.com.
| | |
Semi-Annual Report | The Jensen Quality Growth Fund Inc. | 7 |
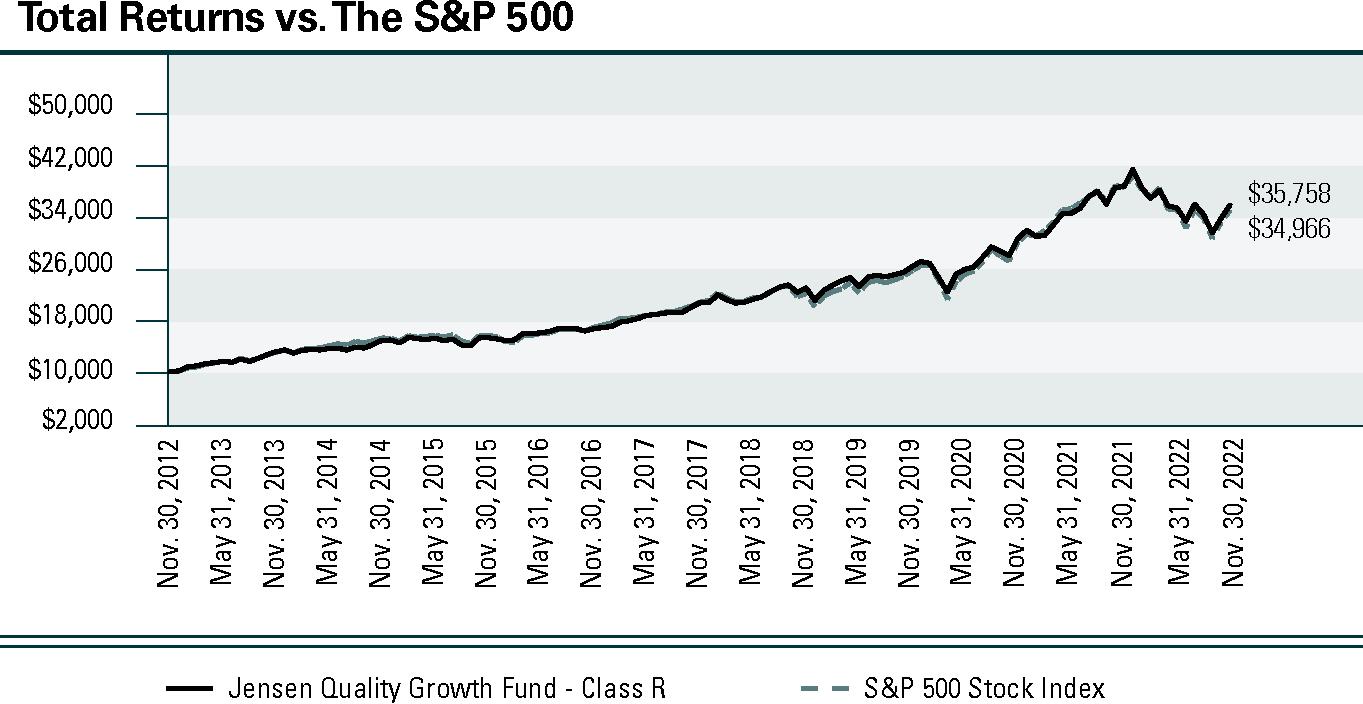
Jensen Quality Growth Fund Inc. - Class R (Unaudited)
| | | | |
For periods ended November 30, 2022 | | | | |
Jensen Quality Growth Fund - Class R | | | | |
| | | | |
The S&P 500 Stock Index is an unmanaged but commonly used measure of common stock total return performance. This chart assumes an initial gross investment of $10,000 made on November 30, 2012 for Class R. Returns shown include the reinvestment of all dividends. Returns shown do not reflect the deduction of taxes that a shareholder would pay on fund distributions or the redemption of fund shares.
Performance data shown represents past performance; Past performance does not guarantee future results. The investment return and principal value of an investment will fluctuate so that an investor’s shares, when redeemed, may be worth more or less than their original cost. Current performance of the fund may be lower or higher than the performance shown. Performance data current to the most recent month end may be obtained by calling 1-800-992-4144 or by visiting www.jenseninvestment.com.
| | |
8 | The Jensen Quality Growth Fund Inc. | Semi-Annual Report |
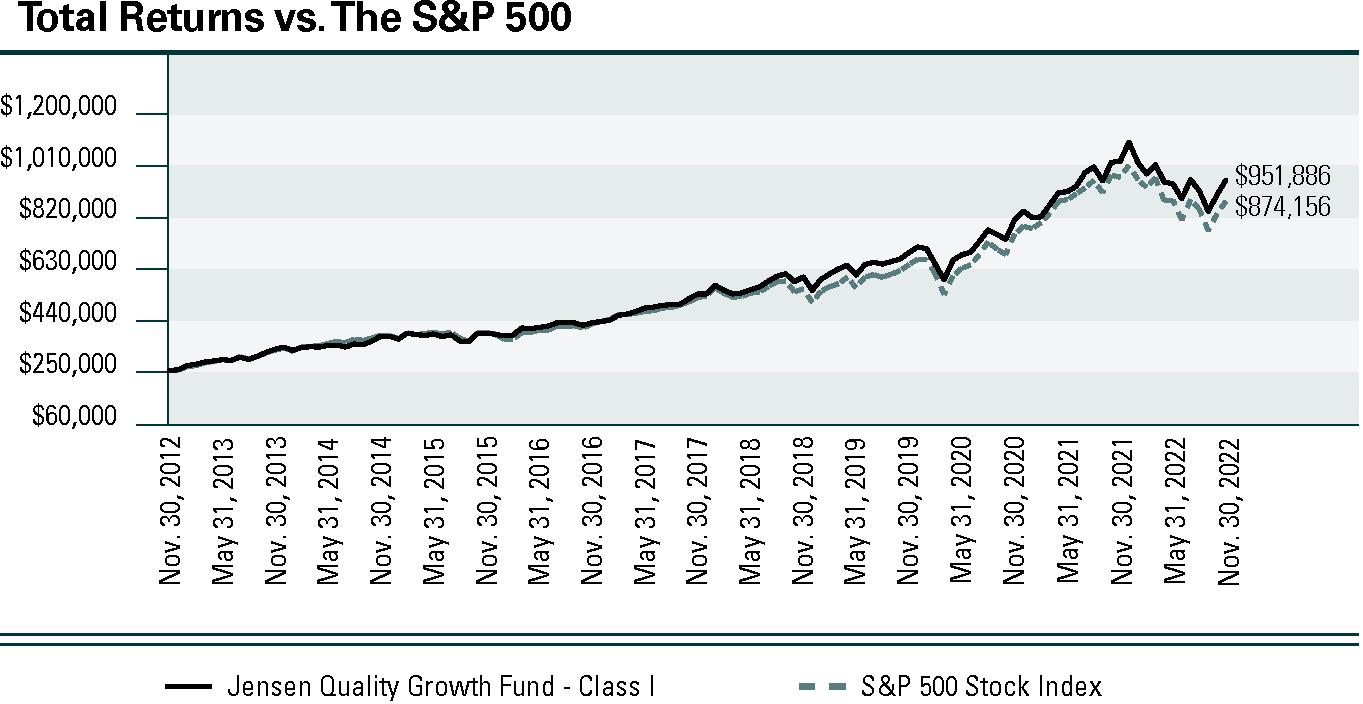
Jensen Quality Growth Fund Inc. - Class I (Unaudited)
| | | | |
For periods ended November 30, 2022 | | | | |
Jensen Quality Growth Fund - Class I | | | | |
| | | | |
The S&P 500 Stock Index is an unmanaged but commonly used measure of common stock total return performance. This chart assumes an initial gross investment of $250,000 made on November 30, 2012 for Class I. Returns shown include the reinvestment of all dividends. Returns shown do not reflect the deduction of taxes that a shareholder would pay on fund distributions or the redemption of fund shares.
Performance data shown represents past performance; Past performance does not guarantee future results. The investment return and principal value of an investment will fluctuate so that an investor’s shares, when redeemed, may be worth more or less than their original cost. Current performance of the fund may be lower or higher than the performance shown. Performance data current to the most recent month end may be obtained by calling 1-800-992-4144 or by visiting www.jenseninvestment.com.
| | |
Semi-Annual Report | The Jensen Quality Growth Fund Inc. | 9 |
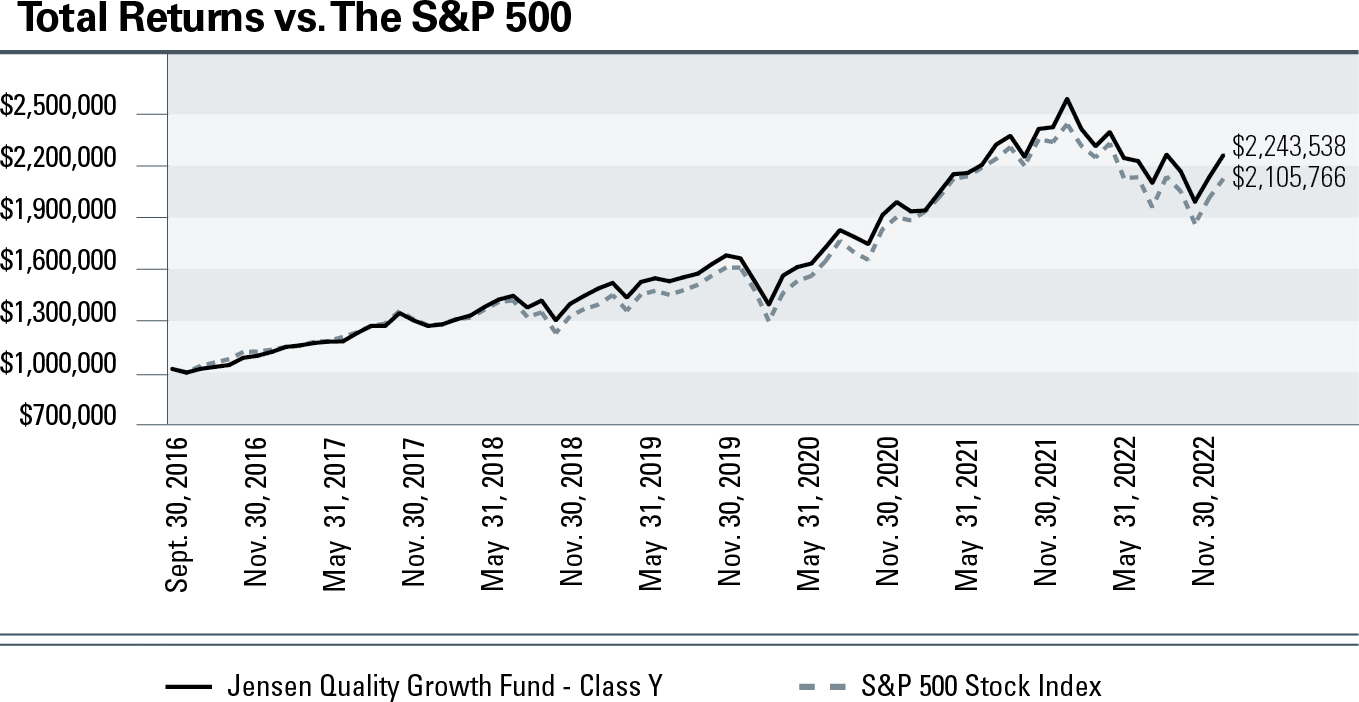
Jensen Quality Growth Fund Inc. - Class Y (Unaudited)
| | | | |
For periods ended November 30, 2022 | | | | Since Inception
(September 30, 2016) |
Jensen Quality Growth Fund - Class Y | | | | |
| | | | |
The S&P 500 Stock Index is an unmanaged but commonly used measure of common stock total return performance. This chart assumes an initial gross investment of $1,000,000 made on September 30, 2016 (commencement of operations for Class Y). Returns shown include the reinvestment of all dividends. Returns shown do not reflect the deduction of taxes that a shareholder would pay on fund distributions or the redemption of fund shares.
Performance data shown represents past performance; Past performance does not guarantee future results. The investment return and principal value of an investment will fluctuate so that an investor’s shares, when redeemed, may be worth more or less than their original cost. Current performance of the fund may be lower or higher than the performance shown. Performance data current to the most recent month end may be obtained by calling 1-800-992-4144 or by visiting www.jenseninvestment.com.
| | |
10 | The Jensen Quality Growth Fund Inc. | Semi-Annual Report |
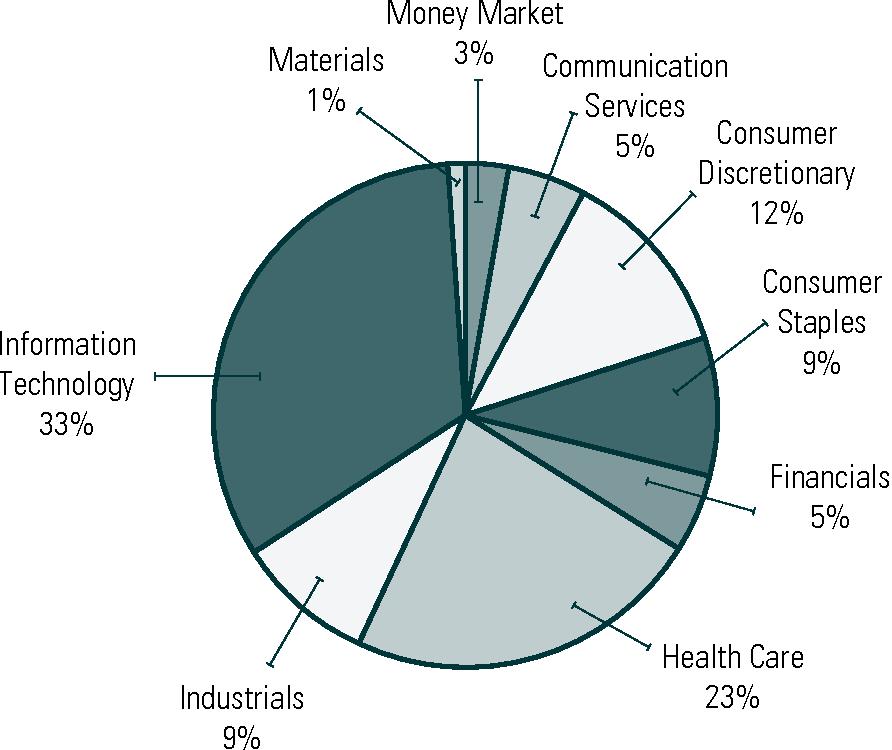
Investments by Sector as of November 30, 2022
(as a Percentage of Total Investments) (Unaudited)
The Global Industry Classification Standard (GICS®) was developed by and/or is the exclusive property of MSCI, Inc. and
Standard & Poor’s Financial Services LLC (“S&P”). GICS is a service mark of MSCI and S&P and has been licensed for use by
U.S. Bancorp Fund Services, LLC doing business as U.S. Bank Global Fund Services.
| | |
Semi-Annual Report | The Jensen Quality Growth Fund Inc. | 11 |
Statement of Assets & Liabilities
As of November 30, 2022 (Unaudited)
|
|
Investment, at value (cost $5,767,966,212) | |
Dividend and interest income receivable | |
Receivable for capital stock issued | |
| |
| |
|
Payable to Investment Adviser | |
Payable for capital stock redeemed | |
Accrued distribution fees | |
| |
Accrued expenses and other liabilities | |
| |
| |
|
| |
Total distributable earnings | |
| |
|
|
| |
| |
Net Asset Value - Offering Price and Redemption Price Per Share
(2,000,000,000 shares authorized) | |
|
| |
| |
Net Asset Value - Offering Price and Redemption Price Per Share
(1,000,000,000 shares authorized) | |
|
| |
| |
Net Asset Value - Offering Price and Redemption Price Per Share
(1,000,000,000 shares authorized) | |
|
| |
| |
Net Asset Value - Offering Price and Redemption Price Per Share
(1,000,000,000 shares authorized) | |
The accompanying notes are an integral part of these financial statements.
| | |
12 | The Jensen Quality Growth Fund Inc. | Semi-Annual Report |
November 30, 2022 (Unaudited) (showing percentage of total net assets)
| | |
| Air Freight & Logistics - 1.81% | |
| United Parcel Service, Inc. - Class B | |
| | |
| Commercial Services & Supplies - 2.16% | |
| | |
| | |
| Containers & Packaging - 1.35% | |
| | |
| | |
| Diversified Financial Services - 1.70% | |
| | |
| | |
| Electronic Equipment, Instruments & Components - 1.71% | |
| Amphenol Corporation - Class A | |
| | |
| Health Care Equipment & Supplies - 8.47% | |
| Becton Dickinson and Company | |
| | |
| |
| | |
| Health Care Providers & Services - 5.13% | |
| | |
| | |
| Hotels, Restaurants & Leisure - 3.43% | |
| | |
| | |
| Household Products - 2.69% | |
| The Procter & Gamble Company | |
| | |
| Industrial Conglomerates - 1.25% | |
| | |
The accompanying footnotes are an integral part of the Financial Statements.
| | |
Semi-Annual Report | The Jensen Quality Growth Fund Inc. | 13 |
Schedule of Investments continued
November 30, 2022 (Unaudited) (showing percentage of total net assets)
| | |
| | |
| Marsh & McLennan Companies, Inc. | |
| | |
| Interactive Media & Services - 5.20% | |
| Alphabet, Inc. - Class A (a) | |
| | |
| | |
| Accenture PLC - Class A (b) | |
| Automatic Data Processing, Inc. | |
| Broadridge Financial Solutions, Inc. | |
| Cognizant Technology Solutions Corporation - Class A | |
| Mastercard, Inc. - Class A | |
| |
| | |
| Professional Services - 3.44% | |
| | |
| | |
| |
| | |
| Semiconductors & Semiconductor Equipment - 2.51% | |
| | |
The accompanying footnotes are an integral part of the Financial Statements.
| | |
14 | The Jensen Quality Growth Fund Inc. | Semi-Annual Report |
Schedule of Investments continued
November 30, 2022 (Unaudited) (showing percentage of total net assets)
| | |
| Technology Hardware, Storage & Peripherals - 4.70% | |
| | |
| | |
| Textiles, Apparel & Luxury Goods - 3.91% | |
| | |
Short-Term Investment - 2.67%
| | |
| Money Market Fund - 2.67% | |
| First American Treasury Obligations Fund - Class X, 3.744% (c) | |
| |
Total Short-Term Investment | |
| |
| |
| |
(Cost $5,767,966,212) - 99.86% | |
Other Assets in Excess of Liabilities - 0.14% | |
TOTAL NET ASSETS - 100.00% | |
Percentages are stated as a percent of net assets.
| |
PLC - Public Limited Company |
| Non-income producing security. |
| Foreign issued security. Foreign concentration (including ADRs) was as follows: Ireland 4.55% as a percentage of net assets. |
| Variable rate security. Rate listed is the 7-day effective yield as of November 30, 2022. |
The accompanying footnotes are an integral part of the Financial Statements.
| | |
Semi-Annual Report | The Jensen Quality Growth Fund Inc. | 15 |
Six Months Ended November 30, 2022 (Unaudited)
|
|
| |
| |
| |
|
| |
| |
Shareholder servicing fees - Class I | |
| |
Sub-transfer agent expenses - Class J | |
| |
Transfer agent fees - Class I | |
Directors' fees and expenses | |
| |
Reports to shareholders - Class I | |
Federal and state registration fees | |
| |
| |
| |
Reports to shareholders - Class Y | |
Chief Compliance Officer Fees | |
| |
Reports to shareholders - Class J | |
Transfer agent fees - Class J | |
Shareholder servicing fees - Class R | |
Transfer agent fees - Class R | |
Transfer agent fees - Class Y | |
Reports to shareholders - Class R | |
| |
| |
Realized and Unrealized Gain (Loss) on Investments: |
Net realized loss on investment transactions | |
Change in unrealized appreciation on investments | |
Net realized and unrealized gain on investments | |
Net Increase in Net Assets Resulting from Operations | |
The accompanying notes are an integral part of these financial statements.
| | |
16 | The Jensen Quality Growth Fund Inc. | Semi-Annual Report |
Statements of Changes in Net Assets
| | |
| Six Months Ended
November 30, 2022
(Unaudited) | |
| | |
Net realized gain (loss) on investment transactions | | |
Change in unrealized appreciation (depreciation) on investments | | |
Net increase in net assets resulting from operations | | |
Capital Share Transactions:
| | |
| | |
| | |
| | |
| | |
Shares issued in reinvestment of dividends - Class J | | |
Shares issued in reinvestment of dividends - Class R | | |
Shares issued in reinvestment of dividends - Class I | | |
Shares issued in reinvestment of dividends - Class Y | | |
Shares redeemed - Class J | | |
Shares redeemed - Class R | | |
Shares redeemed - Class I | | |
Shares redeemed - Class Y | | |
| | |
Dividends and Distributions to Shareholders:
| | |
Net dividends and distributions to shareholders - Class J | | |
Net dividends and distributions to shareholders - Class R | | |
Net dividends and distributions to shareholders - Class I | | |
Net dividends and distributions to shareholders - Class Y | | |
Total dividends and distributions | | |
Increase (decrease) in Net Assets | | |
| | |
| | |
| | |
The accompanying notes are an integral part of these financial statements.
| | |
Semi-Annual Report | The Jensen Quality Growth Fund Inc. | 17 |
| | | | | | |
| six months
ended
November
30, 2022
(unaudited) | | | | | |
Net asset value, beginning of period | | | | | | |
Income from investment
operations: | | | | | | |
| | | | | | |
Net realized and unrealized
gains on investments | | | | | | |
Total from investment
operations | | | | | | |
| | | | | | |
Dividends from net
investment income | | | | | | |
Distributions from
capital gains | | | | | | |
| | | | | | |
Net asset value, end of period | | | | | | |
| | | | | | |
Supplemental data and ratios: | | | | | | |
Net assets, end of
period(000’s) | | | | | | |
Ratio of expenses to average
net assets(3) | | | | | | |
Ratio of net investment income
to average net assets(3) | | | | | | |
Portfolio turnover rate(2) | | | | | | |
| |
| (1) | Net investment income per share is calculated using the ending accumulated net investment income balances prior to consideration or adjustments for permanent book-to-tax differences. |
| (2) | Not annualized for the six months ended November 30, 2022. |
| (3) | Annualized for the six months ended November 30, 2022. |
The accompanying notes are an integral part of these financial statements.
| | |
18 | The Jensen Quality Growth Fund Inc. | Semi-Annual Report |
| | | | | | |
| six months
ended
November
30, 2022
(unaudited) | | | | | |
Net asset value, beginning of period | | | | | | |
Income from investment
operations: | | | | | | |
| | | | | | |
Net realized and unrealized
gains on investments | | | | | | |
Total from investment
operations | | | | | | |
| | | | | | |
Dividends from net
investment income | | | | | | |
Distributions from
capital gains | | | | | | |
| | | | | | |
Net asset value, end of period | | | | | | |
| | | | | | |
Supplemental data and ratios: | | | | | | |
Net assets, end of
period(000’s) | | | | | | |
Ratio of expenses to average
net assets(3) | | | | | | |
Ratio of net investment income
to average net assets(3) | | | | | | |
Portfolio turnover rate(2) | | | | | | |
| |
| (1) | Net investment income per share is calculated using the ending accumulated net investment income balances prior to consideration or adjustments for permanent book-to-tax differences. |
| (2) | Not annualized for the six months ended November 30, 2022. |
| (3) | Annualized for the six months ended November 30, 2022. |
The accompanying notes are an integral part of these financial statements.
| | |
Semi-Annual Report | The Jensen Quality Growth Fund Inc. | 19 |
| | | | | | |
| six months
ended
November
30, 2022
(unaudited) | | | | | |
Net asset value, beginning of period | | | | | | |
Income from investment
operations: | | | | | | |
| | | | | | |
Net realized and unrealized
gains on investments | | | | | | |
Total from investment
operations | | | | | | |
| | | | | | |
Dividends from net
investment income | | | | | | |
Distributions from
capital gains | | | | | | |
| | | | | | |
Net asset value, end of period | | | | | | |
| | | | | | |
Supplemental data and ratios: | | | | | | |
Net assets, end of
period(000’s) | | | | | | |
Ratio of expenses to average
net assets(3) | | | | | | |
Ratio of net investment income
to average net assets(3) | | | | | | |
Portfolio turnover rate(2) | | | | | | |
| |
| (1) | Net investment income per share is calculated using the ending accumulated net investment income balances prior to consideration or adjustments for permanent book-to-tax differences. |
| (2) | Not annualized for the six months ended November 30, 2022. |
| (3) | Annualized for the six months ended November 30, 2022. |
The accompanying notes are an integral part of these financial statements.
| | |
20 | The Jensen Quality Growth Fund Inc. | Semi-Annual Report |
| | | | | | |
| six months
ended
November
30, 2022
(unaudited) | | | | | |
Net asset value, beginning of period | | | | | | |
Income from investment
operations: | | | | | | |
| | | | | | |
Net realized and unrealized
gains on investments | | | | | | |
Total from investment
operations | | | | | | |
| | | | | | |
Dividends from net
investment income | | | | | | |
Distributions from
capital gains | | | | | | |
| | | | | | |
Net asset value, end of period | | | | | | |
| | | | | | |
Supplemental data and ratios: | | | | | | |
Net assets, end of
period(000’s) | | | | | | |
Ratio of expenses to average
net assets(3) | | | | | | |
Ratio of net investment income
to average net assets(3) | | | | | | |
Portfolio turnover rate(2) | | | | | | |
| |
| (1) | Net investment income per share is calculated using the ending accumulated net investment income balances prior to consideration or adjustments for permanent book-to-tax differences. |
| (2) | Not annualized for the six months ended November 30, 2022. |
| (3) | Annualized for the six months ended November 30, 2022. |
The accompanying notes are an integral part of these financial statements.
| | |
Semi-Annual Report | The Jensen Quality Growth Fund Inc. | 21 |
Notes to the Financial Statements
November 30, 2022 (Unaudited)
1. Organization and Significant Accounting Policies
The Jensen Quality Growth Fund Inc. (the “Fund”), was incorporated as an Oregon corporation on April 17, 1992, and is registered as an open-end, nondiversified management investment company under the Investment Company Act of 1940 (the “1940 Act”). The Fund commenced operations on August 3, 1992. Effective March 1, 2018, the name of the Fund was changed from The Jensen Portfolio, Inc. doing business as Jensen Quality Growth Fund to The Jensen Quality Growth Fund Inc. The Fund is authorized to issue 5,000,000,000 shares of common stock, all of which have been authorized for the existing share classes. The Fund currently offers four different classes of shares; Class J, Class I, Class R, and Class Y. Class J shares are subject to a 0.25% 12b-1 fee and a sub-transfer agency fee, Class R shares are subject to a 0.50% 12b-1 fee and up to a 0.25% shareholder servicing fee, Class I shares are subject to a shareholder servicing fee of up to 0.10%, and Class Y shares are not subject to any 12b-1, shareholder servicing or sub transfer agency fee as described in the separate prospectuses for each of the funds share classes. Each class of shares has identical rights and privileges except with respect to the 12b-1 fees, sub-transfer agency fees, shareholder servicing fees, and voting rights on matters affecting a single class of shares. The principal investment objective of the Fund is long-term capital appreciation.
The Fund is an investment company and accordingly follows the investment company accounting and reporting guidance of the Financial Accounting Standards Board (“FASB”) Accounting Standards Codification Topic 946 “Financial Services Investment Companies”.
The following is a summary of significant accounting policies consistently followed by the Fund. The policies are in conformity with accounting principles generally accepted in the United States of America (“GAAP”).
a) Investment Valuation – Securities that are listed on United States stock exchanges are valued at the last sale price at the close of the exchange. Equity securities listed on the NASDAQ Stock Market are valued at the NASDAQ Official Closing Price or, if there has been no sale on that day, at their current bid price. Investments in open-end and closed-end registered investment companies, including money market funds, that do not trade on an exchange are valued at the end of day net asset value per share. Quotations are taken from the market in which the security is primarily traded. Over-the-counter securities are valued at the current bid price in the absence of a closing price. Securities for which market quotations are not readily available are valued at fair value as determined by Jensen Investment Management, Inc. (the “Investment Adviser”) at or under the direction of the Fund’s Board of Directors.
There is no definitive set of circumstances under which the Fund may elect to use fair value procedures to value a security. Although the Fund only invests in publicly traded securities, the large majority of which are large capitalization, highly liquid securities, they nonetheless may become securities for which market quotations are not readily available, such as in instances where the
| | |
22 | The Jensen Quality Growth Fund Inc. | Semi-Annual Report |
market quotation for a security has become stale, sales of a security have been infrequent, trading in the security has been suspended, or where there is a thin market in the security. Securities for which market quotations are not readily available will be valued at their fair value as determined under the Fund’s fair valuation procedures established by the Board of Directors. The Fund is prohibited from investing in restricted securities (securities issued in private placement transactions that may not be offered or sold to the public without registration under the securities laws); therefore, fair value pricing considerations for restricted securities are generally not applicable to the Fund.
Fair Value Measurement – The Fund has adopted authoritative fair valuation accounting standards which establish an authoritative definition of fair value and set out a hierarchy for measuring fair value. These standards require additional disclosures about the various inputs and valuation techniques used to develop the measurements of fair value and a discussion of changes in valuation techniques and related inputs during the year. The three levels of the fair value hierarchy are as follows:
| |
| Inputs that reflect unadjusted quoted prices in active markets for identical assets or liabilities that the Fund has the ability to access at the measurement date. |
| Inputs other than quoted prices that are observable for the asset or liability either directly or indirectly, including inputs in markets that are not considered to be active and prices for similar securities, interest rates, credit risk, etc. |
| Inputs that are unobservable (including the Fund’s own assumptions in determining the fair value of investments). |
Inputs refer broadly to the assumptions that market participants use to make valuation decisions, including assumptions about risk. Inputs may include price information, volatility statistics, specific and broad credit data, liquidity statistics, and other factors. A financial instrument’s level within the fair value hierarchy is based on the lowest level of input that is significant to the fair value measurement. However, the determination of what constitutes “observable” requires significant judgment by the Fund. The Fund considers observable data to be that market data which is readily available, regularly distributed or updated, reliable and verifiable, not proprietary, and provided by independent sources that are actively involved in the relevant market. The categorization of a financial instrument within the hierarchy is based upon the pricing transparency of the instrument and does not necessarily correspond to the Fund’s perceived risk of that instrument.
Investments whose values are based on quoted market prices in active markets, include common stocks and certain money market securities, and are classified within Level 1. Investments that trade in markets that are not considered to be active, but are valued based on quoted market prices, dealer quotations or alternative pricing sources supported by observable inputs are classified within Level 2. Investments classified within Level 3 have significant unobservable inputs, as they trade infrequently or not at all.
| | |
Semi-Annual Report | The Jensen Quality Growth Fund Inc. | 23 |
The following is a summary of the inputs used, as of November 30, 2022, to value the Fund’s investments carried at fair value. The inputs and methodology used for valuing securities may not be an indication of the risk associated with investing in those securities.
* For further information regarding security characteristics and industry classifications, please see the Schedule of Investments.
The Fund did not hold any investments during the period ended November 30, 2022 with significant unobservable inputs which would be classified as Level 3. The Fund did not hold any derivative instruments during the reporting year.
b) Federal Income Taxes – No provision has been made for Federal income taxes since the Fund has elected to be taxed as a “regulated investment company” and intends to distribute substantially all net investment company taxable income and net capital gains to its shareholders and otherwise comply with the provision of the Internal Revenue Code applicable to regulated investment companies.
The Fund has reviewed all open tax years and major jurisdictions and concluded that there is no tax liability resulting from unrecognized tax benefits relating to uncertain income tax positions taken or expected to be taken as of and for the year ended May 31, 2022. The Fund recognizes interest and penalties, if any, related to uncertain tax benefits in the Statement of Operations. During the year, the Fund did not incur any interest or penalties. Open tax years are those that are open for exam by taxing authorities. The Fund has no examination in progress. The Fund is also not aware of any tax positions for which it is reasonably possible that the total amounts of unrecognized tax benefits will significantly change in the next twelve months.
c) Distributions to Shareholders – Dividends to shareholders are recorded on the ex-dividend date. Dividends from net investment income are declared and paid quarterly by the Fund. Distributions of net realized capital gains, if any, will be declared and paid at least annually. Income and capital gain distributions are determined in accordance with income tax regulations which may differ from GAAP. The Fund may utilize earnings and profits distributed to shareholders on redemption of shares as part of the dividend paid deduction.
d) Use of Estimates – The preparation of financial statements in conformity with GAAP requires management to make estimates and assumptions that affect the reported amounts of assets and liabilities and disclosure of contingent assets and liabilities at the date of the financial statements and the reported amounts of revenues and expenses during the reporting period. Actual results could differ from those estimates.
| | |
24 | The Jensen Quality Growth Fund Inc. | Semi-Annual Report |
e) Guarantees and Indemnifications – Under the Fund’s organizational documents, each director, officer, employee or other agent of the Fund is indemnified, to the extent permitted by the 1940 Act, against certain liabilities that may arise out of performance of their duties to the Fund. Additionally, in the normal course of business, the Fund enters into contracts that contain a variety of indemnification clauses. The Fund’s maximum exposure under these arrangements is unknown as this would involve future claims that may be made against the Fund that have not yet occurred. However, the Fund has not had prior claims or losses pursuant to these contracts and believes the risk of loss to be remote.
f) Allocation of Income, Expenses and Gains/Losses – Income, expenses (other than those deemed attributable to a specific share class), and gains and losses of the Fund are allocated daily to each class of shares based upon the ratio of net assets represented by each class as a percentage of the net assets of the Fund. Expenses deemed directly attributable to a class of shares are recorded by the specific class. Most Fund expenses are allocated by class based on relative net assets. Transfer agent fees and reports to shareholders are allocated based on the number of shareholder accounts in each class. Sub-transfer agency fees are expensed to the Class J shares based on the average of two published per-account rates from two known brokerages. 12b-1 fees are expensed at 0.25% of average daily net assets of Class J shares and 0.50% of average daily net assets of Class R shares. Shareholder servicing fees are expensed at up to 0.10% and up to 0.25% of the average daily net assets of Class I shares and Class R shares, respectively.
g) Other – Investment and shareholder transactions are recorded on trade date. Gains or losses from investment transactions are determined on the basis of identified carrying value using the specific identification method. Dividend income is recognized on the ex-dividend date and interest income is recognized on an accrual basis.
2. Capital Share Transactions
Transactions in shares of the Fund were as follows:
| | | | | | | |
| period ended
November 30, 2022 | |
| | | | | | |
Shares issued in reinvestment of dividends | | | | | | |
| | | | | | |
| | | | | | |
|
| | | | | | |
| | | | | | |
| | |
Semi-Annual Report | The Jensen Quality Growth Fund Inc. | 25 |
| | | | | | | |
| period ended
November 30, 2022 | |
| | | | | | |
Shares issued in reinvestment of dividends | | | | | | |
| | | | | | |
| | | | | | |
|
| | | | | | |
| | | | | | |
| | | | | | | |
| period ended
November 30, 2022 | |
| | | | | | |
Shares issued in reinvestment of dividends | | | | | | |
| | | | | | |
| | | | | | |
|
| | | | | | |
| | | | | | |
| | | | | | | |
| period ended
November 30, 2022 | |
| | | | | | |
Shares issued in reinvestment of dividends | | | | | | |
| | | | | | |
| | | | | | |
|
| | | | | | |
| | | | | | |
3. Investment Transactions
The aggregate purchases and aggregate sales of securities, excluding short-term investments, by the Fund for the period ended November 30, 2022, were $555,438,423 and $383,849,714, respectively.
| | |
26 | The Jensen Quality Growth Fund Inc. | Semi-Annual Report |
The distributions of $93,525,514 and $107,389,201 paid during the years ended May 31, 2022 and 2021, respectively, were classified as ordinary income for tax purposes. The distributions of $627,290,825 and $860,454,655 paid during the years ended May 31, 2022 and 2021, respectively, were classified as long-term capital gain for income tax purposes.
Additionally, U.S. generally accepted accounting principles require that certain components of net assets relating to permanent differences be reclassified between financial and tax reporting. These reclassifications have no effect on net assets or net asset value per share. For the year ended May 31, 2022, distributable earnings decreased by $78,974,490 and capital stock increased by $78,974,490. The permanent difference relates to tax equalization.
At May 31, 2022, the cost of investments, net unrealized appreciation (depreciation) and undistributed ordinary income and undistributed long term capital gains for income tax purposes were as follows:
| | | | |
| | | |
Gross unrealized appreciation | | | |
Gross unrealized depreciation | | | |
Net unrealized appreciation | | | |
Undistributed ordinary income | | | |
Undistributed long-term capital gain | | | |
| | | |
| | | |
Total distributable earnings | | | |
The cost of investments differ for financial statement and tax purposes primarily due to the deferral of losses on wash sales.
The Fund has the lesser of (i) $400 million, (ii) 20% of the gross market value of the Fund, or (iii) 33.33% of the net market value of the unencumbered assets of the Fund available under a revolving credit facility, subject to certain restrictions, for temporary emergency purposes, including the meeting of redemption requests that otherwise might require the untimely disposition of securities. The secured line of credit has a one-year term and is reviewed annually by the Board of Directors. The credit facility is with the Fund’s custodian, U.S. Bank. The current credit facility runs through December 13, 2023. The interest rate on the outstanding principal amount is equal to the prime rate less 1%. As of November 30, 2022 the interest rate on the Fund’s line of credit was 6%. The Fund did not borrow on the line of credit during the period ended November 30, 2022.
| | |
Semi-Annual Report | The Jensen Quality Growth Fund Inc. | 27 |
6. Investment Advisory Agreement
The Fund is a party to an Investment Advisory and Service Contract with the Investment Adviser. Pursuant to the terms of the Investment Advisory and Service Contract approved by Fund shareholders, the Investment Adviser is entitled to receive a fee, calculated daily and payable monthly, at the annual rate of 0.50% as applied to the Fund’s average daily net assets of $4 billion or less, 0.475% as applied to the Fund’s average daily net assets of more than $4 billion and up to $8 billion, 0.45% as applied to the Fund’s average daily net assets of more than $8 billion and up to $12 billion, and 0.425% as applied to the Fund’s average daily net assets of more than $12 billion.
Certain officers and a director of the Fund are also officers and directors of the Investment Adviser.
7. Distribution and Shareholder Servicing
The Fund has adopted a distribution and shareholder servicing plan pursuant to Rule 12b-1 under the 1940 Act (the “12b-1 Plan”), which provides that the Fund make payments to the Fund’s distributor at an annual rate of 0.25% of average daily net assets attributable to Class J shares and 0.50% of the average daily net assets attributable to Class R shares. The Fund’s distributor may then make payments to financial intermediaries or others at an annual rate of up to 0.25% of the average daily net assets attributable to Class J shares and up to 0.50% of the average daily net assets attributable to Class R shares. Payments under the 12b-1 Plan shall be used to compensate the Fund’s distributor or others for services provided and expenses incurred in connection with the sale and/or servicing of shares. 12b-1 fees incurred for the period ended November 30, 2022, are disclosed on the Statement of Operations and the amount payable at year end is disclosed on the Statement of Assets and Liabilities.
In addition, the Fund has adopted a Shareholder Servicing Plan for Class I shares under which the Fund can pay for shareholder support services from the Fund’s assets pursuant to a Shareholder Servicing Agreement in an amount not to exceed 0.10% of the Fund’s average daily net assets attributable to Class I shares. The amount actually incurred for the period ended November 30, 2022 was 0.09% on an annualized basis.
The Fund has also adopted a Shareholder Servicing Plan for the Class R shares. Under the Shareholder Servicing Plan, the Fund can pay for shareholder support services, which include the recordkeeping and administrative services provided by retirement plan administrators to retirement plans (and their participants) that are shareholders of the class. Payments will be made pursuant to a Shareholder Servicing Agreement in an amount not to exceed 0.25% of the Fund’s average daily net assets attributable to Class R shares. The amount actually incurred for the period ended November 30, 2022 was 0.17% on an annualized basis.
| | |
28 | The Jensen Quality Growth Fund Inc. | Semi-Annual Report |
The beneficial ownership, either directly or indirectly, of more than 25% of the voting securities of a fund creates presumption of control of the fund, under Section 2(a)(9) of the 1940 Act. At November 30, 2022, Charles Schwab & Co., Inc., for the benefit of its customers, held 40.00% of the outstanding shares of the Class J share class. At November 30, 2022, Wells Fargo Clearing Services LLC, for the benefit of its customers, held 38.75% of the outstanding shares of the Class I share class. At November 30, 2022, Empower Annuity Insurance, for the benefit of its customers, held 25.92% of the outstanding shares of the Class R share class, respectively. At November 30, 2022, Edward D Jones and Co., for the benefit of its customers, held 37.79% of the outstanding shares of the Class Y share class.
The global outbreak of coronavirus disease 2019 (“COVID-19”) has disrupted global economic markets and adversely affected individual companies and investment products. The prolonged economic impact of COVID-19 is uncertain. The operational and financial performance of the issuers of securities in which the Fund invests depends on future developments, including the duration and spread of the outbreak, and such uncertainty may in turn impact the value of the Fund’s investments.
On December 15, 2022, The Fund declared and paid a distribution from ordinary income of $0.14453912, $0.18102123, $0.05727307, and $0.19670470 for Class J, Class I, Class R and Class Y, respectively, to shareholders of record as of December 14, 2022.
On December 15, 2022, the Fund declared and paid a long-term capital gain of $1.18618 for Class J, Class I, Class R and Class Y to shareholders of record as of December 14, 2022.
The board of directors of The Jensen Quality Growth Fund Inc. (the “Fund”) elected Charles A. Wilhoite as an independent director of the Fund effective as of January 1, 2023 to fill a vacancy on the Fund’s board of directors. Mr. Wilhoite was also appointed by the Board as a member of the Fund’s Audit Committee and Governance Committee.
In preparing these financial statements, the Fund has evaluated events and transactions for potential recognition or disclosure resulting from subsequent events after the Statement of Assets and Liabilities date of November 30, 2022 through the date the financial statements were available for issue.
| | |
Semi-Annual Report | The Jensen Quality Growth Fund Inc. | 29 |
Expense Example - November 30, 2022 (Unaudited)
As a shareholder of The Jensen Quality Growth Fund Inc. (the “Fund”), you incur ongoing costs, including investment advisory fees, distribution and/or shareholder servicing fees, and other Fund expenses, which are indirectly paid by shareholders. This example is intended to help you understand your ongoing costs (in dollars) of investing in the Fund and to compare these costs with the ongoing costs of investing in other mutual funds.
The Example is based on an investment of $1,000 invested at the beginning of the period and held for the entire six-month period (June 1, 2022 - November 30, 2022).
The first line of the table below for each share class of the Fund provides information about actual account values and actual expenses. However, the table does not include shareholder specific fees, such as the $15.00 fee charged to IRA accounts, or the $15.00 fee charged for wire redemptions. The table also does not include portfolio trading commissions and related trading costs. You may use the information in this line, together with the amount you invested, to estimate the expenses that you paid over the period. Simply divide your account value by $1,000 (for example, an $8,600 account value divided by $1,000 = 8.6), then multiply the result by the number in the first line under the heading entitled “Expenses Paid During Period” to estimate the expenses you paid on your account during this period.
Hypothetical Example for Comparison Purposes
The second line of the table below provides information about hypothetical account values and hypothetical expenses based on the actual expense ratios for each share class of the Fund and an assumed rate of return of 5% per year before expenses, which is not the Fund’s actual return. The hypothetical account values and expenses may not be used to estimate the actual ending account balance or expenses you paid for the period. You may use this information to compare the ongoing costs of investing in the Fund and other funds. To do so, compare this 5% hypothetical example with the 5% hypothetical examples that appear in the shareholder reports of the other funds.
Please note that the expenses shown in the table are meant to highlight your ongoing costs only and do not reflect any transactional costs, such as sales charges (loads), redemption fees, or exchange fees which, although not charged by the Fund, may be charged by other funds. Therefore, the second line of the table is useful in comparing ongoing costs only, and will not help you determine the relative total costs of owning different funds.
| | |
30 | The Jensen Quality Growth Fund Inc. | Semi-Annual Report |
Expense Example Tables (Unaudited)
| | | | | | | | | | |
Jensen Quality Growth Fund – Class J | Beginning
Account Value
June 1, 2022 | Ending
Account Value
November 30, 2022 | Expenses Paid
During Period*
Jun 1, 2022 –
Nov 30, 2022 |
| | | | | | | | | |
Hypothetical (5% annual return before expenses) | | | | | | | | | |
| |
| Expenses are equal to the Fund’s annualized six-month expense ratio of 0.82%, multiplied by the average account value over the period, multiplied by 183/365 to reflect the one-half year period. |
| | | | | | | | | | |
Jensen Quality Growth Fund – Class R | Beginning
Account Value
June 1, 2022 | Ending
Account Value
November 30, 2022 | Expenses Paid
During Period*
Jun 1, 2022 –
Nov 30, 2022 |
| | | | | | | | | |
Hypothetical (5% annual return before expenses) | | | | | | | | | |
| |
| Expenses are equal to the Fund’s annualized six-month expense ratio of 1.28%, multiplied by the average account value over the period, multiplied by 183/365 to reflect the one-half year period. |
| | | | | | | | | | |
Jensen Quality Growth Fund – Class I | Beginning
Account Value
June 1, 2022 | Ending
Account Value
November 30, 2022 | Expenses Paid
During Period*
Jun 1, 2022 –
Nov 30, 2022 |
| | | | | | | | | |
Hypothetical (5% annual return before expenses) | | | | | | | | | |
| |
| Expenses are equal to the Fund’s annualized six-month expense ratio of 0.61%, multiplied by the average account value over the period, multiplied by 183/365 to reflect the one-half year period. |
| | | | | | | | | | |
Jensen Quality Growth Fund – Class Y | Beginning
Account Value
June 1, 2022 | Ending
Account Value
November 30, 2022 | Expenses Paid
During Period*
Jun 1, 2022 –
Nov 30, 2022 |
| | | | | | | | | |
Hypothetical (5% annual return before expenses) | | | | | | | | | |
| |
| Expenses are equal to the Fund’s annualized six-month expense ratio of 0.52%, multiplied by the average account value over the period, multiplied by 183/365 to reflect the one-half year period. |
| | |
Semi-Annual Report | The Jensen Quality Growth Fund Inc. | 31 |
Additional Information (Unaudited)
1. Investment Advisory Agreement Disclosure
Section 15(c) under the 1940 Act requires that a registered investment company’s board of directors, including a majority of independent directors, approve any new investment advisory contract for the fund and thereafter to review and approve the terms of the fund’s investment advisory agreement on an annual basis. In addition, Section 15(a) of the 1940 Act requires that any new investment advisory agreement be approved by the fund’s shareholders.
In its most recent deliberations concerning whether to renew The Jensen Quality Growth Fund Inc.’s (the “Fund”) Investment Advisory and Service Contract (the “Agreement”) with Jensen Investment Management, Inc. (the “Adviser”), the Fund’s Board of Directors (the “Board”) including the Fund’s independent directors (“Independent Directors”) conducted the review and made the determinations that are described below. During its deliberations, the Board requested from the Adviser, and the Adviser furnished, all information reasonably necessary for it to evaluate the renewal of the Agreement.
The entire Board first met on April 12, 2022 to consider the information provided by the Adviser in connection with the renewal of the Agreement. Prior to the April 12, 2022 meeting, the Independent Directors conferred separately with their legal counsel and certain of the Independent Directors separately conferred with the Adviser regarding the Adviser's profitability analysis. After the April 12, 2022 meeting, the Independent Directors separately met again and conferred with their legal counsel to consider and evaluate the information provided by the Adviser.
The Board considered the information included in both the April 12, 2022 Board meeting materials and the materials presented at a Board meeting held on July 19, 2022 (the “Meeting”). The Adviser confirmed that it had provided all information reasonably necessary for the Board to evaluate the Agreement. At the Meeting, a discussion ensued relating to the advisory fee payable under the Agreement and the factors described in the memorandum prepared by Fund counsel included in the April 12, 2022 Board meeting materials. During the Meeting and the April 12, 2022 Board meeting, the Board, including the Independent Directors, evaluated those and other factors, acknowledging that not any single factor was controlling and not every factor was given the same weight by each director of the Fund, and reached the conclusions described below, among others.
Nature, Extent and Quality of Services. The Board considered the nature, extent and quality of services provided to the Fund by the Adviser under the Agreement. The Board reviewed the terms of the Agreement, as well as the history of the Adviser and its investment discipline, its investment performance, and its day-to-day management of the Fund. The Board noted the Adviser’s focus on the business of the Fund, the compliance and other servicing aspects of the Fund, and the Adviser’s oversight of the Fund’s service providers.
The Board considered the Adviser’s business continuity plan, its organizational and ownership structure and recent changes in ownership and the composition of its investment committee, which makes all investment decisions for the Fund, and the potential impact of changes in Adviser personnel
| | |
32 | The Jensen Quality Growth Fund Inc. | Semi-Annual Report |
and ownership on both the Fund and the Adviser. The Board also considered the Adviser’s approach to risk management. Based on these and other factors, including the additional factors described below, the Board concluded that the services provided to the Fund under the Agreement continued to be satisfactory.
Investment Performance. The Board examined the investment performance of the Fund compared to the S&P 500 Index and the Fund’s rankings and ratings in the Morningstar Large Cap Blend categories, respectively, for certain periods ending February 28, 2022. The Board noted the Fund’s outperformance (for Class I Shares) compared to its index for the one-year, five-year, ten-year and fifteen-year periods, and the Fund’s relative underperformance compared to its index for the three-year period. The Board noted that the Fund received an Analyst Rating of Silver from Morningstar, and that the Fund’s overall rating was five Stars (out of a possible five Stars) for all share classes. The Board observed that the Adviser appeared to have adhered to its strict investment discipline. Furthermore, the Board was informed by the Adviser that, during the last complete stock market cycle (starting with the peak of the last bull market (October 9, 2007) through February 19, 2020), the Class I Shares’ average annual return net of expenses was 10.02% compared to a return of 8.73% for the S&P 500 Index. In addition, since the end of the last economic cycle (February 19, 2020) through February 28, 2022, the Fund has appreciated by 34.37% outperforming the S&P 500 index by 0.97%, providing evidence that the full benefits of the Adviser’s investment discipline are realized over an entire stock market cycle and appear to have been generated with less volatility than the overall market. As a result of these and other factors, the Board concluded that the overall long-term investment performance of the Fund continued to be satisfactory.
Advisory Fee and Expense Ratio. The Board compared the Fund’s advisory fee with those of the funds in the Fund’s Large Cap Blend Morningstar category and a more-focused peer group of retail class shares and institutional class shares of actively managed funds in the Fund’s Morningstar category. The Board noted that the Fund’s blended advisory fee of 0.478% continued to be below the median and the average for its Morningstar category (large cap blend funds between $5 billion and $13 billion in assets), including actively managed retail class funds and actively managed institutional class funds. The Board also noted that, while the Adviser employs a relatively straightforward investment discipline, the Fund appeared to be an efficiently run operation with a high service component for shareholders.
The Board compared the fees charged to the Fund with the advisory fees charged to the non-Fund advisory clients of the Adviser. The Board observed that, with the exception of a small number of long-time institutional separate account clients and a collective investment fund, the Adviser typically charges its separate accounts a minimum annualized fee rate of (i) 1% of assets under management (“AUM”) for individual investors that includes breakpoints that decline to an annualized fee rate of 0.55%, and (ii) 0.55% of AUM for institutional investors that declines to an annualized fee rate of 0.45% of AUM on assets above $50 million. The Board also noted the limitations of such comparisons due to the different services required by separate account clients compared to the Fund. Separate accounts, the Board observed, may be smaller and require more personalized services, but they are subject to less regulation and generally do not require the same level of administrative support as the Fund.
| | |
Semi-Annual Report | The Jensen Quality Growth Fund Inc. | 33 |
The Board considered the Fund’s expense ratio and the expense ratios of other comparable mutual funds in the Fund’s Morningstar categories. The Fund’s expense ratio for the Class J Shares was below the average and median of such funds in the Morningstar category that included the same 25 basis point 12b-1 fee as the Fund. For the Fund’s Class I Shares, the Board observed that, although the expense ratio was slightly above the average and median when compared to the institutional funds in its Morningstar category, it was also noted that the group of comparable funds included in the expense ratio analysis included three funds with total expense ratios of 24, 22, and 16 basis points that impacted the average and median results.
The Board noted that the expense ratio for the Class J Shares had declined from 82 basis points in 2021 to 81 basis points in February 2022, principally due to the beneficial effect of breakpoints in the Fund’s advisory fee, the percentage decrease in sub-transfer agency fees and administrative services and custody fees paid by the Fund, and a relative decline in the Fund’s fixed costs as a percentage of Fund assets.
The Board also noted that the Fund had a relatively low turnover rate, reducing the Fund’s transaction costs, which are not included in the Fund’s expense ratio but are deducted from the Fund’s net asset value. Based on these considerations and other factors, the Board concluded that the Fund’s advisory fee and expense ratio were fair and reasonable relative to the Fund’s peer groups.
Profitability of the Adviser. The Board considered the profitability of the Agreement to the Adviser, including an analysis of the Adviser’s profitability for 2021 and the methodology used to calculate that profitability, and compared the Adviser’s profitability with respect to the Fund to that of publicly traded investment advisers. Including after adjustments for certain compensation and long-term deferred equity compensation expenses, it appeared that the Adviser’s pre-tax profit margin from the Fund was slightly higher than the median pre-tax profit margin of such other advisers on both a pre-marketing and post-marketing basis. It was noted that the Adviser’s adjustment to its compensation expense was made to account for differences between the Adviser’s compensation and incentive programs and those of publicly traded investment management firms.
The Board considered the fact that the Adviser pays certain administrative expenses of the Fund, including the cost of the Fund’s Chief Compliance Officer, though it noted that the Fund paid the Adviser (as approved by the Board) for a small portion of the CCO cost in 2021 under the terms of the Agreement permitting the Fund, with prior Board approval, to pay for certain costs of the Fund’s compliance personnel. The Board also considered the Adviser’s projected profitability for 2022 from the Fund using the same analysis and methodology used to assess the Adviser’s 2021 profitability and, subject to the limitations of estimates and projections, found no meaningful difference between 2021 profitability from the Fund and the profitability projected for 2022 from the Fund.
The Board also examined the Adviser’s profitability from the Fund against the Adviser’s profitability from its separate account advisory business and observed that the Fund provided a higher profit margin to the Adviser. The Board understood that the administrative services the Adviser provides to the Fund are, on balance, more extensive than those it provides to its separate accounts but also
| | |
34 | The Jensen Quality Growth Fund Inc. | Semi-Annual Report |
noted that efficiencies are realized when managing one mutual fund compared to managing multiple separate accounts. The Board also understood that, in calculating its profitability from the Fund, the Adviser had been conservative in its method of allocating expenses to its Fund business relative to other acceptable allocation methodologies.
The Board acknowledged the inherent limitations of profitability analyses, including the use of comparative data that is incomplete or dissimilar, such as financial information of publicly traded advisers that have more diversified business lines and different cost structures than those of the Adviser, the absence of profitability information on a fund-by-fund basis and for privately held investment advisers like the Adviser, and the uncertainty of the various cost allocations and other assumptions used. Based on this and other information, the Board concluded that the profits earned by the Adviser were not excessive.
Economies of Scale. The Board considered whether there have been economies of scale with respect to the management of the Fund, whether the Fund has benefited from any such economies, and whether the implementation of further breakpoints in the Fund’s advisory fee was appropriate. The Board observed that, during a period of rapid Fund growth, the Fund’s expense ratio (for the Class J shares) had declined from about 1% for the fiscal year ended May 31, 2002 to 0.81% for the fiscal year ended May 31, 2022, despite the addition of sub-transfer agency expenses beginning in 2010. Regarding breakpoints, the Board noted the Adviser’s implementation of a breakpoint fee schedule in October 2010. The Board also noted that many comparable funds with breakpoints at lower levels had higher overall advisory fees at the same asset level as the current asset level of the Fund. Using a sensitivity analysis, the Board compared and noted the effect on the Fund’s expense ratio from accelerating the Fund’s existing breakpoint fee schedule at varying asset levels above the Fund’s current asset level. Based on the data presented, the Board concluded that more accelerated or additional breakpoints in the Fund’s advisory fee were not warranted at this time.
Other Benefits. The Board considered the potential fall-out benefits realized by the Adviser from its services as investment manager of the Fund. The Board noted that the Adviser has no affiliated entities that provide services to the Fund and that the Adviser prohibits the receipt of third-party research paid for from additional commissions charged by brokers for Fund portfolio securities transactions, commonly known as “soft dollars”. The Board understood that the Adviser maintained a separate account advisory business and managed two other mutual funds and a collective investment fund. The Board noted that, while the Adviser’s non-Fund business might benefit from any favorable publicity received by the Fund, any such benefit was difficult to quantify.
Other Factors and Considerations. The Board periodically reviews and considers other material information throughout the year relating to the quality of services provided to the Fund, such as the allocation of Fund brokerage, the marketing, administration and compliance program of the Fund, the Adviser’s management of its relationship with the Fund’s administrator, custodian, transfer agent and other service providers, and the expenses paid to those service providers. At its regular meetings, the Board also reviews detailed information relating to the Fund’s portfolio and performance against various metrics and participates in discussions with the Fund’s portfolio managers.
| | |
Semi-Annual Report | The Jensen Quality Growth Fund Inc. | 35 |
Based on its evaluation of all the relevant factors and the information provided to it, the Board, including all of the Independent Directors, voted unanimously on July 19, 2022 to renew the Agreement for a one-year period until July 31, 2023.
2. Shareholder Notification of Federal Tax Status
The Fund designates 100% of dividends declared during the fiscal year ended May 31, 2022 as dividends qualifying for the dividends received deduction available to corporate shareholders.
The Fund designates 100% of dividends declared from net investment income during the fiscal year ended May 31, 2022 as qualified dividend income under the Jobs and Growth Tax Relief Reconciliation Act of 2003.
The Fund designates as a long-term capital gain dividend, pursuant to the Internal Revenue Code Section 852(b)(3), the amount necessary to reduce earnings and profits of the Fund related to net capital gain to zero for the fiscal year ended May 31, 2022.
Additional Information Applicable to Foreign Shareholders Only:
The Fund designates 0.09% of ordinary income distributions as interest-related dividends under Internal Revenue Code Section 871(k)(1)(c).
The Fund designates 6.10% of ordinary income distributions as short-term capital gain distributions under Internal Revenue Section 871(k)(2)(c).
3. Availability of Proxy Voting Information
Information regarding how the Fund votes proxies relating to portfolio securities is available without charge, upon request by calling toll-free, 1-800-221-4384, or by accessing the SEC’s website at www.sec.gov.
The Fund will file its complete schedule of portfolio holdings with the SEC for the first and third quarters of each fiscal year on Part F of Form N-PORT. The Fund’s Part F of Form N-PORT will be available on the EDGAR database on the SEC’s website at www.sec.gov. These Forms may also be reviewed and copied at the SEC’s Public Reference Room in Washington D.C. Information about the operation of the Public Reference Room may be obtained by calling 1-800-SEC-0330. Quarterly portfolio holdings are also available on the website for Jensen Quality Growth Fund, www.JensenInvestment.com.
| | |
36 | The Jensen Quality Growth Fund Inc. | Semi-Annual Report |
5. Additional Disclosure Regarding Fund Directors and Officers
| | | | | |
| Position(s)
Held with
the Fund | Term of Office
and Length of
Time Served** | Principal Occupation During
Past Five Years | # of
Portfolios
in Fund
Complex
Overseen
by Director | Other
Directorships
Held by Director
During the Past
Five Years |
Roger A. Cooke
The Jensen Quality
Growth Fund Inc.
5500 Meadows Road
Suite 200
Lake Oswego, OR 97035
Year of Birth: 1948 | | Indefinite Term; since June 1999. | Retired. Senior Vice President, General Counsel and Secretary of Precision Castparts Corp., a diversified manufacturer of complex metal products, (2000 – 2013); Executive Vice President – Regulatory and Legal Affairs of Fred Meyer, Inc. (now a division of Kroger), a retail grocery and general merchandise company (1992 – 2000). | | |
Kenneth Thrasher
The Jensen Quality
Growth Fund Inc.
5500 Meadows Road
Suite 200
Lake Oswego, OR 97035
Year of Birth: 1949 | Chairperson and Independent Director | Indefinite Term; since July 2007 and Chairman since July 2022. | Retired. Chairman (2002 – 2018) and CEO (2002 – 2009) of Complí, a web-based compliance and risk management software solution company; President and CEO of Fred Meyer, Inc. (now a division of Kroger), a retail grocery and general merchandise company, from 1999-2001, and other executive positions at Fred Meyer, Inc., including EVP and Chief Administrations Officer and SVP and Chief Financial Officer, from 1982-1999. | | Northwest Natural Holding and Northwest Natural Gas Company (a natural gas distribution and service provider). |
Janet G. Hamilton,
PhD, CFA
The Jensen Quality
Growth Fund Inc.
5500 Meadows Road
Suite 200
Lake Oswego, OR 97035
Year of Birth: 1955 | | Indefinite Term; since October 2016. | Associate Professor, Finance, Portland State University’s School of Business (1986 – present) and Area Director (2016-present). | | |
Kathleen J. Kee,
CFP
The Jensen Quality
Growth Fund Inc.
5500 Meadows Road
Suite 200
Lake Oswego, OR 97035
Year of Birth: 1961 | | Indefinite Term; since October 2021. | Senior Wealth Advisor, Buckingham Strategic Wealth (2020 – present); Chief Executive Officer, Confluence Wealth Management LLC (2011 – 2020) | | |
| | |
Semi-Annual Report | The Jensen Quality Growth Fund Inc. | 37 |
| | | | | |
| Position(s)
Held with
the Fund | Term of Office
and Length of
Time Served** | Principal Occupation During
Past Five Years | # of
Portfolios
in Fund
Complex
Overseen
by Director | Other
Directorships
Held by Director
During the Past
Five Years |
Robert D. McIver*
Jensen Investment
Management, Inc.
5500 Meadows Road
Suite 200
Lake Oswego, OR 97035
Year of Birth: 1965 | | Indefinite Term; since July 2015; 1 Year Term as President of the Fund; Served as President since February 2007. | Director (since July 2015) of the Fund; President and Director (February 2007 – present) and Director of Operations (2004 – February 2007) of Jensen Investment Management, Inc. | | Jensen Investment Management, Inc. (since February 2007) |
| | |
38 | The Jensen Quality Growth Fund Inc. | Semi-Annual Report |
| | | | | |
| Position(s)
Held with
the Fund | Term of Office
and Length of
Time Served** | Principal Occupation During
Past Five Years | # of
Portfolios
in Fund
Complex
Overseen
by Director | Other
Directorships
Held by Director
During the Past
Five Years |
Robert D. McIver*
SEE ABOVE | | | | | |
Eric H. Schoenstein*
Jensen Investment
Management, Inc.
5500 Meadows Road
Suite 200 Lake
Oswego, OR 97035
Year of Birth: 1965 | | 1 Year Term; Served since January 2011. | Chief Investment Officer and Portfolio Manager (since 2021); and Director and Vice President of Business Analysis (2002-2021) for Jensen Investment Management, Inc. | | Trustee of the Oregon State University Foundation (2008-present) |
Richard W. Clark***
Jensen Investment
Management, Inc.
5500 Meadows Road
Suite 200 Lake
Oswego, OR 97035
Year of Birth: 1969 | | 1 Year Term; Served since April 2017. | Director - Business Development (since August 2022), Director - Sales and Marketing for Jensen Investment Management, Inc. (2001-2022). | | |
Shannon Contreras*
Jensen Investment
Management, Inc.
5500 Meadows
Road Suite 200 Lake
Oswego,
OR 97035
Year of Birth: 1973 | Treasurer and Vice President | 1 Year Term; Served since February 2020. | Director (since 2022), Director of Finance and Treasurer (February 2020 - present), Senior Compliance Officer and Associate - Finance (October 2014 - February 2020) of Jensen Investment Management, Inc. | | |
Gabriel L. Goddard*
Jensen Investment
Management, Inc.
5500 Meadows Road
Suite 200 Lake
Oswego, OR 97035
Year of Birth: 1972 | Chief Compliance Officer and AML Officer; Vice President and Secretary | 1 Year Term; Served since January 2018 (as Vice President and Secretary) and since February 2020 as Chief Compliance Officer and AML Officer. | Vice President and Secretary (January 2018-present), Secretary, General Counsel, Chief Compliance Officer (2012-present), and Director (2017-present) of Jensen Investment Management, Inc. | | |
| | | |
| This individual is an “interested person” of the Fund within the meaning of the 1940 Act because they also serve as an officer of the Investment Adviser and own securities of the Investment Adviser. |
| Each Director serves for an indefinite term in accordance with the Bylaws of the Fund until the date a Director dies, resigns, retires or is removed in accordance with the Bylaws of the Fund. |
| This individual is an “interested person” of the Fund within the meaning of the 1940 Act because they own securities of the Adviser. |
| | |
Semi-Annual Report | The Jensen Quality Growth Fund Inc. | 39 |
Notice of Privacy Policy (Unaudited)
The Jensen Quality Growth Fund Inc. (the “Fund”) has had a long-standing policy of maintaining strict confidentiality over customer information. The Fund’s policy is as follows:
Confidentiality and Security
All nonpublic personal information about our customers (“you”) will be kept strictly confidential. We maintain physical, electronic and operational safeguards to protect customer nonpublic personal information.
Categories of information the Fund discloses and parties to whom the Fund discloses that information:
The Fund does not disclose any nonpublic personal information about its current or former shareholders to nonaffiliated third parties without the shareholder’s authorization, except as permitted or required by law. For example, the Fund is permitted by law to disclose all of the information it collects, as described below, to its Transfer Agent to process your transactions. The Fund is also permitted by law (and may be required by law) to disclose any nonpublic personal information it collects from you to law enforcement agencies, the Securities and Exchange Commission, and other federal and state regulatory authorities.
Categories of information the Fund collects:
The Fund collects nonpublic personal information about you from the following sources:
•
Information the Fund receives from you on or in applications or other forms, correspondence, or conversations, including, but not limited to, your name, address, telephone number, social security number, and date of birth; and
•
Information about your transactions with the Fund, its affiliates, or others, including, but not limited to, your account number and balance, investment history, parties to transactions, and information about our communications with you, such as account statements and trade confirmations.
•
In the event that you hold shares of the Fund through a financial intermediary, including, but not limited to, a broker-dealer, bank, or trust company, the privacy policy of your financial intermediary will govern how your nonpublic personal information would be shared with nonaffiliated third parties.
| | |
40 | The Jensen Quality Growth Fund Inc. | Semi-Annual Report |
| | | |
|
Jensen Quality Growth Fund Inc. |
| | | |
|
Investment Adviser
Jensen Investment Management, Inc.
5500 Meadows Road, Suite 200
Lake Oswego, OR 97035
800.992.4144 Fund Administrator, Transfer Agent and Fund Accountant
U.S. Bancorp Fund Services, LLC doing business as
U.S. Bank Global Fund Services
615 East Michigan Street
Milwaukee, WI 53202 Custodian
U.S. Bank, N.A.
Custody Operations
1555 North River Center Drive, Suite 302
Milwaukee, WI 53212 Legal Counsel
Stoel Rives LLP
760 SW Ninth Avenue, Suite 3000
Portland, OR 97205 Independent Registered Public Accounting Firm
Cohen & Company, Ltd.
342 North Water Street, Suite 830
Milwaukee, WI 53202 Distributor
Quasar Distributors, LLC
111 East Kilborn Avenue, Suite 2200
Milwaukee, WI 53202 |
This report has been prepared for shareholders and may be distributed to others only if preceded or accompanied by a current prospectus. |
Item 2. Code of Ethics.
Not applicate for Semi-Annual Reports
Item 3. Audit Committee Financial Expert.
Not applicate for Semi-Annual Reports
Item 4. Principal Accountant Fees and Services.
Not applicate for Semi-Annual Reports
Item 5. Audit Committee of Listed Registrants.
Not applicable to registrants who are not listed issuers (as defined in Rule 10A-3 under the Securities Exchange Act of 1934).
Item 6. Investments.
| (a) | Schedule of Investments is included as part of the report to shareholders filed under Item 1 of this Form. |
Item 7. Disclosure of Proxy Voting Policies and Procedures for Closed-End Management Investment Companies.
Not applicable to open-end investment companies.
Item 8. Portfolio Managers of Closed-End Management Investment Companies.
Not applicable to open-end investment companies.
Item 9. Purchases of Equity Securities by Closed-End Management Investment Company and Affiliated Purchasers.
Not applicable to open-end investment companies.
1
Item 10. Submission of Matters to a Vote of Security Holders.
There have been no material changes to the procedures by which shareholders may recommend nominees to the registrant’s board of directors.
Item 11. Controls and Procedures.
| (a) | The Registrant’s President and Treasurer have reviewed the Registrant’s disclosure controls and procedures (as defined in Rule 30a-3(c) under the Investment Company Act of 1940 (the “Act”)) as of a date within 90 days of the filing of this report, as required by Rule 30a-3(b) under the Act and Rules 13a-15(b) or 15d-15(b) under the Securities Exchange Act of 1934. Based on their review, such officers have concluded that the disclosure controls and procedures are effective in ensuring that information required to be disclosed in this report is appropriately recorded, processed, summarized and reported and made known to them by others within the Registrant and by the Registrant’s service provider. |
| (b) | There were no changes in the Registrant’s internal control over financial reporting (as defined in Rule 30a-3(d) under the Act) that occurred during the second fiscal quarter of the period covered by this report that have materially affected, or are reasonably likely to materially affect, the Registrant’s internal control over financial reporting. |
Item 12. Disclosure of Securities Lending Activities for Closed-End Management Investment Companies
Not applicable to open-end investment companies.
Item 13. Exhibits.
| (a) | (1) Any code of ethics or amendment thereto, that is the subject of the disclosure required by Item 2, to the extent that the registrant intends to satisfy Item 2 requirements through filing an exhibit. 1) Not Applicable |
(2) A separate certification for each principal executive officer and principal financial officer pursuant to Section 302 of the Sarbanes-Oxley Act of 2002. Filed herewith.
(3) Any written solicitation to purchase securities under Rule 23c-1 under the Act sent or given during the period covered by the report by or on behalf of the registrant to 10 or more persons. Not applicable to open-end investment companies.
2
SIGNATURES
Pursuant to the requirements of the Securities Exchange Act of 1934 and the Investment Company Act of 1940, the registrant has duly caused this report to be signed on its behalf by the undersigned, thereunto duly authorized.
| | Registrant) The Jensen Quality Growth Fund Inc. |
| | | |
| | By (Signature and Title)* | /s/ Robert McIver |
| | | Robert McIver, President |
| | | |
Pursuant to the requirements of the Securities Exchange Act of 1934 and the Investment Company Act of 1940, this report has been signed below by the following persons on behalf of the registrant and in the capacities and on the dates indicated.
| | By (Signature and Title)* | /s/ Robert McIver |
| | | Robert McIver, President |
| | | |
| | By (Signature and Title)* | /s/ Shannon Contreras |
| | | Shannon Contreras, Treasurer |
| | | |
* Print the name and title of each signing officer under his or her signature.
3