UNITED STATES
SECURITIES AND EXCHANGE COMMISSION
Washington, D.C. 20549
Form N-CSR
CERTIFIED SHAREHOLDER REPORT OF REGISTERED MANAGEMENT
INVESTMENT COMPANIES
Investment Company Act File Number 811-03833
MAINSTAY VP FUNDS TRUST
(Exact name of Registrant as specified in charter)
51 Madison Avenue, New York, NY 10010
(Address of principal executive offices) (Zip code)
J. Kevin Gao, Esq.
30 Hudson Street
Jersey City, New Jersey 07302
(Name and address of agent for service)
Registrant’s telephone number, including area code: (212) 576-7000
Date of fiscal year end: December 31
Date of reporting period: June 30, 2017
Item 1. Reports to Stockholders.
MainStay VP Cornerstone Growth Portfolio
Message from the President and Semiannual Report
Unaudited | June 30, 2017

Sign up for electronic delivery of your shareholder reports. For full details on electronic delivery, including who can participate and what you
can receive via eDelivery, please log on to www.newyorklife.com/vsc

This page intentionally left blank
Message from the President
The six months ended June 30, 2017, brought positive results to many stock and bond investors. The year began with many investors hoping that Republican control of the White House, the Senate and the House of Representatives could bring an end to political gridlock; and while debate has continued on a number of issues, the U.S. stock market climbed relatively steadily throughout the first half of 2017.
According to FTSE-Russell U.S. market data, stocks at all capitalization levels tended to record positive total returns during the reporting period, with large-cap stocks generally outperforming stocks of smaller-capitalization companies. Growth stocks outpaced value stocks at every capitalization level by substantial margins—from more than six percentage points for micro-caps and mid-caps to more than 10 percentage points for the largest 200 U.S. companies by market capitalization.
Most sectors of the stock market advanced during the reporting period, with energy and telecommunication services being notable exceptions. Energy stocks declined as oil prices fell despite moves by the Organization of Petroleum Exporting Countries (OPEC) intended to limit oil production by its members. Telecommunication services stocks tended to decline as competition increased and rising interest rates made dividend payouts less appealing.
In March and June of 2017, the Federal Reserve announced successive increases in the target range for the federal funds rate, ultimately bringing the federal funds target range to 1.00% to 1.25%. While short-term U.S. Treasury yields rose in response, yields for U.S. Treasury securities with maturities of five years or longer declined. As the difference between short- and long-term yields narrowed, the advantages of higher-yielding long-term bonds became increasingly apparent.
Virtually all taxable and tax-exempt bond sectors provided positive total returns during the reporting period. Mortgage-backed
securities, though providing positive total returns, faced headwinds when the Federal Reserve announced plans to begin normalizing its balance sheet by reducing reinvestment of principal payments on mortgage-backed securities.
International stock and bond markets were also strong during the reporting period. International stocks provided double-digit total returns that were surpassed by emerging-market stocks as a whole. Global investment-grade bonds provided single-digit returns; and emerging-market debt was somewhat stronger.
Even during periods of favorable market performance and generally positive returns, MainStay believes that it is important to carefully monitor your investments. Your risk tolerance may
change over time, leading you to reevaluate which MainStay VP Portfolios are most appropriate for your long-term goals. Your goals themselves may also change, leading you to pursue investments with more or less risk. The portfolio managers of MainStay VP Portfolios seek to provide results consistent with the investment objectives of their respective Portfolios, to give you a wide range of choices suitable to various investment needs.
The report that follows provides more detailed information about the specific markets, securities and investment decisions that influenced your MainStay VP Portfolio during the six months ended June 30, 2017. We invite you to review the report carefully as part of your ongoing investment evaluation and review.
Sincerely,

Stephen P. Fisher
President
The opinions expressed are as of the date of the accompanying report and are subject to change. Past performance is no guarantee of future results. There is no guarantee that any forecasts made will come to pass. This material does not constitute investment advice and is not intended as an endorsement of any specific investment.
Not all MainStay VP Portfolios and/or share classes are available under all policies.
Not part of the Semiannual Report
Table of Contents
Investors should refer to the Portfolio’s Summary Prospectus and/or Prospectus and consider the Portfolio’s investment objectives, strategies, risks, charges and expenses carefully before investing. The Summary Prospectus and/or Prospectus contain this and other information about the Portfolio. You may obtain copies of the Portfolio’s Summary Prospectus and/or the Prospectus and the Statement of Additional Information free of charge, upon request, by calling toll-free 800-598-2019, by writing to New York Life Insurance and Annuity Corporation, 51 Madison Avenue, Room 251, New York, New York 10010 or by sending an email to MainStayShareholdersServices@nylim.com. These documents are also available at mainstayinvestments.com/vpdocuments. Please read the Summary Prospectus and/or Prospectus carefully before investing. MainStay VP Funds Trust portfolios are separate account options which are purchased through a variable insurance or variable annuity contract.
Investment and Performance Comparison (Unaudited)
Performance data quoted represents past performance. Past performance is no guarantee of future results. Because of market volatility and other factors, current performance may be lower or higher than the figures shown. Investment return and principal value will fluctuate, and as a result, when shares are redeemed, they may be worth more or less than their original cost. The performance table and graph do not reflect any deduction of sales charges, mortality and expense charges, contract charges or administrative charges. Please refer to the Performance Summary appropriate for your policy. For performance information current to the most recent month-end, please call 800-598-2019 or visit www.newyorklife.com.
Average Annual Total Returns for the Period Ended June 30, 2017
| | | | | | | | | | | | | | | | | | | | | | |
| Class | | Inception Date | | Six Months | | | One Year | | | Five Years | | | Ten Years | | | Gross
Expense
Ratio1 | |
| Initial Class Shares | | 1/29/1993 | | | 12.44 | % | | | 18.81 | % | | | 10.46 | % | | | 5.19 | % | | | 0.77 | % |
| Service Class Shares | | 6/5/2003 | | | 12.30 | | | | 18.51 | | | | 10.18 | | | | 4.92 | | | | 1.02 | |
| | | | | | | | | | | | | | | | |
| Benchmark Performance | | Six
Months | | | One
Year | | | Five
Years | | | Ten
Years | |
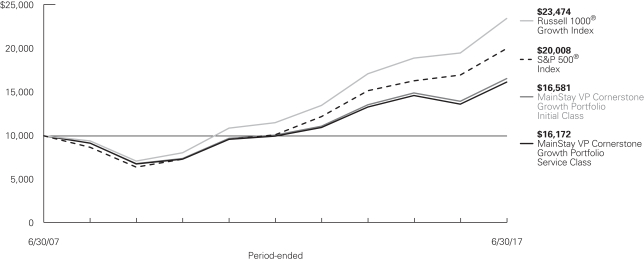
Russell 1000® Growth Index2 | | | 13.99 | % | | | 20.42 | % | | | 15.30 | % | | | 8.91 | % |
S&P 500® Index3 | | | 9.34 | | | | 17.90 | | | | 14.63 | | | | 7.18 | |
Average Lipper Variable Products Multi-Cap Growth Portfolio4 | | | 15.32 | | | | 20.16 | | | | 13.39 | | | | 7.49 | |
| 1. | The gross expense ratios presented reflect the Portfolio’s “Total Annual Portfolio Operating Expenses” from the most recent Prospectus and may differ from other expense ratios disclosed in this report. |
| 2. | The Russell 1000® Growth Index is the Portfolio’s primary broad-based securities market index for comparison purposes. The Russell 1000® Growth Index measures the performance of the large-cap growth segment of the U.S. equity universe. It includes those Russell 1000® Index companies with higher price-to-book ratios and higher forecasted growth values. Results assume reinvestment of all dividends and capital gains. An investment cannot be made directly in an index. |
| 3. | The S&P 500® Index is the Portfolio’s secondary benchmark. “S&P 500®” is a trademark of The McGraw-Hill Companies, Inc. The S&P 500® Index is |
| | widely regarded as the standard index for measuring large-cap U.S. stock market performance. Results assume reinvestment of all dividends and capital gains. An investment cannot be made directly in an index. |
| 4. | The Average Lipper Variable Products Multi-Cap Growth Portfolio is representative of portfolios that, by portfolio practice, invest in a variety of market capitalization ranges without concentrating 75% of their equity assets in any one market capitalization range over an extended period of time. Multi-cap growth portfolios typically have above-average characteristics compared to the S&P SuperComposite 1500 Index. This benchmark is a product of Lipper Inc. Lipper Inc. is an independent monitor of fund performance. Results are based on average total returns of similar portfolios with all dividend and capital gain distributions reinvested. |
Cost in Dollars of a $1,000 Investment in MainStay VP Cornerstone Growth Portfolio (Unaudited)
The example below is intended to describe the fees and expenses borne by shareholders during the six-month period from January 1, 2017 to June 30, 2017, and the impact of those costs on your investment.
Example
As a shareholder of the Portfolio, you incur two types of costs: (1) transaction costs, including exchange fees and sales charges (loads) on purchases (as applicable), and (2) ongoing costs, including management fees, distribution and/or service (12b-1) fees, and other Portfolio expenses (as applicable). This example is intended to help you understand your ongoing costs (in dollars) of investing in the Portfolio and to compare these costs with the ongoing costs of investing in other mutual funds. The example is based on an investment of $1,000 made at the beginning of the six-month period and held for the entire period from January 1, 2017 to June 30, 2017.
This example illustrates your Portfolio’s ongoing costs in two ways:
Actual Expenses
The second and third data columns in the table below provide information about actual account values and actual expenses. You may use the information in these columns, together with the amount you invested, to estimate the expenses that you paid during the six months ended June 30, 2017. Simply divide your account value by $1,000 (for example, an $8,600 account value divided by $1,000 = 8.6), then
multiply the result by the number under the heading entitled “Expenses Paid During Period” to estimate the expenses you paid on your account during this period.
Hypothetical Example for Comparison Purposes
The fourth and fifth data columns in the table below provide information about hypothetical account values and hypothetical expenses based on the Portfolio’s actual expense ratio and an assumed rate of return of 5% per year before expenses, which is not the Portfolio’s actual return. The hypothetical account values and expenses may not be used to estimate the actual ending account balances or expenses you paid for the six-month period shown. You may use this information to compare the ongoing costs of investing in the Portfolio with the ongoing costs of investing in other mutual funds. To do so, compare this 5% hypothetical example with the 5% hypothetical examples that appear in the shareholder reports of the other mutual funds.
Please note that the expenses shown in the table are meant to highlight your ongoing costs only and do not reflect any transactional costs, such as exchange fees or sales charges (loads). Therefore, the fourth and fifth data columns of the table are useful in comparing ongoing costs only and will not help you determine the relative total costs of owning different funds. In addition, if these transactional costs were included, your costs would have been higher.
| | | | | | | | | | | | | | | | | | | | | | | | |
| | | | | | | | | | | | | | | | | | | |
| Share Class | | Beginning
Account
Value
1/1/17 | | | Ending Account
Value (Based
on Actual
Returns and
Expenses)
6/30/17 | | | Expenses
Paid
During
Period1 | | | Ending Account
Value (Based
on Hypothetical
5% Annualized
Return and
Actual Expenses)
6/30/17 | | | Expenses
Paid
During
Period1 | | | Net Expense
Ratio
During
Period2 | |
| | | | | | |
| Initial Class Shares | | $ | 1,000.00 | | | $ | 1,124.40 | | | $ | 3.95 | | | $ | 1,021.10 | | | $ | 3.76 | | | | 0.75 | % |
| | | | | | |
| Service Class Shares | | $ | 1,000.00 | | | $ | 1,123.00 | | | $ | 5.26 | | | $ | 1,019.80 | | | $ | 5.01 | | | | 1.00 | % |
| 1. | Expenses are equal to the Portfolio’s annualized expense ratio of each class multiplied by the average account value over the period, divided by 365 and multiplied by 181 (to reflect the six-month period). The table above represents the actual expenses incurred during the six-month period. |
| 2. | Expenses are equal to the Portfolio’s annualized expense ratio to reflect the six-month period. |
| | |
| 6 | | MainStay VP Cornerstone Growth Portfolio |
Industry Composition as of June 30, 2017 (Unaudited)
| | | | |
| Internet Software & Services | | | 9.0 | % |
| Technology Hardware, Storage & Peripherals | | | 8.0 | |
| Software | | | 7.7 | |
| Health Care Providers & Services | | | 6.4 | |
| Hotels, Restaurants & Leisure | | | 6.0 | |
| Biotechnology | | | 5.7 | |
| Internet & Direct Marketing Retail | | | 5.6 | |
| Semiconductors & Semiconductor Equipment | | | 5.4 | |
| IT Services | | | 5.2 | |
| Specialty Retail | | | 4.5 | |
| Media | | | 3.7 | |
| Equity Real Estate Investment Trusts (REITs) | | | 2.7 | |
| Tobacco | | | 2.5 | |
| Aerospace & Defense | | | 2.4 | |
| Beverages | | | 2.0 | |
| Capital Markets | | | 2.0 | |
| Industrial Conglomerates | | | 1.8 | |
| Health Care Equipment & Supplies | | | 1.6 | |
| Machinery | | | 1.5 | |
| Electronic Equipment, Instruments & Components | | | 1.4 | |
| Airlines | | | 1.2 | |
| Chemicals | | | 1.2 | |
| Food Products | | | 1.1 | |
| Insurance | | | 1.1 | |
| Containers & Packaging | | | 1.0 | |
| | | | |
| Banks | | | 0.9 | % |
| Household Durables | | | 0.9 | |
| Diversified Consumer Services | | | 0.6 | |
| Diversified Telecommunication Services | | | 0.6 | |
| Life Sciences Tools & Services | | | 0.6 | |
| Professional Services | | | 0.6 | |
| Textiles, Apparel & Luxury Goods | | | 0.6 | |
| Trading Companies & Distributors | | | 0.6 | |
| Oil, Gas & Consumable Fuels | | | 0.5 | |
| Pharmaceuticals | | | 0.5 | |
| Air Freight & Logistics | | | 0.4 | |
| Automobiles | | | 0.4 | |
| Commercial Services & Supplies | | | 0.4 | |
| Wireless Telecommunication Services | | | 0.4 | |
| Communications Equipment | | | 0.3 | |
| Health Care Technology | | | 0.3 | |
| Household Products | | | 0.3 | |
| Auto Components | | | 0.2 | |
| Food & Staples Retailing | | | 0.1 | |
| Road & Rail | | | 0.1 | |
| Personal Products | | | 0.0 | ‡ |
| Short-Term Investment | | | 0.0 | ‡ |
| Other Assets, Less Liabilities | | | 0.0 | ‡ |
| | | | |
| | | 100.0 | % |
| | | | |
See Portfolio of Investments beginning on page 10 for specific holdings within these categories.
| ‡ | Less than one-tenth of a percent. |
Top Ten Holdings as of June 30, 2017 (excluding short-term investment) (Unaudited)
| 7. | UnitedHealth Group, Inc. |
Portfolio Management Discussion and Analysis (Unaudited)
Answers to the questions reflect the views of Andrew Ver Planck, CFA, and Migene Kim, CFA, of Cornerstone Capital Management Holdings LLC, the Portfolio’s subadvisor.
How did MainStay VP Cornerstone Growth Portfolio perform relative to its benchmarks and peers during the six months ended June 30, 2017?
For the six months ended June 30, 2017, MainStay VP Cornerstone Growth Portfolio returned 12.44% for Initial Class shares and 12.30% for Service Class shares. Over the same period, both share classes underperformed the 13.99% return of the Russell 1000® Growth Index,1 which is the Portfolio’s primary benchmark. Over the same period, both share classes outperformed the 9.34% return of the S&P 500® Index,1 which is a secondary benchmark of the Portfolio. Both share classes underperformed the 15.32% return of the Average Lipper2 Variable Products Multi-Cap Growth Portfolio for the six months ended June 30, 2017.
What factors affected the Portfolio’s relative performance during the reporting period?
Stock selection detracted from the Portfolio’s performance relative to the Russell 1000® Growth Index during the reporting period. Allocation effects—being overweight or underweight specific sectors as a result of the Portfolio’s bottom-up stock selection process—had a modestly negative impact on relative performance during the reporting period.
Which sectors were the strongest positive contributors to the Portfolio’s relative performance, and which sectors were particularly weak?
During the reporting period, the industrials, consumer discretionary and telecommunication services sectors made the strongest positive contributions to the Portfolio’s performance relative to the Russell 1000® Growth Index. (Contributions take weightings and total returns into account.) The contributions in these sectors were driven by favorable stock selection.
The weakest sector contributions to the Portfolio’s relative performance came from the health care, materials and energy sectors. Unfavorable stock selection detracted in health care and materials. An overweight position in the underperforming energy sector—and an underweight position in the outperforming health care sector—also detracted from the Portfolio’s relative performance.
During the reporting period, which individual stocks made the strongest positive contributions to the Portfolio’s absolute performance and which stocks detracted the most?
During the reporting period, the strongest positive contributor to absolute performance was technology company Apple. Best known for its iPhone, the company continued to deliver strong sales and earnings growth. E-commerce company Amazon.com also performed well, led by strong growth in its online retail platform and its web services business. The Portfolio’s position in social media company Facebook delivered strong absolute performance, aided by strong user adoption of the company’s platform and strong trends in advertising revenue.
On an absolute basis, the Portfolio’s weakest stock performer was steel producer United States Steel, which declined after reporting operating results well below expectations on continued weakness and supply concerns within the commodity segment. Akamai Technologies was another Portfolio holding that was weak on an absolute basis. The company optimizes and secures content and business applications over the Internet, and its stock fell on declining trends in the media segment of Akamai Technologies’ business. Brinker International, an owner and operator of casual-dining restaurants such as the Chili’s franchise, was also weak. The stock came under pressure because of slowing sales.
Did the Portfolio make any significant purchases or sales during the reporting period?
The Portfolio entered into new positions in health care distribution company McKesson and tobacco company Phillip Morris International, moving the Portfolio to overweight positions relative to the Russell 1000® Growth Index in these stocks. We believed that McKesson had exhibited attractive cash flow–based valuation and improving price and earnings trends. We believed that Phillip Morris International had maintained a reasonable valuation perspective and that the company had also exhibited strong earnings trends.
The Portfolio exited positions in defense contractor Northrop Grumman and in food services company Sysco. The Portfolio sold its position in Northrop Grumman because of what we considered to be an expensive valuation and a lack of earnings growth potential. Sysco was sold mainly because of poor cash flows and deteriorating industry trends.
How did the Portfolio’s sector weightings change during the reporting period?
During the reporting period, the Portfolio modestly increased its weightings relative to the Russell 1000® Growth Index in health care and real estate. Over the same period, the Portfolio
| 1. | See footnote on page 5 for more information on this index. |
| 2. | See footnote on page 5 for more information on Lipper Inc. |
| | |
| 8 | | MainStay VP Cornerstone Growth Portfolio |
modestly reduced its weightings relative to the Index in information technology and energy.
How was the Portfolio positioned at the end of the reporting period?
As of June 30, 2017, the Portfolio held modestly overweight positions relative to the Russell 1000® Growth Index in the consumer discretionary and health care sectors. As of the same date, the Portfolio held modestly underweight positions relative to the Index in industrials and materials.
The opinions expressed are those of the portfolio managers as of the date of this report and are subject to change. There is no guarantee that any forecasts made will come to pass. This material does not constitute investment advice and is not intended as an endorsement of any specific investment.
Not all MainStay VP Portfolios and/or share classes are available under all policies.
Portfolio of Investments June 30, 2017 (Unaudited)
| | | | | | | | |
| | |
Shares | | | Value | |
| Common Stocks 99.4%† | |
Aerospace & Defense 2.4% | |
Boeing Co. | | | 37,090 | | | $ | 7,334,548 | |
Lockheed Martin Corp. | | | 9,835 | | | | 2,730,294 | |
Spirit AeroSystems Holdings, Inc. Class A | | | 25,861 | | | | 1,498,386 | |
| | | | | | | | |
| | | | | | | 11,563,228 | |
| | | | | | | | |
Air Freight & Logistics 0.4% | |
United Parcel Service, Inc. Class B | | | 3,762 | | | | 416,039 | |
XPO Logistics, Inc. (a) | | | 21,598 | | | | 1,395,879 | |
| | | | | | | | |
| | | | | | | 1,811,918 | |
| | | | | | | | |
Airlines 1.2% | |
Copa Holdings S.A. Class A | | | 10,932 | | | | 1,279,044 | |
Southwest Airlines Co. | | | 67,439 | | | | 4,190,659 | |
| | | | | | | | |
| | | | | | | 5,469,703 | |
| | | | | | | | |
Auto Components 0.2% | |
Lear Corp. | | | 7,802 | | | | 1,108,508 | |
| | | | | | | | |
|
Automobiles 0.4% | |
Tesla, Inc. (a) | | | 4,979 | | | | 1,800,456 | |
| | | | | | | | |
|
Banks 0.3% | |
Bank of America Corp. | | | 28,423 | | | | 689,542 | |
First Hawaiian, Inc. | | | 6,880 | | | | 210,666 | |
JPMorgan Chase & Co. | | | 4,569 | | | | 417,606 | |
| | | | | | | | |
| | | | | | | 1,317,814 | |
| | | | | | | | |
Beverages 2.0% | | | | | | | | |
Coca-Cola Co. | | | 59,133 | | | | 2,652,115 | |
Constellation Brands, Inc. Class A | | | 9,659 | | | | 1,871,238 | |
PepsiCo., Inc. | | | 41,461 | | | | 4,788,331 | |
| | | | | | | | |
| | | | | | | 9,311,684 | |
| | | | | | | | |
Biotechnology 5.7% | | | | | | | | |
¨AbbVie, Inc. | | | 102,506 | | | | 7,432,710 | |
Amgen, Inc. | | | 35,484 | | | | 6,111,409 | |
Biogen, Inc. (a) | | | 8,268 | | | | 2,243,605 | |
Celgene Corp. (a) | | | 27,524 | | | | 3,574,542 | |
Gilead Sciences, Inc. | | | 84,844 | | | | 6,005,258 | |
United Therapeutics Corp. (a) | | | 10,440 | | | | 1,354,381 | |
| | | | | | | | |
| | | | | | | 26,721,905 | |
| | | | | | | | |
Capital Markets 2.0% | | | | | | | | |
Lazard, Ltd. Class A | | | 56,628 | | | | 2,623,575 | |
LPL Financial Holdings, Inc. | | | 63,599 | | | | 2,700,414 | |
S&P Global, Inc. | | | 28,715 | | | | 4,192,103 | |
| | | | | | | | |
| | | | | | | 9,516,092 | |
| | | | | | | | |
Chemicals 1.2% | | | | | | | | |
Chemours Co. | | | 36,494 | | | | 1,383,852 | |
E.I. du Pont de Nemours & Co. | | | 20,196 | | | | 1,630,019 | |
| | | | | | | | |
| | |
Shares | | | Value | |
Chemicals (continued) | | | | | | | | |
Huntsman Corp. | | | 51,602 | | | $ | 1,333,396 | |
Olin Corp. | | | 41,335 | | | | 1,251,624 | |
| | | | | | | | |
| | | | | | | 5,598,891 | |
| | | | | | | | |
Commercial Services & Supplies 0.4% | | | | | | | | |
Pitney Bowes, Inc. | | | 112,278 | | | | 1,695,398 | |
| | | | | | | | |
| | |
Communications Equipment 0.3% | | | | | | | | |
F5 Networks, Inc. (a) | | | 10,113 | | | | 1,284,958 | |
| | | | | | | | |
| | |
Containers & Packaging 1.0% | | | | | | | | |
Berry Plastics Group, Inc. (a) | | | 50,243 | | | | 2,864,353 | |
Owens-Illinois, Inc. (a) | | | 7,212 | | | | 172,511 | |
Silgan Holdings, Inc. | | | 59,387 | | | | 1,887,319 | |
| | | | | | | | |
| | | | | | | 4,924,183 | |
| | | | | | | | |
Diversified Consumer Services 0.6% | | | | | | | | |
H&R Block, Inc. | | | 92,016 | | | | 2,844,215 | |
| | | | | | | | |
|
Diversified Telecommunication Services 0.6% | |
SBA Communications Corp. (a) | | | 11,853 | | | | 1,598,970 | |
Verizon Communications, Inc. | | | 26,351 | | | | 1,176,835 | |
| | | | | | | | |
| | | | | | | 2,775,805 | |
| | | | | | | | |
Electronic Equipment, Instruments & Components 1.4% | |
Corning, Inc. | | | 43,087 | | | | 1,294,764 | |
Jabil, Inc. | | | 89,445 | | | | 2,610,900 | |
Zebra Technologies Corp. Class A (a) | | | 24,838 | | | | 2,496,716 | |
| | | | | | | | |
| | | | | | | 6,402,380 | |
| | | | | | | | |
Equity Real Estate Investment Trusts (REITs) 2.7% | |
American Tower Corp. | | | 36,243 | | | | 4,795,674 | |
Digital Realty Trust, Inc. | | | 1,340 | | | | 151,353 | |
Gaming and Leisure Properties, Inc. | | | 34,634 | | | | 1,304,663 | |
Lamar Advertising Co. Class A | | | 38,859 | | | | 2,858,856 | |
Outfront Media, Inc. | | | 111,774 | | | | 2,584,215 | |
Public Storage | | | 3,468 | | | | 723,182 | |
Senior Housing Properties Trust | | | 9,509 | | | | 194,364 | |
| | | | | | | | |
| | | | | | | 12,612,307 | |
| | | | | | | | |
Food & Staples Retailing 0.1% | |
Costco Wholesale Corp. | | | 2,341 | | | | 374,396 | |
CVS Health Corp. | | | 4,278 | | | | 344,208 | |
| | | | | | | | |
| | | | | | | 718,604 | |
| | | | | | | | |
Food Products 1.1% | |
Conagra Brands, Inc. | | | 7,096 | | | | 253,753 | |
Flowers Foods, Inc. | | | 71,944 | | | | 1,245,351 | |
Pilgrim’s Pride Corp. (a) | | | 107,889 | | | | 2,364,927 | |
Tyson Foods, Inc. Class A | | | 23,839 | | | | 1,493,036 | |
| | | | | | | | |
| | | | | | | 5,357,067 | |
| | | | | | | | |
| † | Percentages indicated are based on Portfolio net assets. |
| ¨ | | Among the Portfolio’s 10 largest holdings, as of June 30, 2017, excluding short-term investment. May be subject to change daily. |
| | | | |
| 10 | | MainStay VP Cornerstone Growth Portfolio | | The notes to the financial statements are an integral part of,
and should be read in conjunction with, the financial statements. |
| | | | | | | | |
| | |
Shares | | | Value | |
| Common Stocks (continued) | |
Health Care Equipment & Supplies 1.6% | |
Alere, Inc. (a) | | | 24,844 | | | $ | 1,246,920 | |
Baxter International, Inc. | | | 46,546 | | | | 2,817,895 | |
Becton Dickinson & Co. | | | 2,521 | | | | 491,872 | |
Cooper Cos., Inc. | | | 2,662 | | | | 637,336 | |
Danaher Corp. | | | 3,296 | | | | 278,149 | |
Hologic, Inc. (a) | | | 36,907 | | | | 1,674,840 | |
IDEXX Laboratories, Inc. (a) | | | 3,397 | | | | 548,344 | |
Medtronic PLC | | | 280 | | | | 24,850 | |
| | | | | | | | |
| | | | | | | 7,720,206 | |
| | | | | | | | |
Health Care Providers & Services 6.4% | |
Aetna, Inc. | | | 7,771 | | | | 1,179,871 | |
Anthem, Inc. | | | 11,220 | | | | 2,110,819 | |
Centene Corp. (a) | | | 36,440 | | | | 2,910,827 | |
Cigna Corp. | | | 21,591 | | | | 3,614,117 | |
Humana, Inc. | | | 16,651 | | | | 4,006,564 | |
McKesson Corp. | | | 21,340 | | | | 3,511,283 | |
¨UnitedHealth Group, Inc. | | | 52,983 | | | | 9,824,108 | |
WellCare Health Plans, Inc. (a) | | | 16,409 | | | | 2,946,400 | |
| | | | | | | | |
| | | | | | | 30,103,989 | |
| | | | | | | | |
Health Care Technology 0.3% | |
Cerner Corp. (a) | | | 24,345 | | | | 1,618,212 | |
| | | | | | | | |
|
Hotels, Restaurants & Leisure 6.0% | |
Aramark | | | 70,694 | | | | 2,897,040 | |
Brinker International, Inc. | | | 32,066 | | | | 1,221,715 | |
Carnival Corp. | | | 15,844 | | | | 1,038,891 | |
Choice Hotels International, Inc. | | | 716 | | | | 46,003 | |
Darden Restaurants, Inc. | | | 33,971 | | | | 3,072,337 | |
Extended Stay America, Inc. | | | 141,191 | | | | 2,733,458 | |
Las Vegas Sands Corp. | | | 56,577 | | | | 3,614,705 | |
McDonald’s Corp. | | | 38,623 | | | | 5,915,499 | |
Norwegian Cruise Line Holdings, Ltd. (a) | | | 8,631 | | | | 468,577 | |
Royal Caribbean Cruises, Ltd. | | | 6,236 | | | | 681,158 | |
Six Flags Entertainment Corp. | | | 22,925 | | | | 1,366,559 | |
Starbucks Corp. | | | 14,339 | | | | 836,107 | |
Wyndham Worldwide Corp. | | | 30,315 | | | | 3,043,929 | |
Wynn Resorts, Ltd. | | | 337 | | | | 45,198 | |
Yum China Holdings, Inc. (a) | | | 13,410 | | | | 528,756 | |
Yum! Brands, Inc. | | | 14,055 | | | | 1,036,697 | |
| | | | | | | | |
| | | | | | | 28,546,629 | |
| | | | | | | | |
Household Durables 0.9% | |
NVR, Inc. (a) | | | 1,246 | | | | 3,003,620 | |
Tempur Sealy International, Inc. (a) | | | 23,714 | | | | 1,266,091 | |
| | | | | | | | |
| | | | | | | 4,269,711 | |
| | | | | | | | |
Household Products 0.3% | |
Spectrum Brands Holdings, Inc. | | | 10,781 | | | | 1,348,056 | |
| | | | | | | | |
|
Industrial Conglomerates 1.8% | |
3M Co. | | | 30,085 | | | | 6,263,396 | |
| | | | | | | | |
| | |
Shares | | | Value | |
Industrial Conglomerates (continued) | |
Honeywell International, Inc. | | | 16,451 | | | $ | 2,192,754 | |
| | | | | | | | |
| | | | | | | 8,456,150 | |
| | | | | | | | |
Insurance 1.1% | |
Assurant, Inc. | | | 12,207 | | | | 1,265,744 | |
Athene Holding, Ltd. Class A (a) | | | 25,085 | | | | 1,244,467 | |
Lincoln National Corp. | | | 280 | | | | 18,922 | |
Progressive Corp. | | | 28,660 | | | | 1,263,620 | |
XL Group, Ltd. | | | 29,795 | | | | 1,305,021 | |
| | | | | | | | |
| | | | | | | 5,097,774 | |
| | | | | | | | |
Internet & Direct Marketing Retail 5.6% | |
¨Amazon.com, Inc. (a) | | | 18,521 | | | | 17,928,328 | |
Expedia, Inc. | | | 22,797 | | | | 3,395,613 | |
Liberty Interactive Corp. QVC Group Class A (a) | | | 118,127 | | | | 2,898,837 | |
Netflix, Inc. (a) | | | 135 | | | | 20,170 | |
Priceline Group, Inc. (a) | | | 1,129 | | | | 2,111,817 | |
| | | | | | | | |
| | | | | | | 26,354,765 | |
| | | | | | | | |
Internet Software & Services 9.0% | |
Akamai Technologies, Inc. (a) | | | 30,021 | | | | 1,495,346 | |
¨Alphabet, Inc.(a) | |
Class A | | | 11,413 | | | | 10,610,438 | |
Class C | | | 11,617 | | | | 10,556,716 | |
eBay, Inc. (a) | | | 59,872 | | | | 2,090,730 | |
¨Facebook, Inc. Class A (a) | | | 92,471 | | | | 13,961,272 | |
IAC / InterActiveCorp (a) | | | 13,495 | | | | 1,393,224 | |
VeriSign, Inc. (a) | | | 24,834 | | | | 2,308,569 | |
| | | | | | | | |
| | | | | | | 42,416,295 | |
| | | | | | | | |
IT Services 5.2% | |
Accenture PLC Class A | | | 4,278 | | | | 529,103 | |
Alliance Data Systems Corp. | | | 5,787 | | | | 1,485,465 | |
CoreLogic, Inc. (a) | | | 15,294 | | | | 663,454 | |
CSRA, Inc. | | | 37,299 | | | | 1,184,243 | |
DXC Technology Co. | | | 973 | | | | 74,649 | |
First Data Corp. Class A (a) | | | 156,723 | | | | 2,852,359 | |
International Business Machines Corp. | | | 12,767 | | | | 1,963,948 | |
Mastercard, Inc. Class A | | | 38,514 | | | | 4,677,525 | |
Total System Services, Inc. | | | 43,974 | | | | 2,561,485 | |
Visa, Inc. Class A | | | 75,859 | | | | 7,114,057 | |
Western Union Co. | | | 86,850 | | | | 1,654,492 | |
| | | | | | | | |
| | | | | | | 24,760,780 | |
| | | | | | | | |
Life Sciences Tools & Services 0.6% | |
Charles River Laboratories International, Inc. (a) | | | 6,753 | | | | 683,066 | |
VWR Corp. (a) | | | 28,986 | | | | 956,828 | |
Waters Corp. (a) | | | 7,456 | | | | 1,370,711 | |
| | | | | | | | |
| | | | | | | 3,010,605 | |
| | | | | | | | |
Machinery 1.5% | |
Caterpillar, Inc. | | | 24,447 | | | | 2,627,075 | |
Cummins, Inc. | | | 8,676 | | | | 1,407,421 | |
Deere & Co. | | | 16,185 | | | | 2,000,304 | |
| | | | | | |
The notes to the financial statements are an integral part of,
and should be read in conjunction with, the financial statements. | | | | | 11 | |
Portfolio of Investments June 30, 2017 (Unaudited) (continued)
| | | | | | | | |
| | |
Shares | | | Value | |
| Common Stocks (continued) | |
Machinery (continued) | |
Fortive Corp. | | | 5,484 | | | $ | 347,411 | |
Toro Co. | | | 13,427 | | | | 930,357 | |
| | | | | | | | |
| | | | | | | 7,312,568 | |
| | | | | | | | |
Media 3.7% | |
Charter Communications, Inc. Class A (a) | | | 158 | | | | 53,222 | |
¨Comcast Corp. Class A | | | 212,766 | | | | 8,280,853 | |
DISH Network Corp. Class A (a) | | | 3,838 | | | | 240,873 | |
Lions Gate Entertainment Corp. Class A | | | 55,937 | | | | 1,578,542 | |
Live Nation Entertainment, Inc. (a) | | | 16,071 | | | | 560,074 | |
Scripps Networks Interactive, Inc. Class A | | | 15,450 | | | | 1,055,390 | |
Time Warner, Inc. | | | 3,917 | | | | 393,306 | |
Walt Disney Co. | | | 48,970 | | | | 5,203,062 | |
| | | | | | | | |
| | | | | | | 17,365,322 | |
| | | | | | | | |
Oil, Gas & Consumable Fuels 0.5% | |
ONEOK, Inc. | | | 17,011 | | | | 887,294 | |
Williams Cos., Inc. | | | 46,392 | | | | 1,404,750 | |
| | | | | | | | |
| | | | | | | 2,292,044 | |
| | | | | | | | |
Personal Products 0.0%‡ | |
Nu Skin Enterprises, Inc., Class A | | | 390 | | | | 24,508 | |
| | | | | | | | |
|
Pharmaceuticals 0.5% | |
Bristol-Myers Squibb Co. | | | 10,320 | | | | 575,030 | |
Eli Lilly & Co. | | | 14,117 | | | | 1,161,829 | |
Johnson & Johnson | | | 3,130 | | | | 414,068 | |
| | | | | | | | |
| | | | | | | 2,150,927 | |
| | | | | | | | |
Professional Services 0.6% | |
Robert Half International, Inc. | | | 58,951 | | | | 2,825,521 | |
| | | | | | | | |
|
Road & Rail 0.1% | |
Union Pacific Corp. | | | 2,970 | | | | 323,463 | |
| | | | | | | | |
|
Semiconductors & Semiconductor Equipment 5.4% | |
Applied Materials, Inc. | | | 96,704 | | | | 3,994,842 | |
Broadcom, Ltd. | | | 10,246 | | | | 2,387,830 | |
Cree, Inc. (a) | | | 21,976 | | | | 541,709 | |
First Solar, Inc. (a) | | | 35,167 | | | | 1,402,460 | |
KLA-Tencor Corp. | | | 32,365 | | | | 2,961,721 | |
Lam Research Corp. | | | 22,995 | | | | 3,252,183 | |
Micron Technology, Inc. (a) | | | 75,061 | | | | 2,241,322 | |
NVIDIA Corp. | | | 12,563 | | | | 1,816,107 | |
ON Semiconductor Corp. (a) | | | 180,999 | | | | 2,541,226 | |
Qorvo, Inc. (a) | | | 12,747 | | | | 807,140 | |
Skyworks Solutions, Inc. | | | 32,423 | | | | 3,110,987 | |
Texas Instruments, Inc. | | | 8,653 | | | | 665,675 | |
| | | | | | | | |
| | | | | | | 25,723,202 | |
| | | | | | | | |
| | | | | | | | |
| | |
Shares | | | Value | |
Software 7.7% | |
Activision Blizzard, Inc. | | | 70,601 | | | $ | 4,064,500 | |
Adobe Systems, Inc. (a) | | | 5,693 | | | | 805,218 | |
Cadence Design Systems, Inc. (a) | | | 88,171 | | | | 2,952,847 | |
Citrix Systems, Inc. (a) | | | 6,196 | | | | 493,078 | |
Dell Technologies, Inc. Class V (a) | | | 4,042 | | | | 247,007 | |
Electronic Arts, Inc. (a) | | | 15,732 | | | | 1,663,187 | |
¨Microsoft Corp. | | | 341,907 | | | | 23,567,649 | |
Nuance Communications, Inc. (a) | | | 19,417 | | | | 338,050 | |
Take-Two Interactive Software, Inc. (a) | | | 19,008 | | | | 1,394,807 | |
VMware, Inc. Class A (a) | | | 10,094 | | | | 882,518 | |
| | | | | | | | |
| | | | | | | 36,408,861 | |
| | | | | | | | |
Specialty Retail 4.5% | |
Best Buy Co., Inc. | | | 48,703 | | | | 2,792,143 | |
Burlington Stores, Inc. (a) | | | 2,033 | | | | 187,016 | |
GameStop Corp. Class A | | | 52,346 | | | | 1,131,197 | |
Gap, Inc. | | | 26,800 | | | | 589,332 | |
¨Home Depot, Inc. | | | 64,466 | | | | 9,889,084 | |
Lowe’s Cos., Inc. | | | 66,589 | | | | 5,162,645 | |
Signet Jewelers, Ltd. | | | 23,433 | | | | 1,481,903 | |
| | | | | | | | |
| | | | | | | 21,233,320 | |
| | | | | | | | |
Technology Hardware, Storage & Peripherals 8.0% | |
¨Apple, Inc. | | | 223,907 | | | | 32,247,086 | |
HP, Inc. | | | 68,115 | | | | 1,190,650 | |
NCR Corp. (a) | | | 45,095 | | | | 1,841,680 | |
Western Digital Corp. | | | 29,778 | | | | 2,638,331 | |
| | | | | | | | |
| | | | | | | 37,917,747 | |
| | | | | | | | |
Textiles, Apparel & Luxury Goods 0.6% | |
Michael Kors Holdings, Ltd. (a) | | | 75,826 | | | | 2,748,693 | |
NIKE, Inc. Class B | | | 4,743 | | | | 279,837 | |
| | | | | | | | |
| | | | 3,028,530 | |
| | | | | | | | |
Tobacco 2.5% | |
¨Altria Group, Inc. | | | 113,497 | | | | 8,452,122 | |
Philip Morris International, Inc. | | | 28,292 | | | | 3,322,895 | |
| | | | | | | | |
| | | | | | | 11,775,017 | |
| | | | | | | | |
Trading Companies & Distributors 0.6% | |
United Rentals, Inc. (a) | | | 27,057 | | | | 3,049,594 | |
| | | | | | | | |
|
Wireless Telecommunication Services 0.4% | |
T-Mobile U.S., Inc. (a) | | | 29,982 | | | | 1,817,509 | |
| | | | | | | | |
Total Common Stocks
(Cost $412,109,642) | | | | 469,786,421 | |
| | | | | | | | |
| | |
| Exchange-Traded Funds 0.6% (b) | | | | | | | | |
iShares Russell 1000 Growth ETF | | | 24,630 | | | | 2,931,463 | |
| | | | | | | | |
Total Exchange-Traded Funds
(Cost $2,893,716) | | | | | | | 2,931,463 | |
| | | | | | | | |
| | | | |
| 12 | | MainStay VP Cornerstone Growth Portfolio | | The notes to the financial statements are an integral part of,
and should be read in conjunction with, the financial statements. |
| | | | | | | | |
| | | Principal
Amount | | | Value | |
| Short-Term Investment 0.0%‡ | |
Repurchase Agreement 0.0% ‡ | |
Fixed Income Clearing Corp.
0.12%, dated 6/30/17
due 7/3/17
Proceeds at Maturity $166,278 (Collateralized by a United States Treasury Note with a rate of 2.00% and a maturity date of 8/31/21, with a Principal Amount of $170,000 and a Market Value of $172,849) | | $ | 166,276 | | | $ | 166,276 | |
| | | | | | | | |
Total Short-Term Investment
(Cost $166,276) | | | | | | | 166,276 | |
| | | | | | | | |
Total Investments
(Cost $415,169,634) (c) | | | 100.0 | % | | | 472,884,160 | |
Other Assets, Less Liabilities | | | (0.0 | )‡ | | | (234,857 | ) |
Net Assets | | | 100.0 | % | | $ | 472,649,303 | |
| ‡ | Less than one-tenth of a percent. |
| (a) | Non-income producing security. |
| (b) | Exchange-Traded Fund—An investment vehicle that represents a basket of securities that is traded on an exchange. |
| (c) | As of June 30, 2017, cost was $415,550,975 for federal income tax purposes and net unrealized appreciation was as follows: |
| | | | |
Gross unrealized appreciation | | $ | 63,269,611 | |
Gross unrealized depreciation | | | (5,936,426 | ) |
| | | | |
Net unrealized appreciation | | $ | 57,333,185 | |
| | | | |
The following abbreviation is used in the preceding pages:
ETF—Exchange-Traded Fund
The following is a summary of the fair valuations according to the inputs used as of June 30, 2017, for valuing the Portfolio’s assets.
Asset Valuation Inputs
| | | | | | | | | | | | | | | | |
Description | | Quoted
Prices in
Active
Markets for
Identical
Assets
(Level 1) | | | Significant
Other
Observable
Inputs
(Level 2) | | | Significant
Unobservable
Inputs
(Level 3) | | | Total | |
| Investments in Securities (a) | | | | | | | | | | | | | | | | |
| Common Stocks | | $ | 469,786,421 | | | $ | — | | | $ | — | | | $ | 469,786,421 | |
| Exchange-Traded Funds Equity Funds | | | 2,931,463 | | | | — | | | | — | | | | 2,931,463 | |
Short-Term Investment
Repurchase Agreement | | | — | | | | 166,276 | | | | — | | | | 166,276 | |
| | | | | | | | | | | | | | | | |
| Total Investments in Securities | | $ | 472,717,884 | | | $ | 166,276 | | | $ | — | | | $ | 472,884,160 | |
| | | | | | | | | | | | | | | | |
| (a) | For a complete listing of investments and their industries, see the Portfolio of Investments. |
The Portfolio recognizes transfers between the levels as of the beginning of the period.
For the period ended June 30, 2017, the Portfolio did not have any transfers among levels. (See Note 2)
As of June 30, 2017, the Portfolio did not hold any investments with significant unobservable inputs (Level 3). (See Note 2)
| | | | | | |
The notes to the financial statements are an integral part of,
and should be read in conjunction with, the financial statements. | | | | | 13 | |
Statement of Assets and Liabilities as of June 30, 2017 (Unaudited)
| | | | |
| Assets | | | | |
Investment in securities, at value
(identified cost $415,169,634) | | $ | 472,884,160 | |
Receivables: | | | | |
Dividends and interest | | | 303,186 | |
Fund shares sold | | | 18,067 | |
Other assets | | | 2,285 | |
| | | | |
Total assets | | | 473,207,698 | |
| | | | |
| |
| Liabilities | | | | |
Payables: | | | | |
Manager (See Note 3) | | | 275,489 | |
Fund shares redeemed | | | 188,798 | |
Shareholder communication | | | 49,415 | |
Professional fees | | | 23,921 | |
NYLIFE Distributors (See Note 3) | | | 13,013 | |
Custodian | | | 2,704 | |
Trustees | | | 724 | |
Accrued expenses | | | 4,331 | |
| | | | |
Total liabilities | | | 558,395 | |
| | | | |
Net assets | | $ | 472,649,303 | |
| | | | |
| |
| Composition of Net Assets | | | | |
Shares of beneficial interest outstanding (par value of $.001 per share) unlimited number of shares authorized | | $ | 17,622 | |
Additional paid-in capital | | | 398,907,406 | |
| | | | |
| | | 398,925,028 | |
Undistributed net investment income | | | 3,173,225 | |
Accumulated net realized gain (loss) on investments | | | 12,836,524 | |
Net unrealized appreciation (depreciation) on investments | | | 57,714,526 | |
| | | | |
Net assets | | $ | 472,649,303 | |
| | | | |
| | | | |
Initial Class | | | | |
Net assets applicable to outstanding shares | | $ | 409,906,559 | |
| | | | |
Shares of beneficial interest outstanding | | | 15,255,884 | |
| | | | |
Net asset value per share outstanding | | $ | 26.87 | |
| | | | |
Service Class | | | | |
Net assets applicable to outstanding shares | | $ | 62,742,744 | |
| | | | |
Shares of beneficial interest outstanding | | | 2,365,775 | |
| | | | |
Net asset value per share outstanding | | $ | 26.52 | |
| | | | |
| | | | |
| 14 | | MainStay VP Cornerstone Growth Portfolio | | The notes to the financial statements are an integral part of,
and should be read in conjunction with, the financial statements. |
Statement of Operations for the six months ended June 30, 2017 (Unaudited)
| | | | |
| Investment Income (Loss) | |
Income | |
Dividends | | $ | 3,683,817 | |
Interest | | | 95 | |
| | | | |
Total income | | | 3,683,912 | |
| | | | |
Expenses | |
Manager (See Note 3) | | | 1,572,887 | |
Distribution/Service—Service Class (See Note 3) | | | 76,311 | |
Shareholder communication | | | 58,035 | |
Professional fees | | | 33,156 | |
Trustees | | | 5,262 | |
Custodian | | | 3,959 | |
Miscellaneous | | | 9,762 | |
| | | | |
Total expenses | | | 1,759,372 | |
| | | | |
Net investment income (loss) | | | 1,924,540 | |
| | | | |
|
| Realized and Unrealized Gain (Loss) on Investments | |
Net realized gain (loss) on investments | | | 9,512,515 | |
Net change in unrealized appreciation (depreciation) on investments | | | 40,093,841 | |
| | | | |
Net realized and unrealized gain (loss) on investments | | | 49,606,356 | |
| | | | |
Net increase (decrease) in net assets resulting from operations | | $ | 51,530,896 | |
| | | | |
| | | | | | |
The notes to the financial statements are an integral part of,
and should be read in conjunction with, the financial statements. | | | | | 15 | |
Statements of Changes in Net Assets
for the six months ended June 30, 2017 (Unaudited) and the year ended December 31, 2016
| | | | | | | | |
| | | 2017 | | | 2016 | |
| Increase (Decrease) in Net Assets | |
Operations: | | | | | | | | |
Net investment income (loss) | | $ | 1,924,540 | | | $ | 1,247,959 | |
Net realized gain (loss) on investments | | | 9,512,515 | | | | 5,334,451 | |
Net change in unrealized appreciation (depreciation) on investments | | | 40,093,841 | | | | (6,347,528 | ) |
| | | | |
Net increase (decrease) in net assets resulting from operations | | | 51,530,896 | | | | 234,882 | |
| | | | |
Dividends and distributions to shareholders: | | | | | | | | |
From net investment income: | | | | | | | | |
Initial Class | | | — | | | | (549,429 | ) |
| | | | |
From net realized gain on investments: | | | | | | | | |
Initial Class | | | — | | | | (29,462,402 | ) |
Service Class | | | — | | | | (5,192,207 | ) |
| | | | |
| | | — | | | | (34,654,609 | ) |
| | | | |
Total dividends and distributions to shareholders | | | — | | | | (35,204,038 | ) |
| | | | |
Capital share transactions: | | | | | | | | |
Net proceeds from sale of shares | | | 52,963,742 | | | | 10,067,980 | |
Net asset value of shares issued to shareholders in reinvestment of dividends and distributions | | | — | | | | 35,204,038 | |
Cost of shares redeemed | | | (27,693,696 | ) | | | (48,979,279 | ) |
| | | | |
Increase (decrease) in net assets derived from capital share transactions | | | 25,270,046 | | | | (3,707,261 | ) |
| | | | |
Net increase (decrease) in net assets | | | 76,800,942 | | | | (38,676,417 | ) |
|
| Net Assets | |
Beginning of period | | | 395,848,361 | | | | 434,524,778 | |
| | | | |
End of period | | $ | 472,649,303 | | | $ | 395,848,361 | |
| | | | |
Undistributed net investment income at end of period | | $ | 3,173,225 | | | $ | 1,248,685 | |
| | | | |
| | | | |
| 16 | | MainStay VP Cornerstone Growth Portfolio | | The notes to the financial statements are an integral part of,
and should be read in conjunction with, the financial statements. |
Financial Highlights selected per share data and ratios
| | | | | | | | | | | | | | | | | | | | | | | | | | | | |
| | | Six months
ended
June 30, | | | | | | Year ended December 31, | |
| Initial Class | | 2017* | | | | | | 2016 | | | 2015 | | | 2014 | | | 2013 | | | 2012 | |
Net asset value at beginning of period | | $ | 23.90 | | | | | | | $ | 26.09 | | | $ | 29.42 | | | $ | 34.19 | | | $ | 27.64 | | | $ | 24.14 | |
| | | | | | | | | | | | | | | | | | | | | | | | | | | | |
Net investment income (loss) | | | 0.11 | (a) | | | | | | | 0.09 | (a) | | | 0.04 | (a) | | | 0.01 | (a) | | | 0.19 | (a) | | | 0.31 | |
Net realized and unrealized gain (loss) on investments | | | 2.86 | | | | | | | | (0.02 | ) | | | 0.58 | | | | 2.63 | | | | 6.62 | | | | 3.30 | |
| | | | | | | | | | | | | | | | | | | | | | | | | | | | |
Total from investment operations | | | 2.97 | | | | | | | | 0.07 | | | | 0.62 | | | | 2.64 | | | | 6.81 | | | | 3.61 | |
| | | | | | | | | | | | | | | | | | | | | | | | | | | | |
| Less dividends and distributions: | | | | | | | | | | | | | | | | | | | | | | | | | | | | |
From net investment income | | | — | | | | | | | | (0.04 | ) | | | — | | | | (0.23 | ) | | | (0.26 | ) | | | (0.11 | ) |
From net realized gain on investments | | | — | | | | | | | | (2.22 | ) | | | (3.95 | ) | | | (7.18 | ) | | | — | | | | — | |
| | | | | | | | | | | | | | | | | | | | | | | | | | | | |
Total dividends and distributions | | | — | | | | | | | | (2.26 | ) | | | (3.95 | ) | | | (7.41 | ) | | | (0.26 | ) | | | (0.11 | ) |
| | | | | | | | | | | | | | | | | | | | | | | | | | | | |
Net asset value at end of period | | $ | 26.87 | | | | | | | $ | 23.90 | | | $ | 26.09 | | | $ | 29.42 | | | $ | 34.19 | | | $ | 27.64 | |
| | | | | | | | | | | | | | | | | | | | | | | | | | | | |
Total investment return (b) | | | 12.43 | %(c) | | | | | | | 0.40 | % | | | 2.58 | % | | | 8.81 | % | | | 24.71 | % | | | 14.94 | % |
| Ratios (to average net assets)/Supplemental Data: | | | | | | | | | | | | | | | | | | | | | | | | | | | | |
Net investment income (loss) | | | 0.89 | %†† | | | | | | | 0.35 | %(d) | | | 0.15 | % | | | 0.02 | % | | | 0.61 | % | | | 1.04 | % |
Net expenses | | | 0.75 | %†† | | | | | | | 0.76 | %(e) | | | 0.73 | % | | | 0.73 | % | | | 0.71 | % | | | 0.65 | % |
Portfolio turnover rate | | | 71 | % | | | | | | | 177 | % | | | 112 | % | | | 88 | % | | | 164 | % | | | 42 | % |
Net assets at end of period (in 000’s) | | $ | 409,907 | | | | | | | $ | 337,401 | | | $ | 370,679 | | | $ | 405,444 | | | $ | 522,795 | | | $ | 368,442 | |
| (a) | Per share data based on average shares outstanding during the period. |
| (b) | Total return does not reflect any deduction of sales charges, mortality and expense charges, contract charges or administrative charges. For periods of less than one year, total return is not annualized. |
| (c) | Total investment return may reflect adjustments to conform to generally accepted accounting principles. |
| (d) | Without the custody fee reimbursement, net investment income (loss) would have been 0.34%. |
| (e) | Without the custody fee reimbursement, net expenses would have been 0.77%. |
| | | | | | | | | | | | | | | | | | | | | | | | | | | | |
| | | Six months
ended June 30, | | | | | | Year ended December 31, | |
| Service Class | | 2017* | | | | | | 2016 | | | 2015 | | | 2014 | | | 2013 | | | 2012 | |
Net asset value at beginning of period | | $ | 23.62 | | | | | | | $ | 25.83 | | | $ | 29.24 | | | $ | 34.03 | | | $ | 27.52 | | | $ | 24.04 | |
| | | | | | | | | | | | | | | | | | | | | | | | | | | | |
Net investment income (loss) | | | 0.08 | (a) | | | | | | | 0.02 | (a) | | | (0.03 | )(a) | | | (0.08 | )(a) | | | 0.11 | (a) | | | 0.22 | |
Net realized and unrealized gain (loss) on investments | | | 2.82 | | | | | | | | (0.01 | ) | | | 0.57 | | | | 2.61 | | | | 6.59 | | | | 3.31 | |
| | | | | | | | | | | | | | | | | | | | | | | | | | | | |
Total from investment operations | | | 2.90 | | | | | | | | 0.01 | | | | 0.54 | | | | 2.53 | | | | 6.70 | | | | 3.53 | |
| | | | | | | | | | | | | | | | | | | | | | | | | | | | |
| Less dividends and distributions: | | | | | | | | | | | | | | | | | | | | | | | | | | | | |
From net investment income | | | — | | | | | | | | — | | | | — | | | | (0.14 | ) | | | (0.19 | ) | | | (0.05 | ) |
From net realized gain on investments | | | — | | | | | | | | (2.22 | ) | | | (3.95 | ) | | | (7.18 | ) | | | — | | | | — | |
| | | | | | | | | | | | | | | | | | | | | | | | | | | | |
Total dividends and distributions | | | — | | | | | | | | (2.22 | ) | | | (3.95 | ) | | | (7.32 | ) | | | (0.19 | ) | | | (0.05 | ) |
| | | | | | | | | | | | | | | | | | | | | | | | | | | | |
Net asset value at end of period | | $ | 26.52 | | | | | | | $ | 23.62 | | | $ | 25.83 | | | $ | 29.24 | | | $ | 34.03 | | | $ | 27.52 | |
| | | | | | | | | | | | | | | | | | | | | | | | | | | | |
Total investment return (b) | | | 12.28 | %(c) | | | | | | | 0.15 | % | | | 2.33 | % | | | 8.54 | % | | | 24.40 | % | | | 14.66 | % |
| Ratios (to average net assets)/Supplemental Data: | | | | | | | | | | | | | | | | | | | | | | | | | | | | |
Net investment income (loss) | | | 0.63 | %†† | | | | | | | 0.10 | %(d) | | | (0.09 | %) | | | (0.23 | %) | | | 0.36 | % | | | 0.82 | % |
Net expenses | | | 1.00 | %†† | | | | | | | 1.01 | %(e) | | | 0.98 | % | | | 0.98 | % | | | 0.96 | % | | | 0.90 | % |
Portfolio turnover rate | | | 71 | % | | | | | | | 177 | % | | | 112 | % | | | 88 | % | | | 164 | % | | | 42 | % |
Net assets at end of period (in 000’s) | | $ | 62,743 | | | | | | | $ | 58,448 | | | $ | 63,846 | | | $ | 64,445 | | | $ | 63,898 | | | $ | 53,369 | |
| (a) | Per share data based on average shares outstanding during the period. |
| (b) | Total return does not reflect any deduction of sales charges, mortality and expense charges, contract charges or administrative charges. For periods of less than one year, total return is not annualized. |
| (c) | Total investment return may reflect adjustments to conform to generally accepted accounting principles. |
| (d) | Without the custody fee reimbursement, net investment income (loss) would have been 0.09%. |
| (e) | Without the custody fee reimbursement, net expenses would have been 1.02%. |
| | | | | | |
The notes to the financial statements are an integral part of,
and should be read in conjunction with, the financial statements. | | | | | 17 | |
Notes to Financial Statements (Unaudited)
Note 1–Organization and Business
MainStay VP Funds Trust (the “Fund”) was organized as a Delaware statutory trust on February 1, 2011. The Fund is registered under the Investment Company Act of 1940, as amended (the “1940 Act”), as an open-end management investment company. The Fund is comprised of thirty-two separate series (collectively referred to as the “Portfolios”). These financial statements and notes relate to the MainStay VP Cornerstone Growth Portfolio (the “Portfolio”), a “diversified” portfolio, as that term is defined in the 1940 Act, as interpreted or modified by regulatory authorities having jurisdiction, from time to time.
Shares of the Portfolio are currently offered to certain separate accounts to fund variable annuity policies and variable universal life insurance policies issued by New York Life Insurance and Annuity Corporation (“NYLIAC”), a wholly-owned subsidiary of New York Life Insurance Company (“New York Life”). NYLIAC allocates shares of the Portfolios to, among others, NYLIAC Variable Annuity Separate Accounts-I, II, III and IV, VUL Separate Account-I and CSVUL Separate Account-I (collectively, the “Separate Accounts”). Shares of the Portfolio are also offered to the MainStay VP Conservative Allocation Portfolio, MainStay VP Moderate Allocation Portfolio, MainStay VP Moderate Growth Allocation Portfolio and MainStay VP Growth Allocation Portfolio, which operate as “funds-of-funds.”
The Portfolio currently offers two classes of shares. Initial Class shares commenced operations on January 29, 1993. Service Class shares commenced operations on June 5, 2003. Shares of the Portfolio are sold and are redeemed at a price equal to their respective net asset value (“NAV”) per share. No sales or redemption charge is applicable to the purchase or redemption of the Portfolio’s shares. Under the terms of the Fund’s multiple class plan adopted pursuant to Rule 18f-3 under the 1940 Act, the classes differ in that, among other things, Service Class shares pay a combined distribution and service fee of 0.25% of average daily net assets attributable to Service Class shares of the Portfolio to the Distributor (as defined in Note 3(B)) pursuant to a plan adopted in accordance with Rule 12b-1 under the 1940 Act. Contract owners of variable annuity contracts purchased after June 2, 2003, are permitted to invest only in the Service Class shares.
The Portfolio’s investment objective is to seek long-term growth of capital.
Note 2–Significant Accounting Policies
The Portfolio is an investment company and accordingly follows the investment company accounting and reporting guidance of the Financial Accounting Standards Board (“FASB”) Accounting Standard Codification Topic 946 Financial Services—Investment Companies. The Portfolio prepares its financial statements in accordance with generally accepted accounting principles (“GAAP”) in the United States of America and follows the significant accounting policies described below.
(A) Securities Valuation. Investments are usually valued as of the close of regular trading on the New York Stock Exchange (the “Exchange”) (usually 4:00 p.m. Eastern time) on each day the Portfolio is open for business (“valuation date”).
The Board of Trustees (the “Board”) of the Fund adopted procedures establishing methodologies for the valuation of the Portfolio’s securities and other assets and delegated the responsibility for valuation
determinations under those procedures to the Valuation Committee of the Fund (the “Valuation Committee”). The Board authorized the Valuation Committee to appoint a Valuation Sub-Committee (the “Sub-Committee”) to deal in the first instance with establishing the prices of securities for which market quotations are not readily available or the prices of which are not otherwise readily determinable under these procedures. The Sub-Committee meets (in person, via electronic mail or via teleconference) on an as-needed basis. Subsequently, the Valuation Committee meets to ensure that actions taken by the Sub-Committee were appropriate. The procedures recognize that, subject to the oversight of the Board and unless otherwise noted, the responsibility for the day-to-day valuation of portfolio assets (including fair value measurements for the Portfolio’s assets and liabilities) rests with New York Life Investment Management LLC (“New York Life Investments” or the “Manager”), aided to whatever extent necessary by the Subadvisor (as defined in Note 3(A)) to the Portfolio.
To assess the appropriateness of security valuations, the Manager, the Subadvisor or the Portfolio’s third party service provider, who is subject to oversight by the Manager, regularly compares prior day prices, prices on comparable securities and the sale prices to the prior and current day prices and challenges prices with changes exceeding certain tolerance levels with third party pricing services or broker sources. For those securities valued through either a standardized fair valuation methodology or a fair valuation measurement, the Sub-Committee deals in the first instance with such valuation and the Valuation Committee reviews and affirms, if appropriate, the reasonableness of the valuation based on such methodologies and measurements on a regular basis after considering all relevant information that is reasonably available. Any action taken by the Sub-Committee with respect to the valuation of a portfolio security or other asset is submitted by the Valuation Committee to the Board for its review and ratification, if appropriate, at its next regularly scheduled meeting.
“Fair value” is defined as the price the Portfolio would reasonably expect to receive upon selling an asset or liability in an orderly transaction to an independent buyer in the principal or most advantageous market for the asset or liability. Fair value measurements are determined within a framework that establishes a three-tier hierarchy which maximizes the use of observable market data and minimizes the use of unobservable inputs to establish a classification of fair value measurements for disclosure purposes. “Inputs” refer broadly to the assumptions that market participants would use in pricing the asset or liability, including assumptions about risk, such as the risk inherent in a particular valuation technique used to measure fair value using a pricing model and/or the risk inherent in the inputs for the valuation technique. Inputs may be observable or unobservable. Observable inputs reflect the assumptions market participants would use in pricing the asset or liability based on market data obtained from sources independent of the Portfolio. Unobservable inputs reflect the Portfolio’s own assumptions about the assumptions market participants would use in pricing the asset or liability based on the information available. The inputs or methodology used for valuing assets or liabilities may not be an indication of the risks associated with investing in those assets or liabilities. The three-tier hierarchy of inputs is summarized below.
| • | | Level 1—quoted prices in active markets for an identical asset or liability |
| | |
| 18 | | MainStay VP Cornerstone Growth Portfolio |
| • | | Level 2—other significant observable inputs (including quoted prices for a similar asset or liability in active markets, interest rates and yield curves, prepayment speeds, credit risk, etc.) |
| • | | Level 3—significant unobservable inputs (including the Portfolio’s own assumptions about the assumptions that market participants would use in measuring fair value of an asset or liability) |
The level of an asset or liability within the fair value hierarchy is based on the lowest level of an input, both individually and in the aggregate, that is significant to the fair value measurement. As of June 30, 2017, the aggregate value by input level of the Portfolio’s assets and liabilities is included at the end of the Portfolio’s Portfolio of Investments.
The Portfolio may use third party vendor evaluations, whose prices may be derived from one or more of the following standard inputs, among others:
| | |
• Broker/dealer quotes | | • Benchmark securities |
• Two-sided markets | | • Reference data (corporate actions or material event notices) |
• Bids/offers | | • Monthly payment information |
• Industry and economic events | | • Reported trades |
An asset or liability for which market values cannot be measured using the methodologies described above is valued by methods deemed reasonable in good faith by the Valuation Committee, following the procedures established by the Board, to represent fair value. Under these procedures, the Portfolio generally uses a market-based approach which may use related or comparable assets or liabilities, recent transactions, market multiples, book values, and other relevant information. The Portfolio may also use an income-based valuation approach in which the anticipated future cash flows of the asset or liability are discounted to calculate fair value. Discounts may also be applied due to the nature and/or duration of any restrictions on the disposition of the asset or liability. Fair value represents a good faith approximation of the value of a security. Fair value determinations involve the consideration of a number of subjective factors, an analysis of applicable facts and circumstances and the exercise of judgment. As a result, it is possible that the fair value for a security determined in good faith in accordance with the Portfolio’s valuation procedures may differ from valuations for the same security determined by other funds using their own valuation procedures. Although the Portfolio’s valuation procedures are designed to value a security at the price the Portfolio may reasonably expect to receive upon the security’s sale in an orderly transaction, there can be no assurance that any fair value determination thereunder would, in fact, approximate the amount that the Portfolio would actually realize upon the sale of the security or the price at which the security would trade if a reliable market price were readily available. During the six-month period ended June 30, 2017, there were no material changes to the fair value methodologies.
Securities which may be valued in this manner include, but are not limited to: (i) a security for which trading has been halted or suspended; (ii) a debt security that has recently gone into default and for which there is not a current market quotation; (iii) a security of an issuer that has entered into a restructuring; (iv) a security that has been de-listed from a national exchange; (v) a security for which the market price is not readily available from a third party pricing source or, if so provided, does
not, in the opinion of the Manager or Subadvisor, reflect the security’s market value; (vi) a security subject to trading collars for which no or limited trading takes place; and (vii) a security whose principal market has been temporarily closed at a time when, under normal conditions, it would be open. Securities for which market quotations or observable inputs are not readily available are generally categorized as Level 3 in the hierarchy. As of June 30, 2017, there were no securities held by the Portfolio that were fair valued in such a manner.
Equity securities and shares of Exchange-Traded Funds (“ETFs”) are valued at the last quoted sales prices as of the close of regular trading on the relevant exchange on each valuation date. Securities that are not traded on the valuation date are valued at the mean of the last quoted bid and ask prices. Prices are normally taken from the principal market in which each security trades. Investments in mutual funds, including money market funds, are valued at their respective NAVs as of the close of the Exchange on the valuation date. These securities are generally categorized as Level 1 in the hierarchy.
Temporary cash investments acquired in excess of 60 days to maturity at the time of purchase are valued using the latest bid prices or using valuations based on a matrix system (which considers such factors as security prices, yields, maturities, and ratings), both as furnished by independent pricing services. Other temporary cash investments which mature in 60 days or less at the time of purchase (“Short-Term Investments”) are valued using the amortized cost method of valuation, unless the use of such method would be inappropriate. The amortized cost method involves valuing a security at its cost on the date of purchase and thereafter assuming a constant amortization to maturity of the difference between such cost and the value on maturity date. Amortized cost approximates the current fair value of a security. Securities valued using the amortized cost method are not valued using quoted prices in an active market and are generally categorized as Level 2 in the hierarchy.
The information above is not intended to reflect an exhaustive list of the methodologies that may be used to value portfolio investments. The valuation procedures permit the use of a variety of valuation methodologies in connection with valuing portfolio investments. The methodology used for a specific type of investment may vary based on the market data available or other considerations. The methodologies summarized above may not represent the specific means by which portfolio investments are valued on any particular business day.
A Portfolio security or other asset may be determined to be illiquid under procedures approved by the Board. Illiquidity of a security might prevent the sale of such security at a time when the Manager or Subadvisor might wish to sell, and these securities could have the effect of decreasing the overall level of the Portfolio’s liquidity. Further, the lack of an established secondary market may make it more difficult to value illiquid securities, requiring the Portfolio to rely on judgments that may be somewhat subjective in measuring value, which could vary materially from the amount that the Portfolio could realize upon disposition. Difficulty in selling illiquid securities may result in a loss or may be costly to the Portfolio. Under the supervision of the Board, the Manager or Subadvisor determines the liquidity of the Portfolio’s investments; in doing so, the Manager or Subadvisor may consider various factors, including (i) the frequency of trades and quotations, (ii) the number of dealers and prospective purchasers, (iii) dealer undertakings to make a
Notes to Financial Statements (Unaudited) (continued)
market, and (iv) the nature of the security and the market in which it trades (e.g., the time needed to dispose of the security, the method of soliciting offers and the mechanics of transfer). Illiquid securities are often valued in accordance with methods deemed by the Board in good faith to be reasonable and appropriate to accurately reflect their fair value. The liquidity of the Portfolio’s investments, as shown in the Portfolio of Investments and was determined as of June 30, 2017 and can change at any time in response to, among other relevant factors, market conditions or events or developments with respect to an individual issuer or instrument. As of June 30, 2017, the Portfolio did not hold any securities deemed to be illiquid under procedures approved by the Board.
(B) Income Taxes. The Portfolio’s policy is to comply with the requirements of the Internal Revenue Code of 1986, as amended (the “Internal Revenue Code”), applicable to regulated investment companies and to distribute all of its taxable income to the shareholders of the Portfolio within the allowable time limits. Therefore, no federal, state and local income tax provisions are required.
Management evaluates the Portfolio’s tax positions to determine if the tax positions taken meet the minimum recognition threshold in connection with accounting for uncertainties in income tax positions taken or expected to be taken for the purposes of measuring and recognizing tax liabilities in the financial statements. Recognition of tax benefits of an uncertain tax position is permitted only to the extent the position is “more likely than not” to be sustained assuming examination by taxing authorities. Management has analyzed the Portfolio’s tax positions taken on federal, state and local income tax returns for all open tax years (for up to three tax years), and has concluded that no provisions for federal, state and local income tax are required in the Portfolio’s financial statements. The Portfolio’s federal, state and local income and federal excise tax returns for tax years for which the applicable statutes of limitations have not expired are subject to examination by the Internal Revenue Service and state and local departments of revenue.
(C) Dividends and Distributions to Shareholders. Dividends and distributions are recorded on the ex-dividend date. The Portfolio intend to declare and pay dividends from net investment income and distributions from net realized capital and currency gains, if any, at least annually. Unless the shareholder elects otherwise, all dividends and distributions are reinvested in the same class of shares of the Portfolio, at NAV. Dividends and distributions to shareholders are determined in accordance with federal income tax regulations and may differ from GAAP.
(D) Security Transactions and Investment Income. The Portfolio records security transactions on the trade date. Realized gains and losses on security transactions are determined using the identified cost method. Dividend income is recognized on the ex-dividend date; net of any foreign tax withheld at the source, and interest income is accrued as earned using the effective interest rate method. Discounts and premiums on Short-Term Investments are accreted and amortized, respectively, on the straight-line method. The straight-line method approximates the effective interest method for Short-Term Investments.
Investment income and realized and unrealized gains and losses on investments of the Portfolio are allocated pro rata to the separate classes of shares based upon their relative net assets on the date the income is earned or realized and unrealized gains and losses are incurred.
(E) Expenses. Expenses of the Fund are allocated to the individual Portfolios in proportion to the net assets of the respective Portfolios when the expenses are incurred, except where direct allocations of expenses can be made. Expenses (other than fees incurred under the distribution and service plans, further discussed in Note 3(B), which are charged directly to the Service Class shares) are allocated to separate classes of shares pro rata based upon their relative net assets on the date the expenses are incurred. The expenses borne by the Portfolio, including those of related parties to the Portfolio, are shown in the Statement of Operations. Additionally, the Portfolio may invest in shares of ETFs or mutual funds, which are subject to management fees and other fees that may increase their costs versus the costs of owning the underlying securities directly. These indirect expenses of ETFs or mutual funds are not included in the amounts shown as expenses on the Portfolio’s Statement of Operations or in the expense ratios included
in the financial highlights.
(F) Use of Estimates. In preparing financial statements in conformity with GAAP, management makes estimates and assumptions that affect the reported amounts and disclosures in the financial statements. Actual results could differ from those estimates.
(G) Repurchase Agreements. The Portfolio may enter into repurchase agreements (i.e., buy a security from another party with the agreement that it be sold back in the future) to earn income. The Portfolio may enter into repurchase agreements only with counterparties, usually financial institutions, that are deemed by the Manager or Subadvisor to be creditworthy, pursuant to guidelines established by the Board. During the term of any repurchase agreement, the Manager or Subadvisor will continue to monitor the creditworthiness of the counterparty. Under the 1940 Act, repurchase agreements are considered to be collateralized loans by the Portfolio to the counterparty secured by the securities transferred to the Portfolio.
Repurchase agreements are subject to counterparty risk, meaning the Portfolio could lose money by the counterparty’s failure to perform under the terms of the agreement. The Portfolio mitigates this risk by ensuring the repurchase agreement is collateralized by cash, U.S. government securities, fixed income securities and/or other securities. The collateral is held by the Portfolio’s custodian valued daily on a mark to market basis to determine if the value, including accrued interest, exceeds the repurchase price. In the event of the counterparty’s default on the obligation to repurchase, the Portfolio has the right to liquidate the collateral and apply the proceeds in satisfaction of the obligation. Under certain circumstances, such as in the event of default or bankruptcy by the counterparty, realization and/or retention of the collateral may be limited or subject to delay, to legal proceedings and possible realized loss to the Portfolio.
(H) Securities Lending. In order to realize additional income, the Portfolio may engage in securities lending, subject to the limitations set forth in the 1940 Act and relevant guidance by the staff of the Securities and Exchange Commission (“SEC”). In the event the Portfolio does engage in securities lending, the Portfolio will lend through its custodian, State Street Bank and Trust Company (“State Street”). State Street will manage the Portfolio’s collateral in accordance with the lending agreement between the Portfolio and State Street, and indemnify the Portfolio against counterparty risk. The loans will be collateralized by U.S. Treasury securities at least equal at all times to the
| | |
| 20 | | MainStay VP Cornerstone Growth Portfolio |
market value of the securities loaned. The Portfolio may bear the risk of delay in recovery of, or loss of rights in, the securities loaned should the borrower of the securities experience financial difficulty. The Portfolio may also record a realized gain or loss on securities deemed sold due to a borrower’s inability to return securities on loan. The Portfolio bears the risk of any loss on investment of the collateral. The Portfolio will receive compensation for lending its securities in the form of fees or it will retain a portion of interest on the investment of any cash received as collateral. The Portfolio will also continue to receive interest and dividends on the securities loaned and any gain or loss in the market price of the securities loaned that may occur during the term of the loan will be for the account of the Portfolio. During the six-month period ended June 30, 2017, the Portfolio did not have any portfolio securities on loan.
(I) Indemnifications. Under the Fund’s organizational documents, its officers and trustees are indemnified against certain liabilities that may arise out of performance of their duties to the Fund. Additionally, in the normal course of business, the Portfolio enters into contracts with third-party service providers that contain a variety of representations and warranties and which may provide general indemnifications. The Portfolio’s maximum exposure under these arrangements is unknown, as this would involve future claims that may be made against the Portfolio that have not yet occurred. Based on experience, management is of the view that the risk of loss in connection with these potential indemnification obligations is remote. However, there can be no assurance that material liabilities related to such obligations will not arise in the future, which could adversely impact the Portfolio.
Note 3–Fees and Related Party Transactions
(A) Manager and Subadvisor. New York Life Investments, a registered investment adviser and an indirect, wholly-owned subsidiary of New York Life, serves as the Portfolio’s Manager pursuant to an Amended and Restated Management Agreement (“Management Agreement”). The Manager provides offices, conducts clerical, recordkeeping and bookkeeping services, and keeps most of the financial and accounting records required to be maintained by the Portfolio. Except for the portion of salaries and expenses that are the responsibility of the Portfolio, the Manager pays the salaries and expenses of all personnel affiliated with the Portfolio and certain operational expenses of the Portfolio. The Portfolio reimburses New York Life Investments in an amount equal to a portion of the compensation of the Chief Compliance Officer attributable to the Portfolio. Cornerstone Capital Managment Holdings LLC (“Cornerstone Holdings” or “Subadvisor”), a registered investment adviser, an indirect, wholly-owned subsidiary of New York Life, serves as Subadvisor to the Portfolio and is responsible for the day-to-day portfolio management of the Portfolio. Pursuant to the terms of a Subadvisory Agreement (“Subadvisory Agreement”) between New York Life Investments and Cornerstone Holdings, New York Life Investments pays for the services of the Subadvisor.
The Fund, on behalf of the Portfolio, pays New York Life Investments in its capacity as the Portfolio’s investment manager and administrator, pursuant to the Management Agreement, a monthly fee for services performed and facilities furnished at an annual rate of the Portfolio’s average daily net assets as follows: 0.70% up to $500 million; 0.65% from $500 million to $1 billion; 0.625% from $1 billion to $2 billion; and
0.60% on assets over $2 billion. During the six-month period ended June 30, 2017, the effective management fee rate was 0.70%.
During the six-month period ended June 30, 2017, New York Life Investments earned fees from the Portfolio in the amount of $1,572,887.
State Street provides sub-administration and sub-accounting services to the Portfolio pursuant to an agreement with New York Life Investments. These services include calculating the daily NAVs of the Portfolio, maintaining the general ledger and sub-ledger accounts for the calculation of the Portfolio’s NAVs, and assisting New York Life Investments in conducting various aspects of the Portfolio’s administrative operations. For providing these services to the Portfolio, State Street is compensated by New York Life Investments.
(B) Distribution and Service Fees. The Fund, on behalf of the Portfolio, has entered into a distribution agreement with NYLIFE Distributors LLC (the “Distributor”), an indirect, wholly-owned subsidiary of New York Life. The Portfolio has adopted a distribution plan (the “Plan”) in accordance with the provisions of Rule 12b-1 under the 1940 Act. Under the Plan, the Distributor has agreed to provide, through its affiliates or independent third parties, various distribution-related, shareholder and administrative support services to the Service Class shareholders. For its services, the Distributor is entitled to a combined distribution and service fee accrued daily and paid monthly at an annual rate of 0.25% of the average daily net assets attributable to the Service Class shares of the Portfolio.
Note 4–Federal Income Tax
During the year ended December 31, 2016, the tax character of distributions paid as reflected in the Statements of Changes in Net Assets was as follows:
| | |
| 2016 |
Tax-Based
Distributions
from Ordinary
Income | | Tax-Based
Distributions
from Long-Term
Gains |
| $549,429 | | $34,654,609 |
Note 5–Custodian
State Street is the custodian of cash and securities held by the Portfolio. Custodial fees are charged to the Portfolio based on the Portfolio’s net assets and/or the market value of securities held by the Portfolio and the number of certain transactions incurred by the Portfolio.
Note 6–Line of Credit
The Portfolio and certain other funds managed by New York Life Investments, maintain a line of credit with a syndicate of banks in order to secure a source of funds for temporary purposes to meet unanticipated or excessive redemption requests.
Effective August 1, 2017, under the credit agreement (the “Credit Agreement”), the aggregate commitment amount is $600,000,000 with an additional uncommitted amount of $100,000,000. The commitment fee is an annual rate of 0.15% of the average commitment amount
Notes to Financial Statements (Unaudited) (continued)
payable quarterly, regardless of usage, to State Street, who serves as the agent to the syndicate. The commitment fee is allocated among the Portfolio and certain other funds managed by New York Life Investments based upon their respective net assets and other factors. Interest on any revolving credit loan is charged based upon the Federal Funds Rate or the one month LIBOR, whichever is higher. The Credit Agreement expires on July 31, 2018, although the Portfolio, certain other funds managed by New York Life Investments and the syndicate of banks may renew the Credit Agreement for an additional year on the same or different terms. Prior to August 1, 2017, the aggregate commitment amount was $600,000,000 with an additional uncommitted amount of $100,000,000, and the commitment fee, under a credit agreement for which Bank of New York Mellon served as agent, was at an annual rate of 0.15% of the average commitment amount. During the six-month period ended June 30, 2017, there were no borrowings made or outstanding with respect to the Portfolio under the credit agreement for which Bank of New York Mellon served as agent.
Note 7–Interfund Lending Program
Pursuant to an exemptive order issued by the SEC, the Portfolio, along with certain other funds managed by New York Life Investments, may participate in an interfund lending program. The interfund lending program provides an alternative credit facility that permits the Portfolio and certain other funds managed by New York Life Investments to lend or borrow money for temporary purposes directly to or from one another, subject to the conditions of the exemptive order. During the six-month period ended June 30, 2017, there were no interfund loans made or outstanding with respect to the Portfolio.
Note 8–Purchases and Sales of Securities
(in 000’s)
During the six-month period ended June 30, 2017, purchases and sales of securities, other than short-term securities, were $347,540 and $320,468, respectively.
Note 9–Capital Share Transactions
Transactions in capital shares for the six-month period ended June 30, 2017, and the year ended December 31, 2016, were as follows:
| | | | | | | | |
Initial Class | | Shares | | | Amount | |
Six-month period ended June 30, 2017: | | | | | | | | |
Shares sold | | | 1,958,856 | | | $ | 49,353,194 | |
Shares redeemed | | | (822,681 | ) | | | (21,307,720 | ) |
| | | | | | | | |
Net increase (decrease) | | | 1,136,175 | | | $ | 28,045,474 | |
| | | | | | | | |
Year ended December 31, 2016: | | | | | | | | |
Shares sold | | | 123,198 | | | $ | 2,935,592 | |
Shares issued to shareholders in reinvestment of dividends and distributions | | | 1,274,447 | | | | 30,011,831 | |
Shares redeemed | | | (1,485,189 | ) | | | (36,316,995 | ) |
| | | | | | | | |
Net increase (decrease) | | | (87,544 | ) | | $ | (3,369,572 | ) |
| | | | | | | | |
| | | | | | | | |
Service Class | | Shares | | | Amount | |
Six-month period ended June 30, 2017: | | | | | | | | |
Shares sold | | | 141,781 | | | $ | 3,610,548 | |
Shares redeemed | | | (250,954 | ) | | | (6,385,976 | ) |
| | | | | | | | |
Net increase (decrease) | | | (109,173 | ) | | $ | (2,775,428 | ) |
| | | | | | | | |
Year ended December 31, 2016: | | | | | | | | |
Shares sold | | | 300,325 | | | $ | 7,132,388 | |
Shares issued to shareholders in reinvestment of dividends and distributions | | | 222,970 | | | | 5,192,207 | |
Shares redeemed | | | (519,817 | ) | | | (12,662,284 | ) |
| | | | | | | | |
Net increase (decrease) | | | 3,478 | | | $ | (337,689 | ) |
| | | | | | | | |
Note 10–Recent Accounting Pronouncement
In October 2016, the SEC adopted new rules and amended existing rules (together, “final rules”) intended to modernize the reporting and disclosure of information by registered investment companies. In part, the final rules amend Regulation S-X and require standardized, enhanced disclosure about derivatives in investment company financial statements, as well as other amendments. The compliance date for the amendments to Regulation S-X is August 1, 2017 and applies to shareholder reports for funds with fiscal periods ending after August 1, 2017. Management is currently evaluating the impact that the adoption of the amendments to Regulation S-X will have on the Portfolio’s financial statements and related disclosures.
Note 11–Subsequent Events
In connection with the preparation of the financial statements of the Portfolio as of and for the six-month period ended June 30, 2017, events and transactions subsequent to June 30, 2017, through the date the financial statements were issued have been evaluated by the Portfolio’s management for possible adjustment and/or disclosure. No subsequent events requiring financial statement adjustment or disclosure have been identified.
| | |
| 22 | | MainStay VP Cornerstone Growth Portfolio |
Proxy Voting Policies and Procedures and Proxy Voting Record
A description of the policies and procedures that New York Life Investments uses to vote proxies related to the Portfolio’s securities is available without charge, upon request, (i) by calling 800-598-2019 or (ii) by visiting the SECs website at www.sec.gov.
The Portfolio is required to file with the SEC its proxy voting record for the 12-month period ending June 30 on Form N-PX. The Portfolio’s most recent Form N-PX or proxy voting record is available free of charge upon request (i) by calling 800-598-2019 or; (ii) by visiting the SEC’s website at www.sec.gov.
Shareholder Reports and Quarterly Portfolio Disclosure
The Portfolio is required to file its complete schedule of portfolio holdings with the SEC for its first and third fiscal quarters on Form N-Q. The Portfolio’s Form N-Q is available without charge on the SEC’s website at www.sec.gov or by calling MainStay Investments at 800-598-2019. You also can obtain and review copies of Form N-Q by visiting the SEC’s Public Reference Room in Washington, DC (information on the operation of the Public Reference Room may be obtained by calling 1-800-SEC-0330).
This page intentionally left blank
This page intentionally left blank
This page intentionally left blank
MainStay VP Portfolios
MainStay VP offers a wide range of Portfolios. The full array of MainStay VP offerings is listed here, with information about the manager, subadvisors, legal counsel, and independent registered public accounting firm.
Equity Portfolios
MainStay VP Common Stock Portfolio
MainStay VP Cornerstone Growth Portfolio
MainStay VP Eagle Small Cap Growth Portfolio
MainStay VP Emerging Markets Equity Portfolio
MainStay VP Epoch U.S. Equity Yield Portfolio
MainStay VP Epoch U.S. Small Cap Portfolio
MainStay VP International Equity Portfolio
MainStay VP Large Cap Growth Portfolio
MainStay VP MFS® Utilities Portfolio
MainStay VP Mid Cap Core Portfolio
MainStay VP S&P 500 Index Portfolio
MainStay VP Small Cap Core Portfolio
MainStay VP T. Rowe Price Equity Income Portfolio
MainStay VP VanEck Global Hard Assets Portfolio
Mixed Asset Portfolios
MainStay VP Balanced Portfolio
MainStay VP Convertible Portfolio
MainStay VP Cushing Renaissance Advantage Portfolio
MainStay VP Income Builder Portfolio
MainStay VP Janus Henderson Balanced Portfolio
Income Portfolios
MainStay VP Bond Portfolio
MainStay VP Floating Rate Portfolio
MainStay VP Government Portfolio
MainStay VP High Yield Corporate Bond Portfolio
MainStay VP Indexed Bond Portfolio
MainStay VP PIMCO Real Return Portfolio
MainStay VP Unconstrained Bond Portfolio
Money Market
MainStay VP U.S. Government Money Market Portfolio
Alternative
MainStay VP Absolute Return Multi-Strategy Portfolio
Asset Allocation Portfolios
MainStay VP Conservative Allocation Portfolio
MainStay VP Growth Allocation Portfolio
MainStay VP Moderate Allocation Portfolio
MainStay VP Moderate Growth Allocation Portfolio
Manager
New York Life Investment Management LLC
New York, New York
Subadvisors
Candriam Belgium*
Brussels, Belgium
Candriam France S.A.S.*
Paris, France
Cornerstone Capital Management Holdings LLC*
New York, New York
Cushing Asset Management, LP
Dallas, Texas
Eagle Asset Management, Inc.
St Petersburg, Florida
Epoch Investment Partners, Inc.
New York, New York
Janus Capital Management LLC
Denver, Colorado
MacKay Shields LLC*
New York, New York
Massachusetts Financial Services Company
Boston, Massachusetts
NYL Investors LLC*
New York, New York
Pacific Investment Management Company LLC
Newport Beach, California
T. Rowe Price Associates, Inc.
Baltimore, Maryland
Van Eck Associates Corporation
New York, New York
Winslow Capital Management, LLC
Minneapolis, Minnesota
Distributor
NYLIFE Distributors LLC*
Jersey City, New Jersey
Custodian
State Street Bank and Trust Company
Boston, Massachusetts
Independent Registered Public Accounting Firm
PricewaterhouseCoopers LLP
New York, New York
Legal Counsel
Dechert LLP
Washington, District of Columbia
Some Portfolios may not be available in all products.
* An affiliate of New York Life Investment Management LLC
Not part of the Semiannual Report
2017 Semiannual Report
This report is for the general information of New York Life Variable Annuities and NYLIAC Variable Universal Life Insurance Products policyowners. It must be preceded or accompanied by the appropriate product(s) and funds prospectuses if it is given to anyone who is not an owner of a New York Life variable annuity policy or a NYLIAC Variable Universal Life Insurance Product. This report does not offer for sale or solicit orders to purchase securities.
The performance data quoted in this report represents past performance. Past performance is no guarantee of future results. Due to market volatility and other factors, current performance may be lower or higher than the figures shown. The most recent month-end performance summary for your variable annuity or variable life policy is available by calling 800-598-2019 and is updated periodically on www.newyorklife.com.
The New York Life Variable Annuities and NYLIAC Variable Universal Life Insurance Products are issued by New York Life Insurance and Annuity Corporation (a Delaware Corporation) and distributed by NYLIFE Distributors LLC (Member FINRA/SIPC).
New York Life Insurance Company
New York Life Insurance and Annuity Corporation (NYLIAC) (A Delaware Corporation)
51 Madison Avenue, Room 551
New York, NY 10010
www.newyorklife.com
Printed on recycled paper
mainstayinvestments.com
NYLIFE Distributors LLC, 30 Hudson Street, Jersey City, NJ 07302
New York Life Investment Management LLC is the investment manager to the MainStay VP Funds Trust
©2017 by NYLIFE Distributors LLC. All rights reserved.
You may obtain copies of the Prospectus and the Statement of Additional Information free of charge, upon request, by calling toll-free 800-598-2019 or writing to New York Life Insurance and Annuity Corporation, 51 Madison Avenue, New York, NY 10010.
| | | | |
| Not FDIC Insured | | No Bank Guarantee | | May Lose Value |
| | | | |
| 1744204 | | | | MSVPCG10-08/17 (NYLIAC) NI513 |
MainStay VP Convertible Portfolio
Message from the President and Semiannual Report
Unaudited | June 30, 2017

Sign up for electronic delivery of your shareholder reports. For full details on electronic delivery, including who can participate and what you
can receive via eDelivery, please log on to www.newyorklife.com/vsc

This page intentionally left blank
Message from the President
The six months ended June 30, 2017, brought positive results to many stock and bond investors. The year began with many investors hoping that Republican control of the White House, the Senate and the House of Representatives could bring an end to political gridlock; and while debate has continued on a number of issues, the U.S. stock market climbed relatively steadily throughout the first half of 2017.
According to FTSE-Russell U.S. market data, stocks at all capitalization levels tended to record positive total returns during the reporting period, with large-cap stocks generally outperforming stocks of smaller-capitalization companies. Growth stocks outpaced value stocks at every capitalization level by substantial margins—from more than six percentage points for micro-caps and mid-caps to more than 10 percentage points for the largest 200 U.S. companies by market capitalization.
Most sectors of the stock market advanced during the reporting period, with energy and telecommunication services being notable exceptions. Energy stocks declined as oil prices fell despite moves by the Organization of Petroleum Exporting Countries (OPEC) intended to limit oil production by its members. Telecommunication services stocks tended to decline as competition increased and rising interest rates made dividend payouts less appealing.
In March and June of 2017, the Federal Reserve announced successive increases in the target range for the federal funds rate, ultimately bringing the federal funds target range to 1.00% to 1.25%. While short-term U.S. Treasury yields rose in response, yields for U.S. Treasury securities with maturities of five years or longer declined. As the difference between short- and long-term yields narrowed, the advantages of higher-yielding long-term bonds became increasingly apparent.
Virtually all taxable and tax-exempt bond sectors provided positive total returns during the reporting period. Mortgage-backed
securities, though providing positive total returns, faced headwinds when the Federal Reserve announced plans to begin normalizing its balance sheet by reducing reinvestment of principal payments on mortgage-backed securities.
International stock and bond markets were also strong during the reporting period. International stocks provided double-digit total returns that were surpassed by emerging-market stocks as a whole. Global investment-grade bonds provided single-digit returns; and emerging-market debt was somewhat stronger.
Even during periods of favorable market performance and generally positive returns, MainStay believes that it is important to carefully monitor your investments. Your risk tolerance may
change over time, leading you to reevaluate which MainStay VP Portfolios are most appropriate for your long-term goals. Your goals themselves may also change, leading you to pursue investments with more or less risk. The portfolio managers of MainStay VP Portfolios seek to provide results consistent with the investment objectives of their respective Portfolios, to give you a wide range of choices suitable to various investment needs.
The report that follows provides more detailed information about the specific markets, securities and investment decisions that influenced your MainStay VP Portfolio during the six months ended June 30, 2017. We invite you to review the report carefully as part of your ongoing investment evaluation and review.
Sincerely,

Stephen P. Fisher
President
The opinions expressed are as of the date of the accompanying report and are subject to change. Past performance is no guarantee of future results. There is no guarantee that any forecasts made will come to pass. This material does not constitute investment advice and is not intended as an endorsement of any specific investment.
Not all MainStay VP Portfolios and/or share classes are available under all policies.
Not part of the Semiannual Report
Table of Contents
Investors should refer to the Portfolio’s Summary Prospectus and/or Prospectus and consider the Portfolio’s investment objectives, strategies, risks, charges and expenses carefully before investing. The Summary Prospectus and/or Prospectus contain this and other information about the Portfolio. You may obtain copies of the Portfolio’s Summary Prospectus and/or the Prospectus and the Statement of Additional Information free of charge, upon request, by calling toll-free 800-598-2019, by writing to New York Life Insurance and Annuity Corporation, 51 Madison Avenue, Room 251, New York, New York 10010 or by sending an email to MainStayShareholdersServices@nylim.com. These documents are also available at mainstayinvestments.com/vpdocuments. Please read the Summary Prospectus and/or Prospectus carefully before investing. MainStay VP Funds Trust portfolios are separate account options which are purchased through a variable insurance or variable annuity contract.
Investment and Performance Comparison (Unaudited)
Performance data quoted represents past performance. Past performance is no guarantee of future results. Because of market volatility and other factors, current performance may be lower or higher than the figures shown. Investment return and principal value will fluctuate, and as a result, when shares are redeemed, they may be worth more or less than their original cost. The performance table and graph do not reflect any deduction of sales charges, mortality and expense charges, contract charges or administrative charges. Please refer to the Performance Summary appropriate for your policy. For performance information current to the most recent month-end, please call 800-598-2019 or visit www.newyorklife.com.
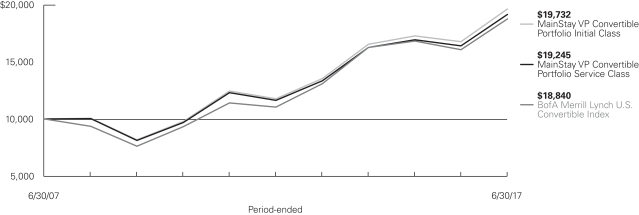
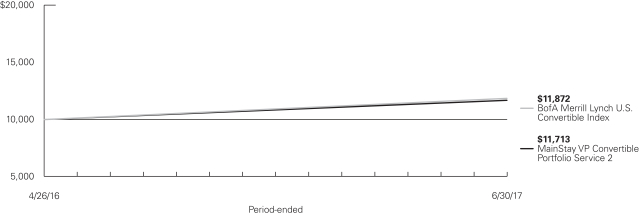
Average Annual Total Returns for the Period Ended June 30, 2017
| | | | | | | | | | | | | | | | | | | | | | |
| Class | | Inception
Date | | Six Months | | | One Year | | | Five Years
or Since
Inception | | | Ten Years
or Since
Inception | | | Gross
Expense
Ratio1 | |
| Initial Class Shares | | 10/1/1996 | | | 6.66 | % | | | 17.20 | % | | | 10.83 | % | | | 7.03 | % | | | 0.64 | % |
| Service Class Shares | | 6/5/2003 | | | 6.53 | | | | 16.91 | | | | 10.55 | | | | 6.77 | | | | 0.89 | |
| Service 2 Class Shares | | 4/26/2016 | | | 6.47 | | | | 16.79 | | | | 14.33 | | | | N/A | | | | 1.00 | |
| | | | | | | | | | | | | | | | |
| Benchmark Performance | | Six
Months | | | One
Year | | | Five
Years | | | Ten
Years | |
BofA Merrill Lynch U.S. Convertible Index2 | | | 7.89 | % | | | 16.79 | % | | | 11.25 | % | | | 6.54 | % |
Average Lipper Convertible Securities Fund3 | | | 7.37 | | | | 14.48 | | | | 8.54 | | | | 4.87 | |
| 1. | The gross expense ratios presented reflect the Portfolio’s “Total Annual Portfolio Operating Expenses” from the most recent Prospectus and may differ from other expense ratios disclosed in this report. |
| 2. | The BofA Merrill Lynch U.S. Convertible Index is the Portfolio’s primary broad-based securities market index for comparison purposes. The BofA Merrill Lynch U.S. Convertible Index is a market-capitalization weighted index of domestic corporate convertible securities. In order to be included in this Index, bonds and preferred stocks must be convertible only to common |
| | stock. Results assume reinvestment of all dividends and capital gains. An investment cannot be made directly in an index. |
| 3. | The Average Lipper Convertible Securities Fund is representative of funds that invest primarily in convertible bonds and/or convertible preferred stock. This benchmark is a product of Lipper Inc. Lipper Inc. is an independent monitor of fund performance. Results are based on average total returns of similar portfolios with all dividend and capital gain distributions reinvested. |
Cost in Dollars of a $1,000 Investment in MainStay VP Convertible Portfolio (Unaudited)
The example below is intended to describe the fees and expenses borne by shareholders during the six-month period from January 1, 2017 to June 30, 2017 and the impact of those costs on your investment.
Example
As a shareholder of the Portfolio, you incur two types of costs: (1) transaction costs, including exchange fees and sales charges (loads) on purchases (as applicable), and (2) ongoing costs, including management fees, distribution and/or service (12b-1) fees, and other Portfolio expenses (as applicable). This example is intended to help you understand your ongoing costs (in dollars) of investing in the Portfolio and to compare these costs with the ongoing costs of investing in other mutual funds. The example is based on an investment of $1,000 made at the beginning of the six-month period and held for the entire period from January 1, 2017 to June 30, 2017.
This example illustrates your Portfolio’s ongoing costs in two ways:
Actual Expenses
The second and third data columns in the table below provide information about actual account values and actual expenses. You may use the information in these columns, together with the amount you invested, to estimate the expenses that you paid during the six months ended June 30, 2017. Simply divide your account value by $1,000 (for example, an $8,600 account value divided by $1,000 = 8.6), then
multiply the result by the number under the heading entitled “Expenses Paid During Period” to estimate the expenses you paid on your account during this period.
Hypothetical Example for Comparison Purposes
The fourth and fifth data columns in the table below provide information about hypothetical account values and hypothetical expenses based on the Portfolio’s actual expense ratio and an assumed rate of return of 5% per year before expenses, which is not the Portfolio’s actual return. The hypothetical account values and expenses may not be used to estimate the actual ending account balances or expenses you paid for the six-month period shown. You may use this information to compare the ongoing costs of investing in the Portfolio with the ongoing costs of investing in other mutual funds. To do so, compare this 5% hypothetical example with the 5% hypothetical examples that appear in the shareholder reports of the other mutual funds.
Please note that the expenses shown in the table are meant to highlight your ongoing costs only and do not reflect any transactional costs, such as exchange fees or sales charges (loads). Therefore, the fourth and fifth data columns of the table are useful in comparing ongoing costs only and will not help you determine the relative total costs of owning different funds. In addition, if these transactional costs were included, your costs would have been higher.
| | | | | | | | | | | | | | | | | | | | | | |
| | | | | | | | | | | | | | | | | | |
| Share Class | | Beginning
Account
Value
1/1/17 | | | Ending Account
Value (Based
on Actual
Returns and
Expenses)
6/30/17 | | | Expenses
Paid
During
Period1 | | | Ending Account
Value (Based
on Hypothetical
5% Annualized
Return and
Actual Expenses)
6/30/17 | | | Expenses
Paid
During
Period1 | | | Net Expense
Ratio
During
Period2 |
| | | | | | |
| Initial Class Shares | | $ | 1,000.00 | | | $ | 1,066.60 | | | $ | 3.18 | | | $ | 1,021.70 | | | $ | 3.11 | | | 0.62% |
| | | | | | |
| Service Class Shares | | $ | 1,000.00 | | | $ | 1,065.30 | | | $ | 4.46 | | | $ | 1,020.50 | | | $ | 4.36 | | | 0.87% |
| | | | | | |
| Service 2 Class Shares | | $ | 1,000.00 | | | $ | 1,064.70 | | | $ | 4.97 | | | $ | 1,020.00 | | | $ | 4.86 | | | 0.97% |
| 1. | Expenses are equal to the Portfolio’s annualized expense ratio of each class multiplied by the average account value over the period, divided by 365 and multiplied by 181 (to reflect the six-month period). The table above represents the actual expenses incurred during the six-month period. |
| 2. | Expenses are equal to the Portfolio’s annualized expense ratio to reflect the six-month period. |
| | |
| 6 | | MainStay VP Convertible Portfolio |
Portfolio Composition as of June 30, 2017 (Unaudited)
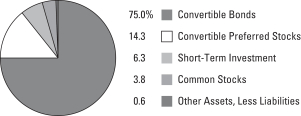
See Portfolio of Investments beginning on page 10 for specific holdings within these categories.
Top Ten Holdings or Issuers Held as of June 30, 2017 (excluding short-term investment) (Unaudited)
| 1. | Priceline Group, Inc. (The), 0.35%–1.00%, due 3/15/18–6/15/20 |
| 2. | Microchip Technology, Inc., 1.625%, due 2/15/25–2/15/27 |
| 3. | DISH Network Corp., 3.375%, due 8/15/26 |
| 4. | Danaher Corp., (zero coupon), due 1/22/21 |
| 6. | Air Lease Corp., 3.875%, due 12/1/18 |
| 7. | Macquarie Infrastructure Corp., 2.875%, due 7/15/19 |
| 8. | XPO Logistics, Inc., 4.50%, due 10/1/17 |
| 9. | NXP Semiconductors N.V., 1.00%, due 12/1/19 |
| 10. | Hologic, Inc., 2.00%, due 3/1/42 |
Portfolio Management Discussion and Analysis (Unaudited)
Answers to the questions reflect the views of portfolio manager Edward Silverstein, CFA, of MacKay Shields LLC, the Portfolio’s Subadvisor.
How did MainStay VP Convertible Portfolio perform relative to its benchmark and peers for the six months ended June 30, 2017?
For the six months ended June 30, 2017, MainStay VP Convertible Portfolio returned 6.66% for Initial Class shares, 6.53% for Service Class shares and 6.47% for Service 2 Class shares. Over the same period, all share classes underperformed the 7.89% return of the BofA Merrill Lynch U.S. Convertible Index,1 which is the Portfolio’s benchmark, and the 7.37% return of the Average Lipper2 Convertible Securities Fund.
What factors affected the Portfolio’s relative performance during the reporting period?
The Portfolio’s relative performance during the reporting period was positively affected by security selection in the technology and transportation sectors. In technology, convertible bonds of semiconductor chip developers Advanced Micro Devices and Xilinx were strong relative performers. Semiconductor companies benefited relative performance as they generally reported better-than-expected sales and earnings, as most of their end markets remained strong. These end markets included autos, gaming and emerging technologies such as self-driving automobiles.
In transportation, convertible bonds of logistics and trucking company XPO Logistics were among the Portfolio’s better-performing holdings on a relative basis during the reporting period. In addition, the convertible bonds of Air Lease Corp. provided a significant contribution to relative performance. (Contributions take weightings and total returns into account.) XPO was a standout relative performer after the company’s 2016 financial results allayed investor fears that the company was making too many acquisitions and taking on too much debt. XPO’s year-end results showed that the company was generating free cash flow, selling less desirable operations and paying down debt.
On a relative basis, the Portfolio underperformed the BofA Merrill Lynch U.S. Convertible Index, in large part because of the Portfolio’s overweight position in the energy sector. Convertible holdings of most of the Portfolio’s energy-related companies declined during the reporting period, largely in concert with the declining price of crude oil. The Portfolio’s holdings in synthetic convertible bonds of Schlumberger, convertible preferred shares of energy producer Southwestern Energy, and convertible bonds of energy service companies Helix Energy and Ensco were all noteworthy detractors from the Portfolio’s relative performance.
Credit selection within the health care and industrials sectors also detracted from relative performance.
What was the Portfolio’s duration3 strategy during the reporting period?
Convertible bond prices tend to vary with changes in the price of the underlying equity security rather than with changes in interest rates. For this reason, duration does not guide our investment decisions regarding the Portfolio’s convertible security holdings. As of June 30, 2017, the Portfolio’s effective duration was 3.9 years.
Which sectors were the strongest contributors to the Portfolio’s performance, and which sectors were particularly weak?
During the reporting period, the Portfolio’s best-performing sectors relative to the BofA Merrill Lynch U.S. Convertible Index were transportation and information technology. Over the same period, the sectors that detracted the most from the Portfolio’s relative performance were energy and financials.
Did the Portfolio make any significant purchases or sales during the reporting period?
During the reporting period, the Portfolio bought convertible bonds of gift card company Blackhawk Network Holdings and convertible preferred shares of tool company Stanley Black & Decker. Blackhawk provides a range of prepaid gift, phone and debit cards in physical and electronic forms. It also provides related prepaid products and payment services in the United States and internationally. The Portfolio bought the convertible bonds because of the company’s strong free cash flow and the low level of competition in the company’s market segment. We initiated a position in convertible preferred shares of Stanley Black & Decker because we believed that the company’s product line-up was likely to benefit from an improving economy. The company had generated solid free cash flow, and the convertible preferred shares have a generous coupon.
Schlumberger’s convertible synthetic security matured in May 2017, so that position was closed out. The Portfolio’s convertible bonds of HealthSouth were also called away during the reporting period when the company exercised its right to buy back the bond.
| 1. | See footnote on page 5 for more information on the BofA Merrill Lynch U.S. Convertible Index. |
| 2. | See footnote on page 5 for more information on Lipper Inc. |
| 3. | Duration is a measure of the price sensitivity of a fixed-income investment to changes in interest rates. Duration is expressed as a number of years and is considered a more accurate sensitivity gauge than average maturity. |
| | |
| 8 | | MainStay VP Convertible Portfolio |
How did the Portfolio’s sector weightings change during the reporting period?
During the reporting period, the Portfolio increased its weighting in the consumer discretionary and information technology sectors. Over the same period, the Portfolio decreased its weightings in industrials and financials. Sector-weighting changes are typically not determined by the sectors themselves but by opportunities in individual securities within those sectors.
How was the Portfolio positioned at the end of the reporting period?
As of June 30, 2017, the Portfolio held overweight positions relative to the BofA Merrill Lynch U.S. Convertible Index in industrials, health care and energy. As of the same date, the Portfolio held an underweight position in financials and, to a lesser degree, an underweight position in the consumer discretionary sector.
The opinions expressed are those of the portfolio manager as of the date of this report and are subject to change. There is no guarantee that any forecasts made will come to pass. This material does not constitute investment advice and is not intended as an endorsement of any specific investment.
Not all MainStay VP Portfolios and/or share classes are available under all policies.
Portfolio of Investments June 30, 2017 (Unaudited)
| | | | | | | | |
| | | Principal
Amount | | | Value | |
Convertible Securities 89.3%† Convertible Bonds 75.0% | | | | | |
Auto Manufacturers 1.1% | | | | | | | | |
Wabash National Corp.
3.375%, due 5/1/18 | | $ | 4,127,000 | | | $ | 7,944,475 | |
| | | | | | | | |
|
Biotechnology 4.7% | |
BioMarin Pharmaceutical, Inc.
0.75%, due 10/15/18 | | | 13,105,000 | | | | 14,587,503 | |
Illumina, Inc. | |
(zero coupon), due 6/15/19 | | | 2,699,000 | | | | 2,739,485 | |
0.50%, due 6/15/21 | | | 7,153,000 | | | | 7,644,769 | |
Intercept Pharmaceuticals, Inc.
3.25%, due 7/1/23 | | | 5,052,000 | | | | 4,938,330 | |
Ionis Pharmaceuticals, Inc.
1.00%, due 11/15/21 | | | 5,385,000 | | | | 5,724,928 | |
| | | | | | | | |
| | | | 35,635,015 | |
| | | | | | | | |
Commercial Services 3.8% | |
Carriage Services, Inc.
2.75%, due 3/15/21 | | | 4,631,000 | | | | 6,028,983 | |
LendingTree, Inc.
0.625%, due 6/1/22 (a) | | | 5,430,000 | | | | 5,925,488 | |
¨Macquarie Infrastructure Corp.
2.875%, due 7/15/19 | | | 15,467,000 | | | | 17,168,370 | |
| | | | | | | | |
| | | | 29,122,841 | |
| | | | | | | | |
Computers 1.3% | |
Lumentum Holdings, Inc.
0.25%, due 3/15/24 (a) | | | 8,377,000 | | | | 9,848,211 | |
| | | | | | | | |
|
Diversified Financial Services 3.4% | |
¨Air Lease Corp.
3.875%, due 12/1/18 | | | 12,427,000 | | | | 17,211,395 | |
Blackhawk Network Holdings, Inc.
1.50%, due 1/15/22 (a) | | | 7,772,000 | | | | 8,704,640 | |
| | | | | | | | |
| | | | 25,916,035 | |
| | | | | | | | |
Health Care—Products 6.8% | |
¨Danaher Corp.
(zero coupon), due 1/22/21 | | | 6,483,000 | | | | 20,915,778 | |
¨Hologic, Inc.
2.00%, due 3/1/42 (b) | | | 10,558,000 | | | | 15,493,865 | |
Teleflex, Inc.
3.875%, due 8/1/17 | | | 4,449,000 | | | | 15,098,794 | |
| | | | | | | | |
| | | | 51,508,437 | |
| | | | | | | | |
Health Care—Services 3.1% | |
Anthem, Inc.
2.75%, due 10/15/42 | | | 4,852,000 | | | | 12,521,192 | |
| | | | | | | | |
| | | Principal
Amount | | | Value | |
Health Care—Services (continued) | |
Molina Healthcare, Inc.
1.625%, due 8/15/44 | | $ | 8,742,000 | | | $ | 11,195,224 | |
| | | | | | | | |
| | | | 23,716,416 | |
| | | | | | | | |
Internet 8.9% | |
Liberty Expedia Holdings, Inc.
1.00%, due 6/30/47 (a) | | | 7,641,000 | | | | 8,161,543 | |
MercadoLibre, Inc.
2.25%, due 7/1/19 | | | 4,207,000 | | | | 8,540,210 | |
¨Priceline Group, Inc. (The) | |
0.35%, due 6/15/20 | | | 7,553,000 | | | | 11,131,234 | |
1.00%, due 3/15/18 | | | 8,317,000 | | | | 16,441,669 | |
Proofpoint, Inc.
0.75%, due 6/15/20 | | | 5,973,000 | | | | 7,469,983 | |
Twitter, Inc.
0.25%, due 9/15/19 | | | 9,402,000 | | | | 8,926,024 | |
WebMD Health Corp. | |
1.50%, due 12/1/20 | | | 2,620,000 | | | | 3,338,863 | |
2.625%, due 6/15/23 | | | 3,379,000 | | | | 3,324,091 | |
| | | | | | | | |
| | | | 67,333,617 | |
| | | | | | | | |
Machinery—Diversified 1.3% | |
Chart Industries, Inc.
2.00%, due 8/1/18 | | | 9,728,000 | | | | 9,691,520 | |
| | | | | | | | |
|
Media 4.7% | |
¨DISH Network Corp.
3.375%, due 8/15/26 (a) | | | 17,289,000 | | | | 21,049,357 | |
Liberty Media Corp-Liberty Formula One
1.00%, due 1/30/23 (a) | | | 6,664,000 | | | | 7,751,065 | |
Liberty Media Corp.
1.375%, due 10/15/23 | | | 5,512,000 | | | | 6,553,217 | |
| | | | | | | | |
| | | | 35,353,639 | |
| | | | | | | | |
Oil & Gas 1.6% | |
Ensco Jersey Finance, Ltd.
3.00%, due 1/31/24 (a) | | | 5,863,000 | | | | 4,536,496 | |
Oasis Petroleum, Inc.
2.625%, due 9/15/23 | | | 7,782,000 | | | | 7,650,679 | |
| | | | | | | | |
| | | | 12,187,175 | |
| | | | | | | | |
Oil & Gas Services 3.0% | |
Helix Energy Solutions Group, Inc.
4.25%, due 5/1/22 | | | 9,729,000 | | | | 9,127,018 | |
Newpark Resources, Inc.
4.00%, due 12/1/21 (a) | | | 2,098,000 | | | | 2,275,019 | |
Weatherford International, Ltd.
5.875%, due 7/1/21 | | | 11,066,000 | | | | 11,225,074 | |
| | | | | | | | |
| | | | 22,627,111 | |
| | | | | | | | |
| † | Percentages indicated are based on Portfolio net assets. |
| ¨ | | Among the Portfolio’s 10 largest holdings or issuers held, as of June 30, 2017, excluding short-term investment. May be subject to change daily. |
| | | | |
| 10 | | MainStay VP Convertible Portfolio | | The notes to the financial statements are an integral part of,
and should be read in conjunction with, the financial statements. |
| | | | | | | | |
| | | Principal
Amount | | | Value | |
| Convertible Bonds (continued) | | | | | |
Pharmaceuticals 1.8% | |
Depomed, Inc.
2.50%, due 9/1/21 | | $ | 3,956,000 | | | $ | 3,486,225 | |
Neurocrine Biosciences, Inc.
2.25%, due 5/15/24 (a) | | | 1,364,000 | | | | 1,358,033 | |
Pacira Pharmaceuticals, Inc.
2.375%, due 4/1/22 (a) | | | 3,730,000 | | | | 3,972,450 | |
Teva Pharmaceutical Finance Co. LLC
0.25%, due 2/1/26 | | | 4,333,000 | | | | 4,668,807 | |
| | | | | | | | |
| | | | 13,485,515 | |
| | | | | | | | |
Real Estate Investment Trusts 1.1% | |
SL Green Operating Partnership, L.P.
3.00%, due 10/15/17 (a) | | | 6,391,000 | | | | 8,691,760 | |
| | | | | | | | |
|
Semiconductors 12.5% | |
Advanced Micro Devices, Inc.
2.125%, due 9/1/26 | | | 3,575,000 | | | | 6,269,656 | |
Inphi Corp.
1.125%, due 12/1/20 | | | 7,578,000 | | | | 8,534,723 | |
Lam Research Corp.
1.25%, due 5/15/18 | | | 4,539,000 | | | | 10,615,586 | |
¨Microchip Technology, Inc. | |
1.625%, due 2/15/27 (a) | | | 5,198,000 | | | | 5,490,388 | |
1.625%, due 2/15/25 | | | 12,203,000 | | | | 18,418,903 | |
Micron Technology, Inc.
3.00%, due 11/15/43 | | | 5,775,000 | | | | 6,525,750 | |
¨NXP Semiconductors N.V.
1.00%, due 12/1/19 | | | 13,018,000 | | | | 15,589,055 | |
ON Semiconductor Corp.
1.00%, due 12/1/20 | | | 8,174,000 | | | | 8,521,395 | |
Rambus, Inc.
1.125%, due 8/15/18 | | | 5,665,000 | | | | 6,153,606 | |
Silicon Laboratories, Inc.
1.375%, due 3/1/22 (a) | | | 8,701,000 | | | | 9,038,164 | |
| | | | | | | | |
| | | | 95,157,226 | |
| | | | | | | | |
Software 9.9% | |
Citrix Systems, Inc.
0.50%, due 4/15/19 | | | 5,869,000 | | | | 7,061,141 | |
HubSpot, Inc.
0.25%, due 6/1/22 (a) | | | 4,076,000 | | | | 3,961,363 | |
NICE Systems, Inc.
1.25%, due 1/15/24 (a) | | | 11,436,000 | | | | 12,801,172 | |
Nuance Communications, Inc.
1.25%, due 4/1/25 (a) | | | 8,331,000 | | | | 8,445,551 | |
RealPage, Inc.
1.50%, due 11/15/22 (a) | | | 4,033,000 | | | | 4,408,573 | |
Red Hat, Inc.
0.25%, due 10/1/19 | | | 4,301,000 | | | | 5,959,573 | |
Salesforce.com, Inc.
0.25%, due 4/1/18 | | | 8,471,000 | | | | 11,224,075 | |
| | | | | | | | |
| | | Principal
Amount | | | Value | |
Software (continued) | |
ServiceNow, Inc.
(zero coupon), due 11/1/18 | | $ | 6,556,000 | | | $ | 9,616,832 | |
Verint Systems, Inc.
1.50%, due 6/1/21 | | | 12,098,000 | | | | 11,908,969 | |
| | | | | | | | |
| | | | 75,387,249 | |
| | | | | | | | |
Telecommunications 1.6% | |
Finisar Corp.
0.50%, due 12/15/36 (a) | | | 4,846,000 | | | | 4,743,023 | |
Viavi Solutions, Inc.
1.00%, due 3/1/24 (a) | | | 7,140,000 | | | | 7,497,000 | |
| | | | | | | | |
| | | | 12,240,023 | |
| | | | | | | | |
Transportation 4.4% | |
Atlas Air Worldwide Holdings, Inc.
2.25%, due 6/1/22 | | | 8,972,000 | | | | 9,476,675 | |
Echo Global Logistics, Inc.
2.50%, due 5/1/20 | | | 7,629,000 | | | | 7,342,912 | |
¨XPO Logistics, Inc.
4.50%, due 10/1/17 | | | 4,178,000 | | | | 16,458,709 | |
| | | | | | | | |
| | | | 33,278,296 | |
| | | | | | | | |
Total Convertible Bonds
(Cost $494,995,108) | | | | | | | 569,124,561 | |
| | | | | | | | |
| | |
| | | | | | | | |
| | |
| | | Shares | | | | |
| Convertible Preferred Stocks 14.3% | | | | | |
Aerospace & Defense 0.3% | | | | | | | | |
Arconic, Inc.
5.375% | | | 59,015 | | | | 2,112,737 | |
| | | | | | | | |
|
Banks 2.8% | |
¨Bank of America Corp.
Series L
7.25% | | | 8,636 | | | | 10,898,546 | |
Wells Fargo & Co.
Series L
7.50% | | | 8,264 | | | | 10,835,013 | |
| | | | | | | | |
| | | | 21,733,559 | |
| | | | | | | | |
Chemicals 1.3% | |
A. Schulman, Inc.
6.00% | | | 11,643 | | | | 9,919,836 | |
| | | | | | | | |
|
Food 1.7% | |
Post Holdings, Inc.
3.75% | | | 41,824 | | | | 7,001,547 | |
Tyson Foods, Inc.
4.75% | | | 87,752 | | | | 5,947,830 | |
| | | | | | | | |
| | | | 12,949,377 | |
| | | | | | | | |
| | | | | | |
The notes to the financial statements are an integral part of,
and should be read in conjunction with, the financial statements. | | | | | 11 | |
Portfolio of Investments June 30, 2017 (Unaudited) (continued)
| | | | | | | | |
| | |
| | | Shares | | | Value | |
| Convertible Preferred Stocks (continued) | | | | | |
Hand & Machine Tools 0.3% | |
Stanley Black & Decker, Inc.
5.375% | | | 20,480 | | | $ | 2,247,066 | |
| | | | | | | | |
|
Health Care—Products 0.8% | |
Becton Dickinson & Co.
Series A
6.125% | | | 112,412 | | | | 6,157,929 | |
| | | | | | | | |
|
Oil & Gas 1.9% | |
Hess Corp.
8.00% | | | 211,085 | | | | 11,740,548 | |
Sanchez Energy Corp.
Series A
4.875% | | | 23,784 | | | | 653,377 | |
Southwestern Energy Co.
Series B
6.25% | | | 129,303 | | | | 1,886,531 | |
| | | | | | | | |
| | | | 14,280,456 | |
| | | | | | | | |
Pharmaceuticals 2.6% | |
Allergan PLC
Series A
5.50% | | | 12,145 | | | | 10,542,831 | |
Teva Pharmaceutical Industries, Ltd.
7.00% | | | 15,844 | | | | 9,419,258 | |
| | | | | | | | |
| | | | 19,962,089 | |
| | | | | | | | |
Real Estate Investment Trusts 1.8% | |
American Tower Corp.
5.50% | | | 96,375 | | | | 11,683,541 | |
Welltower, Inc.
Series I
6.50% | | | 26,800 | | | | 1,775,768 | |
| | | | | | | | |
| | | | 13,459,309 | |
| | | | | | | | |
Telecommunications 0.8% | |
T-Mobile U.S., Inc.
5.50% | | | 60,081 | | | | 5,926,390 | |
| | | | | | | | |
Total Convertible Preferred Stocks
(Cost $113,248,127) | | | | 108,748,748 | |
| | | | | | | | |
Total Convertible Securities
(Cost $608,243,235) | | | | | | | 677,873,309 | |
| | | | | | | | |
| | |
| Common Stocks 3.8% | | | | | | | | |
Airlines 0.9% | | | | | | | | |
Delta Air Lines, Inc. | | | 127,164 | | | | 6,833,794 | |
| | | | | | | | |
|
Banks 0.9% | |
¨Bank of America Corp. | | | 267,678 | | | | 6,493,868 | |
| | | | | | | | |
| | | | | | | | |
| | |
| | | Shares | | | Value | |
Health Care—Services 1.6% | |
HealthSouth Corp. | | | 248,858 | | | $ | 12,044,712 | |
| | | | | | | | |
|
Oil & Gas 0.0% ‡ | |
Sanchez Energy Corp. (c) | | | 8,945 | | | | 64,225 | |
| | | | | | | | |
|
Oil & Gas Services 0.4% | |
Halliburton Co. | | | 73,392 | | | | 3,134,572 | |
| | | | | | | | |
Total Common Stocks
(Cost $24,048,601) | | | | | | | 28,571,171 | |
| | | | | | | | |
| | |
| | | | | | | | |
| | | Principal
Amount | | | | |
| Short-Term Investment 6.3% | | | | | |
Repurchase Agreement 6.3% | | | | | | | | |
Fixed Income Clearing Corp.
0.12%, dated 6/30/17
due 7/3/17
Proceeds at Maturity $48,241,867 (Collateralized by a United States Treasury Note with a rate of 1.125% and a maturity date of 8/31/21, with a Principal Amount of $50,280,000 and a Market Value of $49,208,181) | | $ | 48,241,385 | | | | 48,241,385 | |
| | | | | | | | |
Total Short-Term Investment
(Cost $48,241,385) | | | | | | | 48,241,385 | |
| | | | | | | | |
Total Investments
(Cost $680,533,221) (d) | | | 99.4 | % | | | 754,685,865 | |
Other Assets, Less Liabilities | | | 0.6 | | | | 4,266,451 | |
Net Assets | | | 100.0 | % | | $ | 758,952,316 | |
| ‡ | Less than one-tenth of a percent. |
| (a) | May be sold to institutional investors only under Rule 144A or securities offered pursuant to Section 4(a)(2) of the Securities Act of 1933, as amended. |
| (b) | Step coupon—Rate shown was the rate in effect as of June 30, 2017. |
| (c) | Non-income producing security. |
| (d) | As of June 30, 2017, cost was $688,879,026 for federal income tax purposes and net unrealized appreciation was as follows: |
| | | | |
Gross unrealized appreciation | | $ | 98,282,926 | |
Gross unrealized depreciation | | | (32,476,087 | ) |
| | | | |
Net unrealized appreciation | | $ | 65,806,839 | |
| | | | |
| | | | |
| 12 | | MainStay VP Convertible Portfolio | | The notes to the financial statements are an integral part of,
and should be read in conjunction with, the financial statements. |
The following is a summary of the fair valuations according to the inputs used as of June 30, 2017, for valuing the Portfolio’s assets.
Asset Valuation Inputs
| | | | | | | | | | | | | | | | |
Description | | Quoted
Prices in
Active
Markets for
Identical
Assets (Level 1) | | | Significant
Other
Observable
Inputs (Level 2) | | | Significant
Unobservable
Inputs (Level 3) | | | Total | |
| Investments in Securities (a) | | | | | | | | | | | | | | | | |
| Convertible Securities | | | | | | | | | | | | | | | | |
Convertible Bonds | | $ | — | | | $ | 569,124,561 | | | $ | — | | | $ | 569,124,561 | |
Convertible Preferred Stocks (b) | | | 101,093,824 | | | | 7,654,924 | | | | — | | | | 108,748,748 | |
| | | | | | | | | | | | | | | | |
| Total Convertible Securities | | | 101,093,824 | | | | 576,779,485 | | | | — | | | | 677,873,309 | |
| | | | | | | | | | | | | | | | |
| Common Stocks | | | 28,571,171 | | | | — | | | | — | | | | 28,571,171 | |
| Short-Term Investment | | | | | | | | | | | | | | | | |
Repurchase Agreement | | | — | | | | 48,241,385 | | | | — | | | | 48,241,385 | |
| | | | | | | | | | | | | | | | |
| Total Investments in Securities | | $ | 129,664,995 | | | $ | 625,020,870 | | | $ | — | | | $ | 754,685,865 | |
| | | | | | | | | | | | | | | | |
| (a) | For a complete listing of investments and their industries, see the Portfolio of Investments. |
| (b) | The Level 2 securities valued at $7,001,547 and $653,377 are held in Food and Oil & Gas, respectively, within the Convertible Preferred Stocks section of the Portfolio of Investments. |
The Portfolio recognizes transfers between the levels as of the beginning of the period.
For the period ended June 30, 2017, the Portfolio did not have any transfers among levels. (See Note 2)
As of June 30, 2017, the Portfolio did not hold any investments with significant unobservable inputs (Level 3). (See Note 2)
| | | | | | |
The notes to the financial statements are an integral part of,
and should be read in conjunction with, the financial statements. | | | | | 13 | |
Statement of Assets and Liabilities as of June 30, 2017 (Unaudited)
| | | | |
| Assets | |
Investment in securities, at value (identified cost $680,533,221) | | $ | 754,685,865 | |
Receivables: | | | | |
Dividends and interest | | | 2,705,988 | |
Investment securities sold | | | 1,874,887 | |
Fund shares sold | | | 498,417 | |
Other assets | | | 3,739 | |
| | | | |
Total assets | | | 759,768,896 | |
| | | | |
| |
| Liabilities | | | | |
Payables: | | | | |
Manager (See Note 3) | | | 364,169 | |
Fund shares redeemed | | | 227,080 | |
NYLIFE Distributors (See Note 3) | | | 107,980 | |
Shareholder communication | | | 55,982 | |
Professional fees | | | 34,828 | |
Investment securities purchased | | | 14,493 | |
Custodian | | | 5,827 | |
Trustees | | | 1,118 | |
Accrued expenses | | | 5,103 | |
| | | | |
Total liabilities | | | 816,580 | |
| | | | |
Net assets | | $ | 758,952,316 | |
| | | | |
| |
| Composition of Net Assets | | | | |
Shares of beneficial interest outstanding (par value of $.001 per share) unlimited number of shares authorized | | $ | 58,874 | |
Additional paid-in capital | | | 647,747,419 | |
| | | | |
| | | 647,806,293 | |
Distributions in excess of net investment income | | | (8,258,254 | ) |
Accumulated net realized gain (loss) on investments | | | 45,251,633 | |
Net unrealized appreciation (depreciation) on investments | | | 74,152,644 | |
| | | | |
Net assets | | $ | 758,952,316 | |
| | | | |
| | | | |
Initial Class | | | | |
Net assets applicable to outstanding shares | | $ | 232,933,743 | |
| | | | |
Shares of beneficial interest outstanding | | | 17,969,236 | |
| | | | |
Net asset value per share outstanding | | $ | 12.96 | |
| | | | |
Service Class | | | | |
Net assets applicable to outstanding shares | | $ | 524,679,882 | |
| | | | |
Shares of beneficial interest outstanding | | | 40,800,725 | |
| | | | |
Net asset value per share outstanding | | $ | 12.86 | |
| | | | |
Service 2 Class | | | | |
Net assets applicable to outstanding shares | | $ | 1,338,691 | |
| | | | |
Shares of beneficial interest outstanding | | | 104,119 | |
| | | | |
Net asset value and offering price per share outstanding | | $ | 12.86 | |
| | | | |
| | | | |
| 14 | | MainStay VP Convertible Portfolio | | The notes to the financial statements are an integral part of,
and should be read in conjunction with, the financial statements. |
Statement of Operations for the six months ended June 30, 2017 (Unaudited)
| | | | |
| Investment Income (Loss) | |
Income | | | | |
Interest | | $ | 4,224,401 | |
Dividends (a) | | | 3,245,146 | |
| | | | |
Total income | | | 7,469,547 | |
| | | | |
Expenses | | | | |
Manager (See Note 3) | | | 2,088,839 | |
Distribution/Service—Service Class (See Note 3) | | | 624,262 | |
Distribution/Service—Service 2 Class (See Note 3) | | | 1,873 | |
Shareholder communication | | | 52,774 | |
Professional fees | | | 50,006 | |
Trustees | | | 8,293 | |
Custodian | | | 3,461 | |
Miscellaneous | | | 14,053 | |
| | | | |
Total expenses | | | 2,843,561 | |
| | | | |
Net investment income (loss) | | | 4,625,986 | |
| | | | |
|
| Realized and Unrealized Gain (Loss) on Investments | |
Net realized gain (loss) on investments | | | 31,739,539 | |
Net change in unrealized appreciation (depreciation) on investments | | | 8,197,631 | |
| | | | |
Net realized and unrealized gain (loss) on investments | | | 39,937,170 | |
| | | | |
Net increase (decrease) in net assets resulting from operations | | $ | 44,563,156 | |
| | | | |
| (a) | Dividends net of foreign withholding taxes in the amount of $83,181. |
| | | | | | |
The notes to the financial statements are an integral part of,
and should be read in conjunction with, the financial statements. | | | | | 15 | |
Statements of Changes in Net Assets
for the six months ended June 30, 2017 (Unaudited) and the year ended December 31, 2016
| | | | | | | | |
| | | 2017 | | | 2016 | |
| Increase (Decrease) in Net Assets | |
Operations: | | | | | | | | |
Net investment income (loss) | | $ | 4,625,986 | | | $ | 8,410,959 | |
Net realized gain (loss) on investments | | | 31,739,539 | | | | 15,855,869 | |
Net change in unrealized appreciation (depreciation) on investments | | | 8,197,631 | | | | 42,993,324 | |
| | | | |
Net increase (decrease) in net assets resulting from operations | | | 44,563,156 | | | | 67,260,152 | |
| | | | |
Dividends and distributions to shareholders: | | | | | | | | |
From net investment income: | | | | | | | | |
Initial Class | | | (2,356,030 | ) | | | (5,608,952 | ) |
Service Class | | | (4,611,863 | ) | | | (17,185,454 | ) |
Service 2 Class | | | (9,734 | ) | | | (4,733 | ) |
| | | | |
| | | (6,977,627 | ) | | | (22,799,139 | ) |
| | | | |
From net realized gain on investments: | | | | | | | | |
Initial Class | | | — | | | | (5,438,367 | ) |
Service Class | | | — | | | | (18,194,757 | ) |
Service 2 Class | | | — | | | | (21,519 | ) |
| | | | |
| | | — | | | | (23,654,643 | ) |
| | | | |
Total dividends and distributions to shareholders | | | (6,977,627 | ) | | | (46,453,782 | ) |
| | | | |
Capital share transactions: | | | | | | | | |
Net proceeds from sale of shares | | | 116,238,148 | | | | 65,267,210 | |
Net asset value of shares issued to shareholders in reinvestment of dividends and distributions | | | 6,977,627 | | | | 46,453,782 | |
Cost of shares redeemed | | | (42,033,198 | ) | | | (96,168,106 | ) |
| | | | |
Increase (decrease) in net assets derived from capital share transactions | | | 81,182,577 | | | | 15,552,886 | |
| | | | |
Net increase (decrease) in net assets | | | 118,768,106 | | | | 36,359,256 | |
|
| Net Assets | |
Beginning of period | | | 640,184,210 | | | | 603,824,954 | |
| | | | |
End of period | | $ | 758,952,316 | | | $ | 640,184,210 | |
| | | | |
Distributions in excess of net investment income at end of period | | $ | (8,258,254 | ) | | $ | (5,906,613 | ) |
| | | | |
| | | | |
| 16 | | MainStay VP Convertible Portfolio | | The notes to the financial statements are an integral part of,
and should be read in conjunction with, the financial statements. |
Financial Highlights selected per share data and ratios
| | | | | | | | | | | | | | | | | | | | | | | | |
| | | Six months
ended
June 30, | | | Year ended December 31, | |
| Initial Class | | 2017* | | | 2016 | | | 2015 | | | 2014 | | | 2013 | | | 2012 | |
Net asset value at beginning of period | | $ | 12.28 | | | $ | 11.86 | | | $ | 13.41 | | | $ | 13.38 | | | $ | 11.70 | | | $ | 11.09 | |
| | | | | | | | | | | | | | | | | | | | | | | | |
Net investment income (loss) (a) | | | 0.09 | | | | 0.19 | | | | 0.14 | | | | 0.16 | | | | 0.17 | | | | 0.25 | |
Net realized and unrealized gain (loss) on investments | | | 0.72 | | | | 1.18 | | | | (0.32 | ) | | | 0.88 | | | | 2.73 | | | | 0.75 | |
| | | | | | | | | | | | | | | | | | | | | | | | |
Total from investment operations | | | 0.81 | | | | 1.37 | | | | (0.18 | ) | | | 1.04 | | | | 2.90 | | | | 1.00 | |
| | | | | | | | | | | | | | | | | | | | | | | | |
| Less dividends and distributions: | | | | | | | | | | | | | �� | | | | | | | | | | | |
From net investment income | | | (0.13 | ) | | | (0.47 | ) | | | (0.36 | ) | | | (0.45 | ) | | | (0.32 | ) | | | (0.35 | ) |
From net realized gain on investments | | | — | | | | (0.48 | ) | | | (1.01 | ) | | | (0.56 | ) | | | (0.90 | ) | | | (0.04 | ) |
| | | | | | | | | | | | | | | | | | | | | | | | |
Total dividends and distributions | | | (0.13 | ) | | | (0.95 | ) | | | (1.37 | ) | | | (1.01 | ) | | | (1.22 | ) | | | (0.39 | ) |
| | | | | | | | | | | | | | | | | | | | | | | | |
Net asset value at end of period | | $ | 12.96 | | | $ | 12.28 | | | $ | 11.86 | | | $ | 13.41 | | | $ | 13.38 | | | $ | 11.70 | |
| | | | | | | | | | | | | | | | | | | | | | | | |
Total investment return (b) | | | 6.66 | % | | | 12.07 | % | | | (1.33 | %) | | | 7.98 | % | | | 25.35 | % | | | 9.13 | % |
| Ratios (to average net assets)/Supplemental Data: | | | | | | | | | | | | | | | | | | | | | | | | |
Net investment income (loss) | | | 1.47 | %†† | | | 1.59 | % | | | 1.08 | % | | | 1.21 | % | | | 1.29 | % | | | 2.12 | % |
Net expenses | | | 0.62 | %†† | | | 0.64 | % | | | 0.62 | % | | | 0.63 | % | | | 0.64 | % | | | 0.64 | % |
Portfolio turnover rate | | | 19 | % | | | 39 | % | | | 58 | % | | | 55 | % | | | 77 | % | | | 69 | % |
Net assets at end of period (in 000’s) | | $ | 232,934 | | | $ | 162,462 | | | $ | 142,942 | | | $ | 158,220 | | | $ | 160,947 | | | $ | 149,653 | |
| (a) | Per share data based on average shares outstanding during the period. |
| (b) | Total return does not reflect any deduction of sales charges, mortality and expense charges, contract charges or administrative charges. For periods of less than one year, total return is not annualized. |
| | | | | | | | | | | | | | | | | | | | | | | | |
| | | Six months
ended
June 30, | | | Year ended December 31, | |
| Service Class | | 2017* | | | 2016 | | | 2015 | | | 2014 | | | 2013 | | | 2012 | |
Net asset value at beginning of period | | $ | 12.18 | | | $ | 11.77 | | | $ | 13.32 | | | $ | 13.27 | | | $ | 11.61 | | | $ | 11.01 | |
| | | | | | | | | | | | | | | | | | | | | | | | |
Net investment income (loss) (a) | | | 0.08 | | | | 0.16 | | | | 0.11 | | | | 0.13 | | | | 0.13 | | | | 0.22 | |
Net realized and unrealized gain (loss) on investments | | | 0.72 | | | | 1.17 | | | | (0.32 | ) | | | 0.86 | | | | 2.73 | | | | 0.74 | |
| | | | | | | | | | | | | | | | | | | | | | | | |
Total from investment operations | | | 0.80 | | | | 1.33 | | | | (0.21 | ) | | | 0.99 | | | | 2.86 | | | | 0.96 | |
| | | | | | | | | | | | | | | | | | | | | | | | |
| Less dividends and distributions: | | | | | | | | | | | | | | | | | | | | | | | | |
From net investment income | | | (0.12 | ) | | | (0.44 | ) | | | (0.33 | ) | | | (0.38 | ) | | | (0.30 | ) | | | (0.32 | ) |
From net realized gain on investments | | | — | | | | (0.48 | ) | | | (1.01 | ) | | | (0.56 | ) | | | (0.90 | ) | | | (0.04 | ) |
| | | | | | | | | | | | | | | | | | | | | | | | |
Total dividends and distributions | | | (0.12 | ) | | | (0.92 | ) | | | (1.34 | ) | | | (0.94 | ) | | | (1.20 | ) | | | (0.36 | ) |
| | | | | | | | | | | | | | | | | | | | | | | | |
Net asset value at end of period | | $ | 12.86 | | | $ | 12.18 | | | $ | 11.77 | | | $ | 13.32 | | | $ | 13.27 | | | $ | 11.61 | |
| | | | | | | | | | | | | | | | | | | | | | | | |
Total investment return (b) | | | 6.53 | % | | | 11.79 | % | | | (1.57 | %) | | | 7.71 | % | | | 25.04 | % | | | 8.86 | % |
| Ratios (to average net assets)/Supplemental Data: | | | | | | | | | | | | | | | | | | | | | | | | |
Net investment income (loss) | | | 1.22 | %†† | | | 1.35 | % | | | 0.84 | % | | | 0.97 | % | | | 1.01 | % | | | 1.87 | % |
Net expenses | | | 0.87 | %†† | | | 0.89 | % | | | 0.87 | % | | | 0.88 | % | | | 0.89 | % | | | 0.89 | % |
Portfolio turnover rate | | | 19 | % | | | 39 | % | | | 58 | % | | | 55 | % | | | 77 | % | | | 69 | % |
Net assets at end of period (in 000’s) | | $ | 524,680 | | | $ | 476,926 | | | $ | 460,883 | | | $ | 460,406 | | | $ | 418,817 | | | $ | 315,937 | |
| (a) | Per share data based on average shares outstanding during the period. |
| (b) | Total return does not reflect any deduction of sales charges, mortality and expense charges, contract charges or administrative charges. For periods of less than one year, total return is not annualized. |
| | | | | | |
The notes to the financial statements are an integral part of,
and should be read in conjunction with, the financial statements. | | | | | 17 | |
Financial Highlights selected per share data and ratios
| | | | | | | | |
| Service 2 Class | | Six months
ended
June 30,
2017* | | | April 26,
2016**
through
December 31,
2016 | |
Net asset value at beginning of period | | $ | 12.18 | | | $ | 11.63 | |
| | | | | | | | |
Net investment income (loss) (a) | | | 0.07 | | | | 0.11 | |
Net realized and unrealized gain (loss) on investments | | | 0.72 | | | | 1.04 | |
| | | | | | | | |
Total from investment operations | | | 0.79 | | | | 1.15 | |
| | | | | | | | |
| Less dividends and distributions: | | | | | | | | |
From net investment income | | | (0.11 | ) | | | (0.12 | ) |
From net realized gain on investments | | | — | | | | (0.48 | ) |
| | | | | | | | |
Total dividends and distributions | | | (0.11 | ) | | | (0.60 | ) |
| | | | | | | | |
Net asset value at end of period | | $ | 12.86 | | | $ | 12.18 | |
| | | | | | | | |
Total investment return (b) | | | 6.47 | % | | | 10.01 | % |
| Ratios (to average net assets)/Supplemental Data: | | | | | | | | |
Net investment income (loss)†† | | | 1.15 | % | | | 1.33 | % |
Net expenses†† | | | 0.97 | % | | | 1.00 | % |
Portfolio turnover rate | | | 19 | % | | | 39 | % |
Net assets at end of period (in 000’s) | | $ | 1,339 | | | $ | 797 | |
| (a) | Per share data based on average shares outstanding during the period. |
| (b) | Total return does not reflect any deduction of sales charges, mortality and expense charges, contract charges or administrative charges. For periods of less than one year, total return is not annualized. |
| | | | |
| 18 | | MainStay VP Convertible Portfolio | | The notes to the financial statements are an integral part of,
and should be read in conjunction with, the financial statements. |
Notes to Financial Statements (Unaudited)
Note 1–Organization and Business
MainStay VP Funds Trust (the “Fund”) was organized as a Delaware statutory trust on February 1, 2011. The Fund is registered under the Investment Company Act of 1940, as amended (the “1940 Act”), as an open-end management investment company. The Fund is comprised of thirty-two separate series (collectively referred to as the “Portfolios”). These financial statements and notes relate to the MainStay VP Convertible Portfolio (the “Portfolio”), a “diversified” portfolio, as that term is defined in the 1940 Act, as interpreted or modified by regulatory authorities having jurisdiction, from time to time.
Shares of the Portfolio are currently offered to certain separate accounts to fund variable annuity policies and variable universal life insurance policies issued by New York Life Insurance and Annuity Corporation (“NYLIAC”), a wholly-owned subsidiary of New York Life Insurance Company (“New York Life”). NYLIAC allocates shares of the Portfolios to, among others, NYLIAC Variable Annuity Separate Accounts-I, II, III and IV, VUL Separate Account-I and CSVUL Separate Account-I (collectively, the “Separate Accounts”). Service 2 Class shares launched on April 26, 2016. Service 2 Class shares of the Portfolio are currently offered to certain separate accounts to fund variable annuity policies and variable universal life insurance policies issued by participating insurance companies. Shares of the Portfolio are also offered to the MainStay VP Conservative Allocation Portfolio, MainStay VP Moderate Allocation Portfolio, MainStay VP Moderate Growth Allocation Portfolio and MainStay VP Growth Allocation Portfolio, which operate as “funds-of-funds.”
The Portfolio currently offers three classes of shares. Initial Class shares commenced operations on October 1, 1996. Service Class shares commenced operations on June 5, 2003. Service 2 Class shares commenced operations on April 26, 2016. Shares of the Portfolio are sold and are redeemed at a price equal to their respective net asset value (“NAV”) per share. No sales or redemption charge is applicable to the purchase or redemption of the Portfolio’s shares. Under the terms of the Fund’s multiple class plan, adopted pursuant to Rule 18f-3 under the 1940 Act, the classes differ in that, among other things, Service Class and Service Class 2 shares of the Portfolio pay a combined distribution and service fee of 0.25% of average daily net assets attributable to Service Class and Service Class 2 shares of the Portfolio to the Distributor (as defined in Note 3(B)) pursuant to a plan adopted in accordance with Rule 12b-1 under the 1940 Act. Contract owners of variable annuity contracts purchased after June 2, 2003, are permitted to invest only in the Service Class and Service Class 2 shares.
The Portfolio’s investment objective is to seek capital appreciation together with current income.
Note 2–Significant Accounting Policies
The Portfolio is an investment company and accordingly follows the investment company accounting and reporting guidance of the Financial Accounting Standards Board (“FASB”) Accounting Standard Codification Topic 946 Financial Services – Investment Companies. The Portfolio prepares its financial statements in accordance with generally accepted accounting principles (“GAAP”) in the United States of America and follows the significant accounting policies described below.
(A) Securities Valuation. Investments are usually valued as of the close of regular trading on the New York Stock Exchange (the
“Exchange”) (usually 4:00 p.m. Eastern time) on each day the Portfolio is open for business (“valuation date”).
The Board of Trustees (the “Board”) of the Fund adopted procedures establishing methodologies for the valuation of the Portfolio’s securities and other assets and delegated the responsibility for valuation determinations under those procedures to the Valuation Committee of the Fund (the “Valuation Committee”). The Board authorized the Valuation Committee to appoint a Valuation Sub-Committee (the “Sub-Committee”) to deal in the first instance with establishing the prices of securities for which market quotations are not readily available or the prices of which are not otherwise readily determinable under these procedures. The Sub-Committee meets (in person, via electronic mail or via teleconference) on an as-needed basis. Subsequently, the Valuation Committee meets to ensure that actions taken by the Sub-Committee were appropriate. The procedures recognize that, subject to the oversight of the Board and unless otherwise noted, the responsibility for the day-to-day valuation of portfolio assets (including fair value measurements for the Portfolio’s assets and liabilities) rests with New York Life Investment Management LLC (“New York Life Investments” or the “Manager”), aided to whatever extent necessary by the Subadvisor (as defined in Note 3(A)) to the Portfolio.
To assess the appropriateness of security valuations, the Manager, the Subadvisor or the Portfolio’s third party service provider, who is subject to oversight by the Manager, regularly compares prior day prices, prices on comparable securities and the sale prices to the prior and current day prices and challenges prices with changes exceeding certain tolerance levels with third party pricing services or broker sources. For those securities valued through either a standardized fair valuation methodology or a fair valuation measurement, the Sub-Committee deals in the first instance with such valuation and the Valuation Committee reviews and affirms, if appropriate, the reasonableness of the valuation based on such methodologies and measurements on a regular basis after considering all relevant information that is reasonably available. Any action taken by the Sub-Committee with respect to the valuation of a portfolio security or other asset is submitted by the Valuation Committee to the Board for its review and ratification, if appropriate, at its next regularly scheduled meeting.
“Fair value” is defined as the price the Portfolio would reasonably expect to receive upon selling an asset or liability in an orderly transaction to an independent buyer in the principal or most advantageous market for the asset or liability. Fair value measurements are determined within a framework that establishes a three-tier hierarchy which maximizes the use of observable market data and minimizes the use of unobservable inputs to establish a classification of fair value measurements for disclosure purposes. “Inputs” refer broadly to the assumptions that market participants would use in pricing the asset or liability, including assumptions about risk, such as the risk inherent in a particular valuation technique used to measure fair value using a pricing model and/or the risk inherent in the inputs for the valuation technique. Inputs may be observable or unobservable. Observable inputs reflect the assumptions market participants would use in pricing the asset or liability based on market data obtained from sources independent of the Portfolio. Unobservable inputs reflect the Portfolio’s own assumptions about the assumptions market participants would use in pricing the asset or liability based on the information available. The inputs or methodology
Notes to Financial Statements (Unaudited) (continued)
used for valuing assets or liabilities may not be an indication of the risks associated with investing in those assets or liabilities. The three-tier hierarchy of inputs is summarized below.
| • | | Level 1—quoted prices in active markets for an identical asset or liability |
| • | | Level 2—other significant observable inputs (including quoted prices for a similar asset or liability in active markets, interest rates and yield curves, prepayment speeds, credit risk, etc.) |
| • | | Level 3—significant unobservable inputs (including the Portfolio’s own assumptions about the assumptions that market participants would use in measuring fair value of an asset or liability) |
The level of an asset or liability within the fair value hierarchy is based on the lowest level of an input, both individually and in the aggregate, that is significant to the fair value measurement. As of June 30, 2017, the aggregate value by input level of the Portfolio’s assets and liabilities is included at the end of the Portfolio’s Portfolio of Investments.
The Portfolio may use third party vendor evaluations, whose prices may be derived from one or more of the following standard inputs, among others:
| | |
• Benchmark yields | | • Reported trades |
• Broker/dealer quotes | | • Issuer spreads |
• Two-sided markets | | • Benchmark securities |
• Bids/offers | | • Reference data (corporate actions or material event notices) |
• Industry and economic events | | • Comparable bonds |
• Monthly payment information | | |
An asset or liability for which market values cannot be measured using the methodologies described above is valued by methods deemed reasonable in good faith by the Valuation Committee, following the procedures established by the Board, to represent fair value. Under these procedures, the Portfolio generally uses a market-based approach which may use related or comparable assets or liabilities, recent transactions, market multiples, book values, and other relevant information. The Portfolio may also use an income-based valuation approach in which the anticipated future cash flows of the asset or liability are discounted to calculate fair value. Discounts may also be applied due to the nature and/or duration of any restrictions on the disposition of the asset or liability. Fair value represents a good faith approximation of the value of a security. Fair value determinations involve the consideration of a number of subjective factors, an analysis of applicable facts and circumstances and the exercise of judgment. As a result, it is possible that the fair value for a security determined in good faith in accordance with the Portfolio’s valuation procedures may differ from valuations for the same security determined by other funds using their own valuation procedures. Although the Portfolio’s valuation procedures are designed to value a security at the price the Portfolio may reasonably expect to receive upon the security’s sale in an orderly transaction, there can be no assurance that any fair value determination thereunder would, in fact, approximate the amount that the Portfolio would actually realize upon the sale of the security or the price at which the security would trade if a reliable market price were readily available. During the six-month period ended June 30, 2017, there were no material changes to the fair value methodologies.
Securities which may be valued in this manner include, but are not limited to: (i) a security for which trading has been halted or suspended; (ii) a debt security that has recently gone into default and for which there is not a current market quotation; (iii) a security of an issuer that has entered into a restructuring; (iv) a security that has been de-listed from a national exchange; (v) a security for which the market price is not readily available from a third party pricing source or, if so provided, does not, in the opinion of the Manager or Subadvisor, reflect the security’s market value; (vi) a security subject to trading collars for which no or limited trading takes place; and (vii) a security whose principal market has been temporarily closed at a time when, under normal conditions, it would be open. Securities for which market quotations or observable inputs are not readily available are generally categorized as Level 3 in the hierarchy. As of June 30, 2017, there were no securities held by the Portfolio that were fair valued in such a manner.
Equity securities are valued at the last quoted sales prices as of the close of regular trading on the relevant exchange on each valuation date. Securities that are not traded on the valuation date are valued at the mean of the last quoted bid and ask prices. Prices are normally taken from the principal market in which each security trades.
Investments in mutual funds, including money market funds, are valued at their respective NAVs as of the close of the Exchange on the valuation date. These securities are generally categorized as Level 1 in the hierarchy.
Debt securities (other than convertible and municipal bonds) are valued at the evaluated bid prices (evaluated mean prices in the case of convertible and municipal bonds) supplied by a pricing agent or brokers selected by the Manager, in consultation with the Subadvisor. Those values reflect broker/dealer supplied prices and electronic data processing techniques, if the evaluated bid or mean prices are deemed by the Manager, in consultation with the Subadvisor, to be representative of market values at the regular close of trading of the Exchange on each valuation date. Debt securities purchased on a delayed delivery basis are marked to market daily until settlement at the forward settlement date. Debt securities, including corporate bonds, U.S. government & federal agency bonds, municipal bonds, foreign bonds, convertible bonds, asset-backed securities and mortgage-backed securities are generally categorized as Level 2 in the hierarchy.
Temporary cash investments acquired in excess of 60 days to maturity at the time of purchase are valued using the latest bid prices or using valuations based on a matrix system (which considers such factors as security prices, yields, maturities, and ratings), both as furnished by independent pricing services. Other temporary cash investments which mature in 60 days or less at the time of purchase (“Short-Term Investments”) are valued using the amortized cost method of valuation, unless the use of such method would be inappropriate. The amortized cost method involves valuing a security at its cost on the date of purchase and thereafter assuming a constant amortization to maturity of the difference between such cost and the value on maturity date. Amortized cost approximates the current fair value of a security. Securities valued using the amortized cost method are not valued using quoted prices in an active market and are generally categorized as Level 2 in the hierarchy.
The information above is not intended to reflect an exhaustive list of the methodologies that may be used to value portfolio investments. The
| | |
| 20 | | MainStay VP Convertible Portfolio |
valuation procedures permit the use of a variety of valuation methodologies in connection with valuing portfolio investments. The methodology used for a specific type of investment may vary based on the market data available or other considerations. The methodologies summarized above may not represent the specific means by which portfolio investments are valued on any particular business day.
(B) Income Taxes. The Portfolio’s policy is to comply with the requirements of the Internal Revenue Code of 1986, as amended (the “Internal Revenue Code”), applicable to regulated investment companies and to distribute all of its taxable income to the shareholders of the Portfolio within the allowable time limits. Therefore, no federal, state and local income tax provisions are required.
Management evaluates the Portfolio’s tax positions to determine if the tax positions taken meet the minimum recognition threshold in connection with accounting for uncertainties in income tax positions taken or expected to be taken for the purposes of measuring and recognizing tax liabilities in the financial statements. Recognition of tax benefits of an uncertain tax position is permitted only to the extent the position is “more likely than not” to be sustained assuming examination by taxing authorities. Management has analyzed the Portfolio’s tax positions taken on federal, state and local income tax returns for all open tax years (for up to three tax years), and has concluded that no provisions for federal, state and local income tax are required in the Portfolio’s financial statements. The Portfolio’s federal, state and local income and federal excise tax returns for tax years for which the applicable statutes of limitations have not expired are subject to examination by the Internal Revenue Service and state and local departments of revenue.
(C) Dividends and Distributions to Shareholders. Dividends and distributions are recorded on the ex-dividend date. The Portfolio intends to declare and pay dividends from net investment income, if any, at least quarterly and distributions from net realized capital and currency gains, if any, at least annually. Unless the shareholder elects otherwise, all dividends and distributions are reinvested in the same class of shares of the Portfolio, at NAV. Dividends and distributions to shareholders are determined in accordance with federal income tax regulations and may differ from GAAP.
(D) Security Transactions and Investment Income. The Portfolio records security transactions on the trade date. Realized gains and losses on security transactions are determined using the identified cost method. Dividend income is recognized on the ex-dividend date; net of any foreign tax withheld at the source, and interest income is accrued as earned using the effective interest rate method. Discounts and premiums on securities purchased, other than Short-Term Investments, for the Portfolio are accreted and amortized, respectively, on the effective interest rate method over the life of the respective securities. Discounts and premiums on Short-Term Investments are accreted and amortized, respectively, on the straight-line method. The straight-line method approximates the effective interest method for Short-Term Investments.
Investment income and realized and unrealized gains and losses on investments of the Portfolio are allocated pro rata to the separate classes of shares based upon their relative net assets on the date the income is earned or realized and unrealized gains and losses are incurred.
The Portfolio may place a debt security on non-accrual status and reduce related interest income by ceasing current accruals and writing off all or a
portion of any interest receivables when the collection of all or a portion of such interest has become doubtful. A debt security is removed from non-accrual status when the issuer resumes interest payments or when collectability of interest is reasonably assured.
(E) Expenses. Expenses of the Fund are allocated to the individual Portfolios in proportion to the net assets of the respective Portfolios when the expenses are incurred, except where direct allocations of expenses can be made. Expenses (other than fees incurred under the distribution and service plans and shareholder service plans, further discussed in Note 3(B), which are charged directly to the Service Class shares and Service 2 Class shares, as applicable) are allocated to separate classes of shares pro rata based upon their relative net assets on the date the expenses are incurred. The expenses borne by the Portfolio, including those of related parties to the Portfolio, are shown in the Statement of Operations.
(F) Use of Estimates. In preparing financial statements in conformity with GAAP, management makes estimates and assumptions that affect the reported amounts and disclosures in the financial statements. Actual results could differ from those estimates.
(G) Repurchase Agreements. The Portfolio may enter into repurchase agreements (i.e., buy a security from another party with the agreement that it be sold back in the future) to earn income. The Portfolio may enter into repurchase agreements only with counterparties, usually financial institutions, that are deemed by the Manager or Subadvisor to be creditworthy, pursuant to guidelines established by the Board. During the term of any repurchase agreement, the Manager or Subadvisor will continue to monitor the creditworthiness of the counterparty. Under the 1940 Act, repurchase agreements are considered to be collateralized loans by the Portfolio to the counterparty secured by the securities transferred to the Portfolio.
Repurchase agreements are subject to counterparty risk, meaning the Portfolio could lose money by the counterparty’s failure to perform under the terms of the agreement. The Portfolio mitigates this risk by ensuring the repurchase agreement is collateralized by cash, U.S. government securities, fixed income securities and/or other securities. The collateral is held by the Portfolio’s custodian and valued daily on a mark to market basis to determine if the value, including accrued interest, exceeds the repurchase price. In the event of the counterparty’s default on the obligation to repurchase, the Portfolio has the right to liquidate the collateral and apply the proceeds in satisfaction of the obligation. Under certain circumstances, such as in the event of default or bankruptcy by the counterparty, realization and/or retention of the collateral may be limited or subject to delay, to legal proceedings and possible realized loss to the Portfolio.
(H) Securities Lending. In order to realize additional income, the Portfolio may engage in securities lending, subject to the limitations set forth in the 1940 Act and relevant guidance by the staff of the Securities and Exchange Commission (“SEC”). In the event the Portfolio does engage in securities lending, the Portfolio will lend through its custodian, State Street Bank and Trust Company (“State Street”). State Street will manage the Portfolio’s collateral in accordance with the lending agreement between the Portfolio and State Street, and indemnify the Portfolio against counterparty risk. The loans will be collateralized by U.S. Treasury securities at least equal at all times to the market value of the securities loaned. The Portfolio may bear the risk of delay in recovery of, or loss of rights in, the securities loaned should the borrower of the securities
Notes to Financial Statements (Unaudited) (continued)
experience financial difficulty. The Portfolio may also record a realized gain or loss on securities deemed sold due to a borrower’s inability to return securities on loan. The Portfolio bears the risk of any loss on investment of the collateral. The Portfolio will receive compensation for lending its securities in the form of fees or it will retain a portion of interest on the investment of any cash received as collateral. The Portfolio will also continue to receive interest and dividends on the securities loaned and any gain or loss in the market price of the securities loaned that may occur during the term of the loan will be for the account of the Portfolio. During the six-month period ended June 30, 2017, the Portfolio did not have any portfolio securities on loan.
(I) Convertible Securities Risk. Convertible securities may be subordinate to other securities. In part, the total return for a convertible security depends upon the performance of the underlying stock into which it can be converted. Also, issuers of convertible securities are often not as strong financially as those issuing securities with higher credit ratings, are more likely to encounter financial difficulties and typically are more vulnerable to changes in the economy, such as a recession or a sustained period of rising interest rates, which could affect their ability to make interest and principal payments.
(J) Indemnifications. Under the Fund’s organizational documents, its officers and trustees are indemnified against certain liabilities that may arise out of performance of their duties to the Fund. Additionally, in the normal course of business, the Portfolio enters into contracts with third-party service providers that contain a variety of representations and warranties and which may provide general indemnifications. The Portfolio’s maximum exposure under these arrangements is unknown, as this would involve future claims that may be made against the Portfolio that have not yet occurred. Based on experience, management is of the view that the risk of loss in connection with these potential indemnification obligations is remote. However, there can be no assurance that material liabilities related to such obligations will not arise in the future, which could adversely impact the Portfolio.
Note 3–Fees and Related Party Transactions
(A) Manager and Subadvisor. New York Life Investments, a registered investment adviser and an indirect, wholly-owned subsidiary of New York Life, serves as the Portfolio’s Manager pursuant to an Amended and Restated Management Agreement (“Management Agreement”). The Manager provides offices, conducts clerical, recordkeeping and bookkeeping services, and keeps most of the financial and accounting records required to be maintained by the Portfolio. Except for the portion of salaries and expenses that are the responsibility of the Portfolio, the Manager pays the salaries and expenses of all personnel affiliated with the Portfolio and certain operational expenses of the Portfolio. The Portfolio reimburses New York Life Investments in an amount equal to a portion of the compensation of the Chief Compliance Officer attributable to the Portfolio. MacKay Shields LLC (“MacKay Shields” or “Subadvisor”), a registered investment adviser and an indirect, wholly-owned subsidiary of New York Life, serves as Subadvisor to the Portfolio and is responsible for the day-to-day portfolio management of the portfolio. Pursuant to the terms of a Subadvisory Agreement (Subadvisory Agreement”) between New York Life Investments and MacKay Shields, New York Life Investments pays for the services of the Subadvisor.
The Fund, on behalf of the Portfolio, pays New York Life Investments in its capacity as the Portfolio’s investment manager and administrator, pursuant to the Management Agreement, a monthly fee for services performed and facilities furnished at an annual rate of the Portfolio’s average daily net assets as follows: 0.60% up to $500 million; 0.55% from $500 million to $1 billion; and 0.50% in excess of $1 billion. During the six-month period ended June 30, 2017, the effective management fee rate was 0.58%.
During the six-month period ended June 30, 2017, New York Life Investments earned fees from the Portfolio in the amount of $2,088,839.
State Street provides sub-administration and sub-accounting services to the Portfolio pursuant to an agreement with New York Life Investments. These services include calculating the daily NAVs of the Portfolio, maintaining the general ledger and sub-ledger accounts for the calculation of the Portfolio’s NAVs, and assisting New York Life Investments in conducting various aspects of the Portfolio’s administrative operations. For providing these services to the Portfolio, State Street is compensated by New York Life Investments.
(B) Distribution, Service and Shareholder Service Fees. The Fund, on behalf of the Portfolio, has entered into a distribution agreement with NYLIFE Distributors LLC (the “Distributor”), an indirect, wholly-owned subsidiary of New York Life. The Portfolio has adopted a distribution plan (the “Plan”) in accordance with the provisions of Rule 12b-1 under the 1940 Act. Under the Plan, the Distributor has agreed to provide, through its affiliates or independent third parties, various distribution-related, shareholder and administrative support services to the Service Class and Service Class 2 shareholders. For its services, the Distributor is entitled to a combined distribution and service fee accrued daily and paid monthly at an annual rate of 0.25% of the average daily net assets attributable to the Service Class and Service 2 Class shares of the Portfolio.
The Board has adopted a shareholder services plan (the “Service Plan”) with respect to the Service 2 Class shares of the Portfolio. Under the terms of the Services Plan, the Portfolio is authorized to pay to New York Life Investments, its affiliates or independent third-party service providers, as compensation for services rendered to shareholders of the Service 2 Class shares, in connection with the administration of plans or programs that use Portfolio shares as their funding medium a shareholder servicing fee at the rate of 0.10% on an annualized basis of the average daily net assets of the Service 2 Class shares.
(C) Transfer and Dividend Disbursing Agent. NYLIM Service Company LLC, an affiliate of New York Life Investments, serves as the transfer agent and dividend disbursing agent for the Service 2 Class shares of the Portfolio. NYLIM Service Company LLC has entered into an agreement with Boston Financial Data Services, Inc. (“BFDS”) pursuant to which BFDS performs certain transfer agent services on behalf of NYLIM Service Company LLC. During the six-month period ended June 30, 2017, all associated fees were paid by the Manager.
| | |
| 22 | | MainStay VP Convertible Portfolio |
Note 4–Federal Income Tax
During the year ended December 31, 2016, the tax character of distributions paid as reflected in the Statements of Changes in Net Assets was as follows:
| | |
| 2016 |
Tax-Based
Distributions
from Ordinary
Income | | Tax-Based
Distributions
from Long-Term
Gains |
| $22,799,139 | | $23,654,643 |
Note 5–Custodian
State Street is the custodian of cash and securities held by the Portfolio. Custodial fees are charged to the Portfolio based on the Portfolio’s net assets and/or the market value of securities held by the Portfolio and the number of certain transactions incurred by the Portfolio.
Note 6–Line of Credit
The Portfolio and certain other funds managed by New York Life Investments, maintain a line of credit with a syndicate of banks in order to secure a source of funds for temporary purposes to meet unanticipated or excessive redemption requests.
Effective August 1, 2017, under the credit agreement (the “Credit Agreement”), the aggregate commitment amount is $600,000,000 with an additional uncommitted amount of $100,000,000. The commitment fee is an annual rate of 0.15% of the average commitment amount payable quarterly, regardless of usage, to State Street, who serves as the agent to the syndicate. The commitment fee is allocated among the Portfolio and certain other funds managed by New York Life Investments based upon their respective net assets and other factors. Interest on any revolving credit loan is charged based upon the Federal Funds Rate or the one month LIBOR, whichever is higher. The Credit Agreement expires on July 31, 2018, although the Portfolio, certain other funds managed by New York Life Investments and the syndicate of banks may renew the Credit Agreement for an additional year on the same or different terms. Prior to August 1, 2017, the aggregate commitment amount was $600,000,000 with an additional uncommitted amount of $100,000,000, and the commitment fee, under a credit agreement for which Bank of New York Mellon served as agent, was at an annual rate of 0.15% of the average commitment amount. During the six-month period ended June 30, 2017, there were no borrowings made or outstanding with respect to the Portfolio under the credit agreement for which Bank of New York served as agent.
Note 7–Interfund Lending Program
Pursuant to an exemptive order issued by the SEC, the Portfolio, along with certain other funds managed by New York Life Investments, may participate in an interfund lending program. The interfund lending program provides an alternative credit facility that permits the Portfolio and certain other funds managed by New York Life Investments to lend or borrow money for temporary purposes directly to or from one another, subject to the conditions of the exemptive order. During the six-month period ended June 30, 2017, there were no interfund loans made or outstanding with respect to the Portfolio.
Note 8–Purchases and Sales of Securities (in 000’s)
During the six-month period ended June 30, 2017, purchases and sales of securities, other than short-term securities, were $196,456 and $123,460, respectively.
Note 9–Capital Share Transactions
Transactions in capital shares for the six-month period ended June 30, 2017, and the year ended December 31, 2016, were as follows:
| | | | | | | | |
Initial Class | | Shares | | | Amount | |
Six-month period ended June 30, 2017: | |
Shares sold | | | 5,364,021 | | | $ | 67,751,561 | |
Shares issued to shareholders in reinvestment of dividends and distributions | | | 183,700 | | | | 2,356,030 | |
Shares redeemed | | | (810,355 | ) | | | (10,343,501 | ) |
| | | | | | | | |
Net increase (decrease) | | | 4,737,366 | | | $ | 59,764,090 | |
| | | | | | | | |
Year ended December 31, 2016: | |
Shares sold | | | 1,960,462 | | | $ | 24,206,454 | |
Shares issued to shareholders in reinvestment of dividends and distributions | | | 938,286 | | | | 11,047,319 | |
Shares redeemed | | | (1,720,385 | ) | | | (20,300,007 | ) |
| | | | | | | | |
Net increase (decrease) | | | 1,178,363 | | | $ | 14,953,766 | |
| | | | | | | | |
| | |
| | | | | | | | |
Service Class | | Shares | | | Amount | |
Six-month period ended June 30, 2017: | |
Shares sold | | | 3,783,698 | | | $ | 47,944,496 | |
Shares issued to shareholders in reinvestment of dividends and distributions | | | 362,521 | | | | 4,611,863 | |
Shares redeemed | | | (2,497,382 | ) | | | (31,626,175 | ) |
| | | | | | | | |
Net increase (decrease) | | | 1,648,837 | | | $ | 20,930,184 | |
| | | | | | | | |
Year ended December 31, 2016: | |
Shares sold | | | 3,437,586 | | | $ | 40,295,405 | |
Shares issued to shareholders in reinvestment of dividends and distributions | | | 3,029,633 | | | | 35,380,211 | |
Shares redeemed | | | (6,461,847 | ) | | | (75,858,128 | ) |
| | | | | | | | |
Net increase (decrease) | | | 5,372 | | | $ | (182,512 | ) |
| | | | | | | | |
| | |
| | | | | | | | |
Service 2 Class | | Shares | | | Amount | |
Six-month period ended June 30, 2017: | |
Shares sold | | | 42,900 | | | $ | 542,091 | |
Shares issued to shareholders in reinvestment of dividends and distributions | | | 765 | | | | 9,734 | |
Shares redeemed | | | (4,975 | ) | | | (63,522 | ) |
| | | | | | | | |
Net increase (decrease) | | | 38,690 | | | $ | 488,303 | |
| | | | | | | | |
Period ended December 31, 2016 (a): | |
Shares sold | | | 64,044 | | | $ | 765,351 | |
Shares issued to shareholders in reinvestment of dividends and distributions | | | 2,208 | | | | 26,252 | |
Shares redeemed | | | (823 | ) | | | (9,971 | ) |
| | | | | | | | |
Net increase (decrease) | | | 65,429 | | | $ | 781,632 | |
| | | | | | | | |
|
(a) Inception date was April 26, 2016. | |
Notes to Financial Statements (Unaudited) (continued)
Note 10–Recent Accounting Pronouncement
In October 2016, the SEC adopted new rules and amended existing rules (together, “final rules”) intended to modernize the reporting and disclosure of information by registered investment companies. In part, the final rules amend Regulation S-X and require standardized, enhanced disclosure about derivatives in investment company financial statements, as well as other amendments. The compliance date for the amendments to Regulation S-X is August 1, 2017 and applies to shareholder reports for funds with fiscal periods ending after August 1, 2017. Management is currently evaluating the impact that the adoption of the amendments to Regulation S-X will have on the Portfolio’s financial statements and related disclosures.
Note 11–Subsequent Events
In connection with the preparation of the financial statements of the Portfolio as of and for the six-month period ended June 30, 2017, events and transactions subsequent to June 30, 2017, through the date the financial statements were issued have been evaluated by the Portfolio’s management for possible adjustment and/or disclosure. No subsequent events requiring financial statement adjustment or disclosure have been identified.
| | |
| 24 | | MainStay VP Convertible Portfolio |
Proxy Voting Policies and Procedures and Proxy Voting Record
A description of the policies and procedures that New York Life Investments uses to vote proxies related to the Portfolio’s securities is available without charge, upon request, (i) by calling 800-598-2019 or (ii) by visiting the SEC’s website at www.sec.gov.
The Portfolio is required to file with the SEC its proxy voting record for the 12-month period ending June 30 on Form N-PX. The Portfolio’s most recent Form N-PX or proxy voting record is available free of charge upon request (i) by calling 800-598-2019 or; (ii) by visiting the SEC’s website at www.sec.gov.
Shareholder Reports and Quarterly Portfolio Disclosure
The Portfolio is required to file its complete schedule of portfolio holdings with the SEC for its first and third fiscal quarters on Form N-Q. The Portfolio’s Form N-Q is available without charge on the SEC’s website at www.sec.gov or by calling MainStay Investments at 800-598-2019. You also can obtain and review copies of Form N-Q by visiting the SEC’s Public Reference Room in Washington, DC (information on the operation of the Public Reference Room may be obtained by calling 1-800-SEC-0330).
This page intentionally left blank
MainStay VP Portfolios
MainStay VP offers a wide range of Portfolios. The full array of MainStay VP offerings is listed here, with information about the manager, subadvisors, legal counsel, and independent registered public accounting firm.
Equity Portfolios
MainStay VP Common Stock Portfolio
MainStay VP Cornerstone Growth Portfolio
MainStay VP Eagle Small Cap Growth Portfolio
MainStay VP Emerging Markets Equity Portfolio
MainStay VP Epoch U.S. Equity Yield Portfolio
MainStay VP Epoch U.S. Small Cap Portfolio
MainStay VP International Equity Portfolio
MainStay VP Large Cap Growth Portfolio
MainStay VP MFS® Utilities Portfolio
MainStay VP Mid Cap Core Portfolio
MainStay VP S&P 500 Index Portfolio
MainStay VP Small Cap Core Portfolio
MainStay VP T. Rowe Price Equity Income Portfolio
MainStay VP VanEck Global Hard Assets Portfolio
Mixed Asset Portfolios
MainStay VP Balanced Portfolio
MainStay VP Convertible Portfolio
MainStay VP Cushing Renaissance Advantage Portfolio
MainStay VP Income Builder Portfolio
MainStay VP Janus Henderson Balanced Portfolio
Income Portfolios
MainStay VP Bond Portfolio
MainStay VP Floating Rate Portfolio
MainStay VP Government Portfolio
MainStay VP High Yield Corporate Bond Portfolio
MainStay VP Indexed Bond Portfolio
MainStay VP PIMCO Real Return Portfolio
MainStay VP Unconstrained Bond Portfolio
Money Market
MainStay VP U.S. Government Money Market Portfolio
Alternative
MainStay VP Absolute Return Multi-Strategy Portfolio
Asset Allocation Portfolios
MainStay VP Conservative Allocation Portfolio
MainStay VP Growth Allocation Portfolio
MainStay VP Moderate Allocation Portfolio
MainStay VP Moderate Growth Allocation Portfolio
Manager
New York Life Investment Management LLC
New York, New York
Subadvisors
Candriam Belgium*
Brussels, Belgium
Candriam France S.A.S.*
Paris, France
Cornerstone Capital Management Holdings LLC*
New York, New York
Cushing Asset Management, LP
Dallas, Texas
Eagle Asset Management, Inc.
St Petersburg, Florida
Epoch Investment Partners, Inc.
New York, New York
Janus Capital Management LLC
Denver, Colorado
MacKay Shields LLC*
New York, New York
Massachusetts Financial Services Company
Boston, Massachusetts
NYL Investors LLC*
New York, New York
Pacific Investment Management Company LLC
Newport Beach, California
T. Rowe Price Associates, Inc.
Baltimore, Maryland
Van Eck Associates Corporation
New York, New York
Winslow Capital Management, LLC
Minneapolis, Minnesota
Distributor
NYLIFE Distributors LLC*
Jersey City, New Jersey
Custodian
State Street Bank and Trust Company
Boston, Massachusetts
Independent Registered Public Accounting Firm
PricewaterhouseCoopers LLP
New York, New York
Legal Counsel
Dechert LLP
Washington, District of Columbia
Some Portfolios may not be available in all products.
* An affiliate of New York Life Investment Management LLC
Not part of the Semiannual Report
2017 Semiannual Report
This report is for the general information of New York Life Variable Annuities and NYLIAC Variable Universal Life Insurance Products policyowners. It must be preceded or accompanied by the appropriate product(s) and funds prospectuses if it is given to anyone who is not an owner of a New York Life variable annuity policy or a NYLIAC Variable Universal Life Insurance Product. This report does not offer for sale or solicit orders to purchase securities.
The performance data quoted in this report represents past performance. Past performance is no guarantee of future results. Due to market volatility and other factors, current performance may be lower or higher than the figures shown. The most recent month-end performance summary for your variable annuity or variable life policy is available by calling 800-598-2019 and is updated periodically on www.newyorklife.com.
The New York Life Variable Annuities and NYLIAC Variable Universal Life Insurance Products are issued by New York Life Insurance and Annuity Corporation (a Delaware Corporation) and distributed by NYLIFE Distributors LLC (Member FINRA/SIPC).
New York Life Insurance Company
New York Life Insurance and Annuity Corporation (NYLIAC) (A Delaware Corporation)
51 Madison Avenue, Room 551
New York, NY 10010
www.newyorklife.com
Printed on recycled paper
mainstayinvestments.com
NYLIFE Distributors LLC, 30 Hudson Street, Jersey City, NJ 07302
New York Life Investment Management LLC is the investment manager to the MainStay VP Funds Trust
©2017 by NYLIFE Distributors LLC. All rights reserved.
You may obtain copies of the Prospectus and the Statement of Additional Information free of charge, upon request, by calling toll-free 800-598-2019 or writing to New York Life Insurance and Annuity Corporation, 51 Madison Avenue, New York, NY 10010.
| | | | |
| Not FDIC Insured | | No Bank Guarantee | | May Lose Value |
| | | | |
| 1744024 | | | | MSVPC10-08/17 (NYLIAC) NI512 |
MainStay VP Epoch U.S. Equity Yield Portfolio
(Formerly known as MainStay VP ICAP Select Equity Portfolio)
Message from the President and Semiannual Report
Unaudited | June 30, 2017

Sign up for electronic delivery of your shareholder reports. For full details on electronic delivery, including who can participate and what you
can receive via eDelivery, please log on to www.newyorklife.com/vsc

This page intentionally left blank
Message from the President
The six months ended June 30, 2017, brought positive results to many stock and bond investors. The year began with many investors hoping that Republican control of the White House, the Senate and the House of Representatives could bring an end to political gridlock; and while debate has continued on a number of issues, the U.S. stock market climbed relatively steadily throughout the first half of 2017.
According to FTSE-Russell U.S. market data, stocks at all capitalization levels tended to record positive total returns during the reporting period, with large-cap stocks generally outperforming stocks of smaller-capitalization companies. Growth stocks outpaced value stocks at every capitalization level by substantial margins—from more than six percentage points for micro-caps and mid-caps to more than 10 percentage points for the largest 200 U.S. companies by market capitalization.
Most sectors of the stock market advanced during the reporting period, with energy and telecommunication services being notable exceptions. Energy stocks declined as oil prices fell despite moves by the Organization of Petroleum Exporting Countries (OPEC) intended to limit oil production by its members. Telecommunication services stocks tended to decline as competition increased and rising interest rates made dividend payouts less appealing.
In March and June of 2017, the Federal Reserve announced successive increases in the target range for the federal funds rate, ultimately bringing the federal funds target range to 1.00% to 1.25%. While short-term U.S. Treasury yields rose in response, yields for U.S. Treasury securities with maturities of five years or longer declined. As the difference between short- and long-term yields narrowed, the advantages of higher-yielding long-term bonds became increasingly apparent.
Virtually all taxable and tax-exempt bond sectors provided positive total returns during the reporting period. Mortgage-backed
securities, though providing positive total returns, faced headwinds when the Federal Reserve announced plans to begin normalizing its balance sheet by reducing reinvestment of principal payments on mortgage-backed securities.
International stock and bond markets were also strong during the reporting period. International stocks provided double-digit total returns that were surpassed by emerging-market stocks as a whole. Global investment-grade bonds provided single-digit returns; and emerging-market debt was somewhat stronger.
Even during periods of favorable market performance and generally positive returns, MainStay believes that it is important to carefully monitor your investments. Your risk tolerance may
change over time, leading you to reevaluate which MainStay VP Portfolios are most appropriate for your long-term goals. Your goals themselves may also change, leading you to pursue investments with more or less risk. The portfolio managers of MainStay VP Portfolios seek to provide results consistent with the investment objectives of their respective Portfolios, to give you a wide range of choices suitable to various investment needs.
The report that follows provides more detailed information about the specific markets, securities and investment decisions that influenced your MainStay VP Portfolio during the six months ended June 30, 2017. We invite you to review the report carefully as part of your ongoing investment evaluation and review.
Sincerely,

Stephen P. Fisher
President
The opinions expressed are as of the date of the accompanying report and are subject to change. Past performance is no guarantee of future results. There is no guarantee that any forecasts made will come to pass. This material does not constitute investment advice and is not intended as an endorsement of any specific investment.
Not all MainStay VP Portfolios and/or share classes are available under all policies.
Not part of the Semiannual Report
Table of Contents
Investors should refer to the Portfolio’s Summary Prospectus and/or Prospectus and consider the Portfolio’s investment objectives, strategies, risks, charges and expenses carefully before investing. The Summary Prospectus and/or Prospectus contain this and other information about the Portfolio. You may obtain copies of the Portfolio’s Summary Prospectus and/or the Prospectus and the Statement of Additional Information free of charge, upon request, by calling toll-free 800-598-2019, by writing to New York Life Insurance and Annuity Corporation, 51 Madison Avenue, Room 251, New York, New York 10010 or by sending an email to MainStayShareholdersServices@nylim.com. These documents are also available at mainstayinvestments.com/vpdocuments. Please read the Summary Prospectus and/or Prospectus carefully before investing. MainStay VP Funds Trust portfolios are separate account options which are purchased through a variable insurance or variable annuity contract.
Investment and Performance Comparison1 (Unaudited)
Performance data quoted represents past performance. Past performance is no guarantee of future results. Because of market volatility and other factors, current performance may be lower or higher than the figures shown. Investment return and principal value will fluctuate, and as a result, when shares are redeemed, they may be worth more or less than their original cost. The performance table and graph do not reflect any deduction of sales charges, mortality and expense charges, contract charges or administrative charges. Please refer to the Performance Summary appropriate for your policy. For performance information current to the most recent month-end, please call 800-598-2019 or visit www.newyorklife.com.
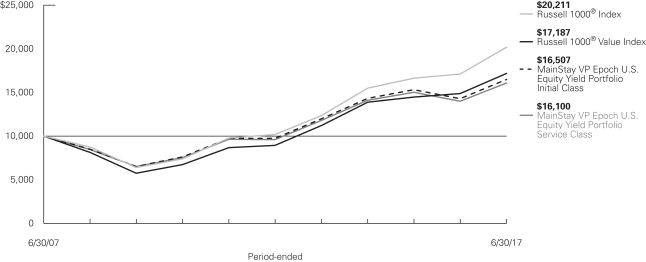
Average Annual Total Returns for the Period Ended June 30, 2017
| | | | | | | | | | | | | | | | | | |
| Class1 | | Inception
Date | | Six Months | | One Year | | Five Years | | | Ten Years | | | Gross
Expense
Ratio2 | |
| Initial Class Shares | | 5/1/1998 | | 8.85% | | 15.38% | | | 11.13 | % | | | 5.14 | % | | | 0.72 | % |
| Service Class Shares | | 6/5/2003 | | 8.72 | | 15.10 | | | 10.85 | | | | 4.88 | | | | 0.97 | |
| | | | | | | | | | | | | | | | |
| Benchmark Performance | | Six
Months | | | One
Year | | | Five
Years | | | Ten
Years | |
Russell 1000® Value Index3 | | | 4.66 | % | | | 15.53 | % | | | 13.94 | % | | | 5.57 | % |
Russell 1000® Index4 | | | 9.27 | | | | 18.03 | | | | 14.67 | | | | 7.29 | |
Average Lipper Variable Products Large-Cap Core Portfolio5 | | | 9.04 | | | | 17.21 | | | | 13.64 | | | | 6.26 | |
| 1. | The Portfolio replaced its subadvisor, effective January 9, 2017, and modified its principal investment strategies as of March 13, 2017. The performance showed above reflects the Portfolio’s prior subadvisor and principal investment strategies. Past performance may have been different if the new subadvisor or revised principal investment strategies had been in place during the period. |
| 2. | The gross expense ratios presented reflect the Portfolio’s “Total Annual Portfolio Operating Expenses” from the most recent Prospectus and may differ from other expense ratios disclosed in this report. |
| 3. | The Russell 1000® Value Index is the Portfolio’s primary broad-based securities market index for comparison purposes. The Russell 1000® Value Index measures the performance of the large-cap value segment of the U.S. equity universe. It includes those Russell 1000® Index companies with lower price-to-book ratios and lower expected growth values. Results assume reinvestment of all dividends and capital gains. An investment cannot be made directly in an index. |
| 4. | The Russell 1000® Index is the Portfolio’s secondary benchmark. The Russell 1000® Index measures the performance of the large-cap segment of the U.S. equity universe. It is a subset of the Russell 3000® Index and includes approximately 1,000 of the largest securities based on a combination of their market cap and current index membership. Results assume reinvestment of all dividends and capital gains. An investment cannot be made directly in an index. |
| 5. | The Average Lipper Variable Products Large-Cap Core Portfolio is representative of portfolios that, by portfolio practice, invest at least 75% of their equity assets in companies with market capitalizations (on a three-year weighted basis) above Lipper’s U.S. diversified equity large-cap floor. Large-cap core portfolios have more latitude in the companies in which they invest. These portfolios typically have average characteristics compared to the S&P 500® Index. This benchmark is a product of Lipper Inc. Lipper Inc. is an independent monitor of fund performance. Results are based on average total returns of similar portfolios with all dividend and capital gain distributions reinvested. |
Cost in Dollars of a $1,000 Investment in MainStay VP Epoch U.S. Equity Yield Portfolio (Unaudited)
The example below is intended to describe the fees and expenses borne by shareholders during the six-month period from January 1, 2017 to June 30, 2017, and the impact of those costs on your investment.
Example
As a shareholder of the Portfolio, you incur two types of costs: (1) transaction costs, including exchange fees and sales charges (loads) on purchases (as applicable), and (2) ongoing costs, including management fees, distribution and/or service (12b-1) fees, and other Portfolio expenses (as applicable). This example is intended to help you understand your ongoing costs (in dollars) of investing in the Portfolio and to compare these costs with the ongoing costs of investing in other mutual funds. The example is based on an investment of $1,000 made at the beginning of the six-month period and held for the entire period from January 1, 2017 to June 30, 2017. Shares are only sold in connection with variable life and annuity contracts and the example does not reflect any contract level or transactional fees or expenses. If these costs had been included, your costs would have been higher.
This example illustrates your Portfolio’s ongoing costs in two ways:
Actual Expenses
The second and third data columns in the table below provide information about actual account values and actual expenses. You may use the information in these columns, together with the amount you invested, to estimate the expenses that you paid during the six months ended June 30, 2017. Simply divide your account value by $1,000
(for example, an $8,600 account value divided by $1,000 = 8.6), then multiply the result by the number under the heading entitled “Expenses Paid During Period” to estimate the expenses you paid on your account during this period.
Hypothetical Example for Comparison Purposes
The fourth and fifth data columns in the table below provide information about hypothetical account values and hypothetical expenses based on the Portfolio’s actual expense ratio and an assumed rate of return of 5% per year before expenses, which is not the Portfolio’s actual return. The hypothetical account values and expenses may not be used to estimate the actual ending account balances or expenses you paid for the six-month period shown. You may use this information to compare the ongoing costs of investing in the Portfolio with the ongoing costs of investing in other mutual funds. To do so, compare this 5% hypothetical example with the 5% hypothetical examples that appear in the shareholder reports of the other mutual funds.
Please note that the expenses shown in the table are meant to highlight your ongoing costs only and do not reflect any transactional costs, such as exchange fees or sales charges (loads). Therefore, the fourth and fifth data columns of the table are useful in comparing ongoing costs only and will not help you determine the relative total costs of owning different funds. In addition, if these transactional costs were included, your costs would have been higher.
| | | | | | | | | | | | | | | | | | | | | | | | |
| | | | | | | | | | | | | | | | | | | |
| Share Class | | Beginning
Account
Value
1/1/17 | | | Ending Account
Value (Based
on Actual
Returns and
Expenses)
6/30/17 | | | Expenses
Paid
During
Period1 | | | Ending Account
Value (Based
on Hypothetical
5% Annualized
Return and
Actual Expenses)
6/30/17 | | | Expenses
Paid
During
Period1 | | | Net Expense
Ratio
During
Period2 | |
| | | | | | |
| Initial Class Shares | | $ | 1,000.00 | | | $ | 1,088.50 | | | $ | 3.83 | | | $ | 1,021.10 | | | $ | 3.71 | | | | 0.74 | % |
| | | | | | |
| Service Class Shares | | $ | 1,000.00 | | | $ | 1,087.20 | | | $ | 5.18 | | | $ | 1,019.80 | | | $ | 5.01 | | | | 1.00 | % |
| 1. | Expenses are equal to the Portfolio’s annualized expense ratio of each class multiplied by the average account value over the period, divided by 365 and multiplied by 181 (to reflect the six-month period). The table above represents the actual expenses incurred during the six-month period. |
| 2. | Expenses are equal to the Portfolio’s annualized expense ratio to reflect the six-month period. |
| | |
| 6 | | MainStay VP Epoch U.S. Equity Yield Portfolio |
Industry Composition as of June 30, 2017 (Unaudited)
| | | | |
| Electric Utilities | | | 7.8 | % |
| Multi-Utilities | | | 7.7 | |
| Tobacco | | | 5.8 | |
| Semiconductors & Semiconductor Equipment | | | 5.3 | |
| Aerospace & Defense | | | 5.2 | |
| Oil, Gas & Consumable Fuels | | | 5.1 | |
| Pharmaceuticals | | | 4.4 | |
| Diversified Telecommunication Services | | | 3.9 | |
| Banks | | | 3.8 | |
| Household Products | | | 3.8 | |
| Equity Real Estate Investment Trusts (REITs) | | | 3.6 | |
| Beverages | | | 3.5 | |
| Insurance | | | 3.3 | |
| Industrial Conglomerates | | | 2.7 | |
| Commercial Services & Supplies | | | 2.5 | |
| Food Products | | | 2.5 | |
| IT Services | | | 2.3 | |
| Electrical Equipment | | | 2.2 | |
| Biotechnology | | | 2.1 | |
| Capital Markets | | | 2.1 | |
| | | | |
| Software | | | 2.0 | % |
| Chemicals | | | 1.9 | |
| Food & Staples Retailing | | | 1.7 | |
| Hotels, Restaurants & Leisure | | | 1.6 | |
| Wireless Telecommunication Services | | | 1.6 | |
| Communications Equipment | | | 1.2 | |
| Media | | | 1.2 | |
| Air Freight & Logistics | | | 1.0 | |
| Technology Hardware, Storage & Peripherals | | | 1.0 | |
| Containers & Packaging | | | 0.9 | |
| Distributors | | | 0.9 | |
| Health Care Equipment & Supplies | | | 0.8 | |
| Health Care Providers & Services | | | 0.8 | |
| Specialty Retail | | | 0.8 | |
| Automobiles | | | 0.7 | |
| Short-Term Investment | | | 2.1 | |
| Other Assets, Less Liabilities | | | 0.2 | |
| | | | |
| | | 100.0 | % |
| | | | |
See Portfolio of Investments beginning on page 10 for specific holdings within these categories.
Top Ten Holdings as of June 30, 2017 (excluding short-term investment) (Unaudited)
| 1. | Reynolds American, Inc. |
| 9. | Philip Morris International, Inc. |
Portfolio Management Discussion and Analysis (Unaudited)
Answers to the questions reflect the views of portfolio managers Eric Sappenfield, Michael Welhoelter, CFA, William Priest, CFA, John M. Tobin, PhD, CFA, Kera Van Valen, CFA, of Epoch Investment Partners, Inc. (“Epoch”), the Portfolio’s Subadvisor.
How did MainStay VP Epoch U.S. Equity Yield Portfolio perform relative to its benchmarks and peers during the six months ended June 30, 2017?
For the six months ended June 30, 2017, MainStay VP Epoch U.S. Equity Yield Portfolio returned 8.85% for Initial Class shares and 8.72% for Service Class shares. Over the same period, both share classes outperformed the 4.66% return of the Russell 1000® Value Index,1 which is the Portfolio’s primary benchmark. Both share classes underperformed the 9.27% return of the Russell 1000® Index,1 which is the Portfolio’s secondary benchmark, and the 9.04% return of the Average Lipper2 Variable Products Large-Cap Core Portfolio for the six months ended June 30, 2017.
Were there any changes to the Portfolio during the reporting period?
Effective January 9, 2017, Institutional Capital LLC was replaced as subadvisor of MainStay VP ICAP Select Equity Portfolio by Epoch, as interim subadvisor. On the same date, the Portfolio’s investment process was revised. Effective March 13, 2017, the Portfolio’s name changed from MainStay VP ICAP Select Equity Portfolio to MainStay VP Epoch U.S. Equity Yield Portfolio and changes were made to the Portfolio’s investment objective, principal investment strategies and principal risks. At a shareholder meeting held on March 31, 2017, shareholders approved a proposal to appoint Epoch as non-interim subadvisor to the Portfolio. For more information on these changes, see the prospectus supplement dated January 9, 2017, and the proxy statement dated January 27, 2017.
What factors affected the Portfolio’s relative performance during the reporting period?
The Portfolio’s performance relative to the Russell 1000® Value Index benefited from stock selection in the energy, telecommunication services and industrials sectors. The Portfolio’s relative performance was also helped by an underweight position relative to the Index in energy, the worst-performing sector in the Index, and an overweight position in information technology. The Portfolio’s relative performance was hindered by stock selection in the consumer staples and information technology sectors.
Which sectors were the strongest positive contributors to the Portfolio’s relative performance, and which sectors were particularly weak?
The strongest contributions to performance relative to the Russell 1000® Value Index came from the energy and industrials sectors. (Contributions take weightings and total
returns into account.) Stock selection helped in each of these sectors, and having roughly half the exposure of the Index to the energy sector was a positive factor. The weakest contribution to the Portfolio’s relative performance came from the consumer staples sector. There were no other notable detractors from the Portfolio’s relative performance on a sector basis.
During the reporting period, which individual stocks made the strongest positive contributions to the Portfolio’s absolute performance and which stocks detracted the most?
The most substantial individual contributors to the Portfolio’s absolute performance were Apple, Oracle and Abbott Laboratories. Apple is a global technology company that designs, develops and sells consumer electronics, computer software and online services. Apple continued to benefit from strong iPhone unit sales and average selling prices, which have been boosted by a shift toward higher-priced phones. Apple continued to drive software and services innovation that enabled the company to capture premium pricing on its hardware. Apple returned cash to shareholders through dividends and share repurchases. Oracle is an enterprise software company and a leading provider of relational database management systems. Performance was driven by strong execution in the company’s shift to subscription service offerings. Oracle’s cloud-based service offerings have grown large enough to offset the company’s declining legacy license business, which we believe has provided a solid foundation for faster growth. In our view, Oracle has paid a well-covered dividend and has a substantial share-repurchase program. Abbott Laboratories makes and sells health care products including prescription drugs, nutritional supplements, medical devices and diagnostic technologies. The company’s shares traded higher in the first half of 2017, broadly in line with the pharmaceutical and health care sectors. The shares were further supported by the closing of the acquisition of St. Jude Medical in January, which strengthened the medical device platform at Abbott Labs. With a significant increase in debt to finance the St. Jude acquisition, and with continued uncertainty (and litigation) surrounding Abbott Labs’ long-pending offer to acquire Alere, we exited the Portfolio’s position in Abbott Labs toward the end of the first quarter of 2017.
The largest individual detractors from the Portfolio’s absolute performance were Whirlpool, Royal Dutch Shell and AT&T. Whirlpool is a leading global appliance manufacturer. Shares came under pressure when management reported weaker-than-expected margins in North America and softer volume growth outside North America. The Portfolio exited its position in the
| 1. | See footnote on page 5 for more information on this index. |
| 2. | See footnote on page 5 for more information on Lipper Inc. |
| | |
| 8 | | MainStay VP Epoch U.S. Equity Yield Portfolio |
company. Royal Dutch Shell is a global integrated energy company that explores, produces and markets crude oil and natural gas. The company’s share price fell in concert with the slump in the energy sector. Royal Dutch Shell has focused on improving its balance sheet, extracting additional synergies from its merger with BG Group, and leveraging its strength in deep-water and liquid natural gas (LNG). AT&T shares faced pressures from an increasingly competitive environment in the wireless segment, which saw a return to unlimited data offerings from all of the major carriers. Even with these pressures, we believed that AT&T, the largest pay TV and second-largest mobile telecommunication services provider in the United States, was well-positioned. The company’s pending Time Warner transaction could help further diversify AT&T’s cash generation and increase the company’s growth profile. AT&T returned excess cash through a healthy dividend, a debt pay-down and opportunistic share repurchases.
Did the Portfolio make any significant purchases or sales during the reporting period?
Several significant purchases and sales were made to bring the Portfolio in line with its revised investment objective, principal investment strategies and investment process.
How did the Portfolio’s sector weightings change during the reporting period?
The Portfolio’s sector weightings were changed to bring investments in line with its revised investment objective, principal investment strategies and investment process. The largest sector weighting shifts were an increase in consumer staples and a decrease in consumer discretionary.
How was the Portfolio positioned at the end of the reporting period?
As of June 30, 2017, the Portfolio held overweight positions relative to the Russell 1000® Value Index in the utilities, consumer staples and industrials sectors. As of the same date, the Portfolio held underweight positions relative to the Index in financials, health care and energy. Sector weights in the Portfolio are the result of individual stock selection.
The opinions expressed are those of the portfolio managers as of the date of this report and are subject to change. There is no guarantee that any forecasts made will come to pass. This material does not constitute investment advice and is not intended as an endorsement of any specific investment.
Not all MainStay VP Portfolios and/or share classes are available under all policies.
Portfolio of Investments June 30, 2017 (Unaudited)
| | | | | | | | |
| | |
Shares | | | Value | |
| Common Stocks 97.7%† | | | | | | | | |
Aerospace & Defense 5.2% | | | | | | | | |
Boeing Co. | | | 71,523 | | | $ | 14,143,673 | |
General Dynamics Corp. | | | 61,306 | | | | 12,144,718 | |
Lockheed Martin Corp. | | | 58,751 | | | | 16,309,865 | |
Raytheon Co. | | | 81,741 | | | | 13,199,537 | |
United Technologies Corp. | | | 95,152 | | | | 11,619,011 | |
| | | | | | | | |
| | | | | | | 67,416,804 | |
| | | | | | | | |
Air Freight & Logistics 1.0% | | | | | | | | |
United Parcel Service, Inc., Class B | | | 119,418 | | | | 13,206,437 | |
| | | | | | | | |
| | |
Automobiles 0.7% | | | | | | | | |
Dong Energy A/S | | | 121,973 | | | | 8,872,316 | |
| | | | | | | | |
| | |
Banks 3.8% | | | | | | | | |
Commonwealth Bank of Australia, Sponsored ADR | | | 98,983 | | | | 6,312,146 | |
M&T Bank Corp. | | | 72,801 | | | | 11,790,122 | |
People’s United Financial, Inc. | | | 501,940 | | | | 8,864,260 | |
U.S. Bancorp | | | 224,149 | | | | 11,637,816 | |
Wells Fargo & Co. | | | 180,724 | | | | 10,013,917 | |
| | | | | | | | |
| | | | | | | 48,618,261 | |
| | | | | | | | |
Beverages 3.5% | | | | | | | | |
Coca-Cola Co. | | | 295,672 | | | | 13,260,889 | |
Coca-Cola European Partners PLC | | | 257,356 | | | | 10,466,669 | |
Molson Coors Brewing Co. Class B | | | 119,418 | | | | 10,310,550 | |
PepsiCo., Inc. | | | 94,513 | | | | 10,915,306 | |
| | | | | | | | |
| | | | | | | 44,953,414 | |
| | | | | | | | |
Biotechnology 2.1% | | | | | | | | |
¨AbbVie, Inc. | | | 371,666 | | | | 26,949,502 | |
| | | | | | | | |
| | |
Capital Markets 2.1% | | | | | | | | |
BlackRock, Inc. | | | 32,569 | | | | 13,757,471 | |
CME Group, Inc. | | | 105,369 | | | | 13,196,414 | |
| | | | | | | | |
| | | | | | | 26,953,885 | |
| | | | | | | | |
Chemicals 1.9% | | | | | | | | |
Agrium, Inc. | | | 78,548 | | | | 7,107,808 | |
Dow Chemical Co. | | | 266,297 | | | | 16,795,352 | |
| | | | | | | | |
| | | | | | | 23,903,160 | |
| | | | | | | | |
Commercial Services & Supplies 2.5% | | | | | | | | |
Deluxe Corp. | | | 132,829 | | | | 9,194,424 | |
Republic Services, Inc. | | | 150,710 | | | | 9,604,748 | |
Waste Management, Inc. | | | 173,700 | | | | 12,740,895 | |
| | | | | | | | |
| | | | | | | 31,540,067 | |
| | | | | | | | |
Communications Equipment 1.2% | | | | | | | | |
Cisco Systems, Inc. | | | 494,916 | | | | 15,490,871 | |
| | | | | | | | |
| | | | | | | | |
| | |
Shares | | | Value | |
Containers & Packaging 0.9% | | | | | | | | |
Bemis Co., Inc. | | | 258,633 | | | $ | 11,961,776 | |
| | | | | | | | |
| | |
Distributors 0.9% | | | | | | | | |
Genuine Parts Co. | | | 123,250 | | | | 11,432,670 | |
| | | | | | | | |
|
Diversified Telecommunication Services 3.9% | |
AT&T, Inc. | | | 557,499 | | | | 21,034,437 | |
CenturyLink, Inc. | | | 369,750 | | | | 8,829,630 | |
Verizon Communications, Inc. | | | 452,130 | | | | 20,192,126 | |
| | | | | | | | |
| | | | | | | 50,056,193 | |
| | | | | | | | |
Electric Utilities 7.8% | | | | | | | | |
American Electric Power Co., Inc. | | | 136,082 | | | | 9,453,617 | |
¨Duke Energy Corp. | | | 296,950 | | | | 24,822,050 | |
Entergy Corp. | | | 240,753 | | | | 18,482,608 | |
Eversource Energy | | | 286,093 | | | | 17,368,706 | |
PPL Corp. | | | 547,920 | | | | 21,182,587 | |
Southern Co. | | | 178,170 | | | | 8,530,780 | |
| | | | | | | | |
| | | | | | | 99,840,348 | |
| | | | | | | | |
Electrical Equipment 2.2% | | | | | | | | |
Eaton Corp. PLC | | | 193,496 | | | | 15,059,794 | |
Emerson Electric Co. | | | 231,174 | | | | 13,782,594 | |
| | | | | | | | |
| | | | | | | 28,842,388 | |
| | | | | | | | |
Equity Real Estate Investment Trusts (REITs) 3.6% | | | | | |
Iron Mountain, Inc. | | | 398,487 | | | | 13,692,013 | |
Public Storage | | | 42,786 | | | | 8,922,165 | |
¨Welltower, Inc. | | | 308,444 | | | | 23,087,033 | |
| | | | | | | | |
| | | | | | | 45,701,211 | |
| | | | | | | | |
Food & Staples Retailing 1.7% | | | | | | | | |
CVS Health Corp. | | | 104,731 | | | | 8,426,656 | |
Wal-Mart Stores, Inc. | | | 180,086 | | | | 13,628,909 | |
| | | | | | | | |
| | | | | | | 22,055,565 | |
| | | | | | | | |
Food Products 2.5% | | | | | | | | |
Campbell Soup Co. | | | 243,307 | | | | 12,688,460 | |
Kraft Heinz Co. | | | 231,174 | | | | 19,797,741 | |
| | | | | | | | |
| | | | | | | 32,486,201 | |
| | | | | | | | |
Health Care Equipment & Supplies 0.8% | | | | | |
Medtronic PLC | | | 113,671 | | | | 10,088,301 | |
| | | | | | | | |
| | |
Health Care Providers & Services 0.8% | | | | | | | | |
UnitedHealth Group, Inc. | | | 56,835 | | | | 10,538,346 | |
| | | | | | | | |
| | |
Hotels, Restaurants & Leisure 1.6% | | | | | | | | |
Brinker International, Inc. | | | 159,012 | | | | 6,058,357 | |
McDonald’s Corp. | | | 97,706 | | | | 14,964,651 | |
| | | | | | | | |
| | | | | | | 21,023,008 | |
| | | | | | | | |
| † | Percentages indicated are based on Portfolio net assets. |
| ¨ | | Among the Portfolio’s 10 largest holdings, as of June 30, 2017, excluding short-term investment. May be subject to change daily. |
| | | | |
| 10 | | MainStay VP Epoch U.S. Equity Yield Portfolio | | The notes to the financial statements are an integral part of,
and should be read in conjunction with, the financial statements. |
| | | | | | | | |
| | |
Shares | | | Value | |
| Common Stocks (continued) | | | | | | | | |
Household Products 3.8% | | | | | | | | |
Colgate-Palmolive Co. | | | 97,067 | | | $ | 7,195,577 | |
¨Kimberly-Clark Corp. | | | 187,110 | | | | 24,157,772 | |
Procter & Gamble Co. | | | 205,630 | | | | 17,920,654 | |
| | | | | | | | |
| | | | | | | 49,274,003 | |
| | | | | | | | |
Industrial Conglomerates 2.7% | | | | | | | | |
¨3M Co. | | | 113,032 | | | | 23,532,132 | |
Honeywell International, Inc. | | | 80,464 | | | | 10,725,047 | |
| | | | | | | | |
| | | | | | | 34,257,179 | |
| | | | | | | | |
Insurance 3.3% | | | | | | | | |
Allianz S.E., Sponsored ADR | | | 562,608 | | | | 11,125,573 | |
Arthur J. Gallagher & Co. | | | 332,711 | | | | 19,047,705 | |
Marsh & McLennan Cos., Inc. | | | 163,150 | | | | 12,719,174 | |
| | | | | | | | |
| | | | | | | 42,892,452 | |
| | | | | | | | |
IT Services 2.3% | | | | | | | | |
Automatic Data Processing, Inc. | | | 175,615 | | | | 17,993,513 | |
Paychex, Inc. | | | 210,100 | | | | 11,963,094 | |
| | | | | | | | |
| | | | | | | 29,956,607 | |
| | | | | | | | |
Media 1.2% | | | | | | | | |
Regal Entertainment Group Class A | | | 400,403 | | | | 8,192,245 | |
Time Warner, Inc. | | | 74,078 | | | | 7,438,172 | |
| | | | | | | | |
| | | | | | | 15,630,417 | |
| | | | | | | | |
Multi-Utilities 7.7% | | | | | | | | |
¨Ameren Corp. | | | 398,487 | | | | 21,785,284 | |
CMS Energy Corp. | | | 356,978 | | | | 16,510,233 | |
Dominion Energy, Inc. | | | 213,931 | | | | 16,393,533 | |
NiSource, Inc. | | | 379,329 | | | | 9,619,783 | |
Vectren Corp. | | | 206,268 | | | | 12,054,302 | |
¨WEC Energy Group, Inc. | | | 372,943 | | | | 22,891,241 | |
| | | | | | | | |
| | | | | | | 99,254,376 | |
| | | | | | | | |
Oil, Gas & Consumable Fuels 5.1% | | | | | | | | |
Enterprise Products Partners, L.P. | | | 656,482 | | | | 17,777,533 | |
Exxon Mobil Corp. | | | 158,373 | | | | 12,785,452 | |
Occidental Petroleum Corp. | | | 260,549 | | | | 15,599,069 | |
Royal Dutch Shell PLC Class A, Sponsored ADR | | | 362,317 | | | | 19,271,641 | |
| | | | | | | | |
| | | | | | | 65,433,695 | |
| | | | | | | | |
Pharmaceuticals 4.4% | | | | | | | | |
Johnson & Johnson | | | 155,819 | | | | 20,613,295 | |
Merck & Co., Inc. | | | 256,651 | | | | 16,448,763 | |
Pfizer, Inc. | | | 590,373 | | | | 19,830,629 | |
| | | | | | | | |
| | | | | | | 56,892,687 | |
| | | | | | | | |
Semiconductors & Semiconductor Equipment 5.3% | |
Analog Devices, Inc. | | | 146,240 | | | | 11,377,472 | |
Intel Corp. | | | 267,574 | | | | 9,027,947 | |
Microchip Technology, Inc. | | | 128,997 | | | | 9,955,988 | |
QUALCOMM, Inc. | | | 330,157 | | | | 18,231,269 | |
Texas Instruments, Inc. | | | 245,861 | | | | 18,914,087 | |
| | | | | | | | |
| | | | | | | 67,506,763 | |
| | | | | | | | |
| | | | | | | | |
| | |
Shares | | | Value | |
Software 2.0% | | | | | �� | | | |
Microsoft Corp. | | | 261,826 | | | $ | 18,047,666 | |
Oracle Corp. | | | 153,784 | | | | 7,710,730 | |
| | | | | | | | |
| | | | | | | 25,758,396 | |
| | | | | | | | |
Specialty Retail 0.8% | | | | | | | | |
Home Depot, Inc. | | | 68,969 | | | | 10,579,845 | |
| | | | | | | | |
|
Technology Hardware, Storage & Peripherals 1.0% | |
Apple, Inc. | | | 89,345 | | | | 12,867,467 | |
| | | | | | | | |
| | |
Tobacco 5.8% | | | | | | | | |
¨Altria Group, Inc. | | | 325,687 | | | | 24,253,911 | |
¨Philip Morris International, Inc. | | | 186,175 | | | | 21,866,254 | |
¨Reynolds American, Inc. | | | 428,501 | | | | 27,869,705 | |
| | | | | | | | |
| | | | | | | 73,989,870 | |
| | | | | | | | |
Wireless Telecommunication Services 1.6% | |
Vodafone Group PLC, Sponsored ADR | | | 720,981 | | | | 20,713,784 | |
| | | | | | | | |
Total Common Stocks
(Cost $1,224,165,947) | | | | | | | 1,256,938,265 | |
| | | | | | | | |
| | |
| | | | | | | | |
| | | Principal
Amount | | | | |
| Short-Term Investment 2.1% | | | | | | | | |
Repurchase Agreement 2.1% | | | | | | | | |
Fixed Income Clearing Corp.
0.12%, dated 6/30/17
due 7/3/17
Proceeds at Maturity $26,800,539 (Collateralized by a United States Treasury Note with a rate of 2.00% and a maturity date of 8/31/21, with a Principal Amount of $26,890,000, and a Market Value of $27,340,569) | | $ | 26,800,271 | | | | 26,800,271 | |
| | | | | | | | |
Total Short-Term Investment
(Cost $26,800,271) | | | | | | | 26,800,271 | |
| | | | | | | | |
Total Investments
(Cost $1,250,966,218) | | | 99.8 | % | | | 1,283,738,536 | |
Other Assets, Less Liabilities | | | 0.2 | | | | 2,219,843 | |
Net Assets | | | 100.0 | % | | $ | 1,285,958,379 | |
| (a) | As of June 30, 2017, cost was $1,251,500,642 for federal income tax purposes and net unrealized appreciation was as follows: |
| | | | |
Gross unrealized appreciation | | $ | 57,374,764 | |
Gross unrealized depreciation | | | (25,136,870 | ) |
| | | | |
Net unrealized appreciation | | $ | 32,237,894 | |
| | | | |
The following abbreviations are used in the preceding pages:
ADR—American Depositary Receipt
CME—Chicago Mercantile Exchange
| | | | | | |
The notes to the financial statements are an integral part of,
and should be read in conjunction with, the financial statements. | | | | | 11 | |
Portfolio of Investments June 30, 2017 (Unaudited) (continued)
The following is a summary of the fair valuations according to the inputs used as of June 30, 2017, for valuing the Portfolio’s assets.
Asset Valuation Inputs
| | | | | | | | | | | | | | | | |
Description | | Quoted
Prices in
Active
Markets for
Identical
Assets (Level 1) | | | Significant
Other
Observable
Inputs
(Level 2) | | | Significant
Unobservable
Inputs
(Level 3) | | | Total | |
| Investments in Securities (a) | | | | | | | | | | | | | | | | |
| Common Stocks | | $ | 1,256,938,265 | | | $ | — | | | $ | — | | | $ | 1,256,938,265 | |
| Short-Term Investment | | | | | | | | | | | | | | | | |
Repurchase Agreement | | | — | | | | 26,800,271 | | | | — | | | | 26,800,271 | |
| | | | | | | | | | | | | | | | |
| Total Investments in Securities | | $ | 1,256,938,265 | | | $ | 26,800,271 | | | $ | — | | | $ | 1,283,738,536 | |
| | | | | | | | | | | | | | | | |
| (a) | For a complete listing of investments and their industries, see the Portfolio of Investments. |
The Portfolio recognizes transfers between the levels as of the beginning of the period.
For the period ended June 30, 2017, the Portfolio did not have any transfers among levels. (See Note 2)
As of June 30, 2017, the Portfolio did not hold any investments with significant unobservable inputs (Level 3). (See Note 2)
| | | | |
| 12 | | MainStay VP Epoch U.S. Equity Yield Portfolio | | The notes to the financial statements are an integral part of,
and should be read in conjunction with, the financial statements. |
Statement of Assets and Liabilities as of June 30, 2017 (Unaudited)
| | | | |
| Assets | |
Investment in securities, at value
(identified cost $1,250,966,218) | | $ | 1,283,738,536 | |
Receivables: | | | | |
Dividends and interest | | | 3,403,185 | |
Fund shares sold | | | 182,405 | |
Other assets | | | 6,726 | |
| | | | |
Total assets | | | 1,287,330,852 | |
| | | | |
| |
| Liabilities | | | | |
Payables: | | | | |
Manager (See Note 3) | | | 730,720 | |
Fund shares redeemed | | | 399,330 | |
NYLIFE Distributors (See Note 3) | | | 110,430 | |
Shareholder communication | | | 92,448 | |
Professional fees | | | 25,650 | |
Custodian | | | 3,451 | |
Trustees | | | 2,080 | |
Accrued expenses | | | 8,364 | |
| | | | |
Total liabilities | | | 1,372,473 | |
| | | | |
Net assets | | $ | 1,285,958,379 | |
| | | | |
| |
| Composition of Net Assets | | | | |
Shares of beneficial interest outstanding (par value of $.001 per share) unlimited number of shares authorized | | $ | 86,172 | |
Additional paid-in capital | | | 1,165,231,177 | |
| | | | |
| | | 1,165,317,349 | |
Undistributed net investment income | | | 27,353,010 | |
Accumulated net realized gain (loss) on investments | | | 60,515,702 | |
Net unrealized appreciation (depreciation) on investments | | | 32,772,318 | |
| | | | |
Net assets | | $ | 1,285,958,379 | |
| | | | |
| | | | |
Initial Class | | | | |
Net assets applicable to outstanding shares | | $ | 755,999,184 | |
| | | | |
Shares of beneficial interest outstanding | | | 50,365,550 | |
| | | | |
Net asset value per share outstanding | | $ | 15.01 | |
| | | | |
Service Class | | | | |
Net assets applicable to outstanding shares | | $ | 529,959,195 | |
| | | | |
Shares of beneficial interest outstanding | | | 35,806,703 | |
| | | | |
Net asset value per share outstanding | | $ | 14.80 | |
| | | | |
| | | | | | |
The notes to the financial statements are an integral part of,
and should be read in conjunction with, the financial statements. | | | | | 13 | |
Statement of Operations for the six months ended June 30, 2017 (Unaudited)
| | | | |
| Investment Income (Loss) | |
Income | | | | |
Dividends (a) | | $ | 16,923,507 | |
Other income | | | 68,647 | |
Interest | | | 11,349 | |
| | | | |
Total income | | | 17,003,503 | |
| | | | |
Expenses | | | | |
Manager (See Note 3) | | | 4,448,978 | |
Distribution/Service—Service Class (See Note 3) | | | 664,501 | |
Shareholder communication | | | 112,102 | |
Professional fees | | | 51,956 | |
Trustees | | | 15,137 | |
Custodian | | | 4,898 | |
Miscellaneous | | | 24,296 | |
| | | | |
Total expenses | | | 5,321,868 | |
| | | | |
Net investment income (loss) | | | 11,681,635 | |
| | | | |
|
| Realized and Unrealized Gain (Loss) on Investments | |
| |
Net realized gain (loss) on investments | | | 105,327,309 | |
Net change in unrealized appreciation (depreciation) on investments | | | (13,097,593 | ) |
| | | | |
Net realized and unrealized gain (loss) on investments | | | 92,229,716 | |
| | | | |
Net increase (decrease) in net assets resulting from operations | | $ | 103,911,351 | |
| | | | |
| (a) | Dividends recorded net of foreign withholding taxes in the amount of $562,511. |
| | | | |
| 14 | | MainStay VP Epoch U.S. Equity Yield Portfolio | | The notes to the financial statements are an integral part of,
and should be read in conjunction with, the financial statements. |
Statements of Changes in Net Assets
for the six months ended June 30, 2017 (Unaudited) and the year ended December 31, 2016
| | | | | | | | |
| | | 2017 | | | 2016 | |
| Increase (Decrease) in Net Assets | |
Operations: | | | | | | | | |
Net investment income (loss) | | $ | 11,681,635 | | | $ | 15,057,805 | |
Net realized gain (loss) on investments | | | 105,327,309 | | | | (43,823,568 | ) |
Net change in unrealized appreciation (depreciation) on investments | | | (13,097,593 | ) | | | 81,399,718 | |
| | | | |
Net increase (decrease) in net assets resulting from operations | | | 103,911,351 | | | | 52,633,955 | |
| | | | |
Dividends and distributions to shareholders: | | | | | | | | |
From net investment income: | | | | | | | | |
Initial Class | | | — | | | | (7,082,681 | ) |
Service Class | | | — | | | | (4,511,516 | ) |
| | | | |
| | | — | | | | (11,594,197 | ) |
| | | | |
From net realized gain on investments: | | | | | | | | |
Initial Class | | | — | | | | (91,649,783 | ) |
Service Class | | | — | | | | (78,388,518 | ) |
| | | | |
| | | — | | | | (170,038,301 | ) |
| | | | |
Total dividends and distributions to shareholders | | | — | | | | (181,632,498 | ) |
| | | | |
Capital share transactions: | | | | | | | | |
Net proceeds from sale of shares | | | 99,879,828 | | | | 30,789,265 | |
Net asset value of shares issued to shareholders in reinvestment of dividends and distributions | | | — | | | | 181,632,498 | |
Cost of shares redeemed | | | (82,221,306 | ) | | | (144,384,432 | ) |
| | | | |
Increase (decrease) in net assets derived from capital share transactions | | | 17,658,522 | | | | 68,037,331 | |
| | | | |
Net increase (decrease) in net assets | | | 121,569,873 | | | | (60,961,212 | ) |
|
| Net Assets | |
Beginning of period | | | 1,164,388,506 | | | | 1,225,349,718 | |
| | | | |
End of period | | $ | 1,285,958,379 | | | $ | 1,164,388,506 | |
| | | | |
Undistributed net investment income at end of period | | $ | 27,353,010 | | | $ | 15,671,375 | |
| | | | |
| | | | | | |
The notes to the financial statements are an integral part of,
and should be read in conjunction with, the financial statements. | | | | | 15 | |
Financial Highlights selected per share data and ratios
| | | | | | | | | | | | | | | | | | | | | | | | | | | | |
| | | Six months
ended June 30, | | | | | | Year ended December 31, | |
| Initial Class | | 2017* | | | | | | 2016 | | | 2015 | | | 2014 | | | 2013 | | | 2012 | |
Net asset value at beginning of period | | $ | 13.79 | | | | | | | $ | 15.58 | | | $ | 18.94 | | | $ | 17.64 | | | $ | 13.76 | | | $ | 12.15 | |
| | | | | | | | | | | | | | | | | | | | | | | | | | | | |
Net investment income (loss) | | | 0.15 | (a) | | | | | | | 0.21 | (a) | | | 0.19 | (a) | | | 0.48 | (a)(b) | | | 0.28 | | | | 0.29 | |
Net realized and unrealized gain (loss) on investments | | | 1.07 | | | | | | | | 0.47 | | | | (0.95 | ) | | | 1.07 | | | | 3.86 | | | | 1.61 | |
| | | | | | | | | | | | | | | | | | | | | | | | | | | | |
Total from investment operations | | | 1.22 | | | | | | | | 0.68 | | | | (0.76 | ) | | | 1.55 | | | | 4.14 | | | | 1.90 | |
| | | | | | | | | | | | | | | | | | | | | | | | | | | | |
| Less dividends and distributions: | | | | | | | | | | | | | | | | | | | | | | | | | | | | |
From net investment income | | | — | | | | | | | | (0.18 | ) | | | (0.51 | ) | | | (0.25 | ) | | | (0.26 | ) | | | (0.29 | ) |
From net realized gain on investments | | | — | | | | | | | | (2.29 | ) | | | (2.09 | ) | | | — | | | | — | | | | — | |
| | | | | | | | | | | | | | | | | | | | | | | | | | | | |
Total dividends and distributions | | | — | | | | | | | | (2.47 | ) | | | (2.60 | ) | | | (0.25 | ) | | | (0.26 | ) | | | (0.29 | ) |
| | | | | | | | | | | | | | | | | | | | | | | | | | | | |
Net asset value at end of period | | $ | 15.01 | | | | | | | $ | 13.79 | | | $ | 15.58 | | | $ | 18.94 | | | $ | 17.64 | | | $ | 13.76 | |
| | | | | | | | | | | | | | | | | | | | | | | | | | | | |
Total investment return (c) | | | 8.85 | % | | | | | | | 4.90 | % | | | (3.78 | %) | | | 8.88 | % | | | 30.29 | % | | | 15.58 | % |
| Ratios (to average net assets)/Supplemental Data: | | | | | | | | | | | | | | | | | | | | | | | | | | | | |
Net investment income (loss) | | | 1.99 | %†† | | | | | | | 1.41 | % | | | 1.07 | % | | | 2.64 | %(b) | | | 1.54 | % | | | 1.76 | % |
Net expenses | | | 0.74 | %†† | | | | | | | 0.79 | % | | | 0.78 | % | | | 0.79 | % | | | 0.79 | % | | | 0.79 | % |
Portfolio turnover rate | | | 114 | % | | | | | | | 99 | % | | | 86 | % | | | 68 | % | | | 50 | % | | | 60 | % |
Net assets at end of period (in 000’s) | | $ | 755,999 | | | | | | | $ | 637,936 | | | $ | 655,690 | | | $ | 722,647 | | | $ | 709,112 | | | $ | 604,786 | |
| (a) | Per share data based on average shares outstanding during the period. |
| (b) | Included in net investment income per share and the ratio of net investment income to average net assets are $0.07 and 0.39%, respectively, resulting from a special one-time dividend from Vodafone Group PLC that paid $4.92 per share. |
| (c) | Total return does not reflect any deduction of sales charges, mortality and expense charges, contract charges or administrative charges. For periods of less than one year, total return is not annualized. |
| | | | | | | | | | | | | | | | | | | | | | | | | | | | |
| | | Six months
ended
June 30, | | | | | | Year ended December 31, | |
| Service Class | | 2017* | | | | | | 2016 | | | 2015 | | | 2014 | | | 2013 | | | 2012 | |
Net asset value at beginning of period | | $ | 13.61 | | | | | | | $ | 15.40 | | | $ | 18.75 | | | $ | 17.48 | | | $ | 13.63 | | | $ | 12.05 | |
| | | | | | | | | | | | | | | | | | | | | | | | | | | | |
Net investment income (loss) | | | 0.12 | (a) | | | | | | | 0.17 | (a) | | | 0.15 | (a) | | | 0.42 | (a)(b) | | | 0.20 | | | | 0.22 | |
Net realized and unrealized gain (loss) on investments | | | 1.07 | | | | | | | | 0.46 | | | | (0.95 | ) | | | 1.07 | | | | 3.87 | | | | 1.62 | |
| | | | | | | | | | | | | | | | | | | | | | | | | | | | |
Total from investment operations | | | 1.19 | | | | | | | | 0.63 | | | | (0.80 | ) | | | 1.49 | | | | 4.07 | | | | 1.84 | |
| | | | | | | | | | | | | | | | | | | | | | | | | | | | |
| Less dividends and distributions: | | | | | | | | | | | | | | | | | | | | | | | | | | | | |
From net investment income | | | — | | | | | | | | (0.13 | ) | | | (0.46 | ) | | | (0.22 | ) | | | (0.22 | ) | | | (0.26 | ) |
From net realized gain on investments | | | — | | | | | | | | (2.29 | ) | | | (2.09 | ) | | | — | | | | — | | | | — | |
| | | | | | | | | | | | | | | | | | | | | | | | | | | | |
Total dividends and distributions | | | — | | | | | | | | (2.42 | ) | | | (2.55 | ) | | | (0.22 | ) | | | (0.22 | ) | | | (0.26 | ) |
| | | | | | | | | | | | | | | | | | | | | | | | | | | | |
Net asset value at end of period | | $ | 14.80 | | | | | | | $ | 13.61 | | | $ | 15.40 | | | $ | 18.75 | | | $ | 17.48 | | | $ | 13.63 | |
| | | | | | | | | | | | | | | | | | | | | | | | | | | | |
Total investment return (c) | | | 8.74 | %(d) | | | | | | | 4.63 | % | | | (4.02 | %) | | | 8.61 | % | | | 29.96 | % | | | 15.29 | % |
| Ratios (to average net assets)/Supplemental Data: | | | | | | | | | | | | | | | | | | | | | | | | | | | | |
Net investment income (loss) | | | 1.70 | %†† | | | | | | | 1.16 | % | | | 0.82 | % | | | 2.36 | %(b) | | | 1.29 | % | | | 1.51 | % |
Net expenses | | | 1.00 | %†† | | | | | | | 1.04 | % | | | 1.03 | % | | | 1.04 | % | | | 1.04 | % | | | 1.04 | % |
Portfolio turnover rate | | | 114 | % | | | | | | | 99 | % | | | 86 | % | | | 68 | % | | | 50 | % | | | 60 | % |
Net assets at end of period (in 000’s) | | $ | 529,959 | | | | | | | $ | 526,452 | | | $ | 569,660 | | | $ | 647,096 | | | $ | 614,863 | | | $ | 475,815 | |
| (a) | Per share data based on average shares outstanding during the period. |
| (b) | Included in net investment income per share and the ratio of net investment income to average net assets are $0.07 and 0.39%, respectively, resulting from a special one-time dividend from Vodafone Group PLC that paid $4.92 per share. |
| (c) | Total return does not reflect any deduction of sales charges, mortality and expense charges, contract charges or administrative charges. For periods of less than one year, total return is not annualized. |
| (d) | Total investment return may reflect adjustments to conform to generally accepted accounting principles. |
| | | | |
| 16 | | MainStay VP Epoch U.S. Equity Yield Portfolio | | The notes to the financial statements are an integral part of,
and should be read in conjunction with, the financial statements. |
Notes to Financial Statements (Unaudited)
Note 1–Organization and Business
MainStay VP Funds Trust (the “Fund”) was organized as a Delaware statutory trust on February 1, 2011. The Fund is registered under the Investment Company Act of 1940, as amended (the “1940 Act”), as an open-end management investment company. The Fund is comprised of thirty-two separate series (collectively referred to as the “Portfolios”). These financial statements and notes relate to the MainStay VP Epoch U.S. Equity Yield Portfolio (formerly known as MainStay VP ICAP Select Equity Portfolio) (the “Portfolio”), a “diversified” portfolio, as that term is defined in the 1940 Act, as interpreted or modified by regulatory authorities having jurisdiction, from time to time.
Shares of the Portfolio are currently offered to certain separate accounts to fund variable annuity policies and variable universal life insurance policies issued by New York Life Insurance and Annuity Corporation (“NYLIAC”), a wholly-owned subsidiary of New York Life Insurance Company (“New York Life”). NYLIAC allocates shares of the Portfolios to, among others, NYLIAC Variable Annuity Separate Accounts-I, II, III and IV, VUL Separate Account-I and CSVUL Separate Account-I (collectively, the “Separate Accounts”). The Separate Accounts are used to fund flexible premium deferred variable annuity contracts and variable life insurance policies. Shares of the Portfolio are also offered to the MainStay VP Conservative Allocation Portfolio, MainStay VP Moderate Allocation Portfolio, MainStay VP Moderate Growth Allocation Portfolio and MainStay VP Growth Allocation Portfolio, which operate as “funds-of-funds.”
The Portfolio currently offers two classes of shares. Initial Class shares commenced operations on May 1, 1998. Service Class shares commenced operations on June 5, 2003. Shares of the Portfolio are sold and are redeemed at a price equal to their respective net asset value (“NAV”) per share. No sales or redemption charge is applicable to the purchase or redemption of the Portfolio’s shares. Under the terms of the Fund’s multiple class plan, adopted pursuant to Rule 18f-3 under the 1940 Act, the classes differ in that, among other things, Service Class shares of the Portfolio pay a combined distribution and service fee of 0.25% of average daily net assets attributable to Service Class shares of the Portfolio to the Distributor (as defined in Note 3(B)) pursuant to a plan adopted in accordance with Rule 12b-1 under the 1940 Act. Contract owners of variable annuity contracts purchased after June 2, 2003, are permitted to invest only in the Service Class shares.
The Portfolio’s investment objective is to seek current income and capital appreciation.
Note 2–Significant Accounting Policies
The Portfolio is an investment company and accordingly follows the investment company accounting and reporting guidance of the Financial Accounting Standards Board (“FASB”) Accounting Standard Codification Topic 946 Financial Services—Investment Companies. The Portfolio prepares its financial statements in accordance with generally accepted accounting principles (“GAAP”) in the United States of America and follows the significant accounting policies described below.
(A) Securities Valuation. Investments are usually valued as of the close of regular trading on the New York Stock Exchange (the “Exchange”) (usually 4:00 p.m. Eastern time) on each day the Portfolio is open for business (“valuation date”).
The Board of Trustees (the “Board”) of the Fund adopted procedures establishing methodologies for the valuation of the Portfolio’s securities and other assets and delegated the responsibility for valuation determinations under those procedures to the Valuation Committee of the Fund (the “Valuation Committee”). The Board authorized the Valuation Committee to appoint a Valuation Sub-Committee (the “Sub-Committee”) to deal in the first instance with establishing the prices of securities for which market quotations are not readily available or the prices of which are not otherwise readily determinable under these procedures. The Sub-Committee meets (in person, via electronic mail or via teleconference) on an as-needed basis. Subsequently, the Valuation Committee meets to ensure that actions taken by the Sub-Committee were appropriate. The procedures recognize that, subject to the oversight of the Board and unless otherwise noted, the responsibility for the day-to-day valuation of portfolio assets (including fair value measurements for the Portfolio’s assets and liabilities) rests with New York Life Investment Management LLC (“New York Life Investments” or the “Manager”), aided to whatever extent necessary by the Subadvisor (as defined in Note 3(A)) to the Portfolio.
To assess the appropriateness of security valuations, the Manager, the Subadvisor or the Portfolio’s third party service provider, who is subject to oversight by the Manager, regularly compares prior day prices, prices on comparable securities and the sale prices to the prior and current day prices and challenges prices with changes exceeding certain tolerance levels with third party pricing services or broker sources. For those securities valued through either a standardized fair valuation methodology or a fair valuation measurement, the Sub-Committee deals in the first instance with such valuation and the Valuation Committee reviews and affirms, if appropriate, the reasonableness of the valuation based on such methodologies and measurements on a regular basis after considering all relevant information that is reasonably available. Any action taken by the Sub-Committee with respect to the valuation of a portfolio security or other asset is submitted by the Valuation Committee to the Board for its review and ratification, if appropriate, at its next regularly scheduled meeting.
“Fair value” is defined as the price the Portfolio would reasonably expect to receive upon selling an asset or liability in an orderly transaction to an independent buyer in the principal or most advantageous market for the asset or liability. Fair value measurements are determined within a framework that establishes a three-tier hierarchy which maximizes the use of observable market data and minimizes the use of unobservable inputs to establish a classification of fair value measurements for disclosure purposes. “Inputs” refer broadly to the assumptions that market participants would use in pricing the asset or liability, including assumptions about risk, such as the risk inherent in a particular valuation technique used to measure fair value using a pricing model and/or the risk inherent in the inputs for the valuation technique. Inputs may be observable or unobservable. Observable inputs reflect the assumptions market participants would use in pricing the asset or liability based on market data obtained from sources independent of the Portfolio. Unobservable inputs reflect the Portfolio’s own assumptions about the assumptions market participants would use in pricing the asset or liability based on the information available. The inputs or methodology used for valuing assets or liabilities may not be an indication of the risks
Notes to Financial Statements (Unaudited) (continued)
associated with investing in those assets or liabilities. The three-tier hierarchy of inputs is summarized below.
| • | | Level 1—quoted prices in active markets for an identical asset or liability |
| • | | Level 2—other significant observable inputs (including quoted prices for a similar asset or liability in active markets, interest rates and yield curves, prepayment speeds, credit risk, etc.) |
| • | | Level 3—significant unobservable inputs (including the Portfolio’s own assumptions about the assumptions that market participants would use in measuring fair value of an asset or liability) |
The level of an asset or liability within the fair value hierarchy is based on the lowest level of an input, both individually and in the aggregate, that is significant to the fair value measurement. As of June 30, 2017, the aggregate value by input level of the Portfolio’s assets and liabilities is included at the end of the Portfolio’s Portfolio of Investments.
The Portfolio may use third party vendor evaluations, whose prices may be derived from one or more of the following standard inputs, among others:
| | |
• Broker/dealer quotes | | • Benchmark securities |
• Two-sided markets | | • Reference data (corporate actions or material event notices) |
• Bids/offers | | • Monthly payment information |
• Industry and economic events | | • Reported trades |
An asset or liability for which market values cannot be measured using the methodologies described above is valued by methods deemed reasonable in good faith by the Valuation Committee, following the procedures established by the Board, to represent fair value. Under these procedures, the Portfolio generally uses a market-based approach which may use related or comparable assets or liabilities, recent transactions, market multiples, book values, and other relevant information. The Portfolio may also use an income-based valuation approach in which the anticipated future cash flows of the asset or liability are discounted to calculate fair value. Discounts may also be applied due to the nature and/or duration of any restrictions on the disposition of the asset or liability. Fair value represents a good faith approximation of the value of a security. Fair value determinations involve the consideration of a number of subjective factors, an analysis of applicable facts and circumstances and the exercise of judgment. As a result, it is possible that the fair value for a security determined in good faith in accordance with the Portfolio’s valuation procedures may differ from valuations for the same security determined by other funds using their own valuation procedures. Although the Portfolio’s valuation procedures are designed to value a security at the price the Portfolio may reasonably expect to receive upon the security’s sale in an orderly transaction, there can be no assurance that any fair value determination thereunder would, in fact, approximate the amount that the Portfolio would actually realize upon the sale of the security or the price at which the security would trade if a reliable market price were readily available. During the six-month period ended June 30, 2017, there were no material changes to the fair value methodologies.
Securities which may be valued in this manner include, but are not limited to: (i) a security for which trading has been halted or suspended;
(ii) a debt security that has recently gone into default and for which there is not a current market quotation; (iii) a security of an issuer that has entered into a restructuring; (iv) a security that has been de-listed from a national exchange; (v) a security for which the market price is not readily available from a third party pricing source or, if so provided, does not, in the opinion of the Manager or Subadvisor, reflect the security’s market value; (vi) a security subject to trading collars for which no or limited trading takes place; and (vii) a security whose principal market has been temporarily closed at a time when, under normal conditions, it would be open. Securities for which market quotations or observable inputs are not readily available are generally categorized as Level 3 in the hierarchy. As of June 30, 2017, there were no securities held by the Portfolio that were fair valued in such a manner.
Equity securities are valued at the last quoted sales prices as of the close of regular trading on the relevant exchange on each valuation date. Securities that are not traded on the valuation date are valued at the mean of the last quoted bid and ask prices. Prices are normally taken from the principal market in which each security trades. These securities are generally categorized as Level 1 in the hierarchy.
Temporary cash investments acquired in excess of 60 days to maturity at the time of purchase are valued using the latest bid prices or using valuations based on a matrix system (which considers such factors as security prices, yields, maturities, and ratings), both as furnished by independent pricing services. Other temporary cash investments which mature in 60 days or less at the time of purchase (“Short-Term Investments”) are valued using the amortized cost method of valuation, unless the use of such method would be inappropriate. The amortized cost method involves valuing a security at its cost on the date of purchase and thereafter assuming a constant amortization to maturity of the difference between such cost and the value on maturity date. Amortized cost approximates the current fair value of a security. Securities valued using the amortized cost method are not valued using quoted prices in an active market and are generally categorized as Level 2 in the hierarchy.
The information above is not intended to reflect an exhaustive list of the methodologies that may be used to value portfolio investments. The valuation procedures permit the use of a variety of valuation methodologies in connection with valuing portfolio investments. The methodology used for a specific type of investment may vary based on the market data available or other considerations. The methodologies summarized above may not represent the specific means by which portfolio investments are valued on any particular business day.
(B) Income Taxes. The Portfolio’s policy is to comply with the requirements of the Internal Revenue Code of 1986, as amended (the “Internal Revenue Code”), applicable to regulated investment companies and to distribute all of its taxable income to the shareholders of the Portfolio within the allowable time limits. Therefore, no federal, state and local income tax provisions are required.
Management evaluates the Portfolio’s tax positions to determine if the tax positions taken meet the minimum recognition threshold in connection with accounting for uncertainties in income tax positions taken or expected to be taken for the purposes of measuring and recognizing tax liabilities in the financial statements. Recognition of tax benefits of an uncertain tax position is permitted only to the extent the position is
| | |
| 18 | | MainStay VP Epoch U.S. Equity Yield Portfolio |
“more likely than not” to be sustained assuming examination by taxing authorities. Management has analyzed the Portfolio’s tax positions taken on federal, state and local income tax returns for all open tax years (for up to three tax years), and has concluded that no provisions for federal, state and local income tax are required in the Portfolio’s financial statements. The Portfolio’s federal, state and local income and federal excise tax returns for tax years for which the applicable statutes of limitations have not expired are subject to examination by the Internal Revenue Service and state and local departments of revenue.
(C) Dividends and Distributions to Shareholders. Dividends and distributions are recorded on the ex-dividend date. The Portfolio intends to declare and pay dividends from net investment income and distributions from net realized capital and currency gains, if any, at least annually. Unless the shareholder elects otherwise, all dividends and distributions are reinvested in the same class of shares of the Portfolio, at NAV. Dividends and distributions to shareholders are determined in accordance with federal income tax regulations and may differ from GAAP.
(D) Security Transactions and Investment Income. The Portfolio records security transactions on the trade date. Realized gains and losses on security transactions are determined using the identified cost method. Dividend income is recognized on the ex-dividend date; net of any foreign tax withheld at the source, and interest income is accrued as earned using the effective interest rate method. Discounts and premiums on Short-Term Investments are accreted and amortized, respectively, on the straight-line method. The straight-line method approximates the effective interest method for Short-Term Investments.
Investment income and realized and unrealized gains and losses on investments of the Portfolio are allocated pro rata to the separate classes of shares based upon their relative net assets on the date the income is earned or realized and unrealized gains and losses are incurred.
(E) Expenses. Expenses of the Fund are allocated to the individual Portfolios in proportion to the net assets of the respective Portfolios when the expenses are incurred, except where direct allocations of expenses can be made. Expenses (other than fees incurred under the distribution and service plans, further discussed in Note 3(B), which are charged directly to the Service Class shares) are allocated to separate classes of shares pro rata based upon their relative net assets on the date the expenses are incurred. The expenses borne by the Portfolio, including those of related parties to the Portfolio, are shown in the Statement of Operations.
(F) Use of Estimates. In preparing financial statements in conformity with GAAP, management makes estimates and assumptions that affect the reported amounts and disclosures in the financial statements. Actual results could differ from those estimates.
(G) Repurchase Agreements. The Portfolio may enter into repurchase agreements (i.e., buy a security from another party with the agreement that it be sold back in the future) to earn income. The Portfolio may enter into repurchase agreements only with counterparties, usually financial institutions, that are deemed by the Manager or Subadvisor to be creditworthy, pursuant to guidelines established by the Board. During the term of any repurchase agreement, the Manager or Subadvisor will continue to monitor the creditworthiness of the counter-
party. Under the 1940 Act, repurchase agreements are considered to be collateralized loans by the Portfolio to the counterparty secured by the securities transferred to the Portfolio.
Repurchase agreements are subject to counterparty risk, meaning the Portfolio could lose money by the counterparty’s failure to perform under the terms of the agreement. The Portfolio mitigates this risk by ensuring the repurchase agreement is collateralized by cash, U.S. government securities, fixed income securities and/or other securities. The collateral is held by the Portfolio’s custodian valued daily on a mark to market basis to determine if the value, including accrued interest, exceeds the repurchase price. In the event of the counterparty’s default on the obligation to repurchase, the Portfolio has the right to liquidate the collateral and apply the proceeds in satisfaction of the obligation. Under certain circumstances, such as in the event of default or bankruptcy by the counterparty, realization and/or retention of the collateral may be limited or subject to delay, to legal proceedings and possible realized loss to the Portfolio.
(H) Securities Lending. In order to realize additional income, the Portfolio may engage in securities lending, subject to the limitations set forth in the 1940 Act and relevant guidance by the staff of the Securities and Exchange Commission (“SEC”). In the event the Portfolio does engage in securities lending, the Portfolio will lend through its custodian, State Street Bank and Trust Company (“State Street”). State Street will manage the Portfolio’s collateral in accordance with the lending agreement between the Portfolio and State Street, and indemnify the Portfolio against counterparty risk. The loans will be collateralized by U.S. Treasury securities at least equal at all times to the market value of the securities loaned. The Portfolio may bear the risk of delay in recovery of, or loss of rights in, the securities loaned should the borrower of the securities experience financial difficulty. The Portfolio may also record a realized gain or loss on securities deemed sold due to a borrower’s inability to return securities on loan. The Portfolio bears the risk of any loss on investment of the collateral. The Portfolio will receive compensation for lending its securities in the form of fees or it will retain a portion of interest on the investment of any cash received as collateral. The Portfolio will also continue to receive interest and dividends on the securities loaned and any gain or loss in the market price of the securities loaned that may occur during the term of the loan will be for the account of the Portfolio. During the six-month period ended June 30, 2017, the Portfolio did not have any portfolio securities on loan.
(I) Indemnifications. Under the Fund’s organizational documents, its officers and trustees are indemnified against certain liabilities that may arise out of performance of their duties to the Fund. Additionally, in the normal course of business, the Portfolio enters into contracts with third-party service providers that contain a variety of representations and warranties and which may provide general indemnifications. The Portfolio’s maximum exposure under these arrangements is unknown, as this would involve future claims that may be made against the Portfolio that have not yet occurred. Based on experience, management is of the view that the risk of loss in connection with these potential indemnification obligations is remote. However, there can be no assurance that material liabilities related to such obligations will not arise in the future, which could adversely impact the Portfolio.
Notes to Financial Statements (Unaudited) (continued)
Note 3–Fees and Related Party Transactions
(A) Manager and Subadvisor. New York Life Investments, a registered investment adviser and an indirect, wholly-owned subsidiary of New York Life Insurance Company (“New York Life”), serves as the Portfolio’s Manager pursuant to an Amended and Restated Management Agreement (“Management Agreement”). The Manager provides offices, conducts clerical, recordkeeping and bookkeeping services, and keeps most of the financial and accounting records required to be maintained by the Portfolio. Except for the portion of salaries and expenses that are the responsibility of the Portfolio, the Manager pays the salaries and expenses of all personnel affiliated with the Portfolio and certain operational expenses of the Portfolio. The Portfolio reimburses New York Life Investments in an amount equal to a portion of the compensation of the Chief Compliance Officer attributable to the Portfolio. Epoch Investment Partners, Inc. (“Epoch” or “Subadvisor”), a registered investment adviser, is responsible for the day-to-day portfolio management of the Portfolio. Pursuant to the terms of a Subadvisory Agreement (“Subadvisory Agreement”) between New York Life Investments and Epoch, New York Life Investments pays for the services of the Subadvisor. Prior to January 9, 2017, Institutional Capital LLC served as subadvisor to the Portfolio.
The Fund, on behalf of the Portfolio, pays New York Life Investments in its capacity as the Portfolio’s investment manager and administrator, pursuant to the Management Agreement, a monthly fee for the services performed and the facilities furnished at an annual percentage of the Portfolio’s average daily net assets. Effective March 13, 2017, the Fund, on behalf of the Portfolio, pays New York Life Investments at the rate of 0.70% up to $500 million; 0.68% from $500 to $1 billion; 0.66% from $1 billion to $2 billion; and 0.65% on assets over $2 billion. Prior to March 13, 2017, the Fund, on behalf of the Portfolio, paid New York Life Investments at the rate of: 0.80% up to $250 million; 0.75% from $250 million to $1 billion; and 0.74% on assets over $1 billion. During the six-month period ended June 30, 2017, the effective management fee rate was 0.71%.
During the six-month period ended June 30, 2017, New York Life Investments earned fees from the Portfolio in the amount of $4,448,978.
State Street provides sub-administration and sub-accounting services to the Portfolio pursuant to an agreement with New York Life Investments. These services include calculating the daily NAVs of the Portfolio, maintaining the general ledger and sub-ledger accounts for the calculation of the Portfolio’s NAVs, and assisting New York Life Investments in conducting various aspects of the Portfolio’s administrative operations. For providing these services to the Portfolio, State Street is compensated by New York Life Investments.
(B) Distribution and Service Fees. The Fund, on behalf of the Portfolio, has entered into a distribution agreement with NYLIFE Distributors LLC (the “Distributor”), an indirect, wholly-owned subsidiary of New York Life. The Portfolio has adopted a distribution plan (the “Plan”) in accordance with the provisions of Rule 12b-1 under the 1940 Act. Under the Plan, the Distributor has agreed to provide, through its affiliates or independent third parties, various distribution-related, shareholder and administrative support services to the Service Class shareholders. For its services, the Distributor is entitled to a
combined distribution and service fee accrued daily and paid monthly at an annual rate of 0.25% of the average daily net assets attributable to the Service Class shares of the Portfolio.
Note 4–Federal Income Tax
During the year ended December 31, 2016, the tax character of distributions paid as reflected in the Statement of Changes in Net Assets was as follows:
| | |
| 2016 |
Tax-Based
Distributions
from Ordinary
Income | | Tax-Based
Distributions
from Long-Term
Gains |
| $63,020,997 | | $118,611,501 |
Note 5–Custodian
State Street is the custodian of cash and securities held by the Portfolio. Custodial fees are charged to the Portfolios based on the Portfolio’s net assets and/or the market value of securities held by the Portfolio and the number of certain cash transactions incurred by the Portfolio.
Note 6–Line of Credit
The Portfolio and certain other funds managed by New York Life Investments, maintain a line of credit with a syndicate of banks in order to secure a source of funds for temporary purposes to meet unanticipated or excessive redemption requests.
Effective August 1, 2017, under the credit agreement (the “Credit Agreement”), the aggregate commitment amount is $600,000,000 with an additional uncommitted amount of $100,000,000. The commitment fee is an annual rate of 0.15% of the average commitment amount payable quarterly, regardless of usage, to State Street, who serves as the agent to the syndicate. The commitment fee is allocated among the Portfolio and certain other funds managed by New York Life Investments based upon their respective net assets and other factors. Interest on any revolving credit loan is charged based upon the Federal Funds Rate or the one month LIBOR, whichever is higher. The Credit Agreement expires on July 31, 2018, although the Portfolio, certain other funds managed by New York Life Investments and the syndicate of banks may renew the Credit Agreement for an additional year on the same or different terms. Prior to August 1, 2017, the aggregate commitment amount was $600,000,000 with an additional uncommitted amount of $100,000,000, and the commitment fee, under a credit agreement for which Bank of New York Mellon served as agent, was at an annual rate of 0.15% of the average commitment amount. During the six-month period ended June 30, 2017, there were no borrowings made or outstanding with respect to the Portfolio under the credit agreement for which Bank of New York Mellon served as agent.
Note 7–Interfund Lending Program
Pursuant to an exemptive order issued by the SEC, the Portfolio, along with certain other funds managed by New York Life Investments, may participate in an interfund lending program. The interfund lending program provides an alternative credit facility that permits the Portfolio and certain other funds managed by New York Life Investments to lend
| | |
| 20 | | MainStay VP Epoch U.S. Equity Yield Portfolio |
or borrow money for temporary purposes directly to or from one another, subject to the conditions of the exemptive order. During the six-month period ended June 30, 2017, there were no interfund loans made or outstanding with respect to the Portfolio.
Note 8–Purchases and Sales of Securities (in 000’s)
During the six-month period ended June 30, 2017, purchases and sales of securities, other than short-term securities, were $1,412,924 and $1,380,341, respectively.
Note 9–Capital Share Transactions
Transactions in capital shares for the six-month period ended June 30, 2017, and the year ended December 31, 2016, were as follows:
| | | | | | | | |
Initial Class | | Shares | | | Amount | |
Six-month period ended June 30, 2017: | | | | | | | | |
Shares sold | | | 5,931,586 | | | $ | 85,873,593 | |
Shares redeemed | | | (1,829,105 | ) | | | (26,876,488 | ) |
| | | | |
Net increase (decrease) | | | 4,102,481 | | | $ | 58,997,105 | |
| | | | |
Year ended December 31, 2016: | | | | | | | | |
Shares sold | | | 259,567 | | | $ | 3,847,228 | |
Shares issued to shareholders in reinvestment of dividends and distributions | | | 7,392,510 | | | | 98,732,464 | |
Shares redeemed | | | (3,484,274 | ) | | | (50,992,669 | ) |
| | | | |
Net increase (decrease) | | | 4,167,803 | | | $ | 51,587,023 | |
| | | | |
|
| |
Service Class | | Shares | | | Amount | |
Six-month period ended June 30, 2017: | | | | | | | | |
Shares sold | | | 965,340 | | | $ | 14,006,235 | |
Shares redeemed | | | (3,829,836 | ) | | | (55,344,818 | ) |
| | | | |
Net increase (decrease) | | | (2,864,496 | ) | | $ | (41,338,583 | ) |
| | | | |
Year ended December 31, 2016: | | | | | | | | |
Shares sold | | | 1,855,424 | | | $ | 26,942,037 | |
Shares issued to shareholders in reinvestment of dividends and distributions | | | 6,283,530 | | | | 82,900,034 | |
Shares redeemed | | | (6,455,499 | ) | | | (93,391,763 | ) |
| | | | |
Net increase (decrease) | | | 1,683,455 | | | $ | 16,450,308 | |
| | | | |
Note 10–Other Matters
At meetings held on January 3 and 6, 2017, the Board approved submitting the following proposal (“Proposal”) to shareholders of the Portfolio at a special meeting held on March 31, 2017 (with any postponements or adjournments, “Special Meeting”):
1. To approve a new subadvisory agreement (“Subadvisory Agreement”) between New York Life Investment Management LLC and Epoch Investment Partners, Inc.
Epoch served as a subadvisor to the Fund on an interim basis pursuant to the terms of an interim subadvisory agreement dated January 9,
2017. The interim subadvisory agreement terminated by its terms on June 8, 2017. The Board also approved the longer-term appointment of Epoch as the subadvisor to the Portfolio and the adoption of the Subadvisory Agreement. Shareholders were asked to approve the Subadvisory Agreement so that Epoch could continue to serve as the subadvisor to the Portfolio on an uninterrupted basis following the expiration of the interim subadvisory agreement.
On or about February 3, 2017, shareholders of record of the Portfolio as of the close of business on January 20, 2017 were sent a proxy statement containing further information regarding the Proposal. The proxy statement also included information about the Special Meeting, at which shareholders of the Portfolio were asked to consider and approve the Proposal. In addition, the proxy statement included information about voting on the Proposal and options shareholders had to do so.
A special meeting of shareholders of the Portfolio was held on March 31, 2017 and the Proposal passed.
The result of the special meeting was as follows:
Proposal 1 To approve a new subadvisory agreement between New York Life Investments and Epoch:
| | | | | | |
Votes For | | Votes Against | | Abstentions | | Total |
| 65,500,069 | | 10,899,231 | | 7,994,938 | | 84,394,238 |
Note 11–Recent Accounting Pronouncement
In October 2016, the SEC adopted new rules and amended existing rules (together, “final rules”) intended to modernize the reporting and disclosure of information by registered investment companies. In part, the final rules amend Regulation S-X and require standardized, enhanced disclosure about derivatives in investment company financial statements, as well as other amendments. The compliance date for the amendments to Regulation S-X is August 1, 2017 and applies to shareholder reports for funds with fiscal periods ending after August 1, 2017. Management is currently evaluating the impact that the adoption of the amendments to Regulation S-X will have on the Portfolio’s financial statements and related disclosures.
Note 12–Subsequent Events
In connection with the preparation of the financial statements of the Portfolio as of and for the six-month period ended June 30, 2017, events and transactions subsequent to June 30, 2017, through the date the financial statements were issued have been evaluated by the Portfolio’s management for possible adjustment and/or disclosure. No subsequent events requiring financial statement adjustment or disclosure have been identified.
Board Consideration and Approval of Subadvisory Agreements (Unaudited)
Section 15(c) of the Investment Company Act of 1940, as amended (the “1940 Act”) requires that each mutual fund’s board of trustees, including a majority of the independent trustees, review and approve the fund’s investment advisory agreements. At an in-person meeting held on January 6, 2017, the Board of Trustees (“Board” or “Trustees”) of the MainStay VP Funds Trust (“Trust”), including a majority of the Trustees who are not “interested persons” (as that term is defined in the 1940 Act), of the Trust (“Independent Trustees”), approved a repositioning of the MainStay VP Epoch U.S. Equity Yield Portfolio, formerly known as MainStay VP ICAP Select Equity Portfolio (the “Portfolio”), which resulted in modifying the Portfolio’s principal investment strategies, investment process and principal risks (the “Repositioning”), and the appointment of Epoch Investment Partners, Inc. (“Epoch”) on an interim basis to replace Institutional Capital LLC (“ICAP”) as subadvisor to the Portfolio. Epoch was appointed pursuant to an Interim Subadvisory Agreement, which was approved by the Board at the January 6, 2017 meeting, as permitted by Rule 15a-4 under the 1940 Act. At the January 6, 2017 meeting, the Board also approved the longer-term appointment of Epoch as subadvisor to the Portfolio and the adoption of the proposed new subadvisory agreement between New York Life Investment Management LLC (“New York Life Investments”) and Epoch (“Proposed New Subadvisory Agreement”) with respect to the Portfolio, subject to shareholder approval.
In reaching its decision to approve the Repositioning, the Interim Subadvisory Agreement and the Proposed New Subadvisory Agreement, the Board considered information furnished by New York Life Investments and Epoch in connection with the Repositioning, as well as other relevant information furnished to the Board throughout the year. The Board also requested and received responses from Epoch to a series of questions encompassing a variety of topics prepared on behalf of the Board by independent legal counsel to the Independent Trustees. In addition, the Board considered information provided by New York Life Investments on the fees charged to other investment advisory clients that follow investment strategies similar to those proposed for the Portfolio and the rationale for any differences in the Portfolio’s subadvisory fees and the fees charged to those other investment advisory clients.
In considering the Repositioning, the Interim Subadvisory Agreement and the Proposed New Subadvisory Agreement, the Trustees reviewed and evaluated the information and factors they believed to be relevant and appropriate in light of legal advice furnished to them by independent legal counsel and through the exercise of their own business judgment. The broad factors considered by the Board are discussed in greater detail below, and included, among other things: (i) the nature, extent, and quality of the services to be provided to the Portfolio by Epoch; (ii) the investment performance of the Portfolio and the historical investment performance of similar funds managed or subadvised by Epoch; (iii) the anticipated costs of the services to be provided, and expected profits to be realized, by Epoch, from its relationships with the Portfolio; (iv) the extent to which economies of scale may be realized as the Portfolio grows and the extent to which economies of scale may benefit Portfolio investors; and (v) the reasonableness of the Portfolio’s proposed fees, including the subadvisory fees to be paid to Epoch, particularly as compared to similar funds and accounts managed or subadvised by Epoch, and third-party “peer funds” identified by New York Life Investments.
While individual Trustees may have weighed certain factors or information differently, the Board’s decisions to approve the Repositioning, the Interim Subadvisory Agreement and the Proposed New Subadvisory Agreement were based on a consideration of all the information provided to the Board in connection with its consideration of the Repositioning, as well as other relevant information provided to the Trustees throughout the year. The Board took note of New York Life Investments’ belief that Epoch, with its resources and historical investment performance track records, is well qualified to serve as the Portfolio’s subadvisor. A summary of the factors that figured prominently in the Board’s decision to approve the Repositioning, the Interim Subadvisory Agreement and the Proposed New Subadvisory Agreement is provided immediately below.
Nature, Extent and Quality of Services to be Provided by Epoch
In considering the approval of the Repositioning, the Interim Subadvisory Agreement and the Proposed New Subadvisory Agreement, the Board considered New York Life Investments’ responsibilities as manager of the Portfolio noting that New York Life Investments has supervisory responsibility for the Portfolio’s subadvisor. The Board also examined the nature, extent and quality of the services that Epoch proposes to provide to the Portfolio. Further, the Board evaluated and/or examined the following with regard to Epoch:
| • | | experience in providing investment advisory services; |
| • | | experience in serving as subadvisory to other similar funds, including other MainStay Funds; |
| • | | experience of investment advisory, senior management and administrative personnel; |
| • | | overall legal and compliance environment; |
| • | | willingness to invest in personnel who may benefit the Portfolio; |
| • | | portfolio construction and risk management processes; |
| • | | experience of the Portfolio’s proposed portfolio managers, the number of accounts managed by each portfolio manager and Epoch’s methods for compensating portfolio managers; and |
| • | | overall reputation, financial condition and assets under management. |
Based on these considerations, the Board concluded, within the context of its overall determinations regarding the Repositioning, the Interim Subadvisory Agreement and the Proposed New Subadvisory Agreement, that the Portfolio is likely to benefit from appointing Epoch as subadvisor to the Portfolio.
Investment Performance
In connection with the Board’s consideration of the Repositioning, the Interim Subadvisory Agreement and the Proposed New Subadvisory Agreement, the Board considered its ongoing concerns and discussions with New York Life Investments regarding the Portfolio’s recent investment performance and remediation efforts undertaken by New York Life Investments, and other alternatives to the Repositioning considered by New York Life Investments. The Board also considered steps taken to
| | |
| 22 | | MainStay VP Epoch U.S. Equity Yield Portfolio |
seek to improve the Portfolio’s investment performance and the Board’s long-standing experience with Epoch as subadvisor to other MainStay Funds and its resulting confidence in Epoch’s investment process. The Board further considered that shareholders may benefit from Epoch’s portfolio construction and risk management processes. The Board further noted that the Repositioning had not yet been implemented so an investment performance track record for the Portfolio as repositioned was not available.
The Board discussed with management and the Portfolio’s proposed portfolio management team the Portfolio’s proposed investment objective, investment process, strategies and risks. The Board considered the historical performance of other investment portfolios with similar investment strategies that are or have been managed by the proposed portfolio managers for the Portfolio. The Board noted that Epoch currently manages a portfolio with investment strategies similar to those proposed for the Portfolio, as repositioned. Based on these considerations, the Board concluded that the Portfolio was likely to be managed responsibly and capably by Epoch.
Also based on these considerations, the Board concluded, within the context of its overall determinations regarding the Repositioning, the Interim Subadvisory Agreement and the Proposed New Subadvisory Agreement, that the selection of Epoch as the subadvisor to the Portfolio is likely to benefit the Portfolio’s long-term investment performance.
Costs of the Services to be Provided, and Profits to be Realized, by Epoch
The Board considered the estimated costs of the services to be provided by Epoch under the Interim Subadvisory Agreement and the Proposed New Subadvisory Agreement and the anticipated profitability of New York Life Investments, its affiliates and Epoch, due to their relationships with the Portfolio. Although the Board did not receive specific profitability information from Epoch, the Board considered representations from Epoch and New York Life Investments that the subadvisory fee to be paid by New York Life Investments to Epoch for services provided to the Portfolio the result of arm’s-length negotiations.
The Board also considered Epoch’s investments in personnel, systems, equipment and other resources necessary to manage the Portfolio. The Board acknowledged that Epoch must be in a position to pay and retain experienced professional personnel to provide services to the Portfolio and that Epoch’s ability to maintain strong financial positions is important in order for Epoch to provide high-quality services to the Portfolio. The Board requested and received information from New York Life Investments estimating the impact that the engagement of Epoch would have on the overall profitability of the Portfolio to New York Life Investments and its affiliates.
In considering the anticipated costs and profitability of the Portfolio, the Board also considered certain fall-out benefits that may be realized by Epoch due to its relationship with the Portfolio. The Board recognized, for example, the benefits to Epoch from legally permitted “soft-dollar” arrangements by which brokers may provide research and other services to Epoch in exchange for commissions paid by the Portfolio with respect to trades in the Portfolio’s portfolio securities.
The Board took into account the fact that the Portfolio would undergo changes to its principal investment strategies in connection with the Repositioning. The Board noted estimates from New York Life Investments and Epoch that a significant portion of the holdings of the Portfolio would be sold to align the Portfolio’s holdings with the strategies that would be pursued by Epoch. The Board noted that New York Life Investments had agreed to bear 100% of the direct portfolio transition costs associated with the Repositioning. Additionally, the Board considered New York Life Investments’ representation that Epoch will seek to minimize potential indirect costs, such as market impact and costs associated with repositioning the Portfolio, and also considered steps that New York Life Investments and Epoch would undertake to minimize adverse tax consequences for shareholders in connection with the Repositioning.
The Board considered that New York Life Investments was subject to a potential conflict of interest in making its recommendation to the Board. In this regard, the Board received information regarding the terms of an asset purchase agreement entered into between and among Epoch, ICAP and New York Life Investment Management Holdings LLC, the parent company of ICAP and New York Life Investments. Epoch, ICAP and New York Life Investment Management Holdings LLC, the parent company of ICAP and New York Life Investments, have entered into an asset purchase agreement (the “Asset Purchase Agreement”), pursuant to which Epoch acquired certain assets of ICAP’s investment management business. Pursuant to the Asset Purchase Agreement, Epoch acquired these assets and assumed certain liabilities of ICAP associated with the acquired assets and paid a purchase price on the closing date of the Asset Purchase Agreement. The Asset Purchase Agreement provides, among other things, for New York Life Investments to recommend to the Board the appointment of Epoch as interim subadvisor to the Portfolio and as a subadvisor on a longer term basis. As set forth in the Asset Purchase Agreement, Epoch and New York Life Investments intend to maintain an ongoing relationship between the parties with regard to the Portfolio and certain other funds wherein, among other things, New York Life Investments agrees to recommend to the Board that Epoch continue to serve as subadvisor for the Portfolio for the five years following the closing date of the Asset Purchase Agreement, subject to Board approval and other conditions, insofar as such recommendation is consistent with New York Life Investments’ fiduciary duties.
After evaluating the information presented to the Board, the Board concluded, within the context of its overall determinations regarding the Repositioning, the Interim Subadvisory Agreement and the Proposed New Subadvisory Agreement, that any profits expected to be realized by New York Life Investments and its affiliates due to their relationships with the Portfolio, were consistent with New York Life Investments and its affiliates’ profitability with respect to other Portfolios and supported the Board’s decision to approve the Repositioning, the Interim Subadvisory Agreement and the Proposed New Subadvisory Agreement.
Extent to Which Economies of Scale May be Realized as the Portfolio Grows
In addition, the Board considered whether the Portfolio’s proposed expense structure will permit economies of scale to be shared with Portfolio investors. The Board also considered a report previously
Board Consideration and Approval of Subadvisory Agreements (Unaudited) (continued)
provided by New York Life Investments, prepared at the request of the Board, that addressed economies of scale in the mutual fund business generally, the changing economics of the mutual fund business and the various ways in which the benefits of economies of scale may be shared with the Portfolio and the other funds within the MainStay Funds Complex. The Board reviewed information from New York Life Investments showing how the Portfolio’s management fee schedule compared to fee schedules of other funds and accounts managed by New York Life Investments and how it hypothetically would compare with fees paid for similar services by peer funds at varying asset levels. While recognizing the difficulty of determining future economies of scale with precision, the Board acknowledged that economies of scale may be shared with the Portfolio in a number of ways, including, for example, through the imposition of management fee breakpoints and by initially setting relatively low management fees.
Based on this information, the Board concluded, within the context of its overall determinations regarding the Repositioning, the Interim Subadvisory Agreement and the Proposed New Subadvisory Agreement, that the Portfolio’s expense structure appropriately reflects economies of scale for the benefit of Portfolio investors. The Board noted, however, that it would continue to evaluate the reasonableness of the Portfolio’s fee and expense structure as the Portfolio grows over time.
Reasonableness of Fees
The Board evaluated the reasonableness of the fees to be paid under the Interim Subadvisory Agreement and the Proposed New Subadvisory Agreement. The Board considered the Portfolio’s contractual management and subadvisory fee schedules. The Board considered information provided by Epoch concerning the fees charged to other investment advisory clients, including institutional separate accounts and other funds with similar investment objectives as the Portfolio. The Board noted, however, that Epoch’s fees as subadvisor are paid by New York Life Investments, and not the Portfolio. Accordingly, the Board principally focused on the reasonableness of the fees paid by the Portfolio to New York Life Investments and its affiliates in determining to approve the Repositioning, the Interim Subadvisory Agreement and Proposed New Subadvisory Agreement. The Board considered the Portfolio’s contractual management and subadvisory fee schedules, and noted that New York Life Investments had agreed to reduce the contractual management fee applicable for the Portfolio at certain asset levels and to add a new breakpoint in the management fee for assets in excess of $2 billion. The Board observed that New York Life Investments and Epoch had also agreed to a different subadvisory fee schedule to be paid to Epoch, as compared to the subadvisory fee paid to ICAP.
After considering the factors above, the Board concluded that the Portfolio’s overall fees were within a range that is competitive and, within the context of the Board’s overall conclusions regarding the Repositioning, that the Interim Subadvisory Agreement and the Proposed New Subadvisory Agreement support the conclusion that these fees are reasonable.
Conclusion
On the basis of the information and factors summarized above and the evaluation thereof, the Board as a whole, including the Independent Trustees who are not parties to the Agreements or “interested persons” of any such party voting separately, unanimously voted to approve the Agreements.
| | |
| 24 | | MainStay VP Epoch U.S. Equity Yield Portfolio |
Proxy Voting Policies and Procedures and Proxy Voting Record
A description of the policies and procedures that New York Life Investments uses to vote proxies related to the Portfolio’s securities is available without charge, upon request, (i) by calling 800-598-2019 or (ii) by visiting the SEC’s website at www.sec.gov.
The Portfolio is required to file with the SEC its proxy voting record for the 12-month period ending June 30 on Form N-PX. The Portfolio’s most recent Form N-PX or proxy voting record is available free of charge upon request (i) by calling 800-598-2019 or; (ii) by visiting the SEC’s website at www.sec.gov.
Shareholder Reports and Quarterly Portfolio Disclosure
The Portfolio is required to file its complete schedule of portfolio holdings with the SEC for its first and third fiscal quarters on Form N-Q. The Portfolio’s Form N-Q is available without charge on the SEC’s website at www.sec.gov or by calling MainStay Investments at 800-598-2019. You also can obtain and review copies of Form N-Q by visiting the SEC’s Public Reference Room in Washington, DC (information on the operation of the Public Reference Room may be obtained by calling 1-800-SEC-0330).
This page intentionally left blank
MainStay VP Portfolios
MainStay VP offers a wide range of Portfolios. The full array of MainStay VP offerings is listed here, with information about the manager, subadvisors, legal counsel, and independent registered public accounting firm.
Equity Portfolios
MainStay VP Common Stock Portfolio
MainStay VP Cornerstone Growth Portfolio
MainStay VP Eagle Small Cap Growth Portfolio
MainStay VP Emerging Markets Equity Portfolio
MainStay VP Epoch U.S. Equity Yield Portfolio
MainStay VP Epoch U.S. Small Cap Portfolio
MainStay VP International Equity Portfolio
MainStay VP Large Cap Growth Portfolio
MainStay VP MFS® Utilities Portfolio
MainStay VP Mid Cap Core Portfolio
MainStay VP S&P 500 Index Portfolio
MainStay VP Small Cap Core Portfolio
MainStay VP T. Rowe Price Equity Income Portfolio
MainStay VP VanEck Global Hard Assets Portfolio
Mixed Asset Portfolios
MainStay VP Balanced Portfolio
MainStay VP Convertible Portfolio
MainStay VP Cushing Renaissance Advantage Portfolio
MainStay VP Income Builder Portfolio
MainStay VP Janus Henderson Balanced Portfolio
Income Portfolios
MainStay VP Bond Portfolio
MainStay VP Floating Rate Portfolio
MainStay VP Government Portfolio
MainStay VP High Yield Corporate Bond Portfolio
MainStay VP Indexed Bond Portfolio
MainStay VP PIMCO Real Return Portfolio
MainStay VP Unconstrained Bond Portfolio
Money Market
MainStay VP U.S. Government Money Market Portfolio
Alternative
MainStay VP Absolute Return Multi-Strategy Portfolio
Asset Allocation Portfolios
MainStay VP Conservative Allocation Portfolio
MainStay VP Growth Allocation Portfolio
MainStay VP Moderate Allocation Portfolio
MainStay VP Moderate Growth Allocation Portfolio
Manager
New York Life Investment Management LLC
New York, New York
Subadvisors
Candriam Belgium*
Brussels, Belgium
Candriam France S.A.S.*
Paris, France
Cornerstone Capital Management Holdings LLC*
New York, New York
Cushing Asset Management, LP
Dallas, Texas
Eagle Asset Management, Inc.
St Petersburg, Florida
Epoch Investment Partners, Inc.
New York, New York
Janus Capital Management LLC
Denver, Colorado
MacKay Shields LLC*
New York, New York
Massachusetts Financial Services Company
Boston, Massachusetts
NYL Investors LLC*
New York, New York
Pacific Investment Management Company LLC
Newport Beach, California
T. Rowe Price Associates, Inc.
Baltimore, Maryland
Van Eck Associates Corporation
New York, New York
Winslow Capital Management, LLC
Minneapolis, Minnesota
Distributor
NYLIFE Distributors LLC*
Jersey City, New Jersey
Custodian
State Street Bank and Trust Company
Boston, Massachusetts
Independent Registered Public Accounting Firm
PricewaterhouseCoopers LLP
New York, New York
Legal Counsel
Dechert LLP
Washington, District of Columbia
Some Portfolios may not be available in all products.
* An affiliate of New York Life Investment Management LLC
Not part of the Semiannual Report
2017 Semiannual Report
This report is for the general information of New York Life Variable Annuities and NYLIAC Variable Universal Life Insurance Products policyowners. It must be preceded or accompanied by the appropriate product(s) and funds prospectuses if it is given to anyone who is not an owner of a New York Life variable annuity policy or a NYLIAC Variable Universal Life Insurance Product. This report does not offer for sale or solicit orders to purchase securities.
The performance data quoted in this report represents past performance. Past performance is no guarantee of future results. Due to market volatility and other factors, current performance may be lower or higher than the figures shown. The most recent month-end performance summary for your variable annuity or variable life policy is available by calling 800-598-2019 and is updated periodically on www.newyorklife.com.
The New York Life Variable Annuities and NYLIAC Variable Universal Life Insurance Products are issued by New York Life Insurance and Annuity Corporation (a Delaware Corporation) and distributed by NYLIFE Distributors LLC (Member FINRA/SIPC).
New York Life Insurance Company
New York Life Insurance and Annuity Corporation (NYLIAC) (A Delaware Corporation)
51 Madison Avenue, Room 551
New York, NY 10010
www.newyorklife.com
Printed on recycled paper
mainstayinvestments.com
NYLIFE Distributors LLC, 30 Hudson Street, Jersey City, NJ 07302
New York Life Investment Management LLC is the investment manager to the MainStay VP Funds Trust
©2017 by NYLIFE Distributors LLC. All rights reserved.
You may obtain copies of the Prospectus and the Statement of Additional Information free of charge, upon request, by calling toll-free 800-598-2019 or writing to New York Life Insurance and Annuity Corporation, 51 Madison Avenue, New York, NY 10010.
| | | | |
| Not FDIC Insured | | No Bank Guarantee | | May Lose Value |
| | | | |
| 1744300 | | | | MSVPEUE10-08/17 (NYLIAC) NI521 |
MainStay VP Large Cap Growth Portfolio
Message from the President and Semiannual Report
Unaudited | June 30, 2017

Sign up for electronic delivery of your shareholder reports. For full details on electronic delivery, including who can participate and what you
can receive via eDelivery, please log on to www.newyorklife.com/vsc

This page intentionally left blank
Message from the President
The six months ended June 30, 2017, brought positive results to many stock and bond investors. The year began with many investors hoping that Republican control of the White House, the Senate and the House of Representatives could bring an end to political gridlock; and while debate has continued on a number of issues, the U.S. stock market climbed relatively steadily throughout the first half of 2017.
According to FTSE-Russell U.S. market data, stocks at all capitalization levels tended to record positive total returns during the reporting period, with large-cap stocks generally outperforming stocks of smaller-capitalization companies. Growth stocks outpaced value stocks at every capitalization level by substantial margins—from more than six percentage points for micro-caps and mid-caps to more than 10 percentage points for the largest 200 U.S. companies by market capitalization.
Most sectors of the stock market advanced during the reporting period, with energy and telecommunication services being notable exceptions. Energy stocks declined as oil prices fell despite moves by the Organization of Petroleum Exporting Countries (OPEC) intended to limit oil production by its members. Telecommunication services stocks tended to decline as competition increased and rising interest rates made dividend payouts less appealing.
In March and June of 2017, the Federal Reserve announced successive increases in the target range for the federal funds rate, ultimately bringing the federal funds target range to 1.00% to 1.25%. While short-term U.S. Treasury yields rose in response, yields for U.S. Treasury securities with maturities of five years or longer declined. As the difference between short- and long-term yields narrowed, the advantages of higher-yielding long-term bonds became increasingly apparent.
Virtually all taxable and tax-exempt bond sectors provided positive total returns during the reporting period. Mortgage-backed
securities, though providing positive total returns, faced headwinds when the Federal Reserve announced plans to begin normalizing its balance sheet by reducing reinvestment of principal payments on mortgage-backed securities.
International stock and bond markets were also strong during the reporting period. International stocks provided double-digit total returns that were surpassed by emerging-market stocks as a whole. Global investment-grade bonds provided single-digit returns; and emerging-market debt was somewhat stronger.
Even during periods of favorable market performance and generally positive returns, MainStay believes that it is important to carefully monitor your investments. Your risk tolerance may
change over time, leading you to reevaluate which MainStay VP Portfolios are most appropriate for your long-term goals. Your goals themselves may also change, leading you to pursue investments with more or less risk. The portfolio managers of MainStay VP Portfolios seek to provide results consistent with the investment objectives of their respective Portfolios, to give you a wide range of choices suitable to various investment needs.
The report that follows provides more detailed information about the specific markets, securities and investment decisions that influenced your MainStay VP Portfolio during the six months ended June 30, 2017. We invite you to review the report carefully as part of your ongoing investment evaluation and review.
Sincerely,

Stephen P. Fisher
President
The opinions expressed are as of the date of the accompanying report and are subject to change. Past performance is no guarantee of future results. There is no guarantee that any forecasts made will come to pass. This material does not constitute investment advice and is not intended as an endorsement of any specific investment.
Not all MainStay VP Portfolios and/or share classes are available under all policies.
Not part of the Semiannual Report
Table of Contents
Investors should refer to the Portfolio’s Summary Prospectus and/or Prospectus and consider the Portfolio’s investment objectives, strategies, risks, charges and expenses carefully before investing. The Summary Prospectus and/or Prospectus contain this and other information about the Portfolio. You may obtain copies of the Portfolio’s Summary Prospectus and/or the Prospectus and the Statement of Additional Information free of charge, upon request, by calling toll-free 800-598-2019, by writing to New York Life Insurance and Annuity Corporation, 51 Madison Avenue, Room 251, New York, New York 10010 or by sending an email to MainStayShareholdersServices@nylim.com. These documents are also available at mainstayinvestments.com/vpdocuments. Please read the Summary Prospectus and/or Prospectus carefully before investing. MainStay VP Funds Trust portfolios are separate account options which are purchased through a variable insurance or variable annuity contract.
Investment and Performance Comparison1 (Unaudited)
Performance data quoted represents past performance. Past performance is no guarantee of future results. Because of market volatility and other factors, current performance may be lower or higher than the figures shown. Investment return and principal value will fluctuate, and as a result, when shares are redeemed, they may be worth more or less than their original cost. The performance table and graph do not reflect any deduction of sales charges, mortality and expense charges, contract charges or administrative charges. Please refer to the Performance Summary appropriate for your policy. For performance information current to the most recent month-end, please call 800-598-2019 or visit www.newyorklife.com.
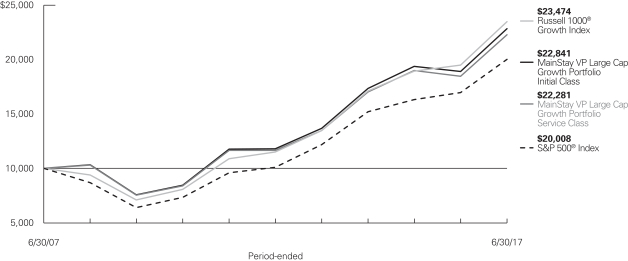
Average Annual Total Returns for the Period Ended June 30, 2017
| | | | | | | | | | | | | | | | |
| Class | | Inception
Date | | Six Months | | One Year | | Five Years | | Ten Years | | | Gross
Expense
Ratio2 | |
| Initial Class Shares | | 5/1/1998 | | 18.37% | | 20.94% | | 14.14% | | | 8.61 | % | | | 0.77 | % |
| Service Class Shares | | 6/6/2003 | | 18.22 | | 20.64 | | 13.86 | | | 8.34 | | | | 1.02 | |
| | | | | | | | | | | | | | | | |
| Benchmark Performance | | Six
Months | | | One
Year | | | Five
Years | | | Ten
Years | |
Russell 1000® Growth Index3 | | | 13.99 | % | | | 20.42 | % | | | 15.30 | % | | | 8.91 | % |
S&P 500® Index4 | | | 9.34 | | | | 17.90 | | | | 14.63 | | | | 7.18 | |
Average Lipper Variable Products Large-Cap Growth Portfolio5 | | | 16.22 | | | | 22.44 | | | | 14.72 | | | | 8.05 | |
| 1. | Performance figures reflect certain fee waivers and/or expense limitations, without which total returns may have been different. For information on current fee waivers and/or expense limitations (if any), please refer to the Notes to Financial Statements. |
| 2. | The gross expense ratios presented reflect the Portfolio’s “Total Annual Portfolio Operating Expenses” from the most recent Prospectus and may differ from other expense ratios disclosed in this report. |
| 3. | The Russell 1000® Growth Index is the Portfolio’s primary broad-based securities market index for comparison purposes. The Russell 1000® Growth Index measures the performance of the large-cap growth segment of the U.S. equity universe. It includes those Russell 1000® Index companies with higher price-to-book ratios and higher forecasted growth values. Results assume reinvestment of all dividends and capital gains. An investment cannot be made directly in an index. |
| 4. | The S&P 500® Index is the Portfolio’s secondary benchmark. “S&P 500®” is a trademark of The McGraw-Hill Companies, Inc. The S&P 500® Index is widely regarded as the standard index for measuring large-cap U.S. stock market performance. Results assume reinvestment of all dividends and capital gains. An investment cannot be made directly in an index. |
| 5. | The Average Lipper Variable Products Large-Cap Growth Portfolio is representative of portfolios that, by portfolio practice, invest at least 75% of their equity assets in companies with market capitalizations (on a three-year weighted basis) above Lipper’s U.S. diversified equity large-cap floor. Large-cap growth portfolios typically have above-average characteristics compared to the S&P 500® Index. This benchmark is a product of Lipper Inc. Lipper Inc. is an independent monitor of fund performance. Results are based on average total returns of similar portfolios with all dividend and capital gain distributions reinvested. |
Cost in Dollars of a $1,000 Investment in MainStay VP Large Cap Growth Portfolio (Unaudited)
The example below is intended to describe the fees and expenses borne by shareholders during the six-month period from January 1, 2017 to June 30, 2017, and the impact of those costs on your investment.
Example
As a shareholder of the Portfolio, you incur two types of costs: (1) transaction costs, including exchange fees and sales charges (loads) on purchases (as applicable), and (2) ongoing costs, including management fees, distribution and/or service (12b-1) fees, and other Portfolio expenses (as applicable). This example is intended to help you understand your ongoing costs (in dollars) of investing in the Portfolio and to compare these costs with the ongoing costs of investing in other mutual funds. The example is based on an investment of $1,000 made at the beginning of the six-month period and held for the entire period from January 1, 2017 to June 30, 2017. Shares are only sold in connection with variable life and annuity contracts and the example does not reflect any contract level or transactional fees or expenses. If these costs had been included, your costs would have been higher.
This example illustrates your Portfolio’s ongoing costs in two ways:
Actual Expenses
The second and third data columns in the table below provide information about actual account values and actual expenses. You may use the information in these columns, together with the amount you invested, to estimate the expenses that you paid during the six months ended June 30, 2017. Simply divide your account value by $1,000
(for example, an $8,600 account value divided by $1,000 = 8.6), then multiply the result by the number under the heading entitled “Expenses Paid During Period” to estimate the expenses you paid on your account during this period.
Hypothetical Example for Comparison Purposes
The fourth and fifth data columns in the table below provide information about hypothetical account values and hypothetical expenses based on the Portfolio’s actual expense ratio and an assumed rate of return of 5% per year before expenses, which is not the Portfolio’s actual return. The hypothetical account values and expenses may not be used to estimate the actual ending account balances or expenses you paid for the six-month period shown. You may use this information to compare the ongoing costs of investing in the Portfolio with the ongoing costs of investing in other mutual funds. To do so, compare this 5% hypothetical example with the 5% hypothetical examples that appear in the shareholder reports of the other mutual funds.
Please note that the expenses shown in the table are meant to highlight your ongoing costs only and do not reflect any transactional costs, such as exchange fees or sales charges (loads). Therefore, the fourth and fifth data columns of the table are useful in comparing ongoing costs only and will not help you determine the relative total costs of owning different funds. In addition, if these transactional costs were included, your costs would have been higher.
| | | | | | | | | | | | | | | | | | | | | | |
| | | | | | | | | | | | | | | | | | |
| Share Class | | Beginning
Account
Value
1/1/17 | | | Ending Account
Value (Based
on Actual
Returns and
Expenses)
6/30/17 | | | Expenses
Paid
During
Period1 | | | Ending Account
Value (Based
on Hypothetical
5% Annualized
Return and
Actual Expenses)
6/30/17 | | | Expenses
Paid
During
Period1 | | | Net Expense
Ratio
During
Period2 |
| | | | | | |
| Initial Class Shares | | $ | 1,000.00 | | | $ | 1,183.70 | | | $ | 4.17 | | | $ | 1,021.00 | | | $ | 3.86 | | | 0.77% |
| | | | | | |
| Service Class Shares | | $ | 1,000.00 | | | $ | 1,182.20 | | | $ | 5.52 | | | $ | 1,019.70 | | | $ | 5.11 | | | 1.02% |
| 1. | Expenses are equal to the Portfolio’s annualized expense ratio of each class multiplied by the average account value over the period, divided by 365 and multiplied by 181 (to reflect the six-month period). The table above represents the actual expenses incurred during the six-month period. |
| 2. | Expenses are equal to the Portfolio’s annualized expense ratio to reflect the six-month period. |
| | |
| 6 | | MainStay VP Large Cap Growth Portfolio |
Industry Composition as of June 30, 2017 (Unaudited)
| | | | |
| Internet Software & Services | | | 12.1 | % |
| Software | | | 12.0 | |
| Internet & Direct Marketing Retail | | | 9.5 | |
| IT Services | | | 9.2 | |
| Health Care Equipment & Supplies | | | 5.9 | |
| Semiconductors & Semiconductor Equipment | | | 5.5 | |
| Technology Hardware, Storage & Peripherals | | | 4.2 | |
| Aerospace & Defense | | | 3.8 | |
| Biotechnology | | | 3.5 | |
| Health Care Providers & Services | | | 3.2 | |
| Hotels, Restaurants & Leisure | | | 3.0 | |
| Life Sciences Tools & Services | | | 2.8 | |
| Pharmaceuticals | | | 2.8 | |
| Airlines | | | 2.5 | |
| Chemicals | | | 2.5 | |
| | | | |
| Capital Markets | | | 2.3 | % |
| Textiles, Apparel & Luxury Goods | | | 2.0 | |
| Industrial Conglomerates | | | 1.8 | |
| Equity Real Estate Investment Trusts (REITs) | | | 1.8 | |
| Media | | | 1.7 | |
| Specialty Retail | | | 1.7 | |
| Road & Rail | | | 1.3 | |
| Banks | | | 1.2 | |
| Oil, Gas & Consumable Fuels | | | 1.1 | |
| Machinery | | | 1.0 | |
| Air Freight & Logistics | | | 0.7 | |
| Short-Term Investment | | | 1.0 | |
| Other Assets, Less Liabilities | | | –0.1 | |
| | | | |
| | | 100.0 | % |
| | | | |
See Portfolio of Investments beginning on page 10 for specific holdings within these categories.
Top Ten Holdings or Issuers as of June 30, 2017 (excluding short-term investment) (Unaudited)
| 7. | UnitedHealth Group, Inc. |
| 10. | Alibaba Group Holding, Ltd. |
Portfolio Management Discussion and Analysis (Unaudited)
Answers to the questions reflect the views of portfolio managers Justin H. Kelly, CFA, and Patrick M. Burton, CFA, of Winslow Capital Management, LLC, the Portfolio’s Subadvisor.
How did MainStay VP Large Cap Growth Portfolio perform relative to its benchmarks and peers during the six months ended June 30, 2017?
For the six months ended June 30, 2017, MainStay VP Large Cap Growth Portfolio returned 18.37% for Initial Class shares and 18.22% for Service Class shares. Over the same period, both share classes outperformed the 13.99% return of the Russell 1000® Growth Index,1 which is the Portfolio’s primary benchmark and a broad-based securities-market index; the 9.34% return of the S&P 500® Index,1 which is a secondary benchmark of the Portfolio; and the 16.22% return of the Average Lipper2 Variable Products Large-Cap Growth Portfolio.
What factors affected the Portfolio’s relative performance during the reporting period?
At the beginning of 2017, our research indicated that on a relative basis, certain high-growth companies were priced as inexpensively as they had been in nearly 40 years. As a result, the Portfolio entered the reporting period with overweight positions in many of the same high-growth companies that were attractively valued on a historical basis. Stocks selected in information technology (Alibaba +60%, Mobileye +59% and ServiceNow +43%), industrials (Southwest +25% and Delta +6%) and consumer discretionary (Ctrip +35%, Amazon.com +29% and Expedia +32%) were performance drivers. In addition, a key element of the Portfolio’s strong relative performance was our decision to hold underweight positions in sectors that had largely benefited from declining interest rates in previous years. With the end of quantitative easing, these stocks lost their tailwinds, and the Portfolio’s underweight positions in the related sectors (consumer staples, telecommunication services, real estate and utilities) all contributed positively to the Portfolio’s performance relative to the Russell 1000® Growth Index.
Health care and energy were modest detractors during the reporting period, with energy reflecting a bear-market decline in oil prices. In the health care sector, the inability of the Senate to pass a new health care bill led the market to conclude that increased pressure on drug pricing may be muted. The stock prices of certain biopharmaceutical companies increased, and the Portfolio’s underweight positions in these companies detracted from relative performance.
Which sectors were the strongest positive contributors to the Portfolio’s relative performance, and which sectors were particularly weak?
For the six months ended June 30, 2017, the strongest positive-contributing sectors to the Portfolio’s performance relative to the Russell 1000® Growth Index were information technology, industrials and consumer staples. (Contributions
take weightings and total returns into account.) The weakest-contributing sectors for the reporting period were health care, energy and financials. The energy sector had a negative total return that detracted from relative performance during the reporting period.
During the reporting period, which individual stocks made the strongest positive contributions to the Portfolio’s absolute performance and which stocks detracted the most?
During the reporting period, the stocks that made the strongest positive contributions to the Portfolio’s absolute performance were e-commerce leader Amazon.com, credit card company Visa and Chinese Internet company Alibaba Group Holding, Ltd. Amazon.com advanced as the company continued to take market share from traditional retail outlets. Visa benefited as the company’s significant investment in Europe positively affected performance. Alibaba Group Holding appreciated when the company announced projected 2018 fiscal-year revenue growth of 45% to 49%—well above Wall Street expectations, which had been in the mid-30% range.
The weakest-contributing stocks during the reporting period were after-market auto parts retailer O’Reilly Automotive, genomics research company Illumina and biopharmaceutical company Biogen. O’Reilly Automotive’s stock declined when the company reported weaker-than-anticipated sales. We took the opportunity to sell the stock. Illumina and Biogen suffered from the uncertainty in the health care regulatory environment.
Did the Portfolio make any significant purchases or sales during the reporting period?
The Portfolio purchased shares of NVIDIA, the market-share leader in the semiconductor industry, to participate in the increased demand for cloud-based computing, machine learning and artificial-intelligence applications. The Portfolio also purchased a position in hotel industry leader Hilton Worldwide Holdings on what we considered to be an attractive valuation after the company spun off its time share and REIT business.
The Portfolio sold its position in membership warehouse merchandiser Costco after news of competitor Amazon.com’s acquisition of Whole Foods. We saw the acquisition as complicating Costco’s competitive environment and possibly resetting the company’s investment thesis. The Portfolio also sold its position in discount variety store Dollar Tree because of general concerns about the retail landscape shifting to online buying.
| 1. | See footnote on page 5 for more information on this index. |
| 2. | See footnote on page 5 for more information on Lipper Inc. |
| | |
| 8 | | MainStay VP Large Cap Growth Portfolio |
How did the Portfolio’s sector weightings change during the reporting period?
The reconstitution of the Russell 1000® Growth Index—along with our strategic sector weightings—resulted in only one sector overweight increase. This occurred in the health care sector, where the Portfolio was overweight by 4.5 percentage points. This differential in part reflects the reduction in the Index weight with certain biopharmaceutical names shifting to the value benchmark. Decreases in active weights relative to the benchmark occurred in information technology, where the Portfolio’s relative overweight decreased by 1.8 percentage points, and in financials, where the Portfolio’s relative overweight decreased by 1.5 percentage points.
How was the Portfolio positioned at the end of the reporting period?
As of June 30, 2017, the Portfolio held overweight sector positions relative to the Russell 1000® Growth Index in information technology (more than six percentage points overweight) and health care (more than four percentage points overweight). As of the same date, the Portfolio held underweight sector positions relative to the Index in consumer staples (more than seven percentage points underweight) and materials (more than one percentage point underweight).
The opinions expressed are those of the portfolio managers as of the date of this report and are subject to change. There is no guarantee that any forecasts made will come to pass. This material does not constitute investment advice and is not intended as an endorsement of any specific investment.
Not all MainStay VP Portfolios and/or share classes are available under all policies.
Portfolio of Investments June 30, 2017 (Unaudited)
| | | | | | | | |
| | |
| | | Shares | | | Value | |
| Common Stocks 99.1%† | | | | | | | | |
Aerospace & Defense 3.8% | | | | | | | | |
General Dynamics Corp. | | | 53,550 | | | $ | 10,608,255 | |
Northrop Grumman Corp. | | | 34,800 | | | | 8,933,508 | |
Raytheon Co. | | | 98,650 | | | | 15,930,002 | |
| | | | | | | | |
| | | | | | | 35,471,765 | |
| | | | | | | | |
Air Freight & Logistics 0.7% | | | | | | | | |
FedEx Corp. | | | 31,250 | | | | 6,791,563 | |
| | | | | | | | |
| | |
Airlines 2.5% | | | | | | | | |
Delta Air Lines, Inc. | | | 185,450 | | | | 9,966,083 | |
Southwest Airlines Co. | | | 208,150 | | | | 12,934,441 | |
| | | | | | | | |
| | | | | | | 22,900,524 | |
| | | | | | | | |
Banks 1.2% | | | | | | | | |
JPMorgan Chase & Co. | | | 122,800 | | | | 11,223,920 | |
| | | | | | | | |
| | |
Biotechnology 3.5% | | | | | | | | |
Biogen, Inc. (a) | | | 35,480 | | | | 9,627,853 | |
¨Celgene Corp. (a) | | | 173,070 | | | | 22,476,601 | |
| | | | | | | | |
| | | | | | | 32,104,454 | |
| | | | | | | | |
Capital Markets 2.3% | | | | | | | | |
Intercontinental Exchange, Inc. | | | 183,500 | | | | 12,096,320 | |
Moody’s Corp. | | | 77,840 | | | | 9,471,571 | |
| | | | | | | | |
| | | | | | | 21,567,891 | |
| | | | | | | | |
Chemicals 2.5% | | | | | | | | |
Ecolab, Inc. | | | 70,050 | | | | 9,299,137 | |
Sherwin-Williams Co. | | | 39,010 | | | | 13,690,950 | |
| | | | | | | | |
| | | | | | | 22,990,087 | |
| | | | | | | | |
Equity Real Estate Investment Trusts (REITs) 1.8% | |
American Tower Corp. | | | 124,300 | | | | 16,447,376 | |
| | | | | | | | |
|
Health Care Equipment & Supplies 5.9% | |
Becton Dickinson & Co. | | | 57,200 | | | | 11,160,292 | |
Boston Scientific Corp. (a) | | | 555,750 | | | | 15,405,390 | |
Danaher Corp. | | | 117,150 | | | | 9,886,288 | |
DexCom, Inc. (a) | | | 78,800 | | | | 5,764,220 | |
Edwards Lifesciences Corp. (a) | | | 108,275 | | | | 12,802,436 | |
| | | | | | | | |
| | | | | | | 55,018,626 | |
| | | | | | | | |
Health Care Providers & Services 3.2% | | | | | | | | |
¨UnitedHealth Group, Inc. | | | 158,350 | | | | 29,361,257 | |
| | | | | | | | |
| | |
Hotels, Restaurants & Leisure 3.0% | | | | | | | | |
Hilton Worldwide Holdings, Inc. | | | 194,850 | | | | 12,051,473 | |
Starbucks Corp. | | | 266,810 | | | | 15,557,691 | |
| | | | | | | | |
| | | | | | | 27,609,164 | |
| | | | | | | | |
| | | | | | | | |
| | |
| | | Shares | | | Value | |
Industrial Conglomerates 1.8% | | | | | | | | |
Honeywell International, Inc. | | | 126,225 | | | $ | 16,824,530 | |
| | | | | | | | |
|
Internet & Direct Marketing Retail 9.5% | |
¨Amazon.com, Inc. (a) | | | 45,890 | | | | 44,421,520 | |
Ctrip.com International, Ltd., ADR (a) | | | 189,850 | | | | 10,225,321 | |
Expedia, Inc. | | | 74,220 | | | | 11,055,069 | |
Netflix, Inc. (a) | | | 30,600 | | | | 4,571,946 | |
Priceline Group, Inc. (a) | | | 9,400 | | | | 17,582,888 | |
| | | | | | | | |
| | | | | | | 87,856,744 | |
| | | | | | | | |
Internet Software & Services 12.1% | | | | | | | | |
¨Alibaba Group Holding, Ltd., Sponsored ADR (a) | | | 146,000 | | | | 20,571,400 | |
¨Alphabet, Inc.(a) | | | | | | | | |
Class A | | | 24,825 | | | | 23,079,306 | |
Class C | | | 27,199 | | | | 24,716,547 | |
CoStar Group, Inc. (a) | | | 44,855 | | | | 11,823,778 | |
¨Facebook, Inc. Class A (a) | | | 211,550 | | | | 31,939,819 | |
| | | | | | | | |
| | | | | | | 112,130,850 | |
| | | | | | | | |
IT Services 9.2% | | | | | | | | |
Fidelity National Information Services, Inc. | | | 115,900 | | | | 9,897,860 | |
Fiserv, Inc. (a) | | | 82,650 | | | | 10,111,401 | |
Mastercard, Inc. Class A | | | 154,100 | | | | 18,715,445 | |
PayPal Holdings, Inc. (a) | | | 175,650 | | | | 9,427,135 | |
¨Visa, Inc. Class A | | | 400,450 | | | | 37,554,201 | |
| | | | | | | | |
| | | | | | | 85,706,042 | |
| | | | | | | | |
Life Sciences Tools & Services 2.8% | | | | | | | | |
Illumina, Inc. (a) | | | 60,200 | | | | 10,445,904 | |
Thermo Fisher Scientific, Inc. | | | 89,800 | | | | 15,667,406 | |
| | | | | | | | |
| | | | | | | 26,113,310 | |
| | | | | | | | |
Machinery 1.0% | | | | | | | | |
Fortive Corp. | | | 150,900 | | | | 9,559,515 | |
| | | | | | | | |
| | |
Media 1.7% | | | | | | | | |
Altice U.S.A., Inc. Class A (a) | | | 73,200 | | | | 2,364,360 | |
Comcast Corp. Class A | | | 338,800 | | | | 13,186,096 | |
| | | | | | | | |
| | | | | | | 15,550,456 | |
| | | | | | | | |
Oil, Gas & Consumable Fuels 1.1% | | | | | | | | |
Diamondback Energy, Inc. (a) | | | 119,990 | | | | 10,656,312 | |
| | | | | | | | |
| | |
Pharmaceuticals 2.8% | | | | | | | | |
Eli Lilly & Co. | | | 111,800 | | | | 9,201,140 | |
Zoetis, Inc. | | | 261,850 | | | | 16,334,203 | |
| | | | | | | | |
| | | | | | | 25,535,343 | |
| | | | | | | | |
Road & Rail 1.3% | | | | | | | | |
Union Pacific Corp. | | | 109,300 | | | | 11,903,863 | |
| | | | | | | | |
| † | Percentages indicated are based on Portfolio net assets. |
| ¨ | | Among the Portfolio’s 10 largest holdings, as of June 30, 2017, excluding short-term investment. May be subject to change daily. |
| | | | |
| 10 | | MainStay VP Large Cap Growth Portfolio | | The notes to the financial statements are an integral part of,
and should be read in conjunction with, the financial statements. |
| | | | | | | | |
| | |
| | | Shares | | | Value | |
| Common Stocks (continued) | | | | | | | | |
Semiconductors & Semiconductor Equipment 5.5% | |
ASML Holding N.V. Registered | | | 70,700 | | | $ | 9,212,917 | |
Broadcom, Ltd. | | | 64,650 | | | | 15,066,682 | |
NVIDIA Corp. | | | 62,500 | | | | 9,035,000 | |
Skyworks Solutions, Inc. | | | 85,300 | | | | 8,184,535 | |
Xilinx, Inc. | | | 144,000 | | | | 9,262,080 | |
| | | | | | | | |
| | | | | | | 50,761,214 | |
| | | | | | | | |
Software 12.0% | | | | | | | | |
Adobe Systems, Inc. (a) | | | 70,550 | | | | 9,978,592 | |
Electronic Arts, Inc. (a) | | | 83,800 | | | | 8,859,336 | |
Intuit, Inc. | | | 83,400 | | | | 11,076,354 | |
¨Microsoft Corp. | | | 465,600 | | | | 32,093,808 | |
¨salesforce.com, Inc. (a) | | | 305,750 | | | | 26,477,950 | |
ServiceNow, Inc. (a) | | | 121,800 | | | | 12,910,800 | |
Splunk, Inc. (a) | | | 168,700 | | | | 9,597,343 | |
| | | | | | | | |
| | | | | | | 110,994,183 | |
| | | | | | | | |
Specialty Retail 1.7% | | | | | | | | |
Home Depot, Inc. | | | 100,600 | | | | 15,432,040 | |
| | | | | | | | |
| |
Technology Hardware, Storage &
Peripherals 4.2% | | | | | |
¨Apple, Inc. | | | 269,425 | | | | 38,802,589 | |
| | | | | | | | |
| | |
Textiles, Apparel & Luxury
Goods 2.0% | | | | | | | | |
NIKE, Inc., Class B | | | 312,950 | | | | 18,464,050 | |
| | | | | | | | |
Total Common Stocks
(Cost $736,297,374) | | | | | | | 917,777,668 | |
| | | | | | | | |
| | | | | | | | |
| | | Principal
Amount | | | Value | |
| Short-Term Investment 1.0% | | | | | | | | |
Repurchase Agreement 1.0% | | | | | | | | |
Fixed Income Clearing Corp.
0.12%, dated 6/30/17
due 7/3/17
Proceeds at Maturity $9,749,588 (Collateralized by a United States Treasury Note with a rate of 1.125% and a maturity date of 9/30/21, with a Principal Amount of $10,185,000 and a Market Value of $9,948,545) | | $ | 9,749,491 | | | $ | 9,749,491 | |
| | | | | | | | |
Total Short-Term Investment
(Cost $9,749,491) | | | | | | | 9,749,491 | |
| | | | | | | | |
Total Investments
(Cost $746,046,865) (b) | | | 100.1 | % | | | 927,527,159 | |
Other Assets, Less Liabilities | | | (0.1 | ) | | | (1,329,139 | ) |
Net Assets | | | 100.0 | % | | $ | 926,198,020 | |
| (a) | Non-income producing security. |
| (b) | As of June 30, 2017, cost was $746,731,396 for federal income tax purposes and net unrealized appreciation was as follows: |
| | | | |
Gross unrealized appreciation | | $ | 184,019,443 | |
Gross unrealized depreciation | | | (3,223,680 | ) |
| | | | |
Net unrealized appreciation | | $ | 180,795,763 | |
| | | | |
The following abbreviation is used in the preceding pages:
ADR—American Depositary Receipt
The following is a summary of the fair valuations according to the inputs used as of June 30, 2017, for valuing the Portfolio’s assets.
Asset Valuation Inputs
| | | | | | | | | | | | | | | | | | | | |
Description | | Quoted Prices in Active Markets for Identical Assets (Level 1) | | | Significant
Other
Observable
Inputs (Level 2) | | | Significant
Unobservable
Inputs (Level 3) | | | Total | | | | |
| Investments in Securities (a) | | | | | | | | | | | | | |
| Common Stocks | | $ | 917,777,668 | | | $ | — | | | $ | — | | | $ | 917,777,668 | | | | | |
| Short-Term Investment | | | | | | | | | | | | | |
Repurchase Agreement | | | — | | | | 9,749,491 | | | | — | | | | 9,749,491 | | | | | |
| | | | | | | | | | | | | | | | | | | | |
| Total Investments in Securities | | $ | 917,777,668 | | | $ | 9,749,491 | | | $ | — | | | $ | 927,527,159 | | | | | |
| | | | | | | | | | | | | | | | | | | | |
| (a) | For a complete listing of investments and their industries, see the Portfolio of Investments. |
The Portfolio recognizes transfers between the levels as of the beginning of the period.
For the period ended June 30, 2017, the Portfolio did not have any transfers among levels. (See Note 2)
As of June 30, 2017, the Portfolio did not hold any investments with significant unobservable inputs (Level 3). (See Note 2)
| | | | | | |
The notes to the financial statements are an integral part of,
and should be read in conjunction with, the financial statements. | | | | | 11 | |
Statement of Assets and Liabilities as of June 30, 2017 (Unaudited)
| | | | |
| Assets | |
Investment in securities, at value
(identified cost $746,046,865) | | $ | 927,527,159 | |
Receivables: | |
Investment securities sold | | | 10,653,586 | |
Fund shares sold | | | 966,161 | |
Dividends and interest | | | 345,371 | |
Other assets | | | 5,512 | |
| | | | |
Total assets | | | 939,497,789 | |
| | | | |
|
| Liabilities | |
Payables: | |
Investment securities purchased | | | 12,418,555 | |
Manager (See Note 3) | | | 573,666 | |
NYLIFE Distributors (See Note 3) | | | 106,406 | |
Shareholder communication | | | 90,667 | |
Fund shares redeemed | | | 73,135 | |
Professional fees | | | 21,253 | |
Custodian | | | 7,951 | |
Trustees | | | 1,608 | |
Accrued expenses | | | 6,528 | |
| | | | |
Total liabilities | | | 13,299,769 | |
| | | | |
Net assets | | $ | 926,198,020 | |
| | | | |
|
| Composition of Net Assets | |
Shares of beneficial interest outstanding (par value of $.001 per share) unlimited number of shares authorized | | $ | 42,717 | |
Additional paid-in capital | | | 627,228,843 | |
| | | | |
| | | 627,271,560 | |
Undistributed net investment income | | | 383,773 | |
Accumulated net realized gain (loss) on investments | | | 117,062,393 | |
Net unrealized appreciation (depreciation) on investments | | | 181,480,294 | |
| | | | |
Net assets | | $ | 926,198,020 | |
| | | | |
| | | | |
Initial Class | |
Net assets applicable to outstanding shares | | $ | 413,747,575 | |
| | | | |
Shares of beneficial interest outstanding | | | 18,682,340 | |
| | | | |
Net asset value per share outstanding | | $ | 22.15 | |
| | | | |
Service Class | |
Net assets applicable to outstanding shares | | $ | 512,450,445 | |
| | | | |
Shares of beneficial interest outstanding | | | 24,034,783 | |
| | | | |
Net asset value per share outstanding | | $ | 21.32 | |
| | | | |
| | | | |
| 12 | | MainStay VP Large Cap Growth Portfolio | | The notes to the financial statements are an integral part of,
and should be read in conjunction with, the financial statements. |
Statement of Operations for the six months ended June 30, 2017 (Unaudited)
| | | | |
| Investment Income (Loss) | |
Income | |
Dividends | | $ | 4,561,853 | |
Interest | | | 2,886 | |
| | | | |
Total income | | | 4,564,739 | |
| | | | |
Expenses | |
Manager (See Note 3) | | | 3,449,208 | |
Distribution/Service—Service Class (See Note 3) | | | 600,081 | |
Shareholder communication | | | 68,498 | |
Professional fees | | | 40,966 | |
Trustees | | | 11,787 | |
Custodian | | | 5,996 | |
Miscellaneous | | | 19,161 | |
| | | | |
Total expenses before waiver/reimbursement | | | 4,195,697 | |
Expense waiver/reimbursement from Manager (See Note 3) | | | (14,731 | ) |
| | | | |
Net expenses | | | 4,180,966 | |
| | | | |
Net investment income (loss) | | | 383,773 | |
| | | | |
|
| Realized and Unrealized Gain (Loss) on Investments | |
Net realized gain (loss) on investments | | | 84,341,053 | |
Net change in unrealized appreciation (depreciation) on investments | | | 75,918,252 | |
| | | | |
Net realized and unrealized gain (loss) on investments | | | 160,259,305 | |
| | | | |
Net increase (decrease) in net assets resulting from operations | | $ | 160,643,078 | |
| | | | |
| | | | | | |
The notes to the financial statements are an integral part of,
and should be read in conjunction with, the financial statements. | | | | | 13 | |
Statements of Changes in Net Assets
for the six months ended June 30, 2017 (Unaudited) and the year ended December 31, 2016
| | | | | | | | |
| | | 2017 | | | 2016 | |
| Increase (Decrease) in Net Assets | |
Operations: | |
Net investment income (loss) | | $ | 383,773 | | | $ | (447,462 | ) |
Net realized gain (loss) on investments | | | 84,341,053 | | | | 33,323,148 | |
Net change in unrealized appreciation (depreciation) on investments | | | 75,918,252 | | | | (55,608,438 | ) |
| | | | |
Net increase (decrease) in net assets resulting from operations | | | 160,643,078 | | | | (22,732,752 | ) |
| | | | |
Distributions to shareholders: | |
From net realized gain on investments: | |
Initial Class | | | — | | | | (37,645,350 | ) |
Service Class | | | — | | | | (38,025,475 | ) |
| | | | |
Total distributions to shareholders | | | — | | | | (75,670,825 | ) |
| | | | |
Capital share transactions: | |
Net proceeds from sale of shares | | | 51,846,571 | | | | 245,856,696 | |
Net asset value of shares issued to shareholders in reinvestment of distributions | | | — | | | | 75,670,825 | |
Cost of shares redeemed | | | (239,745,533 | ) | | | (158,970,224 | ) |
| | | | |
Increase (decrease) in net assets derived from capital share transactions | | | (187,898,962 | ) | | | 162,557,297 | |
| | | | |
Net increase (decrease) in net assets | | | (27,255,884 | ) | | | 64,153,720 | |
|
| Net Assets | |
| |
Beginning of period | | | 953,453,904 | | | | 889,300,184 | |
| | | | |
End of period | | $ | 926,198,020 | | | $ | 953,453,904 | |
| | | | |
Undistributed net investment income at end of period | | $ | 383,773 | | | $ | — | |
| | | | |
| | | | |
| 14 | | MainStay VP Large Cap Growth Portfolio | | The notes to the financial statements are an integral part of,
and should be read in conjunction with, the financial statements. |
Financial Highlights selected per share data and ratios
| | | | | | | | | | | | | | | | | | | | | | | | | | | | |
| | | Six months
ended
June 30, | | | | | | Year ended December 31, | |
| Initial Class | | 2017* | | | | | | 2016 | | | 2015 | | | 2014 | | | 2013 | | | 2012 | |
Net asset value at beginning of period | | $ | 18.71 | | | | | | | $ | 20.83 | | | $ | 22.48 | | | $ | 22.83 | | | $ | 16.88 | | | $ | 14.92 | |
| | | | | | | | | | | | | | | | | | | | | | | | | | | | |
Net investment income (loss) (a) | | | 0.02 | | | | | | | | 0.01 | | | | (0.00 | )‡ | | | (0.01 | ) | | | 0.01 | | | | 0.06 | |
Net realized and unrealized gain (loss) on investments | | | 3.42 | | | | | | | | (0.43 | ) | | | 1.22 | | | | 2.29 | | | | 6.11 | | | | 1.90 | |
| | | | | | | | | | | | | | | | | | | | | | | | | | | | |
Total from investment operations | | | 3.44 | | | | | | | | (0.42 | ) | | | 1.22 | | | | 2.28 | | | | 6.12 | | | | 1.96 | |
| | | | | | | | | | | | | | | | | | | | | | | | | | | | |
| Less dividends and distributions: | | | | | | | | | | | | | | | | | | | | | | | | | | | | |
From net investment income | | | — | | | | | | | | — | | | | — | | | | — | | | | (0.06 | ) | | | — | |
From net realized gain on investments | | | — | | | | | | | | (1.70 | ) | | | (2.87 | ) | | | (2.63 | ) | | | (0.11 | ) | | | — | |
| | | | | | | | | | | | | | | | | | | | | | | | | | | | |
Total dividends and distributions | | | — | | | | | | | | (1.70 | ) | | | (2.87 | ) | | | (2.63 | ) | | | (0.17 | ) | | | — | |
| | | | | | | | | | | | | | | | | | | | | | | | | | | | |
Net asset value at end of period | | $ | 22.15 | | | | | | | $ | 18.71 | | | $ | 20.83 | | | $ | 22.48 | | | $ | 22.83 | | | $ | 16.88 | |
| | | | | | | | | | | | | | | | | | | | | | | | | | | | |
Total investment return (b) | | | 18.39 | %(c) | | | | | | | (2.27 | %) | | | 6.18 | % | | | 10.63 | % | | | 36.47 | % | | | 13.14 | % |
| Ratios (to average net assets)/Supplemental Data: | | | | | | | | | | | | | | | | | | | | | | | | | | | | |
Net investment income (loss) | | | 0.20 | %†† | | | | | | | 0.07 | % | | | (0.01 | %) | | | (0.03 | %) | | | 0.07 | % | | | 0.38 | % |
Net expenses | | | 0.77 | %†† | | | | | | | 0.77 | % | | | 0.77 | % | | | 0.77 | % | | | 0.77 | % | | | 0.78 | % |
Portfolio turnover rate | | | 30 | % | | | | | | | 94 | % | | | 71 | % | | | 78 | % | | | 74 | % | | | 69 | % |
Net assets at end of period (in 000’s) | | $ | 413,748 | | | | | | | $ | 518,425 | | | $ | 448,409 | | | $ | 410,122 | | | $ | 428,354 | | | $ | 441,225 | |
| ‡ | Less than one cent per share. |
| (a) | Per share data based on average shares outstanding during the period. |
| (b) | Total return does not reflect any deduction of sales charges, mortality and expense charges, contract charges or administrative charges. For periods of less than one year, total return is not annualized. |
| (c) | Total investment return may reflect adjustments to conform to generally accepted accounting principles. |
| | | | | | | | | | | | | | | | | | | | | | | | | | | | |
| | | Six months
ended
June 30, | | | | | | Year ended December 31, | |
| Service Class | | 2017* | | | | | | 2016 | | | 2015 | | | 2014 | | | 2013 | | | 2012 | |
Net asset value at beginning of period | | $ | 18.03 | | | | | | | $ | 20.18 | | | $ | 21.93 | | | $ | 22.39 | | | $ | 16.56 | | | $ | 14.68 | |
| | | | | | | | | | | | | | | | | | | | | | | | | | | | |
Net investment income (loss) (a) | | | (0.00 | )‡ | | | | | | | (0.03 | ) | | | (0.06 | ) | | | (0.06 | ) | | | (0.03 | ) | | | 0.02 | |
Net realized and unrealized gain (loss) on investments | | | 3.29 | | | | | | | | (0.42 | ) | | | 1.18 | | | | 2.23 | | | | 6.00 | | | | 1.86 | |
| | | | | | | | | | | | | | | | | | | | | | | | | | | | |
Total from investment operations | | | 3.29 | | | | | | | | (0.45 | ) | | | 1.12 | | | | 2.17 | | | | 5.97 | | | | 1.88 | |
| | | | | | | | | | | | | | | | | | | | | | | | | | | | |
| Less dividends and distributions: | | | | | | | | | | | | | | | | | | | | | | | | | | | | |
From net investment income | | | — | | | | | | | | — | | | | — | | | | — | | | | (0.03 | ) | | | — | |
From net realized gain on investments | | | — | | | | | | | | (1.70 | ) | | | (2.87 | ) | | | (2.63 | ) | | | (0.11 | ) | | | — | |
| | | | | | | | | | | | | | | | | | | | | | | | | | | | |
Total dividends and distributions | | | — | | | | | | | | (1.70 | ) | | | (2.87 | ) | | | (2.63 | ) | | | (0.14 | ) | | | — | |
| | | | | | | | | | | | | | | | | | | | | | | | | | | | |
Net asset value at end of period | | $ | 21.32 | | | | | | | $ | 18.03 | | | $ | 20.18 | | | $ | 21.93 | | | $ | 22.39 | | | $ | 16.56 | |
| | | | | | | | | | | | | | | | | | | | | | | | | | | | |
Total investment return (b) | | | 18.25 | % (c) | | | | | | | (2.52 | %) | | | 5.91 | % | | | 10.35 | % | | | 36.13 | % | | | 12.81 | % |
| Ratios (to average net assets)/Supplemental Data: | | | | | | | | | | | | | | | | | | | | | | | | | | | | |
Net investment income (loss) | | | (0.03 | %)†† | | | | | | | (0.17 | %) | | | (0.26 | %) | | | (0.28 | %) | | | (0.18 | %) | | | 0.10 | % |
Net expenses | | | 1.02 | % †† | | | | | | | 1.02 | % | | | 1.02 | % | | | 1.02 | % | | | 1.02 | % | | | 1.03 | % |
Portfolio turnover rate | | | 30 | % | | | | | | | 94 | % | | | 71 | % | | | 78 | % | | | 74 | % | | | 69 | % |
Net assets at end of period (in 000’s) | | $ | 512,450 | | | | | | | $ | 435,029 | | | $ | 440,891 | | | $ | 373,762 | | | $ | 324,801 | | | $ | 225,199 | |
| ‡ | Less than one cent per share. |
| (a) | Per share data based on average shares outstanding during the period. |
| (b) | Total return does not reflect any deduction of sales charges, mortality and expense charges, contract charges or administrative charges. For periods of less than one year, total return is not annualized. |
| (c) | Total investment return may reflect adjustments to conform to generally accepted accounting principles. |
| | | | | | |
The notes to the financial statements are an integral part of,
and should be read in conjunction with, the financial statements. | | | | | 15 | |
Notes to Financial Statements (Unaudited)
Note 1–Organization and Business
MainStay VP Funds Trust (the ‘‘Fund’’) was organized as a Delaware statutory trust on February 1, 2011. The Fund is registered under the Investment Company Act of 1940, as amended (the “1940 Act”), as an open-end management investment company. The Fund is comprised of thirty-two separate series (collectively referred to as the “Portfolios”). These financial statements and notes relate to the MainStay VP Large Cap Growth Portfolio (the “Portfolio”), a “diversified” portfolio, as that term is defined in the 1940 Act, as interpreted or modified by regulatory authorities having jurisdiction, from time to time.
Shares of the Portfolio are currently sold to certain separate accounts to fund variable annuity policies and variable universal life insurance policies issued by New York Life Insurance and Annuity Corporation (“NYLIAC”), a wholly-owned subsidiary of New York Life Insurance Company (“New York Life”). NYLIAC allocates shares of the Portfolios to, among others, NYLIAC Variable Annuity Separate Accounts-I, II, III and IV, VUL Separate Account-I and CSVUL Separate Account-I (collectively, the “Separate Accounts”). Shares of the Portfolio are also offered to the MainStay VP Conservative Allocation Portfolio, MainStay VP Moderate Allocation Portfolio, MainStay VP Moderate Growth Allocation Portfolio and MainStay VP Growth Allocation Portfolio, which operate as “funds-of-funds.”
The Portfolio currently offers two classes of shares. Initial Class shares commenced operations on May 1, 1998. Service Class shares commenced operations on June 6, 2003. Shares of the Portfolio are offered and are redeemed at a price equal to their respective net asset value (“NAV”) per share. No sales or redemption charge is applicable to the purchase or redemption of the Portfolio’s shares. Under the terms of the Fund’s multiple class plan adopted pursuant to Rule 18f-3 under the 1940 Act, the classes differ in that, among other things, Service Class shares of the Portfolio pay a combined distribution and service fee of 0.25% of average daily net assets to the Distributor (as defined in Note 3(B)) of their shares. Contract owners of variable annuity contracts purchased after June 2, 2003, are permitted to invest only in the Service Class shares.
The Portfolio’s investment objective is to seek long-term growth of capital.
Note 2–Significant Accounting Policies
The Portfolio is an investment company and accordingly follows the investment company accounting and reporting guidance of the Financial Accounting Standards Board (“FASB”) Accounting Standard Codification Topic 946 Financial Services—Investment Companies. The Portfolio prepares its financial statements in accordance with generally accepted accounting principles (“GAAP”) in the United States of America and follows the significant accounting policies described below.
(A) Securities Valuation. Investments are usually valued as of the close of regular trading on the New York Stock Exchange (the ��Exchange”) (usually 4:00 p.m. Eastern time) on each day the Portfolio is open for business (“valuation date”).
The Board of Trustees (the “Board”) adopted procedures establishing methodologies for the valuation of the Portfolio’s securities and other assets and delegated the responsibility for valuation determinations
under those procedures to the Valuation Committee of the Fund (the “Valuation Committee”). The Board authorized the Valuation Committee to appoint a Valuation Sub-Committee (the “Sub-Committee”) to deal in the first instance with establishing the prices of securities for which market quotations are not readily available or the prices of which are not otherwise readily determinable under these procedures. The Sub-Committee meets (in person, via electronic mail or via teleconference) on an as-needed basis. Subsequently, the Valuation Committee meets to ensure that actions taken by the Sub-Committee were appropriate. The procedures recognize that, subject to the oversight of the Board and unless otherwise noted, the responsibility for the day-to-day valuation of portfolio assets (including fair value measurements for the Portfolio’s assets and liabilities) rests with New York Life Investment Management LLC (“New York Life Investments” or the “Manager”), aided to whatever extent necessary by the Subadvisor (as defined in Note 3(A)) to the Portfolio.
To assess the appropriateness of security valuations, the Manager, Subadvisor or the Portfolio’s third party service provider, who is subject to oversight by the Manager, regularly compares prior day prices, prices on comparable securities, and the sale prices to the prior and current day prices and challenges prices with changes exceeding certain tolerance levels with third party pricing services or broker sources. For those securities valued through either a standardized fair valuation methodology or a fair valuation measurement, the Sub-Committee deals in the first instance with such valuation and the Valuation Committee reviews and affirms, if appropriate, the reasonableness of the valuation based on such methodologies and measurements on a regular basis after considering all relevant information that is reasonably available. Any action taken by the Sub-Committee with respect to the valuation of a portfolio security or other asset is submitted by the Valuation Committee to the Board for its review and ratification, if appropriate, at its next regularly scheduled meeting.
“Fair value” is defined as the price the Portfolio would reasonably expect to receive upon selling an asset or liability in an orderly transaction to an independent buyer in the principal or most advantageous market for the asset or liability. Fair value measurements are determined within a framework that establishes a three-tier hierarchy which maximizes the use of observable market data and minimizes the use of unobservable inputs to establish a classification of fair value measurements for disclosure purposes. “Inputs” refer broadly to the assumptions that market participants would use in pricing the asset or liability, including assumptions about risk, such as the risk inherent in a particular valuation technique used to measure fair value using a pricing model and/or the risk inherent in the inputs for the valuation technique. Inputs may be observable or unobservable. Observable inputs reflect the assumptions market participants would use in pricing the asset or liability based on market data obtained from sources independent of the Portfolio. Unobservable inputs reflect the Portfolio’s own assumptions about the assumptions market participants would use in pricing the asset or liability based on the information available. The inputs or methodology used for valuing assets or liabilities may not be an indication of the risks associated with investing in those assets or liabilities. The three-tier hierarchy of inputs is summarized below.
| • | | Level 1—quoted prices in active markets for an identical asset or liability |
| | |
| 16 | | MainStay VP Large Cap Growth Portfolio |
| • | | Level 2—other significant observable inputs (including quoted prices for a similar asset or liability in active markets, interest rates and yield curves, prepayment speeds, credit risk, etc.) |
| • | | Level 3—significant unobservable inputs (including the Portfolio’s own assumptions about the assumptions that market participants would use in measuring fair value of an asset or liability) |
The level of an asset or liability within the fair value hierarchy is based on the lowest level of an input, both individually and in the aggregate, that is significant to the fair value measurement. As of June 30, 2017, the aggregate value by input level of the Portfolio’s assets and liabilities is included at the end of the Portfolio’s Portfolio of Investments.
The Portfolio may use third party vendor evaluations, whose prices may be derived from one or more of the following standard inputs, among others:
| | |
• Broker/dealer quotes | | • Benchmark securities |
• Two-sided markets | | • Reference data (corporate actions or material event notices) |
• Bids / offers | | • Monthly payment information |
• Industry and economic events | | • Reported trades |
An asset or liability for which market values cannot be measured using the methodologies described above is valued by methods deemed reasonable in good faith by the Valuation Committee, following the procedures established by the Board, to represent fair value. Under these procedures, the Portfolio generally uses a market-based approach which may use related or comparable assets or liabilities, recent transactions, market multiples, book values, and other relevant information. The Portfolio may also use an income-based valuation approach in which the anticipated future cash flows of the asset or liability are discounted to calculate fair value. Discounts may also be applied due to the nature and/or duration of any restrictions on the disposition of the asset or liability. Fair value represents a good faith approximation of the value of a security. Fair value determinations involve the consideration of a number of subjective factors, an analysis of applicable facts and circumstances and the exercise of judgment. As a result, it is possible that the fair value for a security determined in good faith in accordance with the Portfolio’s valuation procedures may differ from valuations for the same security determined by other funds using their own valuation procedures. Although the Portfolio’s valuation procedures are designed to value a security at the price the Portfolio may reasonably expect to receive upon the security’s sale in an orderly transaction, there can be no assurance that any fair value determination thereunder would, in fact, approximate the amount that the Portfolio would actually realize upon the sale of the security or the price at which the security would trade if a reliable market price were readily available. During the six-month period ended June 30, 2017, there were no material changes to the fair value methodologies.
Securities which may be valued in this manner include, but are not limited to: (i) a security for which trading has been halted or suspended; (ii) a debt security that has recently gone into default and for which there is not a current market quotation; (iii) a security of an issuer that has entered into a restructuring; (iv) a security that has been de-listed from a national exchange; (v) a security for which the market price is not readily available from a third party pricing source or, if so provided, does
not, in the opinion of the Manager or Subadvisor, reflect the security’s market value; (vi) a security subject to trading collars for which no or limited trading takes place; and (vii) a security whose principal market has been temporarily closed at a time when, under normal conditions, it would be open. Securities for which market quotations or observable inputs are not readily available are generally categorized as Level 3 in the hierarchy. As of June 30, 2017, there were no securities held by the Portfolio that were fair valued in such a manner.
Equity securities are valued at the last quoted sales prices as of the close of regular trading on the relevant exchange on each valuation date. Securities that are not traded on the valuation date are valued at the mean of the last quoted bid and ask prices. Prices are normally taken from the principal market in which each security trades. These securities are generally categorized as Level 1 in the hierarchy.
Temporary cash investments acquired in excess of 60 days to maturity at the time of purchase are valued using the latest bid prices or using valuations based on a matrix system (which considers such factors as security prices, yields, maturities, and ratings), both as furnished by independent pricing services. Other temporary cash investments which mature in 60 days or less at the time of purchase (“Short-Term Investments”) are valued using the amortized cost method of valuation, unless the use of such method would be inappropriate. The amortized cost method involves valuing a security at its cost on the date of purchase and thereafter assuming a constant amortization to maturity of the difference between such cost and the value on maturity date. Amortized cost approximates the current fair value of a security. Securities valued using the amortized cost method are not valued using quoted prices in an active market and are generally categorized as Level 2 in the hierarchy.
The information above is not intended to reflect an exhaustive list of the methodologies that may be used to value portfolio investments. The valuation procedures permit the use of a variety of valuation methodologies in connection with valuing portfolio investments. The methodology used for a specific type of investment may vary based on the market data available or other considerations. The methodologies summarized above may not represent the specific means by which portfolio investments are valued on any particular business day.
(B) Income Taxes. The Portfolio’s policy is to comply with the requirements of the Internal Revenue Code of 1986, as amended (the “Internal Revenue Code”), applicable to regulated investment companies and to distribute all of its taxable income to the shareholders of the Portfolio within the allowable time limits. Therefore, no federal, state and local income tax provisions are required.
Management evaluates the Portfolio’s tax positions to determine if the tax positions taken meet the minimum recognition threshold in connection with accounting for uncertainties in income tax positions taken or expected to be taken for the purposes of measuring and recognizing tax liabilities in the financial statements. Recognition of tax benefits of an uncertain tax position is permitted only to the extent the position is “more likely than not” to be sustained assuming examination by taxing authorities. Management has analyzed the Portfolio’s tax positions taken on federal, state and local income tax returns for all open tax years (for up to three tax years), and has concluded that no provisions for federal, state and local income tax are required in the Portfolio’s financial
Notes to Financial Statements (Unaudited) (continued)
statements. The Portfolio’s federal, state and local income and federal excise tax returns for tax years for which the applicable statutes of limitations have not expired are subject to examination by the Internal Revenue Service and state and local departments of revenue.
(C) Dividends and Distributions to Shareholders. Dividends and distributions are recorded on the ex-dividend date. The Portfolio intends to declare and pay dividends from net investment income and distributions from net realized capital and currency gains, if any, at least annually. All dividends and distributions are reinvested in the same class of shares of the Portfolio, at NAV. Dividends and distributions to shareholders are determined in accordance with federal income tax regulations and may differ from GAAP.
(D) Security Transactions and Investment Income. The Portfolio records security transactions on the trade date. Realized gains and losses on security transactions are determined using the identified cost method. Dividend income is recognized on the ex-dividend date; net of any foreign tax withheld at the source, and interest income is accrued as earned using the effective interest rate method. Discounts and premiums on Short-Term Investments are accreted and amortized, respectively, on the straight-line method. The straight-line method approximates the effective interest method for Short-Term Investments.
Investment income and realized and unrealized gains and losses on investments of the Portfolio are allocated pro rata to the separate classes of shares based upon their relative net assets on the date the income is earned or realized and unrealized gains and losses are incurred.
(E) Expenses. Expenses of the Fund are allocated to the individual Portfolios in proportion to the net assets of the respective Portfolios when the expenses are incurred, except where direct allocations of expenses can be made. Expenses (other than fees incurred under the distribution and service plans, further discussed in Note 3(B), which are charged directly to the Service Class shares) are allocated to separate classes of shares pro rata based upon their relative net assets on the date the expenses are incurred. The expenses borne by the Portfolio, including those of related parties to the Portfolio, are shown in the Statement of Operations.
(F) Use of Estimates. In preparing financial statements in conformity with GAAP, management makes estimates and assumptions that affect the reported amounts and disclosures in the financial statements. Actual results could differ from those estimates.
(G) Repurchase Agreements. The Portfolio may enter into repurchase agreements (i.e., buy a security from another party with the agreement that it be sold back in the future) to earn income. The Portfolio may enter into repurchase agreements only with counterparties, usually financial institutions, that are deemed by the Manager or Subadvisor to be creditworthy, pursuant to guidelines established by the Board. During the term of any repurchase agreement, the Manager or Subadvisor will continue to monitor the creditworthiness of the counterparty. Under the 1940 Act, repurchase agreements are considered to be collateralized loans by the Portfolio to the counterparty secured by the securities transferred to the Portfolio.
Repurchase agreements are subject to counterparty risk, meaning the Portfolio could lose money by the counterparty’s failure to perform
under the terms of the agreement. The Portfolio mitigates this risk by ensuring the repurchase agreement is collateralized by cash, U.S. government securities, fixed income securities and/or other securities. The collateral is held by the Portfolio’s custodian valued daily on a mark to market basis to determine if the value, including accrued interest, exceeds the repurchase price. In the event of the counterparty’s default on the obligation to repurchase, the Portfolio has the right to liquidate the collateral and apply the proceeds in satisfaction of the obligation. Under certain circumstances, such as in the event of default or bankruptcy by the counterparty, realization and/or retention of the collateral may be limited or subject to delay, to legal proceedings and possible realized loss to the Portfolio.
(H) Securities Lending. In order to realize additional income, the Portfolio may engage in securities lending, subject to the limitations set forth in the 1940 Act and relevant guidance by the staff of the Securities and Exchange Commission (“SEC”). In the event the Portfolio does engage in securities lending, the Portfolio will lend through its custodian, State Street Bank and Trust Company (“State Street”). State Street will manage the Portfolio’s collateral in accordance with the lending agreement between the Portfolio and State Street, and indemnify the Portfolio against counterparty risk. The loans will be collateralized by U.S. Treasury securities at least equal at all times to the market value of the securities loaned. The Portfolio may bear the risk of delay in recovery of, or loss of rights in, the securities loaned should the borrower of the securities experience financial difficulty. The Portfolio may also record a realized gain or loss on securities deemed sold due to a borrower’s inability to return securities on loan. The Portfolio bears the risk of any loss on investment of the collateral. The Portfolio will receive compensation for lending its securities in the form of fees or it will retain a portion of interest on the investment of any cash received as collateral. The Portfolio will also continue to receive interest and dividends on the securities loaned and any gain or loss in the market price of the securities loaned that may occur during the term of the loan will be for the account of the Portfolio. During the six-month period ended June 30, 2017, the Portfolio did not have any portfolio securities on loan.
(I) Indemnifications. Under the Fund’s organizational documents, its officers and trustees are indemnified against certain liabilities that may arise out of performance of their duties to the Fund. Additionally, in the normal course of business, the Portfolio enters into contracts with third-party service providers that contain a variety of representations and warranties and which may provide general indemnifications. The Portfolio’s maximum exposure under these arrangements is unknown, as this would involve future claims that may be made against the Portfolio that have not yet occurred. Based on experience, management is of the view that the risk of loss in connection with these potential indemnification obligations is remote. However, there can be no assurance that material liabilities related to such obligations will not arise in the future, which could adversely impact the Portfolio.
Note 3–Fees and Related Party Transactions
(A) Manager and Subadvisor. New York Life Investments, a registered investment adviser and an indirect, wholly-owned subsidiary of New York Life, serves as the Portfolio’s Manager pursuant to an Amended and Restated Management Agreement (“Management Agreement”). The Manager provides offices, conducts clerical, recordkeeping and bookkeeping services, and keeps most of the financial and
| | |
| 18 | | MainStay VP Large Cap Growth Portfolio |
accounting records required to be maintained by the Portfolio. Except for the portion of salaries and expenses that are the responsibility of the Portfolio, the Manager pays the salaries and expenses of all personnel affiliated with the Portfolio and certain operational expenses of the Portfolio. The Portfolio reimburses New York Life Investments in an amount equal to a portion of the compensation of the Chief Compliance Officer attributable to the Portfolio. Pursuant to the terms of a Subadvisory Agreement with New York Life Investments, Winslow Capital Management, LLC. (“Winslow Capital” or “Subadvisor”), a registered investment adviser, serves as Subadvisor to the Portfolio. New York Life Investments pays for the services of the Subadvisor.
The Fund, on behalf of the Portfolio, pays New York Life Investments in its capacity as the Portfolio’s investment manager and administrator, pursuant to the Management Agreement, a monthly fee for services performed and facilities furnished at an annual rate of the average daily net assets as follows: 0.75% up to $500 million; 0.725% from $500 million to $750 million; 0.71% from $750 million to $1 billion; 0.70% from $1 billion to $2 billion; 0.66% from $2 billion to $3 billion; 0.61% from $3 billion to $7 billion; 0.585% from $7 billion to $9 billion; and 0.575% in excess of $9 billion. New York Life Investments has voluntarily agreed to waive a portion of its management fee when the subadvisory fee is reduced as a result of achieving breakpoints in the subadvisory fee schedule. The savings that result from the reduced subadvisory fee will be shared equally with the Portfolio provided that the amount of the management fee retained by New York Life Investments, after payment of the subadvisory fee, exceeds 0.35% of the average daily net assets of the Portfolio. This waiver may be discontinued at any time. New York Life Investments has contractually agreed to waive a portion of its management fee so that the management fee does not exceed 0.55% of the Portfolio’s average daily net assets from $11 billion to $13 billion; and 0.525% of the Portfolio’s average daily net assets over $13 billion. This agreement will remain in effect until May 1, 2018, and shall renew automatically for one-year terms unless New York Life Investments provides written notice of termination prior to the start of the next term or upon approval by the Board. During the six-month period ended June 30, 2017, the effective management fee rate was 0.74% exclusive of the management fee waiver.
During the six-month period ended June 30, 2017, New York Life Investments earned fees from the Portfolio in the amount of $3,449,208 and waived/reimbursed expenses in the amount of $14,731.
State Street provides sub-administration and sub-accounting services to the Portfolio pursuant to an agreement with New York Life Investments. These services include calculating the daily NAVs of the Portfolio, maintaining the general ledger and sub-ledger accounts for the calculation of the Portfolio’s NAVs, and assisting New York Life Investments in conducting various aspects of the Portfolio’s administrative operations. For providing these services to the Portfolio, State Street is compensated by New York Life Investments.
(B) Distribution and Service Fees The Fund, on behalf of the Portfolio, has entered into a distribution agreement with NYLIFE Distributors LLC (the “Distributor”), an indirect, wholly-owned subsidiary of New York Life. The Portfolio has adopted a distribution plan (the “Plan”) in accordance with the provisions of Rule 12b-1 under the 1940 Act.
Under the Plan, the Distributor has agreed to provide, through its affiliates or independent third parties, various distribution-related, shareholder and administrative support services to the Service Class shareholders. For its services, the Distributor is entitled to a combined distribution and service fee accrued daily and paid monthly at an annual rate of 0.25% of the average daily net assets attributable to the Service Class shares of the Portfolio.
Note 4–Federal Income Tax
During the year ended December 31, 2016, the tax character of distributions paid as reflected in the Statements of Changes in Net Assets was as follows:
| | |
| 2016 |
Tax-Based Distributions
from Ordinary
Income | | Tax-Based
Distributions
from Long-Term
Gains |
| $— | | $75,670,825 |
Note 5–Custodian
State Street is the custodian of cash and securities held by the Portfolio. Custodial fees are charged to the Portfolio based on the Portfolio’s net assets and/or the market value of securities held by the Portfolio and the number of certain transactions incurred by the Portfolio.
Note 6–Line of Credit
The Portfolio and certain other funds managed by New York Life Investments, maintain a line of credit with a syndicate of banks in order to secure a source of funds for temporary purposes to meet unanticipated or excessive redemption requests.
Effective August 1, 2017, under the credit agreement (the “Credit Agreement”), the aggregate commitment amount is $600,000,000 with an additional uncommitted amount of $100,000,000. The commitment fee is an annual rate of 0.15% of the average commitment amount payable quarterly, regardless of usage, to State Street, who serves as the agent to the syndicate. The commitment fee is allocated among the Portfolio and certain other funds managed by New York Life Investments based upon their respective net assets and other factors. Interest on any revolving credit loan is charged based upon the Federal Funds Rate or the one month LIBOR, whichever is higher. The Credit Agreement expires on July 31, 2018, although the Portfolio, certain other funds managed by New York Life Investments and the syndicate of banks may renew the Credit Agreement for an additional year on the same or different terms. Prior to August 1, 2017, the aggregate commitment amount was $600,000,000 with an additional uncommitted amount of $100,000,000, and the commitment fee, under a credit agreement for which Bank of New York Mellon served as agent, was at an annual rate of 0.15% of the average commitment amount. During the six-month period ended June 30, 2017, there were no borrowings made or outstanding with respect to the Portfolio under the credit agreement for which Bank of New York Mellon served as agent.
Notes to Financial Statements (Unaudited) (continued)
Note 7–Interfund Lending Program
Pursuant to an exemptive order issued by the SEC, the Portfolio, along with certain other funds managed by New York Life Investments, may participate in an interfund lending program. The interfund lending program provides an alternative credit facility that permits the Portfolio and certain other funds managed by New York Life Investments to lend or borrow money for temporary purposes directly to or from one another, subject to the conditions of the exemptive order. During the six-month period ended June 30, 2017, there were no interfund loans made or outstanding with respect to the Portfolio.
Note 8–Purchases and Sales of Securities (in 000’s)
During the six-month period ended June 30, 2017, purchases and sales of securities, other than short-term securities, were $279,824 and $465,444, respectively.
Note 9–Capital Share Transactions
| | | | | | | | |
Initial Class | | Shares | | | Amount | |
Six-month period ended June 30, 2017: | | | | | | | | |
Shares sold | | | 577,781 | | | $ | 11,646,264 | |
Shares redeemed | | | (9,606,687 | ) | | | (197,780,648 | ) |
| | | | |
Net increase (decrease) | | | (9,028,906 | ) | | $ | (186,134,384 | ) |
| | | | |
Year ended December 31, 2016: | | | | | | | | |
Shares sold | | | 8,384,466 | | | $ | 164,789,515 | |
Shares issued to shareholders in reinvestment of dividends and distributions | | | 1,946,406 | | | | 37,645,350 | |
Shares redeemed | | | (4,150,941 | ) | | | (81,099,269 | ) |
| | | | |
Net increase (decrease) | | | 6,179,931 | | | $ | 121,335,596 | |
| | | | |
| | |
| | | | | | | | |
Service Class | | Shares | | | Amount | |
Six-month period ended June 30, 2017: | | | | | | | | |
Shares sold | | | 1,995,595 | | | $ | 40,200,307 | |
Shares redeemed | | | (2,085,502 | ) | | | (41,964,885 | ) |
| | | | |
Net increase (decrease) | | | (89,907 | ) | | $ | (1,764,578 | ) |
| | | | |
Year ended December 31, 2016: | | | | | | | | |
Shares sold | | | 4,316,999 | | | $ | 81,067,181 | |
Shares issued to shareholders in reinvestment of dividends and distributions | | | 2,038,431 | | | | 38,025,475 | |
Shares redeemed | | | (4,073,363 | ) | | | (77,870,955 | ) |
| | | | |
Net increase (decrease) | | | 2,282,067 | | | $ | 41,221,701 | |
| | | | |
Transactions in capital shares for the six-month period ended June 30, 2017, and the year ended December 31, 2016, were as follows:
Note 10–Recent Accounting Pronouncement
In October 2016, the SEC adopted new rules and amended existing rules (together, “final rules”) intended to modernize the reporting and disclosure of information by registered investment companies. In part, the final rules amend Regulation S-X and require standardized, enhanced disclosure about derivatives in investment company financial statements, as well as other amendments. The compliance date for the amendments to Regulation S-X is August 1, 2017 and applies to shareholder reports for funds with fiscal periods ending after August 1, 2017. Management is currently evaluating the impact that the adoption of the amendments to Regulation S-X will have on the Portfolio’s financial statements and related disclosures.
Note 11–Subsequent Events
In connection with the preparation of the financial statements of the Portfolio as of and for the six-month period ended June 30, 2017, events and transactions subsequent to June 30, 2017, through the date the financial statements were issued have been evaluated by the Portfolio’s management for possible adjustment and/or disclosure. No subsequent events requiring financial statement adjustment or disclosure have been identified.
| | |
| 20 | | MainStay VP Large Cap Growth Portfolio |
Proxy Voting Policies and Procedures and Proxy Voting Record
A description of the policies and procedures that New York Life Investments uses to vote proxies related to the Portfolio’s securities is available without charge, upon request, (i) by calling 800-598-2019 or (ii) by visiting the SEC’s website at www.sec.gov.
The Portfolio is required to file with the SEC its proxy voting record for the 12-month period ending June 30 on Form N-PX. The Portfolio’s most recent Form N-PX or proxy voting record is available free of charge upon request (i) by calling 800-598-2019 or; (ii) by visiting the SEC’s website at www.sec.gov.
Shareholder Reports and Quarterly Portfolio Disclosure
The Portfolio is required to file its complete schedule of portfolio holdings with the SEC for its first and third fiscal quarters on Form N-Q. The Portfolio’s Form N-Q is available without charge on the SEC’s website at www.sec.gov or by calling MainStay Investments at 800-598-2019. You also can obtain and review copies of Form N-Q by visiting the SEC’s Public Reference Room in Washington, DC (information on the operation of the Public Reference Room may be obtained by calling 1-800-SEC-0330).
This page intentionally left blank
MainStay VP Portfolios
MainStay VP offers a wide range of Portfolios. The full array of MainStay VP offerings is listed here, with information about the manager, subadvisors, legal counsel, and independent registered public accounting firm.
Equity Portfolios
MainStay VP Common Stock Portfolio
MainStay VP Cornerstone Growth Portfolio
MainStay VP Eagle Small Cap Growth Portfolio
MainStay VP Emerging Markets Equity Portfolio
MainStay VP Epoch U.S. Equity Yield Portfolio
MainStay VP Epoch U.S. Small Cap Portfolio
MainStay VP International Equity Portfolio
MainStay VP Large Cap Growth Portfolio
MainStay VP MFS® Utilities Portfolio
MainStay VP Mid Cap Core Portfolio
MainStay VP S&P 500 Index Portfolio
MainStay VP Small Cap Core Portfolio
MainStay VP T. Rowe Price Equity Income Portfolio
MainStay VP VanEck Global Hard Assets Portfolio
Mixed Asset Portfolios
MainStay VP Balanced Portfolio
MainStay VP Convertible Portfolio
MainStay VP Cushing Renaissance Advantage Portfolio
MainStay VP Income Builder Portfolio
MainStay VP Janus Henderson Balanced Portfolio
Income Portfolios
MainStay VP Bond Portfolio
MainStay VP Floating Rate Portfolio
MainStay VP Government Portfolio
MainStay VP High Yield Corporate Bond Portfolio
MainStay VP Indexed Bond Portfolio
MainStay VP PIMCO Real Return Portfolio
MainStay VP Unconstrained Bond Portfolio
Money Market
MainStay VP U.S. Government Money Market Portfolio
Alternative
MainStay VP Absolute Return Multi-Strategy Portfolio
Asset Allocation Portfolios
MainStay VP Conservative Allocation Portfolio
MainStay VP Growth Allocation Portfolio
MainStay VP Moderate Allocation Portfolio
MainStay VP Moderate Growth Allocation Portfolio
Manager
New York Life Investment Management LLC
New York, New York
Subadvisors
Candriam Belgium*
Brussels, Belgium
Candriam France S.A.S.*
Paris, France
Cornerstone Capital Management Holdings LLC*
New York, New York
Cushing Asset Management, LP
Dallas, Texas
Eagle Asset Management, Inc.
St Petersburg, Florida
Epoch Investment Partners, Inc.
New York, New York
Janus Capital Management LLC
Denver, Colorado
MacKay Shields LLC*
New York, New York
Massachusetts Financial Services Company
Boston, Massachusetts
NYL Investors LLC*
New York, New York
Pacific Investment Management Company LLC
Newport Beach, California
T. Rowe Price Associates, Inc.
Baltimore, Maryland
Van Eck Associates Corporation
New York, New York
Winslow Capital Management, LLC
Minneapolis, Minnesota
Distributor
NYLIFE Distributors LLC*
Jersey City, New Jersey
Custodian
State Street Bank and Trust Company
Boston, Massachusetts
Independent Registered Public Accounting Firm
PricewaterhouseCoopers LLP
New York, New York
Legal Counsel
Dechert LLP
Washington, District of Columbia
Some Portfolios may not be available in all products.
* An affiliate of New York Life Investment Management LLC
Not part of the Semiannual Report
2017 Semiannual Report
This report is for the general information of New York Life Variable Annuities and NYLIAC Variable Universal Life Insurance Products policyowners. It must be preceded or accompanied by the appropriate product(s) and funds prospectuses if it is given to anyone who is not an owner of a New York Life variable annuity policy or a NYLIAC Variable Universal Life Insurance Product. This report does not offer for sale or solicit orders to purchase securities.
The performance data quoted in this report represents past performance. Past performance is no guarantee of future results. Due to market volatility and other factors, current performance may be lower or higher than the figures shown. The most recent month-end performance summary for your variable annuity or variable life policy is available by calling 800-598-2019 and is updated periodically on www.newyorklife.com.
The New York Life Variable Annuities and NYLIAC Variable Universal Life Insurance Products are issued by New York Life Insurance and Annuity Corporation (a Delaware Corporation) and distributed by NYLIFE Distributors LLC (Member FINRA/SIPC).
New York Life Insurance Company
New York Life Insurance and Annuity Corporation (NYLIAC) (A Delaware Corporation)
51 Madison Avenue, Room 551
New York, NY 10010
www.newyorklife.com
Printed on recycled paper
mainstayinvestments.com
NYLIFE Distributors LLC, 30 Hudson Street, Jersey City, NJ 07302
New York Life Investment Management LLC is the investment manager to the MainStay VP Funds Trust
©2017 by NYLIFE Distributors LLC. All rights reserved.
You may obtain copies of the Prospectus and the Statement of Additional Information free of charge, upon request, by calling toll-free 800-598-2019 or writing to New York Life Insurance and Annuity Corporation, 51 Madison Avenue, New York, NY 10010.
| | | | |
| Not FDIC Insured | | No Bank Guarantee | | May Lose Value |
| | | | |
1743133 | | | | MSVPLG10-08/17 (NYLIAC) NI525 |
MainStay VP Epoch U.S. Small Cap Portfolio
Message from the President and Semiannual Report
Unaudited | June 30, 2017

Sign up for electronic delivery of your shareholder reports. For full details on electronic delivery, including who can participate and what you
can receive via eDelivery, please log on to www.newyorklife.com/vsc

This page intentionally left blank
Message from the President
The six months ended June 30, 2017, brought positive results to many stock and bond investors. The year began with many investors hoping that Republican control of the White House, the Senate and the House of Representatives could bring an end to political gridlock; and while debate has continued on a number of issues, the U.S. stock market climbed relatively steadily throughout the first half of 2017.
According to FTSE-Russell U.S. market data, stocks at all capitalization levels tended to record positive total returns during the reporting period, with large-cap stocks generally outperforming stocks of smaller-capitalization companies. Growth stocks outpaced value stocks at every capitalization level by substantial margins—from more than six percentage points for micro-caps and mid-caps to more than 10 percentage points for the largest 200 U.S. companies by market capitalization.
Most sectors of the stock market advanced during the reporting period, with energy and telecommunication services being notable exceptions. Energy stocks declined as oil prices fell despite moves by the Organization of Petroleum Exporting Countries (OPEC) intended to limit oil production by its members. Telecommunication services stocks tended to decline as competition increased and rising interest rates made dividend payouts less appealing.
In March and June of 2017, the Federal Reserve announced successive increases in the target range for the federal funds rate, ultimately bringing the federal funds target range to 1.00% to 1.25%. While short-term U.S. Treasury yields rose in response, yields for U.S. Treasury securities with maturities of five years or longer declined. As the difference between short- and long-term yields narrowed, the advantages of higher-yielding long-term bonds became increasingly apparent.
Virtually all taxable and tax-exempt bond sectors provided positive total returns during the reporting period. Mortgage-backed
securities, though providing positive total returns, faced headwinds when the Federal Reserve announced plans to begin normalizing its balance sheet by reducing reinvestment of principal payments on mortgage-backed securities.
International stock and bond markets were also strong during the reporting period. International stocks provided double-digit total returns that were surpassed by emerging-market stocks as a whole. Global investment-grade bonds provided single-digit returns; and emerging-market debt was somewhat stronger.
Even during periods of favorable market performance and generally positive returns, MainStay believes that it is important to carefully monitor your investments. Your risk tolerance may
change over time, leading you to reevaluate which MainStay VP Portfolios are most appropriate for your long-term goals. Your goals themselves may also change, leading you to pursue investments with more or less risk. The portfolio managers of MainStay VP Portfolios seek to provide results consistent with the investment objectives of their respective Portfolios, to give you a wide range of choices suitable to various investment needs.
The report that follows provides more detailed information about the specific markets, securities and investment decisions that influenced your MainStay VP Portfolio during the six months ended June 30, 2017. We invite you to review the report carefully as part of your ongoing investment evaluation and review.
Sincerely,

Stephen P. Fisher
President
The opinions expressed are as of the date of the accompanying report and are subject to change. Past performance is no guarantee of future results. There is no guarantee that any forecasts made will come to pass. This material does not constitute investment advice and is not intended as an endorsement of any specific investment.
Not all MainStay VP Portfolios and/or share classes are available under all policies.
Not part of the Semiannual Report
Table of Contents
Investors should refer to the Portfolio’s Summary Prospectus and/or Prospectus and consider the Portfolio’s investment objectives, strategies, risks, charges and expenses carefully before investing. The Summary Prospectus and/or Prospectus contain this and other information about the Portfolio. You may obtain copies of the Portfolio’s Summary Prospectus and/or the Prospectus and the Statement of Additional Information free of charge, upon request, by calling toll-free 800-598-2019, by writing to New York Life Insurance and Annuity Corporation, 51 Madison Avenue, Room 251, New York, New York 10010 or by sending an email to MainStayShareholdersServices@nylim.com. These documents are also available at mainstayinvestments.com/vpdocuments. Please read the Summary Prospectus and/or Prospectus carefully before investing. MainStay VP Funds Trust portfolios are separate account options which are purchased through a variable insurance or variable annuity contract.
Investment and Performance Comparison (Unaudited)
Performance data quoted represents past performance. Past performance is no guarantee of future results. Because of market volatility and other factors, current performance may be lower or higher than the figures shown. Investment return and principal value will fluctuate, and as a result, when shares are redeemed, they may be worth more or less than their original cost. The performance table and graph do not reflect any deduction of sales charges, mortality and expense charges, contract charges or administrative charges. Please refer to the Performance Summary appropriate for your policy. For performance information current to the most recent month-end, please call 800-598-2019 or visit www.newyorklife.com.
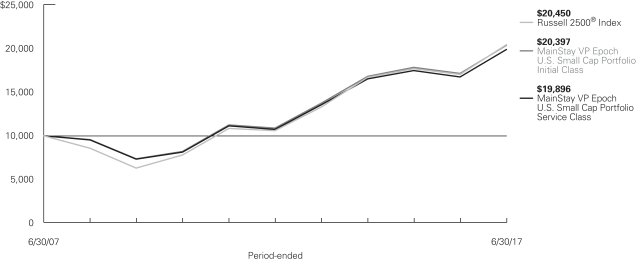
Average Annual Total Returns for the Period Ended June 30, 2017
| | | | | | | | | | | | | | | | |
| Class | | Inception
Date | | Six Months | | One Year | | Five Years | | Ten Years | | | Gross
Expense
Ratio1 | |
| Initial Class Shares | | 5/1/1998 | | 6.21% | | 18.95% | | 13.41% | | | 7.39 | % | | | 0.81 | % |
| Service Class Shares | | 6/5/2003 | | 6.08 | | 18.65 | | 13.13 | | | 7.12 | | | | 1.06 | |
| | | | | | | | | | | | | | | | |
| Benchmark Performance | | Six
Months | | | One
Year | | | Five
Years | | | Ten
Years | |
Russell 2500™ Index2 | | | 5.97 | % | | | 19.84 | % | | | 14.04 | % | | | 7.42 | % |
Average Lipper Variable Products Small-Cap Core Portfolio3 | | | 3.57 | | | | 22.33 | | | | 13.61 | | | | 6.59 | |
| 1. | The gross expense ratios presented reflect the Portfolio’s “Total Annual Portfolio Operating Expenses” from the most recent Prospectus and may differ from other expense ratios disclosed in this report. |
| 2. | The Russell 2500™ Index is the Portfolio’s primary broad-based securities market index for comparison purposes. The Russell 2500™ Index measures the performance of the small- to mid-cap segment of the U.S. equity universe, commonly referred to as “smid” cap. The Russell 2500™ Index is a subset of the Russell 3000® Index. It includes approximately 2,500 of the smallest securities based on a combination of their market cap and current index membership. Results assume reinvestment of all dividends and capital gains. An investment cannot be made directly in an index. |
| 3. | The Average Lipper Variable Products Small-Cap Core Portfolio is representative of portfolios that, by portfolio practice, invest at least 75% of their equity assets in companies with market capitalizations (on a three-year weighted basis) below Lipper’s U.S. Diversified Equity small-cap ceiling. Small-cap core portfolios have more latitude in the companies in which they invest. These portfolios typically have average characteristics compared to the S&P SmallCap 600® Index. This benchmark is a product of Lipper Inc. Lipper Inc. is an independent monitor of fund performance. Results are based on average total returns of similar portfolios with all dividend and capital gain distributions reinvested. |
Cost in Dollars of a $1,000 Investment in MainStay VP Epoch U.S. Small Cap Portfolio (Unaudited)
The example below is intended to describe the fees and expenses borne by shareholders during the six-month period from January 1, 2017 to June 30, 2017, and the impact of those costs on your investment.
Example
As a shareholder of the Portfolio, you incur two types of costs: (1) transaction costs, including exchange fees and sales charges (loads) on purchases (as applicable), and (2) ongoing costs, including management fees, distribution and/or service (12b-1) fees, and other Portfolio expenses (as applicable). This example is intended to help you understand your ongoing costs (in dollars) of investing in the Portfolio and to compare these costs with the ongoing costs of investing in other mutual funds. The example is based on an investment of $1,000 made at the beginning of the six-month period and held for the entire period from January 1, 2017 to June 30, 2017.
This example illustrates your Portfolio’s ongoing costs in two ways:
Actual Expenses
The second and third data columns in the table below provide information about actual account values and actual expenses. You may use the information in these columns, together with the amount you invested, to estimate the expenses that you paid during the six months ended June 30, 2017. Simply divide your account value by $1,000 (for example, an $8,600 account value divided by $1,000 = 8.6), then
multiply the result by the number under the heading entitled “Expenses Paid During Period” to estimate the expenses you paid on your account during this period.
Hypothetical Example for Comparison Purposes
The fourth and fifth data columns in the table below provide information about hypothetical account values and hypothetical expenses based on the Portfolio’s actual expense ratio and an assumed rate of return of 5% per year before expenses, which is not the Portfolio’s actual return. The hypothetical account values and expenses may not be used to estimate the actual ending account balances or expenses you paid for the six-month period shown. You may use this information to compare the ongoing costs of investing in the Portfolio with the ongoing costs of investing in other mutual funds. To do so, compare this 5% hypothetical example with the 5% hypothetical examples that appear in the shareholder reports of the other mutual funds.
Please note that the expenses shown in the table are meant to highlight your ongoing costs only and do not reflect any transactional costs, such as exchange fees or sales charges (loads). Therefore, the fourth and fifth data columns of the table are useful in comparing ongoing costs only and will not help you determine the relative total costs of owning different funds. In addition, if these transactional costs were included, your costs would have been higher.
| | | | | | | | | | | | | | | | | | | | | | | | |
| | | | | | | | | | | | | | | | | | | |
| Share Class | | Beginning
Account
Value
1/1/17 | | | Ending Account
Value (Based
on Actual
Returns and
Expenses)
6/30/17 | | | Expenses
Paid
During
Period1 | | | Ending Account
Value (Based
on Hypothetical
5% Annualized
Return and
Actual Expenses)
6/30/17 | | | Expenses
Paid
During
Period1 | | | Net Expense
Ratio
During
Period2 | |
| | | | | | |
| Initial Class Shares | | $ | 1,000.00 | | | $ | 1,062.10 | | | $ | 4.14 | | | $ | 1,020.80 | | | $ | 4.06 | | | | 0.81 | % |
| | | | | | |
| Service Class Shares | | $ | 1,000.00 | | | $ | 1,060.80 | | | $ | 5.42 | | | $ | 1,019.50 | | | $ | 5.31 | | | | 1.06 | % |
| 1. | Expenses are equal to the Portfolio’s annualized expense ratio of each class multiplied by the average account value over the period, divided by 365 and multiplied by 181 (to reflect the six-month period). The table above represents the actual expenses incurred during the six-month period. |
| 2. | Expenses are equal to the Portfolio’s annualized expense ratio to reflect the six-month period. |
| | |
| 6 | | MainStay VP Epoch U.S. Small Cap Portfolio |
Industry Composition as of June 30, 2017 (Unaudited)
| | | | |
| Banks | | | 11.6 | % |
| Electronic Equipment, Instruments & Components | | | 5.7 | |
| Machinery | | | 5.1 | |
| Health Care Providers & Services | | | 4.9 | |
| Capital Markets | | | 4.6 | |
| Equity Real Estate Investment Trusts (REITs) | | | 4.4 | |
| Textiles, Apparel & Luxury Goods | | | 4.2 | |
| Food Products | | | 4.0 | |
| Hotels, Restaurants & Leisure | | | 4.0 | |
| Building Products | | | 3.3 | |
| Communications Equipment | | | 3.0 | |
| Insurance | | | 3.0 | |
| Road & Rail | | | 2.9 | |
| Real Estate Management & Development | | | 2.8 | |
| Software | | | 2.8 | |
| Commercial Services & Supplies | | | 2.6 | |
| Energy Equipment & Services | | | 2.6 | |
| IT Services | | | 2.6 | |
| | | | |
| Multi-Utilities | | | 2.5 | % |
| Aerospace & Defense | | | 2.1 | |
| Metals & Mining | | | 2.1 | |
| Life Sciences Tools & Services | | | 2.0 | |
| Leisure Products | | | 1.7 | |
| Auto Components | | | 1.6 | |
| Diversified Consumer Services | | | 1.6 | |
| Household Durables | | | 1.6 | |
| Construction Materials | | | 1.5 | |
| Semiconductors & Semiconductor Equipment | | | 1.5 | |
| Specialty Retail | | | 1.5 | |
| Health Care Equipment & Supplies | | | 1.3 | |
| Internet Software & Services | | | 1.3 | |
| Chemicals | | | 1.2 | |
| Media | | | 1.2 | |
| Short-Term Investment | | | 1.1 | |
| Other Assets, Less Liabilities | | | 0.1 | |
| | | | |
| | | 100.0 | % |
| | | | |
See Portfolio of Investments beginning on page 10 for specific holdings within these categories.
Top Ten Holdings or Issuers as of June 30, 2017 (excluding short-term investment) (Unaudited)
| 1. | Universal Display Corp. |
| 2. | Bank of The Ozarks, Inc. |
| 7. | Bio-Rad Laboratories, Inc. Class A |
| 10. | NetScout Systems, Inc. |
Portfolio Management Discussion and Analysis (Unaudited)
Answers to the questions reflect the views of portfolio managers David Pearl, Michael Welhoelter and Michael J. Caputo of Epoch Investment Partners, Inc., the Portfolio’s Subadvisor.
How did MainStay VP Epoch U.S. Small Cap Portfolio perform relative to its benchmark and peers for the six months ended June 30, 2017?
For the six months ended June 30, 2017, MainStay VP Epoch U.S. Small Cap Portfolio returned 6.21% for Initial Class shares and 6.08% for Service Class shares. Over the same period, both share classes outperformed the 5.97% return of the Russell 2500™ Index,1 which is the Portfolio’s benchmark, and the 3.57% return of the Average Lipper2 Variable Products Small-Cap Core Portfolio.
What factors affected the Portfolio’s relative performance during the reporting period?
The Portfolio’s performance relative to the Russell 2500™ Index benefited from stock selection in the consumer discretionary and information technology sectors and from having a less-than-benchmark weight in the energy sector. The Portfolio’s relative performance was hindered by stock selection in the financials and industrials sectors.
Which sectors were the strongest positive contributors to the Portfolio’s relative performance, and which sectors were particularly weak?
The strongest contributions to performance relative to the Russell 2500™ Index came from the energy, consumer discretionary and information technology sectors. (Contributions take weightings and total returns into account.) The Portfolio had minimal exposure to the energy sector, which was the Portfolio’s weakest sector during the reporting period; and this positioning helped relative performance, as did stock selection in that sector. In the consumer discretionary and information technology sectors, stock selection was the primary driver of strong relative performance. The industrials and materials sectors were the most substantial detractors from the Portfolio’s relative performance because of stock selection. The consumer staples sector was also a mild detractor.
During the reporting period, which individual stocks made the strongest positive contributions to the Portfolio’s absolute performance and which stocks detracted the most?
During the reporting period, electronic equipment, instruments & components company Universal Display; household durables company NVR; and health care providers & services company Air Methods made the strongest positive contributions to the Portfolio’s absolute performance.
Shares of Universal Display surged after the company reported revenue growth and earnings that exceeded consensus expectations. The increase in revenue was primarily driven by higher
royalty and license fees on the company’s organic light emitting diode (OLED) technology. Universal Display is the exclusive patent holder for this technology, which will be used in the next generation of screens for smart phones. Shares of homebuilder NVR steadily rose on strong results. Air Methods, which provides air medical-emergency transport services, saw its stock rise after the company agreed to be purchased by American Securities, a private equity firm. We sold the position following the announcement.
During the reporting period, energy equipment & services company Oil States International and specialty retailers Sally Beauty Holdings and Advance Auto Parts were the most substantial detractors from absolute performance.
Oil States International declined along with the slump in the energy sector. Sally Beauty Holdings reported fiscal first-quarter revenue that was below expectations. In addition, the company lowered its forecast for full-year same-store sales. In January, the company approved a comprehensive restructuring plan that included a wide range of organizational efficiency initiatives and cost-reduction efforts. While the company incurred aggregate charges of approximately $12 million to $14 million in the second quarter of 2017, it expects pretax benefits in the range of $17 million to $19 million annually going forward, which should enhance profitability and cash flow. Shares of Advance Auto Parts declined after the company reported lower-than-expected revenue and quarterly profits. Management announced that it expects $750 million in gross productivity savings over the next four years, up from $500 million over a five-year period. Despite short-term difficulties, we believe that the company is positioned to benefit as the purchase of General Parts is digested and as Advance Auto Parts pursues additional operating efficiencies. We also believe that the company’s productivity program should help close the profitability gap with its peer group.
Did the Portfolio make any significant purchases or sales during the reporting period?
The Portfolio purchased shares of Coherent, which sells lasers and laser systems used in displays, microelectronics, inspection and test equipment, semiconductor manufacturing, and other industries. The company is the main supplier of systems for laser annealing of liquid crystal display (LCD) and organic light emitting diode (OLED) based displays. OLED penetration is increasing in handsets because of better price and performance. We expect OLED penetration in smartphones to increase from roughly 20% in mid-2017 to more than 70% in 2020. We believe that this OLED capacity expansion should benefit Coherent’s sales of laser annealing systems at a high gross margin. In addition, each system generates a replacement stream of parts
| 1. | See footnote on page 5 for more information on the Russell 2500™ Index. |
| 2. | See footnote on page 5 for more information on Lipper Inc. |
| | |
| 8 | | MainStay VP Epoch U.S. Small Cap Portfolio |
also at high gross margins that we believe should further benefit Coherent.
The Portfolio also purchased shares of LCI Industries, the largest domestic supplier of parts to the recreational vehicle (RV) and manufactured housing markets. Approximately 90% of the company’s net sales are to the RV segment, while manufactured housing sales represent the remaining 10%. Approximately 90% of the company’s revenue has come from North America, although recent acquisitions will likely expand the company’s European revenue base. The company has leveraged its size to fund research and development (R&D) in an effort to stay at the forefront of RV technology and continue to capture market share from smaller competitors. LCI approximately doubled its average content per towable RV over the last 10 years and tripled its average content per motor home. We expect continued R&D leverage and market share gains will enable LCI to outpace industry RV shipment growth. Although the company’s primary focus is on domestic RVs, the international market for RV components is significant. We believe that LCI will continue to use its free cash flow to make acquisitions, develop new products, improve manufacturing efficiency and return capital to shareholders.
The Portfolio’s most substantial sale during the reporting period was Air Methods, discussed previously. Other significant sales
during the reporting period included building products company Armstrong World Industries and restaurant company Darden Restaurants, each of which was sold as the shares appreciated and reached our price target.
How did the Portfolio’s sector weightings change during the reporting period?
The Portfolio’s sector weightings did not change meaningfully during the reporting period. The most substantial increases were in the information technology and real estate sectors. The most substantial decreases in sector weightings were in industrials and telecommunications services. The largest of these sector-weighting changes was slightly over two percentage points.
How was the Portfolio positioned at the end of the reporting period?
As of June 30, 2017, the only meaningfully overweight sectors in the Portfolio relative to the Russell 2500™ Index were consumer discretionary and financials. As of the same date, the only meaningfully underweight sectors in the Portfolio were health care and real estate. Sector weights are the result of individual stock selection.
The opinions expressed are those of the portfolio managers as of the date of this report and are subject to change. There is no guarantee that any forecasts made will come to pass. This material does not constitute investment advice and is not intended as an endorsement of any specific investment.
Not all MainStay VP Portfolios and/or share classes are available under all policies.
Portfolio of Investments June 30, 2017 (Unaudited)
| | | | | | | | |
| | |
| | | Shares | | | Value | |
| Common Stocks 98.8%† | |
Aerospace & Defense 2.1% | |
¨Hexcel Corp. | | | 198,215 | | | $ | 10,463,770 | |
| | | | | | | | |
|
Auto Components 1.6% | |
LCI Industries | | | 79,920 | | | | 8,183,808 | |
| | | | | | | | |
|
Banks 11.6% | |
Bank of Hawaii Corp. | | | 110,860 | | | | 9,198,054 | |
¨Bank of The Ozarks, Inc. | | | 252,903 | | | | 11,853,564 | |
¨BankUnited, Inc. | | | 326,979 | | | | 11,022,462 | |
CVB Financial Corp. | | | 104,175 | | | | 2,336,645 | |
Eagle Bancorp, Inc. (a) | | | 40,736 | | | | 2,578,589 | |
Glacier Bancorp, Inc. | | | 73,308 | | | | 2,683,806 | |
LegacyTexas Financial Group, Inc. | | | 61,423 | | | | 2,342,059 | |
Texas Capital Bancshares, Inc. (a) | | | 113,748 | | | | 8,804,095 | |
Western Alliance Bancorp (a) | | | 161,480 | | | | 7,944,816 | |
| | | | | | | | |
| | | | 58,764,090 | |
| | | | | | | | |
Building Products 3.3% | |
Armstrong Flooring, Inc. (a) | | | 249,083 | | | | 4,476,022 | |
Insteel Industries, Inc. | | | 133,833 | | | | 4,412,474 | |
JELD-WEN Holding, Inc. (a) | | | 246,611 | | | | 8,004,993 | |
| | | | | | | | |
| | | | 16,893,489 | |
| | | | | | | | |
Capital Markets 4.6% | |
Artisan Partners Asset Management, Inc. Class A | | | 85,406 | | | | 2,621,964 | |
Diamond Hill Investment Group, Inc. | | | 33,852 | | | | 6,750,089 | |
FactSet Research Systems, Inc. | | | 26,361 | | | | 4,380,671 | |
Morningstar, Inc. | | | 74,518 | | | | 5,837,740 | |
Pzena Investment Management, Inc. Class A | | | 376,792 | | | | 3,828,207 | |
| | | | | | | | |
| | | | 23,418,671 | |
| | | | | | | | |
Chemicals 1.2% | |
Valvoline, Inc. | | | 248,895 | | | | 5,903,789 | |
| | | | | | | | |
|
Commercial Services & Supplies 2.6% | |
KAR Auction Services, Inc. | | | 174,181 | | | | 7,310,377 | |
US Ecology, Inc. | | | 118,066 | | | | 5,962,333 | |
| | | | | | | | |
| | | | 13,272,710 | |
| | | | | | | | |
Communications Equipment 3.0% | |
Harmonic, Inc. (a) | | | 1,061,275 | | | | 5,571,694 | |
¨NetScout Systems, Inc. (a) | | | 280,120 | | | | 9,636,128 | |
| | | | | | | | |
| | | | 15,207,822 | |
| | | | | | | | |
Construction Materials 1.5% | |
Summit Materials, Inc. Class A (a) | | | 260,883 | | | | 7,531,692 | |
| | | | | | | | |
|
Diversified Consumer Services 1.6% | |
Service Corp. International | | | 236,478 | | | | 7,910,189 | |
| | | | | | | | |
| | | | | | | | |
| | |
| | | Shares | | | Value | |
Electronic Equipment, Instruments & Components 5.7% | |
Coherent, Inc. (a) | | | 39,384 | | | $ | 8,861,006 | |
¨Universal Display Corp. | | | 136,085 | | | | 14,867,286 | |
VeriFone Systems, Inc. (a) | | | 282,697 | | | | 5,116,816 | |
| | | | | | | | |
| | | | 28,845,108 | |
| | | | | | | | |
Energy Equipment & Services 2.6% | |
Core Laboratories N.V. | | | 36,039 | | | | 3,649,669 | |
Dril-Quip, Inc. (a) | | | 28,292 | | | | 1,380,650 | |
Newpark Resources, Inc. (a) | | | 483,491 | | | | 3,553,659 | |
Oil States International, Inc. (a) | | | 165,743 | | | | 4,499,922 | |
| | | | | | | | |
| | | | 13,083,900 | |
| | | | | | | | |
Equity Real Estate Investment Trusts (REITs) 4.4% | |
CubeSmart | | | 287,638 | | | | 6,914,818 | |
GEO Group, Inc. | | | 194,227 | | | | 5,743,292 | |
Kite Realty Group Trust | | | 226,558 | | | | 4,288,743 | |
Physicians Realty Trust | | | 254,646 | | | | 5,128,570 | |
| | | | | | | | |
| | | | 22,075,423 | |
| | | | | | | | |
Food Products 4.0% | |
B&G Foods, Inc. | | | 162,739 | | | | 5,793,508 | |
Fresh Del Monte Produce, Inc. | | | 81,088 | | | | 4,128,190 | |
¨TreeHouse Foods, Inc. (a) | | | 129,233 | | | | 10,557,044 | |
| | | | | | | | |
| | | | 20,478,742 | |
| | | | | | | | |
Health Care Equipment & Supplies 1.3% | |
Natus Medical, Inc. (a) | | | 181,692 | | | | 6,777,112 | |
| | | | | | | | |
|
Health Care Providers & Services 4.9% | |
HealthSouth Corp. | | | 174,649 | | | | 8,453,012 | |
Molina Healthcare, Inc. (a) | | | 73,940 | | | | 5,115,169 | |
Patterson Cos., Inc. | | | 158,682 | | | | 7,450,120 | |
Universal Health Services, Inc. Class B | | | 32,700 | | | | 3,992,016 | |
| | | | | | | | |
| | | | 25,010,317 | |
| | | | | | | | |
Hotels, Restaurants & Leisure 4.0% | |
Cedar Fair, L.P. | | | 126,136 | | | | 9,094,405 | |
Cheesecake Factory, Inc. | | | 48,942 | | | | 2,461,783 | |
Eldorado Resorts, Inc. (a) | | | 125,321 | | | | 2,506,420 | |
Red Rock Resorts, Inc. Class A | | | 260,831 | | | | 6,142,570 | |
| | | | | | | | |
| | | | 20,205,178 | |
| | | | | | | | |
Household Durables 1.6% | |
NVR, Inc. (a) | | | 3,269 | | | | 7,880,284 | |
| | | | | | | | |
|
Insurance 3.0% | |
¨Markel Corp. (a) | | | 11,512 | | | | 11,234,100 | |
ProAssurance Corp. | | | 66,686 | | | | 4,054,509 | |
| | | | | | | | |
| | | | 15,288,609 | |
| | | | | | | | |
Internet Software & Services 1.3% | |
Criteo S.A., Sponsored ADR (a) | | | 138,235 | | | | 6,780,427 | |
| | | | | | | | |
| † | Percentages indicated are based on Portfolio net assets. |
| ¨ | | Among the Portfolio’s 10 largest holdings, as of June 30, 2017, excluding short-term investment. May be subject to change daily. |
| | | | |
| 10 | | MainStay VP Epoch U.S. Small Cap Portfolio | | The notes to the financial statements are an integral part of,
and should be read in conjunction with, the financial statements. |
| | | | | | | | |
| | |
| | | Shares | | | Value | |
| Common Stocks (continued) | | | | | | | | |
IT Services 2.6% | |
CSRA, Inc. | | | 238,384 | | | $ | 7,568,692 | |
Sabre Corp. | | | 252,309 | | | | 5,492,767 | |
| | | | | | | | |
| | | | 13,061,459 | |
| | | | | | | | |
Leisure Products 1.7% | |
Brunswick Corp. | | | 141,087 | | | | 8,850,387 | |
| | | | | | | | |
|
Life Sciences Tools & Services 2.0% | |
¨Bio-Rad Laboratories, Inc., Class A (a) | | | 45,425 | | | | 10,280,132 | |
| | | | | | | | |
|
Machinery 5.1% | |
John Bean Technologies Corp. | | | 71,891 | | | | 7,045,318 | |
Mueller Industries, Inc. | | | 122,195 | | | | 3,720,838 | |
Welbilt, Inc. (a) | | | 282,305 | | | | 5,321,449 | |
¨Woodward, Inc. | | | 143,031 | | | | 9,666,035 | |
| | | | | | | | |
| | | | 25,753,640 | |
| | | | | | | | |
Media 1.2% | |
Live Nation Entertainment, Inc. (a) | | | 169,103 | | | | 5,893,239 | |
| | | | | | | | |
|
Metals & Mining 2.1% | |
Compass Minerals International, Inc. | | | 101,348 | | | | 6,618,024 | |
Reliance Steel & Aluminum Co. | | | 56,726 | | | | 4,130,220 | |
| | | | | | | | |
| | | | 10,748,244 | |
| | | | | | | | |
Multi-Utilities 2.5% | |
Black Hills Corp. | | | 123,134 | | | | 8,307,851 | |
NorthWestern Corp. | | | 72,032 | | | | 4,395,393 | |
| | | | | | | | |
| | | | 12,703,244 | |
| | | | | | | | |
Real Estate Management & Development 2.8% | |
Howard Hughes Corp. (a) | | | 45,384 | | | | 5,574,971 | |
Jones Lang LaSalle, Inc. | | | 68,329 | | | | 8,541,125 | |
| | | | | | | | |
| | | | 14,116,096 | |
| | | | | | | | |
Road & Rail 2.9% | |
AMERCO | | | 12,178 | | | | 4,457,879 | |
Genesee & Wyoming, Inc. Class A (a) | | | 79,586 | | | | 5,442,886 | |
Werner Enterprises, Inc. | | | 154,480 | | | | 4,533,988 | |
| | | | | | | | |
| | | | 14,434,753 | |
| | | | | | | | |
Semiconductors & Semiconductor Equipment 1.5% | |
Cypress Semiconductor Corp. | | | 553,537 | | | | 7,555,780 | |
| | | | | | | | |
|
Software 2.8% | |
¨PTC, Inc. (a) | | | 183,151 | | | | 10,095,283 | |
TiVo Corp. | | | 232,564 | | | | 4,337,319 | |
| | | | | | | | |
| | | | 14,432,602 | |
| | | | | | | | |
| | | | | | | | |
| | |
| | | Shares | | | Value | |
Specialty Retail 1.5% | |
Advance Auto Parts, Inc. | | | 26,361 | | | $ | 3,073,429 | |
Sally Beauty Holdings, Inc. (a) | | | 222,837 | | | | 4,512,449 | |
| | | | | | | | |
| | | | 7,585,878 | |
| | | | | | | | |
Textiles, Apparel & Luxury Goods 4.2% | |
Carter’s, Inc. | | | 78,272 | | | | 6,962,294 | |
Oxford Industries, Inc. | | | 68,887 | | | | 4,304,749 | |
PVH Corp. | | | 39,876 | | | | 4,565,802 | |
Steven Madden, Ltd. (a) | | | 137,127 | | | | 5,478,224 | |
| | | | | | | | |
| | | | 21,311,069 | |
| | | | | | | | |
Total Common Stocks
(Cost $436,802,959) | | | | 500,701,653 | |
| | | | | | | | |
| | |
| | | | | | | | |
| | | Principal
Amount | | | | |
| Short-Term Investment 1.1% | | | | | |
Repurchase Agreement 1.1% | | | | | | | | |
Fixed Income Clearing Corp.
0.12%, dated 6/30/17
due 7/3/17
Proceeds at Maturity $5,618,546 (Collateralized by a United States Treasury Note with a rate of 2.00% and a maturity date of 8/31/21, with a Principal Amount of $5,640,000 and a Market Value of $5,734,504) | | $ | 5,618,490 | | | | 5,618,490 | |
| | | | | | | | |
Total Short-Term Investment
(Cost $5,618,490) | | | | 5,618,490 | |
| | | | | | | | |
Total Investments
(Cost $442,421,449) (b) | | | 99.9 | % | | | 506,320,143 | |
Other Assets, Less Liabilities | | | 0.1 | | | | 662,545 | |
Net Assets | | | 100.0 | % | | $ | 506,982,688 | |
| (a) | Non-income producing security. |
| (b) | As of June 30, 2017, cost was $443,328,796 for federal income tax purposes and net unrealized appreciation was as follows: |
| | | | |
Gross unrealized appreciation | | $ | 74,213,901 | |
Gross unrealized depreciation | | | (11,222,554 | ) |
| | | | |
Net unrealized appreciation | | $ | 62,991,347 | |
| | | | |
The following abbreviation is used in the preceding pages:
ADR — American Depositary Receipt
| | | | | | |
The notes to the financial statements are an integral part of,
and should be read in conjunction with, the financial statements. | | | | | 11 | |
Portfolio of Investments June 30, 2017 (Unaudited) (continued)
The following is a summary of the fair valuations according to the inputs used as of June 30, 2017, for valuing the Portfolio’s assets.
Asset Valuation Inputs
| | | | | | | | | | | | | | | | |
Description | | Quoted
Prices in
Active
Markets for
Identical
Assets (Level 1) | | | Significant
Other
Observable
Inputs (Level 2) | | | Significant
Unobservable
Inputs (Level 3) | | | Total | |
| Investments in Securities (a) | | | | | | | | | | | | | | | | |
| Common Stocks | | $ | 500,701,653 | | | $ | — | | | $ | — | | | $ | 500,701,653 | |
| Short-Term Investment | | | | | | | | | | | | | | | | |
Repurchase Agreement | | | — | | | | 5,618,490 | | | | — | | | | 5,618,490 | |
| | | | | | | | | | | | | | | | |
| Total Investments in Securities | | $ | 500,701,653 | | | $ | 5,618,490 | | | $ | — | | | $ | 506,320,143 | |
| | | | | | | | | | | | | | | | |
| (a) | For a complete listing of investments and their industries, see the Portfolio of Investments. |
The Portfolio recognizes transfers between the levels as of the beginning of the period.
For the period ended June 30, 2017, the Portfolio did not have any transfers among levels. (See Note 2)
As of June 30, 2017, the Portfolio did not hold any investments with significant unobservable inputs (Level 3). (See Note 2)
| | | | |
| 12 | | MainStay VP Epoch U.S. Small Cap Portfolio | | The notes to the financial statements are an integral part of,
and should be read in conjunction with, the financial statements. |
Statement of Assets and Liabilities as of June 30, 2017 (Unaudited)
| | | | |
| Assets | |
Investment in securities, at value
(identified cost $442,421,449) | | $ | 506,320,143 | |
Receivables: | | | | |
Investment securities sold | | | 698,062 | |
Dividends and interest | | | 427,373 | |
Fund shares sold | | | 103,549 | |
Other assets | | | 2,816 | |
| | | | |
Total assets | | | 507,551,943 | |
| | | | |
|
| Liabilities | |
Payables: | | | | |
Manager (See Note 3) | | | 320,877 | |
Fund shares redeemed | | | 126,153 | |
Shareholder communication | | | 46,224 | |
NYLIFE Distributors (See Note 3) | | | 43,343 | |
Professional fees | | | 24,356 | |
Custodian | | | 2,685 | |
Trustees | | | 894 | |
Accrued expenses | | | 4,723 | |
| | | | |
Total liabilities | | | 569,255 | |
| | | | |
Net assets | | $ | 506,982,688 | |
| | | | |
|
| Net Assets Consist of | |
Shares of beneficial interest outstanding (par value of $.001 per share) unlimited number of shares authorized | | $ | 38,135 | |
Additional paid-in capital | | | 378,897,832 | |
| | | | |
| | | 378,935,967 | |
Undistributed net investment income | | | 4,159,382 | |
Accumulated net realized gain (loss) on investments | | | 59,988,645 | |
Net unrealized appreciation (depreciation) on investments | | | 63,898,694 | |
| | | | |
Net assets | | $ | 506,982,688 | |
| | | | |
| | | | |
Initial Class | | | | |
Net assets applicable to outstanding shares | | $ | 295,848,835 | |
| | | | |
Shares of beneficial interest outstanding | | | 21,912,870 | |
| | | | |
Net asset value per share outstanding | | $ | 13.50 | |
| | | | |
Service Class | | | | |
Net assets applicable to outstanding shares | | $ | 211,133,853 | |
| | | | |
Shares of beneficial interest outstanding | | | 16,222,411 | |
| | | | |
Net asset value per share outstanding | | $ | 13.01 | |
| | | | |
| | | | | | |
The notes to the financial statements are an integral part of,
and should be read in conjunction with, the financial statements. | | | | | 13 | |
Statement of Operations for the six months ended June 30, 2017 (Unaudited)
| | | | |
| Investment Income (Loss) | |
Income | | | | |
Dividends (a) | | $ | 2,135,384 | |
Interest | | | 4,402 | |
| | | | |
Total income | | | 2,139,786 | |
| | | | |
Expenses | | | | |
Manager (See Note 3) | | | 1,915,252 | |
Distribution/Service—Service Class (See Note 3) | | | 255,641 | |
Shareholder communication | | | 38,612 | |
Professional fees | | | 34,599 | |
Custodian | | | 7,274 | |
Trustees | | | 6,353 | |
Miscellaneous | | | 11,200 | |
| | | | |
Total expenses | | | 2,268,931 | |
| | | | |
Net investment income (loss) | | | (129,145 | ) |
| | | | |
|
| Realized and Unrealized Gain (Loss) on Investments | |
| |
Net realized gain (loss) on investments | | | 15,549,765 | |
Net change in unrealized appreciation (depreciation) on investments | | | 14,567,965 | |
| | | | |
Net realized and unrealized gain (loss) on investments | | | 30,117,730 | |
| | | | |
Net increase (decrease) in net assets resulting from operations | | $ | 29,988,585 | |
| | | | |
| (a) | Dividends recorded net of foreign withholding taxes in the amount of $6,309. |
| | | | |
| 14 | | MainStay VP Epoch U.S. Small Cap Portfolio | | The notes to the financial statements are an integral part of,
and should be read in conjunction with, the financial statements. |
Statements of Changes in Net Assets
for the six months ended June 30, 2017 (Unaudited) and the year ended December 31, 2016
| | | | | | | | |
| | | 2017 | | | 2016 | |
| Increase (Decrease) in Net Assets | |
Operations: | | | | | | | | |
Net investment income (loss) | | $ | (129,145 | ) | | $ | 3,629,376 | |
Net realized gain (loss) on investments | | | 15,549,765 | | | | 44,697,350 | |
Net change in unrealized appreciation (depreciation) on investments | | | 14,567,965 | | | | 31,036,947 | |
| | | | |
Net increase (decrease) in net assets resulting from operations | | | 29,988,585 | | | | 79,363,673 | |
| | | | |
Dividends and distributions to shareholders: | | | | | | | | |
From net investment income: | | | | | | | | |
Initial Class | | | — | | | | (1,335,425 | ) |
Service Class | | | — | | | | (357,424 | ) |
| | | | |
| | | — | | | | (1,692,849 | ) |
| | | | |
From net realized gain on investments: | | | | | | | | |
Initial Class | | | — | | | | (14,354,673 | ) |
Service Class | | | — | | | | (9,131,749 | ) |
| | | | |
| | | — | | | | (23,486,422 | ) |
| | | | |
Total dividends and distributions to shareholders | | | — | | | | (25,179,271 | ) |
| | | | |
Capital share transactions: | | | | | | | | |
Net proceeds from sale of shares | | | 23,658,710 | | | | 68,743,450 | |
Net asset value of shares issued to shareholders in reinvestment of dividends and distributions | | | — | | | | 25,179,271 | |
Cost of shares redeemed | | | (41,399,947 | ) | | | (120,229,987 | ) |
| | | | |
Increase (decrease) in net assets derived from capital share transactions | | | (17,741,237 | ) | | | (26,307,266 | ) |
| | | | |
Net increase (decrease) in net assets | | | 12,247,348 | | | | 27,877,136 | |
|
| Net Assets | |
Beginning of period | | | 494,735,340 | | | | 466,858,204 | |
| | | | |
End of period | | $ | 506,982,688 | | | $ | 494,735,340 | |
| | | | |
Undistributed net investment income at end of period | | $ | 4,159,382 | | | $ | 4,288,527 | |
| | | | |
| | | | | | |
The notes to the financial statements are an integral part of,
and should be read in conjunction with, the financial statements. | | | | | 15 | |
Financial Highlights selected per share data and ratios
| | | | | | | | | | | | | | | | | | | | | | | | | | | | |
| | | Six months
ended
June 30, | | | | | | Year ended December 31, | |
| Initial Class | | 2017* | | | | | | 2016 | | | 2015 | | | 2014 | | | 2013 | | | 2012 | |
Net asset value at beginning of period | | $ | 12.71 | | | | | | | $ | 11.53 | | | $ | 13.52 | | | $ | 13.78 | | | $ | 10.06 | | | $ | 8.96 | |
| | | | | | | | | | | | | | | | | | | | | | | | | | | | |
Net investment income (loss) (a) | | | 0.00 | | | | | | | | 0.10 | | | | 0.08 | | | | 0.09 | | | | 0.05 | | | | 0.09 | |
Net realized and unrealized gain (loss) on investments | | | 0.79 | | | | | | | | 1.72 | | | | (0.58 | ) | | | 0.72 | | | | 3.76 | | | | 1.05 | |
| | | | | | | | | | | | | | | | | | | | | | | | | | | | |
Total from investment operations | | | 0.79 | | | | | | | | 1.82 | | | | (0.50 | ) | | | 0.81 | | | | 3.81 | | | | 1.14 | |
| | | | | | | | | | | | | | | | | | | | | | | | | | | | |
| Less dividends and distributions: | | | | | | | | | | | | | | | | | | | | | | | | | | | | |
From net investment income | | | — | | | | | | | | (0.05 | ) | | | (0.07 | ) | | | (0.04 | ) | | | (0.09 | ) | | | (0.04 | ) |
From net realized gain on investments | | | — | | | | | | | | (0.59 | ) | | | (1.42 | ) | | | (1.03 | ) | | | — | | | | — | |
| | | | | | | | | | | | | | | | | | | | | | | | | | | | |
Total dividends and distributions | | | — | | | | | | | | (0.64 | ) | | | (1.49 | ) | | | (1.07 | ) | | | (0.09 | ) | | | (0.04 | ) |
| | | | | | | | | | | | | | | | | | | | | | | | | | | | |
Net asset value at end of period | | $ | 13.50 | | | | | | | $ | 12.71 | | | $ | 11.53 | | | $ | 13.52 | | | $ | 13.78 | | | $ | 10.06 | |
| | | | | | | | | | | | | | | | | | | | | | | | | | | | |
Total investment return (b) | | | 6.22 | %(c) | | | | | | | 16.17 | % | | | (3.86 | %) | | | 6.59 | % | | | 37.90 | % | | | 12.80 | % |
| Ratios (to average net assets)/Supplemental Data: | | | | | | | | | | | | | | | | | | | | | | | | | | | | |
Net investment income (loss) | | | 0.06 | %†† | | | | | | | 0.82 | % | | | 0.63 | % | | | 0.68 | % | | | 0.39 | % | | | 0.98 | % |
Net expenses | | | 0.81 | %†† | | | | | | | 0.81 | % | | | 0.81 | % | | | 0.82 | % | | | 0.82 | % | | | 0.83 | % |
Portfolio turnover rate | | | 23 | % | | | | | | | 78 | % | | | 41 | % | | | 42 | % | | | 40 | % | | | 32 | % |
Net assets at end of period (in 000’s) | | $ | 295,849 | | | | | | | $ | 295,531 | | | $ | 282,077 | | | $ | 204,562 | | | $ | 232,795 | | | $ | 128,576 | |
| (a) | Per share data based on average shares outstanding during the period. |
| (b) | Total return does not reflect any deduction of sales charges, mortality and expense charges, contract charges or administrative charges. For periods of less than one year, total return is not annualized. |
| (c) | Total investment return may reflect adjustments to conform to generally accepted accounting principles. |
| | | | | | | | | | | | | | | | | | | | | | | | | | | | |
| | | Six months
ended
June 30, | | | | | | Year ended December 31, | |
| Service Class | | 2017* | | | | | | 2016 | | | 2015 | | | 2014 | | | 2013 | | | 2012 | |
Net asset value at beginning of period | | $ | 12.27 | | | | | | | $ | 11.15 | | | $ | 13.12 | | | $ | 13.41 | | | $ | 9.80 | | | $ | 8.73 | |
| | | | | | | | | | | | | | | | | | | | | | | | | | | | |
Net investment income (loss) (a) | | | (0.01 | ) | | | | | | | 0.07 | | | | 0.04 | | | | 0.06 | | | | 0.01 | | | | 0.06 | |
Net realized and unrealized gain (loss) on investments | | | 0.75 | | | | | | | | 1.66 | | | | (0.55 | ) | | | 0.70 | | | | 3.67 | | | | 1.03 | |
| | | | | | | | | | | | | | | | | | | | | | | | | | | | |
Total from investment operations | | | 0.74 | | | | | | | | 1.73 | | | | (0.51 | ) | | | 0.76 | | | | 3.68 | | | | 1.09 | |
| | | | | | | | | | | | | | | | | | | | | | | | | | | | |
| Less dividends and distributions: | | | | | | | | | | | | | | | | | | | | | | | | | | | | |
From net investment income | | | — | | | | | | | | (0.02 | ) | | | (0.04 | ) | | | (0.02 | ) | | | (0.07 | ) | | | (0.02 | ) |
From net realized gain on investments | | | — | | | | | | | | (0.59 | ) | | | (1.42 | ) | | | (1.03 | ) | | | — | | | | — | |
| | | | | | | | | | | | | | | | | | | | | | | | | | | | |
Total dividends and distributions | | | — | | | | | | | | (0.61 | ) | | | (1.46 | ) | | | (1.05 | ) | | | (0.07 | ) | | | (0.02 | ) |
| | | | | | | | | | | | | | | | | | | | | | | | | | | | |
Net asset value at end of period | | $ | 13.01 | | | | | | | $ | 12.27 | | | $ | 11.15 | | | $ | 13.12 | | | $ | 13.41 | | | $ | 9.80 | |
| | | | | | | | | | | | | | | | | | | | | | | | | | | | |
Total investment return (b) | | | 6.03 | % (c) | | | | | | | 15.88 | % | | | (4.10 | %) | | | 6.33 | % | | | 37.56 | % | | | 12.52 | % |
| Ratios (to average net assets)/Supplemental Data: | | | | | | | | | | | | | | | | | | | | | | | | | | | | |
Net investment income (loss) | | | (0.21 | %)†† | | | | | | | 0.60 | % | | | 0.33 | % | | | 0.44 | % | | | 0.13 | % | | | 0.69 | % |
Net expenses | | | 1.06 | % †† | | | | | | | 1.06 | % | | | 1.06 | % | | | 1.07 | % | | | 1.07 | % | | | 1.08 | % |
Portfolio turnover rate | | | 23 | % | | | | | | | 78 | % | | | 41 | % | | | 42 | % | | | 40 | % | | | 32 | % |
Net assets at end of period (in 000’s) | | $ | 211,134 | | | | | | | $ | 199,205 | | | $ | 184,781 | | | $ | 199,493 | | | $ | 192,987 | | | $ | 124,643 | |
| (a) | Per share data based on average shares outstanding during the period. |
| (b) | Total return does not reflect any deduction of sales charges, mortality and expense charges, contract charges or administrative charges. For periods of less than one year, total return is not annualized. |
| (c) | Total investment return may reflect adjustments to conform to generally accepted accounting principles. |
| | | | |
| 16 | | MainStay VP Epoch U.S. Small Cap Portfolio | | The notes to the financial statements are an integral part of,
and should be read in conjunction with, the financial statements. |
Notes to Financial Statements (Unaudited)
Note 1–Organization and Business
MainStay VP Funds Trust (the “Fund”) was organized as a Delaware statutory trust on February 1, 2011. The Fund is registered under the Investment Company Act of 1940, as amended (the “1940 Act”), as an open-end management investment company. The Fund is comprised of thirty-two separate series (collectively referred to as the “Portfolios”). These financial statements and notes relate to the MainStay VP Epoch U.S. Small Cap Portfolio (the “Portfolio”), a “diversified” portfolio, as that term is defined in the 1940 Act, as interpreted or modified by regulatory authorities having jurisdiction, from time to time.
Shares of the Portfolio are currently offered to certain separate accounts to fund variable annuity policies and variable universal life insurance policies issued by New York Life Insurance and Annuity Corporation (“NYLIAC”), a wholly-owned subsidiary of New York Life Insurance Company (“New York Life”). NYLIAC allocates shares of the Portfolios to, among others, NYLIAC Variable Annuity Separate Accounts-I, II, III and IV, VUL Separate Account-I and CSVUL Separate Account-I (collectively, the “Separate Accounts”). Shares of the Portfolio are also offered to the MainStay VP Conservative Allocation Portfolio, MainStay VP Moderate Allocation Portfolio, MainStay VP Moderate Growth Allocation Portfolio and MainStay VP Growth Allocation Portfolio, which operate as “funds-of-funds.”
The Portfolio currently offers two classes of shares. Initial Class shares commenced operations on May 1, 1998. Service Class shares commenced operations on June 5, 2003. Shares of the Portfolio are sold and are redeemed at a price equal to their respective net asset value (“NAV”) per share. No sales or redemption charge is applicable to the purchase or redemption of the Portfolio’s shares. Under the terms of the Fund’s multiple class plan adopted pursuant to Rule 18f-3 under the 1940 Act, the classes differ in that, among other things, Service Class shares pay a combined distribution and service fee of 0.25% of average daily net assets attributable to Service Class shares of the Portfolio to the Distributor (as defined in Note 3(B)) pursuant to a plan adopted in accordance with Rule 12b-1 under the 1940 Act. Contract owners of variable annuity contracts purchased after June 2, 2003, are permitted to invest only in the Service Class shares.
The Portfolio’s investment objective is to seek long-term capital appreciation by investing primarily in securities of small-cap companies.
Note 2–Significant Accounting Policies
The Portfolio is an investment company and accordingly follows the investment company accounting and reporting guidance of the Financial Accounting Standards Board (“FASB”) Accounting Standard Codification Topic 946 Financial Services — Investment Companies. The Portfolio prepares its financial statements in accordance with generally accepted accounting principles (“GAAP”) in the United States of America and follows the significant accounting policies described below.
(A) Securities Valuation. Investments are usually valued as of the close of regular trading on the New York Stock Exchange (the “Exchange”) (usually 4:00 p.m. Eastern time) on each day the Portfolio is open for business (“valuation date”).
The Board of Trustees (the “Board”) adopted procedures establishing methodologies for the valuation of the Portfolio’s securities and other assets and delegated the responsibility for valuation determinations
under those procedures to the Valuation Committee of the Fund (the “Valuation Committee”). The Board authorized the Valuation Committee to appoint a Valuation Sub-Committee (the “Sub-Committee”) to deal in the first instance with establishing the prices of securities for which market quotations are not readily available or the prices of which are not otherwise readily determinable under these procedures. The Sub-Committee meets (in person, via electronic mail or via teleconference) on an as-needed basis. Subsequently, the Valuation Committee meets to ensure that actions taken by the Sub-Committee were appropriate. The procedures recognize that, subject to the oversight of the Board and unless otherwise noted, the responsibility for the day-to-day valuation of portfolio assets (including fair value measurements for the Portfolio’s assets and liabilities) rests with New York Life Investment Management LLC (“New York Life Investments” or the “Manager”), aided to whatever extent necessary by the Subadvisor (as defined in Note 3(A)) to the Portfolio.
To assess the appropriateness of security valuations, the Manager, the Subadvisor or the Portfolio’s third party service provider, who is subject to oversight by the Manager, regularly compares prior day prices, prices on comparable securities, and the sale prices to the prior and current day prices and challenges prices with changes exceeding certain tolerance levels with third party pricing services or broker sources. For those securities valued through either a standardized fair valuation methodology or a fair valuation measurement, the Sub-Committee deals in the first instance with such valuation and the Valuation Committee reviews and affirms, if appropriate, the reasonableness of the valuation based on such methodologies and measurements on a regular basis after considering all relevant information that is reasonably available. Any action taken by the Sub-Committee with respect to the valuation of a portfolio security or other asset is submitted by the Valuation Committee to the Board for its review and ratification, if appropriate, at its next regularly scheduled meeting.
“Fair value” is defined as the price the Portfolio would reasonably expect to receive upon selling an asset or liability in an orderly transaction to an independent buyer in the principal or most advantageous market for the asset or liability. Fair value measurements are determined within a framework that establishes a three-tier hierarchy which maximizes the use of observable market data and minimizes the use of unobservable inputs to establish a classification of fair value measurements for disclosure purposes. “Inputs” refer broadly to the assumptions that market participants would use in pricing the asset or liability, including assumptions about risk, such as the risk inherent in a particular valuation technique used to measure fair value using a pricing model and/or the risk inherent in the inputs for the valuation technique. Inputs may be observable or unobservable. Observable inputs reflect the assumptions market participants would use in pricing the asset or liability based on market data obtained from sources independent of the Portfolio. Unobservable inputs reflect the Portfolio’s own assumptions about the assumptions market participants would use in pricing the asset or liability based on the information available. The inputs or methodology used for valuing assets or liabilities may not be an indication of the risks associated with investing in those assets or liabilities. The three-tier hierarchy of inputs is summarized below.
| • | | Level 1—quoted prices in active markets for an identical asset or liability |
Notes to Financial Statements (Unaudited) (continued)
| • | | Level 2—other significant observable inputs (including quoted prices for a similar asset or liability in active markets, interest rates and yield curves, prepayment speeds, credit risk, etc.) |
| • | | Level 3—significant unobservable inputs (including the Portfolio’s own assumptions about the assumptions that market participants would use in measuring fair value of an asset or liability) |
The level of an asset or liability within the fair value hierarchy is based on the lowest level of an input, both individually and in the aggregate, that is significant to the fair value measurement. As of June 30, 2017, the aggregate value by input level of the Portfolio’s assets and liabilities is included at the end of the Portfolio’s Portfolio of Investments.
The Portfolio may use third party vendor evaluations, whose prices may be derived from one or more of the following standard inputs, among others:
| | |
• Broker/dealer quotes | | • Benchmark securities |
• Two-sided markets | | • Reference data (corporate actions or material event notices) |
• Bids/offers | | • Monthly payment information |
• Industry and economic events | | • Reported trades |
An asset or liability for which market values cannot be measured using the methodologies described above is valued by methods deemed reasonable in good faith by the Valuation Committee, following the procedures established by the Board, to represent fair value. Under these procedures, the Portfolio generally uses a market-based approach which may use related or comparable assets or liabilities, recent transactions, market multiples, book values, and other relevant information. The Portfolio may also use an income-based valuation approach in which the anticipated future cash flows of the asset or liability are discounted to calculate fair value. Discounts may also be applied due to the nature and/or duration of any restrictions on the disposition of the asset or liability. Fair value represents a good faith approximation of the value of a security. Fair value determinations involve the consideration of a number of subjective factors, an analysis of applicable facts and circumstances and the exercise of judgment. As a result, it is possible that the fair value for a security determined in good faith in accordance with the Portfolio’s valuation procedures may differ from valuations for the same security determined by other funds using their own valuation procedures. Although the Portfolio’s valuation procedures are designed to value a security at the price the Portfolio may reasonably expect to receive upon the security’s sale in an orderly transaction, there can be no assurance that any fair value determination thereunder would, in fact, approximate the amount that the Portfolio would actually realize upon the sale of the security or the price at which the security would trade if a reliable market price were readily available. During the six-month period ended June 30, 2017, there were no material changes to the fair value methodologies.
Securities which may be valued in this manner include, but are not limited to: (i) a security for which trading has been halted or suspended; (ii) a debt security that has recently gone into default and for which there is not a current market quotation; (iii) a security of an issuer that has entered into a restructuring; (iv) a security that has been de-listed from a national exchange; (v) a security for which the market price is not readily available from a third party pricing source or, if so provided, does
not, in the opinion of the Manager or Subadvisor, reflect the security’s market value; (vi) a security subject to trading collars for which no or limited trading takes place; and (vii) a security whose principal market has been temporarily closed at a time when, under normal conditions, it would be open. Securities for which market quotations or observable inputs are not readily available are generally categorized as Level 3 in the hierarchy. As of June 30, 2017, there were no securities held by the Portfolio that were fair valued in such a manner.
Equity securities are valued at the last quoted sales prices as of the close of regular trading on the relevant exchange on each valuation date. Securities that are not traded on the valuation date are valued at the mean of the last quoted bid and ask prices. Prices are normally taken from the principal market in which each security trades. These securities are generally categorized as Level 1 in the hierarchy.
Temporary cash investments acquired in excess of 60 days to maturity at the time of purchase are valued using the latest bid prices or using valuations based on a matrix system (which considers such factors as security prices, yields, maturities, and ratings), both as furnished by independent pricing services. Other temporary cash investments which mature in 60 days or less at the time of purchase (“Short-Term Investments”) are valued using the amortized cost method of valuation, unless the use of such method would be inappropriate. The amortized cost method involves valuing a security at its cost on the date of purchase and thereafter assuming a constant amortization to maturity of the difference between such cost and the value on maturity date. Amortized cost approximates the current fair value of a security. Securities valued using the amortized cost method are not valued using quoted prices in an active market and are generally categorized as Level 2 in the hierarchy.
The information above is not intended to reflect an exhaustive list of the methodologies that may be used to value portfolio investments. The valuation procedures permit the use of a variety of valuation methodologies in connection with valuing portfolio investments. The methodology used for a specific type of investment may vary based on the market data available or other considerations. The methodologies summarized above may not represent the specific means by which portfolio investments are valued on any particular business day.
A Portfolio security or other asset may be determined to be illiquid under procedures approved by the Board. Illiquidity of a security might prevent the sale of such security at a time when the Manager or Subadvisor might wish to sell, and these securities could have the effect of decreasing the overall level of the Portfolio’s liquidity. Further, the lack of an established secondary market may make it more difficult to value illiquid securities, requiring the Portfolio to rely on judgments that may be somewhat subjective in measuring value, which could vary materially from the amount that the Portfolio could realize upon disposition. Difficulty in selling illiquid securities may result in a loss or may be costly to the Portfolio. Under the supervision of the Board, the Manager or Subadvisor determines the liquidity of the Portfolio’s investments; in doing so, the Manager or Subadvisor may consider various factors, including (i) the frequency of trades and quotations, (ii) the number of dealers and prospective purchasers, (iii) dealer undertakings to make a market, and (iv) the nature of the security and the market in which it trades (e.g., the time needed to dispose of the security, the method of soliciting offers and the mechanics of transfer). Illiquid securities are
| | |
| 18 | | MainStay VP Epoch U.S. Small Cap Portfolio |
often valued in accordance with methods deemed by the Board in good faith to be reasonable and appropriate to accurately reflect their fair value. The liquidity of the Portfolio’s investments, as shown in the Portfolio of Investments and was determined as of June 30, 2017 and can change at any time in response to, among other relevant factors, market conditions or events or developments with respect to an individual issuer or instrument. As of June 30, 2017, the Portfolio did not hold any securities deemed to be illiquid under procedures approved by the Board.
(B) Income Taxes. The Portfolio’s policy is to comply with the requirements of the Internal Revenue Code of 1986, as amended (the “Internal Revenue Code”), applicable to regulated investment companies and to distribute all of its taxable income to the shareholders of the Portfolio within the allowable time limits. Therefore, no federal, state and local income tax provisions are required.
Management evaluates the Portfolio’s tax positions to determine if the tax positions taken meet the minimum recognition threshold in connection with accounting for uncertainties in income tax positions taken or expected to be taken for the purposes of measuring and recognizing tax liabilities in the financial statements. Recognition of tax benefits of an uncertain tax position is permitted only to the extent the position is “more likely than not” to be sustained assuming examination by taxing authorities. Management has analyzed the Portfolio’s tax positions taken on federal, state and local income tax returns for all open tax years (for up to three tax years), and has concluded that no provisions for federal, state and local income tax are required in the Portfolio’s financial statements. The Portfolio’s federal, state and local income and federal excise tax returns for tax years for which the applicable statutes of limitations have not expired are subject to examination by the Internal Revenue Service and state and local departments of revenue.
(C) Dividends and Distributions to Shareholders. Dividends and distributions are recorded on the ex-dividend date. The Portfolio intends to declare and pay dividends from net investment income and distributions from net realized capital and currency gains, if any, at least annually. Unless the shareholder elects otherwise, all dividends and distributions are reinvested in the same class of shares of the Portfolio, at NAV. Dividends and distributions to shareholders are determined in accordance with federal income tax regulations and may differ from GAAP.
(D) Security Transactions and Investment Income. The Portfolio records security transactions on the trade date. Realized gains and losses on security transactions are determined using the identified cost method. Dividend income is recognized on the ex-dividend date; net of any foreign tax withheld at the source, and interest income is accrued as earned using the effective interest rate method and includes any realized gains and losses from repayment of principal on mortgage-backed securities. Discounts and premiums on Short-Term Investments are accreted and amortized, respectively, on the straight-line method. The straight-line method approximates the effective interest method for Short-Term Investments.
Investment income and realized and unrealized gains and losses on investments of the Portfolio are allocated pro rata to the separate classes of shares based upon their relative net assets on the date the income is earned or realized and unrealized gains and losses are incurred.
(E) Expenses. Expenses of the Fund are allocated to the individual Portfolios in proportion to the net assets of the respective Portfolios when the expenses are incurred, except where direct allocations of expenses can be made. Expenses (other than fees incurred under the distribution and service plans, further discussed in Note 3(B), which are charged directly to the Service Class shares) are allocated to separate classes of shares pro rata based upon their relative net assets on the date the expenses are incurred. The expenses borne by the Portfolio, including those of related parties to the Portfolio, are shown in the Statement of Operations.
(F) Use of Estimates. In preparing financial statements in conformity with GAAP, management makes estimates and assumptions that affect the reported amounts and disclosures in the financial statements. Actual results could differ from those estimates.
(G) Repurchase Agreements. The Portfolio may enter into repurchase agreements (i.e., buy a security from another party with the agreement that it be sold back in the future) to earn income. The Portfolio may enter into repurchase agreements only with counterparties, usually financial institutions, that are deemed by the Manager or Subadvisor to be creditworthy, pursuant to guidelines established by the Board. During the term of any repurchase agreement, the Manager or Subadvisor will continue to monitor the creditworthiness of the counterparty. Under the 1940 Act, repurchase agreements are considered to be collateralized loans by the Portfolio to the counterparty secured by the securities transferred to the Portfolio.
Repurchase agreements are subject to counterparty risk, meaning the Portfolio could lose money by the counterparty’s failure to perform under the terms of the agreement. The Portfolio mitigates this risk by ensuring the repurchase agreement is collateralized by cash, U.S. government securities, fixed income securities and/or other securities. The collateral is held by the Portfolio’s custodian valued daily on a mark to market basis to determine if the value, including accrued interest, exceeds the repurchase price. In the event of the counterparty’s default on the obligation to repurchase, the Portfolio has the right to liquidate the collateral and apply the proceeds in satisfaction of the obligation. Under certain circumstances, such as in the event of default or bankruptcy by the counterparty, realization and/or retention of the collateral may be limited or subject to delay, to legal proceedings and possible realized loss to the Portfolio.
(H) Securities Lending. In order to realize additional income, the Portfolio may engage in securities lending, subject to the limitations set forth in the 1940 Act and relevant guidance by the staff of the Securities and Exchange Commission (“SEC”). In the event the Portfolio does engage in securities lending, the Portfolio will lend through its custodian, State Street Bank and Trust Company (“State Street”). State Street will manage the Portfolio’s collateral in accordance with the lending agreement between the Portfolio and State Street, and indemnify the Portfolio against counterparty risk. The loans will be collateralized by U.S. Treasury securities at least equal at all times to the market value of the securities loaned. The Portfolio may bear the risk of delay in recovery of, or loss of rights in, the securities loaned should the borrower of the securities experience financial difficulty. The Portfolio may also record a realized gain or loss on securities deemed sold due to a borrower’s inability to return securities on loan. The Portfolio bears the risk of any loss on investment of the collateral. The Portfolio will receive
Notes to Financial Statements (Unaudited) (continued)
compensation for lending its securities in the form of fees or it will retain a portion of interest on the investment of any cash received as collateral. The Portfolio will also continue to receive interest and dividends on the securities loaned and any gain or loss in the market price of the securities loaned that may occur during the term of the loan will be for the account of the Portfolio. During the six-month period ended June 30, 2017, the Portfolio did not have any portfolio securities on loan.
(I) Indemnifications. Under the Fund’s organizational documents, its officers and trustees are indemnified against certain liabilities that may arise out of performance of their duties to the Fund. Additionally, in the normal course of business, the Portfolio enters into contracts with third-party service providers that contain a variety of representations and warranties and which may provide general indemnifications. The Portfolio’s maximum exposure under these arrangements is unknown, as this would involve future claims that may be made against the Portfolio that have not yet occurred. Based on experience, management is of the view that the risk of loss in connection with these potential indemnification obligations is remote. However, there can be no assurance that material liabilities related to such obligations will not arise in the future, which could adversely impact the Portfolio.
Note 3–Fees and Related Party Transactions
(A) Manager and Subadvisor. New York Life Investments, a registered investment adviser and an indirect, wholly-owned subsidiary of New York Life Insurance Company (“New York Life”), serves as the Portfolio’s Manager pursuant to an Amended and Restated Management Agreement (“Management Agreement”). The Manager provides offices, conducts clerical, recordkeeping and bookkeeping services, and keeps most of the financial and accounting records required to be maintained by the Portfolio. Except for the portion of salaries and expenses that are the responsibility of the Portfolio, the Manager pays the salaries and expenses of all personnel affiliated with the Portfolio and certain operational expenses of the Portfolio. The Portfolio reimburses New York Life Investments in an amount equal to a portion of the compensation of the Chief Compliance Officer attributable to the Portfolio. Epoch Investment Partners, Inc. (“Epoch” or “Subadvisor”), a registered investment adviser, is responsible for the day-to-day portfolio management of the Portfolio. Pursuant to the terms of an Amended and Restated Subadvisory Agreement (“Subadvisory Agreement”) between New York Life Investments and Epoch, New York Life Investments pays for the services of the Subadvisor.
The Fund, on behalf of the Portfolio, pays New York Life Investments in its capacity as the Portfolio’s investment manager and administrator, pursuant to the Management Agreement, a monthly fee for services performed and facilities furnished at an annual rate of the Portfolio’s average daily net assets as follows: 0.80% up to $200 million; 0.75% from $200 million to $500 million; 0.725% from $500 million to $1 billion; and 0.70% in excess of $1 billion. During the six-month period ended June 30, 2017, the effective management fee rate was 0.77%.
During the six-month period ended June 30, 2017, New York Life Investments earned fees from the Portfolio in the amount of $1,915,252.
State Street provides sub-administration and sub-accounting services to the Portfolio pursuant to an agreement with New York Life Investments. These services include calculating the daily NAVs of the Portfolio, maintaining the general ledger and sub-ledger accounts for the calculation of the Portfolio’s NAVs, and assisting New York Life Investments in conducting various aspects of the Portfolio’s administrative operations. For providing these services to the Portfolio, State Street is compensated by New York Life Investments.
(B) Distribution and Service Fees. The Fund, on behalf of the Portfolio, has entered into a distribution agreement with NYLIFE Distributors LLC (the “Distributor”), an indirect, wholly-owned subsidiary of New York Life. The Portfolio has adopted a distribution plan (the “Plan”) in accordance with the provisions of Rule 12b-1 under the 1940 Act. Under the Plan, the Distributor has agreed to provide, through its affiliates or independent third parties, various distribution-related, shareholder and administrative support services to the Service Class shareholders. For its services, the Distributor is entitled to a combined distribution and service fee accrued daily and paid monthly at an annual rate of 0.25% of the average daily net assets attributable to the Service Class shares of the Portfolio.
Note 4–Federal Income Tax
During the year ended December 31, 2016, the tax character of distributions paid as reflected in the Statements of Changes in Net Assets was as follows:
| | |
| 2016 |
Tax-Based
Distributions
from Ordinary
Income | | Tax-Based
Distributions
from Long-Term
Gains |
| $1,692,849 | | $23,486,422 |
Note 5–Custodian
State Street is the custodian of cash and securities held by the Portfolio. Custodial fees are charged to the Portfolio based on the Portfolio’s net assets and/or the market value of securities held by the Portfolio and the number of certain transactions incurred by the Portfolio.
Note 6–Line of Credit
The Portfolio and certain other funds managed by New York Life Investments, maintain a line of credit with a syndicate of banks in order to secure a source of funds for temporary purposes to meet unanticipated or excessive redemption requests.
Effective August 1, 2017, under the credit agreement (the “Credit Agreement”), the aggregate commitment amount is $600,000,000 with an additional uncommitted amount of $100,000,000. The commitment fee is an annual rate of 0.15% of the average commitment amount payable quarterly, regardless of usage, to State Street, who serves as the agent to the syndicate. The commitment fee is allocated among the Portfolio and certain other funds managed by New York Life Investments based upon their respective net assets and other factors. Interest on any revolving credit loan is charged based upon the Federal Funds Rate or the one month LIBOR, whichever is higher. The Credit Agreement
| | |
| 20 | | MainStay VP Epoch U.S. Small Cap Portfolio |
expires on July 31, 2018, although the Portfolio, certain other funds managed by New York Life Investments and the syndicate of banks may renew the Credit Agreement for an additional year on the same or different terms. Prior to August 1, 2017, the aggregate commitment amount was $600,000,000 with an additional uncommitted amount of $100,000,000, and the commitment fee, under a credit agreement for which Bank of New York Mellon served as agent, was at an annual rate of 0.15% of the average commitment amount. During the six-month period ended June 30, 2017, there were no borrowings made or outstanding with respect to the Portfolio under the credit agreement for which Bank of New York Mellon served as agent.
Note 7–Interfund Lending Program
Pursuant to an exemptive order issued by the SEC, the Portfolio, along with certain other funds managed by New York Life Investments, may participate in an interfund lending program. The interfund lending program provides an alternative credit facility that permits the Portfolio and certain other funds managed by New York Life Investments to lend or borrow money for temporary purposes directly to or from one another, subject to the conditions of the exemptive order. During the six-month period ended June 30, 2017, there were no interfund loans made or outstanding with respect to the Portfolio.
Note 8–Purchases and Sales of Securities (in 000’s)
During the six-month period ended June 30, 2017, purchases and sales of securities, other than short-term securities and securities subject to repurchase transactions, were $112,715 and $125,686, respectively.
Note 9–Capital Share Transactions
Transactions in capital shares for the six-month period ended June 30, 2017, and the year ended December 31, 2016, were as follows:
| | | | | | | | |
Initial Class | | Shares | | | Amount | |
Six-month period ended June 30, 2017: | | | | | | | | |
Shares sold | | | 439,845 | | | $ | 5,798,157 | |
Shares redeemed | | | (1,775,704 | ) | | | (23,371,605 | ) |
| | | | |
Net increase (decrease) | | | (1,335,859 | ) | | $ | (17,573,448 | ) |
| | | | |
Year ended December 31, 2016: | | | | | | | | |
Shares sold | | | 4,367,533 | | | $ | 46,176,818 | |
Shares issued to shareholders in reinvestment of dividends and distributions | | | 1,325,255 | | | | 15,690,098 | |
Shares redeemed | | | (6,901,432 | ) | | | (84,470,394 | ) |
| | | | |
Net increase (decrease) | | | (1,208,644 | ) | | $ | (22,603,478 | ) |
| | | | |
| | | | | | | | |
Service Class | | Shares | | | Amount | |
Six-month period ended June 30, 2017: | | | | | | | | |
Shares sold | | | 1,402,000 | | | $ | 17,860,553 | |
Shares redeemed | | | (1,415,853 | ) | | | (18,028,342 | ) |
| | | | |
Net decrease | | | (13,853 | ) | | $ | (167,789 | ) |
| | | | |
Year ended December 31, 2016: | | | | | | | | |
Shares sold | | | 1,964,613 | | | $ | 22,566,632 | |
Shares issued to shareholders in reinvestment of dividends and distributions | | | 829,923 | | | | 9,489,173 | |
Shares redeemed | | | (3,129,270 | ) | | | (35,759,593 | ) |
| | | | |
Net increase (decrease) | | | (334,734 | ) | | $ | (3,703,788 | ) |
| | | | |
Note 10–Recent Accounting Pronouncement
In October 2016, the SEC adopted new rules and amended existing rules (together, “final rules”) intended to modernize the reporting and disclosure of information by registered investment companies. In part, the final rules amend Regulation S-X and require standardized, enhanced disclosure about derivatives in investment company financial statements, as well as other amendments. The compliance date for the amendments to Regulation S-X is August 1, 2017 and applies to shareholder reports for funds with fiscal periods ending after August 1, 2017. Management is currently evaluating the impact that the adoption of the amendments to Regulation S-X will have on the Portfolio’s financial statements and related disclosures.
Note 11–Subsequent Events
In connection with the preparation of the financial statements of the Portfolio as of and for the six-month period ended June 30, 2017, events and transactions subsequent to June 30, 2017, through the date the financial statements were issued have been evaluated by the Portfolio’s management for possible adjustment and/or disclosure. No subsequent events requiring financial statement adjustment or disclosure have been identified.
Proxy Voting Policies and Procedures and Proxy Voting Record
A description of the policies and procedures that New York Life Investments uses to vote proxies related to the Portfolio’s securities is available without charge, upon request, (i) by calling 800-598-2019 or (ii) by visiting the SEC’s website at www.sec.gov.
The Portfolio is required to file with the SEC its proxy voting record for the 12-month period ending June 30 on Form N-PX. The Portfolio’s most recent Form N-PX or proxy voting record is available free of charge upon request (i) by calling 800-598-2019 or; (ii) by visiting the SEC’s website at www.sec.gov.
Shareholder Reports and Quarterly Portfolio Disclosure
The Portfolio is required to file its complete schedule of portfolio holdings with the SEC for its first and third fiscal quarters on Form N-Q. The Portfolio’s Form N-Q is available without charge on the SEC’s website at www.sec.gov or by calling MainStay Investments at 800-598-2019. You also can obtain and review copies of Form N-Q by visiting the SEC’s Public Reference Room in Washington, DC (information on the operation of the Public Reference Room may be obtained by calling 1-800-SEC-0330).
| | |
| 22 | | MainStay VP Epoch U.S. Small Cap Portfolio |
MainStay VP Portfolios
MainStay VP offers a wide range of Portfolios. The full array of MainStay VP offerings is listed here, with information about the manager, subadvisors, legal counsel, and independent registered public accounting firm.
Equity Portfolios
MainStay VP Common Stock Portfolio
MainStay VP Cornerstone Growth Portfolio
MainStay VP Eagle Small Cap Growth Portfolio
MainStay VP Emerging Markets Equity Portfolio
MainStay VP Epoch U.S. Equity Yield Portfolio
MainStay VP Epoch U.S. Small Cap Portfolio
MainStay VP International Equity Portfolio
MainStay VP Large Cap Growth Portfolio
MainStay VP MFS® Utilities Portfolio
MainStay VP Mid Cap Core Portfolio
MainStay VP S&P 500 Index Portfolio
MainStay VP Small Cap Core Portfolio
MainStay VP T. Rowe Price Equity Income Portfolio
MainStay VP VanEck Global Hard Assets Portfolio
Mixed Asset Portfolios
MainStay VP Balanced Portfolio
MainStay VP Convertible Portfolio
MainStay VP Cushing Renaissance Advantage Portfolio
MainStay VP Income Builder Portfolio
MainStay VP Janus Henderson Balanced Portfolio
Income Portfolios
MainStay VP Bond Portfolio
MainStay VP Floating Rate Portfolio
MainStay VP Government Portfolio
MainStay VP High Yield Corporate Bond Portfolio
MainStay VP Indexed Bond Portfolio
MainStay VP PIMCO Real Return Portfolio
MainStay VP Unconstrained Bond Portfolio
Money Market
MainStay VP U.S. Government Money Market Portfolio
Alternative
MainStay VP Absolute Return Multi-Strategy Portfolio
Asset Allocation Portfolios
MainStay VP Conservative Allocation Portfolio
MainStay VP Growth Allocation Portfolio
MainStay VP Moderate Allocation Portfolio
MainStay VP Moderate Growth Allocation Portfolio
Manager
New York Life Investment Management LLC
New York, New York
Subadvisors
Candriam Belgium*
Brussels, Belgium
Candriam France S.A.S.*
Paris, France
Cornerstone Capital Management Holdings LLC*
New York, New York
Cushing Asset Management, LP
Dallas, Texas
Eagle Asset Management, Inc.
St Petersburg, Florida
Epoch Investment Partners, Inc.
New York, New York
Janus Capital Management LLC
Denver, Colorado
MacKay Shields LLC*
New York, New York
Massachusetts Financial Services Company
Boston, Massachusetts
NYL Investors LLC*
New York, New York
Pacific Investment Management Company LLC
Newport Beach, California
T. Rowe Price Associates, Inc.
Baltimore, Maryland
Van Eck Associates Corporation
New York, New York
Winslow Capital Management, LLC
Minneapolis, Minnesota
Distributor
NYLIFE Distributors LLC*
Jersey City, New Jersey
Custodian
State Street Bank and Trust Company
Boston, Massachusetts
Independent Registered Public Accounting Firm
PricewaterhouseCoopers LLP
New York, New York
Legal Counsel
Dechert LLP
Washington, District of Columbia
Some Portfolios may not be available in all products.
* An affiliate of New York Life Investment Management LLC
Not part of the Semiannual Report
2017 Semiannual Report
This report is for the general information of New York Life Variable Annuities and NYLIAC Variable Universal Life Insurance Products policyowners. It must be preceded or accompanied by the appropriate product(s) and funds prospectuses if it is given to anyone who is not an owner of a New York Life variable annuity policy or a NYLIAC Variable Universal Life Insurance Product. This report does not offer for sale or solicit orders to purchase securities.
The performance data quoted in this report represents past performance. Past performance is no guarantee of future results. Due to market volatility and other factors, current performance may be lower or higher than the figures shown. The most recent month-end performance summary for your variable annuity or variable life policy is available by calling 800-598-2019 and is updated periodically on www.newyorklife.com.
The New York Life Variable Annuities and NYLIAC Variable Universal Life Insurance Products are issued by New York Life Insurance and Annuity Corporation (a Delaware Corporation) and distributed by NYLIFE Distributors LLC (Member FINRA/SIPC).
New York Life Insurance Company
New York Life Insurance and Annuity Corporation (NYLIAC) (A Delaware Corporation)
51 Madison Avenue, Room 551
New York, NY 10010
www.newyorklife.com
Printed on recycled paper
mainstayinvestments.com
NYLIFE Distributors LLC, 30 Hudson Street, Jersey City, NJ 07302
New York Life Investment Management LLC is the investment manager to the MainStay VP Funds Trust
©2017 by NYLIFE Distributors LLC. All rights reserved.
You may obtain copies of the Prospectus and the Statement of Additional Information free of charge, upon request, by calling toll-free 800-598-2019 or writing to New York Life Insurance and Annuity Corporation, 51 Madison Avenue, New York, NY 10010.
| | | | |
| Not FDIC Insured | | No Bank Guarantee | | May Lose Value |
| | | | |
| 1744025 | | | | MSVPEUSC10-08/17 (NYLIAC) NI517 |
MainStay VP Mid Cap Core Portfolio
Message from the President and Semiannual Report
Unaudited | June 30, 2017

Sign up for electronic delivery of your shareholder reports. For full details on electronic delivery, including who can participate and what you
can receive via eDelivery, please log on to www.newyorklife.com/vsc

This page intentionally left blank
Message from the President
The six months ended June 30, 2017, brought positive results to many stock and bond investors. The year began with many investors hoping that Republican control of the White House, the Senate and the House of Representatives could bring an end to political gridlock; and while debate has continued on a number of issues, the U.S. stock market climbed relatively steadily throughout the first half of 2017.
According to FTSE-Russell U.S. market data, stocks at all capitalization levels tended to record positive total returns during the reporting period, with large-cap stocks generally outperforming stocks of smaller-capitalization companies. Growth stocks outpaced value stocks at every capitalization level by substantial margins—from more than six percentage points for micro-caps and mid-caps to more than 10 percentage points for the largest 200 U.S. companies by market capitalization.
Most sectors of the stock market advanced during the reporting period, with energy and telecommunication services being notable exceptions. Energy stocks declined as oil prices fell despite moves by the Organization of Petroleum Exporting Countries (OPEC) intended to limit oil production by its members. Telecommunication services stocks tended to decline as competition increased and rising interest rates made dividend payouts less appealing.
In March and June of 2017, the Federal Reserve announced successive increases in the target range for the federal funds rate, ultimately bringing the federal funds target range to 1.00% to 1.25%. While short-term U.S. Treasury yields rose in response, yields for U.S. Treasury securities with maturities of five years or longer declined. As the difference between short- and long-term yields narrowed, the advantages of higher-yielding long-term bonds became increasingly apparent.
Virtually all taxable and tax-exempt bond sectors provided positive total returns during the reporting period. Mortgage-backed
securities, though providing positive total returns, faced headwinds when the Federal Reserve announced plans to begin normalizing its balance sheet by reducing reinvestment of principal payments on mortgage-backed securities.
International stock and bond markets were also strong during the reporting period. International stocks provided double-digit total returns that were surpassed by emerging-market stocks as a whole. Global investment-grade bonds provided single-digit returns; and emerging-market debt was somewhat stronger.
Even during periods of favorable market performance and generally positive returns, MainStay believes that it is important to carefully monitor your investments. Your risk tolerance may
change over time, leading you to reevaluate which MainStay VP Portfolios are most appropriate for your long-term goals. Your goals themselves may also change, leading you to pursue investments with more or less risk. The portfolio managers of MainStay VP Portfolios seek to provide results consistent with the investment objectives of their respective Portfolios, to give you a wide range of choices suitable to various investment needs.
The report that follows provides more detailed information about the specific markets, securities and investment decisions that influenced your MainStay VP Portfolio during the six months ended June 30, 2017. We invite you to review the report carefully as part of your ongoing investment evaluation and review.
Sincerely,

Stephen P. Fisher
President
The opinions expressed are as of the date of the accompanying report and are subject to change. Past performance is no guarantee of future results. There is no guarantee that any forecasts made will come to pass. This material does not constitute investment advice and is not intended as an endorsement of any specific investment.
Not all MainStay VP Portfolios and/or share classes are available under all policies.
Not part of the Semiannual Report
Table of Contents
Investors should refer to the Portfolio’s Summary Prospectus and/or Prospectus and consider the Portfolio’s investment objectives, strategies, risks, charges and expenses carefully before investing. The Summary Prospectus and/or Prospectus contain this and other information about the Portfolio. You may obtain copies of the Portfolio’s Summary Prospectus and/or the Prospectus and the Statement of Additional Information free of charge, upon request, by calling toll-free 800-598-2019, by writing to New York Life Insurance and Annuity Corporation, 51 Madison Avenue, Room 251, New York, New York 10010 or by sending an email to MainStayShareholdersServices@nylim.com. These documents are also available at mainstayinvestments.com/vpdocuments. Please read the Summary Prospectus and/or Prospectus carefully before investing. MainStay VP Funds Trust portfolios are separate account options which are purchased through a variable insurance or variable annuity contract.
Investment and Performance Comparison1 (Unaudited)
Performance data quoted represents past performance. Past performance is no guarantee of future results. Because of market volatility and other factors, current performance may be lower or higher than the figures shown. Investment return and principal value will fluctuate, and as a result, when shares are redeemed, they may be worth more or less than their original cost. The performance table and graph do not reflect any deduction of sales charges, mortality and expense charges, contract charges or administrative charges. Please refer to the Performance Summary appropriate for your policy. For performance information current to the most recent month-end, please call 800-598-2019 or visit www.newyorklife.com.
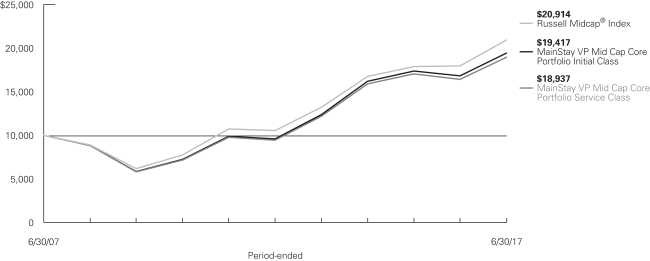
Average Annual Total Returns for the Period Ended June 30, 2017
| | | | | | | | | | | | | | | | | | | | | | | | |
| Class | | Inception
Date | | | Six Months | | | One Year | | | Five Years | | | Ten Years | | | Gross
Expense
Ratio2 | |
| Initial Class Shares | | | 7/2/2001 | | | | 6.64 | % | | | 15.50 | % | | | 15.19 | % | | | 6.86 | % | | | 0.90 | % |
| Service Class Shares | | | 6/5/2003 | | | | 6.51 | | | | 15.21 | | | | 14.90 | | | | 6.59 | | | | 1.15 | |
| | | | | | | | | | | | | | | | |
| Benchmark Performance | | Six
Months | | | One
Year | | | Five
Years | | | Ten
Years | |
Russell Midcap® Index3 | | | 7.99 | % | | | 16.48 | % | �� | | 14.72 | % | | | 7.67 | % |
Average Lipper Variable Products Mid-Cap Core Portfolio4 | | | 5.44 | | | | 17.49 | | | | 13.51 | | | | 6.79 | |
| 1. | Performance figures reflect certain fee waivers and/or expense limitations, without which total returns may have been different. For information on current fee waivers and/or expense limitations (if any), please refer to the Notes to Financial Statements. |
| 2. | The gross expense ratios presented reflect the Portfolio’s “Total Annual Portfolio Operating Expenses” from the most recent Prospectus and may differ from other expense ratios disclosed in this report. |
| 3. | The Russell Midcap® Index is the Portfolio’s primary broad-based securities market index for comparison purposes. The Russell Midcap® Index measures the performance of the mid-cap segment of the U.S. equity universe. The Russell Midcap® Index is a subset of the Russell 1000® Index. It includes approximately 800 of the smallest securities based on a combination of their market cap and current index membership. Results |
| | assume reinvestment of all dividends and capital gains. An investment cannot be made directly in an index. |
| 4. | The Average Lipper Variable Products Mid-Cap Core Portfolio is representative of portfolios that, by portfolio practice, invest at least 75% of their equity assets in companies with market capitalizations (on a three-year weighted basis) below Lipper’s U.S. diversified equity large-cap floor. Mid-cap core portfolios have more latitude in the companies in which they invest. These portfolios typically have average characteristics compared to the S&P MidCap 400® Index. This benchmark is a product of Lipper Inc. Lipper Inc. is an independent monitor of fund performance. Results are based on average total returns of similar portfolios with all dividend and capital gain distributions reinvested. |
Cost in Dollars of a $1,000 Investment in MainStay VP Mid Cap Core Portfolio (Unaudited)
The example below is intended to describe the fees and expenses borne by shareholders during the six-month period from January 1, 2017 to June 30, 2017 and the impact of those costs on your investment.
Example
As a shareholder of the Portfolio, you incur two types of costs: (1) transaction costs, including exchange fees and sales charges (loads) on purchases (as applicable), and (2) ongoing costs, including management fees, distribution and/or service (12b-1) fees, and other Portfolio expenses (as applicable). This example is intended to help you understand your ongoing costs (in dollars) of investing in the Portfolio and to compare these costs with the ongoing costs of investing in other mutual funds. The example is based on an investment of $1,000 made at the beginning of the six-month period and held for the entire period from January 1, 2017 to June 30, 2017. Shares are only sold in connection with variable life and annuity contracts and the example does not reflect any contract level or transactional fees or expenses. If these costs had been included, your costs would have been higher.
This example illustrates your Portfolio’s ongoing costs in two ways:
Actual Expenses
The second and third data columns in the table below provide information about actual account values and actual expenses. You may use the information in these columns, together with the amount you invested, to estimate the expenses that you paid during the six months
ended June 30, 2017. Simply divide your account value by $1,000 (for example, an $8,600 account value divided by $1,000 = 8.6), then multiply the result by the number under the heading entitled “Expenses Paid During Period” to estimate the expenses you paid on your account during this period.
Hypothetical Example for Comparison Purposes
The fourth and fifth data columns in the table below provide information about hypothetical account values and hypothetical expenses based on the Portfolio’s actual expense ratio and an assumed rate of return of 5% per year before expenses, which is not the Portfolio’s actual return. The hypothetical account values and expenses may not be used to estimate the actual ending account balances or expenses you paid for the six-month period shown. You may use this information to compare the ongoing costs of investing in the Portfolio with the ongoing costs of investing in other mutual funds. To do so, compare this 5% hypothetical example with the 5% hypothetical examples that appear in the shareholder reports of the other mutual funds.
Please note that the expenses shown in the table are meant to highlight your ongoing costs only and do not reflect any transactional costs, such as exchange fees or sales charges (loads). Therefore, the fourth and fifth data columns of the table are useful in comparing ongoing costs only and will not help you determine the relative total costs of owning different funds. In addition, if these transactional costs were included, your costs would have been higher.
| | | | | | | | | | | | | | | | | | | | | | | | |
| | | | | | | | | | | | | | | | | | | |
| Share Class | | Beginning
Account
Value
1/1/17 | | | Ending Account
Value (Based
on Actual
Returns and
Expenses)
6/30/17 | | | Expenses
Paid
During
Period1 | | | Ending Account
Value (Based
on Hypothetical
5% Annualized
Return and
Actual Expenses)
6/30/17 | | | Expenses
Paid
During
Period1 | | | Net Expense
Ratio
During
Period2 | |
| | | | | | |
| Initial Class Shares | | $ | 1,000.00 | | | $ | 1,066.40 | | | $ | 4.41 | | | $ | 1,020.50 | | | $ | 4.31 | | | | 0.86 | % |
| | | | | | |
| Service Class Shares | | $ | 1,000.00 | | | $ | 1,065.10 | | | $ | 5.68 | | | $ | 1,019.30 | | | $ | 5.56 | | | | 1.11 | % |
| 1. | Expenses are equal to the Portfolio’s annualized expense ratio of each class multiplied by the average account value over the period, divided by 365 and multiplied by 181 (to reflect the six-month period). The table above represents the actual expenses incurred during the six-month period. |
| 2. | Expenses are equal to the Portfolio’s annualized expense ratio to reflect the six-month period. |
| | |
| 6 | | MainStay VP Mid Cap Core Portfolio |
Industry Composition as of June 30, 2017 (Unaudited)
| | | | |
| Equity Real Estate Investment Trusts (REITs) | | | 7.5 | % |
| Insurance | | | 6.9 | |
| Hotels, Restaurants & Leisure | | | 5.1 | |
| Oil, Gas & Consumable Fuels | | | 4.7 | |
| Semiconductors & Semiconductor Equipment | | | 4.6 | |
| Banks | | | 4.2 | |
| Multi-Utilities | | | 3.8 | |
| Media | | | 3.3 | |
| Food Products | | | 3.1 | |
| Health Care Providers & Services | | | 3.1 | |
| Machinery | | | 3.1 | |
| Software | | | 3.1 | |
| Electric Utilities | | | 3.0 | |
| Capital Markets | | | 2.9 | |
| Specialty Retail | | | 2.9 | |
| IT Services | | | 2.6 | |
| Communications Equipment | | | 2.5 | |
| Health Care Equipment & Supplies | | | 2.4 | |
| Technology Hardware, Storage & Peripherals | | | 2.1 | |
| Airlines | | | 1.9 | |
| Containers & Packaging | | | 1.7 | |
| Exchange Traded Funds | | | 1.7 | |
| Internet Software & Services | | | 1.7 | |
| Aerospace & Defense | | | 1.6 | |
| Chemicals | | | 1.6 | |
| Household Durables | | | 1.5 | |
| Internet & Direct Marketing Retail | | | 1.4 | |
| Metals & Mining | | | 1.3 | |
| | | | |
| Professional Services | | | 1.3 | % |
| Diversified Consumer Services | | | 1.2 | |
| Electronic Equipment, Instruments & Components | | | 1.2 | |
| Life Sciences Tools & Services | | | 1.1 | |
| Building Products | | | 1.0 | |
| Health Care Technology | | | 1.0 | |
| Trading Companies & Distributors | | | 0.9 | |
| Auto Components | | | 0.8 | |
| Household Products | | | 0.7 | |
| Beverages | | | 0.6 | |
| Commercial Services & Supplies | | | 0.6 | |
| Personal Products | | | 0.6 | |
| Real Estate Management & Development | | | 0.6 | |
| Textiles, Apparel & Luxury Goods | | | 0.6 | |
| Biotechnology | | | 0.5 | |
| Electrical Equipment | | | 0.5 | |
| Leisure Products | | | 0.4 | |
| Air Freight & Logistics | | | 0.3 | |
| Energy Equipment & Services | | | 0.3 | |
| Food & Staples Retailing | | | 0.1 | |
| Independent Power & Renewable Electricity Producers | | | 0.1 | |
| Pharmaceuticals | | | 0.1 | |
| Wireless Telecommunication Services | | | 0.1 | |
| Diversified Telecommunication Services | | | 0.0 | ‡ |
| Short-Term Investment | | | 0.1 | |
| Other Assets, Less Liabilities | | | 0.0 | ‡ |
| | | | |
| | | 100.0 | % |
| | | | |
See Portfolio of Investments beginning on page 10 for specific holdings within these categories.
| ‡ | Less than one-tenth of a percent. |
Top Ten Holdings as of June 30, 2017 (excluding short-term investment) (Unaudited)
| 1. | SPDR S&P MidCap 400 ETF Trust |
| 3. | Marathon Petroleum Corp. |
| 5. | Consolidated Edison, Inc. |
| 10. | Tyson Foods, Inc. Class A |
Portfolio Management Discussion and Analysis (Unaudited)
Answers to the questions reflect the views of portfolio managers Migene Kim, CFA, Andrew Ver Planck, CFA, and Mona Patni of Cornerstone Capital Management Holdings LLC, the Portfolio’s Subadvisor.
How did MainStay VP Mid Cap Core Portfolio perform relative to its benchmark and peers for the six months ended June 30, 2017?
For the six months ended June 30, 2017, MainStay VP Mid Cap Core Portfolio returned 6.64% for Initial Class shares and 6.51% for Service Class shares. Over the same period, both share classes underperformed the 7.99% return of the Russell Midcap® Index,1 which is the Portfolio’s benchmark, and outperformed the 5.44% return of the Average Lipper2 Variable Products Mid-Cap Core Portfolio.
What factors affected the Portfolio’s relative performance during the reporting period?
Stock selection decisions detracted from the Portfolio’s performance relative to the Russell Midcap® Index during the reporting period. Allocation effects—being overweight or underweight specific sectors as a result of the Portfolio’s bottom-up stock selection process—also had a negative impact on the Portfolio’s relative performance during the reporting period.
Which sectors were the strongest positive contributors to the Portfolio’s relative performance, and which sectors were particularly weak?
Consumer discretionary, information technology and real estate were the strongest-contributing sectors to the Portfolio’s performance relative to the Russell Midcap® Index during the reporting period. (Contributions take weightings and total returns into account.) The contribution in these sectors was driven by favorable stock selection in consumer discretionary, while an overweight position in the outperforming information technology sector—and an underweight position in the underperforming real estate sector—also contributed to the Portfolio’s relative performance.
The weakest sector contributions to the Portfolio’s relative performance during the reporting period came from the health care, materials and energy sectors. Unfavorable stock selection detracted from relative performance in health care and materials, while an underweight position in the outperforming health care sector—and an overweight position in the underperforming energy sector—also detracted from the Portfolio’s relative performance.
During the reporting period, which individual stocks made the strongest positive contributions to the Portfolio’s absolute performance and which stocks detracted the most?
On an absolute basis, the Portfolio’s strongest-performing stocks were semiconductor, memory and storage solutions
company Micron Technology, which continued to deliver strong results and benefited from strong demand for its products from data centers, handset makers and the auto industry. These trends also helped generate strong returns for the Portfolio in Lam Research, which manufactures equipment used in the production of semiconductor materials. Electronic Arts, a provider of games, content and online services for Internet-connected consoles, mobile devices and personal computers, saw its shares rise after the company posted strong results, which came from favorable demand trends and from higher profitability as consumers shifted from physical disks to downloaded game content.
On an absolute basis, the Portfolio’s weakest stock performer was AmTrust Financial, which fell after disclosing accounting issues that may require restatements of previous financial results. Offshore contract drilling service provider Transocean was also a weak performer for the Portfolio, as its share price dropped in concert with weakness in crude prices during the reporting period. Steel producer United States Steel also declined after the company reported operating results that fell well below expectations because of continued weakness and supply concerns within the commodity segment.
Did the Portfolio make any significant purchases or sales during the reporting period?
The Portfolio entered into new positions that were overweight relative to the benchmark in cruise line operator Royal Caribbean and semiconductor maker Skyworks Solutions. We believe that Royal Caribbean has exhibited improving cash flow–based valuation, strong industry momentum and solid earnings. Skyworks Solutions also looked attractive from a valuation perspective, and the company exhibited strong earnings trends.
The Portfolio exited its overweight positions in off-price retail apparel and home-accessories store operator Ross Stores and consumer and commercial banking provider Huntington Bancshares. Both of these sales were prompted by deteriorating stock price trends and by valuations that we found less than compelling.
How did the Portfolio’s sector weightings change during the reporting period?
During the reporting period, the Portfolio modestly increased its weightings relative to the Russell Midcap® Index in the utilities and industrials sectors. Over the same period, the Portfolio modestly reduced its weightings relative to the Index in energy and materials.
| 1. | See footnote on page 5 for more information on the Russell Midcap® Index. |
| 2. | See footnote on page 5 for more information on Lipper Inc. |
| | |
| 8 | | MainStay VP Mid Cap Core Portfolio |
How was the Portfolio positioned at the end of the reporting period?
As of June 30, 2017, the Portfolio held modestly overweight positions relative to the Russell Midcap® Index in the consumer discretionary and information technology sectors. As of the same date, the Portfolio held modestly underweight positions relative to the Index in real estate and industrials.
The opinions expressed are those of the portfolio managers as of the date of this report and are subject to change. There is no guarantee that any forecasts made will come to pass. This material does not constitute investment advice and is not intended as an endorsement of any specific investment.
Not all MainStay VP Portfolios and/or share classes are available under all policies.
Portfolio of Investments June 30, 2017 (Unaudited)
| | | | | | | | |
| | |
| | | Shares | | | Value | |
| Common Stocks 98.2%† | |
Aerospace & Defense 1.6% | |
Hexcel Corp. | | | 29,441 | | | $ | 1,554,190 | |
Huntington Ingalls Industries, Inc. | | | 30,695 | | | | 5,714,181 | |
L3 Technologies, Inc. | | | 1,145 | | | | 191,307 | |
Orbital ATK, Inc. | | | 13,641 | | | | 1,341,729 | |
Spirit AeroSystems Holdings, Inc. Class A | | | 105,419 | | | | 6,107,977 | |
| | | | | | | | |
| | | | 14,909,384 | |
| | | | | | | | |
Air Freight & Logistics 0.3% | |
XPO Logistics, Inc. (a) | | | 47,836 | | | | 3,091,641 | |
| | | | | | | | |
|
Airlines 1.9% | |
Alaska Air Group, Inc. | | | 10,283 | | | | 923,002 | |
Copa Holdings S.A. Class A | | | 46,354 | | | | 5,423,418 | |
JetBlue Airways Corp. (a) | | | 185,852 | | | | 4,243,001 | |
United Continental Holdings, Inc. (a) | | | 88,259 | | | | 6,641,490 | |
| | | | | | | | |
| | | | 17,230,911 | |
| | | | | | | | |
Auto Components 0.8% | |
Adient PLC | | | 6,444 | | | | 421,309 | |
Goodyear Tire & Rubber Co. | | | 62,220 | | | | 2,175,211 | |
Lear Corp. | | | 33,263 | | | | 4,726,007 | |
| | | | | | | | |
| | | | 7,322,527 | |
| | | | | | | | |
Banks 4.2% | |
CIT Group, Inc. | | | 132,707 | | | | 6,462,831 | |
Citizens Financial Group, Inc. | | | 122,831 | | | | 4,382,610 | |
Commerce Bancshares, Inc. | | | 18,855 | | | | 1,071,530 | |
East West Bancorp, Inc. | | | 25,156 | | | | 1,473,638 | |
Fifth Third Bancorp | | | 160,596 | | | | 4,169,072 | |
First Hawaiian, Inc. | | | 171,487 | | | | 5,250,932 | |
First Republic Bank | | | 10,725 | | | | 1,073,573 | |
KeyCorp | | | 353,250 | | | | 6,619,905 | |
¨SunTrust Banks, Inc. | | | 153,049 | | | | 8,680,939 | |
| | | | | | | | |
| | | | 39,185,030 | |
| | | | | | | | |
Beverages 0.6% | |
Dr. Pepper Snapple Group, Inc. | | | 58,017 | | | | 5,285,929 | |
| | | | | | | | |
|
Biotechnology 0.5% | |
Incyte Corp. (a) | | | 218 | | | | 27,448 | |
OPKO Health, Inc. (a) | | | 200,939 | | | | 1,322,179 | |
United Therapeutics Corp. (a) | | | 25,654 | | | | 3,328,093 | |
| | | | | | | | |
| | | | 4,677,720 | |
| | | | | | | | |
Building Products 1.0% | |
Johnson Controls International PLC | | | 64,304 | | | | 2,788,221 | |
Owens Corning | | | 94,002 | | | | 6,290,614 | |
| | | | | | | | |
| | | | 9,078,835 | |
| | | | | | | | |
| | | | | | | | |
| | |
| | | Shares | | | Value | |
Capital Markets 2.9% | |
Ameriprise Financial, Inc. | | | 46,692 | | | $ | 5,943,425 | |
Artisan Partners Asset Management, Inc. Class A | | | 1,214 | | | | 37,270 | |
E*TRADE Financial Corp. (a) | | | 147,014 | | | | 5,590,942 | |
Lazard, Ltd. Class A | | | 127,724 | | | | 5,917,453 | |
Legg Mason, Inc. | | | 60,036 | | | | 2,290,974 | |
LPL Financial Holdings, Inc. | | | 129,254 | | | | 5,488,125 | |
T. Rowe Price Group, Inc. | | | 19,515 | | | | 1,448,208 | |
| | | | | | | | |
| | | | 26,716,397 | |
| | | | | | | | |
Chemicals 1.6% | |
Cabot Corp. | | | 325 | | | | 17,365 | |
Chemours Co. | | | 76,375 | | | | 2,896,140 | |
Huntsman Corp. | | | 109,899 | | | | 2,839,790 | |
Mosaic Co. | | | 261,258 | | | | 5,964,520 | |
Olin Corp. | | | 93,609 | | | | 2,834,481 | |
| | | | | | | | |
| | | | 14,552,296 | |
| | | | | | | | |
Commercial Services & Supplies 0.6% | |
Pitney Bowes, Inc. | | | 346,759 | | | | 5,236,061 | |
| | | | | | | | |
|
Communications Equipment 2.5% | |
ARRIS International PLC (a) | | | 199,358 | | | | 5,586,011 | |
CommScope Holding Co., Inc. (a) | | | 62,929 | | | | 2,393,190 | |
EchoStar Corp. Class A (a) | | | 79,105 | | | | 4,801,673 | |
F5 Networks, Inc. (a) | | | 46,053 | | | | 5,851,494 | |
Juniper Networks, Inc. | | | 149,211 | | | | 4,160,003 | |
| | | | | | | | |
| | | | 22,792,371 | |
| | | | | | | | |
Containers & Packaging 1.7% | |
Ardagh Group S.A. | | | 16,262 | | | | 367,684 | |
Avery Dennison Corp. | | | 519 | | | | 45,864 | |
Berry Plastics Group, Inc. (a) | | | 104,680 | | | | 5,967,807 | |
Owens-Illinois, Inc. (a) | | | 75,137 | | | | 1,797,277 | |
Silgan Holdings, Inc. | | | 168,916 | | | | 5,368,150 | |
WestRock Co. | | | 34,270 | | | | 1,941,738 | |
| | | | | | | | |
| | | | 15,488,520 | |
| | | | | | | | |
Diversified Consumer Services 1.2% | |
Graham Holdings Co. Class B | | | 7,060 | | | | 4,233,529 | |
H&R Block, Inc. | | | 213,760 | | | | 6,607,322 | |
| | | | | | | | |
| | | | 10,840,851 | |
| | | | | | | | |
Diversified Telecommunication Services 0.0%‡ | |
SBA Communications Corp. (a) | | | 531 | | | | 71,632 | |
| | | | | | | | |
|
Electric Utilities 3.0% | |
¨Edison International | | | 105,603 | | | | 8,257,099 | |
Entergy Corp. | | | 77,413 | | | | 5,942,996 | |
Eversource Energy | | | 78,030 | | | | 4,737,201 | |
FirstEnergy Corp. | | | 29,433 | | | | 858,266 | |
Pinnacle West Capital Corp. | | | 3,133 | | | | 266,806 | |
| † | Percentages indicated are based on Portfolio net assets. |
| ¨ | | Among the Portfolio’s 10 largest holdings, as of June 30, 2017, excluding short-term investment. May be subject to change daily. |
| | | | |
| 10 | | MainStay VP Mid Cap Core Portfolio | | The notes to the financial statements are an integral part of,
and should be read in conjunction with, the financial statements. |
| | | | | | | | |
| | |
| | | Shares | | | Value | |
| Common Stocks (continued) | |
Electric Utilities (continued) | |
¨Xcel Energy, Inc. | | | 177,361 | | | $ | 8,137,323 | |
| | | | | | | | |
| | | | 28,199,691 | |
| | | | | | | | |
Electrical Equipment 0.5% | |
Regal Beloit Corp. | | | 54,149 | | | | 4,415,851 | |
| | | | | | | | |
|
Electronic Equipment, Instruments & Components 1.2% | |
CDW Corp. | | | 7,626 | | | | 476,854 | |
Jabil, Inc. | | | 193,533 | | | | 5,649,228 | |
Zebra Technologies Corp. Class A (a) | | | 45,710 | | | | 4,594,769 | |
| | | | | | | | |
| | | | 10,720,851 | |
| | | | | | | | |
Energy Equipment & Services 0.3% | |
Baker Hughes, Inc. | | | 38,994 | | | | 2,125,563 | |
Transocean, Ltd. (a) | | | 101,402 | | | | 834,538 | |
| | | | | | | | |
| | | | 2,960,101 | |
| | | | | | | | |
Equity Real Estate Investment Trusts (REITs) 7.5% | |
Annaly Capital Management, Inc. | | | 374,976 | | | | 4,518,461 | |
Apple Hospitality REIT, Inc. | | | 13,179 | | | | 246,579 | |
Camden Property Trust | | | 17,395 | | | | 1,487,446 | |
Digital Realty Trust, Inc. | | | 21,420 | | | | 2,419,389 | |
Equinix, Inc. | | | 2,381 | | | | 1,021,830 | |
Equity LifeStyle Properties, Inc. | | | 70,261 | | | | 6,066,335 | |
Gaming and Leisure Properties, Inc. | | | 164,377 | | | | 6,192,082 | |
HCP, Inc. | | | 218,730 | | | | 6,990,611 | |
Hospitality Properties Trust | | | 187,340 | | | | 5,460,961 | |
Host Hotels & Resorts, Inc. | | | 373,574 | | | | 6,825,197 | |
Iron Mountain, Inc. | | | 2,969 | | | | 102,015 | |
Lamar Advertising Co. Class A | | | 80,992 | | | | 5,958,581 | |
Omega Healthcare Investors, Inc. | | | 87,089 | | | | 2,875,679 | |
Outfront Media, Inc. | | | 233,983 | | | | 5,409,687 | |
Senior Housing Properties Trust | | | 267,820 | | | | 5,474,241 | |
Starwood Property Trust, Inc. | | | 39,547 | | | | 885,457 | |
Uniti Group, Inc. (a) | | | 212,852 | | | | 5,351,099 | |
VEREIT, Inc. | | | 72,796 | | | | 592,559 | |
Welltower, Inc. | | | 18,474 | | | | 1,382,779 | |
| | | | | | | | |
| | | | 69,260,988 | |
| | | | | | | | |
Food & Staples Retailing 0.1% | |
U.S. Foods Holding Corp. (a) | | | 38,775 | | | | 1,055,455 | |
| | | | | | | | |
|
Food Products 3.1% | |
Bunge, Ltd. | | | 80,106 | | | | 5,975,908 | |
Campbell Soup Co. | | | 29,906 | | | | 1,559,598 | |
Conagra Brands, Inc. | | | 58,009 | | | | 2,074,402 | |
Flowers Foods, Inc. | | | 283,161 | | | | 4,901,517 | |
Ingredion, Inc. | | | 1,461 | | | | 174,166 | |
Lamb Weston Holdings, Inc. | | | 10,604 | | | | 467,000 | |
Pilgrim’s Pride Corp. (a) | | | 213,499 | | | | 4,679,898 | |
TreeHouse Foods, Inc. (a) | | | 12,155 | | | | 992,942 | |
| | | | | | | | |
| | |
| | | Shares | | | Value | |
Food Products (continued) | |
¨Tyson Foods, Inc. Class A | | | 122,291 | | | $ | 7,659,085 | |
| | | | | | | | |
| | | | 28,484,516 | |
| | | | | | | | |
Health Care Equipment & Supplies 2.4% | |
Cooper Cos., Inc. | | | 28,824 | | | | 6,901,042 | |
Hill-Rom Holdings, Inc. | | | 52,171 | | | | 4,153,333 | |
Hologic, Inc. (a) | | | 150,092 | | | | 6,811,175 | |
IDEXX Laboratories, Inc. (a) | | | 9,466 | | | | 1,528,002 | |
Intuitive Surgical, Inc. (a) | | | 355 | | | | 332,056 | |
STERIS PLC | | | 12,738 | | | | 1,038,147 | |
Teleflex, Inc. | | | 700 | | | | 145,432 | |
Varian Medical Systems, Inc. (a) | | | 12,873 | | | | 1,328,365 | |
Zimmer Biomet Holdings, Inc. | | | 1,135 | | | | 145,734 | |
| | | | | | | | |
| | | | 22,383,286 | |
| | | | | | | | |
Health Care Providers & Services 3.1% | |
AmerisourceBergen Corp. | | | 77,184 | | | | 7,296,203 | |
Centene Corp. (a) | | | 87,586 | | | | 6,996,370 | |
DaVita, Inc. (a) | | | 98,302 | | | | 6,366,038 | |
Universal Health Services, Inc. Class B | | | 16,278 | | | | 1,987,218 | |
WellCare Health Plans, Inc. (a) | | | 35,010 | | | | 6,286,396 | |
| | | | | | | | |
| | | | 28,932,225 | |
| | | | | | | | |
Health Care Technology 1.0% | |
Allscripts Healthcare Solutions, Inc. (a) | | | 192,206 | | | | 2,452,549 | |
Cerner Corp. (a) | | | 98,451 | | | | 6,544,038 | |
| | | | | | | | |
| | | | 8,996,587 | |
| | | | | | | | |
Hotels, Restaurants & Leisure 5.1% | |
Aramark | | | 161,736 | | | | 6,627,941 | |
Brinker International, Inc. | | | 61,635 | | | | 2,348,294 | |
Choice Hotels International, Inc. | | | 6,178 | | | | 396,937 | |
Darden Restaurants, Inc. | | | 72,976 | | | | 6,599,949 | |
Extended Stay America, Inc. | | | 286,784 | | | | 5,552,138 | |
Hilton Worldwide Holdings, Inc. | | | 25,260 | | | | 1,562,331 | |
Hyatt Hotels Corp. Class A (a) | | | 392 | | | | 22,034 | |
International Game Technology PLC | | | 207,665 | | | | 3,800,270 | |
Norwegian Cruise Line Holdings, Ltd. (a) | | | 4,916 | | | | 266,890 | |
Royal Caribbean Cruises, Ltd. | | | 68,717 | | | | 7,505,958 | |
Six Flags Entertainment Corp. | | | 63,601 | | | | 3,791,256 | |
Wyndham Worldwide Corp. | | | 64,571 | | | | 6,483,574 | |
Wynn Resorts, Ltd. | | | 7,993 | | | | 1,072,021 | |
Yum China Holdings, Inc. (a) | | | 24,915 | | | | 982,398 | |
| | | | | | | | |
| | | | 47,011,991 | |
| | | | | | | | |
Household Durables 1.5% | |
NVR, Inc. (a) | | | 2,603 | | | | 6,274,818 | |
Tempur Sealy International, Inc. (a) | | | 84,885 | | | | 4,532,010 | |
Whirlpool Corp. | | | 14,272 | | | | 2,734,801 | |
| | | | | | | | |
| | | | 13,541,629 | |
| | | | | | | | |
Household Products 0.7% | |
Church & Dwight Co., Inc. | | | 529 | | | | 27,445 | |
Energizer Holdings, Inc. | | | 47,914 | | | | 2,300,830 | |
| | | | | | |
The notes to the financial statements are an integral part of,
and should be read in conjunction with, the financial statements. | | | | | 11 | |
Portfolio of Investments June 30, 2017 (Unaudited) (continued)
| | | | | | | | |
| | |
| | | Shares | | | Value | |
| Common Stocks (continued) | |
Household Products (continued) | | | | | | | | |
Spectrum Brands Holdings, Inc. | | | 37,320 | | | $ | 4,666,493 | |
| | | | | | | | |
| | | | 6,994,768 | |
| | | | | | | | |
Independent Power & Renewable Electricity Producers 0.1% | |
NRG Energy, Inc. | | | 27,089 | | | | 466,473 | |
| | | | | | | | |
|
Insurance 6.9% | |
Allied World Assurance Co. Holdings, A.G. | | | 53,209 | | | | 2,814,756 | |
American Financial Group, Inc. | | | 59,583 | | | | 5,920,763 | |
Assurant, Inc. | | | 55,914 | | | | 5,797,723 | |
Assured Guaranty, Ltd. | | | 138,903 | | | | 5,797,811 | |
Athene Holding, Ltd. Class A (a) | | | 99,869 | | | | 4,954,501 | |
CNA Financial Corp. | | | 1,822 | | | | 88,822 | |
Everest Re Group, Ltd. | | | 23,884 | | | | 6,080,628 | |
First American Financial Corp. | | | 130,049 | | | | 5,811,890 | |
FNF Group | | | 154,612 | | | | 6,931,256 | |
Hartford Financial Services Group, Inc. | | | 1,718 | | | | 90,315 | |
Lincoln National Corp. | | | 86,397 | | | | 5,838,709 | |
Old Republic International Corp. | | | 115,255 | | | | 2,250,930 | |
Progressive Corp. | | | 24,908 | | | | 1,098,194 | |
RenaissanceRe Holdings, Ltd. | | | 20,194 | | | | 2,807,976 | |
Unum Group | | | 43,245 | | | | 2,016,514 | |
Validus Holdings, Ltd. | | | 40,529 | | | | 2,106,292 | |
XL Group, Ltd. | | | 76,611 | | | | 3,355,562 | |
| | | | | | | | |
| | | | 63,762,642 | |
| | | | | | | | |
Internet & Direct Marketing Retail 1.4% | |
Expedia, Inc. | | | 51,007 | | | | 7,597,492 | |
Liberty Interactive Corp. QVC Group Class A (a) | | | 215,468 | | | | 5,287,585 | |
| | | | | | | | |
| | | | 12,885,077 | |
| | | | | | | | |
Internet Software & Services 1.7% | |
Akamai Technologies, Inc. (a) | | | 123,585 | | | | 6,155,769 | |
IAC / InterActiveCorp (a) | | | 33,881 | | | | 3,497,874 | |
VeriSign, Inc. (a) | | | 66,958 | | | | 6,224,416 | |
| | | | | | | | |
| | | | 15,878,059 | |
| | | | | | | | |
IT Services 2.6% | |
Alliance Data Systems Corp. | | | 13,189 | | | | 3,385,484 | |
CoreLogic, Inc. (a) | | | 123,180 | | | | 5,343,548 | |
CSRA, Inc. | | | 93,685 | | | | 2,974,499 | |
DXC Technology Co. | | | 9,884 | | | | 758,301 | |
Euronet Worldwide, Inc. (a) | | | 11,814 | | | | 1,032,189 | |
Fidelity National Information Services, Inc. | | | 15,541 | | | | 1,327,201 | |
First Data Corp. Class A (a) | | | 201,697 | | | | 3,670,885 | |
Teradata Corp. (a) | | | 11,940 | | | | 352,111 | |
Total System Services, Inc. | | | 25,843 | | | | 1,505,355 | |
Western Union Co. | | | 195,237 | | | | 3,719,265 | |
| | | | | | | | |
| | | | 24,068,838 | |
| | | | | | | | |
Leisure Products 0.4% | |
Hasbro, Inc. | | | 32,494 | | | | 3,623,406 | |
| | | | | | | | |
| | | | | | | | |
| | |
| | | Shares | | | Value | |
Life Sciences Tools & Services 1.1% | |
Charles River Laboratories International, Inc. (a) | | | 51,976 | | | $ | 5,257,373 | |
Mettler-Toledo International, Inc. (a) | | | 808 | | | | 475,540 | |
PerkinElmer, Inc. | | | 6,645 | | | | 452,790 | |
QIAGEN N.V. (a) | | | 47,373 | | | | 1,588,417 | |
Waters Corp. (a) | | | 15,950 | | | | 2,932,248 | |
| | | | | | | | |
| | | | 10,706,368 | |
| | | | | | | | |
Machinery 3.1% | |
AGCO Corp. | | | 6,324 | | | | 426,174 | |
Allison Transmission Holdings, Inc. | | | 12,437 | | | | 466,512 | |
Cummins, Inc. | | | 35,311 | | | | 5,728,150 | |
Fortive Corp. | | | 20,713 | | | | 1,312,169 | |
Oshkosh Corp. | | | 82,377 | | | | 5,674,128 | |
Terex Corp. | | | 137,240 | | | | 5,146,500 | |
Timken Co. | | | 114,779 | | | | 5,308,529 | |
Toro Co. | | | 7,385 | | | | 511,707 | |
Trinity Industries, Inc. | | | 162,939 | | | | 4,567,180 | |
| | | | | | | | |
| | | | 29,141,049 | |
| | | | | | | | |
Media 3.3% | |
AMC Networks, Inc. Class A (a) | | | 17,960 | | | | 959,243 | |
Cable One, Inc. | | | 2,380 | | | | 1,691,942 | |
Liberty SiriusXM Group (a) | |
Class A | | | 61,448 | | | | 2,579,587 | |
Class C | | | 63,026 | | | | 2,628,184 | |
Lions Gate Entertainment Corp. Class A (a) | | | 117,594 | | | | 3,318,503 | |
Live Nation Entertainment, Inc. (a) | | | 159,705 | | | | 5,565,719 | |
Omnicom Group, Inc. | | | 90,792 | | | | 7,526,657 | |
Regal Entertainment Group Class A | | | 148,100 | | | | 3,030,126 | |
Scripps Networks Interactive, Inc. Class A | | | 41,312 | | | | 2,822,023 | |
| | | | | | | | |
| | | | 30,121,984 | |
| | | | | | | | |
Metals & Mining 1.3% | |
Freeport-McMoRan, Inc. (a) | | | 55,249 | | | | 663,540 | |
Newmont Mining Corp. | | | 162,716 | | | | 5,270,371 | |
Steel Dynamics, Inc. | | | 121,918 | | | | 4,365,884 | |
United States Steel Corp. | | | 75,642 | | | | 1,674,714 | |
| | | | | | | | |
| | | | 11,974,509 | |
| | | | | | | | |
Multi-Utilities 3.8% | |
Ameren Corp. | | | 87,360 | | | | 4,775,971 | |
CenterPoint Energy, Inc. | | | 236,048 | | | | 6,462,994 | |
CMS Energy Corp. | | | 90,075 | | | | 4,165,969 | |
¨Consolidated Edison, Inc. | | | 103,173 | | | | 8,338,442 | |
DTE Energy Co. | | | 41,735 | | | | 4,415,145 | |
MDU Resources Group, Inc. | | | 52,445 | | | | 1,374,059 | |
Public Service Enterprise Group, Inc. | | | 6,805 | | | | 292,683 | |
Vectren Corp. | | | 15,836 | | | | 925,456 | |
WEC Energy Group, Inc. | | | 74,555 | | | | 4,576,186 | |
| | | | | | | | |
| | | | 35,326,905 | |
| | | | | | | | |
Oil, Gas & Consumable Fuels 4.7% | |
Apache Corp. | | | 4,488 | | | | 215,110 | |
Cabot Oil & Gas Corp. | | | 13,241 | | | | 332,084 | |
| | | | |
| 12 | | MainStay VP Mid Cap Core Portfolio | | The notes to the financial statements are an integral part of,
and should be read in conjunction with, the financial statements. |
| | | | | | | | |
| | |
| | | Shares | | | Value | |
| Common Stocks (continued) | |
Oil, Gas & Consumable Fuels (continued) | |
Cimarex Energy Co. | | | 2,713 | | | $ | 255,049 | |
Concho Resources, Inc. (a) | | | 9,142 | | | | 1,111,027 | |
CONSOL Energy, Inc. (a) | | | 218,457 | | | | 3,263,748 | |
Devon Energy Corp. | | | 100,825 | | | | 3,223,375 | |
Diamondback Energy, Inc. (a) | | | 1,861 | | | | 165,276 | |
EQT Corp. | | | 12,662 | | | | 741,867 | |
Hess Corp. | | | 10,382 | | | | 455,458 | |
HollyFrontier Corp. | | | 208,302 | | | | 5,722,056 | |
Marathon Oil Corp. | | | 108,425 | | | | 1,284,836 | |
¨Marathon Petroleum Corp. | | | 165,124 | | | | 8,640,939 | |
Murphy Oil Corp. | | | 3,617 | | | | 92,704 | |
Newfield Exploration Co. (a) | | | 717 | | | | 20,406 | |
Noble Energy, Inc. | | | 25,131 | | | | 711,207 | |
ONEOK, Inc. | | | 52,525 | | | | 2,739,704 | |
Parsley Energy, Inc. Class A (a) | | | 1,290 | | | | 35,798 | |
Southwestern Energy Co. (a) | | | 45,815 | | | | 278,555 | |
Tesoro Corp. | | | 5,040 | | | | 471,744 | |
Whiting Petroleum Corp. (a) | | | 430,638 | | | | 2,372,815 | |
¨Williams Cos., Inc. | | | 274,951 | | | | 8,325,516 | |
World Fuel Services Corp. | | | 72,943 | | | | 2,804,658 | |
| | | | | | | | |
| | | | 43,263,932 | |
| | | | | | | | |
Personal Products 0.6% | |
Nu Skin Enterprises, Inc., Class A | | | 92,536 | | | | 5,814,962 | |
| | | | | | | | |
|
Pharmaceuticals 0.1% | |
Akorn, Inc. (a) | | | 21,737 | | | | 729,059 | |
| | | | | | | | |
|
Professional Services 1.3% | |
ManpowerGroup, Inc. | | | 56,442 | | | | 6,301,749 | |
Robert Half International, Inc. | | | 121,885 | | | | 5,841,948 | |
| | | | | | | | |
| | | | 12,143,697 | |
| | | | | | | | |
Real Estate Management & Development 0.6% | |
Realogy Holdings Corp. | | | 167,285 | | | | 5,428,398 | |
| | | | | | | | |
|
Semiconductors & Semiconductor Equipment 4.6% | |
Analog Devices, Inc. | | | 21,762 | | | | 1,693,084 | |
Cree, Inc. (a) | | | 116,479 | | | | 2,871,207 | |
First Solar, Inc. (a) | | | 74,070 | | | | 2,953,912 | |
KLA-Tencor Corp. | | | 14,893 | | | | 1,362,858 | |
¨Lam Research Corp. | | | 54,835 | | | | 7,755,314 | |
Micron Technology, Inc. (a) | | | 158,704 | | | | 4,738,902 | |
Microsemi Corp. (a) | | | 3,138 | | | | 146,858 | |
NVIDIA Corp. | | | 25,188 | | | | 3,641,177 | |
ON Semiconductor Corp. (a) | | | 375,719 | | | | 5,275,095 | |
Qorvo, Inc. (a) | | | 38,735 | | | | 2,452,700 | |
Skyworks Solutions, Inc. | | | 73,733 | | | | 7,074,681 | |
Teradyne, Inc. | | | 82,283 | | | | 2,470,959 | |
| | | | | | | | |
| | | | 42,436,747 | |
| | | | | | | | |
| | | | | | | | |
| | |
| | | Shares | | | Value | |
Software 3.1% | |
Cadence Design Systems, Inc. (a) | | | 185,570 | | | $ | 6,214,739 | |
Citrix Systems, Inc. (a) | | | 21,050 | | | | 1,675,159 | |
Dell Technologies, Inc. Class V (a) | | | 13,818 | | | | 844,418 | |
Electronic Arts, Inc. (a) | | | 44,381 | | | | 4,691,959 | |
Fortinet, Inc. (a) | | | 145,784 | | | | 5,458,153 | |
Nuance Communications, Inc. (a) | | | 176,914 | | | | 3,080,073 | |
Red Hat, Inc. (a) | | | 28,182 | | | | 2,698,427 | |
SS&C Technologies Holdings, Inc. | | | 779 | | | | 29,922 | |
Synopsys, Inc. (a) | | | 17,309 | | | | 1,262,345 | |
Take-Two Interactive Software, Inc. (a) | | | 40,027 | | | | 2,937,181 | |
| | | | | | | | |
| | | | 28,892,376 | |
| | | | | | | | |
Specialty Retail 2.9% | |
Best Buy Co., Inc. | | | 128,969 | | | | 7,393,793 | |
Burlington Stores, Inc. (a) | | | 34,199 | | | | 3,145,966 | |
GameStop Corp. Class A | | | 232,184 | | | | 5,017,496 | |
Gap, Inc. | | | 125,650 | | | | 2,763,044 | |
Signet Jewelers, Ltd. | | | 45,483 | | | | 2,876,345 | |
Staples, Inc. | | | 102,685 | | | | 1,034,038 | |
Williams-Sonoma, Inc. | | | 93,007 | | | | 4,510,839 | |
| | | | | | | | |
| | | | 26,741,521 | |
| | | | | | | | |
Technology Hardware, Storage & Peripherals 2.1% | |
NCR Corp. (a) | | | 125,881 | | | | 5,140,980 | |
NetApp, Inc. | | | 113,464 | | | | 4,544,233 | |
¨Western Digital Corp. | | | 95,488 | | | | 8,460,237 | |
Xerox Corp. | | | 47,189 | | | | 1,355,740 | |
| | | | | | | | |
| | | | 19,501,190 | |
| | | | | | | | |
Textiles, Apparel & Luxury Goods 0.6% | |
Michael Kors Holdings, Ltd. (a) | | | 160,271 | | | | 5,809,824 | |
Ralph Lauren Corp. | | | 1,978 | | | | 145,976 | |
| | | | | | | | |
| | | | 5,955,800 | |
| | | | | | | | |
Trading Companies & Distributors 0.9% | |
United Rentals, Inc. (a) | | | 57,025 | | | | 6,427,288 | |
W.W. Grainger, Inc. | | | 10,597 | | | | 1,913,076 | |
| | | | | | | | |
| | | | 8,340,364 | |
| | | | | | | | |
Wireless Telecommunication Services 0.1% | |
Sprint Corp. (a) | | | 145,620 | | | | 1,195,540 | |
| | | | | | | | |
Total Common Stocks
(Cost $790,717,311) | | | | 907,836,940 | |
| | | | | | | | |
|
| Exchange-Traded Funds (b) 1.7% | |
SPDR S&P 500 ETF Trust | | | 6,682 | | | | 1,615,707 | |
¨SPDR S&P MidCap 400 ETF Trust | | | 45,190 | | | | 14,353,248 | |
| | | | | | | | |
Total Exchange-Traded Funds
(Cost $13,532,930) | | | | 15,968,955 | |
| | | | | | | | |
| | | | | | |
The notes to the financial statements are an integral part of,
and should be read in conjunction with, the financial statements. | | | | | 13 | |
Portfolio of Investments June 30, 2017 (Unaudited) (continued)
| | | | | | | | |
| | | Number of Rights | | | Value | |
| Rights 0.0%‡ | |
Food & Staples Retailing 0.0%‡ | |
Safeway Casa Ley CVR
Expires 1/30/19 (a)(c)(d) | | | 24,754 | | | $ | 25,123 | |
Safeway PDC LLC CVR
Expires 1/30/18 (a)(d) | | | 24,754 | | | | 421 | |
| | | | | | | | |
Total Rights
(Cost $26,331) | | | | 25,544 | |
| | | | | | | | |
| | |
| | | | | | | | |
| | | Principal
Amount | | | | |
| Short-Term Investment 0.1% | |
Repurchase Agreement 0.1% | |
Fixed Income Clearing Corp.
0.12%, dated 6/30/17
due 7/3/17
Proceeds at Maturity $459,167 (Collateralized by a United States Treasury Note with a rate of 1.25% and a maturity date of 10/31/21, with a Principal Amount of $480,000 and a Market Value of $470,489) | | $ | 459,162 | | | | 459,162 | |
| | | | | | | | |
Total Short-Term Investment
(Cost $459,162) | | | | 459,162 | |
| | | | | | | | |
Total Investments
(Cost $804,735,734) (e) | | | 100.0 | % | | | 924,290,601 | |
Other Assets, Less Liabilities | | | 0.0 | ‡ | | | 175,210 | |
Net Assets | | | 100.0 | % | | $ | 924,465,811 | |
| ‡ | Less than one-tenth of a percent. |
| (a) | Non-income producing security. |
| (b) | Exchange-Traded Fund—An investment vehicle that represents a basket of securities that is traded on an exchange. |
| (c) | Fair valued security—Represents fair value as measured in good faith under procedures approved by the Board of Trustees. As of June 30, 2017, the total market value of this security was $25,123, which represented less than one-tenth of a percent of the Portfolio’s net assets. |
| (d) | Illiquid security—As of June 30, 2017, the total market value of these securities deemed illiquid under procedures approved by the Board of Trustees was $25,544, which represented less than one-tenth of a percent of the Portfolio’s net assets. |
| (e) | As of June 30, 2017, cost was $813,129,268 for federal income tax purposes and net unrealized appreciation was as follows: |
| | | | |
Gross unrealized appreciation | | $ | 132,494,242 | |
Gross unrealized depreciation | | | (21,332,909 | ) |
| | | | |
Net unrealized appreciation | | $ | 111,161,333 | |
| | | | |
The following abbreviations are used in the preceding pages:
CVR—Contingent Value Right
ETF—Exchange-Traded Fund
SPDR—Standard & Poor’s Depositary Receipt
| | | | |
| 14 | | MainStay VP Mid Cap Core Portfolio | | The notes to the financial statements are an integral part of,
and should be read in conjunction with, the financial statements. |
The following is a summary of the fair valuations according to the inputs used as of June 30, 2017, for valuing the Portfolio’s assets.
Asset Valuation Inputs
| | | | | | | | | | | | | | | | |
Description | | Quoted
Prices in
Active
Markets for
Identical
Assets (Level 1) | | | Significant
Other
Observable
Inputs (Level 2) | | | Significant
Unobservable
Inputs (Level 3) | | | Total | |
| Investments in Securities (a) | | | | | | | | | | | | | | | | |
| Common Stocks | | $ | 907,836,940 | | | $ | — | | | $ | — | | | $ | 907,836,940 | |
| Exchange-Traded Funds | | | 15,968,955 | | | | — | | | | — | | | | 15,968,955 | |
| Rights (b) | | | — | | | | 421 | | | | 25,123 | | | | 25,544 | |
| Short-Term Investment | | | | | | | | | | | | | | | | |
Repurchase Agreement | | | — | | | | 459,162 | | | | — | | | | 459,162 | |
| | | | | | | | | | | | | | | | |
| Total Investments in Securities | | $ | 923,805,895 | | | $ | 459,583 | | | $ | 25,123 | | | $ | 924,290,601 | |
| | | | | | | | | | | | | | | | |
| (a) | For a complete listing of investments and their industries, see the Portfolio of Investments. |
| (b) | The Level 3 security valued at $25,123 is held in Food & Staples Retailing within the Rights section of the Portfolio of Investments. |
The Portfolio recognizes transfers between the levels as of the beginning of the period.
For the period ended June 30, 2017, the Portfolio did not have any transfers between Level 1 and Level 2 fair value measurements. (See Note 2)
As of June 30, 2017, a security with a market value of $1,208 transferred from Level 3 to Level 2. The transfer occurred as a result of utilizing significant observable inputs. As of December 31, 2016, the fair value obtained for this security, utilized significant unobservable inputs. (See Note 2)
The following is a reconciliation of investments in which significant unobservable inputs (Level 3) were used in determining value:
| | | | | | | | | | | | | | | | | | | | | | | | | | | | | | | | | | | | | | | | | | |
Investments in Securities | | Balance
as of
December 31, 2016 | | | Accrued
Discounts
(Premiums) | | | Realized
Gain (Loss) | | | Change in
Unrealized
Appreciation
(Depreciation) | | | Purchases | | | Sales | | | Transfers in to
Level 3 | | | Transfers out of
Level 3 | | | Balance
as of
June 30, 2017 | | | Change in
Unrealized
Appreciation
(Depreciation)
from
Investments
Still Held as of
June 30,
2017 | |
| Rights | |
Food & Staples Retailing | | $ | 26,331 | | | $ | — | | | $ | — | | | $ | — | | | $ | — | | | $ | — | | | $ | — | | | $ | (1,208 | ) | | $ | 25,123 | | | $ | — | |
| | | | | | | | | | | | | | | | | | | | | | | | | | | | | | | | | | | | | | | | | | |
| | | | | | |
The notes to the financial statements are an integral part of,
and should be read in conjunction with, the financial statements. | | | | | 15 | |
Statement of Assets and Liabilities as of June 30, 2017 (Unaudited)
| | | | |
| Assets | |
Investment in securities, at value (identified cost $804,735,734) | | $ | 924,290,601 | |
Receivables: | |
Dividends and interest | | | 1,012,875 | |
Fund shares sold | | | 262,768 | |
Other assets | | | 5,637 | |
| | | | |
Total assets | | | 925,571,881 | |
| | | | |
|
| Liabilities | |
Payables: | |
Manager (See Note 3) | | | 637,434 | |
Fund shares redeemed | | | 224,151 | |
Shareholder communication | | | 96,150 | |
NYLIFE Distributors (See Note 3) | | | 92,722 | |
Custodian | | | 24,470 | |
Professional fees | | | 23,344 | |
Trustees | | | 1,716 | |
Accrued expenses | | | 6,083 | |
| | | | |
Total liabilities | | | 1,106,070 | |
| | | | |
Net assets | | $ | 924,465,811 | |
| | | | |
|
Composition of Net Assets | |
Shares of beneficial interest outstanding (par value of $.001 per share) unlimited number of shares authorized | | $ | 65,346 | |
Additional paid-in capital | | | 726,245,429 | |
| | | | |
| | | 726,310,775 | |
Undistributed net investment income | | | 13,389,830 | |
Accumulated net realized gain (loss) on investments | | | 65,210,339 | |
Net unrealized appreciation (depreciation) on investments | | | 119,554,867 | |
| | | | |
Net assets | | $ | 924,465,811 | |
| | | | |
| | | | |
Initial Class | |
Net assets applicable to outstanding shares | | $ | 474,599,788 | |
| | | | |
Shares of beneficial interest outstanding | | | 33,294,515 | |
| | | | |
Net asset value per share outstanding | | $ | 14.25 | |
| | | | |
Service Class | |
Net assets applicable to outstanding shares | | $ | 449,866,023 | |
| | | | |
Shares of beneficial interest outstanding | | | 32,051,510 | |
| | | | |
Net asset value per share outstanding | | $ | 14.04 | |
| | | | |
| | | | |
| 16 | | MainStay VP Mid Cap Core Portfolio | | The notes to the financial statements are an integral part of,
and should be read in conjunction with, the financial statements. |
Statement of Operations for the six months ended June 30, 2017 (Unaudited)
| | | | |
| Investment Income (Loss) | | | | |
Income | |
Dividends | | $ | 8,489,149 | |
Interest | | | 66 | |
| | | | |
Total income | | | 8,489,215 | |
| | | | |
Expenses | |
Manager (See Note 3) | | | 3,993,398 | |
Distribution/Service—Service Class (See Note 3) | | | 554,623 | |
Shareholder communication | | | 73,074 | |
Professional fees | | | 42,935 | |
Custodian | | | 12,775 | |
Trustees | | | 12,119 | |
Miscellaneous | | | 20,416 | |
| | | | |
Total expenses before waiver/reimbursement | | | 4,709,340 | |
Expense waiver/reimbursement from Manager (See Note 3) | | | (113,623 | ) |
| | | | |
Net expenses | | | 4,595,717 | |
| | | | |
Net investment income (loss) | | | 3,893,498 | |
| | | | |
|
| Realized and Unrealized Gain (Loss) on Investments | |
Net realized gain (loss) on investments | | | 62,368,828 | |
Net change in unrealized appreciation (depreciation) on investments | | | (3,183,002 | ) |
| | | | |
Net realized and unrealized gain (loss) on investments | | | 59,185,826 | |
| | | | |
Net increase (decrease) in net assets resulting from operations | | $ | 63,079,324 | |
| | | | |
| | | | | | |
The notes to the financial statements are an integral part of,
and should be read in conjunction with, the financial statements. | | | | | 17 | |
Statements of Changes in Net Assets
for the six months ended June 30, 2017 (Unaudited) and the year ended December 31, 2016
| | | | | | | | |
| | | 2017 | | | 2016 | |
| Increase (Decrease) in Net Assets | |
Operations: | |
Net investment income (loss) | | $ | 3,893,498 | | | $ | 9,307,333 | |
Net realized gain (loss) on investments | | | 62,368,828 | | | | 10,420,223 | |
Net change in unrealized appreciation (depreciation) on investments | | | (3,183,002 | ) | | | 83,937,878 | |
| | | | |
Net increase (decrease) in net assets resulting from operations | | | 63,079,324 | | | | 103,665,434 | |
| | | | |
Dividends and distributions to shareholders: | | | | | | | | |
From net investment income: | |
Initial Class | | | — | | | | (4,481,020 | ) |
Service Class | | | — | | | | (2,361,678 | ) |
| | | | |
| | | — | | | | (6,842,698 | ) |
| | | | |
From net realized gain on investments: | |
Initial Class | | | — | | | | (36,976,648 | ) |
Service Class | | | — | | | | (29,027,147 | ) |
| | | | |
| | | — | | | | (66,003,795 | ) |
| | | | |
Total dividends and distributions to shareholders | | | — | | | | (72,846,493 | ) |
| | | | |
Capital share transactions: | |
Net proceeds from sale of shares | | | 35,261,035 | | | | 95,251,344 | |
Net asset value of shares issued to shareholders in reinvestment of dividends and distributions | | | — | | | | 72,846,493 | |
Cost of shares redeemed | | | (167,943,744 | ) | | | (137,358,544 | ) |
| | | | |
Increase (decrease) in net assets derived from capital share transactions | | | (132,682,709 | ) | | | 30,739,293 | |
| | | | |
Net increase (decrease) in net assets | | | (69,603,385 | ) | | | 61,558,234 | |
|
| Net Assets | |
Beginning of period | | | 994,069,196 | | | | 932,510,962 | |
| | | | |
End of period | | $ | 924,465,811 | | | $ | 994,069,196 | |
| | | | |
Undistributed net investment income at end of period | | $ | 13,389,830 | | | $ | 9,496,332 | |
| | | | |
| | | | |
| 18 | | MainStay VP Mid Cap Core Portfolio | | The notes to the financial statements are an integral part of,
and should be read in conjunction with, the financial statements. |
Financial Highlights selected per share data and ratios
| | | | | | | | | | | | | | | | | | | | | | | | | | | | |
| | | Six months
ended
June 30, | | | | | | Year ended December 31, | |
| Initial Class | | 2017* | | | | | | 2016 | | | 2015 | | | 2014 | | | 2013 | | | 2012 | |
Net asset value at beginning of period | | $ | 13.37 | | | | | | | $ | 13.00 | | | $ | 15.83 | | | $ | 16.18 | | | $ | 12.23 | | | $ | 11.40 | |
| | | | | | | | | | | | | | | | | | | | | | | | | | | | |
Net investment income (loss) (a) | | | 0.06 | | | | | | | | 0.13 | | | | 0.13 | | | | 0.10 | | | | 0.12 | | | | 0.17 | |
Net realized and unrealized gain (loss) on investments | | | 0.82 | | | | | | | | 1.28 | | | | (0.73 | ) | | | 2.07 | | | | 4.93 | | | | 1.80 | |
| | | | | | | | | | | | | | | | | | | | | | | | | | | | |
Total from investment operations | | | 0.88 | | | | | | | | 1.41 | | | | (0.60 | ) | | | 2.17 | | | | 5.05 | | | | 1.97 | |
| | | | | | | | | | | | | | | | | | | | | | | | | | | | |
| Less dividends and distributions: | | | | | | | | | | | | | | | | | | | | | | | | | | | | |
From net investment income | | | — | | | | | | | | (0.11 | ) | | | (0.09 | ) | | | (0.09 | ) | | | (0.16 | ) | | | (0.10 | ) |
From net realized gain on investments | | | — | | | | | | | | (0.93 | ) | | | (2.14 | ) | | | (2.43 | ) | | | (0.94 | ) | | | (1.04 | ) |
| | | | | | | | | | | | | | | | | | | | | | | | | | | | |
Total dividends and distributions | | | — | | | | | | | | (1.04 | ) | | | (2.23 | ) | | | (2.52 | ) | | | (1.10 | ) | | | (1.14 | ) |
| | | | | | | | | | | | | | | | | | | | | | | | | | | | |
Net asset value at end of period | | $ | 14.25 | | | | | | | $ | 13.37 | | | $ | 13.00 | | | $ | 15.83 | | | $ | 16.18 | | | $ | 12.23 | |
| | | | | | | | | | | | | | | | | | | | | | | | | | | | |
Total investment return (b) | | | 6.58 | %(c) | | | | | | | 11.17 | % | | | (3.68 | %) | | | 14.38 | % | | | 42.18 | % | | | 17.52 | % |
| Ratios (to average net assets)/Supplemental Data: | | | | | | | | | | | | | | | | | | | | | | | | | | | | |
Net investment income (loss) | | | 0.93 | %†† | | | | | | | 1.09 | % | | | 0.88 | % | | | 0.62 | % | | | 0.79 | % | | | 1.38 | % |
Net expenses | | | 0.86 | %†† | | | | | | | 0.86 | % | | | 0.86 | % | | | 0.85 | % | | | 0.85 | % | | | 0.89 | % |
Expenses (before waiver/reimbursement) | | | 0.88 | %†† | | | | | | | 0.89 | % | | | 0.88 | % | | | 0.88 | % | | | 0.89 | % | | | — | |
Portfolio turnover rate | | | 80 | % | | | | | | | 164 | % | | | 174 | % | | | 172 | % | | | 167 | % | | | 186 | % |
Net assets at end of period (in 000’s) | | $ | 474,600 | | | | | | | $ | 558,783 | | | $ | 506,368 | | | $ | 440,409 | | | $ | 397,964 | | | $ | 231,959 | |
| (a) | Per share data based on average shares outstanding during the period. |
| (b) | Total return does not reflect any deduction of sales charges, mortality and expense charges, contract charges or administrative charges. For periods of less than one year, total return is not annualized. |
| (c) | Total investment return may reflect adjustments to conform to generally accepted accounting principles. |
| | | | | | | | | | | | | | | | | | | | | | | | | | | | |
| | | Six months
ended
June 30, | | | | | | Year ended December 31, | |
| Service Class | | 2017* | | | | | | 2016 | | | 2015 | | | 2014 | | | 2013 | | | 2012 | |
Net asset value at beginning of period | | $ | 13.18 | | | | | | | $ | 12.83 | | | $ | 15.64 | | | $ | 16.03 | | | $ | 12.13 | | | $ | 11.31 | |
| | | | | | | | | | | | | | | | | | | | | | | | | | | | |
Net investment income (loss) (a) | | | 0.05 | | | | | | | | 0.12 | | | | 0.09 | | | | 0.06 | | | | 0.08 | | | | 0.15 | |
Net realized and unrealized gain (loss) on investments | | | 0.81 | | | | | | | | 1.24 | | | | (0.71 | ) | | | 2.03 | | | | 4.89 | | | | 1.78 | |
| | | | | | | | | | | | | | | | | | | | | | | | | | | | |
Total from investment operations | | | 0.86 | | | | | | | | 1.36 | | | | (0.62 | ) | | | 2.09 | | | | 4.97 | | | | 1.93 | |
| | | | | | | | | | | | | | | | | | | | | | | | | | | | |
| Less dividends and distributions: | | | | | | | | | | | | | | | | | | | | | | | | | | | | |
From net investment income | | | — | | | | | | | | (0.08 | ) | | | (0.05 | ) | | | (0.05 | ) | | | (0.13 | ) | | | (0.07 | ) |
From net realized gain on investments | | | — | | | | | | | | (0.93 | ) | | | (2.14 | ) | | | (2.43 | ) | | | (0.94 | ) | | | (1.04 | ) |
| | | | | | | | | | | | | | | | | | | | | | | | | | | | |
Total dividends and distributions | | | — | | | | | | | | (1.01 | ) | | | (2.19 | ) | | | (2.48 | ) | | | (1.07 | ) | | | (1.11 | ) |
| | | | | | | | | | | | | | | | | | | | | | | | | | | | |
Net asset value at end of period | | $ | 14.04 | | | | | | | $ | 13.18 | | | $ | 12.83 | | | $ | 15.64 | | | $ | 16.03 | | | $ | 12.13 | |
| | | | | | | | | | | | | | | | | | | | | | | | | | | | |
Total investment return (b) | | | 6.53 | %(c) | | | | | | | 10.89 | % | | | (3.92 | %) | | | 14.10 | % | | | 41.82 | % | | | 17.22 | % |
| Ratios (to average net assets)/Supplemental Data: | | | | | | | | | | | | | | | | | | | | | | | | | | | | |
Net investment income (loss) | | | 0.71 | %†† | | | | | | | 0.83 | % | | | 0.61 | % | | | 0.37 | % | | | 0.53 | % | | | 1.26 | % |
Net expenses | | | 1.11 | %†† | | | | | | | 1.11 | % | | | 1.11 | % | | | 1.10 | % | | | 1.10 | % | | | 1.14 | % |
Expenses (before waiver/reimbursement) | | | 1.13 | %†† | | | | | | | 1.14 | % | | | 1.13 | % | | | 1.13 | % | | | 1.14 | % | | | — | |
Portfolio turnover rate | | | 80 | % | | | | | | | 164 | % | | | 174 | % | | | 172 | % | | | 167 | % | | | 186 | % |
Net assets at end of period (in 000’s) | | $ | 449,866 | | | | | | | $ | 435,287 | | | $ | 426,143 | | | $ | 479,799 | | | $ | 420,462 | | | $ | 282,772 | |
| (a) | Per share data based on average shares outstanding during the period. |
| (b) | Total return does not reflect any deduction of sales charges, mortality and expense charges, contract charges or administrative charges. For periods of less than one year, total return is not annualized. |
| (c) | Total investment return may reflect adjustments to conform to generally accepted accounting principles. |
| | | | | | |
The notes to the financial statements are an integral part of,
and should be read in conjunction with, the financial statements. | | | | | 19 | |
Notes to Financial Statements (Unaudited)
Note 1–Organization and Business
MainStay VP Funds Trust (the “Fund”) was organized as a Delaware statutory trust on February 1, 2011. The Fund is registered under the Investment Company Act of 1940, as amended (the “1940 Act”), as an open-end management investment company. The Fund is comprised of thirty-two separate series (collectively referred to as the “Portfolios”). These financial statements and notes relate to the MainStay VP Mid Cap Core Portfolio (the “Portfolio”), a “diversified” portfolio, as that term is defined in the 1940 Act, as interpreted or modified by regulatory authorities having jurisdiction, from time to time.
Shares of the Portfolio are currently offered to certain separate accounts to fund variable annuity policies and variable universal life insurance policies issued by New York Life Insurance and Annuity Corporation (“NYLIAC”), a wholly-owned subsidiary of New York Life Insurance Company (“New York Life”). NYLIAC allocates shares of the Portfolios to, among others, NYLIAC Variable Annuity Separate Accounts-I, II, III and IV, VUL Separate Account-I and CSVUL Separate Account-I (collectively, the “Separate Accounts”). Shares of the Portfolio are also offered to the MainStay VP Conservative Allocation Portfolio, MainStay VP Moderate Allocation Portfolio, MainStay VP Moderate Growth Allocation Portfolio and MainStay VP Growth Allocation Portfolio, which operate as “funds-of-funds.”
The Portfolio currently offers two classes of shares. Initial Class shares commenced operations on July 2, 2001. Service Class shares commenced operations on June 5, 2003. Shares of the Portfolio are sold and are redeemed at a price equal to their respective net asset value (“NAV”) per share. No sales or redemption charge is applicable to the purchase or redemption of the Portfolio’s shares. Under the terms of the Fund’s multiple class plan, adopted pursuant to Rule 18f-3 under the 1940 Act, the classes differ in that, among other things, Service Class shares of the Portfolio pay a combined distribution and service fee of 0.25% of average daily net assets attributable to Service Class shares of the Portfolio to the Distributor (as defined in Note 3(B)) pursuant to a plan adopted in accordance with Rule 12b-1 under the 1940 Act. Contract owners of variable annuity contracts purchased after June 2, 2003, are permitted to invest only in the Service Class shares.
The Portfolio’s investment objective is to seek long-term growth of capital.
Note 2–Significant Accounting Policies
The Portfolio is an investment company and accordingly follows the investment company accounting and reporting guidance of the Financial Accounting Standards Board (“FASB”) Accounting Standard Codification Topic 946 Financial Services—Investment Companies. The Portfolio prepares its financial statements in accordance with generally accepted accounting principles (“GAAP”) in the United States of America and follows the significant accounting policies described below.
(A) Securities Valuation. Investments are usually valued as of the close of regular trading on the New York Stock Exchange (the “Exchange”) (usually 4:00 p.m. Eastern time) on each day the Portfolio is open for business (“valuation date”).
The Board of Trustees (the “Board”) of the Fund adopted procedures establishing methodologies for the valuation of the Portfolio’s securities and other assets and delegated the responsibility for valuation determi-
nations under those procedures to the Valuation Committee of the Fund (the “Valuation Committee”). The Board authorized the Valuation Committee to appoint a Valuation Sub-Committee (the “Sub-Committee”) to deal in the first instance with establishing the prices of securities for which market quotations are not readily available or the prices of which are not otherwise readily determinable under these procedures. The Sub-Committee meets (in person, via electronic mail or via teleconference) on an as-needed basis. Subsequently, the Valuation Committee meets to ensure that actions taken by the Sub-Committee were appropriate. The procedures recognize that, subject to the oversight of the Board and unless otherwise noted, the responsibility for the day-to-day valuation of portfolio assets (including fair value measurements for the Portfolio’s assets and liabilities) rests with New York Life Investment Management LLC (“New York Life Investments” or the “Manager”), aided to whatever extent necessary by the Subadvisor (as defined in Note 3(A)) to the Portfolio.
To assess the appropriateness of security valuations, the Manager, the Subadvisor or the Portfolio’s third party service provider, who is subject to oversight by the Manager, regularly compares prior day prices, prices on comparable securities and the sale prices to the prior and current day prices and challenges prices with changes exceeding certain tolerance levels with third party pricing services or broker sources. For those securities valued through either a standardized fair valuation methodology or a fair valuation measurement, the Sub-Committee deals in the first instance with such valuation and the Valuation Committee reviews and affirms, if appropriate, the reasonableness of the valuation based on such methodologies and measurements on a regular basis after considering all relevant information that is reasonably available. Any action taken by the Sub-Committee with respect to the valuation of a portfolio security or other asset is submitted by the Valuation Committee to the Board for its review and ratification, if appropriate, at its next regularly scheduled meeting.
“Fair value” is defined as the price the Portfolio would reasonably expect to receive upon selling an asset or liability in an orderly transaction to an independent buyer in the principal or most advantageous market for the asset or liability. Fair value measurements are determined within a framework that establishes a three-tier hierarchy which maximizes the use of observable market data and minimizes the use of unobservable inputs to establish a classification of fair value measurements for disclosure purposes. “Inputs” refer broadly to the assumptions that market participants would use in pricing the asset or liability, including assumptions about risk, such as the risk inherent in a particular valuation technique used to measure fair value using a pricing model and/or the risk inherent in the inputs for the valuation technique. Inputs may be observable or unobservable. Observable inputs reflect the assumptions market participants would use in pricing the asset or liability based on market data obtained from sources independent of the Portfolio. Unobservable inputs reflect the Portfolio’s own assumptions about the assumptions market participants would use in pricing the asset or liability based on the information available. The inputs or methodology used for valuing assets or liabilities may not be an indication of the risks associated with investing in those assets or liabilities. The three-tier hierarchy of inputs is summarized below.
| • | | Level 1—quoted prices in active markets for an identical asset or liability |
| | |
| 20 | | MainStay VP Mid Cap Core Portfolio |
| • | | Level 2—other significant observable inputs (including quoted prices for a similar asset or liability in active markets, interest rates and yield curves, prepayment speeds, credit risk, etc.) |
| • | | Level 3—significant unobservable inputs (including the Portfolio’s own assumptions about the assumptions that market participants would use in measuring fair value of an asset or liability) |
The level of an asset or liability within the fair value hierarchy is based on the lowest level of an input, both individually and in the aggregate, that is significant to the fair value measurement. As of June 30, 2017, the aggregate value by input level of the Portfolio’s assets and liabilities is included at the end of the Portfolio’s Portfolio of Investments.
The Portfolio may use third party vendor evaluations, whose prices may be derived from one or more of the following standard inputs, among others:
| | |
• Reported trades | | • Broker/dealer quotes |
• Two-sided markets | | • Benchmark securities |
• Bids/offers | | • Reference data (corporate actions or material event notices) |
• Industry and economic events | | • Monthly payment information |
An asset or liability for which market values cannot be measured using the methodologies described above is valued by methods deemed reasonable in good faith by the Valuation Committee, following the procedures established by the Board, to represent fair value. Under these procedures, the Portfolio generally uses a market-based approach which may use related or comparable assets or liabilities, recent transactions, market multiples, book values, and other relevant information. The Portfolio may also use an income-based valuation approach in which the anticipated future cash flows of the asset or liability are discounted to calculate fair value. Discounts may also be applied due to the nature and/or duration of any restrictions on the disposition of the asset or liability. Fair value represents a good faith approximation of the value of a security. Fair value determinations involve the consideration of a number of subjective factors, an analysis of applicable facts and circumstances and the exercise of judgment. As a result, it is possible that the fair value for a security determined in good faith in accordance with the Portfolio’s valuation procedures may differ from valuations for the same security determined by other funds using their own valuation procedures. Although the Portfolio’s valuation procedures are designed to value a security at the price the Portfolio may reasonably expect to receive upon the security’s sale in an orderly transaction, there can be no assurance that any fair value determination thereunder would, in fact, approximate the amount that the Portfolio would actually realize upon the sale of the security or the price at which the security would trade if a reliable market price were readily available. During the six-month period ended June 30, 2017, there were no material changes to the fair value methodologies.
Securities which may be valued in this manner include, but are not limited to: (i) a security for which trading has been halted or suspended; (ii) a debt security that has recently gone into default and for which there is not a current market quotation; (iii) a security of an issuer that has entered into a restructuring; (iv) a security that has been de-listed from a national exchange; (v) a security for which the market price is not readily available from a third party pricing source or, if so provided, does
not, in the opinion of the Manager or Subadvisor, reflect the security’s market value; (vi) a security subject to trading collars for which no or limited trading takes place; and (vii) a security whose principal market has been temporarily closed at a time when, under normal conditions, it would be open. Securities for which market quotations or observable inputs are not readily available are generally categorized as Level 3 in the hierarchy. As of June 30, 2017, a security that was fair valued in such a manner is shown in the Portfolio of Investments.
Equity securities, rights and shares of Exchange-Traded Funds (“ETFs”) are valued at the last quoted sales prices as of the close of regular trading on the relevant exchange on each valuation date. Securities that are not traded on the valuation date are valued at the mean of the last quoted bid and ask prices. Prices are normally taken from the principal market in which each security trades. These securities are generally categorized as Level 1 in the hierarchy.
Temporary cash investments acquired in excess of 60 days to maturity at the time of purchase are valued using the latest bid prices or using valuations based on a matrix system (which considers such factors as security prices, yields, maturities, and ratings), both as furnished by independent pricing services. Other temporary cash investments which mature in 60 days or less at the time of purchase (“Short-Term Investments”) are valued using the amortized cost method of valuation, unless the use of such method would be inappropriate. The amortized cost method involves valuing a security at its cost on the date of purchase and thereafter assuming a constant amortization to maturity of the difference between such cost and the value on maturity date. Amortized cost approximates the current fair value of a security. Securities valued using the amortized cost method are not valued using quoted prices in an active market and are generally categorized as Level 2 in the hierarchy.
The information above is not intended to reflect an exhaustive list of the methodologies that may be used to value portfolio investments. The valuation procedures permit the use of a variety of valuation methodologies in connection with valuing portfolio investments. The methodology used for a specific type of investment may vary based on the market data available or other considerations. The methodologies summarized above may not represent the specific means by which portfolio investments are valued on any particular business day.
A portfolio security or other asset may be determined to be illiquid under procedures approved by the Board. Illiquidity of a security might prevent the sale of such security at a time when the Manager or Subadvisor might wish to sell, and these securities could have the effect of decreasing the overall level of the Portfolio’s liquidity. Further, the lack of an established secondary market may make it more difficult to value illiquid securities, requiring the Portfolio to rely on judgments that may be somewhat subjective in measuring value, which could vary materially from the amount that the Portfolio could realize upon disposition. Difficulty in selling illiquid securities may result in a loss or may be costly to the Portfolio. Under the supervision of the Board, the Manager or Subadvisor determines the liquidity of the Portfolio’s investments; in doing so, the Manager or Subadvisor may consider various factors, including (i) the frequency of trades and quotations, (ii) the number of dealers and prospective purchasers, (iii) dealer undertakings to make a market, and (iv) the nature of the security and the market in which it trades (e.g., the time needed to dispose of the security, the method of
Notes to Financial Statements (Unaudited) (continued)
soliciting offers and the mechanics of transfer). Illiquid securities are often valued in accordance with methods deemed by the Board in good faith to be reasonable and appropriate to accurately reflect their fair value. The liquidity of the Portfolio’s investments, as shown in the Portfolio of Investments and was determined as of June 30, 2017 and can change at any time in response to, among other relevant factors, market conditions or events or developments with respect to an individual issuer or instrument. As of June 30, 2017, securities deemed to be illiquid under procedures approved by the Board are shown in the Portfolio of Investments.
(B) Income Taxes. The Portfolio’s policy is to comply with the requirements of the Internal Revenue Code of 1986, as amended (the “Internal Revenue Code”), applicable to regulated investment companies and to distribute all of its taxable income to the shareholders of the Portfolio within the allowable time limits. Therefore, no federal, state and local income tax provisions are required.
Management evaluates the Portfolio’s tax positions to determine if the tax positions taken meet the minimum recognition threshold in connection with accounting for uncertainties in income tax positions taken or expected to be taken for the purposes of measuring and recognizing tax liabilities in the financial statements. Recognition of tax benefits of an uncertain tax position is permitted only to the extent the position is “more likely than not” to be sustained assuming examination by taxing authorities. Management has analyzed the Portfolio’s tax positions taken on federal, state and local income tax returns for all open tax years (for up to three tax years), and has concluded that no provisions for federal, state and local income tax are required in the Portfolio’s financial statements. The Portfolio’s federal, state and local income and federal excise tax returns for tax years for which the applicable statutes of limitations have not expired are subject to examination by the Internal Revenue Service and state and local departments of revenue.
(C) Dividends and Distributions to Shareholders. Dividends and distributions are recorded on the ex-dividend date. The Portfolio intends to declare and pay dividends from net investment income and distributions from net realized capital and currency gains, if any, at least annually. Unless the shareholder elects otherwise, all dividends and distributions are reinvested in the same class of shares of the Portfolio, at NAV. Dividends and distributions to shareholders are determined in accordance with federal income tax regulations and may differ from GAAP.
(D) Security Transactions and Investment Income. The Portfolio records security transactions on the trade date. Realized gains and losses on security transactions are determined using the identified cost method. Dividend income is recognized on the ex-dividend date; net of any foreign tax withheld at the source, and interest income is accrued as earned using the effective interest rate method and includes any realized gains and losses from repayment of principal on mortgage-backed securities. Discounts and premiums on Short-Term Investments are accreted and amortized, respectively, on the straight-line method. The straight-line method approximates the effective interest method for Short-Term Investments.
Investment income and realized and unrealized gains and losses on investments of the Portfolio are allocated pro rata to the separate classes of shares based upon their relative net assets on the date the
income is earned or realized and unrealized gains and losses are incurred.
(E) Expenses. Expenses of the Fund are allocated to the individual Portfolios in proportion to the net assets of the respective Portfolios when the expenses are incurred, except where direct allocations of expenses can be made. Expenses (other than fees incurred under the distribution and service plans, further discussed in Note 3(B), which are charged directly to the Service Class shares) are allocated to separate classes of shares pro rata based upon their relative net assets on the date the expenses are incurred. The expenses borne by the Portfolio, including those of related parties to the Portfolio, are shown in the Statement of Operations. Additionally, the Portfolio may invest in shares of ETFs, which are subject to management fees and other fees that may increase their costs versus the costs of owning the underlying securities directly. These indirect expenses of ETFs are not included in the amounts shown as expenses on the Portfolio’s Statement of Operations or in the expense ratios included in the financial highlights.
(F) Use of Estimates. In preparing financial statements in conformity with GAAP, management makes estimates and assumptions that affect the reported amounts and disclosures in the financial statements. Actual results could differ from those estimates.
(G) Repurchase Agreements. The Portfolio may enter into repurchase agreements (i.e., buy a security from another party with the agreement that it be sold back in the future) to earn income. The Portfolio may enter into repurchase agreements only with counterparties, usually financial institutions, that are deemed by the Manager or Subadvisor to be creditworthy, pursuant to guidelines established by the Board. During the term of any repurchase agreement, the Manager or Subadvisor will continue to monitor the creditworthiness of the counterparty. Under the 1940 Act, repurchase agreements are considered to be collateralized loans by the Portfolio to the counterparty secured by the securities transferred to the Portfolio.
Repurchase agreements are subject to counterparty risk, meaning the Portfolio could lose money by the counterparty’s failure to perform under the terms of the agreement. The Portfolio mitigates this risk by ensuring the repurchase agreement is collateralized by cash, U.S. government securities, fixed income securities and/or other securities. The collateral is held by the Portfolio’s custodian valued daily on a mark to market basis to determine if the value, including accrued interest, exceeds the repurchase price. In the event of the counterparty’s default on the obligation to repurchase, the Portfolio has the right to liquidate the collateral and apply the proceeds in satisfaction of the obligation. Under certain circumstances, such as in the event of default or bankruptcy by the counterparty, realization and/or retention of the collateral may be limited or subject to delay, to legal proceedings and possible realized loss to the Portfolio.
(H) Rights and Warrants. Rights are certificates that permit the holder to purchase a certain number of shares, or a fractional share, of a new stock from the issuer at a specific price. Warrants are instruments that entitle the holder to buy an equity security at a specific price for a specific period of time. These investments can provide a greater potential for profit or loss than an equivalent investment in the underlying security. Prices of these investments do not necessarily move in tandem with the prices of the underlying securities.
| | |
| 22 | | MainStay VP Mid Cap Core Portfolio |
There is risk involved in the purchase of rights and warrants in that these investments are speculative investments. The Portfolio could also lose the entire value of its investment in warrants if such warrants are not exercised by the date of its expiration. The Portfolio is exposed to risk until the sale or exercise of each right or warrant is completed. As of June 30, 2017, the Portfolio did not hold any warrants.
(I) Securities Lending. In order to realize additional income, the Portfolio may engage in securities lending, subject to the limitations set forth in the 1940 Act and relevant guidance by the staff of the Securities and Exchange Commission (“SEC”). In the event the Portfolio does engage in securities lending, the Portfolio will lend through its custodian, State Street Bank and Trust Company (“State Street”). State Street will manage the Portfolio’s collateral in accordance with the lending agreement between the Portfolio and State Street, and indemnify the Portfolio against counterparty risk. The loans will be collateralized by U.S. Treasury securities at least equal at all times to the market value of the securities loaned. The Portfolio may bear the risk of delay in recovery of, or loss of rights in, the securities loaned should the borrower of the securities experience financial difficulty. The Portfolio may also record a realized gain or loss on securities deemed sold due to a borrower’s inability to return securities on loan. The Portfolio bears the risk of any loss on investment of the collateral. The Portfolio will receive compensation for lending its securities in the form of fees or it will retain a portion of interest on the investment of any cash received as collateral. The Portfolio will also continue to receive interest and dividends on the securities loaned and any gain or loss in the market price of the securities loaned that may occur during the term of the loan will be for the account of the Portfolio. During the six-month period ended June 30, 2017, the Portfolio did not have any portfolio securities on loan.
(J) Indemnifications. Under the Fund’s organizational documents, its officers and trustees are indemnified against certain liabilities that may arise out of performance of their duties to the Fund. Additionally, in the normal course of business, the Portfolio enters into contracts with third-party service providers that contain a variety of representations and warranties and which may provide general indemnifications. The Portfolio’s maximum exposure under these arrangements is unknown, as this would involve future claims that may be made against the Portfolio that have not yet occurred. Based on experience, management is of the view that the risk of loss in connection with these potential indemnification obligations is remote. However, there can be no assurance that material liabilities related to such obligations will not arise in the future, which could adversely impact the Portfolio.
Note 3–Fees and Related Party Transactions
(A) Manager and Subadvisor. New York Life Investments, a registered investment adviser and an indirect, wholly-owned subsidiary of New York Life, serves as the Portfolio’s Manager pursuant to an Amended and Restated Management Agreement (“Management Agreement”). The Manager provides offices, conducts clerical, recordkeeping and bookkeeping services, and keeps most of the financial and accounting records required to be maintained by the Portfolio. Except for the portion of salaries and expenses that are the responsibility of the Portfolio, the Manager pays the salaries and expenses of all personnel affiliated with the Portfolio and certain operational expenses of the
Portfolio. The Portfolio reimburses New York Life Investments in an amount equal to a portion of the compensation of the Chief Compliance Officer attributable to the Portfolio. Cornerstone Capital Managment Holdings LLC (“Cornerstone Holdings”), a registered investment adviser, serves as Subadvisor to the Portfolio and is responsible for the day-to-day portfolio management of the Portfolio. Pursuant to the terms of a Subadvisory Agreement (“Subadvisory Agreement”) between New York Life Investments and Cornerstone Holdings, New York Life Investments pays for the services of the Subadvisor.
The Fund, on behalf of the Portfolio, pays New York Life Investments in its capacity as the Portfolio’s investment manager and administrator, pursuant to the Management Agreement, a monthly fee for the services performed and facilities furnished at an annual percentage of the Portfolio’s average daily net assets as follows: 0.85% up to $1 billion; and 0.80% in excess of $1 billion. New York Life Investments has contractually agreed to waive fees and/or reimburse expenses so that the total annual operating expenses (excluding taxes, interest, litigation, extraordinary expenses, brokerage and other transaction expenses relating to the purchase or sale of portfolio investments, and acquired (underlying) fund fees and expenses) do not exceed 0.86% for the Initial Class shares and 1.11% for Service Class shares. This agreement expires on May 1, 2018 and may only be amended or terminated prior to that date by action of the Board. During the six-month period ended June 30, 2017, the effective management fee rate was 0.85%.
During the six-month period ended June 30, 2017, New York Life Investments earned fees from the Portfolio in the amount of $3,993,398 and waived fees/reimbursed expenses in the amount of $113,623.
State Street provides sub-administration and sub-accounting services to the Portfolio pursuant to an agreement with New York Life Investments. These services include calculating the daily NAVs of the Portfolio, maintaining the general ledger and sub-ledger accounts for the calculation of the Portfolio’s NAVs, and assisting New York Life Investments in conducting various aspects of the Portfolio’s administrative operations. For providing these services to the Portfolio, State Street is compensated by New York Life Investments.
(B) Distribution and Service Fees The Fund, on behalf of the Portfolio, has entered into a distribution agreement with NYLIFE Distributors LLC (the “Distributor”), an indirect, wholly-owned subsidiary of New York Life. The Portfolio has adopted a distribution plan (the “Plan”) in accordance with the provisions of Rule 12b-1 under the 1940 Act. Under the Plan, the Distributor has agreed to provide, through its affiliates or independent third parties, various distribution-related, shareholder and administrative support services to the Service Class shareholders. For its services, the Distributor is entitled to a combined distribution and service fee accrued daily and paid monthly at an annual rate of 0.25% of the average daily net assets attributable to the Service Class shares of the Portfolio.
Notes to Financial Statements (Unaudited) (continued)
Note 4–Federal Income Tax
During the year ended December 31, 2016, the tax character of distributions paid as reflected in the Statement of Changes in Net Assets was as follows:
| | |
| 2016 |
Tax-Based
Distributions from
Ordinary Income | | Tax-Based
Distributions from
Long-Term Gains |
| $6,842,698 | | $66,003,795 |
Note 5–Custodian
State Street is the custodian of cash and securities held by the Portfolio. Custodial fees are charged to the Portfolio based on the Portfolio’s net assets and/or the market value of securities held by the Portfolio and the number of certain transactions incurred by the Portfolio.
Note 6–Line of Credit
The Portfolio and certain other funds managed by New York Life Investments, maintain a line of credit with a syndicate of banks in order to secure a source of funds for temporary purposes to meet unanticipated or excessive redemption requests.
Effective August 1, 2017, under the credit agreement (the “Credit Agreement”), the aggregate commitment amount is $600,000,000 with an additional uncommitted amount of $100,000,000. The commitment fee is an annual rate of 0.15% of the average commitment amount payable quarterly, regardless of usage, to State Street, who serves as the agent to the syndicate. The commitment fee is allocated among the Portfolio and certain other funds managed by New York Life Investments based upon their respective net assets and other factors. Interest on any revolving credit loan is charged based upon the Federal Funds Rate or the one month LIBOR, whichever is higher. The Credit Agreement expires on July 31, 2018, although the Portfolio, certain other funds managed by New York Life Investments and the syndicate of banks may renew the Credit Agreement for an additional year on the same or different terms. Prior to August 1, 2017, the aggregate commitment amount was $600,000,000 with an additional uncommitted amount of $100,000,000, and the commitment fee, under a credit agreement for which Bank of New York Mellon served as agent, was at an annual rate of 0.15% of the average commitment amount. During the six-month period ended June 30, 2017, there were no borrowings made or outstanding with respect to the Portfolio under the credit agreement for which Bank of New York Mellon served as agent.
Note 7–Interfund Lending Program
Pursuant to an exemptive order issued by the SEC, the Portfolio, along with certain other funds managed by New York Life Investments, may participate in an interfund lending program. The interfund lending program provides an alternative credit facility that permits the Portfolio and certain other funds managed by New York Life Investments to lend or borrow money for temporary purposes directly to or from one another, subject to the conditions of the exemptive order. During the six-month period ended June 30, 2017, there were no interfund loans made or outstanding with respect to the Portfolio.
Note 8–Purchases and Sales of Securities (in 000’s)
During the six-month period ended June 30, 2017, purchases and sales of securities, other than short-term securities, were $757,070 and $885,020, respectively.
Note 9–Capital Share Transactions
Transactions in capital shares for the six-month period ended June 30, 2017, and the year ended December 31, 2016, were as follows:
| | | | | | | | |
Initial Class | | Shares | | | Amount | |
Six-month period ended June 30, 2017: | | | | | | | | |
Shares sold | | | 585,173 | | | $ | 8,171,880 | |
Shares redeemed | | | (9,092,807 | ) | | | (127,418,835 | ) |
| | | | |
Net increase (decrease) | | | (8,507,634 | ) | | $ | (119,246,955 | ) |
| | | | |
Year ended December 31, 2016: | | | | | | | | |
Shares sold | | | 4,134,540 | | | $ | 52,525,855 | |
Shares issued to shareholders in reinvestment of dividends and distributions | | | 3,244,952 | | | | 41,457,668 | |
Shares redeemed | | | (4,526,801 | ) | | | (59,743,346 | ) |
| | | | |
Net increase (decrease) | | | 2,852,691 | | | $ | 34,240,177 | |
| | | | |
| | |
| | | | | | | | |
Service Class | | Shares | | | Amount | |
Six-month period ended June 30, 2017: | | | | | | | | |
Shares sold | | | 1,972,164 | | | $ | 27,089,155 | |
Shares redeemed | | | (2,951,005 | ) | | | (40,524,909 | ) |
| | | | |
Net decrease | | | (978,841 | ) | | $ | (13,435,754 | ) |
| | | | |
Year ended December 31, 2016: | | | | | | | | |
Shares sold | | | 3,303,451 | | | $ | 42,725,489 | |
Shares issued to shareholders in reinvestment of dividends and distributions | | | 2,490,611 | | | | 31,388,825 | |
Shares redeemed | | | (5,984,662 | ) | | | (77,615,198 | ) |
| | | | |
Net increase (decrease) | | | (190,600 | ) | | $ | (3,500,884 | ) |
| | | | |
Note 10–Litigation
The Portfolio has been named as a defendant in the case entitled Kirschner v. FitzSimons, No. 12-2652 (S.D.N.Y.) (the “FitzSimons action”) as a result of its ownership of shares in the Tribune Company (“Tribune”) in 2007 when Tribune effected a leveraged buyout transaction (“LBO”) by which Tribune converted to a privately-held company. In its complaint, the plaintiff asserts claims against certain insiders, major shareholders, professional advisers, and others involved in the LBO. Separately, the complaint also seeks to obtain from former Tribune shareholders, including the Portfolios, any proceeds they received in connection with the LBO. The sole claim and cause of action brought against the Portfolios is for fraudulent conveyance pursuant to United States Bankruptcy Code Section 548(a)(1)(A).
In June 2011, certain Tribune creditors filed numerous additional actions asserting state law constructive fraudulent conveyance claims (the “SLCFC actions”) against specifically-named former Tribune shareholders and, in some cases, putative defendant classes comprised of former Tribune shareholders. One of the SLCFC actions, entitled Deutsche Bank Trust Co. Americas v. Blackrock Institutional Trust Co., No. 11-9319 (S.D.N.Y.) (the “Deutsche Bank action”), named The MainStay Fund as a defendant.
| | |
| 24 | | MainStay VP Mid Cap Core Portfolio |
The FitzSimons action and Deutsche Bank action have been consolidated with the majority of the other Tribune LBO related lawsuits in a multidistrict litigation proceeding entitled In re Tribune Co. Fraudulent Conveyance Litig., No. 11-md-2296 (S.D.N.Y.) (the “MDL Proceeding”).
On September 23, 2013, the District Court granted the defendants’ motion to dismiss the SLCFC actions, including the Deutsche Bank action, on the basis that the plaintiffs did not have standing to pursue their claims. On September 30, 2013, the plaintiffs in the SLCFC actions filed a notice of appeal to the United States Court of Appeals for the Second Circuit. On October 28, 2013, the defendants filed a joint notice of cross-appeal of that same order. On March 29, 2016, the United States Court of Appeals for the Second Circuit issued its opinion on the appeal of the SLCFC actions. The appeals court affirmed the district court’s dismissal of those lawsuits, but on different grounds than the district court. The appeals court held that while the plaintiffs have standing under the U.S. Bankruptcy Code, their claims were preempted by Section 546(e) of the Bankruptcy Code-the statutory safe harbor for settlement payments. On April 12, 2016 the Plaintiffs in the SLCFC actions filed a petition seeking rehearing en banc before the appeals court. On July 22, 2016, the appeals court denied the petition. On September 9, 2016, the plaintiffs filed a petition for writ of certiorari in the U.S. Supreme Court challenging the Second Circuit’s decision that the safe harbor of Section 546(e) applied to their claims. Certain shareholder defendants filed a joint brief in opposition to the petition for certiorari on October 24, 2016. The plaintiffs filed a reply in support of the petition on November 4, 2016. The Supreme Court has not yet granted or denied the petition for certiorari.
On August 2, 2013, the plaintiff in the FitzSimons action filed a Fifth Amended Complaint. On May 23, 2014, the defendants filed motions to dismiss the FitzSimons action, including a global motion to dismiss Count I, which is the claim brought against former Tribune shareholders, for intentional fraudulent conveyance under U.S. federal law.
On January 6, 2017, the United States District Court for the Southern District of New York granted the shareholder defendants’ motion to dismiss the intentional fraudulent conveyance claim in the FitzSimons action. The Court concluded that the plaintiff had failed to allege that Tribune entered the LBO with actual intent to hinder, delay, or defraud its creditors, and therefore the complaint failed to state a claim. In dismissing the intentional fraudulent conveyance claim, the Court
denied the plaintiff’s request to amend the complaint. While the District Court’s order granting the motion to dismiss is not immediately appealable, the plaintiff has asked the Court to direct entry of a final judgment in order to make the order immediately appealable. On February 23, 2017, the Court issued an order stating that it intends to permit an interlocutory appeal of the dismissal order, but will wait to do so until it has resolved outstanding motions to dismiss filed by other defendants. Accordingly, the timing of the appeal is uncertain. The value of the proceeds received by the Portfolios in connection with the LBO and the Portfolio’s cost basis in shares of Tribune was as follows:
| | | | | | | | |
Portfolio | | Proceeds | | | Cost Basis | |
MainStay VP Mid Cap Core | | $ | 808,180 | | | $ | 790,269 | |
At this stage of the proceedings, it would be difficult to assess with any reasonable certainty the probable outcome of the pending litigation or the effect, if any, on the Portfolio’s net asset value.
Note 11–Recent Accounting Pronouncement
In October 2016, the SEC adopted new rules and amended existing rules (together, “final rules”) intended to modernize the reporting and disclosure of information by registered investment companies. In part, the final rules amend Regulation S-X and require standardized, enhanced disclosure about derivatives in investment company financial statements, as well as other amendments. The compliance date for the amendments to Regulation S-X is August 1, 2017 and applies to shareholder reports for funds with fiscal periods ending after August 1, 2017. Management is currently evaluating the impact that the adoption of the amendments to Regulation S-X will have on the Portfolio’s financial statements and related disclosures.
Note 12–Subsequent Events
In connection with the preparation of the financial statements of the Portfolio as of and for the six-month period ended June 30, 2017, events and transactions subsequent to June 30, 2017, through the date the financial statements were issued have been evaluated by the Portfolio’s management for possible adjustment and/or disclosure. No subsequent events requiring financial statement adjustment or disclosure have been identified.
Proxy Voting Policies and Procedures and Proxy Voting Record
A description of the policies and procedures that New York Life Investments uses to vote proxies related to the Portfolio’s securities is available without charge, upon request, (i) by calling 800-598-2019 or (ii) by visiting the SEC’s website at www.sec.gov.
The Portfolio is required to file with the SEC its proxy voting record for the 12-month period ending June 30 on Form N-PX. The Portfolio’s most recent Form N-PX or proxy voting record is available free of charge upon request (i) by calling 800-598-2019 or; (ii) by visiting the SEC’s website at www.sec.gov.
Shareholder Reports and Quarterly Portfolio Disclosure
The Portfolio is required to file its complete schedule of portfolio holdings with the SEC for its first and third fiscal quarters on Form N-Q. The Portfolio’s Form N-Q is available without charge on the SEC’s website at www.sec.gov or by calling MainStay Investments at 800-598-2019. You also can obtain and review copies of Form N-Q by visiting the SEC’s Public Reference Room in Washington, DC (information on the operation of the Public Reference Room may be obtained by calling 1-800-SEC-0330).
| | |
| 26 | | MainStay VP Mid Cap Core Portfolio |
MainStay VP Portfolios
MainStay VP offers a wide range of Portfolios. The full array of MainStay VP offerings is listed here, with information about the manager, subadvisors, legal counsel, and independent registered public accounting firm.
Equity Portfolios
MainStay VP Common Stock Portfolio
MainStay VP Cornerstone Growth Portfolio
MainStay VP Eagle Small Cap Growth Portfolio
MainStay VP Emerging Markets Equity Portfolio
MainStay VP Epoch U.S. Equity Yield Portfolio
MainStay VP Epoch U.S. Small Cap Portfolio
MainStay VP International Equity Portfolio
MainStay VP Large Cap Growth Portfolio
MainStay VP MFS® Utilities Portfolio
MainStay VP Mid Cap Core Portfolio
MainStay VP S&P 500 Index Portfolio
MainStay VP Small Cap Core Portfolio
MainStay VP T. Rowe Price Equity Income Portfolio
MainStay VP VanEck Global Hard Assets Portfolio
Mixed Asset Portfolios
MainStay VP Balanced Portfolio
MainStay VP Convertible Portfolio
MainStay VP Cushing Renaissance Advantage Portfolio
MainStay VP Income Builder Portfolio
MainStay VP Janus Henderson Balanced Portfolio
Income Portfolios
MainStay VP Bond Portfolio
MainStay VP Floating Rate Portfolio
MainStay VP Government Portfolio
MainStay VP High Yield Corporate Bond Portfolio
MainStay VP Indexed Bond Portfolio
MainStay VP PIMCO Real Return Portfolio
MainStay VP Unconstrained Bond Portfolio
Money Market
MainStay VP U.S. Government Money Market Portfolio
Alternative
MainStay VP Absolute Return Multi-Strategy Portfolio
Asset Allocation Portfolios
MainStay VP Conservative Allocation Portfolio
MainStay VP Growth Allocation Portfolio
MainStay VP Moderate Allocation Portfolio
MainStay VP Moderate Growth Allocation Portfolio
Manager
New York Life Investment Management LLC
New York, New York
Subadvisors
Candriam Belgium*
Brussels, Belgium
Candriam France S.A.S.*
Paris, France
Cornerstone Capital Management Holdings LLC*
New York, New York
Cushing Asset Management, LP
Dallas, Texas
Eagle Asset Management, Inc.
St Petersburg, Florida
Epoch Investment Partners, Inc.
New York, New York
Janus Capital Management LLC
Denver, Colorado
MacKay Shields LLC*
New York, New York
Massachusetts Financial Services Company
Boston, Massachusetts
NYL Investors LLC*
New York, New York
Pacific Investment Management Company LLC
Newport Beach, California
T. Rowe Price Associates, Inc.
Baltimore, Maryland
Van Eck Associates Corporation
New York, New York
Winslow Capital Management, LLC
Minneapolis, Minnesota
Distributor
NYLIFE Distributors LLC*
Jersey City, New Jersey
Custodian
State Street Bank and Trust Company
Boston, Massachusetts
Independent Registered Public Accounting Firm
PricewaterhouseCoopers LLP
New York, New York
Legal Counsel
Dechert LLP
Washington, District of Columbia
Some Portfolios may not be available in all products.
* An affiliate of New York Life Investment Management LLC
Not part of the Semiannual Report
2017 Semiannual Report
This report is for the general information of New York Life Variable Annuities and NYLIAC Variable Universal Life Insurance Products policyowners. It must be preceded or accompanied by the appropriate product(s) and funds prospectuses if it is given to anyone who is not an owner of a New York Life variable annuity policy or a NYLIAC Variable Universal Life Insurance Product. This report does not offer for sale or solicit orders to purchase securities.
The performance data quoted in this report represents past performance. Past performance is no guarantee of future results. Due to market volatility and other factors, current performance may be lower or higher than the figures shown. The most recent month-end performance summary for your variable annuity or variable life policy is available by calling 800-598-2019 and is updated periodically on www.newyorklife.com.
The New York Life Variable Annuities and NYLIAC Variable Universal Life Insurance Products are issued by New York Life Insurance and Annuity Corporation (a Delaware Corporation) and distributed by NYLIFE Distributors LLC (Member FINRA/SIPC).
New York Life Insurance Company
New York Life Insurance and Annuity Corporation (NYLIAC) (A Delaware Corporation)
51 Madison Avenue, Room 551
New York, NY 10010
www.newyorklife.com
Printed on recycled paper
mainstayinvestments.com
NYLIFE Distributors LLC, 30 Hudson Street, Jersey City, NJ 07302
New York Life Investment Management LLC is the investment manager to the MainStay VP Funds Trust
©2017 by NYLIFE Distributors LLC. All rights reserved.
You may obtain copies of the Prospectus and the Statement of Additional Information free of charge, upon request, by calling toll-free 800-598-2019 or writing to New York Life Insurance and Annuity Corporation, 51 Madison Avenue, New York, NY 10010.
| | | | |
| Not FDIC Insured | | No Bank Guarantee | | May Lose Value |
| | | | |
1744029 | | | | MSVPMCC10-08/17 (NYLIAC) NI527 |
MainStay VP Common Stock Portfolio
Message from the President and Semiannual Report
Unaudited | June 30, 2017

Sign up for electronic delivery of your shareholder reports. For full details on electronic delivery, including who can participate and what you
can receive via eDelivery, please log on to www.newyorklife.com/vsc

This page intentionally left blank
Message from the President
The six months ended June 30, 2017, brought positive results to many stock and bond investors. The year began with many investors hoping that Republican control of the White House, the Senate and the House of Representatives could bring an end to political gridlock; and while debate has continued on a number of issues, the U.S. stock market climbed relatively steadily throughout the first half of 2017.
According to FTSE-Russell U.S. market data, stocks at all capitalization levels tended to record positive total returns during the reporting period, with large-cap stocks generally outperforming stocks of smaller-capitalization companies. Growth stocks outpaced value stocks at every capitalization level by substantial margins—from more than six percentage points for micro-caps and mid-caps to more than 10 percentage points for the largest 200 U.S. companies by market capitalization.
Most sectors of the stock market advanced during the reporting period, with energy and telecommunication services being notable exceptions. Energy stocks declined as oil prices fell despite moves by the Organization of Petroleum Exporting Countries (OPEC) intended to limit oil production by its members. Telecommunication services stocks tended to decline as competition increased and rising interest rates made dividend payouts less appealing.
In March and June of 2017, the Federal Reserve announced successive increases in the target range for the federal funds rate, ultimately bringing the federal funds target range to 1.00% to 1.25%. While short-term U.S. Treasury yields rose in response, yields for U.S. Treasury securities with maturities of five years or longer declined. As the difference between short- and long-term yields narrowed, the advantages of higher-yielding long-term bonds became increasingly apparent.
Virtually all taxable and tax-exempt bond sectors provided positive total returns during the reporting period. Mortgage-backed
securities, though providing positive total returns, faced headwinds when the Federal Reserve announced plans to begin normalizing its balance sheet by reducing reinvestment of principal payments on mortgage-backed securities.
International stock and bond markets were also strong during the reporting period. International stocks provided double-digit total returns that were surpassed by emerging-market stocks as a whole. Global investment-grade bonds provided single-digit returns; and emerging-market debt was somewhat stronger.
Even during periods of favorable market performance and generally positive returns, MainStay believes that it is important to carefully monitor your investments. Your risk tolerance may
change over time, leading you to reevaluate which MainStay VP Portfolios are most appropriate for your long-term goals. Your goals themselves may also change, leading you to pursue investments with more or less risk. The portfolio managers of MainStay VP Portfolios seek to provide results consistent with the investment objectives of their respective Portfolios, to give you a wide range of choices suitable to various investment needs.
The report that follows provides more detailed information about the specific markets, securities and investment decisions that influenced your MainStay VP Portfolio during the six months ended June 30, 2017. We invite you to review the report carefully as part of your ongoing investment evaluation and review.
Sincerely,

Stephen P. Fisher
President
The opinions expressed are as of the date of the accompanying report and are subject to change. Past performance is no guarantee of future results. There is no guarantee that any forecasts made will come to pass. This material does not constitute investment advice and is not intended as an endorsement of any specific investment.
Not all MainStay VP Portfolios and/or share classes are available under all policies.
Not part of the Semiannual Report
Table of Contents
Investors should refer to the Portfolio’s Summary Prospectus and/or Prospectus and consider the Portfolio’s investment objectives, strategies, risks, charges and expenses carefully before investing. The Summary Prospectus and/or Prospectus contain this and other information about the Portfolio. You may obtain copies of the Portfolio’s Summary Prospectus and/or the Prospectus and the Statement of Additional Information free of charge, upon request, by calling toll-free 800-598-2019, by writing to New York Life Insurance and Annuity Corporation, 51 Madison Avenue, Room 251, New York, New York 10010 or by sending an email to MainStayShareholdersServices@nylim.com. These documents are also available at mainstayinvestments.com/vpdocuments. Please read the Summary Prospectus and/or Prospectus carefully before investing. MainStay VP Funds Trust portfolios are separate account options which are purchased through a variable insurance or variable annuity contract.
Investment and Performance Comparison (Unaudited)
Performance data quoted represents past performance. Past performance is no guarantee of future results. Because of market volatility and other factors, current performance may be lower or higher than the figures shown. Investment return and principal value will fluctuate, and as a result, when shares are redeemed, they may be worth more or less than their original cost. The performance table and graph do not reflect any deduction of sales charges, mortality and expense charges, contract charges or administrative charges. Please refer to the Performance Summary appropriate for your policy. For performance information current to the most recent month-end, please call 800-598-2019 or visit www.newyorklife.com.
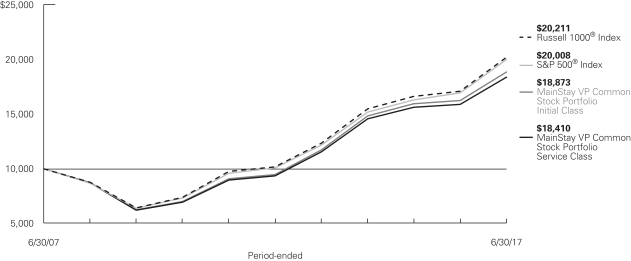
Average Annual Total Returns for the Period Ended June 30, 2017
| | | | | | | | | | | | | | | | | | | | | | |
| Class | | Inception
Date | | Six Months | | | One Year | | | Five Years | | | Ten Years | | | Gross
Expense
Ratio1 | |
| Initial Class Shares | | 1/23/1984 | | | 8.64 | % | | | 16.08 | % | | | 14.73 | % | | | 6.56 | % | | | 0.59 | % |
| Service Class Shares | | 6/5/2003 | | | 8.50 | | | | 15.79 | | | | 14.44 | | | | 6.29 | | | | 0.84 | |
| | | | | | | | | | | | | | | | |
| Benchmark Performance | | Six
Months | | | One
Year | | | Five
Years | | | Ten
Years | |
S&P 500® Index2 | | | 9.34 | % | | | 17.90 | % | | | 14.63 | % | | | 7.18 | % |
Russell 1000® Index3 | | | 9.27 | | | | 18.03 | | | | 14.67 | | | | 7.29 | |
Average Lipper Variable Products Multi-Cap Core Portfolio4 | | | 8.27 | | | | 16.83 | | | | 12.71 | | | | 5.92 | |
| 1. | The gross expense ratios presented reflect the Portfolio’s “Total Annual Portfolio Operating Expenses” from the most recent Prospectus and may differ from other expense ratios disclosed in this report. |
| 2. | The S&P 500® Index is the Portfolio’s primary broad-based securities market index for comparison purposes. “S&P 500®” is a trademark of The McGraw-Hill Companies, Inc. The S&P 500® Index is widely regarded as the standard index for measuring large-cap U.S. stock market performance. Results assume reinvestment of all dividends and capital gains. An investment cannot be made directly in an index. |
| 3. | The Russell 1000® Index is the Portfolio’s secondary benchmark. The Russell 1000® Index measures the performance of the large-cap segment of the U.S. equity universe. It is a subset of the Russell 3000® Index and includes approximately 1,000 of the largest securities based on a |
| | combination of their market cap and current index membership. Results assume reinvestment of all dividends and capital gains. An investment cannot be made directly in an index. |
| 4. | The Average Lipper Variable Products Multi-Cap Core Portfolio is representative of portfolios that, by portfolio practice, invest in a variety of market capitalization ranges without concentrating 75% of their equity assets in any one market capitalization range over an extended period of time. Multi-cap core portfolios typically have average characteristics compared to the S&P SuperComposite 1500® Index. This benchmark is a product of Lipper Inc. Lipper Inc. is an independent monitor of fund performance. Results are based on average total returns of similar portfolios with all dividend and capital gain distributions reinvested. |
Cost in Dollars of a $1,000 Investment in MainStay VP Common Stock Portfolio (Unaudited)
The example below is intended to describe the fees and expenses borne by shareholders during the six-month period from January 1, 2017 to June 30, 2017, and the impact of those costs on your investment.
Example
As a shareholder of the Portfolio, you incur two types of costs: (1) transaction costs, including exchange fees and sales charges (loads) on purchases (as applicable), and (2) ongoing costs, including management fees, distribution and/or service (12b-1) fees, and other Portfolio expenses (as applicable). This example is intended to help you understand your ongoing costs (in dollars) of investing in the Portfolio and to compare these costs with the ongoing costs of investing in other mutual funds. The example is based on an investment of $1,000 made at the beginning of the six-month period and held for the entire period from January 1, 2017 to June 30, 2017. Shares are only sold in connection with variable life and annuity contracts and the example does not reflect any contract level or transactional fees or expenses. If these costs had been included, your costs would have been higher.
This example illustrates your Portfolio’s ongoing costs in two ways:
Actual Expenses
The second and third data columns in the table below provide information about actual account values and actual expenses. You may use the information in these columns, together with the amount you invested, to estimate the expenses that you paid during the six months
ended June 30, 2017. Simply divide your account value by $1,000 (for example, an $8,600 account value divided by $1,000 = 8.6), then multiply the result by the number under the heading entitled “Expenses Paid During Period” to estimate the expenses you paid on your account during this period.
Hypothetical Example for Comparison Purposes
The fourth and fifth data columns in the table below provide information about hypothetical account values and hypothetical expenses based on the Portfolio’s actual expense ratio and an assumed rate of return of 5% per year before expenses, which is not the Portfolio’s actual return. The hypothetical account values and expenses may not be used to estimate the actual ending account balances or expenses you paid for the six-month period shown. You may use this information to compare the ongoing costs of investing in the Portfolio with the ongoing costs of investing in other mutual funds. To do so, compare this 5% hypothetical example with the 5% hypothetical examples that appear in the shareholder reports of the other mutual funds.
Please note that the expenses shown in the table are meant to highlight your ongoing costs only and do not reflect any transactional costs, such as exchange fees or sales charges (loads). Therefore, the fourth and fifth data columns of the table are useful in comparing ongoing costs only and will not help you determine the relative total costs of owning different funds. In addition, if these transactional costs were included, your costs would have been higher.
| | | | | | | | | | | | | | | | | | | | | | | | |
| | | | | | | | | | | | | | | | | | | |
| Share Class | | Beginning
Account
Value
1/1/17 | | | Ending Account
Value (Based
on Actual
Returns and
Expenses)
6/30/17 | | | Expenses
Paid
During
Period1 | | | Ending Account
Value (Based
on Hypothetical
5% Annualized
Return and
Actual Expenses)
6/30/17 | | | Expenses
Paid
During
Period1 | | | Net Expense
Ratio
During
Period2 | |
| | | | | | |
| Initial Class Shares | | $ | 1,000.00 | | | $ | 1,086.40 | | | $ | 2.95 | | | $ | 1,022.00 | | | $ | 2.86 | | | | 0.57 | % |
| | | | | | |
| Service Class Shares | | $ | 1,000.00 | | | $ | 1,085.00 | | | $ | 4.24 | | | $ | 1,020.70 | | | $ | 4.11 | | | | 0.82 | % |
| 1. | Expenses are equal to the Portfolio’s annualized expense ratio of each class multiplied by the average account value over the period, divided by 365 and multiplied by 181 (to reflect the six-month period). The table above represents the actual expenses incurred during the six-month period. |
| 2. | Expenses are equal to the Portfolio’s annualized expense ratio to reflect the six-month period. |
| | |
| 6 | | MainStay VP Common Stock Portfolio |
Industry Composition as of June 30, 2017 (Unaudited)
| | | | |
| Banks | | | 6.4 | % |
| Technology Hardware, Storage & Peripherals | | | 5.6 | |
| Internet Software & Services | | | 5.3 | |
| Oil, Gas & Consumable Fuels | | | 4.8 | |
| Pharmaceuticals | | | 4.7 | |
| Health Care Providers & Services | | | 4.6 | |
| Software | | | 4.3 | |
| Insurance | | | 4.2 | |
| Semiconductors & Semiconductor Equipment | | | 3.7 | |
| Hotels, Restaurants & Leisure | | | 3.5 | |
| IT Services | | | 3.5 | |
| Electric Utilities | | | 2.9 | |
| Internet & Direct Marketing Retail | | | 2.8 | |
| Specialty Retail | | | 2.7 | |
| Media | | | 2.6 | |
| Biotechnology | | | 2.4 | |
| Equity Real Estate Investment Trusts (REITs) | | | 2.4 | |
| Tobacco | | | 2.4 | |
| Health Care Equipment & Supplies | | | 2.3 | |
| Industrial Conglomerates | | | 2.2 | |
| Chemicals | | | 2.1 | |
| Machinery | | | 2.1 | |
| Food & Staples Retailing | | | 2.0 | |
| Capital Markets | | | 1.9 | |
| Exchange-Traded Funds | | | 1.9 | |
| Household Products | | | 1.9 | |
| Diversified Telecommunication Services | | | 1.7 | |
| | | | |
| Beverages | | | 1.6 | % |
| Aerospace & Defense | | | 1.5 | |
| Diversified Financial Services | | | 1.1 | |
| Electronic Equipment, Instruments & Components | | | 0.8 | |
| Food Products | | | 0.8 | |
| Professional Services | | | 0.8 | |
| Airlines | | | 0.7 | |
| Communications Equipment | | | 0.6 | |
| Energy Equipment & Services | | | 0.6 | |
| Multi-Utilities | | | 0.6 | |
| Diversified Consumer Services | | | 0.5 | |
| Household Durables | | | 0.5 | |
| Life Sciences Tools & Services | | | 0.5 | |
| Textiles, Apparel & Luxury Goods | | | 0.5 | |
| Trading Companies & Distributors | | | 0.5 | |
| Commercial Services & Supplies | | | 0.3 | |
| Independent Power & Renewable Electricity Producers | | | 0.3 | |
| Multiline Retail | | | 0.3 | |
| Building Products | | | 0.2 | |
| Auto Components | | | 0.1 | |
| Leisure Products | | | 0.1 | |
| Metals & Mining | | | 0.1 | |
| Short-Term Investment | | | 0.0 | ‡ |
| Other Assets, Less Liabilities | | | 0.1 | |
| | | | |
| | | 100.0 | % |
| | | | |
See Portfolio of Investments beginning on page 9 for specific holdings within these categories.
| ‡ | Less than one-tenth of a percent. |
Top Ten Holdings or Issuers as of June 30, 2017 (excluding short-term investment) (Unaudited)
Portfolio Management Discussion and Analysis (Unaudited)
Answers to the questions reflect the views of portfolio managers Migene Kim, CFA, Andrew Ver Planck, CFA, and Mona Patni of Cornerstone Capital Management Holdings LLC, the Portfolio’s Subadvisor.
How did MainStay VP Common Stock Portfolio perform relative to its benchmarks and peers during the six months ended June 30, 2017?
For the six months ended June 30, 2017, MainStay VP Common Stock Portfolio returned 8.64% for Initial Class shares and 8.50% for Service Class shares. Over the same period, both share classes underperformed the 9.34% return of the S&P 500® Index,1 which is the Portfolio’s primary benchmark, and the 9.27% return of the Russell 1000® Index,1 which is the secondary benchmark of the Portfolio. Both share classes outperformed the 8.27% return of the Average Lipper2 Variable Products Multi-Cap Core Portfolio for the six months ended June 30, 2017.
What factors affected the Portfolio’s relative performance during the reporting period?
Stock selection detracted from the Portfolio’s performance relative to the S&P 500® Index, while allocation effects—being overweight or underweight specific sectors as a result of the Portfolio’s bottom-up stock selection process—proved to be modestly positive during the reporting period.
Which sectors were the strongest positive contributors to the Portfolio’s relative performance, and which sectors were particularly weak?
Financials, consumer discretionary and real estate were the Portfolio’s strongest-contributing sectors relative to the S&P 500® Index during the reporting period. (Contributions take weightings and total returns into account.) The contributions in these sectors were driven by favorable stock selection. An underweight position in the underperforming real estate sector also contributed modestly to the Portfolio’s relative performance.
The weakest sector contributions to the Portfolio’s relative performance came from the materials, health care and information technology sectors. Unfavorable stock selection detracted in each of these sectors. An underweight position in the outperforming health care sector also detracted modestly from the Portfolio’s relative performance.
During the reporting period, which individual stocks made the strongest positive contributions to the Portfolio’s absolute performance and which stocks detracted the most?
During the reporting period, the strongest positive contributor to absolute performance was technology company Apple. Best known for its iPhone, the company continued to deliver strong
sales and earnings growth. E-commerce company Amazon.com also performed well, led by strong growth of its online retail platform and its web services business. The Portfolio’s position in social media company Facebook delivered strong absolute performance, aided by solid user adoption of the company’s platform and strong trends in advertising revenue.
On an absolute basis, the Portfolio’s weakest stock performers were offshore contract drilling service provider Transocean and integrated oil company Exxon Mobil, which dropped in concert with weakness in crude oil prices during the reporting period. Steel producer United States Steel declined after reporting operating results well below expectations on continued weakness and supply concerns within the commodity segment.
Did the Portfolio make any significant purchases or sales during the reporting period?
The Portfolio entered into new positions in industrial equipment company Caterpillar and air carrier Southwest Airlines, moving the Portfolio to overweight positions relative to the S&P 500® Index in these stocks. Strong earnings and cash flow were the main drivers behind the Caterpillar addition. Southwest Airlines has had strong price momentum and earnings trends; and compared to other airline stocks, we viewed the stock as attractive from a valuation perspective.
The Portfolio exited positions in insurance company Aetna and consumer- and commercial-banking provider Huntington Bancshares. The Portfolio sold Aetna because of what we viewed as an unattractive valuation, while Huntington Bancshares was sold because of deteriorating stock price trends and a valuation that, in our view, was less than compelling.
How did the Portfolio’s sector weightings change during the reporting period?
During the reporting period, the Portfolio modestly increased its weightings relative to the S&P 500® Index in real estate and utilities. Over the same period, the Portfolio modestly reduced its weightings relative to the Index in financials and consumer staples.
How was the Portfolio positioned at the end of the reporting period?
As of June 30, 2017, the Portfolio held modestly overweight positions relative to the S&P 500® Index in the consumer discretionary and information technology sectors. As of the same date, the Portfolio held modestly underweight positions relative to the Index in financials and industrials.
| 1. | See footnote on page 5 for more information on this index. |
| 2. | See footnote on page 5 for more information on Lipper Inc. |
The opinions expressed are those of the portfolio managers as of the date of this report and are subject to change. There is no guarantee that any forecasts made will come to pass. This material does not constitute investment advice and is not intended as an endorsement of any specific investment.
Not all MainStay VP Portfolios and/or share classes are available under all policies.
| | |
| 8 | | MainStay VP Common Stock Portfolio |
Portfolio of Investments June 30, 2017 (Unaudited)
| | | | | | | | |
| | |
| | | Shares | | | Value | |
| Common Stocks 98.0%† | |
Aerospace & Defense 1.5% | |
Boeing Co. | | | 41,600 | | | $ | 8,226,400 | |
Lockheed Martin Corp. | | | 13,864 | | | | 3,848,785 | |
| | | | | | | | |
| | | | 12,075,185 | |
| | | | | | | | |
Airlines 0.7% | |
Southwest Airlines Co. | | | 85,525 | | | | 5,314,523 | |
United Continental Holdings, Inc. (a) | | | 11,607 | | | | 873,427 | |
| | | | | | | | |
| | | | 6,187,950 | |
| | | | | | | | |
Auto Components 0.1% | |
Goodyear Tire & Rubber Co. | | | 37,138 | | | | 1,298,345 | |
| | | | | | | | |
|
Banks 6.4% | |
¨Bank of America Corp. | | | 545,958 | | | | 13,244,941 | |
Citigroup, Inc. | | | 165,673 | | | | 11,080,211 | |
¨JPMorgan Chase & Co. | | | 181,173 | | | | 16,559,212 | |
SunTrust Banks, Inc. | | | 8,982 | | | | 509,459 | |
U.S. Bancorp | | | 49,524 | | | | 2,571,286 | |
Wells Fargo & Co. | | | 161,034 | | | | 8,922,894 | |
| | | | | | | | |
| | | | 52,888,003 | |
| | | | | | | | |
Beverages 1.6% | |
Coca-Cola Co. | | | 73,132 | | | | 3,279,970 | |
PepsiCo., Inc. | | | 86,865 | | | | 10,032,039 | |
| | | | | | | | |
| | | | 13,312,009 | |
| | | | | | | | |
Biotechnology 2.4% | |
AbbVie, Inc. | | | 87,481 | | | | 6,343,247 | |
Amgen, Inc. | | | 22,703 | | | | 3,910,138 | |
Gilead Sciences, Inc. | | | 107,038 | | | | 7,576,150 | |
United Therapeutics Corp. (a) | | | 14,380 | | | | 1,865,517 | |
| | | | | | | | |
| | | | 19,695,052 | |
| | | | | | | | |
Building Products 0.2% | |
Johnson Controls International PLC | | | 36,444 | | | | 1,580,212 | |
| | | | | | | | |
|
Capital Markets 1.9% | |
Ameriprise Financial, Inc. | | | 22,388 | | | | 2,849,769 | |
E*TRADE Financial Corp. (a) | | | 107,512 | | | | 4,088,681 | |
Franklin Resources, Inc. | | | 2,212 | | | | 99,075 | |
Raymond James Financial, Inc. | | | 8,281 | | | | 664,302 | |
S&P Global, Inc. | | | 35,507 | | | | 5,183,667 | |
State Street Corp. | | | 36,732 | | | | 3,295,962 | |
| | | | | | | | |
| | | | 16,181,456 | |
| | | | | | | | |
Chemicals 2.1% | |
Chemours Co. | | | 86,088 | | | | 3,264,457 | |
LyondellBasell Industries N.V. Class A | | | 50,871 | | | | 4,293,004 | |
Mosaic Co. | | | 170,168 | | | | 3,884,935 | |
Olin Corp. | | | 118,590 | | | | 3,590,905 | |
| | | | | | | | |
| | |
| | | Shares | | | Value | |
Chemicals (continued) | |
Sherwin-Williams Co. | | | 6,826 | | | $ | 2,395,653 | |
| | | | | | | | |
| | | | 17,428,954 | |
| | | | | | | | |
Commercial Services & Supplies 0.3% | |
Waste Management, Inc. | | | 38,379 | | | | 2,815,100 | |
| | | | | | | | |
|
Communications Equipment 0.6% | |
ARRIS International PLC (a) | | | 342 | | | | 9,583 | |
Cisco Systems, Inc. | | | 79,327 | | | | 2,482,935 | |
Juniper Networks, Inc. | | | 90,587 | | | | 2,525,566 | |
| | | | | | | | |
| | | | 5,018,084 | |
| | | | | | | | |
Diversified Consumer Services 0.5% | |
H&R Block, Inc. | | | 146,849 | | | | 4,539,103 | |
| | | | | | | | |
|
Diversified Financial Services 1.1% | |
Berkshire Hathaway, Inc., Class B (a) | | | 52,037 | | | | 8,813,507 | |
| | | | | | | | |
|
Diversified Telecommunication Services 1.7% | |
AT&T, Inc. | | | 289,654 | | �� | | 10,928,645 | |
Verizon Communications, Inc. | | | 79,365 | | | | 3,544,441 | |
| | | | | | | | |
| | | | 14,473,086 | |
| | | | | | | | |
Electric Utilities 2.9% | |
American Electric Power Co., Inc. | | | 42,719 | | | | 2,967,689 | |
Duke Energy Corp. | | | 31,668 | | | | 2,647,128 | |
Edison International | | | 34,122 | | | | 2,667,999 | |
Entergy Corp. | | | 33,954 | | | | 2,606,649 | |
Exelon Corp. | | | 94,950 | | | | 3,424,846 | |
FirstEnergy Corp. | | | 36,633 | | | | 1,068,218 | |
NextEra Energy, Inc. | | | 20,874 | | | | 2,925,074 | |
PG&E Corp. | | | 38,718 | | | | 2,569,714 | |
Xcel Energy, Inc. | | | 61,559 | | | | 2,824,327 | |
| | | | | | | | |
| | | | 23,701,644 | |
| | | | | | | | |
Electronic Equipment, Instruments & Components 0.8% | |
Corning, Inc. | | | 9,715 | | | | 291,936 | |
Jabil, Inc. | | | 120,527 | | | | 3,518,183 | |
Zebra Technologies Corp. Class A (a) | | | 26,765 | | | | 2,690,418 | |
| | | | | | | | |
| | | | 6,500,537 | |
| | | | | | | | |
Energy Equipment & Services 0.6% | |
Baker Hughes, Inc. | | | 63,733 | | | | 3,474,086 | |
Schlumberger, Ltd. | | | 2,518 | | | | 165,785 | |
Transocean, Ltd. (a) | | | 128,216 | | | | 1,055,218 | |
| | | | | | | | |
| | | | 4,695,089 | |
| | | | | | | | |
Equity Real Estate Investment Trusts (REITs) 2.4% | |
American Tower Corp. | | | 25,864 | | | | 3,422,324 | |
Crown Castle International Corp. | | | 1,992 | | | | 199,558 | |
Digital Realty Trust, Inc. | | | 8,340 | | | | 942,003 | |
| † | Percentages indicated are based on Portfolio net assets. |
| ¨ | | Among the Portfolio’s 10 largest holdings or Issuers, as of June 30, 2017, excluding short-term investment. May be subject to change daily. |
| | | | | | |
The notes to the financial statements are an integral part of,
and should be read in conjunction with, the financial statements. | | | | | 9 | |
Portfolio of Investments June 30, 2017 (Unaudited) (continued)
| | | | | | | | |
| | |
| | | Shares | | | Value | |
| Common Stocks (continued) | |
Equity Real Estate Investment Trusts (REITs) (continued) | |
Equinix, Inc. | | | 238 | | | $ | 102,140 | |
HCP, Inc. | | | 133,432 | | | | 4,264,487 | |
Host Hotels & Resorts, Inc. | | | 227,926 | | | | 4,164,208 | |
Iron Mountain, Inc. | | | 470 | | | | 16,149 | |
Lamar Advertising Co. Class A | | | 17,114 | | | | 1,259,077 | |
Public Storage | | | 8,530 | | | | 1,778,761 | |
Senior Housing Properties Trust | | | 170,077 | | | | 3,476,374 | |
Uniti Group, Inc. | | | 24,776 | | | | 622,869 | |
| | | | | | | | |
| | | | 20,247,950 | |
| | | | | | | | |
Food & Staples Retailing 2.0% | |
Costco Wholesale Corp. | | | 362 | | | | 57,895 | |
CVS Health Corp. | | | 54,139 | | | | 4,356,024 | |
Sysco Corp. | | | 15,521 | | | | 781,172 | |
Wal-Mart Stores, Inc. | | | 104,266 | | | | 7,890,851 | |
Walgreens Boots Alliance, Inc. | | | 39,582 | | | | 3,099,666 | |
| | | | | | | | |
| | | | 16,185,608 | |
| | | | | | | | |
Food Products 0.8% | |
Archer-Daniels-Midland Co. | | | 40,824 | | | | 1,689,297 | |
Campbell Soup Co. | | | 3,469 | | | | 180,908 | |
TreeHouse Foods, Inc. (a) | | | 4,282 | | | | 349,797 | |
Tyson Foods, Inc. Class A | | | 71,781 | | | | 4,495,644 | |
| | | | | | | | |
| | | | 6,715,646 | |
| | | | | | | | |
Health Care Equipment & Supplies 2.3% | |
Abbott Laboratories | | | 41,435 | | | | 2,014,155 | |
Baxter International, Inc. | | | 80,636 | | | | 4,881,703 | |
Becton Dickinson & Co. | | | 2,190 | | | | 427,291 | |
Danaher Corp. | | | 23,686 | | | | 1,998,862 | |
Hologic, Inc. (a) | | | 72,299 | | | | 3,280,929 | |
Masimo Corp. (a) | | | 40,735 | | | | 3,714,217 | |
Medtronic PLC | | | 28,869 | | | | 2,562,124 | |
| | | | | | | | |
| | | | 18,879,281 | |
| | | | | | | | |
Health Care Providers & Services 4.6% | |
Anthem, Inc. | | | 28,549 | | | | 5,370,923 | |
Centene Corp. (a) | | | 53,966 | | | | 4,310,804 | |
Cigna Corp. | | | 26,379 | | | | 4,415,581 | |
HealthSouth Corp. | | | 37,091 | | | | 1,795,205 | |
Humana, Inc. | | | 21,544 | | | | 5,183,917 | |
McKesson Corp. | | | 31,157 | | | | 5,126,573 | |
UnitedHealth Group, Inc. | | | 42,402 | | | | 7,862,179 | |
WellCare Health Plans, Inc. (a) | | | 20,600 | | | | 3,698,936 | |
| | | | | | | | |
| | | | 37,764,118 | |
| | | | | | | | |
Hotels, Restaurants & Leisure 3.5% | |
Carnival Corp. | | | 73,683 | | | | 4,831,394 | |
Cracker Barrel Old Country Store, Inc. | | | 19,770 | | | | 3,306,532 | |
Darden Restaurants, Inc. | | | 45,261 | | | | 4,093,405 | |
McDonald’s Corp. | | | 29,939 | | | | 4,585,457 | |
Royal Caribbean Cruises, Ltd. | | | 39,495 | | | | 4,314,039 | |
| | | | | | | | |
| | |
| | | Shares | | | Value | |
Hotels, Restaurants & Leisure (continued) | |
Starbucks Corp. | | | 1,377 | | | $ | 80,293 | |
Wyndham Worldwide Corp. | | | 41,082 | | | | 4,125,044 | |
Wynn Resorts, Ltd. | | | 19,141 | | | | 2,567,191 | |
Yum! Brands, Inc. | | | 13,039 | | | | 961,757 | |
| | | | | | | | |
| | | | 28,865,112 | |
| | | | | | | | |
Household Durables 0.5% | |
NVR, Inc. (a) | | | 1,528 | | | | 3,683,412 | |
Whirlpool Corp. | | | 4,765 | | | | 913,069 | |
| | | | | | | | |
| | | | 4,596,481 | |
| | | | | | | | |
Household Products 1.9% | |
Kimberly-Clark Corp. | | | 26,186 | | | | 3,380,874 | |
Procter & Gamble Co. | | | 139,793 | | | | 12,182,960 | |
| | | | | | | | |
| | | | 15,563,834 | |
| | | | | | | | |
Independent Power & Renewable Electricity Producers 0.3% | |
AES Corp. | | | 219,538 | | | | 2,439,067 | |
| | | | | | | | |
|
Industrial Conglomerates 2.2% | |
3M Co. | | | 37,770 | | | | 7,863,336 | |
General Electric Co. | | | 208,770 | | | | 5,638,878 | |
Honeywell International, Inc. | | | 34,821 | | | | 4,641,291 | |
| | | | | | | | |
| | | | 18,143,505 | |
| | | | | | | | |
Insurance 4.2% | |
Aflac, Inc. | | | 63,889 | | | | 4,962,897 | |
Allstate Corp. | | | 56,469 | | | | 4,994,118 | |
American Financial Group, Inc. | | | 2,698 | | | | 268,100 | |
Assurant, Inc. | | | 38,466 | | | | 3,988,540 | |
Everest Re Group, Ltd. | | | 7,343 | | | | 1,869,454 | |
First American Financial Corp. | | | 38,775 | | | | 1,732,855 | |
Lincoln National Corp. | | | 52,486 | | | | 3,547,004 | |
Old Republic International Corp. | | | 5,290 | | | | 103,314 | |
Progressive Corp. | | | 27,513 | | | | 1,213,048 | |
Prudential Financial, Inc. | | | 50,890 | | | | 5,503,245 | |
Travelers Cos., Inc. | | | 30,641 | | | | 3,877,006 | |
XL Group, Ltd. | | | 58,713 | | | | 2,571,629 | |
| | | | | | | | |
| | | | 34,631,210 | |
| | | | | | | | |
Internet & Direct Marketing Retail 2.8% | |
¨Amazon.com, Inc. (a) | | | 19,038 | | | | 18,428,784 | |
Expedia, Inc. | | | 29,511 | | | | 4,395,663 | |
| | | | | | | | |
| | | | 22,824,447 | |
| | | | | | | | |
Internet Software & Services 5.3% | |
Akamai Technologies, Inc. (a) | | | 81,768 | | | | 4,072,864 | |
¨Alphabet, Inc. (a) | | | | | | | | |
Class A | | | 9,999 | | | | 9,295,870 | |
Class C | | | 9,863 | | | | 8,962,804 | |
eBay, Inc. (a) | | | 142,544 | | | | 4,977,637 | |
¨Facebook, Inc. Class A (a) | | | 91,405 | | | | 13,800,327 | |
j2 Global, Inc. | | | 4,966 | | | | 422,557 | |
VeriSign, Inc. (a) | | | 21,825 | | | | 2,028,852 | |
| | | | | | | | |
| | | | 43,560,911 | |
| | | | | | | | |
| | | | |
| 10 | | MainStay VP Common Stock Portfolio | | The notes to the financial statements are an integral part of,
and should be read in conjunction with, the financial statements. |
| | | | | | | | |
| | |
| | | Shares | | | Value | |
| Common Stocks (continued) | |
IT Services 3.5% | |
Accenture PLC Class A | | | 176 | | | $ | 21,767 | |
Alliance Data Systems Corp. | | | 8,606 | | | | 2,209,074 | |
CSRA, Inc. | | | 58,955 | | | | 1,871,821 | |
International Business Machines Corp. | | | 52,825 | | | | 8,126,070 | |
Mastercard, Inc. Class A | | | 36,567 | | | | 4,441,062 | |
MAXIMUS, Inc. | | | 9,963 | | | | 623,983 | |
Total System Services, Inc. | | | 42,631 | | | | 2,483,256 | |
Visa, Inc. Class A | | | 72,101 | | | | 6,761,632 | |
Western Union Co. | | | 113,979 | | | | 2,171,300 | |
| | | | | | | | |
| | | | 28,709,965 | |
| | | | | | | | |
Leisure Products 0.1% | |
Hasbro, Inc. | | | 11,350 | | | | 1,265,639 | |
| | | | | | | | |
|
Life Sciences Tools & Services 0.5% | |
PAREXEL International Corp. (a) | | | 44,662 | | | | 3,881,574 | |
| | | | | | | | |
|
Machinery 2.1% | |
Caterpillar, Inc. | | | 57,606 | | | | 6,190,341 | |
Cummins, Inc. | | | 29,050 | | | | 4,712,491 | |
Deere & Co. | | | 19,253 | | | | 2,379,478 | |
Oshkosh Corp. | | | 52,565 | | | | 3,620,677 | |
Trinity Industries, Inc. | | | 4,824 | | | | 135,217 | |
| | | | | | | | |
| | | | 17,038,204 | |
| | | | | | | | |
Media 2.6% | |
Comcast Corp. Class A | | | 274,233 | | | | 10,673,149 | |
DISH Network Corp. Class A (a) | | | 15,756 | | | | 988,847 | |
Live Nation Entertainment, Inc. (a) | | | 50,851 | | | | 1,772,157 | |
Omnicom Group, Inc. | | | 36,277 | | | | 3,007,363 | |
Walt Disney Co. | | | 50,681 | | | | 5,384,856 | |
| | | | | | | | |
| | | | 21,826,372 | |
| | | | | | | | |
Metals & Mining 0.1% | |
Newmont Mining Corp. | | | 33,787 | | | | 1,094,361 | |
| | | | | | | | |
|
Multi-Utilities 0.6% | |
CenterPoint Energy, Inc. | | | 93,921 | | | | 2,571,557 | |
Consolidated Edison, Inc. | | | 33,271 | | | | 2,688,962 | |
| | | | | | | | |
| | | | 5,260,519 | |
| | | | | | | | |
Multiline Retail 0.3% | |
Target Corp. | | | 42,800 | | | | 2,238,012 | |
| | | | | | | | |
|
Oil, Gas & Consumable Fuels 4.8% | |
Chevron Corp. | | | 39,163 | | | | 4,085,876 | |
ConocoPhillips | | | 12,417 | | | | 545,851 | |
EOG Resources, Inc. | | | 4,720 | | | | 427,254 | |
¨Exxon Mobil Corp. | | | 180,811 | | | | 14,596,872 | |
HollyFrontier Corp. | | | 141,982 | | | | 3,900,246 | |
Marathon Petroleum Corp. | | | 88,477 | | | | 4,630,002 | |
| | | | | | | | |
| | |
| | | Shares | | | Value | |
Oil, Gas & Consumable Fuels (continued) | |
ONEOK, Inc. | | | 29,521 | | | $ | 1,539,815 | |
Valero Energy Corp. | | | 74,346 | | | | 5,015,381 | |
Williams Cos., Inc. | | | 154,242 | | | | 4,670,448 | |
| | | | | | | | |
| | | | 39,411,745 | |
| | | | | | | | |
Pharmaceuticals 4.7% | |
Eli Lilly & Co. | | | 33,736 | | | | 2,776,473 | |
¨Johnson & Johnson | | | 133,340 | | | | 17,639,549 | |
Merck & Co., Inc. | | | 49,657 | | | | 3,182,517 | |
Mylan N.V. (a) | | | 92,837 | | | | 3,603,932 | |
Pfizer, Inc. | | | 340,989 | | | | 11,453,820 | |
| | | | | | | | |
| | | | 38,656,291 | |
| | | | | | | | |
Professional Services 0.8% | |
ManpowerGroup, Inc. | | | 23,182 | | | | 2,588,270 | |
Robert Half International, Inc. | | | 82,780 | | | | 3,967,646 | |
| | | | | | | | |
| | | | 6,555,916 | |
| | | | | | | | |
Semiconductors & Semiconductor Equipment 3.7% | |
Applied Materials, Inc. | | | 120,942 | | | | 4,996,114 | |
Broadcom, Ltd. | | | 8,165 | | | | 1,902,853 | |
Cirrus Logic, Inc. (a) | | | 25,575 | | | | 1,604,064 | |
Intel Corp. | | | 226,106 | | | | 7,628,816 | |
Lam Research Corp. | | | 29,083 | | | | 4,113,209 | |
Micron Technology, Inc. (a) | | | 160,716 | | | | 4,798,980 | |
NVIDIA Corp. | | | 10,602 | | | | 1,532,625 | |
Qorvo, Inc. (a) | | | 8,520 | | | | 539,486 | |
Skyworks Solutions, Inc. | | | 33,905 | | | | 3,253,185 | |
| | | | | | | | |
| | | | 30,369,332 | |
| | | | | | | | |
Software 4.3% | |
Activision Blizzard, Inc. | | | 88,936 | | | | 5,120,046 | |
Cadence Design Systems, Inc. (a) | | | 9,154 | | | | 306,567 | |
¨Microsoft Corp. | | | 351,658 | | | | 24,239,786 | |
Oracle Corp. | | | 48,622 | | | | 2,437,907 | |
Take-Two Interactive Software, Inc. (a) | | | 49,451 | | | | 3,628,714 | |
| | | | | | | | |
| | | | 35,733,020 | |
| | | | | | | | |
Specialty Retail 2.7% | |
Best Buy Co., Inc. | | | 76,229 | | | | 4,370,209 | |
Gap, Inc. | | | 89,485 | | | | 1,967,775 | |
Home Depot, Inc. | | | 41,329 | | | | 6,339,869 | |
Lowe’s Cos., Inc. | | | 78,238 | | | | 6,065,792 | |
Signet Jewelers, Ltd. | | | 31,900 | | | | 2,017,356 | |
Staples, Inc. | | | 157,750 | | | | 1,588,542 | |
| | | | | | | | |
| | | | 22,349,543 | |
| | | | | | | | |
Technology Hardware, Storage & Peripherals 5.6% | |
¨Apple, Inc. | | | 206,434 | | | | 29,730,625 | |
Hewlett Packard Enterprise Co. | | | 64,698 | | | | 1,073,340 | |
HP, Inc. | | | 259,480 | | | | 4,535,710 | |
NCR Corp. (a) | | | 43,922 | | | | 1,793,774 | |
NetApp, Inc. | | | 11,683 | | | | 467,904 | |
Seagate Technology PLC | | | 96,076 | | | | 3,722,945 | |
| | | | | | |
The notes to the financial statements are an integral part of,
and should be read in conjunction with, the financial statements. | | | | | 11 | |
Portfolio of Investments June 30, 2017 (Unaudited) (continued)
| | | | | | | | |
| | |
| | | Shares | | | Value | |
| Common Stocks (continued) | |
Technology Hardware, Storage & Peripherals (continued) | |
Western Digital Corp. | | | 51,823 | | | $ | 4,591,518 | |
| | | | | | | | |
| | | | 45,915,816 | |
| | | | | | | | |
Textiles, Apparel & Luxury Goods 0.5% | |
Michael Kors Holdings, Ltd. (a) | | | 105,075 | | | | 3,808,969 | |
| | | | | | | | |
|
Tobacco 2.4% | |
Altria Group, Inc. | | | 124,728 | | | | 9,288,494 | |
Philip Morris International, Inc. | | | 90,878 | | | | 10,673,621 | |
| | | | | | | | |
| | | | 19,962,115 | |
| | | | | | | | |
Trading Companies & Distributors 0.5% | |
United Rentals, Inc. (a) | | | 36,610 | | | | 4,126,313 | |
| | | | | | | | |
Total Common Stocks
(Cost $687,570,500) | | | | 809,824,192 | |
| | | | | | | | |
|
| Exchange-Traded Funds 1.9% (b) | |
¨SPDR S&P 500 ETF Trust | | | 63,765 | | | | 15,418,377 | |
| | | | | | | | |
Total Exchange-Traded Funds
(Cost $14,873,245) | | | | 15,418,377 | |
| | | | | | | | |
| | |
| | | | | | | | |
| | | Principal
Amount | | | | |
| Short-Term Investment 0.0%‡ | |
Repurchase Agreement 0.0%‡ | |
Fixed Income Clearing Corp.
0.12%, dated 6/30/17
due 7/3/17
Proceeds at Maturity $164,394 (Collateralized by a United States Treasury Note with a rate of 2.00% and a maturity date of 8/31/21, with a Principal Amount of $165,000 and a Market Value of $167,765) | | $ | 164,393 | | | | 164,393 | |
| | | | | | | | |
Total Short-Term Investment
(Cost $164,393) | | | | | | | 164,393 | |
| | | | | | | | |
Total Investments
(Cost $702,608,138) (c) | | | 99.9 | % | | | 825,406,962 | |
Other Assets, Less Liabilities | | | 0.1 | | | | 455,110 | |
Net Assets | | | 100.0 | % | | $ | 825,862,072 | |
| ‡ | Less than one-tenth of a percent. |
| (a) | Non-income producing security. |
| (b) | Exchange-Traded Fund—An investment vehicle that represents a basket of securities that is traded on an exchange. |
| (c) | As of June 30, 2017, cost was $705,722,310 for federal income tax purposes and net unrealized appreciation was as follows: |
| | | | |
Gross unrealized appreciation | | $ | 134,791,981 | |
Gross unrealized depreciation | | | (15,107,329 | ) |
| | | | |
Net unrealized appreciation | | $ | 119,684,652 | |
| | | | |
The following abbreviations are used in the preceding pages:
ETF—Exchange-Traded Fund
SPDR—Standard & Poor’s Depositary Receipt
| | | | |
| 12 | | MainStay VP Common Stock Portfolio | | The notes to the financial statements are an integral part of,
and should be read in conjunction with, the financial statements. |
The following is a summary of the fair valuations according to the inputs used as of June 30, 2017, for valuing the Portfolio’s assets.
Asset Valuation Inputs
| | | | | | | | | | | | | | | | |
Description | | Quoted
Prices in
Active
Markets for
Identical
Assets
(Level 1) | | | Significant
Other
Observable
Inputs (Level 2) | | | Significant
Unobservable
Inputs (Level 3) | | | Total | |
| Investments in Securities (a) | | | | | | | | | | | | | | | | |
Common Stocks | | $ | 809,824,192 | | | $ | — | | | $ | — | | | $ | 809,824,192 | |
Exchange-Traded Funds | | | 15,418,377 | | | | — | | | | — | | | | 15,418,377 | |
| Short-Term Investment | | | | | | | | | | | | | | | | |
Repurchase Agreement | | | — | | | | 164,393 | | | | — | | | | 164,393 | |
| | | | | | | | | | | | | | | | |
| Total Investments in Securities | | $ | 825,242,569 | | | $ | 164,393 | | | $ | — | | | $ | 825,406,962 | |
| | | | | | | | | | | | | | | | |
| (a) | For a complete listing of investments and their industries, see the Portfolio of Investments. |
The Portfolio recognizes transfers between the levels as of the beginning of the period.
For the period ended June 30, 2017, the Portfolio did not have any transfers among levels. (See Note 2)
As of June 30, 2017, the Portfolio did not hold any investments with significant unobservable inputs (Level 3). (See Note 2)
| | | | | | |
The notes to the financial statements are an integral part of,
and should be read in conjunction with, the financial statements. | | | | | 13 | |
Statement of Assets and Liabilities as of June 30, 2017 (Unaudited)
| | | | |
| Assets | |
Investment in securities, at value
(identified cost $702,608,138) | | $ | 825,406,962 | |
Receivables: | | | | |
Dividends and interest | | | 950,211 | |
Fund shares sold | | | 258,619 | |
Other assets | | | 4,452 | |
| | | | |
Total assets | | | 826,620,244 | |
| | | | |
| |
| Liabilities | | | | |
Payables: | | | | |
Manager (See Note 3) | | | 368,243 | |
Fund shares redeemed | | | 221,092 | |
Shareholder communication | | | 77,622 | |
NYLIFE Distributors (See Note 3) | | | 45,794 | |
Professional fees | | | 22,852 | |
Custodian | | | 15,194 | |
Trustees | | | 1,354 | |
Accrued expenses | | | 6,021 | |
| | | | |
Total liabilities | | | 758,172 | |
| | | | |
Net assets | | $ | 825,862,072 | |
| | | | |
| |
| Composition of Net Assets | | | | |
Shares of beneficial interest outstanding (par value of $.001 per share) unlimited number of shares authorized | | $ | 29,779 | |
Additional paid-in capital | | | 623,007,896 | |
| | | | |
| | | 623,037,675 | |
Undistributed net investment income | | | 16,765,872 | |
Accumulated net realized gain (loss) on investments | | | 63,259,701 | |
Net unrealized appreciation (depreciation) on investments | | | 122,798,824 | |
| | | | |
Net assets | | $ | 825,862,072 | |
| | | | |
| | | | |
Initial Class | | | | |
Net assets applicable to outstanding shares | | $ | 602,539,856 | |
| | | | |
Shares of beneficial interest outstanding | | | 21,667,340 | |
| | | | |
Net asset value per share outstanding | | $ | 27.81 | |
| | | | |
Service Class | | | | |
Net assets applicable to outstanding shares | | $ | 223,322,216 | |
| | | | |
Shares of beneficial interest outstanding | | | 8,111,930 | |
| | | | |
Net asset value per share outstanding | | $ | 27.53 | |
| | | | |
| | | | |
| 14 | | MainStay VP Common Stock Portfolio | | The notes to the financial statements are an integral part of,
and should be read in conjunction with, the financial statements. |
Statement of Operations for the six months ended June 30, 2017 (Unaudited)
| | | | |
| Investment Income (Loss) | |
Income | | | | |
Dividends | | $ | 8,164,308 | |
Interest | | | 117 | |
| | | | |
Total income | | | 8,164,425 | |
| | | | |
Expenses | |
Manager (See Note 3) | | | 2,165,124 | |
Distribution/Service—Service Class (See Note 3) | | | 261,484 | |
Shareholder communication | | | 62,405 | |
Professional fees | | | 39,755 | |
Trustees | | | 9,829 | |
Custodian | | | 6,862 | |
Miscellaneous | | | 16,569 | |
| | | | |
Total expenses | | | 2,562,028 | |
| | | | |
Net investment income (loss) | | | 5,602,397 | |
| | | | |
|
| Realized and Unrealized Gain (Loss) on Investments | |
Net realized gain (loss) on investments | | | 31,507,964 | |
Net change in unrealized appreciation (depreciation) on investments | | | 28,922,993 | |
| | | | |
Net realized and unrealized gain (loss) on investments | | | 60,430,957 | |
| | | | |
Net increase (decrease) in net assets resulting from operations | | $ | 66,033,354 | |
| | | | |
| | | | | | |
The notes to the financial statements are an integral part of,
and should be read in conjunction with, the financial statements. | | | | | 15 | |
Statements of Changes in Net Assets
for the six months ended June 30, 2017 (Unaudited) and the year ended December 31, 2016
| | | | | | | | |
| | | 2017 | | | 2016 | |
| Increase (Decrease) in Net Assets | |
Operations: | | | | | | | | |
Net investment income (loss) | | $ | 5,602,397 | | | $ | 11,110,976 | |
Net realized gain (loss) on investments | | | 31,507,964 | | | | 34,344,804 | |
Net change in unrealized appreciation (depreciation) on investments | | | 28,922,993 | | | | 19,953,541 | |
| | | | |
Net increase (decrease) in net assets resulting from operations | | | 66,033,354 | | | | 65,409,321 | |
| | | | |
Dividends and distributions to shareholders: | | | | | | | | |
From net investment income: | | | | | | | | |
Initial Class | | | — | | | | (8,623,415 | ) |
Service Class | | | — | | | | (2,364,176 | ) |
| | | | |
| | | — | | | | (10,987,591 | ) |
| | | | |
From net realized gain on investments: | | | | | | | | |
Initial Class | | | — | | | | (35,260,971 | ) |
Service Class | | | — | | | | (11,192,144 | ) |
| | | | |
| | | — | | | | (46,453,115 | ) |
| | | | |
Total dividends and distributions to shareholders | | | — | | | | (57,440,706 | ) |
| | | | |
Capital share transactions: | | | | | | | | |
Net proceeds from sale of shares | | | 37,844,997 | | | | 74,657,918 | |
Net asset value of shares issued to shareholders in reinvestment of dividends and distributions | | | — | | | | 57,440,706 | |
Cost of shares redeemed | | | (50,318,242 | ) | | | (97,758,570 | ) |
| | | | |
Increase (decrease) in net assets derived from capital share transactions | | | (12,473,245 | ) | | | 34,340,054 | |
| | | | |
Net increase (decrease) in net assets | | | 53,560,109 | | | | 42,308,669 | |
|
| Net Assets | |
Beginning of period | | | 772,301,963 | | | | 729,993,294 | |
| | | | |
End of period | | $ | 825,862,072 | | | $ | 772,301,963 | |
| | | | |
Undistributed net investment income at end of period | | $ | 16,765,872 | | | $ | 11,163,475 | |
| | | | |
| | | | |
| 16 | | MainStay VP Common Stock Portfolio | | The notes to the financial statements are an integral part of,
and should be read in conjunction with, the financial statements. |
Financial Highlights selected per share data and ratios
| | | | | | | | | | | | | | | | | | | | | | | | |
| | | Six months
ended
June 30, | | | Year ended December 31, | |
| Initial Class | | 2017* | | | 2016 | | | 2015 | | | 2014 | | | 2013 | | | 2012 | |
Net asset value at beginning of period | | $ | 25.60 | | | $ | 25.43 | | | $ | 27.80 | | | $ | 24.58 | | | $ | 18.40 | | | $ | 16.02 | |
| | | | | | | | | | | | | | | | | | | | | | | | |
Net investment income (loss) | | | 0.20 | (a) | | | 0.40 | (a) | | | 0.42 | (a) | | | 0.37 | (a) | | | 0.37 | | | | 0.32 | (a) |
Net realized and unrealized gain (loss) on investments | | | 2.01 | | | | 1.82 | | | | (0.28 | ) | | | 3.19 | | | | 6.16 | | | | 2.36 | |
| | | | | | | | | | | | | | | | | | | | | | | | |
Total from investment operations | | | 2.21 | | | | 2.22 | | | | 0.14 | | | | 3.56 | | | | 6.53 | | | | 2.68 | |
| | | | | | | | | | | | | | | | | | | | | | | | |
| Less dividends and distributions: | | | | | | | | | | | | | | | | | | | | | | | | |
From net investment income | | | — | | | | (0.40 | ) | | | (0.38 | ) | | | (0.34 | ) | | | (0.35 | ) | | | (0.30 | ) |
From net realized gain on investments | | | — | | | | (1.65 | ) | | | (2.13 | ) | | | — | | | | — | | | | — | |
| | | | | | | | | | | | | | | | | | | | | | | | |
Total dividends and distributions | | | — | | | | (2.05 | ) | | | (2.51 | ) | | | (0.34 | ) | | | (0.35 | ) | | | (0.30 | ) |
| | | | | | | | | | | | | | | | | | | | | | | | |
Net asset value at end of period | | $ | 27.81 | | | $ | 25.60 | | | $ | 25.43 | | | $ | 27.80 | | | $ | 24.58 | | | $ | 18.40 | |
| | | | | | | | | | | | | | | | | | | | | | | | |
Total investment return (b) | | | 8.63 | %(c) | | | 9.12 | % | | | 0.85 | % | | | 14.53 | % | | | 35.66 | % | | | 16.72 | % |
| Ratios (to average net assets)/Supplemental Data: | | | | | | | | | | | | | | | | | | | | | | | | |
Net investment income (loss) | | | 1.46 | %†† | | | 1.57 | % | | | 1.55 | % | | | 1.44 | % | | | 1.48 | % | | | 1.80 | % |
Net expenses | | | 0.57 | %†† | | | 0.58 | % | | | 0.57 | % | | | 0.58 | % | | | 0.58 | % | | | 0.59 | % |
Portfolio turnover rate | | | 50 | % | | | 125 | % | | | 112 | % | | | 111 | % | | | 108 | % | | | 132 | % |
Net assets at end of period (in 000’s) | | $ | 602,540 | | | $ | 577,310 | | | $ | 580,635 | | | $ | 605,679 | | | $ | 570,986 | | | $ | 472,324 | |
| (a) | Per share data based on average shares outstanding during the period. |
| (b) | Total return does not reflect any deduction of sales charges, mortality and expense charges, contract charges or administrative charges. For periods of less than one year, total return is not annualized. |
| (c) | Total investment return may reflect adjustments to conform to generally accepted accounting principles. |
| | | | | | | | | | | | | | | | | | | | | | | | |
| | | Six months
ended
June 30, | | | Year ended December 31, | |
| Service Class | | 2017* | | | 2016 | | | 2015 | | | 2014 | | | 2013 | | | 2012 | |
Net asset value at beginning of period | | $ | 25.37 | | | $ | 25.23 | | | $ | 27.61 | | | $ | 24.44 | | | $ | 18.31 | | | $ | 15.94 | |
| | | | | | | | | | | | | | | | | | | | | | | | |
Net investment income (loss) | | | 0.16 | (a) | | | 0.33 | (a) | | | 0.35 | (a) | | | 0.31 | (a) | | | 0.26 | | | | 0.27 | (a) |
Net realized and unrealized gain (loss) on investments | | | 2.00 | | | | 1.81 | | | | (0.27 | ) | | | 3.15 | | | | 6.17 | | | | 2.35 | |
| | | | | | | | | | | | | | | | | | | | | | | | |
Total from investment operations | | | 2.16 | | | | 2.14 | | | | 0.08 | | | | 3.46 | | | | 6.43 | | | | 2.62 | |
| | | | | | | | | | | | | | | | | | | | | | | | |
| Less dividends and distributions: | | | | | | | | | | | | | | | | | | | | | | | | |
From net investment income | | | — | | | | (0.35 | ) | | | (0.33 | ) | | | (0.29 | ) | | | (0.30 | ) | | | (0.25 | ) |
From net realized gain on investments | | | — | | | | (1.65 | ) | | | (2.13 | ) | | | — | | | | — | | | | — | |
| | | | | | | | | | | | | | | | | | | | | | | | |
Total dividends and distributions | | | — | | | | (2.00 | ) | | | (2.46 | ) | | | (0.29 | ) | | | (0.30 | ) | | | (0.25 | ) |
| | | | | | | | | | | | | | | | | | | | | | | | |
Net asset value at end of period | | $ | 27.53 | | | $ | 25.37 | | | $ | 25.23 | | | $ | 27.61 | | | $ | 24.44 | | | $ | 18.31 | |
| | | | | | | | | | | | | | | | | | | | | | | | |
Total investment return (b) | | | 8.51 | %(c) | | | 8.85 | % | | | 0.60 | % | | | 14.25 | % | | | 35.32 | % | | | 16.43 | % |
| Ratios (to average net assets)/Supplemental Data: | | | | | | | | | | | | | | | | | | | | | | | | |
Net investment income (loss) | | | 1.21 | %†† | | | 1.32 | % | | | 1.30 | % | | | 1.19 | % | | | 1.23 | % | | | 1.54 | % |
Net expenses | | | 0.82 | %†† | | | 0.83 | % | | | 0.82 | % | | | 0.83 | % | | | 0.83 | % | | | 0.84 | % |
Portfolio turnover rate | | | 50 | % | | | 125 | % | | | 112 | % | | | 111 | % | | | 108 | % | | | 132 | % |
Net assets at end of period (in 000’s) | | $ | 223,322 | | | $ | 194,992 | | | $ | 149,358 | | | $ | 141,170 | | | $ | 90,813 | | | $ | 59,329 | |
| (a) | Per share data based on average shares outstanding during the period. |
| (b) | Total return does not reflect any deduction of sales charges, mortality and expense charges, contract charges or administrative charges. For periods of less than one year, total return is not annualized. |
| (c) | Total investment return may reflect adjustments to conform to generally accepted accounting principles. |
| | | | | | |
The notes to the financial statements are an integral part of,
and should be read in conjunction with, the financial statements. | | | | | 17 | |
Notes to Financial Statements (Unaudited)
Note 1–Organization and Business
MainStay VP Funds Trust (the “Fund”) was organized as a Delaware statutory trust on February 1, 2011. The Fund is registered under the Investment Company Act of 1940, as amended (the “1940 Act”), as an open-end management investment company. The Fund is comprised of thirty-two separate series (collectively referred to as the “Portfolios”). These financial statements and notes relate to the MainStay VP Common Stock Portfolio (the “Portfolio”), a “diversified” portfolio, as that term is defined in the 1940 Act, as interpreted or modified by regulatory authorities having jurisdiction, from time to time.
Shares of the Portfolio are currently offered to certain separate accounts to fund variable annuity policies and variable universal life insurance policies issued by New York Life Insurance and Annuity Corporation (“NYLIAC”), a wholly-owned subsidiary of New York Life Insurance Company (“New York Life”). NYLIAC allocates shares of the Portfolios to, among others, NYLIAC Variable Annuity Separate Accounts-I, II, III and IV, VUL Separate Account-I and CSVUL Separate Account-I (collectively, the “Separate Accounts”). Shares of the Portfolio are also offered to the MainStay VP Conservative Allocation Portfolio, MainStay VP Moderate Allocation Portfolio, MainStay VP Moderate Growth Allocation Portfolio and MainStay VP Growth Allocation Portfolio, which operate as “funds-of-funds.”
The Portfolio currently offers two classes of shares. Initial Class shares commenced operations on January 23, 1984. Service Class shares commenced operations on June 5, 2003. Shares of the Portfolio are offered and are redeemed at a price equal to their respective net asset value (“NAV”) per share. No sales or redemption charge is applicable to the purchase or redemption of the Portfolio’s shares. Under the terms of the Fund’s multiple class plan, adopted pursuant to Rule 18f-3 under the 1940 Act, the classes differ in that, among other things, Service Class shares of the Portfolio pay a combined distribution and service fee of 0.25% of average daily net assets attributable to Service Class shares of the Portfolio to the Distributor (as defined in Note 3(B)) pursuant to a plan adopted in accordance with Rule 12b-1 under the 1940 Act. Contract owners of variable annuity contracts purchased after June 2, 2003, are permitted to invest only in the Service Class shares.
The Portfolio’s investment objective is to seek long-term growth of capital.
Note 2–Significant Accounting Policies
The Portfolio is an investment company and accordingly follows the investment company accounting and reporting guidance of the Financial Accounting Standards Board (“FASB”) Accounting Standard Codification Topic 946 Financial Services—Investment Companies. The Portfolio prepares its financial statements in accordance with generally accepted accounting principles (“GAAP”) in the United States of America and follows the significant accounting policies described below.
(A) Securities Valuation. Investments are usually valued as of the close of regular trading on the New York Stock Exchange (the “Exchange”) (usually 4:00 p.m. Eastern time) on each day the Portfolio is open for business (“valuation date”).
The Board of Trustees (the “Board”) of the Fund adopted procedures establishing methodologies for the valuation of the Portfolio’s securities and other assets and delegated the responsibility for valuation determi-
nations under those procedures to the Valuation Committee of the Fund (the “Valuation Committee”). The Board authorized the Valuation Committee to appoint a Valuation Sub-Committee (the “Sub-Committee”) to deal in the first instance with establishing the prices of securities for which market quotations are not readily available or the prices of which are not otherwise readily determinable under these procedures. The Sub-Committee meets (in person, via electronic mail or via teleconference) on an as-needed basis. Subsequently, the Valuation Committee meets to ensure that actions taken by the Sub-Committee were appropriate. The procedures recognize that, subject to the oversight of the Board and unless otherwise noted, the responsibility for the day-to-day valuation of portfolio assets (including fair value measurements for the Portfolio’s assets and liabilities) rests with New York Life Investment Management LLC (“New York Life Investments” or the “Manager”), aided to whatever extent necessary by the Subadvisor (as defined in Note 3(A)) to the Portfolio.
To assess the appropriateness of security valuations, the Manager, the Subadvisor or the Portfolio’s third party service provider, who is subject to oversight by the Manager, regularly compares prior day prices, prices on comparable securities and the sale prices to the prior and current day prices and challenges prices with changes exceeding certain tolerance levels with third party pricing services or broker sources. For those securities valued through either a standardized fair valuation methodology or a fair valuation measurement, the Sub-Committee deals in the first instance with such valuation and the Valuation Committee reviews and affirms, if appropriate, the reasonableness of the valuation based on such methodologies and measurements on a regular basis after considering all relevant information that is reasonably available. Any action taken by the Sub-Committee with respect to the valuation of a portfolio security or other asset is submitted by the Valuation Committee to the Board for its review and ratification, if appropriate, at its next regularly scheduled meeting.
“Fair value” is defined as the price the Portfolio would reasonably expect to receive upon selling an asset or liability in an orderly transaction to an independent buyer in the principal or most advantageous market for the asset or liability. Fair value measurements are determined within a framework that establishes a three-tier hierarchy which maximizes the use of observable market data and minimizes the use of unobservable inputs to establish a classification of fair value measurements for disclosure purposes. “Inputs” refer broadly to the assumptions that market participants would use in pricing the asset or liability, including assumptions about risk, such as the risk inherent in a particular valuation technique used to measure fair value using a pricing model and/or the risk inherent in the inputs for the valuation technique. Inputs may be observable or unobservable. Observable inputs reflect the assumptions market participants would use in pricing the asset or liability based on market data obtained from sources independent of the Portfolio. Unobservable inputs reflect the Portfolio’s own assumptions about the assumptions market participants would use in pricing the asset or liability based on the information available. The inputs or methodology used for valuing assets or liabilities may not be an indication of the risks associated with investing in those assets or liabilities. The three-tier hierarchy of inputs is summarized below.
| • | | Level 1—quoted prices in active markets for an identical asset or liability |
| | |
| 18 | | MainStay VP Common Stock Portfolio |
| • | | Level 2—other significant observable inputs (including quoted prices for a similar asset or liability in active markets, interest rates and yield curves, prepayment speeds, credit risk, etc.) |
| • | | Level 3—significant unobservable inputs (including the Portfolio’s own assumptions about the assumptions that market participants would use in measuring fair value of an asset or liability) |
The level of an asset or liability within the fair value hierarchy is based on the lowest level of an input, both individually and in the aggregate, that is significant to the fair value measurement. As of June 30, 2017, the aggregate value by input level of the Portfolio’s assets and liabilities is included at the end of the Portfolio’s Portfolio of Investments.
The Portfolio may use third party vendor evaluations, whose prices may be derived from one or more of the following standard inputs, among others:
| | |
• Broker/dealer quotes | | • Benchmark securities |
• Two-sided markets | | • Reference data (corporate actions or material event notices) |
• Bids/offers | | • Monthly payment information |
• Industry and economic events | | • Reported trades |
An asset or liability for which market values cannot be measured using the methodologies described above is valued by methods deemed reasonable in good faith by the Valuation Committee, following the procedures established by the Board, to represent fair value. Under these procedures, the Portfolio generally uses a market-based approach which may use related or comparable assets or liabilities, recent transactions, market multiples, book values, and other relevant information. The Portfolio may also use an income-based valuation approach in which the anticipated future cash flows of the asset or liability are discounted to calculate fair value. Discounts may also be applied due to the nature and/or duration of any restrictions on the disposition of the asset or liability. Fair value represents a good faith approximation of the value of a security. Fair value determinations involve the consideration of a number of subjective factors, an analysis of applicable facts and circumstances and the exercise of judgment. As a result, it is possible that the fair value for a security determined in good faith in accordance with the Portfolio’s valuation procedures may differ from valuations for the same security determined by other funds using their own valuation procedures. Although the Portfolio’s valuation procedures are designed to value a security at the price the Portfolio may reasonably expect to receive upon the security’s sale in an orderly transaction, there can be no assurance that any fair value determination thereunder would, in fact, approximate the amount that the Portfolio would actually realize upon the sale of the security or the price at which the security would trade if a reliable market price were readily available. During the six-month period ended June 30, 2017, there were no material changes to the fair value methodologies.
Securities which may be valued in this manner include, but are not limited to: (i) a security for which trading has been halted or suspended; (ii) a debt security that has recently gone into default and for which there is not a current market quotation; (iii) a security of an issuer that has entered into a restructuring; (iv) a security that has been de-listed from a national exchange; (v) a security for which the market price is not readily available from a third party pricing source or, if so provided, does
not, in the opinion of the Manager or Subadvisor, reflect the security’s market value; (vi) a security subject to trading collars for which no or limited trading takes place; and (vii) a security whose principal market has been temporarily closed at a time when, under normal conditions, it would be open. Securities for which market quotations or observable inputs are not readily available are generally categorized as Level 3 in the hierarchy. As of June 30, 2017, there were no securities held by the Portfolio that were fair valued in such a manner.
Equity securities and shares of Exchange-Traded Funds (“ETFs”) are valued at the last quoted sales prices as of the close of regular trading on the relevant exchange on each valuation date. Securities that are not traded on the valuation date are valued at the mean of the last quoted bid and ask prices. Prices are normally taken from the principal market in which each security trades. Investments in mutual funds, including money market funds, are valued at their respective NAVs as of the close of the Exchange on the valuation date. These securities are generally categorized as Level 1 in the hierarchy.
Temporary cash investments acquired in excess of 60 days to maturity at the time of purchase are valued using the latest bid prices or using valuations based on a matrix system (which considers such factors as security prices, yields, maturities, and ratings), both as furnished by independent pricing services. Other temporary cash investments which mature in 60 days or less at the time of purchase (“Short-Term Investments”) are valued using the amortized cost method of valuation, unless the use of such method would be inappropriate. The amortized cost method involves valuing a security at its cost on the date of purchase and thereafter assuming a constant amortization to maturity of the difference between such cost and the value on maturity date. Amortized cost approximates the current fair value of a security. Securities valued using the amortized cost method are not valued using quoted prices in an active market and are generally categorized as Level 2 in the hierarchy.
The information above is not intended to reflect an exhaustive list of the methodologies that may be used to value portfolio investments. The valuation procedures permit the use of a variety of valuation methodologies in connection with valuing portfolio investments. The methodology used for a specific type of investment may vary based on the market data available or other considerations. The methodologies summarized above may not represent the specific means by which portfolio investments are valued on any particular business day.
(B) Income Taxes. The Portfolio’s policy is to comply with the requirements of the Internal Revenue Code of 1986, as amended (the “Internal Revenue Code”), applicable to regulated investment companies and to distribute all of its taxable income to the shareholders of the Portfolio within the allowable time limits. Therefore, no federal, state and local income tax provisions are required.
Management evaluates the Portfolio’s tax positions to determine if the tax positions taken meet the minimum recognition threshold in connection with accounting for uncertainties in income tax positions taken or expected to be taken for the purposes of measuring and recognizing tax liabilities in the financial statements. Recognition of tax benefits of an uncertain tax position is permitted only to the extent the position is “more likely than not” to be sustained assuming examination by taxing authorities. Management has analyzed the Portfolio’s tax positions taken
Notes to Financial Statements (Unaudited) (continued)
on federal, state and local income tax returns for all open tax years (for up to three tax years), and has concluded that no provisions for federal, state and local income tax are required in the Portfolio’s financial statements. The Portfolio’s federal, state and local income and federal excise tax returns for tax years for which the applicable statutes of limitations have not expired are subject to examination by the Internal Revenue Service and state and local departments of revenue.
(C) Dividends and Distributions to Shareholders. Dividends and distributions are recorded on the ex-dividend date. The Portfolio intends to declare and pay dividends from net investment income and distributions from net realized capital and currency gains, if any, at least annually. Unless the shareholder elects otherwise, all dividends and distributions are reinvested in the same class of shares of the Portfolio, at NAV. Dividends and distributions to shareholders are determined in accordance with federal income tax regulations and may differ from GAAP.
(D) Security Transactions and Investment Income. The Portfolio records security transactions on the trade date. Realized gains and losses on security transactions are determined using the identified cost method. Dividend income is recognized on the ex-dividend date; net of any foreign tax withheld at the source, and interest income is accrued as earned using the effective interest rate method. Discounts and premiums on Short-Term Investments are accreted and amortized, respectively, on the straight-line method. The straight-line method approximates the effective interest method for Short-Term Investments.
Investment income and realized and unrealized gains and losses on investments of the Portfolio are allocated pro rata to the separate classes of shares based upon their relative net assets on the date the income is earned or realized and unrealized gains and losses are incurred.
(E) Expenses. Expenses of the Fund are allocated to the individual Portfolios in proportion to the net assets of the respective Portfolios when the expenses are incurred, except where direct allocations of expenses can be made. Expenses (other than fees incurred under the distribution and service plans, further discussed in Note 3(B)) are allocated to separate classes of shares pro rata based upon their relative net assets on the date the expenses are incurred. The expenses borne by the Portfolio, including those of related parties to the Portfolio, are shown in the Statement of Operations. Additionally, the Portfolio may invest in shares of ETFs or mutual funds, which are subject to management fees and other fees that may increase their costs versus the costs of owning the underlying securities directly. These indirect expenses of ETFs or mutual funds are not included in the amounts shown as expenses in the Portfolio’s Statement of Operations or in the expense ratios included in the financial highlights.
(F) Use of Estimates. In preparing financial statements in conformity with GAAP, management makes estimates and assumptions that affect the reported amounts and disclosures in the financial statements. Actual results could differ from those estimates.
(G) Repurchase Agreements. The Portfolio may enter into repurchase agreements (i.e., buy a security from another party with the agreement that it be sold back in the future) to earn income. The Portfolio may enter into repurchase agreements only with counterparties, usually financial institutions, that are deemed by the Manager or
Subadvisor to be creditworthy, pursuant to guidelines established by the Board. During the term of any repurchase agreement, the Manager or Subadvisor will continue to monitor the creditworthiness of the counterparty. Under the 1940 Act, repurchase agreements are considered to be collateralized loans by the Portfolio to the counterparty secured by the securities transferred to the Portfolio.
Repurchase agreements are subject to counterparty risk, meaning the Portfolio could lose money by the counterparty’s failure to perform under the terms of the agreement. The Portfolio mitigates this risk by ensuring the repurchase agreement is collateralized by cash, U.S. government securities, fixed income securities and/or other securities. The collateral is held by the Portfolio’s custodian and valued daily on a mark to market basis to determine if the value, including accrued interest, exceeds the repurchase price. In the event of the counterparty’s default on the obligation to repurchase, the Portfolio has the right to liquidate the collateral and apply the proceeds in satisfaction of the obligation. Under certain circumstances, such as in the event of default or bankruptcy by the counterparty, realization and/or retention of the collateral may be limited or subject to delay, to legal proceedings and possible realized loss to the Portfolio.
(H) Securities Lending. In order to realize additional income, the Portfolio may engage in securities lending, subject to the limitations set forth in the 1940 Act and relevant guidance by the staff of the Securities and Exchange Commission (“SEC”). In the event the Portfolio does engage in securities lending, the Portfolio will lend through its custodian, State Street Bank and Trust Company (“State Street”). State Street will manage the Portfolio’s collateral in accordance with the lending agreement between the Portfolio and State Street, and indemnify the Portfolio against counterparty risk. The loans will be collateralized by U.S. Treasury securities at least equal at all times to the market value of the securities loaned. The Portfolio may bear the risk of delay in recovery of, or loss of rights in, the securities loaned should the borrower of the securities experience financial difficulty. The Portfolio may also record a realized gain or loss on securities deemed sold due to a borrower’s inability to return securities on loan. The Portfolio bears the risk of any loss on investment of the collateral. The Portfolio will receive compensation for lending its securities in the form of fees or it will retain a portion of interest on the investment of any cash received as collateral. The Portfolio will also continue to receive interest and dividends on the securities loaned and any gain or loss in the market price of the securities loaned that may occur during the term of the loan will be for the account of the Portfolio. During the six-month period ended June 30, 2017, the Portfolio did not have any portfolio securities on loan.
(I) Indemnifications. Under the Fund’s organizational documents, its officers and trustees are indemnified against certain liabilities that may arise out of performance of their duties to the Fund. Additionally, in the normal course of business, the Portfolio enters into contracts with third-party service providers that contain a variety of representations and warranties and which may provide general indemnifications. The Portfolio’s maximum exposure under these arrangements is unknown, as this would involve future claims that may be made against the Portfolio that have not yet occurred. Based on experience, management is of the view that the risk of loss in connection with these potential indemnification obligations is remote. However, there can be no
| | |
| 20 | | MainStay VP Common Stock Portfolio |
assurance that material liabilities related to such obligations will not arise in the future, which could adversely impact the Portfolio.
Note 3–Fees and Related Party Transactions
(A) Manager and Subadvisor. New York Life Investments, a registered investment adviser and an indirect, wholly-owned subsidiary of New York Life, serves as the Portfolio’s Manager pursuant to an Amended and Restated Management Agreement (“Management Agreement”). The Manager provides offices, conducts clerical, recordkeeping and bookkeeping services, and keeps most of the financial and accounting records required to be maintained by the Portfolio. Except for the portion of salaries and expenses that are the responsibility of the Portfolio, the Manager pays the salaries and expenses of all personnel affiliated with the Portfolio and certain operational expenses of the Portfolio. The Portfolio reimburses New York Life Investments in an amount equal to a portion of the compensation of the Chief Compliance Officer attributable to the Portfolio. Cornerstone Capital Management Holdings LLC (“Cornerstone Holdings” or “Subadvisor”), a registered investment adviser and an indirect wholly-owned subsidiary of New York Life, serves as Subadvisor to the Portfolio and is responsible for the day-to-day portfolio management of the Portfolio. Pursuant to the terms of a Subadvisory Agreement (“Subadvisory Agreement”) between New York Life Investments and Cornerstone Holdings, New York Life Investments pays for the services of the Subadvisor.
The Fund, on behalf of the Portfolio, pays New York Life Investments in its capacity as the Portfolio’s investment manager and administrator, pursuant to the Management Agreement, a monthly fee for services performed and facilities furnished at an annual rate of the Portfolio’s average daily net assets as follows: 0.55% up to $500 million; 0.525% from $500 million to $1 billion; and 0.50% in excess of $1 billion. During the six-month period ended June 30, 2017, the effective management fee rate was 0.54%.
During the six-month period ended June 30, 2017, New York Life Investments earned fees from the Portfolio in the amount of $2,165,124.
State Street provides sub-administration and sub-accounting services to the Portfolio pursuant to an agreement with New York Life Investments. These services include calculating the daily NAVs of the Portfolio, maintaining the general ledger and sub-ledger accounts for the calculation of the Portfolio’s NAVs, and assisting New York Life Investments in conducting various aspects of the Portfolio’s administrative operations. For providing these services to the Portfolio, State Street is compensated by New York Life Investments.
(B) Distribution and Service Fees. The Fund, on behalf of the Portfolio, has entered into a distribution agreement with NYLIFE Distributors LLC (the “Distributor”), an indirect, wholly-owned subsidiary of New York Life. The Portfolio has adopted a distribution plan (the “Plan”) in accordance with the provisions of Rule 12b-1 under the 1940 Act. Under the Plan, the Distributor has agreed to provide, through its affiliates or independent third parties, various distribution-related, shareholder and administrative support services to the Service Class shareholders. For its services, the Distributor is entitled to a combined distribution and service fee accrued daily and paid monthly at an annual rate of 0.25% of the average daily net assets attributable to the Service Class shares of the Portfolio.
Note 4–Federal Income Tax
During the year ended December 31, 2016, the tax character of distributions paid as reflected in the Statements of Changes in Net Assets was as follows:
| | |
| 2016 |
Tax-Based
Distributions
from Ordinary
Income | | Tax-Based
Distributions
from Long-Term
Gains |
| $10,987,591 | | $46,453,115 |
Note 5–Custodian
State Street is the custodian of cash and securities held by the Portfolio. Custodial fees are charged to the Portfolio based on the Portfolio’s net assets and/or the market value of securities held by the Portfolio and the number of certain transactions incurred by the Portfolio.
Note 6–Line of Credit
The Portfolio and certain other funds managed by New York Life Investments, maintain a line of credit with a syndicate of banks in order to secure a source of funds for temporary purposes to meet unanticipated or excessive redemption requests.
Effective August 1, 2017, under the credit agreement (the “Credit Agreement”), the aggregate commitment amount is $600,000,000 with an additional uncommitted amount of $100,000,000. The commitment fee is an annual rate of 0.15% of the average commitment amount payable quarterly, regardless of usage, to State Street, who serves as the agent to the syndicate. The commitment fee is allocated among the Portfolio and certain other funds managed by New York Life Investments based upon their respective net assets and other factors. Interest on any revolving credit loan is charged based upon the Federal Funds Rate or the one month LIBOR, whichever is higher. The Credit Agreement expires on July 31, 2018, although the Portfolio, certain other funds managed by New York Life Investments and the syndicate of banks may renew the Credit Agreement for an additional year on the same or different terms. Prior to August 1, 2017, the aggregate commitment amount was $600,000,000 with an additional uncommitted amount of $100,000,000, and the commitment fee, under a credit agreement for which Bank of New York Mellon served as agent, was at an annual rate of 0.15% of the average commitment amount. During the six-month period ended June 30, 2017, there were no borrowings made or outstanding with respect to the Portfolio under the credit agreement for which Bank of New York Mellon served as agent.
Note 7–Interfund Lending Program
Pursuant to an exemptive order issued by the SEC, the Portfolio, along with certain other funds managed by New York Life Investments, may participate in an interfund lending program. The interfund lending program provides an alternative credit facility that permits the Portfolio and certain other funds managed by New York Life Investments to lend or borrow money for temporary purposes directly to or from one another, subject to the conditions of the exemptive order. During the six-month period ended June 30, 2017, there were no interfund loans made or outstanding with respect to the Portfolio.
Notes to Financial Statements (Unaudited) (continued)
Note 8–Purchases and Sales of Securities (in 000’s)
During the six-month period ended June 30, 2017, purchases and sales of securities, other than short-term securities, were $399,076 and $406,109, respectively.
Note 9–Capital Share Transactions
Transactions in capital shares for the six-month period ended June 30, 2017, and the year ended December 31, 2016, were as follows:
| | | | | | | | |
Initial Class | | Shares | | | Amount | |
Six-month period ended June 30, 2017: | | | | | | | | |
Shares sold | | | 155,943 | | | $ | 4,185,239 | |
Shares redeemed | | | (1,041,646 | ) | | | (28,142,707 | ) |
| | | | |
Net increase (decrease) | | | (885,703 | ) | | $ | (23,957,468 | ) |
| | | | |
Year ended December 31, 2016: | | | | | | | | |
Shares sold | | | 278,659 | | | $ | 6,983,347 | |
Shares issued to shareholders in reinvestment of dividends and distributions | | | 1,787,464 | | | | 43,884,386 | |
Shares redeemed | | | (2,350,010 | ) | | | (59,802,788 | ) |
| | | | |
Net increase (decrease) | | | (283,887 | ) | | $ | (8,935,055 | ) |
| | | | |
| | |
| | | | | | | | |
Service Class | | Shares | | | Amount | |
Six-month period ended June 30, 2017: | | | | | | | | |
Shares sold | | | 1,259,798 | | | $ | 33,659,758 | |
Shares redeemed | | | (832,930 | ) | | | (22,175,535 | ) |
| | | | |
Net increase (decrease) | | | 426,868 | | | $ | 11,484,223 | |
| | | | |
Year ended December 31, 2016: | | | | | | | | |
Shares sold | | | 2,699,734 | | | $ | 67,674,571 | |
Shares issued to shareholders in reinvestment of dividends and distributions | | | 556,736 | | | | 13,556,320 | |
Shares redeemed | | | (1,491,700 | ) | | | (37,955,782 | ) |
| | | | |
Net increase (decrease) | | | 1,764,770 | | | $ | 43,275,109 | |
| | | | |
Note 10–Litigation
The Portfolio has been named as a defendant in the case entitled Kirschner v. FitzSimons, No. 12-2652 (S.D.N.Y.) (the “FitzSimons action”) as a result of its ownership of shares in the Tribune Company (“Tribune”) in 2007 when Tribune effected a leveraged buyout transaction (“LBO”) by which Tribune converted to a privately-held company. In its complaint, the plaintiff asserts claims against certain insiders, major shareholders, professional advisers, and others involved in the LBO. Separately, the complaint also seeks to obtain from former Tribune shareholders, including the Portfolios, any proceeds they received in connection with the LBO. The sole claim and cause of action brought against the Portfolios is for fraudulent conveyance pursuant to United States Bankruptcy Code Section 548(a)(1)(A).
In June 2011, certain Tribune creditors filed numerous additional actions asserting state law constructive fraudulent conveyance claims (the “SLCFC actions”) against specifically-named former Tribune shareholders and, in some cases, putative defendant classes comprised of former Tribune shareholders. One of the SLCFC actions, entitled Deutsche Bank Trust Co. Americas v. Blackrock Institutional Trust Co., No. 11-9319 (S.D.N.Y.) (the “Deutsche Bank action”), named the Portfolio as a defendant.
The FitzSimons action and Deutsche Bank action have been consolidated with the majority of the other Tribune LBO related lawsuits in a multidistrict litigation proceeding entitled In re Tribune Co. Fraudulent Conveyance Litig., No. 11-md-2296 (S.D.N.Y.) (the “MDL Proceeding”).
On September 23, 2013, the District Court granted the defendants’ motion to dismiss the SLCFC actions, including the Deutsche Bank action, on the basis that the plaintiffs did not have standing to pursue their claims. On September 30, 2013, the plaintiffs in the SLCFC actions filed a notice of appeal to the United States Court of Appeals for the Second Circuit. On October 28, 2013, the defendants filed a joint notice of cross-appeal of that same order. On March 29, 2016, the United States Court of Appeals for the Second Circuit issued its opinion on the appeal of the SLCFC actions. The appeals court affirmed the district court’s dismissal of those lawsuits, but on different grounds than the district court. The appeals court held that while the plaintiffs have standing under the U.S. Bankruptcy Code, their claims were preempted by Section 546(e) of the Bankruptcy Code-the statutory safe harbor for settlement payments. On April 12, 2016 the Plaintiffs in the SLCFC actions filed a petition seeking rehearing en banc before the appeals court. On July 22, 2016, the appeals court denied the petition. On September 9, 2016, the plaintiffs filed a petition for writ of certiorari in the U.S. Supreme Court challenging the Second Circuit’s decision that the safe harbor of Section 546(e) applied to their claims. Certain shareholder defendants filed a joint brief in opposition to the petition for certiorari on October 24, 2016. The plaintiffs filed a reply in support of the petition on November 4, 2016. The Supreme Court has not yet granted or denied the petition for certiorari.
On August 2, 2013, the plaintiff in the FitzSimons action filed a Fifth Amended Complaint. On May 23, 2014, the defendants filed motions to dismiss the FitzSimons action, including a global motion to dismiss Count I, which is the claim brought against former Tribune shareholders, for intentional fraudulent conveyance under U.S. federal law.
On January 6, 2017, the United States District Court for the Southern District of New York granted the shareholder defendants’ motion to dismiss the intentional fraudulent conveyance claim in the FitzSimons action. The Court concluded that the plaintiff had failed to allege that Tribune entered the LBO with actual intent to hinder, delay, or defraud its creditors, and therefore the complaint failed to state a claim. In dismissing the intentional fraudulent conveyance claim, the Court denied the plaintiff’s request to amend the complaint. While the District Court’s order granting the motion to dismiss is not immediately appealable, the plaintiff has asked the Court to direct entry of a final judgment in order to make the order immediately appealable. On February 23, 2017, the Court issued an order stating that it intends to permit an interlocutory appeal of the dismissal order, but will wait to do so until it has resolved outstanding motions to dismiss filed by other defendants. Accordingly, the timing of the appeal is uncertain. The value of the proceeds received by the Portfolios in connection with the LBO and the Portfolio’s cost basis in shares of Tribune was as follows:
| | | | | | | | |
Portfolio | | Proceeds | | | Cost Basis | |
MainStay VP Common Stock | | $ | 751,774 | | | $ | 729,369 | |
At this stage of the proceedings, it would be difficult to assess with any reasonable certainty the probable outcome of the pending litigation or the effect, if any, on the Portfolio’s net asset value.
| | |
| 22 | | MainStay VP Common Stock Portfolio |
Note 11–Recent Accounting Pronouncement
In October 2016, the SEC adopted new rules and amended existing rules (together, “final rules”) intended to modernize the reporting and disclosure of information by registered investment companies. In part, the final rules amend Regulation S-X and require standardized, enhanced disclosure about derivatives in investment company financial statements, as well as other amendments. The compliance date for the amendments to Regulation S-X is August 1, 2017 and applies to shareholder reports for funds with fiscal periods ending after August 1, 2017. Management is currently evaluating the impact that the adoption of the amendments to Regulation S-X will have on the Portfolio’s financial statements and related disclosures.
Note 12–Subsequent Events
In connection with the preparation of the financial statements of the Portfolio as of and for the six-month period ended June 30, 2017, events and transactions subsequent to June 30, 2017, through the date the financial statements were issued have been evaluated by the Portfolio’s management for possible adjustment and/or disclosure. No subsequent events requiring financial statement adjustment or disclosure have been identified.
Proxy Voting Policies and Procedures and Proxy Voting Record
A description of the policies and procedures that New York Life Investments uses to vote proxies related to the Portfolio’s securities is available without charge, upon request, (i) by calling 800-598-2019 or (ii) by visiting the SEC website at www.sec.gov.
The Portfolio is required to file with the SEC its proxy voting record for the 12-month period ending June 30 on Form N-PX. The Portfolio’s most recent Form N-PX or proxy voting record is available free of charge upon request (i) by calling 800-598-2019 or; (ii) by visiting the SEC’s website at www.sec.gov.
Shareholder Reports and Quarterly Portfolio Disclosure
The Portfolio is required to file its complete schedule of portfolio holdings with the SEC for its first and third fiscal quarters on Form N-Q. The Portfolio’s Form N-Q is available without charge on the SEC’s website at www.sec.gov or by calling MainStay Investments at 800-598-2019. You also can obtain and review copies of Form N-Q by visiting the SEC’s Public Reference Room in Washington, DC (information on the operation of the Public Reference Room may be obtained by calling 1-800-SEC-0330).
| | |
| 24 | | MainStay VP Common Stock Portfolio |
This page intentionally left blank
This page intentionally left blank
MainStay VP Portfolios
MainStay VP offers a wide range of Portfolios. The full array of MainStay VP offerings is listed here, with information about the manager, subadvisors, legal counsel, and independent registered public accounting firm.
Equity Portfolios
MainStay VP Common Stock Portfolio
MainStay VP Cornerstone Growth Portfolio
MainStay VP Eagle Small Cap Growth Portfolio
MainStay VP Emerging Markets Equity Portfolio
MainStay VP Epoch U.S. Equity Yield Portfolio
MainStay VP Epoch U.S. Small Cap Portfolio
MainStay VP International Equity Portfolio
MainStay VP Large Cap Growth Portfolio
MainStay VP MFS® Utilities Portfolio
MainStay VP Mid Cap Core Portfolio
MainStay VP S&P 500 Index Portfolio
MainStay VP Small Cap Core Portfolio
MainStay VP T. Rowe Price Equity Income Portfolio
MainStay VP VanEck Global Hard Assets Portfolio
Mixed Asset Portfolios
MainStay VP Balanced Portfolio
MainStay VP Convertible Portfolio
MainStay VP Cushing Renaissance Advantage Portfolio
MainStay VP Income Builder Portfolio
MainStay VP Janus Henderson Balanced Portfolio
Income Portfolios
MainStay VP Bond Portfolio
MainStay VP Floating Rate Portfolio
MainStay VP Government Portfolio
MainStay VP High Yield Corporate Bond Portfolio
MainStay VP Indexed Bond Portfolio
MainStay VP PIMCO Real Return Portfolio
MainStay VP Unconstrained Bond Portfolio
Money Market
MainStay VP U.S. Government Money Market Portfolio
Alternative
MainStay VP Absolute Return Multi-Strategy Portfolio
Asset Allocation Portfolios
MainStay VP Conservative Allocation Portfolio
MainStay VP Growth Allocation Portfolio
MainStay VP Moderate Allocation Portfolio
MainStay VP Moderate Growth Allocation Portfolio
Manager
New York Life Investment Management LLC
New York, New York
Subadvisors
Candriam Belgium*
Brussels, Belgium
Candriam France S.A.S.*
Paris, France
Cornerstone Capital Management Holdings LLC*
New York, New York
Cushing Asset Management, LP
Dallas, Texas
Eagle Asset Management, Inc.
St Petersburg, Florida
Epoch Investment Partners, Inc.
New York, New York
Janus Capital Management LLC
Denver, Colorado
MacKay Shields LLC*
New York, New York
Massachusetts Financial Services Company
Boston, Massachusetts
NYL Investors LLC*
New York, New York
Pacific Investment Management Company LLC
Newport Beach, California
T. Rowe Price Associates, Inc.
Baltimore, Maryland
Van Eck Associates Corporation
New York, New York
Winslow Capital Management, LLC
Minneapolis, Minnesota
Distributor
NYLIFE Distributors LLC*
Jersey City, New Jersey
Custodian
State Street Bank and Trust Company
Boston, Massachusetts
Independent Registered Public Accounting Firm
PricewaterhouseCoopers LLP
New York, New York
Legal Counsel
Dechert LLP
Washington, District of Columbia
Some Portfolios may not be available in all products.
* An affiliate of New York Life Investment Management LLC
Not part of the Semiannual Report
2017 Semiannual Report
This report is for the general information of New York Life Variable Annuities and NYLIAC Variable Universal Life Insurance Products policyowners. It must be preceded or accompanied by the appropriate product(s) and funds prospectuses if it is given to anyone who is not an owner of a New York Life variable annuity policy or a NYLIAC Variable Universal Life Insurance Product. This report does not offer for sale or solicit orders to purchase securities.
The performance data quoted in this report represents past performance. Past performance is no guarantee of future results. Due to market volatility and other factors, current performance may be lower or higher than the figures shown. The most recent month-end performance summary for your variable annuity or variable life policy is available by calling 800-598-2019 and is updated periodically on www.newyorklife.com.
The New York Life Variable Annuities and NYLIAC Variable Universal Life Insurance Products are issued by New York Life Insurance and Annuity Corporation (a Delaware Corporation) and distributed by NYLIFE Distributors LLC (Member FINRA/SIPC).
New York Life Insurance Company
New York Life Insurance and Annuity Corporation (NYLIAC) (A Delaware Corporation)
51 Madison Avenue, Room 551
New York, NY 10010
www.newyorklife.com
Printed on recycled paper
mainstayinvestments.com
NYLIFE Distributors LLC, 30 Hudson Street, Jersey City, NJ 07302
New York Life Investment Management LLC is the investment manager to the MainStay VP Funds Trust
©2017 by NYLIFE Distributors LLC. All rights reserved.
You may obtain copies of the Prospectus and the Statement of Additional Information free of charge, upon request, by calling toll-free 800-598-2019 or writing to New York Life Insurance and Annuity Corporation, 51 Madison Avenue, New York, NY 10010.
| | | | |
| Not FDIC Insured | | No Bank Guarantee | | May Lose Value |
| | | | |
| 1744023 | | | | MSVPCS10-08/17 (NYLIAC) NI511 |
MainStay VP Balanced Portfolio
Message from the President and Semiannual Report
Unaudited | June 30, 2017

Sign up for electronic delivery of your shareholder reports. For full details on electronic delivery, including who can participate and what you
can receive via eDelivery, please log on to www.newyorklife.com/vsc

This page intentionally left blank
Message from the President
The six months ended June 30, 2017, brought positive results to many stock and bond investors. The year began with many investors hoping that Republican control of the White House, the Senate and the House of Representatives could bring an end to political gridlock; and while debate has continued on a number of issues, the U.S. stock market climbed relatively steadily throughout the first half of 2017.
According to FTSE-Russell U.S. market data, stocks at all capitalization levels tended to record positive total returns during the reporting period, with large-cap stocks generally outperforming stocks of smaller-capitalization companies. Growth stocks outpaced value stocks at every capitalization level by substantial margins—from more than six percentage points for micro-caps and mid-caps to more than 10 percentage points for the largest 200 U.S. companies by market capitalization.
Most sectors of the stock market advanced during the reporting period, with energy and telecommunication services being notable exceptions. Energy stocks declined as oil prices fell despite moves by the Organization of Petroleum Exporting Countries (OPEC) intended to limit oil production by its members. Telecommunication services stocks tended to decline as competition increased and rising interest rates made dividend payouts less appealing.
In March and June of 2017, the Federal Reserve announced successive increases in the target range for the federal funds rate, ultimately bringing the federal funds target range to 1.00% to 1.25%. While short-term U.S. Treasury yields rose in response, yields for U.S. Treasury securities with maturities of five years or longer declined. As the difference between short- and long-term yields narrowed, the advantages of higher-yielding long-term bonds became increasingly apparent.
Virtually all taxable and tax-exempt bond sectors provided positive total returns during the reporting period. Mortgage-backed
securities, though providing positive total returns, faced headwinds when the Federal Reserve announced plans to begin normalizing its balance sheet by reducing reinvestment of principal payments on mortgage-backed securities.
International stock and bond markets were also strong during the reporting period. International stocks provided double-digit total returns that were surpassed by emerging-market stocks as a whole. Global investment-grade bonds provided single-digit returns; and emerging-market debt was somewhat stronger.
Even during periods of favorable market performance and generally positive returns, MainStay believes that it is important to carefully monitor your investments. Your risk tolerance may
change over time, leading you to reevaluate which MainStay VP Portfolios are most appropriate for your long-term goals. Your goals themselves may also change, leading you to pursue investments with more or less risk. The portfolio managers of MainStay VP Portfolios seek to provide results consistent with the investment objectives of their respective Portfolios, to give you a wide range of choices suitable to various investment needs.
The report that follows provides more detailed information about the specific markets, securities and investment decisions that influenced your MainStay VP Portfolio during the six months ended June 30, 2017. We invite you to review the report carefully as part of your ongoing investment evaluation and review.
Sincerely,

Stephen P. Fisher
President
The opinions expressed are as of the date of the accompanying report and are subject to change. Past performance is no guarantee of future results. There is no guarantee that any forecasts made will come to pass. This material does not constitute investment advice and is not intended as an endorsement of any specific investment.
Not all MainStay VP Portfolios and/or share classes are available under all policies.
Not part of the Semiannual Report
Table of Contents
Investors should refer to the Portfolio’s Summary Prospectus and/or Prospectus and consider the Portfolio’s investment objectives, strategies, risks, charges and expenses carefully before investing. The Summary Prospectus and/or Prospectus contain this and other information about the Portfolio. You may obtain copies of the Portfolio’s Summary Prospectus and/or the Prospectus and the Statement of Additional Information free of charge, upon request, by calling toll-free 800-598-2019, by writing to New York Life Insurance and Annuity Corporation, 51 Madison Avenue, Room 251, New York, New York 10010 or by sending an email to MainStayShareholdersServices@nylim.com. These documents are also available at mainstayinvestments.com/vpdocuments. Please read the Summary Prospectus and/or Prospectus carefully before investing. MainStay VP Funds Trust portfolios are separate account options which are purchased through a variable insurance or variable annuity contract.
Investment and Performance Comparison1 (Unaudited)
Performance data quoted represents past performance. Past performance is no guarantee of future results. Because of market volatility and other factors, current performance may be lower or higher than the figures shown. Investment return and principal value will fluctuate, and as a result, when shares are redeemed, they may be worth more or less than their original cost. The performance table and graph do not reflect any deduction of sales charges, mortality and expense charges, contract charges or administrative charges. Please refer to the Performance Summary appropriate for your policy. For performance information current to the most recent month-end, please call 800-598-2019 or visit www.newyorklife.com.
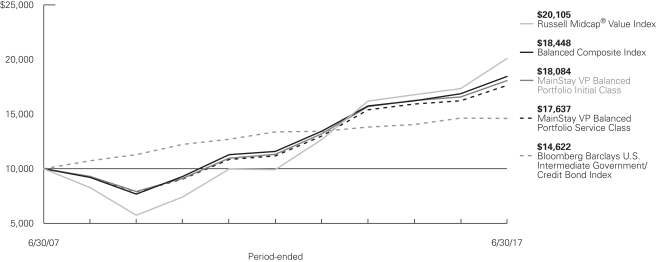
Average Annual Total Returns for the Period Ended June 30, 2017
| | | | | | | | | | | | | | | | | | | | | | |
| Class | | Inception
Date | | Six Months | | | One Year | | | Five Years | | | Ten Years | | | Gross
Expense
Ratio2 | |
Initial Class Shares | | 5/2/2005 | | | 3.77 | % | | | 9.02 | % | | | 9.82 | % | | | 6.10 | % | | | 0.79 | % |
Service Class Shares | | 5/2/2005 | | | 3.64 | | | | 8.75 | | | | 9.55 | | | | 5.84 | | | | 1.04 | |
| | | | | | | | | | | | | | | | |
| Benchmark Performance | | Six
Months | | | One
Year | | | Five
Years | | | Ten
Years | |
Russell Midcap® Value Index3 | | | 5.18 | % | | | 15.93 | % | | | 15.14 | % | | | 7.23 | % |
Bloomberg Barclays U.S. Intermediate Government/Credit Bond Index4 | | | 1.73 | | | | –0.21 | | | | 1.77 | | | | 3.87 | |
Balanced Composite Index5 | | | 3.80 | | | | 9.30 | | | | 9.75 | | | | 6.32 | |
Average Lipper Variable Products Mixed-Asset Target Allocation Growth Portfolio6 | | | 7.70 | | | | 12.52 | | | | 9.01 | | | | 5.17 | |
| 1. | Performance figures reflect certain fee waivers and/or expense limitations, without which total returns may have been different. For information on current fee waivers and/or expense limitations (if any), please refer to the Notes to Financial Statements. |
| 2. | The gross expense ratios presented reflect the Portfolio’s “Total Annual Portfolio Operating Expenses” from the most recent Prospectus and may differ from other expense ratios disclosed in this report. |
| 3. | The Russel Midcap Value® Index is the Portfolio’s primary broad-based securities market index for comparison purposes. The Russell Midcap® Value Index measures the performance of the mid-cap value segment of the U.S. equity universe. It includes those Russell Midcap® Index companies with lower price-to-book ratios and lower forecasted growth values. Results assume reinvestment of all dividends and capital gains. An investment cannot be made directly in an index. |
| 4. | The Portfolio has selected the Bloomberg Barclays U.S. Intermediate Government/Credit Bond Index as a secondary benchmark. The Bloomberg Barclays U.S. Intermediate Government/Credit Bond Index measures the performance of U.S. dollar-denominated U.S. Treasurys, government- |
| | related and investment-grade U.S. corporate securities that have a remaining maturity of greater than one year and less than ten years. Results assume reinvestment of all dividends and capital gains. An investment cannot be made directly in an index. |
| 5. | The Portfolio has selected the Balanced Composite Index as an additional benchmark. The Balanced Composite Index consists of the Russell Midcap® Value Index (60% weighted) and the Bloomberg Barclays U.S. Intermediate Government/Credit Bond Index (40% weighted). Results assume reinvestment of all dividends and capital gains. An investment cannot be made directly in an index. |
| 6. | The Average Lipper Variable Products Mixed-Asset Target Allocation Growth Portfolio is representative of portfolios that, by portfolio practice, maintain a mix of between 60%-80% equity securities, with the remainder invested in bonds, cash, and cash equivalents. The benchmark is a product of Lipper Inc. Lipper Inc. is an independent monitor of fund performance. Results are based on average total returns of similar portfolios with all dividend and capital gain distributions reinvested. |
Cost in Dollars of a $1,000 Investment in MainStay VP Balanced Portfolio (Unaudited)
The example below is intended to describe the fees and expenses borne by shareholders during the six-month period from January 1, 2017 to June 30, 2017, and the impact of those costs on your investment.
Example
As a shareholder of the Portfolio, you incur two types of costs: (1) transaction costs, including exchange fees and sales charges (loads) on purchases (as applicable), and (2) ongoing costs, including management fees, distribution and/or service (12b-1) fees, and other Portfolio expenses (as applicable). This example is intended to help you understand your ongoing costs (in dollars) of investing in the Portfolio and to compare these costs with the ongoing costs of investing in other mutual funds. The example is based on an investment of $1,000 made at the beginning of the six-month period and held for the entire period from January 1, 2017 to June 30, 2017. Shares are only sold in connection with variable life and annuity contracts and the example does not reflect any contract level or transactional fees or expenses. If these costs had been included, your costs would have been higher.
This example illustrates your Portfolio’s ongoing costs in two ways:
Actual Expenses
The second and third data columns in the table below provide information about actual account values and actual expenses. You may use the information in these columns, together with the amount you invested, to estimate the expenses that you paid during the six months ended June 30, 2017. Simply divide your account value by $1,000
(for example, an $8,600 account value divided by $1,000 = 8.6), then multiply the result by the number under the heading entitled “Expenses Paid During Period” to estimate the expenses you paid on your account during this period.
Hypothetical Example for Comparison Purposes
The fourth and fifth data columns in the table below provide information about hypothetical account values and hypothetical expenses based on the Portfolio’s actual expense ratio and an assumed rate of return of 5% per year before expenses, which is not the Portfolio’s actual return. The hypothetical account values and expenses may not be used to estimate the actual ending account balances or expenses you paid for the six-month period shown. You may use this information to compare the ongoing costs of investing in the Portfolio with the ongoing costs of investing in other mutual funds. To do so, compare this 5% hypothetical example with the 5% hypothetical examples that appear in the shareholder reports of the other mutual funds.
Please note that the expenses shown in the table are meant to highlight your ongoing costs only and do not reflect any transactional costs, such as exchange fees or sales charges (loads). Therefore, the fourth and fifth data columns of the table are useful in comparing ongoing costs only and will not help you determine the relative total costs of owning different funds. In addition, if these transactional costs were included, your costs would have been higher.
| | | | | | | | | | | | | | | | | | | | | | |
| | | | | | | | | | | | | | | | | | |
| Share Class | | Beginning
Account
Value
1/1/17 | | | Ending Account
Value (Based
on Actual
Returns and
Expenses)
6/30/17 | | | Expenses
Paid
During
Period1 | | | Ending Account
Value (Based
on Hypothetical
5% Annualized
Return and
Actual Expenses)
6/30/17 | | | Expenses
Paid
During
Period1 | | | Net Expense
Ratio
During
Period2 |
| | | | | | |
| Initial Class Shares | | $ | 1,000.00 | | | $ | 1,037.70 | | | $ | 3.79 | | | $ | 1,021.10 | | | $ | 3.76 | | | 0.75% |
| | | | | | |
| Service Class Shares | | $ | 1,000.00 | | | $ | 1,036.40 | | | $ | 5.05 | | | $ | 1,019.80 | | | $ | 5.01 | | | 1.00% |
| 1. | Expenses are equal to the Portfolio’s annualized expense ratio of each class multiplied by the average account value over the period, divided by 365 and multiplied by 181 (to reflect the six-month period). The table above represents the actual expenses incurred during the six-month period. |
| 2. | Expenses are equal to the Portfolio’s annualized expense ratio to reflect the six-month period. |
| | |
| 6 | | MainStay VP Balanced Portfolio |
Portfolio Composition as of June 30, 2017 (Unaudited)
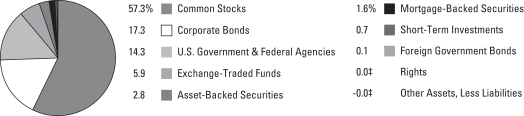
See Portfolio of Investments beginning on page 11 for specific holdings within these categories.
| ‡ | Less than one-tenth of a percent. |
Top Ten Holdings or Issuers Held as of June 30, 2017 (excluding short-term investments) (Unaudited)
| 1. | United States Treasury Notes, 0.75%–2.375%, due 12/31/17-5/15/27 |
| 2. | Vanguard Mid-Cap Value ETF |
| 3. | iShares Intermediate Government / Credit Bond ETF |
| 4. | Federal National Mortgage Association, 0.875%–1.875%, due 7/26/19–9/24/26 |
| 5. | iShares Russell 1000 Value ETF |
| 8. | iShares Intermediate Credit Bond ETF |
Portfolio Management Discussion and Analysis (Unaudited)
Answers to the questions reflect the views of portfolio managers Jae S. Yoon, CFA, and Jonathan Swaney of New York Life Investment Management LLC, the Portfolio’s Manager; Thomas J. Girard, Donald F. Serek, CFA, and George S. Cherpelis of NYL Investors LLC, the Portfolio’s fixed-income Subadvisor; and Andrew Ver Planck, CFA, and Migene Kim, CFA, of Cornerstone Capital Management Holdings LLC, the Portfolio’s equity Subadvisor.
How did MainStay VP Balanced Portfolio perform relative to its benchmarks and peers during the six months ended June 30, 2017?
For the six months ended June 30, 2017, MainStay VP Balanced Portfolio returned 3.77% for Initial Class shares and 3.64% for Service Class shares. Over the same period both share classes underperformed the 5.18% return of the Russell Midcap® Value Index,1 which is the Portfolio’s primary benchmark, and outperformed the 1.73% return of the Bloomberg Barclays U.S. Intermediate Government/Credit Bond Index,1 which is a secondary benchmark of the Portfolio. Both share classes underperformed the 3.80% return of the Balanced Composite Index,1 which is an additional benchmark of the Portfolio, and the 7.70% return of the Average Lipper2 Variable Products Mixed-Asset Target Allocation Growth Portfolio for the six months ended June 30, 2017.
Were there any changes to the Portfolio during the reporting period?
Effective June 1, 2017, Jonathan Swaney was added as a portfolio manager of the Portfolio.
What factors affected the relative performance of the equity portion of the Portfolio during the reporting period?
During the reporting period, stock selection decisions made modestly positive contributions to the performance of the equity portion of the Portfolio relative to the Russell Midcap® Value Index. (Contributions take weightings and total returns into account.) Allocation effects—being overweight or underweight in specific sectors as a result of the bottom-up stock selection process of the equity portion of the Portfolio—also provided modestly positive contributions to the relative performance of the equity portion of the Portfolio.
Which sectors were the strongest positive contributors to the relative performance of the equity portion of the Portfolio, and which sectors were particularly weak?
During the reporting period, industrials, information technology and health care were the strongest-contributing sectors to relative performance in the equity portion of the Portfolio. These sector contributions were driven primarily by favorable stock selection. Overweight positions in the outperforming information technology and health care sectors also contributed positively to relative performance in the equity portion of the Portfolio.
During the reporting period, the weakest sector contributions to relative performance in the equity portion of the Portfolio came
from materials, energy and utilities. Unfavorable stock selection detracted from results in these sectors, while an overweight position in the underperforming energy sector—and an underweight position in the outperforming utilities sector—also detracted from relative performance in the equity portion of the Portfolio.
During the reporting period, which individual stocks made the strongest positive contributions to the absolute performance of the equity portion of the Portfolio and which stocks detracted the most?
The strongest positive contributor to absolute performance in the equity portion of the Portfolio was semiconductor and memory solutions provider Micron Technology. The company continued to deliver strong results and benefited from solid demand for its products from data centers, handset makers and the auto industry. These trends also helped generate strong absolute returns for Lam Research, which was also held in the equity portion of the Portfolio. The company manufactures equipment used in the production of semiconductor materials. Data storage device maker Western Digital was another positive contributor to absolute performance in the equity portion of the Portfolio, supported by better-than-expected earnings and margins.
On an absolute basis, the weakest contributor to absolute performance in the equity portion of the Portfolio was insurance company AmTrust Financial Services, whose stock price fell after the company disclosed accounting issues that could require restatements of previous financial results. Offshore contract drilling service provider Transocean also detracted from absolute performance in the equity portion of the Portfolio. The company’s stock price declined in concert with crude oil prices during the reporting period. The share price of steel producer United States Steel also declined after the company reported operating results that were well below expectations. The company experienced continued weakness and supply concerns within the commodity segment.
Did the equity portion of the Portfolio make any significant purchases or sales during the reporting period?
During the reporting period, the equity portion of the Portfolio established new positions in consumer electronics retailer Best Buy and health care real estate investment trust (REIT) HCP. As of June 30, 2017, these positions were overweight relative to the Russell Midcap® Value Index. In our view, Best Buy had exhibited strong cash flow–based valuation and attractive price
| 1. | See footnote on page 5 for more information on this index. |
| 2. | See footnote on page 5 for more information on Lipper Inc. |
| | |
| 8 | | MainStay VP Balanced Portfolio |
and earnings trends. HCP also looked attractive to us from a valuation perspective, while the REIT exhibited strong earnings trends.
During the reporting period, the equity portion of the Portfolio exited its previously overweight positions in steel manufacturers Nucor and Reliance Steel & Aluminum. In both cases, earnings and sentiment signals deteriorated, which in our opinion made the valuations less than compelling.
During the reporting period, how did sector weightings change in the equity portion of the Portfolio?
During the reporting period, the equity portion of the Portfolio modestly increased its weightings relative to the Russell Midcap® Value Index in the utilities and industrials sectors. Over the same period, the equity portion of the Portfolio modestly decreased its weightings relative to the Index in consumer discretionary and materials.
How was the equity portion of the Portfolio positioned at the end of the reporting period?
As of June 30, 2017, the equity portion of the Portfolio held modestly overweight positions relative to the Russell Midcap® Value Index in the information technology and consumer staples sectors. As of the same date, the equity portion of the Portfolio held modestly underweight positions relative to the Index in the real estate and materials sectors.
During the reporting period, what factors affected relative performance in the fixed-income portion of the Portfolio?
Throughout the reporting period, the fixed-income portion of the Portfolio held overweight positions relative to the Bloomberg Barclays U.S. Government/Credit Bond Index in corporate bonds, asset-backed securities and commercial mortgage-backed securities. The corporate sector was the best-performing sector in the fixed-income portion of the Portfolio during the reporting period. The fixed-income portion of the Portfolio held overweight positions in asset-backed securities and commercial mortgage-backed securities that added to performance during the reporting period. During the first half of the reporting period, the non-corporate sector was the best performing sector in the Bloomberg Barclays U.S. Government/Credit Bond Index. The fixed-income portion of the Portfolio held an underweight position relative to the Index in this sector, which detracted from relative performance during this portion of the reporting period. The fixed-income portion of the Portfolio held an overweight position in asset-backed securities, which added to performance during this time frame. During the
second half of the reporting period, the fixed-income portion of the Portfolio enjoyed positive excess relative return driven by an overweight position in U.S. corporates, particularly the banking subsector.
What was the duration3 strategy of the fixed-income portion of the Portfolio during the reporting period?
During the reporting period, the fixed-income portion of the Portfolio maintained a duration that was relatively close to the duration of the Bloomberg Barclays U.S. Intermediate Government/Credit Bond Index. There were two occasions when the duration of the fixed-income portion of the Portfolio was shorter than the duration of the benchmark. These variations in duration relative to the Index had a slightly negative impact on the performance of the fixed-income portion of the Portfolio. As of June 30, 2017, the effective duration of the fixed-income portion of the Portfolio was 4.04 years, which was in line with the 4.04-year duration of the Bloomberg Barclays U.S. Intermediate Government/Credit Bond Index.
What specific factors, risks or market forces prompted significant decisions for the fixed-income portion of the Portfolio during the reporting period?
The fixed-income portion of the Portfolio maintained overweight positions relative to the Bloomberg Barclays U.S. Intermediate Government/Credit Bond Index in corporate bonds, commercial mortgage-backed securities and asset-backed securities. Toward the beginning of the reporting period, consistent economic data and a shift in tone at the Federal Reserve pushed interest rates higher. This provided a favorable backdrop for investment-grade corporate bonds and prompted us to increase the overweight position in the sector in the fixed-income portion of the Portfolio. Toward the end of the reporting period, strong fundamentals and a favorable yield profile led us to add to an overweight position in the commercial mortgage-backed securities sector. During this portion of the reporting period, we also increased the allocation to asset-backed securities by adding short-duration, high-quality assets to the fixed-income portion of the Portfolio.
During the reporting period, which market segments made the strongest positive contributions to the performance of the fixed-income portion of the Portfolio and which market segments were particularly weak?
During the reporting period, the fixed-income portion of the Portfolio maintained overweight positions relative to the Bloomberg Barclays U.S. Intermediate Government/Credit Bond Index in the financials, industrials and utilities sectors. This positioning
| 3. | Duration is a measure of the price sensitivity of a fixed-income investment to changes in interest rates. Duration is expressed as a number of years and is considered a more accurate sensitivity gauge than average maturity. |
benefited the performance of the fixed-income portion of the Portfolio relative to this Index. In financials, the fixed-income portion of the Portfolio had overweight positions among banks, which made the greatest positive contributions to the relative performance of the fixed-income portion of the Portfolio. Overweight positions in banking companies Fifth Third Bancorp, BNP Paribas and Credit Suisse Group all contributed positively to relative performance in the fixed-income portion of the Portfolio. In the industrials sector, basic materials, consumer cyclical and communications were the best-performing subsectors in the fixed-income portion of the Portfolio. Telecommunications company Telefonica, automaker Ford Motor Company and building materials company Masco were among the best performers in the fixed-income portion of the Portfolio. Allocations that detracted from the relative performance of the fixed-income portion of the Portfolio during the reporting period included energy and the non-corporate sectors. In energy, the fixed-income portion of the Portfolio underperformed the Bloomberg Barclays U.S. Intermediate Government/Credit Bond Index primarily because of positioning in the integrated energy industry. Within the non-corporate sectors, the fixed-income portion of the Portfolio held underweight positions relative to the Bloomberg Barclays U.S. Intermediate Government/Credit Bond Index, and these positions detracted from performance.
Did the fixed-income portion of the Portfolio make any significant purchases or sales during the reporting period?
During the reporting period, the fixed-income portion of the Portfolio generally sought to purchase corporate bonds during periods of market weakness and to sell corporate bonds as the market rallied. During the beginning of the reporting period, we made significant purchases in the banking subsector. These purchases were driven by our favorable view of valuations within the banking subsector.
During the reporting period, how did sector weightings change in the fixed-income portion of the Portfolio?
The fixed-income portion of the Portfolio had overweight allocations within the financials, industrials and utilities sectors. During the first half of the reporting period, these weightings were increased to take advantage of what we viewed to be a
strong technical backdrop as well as a robust new issue calendar. The corresponding increases in these overweight positions relative to the Bloomberg Barclays U.S. Intermediate Government/Credit Bond Index were primarily concentrated in the banking, capital goods, communications and electric subsectors. Toward the end of the reporting period, the fixed-income portion of the Portfolio slightly reduced its overweight position relative to the Bloomberg Barclays U.S. Intermediate Government/Credit Bond Index in corporate bonds. We still had a favorable view of the asset class, but we were cautious in the short term. Summer months are often known for lower liquidity leading to greater volatility. During the latter part of the reporting period, the fixed-income portion of the Portfolio added to its overweight positions in the commercial mortgage-backed securities and asset-backed securities sectors. Throughout the reporting period the fixed-income portion of the Portfolio decreased its weighting in the U.S. Treasury sector to fund purchases in spread4 assets.
How was the fixed-income portion of the Portfolio positioned at the end of the reporting period?
As of June 30, 2017, the fixed-income portion of the Portfolio held an overweight position relative to the Bloomberg Barclays Intermediate Government/Credit Bond Index in corporate bonds. In the corporate sector, the fixed-income portion of the Portfolio was overweight in financials, industrials and utilities as of June 30, 2017. As of the same date, the fixed-income portion of the Portfolio also held overweight positions relative to the Bloomberg Barclays U.S. Intermediate Government/Credit Bond Index in asset-backed securities, commercial mortgage-backed securities and U.S. government agency securities. As of June 30, 2017, the most substantially overweight allocation in spread assets in the fixed-income portion of the Portfolio was to the asset-backed securities sector.
As of June 30, 2017, the fixed-income portion of the Portfolio held underweight positions relative to the Bloomberg Barclays Intermediate Government/Credit Bond Index in the sovereign, supranational, foreign agency and foreign local government sectors. As of the same date, the fixed-income portion of the Portfolio maintained a duration that was in line with the duration of the Bloomberg Barclays U.S. Intermediate Government/Credit Bond Index.
| 4. | The terms “spread” and “yield spread” may refer to the difference in yield between a security or type of security and comparable U.S. Treasury issues. The terms may also refer to the difference in yield between two specific securities or types of securities at a given time. The term “spread assets” refers to asset classes that typically trade at a spread to comparable U.S. Treasury securities. |
The opinions expressed are those of the portfolio managers as of the date of this report and are subject to change. There is no guarantee that any forecasts made will come to pass. This material does not constitute investment advice and is not intended as an endorsement of any specific investment.
Not all MainStay VP Portfolios and/or share classes are available under all policies.
| | |
| 10 | | MainStay VP Balanced Portfolio |
Portfolio of Investments June 30, 2017 (Unaudited)
| | | | | | | | |
| | | Principal
Amount | | | Value | |
Long-Term Bonds 36.1%† Asset-Backed Securities 2.8% | |
Automobile 0.1% | |
Capital Automotive REIT
Series 2017-1A, Class A1
3.87%, due 4/15/47 (a) | | $ | 199,667 | | | $ | 202,050 | |
Hertz Vehicle Financing LLC
Series 2016-1A, Class A
2.32%, due 3/25/20 (a) | | | 200,000 | | | | 199,306 | |
| | | | | | | | |
| | | | 401,356 | |
| | | | | | | | |
Other ABS 2.7% | |
AIMCO CLO (a)(b) | |
Series 2014-AA, Class AR
2.181%, due 7/20/26 | | | 500,000 | | | | 499,984 | |
Series 2017-AA, Class A
2.593%, due 7/20/29 | | | 250,000 | | | | 249,994 | |
Apidos CLO XXV
Series 2016-25A, Class A1
2.363%, due 10/20/28 (a)(b) | | | 475,000 | | | | 476,465 | |
Ares XXIX CLO, Ltd.
Series 2014-1A, Class A1R
2.038%, due 4/17/26 (a)(b) | | | 250,000 | | | | 250,493 | |
Babson CLO, Ltd.
Series 2013-IA, Class A
2.13%, due 4/20/25 (a)(b) | | | 450,000 | | | | 450,671 | |
Birchwood Park CLO, Ltd.
Series 2014-1A, Class AR
2.203%, due 7/15/26 (a)(b) | | | 250,000 | | | | 250,142 | |
Canyon Capital CLO, Ltd.
Series 2015-1A, Class AS
2.408%, due 4/15/29 (a)(b) | | | 690,000 | | | | 689,997 | |
Cedar Funding IV CLO, Ltd.
Series 2014-4A, Class AR
2.386%, due 7/23/30 (a)(b) | | | 750,000 | | | | 749,995 | |
Domino’s Pizza Master Issuer LLC
Series 2017-1A, Class A2II
3.082%, due 7/25/47 (a) | | | 1,300,000 | | | | 1,293,703 | |
Dryden Senior Loan Fund
Series 2014-33A, Class AR
2.452%, due 10/15/28 (a)(b) | | | 250,000 | | | | 251,651 | |
Dryden XXXI Senior Loan Fund
Series 2014-31A, Class AR
2.238%, due 4/18/26 (a)(b) | | | 280,000 | | | | 280,000 | |
Finn Square CLO, Ltd.
Series 2012-1A, Class A1R
2.367%, due 12/24/23 (a)(b) | | | 134,059 | | | | 134,274 | |
FOCUS Brands Funding LLC
Series 2017-1A, Class A2I
3.857%, due 4/30/47 (a) | | | 100,000 | | | | 101,373 | |
Galaxy XIV CLO, Ltd.
Series 2012-14A, Class AR
2.409%, due 11/15/26 (a)(b) | | | 250,000 | | | | 250,319 | |
| | | | | | | | |
| | | Principal
Amount | | | Value | |
Other ABS (continued) | |
Galaxy XVI CLO, Ltd.
Series 2013-16A, Class A1R
2.167%, due 11/16/25 (a)(b) | | $ | 250,000 | | | $ | 250,004 | |
Highbridge Loan Management, Ltd.
Series 2015-6A, Class A
2.484%, due 5/5/27 (a)(b) | | | 250,000 | | | | 250,172 | |
HPS Loan Management, Ltd.
Series 2011 A-17, Class A
2.395%, due 5/6/30 (a)(b) | | | 850,000 | | | | 850,133 | |
LCM, Ltd. Partnership
Series 2015-A, Class AR
2.429%, due 7/20/30 (a)(b) | | | 350,000 | | | | 349,993 | |
Magnetite VIII, Ltd.
Series 2014-8A, Class AR
2.323%, due 4/15/26 (a)(b) | | | 260,000 | | | | 261,561 | |
Magnetite XII, Ltd.
Series 2015-12A, Class AR
2.353%, due 4/15/27 (a)(b) | | | 250,000 | | | | 251,330 | |
Neuberger Berman CLO XIV, Ltd.
Series 2013-14A, Class AR
2.422%, due 1/28/30 (a)(b) | | | 390,000 | | | | 389,997 | |
Neuberger Berman CLO XIX, Ltd. (a)(b) | |
Series 2015-19A, Class A1R
TBD, due 7/15/27 | | | 350,000 | | | | 350,000 | |
Series 2015-19A, Class A1
2.443%, due 7/15/27 | | | 350,000 | | | | 350,970 | |
Octagon Investment Partners 30, Ltd.
Series 2017-1A, Class A1
2.567%, due 3/17/30 (a)(b) | | | 350,000 | | | | 350,804 | |
Octagon Loan Funding, Ltd.
Series 2014-1A, Class A1R
2.321%, due 11/18/26 (a)(b) | | | 450,000 | | | | 449,996 | |
Sound Point CLO XVI, Ltd.
Series 2017-2A, Class A
2.567%, due 7/25/30 (a)(b)(c) | | | 450,000 | | | | 449,736 | |
THL Credit Wind River CLO, Ltd. (a)(b) | |
Series 2014-3A, Class AR
2.218%, due 1/22/27 | | | 390,000 | | | | 389,966 | |
Series 2012-1A, Class AR
2.473%, due 1/15/26 | | | 250,000 | | | | 250,869 | |
Volvo Financial Equipment LLC
Series 2016-IA, Class A3
1.67%, due 2/18/20 (a) | | | 100,000 | | | | 100,051 | |
Voya CLO, Ltd.
Series 2014-2A, Class A1R
2.408%, due 4/17/30 (a)(b) | | | 600,000 | | | | 600,103 | |
| | | | | | | | |
| | | | 11,824,746 | |
| | | | | | | | |
Total Asset-Backed Securities
(Cost $12,220,216) | | | | 12,226,102 | |
| | | | | | | | |
| † | Percentages indicated are based on Portfolio net assets. |
| ¨ | | Among the Portfolio’s 10 largest holdings or issuers held, as of June 30, 2017, excluding short-term investments. May be subject to change daily. |
| | | | | | |
The notes to the financial statements are an integral part of,
and should be read in conjunction with, the financial statements. | | | | | 11 | |
Portfolio of Investments June 30, 2017 (Unaudited) (continued)
| | | | | | | | |
| | | Principal
Amount | | | Value | |
| Corporate Bonds 17.3% | |
Aerospace & Defense 0.2% | |
BAE Systems PLC
4.75%, due 10/11/21 (a) | | $ | 1,050,000 | | | $ | 1,133,144 | |
| | | | | | | | |
|
Auto Manufacturers 0.9% | |
Daimler Finance North America LLC
2.85%, due 1/6/22 (a) | | | 1,000,000 | | | | 1,012,079 | |
Ford Motor Credit Co. LLC
4.25%, due 9/20/22 | | | 1,575,000 | | | | 1,654,583 | |
General Motors Co.
4.875%, due 10/2/23 | | | 1,150,000 | | | | 1,232,425 | |
| | | | | | | | |
| | | | 3,899,087 | |
| | | | | | | | |
Banks 6.4% | |
Bank of America Corp. | |
3.124%, due 1/20/23 (b) | | | 500,000 | | | | 505,491 | |
4.45%, due 3/3/26 | | | 1,000,000 | | | | 1,040,744 | |
Bank of New York Mellon Corp.
2.661%, due 5/16/23 (b) | | | 1,250,000 | | | | 1,253,960 | |
Bank of Tokyo-Mitsubishi UFJ, Ltd.
2.35%, due 9/8/19 (a) | | | 300,000 | | | | 300,890 | |
BNP Paribas S.A.
3.80%, due 1/10/24 (a) | | | 1,025,000 | | | | 1,067,458 | |
Branch Banking & Trust Co.
2.625%, due 1/15/22 | | | 975,000 | | | | 986,259 | |
Capital One N.A.
2.35%, due 1/31/20 | | | 1,100,000 | | | | 1,100,359 | |
¨Citigroup, Inc. | |
2.75%, due 4/25/22 | | | 1,200,000 | | | | 1,198,100 | |
4.60%, due 3/9/26 | | | 750,000 | | | | 787,005 | |
Cooperatieve Rabobank UA
4.375%, due 8/4/25 | | | 1,000,000 | | | | 1,048,664 | |
Credit Agricole S.A.
3.375%, due 1/10/22 (a) | | | 575,000 | | | | 590,378 | |
Credit Suisse Group Funding Guernsey, Ltd.
3.80%, due 9/15/22 | | | 1,500,000 | | | | 1,558,471 | |
Discover Bank
3.20%, due 8/9/21 | | | 850,000 | | | | 865,720 | |
¨Fifth Third Bancorp
4.30%, due 1/16/24 | | | 1,250,000 | | | | 1,327,637 | |
Goldman Sachs Group, Inc. | |
2.908%, due 6/5/23 (b) | | | 350,000 | | | | 349,306 | |
3.85%, due 1/26/27 | | | 475,000 | | | | 483,221 | |
5.375%, due 3/15/20 | | | 125,000 | | | | 134,943 | |
6.00%, due 6/15/20 | | | 300,000 | | | | 330,967 | |
HBOS PLC
6.75%, due 5/21/18 (a) | | | 1,250,000 | | | | 1,300,162 | |
HSBC Bank USA N.A.
6.00%, due 8/9/17 | | | 425,000 | | | | 426,743 | |
HSBC Holdings PLC
3.262%, due 3/13/23 (b) | | | 1,000,000 | | | | 1,018,949 | |
| | | | | | | | |
| | | Principal
Amount | | | Value | |
Banks (continued) | |
Huntington National Bank | |
2.20%, due 4/1/19 | | $ | 250,000 | | | $ | 250,289 | |
2.875%, due 8/20/20 | | | 500,000 | | | | 508,507 | |
¨JPMorgan Chase & Co.
3.875%, due 9/10/24 | | | 2,200,000 | | | | 2,269,835 | |
¨Morgan Stanley | |
2.75%, due 5/19/22 | | | 325,000 | | | | 324,930 | |
3.625%, due 1/20/27 | | | 500,000 | | | | 503,595 | |
4.35%, due 9/8/26 | | | 1,000,000 | | | | 1,039,638 | |
Sumitomo Mitsui Banking Corp.
2.25%, due 7/11/19 | | | 625,000 | | | | 627,723 | |
SunTrust Bank
2.25%, due 1/31/20 | | | 1,000,000 | | | | 1,004,305 | |
UBS Group Funding Switzerland A.G. (a) | |
4.125%, due 4/15/26 | | | 1,250,000 | | | | 1,303,611 | |
4.253%, due 3/23/28 | | | 825,000 | | | | 861,902 | |
Wells Fargo & Co. | |
2.50%, due 3/4/21 | | | 750,000 | | | | 752,594 | |
4.10%, due 6/3/26 | | | 225,000 | | | | 232,981 | |
| | | | | | | | |
| | | | 27,355,337 | |
| | | | | | | | |
Beverages 0.4% | |
Anheuser-Busch InBev Finance, Inc. | |
2.65%, due 2/1/21 | | | 350,000 | | | | 354,693 | |
3.65%, due 2/1/26 | | | 1,400,000 | | | | 1,442,378 | |
| | | | | | | | |
| | | | 1,797,071 | |
| | | | | | | | |
Building Materials 0.5% | |
Fortune Brands Home & Security, Inc.
4.00%, due 6/15/25 | | | 850,000 | | | | 882,946 | |
Masco Corp. | |
3.50%, due 4/1/21 | | | 325,000 | | | | 333,765 | |
4.45%, due 4/1/25 | | | 850,000 | | | | 907,885 | |
| | | | | | | | |
| | | | 2,124,596 | |
| | | | | | | | |
Chemicals 0.3% | |
NewMarket Corp.
4.10%, due 12/15/22 | | | 400,000 | | | | 413,689 | |
NOVA Chemicals Corp.
5.00%, due 5/1/25 (a) | | | 210,000 | | | | 208,950 | |
Westlake Chemical Corp.
3.60%, due 8/15/26 | | | 750,000 | | | | 744,374 | |
| | | | | | | | |
| | | | 1,367,013 | |
| | | | | | | | |
Computers 0.1% | |
Hewlett Packard Enterprise Co.
3.60%, due 10/15/20 | | | 325,000 | | | | 335,107 | |
| | | | | | | | |
|
Diversified Financial Services 0.1% | |
American Express Credit Corp.
1.817%, due 3/18/19 (b) | | | 350,000 | | | | 351,747 | |
| | | | |
| 12 | | MainStay VP Balanced Portfolio | | The notes to the financial statements are an integral part of,
and should be read in conjunction with, the financial statements. |
| | | | | | | | |
| | | Principal
Amount | | | Value | |
| Corporate Bonds (continued) | |
Diversified Financial Services (continued) | |
Discover Financial Services | |
3.85%, due 11/21/22 | | $ | 100,000 | | | $ | 102,411 | |
5.20%, due 4/27/22 | | | 25,000 | | | | 27,214 | |
| | | | | | | | |
| | | | 481,372 | |
| | | | | | | | |
Electric 2.1% | |
Arizona Public Service Co.
2.20%, due 1/15/20 | | | 250,000 | | | | 250,630 | |
Detroit Edison Co.
2.65%, due 6/15/22 | | | 750,000 | | | | 751,733 | |
Dominion Energy, Inc.
4.104%, due 4/1/21 (d) | | | 1,000,000 | | | | 1,049,580 | |
Electricite de France S.A.
2.35%, due 10/13/20 (a) | | | 1,500,000 | | | | 1,505,827 | |
Emera U.S. Finance, L.P.
2.70%, due 6/15/21 | | | 750,000 | | | | 751,148 | |
Engie S.A.
1.625%, due 10/10/17 (a) | | | 150,000 | | | | 149,882 | |
Entergy Corp.
4.00%, due 7/15/22 | | | 750,000 | | | | 792,681 | |
Exelon Corp. | |
2.85%, due 6/15/20 | | | 425,000 | | | | 431,770 | |
3.497%, due 6/1/22 | | | 500,000 | | | | 510,821 | |
FirstEnergy Transmission LLC
4.35%, due 1/15/25 (a) | | | 500,000 | | | | 522,465 | |
Great Plains Energy, Inc.
4.85%, due 6/1/21 | | | 280,000 | | | | 298,391 | |
Kansas City Power & Light Co.
7.15%, due 4/1/19 | | | 250,000 | | | | 271,497 | |
Niagara Mohawk Power Corp.
2.721%, due 11/28/22 (a) | | | 100,000 | | | | 100,077 | |
Southern Co.
2.95%, due 7/1/23 | | | 1,500,000 | | | | 1,490,385 | |
| | | | | | | | |
| | | | 8,876,887 | |
| | | | | | | | |
Electronics 0.3% | |
Amphenol Corp.
3.125%, due 9/15/21 | | | 175,000 | | | | 179,069 | |
Fortive Corp.
2.35%, due 6/15/21 | | | 1,000,000 | | | | 994,216 | |
| | | | | | | | |
| | | | 1,173,285 | |
| | | | | | | | |
Food 0.3% | |
Ingredion, Inc. | |
1.80%, due 9/25/17 | | | 75,000 | | | | 75,045 | |
4.625%, due 11/1/20 | | | 250,000 | | | | 267,962 | |
Mondelez International Holdings Netherlands B.V.
2.00%, due 10/28/21 (a) | | | 1,250,000 | | | | 1,217,897 | |
| | | | | | | | |
| | | | | | | 1,560,904 | |
| | | | | | | | |
| | | | | | | | |
| | | Principal
Amount | | | Value | |
Health Care—Products 0.1% | |
Becton Dickinson & Co.
2.894%, due 6/6/22 | | $ | 375,000 | | | $ | 376,172 | |
Medtronic, Inc.
3.50%, due 3/15/25 | | | 150,000 | | | | 156,040 | |
| | | | | | | | |
| | | | | | | 532,212 | |
| | | | | | | | |
Insurance 0.5% | |
Nationwide Financial Services, Inc.
5.375%, due 3/25/21 (a) | | | 725,000 | | | | 795,122 | |
Pricoa Global Funding I
2.20%, due 6/3/21 (a) | | | 1,250,000 | | | | 1,234,943 | |
| | | | | | | | |
| | | | | | | 2,030,065 | |
| | | | | | | | |
Iron & Steel 0.1% | |
Carpenter Technology Corp.
4.45%, due 3/1/23 | | | 125,000 | | | | 127,251 | |
Reliance Steel & Aluminum Co.
4.50%, due 4/15/23 | | | 200,000 | | | | 211,264 | |
| | | | | | | | |
| | | | | | | 338,515 | |
| | | | | | | | |
Mining 0.6% | |
Anglo American Capital PLC (a)
4.75%, due 4/10/27 | | | 800,000 | | | | 821,840 | |
4.875%, due 5/14/25 | | | 625,000 | | | | 650,000 | |
Rio Tinto Finance USA, Ltd.
3.75%, due 6/15/25 | | | 1,250,000 | | | | 1,315,676 | |
| | | | | | | | |
| | | | | | | 2,787,516 | |
| | | | | | | | |
Miscellaneous—Manufacturing 0.4% | |
General Electric Co.
4.375%, due 9/16/20 | | | 225,000 | | | | 241,510 | |
Siemens Financieringsmaatschappij N.V. (a)
1.70%, due 9/15/21 | | | 750,000 | | | | 732,651 | |
2.70%, due 3/16/22 | | | 700,000 | | | | 709,101 | |
| | | | | | | | |
| | | | | | | 1,683,262 | |
| | | | | | | | |
Oil & Gas 0.9% | |
Anadarko Petroleum Corp.
4.85%, due 3/15/21 | | | 1,000,000 | | | | 1,067,340 | |
BP Capital Markets PLC
3.062%, due 3/17/22 | | | 425,000 | | | | 434,422 | |
Cenovus Energy, Inc.
4.25%, due 4/15/27 (a) | | | 600,000 | | | | 571,576 | |
Helmerich & Payne International Drilling Co.
4.65%, due 3/15/25 | | | 400,000 | | | | 419,455 | |
Nabors Industries, Inc.
5.00%, due 9/15/20 | | | 540,000 | | | | 538,650 | |
Petroleos Mexicanos
3.50%, due 7/23/20 | | | 75,000 | | | | 75,787 | |
3.50%, due 1/30/23 | | | 100,000 | | | | 95,850 | |
Shell International Finance B.V.
3.25%, due 5/11/25 | | | 700,000 | | | | 715,062 | |
| | | | | | | | |
| | | | | | | 3,918,142 | |
| | | | | | | | |
| | | | | | |
The notes to the financial statements are an integral part of,
and should be read in conjunction with, the financial statements. | | | | | 13 | |
Portfolio of Investments June 30, 2017 (Unaudited) (continued)
| | | | | | | | |
| | | Principal
Amount | | | Value | |
| Corporate Bonds (continued) | |
Pharmaceuticals 0.2% | |
Actavis Funding SCS
3.00%, due 3/12/20 | | $ | 350,000 | | | $ | 357,427 | |
Bayer U.S. Finance LLC
2.375%, due 10/8/19 (a) | | | 625,000 | | | | 629,975 | |
| | | | | | | | |
| | | | | | | 987,402 | |
| | | | | | | | |
Pipelines 0.6% | |
Kinder Morgan, Inc.
5.00%, due 2/15/21 (a) | | | 895,000 | | | | 959,576 | |
Plains All American Pipeline, L.P. / PAA Finance Corp.
8.75%, due 5/1/19 | | | 200,000 | | | | 222,346 | |
Regency Energy Partners, L.P. / Regency Energy Finance Corp.
5.875%, due 3/1/22 | | | 850,000 | | | | 936,345 | |
Spectra Energy Partners, L.P.
2.95%, due 9/25/18 | | | 200,000 | | | | 202,252 | |
Texas Eastern Transmission, L.P.
2.80%, due 10/15/22 (a) | | | 175,000 | | | | 171,684 | |
| | | | | | | | |
| | | | | | | 2,492,203 | |
| | | | | | | | |
Real Estate Investment Trusts 0.6% | |
DDR Corp.
4.75%, due 4/15/18 | | | 355,000 | | | | 361,948 | |
Host Hotels & Resorts, L.P.
6.00%, due 10/1/21 | | | 150,000 | | | | 167,293 | |
Liberty Property, L.P.
4.40%, due 2/15/24 | | | 125,000 | | | | 132,221 | |
Mid-America Apartments, L.P.
3.60%, due 6/1/27 | | | 375,000 | | | | 373,987 | |
Simon Property Group, L.P.
2.625%, due 6/15/22 | | | 475,000 | | | | 476,737 | |
VEREIT Operating Partnership, L.P.
4.875%, due 6/1/26 | | | 1,000,000 | | | | 1,057,170 | |
| | | | | | | | |
| | | | | | | 2,569,356 | |
| | | | | | | | |
Semiconductors 0.1% | |
Applied Materials, Inc.
3.30%, due 4/1/27 | | | 225,000 | | | | 228,657 | |
| | | | | | | | |
|
Software 0.6% | |
Fidelity National Information Services, Inc.
2.25%, due 8/15/21 | | | 1,075,000 | | | | 1,063,431 | |
Fiserv, Inc.
4.75%, due 6/15/21 | | | 200,000 | | | | 216,109 | |
Oracle Corp.
1.90%, due 9/15/21 | | | 1,250,000 | | | | 1,239,009 | |
| | | | | | | | |
| | | | | | | 2,518,549 | |
| | | | | | | | |
| | | | | | | | |
| | | Principal
Amount | | | Value | |
Telecommunications 1.0% | |
AT&T, Inc.
3.95%, due 1/15/25 | | $ | 850,000 | | | $ | 866,304 | |
4.45%, due 4/1/24 | | | 21,000 | | | | 22,107 | |
Orange S.A.
2.75%, due 2/6/19 | | | 225,000 | | | | 227,854 | |
Telefonica Emisiones SAU
4.103%, due 3/8/27 | | | 1,750,000 | | | | 1,808,005 | |
Verizon Communications, Inc.
5.15%, due 9/15/23 | | | 1,100,000 | | | | 1,221,866 | |
| | | | | | | | |
| | | | | | | 4,146,136 | |
| | | | | | | | |
Transportation 0.0%‡ | |
Burlington Northern Santa Fe LLC
4.70%, due 10/1/19 | | | 125,000 | | | | 132,892 | |
| | | | | | | | |
Total Corporate Bonds
(Cost $73,381,515) | | | | 74,468,710 | |
| | | | | | | | |
|
| Foreign Government Bonds 0.1% | |
Sovereign 0.1% | |
Republic of Poland Government International Bond
5.00%, due 3/23/22 | | | 50,000 | | | | 55,500 | |
Russian Federation
3.50%, due 1/16/19 (a) | | | 400,000 | | | | 406,943 | |
| | | | | | | | |
Total Foreign Government Bonds
(Cost $448,641) | | | | 462,443 | |
| | | | | | | | |
|
| Mortgage-Backed Securities 1.6% | |
Commercial Mortgage Loans
(Collateralized Mortgage Obligations) 1.6% | |
Bank
Series 2017-BNK5, Class A2
2.987%, due 6/15/60 | | | 300,000 | | | | 307,440 | |
CD Mortgage Trust
Series 2017-CD4, Class A2
3.03%, due 5/10/50 | | | 600,000 | | | | 617,933 | |
CFCRE Commercial Mortgage Trust
Series 2017-C8, Class A2
2.982%, due 6/15/50 | | | 900,000 | | | | 921,708 | |
Citigroup Commercial Mortgage Trust
Series 2014-GC21, Class A5
3.855%, due 5/10/47 | | | 100,000 | | | | 105,490 | |
COMM Mortgage Trust | |
Series 2013-THL, Class A2
2.139%, due 6/8/30 (a)(b) | | | 300,000 | | | | 300,280 | |
Series 2013-LC13, Class A2
3.009%, due 8/10/46 | | | 300,000 | | | | 304,208 | |
DBJPM Mortgage Trust
Series 2017-C6, Class A2
2.917%, due 6/10/50 | | | 800,000 | | | | 817,309 | |
| | | | |
| 14 | | MainStay VP Balanced Portfolio | | The notes to the financial statements are an integral part of,
and should be read in conjunction with, the financial statements. |
| | | | | | | | |
| | | Principal
Amount | | | Value | |
| Mortgage-Backed Securities (continued) | |
Commercial Mortgage Loans
(Collateralized Mortgage Obligations) (continued) | |
GRACE Mortgage Trust
Series 2014-GRCE, Class A
3.369%, due 6/10/28 (a) | | $ | 200,000 | | | $ | 207,726 | |
JPMBB Commercial Mortgage Securities Trust
Series 2013-C14, Class A2
3.019%, due 8/15/46 | | | 227,906 | | | | 231,512 | |
Morgan Stanley Bank of America Merrill Lynch Trust | | | | | | | | |
Series 2013-C13, Class A2
2.936%, due 11/15/46 | | | 500,000 | | | | 507,587 | |
Series 2017-C33, Class A2
3.14%, due 5/15/50 | | | 1,000,000 | | | | 1,031,078 | |
Series 2013-C12, Class A4
4.259%, due 10/15/46 (b) | | | 300,000 | | | | 324,289 | |
Morgan Stanley Capital I Trust
Series 2017-H1, Class A2
3.089%, due 6/15/50 | | | 900,000 | | | | 933,043 | |
Wells Fargo Commercial Mortgage Trust
Series 2016-C33, Class AS
3.749%, due 3/15/59 | | | 100,000 | | | | 102,816 | |
| | | | | | | | |
Total Mortgage-Backed Securities
(Cost $6,723,070) | | | | 6,712,419 | |
| | | | | | | | |
|
| U.S. Government & Federal Agencies 14.3% | |
Federal Home Loan Bank 0.1% | |
1.00%, due 9/26/19 | | | 400,000 | | | | 395,937 | |
1.375%, due 3/18/19 | | | 200,000 | | | | 199,912 | |
| | | | | | | | |
| | | | 595,849 | |
| | | | | | | | |
Federal Home Loan Mortgage Corporation 0.5% | |
1.00%, due 9/27/17 | | | 75,000 | | | | 74,982 | |
1.25%, due 8/15/19 | | | 350,000 | | | | 348,269 | |
1.25%, due 10/2/19 | | | 350,000 | | | | 348,075 | |
1.35%, due 1/25/19 | | | 600,000 | | | | 599,170 | |
1.50%, due 1/17/20 | | | 725,000 | | | | 724,391 | |
| | | | | | | | |
| | | | 2,094,887 | |
| | | | | | | | |
¨Federal National Mortgage Association 1.3% | |
0.875%, due 8/2/19 | | | 400,000 | | | | 395,191 | |
1.25%, due 7/26/19 | | | 450,000 | | | | 446,553 | |
1.25%, due 8/17/21 | | | 500,000 | | | | 488,772 | |
1.375%, due 2/26/21 | | | 150,000 | | | | 148,159 | |
1.75%, due 9/12/19 | | | 250,000 | | | | 251,495 | |
1.875%, due 4/5/22 | | | 1,200,000 | | | | 1,196,232 | |
1.875%, due 9/24/26 | | | 2,975,000 | | | | 2,820,728 | |
| | | | | | | | |
| | | | 5,747,130 | |
| | | | | | | | |
| | | | | | | | |
| | | Principal
Amount | | | Value | |
¨United States Treasury Notes 12.4% | |
0.75%, due 12/31/17 | | $ | 725,000 | | | $ | 723,546 | |
0.75%, due 9/30/18 | | | 9,100,000 | | | | 9,035,663 | |
0.875%, due 5/31/18 | | | 1,450,000 | | | | 1,444,789 | |
1.00%, due 9/15/18 | | | 3,650,000 | | | | 3,636,312 | |
1.00%, due 10/15/19 | | | 8,850,000 | | | | 8,766,341 | |
1.125%, due 7/31/21 | | | 100,000 | | | | 97,469 | |
1.25%, due 6/30/19 | | | 5,300,000 | | | | 5,285,510 | |
1.375%, due 9/30/23 | | | 1,385,000 | | | | 1,329,222 | |
1.50%, due 5/15/20 | | | 5,300,000 | | | | 5,293,995 | |
1.50%, due 6/15/20 | | | 8,000,000 | | | | 7,988,752 | |
1.75%, due 6/30/22 | | | 1,450,000 | | | | 1,440,598 | |
2.00%, due 4/30/24 | | | 2,775,000 | | | | 2,754,296 | |
2.125%, due 2/29/24 | | | 3,350,000 | | | | 3,354,057 | |
2.125%, due 3/31/24 | | | 650,000 | | | | 650,482 | |
2.375%, due 5/15/27 | | | 1,185,000 | | | | 1,192,499 | |
| | | | | | | | |
| | | | 52,993,531 | |
| | | | | | | | |
Total U.S. Government & Federal Agencies
(Cost $61,612,178) | | | | 61,431,397 | |
| | | | | | | | |
Total Long-Term Bonds
(Cost $154,385,620) | | | | 155,301,071 | |
| | | | | | | | |
| | |
| | | | | | | | |
| | |
| | | Shares | | | | |
| Common Stocks 57.3% | |
Aerospace & Defense 0.9% | |
General Dynamics Corp. | | | 2,462 | | | | 487,722 | |
Lockheed Martin Corp. | | | 2,048 | | | | 568,545 | |
Orbital ATK, Inc. | | | 3,791 | | | | 372,883 | |
Raytheon Co. | | | 3,066 | | | | 495,098 | |
Spirit AeroSystems Holdings, Inc. Class A | | | 21,087 | | | | 1,221,781 | |
United Technologies Corp. | | | 4,745 | | | | 579,412 | |
| | | | | | | | |
| | | | 3,725,441 | |
| | | | | | | | |
Agriculture 0.7% | |
Archer-Daniels-Midland Co. | | | 15,383 | | | | 636,548 | |
Bunge, Ltd. | | | 18,420 | | | | 1,374,132 | |
Philip Morris International, Inc. | | | 4,704 | | | | 552,485 | |
Reynolds American, Inc. | | | 8,675 | | | | 564,222 | |
| | | | | | | | |
| | | | 3,127,387 | |
| | | | | | | | |
Airlines 0.9% | |
American Airlines Group, Inc. | | | 2,762 | | | | 138,984 | |
Copa Holdings S.A. Class A | | | 9,741 | | | | 1,139,697 | |
Delta Air Lines, Inc. | | | 11,012 | | | | 591,785 | |
JetBlue Airways Corp. (e) | | | 22,893 | | | | 522,647 | |
United Continental Holdings, Inc. (e) | | | 18,734 | | | | 1,409,733 | |
| | | | | | | | |
| | | | 3,802,846 | |
| | | | | | | | |
Apparel 0.1% | |
Michael Kors Holdings, Ltd. (e) | | | 17,070 | | | | 618,788 | |
| | | | | | | | |
| | | | | | |
The notes to the financial statements are an integral part of,
and should be read in conjunction with, the financial statements. | | | | | 15 | |
Portfolio of Investments June 30, 2017 (Unaudited) (continued)
| | | | | | | | |
| | |
| | | Shares | | | Value | |
| Common Stocks (continued) | |
Auto Manufacturers 0.3% | |
Ford Motor Co. | | | 51,447 | | | $ | 575,692 | |
General Motors Co. | | | 16,834 | | | | 588,012 | |
PACCAR, Inc. | | | 484 | | | | 31,963 | |
| | | | | | | | |
| | | | 1,195,667 | |
| | | | | | | | |
Auto Parts & Equipment 0.3% | |
Adient PLC | | | 3,869 | | | | 252,955 | |
Goodyear Tire & Rubber Co. | | | 15,840 | | | | 553,767 | |
Lear Corp. | | | 2,636 | | | | 374,523 | |
| | | | | | | | |
| | | | 1,181,245 | |
| | | | | | | | |
Banks 4.1% | |
Bank of America Corp. | | | 27,305 | | | | 662,419 | |
Bank of New York Mellon Corp. | | | 12,984 | | | | 662,444 | |
BankUnited, Inc. | | | 22,135 | | | | 746,171 | |
BB&T Corp. | | | 13,050 | | | | 592,600 | |
Capital One Financial Corp. | | | 6,162 | | | | 509,104 | |
¨Citigroup, Inc. | | | 10,124 | | | | 677,093 | |
Citizens Financial Group, Inc. | | | 20,307 | | | | 724,554 | |
Commerce Bancshares, Inc. | | | 20,214 | | | | 1,148,762 | |
¨Fifth Third Bancorp | | | 73,045 | | | | 1,896,248 | |
First Hawaiian, Inc. | | | 33,740 | | | | 1,033,119 | |
Goldman Sachs Group, Inc. | | | 2,229 | | | | 494,615 | |
Huntington Bancshares, Inc. | | | 3,826 | | | | 51,728 | |
¨JPMorgan Chase & Co. | | | 7,412 | | | | 677,457 | |
KeyCorp | | | 98,309 | | | | 1,842,311 | |
M&T Bank Corp. | | | 1,023 | | | | 165,675 | |
¨Morgan Stanley | | | 12,648 | | | | 563,595 | |
PNC Financial Services Group, Inc. | | | 4,670 | | | | 583,143 | |
State Street Corp. | | | 7,292 | | | | 654,311 | |
SunTrust Banks, Inc. | | | 39,177 | | | | 2,222,119 | |
TCF Financial Corp. | | | 32,009 | | | | 510,223 | |
U.S. Bancorp | | | 10,999 | | | | 571,068 | |
Wells Fargo & Co. | | | 10,660 | | | | 590,671 | |
| | | | | | | | |
| | | | 17,579,430 | |
| | | | | | | | |
Beverages 0.2% | |
Coca-Cola Co. | | | 11,098 | | | | 497,745 | |
PepsiCo., Inc. | | | 4,930 | | | | 569,366 | |
| | | | | | | | |
| | | | 1,067,111 | |
| | | | | | | | |
Biotechnology 0.7% | |
Alexion Pharmaceuticals, Inc. (e) | | | 4,336 | | | | 527,561 | |
Amgen, Inc. | | | 3,502 | | | | 603,150 | |
Biogen, Inc. (e) | | | 2,219 | | | | 602,148 | |
Gilead Sciences, Inc. | | | 10,071 | | | | 712,825 | |
United Therapeutics Corp. (e) | | | 5,532 | | | | 717,666 | |
| | | | | | | | |
| | | | 3,163,350 | |
| | | | | | | | |
Building Materials 0.7% | |
Cree, Inc. (e) | | | 20,655 | | | | 509,146 | |
Johnson Controls International PLC | | | 29,139 | | | | 1,263,467 | |
| | | | | | | | |
| | |
| | | Shares | | | Value | |
Building Materials (continued) | |
Owens Corning | | | 20,124 | | | $ | 1,346,698 | |
| | | | | | | | |
| | | | 3,119,311 | |
| | | | | | | | |
Chemicals 1.2% | |
Air Products & Chemicals, Inc. | | | 3,445 | | | | 492,842 | |
Ashland Global Holdings, Inc. | | | 2,889 | | | | 190,414 | |
Dow Chemical Co. | | | 10,010 | | | | 631,331 | |
LyondellBasell Industries N.V. Class A | | | 8,030 | | | | 677,652 | |
Mosaic Co. | | | 57,420 | | | | 1,310,899 | |
Olin Corp. | | | 20,005 | | | | 605,751 | |
PPG Industries, Inc. | | | 4,532 | | | | 498,339 | |
Praxair, Inc. | | | 3,690 | | | | 489,109 | |
Valvoline, Inc. | | | 8,948 | | | | 212,246 | |
| | | | | | | | |
| | | | 5,108,583 | |
| | | | | | | | |
Coal 0.3% | |
CONSOL Energy, Inc. (e) | | | 72,352 | | | | 1,080,939 | |
| | | | | | | | |
|
Commercial Services 1.3% | |
CoreLogic, Inc. (e) | | | 23,738 | | | | 1,029,754 | |
Graham Holdings Co. Class B | | | 1,784 | | | | 1,069,776 | |
H&R Block, Inc. | | | 42,735 | | | | 1,320,939 | |
Live Nation Entertainment, Inc. (e) | | | 15,141 | | | | 527,664 | |
ManpowerGroup, Inc. | | | 12,002 | | | | 1,340,023 | |
United Rentals, Inc. (e) | | | 4,473 | | | | 504,152 | |
| | | | | | | | |
| | | | 5,792,308 | |
| | | | | | | | |
Computers 1.2% | |
Hewlett Packard Enterprise Co. | | | 30,123 | | | | 499,741 | |
HP, Inc. | | | 36,905 | | | | 645,099 | |
International Business Machines Corp. | | | 4,216 | | | | 648,547 | |
NetApp, Inc. | | | 31,749 | | | | 1,271,548 | |
Western Digital Corp. | | | 23,175 | | | | 2,053,305 | |
| | | | | | | | |
| | | | 5,118,240 | |
| | | | | | | | |
Cosmetics & Personal Care 0.2% | |
Colgate-Palmolive Co. | | | 6,549 | | | | 485,478 | |
Procter & Gamble Co. | | | 6,435 | | | | 560,810 | |
| | | | | | | | |
| | | | 1,046,288 | |
| | | | | | | | |
Diversified Financial Services 1.7% | |
American Express Co. | | | 7,062 | | | | 594,903 | |
Charles Schwab Corp. | | | 11,861 | | | | 509,549 | |
CIT Group, Inc. | | | 29,077 | | | | 1,416,050 | |
CME Group, Inc. | | | 3,951 | | | | 494,823 | |
Discover Financial Services | | | 690 | | | | 42,911 | |
E*TRADE Financial Corp. (e) | | | 4,497 | | | | 171,021 | |
FNF Group | | | 34,359 | | | | 1,540,314 | |
Intercontinental Exchange, Inc. | | | 7,775 | | | | 512,528 | |
Lazard, Ltd. Class A | | | 23,965 | | | | 1,110,298 | |
LPL Financial Holdings, Inc. | | | 13,594 | | | | 577,201 | |
Synchrony Financial | | | 4,858 | | | | 144,866 | |
| | | | | | | | |
| | | | | | | 7,114,464 | |
| | | | | | | | |
| | | | |
| 16 | | MainStay VP Balanced Portfolio | | The notes to the financial statements are an integral part of,
and should be read in conjunction with, the financial statements. |
| | | | | | | | |
| | |
| | | Shares | | | Value | |
| Common Stocks (continued) | |
Electric 5.3% | |
AES Corp. | | | 37,737 | | | $ | 419,258 | |
Alliant Energy Corp. | | | 2,164 | | | | 86,928 | |
Ameren Corp. | | | 27,580 | | | | 1,507,799 | |
American Electric Power Co., Inc. | | | 8,024 | | | | 557,427 | |
CenterPoint Energy, Inc. | | | 53,710 | | | | 1,470,580 | |
CMS Energy Corp. | | | 29,831 | | | | 1,379,684 | |
Consolidated Edison, Inc. | | | 24,806 | | | | 2,004,821 | |
Dominion Energy, Inc. | | | 6,266 | | | | 480,164 | |
DTE Energy Co. | | | 11,760 | | | | 1,244,090 | |
Duke Energy Corp. | | | 5,796 | | | | 484,488 | |
Edison International | | | 24,644 | | | | 1,926,914 | |
Entergy Corp. | | | 20,524 | | | | 1,575,627 | |
Eversource Energy | | | 20,492 | | | | 1,244,069 | |
Exelon Corp. | | | 17,721 | | | | 639,196 | |
FirstEnergy Corp. | | | 19,910 | | | | 580,576 | |
Great Plains Energy, Inc. | | | 2,918 | | | | 85,439 | |
Hawaiian Electric Industries, Inc. | | | 2,422 | | | | 78,424 | |
MDU Resources Group, Inc. | | | 42,053 | | | | 1,101,789 | |
NextEra Energy, Inc. | | | 3,536 | | | | 495,500 | |
NRG Energy, Inc. | | | 2,186 | | | | 37,643 | |
PG&E Corp. | | | 8,376 | | | | 555,915 | |
Pinnacle West Capital Corp. | | | 2,678 | | | | 228,058 | |
PPL Corp. | | | 7,836 | | | | 302,940 | |
Public Service Enterprise Group, Inc. | | | 11,554 | | | | 496,938 | |
Southern Co. | | | 9,795 | | | | 468,985 | |
WEC Energy Group, Inc. | | | 19,038 | | | | 1,168,552 | |
Xcel Energy, Inc. | | | 43,606 | | | | 2,000,643 | |
| | | | | | | | |
| | | | | | | 22,622,447 | |
| | | | | | | | |
Electrical Components & Equipment 0.2% | |
Emerson Electric Co. | | | 8,205 | | | | 489,182 | |
Energizer Holdings, Inc. | | | 8,595 | | | | 412,732 | |
| | | | | | | | |
| | | | | | | 901,914 | |
| | | | | | | | |
Electronics 0.6% | |
Corning, Inc. | | | 21,849 | | | | 656,563 | |
Honeywell International, Inc. | | | 4,256 | | | | 567,282 | |
Jabil, Inc. | | | 41,095 | | | | 1,199,563 | |
| | | | | | | | |
| | | | | | | 2,423,408 | |
| | | | | | | | |
Energy—Alternate Sources 0.3% | |
First Solar, Inc. (e) | | | 29,680 | | | | 1,183,638 | |
| | | | | | | | |
|
Entertainment 0.6% | |
International Game Technology PLC | | | 48,354 | | | | 884,878 | |
Lions Gate Entertainment Corp. Class A | | | 18,182 | | | | 513,096 | |
Regal Entertainment Group Class A | | | 48,137 | | | | 984,883 | |
| | | | | | | | |
| | | | | | | 2,382,857 | |
| | | | | | | | |
Environmental Controls 0.2% | |
Waste Management, Inc. | | | 8,800 | | | | 645,480 | |
| | | | | | | | |
| | | | | | | | |
| | |
| | | Shares | | | Value | |
Equity Real Estate Investment Trusts (REITs) 5.2% | |
AGNC Investment Corp. | | | 7,910 | | | $ | 168,404 | |
American Homes 4 Rent Class A | | | 12,844 | | | | 289,889 | |
Annaly Capital Management, Inc. | | | 101,900 | | | | 1,227,895 | |
Apple Hospitality REIT, Inc. | | | 55,430 | | | | 1,037,095 | |
AvalonBay Communities, Inc. | | | 1,540 | | | | 295,942 | |
Brandywine Realty Trust | | | 59,018 | | | | 1,034,586 | |
Camden Property Trust | | | 10,402 | | | | 889,475 | |
Corporate Office Properties Trust | | | 20,420 | | | | 715,313 | |
DCT Industrial Trust, Inc. | | | 294 | | | | 15,711 | |
Digital Realty Trust, Inc. | | | 1,091 | | | | 123,228 | |
Equity Commonwealth (e) | | | 22,327 | | | | 705,533 | |
Equity Residential | | | 8,487 | | | | 558,699 | |
Gaming and Leisure Properties, Inc. | | | 16,096 | | | | 606,336 | |
HCP, Inc. | | | 51,231 | | | | 1,637,343 | |
Highwoods Properties, Inc. | | | 22,051 | | | | 1,118,206 | |
Hospitality Properties Trust | | | 39,271 | | | | 1,144,750 | |
Host Hotels & Resorts, Inc. | | | 85,107 | | | | 1,554,905 | |
Lamar Advertising Co. Class A | | | 6,662 | | | | 490,123 | |
Omega Healthcare Investors, Inc. | | | 35,650 | | | | 1,177,163 | |
Outfront Media, Inc. | | | 46,066 | | | | 1,065,046 | |
Piedmont Office Realty Trust, Inc. Class A | | | 4,865 | | | | 102,554 | |
Prologis, Inc. | | | 7,929 | | | | 464,957 | |
Senior Housing Properties Trust | | | 54,287 | | | | 1,109,626 | |
Simon Property Group, Inc. | | | 3,168 | | | | 512,456 | |
Starwood Property Trust, Inc. | | | 16,052 | | | | 359,404 | |
UDR, Inc. | | | 4,548 | | | | 177,236 | |
Uniti Group, Inc. | | | 42,732 | | | | 1,074,283 | |
Ventas, Inc. | | | 3,503 | | | | 243,388 | |
VEREIT, Inc. | | | 132,063 | | | | 1,074,993 | |
Welltower, Inc. | | | 13,558 | | | | 1,014,816 | |
Weyerhaeuser Co. | | | 6,534 | | | | 218,889 | |
WP Carey, Inc. | | | 593 | | | | 39,144 | |
| | | | | | | | |
| | | | 22,247,388 | |
| | | | | | | | |
Food 1.4% | |
Conagra Brands, Inc. | | | 11,408 | | | | 407,950 | |
Flowers Foods, Inc. | | | 56,463 | | | | 977,375 | |
General Mills, Inc. | | | 8,817 | | | | 488,462 | |
Ingredion, Inc. | | | 697 | | | | 83,090 | |
Kraft Heinz Co. | | | 5,605 | | | | 480,012 | |
Kroger Co. | | | 25,541 | | | | 595,616 | |
Lamb Weston Holdings, Inc. | | | 2,549 | | | | 112,258 | |
Mondelez International, Inc. Class A | | | 11,074 | | | | 478,286 | |
Pilgrim’s Pride Corp. (e) | | | 41,684 | | | | 913,713 | |
Tyson Foods, Inc. Class A | | | 25,843 | | | | 1,618,547 | |
U.S. Foods Holding Corp. (e) | | | 1,582 | | | | 43,062 | |
| | | | | | | | |
| | | | | | | 6,198,371 | |
| | | | | | | | |
Food Services 0.3% | |
Aramark | | | 30,893 | | | | 1,265,995 | |
| | | | | | | | |
|
Forest Products & Paper 0.0%‡ | |
International Paper Co. | | | 940 | | | | 53,213 | |
| | | | | | | | |
| | | | | | |
The notes to the financial statements are an integral part of,
and should be read in conjunction with, the financial statements. | | | | | 17 | |
Portfolio of Investments June 30, 2017 (Unaudited) (continued)
| | | | | | | | |
| | |
| | | Shares | | | Value | |
| Common Stocks (continued) | |
Gas 0.4% | |
Sempra Energy | | | 3,443 | | | $ | 388,198 | |
UGI Corp. | | | 1,958 | | | | 94,787 | |
Vectren Corp. | | | 17,616 | | | | 1,029,479 | |
| | | | | | | | |
| | | | | | | 1,512,464 | |
| | | | | | | | |
Hand & Machine Tools 0.4% | |
Lincoln Electric Holdings, Inc. | | | 5,436 | | | | 500,601 | |
Regal Beloit Corp. | | | 13,766 | | | | 1,122,617 | |
Stanley Black & Decker, Inc. | | | 443 | | | | 62,344 | |
| | | | | | | | |
| | | | | | | 1,685,562 | |
| | | | | | | | |
Health Care—Products 1.0% | |
Abbott Laboratories | | | 11,827 | | | | 574,910 | |
Baxter International, Inc. | | | 10,963 | | | | 663,700 | |
Danaher Corp. | | | 6,781 | | | | 572,248 | |
Hill-Rom Holdings, Inc. | | | 7,174 | | | | 571,122 | |
Medtronic PLC | | | 6,497 | | | | 576,609 | |
QIAGEN N.V. (e) | | | 21,896 | | | | 734,173 | |
Thermo Fisher Scientific, Inc. | | | 3,280 | | | | 572,262 | |
Zimmer Biomet Holdings, Inc. | | | 774 | | | | 99,382 | |
| | | | | | | | |
| | | | | | | 4,364,406 | |
| | | | | | | | |
Health Care—Services 1.8% | |
Aetna, Inc. | | | 4,302 | | | | 653,173 | |
Anthem, Inc. | | | 3,386 | | | | 637,008 | |
Centene Corp. (e) | | | 16,853 | | | | 1,346,218 | |
Cigna Corp. | | | 3,834 | | | | 641,773 | |
DaVita, Inc. (e) | | | 20,295 | | | | 1,314,304 | |
HCA Holdings, Inc. (e) | | | 7,715 | | | | 672,748 | |
Humana, Inc. | | | 2,772 | | | | 666,999 | |
LifePoint Health, Inc. (e) | | | 8,005 | | | | 537,536 | |
Universal Health Services, Inc. Class B | | | 3,128 | | | | 381,866 | |
WellCare Health Plans, Inc. (e) | | | 5,608 | | | | 1,006,972 | |
| | | | | | | | |
| | | | | | | 7,858,597 | |
| | | | | | | | |
Holding Company—Diversified 0.2% | |
Leucadia National Corp. | | | 25,315 | | | | 662,240 | |
| | | | | | | | |
|
Home Builders 0.1% | |
CalAtlantic Group, Inc. | | | 14,712 | | | | 520,069 | |
| | | | | | | | |
|
Home Furnishing 0.3% | |
Tempur Sealy International, Inc. (e) | | | 10,561 | | | | 563,852 | |
Whirlpool Corp. | | | 4,504 | | | | 863,056 | |
| | | | | | | | |
| | | | | | | 1,426,908 | |
| | | | | | | | |
Household Products & Wares 0.1% | |
Kimberly-Clark Corp. | | | 4,354 | | | | 562,145 | |
| | | | | | | | |
|
Housewares 0.0%‡ | |
Newell Brands, Inc. | | | 2,032 | | | | 108,956 | |
| | | | | | | | |
| | | | | | | | |
| | |
| | | Shares | | | Value | |
Insurance 4.7% | |
Aflac, Inc. | | | 8,236 | | | $ | 639,773 | |
Allied World Assurance Co. Holdings, A.G. | | | 11,208 | | | | 592,903 | |
Allstate Corp. | | | 7,301 | | | | 645,701 | |
American Financial Group, Inc. | | | 12,683 | | | | 1,260,310 | |
American International Group, Inc. | | | 10,208 | | | | 638,204 | |
American National Insurance Co. | | | 2,239 | | | | 260,821 | |
Aspen Insurance Holdings, Ltd. | | | 1,265 | | | | 63,060 | |
Assurant, Inc. | | | 11,631 | | | | 1,206,018 | |
Assured Guaranty, Ltd. | | | 29,198 | | | | 1,218,725 | |
Athene Holding, Ltd. Class A (e) | | | 21,290 | | | | 1,056,197 | |
Axis Capital Holdings, Ltd. | | | 8,903 | | | | 575,668 | |
Berkshire Hathaway, Inc. Class B (e) | | | 3,370 | | | | 570,777 | |
Chubb, Ltd. | | | 3,930 | | | | 571,343 | |
CNA Financial Corp. | | | 1,037 | | | | 50,554 | |
Everest Re Group, Ltd. | | | 5,690 | | | | 1,448,617 | |
First American Financial Corp. | | | 26,488 | | | | 1,183,749 | |
Hartford Financial Services Group, Inc. | | | 10,530 | | | | 553,562 | |
Lincoln National Corp. | | | 23,381 | | | | 1,580,088 | |
MetLife, Inc. | | | 9,328 | | | | 512,480 | |
Old Republic International Corp. | | | 34,735 | | | | 678,375 | |
Progressive Corp. | | | 3,284 | | | | 144,792 | |
Prudential Financial, Inc. | | | 6,023 | | | | 651,327 | |
RenaissanceRe Holdings, Ltd. | | | 3,886 | | | | 540,348 | |
Travelers Cos., Inc. | | | 5,089 | | | | 643,911 | |
Unum Group | | | 18,934 | | | | 882,892 | |
Validus Holdings, Ltd. | | | 17,640 | | | | 916,751 | |
XL Group, Ltd. | | | 23,744 | | | | 1,039,987 | |
| | | | | | | | |
| | | | | | | 20,126,933 | |
| | | | | | | | |
Internet 0.2% | |
eBay, Inc. (e) | | | 18,706 | | | | 653,214 | |
IAC / InterActiveCorp (e) | | | 884 | | | | 91,264 | |
| | | | | | | | |
| | | | | | | 744,478 | |
| | | | | | | | |
Investment Management/Advisory Services 0.7% | |
Ameriprise Financial, Inc. | | | 8,215 | | | | 1,045,687 | |
BlackRock, Inc. | | | 1,349 | | | | 569,831 | |
Federated Investors, Inc. Class B | | | 2,438 | | | | 68,874 | |
Franklin Resources, Inc. | | | 14,559 | | | | 652,098 | |
Legg Mason, Inc. | | | 13,428 | | | | 512,412 | |
| | | | | | | | |
| | | | | | | 2,848,902 | |
| | | | | | | | |
Iron & Steel 0.3% | |
Steel Dynamics, Inc. | | | 33,058 | | | | 1,183,807 | |
United States Steel Corp. | | | 1,583 | | | | 35,048 | |
| | | | | | | | |
| | | | | | | 1,218,855 | |
| | | | | | | | |
Leisure Time 0.7% | |
Carnival Corp. | | | 9,843 | | | | 645,406 | |
Norwegian Cruise Line Holdings, Ltd. (e) | | | 11,169 | | | | 606,365 | |
Royal Caribbean Cruises, Ltd. | | | 16,535 | | | | 1,806,118 | |
| | | | | | | | |
| | | | | | | 3,057,889 | |
| | | | | | | | |
| | | | |
| 18 | | MainStay VP Balanced Portfolio | | The notes to the financial statements are an integral part of,
and should be read in conjunction with, the financial statements. |
| | | | | | | | |
| | |
| | | Shares | | | Value | |
| Common Stocks (continued) | |
Lodging 0.4% | |
Choice Hotels International, Inc. | | | 3,429 | | | $ | 220,313 | |
Extended Stay America, Inc. | | | 54,250 | | | | 1,050,280 | |
Hyatt Hotels Corp. Class A (e) | | | 10,590 | | | | 595,264 | |
Wynn Resorts, Ltd. | | | 166 | | | | 22,264 | |
| | | | | | | | |
| | | | | | | 1,888,121 | |
| | | | | | | | |
Machinery—Construction & Mining 0.7% | |
Caterpillar, Inc. | | | 6,073 | | | | 652,605 | |
Oshkosh Corp. | | | 17,579 | | | | 1,210,841 | |
Terex Corp. | | | 31,294 | | | | 1,173,525 | |
| | | | | | | | |
| | | | | | | 3,036,971 | |
| | | | | | | | |
Machinery—Diversified 0.4% | |
AGCO Corp. | | | 9,149 | | | | 616,551 | |
Cummins, Inc. | | | 5,025 | | | | 815,155 | |
Zebra Technologies Corp. Class A (e) | | | 4,761 | | | | 478,576 | |
| | | | | | | | |
| | | | | | | 1,910,282 | |
| | | | | | | | |
Media 1.4% | |
Charter Communications, Inc. Class A (e) | | | 1,699 | | | | 572,308 | |
Comcast Corp. Class A | | | 15,618 | | | | 607,852 | |
DISH Network Corp. Class A (e) | | | 10,047 | | | | 630,550 | |
John Wiley & Sons, Inc. Class A | | | 1,631 | | | | 86,035 | |
Liberty SiriusXM Group (e) | |
Class A | | | 19,612 | | | | 823,312 | |
Class C | | | 21,948 | | | | 915,232 | |
Time Warner, Inc. | | | 5,788 | | | | 581,173 | |
Twenty-First Century Fox, Inc. | |
Class A | | | 18,117 | | | | 513,436 | |
Class B | | | 21,081 | | | | 587,527 | |
Walt Disney Co. | | | 4,780 | | | | 507,875 | |
| | | | | | | | |
| | | | | | | 5,825,300 | |
| | | | | | | | |
Metal Fabricate & Hardware 0.3% | |
Timken Co. | | | 23,720 | | | | 1,097,050 | |
| | | | | | | | |
|
Mining 0.5% | |
Alcoa Corp. | | | 7,706 | | | | 251,601 | |
Freeport-McMoRan, Inc. (e) | | | 26,960 | | | | 323,790 | |
Newmont Mining Corp. | | | 52,473 | | | | 1,699,600 | |
| | | | | | | | |
| | | | | | | 2,274,991 | |
| | | | | | | | |
Miscellaneous—Manufacturing 0.8% | |
Crane Co. | | | 340 | | | | 26,989 | |
Donaldson Co., Inc. | | | 3,233 | | | | 147,231 | |
Eaton Corp. PLC | | | 8,362 | | | | 650,814 | |
General Electric Co. | | | 17,488 | | | | 472,351 | |
Ingersoll-Rand PLC | | | 10,897 | | | | 995,877 | |
Parker-Hannifin Corp. | | | 271 | | | | 43,311 | |
Trinity Industries, Inc. | | | 39,188 | | | | 1,098,440 | |
| | | | | | | | |
| | | | | | | 3,435,013 | |
| | | | | | | | |
| | | | | | | | |
| | |
| | | Shares | | | Value | |
Office & Business Equipment 0.3% | |
Pitney Bowes, Inc. | | | 35,290 | | | $ | 532,879 | |
Xerox Corp. | | | 26,870 | | | | 771,975 | |
| | | | | | | | |
| | | | | | | 1,304,854 | |
| | | | | | | | |
Oil & Gas 3.1% | |
Anadarko Petroleum Corp. | | | 12,382 | | | | 561,400 | |
Apache Corp. | | | 4,216 | | | | 202,073 | |
Chevron Corp. | | | 5,381 | | | | 561,400 | |
Cimarex Energy Co. | | | 790 | | | | 74,268 | |
Concho Resources, Inc. (e) | | | 3,318 | | | | 403,237 | |
ConocoPhillips | | | 14,082 | | | | 619,045 | |
Devon Energy Corp. | | | 34,190 | | | | 1,093,054 | |
Diamondback Energy, Inc. (e) | | | 373 | | | | 33,126 | |
Energen Corp. (e) | | | 140 | | | | 6,912 | |
EOG Resources, Inc. | | | 5,718 | | | | 517,593 | |
EQT Corp. | | | 5,114 | | | | 299,629 | |
Exxon Mobil Corp. | | | 6,987 | | | | 564,061 | |
Hess Corp. | | | 4,217 | | | | 185,000 | |
HollyFrontier Corp. | | | 43,578 | | | | 1,197,088 | |
Marathon Oil Corp. | | | 58,006 | | | | 687,371 | |
Marathon Petroleum Corp. | | | 41,976 | | | | 2,196,604 | |
Murphy Oil Corp. | | | 6,086 | | | | 155,984 | |
Noble Energy, Inc. | | | 6,501 | | | | 183,978 | |
Occidental Petroleum Corp. | | | 8,119 | | | | 486,085 | |
Parsley Energy, Inc. Class A (e) | | | 839 | | | | 23,282 | |
Phillips 66 | | | 6,199 | | | | 512,595 | |
Pioneer Natural Resources Co. | | | 3,171 | | | | 506,028 | |
Tesoro Corp. | | | 4,549 | | | | 425,786 | |
Transocean, Ltd. (e) | | | 81,978 | | | | 674,679 | |
Valero Energy Corp. | | | 9,801 | | | | 661,175 | |
Whiting Petroleum Corp. (e) | | | 110,049 | | | | 606,370 | |
| | | | | | | | |
| | | | | | | 13,437,823 | |
| | | | | | | | |
Oil & Gas Services 0.6% | |
Baker Hughes, Inc. | | | 28,380 | | | | 1,546,994 | |
Halliburton Co. | | | 11,454 | | | | 489,200 | |
Oceaneering International, Inc. | | | 6,051 | | | | 138,205 | |
Schlumberger, Ltd. | | | 7,395 | | | | 486,887 | |
| | | | | | | | |
| | | | | | | 2,661,286 | |
| | | | | | | | |
Packaging & Containers 0.3% | |
Ardagh Group S.A. | | | 3,334 | | | | 75,382 | |
Owens-Illinois, Inc. (e) | | | 21,660 | | | | 518,107 | |
WestRock Co. | | | 11,642 | | | | 659,636 | |
| | | | | | | | |
| | | | | | | 1,253,125 | |
| | | | | | | | |
Pharmaceuticals 0.9% | |
Allergan PLC | | | 2,119 | | | | 515,108 | |
Bristol-Myers Squibb Co. | | | 9,120 | | | | 508,166 | |
Cardinal Health, Inc. | | | 831 | | | | 64,751 | |
Express Scripts Holding Co. (e) | | | 10,164 | | | | 648,870 | |
Johnson & Johnson | | | 3,756 | | | | 496,881 | |
McKesson Corp. | | | 4,036 | | | | 664,083 | |
| | | | | | |
The notes to the financial statements are an integral part of,
and should be read in conjunction with, the financial statements. | | | | | 19 | |
Portfolio of Investments June 30, 2017 (Unaudited) (continued)
| | | | | | | | |
| | |
| | | Shares | | | Value | |
| Common Stocks (continued) | |
Pharmaceuticals (continued) | |
Merck & Co., Inc. | | | 7,909 | | | $ | 506,888 | |
Pfizer, Inc. | | | 17,406 | | | | 584,668 | |
| | | | | | | | |
| | | | | | | 3,989,415 | |
| | | | | | | | |
Pipelines 0.7% | |
Kinder Morgan, Inc. | | | 26,425 | | | | 506,303 | |
Targa Resources Corp. | | | 13,359 | | | | 603,827 | |
Williams Cos., Inc. | | | 63,020 | | | | 1,908,245 | |
| | | | | | | | |
| | | | | | | 3,018,375 | |
| | | | | | | | |
Real Estate 0.3% | |
Realogy Holdings Corp. | | | 37,522 | | | | 1,217,589 | |
| | | | | | | | |
|
Retail 2.3% | |
Best Buy Co., Inc. | | | 30,305 | | | | 1,737,386 | |
CVS Health Corp. | | | 7,403 | | | | 595,645 | |
GameStop Corp. Class A | | | 48,407 | | | | 1,046,075 | |
Gap, Inc. | | | 29,398 | | | | 646,462 | |
Liberty Interactive Corp. QVC Group Class A (e) | | | 47,972 | | | | 1,177,233 | |
Nu Skin Enterprises, Inc. Class A | | | 18,285 | | | | 1,149,029 | |
Signet Jewelers, Ltd. | | | 8,082 | | | | 511,106 | |
Staples, Inc. | | | 6,880 | | | | 69,282 | |
Target Corp. | | | 9,740 | | | | 509,305 | |
Wal-Mart Stores, Inc. | | | 8,646 | | | | 654,329 | |
Walgreens Boots Alliance, Inc. | | | 7,245 | | | | 567,356 | |
Williams-Sonoma, Inc. | | | 847 | | | | 41,079 | |
World Fuel Services Corp. | | | 29,164 | | | | 1,121,356 | |
| | | | | | | | |
| | | | 9,825,643 | |
| | | | | | | | |
Semiconductors 1.5% | |
Analog Devices, Inc. | | | 2,415 | | | | 187,887 | |
Intel Corp. | | | 18,385 | | | | 620,310 | |
Lam Research Corp. | | | 2,740 | | | | 387,518 | |
Micron Technology, Inc. (e) | | | 62,174 | | | | 1,856,515 | |
Microsemi Corp. (e) | | | 260 | | | | 12,168 | |
NXP Semiconductors N.V. (e) | | | 5,297 | | | | 579,757 | |
ON Semiconductor Corp. (e) | | | 70,656 | | | | 992,010 | |
Qorvo, Inc. (e) | | | 8,049 | | | | 509,663 | |
QUALCOMM, Inc. | | | 10,037 | | | | 554,243 | |
Skyworks Solutions, Inc. | | | 3,214 | | | | 308,383 | |
Teradyne, Inc. | | | 7,790 | | | | 233,934 | |
| | | | | | | | |
| | | | 6,242,388 | |
| | | | | | | | |
Shipbuilding 0.1% | |
Huntington Ingalls Industries, Inc. | | | 1,213 | | | | 225,812 | |
| | | | | | | | |
|
Software 0.8% | |
Akamai Technologies, Inc. (e) | | | 23,834 | | | | 1,187,171 | |
CA, Inc. | | | 4,548 | | | | 156,770 | |
Fidelity National Information Services, Inc. | | | 965 | | | | 82,411 | |
Nuance Communications, Inc. (e) | | | 58,647 | | | | 1,021,044 | |
| | | | | | | | |
| | |
| | | Shares | | | Value | |
Software (continued) | |
Oracle Corp. | | | 14,276 | | | $ | 715,799 | |
SS&C Technologies Holdings, Inc. | | | 2,283 | | | | 87,690 | |
Synopsys, Inc. (e) | | | 4,467 | | | | 325,778 | |
| | | | | | | | |
| | | | 3,576,663 | |
| | | | | | | | |
Telecommunications 1.5% | |
ARRIS International PLC (e) | | | 41,092 | | | | 1,151,398 | |
AT&T, Inc. | | | 14,861 | | | | 560,706 | |
Cisco Systems, Inc. | | | 20,408 | | | | 638,770 | |
EchoStar Corp. Class A (e) | | | 17,834 | | | | 1,082,524 | |
Juniper Networks, Inc. | | | 49,764 | | | | 1,387,420 | |
Sprint Corp. (e) | | | 72,921 | | | | 598,681 | |
T-Mobile U.S., Inc. (e) | | | 9,033 | | | | 547,581 | |
Verizon Communications, Inc. | | | 10,815 | | | | 482,998 | |
| | | | | | | | |
| | | | 6,450,078 | |
| | | | | | | | |
Transportation 0.6% | |
CSX Corp. | | | 12,258 | | | | 668,796 | |
Norfolk Southern Corp. | | | 4,813 | | | | 585,742 | |
Ryder System, Inc. | | | 5,285 | | | | 380,414 | |
Union Pacific Corp. | | | 5,170 | | | | 563,065 | |
XPO Logistics, Inc. (e) | | | 8,333 | | | | 538,562 | |
| | | | | | | | |
| | | | 2,736,579 | |
| | | | | | | | |
Total Common Stocks
(Cost $207,083,365) | | | | 245,871,871 | |
| | | | | | | | |
|
| Exchange-Traded Funds 5.9% (f) | |
¨iShares Intermediate Credit Bond ETF | | | 25,041 | | | | 2,749,001 | |
¨iShares Intermediate Government / Credit Bond ETF | | | 70,138 | | | | 7,762,874 | |
¨iShares Russell 1000 Value ETF | | | 31,829 | | | | 3,705,850 | |
SPDR S&P 500 ETF Trust | | | 1,725 | | | | 417,105 | |
SPDR S&P MidCap 400 ETF Trust | | | 1,485 | | | | 471,666 | |
¨Vanguard Mid-Cap Value ETF | | | 97,527 | | | | 10,032,603 | |
| | | | | | | | |
Total Exchange-Traded Funds
(Cost $24,264,243) | | | | 25,139,099 | |
| | | | | | | | |
| | |
| | | | | | | | |
| | | Number of
Rights | | | | |
| Rights 0.0%‡ | |
Food & Staples Retailing 0.0%‡ | |
Safeway Casa Ley CVR
Expires 1/30/19 (c)(e)(g) | | | 9,999 | | | | 10,148 | |
Safeway PDC LLC CVR
Expires 1/30/18 (e)(g) | | | 9,999 | | | | 170 | |
| | | | | | | | |
Total Rights
(Cost $10,636) | | | | 10,318 | |
| | | | | | | | |
| | | | |
| 20 | | MainStay VP Balanced Portfolio | | The notes to the financial statements are an integral part of,
and should be read in conjunction with, the financial statements. |
| | | | | | | | |
| | | Principal
Amount | | | Value | |
| Short-Term Investments 0.7% | |
Repurchase Agreements 0.7% | |
Fixed Income Clearing Corp.
0.12%, dated 6/30/17
due 7/3/17
Proceeds at Maturity $176,397 (Collateralized by United States Treasury securities with rates between 1.125% and 2.00% and maturity dates between 8/31/21 and 9/30/21, with a Principal Amount of $180,000 and a Market Value of $180,418) | | $ | 176,395 | | | $ | 176,395 | |
RBC Capital Markets
1.05%, dated 6/30/17
due 7/3/17
Proceeds at Maturity $2,870,251 (Collateralized by United States Treasury securities with rates between 0.00% and 3.375% and maturity dates between 9/28/17 and 2/15/44, with a Principal Amount of $2,017,000 and a Market Value of $2,927,405) | | | 2,870,000 | | | | 2,870,000 | |
| | | | | | | | |
Total Short-Term Investments
(Cost $3,046,395) | | | | 3,046,395 | |
| | | | | | | | |
Total Investments
(Cost $388,790,259) (h) | | | 100.0 | % | | | 429,368,754 | |
Other Assets, Less Liabilities | | | (0.0 | )‡ | | | (145,321 | ) |
Net Assets | | | 100.0 | % | | $ | 429,223,433 | |
| ‡ | Less than one-tenth of a percent. |
| (a) | May be sold to institutional investors only under Rule 144A or securities offered pursuant to Section 4(a)(2) of the Securities Act of 1933, as amended. |
| (b) | Floating rate—Rate shown was the rate in effect as of June 30, 2017. |
| (c) | Fair valued security—Represents fair value as measured in good faith under procedures approved by the Board of Trustees. As of June 30, 2017, the total market value of fair valued securities was $459,884, which represented 0.1% of the Portfolio’s net assets. |
| (d) | Step coupon—Rate shown was the rate in effect as of June 30, 2017. |
| (e) | Non-income producing security. |
| (f) | Exchange-Traded Fund—An investment vehicle that represents a basket of securities that is traded on an exchange. |
| (g) | Illiquid security—As of June 30, 2017, the total market value of these securities deemed illiquid under procedures approved by the Board of Trustees was $10,318, which represented less than one-tenth of a percent of the Portfolio’s net assets. |
| (h) | As of June 30, 2017, cost was $392,219,774 for federal income tax purposes and net unrealized appreciation was as follows: |
| | | | |
Gross unrealized appreciation | | $ | 43,937,842 | |
Gross unrealized depreciation | | | (6,788,862 | ) |
| | | | |
Net unrealized appreciation | | $ | 37,148,980 | |
| | | | |
As of June 30, 2017, the Portfolio held the following futures contracts1:
| | | | | | | | | | | | | | | | |
Type | | Number of
Contracts
Long
(Short) | | | Expiration
Date | | | Notional
Amount | | | Unrealized
Appreciation
(Depreciation)2 | |
| 2-Year United States Treasury Note | | | 25 | | | | September 2017 | | | $ | 5,402,734 | | | $ | (4,340 | ) |
| 5-Year United States Treasury Note | | | 84 | | | | September 2017 | | | | 9,898,219 | | | | (35,526 | ) |
| 10-Year United States Treasury Note | | | 31 | | | | September 2017 | | | | 3,891,469 | | | | (4,351 | ) |
| 10-Year United States Treasury Ultra Note | | | (26 | ) | | | September 2017 | | | | (3,505,125 | ) | | | 15,168 | |
| United States Treasury Long Bond | | | (1 | ) | | | September 2017 | | | | (153,688 | ) | | | 339 | |
| | | | | | | | | | | | | | | | |
| | | $ | 15,533,609 | | | $ | (28,710 | ) |
| | | | | | | | | | | | | | | | |
| 1. | As of June 30, 2017, cash in the amount of $69,438 was on deposit with a broker or futures commission merchant for futures transactions. |
| 2. | Represents the difference between the value of the contracts at the time they were opened and the value as of June 30, 2017. |
The following abbreviations are used in the preceding pages:
CME—Chicago Mercantile Exchange
CVR—Contingent Value Right
ETF—Exchange-Traded Fund
REIT—Real Estate Investment Trust
SPDR—Standard & Poor’s Depositary Receipt
TBD—To Be Determined
| | | | | | |
The notes to the financial statements are an integral part of,
and should be read in conjunction with, the financial statements. | | | | | 21 | |
Portfolio of Investments June 30, 2017 (Unaudited) (continued)
The following is a summary of the fair valuations according to the inputs used as of June 30, 2017, for valuing the Portfolio’s assets and liabilities.
Asset Valuation Inputs
| | | | | | | | | | | | | | | | |
Description | | Quoted
Prices in Active
Markets for
Identical
Assets
(Level 1) | | | Significant
Other
Observable
Inputs (Level 2) | | | Significant
Unobservable
Inputs (Level 3) | | | Total | |
| Investments in Securities (a) | | | | | | | | | | | | | | | | |
| Long-Term Bonds | | | | | | | | | | | | | | | | |
Asset-Backed Securities | | $ | — | | | $ | 12,226,102 | | | $ | — | | | $ | 12,226,102 | |
Corporate Bonds | | | — | | | | 74,468,710 | | | | — | | | | 74,468,710 | |
Foreign Government Bonds | | | — | | | | 462,443 | | | | — | | | | 462,443 | |
Mortgage-Backed Securities | | | — | | | | 6,712,419 | | | | — | | | | 6,712,419 | |
U.S. Government & Federal Agencies | | | — | | | | 61,431,397 | | | | — | | | | 61,431,397 | |
| | | | | | | | | | | | | | | | |
| Total Long-Term Bonds | | | — | | | | 155,301,071 | | | | — | | | | 155,301,071 | |
| | | | | | | | | | | | | | | | |
| Common Stocks | | | 245,871,871 | | | | — | | | | — | | | | 245,871,871 | |
| Exchange-Traded Funds | | | 25,139,099 | | | | — | | | | — | | | | 25,139,099 | |
| Rights (b) | | | — | | | | 170 | | | | 10,148 | | | | 10,318 | |
| Short-Term Investments | | | | | | | | | | | | | | | | |
Repurchase Agreements | | | — | | | | 3,046,395 | | | | — | | | | 3,046,395 | |
| | | | | | | | | | | | | | | | |
| Total Investments in Securities | | | 271,010,970 | | | | 158,347,636 | | | | 10,148 | | | | 429,368,754 | |
| | | | | | | | | | | | | | | | |
| Other Financial Instruments | | | | | | | | | | | | | | | | |
Futures Contracts (c) | | | 15,507 | | | | — | | | | — | | | | 15,507 | |
| | | | | | | | | | | | | | | | |
| Total Investments in Securities and Other Financial Instruments | | $ | 271,026,477 | | | $ | 158,347,636 | | | $ | 10,148 | | | $ | 429,384,261 | |
| | | | | | | | | | | | | | | | |
Liability Valuation Inputs
| | | | | | | | | | | | | | | | |
Description | | Quoted
Prices in
Active
Markets for
Identical
Assets (Level 1) | | | Significant
Other
Observable
Inputs (Level 2) | | | Significant
Unobservable
Inputs (Level 3) | | | Total | |
| Other Financial Instruments | | | | | | | | | | | | | | | | |
Futures Contracts (c) | | $ | (44,217 | ) | | $ | — | | | $ | — | | | $ | (44,217 | ) |
| | | | | | | | | | | | | | | | |
| (a) | For a complete listing of investments and their industries, see the Portfolio of Investments. |
| (b) | The Level 3 securities valued at $10,148 are held in Food & Staples Retailing within the Rights section of the Portfolio of Investments. |
| (c) | The value listed for these securities reflects unrealized appreciation (depreciation) as shown on the Portfolio of Investments. |
The Portfolio recognizes transfers between the levels as of the beginning of the period.
For the period ended June 30, 2017, the Portfolio did not have any transfers between Level 1 and Level 2 fair value measurements. (See Note 2)
As of June 30, 2017, a security with a market value of $488 transferred from Level 3 to Level 2. The transfer occurred as a result of utilizing significant observable inputs. As of December 31, 2016, the fair value obtained for this security, as determined based on information provided by an independent pricing source, utilized significant unobservable inputs. (See Note 2)
| | | | |
| 22 | | MainStay VP Balanced Portfolio | | The notes to the financial statements are an integral part of,
and should be read in conjunction with, the financial statements. |
The following is a reconciliation of investments in which significant unobservable inputs (Level 3) were used in determining value:
| | | | | | | | | | | | | | | | | | | | | | | | | | | | | | | | | | | | | | | | |
Investments in Securities | | Balance
as of
December 31,
2016 | | | Accrued
Discounts
(Premiums) | | | Realized
Gain
(Loss) | | | Change in
Unrealized
Appreciation
(Depreciation) | | | Purchases | | | Sales | | | Transfers
in to
Level 3 | | | Transfers
out of
Level 3 | | | Balance
as of
June 30,
2017 | | | Change in
Unrealized
Appreciation
(Depreciation)
from
Investments
Still Held at
June 30,
2017 (a) | |
| Rights | | | | | | | | | | | | | | | | | | | | | | | | | | | | | | | | | | | | | | | | |
Food & Staples Retailing | | $ | 10,636 | | | $ | — | | | $ | — | | | $ | — | | | $ | — | | | $ | — | | | $ | — | | | $ | (488 | ) | | $ | 10,148 | | | $ | — | |
| | | | | | | | | | | | | | | | | | | | | | | | | | | | | | | | | | | | | | | | |
| (a) | Included in “Net change in unrealized appreciation (depreciation) on investments” in the Statement of Operations. |
| | | | | | |
The notes to the financial statements are an integral part of,
and should be read in conjunction with, the financial statements. | | | | | 23 | |
Statement of Assets and Liabilities as of June 30, 2017 (Unaudited)
| | | | |
| Assets | |
Investment in securities, at value (identified cost $388,790,259) | | $ | 429,368,754 | |
Cash | | | 355,423 | |
Cash collateral on deposit at broker | | | 69,438 | |
Receivables: | | | | |
Investment securities sold | | | 2,976,060 | |
Dividends and interest | | | 1,303,424 | |
Fund shares sold | | | 278,560 | |
Other assets | | | 2,321 | |
| | | | |
Total assets | | | 434,353,980 | |
| | | | |
| |
| Liabilities | | | | |
Payables: | | | | |
Investment securities purchased | | | 4,557,467 | |
Manager (See Note 3) | | | 244,126 | |
Fund shares redeemed | | | 116,841 | |
NYLIFE Distributors (See Note 3) | | | 84,773 | |
Custodian | | | 49,566 | |
Shareholder communication | | | 32,081 | |
Professional fees | | | 25,490 | |
Variation margin on futures contracts | | | 15,362 | |
Trustees | | | 778 | |
Accrued expenses | | | 4,063 | |
| | | | |
Total liabilities | | | 5,130,547 | |
| | | | |
Net assets | | $ | 429,223,433 | |
| | | | |
| |
| Composition of Net Assets | | | | |
Shares of beneficial interest outstanding (par value of $.001 per share) unlimited number of shares authorized | | $ | 29,296 | |
Additional paid-in capital | | | 365,077,005 | |
| | | | |
| | | 365,106,301 | |
Undistributed net investment income | | | 7,295,901 | |
Accumulated net realized gain (loss) on investments and futures transactions | | | 16,271,446 | |
Net unrealized appreciation (depreciation) on investments and futures contracts | | | 40,549,785 | |
| | | | |
Net assets | | $ | 429,223,433 | |
| | | | |
| | | | |
Initial Class | | | | |
Net assets applicable to outstanding shares | | $ | 16,373,803 | |
| | | | |
Shares of beneficial interest outstanding | | | 1,106,522 | |
| | | | |
Net asset value per share outstanding | | $ | 14.80 | |
| | | | |
Service Class | | | | |
Net assets applicable to outstanding shares | | $ | 412,849,630 | |
| | | | |
Shares of beneficial interest outstanding | | | 28,189,516 | |
| | | | |
Net asset value per share outstanding | | $ | 14.65 | |
| | | | |
| | | | |
| 24 | | MainStay VP Balanced Portfolio | | The notes to the financial statements are an integral part of,
and should be read in conjunction with, the financial statements. |
Statement of Operations for the six months ended June 30, 2017 (Unaudited)
| | | | |
| Investment Income (Loss) | |
Income | | | | |
Dividends (a) | | $ | 2,760,262 | |
Interest | | | 1,742,930 | |
Other income | | | 567 | |
| | | | |
Total income | | | 4,503,759 | |
| | | | |
Expenses | | | | |
Manager (See Note 3) | | | 1,469,881 | |
Distribution/Service—Service Class (See Note 3) | | | 505,020 | |
Shareholder communication | | | 33,794 | |
Professional fees | | | 33,600 | |
Custodian | | | 12,810 | |
Trustees | | | 5,202 | |
Miscellaneous | | | 9,615 | |
| | | | |
Total expenses | | | 2,069,922 | |
| | | | |
Net investment income (loss) | | | 2,433,837 | |
| | | | |
|
| Realized and Unrealized Gain (Loss) on Investments and Futures Contracts | |
Net realized gain (loss) on: | | | | |
Investment transactions | | | 10,845,471 | |
Futures transactions | | | 144,147 | |
| | | | |
Net realized gain (loss) on investments and futures transactions | | | 10,989,618 | |
| | | | |
Net change in unrealized appreciation (depreciation) on: | | | | |
Investments | | | 1,578,022 | |
Futures contracts | | | 39,298 | |
| | | | |
Net change in unrealized appreciation (depreciation) on investments and futures contracts | | | 1,617,320 | |
| | | | |
Net realized and unrealized gain (loss) on investments and futures transactions | | | 12,606,938 | |
| | | | |
Net increase (decrease) in net assets resulting from operations | | $ | 15,040,775 | |
| | | | |
| (a) | Dividends recorded net of foreign withholding taxes in the amount of $1,255. |
| | | | | | |
The notes to the financial statements are an integral part of,
and should be read in conjunction with, the financial statements. | | | | | 25 | |
Statements of Changes in Net Assets
for the six months ended June 30, 2017 (Unaudited) and the year ended December 31, 2016
| | | | | | | | |
| | | 2017 | | | 2016 | |
| Increase (Decrease) in Net Assets | |
Operations: | | | | | | | | |
Net investment income (loss) | | $ | 2,433,837 | | | $ | 4,698,503 | |
Net realized gain (loss) on investments and futures transactions | | | 10,989,618 | | | | 7,731,887 | |
Net change in unrealized appreciation (depreciation) on investments and futures contracts | | | 1,617,320 | | | | 23,846,606 | |
| | | | |
Net increase (decrease) in net assets resulting from operations | | | 15,040,775 | | | | 36,276,996 | |
| | | | |
Dividends and distributions to shareholders: | | | | | | | | |
From net investment income: | | | | | | | | |
Initial Class | | | — | | | | (210,721 | ) |
Service Class | | | — | | | | (4,533,804 | ) |
| | | | |
| | | — | | | | (4,744,525 | ) |
| | | | |
From net realized gain on investments: | | | | | | | | |
Initial Class | | | — | | | | (487,300 | ) |
Service Class | | | — | | | | (12,572,498 | ) |
| | | | |
| | | — | | | | (13,059,798 | ) |
| | | | |
Total dividends and distributions to shareholders | | | — | | | | (17,804,323 | ) |
| | | | |
Capital share transactions: | | | | | | | | |
Net proceeds from sale of shares | | | 34,273,481 | | | | 57,291,815 | |
Net asset value of shares issued to shareholders in reinvestment of dividends and distributions | | | — | | | | 17,804,323 | |
Cost of shares redeemed | | | (31,367,459 | ) | | | (49,567,106 | ) |
| | | | |
Increase (decrease) in net assets derived from capital share transactions | | | 2,906,022 | | | | 25,529,032 | |
| | | | |
Net increase (decrease) in net assets | | | 17,946,797 | | | | 44,001,705 | |
|
| Net Assets | |
Beginning of period | | | 411,276,636 | | | | 367,274,931 | |
| | | | |
End of period | | $ | 429,223,433 | | | $ | 411,276,636 | |
| | | | |
Undistributed net investment income at end of period | | $ | 7,295,901 | | | $ | 4,862,064 | |
| | | | |
| | | | |
| 26 | | MainStay VP Balanced Portfolio | | The notes to the financial statements are an integral part of,
and should be read in conjunction with, the financial statements. |
Financial Highlights selected per share data and ratios
| | | | | | | | | | | | | | | | | | | | | | | | | | | | |
| | | Six months
ended
June 30, | | | | | | Year ended December 31, | |
| Initial Class | | 2017* | | | | | | 2016 | | | 2015 | | | 2014 | | | 2013 | | | 2012 | |
Net asset value at beginning of period | | $ | 14.26 | | | | | | | $ | 13.57 | | | $ | 15.04 | | | $ | 14.72 | | | $ | 12.22 | | | $ | 11.02 | |
| | | | | | | | | | | | | | | | | | | | | | | | | | | | |
Net investment income (loss) (a) | | | 0.10 | | | | | | | | 0.21 | | | | 0.22 | | | | 0.20 | | | | 0.17 | | | | 0.19 | |
Net realized and unrealized gain (loss) on investments | | | 0.44 | | | | | | | | 1.15 | | | | (0.61 | ) | | | 1.35 | | | | 2.48 | | | | 1.17 | |
| | | | | | | | | | | | | | | | | | | | | | | | | | | | |
Total from investment operations | | | 0.54 | | | | | | | | 1.36 | | | | (0.39 | ) | | | 1.55 | | | | 2.65 | | | | 1.36 | |
| | | | | | | | | | | | | | | | | | | | | | | | | | | | |
| Less dividends and distributions: | | | | | | | | | | | | | | | | | | | | | | | | | | | | |
From net investment income | | | — | | | | | | | | (0.20 | ) | | | (0.16 | ) | | | (0.14 | ) | | | (0.15 | ) | | | (0.16 | ) |
From net realized gain on investments | | | — | | | | | | | | (0.47 | ) | | | (0.92 | ) | | | (1.09 | ) | | | — | | | | — | |
| | | | | | | | | | | | | | | | | | | | | | | | | | | | |
Total dividends and distributions | | | — | | | | | | | | (0.67 | ) | | | (1.08 | ) | | | (1.23 | ) | | | (0.15 | ) | | | (0.16 | ) |
| | | | | | | | | | | | | | | | | | | | | | | | | | | | |
Net asset value at end of period | | $ | 14.80 | | | | | | | $ | 14.26 | | | $ | 13.57 | | | $ | 15.04 | | | $ | 14.72 | | | $ | 12.22 | |
| | | | | | | | | | | | | | | | | | | | | | | | | | | | |
Total investment return (b) | | | 3.79 | %(c) | | | | | | | 10.24 | % | | | (2.59 | %) | | | 10.88 | % | | | 21.87 | % | | | 12.32 | % |
| Ratios (to average net assets)/Supplemental Data: | | | | | | | | | | | | | | | | | | | | | | | | | | | | |
Net investment income (loss) | | | 1.40 | %†† | | | | | | | 1.47 | %(d) | | | 1.49 | % | | | 1.33 | % | | | 1.27 | % | | | 1.62 | % |
Net expenses | | | 0.75 | %†† | | | | | | | 0.74 | %(e) | | | 0.76 | % | | | 0.76 | % | | | 0.77 | % | | | 0.78 | % |
Expenses (before waiver/reimbursement) | | | 0.75 | %†† | | | | | | | 0.76 | % | | | 0.76 | % | | | 0.76 | % | | | 0.78 | % | | | 0.83 | % |
Portfolio turnover rate | | | 99 | % | | | | | | | 253 | % | | | 214 | % | | | 171 | % | | | 162 | %(f) | | | 202 | %(f) |
Net assets at end of period (in 000’s) | | $ | 16,374 | | | | | | | $ | 15,666 | | | $ | 14,037 | | | $ | 14,274 | | | $ | 13,017 | | | $ | 10,075 | |
| (a) | Per share data based on average shares outstanding during the period. |
| (b) | Total return does not reflect any deduction of sales charges, mortality and expense charges, contract charges or administrative charges. For periods of less than one year, total return is not annualized. |
| (c) | Total investment return may reflect adjustments to conform to generally accepted accounting principles. |
| (d) | Without the custody fee reimbursement, net investment income (loss) would have been 1.45%. |
| (e) | Without the custody fee reimbursement, net expenses would have been 0.76%. |
| (f) | The portfolio turnover rates not including mortgage dollar rolls were 159% and 195% for the years ended December 31, 2013 and 2012, respectively. The Portfolio did not engage in mortgage dollar rolls for the six months ended June 30, 2017 and the years ended December 31, 2016, 2015, and 2014. |
| | | | | | |
The notes to the financial statements are an integral part of,
and should be read in conjunction with, the financial statements. | | | | | 27 | |
Financial Highlights selected per share data and ratios
| | | | | | | | | | | | | | | | | | | | | | | | | | | | |
| | | Six months
ended
June 30, | | | | | | Year ended December 31, | |
| Service Class | | 2017* | | | | | | 2016 | | | 2015 | | | 2014 | | | 2013 | | | 2012 | |
Net asset value at beginning of period | | $ | 14.13 | | | | | | | $ | 13.45 | | | $ | 14.92 | | | $ | 14.63 | | | $ | 12.15 | | | $ | 10.97 | |
| | | | | | | | | | | | | | | | | | | | | | | | | | | | |
Net investment income (loss) (a) | | | 0.08 | | | | | | | | 0.17 | | | | 0.18 | | | | 0.16 | | | | 0.14 | | | | 0.16 | |
Net realized and unrealized gain (loss) on investments | | | 0.44 | | | | | | | | 1.15 | | | | (0.60 | ) | | | 1.33 | | | | 2.47 | | | | 1.16 | |
| | | | | | | | | | | | | | | | | | | | | | | | | | | | |
Total from investment operations | | | 0.52 | | | | | | | | 1.32 | | | | (0.42 | ) | | | 1.49 | | | | 2.61 | | | | 1.32 | |
| | | | | | | | | | | | | | | | | | | | | | | | | | | | |
| Less dividends and distributions: | | | | | | | | | | | | | | | | | | | | | | | | | | | | |
From net investment income | | | — | | | | | | | | (0.17 | ) | | | (0.13 | ) | | | (0.11 | ) | | | (0.13 | ) | | | (0.14 | ) |
From net realized gain on investments | | | — | | | | | | | | (0.47 | ) | | | (0.92 | ) | | | (1.09 | ) | | | — | | | | — | |
| | | | | | | | | | | | | | | | | | | | | | | | | | | | |
Total dividends and distributions | | | — | | | | | | | | (0.64 | ) | | | (1.05 | ) | | | (1.20 | ) | | | (0.13 | ) | | | (0.14 | ) |
| | | | | | | | | | | | | | | | | | | | | | | | | | | | |
Net asset value at end of period | | $ | 14.65 | | | | | | | $ | 14.13 | | | $ | 13.45 | | | $ | 14.92 | | | $ | 14.63 | | | $ | 12.15 | |
| | | | | | | | | | | | | | | | | | | | | | | | | | | | |
Total investment return (b) | | | 3.68 | %(c) | | | | | | | 9.96 | % | | | (2.83 | %) | | | 10.60 | % | | | 21.57 | % | | | 12.04 | % |
| Ratios (to average net assets)/Supplemental Data: | | | | | | | | | | | | | | | | | | | | | | | | | | | | |
Net investment income (loss) | | | 1.15 | %†† | | | | | | | 1.22 | %(d) | | | 1.24 | % | | | 1.09 | % | | | 1.02 | % | | | 1.37 | % |
Net expenses | | | 1.00 | %†† | | | | | | | 0.99 | %(e) | | | 1.01 | % | | | 1.01 | % | | | 1.02 | % | | | 1.03 | % |
Expenses (before waiver/reimbursement) | | | 1.00 | %†† | | | | | | | 1.01 | % | | | 1.01 | % | | | 1.01 | % | | | 1.03 | % | | | 1.08 | % |
Portfolio turnover rate | | | 99 | % | | | | | | | 253 | % | | | 214 | % | | | 171 | % | | | 162 | %(f) | | | 202 | %(f) |
Net assets at end of period (in 000’s) | | $ | 412,850 | | | | | | | $ | 395,611 | | | $ | 353,238 | | | $ | 338,667 | | | $ | 280,326 | | | $ | 191,296 | |
| (a) | Per share data based on average shares outstanding during the period. |
| (b) | Total return does not reflect any deduction of sales charges, mortality and expense charges, contract charges or administrative charges. For periods of less than one year, total return is not annualized. |
| (c) | Total investment return may reflect adjustments to conform to generally accepted accounting principles. |
| (d) | Without the custody fee reimbursement, net investment income (loss) would have been 1.20%. |
| (e) | Without the custody fee reimbursement, net expenses would have been 1.01%. |
| (f) | The portfolio turnover rates not including mortgage dollar rolls were 159% and 195% for the years ended December 31, 2013 and 2012, respectively. The Portfolio did not engage in mortgage dollar rolls for the six months ended June 30, 2017 and the years ended December 31, 2016, 2015, and 2014. |
| | | | |
| 28 | | MainStay VP Balanced Portfolio | | The notes to the financial statements are an integral part of,
and should be read in conjunction with, the financial statements. |
Notes to Financial Statements (Unaudited)
Note 1–Organization and Business
MainStay VP Funds Trust (the “Fund”) was organized as a Delaware statutory trust on February 1, 2011. The Fund is registered under the Investment Company Act of 1940, as amended (the “1940 Act”), as an open-end management investment company. The Fund is comprised of thirty-two separate series (collectively referred to as the “Portfolios”). These financial statements and notes relate to the MainStay VP Balanced Portfolio (the “Portfolio”), a “diversified” portfolio, as that term is defined in the 1940 Act, as interpreted or modified by regulatory authorities having jurisdiction, from time to time.
Shares of the Portfolio are currently offered to certain separate accounts to fund variable annuity policies and variable universal life insurance policies issued by New York Life Insurance and Annuity Corporation (“NYLIAC”), a wholly-owned subsidiary of New York Life Insurance Company (“New York Life”). NYLIAC allocates shares of the Portfolios to, among others, NYLIAC Variable Annuity Separate Accounts-I, II, III and IV, VUL Separate Account-I and CSVUL Separate Account-I (collectively, the “Separate Accounts”). Shares of the Portfolio are also offered to the MainStay VP Conservative Allocation Portfolio, MainStay VP Moderate Allocation Portfolio, MainStay VP Moderate Growth Allocation Portfolio and MainStay VP Growth Allocation Portfolio, which operate as “funds-of-funds.”
The Portfolio currently offers two classes of shares. Initial Class and Service Class shares commenced operations on May 2, 2005. Shares of the Portfolio are sold and are redeemed at a price equal to their respective net asset value (“NAV”) per share. No sales or redemption charge is applicable to the purchase or redemption of the Portfolio’s shares. Under the terms of the Fund’s multiple class plan, adopted pursuant to Rule 18f-3 under the 1940 Act, the classes differ in that, among other things, Service Class shares of the Portfolio pay a combined distribution and service fee of 0.25% of average daily net assets attributable to Service Class shares of the Portfolio to the Distributor (as defined in Note 3(B)). Contract owners of variable annuity contracts purchased after June 2, 2003, are permitted to invest only in the Service Class shares.
The Portfolio’s investment objective is to seek total return.
Note 2–Significant Accounting Policies
The Portfolio is an investment company and accordingly follows the investment company accounting and reporting guidance of the Financial Accounting Standards Board (“FASB”) Accounting Standard Codification Topic 946 Financial Services—Investment Companies. The Portfolio prepares its financial statements in accordance with generally accepted accounting principles (“GAAP”) in the United States of America and follows the significant accounting policies described below.
(A) Securities Valuation. Investments are usually valued as of the close of regular trading on the New York Stock Exchange (the “Exchange”) (usually 4:00 p.m. Eastern time) on each day the Portfolio is open for business (“valuation date”).
The Board of Trustees (the “Board”) of the Fund adopted procedures establishing methodologies for the valuation of the Portfolio’s securities and other assets and delegated the responsibility for valuation determinations under those procedures to the Valuation Committee of the Fund
(the “Valuation Committee”). The Board authorized the Valuation Committee to appoint a Valuation Sub-Committee (the “Sub-Committee”) to deal in the first instance with establishing the prices of securities for which market quotations are not readily available or the prices of which are not otherwise readily determinable under these procedures. The Sub-Committee meets (in person, via electronic mail or via teleconference) on an as-needed basis. Subsequently, the Valuation Committee meets to ensure that actions taken by the Sub-Committee were appropriate. The procedures recognize that, subject to the oversight of the Board and unless otherwise noted, the responsibility for the day-to-day valuation of portfolio assets (including fair value measurements for the Portfolio’s assets and liabilities) rests with New York Life Investment Management LLC (“New York Life Investments” or the “Manager”), aided to whatever extent necessary by the Subadvisors (as defined in Note 3(A)) to the Portfolio.
To assess the appropriateness of security valuations, the Manager, Subadvisors or the Portfolio’s third party service provider, who is subject to oversight by the Manager, regularly compares prior day prices, prices on comparable securities, and the sale prices to the prior and current day prices and challenges prices with changes exceeding certain tolerance levels with third party pricing services or broker sources. For those securities valued through either a standardized fair valuation methodology or a fair valuation measurement, the Sub-Committee deals in the first instance with such valuation and the Valuation Committee reviews and affirms, if appropriate, the reasonableness of the valuation based on such methodologies and measurements on a regular basis after considering all relevant information that is reasonably available. Any action taken by the Sub-Committee with respect to the valuation of a portfolio security or other asset is submitted by the Valuation Committee to the Board for its review and ratification, if appropriate, at its next regularly scheduled meeting.
“Fair value” is defined as the price the Portfolio would reasonably expect to receive upon selling an asset or liability in an orderly transaction to an independent buyer in the principal or most advantageous market for the asset or liability. Fair value measurements are determined within a framework that establishes a three-tier hierarchy which maximizes the use of observable market data and minimizes the use of unobservable inputs to establish a classification of fair value measurements for disclosure purposes. “Inputs” refer broadly to the assumptions that market participants would use in pricing the asset or liability, including assumptions about risk, such as the risk inherent in a particular valuation technique used to measure fair value using a pricing model and/or the risk inherent in the inputs for the valuation technique. Inputs may be observable or unobservable. Observable inputs reflect the assumptions market participants would use in pricing the asset or liability based on market data obtained from sources independent of the Portfolio. Unobservable inputs reflect the Portfolio’s own assumptions about the assumptions market participants would use in pricing the asset or liability based on the information available. The inputs or methodology used for valuing assets or liabilities may not be an indication of the risks associated with investing in those assets or liabilities. The three-tier hierarchy of inputs is summarized below.
| • | | Level 1—quoted prices in active markets for an identical asset or liability |
Notes to Financial Statements (Unaudited) (continued)
| • | | Level 2—other significant observable inputs (including quoted prices for a similar asset or liability in active markets, interest rates and yield curves, prepayment speeds, credit risk, etc.) |
| • | | Level 3—significant unobservable inputs (including the Portfolio’s own assumptions about the assumptions that market participants would use in measuring fair value of an asset or liability) |
The level of an asset or liability within the fair value hierarchy is based on the lowest level of an input, both individually and in the aggregate, that is significant to the fair value measurement. As of June 30, 2017, the aggregate value by input level of the Portfolio’s assets and liabilities is included at the end of the Portfolio’s Portfolio of Investments.
The Portfolio may use third party vendor evaluations, whose prices may be derived from one or more of the following standard inputs, among others:
| | |
• Benchmark yields | | • Reported trades |
• Broker/dealer quotes | | • Issuer spreads |
• Two-sided markets | | • Benchmark securities |
• Bids/offers | | • Reference data (corporate actions or material event notices) |
• Industry and economic events | | • Comparable bonds |
• Monthly payment information | | |
An asset or liability for which market values cannot be measured using the methodologies described above is valued by methods deemed reasonable in good faith by the Valuation Committee, following the procedures established by the Board, to represent fair value. Under these procedures, the Portfolio generally uses a market-based approach which may use related or comparable assets or liabilities, recent transactions, market multiples, book values, and other relevant information. The Portfolio may also use an income-based valuation approach in which the anticipated future cash flows of the asset or liability are discounted to calculate fair value. Discounts may also be applied due to the nature and/or duration of any restrictions on the disposition of the asset or liability. Fair value represents a good faith approximation of the value of a security. Fair value determinations involve the consideration of a number of subjective factors, an analysis of applicable facts and circumstances and the exercise of judgment. As a result, it is possible that the fair value for a security determined in good faith in accordance with the Portfolio’s valuation procedures may differ from valuations for the same security determined by other funds using their own valuation procedures. Although the Portfolio’s valuation procedures are designed to value a security at the price the Portfolio may reasonably expect to receive upon the security’s sale in an orderly transaction, there can be no assurance that any fair value determination thereunder would, in fact, approximate the amount that the Portfolio would actually realize upon the sale of the security or the price at which the security would trade if a reliable market price were readily available. During the six-month period ended June 30, 2017, there were no material changes to the fair value methodologies.
Securities which may be valued in this manner include, but are not limited to: (i) a security for which trading has been halted or suspended; (ii) a debt security that has recently gone into default and for which there is not a current market quotation; (iii) a security of an issuer that
has entered into a restructuring; (iv) a security that has been de-listed from a national exchange; (v) a security for which the market price is not readily available from a third party pricing source or, if so provided, does not, in the opinion of the Manager or Subadvisors reflect the security’s market value; (vi) a security subject to trading collars for which no or limited trading takes place; and (vii) a security whose principal market has been temporarily closed at a time when, under normal conditions, it would be open. Securities for which market quotations or observable inputs are not readily available are generally categorized as Level 3 in the hierarchy. As of June 30, 2017, securities that were fair valued in such a manner are shown in the Portfolio of Investments.
Equity securities, rights and shares of Exchange-Traded Funds (“ETFs”) are valued at the last quoted sales prices as of the close of regular trading on the relevant exchange on each valuation date. Securities that are not traded on the valuation date are valued at the mean of the last quoted bid and ask prices. Prices are normally taken from the principal market in which each security trades. Futures contracts are valued at the last posted settlement price on the market where such futures are primarily traded. These securities are generally categorized as Level 1 in the hierarchy.
Debt securities (other than convertible and municipal bonds) are valued at the evaluated bid prices (evaluated mean prices in the case of convertible and municipal bonds) supplied by a pricing agent or brokers selected by the Manager, in consultation with the Subadvisors. Those values reflect broker/dealer supplied prices and electronic data processing techniques, if the evaluated bid or mean prices are deemed by the Manager, in consultation with the Subadvisors, to be representative of market values at the regular close of trading of the Exchange on each valuation date. Debt securities purchased on a delayed delivery basis are marked to market daily until settlement at the forward settlement date. Debt securities, including corporate bonds, U.S. government & federal agency bonds, municipal bonds, foreign bonds, convertible bonds, asset-backed securities and mortgage-backed securities are generally categorized as Level 2 in the hierarchy.
Temporary cash investments acquired in excess of 60 days to maturity at the time of purchase are valued using the latest bid prices or using valuations based on a matrix system (which considers such factors as security prices, yields, maturities, and ratings), both as furnished by independent pricing services. Other temporary cash investments which mature in 60 days or less at the time of purchase (“Short-Term Investments”) are valued using the amortized cost method of valuation, unless the use of such method would be inappropriate. The amortized cost method involves valuing a security at its cost on the date of purchase and thereafter assuming a constant amortization to maturity of the difference between such cost and the value on maturity date. Amortized cost approximates the current fair value of a security. Securities valued using the amortized cost method are not valued using quoted prices in an active market and are generally categorized as Level 2 in the hierarchy.
The information above is not intended to reflect an exhaustive list of the methodologies that may be used to value portfolio investments. The valuation procedures permit the use of a variety of valuation methodologies in connection with valuing portfolio investments. The methodology used for a specific type of investment may vary based on the market data available or other considerations. The methodologies
| | |
| 30 | | MainStay VP Balanced Portfolio |
summarized above may not represent the specific means by which portfolio investments are valued on any particular business day.
A portfolio security or other asset may be determined to be illiquid under procedures approved by the Board. Illiquidity of a security might prevent the sale of such security at a time when the Manager or Subadvisors might wish to sell, and these securities could have the effect of decreasing the overall level of the Portfolio’s liquidity. Further, the lack of an established secondary market may make it more difficult to value illiquid securities, requiring the Portfolio to rely on judgments that may be somewhat subjective in measuring value, which could vary materially from the amount that the Portfolio could realize upon disposition. Difficulty in selling illiquid securities may result in a loss or may be costly to the Portfolio. Under the supervision of the Board, the Manager or Subadvisors determines the liquidity of the Portfolio’s investments; in doing so, the Manager or Subadvisors may consider various factors, including (i) the frequency of trades and quotations, (ii) the number of dealers and prospective purchasers, (iii) dealer undertakings to make a market, and (iv) the nature of the security and the market in which it trades (e.g., the time needed to dispose of the security, the method of soliciting offers and the mechanics of transfer). Illiquid securities are often valued in accordance with methods deemed by the Board in good faith to be reasonable and appropriate to accurately reflect their fair value. The liquidity of the Portfolio’s investments, as shown in the Portfolio of Investments and was determined as of June 30, 2017 and can change at any time in response to, among other relevant factors, market conditions or events or developments with respect to an individual issuer or instrument. As of June 30, 2017, securities deemed to be illiquid under procedures approved by the Board are shown in the Portfolio of Investments.
(B) Income Taxes. The Portfolio’s policy is to comply with the requirements of the Internal Revenue Code of 1986, as amended (the “Internal Revenue Code”), applicable to regulated investment companies and to distribute all of its taxable income to the shareholders of the Portfolio within the allowable time limits. Therefore, no federal, state and local income tax provisions are required.
Management evaluates the Portfolio’s tax positions to determine if the tax positions taken meet the minimum recognition threshold in connection with accounting for uncertainties in income tax positions taken or expected to be taken for the purposes of measuring and recognizing tax liabilities in the financial statements. Recognition of tax benefits of an uncertain tax position is permitted only to the extent the position is “more likely than not” to be sustained assuming examination by taxing authorities. Management has analyzed the Portfolio’s tax positions taken on federal, state and local income tax returns for all open tax years (for up to three tax years), and has concluded that no provisions for federal, state and local income tax are required in the Portfolio’s financial statements. The Portfolio’s federal, state and local income and federal excise tax returns for tax years for which the applicable statutes of limitations have not expired are subject to examination by the Internal Revenue Service and state and local departments of revenue.
(C) Dividends and Distributions to Shareholders. Dividends and distributions are recorded on the ex-dividend date. The Portfolio intends to declare and pay dividends from net investment income and distributions from net realized capital and currency gains, if any, at least annually. Unless the shareholder elects otherwise, all dividends and
distributions are reinvested in the same class of shares of the Portfolio, at NAV. Dividends and distributions to shareholders are determined in accordance with federal income tax regulations and may differ from GAAP.
(D) Security Transactions and Investment Income. The Portfolio records security transactions on the trade date. Realized gains and losses on security transactions are determined using the identified cost method. Dividend income is recognized on the ex-dividend date; net of any foreign tax withheld at the source, and interest income is accrued as earned using the effective interest rate method. Discounts and premiums on securities purchased, other than Short-Term Investments, for the Portfolio are accreted and amortized, respectively, on the effective interest rate method over the life of the respective securities. Discounts and premiums on Short-Term Investments are accreted and amortized, respectively, on the straight-line method. The straight-line method approximates the effective interest method for Short-Term Investments.
Investment income and realized and unrealized gains and losses on investments of the Portfolio are allocated pro rata to the separate classes of shares based upon their relative net assets on the date the income is earned or realized and unrealized gains and losses are incurred.
The Portfolio may place a debt security on non-accrual status and reduce related interest income by ceasing current accruals and writing off all or a portion of any interest receivables when the collection of all or a portion of such interest has become doubtful. A debt security is removed from non-accrual status when the issuer resumes interest payments or when collectability of interest is reasonably assured.
(E) Expenses. Expenses of the Fund are allocated to the individual Portfolios in proportion to the net assets of the respective Portfolios when the expenses are incurred, except where direct allocations of expenses can be made. Expenses (other than fees incurred under the distribution and service plans, further discussed in Note 3(B), which are charged directly to the Service Class shares) are allocated to separate classes of shares pro rata based upon their relative net assets on the date the expenses are incurred. The expenses borne by the Portfolio, including those of related parties to the Portfolio, are shown in the Statement of Operations. Additionally, the Portfolio may invest in shares of ETFs or mutual funds, which are subject to management fees and other fees that may increase their costs versus the costs of owning the underlying securities directly. These indirect expenses of ETFs or mutual funds are not included in the amounts shown as expenses on the Portfolio’s Statement of Operations or in the expense ratios included in the financial highlights.
(F) Use of Estimates. In preparing financial statements in conformity with GAAP, management makes estimates and assumptions that affect the reported amounts and disclosures in the financial statements. Actual results could differ from those estimates.
(G) Repurchase Agreements. The Portfolio may enter into repurchase agreements (i.e., buy a security from another party with the agreement that it be sold back in the future) to earn income. The Portfolio may enter into repurchase agreements only with counterparties, usually financial institutions, that are deemed by the Manager or Subadvisor to be creditworthy, pursuant to guidelines established by
Notes to Financial Statements (Unaudited) (continued)
the Board. During the term of any repurchase agreement, the Manager or Subadvisors will continue to monitor the creditworthiness of the counterparty. Under the 1940 Act, repurchase agreements are considered to be collateralized loans by the Portfolio to the counterparty secured by the securities transferred to the Portfolio.
Repurchase agreements are subject to counterparty risk, meaning the Portfolio could lose money by the counterparty’s failure to perform under the terms of the agreement. The Portfolio mitigates this risk by ensuring the repurchase agreement is collateralized by cash, U.S. government securities, fixed income securities and/or other securities. The collateral is held by the Portfolio’s custodian and valued daily on a mark to market basis to determine if the value, including accrued interest, exceeds the repurchase price. In the event of the counterparty’s default on the obligation to repurchase, the Portfolio has the right to liquidate the collateral and apply the proceeds in satisfaction of the obligation. Under certain circumstances, such as in the event of default or bankruptcy by the counterparty, realization and/or retention of the collateral may be limited or subject to delay, to legal proceedings and possible realized loss to the Portfolio.
(H) Futures Contracts. A futures contract is an agreement to purchase or sell a specified quantity of an underlying instrument at a specified future date and price, or to make or receive a cash payment based on the value of a financial instrument (e.g., foreign currency, interest rate, security, or securities index). The Portfolio is subject to risks such as market price risk and/or interest rate risk in the normal course of investing in these transactions. Upon entering into a futures contract, the Portfolio is required to pledge to the broker or futures commission merchant an amount of cash and/or U.S. Government securities equal to a certain percentage of the collateral amount, known as the “initial margin.” During the period the futures contract is open, changes in the value of the contract are recognized as unrealized appreciation or depreciation by marking to market such contract on a daily basis to reflect the market value of the contract at the end of each day’s trading. The Portfolio agrees to receive from or pay to the broker or futures commission merchant an amount of cash equal to the daily fluctuation in the value of the contract. Such receipts or payments are known as “variation margin.” When the futures contract is closed, the Portfolio records a realized gain or loss equal to the difference between the proceeds from (or cost of) the closing transaction and the Portfolio’s basis in the contract.
The use of futures contracts involves, to varying degrees, elements of market risk in excess of the amount recognized in the Statement of Assets and Liabilities. The contract or notional amounts and variation margin reflect the extent of the Portfolio’s involvement in open futures positions. There are several risks associated with the use of futures contracts as hedging techniques. There can be no assurance that a liquid market will exist at the time when the Portfolio seeks to close out a futures contract. If no liquid market exists, the Portfolio would remain obligated to meet margin requirements until the position is closed. Futures may involve a small initial investment relative to the risk assumed, which could result in losses greater than if they had not been used. Futures may be more volatile than direct investments in the instrument underlying the futures, and may not correlate to the underlying instrument, causing a given hedge not to achieve its objectives. The Portfolio’s activities in futures contracts have minimal counterparty
risk as they are conducted through regulated exchanges that guarantee the futures against default by the counterparty. In the event of a bankruptcy or insolvency of a futures commission merchant that holds margin on behalf of the Portfolio, the Portfolio may not be entitled to the return of the entire margin owed to the Portfolio, potentially resulting in a loss. The Portfolio’s investment in futures contracts and other derivatives may increase the volatility of the Portfolio’s NAV and may result in a loss to the Portfolio. As of June 30, 2017, all open futures contracts are shown in the Portfolio of Investments.
(I) Rights and Warrants. Rights are certificates that permit the holder to purchase a certain number of shares, or a fractional share, of a new stock from the issuer at a specific price. Warrants are instruments that entitle the holder to buy an equity security at a specific price for a specific period of time. These investments can provide a greater potential for profit or loss than an equivalent investment in the underlying security. Prices of these investments do not necessarily move in tandem with the prices of the underlying securities.
There is risk involved in the purchase of rights and warrants in that these investments are speculative investments. The Portfolio could also lose the entire value of its investment in warrants if such warrants are not exercised by the date of its expiration. The Portfolio is exposed to risk until the sale or exercise of each right or warrant is completed. As of June 30, 2017, the Portfolio did not hold any warrants.
(J) Dollar Rolls. The Portfolio may enter into dollar roll transactions in which it sells mortgage-backed securities (“MBS”) from its portfolio to a counterparty from whom it simultaneously agrees to buy a similar security on a delayed delivery basis. The Portfolio generally transfers MBS where the MBS are “to be announced,” therefore, the Portfolio accounts for these transactions as purchases and sales.
The securities sold in connection with the dollar rolls are removed from the portfolio and a realized gain or loss is recognized. The securities the Portfolio has agreed to acquire are included at market value in the Portfolio of Investments and liabilities for such purchase commitments are included as payables for investments purchased. During the roll period, the Portfolio foregoes principal and interest paid on the securities. The Portfolio is compensated by the difference between the current sales price and the forward price for the future as well as by the earnings on the cash proceeds of the initial sale. Dollar rolls may be renewed without physical delivery of the securities subject to the contract. The Portfolio maintains liquid assets from its portfolio having a value not less than the repurchase price, including accrued interest. Dollar roll transactions involve certain risks, including the risk that the securities returned to the Portfolio at the end of the roll period, while substantially similar, could be inferior to what was initially sold to the counterparty.
The Portfolio accounts for a dollar roll transaction as a purchase and sale whereby the difference in the sales price and purchase price of the security sold is recorded as a realized gain (loss).
(K) Securities Lending. In order to realize additional income, the Portfolio may engage in securities lending, subject to the limitations set forth in the 1940 Act and relevant guidance by the staff of the Securities and Exchange Commission (“SEC”). In the event the Portfolio does engage in securities lending, the Portfolio will lend through its custodian, State Street Bank and Trust Company (“State Street”). State
| | |
| 32 | | MainStay VP Balanced Portfolio |
Street will manage the Portfolio’s collateral in accordance with the lending agreement between the Portfolio and State Street, and indemnify the Portfolio against counterparty risk. The loans will be collateralized by U.S. Treasury securities at least equal at all times to the market value of the securities loaned. The Portfolio may bear the risk of delay in recovery of, or loss of rights in, the securities loaned should the borrower of the securities experience financial difficulty. The Portfolio may also record a realized gain or loss on securities deemed sold due to a borrower’s inability to return securities on loan. The Portfolio bears the risk of any loss on investment of the collateral. The Portfolio will receive compensation for lending its securities in the form of fees or it will retain a portion of interest on the investment of any cash received as collateral. The Portfolio will also continue to receive interest and dividends on the securities loaned and any gain or loss in the market price of the securities loaned that may occur during the term of the loan will be for the account of the Portfolio. During the six-month period ended June 30, 2017, the Portfolio did not have any portfolio securities on loan.
(L) Securities Risk. The ability of issuers of debt securities held by the Fund to meet their obligations may be affected by, among other things, economic or political developments in a specific country, industry or region. Debt securities are also subject to the risks associated with changes in interest rates.
(M) Indemnifications. Under the Fund’s organizational documents, its officers and trustees are indemnified against certain liabilities that may arise out of performance of their duties to the Fund. Additionally, in the normal course of business, the Portfolio enters into contracts with third-party service providers that contain a variety of representations and warranties and which may provide general indemnifications. The Portfolio’s maximum exposure under these arrangements is unknown, as this would involve future claims that may be made against the Portfolio that have not yet occurred. Based on experience, management is of the view that the risk of loss in connection with these potential indemnification obligations is remote. However, there can be no assurance that material liabilities related to such obligations will not arise in the future, which could adversely impact the Portfolio.
(N) Quantitative Disclosure of Derivative Holdings. The following tables show additional disclosures related to the Portfolio’s derivative and hedging activities, including how such activities are accounted for and their effect on the Portfolio’s financial positions, performance and cash flows. The Portfolio entered into futures contracts to help manage the duration and yield curve of the portfolio while minimizing the exposure to wider bid/ask spreads in traditional bonds. These derivatives are not accounted for as hedging instruments.
Fair value of derivative instruments as of June 30, 2017:
Asset Derivatives
| | | | | | | | | | |
| | | Statement of Assets
and Liabilities | | Interest
Rate
Contracts
Risk | | | Total | |
Futures Contracts | | Net Assets—Net unrealized appreciation (depreciation) on investments and futures contracts (a) | | $ | 15,507 | | | $ | 15,507 | |
| | | | | | |
Total Fair Value | | | | $ | 15,507 | | | $ | 15,507 | |
| | | | | | |
Liability Derivatives
| | | | | | | | | | |
| | | Statement of Assets
and Liabilities | | Interest
Rate
Contracts
Risk | | | Total | |
Futures Contracts | | Net Assets—Net unrealized appreciation (depreciation) on investments and futures contracts (a) | | $ | (44,217 | ) | | $ | (44,217 | ) |
| | | | | | |
Total Fair Value | | | | $ | (44,217 | ) | | $ | (44,217 | ) |
| | | | | | |
| (a) | Includes cumulative appreciation (depreciation) of futures contracts as reported in the Portfolio of Investments. Only current day’s variation margin is reported within the Statement of Assets and Liabilities. |
The effect of derivative instruments on the Statement of Operations for the period ended June 30, 2017:
Realized Gain (Loss)
| | | | | | | | | | |
| | | Statement of
Operations
Location | | Interest
Rate
Contracts
Risk | | | Total | |
Futures Contracts | | Net realized gain (loss) on futures transactions | | $ | 144,147 | | | $ | 144,147 | |
| | | | | | |
Total Realized Gain (Loss) | | | | $ | 144,147 | | | $ | 144,147 | |
| | | | | | |
Change in Unrealized Appreciation (Depreciation)
| | | | | | | | | | |
| | | Statement of
Operations
Location | | Interest
Rate
Contracts
Risk | | | Total | |
Futures Contracts | | Net change in unrealized appreciation (depreciation) on futures transactions | | $ | 39,298 | | | $ | 39,298 | |
| | | | | | |
Total Change in Unrealized Appreciation (Depreciation) | | | | $ | 39,298 | | | $ | 39,298 | |
| | | | | | |
Notes to Financial Statements (Unaudited) (continued)
Average Notional Amount
| | | | | | | | | | |
| | | | | Interest
Rate
Contracts
Risk | | | Total | |
Futures Contracts Long | | | | $ | 19,866,417 | | | $ | 19,866,417 | |
Futures Contracts Short | | | | $ | (4,731,146 | ) | | $ | (4,731,146 | ) |
| | | | | | |
Note 3–Fees and Related Party Transactions
(A) Manager and Subadvisors. New York Life Investments, a registered investment adviser and an indirect, wholly-owned subsidiary of New York Life, serves as the Portfolio’s Manager pursuant to an Amended and Restated Management Agreement (“Management Agreement”). The Manager provides offices, conducts clerical, recordkeeping and bookkeeping services, and keeps most of the financial and accounting records required to be maintained by the Portfolio. Except for the portion of salaries and expenses that are the responsibility of the Portfolio, the Manager pays the salaries and expenses of all personnel affiliated with the Portfolio and certain operational expenses of the Portfolio. The Portfolio reimburses the Manager in an amount equal to a portion of the compensation of the Chief Compliance Officer attributable to the Portfolio. Pursuant to the terms of a Subadvisory Agreement with New York Life Investments, Cornerstone Capital Management Holdings LLC (“Cornerstone Holdings” or “Subadvisor”), a registered investment adviser and an indirect, wholly-owned subsidiary of New York Life serves as a Subadvisor and is responsible for the day-to-day portfolio management of the equity portion of the Portfolio. Pursuant to the terms of a Subadvisory Agreement with New York Life Investments, NYL Investors LLC (“NYL Investors” or the “Subadvisor,” and, together with Cornerstone Holdings, the “Subadvisors”), a registered investment adviser and a direct, wholly owned subsidiary of New York Life, serves as a Subadvisor and is responsible for the day-to-day portfolio management of the fixed-income portion of the Portfolio. New York Life Investments pays for the services of the Subadvisors.
The Fund, on behalf of the Portfolio, pays New York Life Investments in its capacity as the Portfolio’s investment manager and administrator, pursuant to the Management Agreement, a monthly fee for services performed and facilities furnished at an annual rate of the Portfolio’s average daily net assets as follows: 0.70% up to $1 billion; 0.65% from $1 billion to $2 billion; and 0.60% in excess of $2 billion. During the six-month period ended June 30, 2017, the effective management fee rate was 0.70%.
During the six-month period ended June 30, 2017, New York Life Investments earned fees from the Portfolio in the amount of $1,469,881.
State Street provides sub-administration and sub-accounting services to the Portfolio pursuant to an agreement with New York Life Investments. These services include calculating the daily NAVs of the Portfolio, maintaining the general ledger and sub-ledger accounts for the calculation of the Portfolio’s NAVs, and assisting New York Life Investments in conducting various aspects of the Portfolio’s administrative operations. For providing these services to the Portfolio, State Street is compensated by New York Life Investments.
(B) Distribution and Service Fees The Fund, on behalf of the Portfolio, has entered into a distribution agreement with NYLIFE Distributors LLC (the “Distributor”), an indirect, wholly-owned subsidiary of New York Life. The Portfolio has adopted a distribution plan (the “Plan”) in accordance with the provisions of Rule 12b-1 under the 1940 Act. Under the Plan, the Distributor has agreed to provide, through its affiliates or independent third parties, various distribution-related, shareholder and administrative support services to the Service Class shareholders. For its services, the Distributor is entitled to a combined distribution and service fee accrued daily and paid monthly at an annual rate of 0.25% of the average daily net assets attributable to the Service Class shares of the Portfolio.
Note 4–Federal Income Tax
During the year ended December 31, 2016, the tax character of distributions paid as reflected in the Statement of Changes in Net Assets was as follows:
| | |
| 2016 |
Tax-Based
Distributions
from Ordinary
Income | | Tax-Based
Distributions
from Long-Term
Gains |
| $4,744,525 | | $13,059,798 |
Note 5–Custodian
State Street is the custodian of cash and securities held by the Portfolio. Custodial fees are charged to the Portfolio based on the Portfolio’s net assets and/or the market value of securities held by the Portfolio and the number of certain transactions incurred by the Portfolio.
Note 6–Line of Credit
The Portfolio and certain other funds managed by New York Life Investments, maintain a line of credit with a syndicate of banks in order to secure a source of funds for temporary purposes to meet unanticipated or excessive redemption requests.
Effective August 1, 2017, under the credit agreement (the “Credit Agreement”), the aggregate commitment amount is $600,000,000 with an additional uncommitted amount of $100,000,000. The commitment fee is an annual rate of 0.15% of the average commitment amount payable quarterly, regardless of usage, to State Street, who serves as the agent to the syndicate. The commitment fee is allocated among the Portfolio and certain other funds managed by New York Life Investments based upon their respective net assets and other factors. Interest on any revolving credit loan is charged based upon the Federal Funds Rate or the one month LIBOR, whichever is higher. The Credit Agreement expires on July 31, 2018, although the Portfolio, certain other funds managed by New York Life Investments and the syndicate of banks may renew the Credit Agreement for an additional year on the same or different terms. Prior to August 1, 2017, the aggregate commitment amount was $600,000,000 with an additional uncommitted amount of $100,000,000, and the commitment fee, under a credit agreement for which Bank of New York Mellon served as agent, was at an annual rate of 0.15% of the average commitment amount. During the six-month period ended June 30, 2017, there were no borrowings made or
| | |
| 34 | | MainStay VP Balanced Portfolio |
outstanding with respect to the Portfolio under the credit agreement for which Bank of New York served as agent.
Note 7–Interfund Lending Program
Pursuant to an exemptive order issued by the SEC, the Portfolio, along with certain other funds managed by New York Life Investments, may participate in an interfund lending program. The interfund lending program provides an alternative credit facility that permits the Portfolio and certain other funds managed by New York Life Investments to lend or borrow money for temporary purposes directly to or from one another, subject to the conditions of the exemptive order. During the six-month period ended June 30, 2017, there were no interfund loans made or outstanding with respect to the Portfolio.
Note 8–Purchases and Sales of Securities (in 000’s)
During the six-month period ended June 30, 2017, purchases and sales of U.S. government securities were $162,542 and $178,679, respectively. Purchases and sales of securities, other than U.S. government securities and short-term securities, were $258,311 and $235,142, respectively.
Note 9–Capital Share Transactions
Transactions in capital shares for the six-month period ended June 30, 2017, and the year ended December 31, 2016, were as follows:
| | | | | | | | |
Initial Class | | Shares | | | Amount | |
Six-month period ended June 30, 2017: | | | | | | | | |
Shares sold | | | 69,111 | | | $ | 1,007,552 | |
Shares redeemed | | | (61,166 | ) | | | (891,464 | ) |
| | | | | | | | |
Net increase (decrease) | | | 7,945 | | | $ | 116,088 | |
| | | | | | | | |
Year ended December 31, 2016: | | | | | | | | |
Shares sold | | | 113,606 | | | $ | 1,594,077 | |
Shares issued to shareholders in reinvestment of dividends and distributions | | | 50,288 | | | | 698,021 | |
Shares redeemed | | | (99,944 | ) | | | (1,390,764 | ) |
| | | | | | | | |
Net increase (decrease) | | | 63,950 | | | $ | 901,334 | |
| | | | | | | | |
| | | | | | | | |
Service Class | | Shares | | | Amount | |
Six-month period ended June 30, 2017: | | | | | | | | |
Shares sold | | | 2,301,753 | | | $ | 33,265,929 | |
Shares redeemed | | | (2,107,606 | ) | | | (30,475,995 | ) |
| | | | | | | | |
Net increase (decrease) | | | 194,147 | | | $ | 2,789,934 | |
| | | | | | | | |
Year ended December 31, 2016: | | | | | | | | |
Shares sold | | | 4,011,892 | | | $ | 55,697,738 | |
Shares issued to shareholders in reinvestment of dividends and distributions | | | 1,242,919 | | | | 17,106,302 | |
Shares redeemed | | | (3,518,186 | ) | | | (48,176,342 | ) |
| | | | | | | | |
Net increase (decrease) | | | 1,736,625 | | | $ | 24,627,698 | |
| | | | | | | | |
Note 10–Recent Accounting Pronouncement
In October 2016, the SEC adopted new rules and amended existing rules (together, “final rules”) intended to modernize the reporting and disclosure of information by registered investment companies. In part, the final rules amend Regulation S-X and require standardized, enhanced disclosure about derivatives in investment company financial statements, as well as other amendments. The compliance date for the amendments to Regulation S-X is August 1, 2017 and applies to shareholder reports for funds with fiscal periods ending after August 1, 2017. Management is currently evaluating the impact that the adoption of the amendments to Regulation S-X will have on the Portfolio’s financial statements and related disclosures.
Note 11–Subsequent Events
In connection with the preparation of the financial statements of the Portfolio as of and for the six-month period ended June 30, 2017, events and transactions subsequent to June 30, 2017, through the date the financial statements were issued have been evaluated by the Portfolio’s management for possible adjustment and/or disclosure. No subsequent events requiring financial statement adjustment or disclosure have been identified.
Proxy Voting Policies and Procedures and Proxy Voting Record
A description of the policies and procedures that New York Life Investments uses to vote proxies related to the Portfolio’s securities is available without charge, upon request, (i) by calling 800-598-2019 or (ii) by visiting the SEC’s website at www.sec.gov.
The Portfolio is required to file with the SEC its proxy voting record for the 12-month period ending June 30 on Form N-PX. The Portfolio’s most recent Form N-PX or proxy voting record is available free of charge upon request (i) by calling 800-598-2019 or; (ii) by visiting the SEC’s website at www.sec.gov.
Shareholder Reports and Quarterly Portfolio Disclosure
The Portfolio is required to file its complete schedule of portfolio holdings with the SEC for its first and third fiscal quarters on Form N-Q. The Portfolio’s Form N-Q is available without charge on the SEC’s website at www.sec.gov or by calling MainStay Investments at 800-598-2019. You also can obtain and review copies of Form N-Q by visiting the SEC’s Public Reference Room in Washington, DC (information on the operation of the Public Reference Room may be obtained by calling 1-800-SEC-0330).
| | |
| 36 | | MainStay VP Balanced Portfolio |
This page intentionally left blank
This page intentionally left blank
MainStay VP Portfolios
MainStay VP offers a wide range of Portfolios. The full array of MainStay VP offerings is listed here, with information about the manager, subadvisors, legal counsel, and independent registered public accounting firm.
Equity Portfolios
MainStay VP Common Stock Portfolio
MainStay VP Cornerstone Growth Portfolio
MainStay VP Eagle Small Cap Growth Portfolio
MainStay VP Emerging Markets Equity Portfolio
MainStay VP Epoch U.S. Equity Yield Portfolio
MainStay VP Epoch U.S. Small Cap Portfolio
MainStay VP International Equity Portfolio
MainStay VP Large Cap Growth Portfolio
MainStay VP MFS® Utilities Portfolio
MainStay VP Mid Cap Core Portfolio
MainStay VP S&P 500 Index Portfolio
MainStay VP Small Cap Core Portfolio
MainStay VP T. Rowe Price Equity Income Portfolio
MainStay VP VanEck Global Hard Assets Portfolio
Mixed Asset Portfolios
MainStay VP Balanced Portfolio
MainStay VP Convertible Portfolio
MainStay VP Cushing Renaissance Advantage Portfolio
MainStay VP Income Builder Portfolio
MainStay VP Janus Henderson Balanced Portfolio
Income Portfolios
MainStay VP Bond Portfolio
MainStay VP Floating Rate Portfolio
MainStay VP Government Portfolio
MainStay VP High Yield Corporate Bond Portfolio
MainStay VP Indexed Bond Portfolio
MainStay VP PIMCO Real Return Portfolio
MainStay VP Unconstrained Bond Portfolio
Money Market
MainStay VP U.S. Government Money Market Portfolio
Alternative
MainStay VP Absolute Return Multi-Strategy Portfolio
Asset Allocation Portfolios
MainStay VP Conservative Allocation Portfolio
MainStay VP Growth Allocation Portfolio
MainStay VP Moderate Allocation Portfolio
MainStay VP Moderate Growth Allocation Portfolio
Manager
New York Life Investment Management LLC
New York, New York
Subadvisors
Candriam Belgium*
Brussels, Belgium
Candriam France S.A.S.*
Paris, France
Cornerstone Capital Management Holdings LLC*
New York, New York
Cushing Asset Management, LP
Dallas, Texas
Eagle Asset Management, Inc.
St Petersburg, Florida
Epoch Investment Partners, Inc.
New York, New York
Janus Capital Management LLC
Denver, Colorado
MacKay Shields LLC*
New York, New York
Massachusetts Financial Services Company
Boston, Massachusetts
NYL Investors LLC*
New York, New York
Pacific Investment Management Company LLC
Newport Beach, California
T. Rowe Price Associates, Inc.
Baltimore, Maryland
Van Eck Associates Corporation
New York, New York
Winslow Capital Management, LLC
Minneapolis, Minnesota
Distributor
NYLIFE Distributors LLC*
Jersey City, New Jersey
Custodian
State Street Bank and Trust Company
Boston, Massachusetts
Independent Registered Public Accounting Firm
PricewaterhouseCoopers LLP
New York, New York
Legal Counsel
Dechert LLP
Washington, District of Columbia
Some Portfolios may not be available in all products.
* An affiliate of New York Life Investment Management LLC
Not part of the Semiannual Report
2017 Semiannual Report
This report is for the general information of New York Life Variable Annuities and NYLIAC Variable Universal Life Insurance Products policyowners. It must be preceded or accompanied by the appropriate product(s) and funds prospectuses if it is given to anyone who is not an owner of a New York Life variable annuity policy or a NYLIAC Variable Universal Life Insurance Product. This report does not offer for sale or solicit orders to purchase securities.
The performance data quoted in this report represents past performance. Past performance is no guarantee of future results. Due to market volatility and other factors, current performance may be lower or higher than the figures shown. The most recent month-end performance summary for your variable annuity or variable life policy is available by calling 800-598-2019 and is updated periodically on www.newyorklife.com.
The New York Life Variable Annuities and NYLIAC Variable Universal Life Insurance Products are issued by New York Life Insurance and Annuity Corporation (a Delaware Corporation) and distributed by NYLIFE Distributors LLC (Member FINRA/SIPC).
New York Life Insurance Company
New York Life Insurance and Annuity Corporation (NYLIAC) (A Delaware Corporation)
51 Madison Avenue, Room 551
New York, NY 10010
www.newyorklife.com
Printed on recycled paper
mainstayinvestments.com
NYLIFE Distributors LLC, 30 Hudson Street, Jersey City, NJ 07302
New York Life Investment Management LLC is the investment manager to the MainStay VP Funds Trust
©2017 by NYLIFE Distributors LLC. All rights reserved.
You may obtain copies of the Prospectus and the Statement of Additional Information free of charge, upon request, by calling toll-free 800-598-2019 or writing to New York Life Insurance and Annuity Corporation, 51 Madison Avenue, New York, NY 10010.
| | | | |
| Not FDIC Insured | | No Bank Guarantee | | May Lose Value |
| | | | |
1744154 | | | | MSVPBL10-08/17 (NYLIAC) NI508 |
MainStay VP Floating Rate Portfolio
Message from the President and Semiannual Report
Unaudited | June 30, 2017

Sign up for electronic delivery of your shareholder reports. For full details on electronic delivery, including who can participate and what you
can receive via eDelivery, please log on to www.newyorklife.com/vsc

This page intentionally left blank
Message from the President
The six months ended June 30, 2017, brought positive results to many stock and bond investors. The year began with many investors hoping that Republican control of the White House, the Senate and the House of Representatives could bring an end to political gridlock; and while debate has continued on a number of issues, the U.S. stock market climbed relatively steadily throughout the first half of 2017.
According to FTSE-Russell U.S. market data, stocks at all capitalization levels tended to record positive total returns during the reporting period, with large-cap stocks generally outperforming stocks of smaller-capitalization companies. Growth stocks outpaced value stocks at every capitalization level by substantial margins—from more than six percentage points for micro-caps and mid-caps to more than 10 percentage points for the largest 200 U.S. companies by market capitalization.
Most sectors of the stock market advanced during the reporting period, with energy and telecommunication services being notable exceptions. Energy stocks declined as oil prices fell despite moves by the Organization of Petroleum Exporting Countries (OPEC) intended to limit oil production by its members. Telecommunication services stocks tended to decline as competition increased and rising interest rates made dividend payouts less appealing.
In March and June of 2017, the Federal Reserve announced successive increases in the target range for the federal funds rate, ultimately bringing the federal funds target range to 1.00% to 1.25%. While short-term U.S. Treasury yields rose in response, yields for U.S. Treasury securities with maturities of five years or longer declined. As the difference between short- and long-term yields narrowed, the advantages of higher-yielding long-term bonds became increasingly apparent.
Virtually all taxable and tax-exempt bond sectors provided positive total returns during the reporting period. Mortgage-backed
securities, though providing positive total returns, faced headwinds when the Federal Reserve announced plans to begin normalizing its balance sheet by reducing reinvestment of principal payments on mortgage-backed securities.
International stock and bond markets were also strong during the reporting period. International stocks provided double-digit total returns that were surpassed by emerging-market stocks as a whole. Global investment-grade bonds provided single-digit returns; and emerging-market debt was somewhat stronger.
Even during periods of favorable market performance and generally positive returns, MainStay believes that it is important to carefully monitor your investments. Your risk tolerance may
change over time, leading you to reevaluate which MainStay VP Portfolios are most appropriate for your long-term goals. Your goals themselves may also change, leading you to pursue investments with more or less risk. The portfolio managers of MainStay VP Portfolios seek to provide results consistent with the investment objectives of their respective Portfolios, to give you a wide range of choices suitable to various investment needs.
The report that follows provides more detailed information about the specific markets, securities and investment decisions that influenced your MainStay VP Portfolio during the six months ended June 30, 2017. We invite you to review the report carefully as part of your ongoing investment evaluation and review.
Sincerely,

Stephen P. Fisher
President
The opinions expressed are as of the date of the accompanying report and are subject to change. Past performance is no guarantee of future results. There is no guarantee that any forecasts made will come to pass. This material does not constitute investment advice and is not intended as an endorsement of any specific investment.
Not all MainStay VP Portfolios and/or share classes are available under all policies.
Not part of the Semiannual Report
Table of Contents
Investors should refer to the Portfolio’s Summary Prospectus and/or Prospectus and consider the Portfolio’s investment objectives, strategies, risks, charges and expenses carefully before investing. The Summary Prospectus and/or Prospectus contain this and other information about the Portfolio. You may obtain copies of the Portfolio’s Summary Prospectus and/or the Prospectus and the Statement of Additional Information free of charge, upon request, by calling toll-free 800-598-2019, by writing to New York Life Insurance and Annuity Corporation, 51 Madison Avenue, Room 251, New York, New York 10010 or by sending an email to MainStayShareholdersServices@nylim.com. These documents are also available at mainstayinvestments.com/vpdocuments. Please read the Summary Prospectus and/or Prospectus carefully before investing. MainStay VP Funds Trust portfolios are separate account options which are purchased through a variable insurance or variable annuity contract.
Investment and Performance Comparison (Unaudited)
Performance data quoted represents past performance. Past performance is no guarantee of future results. Because of market volatility and other factors, current performance may be lower or higher than the figures shown. Investment return and principal value will fluctuate, and as a result, when shares are redeemed, they may be worth more or less than their original cost. The performance table and graph do not reflect any deduction of sales charges, mortality and expense charges, contract charges or administrative charges. Please refer to the Performance Summary appropriate for your policy. For performance information current to the most recent month-end, please call 800-598-2019 or visit www.newyorklife.com.
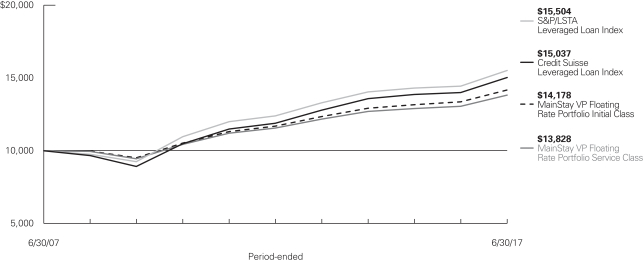
Average Annual Total Returns for the Period Ended June 30, 2017
| | | | | | | | | | | | | | | | | | | | | | | | |
| Class | | Inception
Date | | | Six Months | | | One Year | | | Five Years | | | Ten Years | | | Gross
Expense
Ratio1 | |
| Initial Class Shares | | | 5/2/2005 | | | | 1.74 | % | | | 6.18 | % | | | 3.93 | % | | | 3.54 | % | | | 0.66 | % |
| Service Class Shares | | | 5/2/2005 | | | | 1.62 | | | | 5.92 | | | | 3.67 | | | | 3.29 | | | | 0.91 | |
| | | | | | | | | | | | | | | | |
| Benchmark Performance | | Six
Months | | | One
Year | | | Five
Years | | | Ten
Years | |
S&P/LSTA Leveraged Loan Index2 | | | 1.91 | % | | | 7.42 | % | | | 4.58 | % | | | 4.48 | % |
Credit Suisse Leveraged Loan Index3 | | | 1.96 | | | | 7.49 | | | | 4.83 | | | | 4.16 | |
Average Lipper Loan Participation Fund4 | | | 1.56 | | | | 6.62 | | | | 3.84 | | | | 3.15 | |
| 1. | The gross expense ratios presented reflect the Portfolio’s “Total Annual Portfolio Operating Expenses” from the most recent Prospectus and may differ from other expense ratios disclosed in this report. |
| 2. | The S&P/LSTA Leveraged Loan Index is the Portfolio’s primary broad-based securities market index for comparison purposes. The S&P/LSTA Leveraged Loan Index is a broad-based index designed to reflect the performance of U.S. dollar facilities in the leveraged loan market. Results assume reinvestment of all dividends and capital gains. An investment cannot be made directly in an index. |
| 3. | The Credit Suisse Leveraged Loan Index is the Portfolio’s secondary benchmark. The Credit Suisse Leveraged Loan Index represents tradable, |
| | senior-secured, U.S. dollar denominated non-investment-grade loans. Results assume reinvestment of all dividends and capital gains. An investment cannot be made directly in an index. |
| 4. | The Average Lipper Loan Participation Fund is representative of funds that invest primarily in participation interests in collateralized senior corporate loans that have floating or variable rates. The benchmark is a product of Lipper Inc. Lipper Inc. is an independent monitor of fund performance. Results are based on average total returns of similar portfolios with all dividend and capital gain distributions reinvested. |
Cost in Dollars of a $1,000 Investment in MainStay VP Floating Rate Portfolio (Unaudited)
The example below is intended to describe the fees and expenses borne by shareholders during the six-month period from January 1, 2017 to June 30, 2017, and the impact of those costs on your investment.
Example
As a shareholder of the Portfolio, you incur two types of costs: (1) transaction costs, including exchange fees and sales charges (loads) on purchases (as applicable), and (2) ongoing costs, including management fees, distribution and/or service (12b-1) fees, and other Portfolio expenses (as applicable). This example is intended to help you understand your ongoing costs (in dollars) of investing in the Portfolio and to compare these costs with the ongoing costs of investing in other mutual funds. The example is based on an investment of $1,000 made at the beginning of the six-month period and held for the entire period from January 1, 2017 to June 30, 2017. Shares are only sold in connection with variable life and annuity contracts and the example does not reflect any contract level or transactional fees or expenses. If these costs had been included, your costs would have been higher.
This example illustrates your Portfolio’s ongoing costs in two ways:
Actual Expenses
The second and third data columns in the table below provide information about actual account values and actual expenses. You may use the information in these columns, together with the amount you invested, to estimate the expenses that you paid during the six months ended June 30, 2017. Simply divide your account value by $1,000
(for example, an $8,600 account value divided by $1,000 = 8.6), then multiply the result by the number under the heading entitled “Expenses Paid During Period” to estimate the expenses you paid on your account during this period.
Hypothetical Example for Comparison Purposes
The fourth and fifth data columns in the table below provide information about hypothetical account values and hypothetical expenses based on the Portfolio’s actual expense ratio and an assumed rate of return of 5% per year before expenses, which is not the Portfolio’s actual return. The hypothetical account values and expenses may not be used to estimate the actual ending account balances or expenses you paid for the six-month period shown. You may use this information to compare the ongoing costs of investing in the Portfolio with the ongoing costs of investing in other mutual funds. To do so, compare this 5% hypothetical example with the 5% hypothetical examples that appear in the shareholder reports of the other mutual funds.
Please note that the expenses shown in the table are meant to highlight your ongoing costs only and do not reflect any transactional costs, such as exchange fees or sales charges (loads). Therefore, the fourth and fifth data columns of the table are useful in comparing ongoing costs only and will not help you determine the relative total costs of owning different funds. In addition, if these transactional costs were included, your costs would have been higher.
| | | | | | | | | | | | | | | | | | | | | | | | |
| | | | | | | | | | | | | | | | | | | |
| Share Class | | Beginning
Account
Value
1/1/17 | | | Ending Account
Value (Based
on Actual
Returns and
Expenses)
6/30/17 | | | Expenses
Paid
During
Period1 | | | Ending Account
Value (Based
on Hypothetical
5% Annualized
Return and
Actual Expenses)
6/30/17 | | | Expenses
Paid
During
Period1 | | | Net Expense
Ratio
During
Period2 | |
| | | | | | |
| Initial Class Shares | | $ | 1,000.00 | | | $ | 1,017.40 | | | $ | 3.20 | | | $ | 1,021.60 | | | $ | 3.21 | | | | 0.64 | % |
| | | | | | |
| Service Class Shares | | $ | 1,000.00 | | | $ | 1,016.20 | | | $ | 4.45 | | | $ | 1,020.40 | | | $ | 4.46 | | | | 0.89 | % |
| 1. | Expenses are equal to the Portfolio’s annualized expense ratio of each class multiplied by the average account value over the period, divided by 365 and multiplied by 181 (to reflect the six-month period). The table above represents the actual expenses incurred during the six-month period. |
| 2. | Expenses are equal to the Portfolio’s annualized expense ratio to reflect the six-month period. |
| | |
| 6 | | MainStay VP Floating Rate Portfolio |
Industry Composition as of June 30, 2017 (Unaudited)
| | | | |
| Electronics | | | 11.8 | % |
| Healthcare, Education & Childcare | | | 9.9 | |
| Hotels, Motels, Inns & Gaming | | | 6.7 | |
| Chemicals, Plastics & Rubber | | | 6.1 | |
| Diversified/Conglomerate Service | | | 5.9 | |
| Retail Store | | | 5.7 | |
| Containers, Packaging & Glass | | | 4.9 | |
| Leisure, Amusement, Motion Pictures & Entertainment | | | 4.6 | |
| Broadcasting & Entertainment | | | 4.5 | |
| Utilities | | | 4.4 | |
| Telecommunications | | | 4.0 | |
| Beverage, Food & Tobacco | | | 3.4 | |
| Buildings & Real Estate | | | 3.2 | |
| Insurance | | | 3.0 | |
| Machinery (Non-Agriculture, Non-Construct & Non-Electronic) | | | 2.5 | |
| Automobile | | | 2.4 | |
| Diversified/Conglomerate Manufacturing | | | 2.4 | |
| Oil & Gas | | | 2.2 | |
Personal & Nondurable Consumer Products (Manufacturing Only) | | | 2.0 | |
| | | | |
| Finance | | | 1.7 | % |
| Personal, Food & Miscellaneous Services | | | 1.7 | |
| Mining, Steel, Iron & Non-Precious Metals | | | 1.4 | |
| Printing & Publishing | | | 1.4 | |
| Aerospace & Defense | | | 1.3 | |
| Banking | | | 1.0 | |
| Affiliated Investment Companies | | | 0.9 | |
| Ecological | | | 0.8 | |
Home and Office Furnishings, Housewares & Durable Consumer Products | | | 0.5 | |
| Commercial Services | | | 0.4 | |
| Media | | | 0.4 | |
| Cargo Transport | | | 0.1 | |
| Auto Manufacturers | | | 0.1 | |
| Short-Term Investments | | | 3.1 | |
| Other Assets, Less Liabilities | | | –4.4 | |
| | | | |
| | | 100.0 | % |
| | | | |
See Portfolio of Investments beginning on page 10 for specific holdings within these categories.
Top Ten Holdings or Issuers Held as of June 30, 2017 (excluding short-term investments) (Unaudited)
| 1. | Univision Communications, Inc., 3.976%, due 3/15/24 |
| 2. | Valeant Pharmaceuticals International, Inc., 5.830%–6.500%, due 3/15/22–4/1/22 |
| 3. | Energy Future Intermediate Holding Co. LLC, TBD, due 6/23/18 |
| 4. | Party City Holdings, Inc., 4.188%, due 8/19/22 |
| 5. | MGM Growth Properties Operating Partnership L.P., 3.476%, due 4/25/23 |
| 6. | Michaels Stores, Inc., 3.938%, due 1/30/23 |
| 7. | Capital Automotive, L.P., 4.220%–7.220%, due 3/24/24–3/24/25 |
| 8. | First Data Corp., 3.466%–3.716%, due 7/8/22–4/26/24 |
| 9. | MainStay High Yield Corporate Bond Fund Class I |
| 10. | Rexnord LLC, 3.971%, due 8/21/23 |
Portfolio Management Discussion and Analysis (Unaudited)
Answers to the questions reflect the views of portfolio managers Robert H. Dial, Mark A. Campellone and Arthur S. Torrey of NYL Investors LLC, the Portfolio’s Subadvisor.
How did MainStay VP Floating Rate Portfolio perform relative to its benchmarks and peers for the six months ended June 30, 2017?
For the six months ended June 30, 2017, MainStay VP Floating Rate Portfolio returned 1.74% for Initial Class shares and 1.62% for Service Class shares. Over the same period, both share classes underperformed the 1.91% return of the S&P/LSTA Leveraged Loan Index,1 which is the Portfolio’s primary benchmark, and the 1.96% return of the Credit Suisse Leveraged Loan Index,1 which is the Portfolio’s secondary benchmark. Both share classes outperformed the 1.56% return of the Average Lipper2 Loan Participation Fund for the six months ended June 30, 2017.
What factors affected the Portfolio’s relative performance during the reporting period?
The Portfolio’s performance relative to the S&P/LSTA Leveraged Loan Index was hurt by an underweight position in credits rated CCC3 and unrated credits. On the other hand, the Portfolio’s relative performance benefited from overweight positions in credits rated BB and credits rated B.4
On an industry basis, security selection among investments in out-of-index sectors—utilities, retail and building products—provided the greatest positive contributions to the Portfolio’s relative performance during the reporting period. (Contributions take weightings and total returns into account.) Security selection in nonferrous metals & mining, financials, and aerospace, on the other hand, detracted from relative performance. Excess cash balances also were a drag on relative performance during the reporting period.
What was the Portfolio’s duration5 strategy during the reporting period?
The Portfolio invested in floating-rate loans that had a weighted average effective duration of less than three months. Floating-rate loans mature, on average, in five to seven years, but loan maturity can be as long as nine years. The underlying interest-rate contracts of the Portfolio’s loans, which are typically pegged to LIBOR,6 reset every 30, 60, 90 or 180 days. As of June 30, 2017, the Portfolio’s weighted average days to LIBOR reset was 43 days, which we considered to be a short duration.
Since reset dates may vary for different loans, the actual period between a shift in interest rates and the time when the Portfolio would “catch up” may differ.
What specific factors, risks or market forces prompted significant decisions for the Portfolio during the reporting period?
During the reporting period, riskier assets continued to materially outperform other segments of the loan market. In response, we modified the Portfolio’s risk exposure by reducing the Portfolio’s weighting in credits rated BB and increasing exposure to credits rated B and, to a lesser extent, to credits rated CCC.
During the reporting period, which market segments were the strongest positive contributors to the Portfolio’s performance and which market segments were particularly weak?
Although CCC-rated credits provided the highest total returns during the reporting period, the Portfolio held an underweight position in this category, which detracted from relative performance. The most substantial positive contributions to performance during the reporting period came from the Portfolio’s overweight position in credits rated BB and from its overweight position in credits rated B. On a sector basis, security selection was strong in utilities, retail and building products, but security selection was weak in nonferrous metals & mining, financials, and aerospace.
How did the Portfolio’s sector weightings change during the reporting period?
During the reporting period, the Portfolio reduced its exposure to credits rated BB and increased its exposure to lower-rated credits.
How was the Portfolio positioned at the end of the reporting period?
As of June 30, 2017, the Portfolio was overweight relative to the S&P/LSTA Leveraged Loan Index in credits rated BB and in
credits rated B. As of the same date, the Portfolio was overweight relative to the Index in cash, primarily because unlike
| 1. | See footnote on page 5 for more information on this index. |
| 2. | See footnote on page 5 for more information on Lipper Inc. |
| 3. | An obligation rated ‘CCC’ by Standard & Poor’s (“S&P”) is deemed by S&P to be currently vulnerable to nonpayment and is dependent upon favorable business, financial and economic conditions for the obligor to meet its financial commitment on the obligation. It is the opinion of S&P that in the event of adverse business, financial or economic conditions, the obligor is not likely to have the capacity to meet its financial commitment on the obligation. When applied to portfolio holdings, ratings are based solely on the creditworthiness of the bonds in the portfolio and are not meant to represent the security or safety of the Portfolio. |
| 4. | An obligation rated ‘BB’ by S&P is deemed by S&P to be less vulnerable to nonpayment than other speculative issues. In the opinion of S&P, however, the obligor faces major ongoing uncertainties or exposure to adverse business, financial or economic conditions which could lead to the obligor’s inadequate capacity to meet its financial commitment on the obligation. An obligation rated ‘B’ by S&P is deemed by S&P to be more vulnerable to nonpayment than obligations rated ‘BB’, but in the opinion of S&P, the obligor currently has the capacity to meet its financial commitment on the obligation. It is the opinion of S&P that adverse business, financial, or economic conditions will likely impair the obligor’s capacity or willingness to meet its financial commitment on the obligation. When applied to portfolio holdings, ratings are based solely on the creditworthiness of the bonds in the portfolio and are not meant to represent the security or safety of the Portfolio. |
| 5. | Duration is a measure of the price sensitivity of a fixed-income investment to changes in interest rates. Duration is expressed as a number of years and is considered a more accurate sensitivity gauge than average maturity. |
| 6. | The London InterBank Offered Rate (LIBOR) is a composite of interest rates at which banks borrow from one another in the London market, and it is a widely used benchmark for short-term interest rates. |
| | |
| 8 | | MainStay VP Floating Rate Portfolio |
the Portfolio, the S&P/LSTA Leveraged Loan Index has no cash component. As of June 30, 2017, the Portfolio remained underweight relative to the Index in credits rated CCC and lower and in unrated credits.
As of June 30, 2017, the Portfolio’s top five market-value weighted industry exposures relative to the S&P/LSTA Leveraged Loan Index were in electronics (underweight), business equipment/services (underweight), health care (underweight), hotels & casinos (overweight) and chemicals (overweight).
The opinions expressed are those of the portfolio managers as of the date of this report and are subject to change. There is no guarantee that any forecasts made will come to pass. This material does not constitute investment advice and is not intended as an endorsement of any specific investment.
Not all MainStay VP Portfolios and/or share classes are available under all policies.
Portfolio of Investments June 30, 2017 (Unaudited)
| | | | | | | | |
| | | Principal
Amount | | | Value | |
| | | | | | | | |
Long-Term Bonds 100.3%† Corporate Bonds 2.6% | | | | | | | | |
Auto Manufacturers 0.1% | | | | | | | | |
Cooper-Standard Automotive, Inc.
5.625%, due 11/15/26 (a) | | $ | 400,000 | | | $ | 401,500 | |
| | | | | | | | |
|
Automobile 0.1% | |
Goodyear Tire & Rubber Co.
4.875%, due 3/15/27 | | | 750,000 | | | | 761,250 | |
| | | | | | | | |
|
Cargo Transport 0.1% | |
Park Aerospace Holdings, Ltd.
5.250%, due 8/15/22 (a) | | | 500,000 | | | | 522,660 | |
| | | | | | | | |
|
Chemicals, Plastics & Rubber 0.4% | |
Alpha 3 B.V. / Alpha U.S. Bidco, Inc.
6.250%, due 2/1/25 (a) | | | 400,000 | | | | 411,500 | |
Koppers, Inc.
6.000%, due 2/15/25 (a) | | | 500,000 | | | | 531,250 | |
Platform Specialty Products Corp.
6.500%, due 2/1/22 (a) | | | 1,500,000 | | | | 1,548,750 | |
Versum Materials, Inc.
5.500%, due 9/30/24 (a) | | | 1,050,000 | | | | 1,103,812 | |
| | | | | | | | |
| | | | | | | 3,595,312 | |
| | | | | | | | |
Commercial Services 0.3% | |
Hertz Corp.
7.625%, due 6/1/22 (a) | | | 2,000,000 | | | | 1,995,200 | |
KAR Auction Services, Inc.
5.125%, due 6/1/25 (a) | | | 350,000 | | | | 356,562 | |
| | | | | | | | |
| | | | | | | 2,351,762 | |
| | | | | | | | |
Containers, Packaging & Glass 0.2% | |
ARD Finance S.A.
7.125% (7.875% PIK), due 9/15/23 (b) | | | 670,000 | | | | 715,158 | |
Ardagh Packaging Finance PLC / Ardagh Holdings USA, Inc.
7.250%, due 5/15/24 (a) | | | 600,000 | | | | 656,250 | |
Greif, Inc.
7.750%, due 8/1/19 | | | 650,000 | | | | 711,750 | |
| | | | | | | | |
| | | | | | | 2,083,158 | |
| | | | | | | | |
Diversified/Conglomerate Manufacturing 0.2% | |
Acco Brands Corp.
5.250%, due 12/15/24 (a) | | | 1,880,000 | | | | 1,952,850 | |
Scotts Miracle-Gro Co.
5.250%, due 12/15/26 | | | 200,000 | | | | 209,500 | |
| | | | | | | | |
| | | | | | | 2,162,350 | |
| | | | | | | | |
| | | | | | | | |
| | | Principal
Amount | | | Value | |
| | | | | | | | |
Ecological 0.1% | |
Advanced Disposal Services, Inc.
5.625%, due 11/15/24 (a) | | $ | 800,000 | | | $ | 824,000 | |
| | | | | | | | |
|
Healthcare, Education & Childcare 0.1% | |
MPH Acquisition Holdings LLC
7.125%, due 6/1/24 (a) | | | 170,000 | | | | 181,263 | |
¨Valeant Pharmaceuticals International, Inc.
6.500%, due 3/15/22 (a) | | | 1,000,000 | | | | 1,048,750 | |
| | | | | | | | |
| | | | | | | 1,230,013 | |
| | | | | | | | |
Hotels, Motels, Inns & Gaming 0.1% | |
Pinnacle Entertainment, Inc.
5.625%, due 5/1/24 (a) | | | 1,250,000 | | | | 1,300,000 | |
| | | | | | | | |
|
Media 0.4% | |
E.W. Scripps Co.
5.125%, due 5/15/25 (a) | | | 500,000 | | | | 515,000 | |
Salem Media Group, Inc.
6.750%, due 6/1/24 (a) | | | 600,000 | | | | 613,500 | |
SFR Group S.A.
6.000%, due 5/15/22 (a) | | | 2,000,000 | | | | 2,092,500 | |
| | | | | | | | |
| | | | | | | 3,221,000 | |
| | | | | | | | |
Mining, Steel, Iron & Non-Precious Metals 0.0%‡ | |
FMG Resources (August 2006) Pty, Ltd.
9.750%, due 3/1/22 (a) | | | 170,000 | | | | 193,588 | |
| | | | | | | | |
|
Oil & Gas 0.1% | |
EP Energy LLC / Everest Acquistion Finance, Inc.
8.000%, due 2/15/25 (a) | | | 200,000 | | | | 149,000 | |
FTS International, Inc.
8.746%, due 6/15/20 (a)(c) | | | 830,000 | | | | 832,075 | |
| | | | | | | | |
| | | | | | | 981,075 | |
| | | | | | | | |
Retail Store 0.0%‡ | |
PetSmart, Inc.
5.875%, due 6/1/25 (a) | | | 200,000 | | | | 192,750 | |
| | | | | | | | |
|
Utilities 0.4% | |
Dynegy, Inc. | |
7.375%, due 11/1/22 | | | 1,000,000 | | | | 987,500 | |
7.625%, due 11/1/24 | | | 1,500,000 | | | | 1,455,000 | |
NRG Energy, Inc.
7.250%, due 5/15/26 | | | 1,300,000 | | | | 1,345,500 | |
| | | | | | | | |
| | | | | | | 3,788,000 | |
| | | | | | | | |
Total Corporate Bonds
(Cost $22,952,172) | | | | | | | 23,608,418 | |
| | | | | | | | |
| † | Percentages indicated are based on Portfolio net assets. |
| ¨ | | Among the Portfolio’s 10 largest Holdings or issuers held, as of June 30, 2017, excluding short-term investments. May be subject to change daily. |
| | | | |
| 10 | | MainStay VP Floating Rate Portfolio | | The notes to the financial statements are an integral part of,
and should be read in conjunction with, the financial statements. |
| | | | | | | | |
| | | Principal
Amount | | | Value | |
| | | | | | | | |
| Floating Rate Loans 87.1% (d) | |
Aerospace & Defense 1.1% | |
American Airlines, Inc.
2016 USD Term Loan B
3.659%, due 12/14/23 | | $ | 1,803,808 | | | $ | 1,803,808 | |
DAE Aviation Holdings, Inc.
1st Lien Term Loan
4.980%, due 7/7/22 | | | 3,389,625 | | | | 3,403,184 | |
Engility Corp.
Term Loan B2
4.976%, due 8/12/23 | | | 851,471 | | | | 858,921 | |
TransDigm, Inc.
2016 Extended Term Loan F
4.226%, due 6/9/23 | | | 3,733,840 | | | | 3,728,008 | |
| | | | | | | | |
| | | | | | | 9,793,921 | |
| | | | | | | | |
Automobile 2.3% | |
American Axle and Manufacturing, Inc.
Term Loan B
3.470%, due 4/6/24 | | | 4,455,000 | | | | 4,424,929 | |
AP Exhaust Acquisition LLC
1st Lien Term Loan
6.180%, due 5/10/24 | | | 2,500,000 | | | | 2,450,000 | |
CH Hold Corp.
1st Lien Term Loan
4.226%, due 2/1/24 | | | 1,795,500 | | | | 1,799,989 | |
Federal-Mogul Holdings Corp.
New Term Loan C
4.927%, due 4/15/21 | | | 2,482,881 | | | | 2,489,088 | |
KAR Auction Services, Inc.
Term Loan B5
3.813%, due 3/9/23 | | | 2,333,333 | | | | 2,345,000 | |
Tower Automotive Holdings USA LLC
2017 Term Loan B
3.875%, due 3/7/24 | | | 2,794,646 | | | | 2,792,318 | |
Truck Hero, Inc.
1st Lien Term Loan
5.156%, due 4/21/24 | | | 3,033,333 | | | | 3,006,792 | |
U.S. Farathane LLC
Reprice Term Loan
5.296%, due 12/23/21 | | | 1,454,756 | | | | 1,465,667 | |
| | | | | | | | |
| | | | 20,773,783 | |
| | | | | | | | |
Banking 1.0% | |
¨Capital Automotive, L.P. | |
2017 1st Lien Term Loan
4.220%, due 3/24/24 | | | 4,950,000 | | | | 4,984,031 | |
2017 2nd Lien Term Loan
7.220%, due 3/24/25 | | | 3,000,000 | | | | 3,035,001 | |
Russell Investment Group
Term Loan B
TBD, due 6/1/23 | | | 1,000,000 | | | | 1,010,000 | |
| | | | | | | | |
| | | | 9,029,032 | |
| | | | | | | | |
| | | | | | | | |
| | | Principal
Amount | | | Value | |
| | | | | | | | |
Beverage, Food & Tobacco 3.0% | |
Acosta Holdco, Inc.
2015 Term Loan
4.476%, due 9/26/21 | | $ | 2,180,949 | | | $ | 1,958,594 | |
Advantage Sales & Marketing, Inc. | |
Incremental Term Loan B
4.420%, due 7/25/21 | | | 1,000,000 | | | | 959,500 | |
2014 1st Lien Term Loan
4.546%, due 7/23/21 | | | 4,368,845 | | | | 4,191,907 | |
2014 2nd Lien Term Loan
7.796%, due 7/25/22 | | | 625,000 | | | | 596,875 | |
Albertsons LLC | |
USD 2017 Term Loan B4
3.976%, due 8/25/21 | | | 3,442,133 | | | | 3,396,418 | |
USD 2017 Term Loan B6
4.251%, due 6/22/23 | | | 2,718,990 | | | | 2,685,854 | |
Arctic Glacier U.S.A., Inc.
2017 Term Loan B
5.476%, due 3/20/24 | | | 1,795,500 | | | | 1,811,211 | |
ASP MSG Acquisition Co., Inc.
2017 Term Loan B
5.296%, due 8/16/23 | | | 2,233,125 | | | | 2,245,686 | |
B&G Foods, Inc.
2017 Term Loan B
3.476%, due 11/2/22 | | | 746,795 | | | | 749,862 | |
Chobani LLC
1st Lien Term Loan
5.476%, due 10/7/23 | | | 997,494 | | | | 1,002,481 | |
Crossmark Holdings, Inc. (e) | |
1st Lien Term Loan
4.796%, due 12/20/19 | | | 108,135 | | | | 75,334 | |
2nd Lien Term Loan
8.796%, due 12/21/20 | | | 800,000 | | | | 354,000 | |
Hostess Brands LLC
2017 Term Loan
3.726%, due 8/3/22 | | | 2,476,256 | | | | 2,485,027 | |
JBS USA LLC
2017 Term Loan B
5.750%, due 10/30/22 | | | 1,995,000 | | | | 1,937,644 | |
Post Holdings, Inc.
2017 Series A Incremental Term Loan
3.470%, due 5/24/24 | | | 1,000,000 | | | | 1,000,781 | |
U.S. Foods, Inc.
2016 Term Loan B
3.980%, due 6/27/23 | | | 2,471,192 | | | | 2,479,923 | |
| | | | | | | | |
| | | | 27,931,097 | |
| | | | | | | | |
Broadcasting & Entertainment 3.7% | |
CBS Radio Inc.
Term Loan B
4.716%, due 10/17/23 | | | 1,801,321 | | | | 1,812,017 | |
| | | | | | |
The notes to the financial statements are an integral part of,
and should be read in conjunction with, the financial statements. | | | | | 11 | |
Portfolio of Investments June 30, 2017 (Unaudited) (continued)
| | | | | | | | |
| | | Principal
Amount | | | Value | |
| | | | | | | | |
| Floating Rate Loans (continued) | |
Broadcasting & Entertainment (continued) | |
Charter Communications Operating LLC
2016 Term Loan I Add
3.480%, due 1/15/24 | | $ | 2,750,893 | | | $ | 2,760,061 | |
Cumulus Media Holdings, Inc.
2013 Term Loan
4.480%, due 12/23/20 | | | 2,027,594 | | | | 1,629,172 | |
Entercom Radio, LLC
2016 Term Loan
4.703%, due 11/1/23 | | | 1,821,591 | | | | 1,827,056 | |
Global Eagle Entertainment, Inc.
1st Lien Term Loan
8.322%, due 1/6/23 | | | 894,375 | | | | 778,106 | |
iHeartCommunications, Inc.
Term Loan D
7.976%, due 1/30/19 | | | 1,750,000 | | | | 1,422,750 | |
Mission Broadcasting, Inc.
2016 Term Loan B2
4.246%, due 1/17/24 | | | 170,000 | | | | 170,266 | |
Nexstar Broadcasting, Inc.
2017 Term Loan B
4.238%, due 1/17/24 | | | 1,703,059 | | | | 1,705,721 | |
Tribune Media Co. | |
Term Loan
4.226%, due 12/27/20 | | | 220,315 | | | | 220,728 | |
Term Loan C
4.226%, due 1/27/24 | | | 3,544,630 | | | | 3,565,678 | |
¨Univision Communications, Inc.
Term Loan C5
3.976%, due 3/15/24 | | | 10,363,925 | | | | 10,167,010 | |
VFH Parent LLC
2017 Term Loan
TBD, due 10/15/21 | | | 1,000,000 | | | | 1,005,417 | |
Virgin Media Bristol LLC
USD Term Loan I
3.909%, due 1/31/25 | | | 5,000,000 | | | | 5,000,000 | |
WideOpenWest Finance LLC
2016 Term Loan B
4.702%, due 8/18/23 | | | 1,985,000 | | | | 1,984,007 | |
| | | | | | | | |
| | | | | | | 34,047,989 | |
| | | | | | | | |
Buildings & Real Estate 3.2% | |
DTZ U.S. Borrower LLC
2015 1st Lien Term Loan
4.447%, due 11/4/21 | | | 3,440,282 | | | | 3,438,992 | |
GYP Holdings III Corp.
2017 Term Loan B
4.142%, due 4/1/23 | | | 1,985,000 | | | | 1,987,481 | |
HD Supply, Inc. | |
Incremental Term Loan B1
4.046%, due 8/13/21 | | | 629,634 | | | | 630,618 | |
Incremental Term Loan B2
4.046%, due 10/17/23 | | | 2,481,250 | | | | 2,491,071 | |
| | | | | | | | |
| | | Principal
Amount | | | Value | |
| | | | | | | | |
Buildings & Real Estate (continued) | |
Jeld-Wen, Inc.
2017 Term Loan B
4.296%, due 7/1/22 | | $ | 2,863,053 | | | $ | 2,885,957 | |
Priso Acquisition Corp.
2017 Term Loan B
4.226%, due 5/8/22 (e) | | | 2,118,625 | | | | 2,114,653 | |
Realogy Corp.
2017 Term Loan B
3.476%, due 7/20/22 | | | 5,922,103 | | | | 5,950,233 | |
SRS Distribution, Inc.
2015 Term Loan B
4.476%, due 8/25/22 | | | 1,488,665 | | | | 1,493,627 | |
VC GB Holdings, Inc.
1st Lien Term Loan
4.976%, due 2/28/24 | | | 2,443,998 | | | | 2,456,218 | |
Wilsonart LLC
2016 Term Loan
4.800%, due 12/19/23 | | | 6,101,374 | | | | 6,116,627 | |
| | | | | | | | |
| | | | | | | 29,565,477 | |
| | | | | | | | |
Chemicals, Plastics & Rubber 5.2% | |
Allnex USA, Inc.
USD Term Loan B3
4.406%, due 9/13/23 | | | 981,837 | | | | 981,837 | |
ASP Chromaflo Intermediate Holdings, Inc.
Term Loan B1
5.226%, due 11/18/23 | | | 216,274 | | | | 216,950 | |
Axalta Coating Systems U.S. Holdings, Inc.
Term Loan
3.296%, due 6/1/24 | | | 4,000,000 | | | | 4,010,500 | |
Colouroz Investment 2 LLC
USD 2nd Lien Term Loan B2
8.403%, due 9/6/22 | | | 378,732 | | | | 369,263 | |
Emerald Performance Materials LLC | |
New 1st Lien Term Loan
4.726%, due 8/1/21 | | | 1,688,830 | | | | 1,698,119 | |
New 2nd Lien Term Loan
8.976%, due 8/1/22 | | | 700,000 | | | | 698,542 | |
Flex Acquisition Co., Inc.
1st Lien Term Loan
4.398%, due 12/29/23 | | | 1,500,000 | | | | 1,505,250 | |
Flint Group U.S. LLC
USD 1st Lien Term Loan B2
4.153%, due 9/7/21 | | | 2,458,486 | | | | 2,433,901 | |
GCP Applied Technologies, Inc.
2016 Term Loan B
4.476%, due 2/3/22 | | | 2,715,625 | | | | 2,722,414 | |
Huntsman International LLC
Term Loan B2
4.121%, due 4/1/23 | | | 1,481,306 | | | | 1,485,935 | |
| | | | |
| 12 | | MainStay VP Floating Rate Portfolio | | The notes to the financial statements are an integral part of,
and should be read in conjunction with, the financial statements. |
| | | | | | | | |
| | | Principal
Amount | | | Value | |
| | | | | | | | |
| Floating Rate Loans (continued) | |
Chemicals, Plastics & Rubber (continued) | |
Ineos U.S. Finance LLC
2022 USD Term Loan
3.976%, due 3/31/22 | | $ | 3,235,889 | | | $ | 3,241,957 | |
KMG Chemicals, Inc.
Term Loan B
5.409%, due 6/15/24 | | | 750,000 | | | | 756,338 | |
Kraton Polymers LLC
2016 Term Loan B
5.226%, due 1/6/22 | | | 519,953 | | | | 524,529 | |
MacDermid, Inc.
USD Term Loan B6
4.226%, due 6/7/23 | | | 3,664,472 | | | | 3,670,581 | |
Nexeo Solutions LLC
2017 Term Loan B
4.973%, due 6/9/23 | | | 3,543,272 | | | | 3,568,741 | |
OXEA Finance LLC
USD Term Loan B2
4.400%, due 1/15/20 | | | 2,470,562 | | | | 2,430,415 | |
PQ Corp.
2016 USD Term Loan
5.476%, due 11/4/22 | | | 1,861,504 | | | | 1,877,939 | |
Solenis International, L.P. | |
USD 1st Lien Term Loan
4.452%, due 7/31/21 | | | 1,361,524 | | | | 1,363,652 | |
USD 2nd Lien Term Loan
7.952%, due 7/31/22 | | | 750,000 | | | | 746,250 | |
Trinseo Materials Operating S.C.A.
Term Loan B
4.476%, due 11/5/21 | | | 3,667,656 | | | | 3,697,456 | |
Univar, Inc.
2017 Term Loan B
3.976%, due 7/1/22 | | | 6,877,938 | | | | 6,880,806 | |
Venator Materials Corp.
Term Loan B
TBD, due 6/20/24 (e) | | | 2,000,000 | | | | 2,007,500 | |
Zep, Inc.
2016 Term Loan
5.226%, due 6/26/22 | | | 1,372,000 | | | | 1,373,715 | |
| | | | | | | | |
| | | | | | | 48,262,590 | |
| | | | | | | | |
Commercial Services 0.1% | |
TRC Companies, Inc.
Term Loan
TBD, due 5/24/24 | | | 900,000 | | | | 904,500 | |
| | | | | | | | |
|
Containers, Packaging & Glass 4.7% | |
Anchor Glass Container Corp. | |
2016 1st Lien Term Loan
4.381%, due 12/7/23 | | | 3,184,000 | | | | 3,199,124 | |
2016 2nd Lien Term Loan
8.810%, due 12/7/24 | | | 500,000 | | | | 507,500 | |
| | | | | | | | |
| | | Principal
Amount | | | Value | |
| | | | | | | | |
Containers, Packaging & Glass (continued) | |
Berlin Packaging LLC
2017 Term Loan B
4.432%, due 10/1/21 | | $ | 1,481,049 | | | $ | 1,483,641 | |
Berry Plastics Group, Inc. | |
Term Loan L
3.367%, due 1/6/21 | | | 4,622,173 | | | | 4,631,561 | |
Term Loan I
3.681%, due 10/1/22 | | | 2,682,982 | | | | 2,683,989 | |
BWAY Holding Co., Inc.
2017 Term Loan B
4.326%, due 4/3/24 | | | 4,000,000 | | | | 3,994,284 | |
Caraustar Industries, Inc.
2017 Term Loan B
6.796%, due 3/14/22 | | | 1,793,702 | | | | 1,794,823 | |
Charter NEX U.S. Holdings, Inc.
2017 Term Loan B
4.476%, due 5/16/24 | | | 3,000,000 | | | | 2,998,749 | |
Consolidated Container Co. LLC
2017 1st Lien Term Loan
4.726%, due 5/22/24 | | | 2,000,000 | | | | 2,010,000 | |
Fort Dearborn Co. | |
2016 1st Lien Term Loan
5.148%, due 10/19/23 | | | 2,487,500 | | | | 2,503,047 | |
2016 2nd Lien Term Loan
9.650%, due 10/19/24 | | | 1,000,000 | | | | 987,500 | |
Klockner-Pentaplast of America, Inc.
USD 2017 Term Loan B2
TBD, due 6/13/24 | | | 2,500,000 | | | | 2,478,125 | |
Rack Merger Sub, Inc.
2nd Lien Term Loan
8.422%, due 10/3/22 | | | 355,556 | | | | 353,778 | |
Ranpak Corp.
2015 Term Loan
4.476%, due 10/1/21 | | | 1,773,395 | | | | 1,773,395 | |
Reynolds Group Holdings, Inc.
2017 Term Loan
4.226%, due 2/5/23 | | | 7,264,619 | | | | 7,277,557 | |
Signode Industrial Group U.S., Inc.
USD Term Loan B
4.007%, due 5/4/21 | | | 3,531,984 | | | | 3,523,153 | |
Tekni-Plex, Inc.
2015 USD Term Loan B
4.726%, due 6/1/22 | | | 1,568,000 | | | | 1,568,000 | |
| | | | | | | | |
| | | | 43,768,226 | |
| | | | | | | | |
Diversified/Conglomerate Manufacturing 1.7% | |
Allied Universal Holdco LLC
2015 Term Loan
5.046%, due 7/28/22 | | | 1,784,658 | | | | 1,786,889 | |
Clark Equipment Co.
2017 Term Loan B
3.929%, due 5/18/24 | | | 2,493,750 | | | | 2,497,648 | |
| | | | | | |
The notes to the financial statements are an integral part of,
and should be read in conjunction with, the financial statements. | | | | | 13 | |
Portfolio of Investments June 30, 2017 (Unaudited) (continued)
| | | | | | | | |
| | | Principal
Amount | | | Value | |
| | | | | | | | |
| Floating Rate Loans (continued) | |
Diversified/Conglomerate Manufacturing (continued) | |
Filtration Group Corp.
1st Lien Term Loan
4.476%, due 11/21/20 | | $ | 3,249,946 | | | $ | 3,269,582 | |
Gardner Denver, Inc.
USD Term Loan
4.546%, due 7/30/20 | | | 1,375,298 | | | | 1,378,048 | |
Hyster-Yale Materials Handling, Inc.
Term Loan B
5.226%, due 5/30/23 | | | 500,000 | | | | 503,437 | |
Mueller Water Products, Inc.
2017 Term Loan B
3.748%, due 11/25/21 | | | 1,511,405 | | | | 1,517,703 | |
North American Lifting Holdings, Inc.
1st Lien Term Loan
5.796%, due 11/27/20 (e) | | | 831,678 | | | | 774,847 | |
Quikrete Holdings, Inc.
2016 1st Lien Term Loan
3.976%, due 11/15/23 | | | 4,145,833 | | | | 4,136,045 | |
| | | | | | | | |
| | | | 15,864,199 | |
| | | | | | | | |
Diversified/Conglomerate Service 5.9% | |
Applied Systems, Inc. | |
New 1st Lien Term Loan
4.546%, due 1/25/21 | | | 2,367,187 | | | | 2,379,515 | |
New 2nd Lien Term Loan
7.796%, due 1/24/22 | | | 1,081,745 | | | | 1,090,309 | |
Brickman Group, Ltd. LLC
1st Lien Term Loan
4.217%, due 12/18/20 | | | 3,393,498 | | | | 3,395,089 | |
CCC Information Services, Inc.
2017 1st Lien Term Loan
4.226%, due 4/27/24 | | | 2,000,000 | | | | 1,993,750 | |
Change Healthcare Holdings, Inc.
2017 Term Loan B
3.976%, due 3/1/24 | | | 2,137,500 | | | | 2,137,166 | |
CompuCom Systems, Inc.
REFI Term Loan B
4.480%, due 5/9/20 (e) | | | 2,017,752 | | | | 1,580,572 | |
¨First Data Corp. | |
2022 USD Term Loan
3.466%, due 7/8/22 | | | 2,198,860 | | | | 2,194,889 | |
2017 Term Loan
3.716%, due 4/26/24 | | | 5,722,760 | | | | 5,719,183 | |
Greeneden U.S. Holdings II LLC
2017 Term Loan B
5.296%, due 12/1/23 | | | 1,492,500 | | | | 1,494,366 | |
Information Resources, Inc.
1st Lien Term Loan
5.466%, due 1/18/24 | | | 685,781 | | | | 687,496 | |
| | | | | | | | |
| | | Principal
Amount | | | Value | |
| | | | | | | | |
Diversified/Conglomerate Service (continued) | |
J.D. Power and Associates | |
1st Lien Term Loan
5.546%, due 9/7/23 | | $ | 1,985,000 | | | $ | 1,992,444 | |
2nd Lien Term Loan
9.796%, due 9/7/24 | | | 375,000 | | | | 378,750 | |
Kronos, Inc.
2017 Term Loan B
4.680%, due 11/1/23 | | | 4,129,276 | | | | 4,154,279 | |
Mitchell International, Inc.
New 1st Lien Term Loan
4.672%, due 10/13/20 | | | 3,118,076 | | | | 3,129,769 | |
MKS Instruments, Inc.
2016 Term Loan B2
3.976%, due 5/1/23 | | | 1,520,777 | | | | 1,525,054 | |
Monitronics International Inc.
Term Loan B2
6.796%, due 9/30/22 | | | 3,176,000 | | | | 3,202,202 | |
MX Holdings U.S., Inc.
Term Loan B1B
3.976%, due 8/14/23 | | | 3,312,565 | | | | 3,329,128 | |
Prime Security Services Borrower LLC
2016 1st Lien Term Loan
3.974%, due 5/2/22 | | | 3,307,573 | | | | 3,310,526 | |
Sabre GLBL, Inc.
Term Loan B
3.976%, due 2/22/24 | | | 3,020,061 | | | | 3,040,015 | |
Sophia, L.P.
2017 Term Loan B
4.546%, due 9/30/22 | | | 1,955,995 | | | | 1,949,709 | |
Sungard Availability Services Capital, Inc.
Term Loan B
6.226%, due 3/31/19 | | | 1,496,623 | | | | 1,488,673 | |
TruGreen, Ltd. Partnership
1st Lien Term Loan B
6.627%, due 4/13/23 | | | 1,782,000 | | | | 1,793,137 | |
Vantiv LLC
2014 Term Loan B
3.659%, due 10/14/23 | | | 1,631,089 | | | | 1,641,284 | |
WEX, Inc.
Term Loan B
4.726%, due 7/1/23 | | | 990,000 | | | | 992,122 | |
| | | | | | | | |
| | | | | | | 54,599,427 | |
| | | | | | | | |
Ecological 0.7% | |
Advanced Disposal Services, Inc.
Term Loan B3
3.939%, due 11/10/23 | | | 3,808,869 | | | | 3,825,872 | |
Casella Waste Systems, Inc.
2017 Term Loan B
3.959%, due 10/17/23 | | | 1,243,750 | | | | 1,247,637 | |
| | | | |
| 14 | | MainStay VP Floating Rate Portfolio | | The notes to the financial statements are an integral part of,
and should be read in conjunction with, the financial statements. |
| | | | | | | | |
| | | Principal
Amount | | | Value | |
| | | | | | | | |
| Floating Rate Loans (continued) | |
Ecological (continued) | |
Waste Industries USA, Inc.
2016 Term Loan
4.046%, due 2/27/20 | | $ | 1,303,333 | | | $ | 1,307,406 | |
| | | | | | | | |
| | | | | | | 6,380,915 | |
| | | | | | | | |
Electronics 11.1% | |
Almonde, Inc. | |
USD 1st Lien Term Loan
4.736%, due 6/13/24 | | | 4,000,000 | | | | 3,998,720 | |
USD 2nd Lien Term Loan
8.459%, due 6/13/25 | | | 1,400,000 | | | | 1,422,750 | |
BMC Software Finance, Inc.
2017 USD Term Loan
5.226%, due 9/10/22 | | | 4,045,806 | | | | 4,051,571 | |
Cision U.S., Inc.
USD Term Loan B
7.226%, due 6/16/23 | | | 2,699,732 | | | | 2,712,556 | |
Cologix, Inc.
2017 1st Lien Term Loan
4.216%, due 3/20/24 | | | 2,992,500 | | | | 2,986,889 | |
Colorado Buyer, Inc.
Term Loan B
4.170%, due 5/1/24 | | | 1,000,000 | | | | 1,005,750 | |
CommScope, Inc.
Term Loan B5
3.296%, due 12/29/22 | | | 1,754,000 | | | | 1,755,461 | |
Compuware Corp.
Term Loan B3
5.550%, due 12/15/21 | | | 1,165,003 | | | | 1,167,500 | |
ConvergeOne Holdings Corp.
2017 Term Loan B
6.050%, due 6/20/24 | | | 1,200,000 | | | | 1,188,000 | |
Cortes NP Acquisition Corp.
2017 Term Loan B
5.226%, due 11/30/23 | | | 2,580,460 | | | | 2,590,136 | |
Dell, Inc.
2017 Term Loan B
3.730%, due 9/7/23 | | | 7,064,544 | | | | 7,088,514 | |
Diebold, Inc.
USD 2017 Term Loan B
3.875%, due 11/6/23 | | | 1,695,750 | | | | 1,701,402 | |
EIG Investors Corp.
2017 Term Loan
5.242%, due 2/9/23 | | | 4,668,234 | | | | 4,677,958 | |
Epicor Software Corp.
1st Lien Term Loan
4.980%, due 6/1/22 | | | 6,259,714 | | | | 6,250,769 | |
Evertec Group LLC
New Term Loan B
3.655%, due 4/17/20 | | | 214,467 | | | | 213,394 | |
| | | | | | | | |
| | | Principal
Amount | | | Value | |
| | | | | | | | |
Electronics (continued) | |
Eze Castle Software, Inc.
2017 1st Lien Term Loan
4.296%, due 4/6/20 | | $ | 1,984,733 | | | $ | 1,994,656 | |
GoDaddy Operating Co. LLC
2017 Term Loan B
3.726%, due 2/15/24 | | | 1,997,853 | | | | 2,001,099 | |
Hyland Software, Inc. | |
2017 1st Lien Term Loan
4.476%, due 7/1/22 | | | 4,743,495 | | | | 4,763,262 | |
2017 2nd Lien Term Loan
TBD, due 7/12/25 (e) | | | 208,333 | | | | 209,896 | |
Infor (U.S.), Inc.
Term Loan B6
4.046%, due 2/1/22 | | | 4,258,869 | | | | 4,229,968 | |
Informatica Corp.
USD Term Loan
4.796%, due 8/5/22 | | | 1,773,397 | | | | 1,770,072 | |
MA FinanceCo. LLC
USD Term Loan B3
TBD, due 4/29/24 | | | 368,509 | | | | 368,233 | |
Optiv Security, Inc.
1st Lien Term Loan
4.438%, due 2/1/24 | | | 144,984 | | | | 142,326 | |
Project Alpha Intermediate Holding, Inc.
2017 Term Loan B
4.670%, due 4/26/24 | | | 3,200,000 | | | | 3,176,000 | |
Quest Software U.S. Holdings, Inc.
Term Loan B
7.226%, due 10/31/22 | | | 4,029,623 | | | | 4,089,229 | |
Rocket Software, Inc.
2016 1st Lien Term Loan
5.546%, due 10/14/23 | | | 3,473,750 | | | | 3,498,935 | |
RP Crown Parent LLC
2016 Term Loan B
4.726%, due 10/12/23 | | | 2,388,000 | | | | 2,398,944 | |
Seattle Spinco, Inc.
USD Term Loan B3
TBD, due 4/19/24 | | | 2,488,634 | | | | 2,486,767 | |
Solera LLC
USD Term Loan B
4.476%, due 3/3/23 | | | 2,741,171 | | | | 2,746,484 | |
SS&C Technologies, Inc. | |
2017 Term Loan B1
3.476%, due 7/8/22 | | | 3,028,310 | | | | 3,038,585 | |
2017 Term Loan B2
3.476%, due 7/8/22 | | | 183,681 | | | | 184,304 | |
Tempo Acquisition LLC
Term Loan
4.060%, due 5/1/24 | | | 3,500,000 | | | | 3,505,834 | |
Tibco Software, Inc.
2017 Term Loan B
5.730%, due 12/4/20 | | | 1,641,676 | | | | 1,647,833 | |
| | | | | | |
The notes to the financial statements are an integral part of,
and should be read in conjunction with, the financial statements. | | | | | 15 | |
Portfolio of Investments June 30, 2017 (Unaudited) (continued)
| | | | | | | | |
| | | Principal
Amount | | | Value | |
| | | | | | | | |
| Floating Rate Loans (continued) | |
Electronics (continued) | |
Verint Systems, Inc.
2017 Term Loan B
TBD, due 6/21/24 (e) | | $ | 2,500,000 | | | $ | 2,504,687 | |
Veritas Bermuda, Ltd.
Repriced Term Loan B
5.796%, due 1/27/23 | | | 2,263,941 | | | | 2,265,639 | |
VF Holding Corp.
Reprice Term Loan
4.546%, due 6/30/23 | | | 2,977,500 | | | | 2,974,243 | |
Western Digital Corp.
2017 USD Term Loan B
3.976%, due 4/29/23 | | | 2,178,055 | | | | 2,189,967 | |
Xerox Business Services LLC
USD Term Loan B
5.226%, due 12/7/23 | | | 4,776,000 | | | | 4,835,700 | |
Zebra Technologies Corp.
2016 Term Loan B
3.723%, due 10/27/21 | | | 2,202,078 | | | | 2,209,631 | |
| | | | | | | | |
| | | | | | | 102,043,664 | |
| | | | | | | | |
Finance 1.7% | |
Alliant Holdings I, Inc.
2015 Term Loan B
4.417%, due 8/12/22 | | | 1,829,350 | | | | 1,831,179 | |
Brand Energy & Infrastructure Services, Inc.
2017 Term Loan
5.491%, due 6/21/24 | | | 5,294,118 | | | | 5,270,294 | |
Duff & Phelps Corp. | |
Term Loan B
5.046%, due 4/23/20 | | | 1,602,059 | | | | 1,610,069 | |
Term Loan B1
5.046%, due 4/23/20 | | | 975,000 | | | | 979,875 | |
Focus Financial Partners LLC
1st Lien Term Loan
TBD, due 5/22/24 (e) | | | 1,500,000 | | | | 1,510,625 | |
Istar Financial, Inc.
2016 Term Loan B
4.901%, due 7/1/20 | | | 1,389,135 | | | | 1,397,817 | |
NAB Holdings LLC
2017 Term Loan
TBD, due 6/15/24 | | | 2,000,000 | | | | 2,000,000 | |
Virtus Investment Partners, Inc.
Term Loan
4.952%, due 6/1/24 | | | 800,000 | | | | 809,000 | |
| | | | | | | | |
| | | | | | | 15,408,859 | |
| | | | | | | | |
Healthcare, Education & Childcare 7.9% | |
Acadia Healthcare Co., Inc.
Term Loan B2
3.801%, due 2/16/23 | | | 1,292,320 | | | | 1,300,397 | |
| | | | | | | | |
| | | Principal
Amount | | | Value | |
| | | | | | | | |
Healthcare, Education & Childcare (continued) | |
Akorn, Inc.
Term Loan B
5.500%, due 4/16/21 | | $ | 2,308,726 | | | $ | 2,328,927 | |
Alvogen Pharma U.S., Inc.
Term Loan
6.230%, due 4/2/22 | | | 3,127,163 | | | | 3,077,650 | |
Avantor Performance Materials Holdings LLC
2017 1st Lien Term Loan
5.230%, due 3/10/24 | | | 3,305,094 | | | | 3,324,373 | |
Community Health Systems, Inc. | |
Term Loan G
3.948%, due 12/31/19 | | | 1,900,678 | | | | 1,897,709 | |
Term Loan H
4.161%, due 1/27/21 | | | 3,503,212 | | | | 3,496,580 | |
Concentra, Inc.
1st Lien Term Loan
4.211%, due 6/1/22 | | | 2,673,918 | | | | 2,675,172 | |
Curo Health Services Holdings, Inc.
2015 1st Lien Term Loan
5.932%, due 2/7/22 | | | 1,155,106 | | | | 1,162,807 | |
DaVita HealthCare Partners, Inc.
Term Loan B
3.976%, due 6/24/21 | | | 3,802,374 | | | | 3,819,348 | |
Envision Healthcare Corp.
2016 Term Loan B
4.300%, due 12/1/23 | | | 3,884,562 | | | | 3,896,216 | |
Equian LLC
Term Loan B
4.928%, due 5/20/24 | | | 2,003,529 | | | | 2,017,304 | |
ExamWorks Group, Inc.
2017 Term Loan
4.476%, due 7/27/23 | | | 2,481,281 | | | | 2,493,688 | |
HCA, Inc.
Term Loan B9
3.226%, due 3/17/23 | | | 1,840,494 | | | | 1,844,583 | |
inVentiv Health, Inc.
2016 Term Loan B
4.952%, due 11/9/23 | | | 3,484,994 | | | | 3,493,706 | |
Jaguar Holding Co. II
2017 Term Loan
4.013%, due 8/18/22 | | | 5,770,961 | | | | 5,770,061 | |
Kindred Healthcare, Inc.
New Term Loan
4.688%, due 4/9/21 | | | 2,023,166 | | | | 2,029,068 | |
Kinetic Concepts, Inc.
2017 USD Term Loan B
4.546%, due 2/2/24 | | | 4,000,000 | | | | 3,971,668 | |
Onex Carestream Finance, L.P.
1st Lien Term Loan
5.275%, due 6/7/19 | | | 4,861,209 | | | | 4,825,965 | |
| | | | |
| 16 | | MainStay VP Floating Rate Portfolio | | The notes to the financial statements are an integral part of,
and should be read in conjunction with, the financial statements. |
| | | | | | | | |
| | | Principal
Amount | | | Value | |
| | | | | | | | |
| Floating Rate Loans (continued) | |
Healthcare, Education & Childcare (continued) | |
Onex Carestream Finance, L.P. (continued) | | | | | | | | |
2nd Lien Term Loan
9.796%, due 12/7/19 (e) | | $ | 1,723,401 | | | $ | 1,684,624 | |
Ortho-Clinical Diagnostics, Inc.
Term Loan B
5.046%, due 6/30/21 | | | 4,085,039 | | | | 4,060,953 | |
Press Ganey Holdings, Inc.
1st Lien Term Loan
4.476%, due 10/21/23 | | | 995,000 | | | | 997,488 | |
RPI Finance Trust
Term Loan B6
3.296%, due 3/27/23 | | | 4,050,880 | | | | 4,063,539 | |
Select Medical Corp.
2017 Term Loan B
4.650%, due 3/6/24 | | | 3,491,250 | | | | 3,514,526 | |
Team Health Holdings, Inc.
1st Lien Term Loan
3.976%, due 2/6/24 | | | 4,987,500 | | | | 4,952,587 | |
U.S. Anesthesia Partners, Inc.
2017 Term Loan
4.466%, due 6/7/24 | | | 500,000 | | | | 500,000 | |
| | | | | | | | |
| | | | 73,198,939 | |
| | | | | | | | |
Home and Office Furnishings, Housewares & Durable Consumer Products 0.5% | |
Comfort Holding LLC
1st Lien Term Loan
5.885%, due 2/5/24 | | | 1,200,000 | | | | 1,200,000 | |
Serta Simmons Bedding LLC
1st Lien Term Loan
4.586%, due 11/8/23 | | | 3,529,150 | | | | 3,521,358 | |
| | | | | | | | |
| | | | 4,721,358 | |
| | | | | | | | |
Hotels, Motels, Inns & Gaming 5.8% | |
Affinity Gaming LLC
Initial Term Loan
4.726%, due 7/1/23 | | | 2,572,953 | | | | 2,585,818 | |
AP Gaming I LLC
2017 Term Loan B
6.586%, due 2/15/24 | | | 1,900,750 | | | | 1,913,818 | |
Caesars Entertainment Operating Co. | |
Exit Term Loan
TBD, due 3/31/24 (e) | | | 1,666,667 | | | | 1,660,763 | |
Extended Term Loan B5
11.000%, due 3/1/22 (f) | | | 2,279,722 | | | | 2,641,628 | |
Extended Term Loan B6
12.000%, due 3/1/22 (f) | | | 1,747,210 | | | | 2,076,996 | |
Term Loan B7 (Non RSA)
14.000%, due 3/1/22 (f) | | | 1,015,168 | | | | 1,260,501 | |
Caesars Entertainment Resort Properties LLC
Term Loan B
4.726%, due 10/11/20 | | | 2,400,285 | | | | 2,407,786 | |
| | | | | | | | |
| | | Principal
Amount | | | Value | |
| | | | | | | | |
Hotels, Motels, Inns & Gaming (continued) | |
CityCenter Holdings LLC
2017 Term Loan B
3.716%, due 4/18/24 | | $ | 2,900,000 | | | $ | 2,903,106 | |
ESH Hospitality, Inc.
2017 Term Loan B
3.726%, due 8/30/23 | | | 992,513 | | | | 995,348 | |
Everi Payments, Inc.
Term Loan B
5.754%, due 5/9/24 | | | 2,000,000 | | | | 2,011,876 | |
Hilton Worldwide Finance LLC
Term Loan B2
3.216%, due 10/25/23 | �� | | 4,840,576 | | | | 4,853,350 | |
La Quinta Intermediate Holdings LLC
Term Loan B
3.908%, due 4/14/21 | | | 3,298,172 | | | | 3,309,511 | |
¨MGM Growth Properties Operating Partnership L.P.
2016 Term Loan B
3.476%, due 4/25/23 | | | 8,364,125 | | | | 8,370,398 | |
Penn National Gaming, Inc.
2017 Term Loan B
3.726%, due 1/19/24 | | | 997,500 | | | | 1,000,885 | |
Pinnacle Entertainment, Inc.
Term Loan B
4.230%, due 4/28/23 | | | 46,667 | | | | 46,842 | |
Scientific Games International, Inc.
2017 Term Loan B3
5.108%, due 10/1/21 | | | 6,976,445 | | | | 7,041,228 | |
Station Casinos LLC
2016 Term Loan B
3.710%, due 6/8/23 | | | 4,683,708 | | | | 4,681,197 | |
UFC Holdings LLC
1st Lien Term Loan
4.470%, due 8/18/23 | | | 3,656,415 | | | | 3,664,901 | |
| | | | | | | | |
| | | | 53,425,952 | |
| | | | | | | | |
Insurance 3.0% | |
AmWINS Group, Inc.
2017 Term Loan B
4.130%, due 1/25/24 | | | 2,487,500 | | | | 2,485,945 | |
Asurion LLC | | | | | | | | |
2017 Term Loan B5
4.226%, due 11/3/23 | | | 1,739,392 | | | | 1,748,089 | |
New Term Loan B4
4.476%, due 8/4/22 | | | 2,540,897 | | | | 2,552,013 | |
New 2nd Lien Term Loan
8.726%, due 3/3/21 | | | 1,000,000 | | | | 1,004,167 | |
Hub International, Ltd.
Term Loan B
4.422%, due 10/2/20 | | | 5,784,151 | | | | 5,800,815 | |
MPH Acquisition Holdings LLC
2016 Term Loan B
4.296%, due 6/7/23 | | | 2,727,666 | | | | 2,724,256 | |
| | | | | | |
The notes to the financial statements are an integral part of,
and should be read in conjunction with, the financial statements. | | | | | 17 | |
Portfolio of Investments June 30, 2017 (Unaudited) (continued)
| | | | | | | | |
| | | Principal
Amount | | | Value | |
| | | | | | | | |
| Floating Rate Loans (continued) | |
Insurance (continued) | |
NFP Corp.
Term Loan B
4.796%, due 1/8/24 | | $ | 1,497,500 | | | $ | 1,502,367 | |
Sedgwick Claims Management Services, Inc. | |
1st Lien Term Loan
3.976%, due 3/1/21 | | | 2,003,418 | | | | 2,002,583 | |
2nd Lien Term Loan
6.976%, due 2/28/22 | | | 4,400,000 | | | | 4,400,000 | |
USI, Inc.
2017 Term Loan B
4.180%, due 5/16/24 | | | 3,000,000 | | | | 2,978,250 | |
| | | | | | | | |
| | | | 27,198,485 | |
| | | | | | | | |
Leisure, Amusement, Motion Pictures & Entertainment 2.9% | |
Boyd Gaming Corp.
Term Loan B3
3.688%, due 9/15/23 | | | 4,470,956 | | | | 4,474,949 | |
Cedar Fair, L.P.
2017 Term Loan B
3.476%, due 4/13/24 | | | 1,641,092 | | | | 1,653,810 | |
Creative Artists Agency LLC
2017 1st Lien Term Loan B
4.659%, due 2/15/24 | | | 1,950,980 | | | | 1,961,955 | |
Fitness International LLC | |
Term Loan A
4.476%, due 4/1/20 | | | 945,746 | | | | 944,563 | |
Term Loan B
5.476%, due 7/1/20 | | | 1,974,647 | | | | 1,999,330 | |
LTF Merger Sub, Inc.
2017 Term Loan B
4.226%, due 6/10/22 | | | 2,102,214 | | | | 2,104,842 | |
Six Flags Theme Parks, Inc.
2015 Term Loan B
3.231%, due 6/30/22 | | | 2,000,000 | | | | 2,012,500 | |
TKC Holdings, Inc. | |
2017 1st Lien Term Loan
5.376%, due 2/1/23 | | | 2,618,438 | | | | 2,610,255 | |
2017 2nd Lien Term Loan
9.126%, due 2/1/24 | | | 150,000 | | | | 150,000 | |
Travel Leaders Group LLC
2017 1st Lien Term Loan
6.476%, due 1/25/24 | | | 1,496,250 | | | | 1,501,861 | |
Vivid Seats, Ltd.
2017 1st Lien Term Loan
TBD, due 6/21/24 (e) | | | 1,200,000 | | | | 1,200,000 | |
William Morris Endeavor Entertainment LLC | |
1st Lien Term Loan
4.480%, due 5/6/21 | | | 2,852,888 | | | | 2,860,734 | |
2nd Lien Term Loan
8.476%, due 5/6/22 | | | 800,000 | | | | 810,000 | |
| | | | | | | | |
| | | Principal
Amount | | | Value | |
| | | | | | | | |
Leisure, Amusement, Motion Pictures & Entertainment (continued) | |
WMG Acquisition Corp.
Term Loan D
3.716%, due 11/1/23 | | $ | 2,491,632 | | | $ | 2,490,074 | |
| | | | | | | | |
| | | | 26,774,873 | |
| | | | | | | | |
Machinery (Non-Agriculture, Non-Construct & Non-Electronic) 2.1% | |
Accudyne Industries LLC
Term Loan
4.226%, due 12/13/19 | | | 321,563 | | | | 318,749 | |
Apex Tool Group LLC
Term Loan B
4.500%, due 1/31/20 | | | 2,471,451 | | | | 2,399,366 | |
Columbus McKinnon Corp.
Term Loan B
4.296%, due 1/31/24 | | | 1,447,775 | | | | 1,458,634 | |
CPM Holdings, Inc.
Term Loan B
5.476%, due 4/11/22 | | | 1,473,543 | | | | 1,488,278 | |
Manitowoc Foodservice, Inc.
2016 Term Loan B
4.226%, due 3/3/23 | | | 1,393,162 | | | | 1,402,740 | |
Power Products LLC
Term Loan
5.656%, due 12/20/22 | | | 2,670,313 | | | | 2,678,657 | |
¨Rexnord LLC
2016 Term Loan B
3.971%, due 8/21/23 | | | 7,640,834 | | | | 7,640,834 | |
Zodiac Pool Solutions LLC
2017 1st Lien Term Loan
5.296%, due 12/20/23 (e) | | | 1,796,005 | | | | 1,803,863 | |
| | | | | | | | |
| | | | 19,191,121 | |
| | | | | | | | |
Mining, Steel, Iron & Non-Precious Metals 1.4% | |
Ameriforge Group, Inc.
1st Lien Term Loan
5.000%, due 12/19/19 (e) | | | 2,913,665 | | | | 1,544,242 | |
Arch Coal, Inc.
2017 Term Loan B
5.226%, due 3/7/24 | | | 598,500 | | | | 597,752 | |
Fairmount Santrol, Inc.
New Term Loan B2
4.796%, due 9/5/19 | | | 3,230,860 | | | | 3,061,240 | |
Gates Global LLC
2017 USD Term Loan B
4.546%, due 4/1/24 | | | 1,963,207 | | | | 1,964,026 | |
McJunkin Red Man Corp.
New Term Loan
5.226%, due 11/8/19 (e) | | | 1,525,746 | | | | 1,534,645 | |
Minerals Technologies, Inc.
2017 Term Loan B
3.522%, due 2/14/24 | | | 2,582,313 | | | | 2,598,453 | |
| | | | |
| 18 | | MainStay VP Floating Rate Portfolio | | The notes to the financial statements are an integral part of,
and should be read in conjunction with, the financial statements. |
| | | | | | | | |
| | | Principal
Amount | | | Value | |
| | | | | | | | |
| Floating Rate Loans (continued) | |
Mining, Steel, Iron & Non-Precious Metals (continued) | |
Zekelman Industries, Inc.
Term Loan B
4.789%, due 6/14/21 | | $ | 1,777,772 | | | $ | 1,788,883 | |
| | | | | | | | |
| | | | 13,089,241 | |
| | | | | | | | |
Oil & Gas 1.8% | |
Ascent Resources-Marcellus LLC (e)(f)(g) | |
1st Lien Term Loan
TBD, due 8/4/20 | | | 944,563 | | | | 595,075 | |
2nd Lien Term Loan
TBD, due 8/4/21 | | | 250,000 | | | | 25,000 | |
Chesapeake Energy Corp.
Term Loan
8.686%, due 8/23/21 | | | 2,166,667 | | | | 2,304,792 | |
CITGO Holding, Inc.
2015 Term Loan B
9.796%, due 5/12/18 | | | 1,204,571 | | | | 1,211,884 | |
Energy Transfer Equity, L.P.
2017 Term Loan B
3.826%, due 2/2/24 | | | 7,566,544 | | | | 7,519,253 | |
Fieldwood Energy LLC | |
New 1st Lien Term Loan
8.296%, due 8/31/20 | | | 305,556 | | | | 285,694 | |
1st Lien Last Out Term Loan
8.421%, due 9/30/20 | | | 412,500 | | | | 323,812 | |
HGIM Corp.
Term Loan B
5.750%, due 6/18/20 (e) | | | 782,827 | | | | 340,530 | |
Philadelphia Energy Solutions LLC
Term Loan B
6.250%, due 4/4/18 | | | 1,248,907 | | | | 1,152,117 | |
Seadrill Partners Finco LLC
Term Loan B
4.296%, due 2/21/21 (e) | | | 2,011,461 | | | | 1,267,220 | |
Summit Midstream Holdings LLC
Term Loan B
7.226%, due 5/13/22 | | | 1,750,000 | | | | 1,767,500 | |
| | | | | | | | |
| | | | 16,792,877 | |
| | | | | | | | |
Personal & Nondurable Consumer Products
(Manufacturing Only) 1.8% | |
American Builders & Contractors Supply Co., Inc.
2017 Term Loan B
3.726%, due 10/31/23 | | | 2,147,119 | | | | 2,150,997 | |
Hillman Group, Inc.
Term Loan B
4.796%, due 6/30/21 | | | 2,445,793 | | | | 2,457,002 | |
KIK Custom Products, Inc.
2015 Term Loan B
5.793%, due 8/26/22 | | | 1,000,000 | | | | 1,004,250 | |
| | | | | | | | |
| | | Principal
Amount | | | Value | |
| | | | | | | | |
Personal & Nondurable Consumer Products
(Manufacturing Only) (continued) | |
Prestige Brands, Inc.
Term Loan B4
3.976%, due 1/26/24 | | $ | 933,427 | | | $ | 936,760 | |
Revlon Consumer Products Corp.
2016 Term Loan B
4.726%, due 9/7/23 | | | 2,563,958 | | | | 2,383,412 | |
Spectrum Brands, Inc.
2017 Term Loan B
3.174%, due 6/23/22 | | | 1,899,502 | | | | 1,904,250 | |
SRAM LLC
2017 Term Loan
4.609%, due 3/15/24 | | | 4,055,301 | | | | 4,060,370 | |
Varsity Brands, Inc.
1st Lien Term Loan
4.552%, due 12/11/21 | | | 1,950,000 | | | | 1,957,718 | |
| | | | | | | | |
| | | | 16,854,759 | |
| | | | | | | | |
Personal, Food & Miscellaneous Services 1.0% | |
Aramark Services, Inc.
2017 USD Term Loan B
3.226%, due 3/28/24 | | | 4,987,500 | | | | 5,012,437 | |
Weight Watchers International, Inc.
Term Loan B2
4.377%, due 4/2/20 | | | 1,284,460 | | | | 1,237,898 | |
Yum! Brands, Inc.
1st Lien Term Loan B
3.209%, due 6/16/23 | | | 2,977,538 | | | | 2,987,462 | |
| | | | | | | | |
| | | | 9,237,797 | |
| | | | | | | | |
Printing & Publishing 0.8% | |
Cengage Learning Acquisitions, Inc.
2016 Term Loan B
5.339%, due 6/7/23 | | | 1,759,849 | | | | 1,660,857 | |
Checkout Holding Corp.
1st Lien Term Loan
4.726%, due 4/9/21 | | | 1,337,932 | | | | 1,110,275 | |
Getty Images, Inc.
Term Loan B
4.796%, due 10/18/19 | | | 2,144,451 | | | | 1,972,895 | |
McGraw-Hill Global Education Holdings LLC
2016 Term Loan B
5.226%, due 5/4/22 | | | 2,227,500 | | | | 2,191,860 | |
| | | | | | | | |
| | | | 6,935,887 | |
| | | | | | | | |
Retail Store 5.7% | |
American Tire Distributors Holdings, Inc.
2015 Term Loan
5.476%, due 9/1/21 | | | 1,562,110 | | | | 1,562,389 | |
Bass Pro Group LLC | |
2015 Term Loan
4.367%, due 6/5/20 | | | 997,449 | | | | 994,539 | |
Term Loan B
6.296%, due 12/16/23 | | | 3,000,000 | | | | 2,911,608 | |
| | | | | | |
The notes to the financial statements are an integral part of,
and should be read in conjunction with, the financial statements. | | | | | 19 | |
Portfolio of Investments June 30, 2017 (Unaudited) (continued)
| | | | | | | | |
| | | Principal
Amount | | | Value | |
| | | | | | | | |
| Floating Rate Loans (continued) | |
Retail Store (continued) | |
Belk, Inc.
Term Loan
5.905%, due 12/12/22 | | $ | 1,454,698 | | | $ | 1,237,220 | |
BJ’s Wholesale Club, Inc. | |
2017 1st Lien Term Loan
4.968%, due 2/3/24 | | | 2,600,000 | | | | 2,518,750 | |
2017 2nd Lien Term Loan
8.710%, due 2/3/25 | | | 1,437,500 | | | | 1,397,969 | |
CNT Holdings III Corp.
2017 Term Loan
4.510%, due 1/22/23 | | | 2,473,803 | | | | 2,469,679 | |
Harbor Freight Tools USA, Inc.
2016 Term Loan B
4.476%, due 8/18/23 | | | 2,490,139 | | | | 2,488,065 | |
Leslie’s Poolmart, Inc.
2016 Term Loan
4.871%, due 8/16/23 | | | 3,970,000 | | | | 3,978,270 | |
¨Michaels Stores, Inc.
2016 Term Loan B1
3.938%, due 1/30/23 | | | 8,101,896 | | | | 8,078,749 | |
Nature’s Bounty Co.
2017 USD Term Loan B
4.796%, due 5/5/23 | | | 2,640,067 | | | | 2,641,387 | |
Neiman Marcus Group, Ltd. LLC
2020 Term Loan
4.339%, due 10/25/20 | | | 1,862,496 | | | | 1,394,544 | |
¨Party City Holdings, Inc.
2016 Term Loan
4.188%, due 8/19/22 | | | 8,837,128 | | | | 8,833,973 | |
Petco Animal Supplies, Inc.
2017 Term Loan B
4.172%, due 1/26/23 | | | 2,633,333 | | | | 2,366,708 | |
PetSmart, Inc.
Term Loan B2
4.220%, due 3/11/22 | | | 5,788,434 | | | | 5,361,537 | |
Pilot Travel Centers LLC
2017 Term Loan B
3.226%, due 5/25/23 | | | 2,318,184 | | | | 2,329,775 | |
Sally Holdings LLC
Term Loan B2
TBD, due 6/22/24 | | | 1,666,667 | | | | 1,666,667 | |
| | | | | | | | |
| | | | 52,231,829 | |
| | | | | | | | |
Telecommunications 3.0% | |
Aerial Merger Sub, Inc. (e) | |
Term Loan B1
TBD, due 8/28/19 | | | 1,000,000 | | | | 1,006,563 | |
Term Loan B2
TBD, due 2/28/24 | | | 1,666,667 | | | | 1,675,522 | |
| | | | | | | | |
| | | Principal
Amount | | | Value | |
| | | | | | | | |
Telecommunications (continued) | |
Avaya, Inc. | |
Extended Term Loan B3
5.670%, due 10/26/17 (f) | | $ | 750,000 | | | $ | 595,625 | |
Term Loan B6
6.667%, due 3/30/18 (f) | | | 1,105,954 | | | | 878,312 | |
DIP Term Loan
8.675%, due 1/24/18 | | | 782,800 | | | | 805,306 | |
CenturyLink, Inc.
2017 Term Loan B
1.375%, due 1/31/25 | | | 3,000,000 | | | | 2,965,713 | |
Colorado Buyer, Inc.
2nd Lien Term Loan
8.420%, due 5/1/25 | | | 800,000 | | | | 810,000 | |
Frontier Communications Corp.
2017 Term Loan B1
4.910%, due 6/15/24 | | | 1,500,000 | | | | 1,476,063 | |
LTS Buyer LLC
1st Lien Term Loan
4.546%, due 4/13/20 | | | 3,872,248 | | | | 3,883,543 | |
Onvoy LLC
2017 1st Lien Term Loan B
5.796%, due 2/10/24 | | | 2,493,750 | | | | 2,495,827 | |
Rackspace Hosting, Inc.
2017 1st Lien Term Loan
4.280%, due 11/3/23 | | | 517,187 | | | | 516,670 | |
Radiate Holdco LLC
1st Lien Term Loan
4.226%, due 2/1/24 | | | 1,396,500 | | | | 1,376,716 | |
SBA Senior Finance II LLC
Term Loan B1
3.480%, due 3/24/21 | | | 3,855,128 | | | | 3,861,875 | |
Sprint Communications, Inc.
1st Lien Term Loan B
3.750%, due 2/2/24 | | | 1,995,000 | | | | 1,993,931 | |
Syniverse Holdings, Inc.
Term Loan
4.172%, due 4/23/19 | | | 3,543,180 | | | | 3,299,586 | |
Zayo Group LLC
2017 Term Loan B2
3.716%, due 1/19/24 | | | 285,985 | | | | 286,521 | |
| | | | | | | | |
| | | | 27,927,773 | |
| | | | | | | | |
Utilities 4.0% | |
Astoria Energy LLC
Term Loan B
5.230%, due 12/24/21 | | | 2,434,280 | | | | 2,435,801 | |
Calpine Corp.
Term Loan B5
4.046%, due 1/15/24 | | | 4,736,667 | | | | 4,726,601 | |
Dayton Power & Light Co.
Term Loan B
4.480%, due 8/24/22 | | | 497,500 | | | | 505,273 | |
| | | | |
| 20 | | MainStay VP Floating Rate Portfolio | | The notes to the financial statements are an integral part of,
and should be read in conjunction with, the financial statements. |
| | | | | | | | |
| | | Principal
Amount | | | Value | |
| | | | | | | | |
| Floating Rate Loans (continued) | |
Utilities (continued) | |
Dynegy, Inc.
2017 Term Loan C
4.476%, due 2/7/24 | | $ | 2,115,886 | | | $ | 2,110,080 | |
EIF Channelview Cogeneration LLC
Term Loan B
4.476%, due 5/8/20 | | | 2,290,424 | | | | 2,118,642 | |
¨Energy Future Intermediate Holding Co. LLC
2017 DIP Term Loan
TBD, due 6/23/18 (e) | | | 9,125,000 | | | | 9,151,618 | |
Entergy Rhode Island State Energy, L.P.
Term Loan B
5.980%, due 12/17/22 | | | 985,000 | | | | 975,150 | |
Granite Acquisition, Inc. | |
Term Loan B
5.296%, due 12/19/21 | | | 1,907,992 | | | | 1,913,444 | |
Term Loan C
5.296%, due 12/19/21 | | | 47,404 | | | | 47,540 | |
2nd Lien Term Loan B
8.546%, due 12/19/22 | | | 742,177 | | | | 734,755 | |
Helix Gen Funding LLC
Term Loan B
4.960%, due 6/2/24 | | | 3,824,179 | | | | 3,846,715 | |
NRG Energy, Inc.
2016 Term Loan B
3.546%, due 6/30/23 | | | 1,975,025 | | | | 1,970,088 | |
Southeast PowerGen LLC
Term Loan B
4.800%, due 12/2/21 | | | 863,824 | | | | 832,510 | |
TEX Operations Co. LLC | |
Exit Term Loan C
3.795%, due 8/4/23 | | | 742,857 | | | | 734,871 | |
Exit Term Loan B
3.976%, due 8/4/23 | | | 3,240,857 | | | | 3,206,018 | |
Texas Competitive Electric Holdings Co. LLC (h) | |
Extended Term Loan
TBD, due 10/10/17 | | | 1,750,000 | | | | 621,075 | |
Non-Extended Term Loan
TBD, due 10/10/17 | | | 1,750,000 | | | | 619,675 | |
Vistra Operations Co. LLC
2016 Term Loan B2
4.467%, due 12/14/23 | | | 652,969 | | | | 652,969 | |
| | | | | | | | |
| | | | | | | 37,202,825 | |
| | | | | | | | |
Total Floating Rate Loans
(Cost $806,818,682) | | | | | | | 803,157,395 | |
| | | | | | | | |
| | | | | | | | |
| | | Principal
Amount | | | Value | |
| | | | | | | | |
| Foreign Floating Rate Loans 10.6% (d) | |
Aerospace & Defense 0.2% | |
Avolon TLB Borrower 1 (Luxembourg) S.A.R.L.
Term Loan B2
3.962%, due 3/20/22 | | $ | 1,500,000 | | | $ | 1,511,759 | |
| | | | | | | | |
|
Beverage, Food & Tobacco 0.4% | |
Jacobs Douwe Egberts International B.V.
USD Term Loan B5
3.438%, due 7/2/22 | | | 3,413,046 | | | | 3,430,111 | |
| | | | | | | | |
|
Broadcasting & Entertainment 0.8% | |
DHX Media Ltd.
Term Loan B
TBD, due 12/22/23 | | | 1,250,000 | | | | 1,253,125 | |
Numericable Group S.A.
USD Term Loan B11
3.944%, due 7/31/25 | | | 5,000,000 | | | | 4,954,465 | |
Unitymedia Hessen GmbH & Co. KG
Term Loan B
TBD, due 9/30/25 (e) | | | 1,500,000 | | | | 1,495,001 | |
| | | | | | | | |
| | | | 7,702,591 | |
| | | | | | | | |
Chemicals, Plastics & Rubber 0.5% | |
Allnex (Luxembourg) & Cy S.C.A.
2016 USD Term Loan B2
4.406%, due 9/13/23 | | | 1,303,226 | | | | 1,303,226 | |
Alpha 3 B.V.
2017 Term Loan B1
4.296%, due 1/31/24 | | | 2,000,000 | | | | 2,004,000 | |
ASP Chromaflo Dutch I B.V.
Term Loan B2
5.226%, due 11/18/23 | | | 281,226 | | | | 282,106 | |
Flint Group GmbH
USD Term Loan C
4.153%, due 9/7/21 | | | 406,416 | | | | 402,352 | |
Tronox Pigments (Netherlands) B.V.
2013 Term Loan
TBD, due 3/19/20 | | | 1,000,000 | | | | 1,006,000 | |
| | | | | | | | |
| | | | 4,997,684 | |
| | | | | | | | |
Diversified/Conglomerate Manufacturing 0.5% | |
Garda World Security Corp.
2017 Term Loan
5.226%, due 5/24/24 | | | 2,212,926 | | | | 2,221,225 | |
Lumileds Holding B.V.
Term Loan B
TBD, due 2/27/24 | | | 2,000,000 | | | | 2,027,500 | |
| | | | | | | | |
| | | | 4,248,725 | |
| | | | | | | | |
| | | | | | |
The notes to the financial statements are an integral part of,
and should be read in conjunction with, the financial statements. | | | | | 21 | |
Portfolio of Investments June 30, 2017 (Unaudited) (continued)
| | | | | | | | |
| | | Principal
Amount | | | Value | |
| | | | | | | | |
| Foreign Floating Rate Loans (continued) | |
Electronics 0.7% | |
Avast Software B.V.
2017 USD Term Loan B
4.546%, due 9/30/23 | | $ | 3,100,417 | | | $ | 3,123,025 | |
Camelot UK Holdco, Ltd.
2017 Term Loan B
4.726%, due 10/3/23 | | | 1,488,769 | | | | 1,496,213 | |
Oberthur Technologies S.A.
2016 USD Term Loan B1
3.750%, due 1/10/24 | | | 1,809,750 | | | | 1,814,274 | |
| | | | | | | | |
| | | | 6,433,512 | |
| | | | | | | | |
Healthcare, Education & Childcare 1.9% | |
Endo Luxembourg Finance Co. I S.A.R.L
2017 Term Loan B
5.500%, due 4/29/24 | | | 4,886,364 | | | | 4,919,195 | |
Mallinckrodt International Finance S.A.
USD Term Loan B
4.046%, due 9/24/24 | | | 2,287,535 | | | | 2,279,815 | |
Patheon Holdings I B.V.
2017 USD Term Loan
4.504%, due 4/20/24 | | | 1,667,143 | | | | 1,668,881 | |
¨Valeant Pharmaceuticals International, Inc.
Term Loan B F1
5.830%, due 4/1/22 | | | 8,560,229 | | | | 8,672,462 | |
| | | | | | | | |
| | | | 17,540,353 | |
| | | | | | | | |
Hotels, Motels, Inns & Gaming 0.8% | |
Amaya Holdings B.V. | |
Repriced Term Loan B
4.796%, due 8/1/21 | | | 4,626,768 | | | | 4,631,908 | |
USD 2nd Lien Term Loan
8.296%, due 8/1/22 | | | 243,750 | | | | 244,283 | |
Belmond Interfin, Ltd.
USD 2017 Term Loan B
TBD, due 6/21/24 | | | 1,600,000 | | | | 1,598,000 | |
Four Seasons Hotels, Ltd.
New 1st Lien Term Loan
3.726%, due 11/30/23 | | | 497,500 | | | | 499,677 | |
Gateway Casinos & Entertainment, Ltd.
Term Loan B1
5.046%, due 2/22/23 | | | 500,000 | | | | 503,750 | |
| | | | | | | | |
| | | | 7,477,618 | |
| | | | | | | | |
Leisure, Amusement, Motion Pictures & Entertainment 1.7% | |
Bombardier Recreational Products, Inc.
2016 Term Loan B
4.230%, due 6/30/23 | | | 2,730,129 | | | | 2,741,830 | |
Delta 2 (Luxembourg) S.A.R.L. | |
USD Term Loan B3
4.504%, due 2/1/24 | | | 5,766,667 | | | | 5,768,472 | |
USD 2nd Lien Term Loan
8.004%, due 7/29/22 | | | 360,000 | | | | 362,160 | |
| | | | | | | | |
| | | Principal
Amount | | | Value | |
| | | | | | | | |
Leisure, Amusement, Motion Pictures & Entertainment (continued) | |
Lions Gate Entertainment Corp.
2016 1st Lien Term Loan
4.226%, due 12/8/23 | | $ | 2,570,313 | | | $ | 2,579,309 | |
Travelport Finance (Luxembourg) S.A.R.L.
2017 Term Loan B
4.432%, due 9/2/21 | | | 4,299,797 | | | | 4,308,241 | |
| | | | | | | | |
| | | | 15,760,012 | |
| | | | | | | | |
Machinery (Non-Agriculture, Non-Construct & Non-Electronic) 0.4% | |
Husky Injection Molding Systems, Ltd.
1st Lien Term Loan
4.476%, due 6/30/21 | | | 3,671,637 | | | | 3,688,159 | |
| | | | | | | | |
|
Oil & Gas 0.2% | |
Drillships Financing Holding, Inc.
Term Loan B1
TBD, due 3/31/21 (e)(g) | | | 1,440,005 | | | | 926,403 | |
MEG Energy Corp.
2017 Term Loan B
4.696%, due 12/31/23 | | | 748,125 | | | | 726,616 | |
Pacific Drilling S.A.
Term Loan B
4.750%, due 6/3/18 (e) | | | 1,493,333 | | | | 619,733 | |
| | | | | | | | |
| | | | 2,272,752 | |
| | | | | | | | |
Personal & Nondurable Consumer Products (Manufacturing Only) 0.2% | |
Array Canada, Inc.
Term Loan B
6.296%, due 2/10/23 | | | 1,490,625 | | | | 1,481,309 | |
| | | | | | | | |
|
Personal, Food & Miscellaneous Services 0.7% | |
B.C. Unlimited Liability Co.
Term Loan B3
3.504%, due 2/16/24 | | | 5,990,911 | | | | 5,980,924 | |
| | | | | | | | |
|
Printing & Publishing 0.6% | |
Springer Science & Business Media Deutschland GmbH
USD Term Loan B9
4.796%, due 8/14/20 | | | 4,014,181 | | | | 4,017,946 | |
Trader Corp.
2017 Term Loan B
4.545%, due 9/28/23 | | | 1,396,500 | | | | 1,389,517 | |
| | | | | | | | |
| | | | 5,407,463 | |
| | | | | | | | |
Telecommunications 1.0% | |
Digicel International Finance, Ltd.
2017 Term Loan B
4.940%, due 5/28/24 | | | 525,000 | | | | 528,062 | |
Intelsat Jackson Holdings S.A.
Term Loan B2
4.000%, due 6/30/19 | | | 4,139,180 | | | | 4,101,236 | |
| | | | |
| 22 | | MainStay VP Floating Rate Portfolio | | The notes to the financial statements are an integral part of,
and should be read in conjunction with, the financial statements. |
| | | | | | | | |
| | | Principal
Amount | | | Value | |
| | | | | | | | |
| Foreign Floating Rate Loans (continued) | |
Telecommunications (continued) | |
Telesat Canada
Term Loan B4
4.300%, due 11/17/23 | | $ | 4,962,563 | | | $ | 4,985,306 | |
| | | | | | | | |
| | | | | | | 9,614,604 | |
| | | | | | | | |
Total Foreign Floating Rate Loans
(Cost $98,409,778) | �� | | | | | | 97,547,576 | |
| | | | | | | | |
Total Long-Term Bonds
(Cost $928,180,632) | | | | | | | 924,313,389 | |
| | | | | | | | |
| | |
| | | | | | | | |
| | |
| | | Shares | | | | |
| Affiliated Investment Companies 0.9% | |
Fixed Income Funds 0.9% | | | | | | | | |
¨MainStay High Yield Corporate Bond Fund Class I | | | 1,354,128 | | | | 7,799,778 | |
| | | | | | | | |
Total Affiliated Investment Companies
(Cost $7,870,835) | | | | | | | 7,799,778 | |
| | | | | | | | |
| | |
| Common Stocks 0.1% | | | | | | | | |
Healthcare, Education & Childcare 0.0%‡ | |
Millennium Laboratories, Inc. (e) | | | 7,670 | | | | 11,505 | |
| | | | | | | | |
|
Oil & Gas 0.1% | |
Samson Resources Corp. (e)(h)(i) | | | 56,463 | | | | 1,054,729 | |
Templar Energy Corp. Class B (e)(h)(i) | | | 36,393 | | | | 1,772 | |
Templar Energy LLC Class A (e)(h)(i) | | | 36,029 | | | | 175,462 | |
| | | | | | | | |
| | | | | | | 1,231,963 | |
| | | | | | | | |
Total Common Stocks
(Cost $1,284,464) | | | | | | | 1,243,468 | |
| | | | | | | | |
| | |
| Preferred Stocks 0.0%‡ | | | | | | | | |
Oil & Gas 0.0%‡ | | | | | | | | |
Templar Energy Corp.
(8.00% PIK) (b)(e)(h)(i) | | | 46,306 | | | | 187,444 | |
| | | | | | | | |
Total Preferred Stocks
(Cost $227,580) | | | | | | | 187,444 | |
| | | | | | | | |
| | |
| | | | | | | | |
| | | | | | | | |
| | | Principal
Amount | | | Value | |
| | | | | | | | |
| Short-Term Investments 3.1% | |
Repurchase Agreement 0.2% | | | | | | | | |
Fixed Income Clearing Corp.
0.12%, dated 6/30/17
due 7/3/17
Proceeds at Maturity $1,998,352 (Collateralized by a United States Treasury Note with a rate of 2.125% and a maturity date of 5/15/25, with a Principal Amount of $2,045,000 and a Market Value of $2,043,252) | | $ | 1,998,332 | | | $ | 1,998,332 | |
| | | | | | | | |
Total Repurchase Agreement
(Cost $1,998,332) | | | | 1,998,332 | |
| | | | | | | | |
|
U.S. Government & Federal Agencies 2.9% | |
United States Treasury Bills (j) | |
0.710%, due 7/6/17 | | | 25,034,000 | | | | 25,031,439 | |
0.862%, due 7/20/17 | | | 1,690,000 | | | | 1,689,242 | |
| | | | | | | | |
Total U.S. Government & Federal Agencies
(Cost $26,720,681) | | | | | | | 26,720,681 | |
| | | | | | | | |
Total Short-Term Investments
(Cost $28,719,013) | | | | | | | 28,719,013 | |
| | | | | | | | |
Total Investments
(Cost $966,282,524) (k) | | | 104.4 | % | | | 962,263,092 | |
Other Assets, Less Liabilities | | | (4.4 | ) | | | (40,346,978 | ) |
Net Assets | | | 100.0 | % | | $ | 921,916,114 | |
| ‡ | Less than one-tenth of a percent. |
| (a) | May be sold to institutional investors only under Rule 144A or securities offered pursuant to Section 4(a)(2) of the Securities Act of 1933, as amended. |
| (b) | PIK (“Payment-in-Kind”)—issuer may pay interest or dividends with additional securities and/or in cash. |
| (c) | Floating rate—Rate shown was the rate in effect as of June 30, 2017. |
| (d) | Floating Rate Loan—generally pays interest at rates which are periodically re-determined at a margin above the London InterBank Offered Rate or other short-term rates. The rate shown was the weighted average interest rate of all contracts within the floating rate loan facility as of June 30, 2017. |
| (e) | Illiquid security—As of June 30, 2017, the total market value of these securities deemed illiquid under procedures approved by the Board of Trustees was $39,093,828, which represented 4.2% of the Portfolio’s net assets. |
| (g) | Issue in non-accrual status. |
| | | | | | |
The notes to the financial statements are an integral part of,
and should be read in conjunction with, the financial statements. | | | | | 23 | |
Portfolio of Investments June 30, 2017 (Unaudited) (continued)
| (h) | Fair valued security—Represents fair value as measured in good faith under procedures approved by the Board of Trustees. As of June 30, 2017, the total market value of these securities was $2,660,157, which represented 0.3% of the Portfolio’s net assets. |
| (i) | Non-income producing security. |
| (j) | Interest rate shown represents yield to maturity. |
| (k) | As of June 30, 2017, cost was $966,317,094 for federal income tax purposes and net unrealized depreciation was as follows: |
| | | | |
Gross unrealized appreciation | | $ | 6,871,667 | |
Gross unrealized depreciation | | | (10,925,669 | ) |
| | | | |
Net unrealized depreciation | | $ | (4,054,002 | ) |
| | | | |
The following abbreviation is used in the preceding pages:
TBD—To Be Determined
The following is a summary of the fair valuations according to the inputs used as of June 30, 2017, for valuing the Portfolio’s assets.
Asset Valuation Inputs
| | | | | | | | | | | | | | | | |
Description | | Quoted
Prices in
Active
Markets for
Identical
Assets (Level 1) | | | Significant
Other
Observable
Inputs (Level 2) | | | Significant
Unobservable
Inputs (Level 3) | | | Total | |
| Investments in Securities (a) | | | | | | | | | | | | | | | | |
| Long-Term Bonds | | | | | | | | | | | | | | | | |
Corporate Bonds | | $ | — | | | $ | 23,608,418 | | | $ | — | | | $ | 23,608,418 | |
Floating Rate Loans (b) | | | — | | | | 748,175,639 | | | | 54,981,756 | | | | 803,157,395 | |
Foreign Floating Rate Loans (c) | | | — | | | | 90,189,434 | | | | 7,358,142 | | | | 97,547,576 | |
| | | | | | | | | | | | | | | | |
| Total Long-Term Bonds | | | — | | | | 861,973,491 | | | | 62,339,898 | | | | 924,313,389 | |
| | | | | | | | | | | | | | | | |
| Affiliated Investment Companies | | | | | | | | | | | | | | | | |
Fixed Income Funds | | | 7,799,778 | | | | — | | | | — | | | | 7,799,778 | |
| Common Stocks (d) | | | 11,505 | | | | — | | | | 1,231,963 | | | | 1,243,468 | |
| Preferred Stocks (e) | | | — | | | | — | | | | 187,444 | | | | 187,444 | |
| Short-Term Investments | | | | | | | | | | | | | | | | |
Repurchase Agreement | | | — | | | | 1,998,332 | | | | — | | | | 1,998,332 | |
U.S. Government & Federal Agencies | | | — | | | | 26,720,681 | | | | — | | | | 26,720,681 | |
| | | | | | | | | | | | | | | | |
| Total Short-Term Investments | | | — | | | | 28,719,013 | | | | — | | | | 28,719,013 | |
| | | | | | | | | | | | | | | | |
| Total Investments in Securities | | $ | 7,811,283 | | | $ | 890,692,504 | | | $ | 63,759,305 | | | $ | 962,263,092 | |
| | | | | | | | | | | | | | | | |
| (a) | For a complete listing of investments and their industries, see the Portfolio of Investments. |
| (b) | The Level 3 securities valued at $54,981,756 are held in within the Floating Rate Loans section of the Portfolio of Investments. $53,741,006 of these Level 3 securities which were valued by a pricing service without adjustment. |
| (c) | The Level 3 securities valued at $7,358,142 are held in within the Foreign Floating Rate Loans section of the Portfolio of Investments, which were valued by a pricing service without adjustment. |
| (d) | The Level 3 securities valued at $1,231,963 are held in Oil & Gas within the Common Stocks section of the Portfolio of Investments. |
| (e) | The Level 3 security valued at $187,444 is held within the Preferred Stock section of the Portfolio of Investments. |
The Portfolio recognizes transfers between the levels as of the beginning of the period.
For the period ended June 30, 2017, the Portfolio did not have any transfers between Level 1 and Level 2 fair value measurements. (See Note 2)
As of June 30, 2017, securities with a market value of $12,268,791 transferred from Level 2 to Level 3. The transfer occurred as a result of utilizing significant unobservable inputs. As of December 31, 2016, the fair value obtained for these floating rate loans, from an independent pricing service, utilized significant observable inputs.
As of June 30, 2017, securities with a market value of $19,926,040 transferred from Level 3 to Level 1. The transfer occurred as a result of utilizing significant observable inputs. As of December 31, 2016, the fair value obtained for these floating rate loans, from an independent pricing service, utilized significant unobservable inputs.
| | | | |
| 24 | | MainStay VP Floating Rate Portfolio | | The notes to the financial statements are an integral part of,
and should be read in conjunction with, the financial statements. |
The following is a reconciliation of investments in which significant unobservable inputs (Level 3) were used in determining value:
| | | | | | | | | | | | | | | | | | | | | | | | | | | | | | | | | | | | | | | | |
Investments in Securities | | Balance
as of
December 31,
2016 | | | Accrued
Discounts
(Premiums) | | | Realized
Gain (Loss) | | | Change in
Unrealized
Appreciation
(Depreciation) | | | Purchases | | | Sales (a) | | | Transfers
into
Level 3 | | | Transfers
out of
Level 3 | | | Balance
as of
June 30,
2017 | | | Change in
Unrealized
Appreciation
(Depreciation)
from
Investments
Still Held as
of June 30,
2017 (b) | |
| Long-Term Bonds | | | | | | | | | | | | | | | | | | | | | | | | | | | | | | | | | | | | | | | | |
Floating Rate Loans | | | | | | | | | | | | | | | | | | | | | | | | | | | | | | | | | | | | | | | | |
Automobile | | $ | 2,398,676 | | | $ | 1,678 | | | $ | 15,940 | | | $ | (47,245 | ) | | $ | 2,450,014 | | | $ | (2,369,063 | ) | | $ | — | | | $ | — | | | $ | 2,450,000 | | | $ | (934 | ) |
Beverage, Food & Tobacco | | | 2,355,674 | | | | 692 | | | | 135 | | | | (58,983 | ) | | | 1,824,804 | | | | (2,228,130 | ) | | | 948,333 | | | | (80,439 | ) | | | 2,762,086 | | | | (6,859 | ) |
Broadcasting & Entertainment | | | 1,167,248 | | | | (71 | ) | | | (6,008 | ) | | | (4,046 | ) | | | — | | | | (1,157,123 | ) | | | — | | | | — | | | | — | | | | — | |
Buildings & Real Estate | | | 6,048,580 | | | | (138 | ) | | | 30 | | | | (98,680 | ) | | | 2,464,056 | | | | (5,957,631 | ) | | | — | | | | — | | | | 2,456,217 | | | | (1,723 | ) |
Chemicals, Plastics & Rubber | | | 4,135,740 | | | | 712 | | | | 1,427 | | | | 1,843 | | | | 2,146,891 | | | | (275,315 | ) | | | 1,470,862 | | | | (2,749,845 | ) | | | 4,732,315 | | | | 1,843 | |
Commercial Services | | | — | | | | — | | | | — | | | | 9,000 | | | | 895,500 | | | | — | | | | — | | | | — | | | | 904,500 | | | | 9,000 | |
Containers, Packaging & Glass | | | 5,525,922 | | | | 1,866 | | | | 1,057 | | | | (15,682 | ) | | | 3,472,538 | | | | (429,014 | ) | | | 4,292,015 | | | | (3,732,750 | ) | | | 9,115,952 | | | | (15,682 | ) |
Diversified/Conglomerate Manufacturing | | | 3,389,918 | | | | (766 | ) | | | (8,150 | ) | | | (21,151 | ) | | | — | | | | (2,186,538 | ) | | | — | | | | (1,173,313 | ) | | | — | | | | — | |
Diversified/Conglomerate Service | | | 6,746,642 | | | | 20,291 | | | | 33,846 | | | | (925 | ) | | | 3,326,939 | | | | (4,363,585 | ) | | | 1,443,306 | | | | (2,009,963 | ) | | | 5,196,551 | | | | 48,321 | |
Ecological | | | 3,028,839 | | | | 259 | | | | 18 | | | | (16,971 | ) | | | — | | | | (3,012,145 | ) | | | — | | | | — | | | | — | | | | — | |
Electronics | | | 6,761,686 | | | | 558 | | | | 1,563 | | | | 5,217 | | | | 1,895,325 | | | | (2,412,453 | ) | | | — | | | | (4,854,000 | ) | | | 1,397,896 | | | | 2,567 | |
Finance | | | 1,410,177 | | | | 1,718 | | | | 59 | | | | 2,943 | | | | 1,990,000 | | | | (7,080 | ) | | | — | | | | — | | | | 3,397,817 | | | | 2,943 | |
Healthcare, Education & Childcare | | | 2,337,585 | | | | 557 | | | | — | | | | (9,215 | ) | | | — | | | | — | | | | — | | | | — | | | | 2,328,927 | | | | (9,215 | ) |
Home and Office Furnishings, Housewares & Durable Consumer Products | | | — | | | | 636 | | | | — | | | | 11,348 | | | | 1,188,016 | | | | — | | | | — | | | | — | | | | 1,200,000 | | | | 11,348 | |
Hotels, Motels, Inns & Gaming | | | — | | | | — | | | | — | | | | 329,786 | | | | 1,747,210 | | | | — | | | | — | | | | — | | | | 2,076,996 | | | | 329,786 | |
Leisure, Amusement, Motion Pictures & Entertainment | | | 1,215,000 | | | | 576 | | | | 14,588 | | | | 836 | | | | 2,382,000 | | | | (1,603,000 | ) | | | — | | | | — | | | | 2,010,000 | | | | 836 | |
Machinery (Non-Agriculture, Non-Construct & Non-Electronic) | | | — | | | | (156 | ) | | | 247 | | | | 1,964 | | | | 1,508,804 | | | | (52,225 | ) | | | — | | | | — | | | | 1,458,634 | | | | 1,964 | |
Mining, Steel, Iron & Non-Precious Metals | | | 1,804,572 | | | | 434 | | | | (30 | ) | | | 28,686 | | | | — | | | | (7,509 | ) | | | 1,522,662 | | | | (1,804,573 | ) | | | 1,544,242 | | | | 28,686 | |
Oil & Gas | | | 917,278 | | | | 3,868 | | | | (1,862,580 | ) | | | 2,002,637 | | | | 1,759,413 | | | | (767,422 | ) | | | — | | | | — | | | | 2,053,194 | | | | (351 | ) |
Personal & Nondurable Consumer Products | | | 3,041,455 | | | | 823 | | | | 299 | | | | 32,414 | | | | 4,106,918 | | | | (3,121,539 | ) | | | — | | | | — | | | | 4,060,370 | | | | 15,942 | |
Printing & Publishing | | | 1,188,378 | | | | — | | | | — | | | | — | | | | — | | | | — | | | | — | | | | (1,188,378 | ) | | | — | | | | — | |
Retail Store | | | — | | | | — | | | | — | | | | 8,334 | | | | 1,658,333 | | | | — | | | | — | | | | — | | | | 1,666,667 | | | | 8,334 | |
Telecommunications | | | — | | | | 156 | | | | — | | | | 17,828 | | | | 792,016 | | | | — | | | | — | | | | — | | | | 810,000 | | | | 17,828 | |
Utilities | | | 5,082,765 | | | | 5,548 | | | | (6,570 | ) | | | (4,764 | ) | | | 1,215,038 | | | | (3,418,134 | ) | | | 1,475,509 | | | | (990,000 | ) | | | 3,359,392 | | | | (6,019 | ) |
Foreign Floating Rate Loans | | | | | | | | | | | | | | | | | | | | | | | | | | | | | | | | | | | | | | | | |
Broadcasting & Entertainment | | | — | | | | — | | | | — | | | | 9,375 | | | | 1,243,750 | | | | — | | | | — | | | | — | | | | 1,253,125 | | | | 9,375 | |
Chemicals, Plastics & Rubber | | | 411,570 | | | | — | | | | — | | | | (8,928 | ) | | | 201,609 | | | | (5,560 | ) | | | 1,116,104 | | | | (411,570 | ) | | | 1,303,225 | | | | (8,928 | ) |
Electronics | | | 697,486 | | | | 94 | | | | (16 | ) | | | 799 | | | | 1,117,642 | | | | (1,731 | ) | | | — | | | | — | | | | 1,814,274 | | | | 799 | |
Hotels, Motels, Inns & Gaming | | | — | | | | — | | | | — | | | | 10,000 | | | | 1,588,000 | | | | — | | | | — | | | | — | | | | 1,598,000 | | | | 10,000 | |
Media | | | 1,414,000 | | | | 109 | | | | 18 | | | | (17,118 | ) | | | — | | | | (1,397,009 | ) | | | — | | | | — | | | | — | | | | — | |
Oil & Gas | | | 931,209 | | | | — | | | | — | | | | — | | | | — | | | | — | | | | — | | | | (931,209 | ) | | | — | | | | — | |
Printing & Publishing | | | — | | | | 120 | | | | 7 | | | | (4,118 | ) | | | 1,397,009 | | | | (3,500 | ) | | | — | | | | — | | | | 1,389,518 | | | | (4,118 | ) |
Telecommunications | | | 1,130,407 | | | | 157 | | | | 5 | | | | (10,157 | ) | | | — | | | | (1,120,412 | ) | | | — | | | | — | | | | — | | | | — | |
| Common Stock | | | | | | | | | | | | | | | | | | | | | | | | | | | | | | | | | | | | | | | | |
Oil & Gas | | | 265,921 | | | | — | | | | — | | | | 41,870 | | | | 924,172 | | | | — | | | | — | | | | — | | | | 1,231,963 | | | | 41,870 | |
| Preferred Stock | | | | | | | | | | | | | | | | | | | | | | | | | | | | | | | | | | | | | | | | |
Oil & Gas | | | 284,475 | | | | — | | | | — | | | | (97,031 | ) | | | — | | | | — | | | | — | | | | — | | | | 187,444 | | | | (97,031 | ) |
| | | | | | | | | | | | | | | | | | | | | | | | | | | | | | | | | | | | | | | | |
| Total | | $ | 63,691,203 | | | $ | 39,721 | | | $ | (1,814,115 | ) | | $ | 2,099,866 | | | $ | 43,295,997 | | | $ | (35,896,118 | ) | | $ | 12,268,791 | | | $ | (19,926,040 | ) | | $ | 63,759,305 | | | $ | 390,582 | |
| | | | | | | | | | | | | | | | | | | | | | | | | | | | | | | | | | | | | | | | |
| (a) | Sales include principal reduction. |
| (b) | Included in “Net change in unrealized appreciation (depreciation) on investments” in the Statement of Operations. |
| | | | | | |
The notes to the financial statements are an integral part of,
and should be read in conjunction with, the financial statements. | | | | | 25 | |
Statement of Assets and Liabilities as of June 30, 2017 (Unaudited)
| | | | |
| Assets | |
Investment in securities, at value (identified cost $958,411,689) | | $ | 954,463,314 | |
Investment in affiliated investment company, at value (identified cost $7,870,835) | | | 7,799,778 | |
Unrealized appreciation on unfunded commitments (See Note 5) | | | 4,688 | |
Receivables: | | | | |
Investment securities sold | | | 8,646,686 | |
Dividends and interest | | | 3,578,487 | |
Fund shares sold | | | 496,684 | |
Other assets | | | 12,370 | |
| | | | |
Total assets | | | 975,002,007 | |
| | | | |
| |
| Liabilities | | | | |
Payables: | | | | |
Investment securities purchased | | | 51,809,382 | |
Fund shares redeemed | | | 555,955 | |
Manager (See Note 3) | | | 453,486 | |
NYLIFE Distributors (See Note 3) | | | 120,959 | |
Shareholder communication | | | 79,083 | |
Professional fees | | | 41,752 | |
Custodian | | | 19,751 | |
Trustees | | | 1,489 | |
Accrued expenses | | | 4,036 | |
| | | | |
Total liabilities | | | 53,085,893 | |
| | | | |
Net assets | | $ | 921,916,114 | |
| | | | |
| |
| Composition of Net Assets | | | | |
Shares of beneficial interest outstanding (par value of $.001 per share) unlimited number of shares authorized | | $ | 101,340 | |
Additional paid-in capital | | | 943,293,705 | |
| | | | |
| | | 943,395,045 | |
Undistributed net investment income | | | 270,066 | |
Accumulated net realized gain (loss) on investments and unfunded commitments | | | (17,734,253 | ) |
Net unrealized appreciation (depreciation) on investments | | | (4,019,432 | ) |
Net unrealized appreciation (depreciation) on unfunded commitments | | | 4,688 | |
| | | | |
Net assets | | $ | 921,916,114 | |
| | | | |
| | | | |
Initial Class | | | | |
Net assets applicable to outstanding shares | | $ | 335,043,513 | |
| | | | |
Shares of beneficial interest outstanding | | | 36,847,561 | |
| | | | |
Net asset value per share outstanding | | $ | 9.09 | |
| | | | |
Service Class | | | | |
Net assets applicable to outstanding shares | | $ | 586,872,601 | |
| | | | |
Shares of beneficial interest outstanding | | | 64,492,037 | |
| | | | |
Net asset value per share outstanding | | $ | 9.10 | |
| | | | |
| | | | |
| 26 | | MainStay VP Floating Rate Portfolio | | The notes to the financial statements are an integral part of,
and should be read in conjunction with, the financial statements. |
Statement of Operations for the six months ended June 30, 2017 (Unaudited)
| | | | |
| Investment Income (Loss) | |
Income | | | | |
Interest | | $ | 20,283,419 | |
Dividend distributions from an affiliated investment company | | | 251,055 | |
| | | | |
Total income | | | 20,534,474 | |
| | | | |
Expenses | | | | |
Manager (See Note 3) | | | 2,687,096 | |
Distribution/Service—Service Class (See Note 3) | | | 731,852 | |
Shareholder communication | | | 66,336 | |
Professional fees | | | 60,747 | |
Custodian | | | 11,097 | |
Trustees | | | 10,783 | |
Miscellaneous | | | 32,358 | |
| | | | |
Total expenses | | | 3,600,269 | |
| | | | |
Net investment income (loss) | | | 16,934,205 | |
| | | | |
|
| Realized and Unrealized Gain (Loss) on Investments | |
Net realized gain (loss) on investments | | | (1,032,672 | ) |
Net change in unrealized appreciation (depreciation) on investments, affiliated investments and unfunded commitments | | | (1,183,632 | ) |
| | | | |
Net realized and unrealized gain (loss) on investments and unfunded commitments and unfunded commitments | | | (2,216,304 | ) |
| | | | |
Net increase (decrease) in net assets resulting from operations | | $ | 14,717,901 | |
| | | | |
| | | | | | |
The notes to the financial statements are an integral part of,
and should be read in conjunction with, the financial statements. | | | | | 27 | |
Statements of Changes in Net Assets
for the six months ended June 30, 2017 (Unaudited) and the year ended December 31, 2016
| | | | | | | | |
| | | 2017 | | | 2016 | |
| Increase (Decrease) in Net Assets | |
| |
Operations: | |
Net investment income (loss) | | $ | 16,934,205 | | | $ | 29,905,000 | |
Net realized gain (loss) on investments | | | (1,032,672 | ) | | | (6,493,304 | ) |
Net change in unrealized appreciation (depreciation) on investments, affiliated investments and unfunded commitments | | | (1,183,632 | ) | | | 39,413,756 | |
| | | | |
Net increase (decrease) in net assets resulting from operations | | | 14,717,901 | | | | 62,825,452 | |
| | | | |
Dividends to shareholders: | |
From net investment income: | |
Initial Class | | | (6,129,882 | ) | | | (9,137,208 | ) |
Service Class | | | (10,837,660 | ) | | | (20,787,470 | ) |
| | | | |
Total dividends to shareholders | | | (16,967,542 | ) | | | (29,924,678 | ) |
| | | | |
Capital share transactions: | |
Net proceeds from sale of shares | | | 103,197,953 | | | | 175,695,490 | |
Net asset value of shares issued to shareholders in reinvestment of dividends | | | 16,967,542 | | | | 29,924,678 | |
Cost of shares redeemed | | | (65,713,286 | ) | | | (160,168,392 | ) |
| | | | |
Increase (decrease) in net assets derived from capital share transactions | | | 54,452,209 | | | | 45,451,776 | |
| | | | |
Net increase (decrease) in net assets | | | 52,202,568 | | | | 78,352,550 | |
|
| Net Assets | |
| |
Beginning of period | | | 869,713,546 | | | | 791,360,996 | |
| | | | |
End of period | | $ | 921,916,114 | | | $ | 869,713,546 | |
| | | | |
Undistributed net investment income at end of period | | $ | 270,066 | | | $ | 303,403 | |
| | | | |
| | | | |
| 28 | | MainStay VP Floating Rate Portfolio | | The notes to the financial statements are an integral part of,
and should be read in conjunction with, the financial statements. |
Financial Highlights selected per share data and ratios
| | | | | | | | | | | | | | | | | | | | | | | | | | | | |
| | | Six months
ended
June 30, | | | | | | Year ended December 31, | |
| Initial Class | | 2017* | | | | | | 2016 | | | 2015 | | | 2014 | | | 2013 | | | 2012 | |
Net asset value at beginning of period | | $ | 9.11 | | | | | | | $ | 8.74 | | | $ | 9.05 | | | $ | 9.33 | | | $ | 9.32 | | | $ | 9.07 | |
| | | | | | | | | | | | | | | | | | | | | | | | | | | | |
Net investment income (loss) (a) | | | 0.18 | | | | | | | | 0.35 | | | | 0.35 | | | | 0.36 | | | | 0.39 | | | | 0.39 | |
Net realized and unrealized gain (loss) on investments | | | (0.02 | ) | | | | | | | 0.37 | | | | (0.31 | ) | | | (0.28 | ) | | | 0.01 | | | | 0.25 | |
| | | | | | | | | | | | | | | | | | | | | | | | | | | | |
Total from investment operations | | | 0.16 | | | | | | | | 0.72 | | | | 0.04 | | | | 0.08 | | | | 0.40 | | | | 0.64 | |
| | | | | | | | | | | | | | | | | | | | | | | | | | | | |
| Less dividends: | | | | | | | | | | | | | | | | | | | | | | | | | | | | |
From net investment income | | | (0.18 | ) | | | | | | | (0.35 | ) | | | (0.35 | ) | | | (0.36 | ) | | | (0.39 | ) | | | (0.39 | ) |
| | | | | | | | | | | | | | | | | | | | | | | | | | | | |
Net asset value at end of period | | $ | 9.09 | | | | | | | $ | 9.11 | | | $ | 8.74 | | | $ | 9.05 | | | $ | 9.33 | | | $ | 9.32 | |
| | | | | | | | | | | | | | | | | | | | | | | | | | | | |
Total investment return (b) | | | 1.74 | % | | | | | | | 8.45 | % | | | 0.39 | % | | | 0.86 | % | | | 4.46 | % | | | 7.15 | % |
| Ratios (to average net assets)/Supplemental Data: | | | | | | | | | | | | | | | | | | | | | | | | | | | | |
Net investment income (loss) | | | 3.94 | %†† | | | | | | | 3.94 | %(c) | | | 3.88 | % | | | 3.89 | % | | | 4.22 | % | | | 4.25 | % |
Net expenses | | | 0.64 | %†† | | | | | | | 0.64 | %(d) | | | 0.64 | % | | | 0.64 | % | | | 0.64 | % | | | 0.65 | % |
Portfolio turnover rate | | | 24 | % | | | | | | | 36 | % | | | 35 | % | | | 48 | % | | | 49 | % | | | 47 | % |
Net assets at end of period (in 000’s) | | $ | 335,044 | | | | | | | $ | 287,373 | | | $ | 226,083 | | | $ | 205,057 | | | $ | 281,957 | | | $ | 282,716 | |
| (a) | Per share data based on average shares outstanding during the period. |
| (b) | Total return does not reflect any deduction of sales charges, mortality and expense charges, contract charges or administrative charges. For periods of less than one year, total return is not annualized. |
| (c) | Without the custody fee reimbursement, net investment income (loss) would have been 3.93%. |
| (d) | Without the custody fee reimbursement, net expenses would have been 0.65%. |
| | | | | | | | | | | | | | | | | | | | | | | | | | | | |
| | | Six months
ended
June 30, | | | | | | Year ended December 31, | |
| Service Class | | 2017* | | | | | | 2016 | | | 2015 | | | 2014 | | | 2013 | | | 2012 | |
Net asset value at beginning of period | | $ | 9.12 | | | | | | | $ | 8.75 | | | $ | 9.06 | | | $ | 9.34 | | | $ | 9.33 | | | $ | 9.08 | |
| | | | | | | | | | | | | | | | | | | | | | | | | | | | |
Net investment income (loss) (a) | | | 0.17 | | | | | | | | 0.33 | | | | 0.33 | | | | 0.34 | | | | 0.37 | | | | 0.37 | |
Net realized and unrealized gain (loss) on investments | | | (0.02 | ) | | | | | | | 0.37 | | | | (0.31 | ) | | | (0.28 | ) | | | 0.01 | | | | 0.25 | |
| | | | | | | | | | | | | | | | | | | | | | | | | | | | |
Total from investment operations | | | 0.15 | | | | | | | | 0.70 | | | | 0.02 | | | | 0.06 | | | | 0.38 | | | | 0.62 | |
| | | | | | | | | | | | | | | | | | | | | | | | | | | | |
| Less dividends: | | | | | | | | | | | | | | | | | | | | | | | | | | | | |
From net investment income | | | (0.17 | ) | | | | | | | (0.33 | ) | | | (0.33 | ) | | | (0.34 | ) | | | (0.37 | ) | | | (0.37 | ) |
| | | | | | | | | | | | | | | | | | | | | | | | | | | | |
Net asset value at end of period | | $ | 9.10 | | | | | | | $ | 9.12 | | | $ | 8.75 | | | $ | 9.06 | | | $ | 9.34 | | | $ | 9.33 | |
| | | | | | | | | | | | | | | | | | | | | | | | | | | | |
Total investment return (b) | | | 1.62 | % | | | | | | | 8.18 | % | | | 0.14 | % | | | 0.61 | % | | | 4.20 | % | | | 6.89 | % |
| Ratios (to average net assets)/Supplemental Data: | | | | | | | | | | | | | | | | | | | | | | | | | | | | |
Net investment income (loss) | | | 3.69 | %†† | | | | | | | 3.68 | %(c) | | | 3.63 | % | | | 3.65 | % | | | 3.96 | % | | | 4.00 | % |
Net expenses | | | 0.89 | %†† | | | | | | | 0.89 | %(d) | | | 0.89 | % | | | 0.89 | % | | | 0.89 | % | | | 0.90 | % |
Portfolio turnover rate | | | 24 | % | | | | | | | 36 | % | | | 35 | % | | | 48 | % | | | 49 | % | | | 47 | % |
Net assets at end of period (in 000’s) | | $ | 586,873 | | | | | | | $ | 582,341 | | | $ | 565,278 | | | $ | 581,456 | | | $ | 566,841 | | | $ | 458,609 | |
| (a) | Per share data based on average shares outstanding during the period. |
| (b) | Total return does not reflect any deduction of sales charges, mortality and expense charges, contract charges or administrative charges. For periods of less than one year, total return is not annualized. |
| (c) | Without the custody fee reimbursement, net investment income (loss) would have been 3.67%. |
| (d) | Without the custody fee reimbursement, net expenses would have been 0.90%. |
| | | | | | |
The notes to the financial statements are an integral part of,
and should be read in conjunction with, the financial statements. | | | | | 29 | |
Notes to Financial Statements (Unaudited)
Note 1–Organization and Business
MainStay VP Funds Trust (the “Fund”) was organized as a Delaware statutory trust on February 1, 2011. The Fund is registered under the Investment Company Act of 1940, as amended (the “1940 Act”), as an open-end management investment company. The Fund is comprised of thirty-two separate series (collectively referred to as the “Portfolios”). These financial statements and notes relate to the MainStay VP Floating Rate Portfolio (the “Portfolio”), a “non diversified” portfolio, as that term is defined in the 1940 Act, as interpreted or modified by regulatory authorities having jurisdiction, from time to time. Since the Portfolio has historically operated as a “diversified” portfolio, it will not operate as “non diversified” without first obtaining shareholder approval.
Shares of the Portfolio are currently offered to certain separate accounts to fund variable annuity policies and variable universal life insurance policies issued by New York Life Insurance and Annuity Corporation (“NYLIAC”), a wholly-owned subsidiary of New York Life Insurance Company (“New York Life”). NYLIAC allocates shares of the Portfolios to, among others, NYLIAC Variable Annuity Separate Accounts-I, II, III and IV, VUL Separate Account-I and CSVUL Separate Account-I (collectively, the “Separate Accounts”). Shares of the Portfolio are also offered to the MainStay VP Conservative Allocation Portfolio, MainStay VP Moderate Allocation Portfolio, MainStay VP Moderate Growth Allocation Portfolio and MainStay VP Growth Allocation Portfolio, which operate as “funds-of-funds.”
The Portfolio currently offers two classes of shares. Initial Class and Service Class shares commenced operations on May 2, 2005. Shares of the Portfolio are sold and are redeemed at a price equal to their respective net asset value (“NAV”) per share. No sales or redemption charge is applicable to the purchase or redemption of the Portfolio’s shares. Under the terms of the Fund’s multiple class plan adopted pursuant to Rule 18f-3 under the 1940 Act, the classes differ in that, among other things, Service Class shares pay a combined distribution and service fee of 0.25% of average daily net assets attributable to Service Class shares of the Portfolio to the Distributor (as defined in Note 3(B)) pursuant to a plan adopted in accordance with Rule 12b-1 under the 1940 Act. Contract owners of variable annuity contracts purchased after June 2, 2003, are permitted to invest only in the Service Class shares.
The Portfolio’s investment objective is to seek high current income.
Note 2–Significant Accounting Policies
The Portfolio is an investment company and accordingly follows the investment company accounting and reporting guidance of the Financial Accounting Standards Board (“FASB”) Accounting Standard Codification Topic 946 Financial Services—Investment Companies. The Portfolio prepares its financial statements in accordance with generally accepted accounting principles (“GAAP”) in the United States of America and follows the significant accounting policies described below.
(A) Securities Valuation. Investments are usually valued as of the close of regular trading on the New York Stock Exchange (the “Exchange”) (usually 4:00 p.m. Eastern time) on each day the Portfolio is open for business (“valuation date”).
The Board of Trustees (the “Board”) of the Fund adopted procedures establishing methodologies for the valuation of the Portfolio’s securities
and other assets and delegated the responsibility for valuation determinations under those procedures to the Valuation Committee of the Fund (the “Valuation Committee”). The Board authorized the Valuation Committee to appoint a Valuation Sub-Committee (the “Sub-Committee”) to deal in the first instance with establishing the prices of securities for which market quotations are not readily available or the prices of which are not otherwise readily determinable under these procedures. The Sub-Committee meets (in person, via electronic mail or via teleconference) on an as-needed basis. Subsequently, the Valuation Committee meets to ensure that actions taken by the Sub-Committee were appropriate. The procedures recognize that, subject to the oversight of the Board and unless otherwise noted, the responsibility for the day-to-day valuation of portfolio assets (including fair value measurements for the Portfolio’s assets and liabilities) rests with New York Life Investment Management LLC (“New York Life Investments” or the “Manager”), aided to whatever extent necessary by the Subadvisor (as defined in Note 3(A)) to the Portfolio.
To assess the appropriateness of security valuations, the Manager, the Subadvisor or the Portfolio’s third party service provider, who is subject to oversight by the Manager, regularly compares prior day prices, prices on comparable securities and the sale prices to the prior and current day prices and challenges prices with changes exceeding certain tolerance levels with third party pricing services or broker sources. For those securities valued through either a standardized fair valuation methodology or a fair valuation measurement, the Sub-Committee deals in the first instance with such valuation and the Valuation Committee reviews and affirms, if appropriate, the reasonableness of the valuation based on such methodologies and measurements on a regular basis after considering all relevant information that is reasonably available. Any action taken by the Sub-Committee with respect to the valuation of a portfolio security or other asset is submitted by the Valuation Committee to the Board for its review and ratification, if appropriate, at its next regularly scheduled meeting.
“Fair value” is defined as the price the Portfolio would reasonably expect to receive upon selling an asset or liability in an orderly transaction to an independent buyer in the principal or most advantageous market for the asset or liability. Fair value measurements are determined within a framework that establishes a three-tier hierarchy which maximizes the use of observable market data and minimizes the use of unobservable inputs to establish a classification of fair value measurements for disclosure purposes. “Inputs” refer broadly to the assumptions that market participants would use in pricing the asset or liability, including assumptions about risk, such as the risk inherent in a particular valuation technique used to measure fair value using a pricing model and/or the risk inherent in the inputs for the valuation technique. Inputs may be observable or unobservable. Observable inputs reflect the assumptions market participants would use in pricing the asset or liability based on market data obtained from sources independent of the Portfolio. Unobservable inputs reflect the Portfolio’s own assumptions about the assumptions market participants would use in pricing the asset or liability based on the information available. The inputs or methodology used for valuing assets or liabilities may not be an indication of the risks associated with investing in those assets or liabilities. The three-tier hierarchy of inputs is summarized below.
| • | | Level 1—quoted prices in active markets for an identical asset or liability |
| | |
| 30 | | MainStay VP Floating Rate Portfolio |
| • | | Level 2—other significant observable inputs (including quoted prices for a similar asset or liability in active markets, interest rates and yield curves, prepayment speeds, credit risk, etc.) |
| • | | Level 3—significant unobservable inputs (including the Portfolio’s own assumptions about the assumptions that market participants would use in measuring fair value of an asset or liability) |
The level of an asset or liability within the fair value hierarchy is based on the lowest level of an input, both individually and in the aggregate, that is significant to the fair value measurement. As of June 30, 2017, the aggregate value by input level of the Portfolio’s assets and liabilities is included at the end of the Portfolio’s Portfolio of Investments.
The Portfolio may use third party vendor evaluations, whose prices may be derived from one or more of the following standard inputs, among others:
| | |
• Benchmark yields | | • Reported trades |
| • Broker/dealer quotes | | • Issuer spreads |
| • Two-sided markets | | • Benchmark securities |
| • Bids/offers | | •Reference data (corporate actions or material event notices) |
| • Industry and economic events | | • Comparable bonds |
•Monthly payment information | | |
An asset or liability for which market values cannot be measured using the methodologies described above is valued by methods deemed reasonable in good faith by the Valuation Committee, following the procedures established by the Board, to represent fair value. Under these procedures, the Portfolio generally uses a market-based approach which may use related or comparable assets or liabilities, recent transactions, market multiples, book values, and other relevant information. The Portfolio may also use an income-based valuation approach in which the anticipated future cash flows of the asset or liability are discounted to calculate fair value. Discounts may also be applied due to the nature and/or duration of any restrictions on the disposition of the asset or liability. Fair value represents a good faith approximation of the value of a security. Fair value determinations involve the consideration of a number of subjective factors, an analysis of applicable facts and circumstances and the exercise of judgment. As a result, it is possible that the fair value for a security determined in good faith in accordance with the Portfolio’s valuation procedures may differ from valuations for the same security determined by other funds using their own valuation procedures. Although the Portfolio’s valuation procedures are designed to value a security at the price the Portfolio may reasonably expect to receive upon the security’s sale in an orderly transaction, there can be no assurance that any fair value determination thereunder would, in fact, approximate the amount that the Portfolio would actually realize upon the sale of the security or the price at which the security would trade if a reliable market price were readily available. During the six-month period ended June 30, 2017, there were no material changes to the fair value methodologies.
Securities which may be valued in this manner include, but are not limited to: (i) a security for which trading has been halted or suspended; (ii) a debt security that has recently gone into default and for which there is not a current market quotation; (iii) a security of an issuer that
has entered into a restructuring; (iv) a security that has been de-listed from a national exchange; (v) a security for which the market price is not readily available from a third party pricing source or, if so provided, does not, in the opinion of the Manager or Subadvisor, reflect the security’s market value; (vi) a security subject to trading collars for which no or limited trading takes place; and (vii) a security whose principal market has been temporarily closed at a time when, under normal conditions, it would be open. Securities for which market quotations or observable inputs are not readily available are generally categorized as Level 3 in the hierarchy. As of June 30, 2017, securities that were fair valued in such a manner are shown in the Portfolio of Investments.
Equity securities are valued at the last quoted sales prices as of the close of regular trading on the relevant exchange on each valuation date. Securities that are not traded on the valuation date are valued at the mean of the last quoted bid and ask prices. Prices are normally taken from the principal market in which each security trades. Futures contracts are valued at the last posted settlement price on the market where such futures are primarily traded. These securities are generally categorized as Level 1 in the hierarchy.
Debt securities (other than convertible and municipal bonds) are valued at the evaluated bid prices (evaluated mean prices in the case of convertible and municipal bonds) supplied by a pricing agent or brokers selected by the Manager, in consultation with the Subadvisor. Those values reflect broker/dealer supplied prices and electronic data processing techniques, if the evaluated bid or mean prices are deemed by the Manager, in consultation with the Subadvisor, to be representative of market values at the regular close of trading of the Exchange on each valuation date. Debt securities purchased on a delayed delivery basis are marked to market daily until settlement at the forward settlement date. Debt securities, including corporate bonds, U.S. government & federal agency bonds, municipal bonds, foreign bonds, convertible bonds, asset-backed securities and mortgage-backed securities are generally categorized as Level 2 in the hierarchy.
Loan assignments, participations and commitments are valued at the average of bid quotations obtained from the engaged independent pricing service and are generally categorized as Level 2 in the hierarchy. Certain loan assignments, participations and commitments may be valued by utilizing significant unobservable inputs obtained from the pricing service and are generally categorized as Level 3 in the hierarchy. As of June 30, 2017, securities that were fair valued in such a manner are shown in the Portfolio of Investments.
Temporary cash investments acquired in excess of 60 days to maturity at the time of purchase are valued using the latest bid prices or using valuations based on a matrix system (which considers such factors as security prices, yields, maturities, and ratings), both as furnished by independent pricing services. Other temporary cash investments which mature in 60 days or less at the time of purchase (“Short-Term Investments”) are valued using the amortized cost method of valuation, unless the use of such method would be inappropriate. The amortized cost method involves valuing a security at its cost on the date of purchase and thereafter assuming a constant amortization to maturity of the difference between such cost and the value on maturity date. Amortized cost approximates the current fair value of a security. Securities valued using the amortized cost method are not valued using quoted
Notes to Financial Statements (Unaudited) (continued)
prices in an active market and are generally categorized as Level 2 in the hierarchy.
The information above is not intended to reflect an exhaustive list of the methodologies that may be used to value portfolio investments. The valuation procedures permit the use of a variety of valuation methodologies in connection with valuing portfolio investments. The methodology used for a specific type of investment may vary based on the market data available or other considerations. The methodologies summarized above may not represent the specific means by which portfolio investments are valued on any particular business day.
A portfolio security or other asset may be determined to be illiquid under procedures approved by the Board. Illiquidity of a security might prevent the sale of such security at a time when the Manager or Subadvisor might wish to sell, and these securities could have the effect of decreasing the overall level of the Portfolio’s liquidity. Further, the lack of an established secondary market may make it more difficult to value illiquid securities, requiring the Portfolio to rely on judgments that may be somewhat subjective in measuring value, which could vary materially from the amount that the Portfolio could realize upon disposition. Difficulty in selling illiquid securities may result in a loss or may be costly to the Portfolio. Under the supervision of the Board, the Manager or Subadvisor determines the liquidity of the Portfolio’s investments; in doing so, the Manager or Subadvisor may consider various factors, including (i) the frequency of trades and quotations, (ii) the number of dealers and prospective purchasers, (iii) dealer undertakings to make a market, and (iv) the nature of the security and the market in which it trades (e.g., the time needed to dispose of the security, the method of soliciting offers and the mechanics of transfer). Illiquid securities are often valued in accordance with methods deemed by the Board in good faith to be reasonable and appropriate to accurately reflect their fair value. The liquidity of the Portfolio’s investments, as shown in the Portfolio of Investments and was determined as of June 30, 2017 and can change at any time in response to, among other relevant factors, market conditions or events or developments with respect to an individual issuer or instrument. As of June 30, 2017, securities deemed to be illiquid under procedures approved by the Board are shown in the Portfolio of Investments.
(B) Income Taxes. The Portfolio’s policy is to comply with the requirements of the Internal Revenue Code of 1986, as amended (the “Internal Revenue Code”), applicable to regulated investment companies and to distribute all of its taxable income to the shareholders of the Portfolio within the allowable time limits. Therefore, no federal, state and local income tax provisions are required.
Management evaluates the Portfolio’s tax positions to determine if the tax positions taken meet the minimum recognition threshold in connection with accounting for uncertainties in income tax positions taken or expected to be taken for the purposes of measuring and recognizing tax liabilities in the financial statements. Recognition of tax benefits of an uncertain tax position is permitted only to the extent the position is “more likely than not” to be sustained assuming examination by taxing authorities. Management has analyzed the Portfolio’s tax positions taken on federal, state and local income tax returns for all open tax years (for up to three tax years), and has concluded that no provisions for federal, state and local income tax are required in the Portfolio’s financial statements. The Portfolio’s federal, state and local income and federal
excise tax returns for tax years for which the applicable statutes of limitations have not expired are subject to examination by the Internal Revenue Service and state and local departments of revenue.
(C) Dividends and Distributions to Shareholders. Dividends and distributions are recorded on the ex-dividend date. Dividends from net investment income, if any, are declared daily and paid monthly and distributions from net realized capital and currency gains, if any, are declared and paid at least annually. Unless the shareholder elects otherwise, all dividends and distributions are reinvested in the same class of shares of the Portfolio, at NAV. Dividends and distributions to shareholders are determined in accordance with federal income tax regulations and may differ from GAAP.
(D) Security Transactions and Investment Income. The Portfolio records security transactions on the trade date. Realized gains and losses on security transactions are determined using the identified cost method. Dividend income is recognized on the ex-dividend date; net of any foreign tax withheld at the source, and interest income is accrued as earned using the effective interest rate method. Discounts and premiums on Short-Term Investments, for all Portfolios are accreted and amortized, respectively, on the effective interest rate method over the life of the respective securities. Discounts and premiums on Short-Term Investments are accreted and amortized, respectively, on the straight-line method. The straight-line method approximates the effective interest method for Short-Term Investments.
Investment income and realized and unrealized gains and losses on investments of the Portfolio are allocated to the separate classes of shares pro rata based upon their relative net assets on the date the income is earned or realized and unrealized gains and losses are incurred.
The Portfolio may place a debt security on non-accrual status and reduce related interest income by ceasing current accruals and writing off all or a portion of any interest receivables when the collection of all or a portion of such interest has become doubtful. A debt security is removed from non-accrual status when the issuer resumes interest payments or when collectability of interest is reasonably assured.
(E) Expenses. Expenses of the Fund are allocated to the individual Portfolios in proportion to the net assets of the respective Portfolios when the expenses are incurred, except where direct allocations of expenses can be made. Expenses (other than fees incurred under the distribution and service plans, further discussed in Note 3(B), which are charged directly to the Service Class shares) are allocated to separate classes of shares pro rata based upon their relative net assets on the date the expenses are incurred. The expenses borne by the Portfolio, including those of related parties to the Portfolio, are shown in the Statement of Operations. Additionally, the Portfolio may invest in shares of ETFs or mutual funds, which are subject to management fees and other fees that may increase their costs versus the costs of owning the underlying securities directly. These indirect expenses of ETFs or mutual funds are not included in the amounts shown as expenses on the Portfolio’s Statement of Operations or in the expense ratios included in the financial highlights.
(F) Use of Estimates. In preparing financial statements in conformity with GAAP, management makes estimates and assumptions that
| | |
| 32 | | MainStay VP Floating Rate Portfolio |
affect the reported amounts and disclosures in the financial statements. Actual results could differ from those estimates.
(G) Repurchase Agreements. The Portfolio may enter into repurchase agreements (i.e., buy a security from another party with the agreement that it be sold back in the future) to earn income. The Portfolio may enter into repurchase agreements only with counterparties, usually financial institutions, that are deemed by the Manager or Subadvisor to be creditworthy, pursuant to guidelines established by the Board. During the term of any repurchase agreement, the Manager or Subadvisor will continue to monitor the creditworthiness of the counterparty. Under the 1940 Act, repurchase agreements are considered to be collateralized loans by the Portfolio to the counterparty secured by the securities transferred to the Portfolio.
Repurchase agreements are subject to counterparty risk, meaning the Portfolio could lose money by the counterparty’s failure to perform under the terms of the agreement. The Portfolio mitigates this risk by ensuring the repurchase agreement is collateralized by cash, U.S. government securities, fixed income securities and/or other securities. The collateral is held by the Portfolio’s custodian and valued daily on a mark to market basis to determine if the value, including accrued interest, exceeds the repurchase price. In the event of the counterparty’s default on the obligation to repurchase, the Portfolio has the right to liquidate the collateral and apply the proceeds in satisfaction of the obligation. Under certain circumstances, such as in the event of default or bankruptcy by the counterparty, realization and/or retention of the collateral may be limited or subject to delay, to legal proceedings and possible realized loss to the Portfolio.
(H) Loan Assignments, Participations and Commitments. The Portfolio may invest in loan assignments and participations (“loans”). Commitments are agreements to make money available to a borrower in a specified amount, at a specified rate and within a specified time. The Portfolio records an investment when the borrower withdraws money on a commitment or when a funded loan is purchased (trade date) and records interest as earned. These loans pay interest at rates that are periodically reset by reference to a base lending rate plus a spread. These base lending rates are generally the prime rate offered by a designated U.S. bank or the London InterBank Offered Rate.
The loans in which the Portfolio may invest are generally readily marketable, but may be subject to some restrictions on resale. For example, the Portfolio may be contractually obligated to receive approval from the agent bank and/or borrower prior to the sale of these investments. If the Portfolio purchases an assignment from a lender, the Portfolio will generally have direct contractual rights against the borrower in favor of the lender. If the Portfolio purchases a participation interest either from a lender or a participant, the Portfolio typically will have established a direct contractual relationship with the seller of the participation interest, but not with the borrower. Consequently, the Portfolio is subject to the credit risk of the lender or participant who sold the participation interest to the Portfolio, in addition to the usual credit risk of the borrower. In the event that the borrower, selling participant or intermediate participants become insolvent or enters into bankruptcy, the Portfolio may incur certain costs and delays in realizing payment, or may suffer a loss of principal and/or interest.
Unfunded commitments represent the remaining obligation of the Portfolio to the borrower. At any point in time, up to the maturity date of
the issue, the borrower may demand the unfunded portion. Unfunded amounts, if any, are marked to market and any unrealized gains or losses are recorded in the Statement of Assets and Liabilities. As of June 30, 2017, the Portfolio held unfunded commitments (see Note 5).
(I) Securities Lending. In order to realize additional income, the Portfolio may engage in securities lending, subject to the limitations set forth in the 1940 Act and relevant guidance by the staff of the Securities and Exchange Commission (“SEC”). In the event the Portfolio does engage in securities lending, the Portfolio will lend through its custodian, State Street Bank and Trust Company (“State Street”). State Street will manage the Portfolio’s collateral in accordance with the lending agreement between the Portfolio and State Street, and indemnify the Portfolio against counterparty risk. The loans will be collateralized by U.S. Treasury securities at least equal at all times to the market value of the securities loaned. The Portfolio may bear the risk of delay in recovery of, or loss of rights in, the securities loaned should the borrower of the securities experience financial difficulty. The Portfolio may also record a realized gain or loss on securities deemed sold due to a borrower’s inability to return securities on loan. The Portfolio bears the risk of any loss on investment of the collateral. The Portfolio will receive compensation for lending its securities in the form of fees or it will retain a portion of interest on the investment of any cash received as collateral. The Portfolio will also continue to receive interest and dividends on the securities loaned and any gain or loss in the market price of the securities loaned that may occur during the term of the loan will be for the account of the Portfolio. During the six-month period ended June 30, 2017, the Portfolio did not have any portfolio securities on loan.
(J) Securities Risk. The ability of issuers of debt securities held by the Portfolio to meet their obligations may be affected by economic or political developments in a specific country, industry or region.
The Portfolio’s principal investments may include loans which are usually rated below investment grade and are generally considered speculative because they present a greater risk of loss, including default, than higher rated debt securities. These investments pay investors a higher interest rate than investment grade debt securities because of the increased risk of loss. Although certain loans are collateralized, there is no guarantee that the value of the collateral will be sufficient to repay the loan. In a recession or serious credit event, the value of these investments could decline significantly. As a result, the Portfolio’s NAV could go down and you could lose money. In addition, floating rate loans generally are subject to extended settlement periods that may be longer than seven days. As a result, the Portfolio may be adversely affected by selling other investments at an unfavorable time and/or under unfavorable conditions or engaging in borrowing transactions, such as borrowing against its credit facility, to raise cash to meet redemption obligations or pursue other investment opportunities. In certain circumstances, floating rate loans may not be deemed to be securities. As a result, the Portfolio may not have the protection of the anti-fraud provisions of the federal securities laws. In such cases, the Portfolio generally must rely on the contractual provisions in the loan agreement and common-law fraud protections under applicable state law.
There are certain risks involved in investing in foreign securities that are in addition to the usual risks inherent in domestic instruments. These risks include those resulting from currency fluctuations, future adverse political or economic developments and possible imposition of currency
Notes to Financial Statements (Unaudited) (continued)
exchange blockages or other foreign governmental laws or restrictions. These risks are likely to be greater in emerging markets than in developed markets. The ability of issuers of debt securities held by the Portfolios to meet their obligations may be affected by economic or political developments in a specific country, industry or region.
(K) Indemnifications. Under the Fund’s organizational documents, its officers and trustees are indemnified against certain liabilities that may arise out of performance of their duties to the Fund. Additionally, in the normal course of business, the Portfolio enters into contracts with third-party service providers that contain a variety of representations and warranties and which may provide general indemnifications. The Portfolio’s maximum exposure under these arrangements is unknown, as this would involve future claims that may be made against the Portfolio that have not yet occurred. Based on experience, management is of the view that the risk of loss in connection with these potential indemnification obligations is remote. However, there can be no assurance that material liabilities related to such obligations will not arise in the future, which could adversely impact the Portfolio.
Note 3–Fees and Related Party Transactions
(A) Manager and Subadvisor. New York Life Investments, a registered investment adviser and an indirect, wholly-owned subsidiary of New York Life, serves as the Portfolio’s Manager pursuant to an Amended and Restated Management Agreement (“Management Agreement”). The Manager provides offices, conducts clerical, recordkeeping and bookkeeping services, and keeps most of the financial and accounting records required to be maintained by the Portfolio. Except for the portion of salaries and expenses that are the responsibility of the Portfolio, the Manager pays the salaries and expenses of all personnel affiliated with the Portfolio and certain operational expenses of the Portfolio. The Portfolio reimburses New York Life Investments in an amount equal to a portion of the compensation of the Chief Compliance Officer attributable to the Portfolio. NYL Investors LLC (“NYL Investors” or “Subadvisor”), a registered investment adviser and a direct wholly-owned subsidiary of New York Life, serves as Subadvisor to the Portfolio and is responsible for the day-to-day portfolio management of Portfolio.
Pursuant to the terms of a Subadvisory Agreement (Subadvisory Agreement”) between New York Life Investments and NYL Investors, New York Life Investments pays for the services of the Subadvisor.
The Fund, on behalf of the Portfolio, pays New York Life Investments in its capacity as the Portfolio’s investment manager and administrator, pursuant to the Management Agreement, a monthly fee for services performed and facilities furnished at an annual rate of the Portfolio’s average daily net assets as follows: 0.60% to $1 billion; 0.575% from $1 billion to $3 billion; and 0.565% in excess of $3 billion. During the six-month period ended June 30, 2017, the effective management fee rate was 0.60%.
During the six-month period ended June 30, 2017, New York Life Investments earned fees from the Portfolio in the amount of $2,687,096.
State Street provides sub-administration and sub-accounting services to the Portfolio pursuant to an agreement with New York Life Investments. These services include calculating the daily NAVs of the Portfolio, maintaining the general ledger and sub-ledger accounts for the calculation of the Portfolio’s NAVs, and assisting New York Life Investments in conducting various aspects of the Portfolio’s administrative operations. For providing these services to the Portfolio, State Street is compensated by New York Life Investments.
(B) Distribution and Service Fees. The Fund, on behalf of the Portfolio, has entered into a distribution agreement with NYLIFE Distributors LLC (the “Distributor”), an indirect, wholly-owned subsidiary of New York Life. The Portfolio has adopted a distribution plan (the “Plan”) in accordance with the provisions of Rule 12b-1 under the 1940 Act. Under the Plan, the Distributor has agreed to provide, through its affiliates or independent third parties, various distribution-related, shareholder and administrative support services to the Service Class shareholders. For its services, the Distributor is entitled to a combined distribution and service fee accrued daily and paid monthly at an annual rate of 0.25% of the average daily net assets attributable to the Service Class shares of the Portfolio.
(C) Investments in Affiliates (in 000’s). During the six-month period ended June 30, 2017, purchases and sales transactions, income earned from investments and percentage of outstanding shares of Affiliated Investment Companies were as follows:
| | | | | | | | | | | | | | | | | | | | | | | | | | | | |
Affiliated Investment Company | | Value, beginning of year | | | Cost of Purchases | | | Proceeds of Sales | | | Dividend Income | | | Capital Gain Distributions Received | | | Value, end of year | | | %
Ownership | |
| | | | | | | |
| MainStay High Yield Corporate Bond Fund Class I | | $ | 7,773 | | | $ | — | | | $ | — | | | $ | 27 | | | $ | — | | | $ | 7,800 | | | | 0.1 | % |
| | | | |
Note 4–Federal Income Tax
During the year ended December 31, 2016, the tax character of distributions paid as reflected in the Statements of Changes in Net Assets was as follows:
| | |
| 2016 |
Tax-Based Distributions from Ordinary Income | | Tax-Based Distributions from Long-Term Gains |
| $29,924,678 | | $— |
Note 5–Commitments and Contingencies
As of June 30, 2017, the Portfolio had unfunded commitments pursuant to the following loan agreements:
| | | | | | | | |
Borrower | | Unfunded
Commitments | | | Unrealized
Appreciation | |
CH Hold Corp.
Delayed Draw Term Loan B 3.00%, due 2/1/24 | | $ | 180,000 | | | $ | 450 | |
Equian LLC
Delayed Draw Term Loan TBD, due 5/20/24 | | $ | 616,471 | | | $ | 4,238 | |
Total | | | | | | $ | 4,688 | |
| | | | |
Commitments are available until maturity date.
| | |
| 34 | | MainStay VP Floating Rate Portfolio |
Note 6–Custodian
State Street is the custodian of cash and securities held by the Portfolio. Custodial fees are charged to the Portfolio based on the Portfolio’s net assets and/or the market value of securities held by the Portfolio and the number of certain transactions incurred by the Portfolio.
Note 7–Line of Credit
The Portfolio and certain other funds managed by New York Life Investments, maintain a line of credit with a syndicate of banks in order to secure a source of funds for temporary purposes to meet unanticipated or excessive redemption requests.
Effective August 1, 2017, under the credit agreement (the “Credit Agreement”), the aggregate commitment amount is $600,000,000 with an additional uncommitted amount of $100,000,000. The commitment fee is an annual rate of 0.15% of the average commitment amount payable quarterly, regardless of usage, to State Street, who serves as the agent to the syndicate. The commitment fee is allocated among the Portfolio and certain other funds managed by New York Life Investments based upon their respective net assets and other factors. Interest on any revolving credit loan is charged based upon the Federal Funds Rate or the one month LIBOR, whichever is higher. The Credit Agreement expires on July 31, 2018, although the Portfolio, certain other funds managed by New York Life Investments and the syndicate of banks may renew the Credit Agreement for an additional year on the same or different terms. Prior to August 1, 2017, the aggregate commitment amount was $600,000,000 with an additional uncommitted amount of $100,000,000, and the commitment fee, under a credit agreement for which Bank of New York Mellon served as agent, was at an annual rate of 0.15% of the average commitment amount. During the six-month period ended June 30, 2017, there were no borrowings made or outstanding with respect to the Portfolio under the credit agreement for which Bank of New York served as agent.
Note 8–Interfund Lending Program
Pursuant to an exemptive order issued by the SEC, the Portfolio, along with certain other funds managed by New York Life Investments, may participate in an interfund lending program. The interfund lending program provides an alternative credit facility that permits the Portfolio and certain other funds managed by New York Life Investments to lend or borrow money for temporary purposes directly to or from one another subject to the conditions of the exemptive order. During the six-month period ended June 30, 2017, there were no interfund loans made or outstanding with respect to the Portfolio.
Note 9–Purchases and Sales of Securities (in 000’s)
During the six-month period ended June 30, 2017, purchases and sales of securities, other than short-term securities, were $289,998 and $211,932, respectively.
Note 10–Capital Share Transactions
Transactions in capital shares for the six-month period ended June 30, 2017, and the year ended December 31, 2016, were as follows:
| | | | | | | | |
| | | Shares | | | Amount | |
Six-month period ended June 30, 2017: | | | | | | | | |
Shares sold | | | 5,487,309 | | | $ | 50,129,397 | |
Shares issued to shareholders in reinvestment of dividends and distributions | | | 672,044 | | | | 6,129,882 | |
Shares redeemed | | | (843,561 | ) | | | (7,699,301 | ) |
| | | | |
Net increase (decrease) | | | 5,315,792 | | | $ | 48,559,978 | |
| | | | |
Year ended December 31, 2016: | | | | | | | | |
Shares sold | | | 10,616,181 | | | $ | 95,242,947 | |
Shares issued to shareholders in reinvestment of dividends and distributions | | | 1,021,510 | | | | 9,137,208 | |
Shares redeemed | | | (5,976,244 | ) | | | (52,481,853 | ) |
| | | | |
Net increase (decrease) | | | 5,661,447 | | | $ | 51,898,302 | |
| | | | |
|
| |
Service Class | | Shares | | | Amount | |
Six-month period ended June 30, 2017: | | | | | | | | |
Shares sold | | | 5,811,133 | | | $ | 53,068,556 | |
Shares issued to shareholders in reinvestment of dividends and distributions | | | 1,187,184 | | | | 10,837,660 | |
Shares redeemed | | | (6,352,630 | ) | | | (58,013,985 | ) |
| | | | |
Net increase (decrease) | | | 645,687 | | | $ | 5,892,231 | |
| | | | |
Year ended December 31, 2016: | | | | | | | | |
Shares sold | | | 8,986,272 | | | $ | 80,452,543 | |
Shares issued to shareholders in reinvestment of dividends and distributions | | | 2,324,999 | | | | 20,787,470 | |
Shares redeemed | | | (12,097,628 | ) | | | (107,686,539 | ) |
| | | | |
Net increase (decrease) | | | (786,357 | ) | | $ | (6,446,526 | ) |
| | | | |
Note 11–Recent Accounting Pronouncement
In October 2016, the SEC adopted new rules and amended existing rules (together, “final rules”) intended to modernize the reporting and disclosure of information by registered investment companies. In part, the final rules amend Regulation S-X and require standardized, enhanced disclosure about derivatives in investment company financial statements, as well as other amendments. The compliance date for the amendments to Regulation S-X is August 1, 2017 and applies to shareholder reports for funds with fiscal periods ending after August 1, 2017. Management is currently evaluating the impact that the adoption of the amendments to Regulation S-X will have on the Portfolio’s financial statements and related disclosures.
Note 12–Subsequent Events
In connection with the preparation of the financial statements of the Portfolio as of and for the six-month period ended June 30, 2017, events and transactions subsequent to June 30, 2017, through the date the financial statements were issued have been evaluated by the Portfolio’s management for possible adjustment and/or disclosure. No subsequent events requiring financial statement adjustment or disclosure have been identified.
Proxy Voting Policies and Procedures and Proxy Voting Record
A description of the policies and procedures that New York Life Investments uses to vote proxies related to the Portfolio’s securities is available without charge, upon request, (i) by calling 800-598-2019 or (ii) by visiting the SEC’s website at www.sec.gov.
The Portfolio is required to file with the SEC its proxy voting record for the 12-month period ending June 30 on Form N-PX. The Portfolio’s most recent Form N-PX or proxy voting record is available free of charge upon request (i) by calling 800-598-2019 or; (ii) by visiting the SEC’s website at www.sec.gov.
Shareholder Reports and Quarterly Portfolio Disclosure
The Portfolio is required to file its complete schedule of portfolio holdings with the SEC for its first and third fiscal quarters on Form N-Q. The Portfolio’s Form N-Q is available without charge on the SEC’s website at www.sec.gov or by calling MainStay Investments at 800-598-2019. You also can obtain and review copies of Form N-Q by visiting the SEC’s Public Reference Room in Washington, DC (information on the operation of the Public Reference Room may be obtained by calling 1-800-SEC-0330).
| | |
| 36 | | MainStay VP Floating Rate Portfolio |
This page intentionally left blank
This page intentionally left blank
MainStay VP Portfolios
MainStay VP offers a wide range of Portfolios. The full array of MainStay VP offerings is listed here, with information about the manager, subadvisors, legal counsel, and independent registered public accounting firm.
Equity Portfolios
MainStay VP Common Stock Portfolio
MainStay VP Cornerstone Growth Portfolio
MainStay VP Eagle Small Cap Growth Portfolio
MainStay VP Emerging Markets Equity Portfolio
MainStay VP Epoch U.S. Equity Yield Portfolio
MainStay VP Epoch U.S. Small Cap Portfolio
MainStay VP International Equity Portfolio
MainStay VP Large Cap Growth Portfolio
MainStay VP MFS® Utilities Portfolio
MainStay VP Mid Cap Core Portfolio
MainStay VP S&P 500 Index Portfolio
MainStay VP Small Cap Core Portfolio
MainStay VP T. Rowe Price Equity Income Portfolio
MainStay VP VanEck Global Hard Assets Portfolio
Mixed Asset Portfolios
MainStay VP Balanced Portfolio
MainStay VP Convertible Portfolio
MainStay VP Cushing Renaissance Advantage Portfolio
MainStay VP Income Builder Portfolio
MainStay VP Janus Henderson Balanced Portfolio
Income Portfolios
MainStay VP Bond Portfolio
MainStay VP Floating Rate Portfolio
MainStay VP Government Portfolio
MainStay VP High Yield Corporate Bond Portfolio
MainStay VP Indexed Bond Portfolio
MainStay VP PIMCO Real Return Portfolio
MainStay VP Unconstrained Bond Portfolio
Money Market
MainStay VP U.S. Government Money Market Portfolio
Alternative
MainStay VP Absolute Return Multi-Strategy Portfolio
Asset Allocation Portfolios
MainStay VP Conservative Allocation Portfolio
MainStay VP Growth Allocation Portfolio
MainStay VP Moderate Allocation Portfolio
MainStay VP Moderate Growth Allocation Portfolio
Manager
New York Life Investment Management LLC
New York, New York
Subadvisors
Candriam Belgium*
Brussels, Belgium
Candriam France S.A.S.*
Paris, France
Cornerstone Capital Management Holdings LLC*
New York, New York
Cushing Asset Management, LP
Dallas, Texas
Eagle Asset Management, Inc.
St Petersburg, Florida
Epoch Investment Partners, Inc.
New York, New York
Janus Capital Management LLC
Denver, Colorado
MacKay Shields LLC*
New York, New York
Massachusetts Financial Services Company
Boston, Massachusetts
NYL Investors LLC*
New York, New York
Pacific Investment Management Company LLC
Newport Beach, California
T. Rowe Price Associates, Inc.
Baltimore, Maryland
Van Eck Associates Corporation
New York, New York
Winslow Capital Management, LLC
Minneapolis, Minnesota
Distributor
NYLIFE Distributors LLC*
Jersey City, New Jersey
Custodian
State Street Bank and Trust Company
Boston, Massachusetts
Independent Registered Public Accounting Firm
PricewaterhouseCoopers LLP
New York, New York
Legal Counsel
Dechert LLP
Washington, District of Columbia
Some Portfolios may not be available in all products.
* An affiliate of New York Life Investment Management LLC
Not part of the Semiannual Report
2017 Semiannual Report
This report is for the general information of New York Life Variable Annuities and NYLIAC Variable Universal Life Insurance Products policyowners. It must be preceded or accompanied by the appropriate product(s) and funds prospectuses if it is given to anyone who is not an owner of a New York Life variable annuity policy or a NYLIAC Variable Universal Life Insurance Product. This report does not offer for sale or solicit orders to purchase securities.
The performance data quoted in this report represents past performance. Past performance is no guarantee of future results. Due to market volatility and other factors, current performance may be lower or higher than the figures shown. The most recent month-end performance summary for your variable annuity or variable life policy is available by calling 800-598-2019 and is updated periodically on www.newyorklife.com.
The New York Life Variable Annuities and NYLIAC Variable Universal Life Insurance Products are issued by New York Life Insurance and Annuity Corporation (a Delaware Corporation) and distributed by NYLIFE Distributors LLC (Member FINRA/SIPC).
New York Life Insurance Company
New York Life Insurance and Annuity Corporation (NYLIAC) (A Delaware Corporation)
51 Madison Avenue, Room 551
New York, NY 10010
www.newyorklife.com
Printed on recycled paper
mainstayinvestments.com
NYLIFE Distributors LLC, 30 Hudson Street, Jersey City, NJ 07302
New York Life Investment Management LLC is the investment manager to the MainStay VP Funds Trust
©2017 by NYLIFE Distributors LLC. All rights reserved.
You may obtain copies of the Prospectus and the Statement of Additional Information free of charge, upon request, by calling toll-free 800-598-2019 or writing to New York Life Insurance and Annuity Corporation, 51 Madison Avenue, New York, NY 10010.
| | | | |
| Not FDIC Insured | | No Bank Guarantee | | May Lose Value |
| | | | |
| 1744152 | | | | MSVPFR10-08/17 (NYLIAC) NI518 |
MainStay VP Allocation Portfolios
Message from the President and Semiannual Report
Unaudited | June 30, 2017

MainStay VP Conservative Allocation Portfolio
MainStay VP Moderate Allocation Portfolio
MainStay VP Moderate Growth Allocation Portfolio
MainStay VP Growth Allocation Portfolio
Sign up for electronic delivery of your shareholder reports. For full details on electronic delivery, including who can participate and what you
can receive via eDelivery, please log on to www.newyorklife.com/vsc

This page intentionally left blank
Message from the President
The six months ended June 30, 2017, brought positive results to many stock and bond investors. The year began with many investors hoping that Republican control of the White House, the Senate and the House of Representatives could bring an end to political gridlock; and while debate has continued on a number of issues, the U.S. stock market climbed relatively steadily throughout the first half of 2017.
According to FTSE-Russell U.S. market data, stocks at all capitalization levels tended to record positive total returns during the reporting period, with large-cap stocks generally outperforming stocks of smaller-capitalization companies. Growth stocks outpaced value stocks at every capitalization level by substantial margins—from more than six percentage points for micro-caps and mid-caps to more than 10 percentage points for the largest 200 U.S. companies by market capitalization.
Most sectors of the stock market advanced during the reporting period, with energy and telecommunication services being notable exceptions. Energy stocks declined as oil prices fell despite moves by the Organization of Petroleum Exporting Countries (OPEC) intended to limit oil production by its members. Telecommunication services stocks tended to decline as competition increased and rising interest rates made dividend payouts less appealing.
In March and June of 2017, the Federal Reserve announced successive increases in the target range for the federal funds rate, ultimately bringing the federal funds target range to 1.00% to 1.25%. While short-term U.S. Treasury yields rose in response, yields for U.S. Treasury securities with maturities of five years or longer declined. As the difference between short- and long-term yields narrowed, the advantages of higher-yielding long-term bonds became increasingly apparent.
Virtually all taxable and tax-exempt bond sectors provided positive total returns during the reporting period. Mortgage-backed
securities, though providing positive total returns, faced headwinds when the Federal Reserve announced plans to begin normalizing its balance sheet by reducing reinvestment of principal payments on mortgage-backed securities.
International stock and bond markets were also strong during the reporting period. International stocks provided double-digit total returns that were surpassed by emerging-market stocks as a whole. Global investment-grade bonds provided single-digit returns; and emerging-market debt was somewhat stronger.
Even during periods of favorable market performance and generally positive returns, MainStay believes that it is important to carefully monitor your investments. Your risk tolerance may
change over time, leading you to reevaluate which MainStay VP Portfolios are most appropriate for your long-term goals. Your goals themselves may also change, leading you to pursue investments with more or less risk. The portfolio managers of MainStay VP Portfolios seek to provide results consistent with the investment objectives of their respective Portfolios, to give you a wide range of choices suitable to various investment needs.
The report that follows provides more detailed information about the specific markets, securities and investment decisions that influenced your MainStay VP Portfolio(s) during the six months ended June 30, 2017. We invite you to review the report carefully as part of your ongoing investment evaluation and review.
Sincerely,

Stephen P. Fisher
President
The opinions expressed are as of the date of the accompanying report and are subject to change. Past performance is no guarantee of future results. There is no guarantee that any forecasts made will come to pass. This material does not constitute investment advice and is not intended as an endorsement of any specific investment.
Not all MainStay VP Portfolios and/or share classes are available under all policies.
Not part of the Semiannual Report
Table of Contents
Investors should refer to the Portfolio’s Summary Prospectus and/or Prospectus and consider the Portfolio’s investment objectives, strategies, risks, charges and expenses carefully before investing. The Summary Prospectus and/or Prospectus contain this and other information about the Portfolio. You may obtain copies of the Portfolio’s Summary Prospectus and/or the Prospectus and the Statement of Additional Information free of charge, upon request, by calling toll-free 800-598-2019, by writing to New York Life Insurance and Annuity Corporation, 51 Madison Avenue, Room 251, New York, New York 10010 or by sending an email to MainStayShareholdersServices@nylim.com. These documents are also available at mainstayinvestments.com/vpdocuments. Please read the Summary Prospectus and/or Prospectus carefully before investing. MainStay VP Funds Trust portfolios are separate account options which are purchased through a variable insurance or variable annuity contract.
MainStay VP Conservative Allocation Portfolio
Investment and Performance Comparison1 (Unaudited)
Performance data quoted represents past performance. Past performance is no guarantee of future results. Because of market volatility and other factors, current performance may be lower or higher than the figures shown. Investment return and principal value will fluctuate, and as a result, when shares are redeemed, they may be worth more or less than their original cost. The performance table and graph do not reflect any deduction of sales charges, mortality and expense charges, contract charges, or administrative charges. Please refer to the Performance Summary appropriate for your policy. For performance information current to the most recent month-end, please call 800-598-2019 or visit www.newyorklife.com.
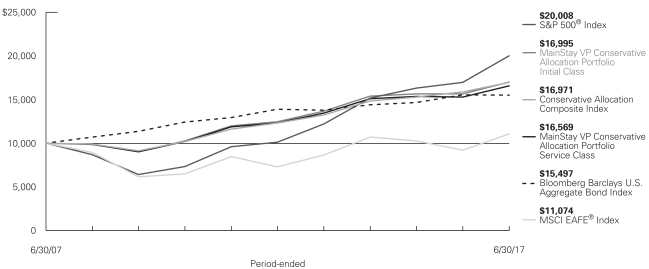
Average Annual Total Returns for the Period Ended June 30, 2017
| | | | | | | | | | | | | | | | |
| Class | | Inception
Date | | Six Months | | One Year | | Five Years | | Ten Years | | | Gross
Expense
Ratio2 | |
| Initial Class Shares | | 2/13/2006 | | 4.96% | | 8.63% | | 6.41% | | | 5.45 | % | | | 0.93 | % |
| Service Class Shares | | 2/13/2006 | | 4.83 | | 8.35 | | 6.14 | | | 5.18 | | | | 1.18 | |
| | | | | | | | | | | | | | | | |
| Benchmark Performance | | Six
Months | | | One
Year | | | Five
Years | | | Ten
Years | |
S&P 500® Index3 | | | 9.34 | % | | | 17.90 | % | | | 14.63 | % | | | 7.18 | % |
MSCI EAFE® Index4 | | | 13.81 | | | | 20.27 | | | | 8.69 | | | | 1.03 | |
Bloomberg Barclays U.S. Aggregate Bond Index5 | | | 2.27 | | | | –0.31 | | | | 2.21 | | | | 4.48 | |
Conservative Allocation Composite Index6 | | | 5.49 | | | | 6.91 | | | | 6.60 | | | | 5.43 | |
Average Lipper Variable Products Mixed-Asset Target Allocation Conservative Portfolio7 | | | 4.67 | | | | 6.13 | | | | 5.03 | | | | 4.25 | |
| 1. | Performance figures reflect certain fee waivers and/or expense limitations, without which total returns may have been different. For information on current fee waivers and/or expense limitations (if any), please refer to the Notes to Financial Statements. |
| 2. | The gross expense ratios presented reflect the Portfolio’s “Total Annual Portfolio Operating Expenses” from the most recent Prospectus and may differ from other expense ratios disclosed in this report. |
| 3. | The S&P 500® Index is the Portfolio’s primary broad-based securities market index for comparison purposes. “S&P 500®” is a trademark of The McGraw-Hill Companies, Inc. The S&P 500® Index is widely regarded as the standard index for measuring large-cap U.S. stock market performance. Results assume reinvestment of all dividends and capital gains. An investment cannot be made directly in an index. |
| 4. | The MSCI EAFE® Index is the Portfolio’s secondary benchmark. The MSCI EAFE® Index consists of international stocks representing the developed world outside of North America. Results assume reinvestment of all dividends and capital gains. An investment cannot be made directly in an index. |
| 5. | The Portfolio has selected the Bloomberg Barclays U.S. Aggregate Bond Index as an additional benchmark. The Bloomberg Barclays U.S. Aggregate Bond Index is a broad-based benchmark that measures performance of the |
| | investment-grade, U.S. dollar-denominated, fixed-rate taxable bond market, including Treasurys, government-related and corporate securities, mortgage-backed securities (agency fixed-rate and hybrid adjustable-rate mortgage pass-throughs), asset-backed securities and commercial mortgage-backed securities. Results assume reinvestment of all dividends and capital gains. An investment cannot be made directly in an index. |
| 6. | The Portfolio has selected the Conservative Allocation Composite Index as an additional benchmark. The Conservative Allocation Composite Index consists of the S&P 500® Index, the MSCI EAFE® Index and the Bloomberg Barclays U.S. Aggregate Bond Index weighted 30%, 10% and 60%, respectively. Results assume reinvestment of all dividends and capital gains. An investment cannot be made directly in an index. |
| 7. | The Average Lipper Variable Products Mixed-Asset Target Allocation Conservative Portfolio is representative of portfolios that, by portfolio practice, maintain a mix of between 20%-40% equity securities, with the remainder invested in bonds, cash and cash equivalents. This benchmark is a product of Lipper Inc. Lipper Inc. is an independent monitor of fund performance. Results are based on average total returns of similar portfolios with all dividend and capital gain distributions reinvested. |
The footnotes are an integral part of the table and graph and should be carefully read in conjunction with them.
Cost in Dollars of a $1,000 Investment in MainStay VP Conservative Allocation Portfolio (Unaudited)
The example below is intended to describe the fees and expenses borne by shareholders during the six-month period from January 1, 2017 to June 30, 2017, and the impact of those costs on your investment.
Example
As a shareholder of the Portfolio, you incur two types of costs: (1) transaction costs, including exchange fees and sales charges (loads) on purchases (as applicable), and (2) ongoing costs, including management fees, distribution and/or service (12b-1) fees, and other Portfolio expenses (as applicable). This example is intended to help you understand your ongoing costs (in dollars) of investing in the Portfolio and to compare these costs with the ongoing costs of investing in other mutual funds. The example is based on an investment of $1,000 made at the beginning of the six-month period and held for the entire period from January 1, 2017 to June 30, 2017. Shares are only sold in connection with variable life and annuity contracts and the example does not reflect any contract level or transactional fees or expenses. If these costs had been included, your costs would have been higher.
This example illustrates your Portfolio’s ongoing costs in two ways:
Actual Expenses
The second and third data columns in the table below provide information about actual account values and actual expenses. You may use the information in these columns, together with the amount you invested, to estimate the expenses that you paid during the six months ended June 30, 2017. Simply divide your account value by $1,000
(for example, an $8,600 account value divided by $1,000 = 8.6), then multiply the result by the number under the heading entitled “Expenses Paid During Period” to estimate the expenses you paid on your account during this period.
Hypothetical Example for Comparison Purposes
The fourth and fifth data columns in the table below provide information about hypothetical account values and hypothetical expenses based on the Portfolio’s actual expense ratio and an assumed rate of return of 5% per year before expenses, which is not the Portfolio’s actual return. The hypothetical account values and expenses may not be used to estimate the actual ending account balances or expenses you paid for the six-month period shown. You may use this information to compare the ongoing costs of investing in the Portfolio with the ongoing costs of investing in other mutual funds. To do so, compare this 5% hypothetical example with the 5% hypothetical examples that appear in the shareholder reports of the other mutual funds.
Please note that the expenses shown in the table are meant to highlight your ongoing costs only and do not reflect any transactional costs, such as exchange fees or sales charges (loads). Therefore, the fourth and fifth data columns of the table are useful in comparing ongoing costs only and will not help you determine the relative total costs of owning different funds. In addition, if these transactional costs were included, your costs would have been higher.
| | | | | | | | | | | | | | | | | | | | | | |
| | | | | | | | | | | | | | | | | | |
| Share Class | | Beginning
Account
Value
1/1/17 | | | Ending Account
Value (Based
on Actual
Returns and
Expenses)
6/30/17 | | | Expenses
Paid
During
Period1 | | | Ending Account
Value (Based
on Hypothetical
5% Annualized
Return and
Actual Expenses)
6/30/17 | | | Expenses
Paid
During
Period1 | | | Net Expense
Ratio
During
Period2 |
| | | | | | |
| Initial Class Shares | | $ | 1,000.00 | | | $ | 1,049.60 | | | $ | 0.15 | | | $ | 1,024.60 | | | $ | 0.15 | | | 0.03% |
| | | | | | |
| Service Class Shares | | $ | 1,000.00 | | | $ | 1,048.30 | | | $ | 1.42 | | | $ | 1,023.40 | | | $ | 1.40 | | | 0.28% |
| 1. | Expenses are equal to the Portfolio’s annualized expense ratio of each class multiplied by the average account value over the period, divided by 365 and multiplied by 181 (to reflect the six-month period). The table above represents the actual expenses incurred during the six-month period. In addition to the fees and expenses which the Portfolio bears directly, the Portfolio indirectly bears a pro rata share of the fees and expenses of the Underlying Portfolios/Funds in which it invests. Such indirect expenses are not included in the above-reported expense figures. |
| 2. | Expenses are equal to the Portfolio’s annualized expense ratio to reflect the six-month period. |
| | |
| 6 | | MainStay VP Conservative Allocation Portfolio |
Investment Objectives of Underlying Portfolios/Funds as of June 30, 2017 (Unaudited)
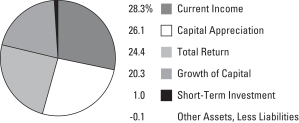
See Portfolio of Investments beginning on page 11 for specific holdings within these categories.
Portfolio Management Discussion and Analysis (Unaudited)
Answers to the questions reflect the views of portfolio managers Jae S.Yoon, CFA, Jonathan Swaney, Poul Kristensen, CFA, and Amit Soni, CFA, of New York Life Investments,1 the Portfolio’s Manager.
How did MainStay VP Conservative Allocation Portfolio perform relative to its benchmarks and peers during the six months ended June 30, 2017?
For the six months ended June 30, 2017, MainStay VP Conservative Allocation Portfolio returned 4.96% for Initial Class shares and 4.83% for Service Class shares. Over the same period, both share classes underperformed the 9.34% return of the S&P 500® Index,2 which is the Portfolio’s primary benchmark, and the 13.81% return of the MSCI EAFE® Index,2 which is a secondary benchmark of the Portfolio. For the six months ended June 30, 2017, both share classes outperformed the 2.27% return of the Bloomberg Barclays U.S. Aggregate Bond Index2 but underperformed the 5.49% return of the Conservative Allocation Composite Index.2 These two indices are additional benchmarks of the Portfolio. Over the same period, both share classes outperformed the 4.67% return of the Average Lipper3 Variable Products Mixed-Asset Target Allocation Conservative Portfolio.
What factors affected the Portfolio’s relative performance during the reporting period?
The Portfolio is a “fund of funds,” meaning that it seeks to achieve its investment objective by investing primarily in mutual funds and exchange-traded funds (“ETFs”) managed by New York Life Investments or its affiliates (the “Underlying Portfolios/Funds”). The Underlying Portfolios/Funds may invest in various instruments, including fixed-income securities and domestic or international stocks at various capitalization levels. The Portfolio’s primary benchmark, the S&P 500® Index, on the other hand, consists entirely of U.S. large-cap stocks. These differences—particularly the Portfolio’s holdings in Underlying Portfolios/Funds that invest in investment-grade bonds—largely accounted for the Portfolio’s underperformance of its primary benchmark during the reporting period because investment-grade bonds in the aggregate tended to underperform U.S. large-cap stocks by a substantial margin during the reporting period. The Conservative Allocation Composite Index reflects a broader mix of asset classes than the S&P 500® Index and offers an alternative yardstick against which to measure the performance of the Portfolio.
Asset class policy in the aggregate had relatively little impact on the Portfolio’s active return during the reporting period. Because we anticipated strong domestic growth spurred in part by policy stimulus, the Portfolio was skewed in favor of Underlying Equity Portfolios/Funds that invested in the United States rather than in international markets. This positioning proved to be a drag on
performance, as policy developments progressed more slowly than expected at home while growth overseas was stronger than expected. For similar reasons, a tilt toward small-cap stocks detracted from relative performance. Offsetting these factors was a bias toward emerging-market equities and an allocation to an Underlying Portfolio/Fund that invested in convertible bonds, which lifted returns in the fixed-income portion of the Portfolio.
More influential than asset allocation decisions were the Underlying Portfolios/Funds the Portfolio selected to gain exposure to those asset classes. A few Underlying Portfolio/Fund investments proved problematic, the most material of which was a position in MainStay VP Absolute Return Multi-Strategy Portfolio that lost value while other Underlying Fixed-Income Portfolios/Funds from which this position was funded performed well. Returns were also reduced by investments in Underlying Portfolios/Funds that invested in commodity-related equities, such as MainStay Cushing MLP Premier Fund, MainStay VP Cushing Renaissance Advantage Portfolio and IndexIQ Global Resources ETF. Capital investment in supply capacity has been greatly curtailed over the past few years, even as global demand has continued to grow. We anticipated that this dynamic could lead to higher commodity prices and rising profits for commodity producers, but these results were not seen during the reporting period. In addition, the Portfolio’s use of a currency hedged fund to gain exposure to international equities also weighed on results, as foreign currencies generally strengthened in relation to the U.S. dollar. Together, these Underlying Portfolio/Fund selection decisions cost the Portfolio close to 0.5% in return.
How did you allocate the Portfolio’s assets during the reporting period and why?
We considered a variety of information, including the portfolio-level characteristics of the Underlying Portfolios/Funds, such as capitalization, style biases, sector exposures, credit quality and duration.4 We also examined the attributes of the holdings of the Underlying Portfolios/Funds, such as valuation metrics, earnings data and technical indicators. Generally speaking, we seek to invest the Portfolio’s assets in Underlying Portfolios/Funds that correspond well to our desired asset class exposures and appear positioned to benefit from the current economic environment. Our desired asset class exposures include attractively valued market segments that we believe enjoy strong price and earnings momentum.
Risk exposure did not stray particularly far from that of the Conservative Allocation Composite Index during the reporting
| 1. | “New York Life Investments” is a service mark used by New York Life Investment Management Holdings LLC and its subsidiary New York Life Investment Management LLC. |
| 2. | See footnote on page 5 for more information on this index. |
| 3. | See footnote on page 5 for more information on Lipper Inc. |
| 4. | Duration is a measure of the price sensitivity of a fixed-income investment to changes in interest rates. Duration is expressed as a number of years and is considered a more accurate sensitivity gauge than average maturity. |
| | |
| 8 | | MainStay VP Conservative Allocation Portfolio |
period. Balancing our concerns over rich valuations and potentially destabilizing geopolitical risks with our assessment of an otherwise very healthy economy and the potential for policy stimulus to drive growth higher, the Portfolio came into the year roughly neutral in terms of its stock/bond blend, but with a bias toward U.S. companies over those based in other developed nations and with a moderate preference for small-cap companies. With the market leveling off through the winter, the Trump policy agenda stalling and events in Europe looking potentially ominous, we pulled back equity sensitivity slightly heading into the spring months. Following a strong earnings season, surprisingly robust growth abroad and a resounding defeat of Marine LePen and her National Front party in France, we retraced those steps and maintained a modest “risk-on” posture at the end of the reporting period.
There were also some policy adjustments within asset classes. Having tactically pulled back on small-cap stocks in the wake of a sharp rally late in 2016, we reversed course and reestablished a preference for small-cap companies after a period of underperformance in the first part of 2017.
This positioning reflected our belief that small-cap companies were likely to be among the preferred beneficiaries of corporate tax reform, deregulation, trade negotiations and strong domestic consumption.
Another change was in the Portfolio’s exposure to high-yield bonds. As credit spreads5 compressed significantly throughout 2016, we elected to reduce the Portfolio’s exposure to Underlying Portfolios/Funds that invested in high-yield bonds. We finished the reporting period with high-yield exposure approximately neutral to that of the Conservative Allocation Composite Index.
Our perception of opportunities in Europe—and internationally in general—evolved during the reporting period. For some time, we have been encouraged by available economic data and have perceived relative equity valuations to be attractive. Even so, the potential for disruptive political events dissuaded us from investing heavily in international stocks. With polls suggesting a high likelihood that a centrist would win in France’s presidential election, we determined that we were more pessimistic than was justified, and we increased the Portfolio’s exposure at the margins. The Portfolio continued to add exposure to Underlying Portfolios/Funds that invest in international stocks, as we believed that U.S. economic expansion appeared quite mature while economies in other parts of the world appeared to be earlier in their respective cycles with more room for growth.
How did the Portfolio’s allocations change over the course of the reporting period?
A position in an Underlying Portfolio/Fund that invests in convertible bonds, first established late in 2016, was enlarged materially early in 2017. In our opinion, economic conditions were favorable for corporate profit growth and corresponding stock price gains, but investor sentiment appeared fragile and prone to being swayed by fast-changing political developments. Exposure to convertible bonds would allow the Portfolio to participate in the equity rally that we anticipated while providing a measure of protection on the downside should our expectations fail to be met.
We decided to increase the Portfolio’s exposure to international equities with an emphasis on European and emerging-market companies. This positioning reflected our belief that the discount on the valuation of these stocks was excessive and that these stocks offered more compelling growth opportunities than those in the United States.
We reduced the Portfolio’s exposure to high-yield bonds in response to narrowing credit spreads. A position in MainStay High Yield Opportunities Fund was eliminated, and we reduced the Portfolio’s allocation to MainStay VP High Yield Corporate Bond Portfolio. We also shifted some assets into IQ S&P High Yield Low Volatility Bond ETF, which seeks to avoid some of the most vulnerable credits within the high-yield universe, offering a more conservative way to access high-yield bonds.
The Portfolio also closed its position in MainStay High Yield Municipal Bond Fund. Municipal bonds became less expensive than taxable bonds following the U.S. election on fear that tax reform might limit or eliminate the tax advantages of municipal bonds. We saw the risk of a material change as relatively remote and bought shares of MainStay High Yield Municipal Bond Fund for the Portfolio in early December 2016. Over the winter months, prices on municipal bonds reverted back toward a more traditional relationship to taxable bonds, and we unwound the trade at a profit.
We initiated a position in MainStay VP Cornerstone Growth Portfolio, which the Portfolio had not owned for several years. A new management team assumed responsibility for MainStay VP Cornerstone Growth Portfolio last summer, introducing a quantitative discipline with which we were very familiar and altogether comfortable. The investment was funded primarily by reducing the Portfolio’s position in MainStay VP Large Cap Growth Portfolio.
The Portfolio established a position in the newly launched MainStay VP Indexed Bond Portfolio. To fund the purchase, the
| 5. | The terms “spread” and “yield spread” may refer to the difference in yield between a security or type of security and comparable U.S. Treasury issues. The terms may also refer to the difference in yield between two specific securities or types of securities at a given time. The term “credit spread” typically refers to the difference in yield between corporate or municipal bonds (or a specific category of these bonds) and comparable U.S. Treasury issues. |
Portfolio reduced its exposure to MainStay VP Bond Portfolio and MainStay Total Return Bond Fund.
The Portfolio increased its exposure to MainStay VP Cushing Renaissance Advantage Portfolio. We have witnessed domestic unconventional energy production rebound despite efforts on the part of the Organization of Petroleum Exporting Countries (OPEC) to drive shale drillers out of the market. In our opinion, the United States is poised to become the world’s dominant producer in the years ahead, benefiting not just energy companies but also domestic energy consumers.
Which Underlying Equity Portfolios/Funds had the highest total returns during the reporting period, and which Underlying Equity Portfolios/Funds had the lowest total returns?
Of the Underlying Portfolios/Funds held for the full reporting period, the highest returns came from MainStay VP Emerging Markets Equity Portfolio and MainStay VP International Equity Portfolio. The most substantial losses came from MainStay VP Cushing Renaissance Advantage Portfolio and MainStay Cushing MLP Premier Fund.
Which Underlying Equity Portfolios/Funds made the strongest positive contributions to the Portfolio’s overall performance, and which Underlying Equity Portfolios/Funds were the greatest detractors?
The most significant contributions to the Portfolio’s performance came from MainStay VP Large Cap Growth Portfolio and MainStay VP Emerging Markets Equity Portfolio. (Contributions take weightings and total returns into account.) The largest detractors from the Portfolio’s performance included MainStay VP Cushing Renaissance Advantage Portfolio and MainStay Cushing MLP Premier Fund.
What factors and risks affected the Portfolio’s Underlying Fixed-Income Portfolio/Fund investments during the reporting period?
Economic growth has been steady but modest, with labor markets showing little remaining slack. For these reasons, we
were especially surprised that the Federal Reserve repeatedly increased the federal funds target range during the reporting period, which raised the short end of the yield curve.6 Somewhat more surprising was how subdued inflation remained. Old rules of thumb connecting falling unemployment rates with more rapid rates of wage gains and higher inflation appeared inapplicable during the reporting period. The combination of lower-than-expected inflation and ongoing quantitative easing by some central banks outside the United States—most notably the European Central Bank—contributed to falling bond yields during the reporting period.
During the reporting period, which fixed-income market segments were the strongest positive contributors to the Portfolio’s performance and which segments were particularly weak?
Riskier fixed-income securities that are sensitive to economic developments, such as speculative-grade debt and convertible bonds, fared well during the reporting period. Higher-quality bonds with longer maturities also pushed higher as yields fell. Cash climbed above zero, but provided very low yields.
Which Underlying Fixed-Income Portfolios/Funds made the strongest positive contributions to the Portfolio’s performance, and which Underlying Fixed-Income Portfolios/Funds were the greatest detractors?
In the fixed-income portion of the Portfolio, MainStay VP Bond Portfolio made the largest positive contribution to performance, followed by MainStay VP High Yield Corporate Bond Portfolio. Although not technically an Underlying Fixed-Income Portfolio, MainStay VP Absolute Return Multi-Strategy Portfolio is similar to a bond fund in light of its volatility characteristics and return objective. It was the only Underlying Portfolio/Fund in the Portfolio that provided a negative total return. Cash was positive, but its contribution was minimal. The next-smallest contribution came from MainStay VP PIMCO Real Return Portfolio.
| 6. | The yield curve is a line that plots the yields of various securities of similar quality—typically U.S. Treasury issues—across a range of maturities. The U.S. Treasury yield curve serves as a benchmark for other debt and is used in economic forecasting. |
The opinions expressed are those of the portfolio managers as of the date of this report and are subject to change. There is no guarantee that any forecasts made will come to pass. This material does not constitute investment advice and is not intended as an endorsement of any specific investment.
Not all MainStay VP Portfolios and/or share classes are available under all policies.
| | |
| 10 | | MainStay VP Conservative Allocation Portfolio |
Portfolio of Investments June 30, 2017 (Unaudited)
| | | | | | | | |
| | |
| | | Shares | | | Value | |
| Affiliated Investment Companies 99.1%† | |
Equity Funds 48.5% | |
IQ 50 Percent Hedged FTSE Europe ETF (a) | | | 600,624 | | | $ | 11,513,962 | |
IQ 50 Percent Hedged FTSE International ETF (a) | | | 1,257,540 | | | | 25,326,856 | |
IQ Chaikin U.S. Small Cap ETF | | | 13,595 | | | | 346,537 | |
IQ Global Resources ETF | | | 237,956 | | | | 6,063,119 | |
MainStay Cushing MLP Premier Fund Class I | | | 432,775 | | | | 5,777,543 | |
MainStay Emerging Markets Equity Fund Class I | | | 251,951 | | | | 2,438,884 | |
MainStay Epoch Capital Growth Fund Class I (a) | | | 641,074 | | | | 7,545,439 | |
MainStay Epoch Global Choice Fund Class I (a) | | | 996,219 | | | | 20,283,025 | |
MainStay Epoch International Choice Fund Class I | | | 119,651 | | | | 4,087,275 | |
MainStay Epoch U.S. All Cap Fund Class I | | | 778,135 | | | | 22,534,803 | |
MainStay Epoch U.S. Equity Yield Fund Class I | | | 214,189 | | | | 3,364,917 | |
MainStay International Opportunities Fund Class I | | | 731,051 | | | | 6,542,902 | |
MainStay MAP Equity Fund Class I | | | 581,652 | | | | 24,551,512 | |
MainStay U.S. Equity Opportunities Fund Class I | | | 2,288,345 | | | | 22,563,082 | |
MainStay VP Absolute Return Multi-Strategy Portfolio Initial Class (a)(b) | | | 7,431,079 | | | | 65,895,223 | |
MainStay VP Cornerstone Growth Portfolio Initial Class (b) | | | 306,296 | | | | 8,229,792 | |
MainStay VP Cushing Renaissance Advantage Portfolio Initial Class (a)(b) | | | 1,794,064 | | | | 15,806,671 | |
MainStay VP Eagle Small Cap Growth Portfolio Initial Class (b) | | | 924,952 | | | | 12,365,358 | |
MainStay VP Emerging Markets Equity Portfolio Initial Class (a) | | | 4,838,141 | | | | 42,766,561 | |
MainStay VP Epoch U.S. Equity Yield Portfolio Initial Class | | | 610,263 | | | | 9,160,197 | |
MainStay VP Epoch U.S. Small Cap Portfolio Initial Class (a) | | | 1,282,303 | | | | 17,312,455 | |
MainStay VP Large Cap Growth Portfolio Initial Class (a)(b) | | | 1,003,277 | | | | 22,216,038 | |
MainStay VP Mid Cap Core Portfolio Initial Class | | | 1,454,399 | | | | 20,731,866 | |
MainStay VP S&P 500 Index Portfolio Initial Class | | | 105,343 | | | | 5,065,869 | |
MainStay VP Small Cap Core Portfolio Initial Class (a) | | | 1,204,734 | | | | 14,583,222 | |
MainStay VP T. Rowe Price Equity Income Portfolio Initial Class | | | 1,758,647 | | | | 24,104,710 | |
| | | | | | | | |
| | | | | | | 421,177,818 | |
| | | | | | | | |
| | | | | | | | |
| | |
| | | Shares | | | Value | |
Fixed Income Funds 50.6% | | | | | | | | |
IQ Enhanced Core Plus Bond U.S. ETF (a) | | | 2,054,320 | | | $ | 41,209,659 | |
IQ S&P High Yield Low Volatility Bond ETF (a) | | | 278,384 | | | | 7,073,459 | |
MainStay Short Duration High Yield Fund Class I | | | 2,205,892 | | | | 21,926,562 | |
MainStay Total Return Bond Fund Class I | | | 336,117 | | | | 3,562,840 | |
MainStay VP Bond Portfolio Initial Class (a) | | | 8,392,455 | | | | 122,562,168 | |
MainStay VP Convertible Portfolio Initial Class (a) | | | 1,372,253 | | | | 17,788,407 | |
MainStay VP Floating Rate Portfolio Initial Class (a) | | | 7,496,404 | | | | 68,162,560 | |
MainStay VP High Yield Corporate Bond Portfolio Initial Class (a) | | | 3,182,424 | | | | 32,944,635 | |
MainStay VP Indexed Bond Portfolio Initial Class (a) | | | 9,305,655 | | | | 93,485,820 | |
MainStay VP PIMCO Real Return Portfolio Initial Class (a) | | | 833,117 | | | | 7,087,194 | |
MainStay VP Unconstrained Bond Portfolio Initial Class (a) | | | 2,280,855 | | | | 22,867,447 | |
| | | | | | | | |
| | | | | | | 438,670,751 | |
| | | | | | | | |
Total Affiliated Investment Companies
(Cost $827,497,723) | | | | | | | 859,848,569 | |
| | | | | | | | |
| | |
| | | | | | | | |
| | | Principal
Amount | | | | |
| Short-Term Investment 1.0% | |
Repurchase Agreement 1.0% | |
Fixed Income Clearing Corp.
0.12 dated 6/30/17
due 7/3/17
Proceeds at Maturity $8,111,157 (Collateralized by a Federal Home Loan Mortgage Corp. security with a rate of 0.75% and a maturity date of 7/14/17, with a Principal Amount of $8,250,000 and a Market Value of $8,277,778) | | $ | 8,111,076 | | | | 8,111,076 | |
| | | | | | | | |
Total Short-Term Investment
(Cost $8,111,076) | | | | | | | 8,111,076 | |
| | | | | | | | |
Total Investments
(Cost $835,608,799) (c) | | | 100.1 | % | | | 867,959,645 | |
Other Assets, Less Liabilities | | | (0.1 | ) | | | (547,566 | ) |
Net Assets | | | 100.0 | % | | $ | 867,412,079 | |
| † | Percentages indicated are based on Portfolio net assets. |
| (a) | The Portfolio’s ownership exceeds 5% of the outstanding shares of the Underlying Portfolio’s/Fund’s share class. (See Note 3) |
| (b) | Non-income producing Underlying Portfolio/Fund. |
| | | | | | |
The notes to the financial statements are an integral part of,
and should be read in conjunction with, the financial statements. | | | | | 11 | |
Portfolio of Investments June 30, 2017 (Unaudited) (continued)
| (c) | As of June 30, 2017, cost was $842,704,531 for federal income tax purposes and net unrealized appreciation was as follows: |
| | | | |
Gross unrealized appreciation | | $ | 35,459,712 | |
Gross unrealized depreciation | | | (10,204,598 | ) |
| | | | |
Net unrealized appreciation | | $ | 25,255,114 | |
| | | | |
The following abbreviation is used in the preceding pages:
ETF—Exchange-Traded Fund
The following is a summary of the fair valuations according to the inputs used as of June 30, 2017, for valuing the Portfolio’s assets.
Asset Valuation Inputs
| | | | | | | | | | | | | | | | |
Description | | Quoted
Prices in
Active
Markets for
Identical
Assets (Level 1) | | | Significant
Other
Observable
Inputs (Level 2) | | | Significant
Unobservable
Inputs (Level 3) | | | Total | |
| Investments (a) | | | | | | | | | | | | | | | | |
| Affiliated Investment Companies | | | | | | | | | | | | | | | | |
Equity Funds | | $ | 421,177,818 | | | $ | — | | | $ | — | | | $ | 421,177,818 | |
Fixed Income Funds | | | 438,670,751 | | | | — | | | | — | | | | 438,670,751 | |
| Short-Term Investment | | | | | | | | | | | | | | | | |
Repurchase Agreement | | | — | | | | 8,111,076 | | | | — | | | | 8,111,076 | |
| | | | | | | | | | | | | | | | |
| Total Investments in Securities | | $ | 859,848,569 | | | $ | 8,111,076 | | | $ | — | | | $ | 867,959,645 | |
| | | | | | | | | | | | | | | | |
| (a) | For a complete listing of investments, see the Portfolio of Investments. |
The Portfolio recognizes transfers between the levels as of the beginning of the period.
For the period ended June 30, 2017, the Portfolio did not have any transfers among levels. (See Note 2)
As of June 30, 2017, the Portfolio did not hold any investments with significant unobservable inputs (Level 3). (See Note 2)
| | | | |
| 12 | | MainStay VP Conservative Allocation Portfolio | | The notes to the financial statements are an integral part of,
and should be read in conjunction with, the financial statements. |
Statement of Assets and Liabilities as of June 30, 2017 (Unaudited)
| | | | |
| Assets | |
Investment in affiliated investment companies, at value
(identified cost $827,497,723) | | $ | 859,848,569 | |
Repurchase agreement, at value
(identified cost $8,111,076) | | | 8,111,076 | |
Receivables: | | | | |
Fund shares sold | | | 175,805 | |
Dividends and interest | | | 27 | |
Other assets | | | 4,933 | |
| | | | |
Total assets | | | 868,140,410 | |
| | | | |
| |
| Liabilities | | | | |
Payables: | | | | |
Fund shares redeemed | | | 383,924 | |
NYLIFE Distributors (See Note 3) | | | 175,978 | |
Shareholder communication | | | 78,494 | |
Investment securities purchased | | | 67,468 | |
Professional fees | | | 13,607 | |
Trustees | | | 1,546 | |
Custodian | | | 867 | |
Accrued expenses | | | 6,447 | |
| | | | |
Total liabilities | | | 728,331 | |
| | | | |
Net assets | | $ | 867,412,079 | |
| | | | |
| |
| Composition of Net Assets | | | | |
Shares of beneficial interest outstanding (par value of $.001 per share) unlimited number of shares authorized | | $ | 76,923 | |
Additional paid-in capital | | | 863,479,164 | |
| | | | |
| | | 863,556,087 | |
Undistributed net investment income | | | 19,041,489 | |
Accumulated net realized gain (loss) on investments | | | (47,536,343 | ) |
Net unrealized appreciation (depreciation) on investments | | | 32,350,846 | |
| | | | |
Net assets | | $ | 867,412,079 | |
| | | | |
| | | | |
Initial Class | | | | |
Net assets applicable to outstanding shares | | $ | 16,995,091 | |
| | | | |
Shares of beneficial interest outstanding | | | 1,489,631 | |
| | | | |
Net asset value per share outstanding | | $ | 11.41 | |
| | | | |
Service Class | | | | |
Net assets applicable to outstanding shares | | $ | 850,416,988 | |
| | | | |
Shares of beneficial interest outstanding | | | 75,433,512 | |
| | | | |
Net asset value per share outstanding | | $ | 11.27 | |
| | | | |
| | | | | | |
The notes to the financial statements are an integral part of,
and should be read in conjunction with, the financial statements. | | | | | 13 | |
Statement of Operations for the six months ended June 30, 2017 (Unaudited)
| | | | |
| Investment Income (Loss) | |
Income | | | | |
Dividend distributions from affiliated investment companies | | $ | 4,188,344 | |
Interest | | | 5,589 | |
| | | | |
Total income | | | 4,193,933 | |
| | | | |
Expenses | | | | |
Distribution/Service—Service Class (See Note 3) | | | 1,060,879 | |
Shareholder communication | | | 53,238 | |
Professional fees | | | 32,297 | |
Trustees | | | 10,994 | |
Custodian | | | 5,514 | |
Miscellaneous | | | 13,669 | |
| | | | |
Total expenses | | | 1,176,591 | |
| | | | |
Net investment income (loss) | | | 3,017,342 | |
| | | | |
|
| Realized and Unrealized Gain (Loss) on Investments | |
Net realized gain (loss) on: | | | | |
Affiliated investment company transactions | | | 2,899,524 | |
Realized capital gain distributions from affiliated investment companies | | | 449,523 | |
| | | | |
Net realized gain (loss) on investments and investments from affiliated investment companies | | | 3,349,047 | |
| | | | |
Net change in unrealized appreciation (depreciation) on investments | | | 34,830,797 | |
| | | | |
Net realized and unrealized gain (loss) on investments | | | 38,179,844 | |
| | | | |
Net increase (decrease) in net assets resulting from operations | | $ | 41,197,186 | |
| | | | |
| | | | |
| 14 | | MainStay VP Conservative Allocation Portfolio | | The notes to the financial statements are an integral part of,
and should be read in conjunction with, the financial statements. |
Statements of Changes in Net Assets
for the six months ended June 30, 2017 (Unaudited) and the year ended December 31, 2016
| | | | | | | | |
| | | 2017 | | | 2016 | |
| Increase (Decrease) in Net Assets | |
Operations: | | | | | | | | |
Net investment income (loss) | | $ | 3,017,342 | | | $ | 15,275,186 | |
Net realized gain (loss) on investments and investments from affiliated investment companies transactions | | | 3,349,047 | | | | (23,605,961 | ) |
Net change in unrealized appreciation (depreciation) on investments | | | 34,830,797 | | | | 59,237,249 | |
| | | | |
Net increase (decrease) in net assets resulting from operations | | | 41,197,186 | | | | 50,906,474 | |
| | | | |
Dividends and distributions to shareholders: | | | | | | | | |
From net investment income: | | | | | | | | |
Initial Class | | | — | | | | (414,278 | ) |
Service Class | | | — | | | | (20,172,435 | ) |
| | | | |
| | | — | | | | (20,586,713 | ) |
| | | | |
From net realized gain on investments: | | | | | | | | |
Initial Class | | | — | | | | (328,587 | ) |
Service Class | | | — | | | | (17,843,302 | ) |
| | | | |
| | | — | | | | (18,171,889 | ) |
| | | | |
Total dividends and distributions to shareholders | | | — | | | | (38,758,602 | ) |
| | | | |
Capital share transactions: | | | | | | | | |
Net proceeds from sale of shares | | | 38,147,657 | | | | 104,922,775 | |
Net asset value of shares issued to shareholders in reinvestment of dividends and distributions | | | — | | | | 38,758,602 | |
Cost of shares redeemed | | | (78,655,582 | ) | | | (205,370,550 | ) |
| | | | |
Increase (decrease) in net assets derived from capital share transactions | | | (40,507,925 | ) | | | (61,689,173 | ) |
| | | | |
Net increase (decrease) in net assets | | | 689,261 | | | | (49,541,301 | ) |
|
| Net Assets | |
Beginning of period | | | 866,722,818 | | | | 916,264,119 | |
| | | | |
End of period | | $ | 867,412,079 | | | $ | 866,722,818 | |
| | | | |
Undistributed net investment income at end of period | | $ | 19,041,489 | | | $ | 16,024,147 | |
| | | | |
| | | | | | |
The notes to the financial statements are an integral part of,
and should be read in conjunction with, the financial statements. | | | | | 15 | |
Financial Highlights selected per share data and ratios
| | | | | | | | | | | | | | | | | | | | | | | | | | | | |
| | | Six months
ended
June 30, | | | | | | Year ended December 31, | |
| Initial Class | | 2017* | | | | | | 2016 | | | 2015 | | | 2014 | | | 2013 | | | 2012 | |
Net asset value at beginning of period | | $ | 10.87 | | | | | | | $ | 10.71 | | | $ | 11.85 | | | $ | 12.47 | | | $ | 11.62 | | | $ | 11.35 | |
| | | | | | | | | | | | | | | | | | | | | | | | | | | | |
Net investment income (loss) (a) | | | 0.05 | | | | | | | | 0.22 | | | | 0.24 | | | | 0.25 | | | | 0.24 | | | | 0.28 | |
Net realized and unrealized gain (loss) on investments | | | 0.49 | | | | | | | | 0.46 | | | | (0.41 | ) | | | 0.28 | | | | 1.24 | | | | 0.93 | |
| | | | | | | | | | | | | | | | | | | | | | | | | | | | |
Total from investment operations | | | 0.54 | | | | | | | | 0.68 | | | | (0.17 | ) | | | 0.53 | | | | 1.48 | | | | 1.21 | |
| | | | | | | | | | | | | | | | | | | | | | | | | | | | |
| Less dividends and distributions: | | | | | | | | | | | | | | | | | | | | | | | | | | | | |
From net investment income | | | — | | | | | | | | (0.29 | ) | | | (0.28 | ) | | | (0.32 | ) | | | (0.31 | ) | | | (0.26 | ) |
From net realized gain on investments | | | — | | | | | | | | (0.23 | ) | | | (0.69 | ) | | | (0.83 | ) | | | (0.32 | ) | | | (0.68 | ) |
| | | | | | | | | | | | | | | | | | | | | | | | | | | | |
Total dividends and distributions | | | — | | | | | | | | (0.52 | ) | | | (0.97 | ) | | | (1.15 | ) | | | (0.63 | ) | | | (0.94 | ) |
| | | | | | | | | | | | | | | | | | | | | | | | | | | | |
Net asset value at end of period | | $ | 11.41 | | | | | | | $ | 10.87 | | | $ | 10.71 | | | $ | 11.85 | | | $ | 12.47 | | | $ | 11.62 | |
| | | | | | | | | | | | | | | | | | | | | | | | | | | | |
Total investment return (b) | | | 4.97 | %(c) | | | | | | | 6.36 | % | | | (1.41 | %) | | | 4.29 | % | | | 13.03 | % | | | 10.69 | % |
| Ratios (to average net assets)/Supplemental Data: | | | | | | | | | | | | | | | | | | | | | | | | | | | | |
Net investment income (loss) | | | 0.94 | %†† | | | | | | | 2.02 | % | | | 2.01 | % | | | 1.99 | % | | | 1.96 | % | | | 2.34 | % |
Net expenses (d) | | | 0.03 | %†† | | | | | | | 0.03 | % | | | 0.03 | % | | | 0.03 | % | | | 0.03 | % | | | 0.03 | % |
Portfolio turnover rate | | | 27 | % | | | | | | | 44 | % | | | 40 | % | | | 47 | % | | | 56 | % | | | 53 | % |
Net assets at end of period (in 000’s) | | $ | 16,995 | | | | | | | $ | 16,599 | | | $ | 16,171 | | | $ | 15,669 | | | $ | 14,971 | | | $ | 12,866 | |
| (a) | Per share data based on average shares outstanding during the period. |
| (b) | Total return does not reflect any deduction of sales charges, mortality and expense charges, contract charges or administrative charges. For periods of less than one year, total return is not annualized. |
| (c) | Total investment return may reflect adjustments to conform to generally accepted accounting principles. |
| (d) | In addition to the fees and expenses which the Portfolio bears directly, the Portfolio indirectly bears a pro-rata share of the fees and expenses of the Underlying Portfolios/Funds in which it invests. Such indirect expenses are not included in the above expense ratios. |
| | | | | | | | | | | | | | | | | | | | | | | | | | | | |
| | | Six months
ended
June 30, | | | | | | Year ended December 31, | |
| Service Class | | 2017* | | | | | | 2016 | | | 2015 | | | 2014 | | | 2013 | | | 2012 | |
Net asset value at beginning of period | | $ | 10.75 | | | | | | | $ | 10.60 | | | $ | 11.73 | | | $ | 12.37 | | | $ | 11.54 | | | $ | 11.28 | |
| | | | | | | | | | | | | | | | | | | | | | | | | | | | |
Net investment income (loss) (a) | | | 0.04 | | | | | | | | 0.19 | | | | 0.21 | | | | 0.22 | | | | 0.21 | | | | 0.24 | |
Net realized and unrealized gain (loss) on investments | | | 0.48 | | | | | | | | 0.45 | | | | (0.40 | ) | | | 0.26 | | | | 1.23 | | | | 0.93 | |
| | | | | | | | | | | | | | | | | | | | | | | | | | | | |
Total from investment operations | | | 0.52 | | | | | | | | 0.64 | | | | (0.19 | ) | | | 0.48 | | | | 1.44 | | | | 1.17 | |
| | | | | | | | | | | | | | | | | | | | | | | | | | | | |
| Less dividends and distributions: | | | | | | | | | | | | | | | | | | | | | | | | | | | | |
From net investment income | | | — | | | | | | | | (0.26 | ) | | | (0.25 | ) | | | (0.29 | ) | | | (0.29 | ) | | | (0.23 | ) |
From net realized gain on investments | | | — | | | | | | | | (0.23 | ) | | | (0.69 | ) | | | (0.83 | ) | | | (0.32 | ) | | | (0.68 | ) |
| | | | | | | | | | | | | | | | | | | | | | | | | | | | |
Total dividends and distributions | | | — | | | | | | | | (0.49 | ) | | | (0.94 | ) | | | (1.12 | ) | | | (0.61 | ) | | | (0.91 | ) |
| | | | | | | | | | | | | | | | | | | | | | | | | | | | |
Net asset value at end of period | | $ | 11.27 | | | | | | | $ | 10.75 | | | $ | 10.60 | | | $ | 11.73 | | | $ | 12.37 | | | $ | 11.54 | |
| | | | | | | | | | | | | | | | | | | | | | | | | | | | |
Total investment return (b) | | | 4.84 | %(c) | | | | | | | 6.10 | % | | | (1.65 | %) | | | 4.03 | % | | | 12.75 | % | | | 10.42 | % |
| Ratios (to average net assets)/Supplemental Data: | | | | | | | | | | | | | | | | | | | | | | | | | | | | |
Net investment income (loss) | | | 0.69 | %†† | | | | | | | 1.74 | % | | | 1.84 | % | | | 1.78 | % | | | 1.73 | % | | | 2.07 | % |
Net expenses (d) | | | 0.28 | %†† | | | | | | | 0.28 | % | | | 0.28 | % | | | 0.28 | % | | | 0.28 | % | | | 0.28 | % |
Portfolio turnover rate | | | 27 | % | | | | | | | 44 | % | | | 40 | % | | | 47 | % | | | 56 | % | | | 53 | % |
Net assets at end of period (in 000’s) | | $ | 850,417 | | | | | | | $ | 850,124 | | | $ | 900,093 | | | $ | 896,381 | | | $ | 838,989 | | | $ | 680,119 | |
| (a) | Per share data based on average shares outstanding during the period. |
| (b) | Total return does not reflect any deduction of sales charges, mortality and expense charges, contract charges or administrative charges. For periods of less than one year, total return is not annualized. |
| (c) | Total investment return may reflect adjustments to conform to generally accepted accounting principles. |
| (d) | In addition to the fees and expenses which the Portfolio bears directly, the Portfolio indirectly bears a pro-rata share of the fees and expenses of the Underlying Portfolios/Funds in which it invests. Such indirect expenses are not included in the above expense ratios. |
| | | | |
| 16 | | MainStay VP Conservative Allocation Portfolio | | The notes to the financial statements are an integral part of,
and should be read in conjunction with, the financial statements. |
MainStay VP Moderate Allocation Portfolio
Investment and Performance Comparison1 (Unaudited)
Performance data quoted represents past performance. Past performance is no guarantee of future results. Because of market volatility and other factors, current performance may be lower or higher than the figures shown. Investment return and principal value will fluctuate, and as a result, when shares are redeemed, they may be worth more or less than their original cost. The performance table and graph do not reflect any deduction of sales charges, mortality and expense charges, contract charges or administrative charges. Please refer to the Performance Summary appropriate for your policy. For performance information current to the most recent month-end, please call 800-598-2019 or visit www.newyorklife.com.
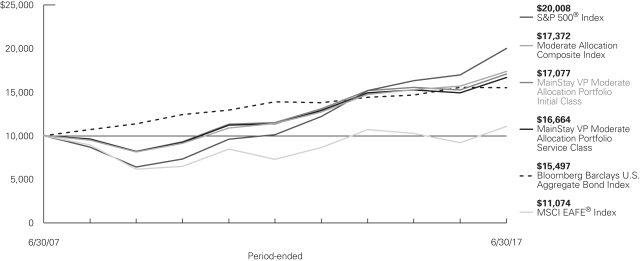
Average Annual Total Returns for the Period Ended June 30, 2017
| | | | | | | | | | | | | | | | | | |
| Class | | Inception
Date | | Six Months | | One Year | | Five Years | | | Ten Years | | | Gross
Expense
Ratio2 | |
| Initial Class Shares | | 2/13/2006 | | 6.85% | | 11.97% | | | 8.20 | % | | | 5.50 | % | | | 1.02 | % |
| Service Class Shares | | 2/13/2006 | | 6.71 | | 11.70 | | | 7.93 | | | | 5.24 | | | | 1.27 | |
| | | | | | | | | | | | | | | | |
| Benchmark Performance | | Six
Months | | | One
Year | | | Five
Years | | | Ten
Years | |
S&P 500® Index3 | | | 9.34 | % | | | 17.90 | % | | | 14.63 | % | | | 7.18 | % |
MSCI EAFE® Index4 | | | 13.81 | | | | 20.27 | | | | 8.69 | | | | 1.03 | |
Bloomberg Barclays U.S. Aggregate Bond Index5 | | | 2.27 | | | | –0.31 | | | | 2.21 | | | | 4.48 | |
Moderate Allocation Composite Index6 | | | 7.13 | | | | 10.68 | | | | 8.79 | | | | 5.68 | |
Average Lipper Variable Products Mixed-Asset Target Allocation Moderate Portfolio7 | | | 6.59 | | | | 9.96 | | | | 7.50 | | | | 4.88 | |
| 1. | Performance figures reflect certain fee waivers and/or expense limitations, without which total returns may have been different. For information on current fee waivers and/or expense limitations (if any), please refer to the Notes to Financial Statements. |
| 2. | The gross expense ratios presented reflect the Portfolio’s “Total Annual Portfolio Operating Expenses” from the most recent Prospectus and may differ from other expense ratios disclosed in this report. |
| 3. | The S&P 500® Index is the Portfolio’s primary broad-based securities market index for comparison purposes. “S&P 500®” is a trademark of The McGraw-Hill Companies, Inc. The S&P 500® Index is widely regarded as the standard index for measuring large-cap U.S. stock market performance. Results assume reinvestment of all dividends and capital gains. An investment cannot be made directly in an index. |
| 4. | The MSCI EAFE® Index is the Portfolio’s secondary benchmark. The MSCI EAFE® Index consists of international stocks representing the developed world outside of North America. Results assume reinvestment of all dividends and capital gains. An investment cannot be made directly in an index. |
| 5. | The Portfolio has selected the Bloomberg Barclays U.S. Aggregate Bond Index as an additional benchmark. The Bloomberg Barclays U.S. Aggregate Bond Index is a broad-based benchmark that measures performance of the |
| | investment-grade, U.S. dollar-denominated, fixed-rate taxable bond market, including Treasurys, government-related and corporate securities, mortgage-backed securities (agency fixed-rate and hybrid adjustable-rate mortgage pass-throughs), asset-backed securities and commercial mortgage-backed securities. Results assume reinvestment of all dividends and capital gains. An investment cannot be made directly in an index. |
| 6. | The Portfolio has selected the Moderate Allocation Composite Index as an additional benchmark. The Moderate Allocation Composite Index consists of the S&P 500® Index, the MSCI EAFE® Index and the Bloomberg Barclays U.S. Aggregate Bond Index weighted 45%, 15% and 40%, respectively. Results assume reinvestment of all dividends and capital gains. An investment cannot be made directly in an index. |
| 7. | The Average Lipper Variable Products Mixed-Asset Target Allocation Moderate Portfolio is representative of portfolios that, by portfolio practice, maintain a mix of between 40%-60% equity securities, with the remainder invested in bonds, cash, and cash equivalents. The benchmark is a product of Lipper Inc. Lipper Inc. is an independent monitor of fund performance. Results are based on average total returns of similar portfolios with all dividend and capital gain distributions reinvested. |
The footnotes are an integral part of the table and graph and should be carefully read in conjunction with them.
Cost in Dollars of a $1,000 Investment in MainStay VP Moderate Allocation Portfolio (Unaudited)
The example below is intended to describe the fees and expenses borne by shareholders during the six-month period from January 1, 2017 to June 30, 2017, and the impact of those costs on your investment.
Example
As a shareholder of the Portfolio, you incur two types of costs: (1) transaction costs, including exchange fees and sales charges (loads) on purchases (as applicable), and (2) ongoing costs, including management fees, distribution and/or service (12b-1) fees, and other Portfolio expenses (as applicable). This example is intended to help you understand your ongoing costs (in dollars) of investing in the Portfolio and to compare these costs with the ongoing costs of investing in other mutual funds. The example is based on an investment of $1,000 made at the beginning of the six-month period and held for the entire period from January 1, 2017 to June 30, 2017. Shares are only sold in connection with variable life and annuity contracts and the example does not reflect any contract level or transactional fees or expenses. If these costs had been included, your costs would have been higher.
This example illustrates your Portfolio’s ongoing costs in two ways:
Actual Expenses
The second and third data columns in the table below provide information about actual account values and actual expenses. You may use the information in these columns, together with the amount you invested, to estimate the expenses that you paid during the six months ended June 30, 2017. Simply divide your account value by $1,000 (for
example, an $8,600 account value divided by $1,000 = 8.6), then multiply the result by the number under the heading entitled “Expenses Paid During Period” to estimate the expenses you paid on your account during this period.
Hypothetical Example for Comparison Purposes
The fourth and fifth data columns in the table below provide information about hypothetical account values and hypothetical expenses based on the Portfolio’s actual expense ratio and an assumed rate of return of 5% per year before expenses, which is not the Portfolio’s actual return. The hypothetical account values and expenses may not be used to estimate the actual ending account balances or expenses you paid for the six-month period shown. You may use this information to compare the ongoing costs of investing in the Portfolio with the ongoing costs of investing in other mutual funds. To do so, compare this 5% hypothetical example with the 5% hypothetical examples that appear in the shareholder reports of the other mutual funds.
Please note that the expenses shown in the table are meant to highlight your ongoing costs only and do not reflect any transactional costs, such as exchange fees or sales charges (loads). Therefore, the fourth and fifth data columns of the table are useful in comparing ongoing costs only and will not help you determine the relative total costs of owning different funds. In addition, if these transactional costs were included, your costs would have been higher.
| | | | | | | | | | | | | | | | | | | | | | |
| | | | | | | | | | | | | | | | | | |
| Share Class | | Beginning
Account
Value
1/1/17 | | | Ending Account
Value (Based
on Actual
Returns and
Expenses)
6/30/17 | | | Expenses
Paid
During
Period1 | | | Ending Account
Value (Based
on Hypothetical
5% Annualized
Return and
Actual Expenses)
6/30/17 | | | Expenses
Paid
During
Period1 | | | Net Expense
Ratio
During
Period2 |
| | | | | | |
| Initial Class Shares | | $ | 1,000.00 | | | $ | 1,068.50 | | | $ | 0.15 | | | $ | 1,024.60 | | | $ | 0.15 | | | 0.03% |
| | | | | | |
| Service Class Shares | | $ | 1,000.00 | | | $ | 1,067.10 | | | $ | 1.44 | | | $ | 1,023.40 | | | $ | 1.40 | | | 0.28% |
| 1. | Expenses are equal to the Portfolio’s annualized expense ratio of each class multiplied by the average account value over the period, divided by 365 and multiplied by 181 (to reflect the six-month period). The table above represents the actual expenses incurred during the six-month period. In addition to the fees and expenses which the Portfolio bears directly, the Portfolio indirectly bears a pro rata share of the fees and expenses of the Underlying Portfolios/Funds in which it invests. Such indirect expenses are not included in the above-reported expense figures. |
| 2. | Expenses are equal to the Portfolio’s annualized expense ratio to reflect the six-month period. |
| | |
| 18 | | MainStay VP Moderate Allocation Portfolio |
Investment Objectives of Underlying Portfolios/Funds as of June 30, 2017 (Unaudited)
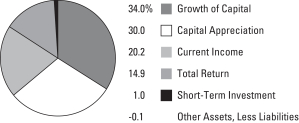
See Portfolio of Investments beginning on page 23 for specific holdings within these categories.
Portfolio Management Discussion and Analysis (Unaudited)
Answers to the questions reflect the views of portfolio managers Jae S.Yoon, CFA, Jonathan Swaney, Poul Kristensen, CFA, and Amit Soni, CFA, of New York Life Investments,1 the Portfolio’s Manager.
How did MainStay VP Moderate Allocation Portfolio perform relative to its benchmarks and peers during the six months ended June 30, 2017?
For the six months ended June 30, 2017, MainStay VP Moderate Allocation Portfolio returned 6.85% for Initial Class shares and 6.71% for Service Class shares. Over the same period, both share classes underperformed the 9.34% return of the S&P 500® Index,2 which is the Portfolio’s primary benchmark, and the 13.81% return of the MSCI EAFE® Index,2 which is a secondary benchmark of the Portfolio. For the six months ended June 30, 2017, both share classes outperformed the 2.27% return of the Bloomberg Barclays U.S. Aggregate Bond Index2 but underperformed the 7.13% return of the Moderate Allocation Composite Index.2 These two indices are additional benchmarks of the Portfolio. Over the same period, both share classes outperformed the 6.59% return of the Average Lipper3 Variable Products Mixed-Asset Target Allocation Moderate Portfolio.
What factors affected the Portfolio’s relative performance during the reporting period?
The Portfolio is a “fund of funds,” meaning that it seeks to achieve its investment objective by investing primarily in mutual funds and exchange-traded funds (“ETFs”) managed by New York Life Investments or its affiliates (the “Underlying Portfolios/Funds”). The Underlying Portfolios/Funds may invest in various instruments, including fixed-income securities and domestic or international stocks at various capitalization levels. The Portfolio’s primary benchmark, the S&P 500® Index, on the other hand, consists entirely of U.S. large-cap stocks. These differences—particularly the Portfolio’s holdings in Underlying Portfolios/Funds that invest in investment-grade bonds—largely accounted for the Portfolio’s underperformance of its primary benchmark during the reporting period because investment-grade bonds in the aggregate tended to underperform U.S. large-cap stocks by a substantial margin during the reporting period. The Moderate Allocation Composite Index reflects a broader mix of asset classes than the S&P 500® Index and offers an alternative yardstick against which to measure the performance of the Portfolio.
Asset class policy in the aggregate had relatively little impact on the Portfolio’s active return during the reporting period. Because we anticipated strong domestic growth spurred in part by policy stimulus, the Portfolio was skewed in favor of Underlying Equity Portfolios/Funds that invested in the United States rather than in
international markets. This positioning proved to be a drag on performance, as policy developments progressed more slowly than expected at home while growth overseas was stronger than expected. For similar reasons, a tilt toward small-cap stocks detracted from relative performance. Offsetting these factors was a bias toward emerging-market equities and an allocation to an Underlying Portfolio/Fund that invested in convertible bonds, which lifted returns in the fixed-income portion of the Portfolio.
More influential than asset allocation decisions were the Underlying Portfolios/Funds the Portfolio selected to gain exposure to those asset classes. A few Underlying Portfolio/Fund investments proved problematic, the most material of which was a position in MainStay VP Absolute Return Multi-Strategy Portfolio that lost value while other Underlying Fixed-Income Portfolios/Funds from which this position was funded performed well. Returns were also reduced by investments in Underlying Portfolios/Funds that invested in commodity-related equities, such as MainStay Cushing MLP Premier Fund, MainStay VP Cushing Renaissance Advantage Portfolio and IndexIQ Global Resources ETF. Capital investment in supply capacity has been greatly curtailed over the past few years, even as global demand has continued to grow. We anticipated that this dynamic could lead to higher commodity prices and rising profits for commodity producers, but these results were not seen during the reporting period. In addition, the Portfolio’s use of a currency hedged fund to gain exposure to international equities also weighed on results, as foreign currencies generally strengthened in relation to the U.S. dollar. Together, these Underlying Portfolio/Fund selection decisions cost the Portfolio close to 0.5% in return.
How did you allocate the Portfolio’s assets during the reporting period and why?
We considered a variety of information, including the portfolio-level characteristics of the Underlying Portfolios/Funds, such as capitalization, style biases, sector exposures, credit quality and duration.4 We also examined the attributes of the holdings of the Underlying Portfolios/Funds, such as valuation metrics, earnings data and technical indicators. Generally speaking, we seek to invest the Portfolio’s assets in Underlying Portfolios/Funds that correspond well to our desired asset class exposures and appear positioned to benefit from the current economic environment. Our desired asset class exposures include attractively valued market segments that we believe enjoy strong price and earnings momentum.
| 1. | “New York Life Investments” is a service mark used by New York Life Investment Management Holdings LLC and its subsidiary New York Life Investment Management LLC. |
| 2. | See footnote on page 17 for more information on this index. |
| 3. | See footnote on page 17 for more information on Lipper Inc. |
| 4. | Duration is a measure of the price sensitivity of a fixed-income investment to changes in interest rates. Duration is expressed as a number of years and is considered a more accurate sensitivity gauge than average maturity. |
| | |
| 20 | | MainStay VP Moderate Allocation Portfolio |
Risk exposure did not stray particularly far from that of the Moderate Allocation Composite Index during the reporting period. Balancing our concerns over rich valuations and potentially destabilizing geopolitical risks with our assessment of an otherwise very healthy economy and the potential for policy stimulus to drive growth higher, the Portfolio came into the year roughly neutral in terms of its stock/bond blend, but with a bias toward U.S. companies over those based in other developed nations and with a moderate preference for small-cap companies. With the market leveling off through the winter, the Trump policy agenda stalling and events in Europe looking potentially ominous, we pulled back equity sensitivity slightly heading into the spring months. Following a strong earnings season, surprisingly robust growth abroad and a resounding defeat of Marine LePen and her National Front party in France, we retraced those steps and maintained a modest “risk-on” posture at the end of the reporting period.
There were also some policy adjustments within asset classes. Having tactically pulled back on small-cap stocks in the wake of a sharp rally late in 2016, we reversed course and reestablished a preference for small-cap companies after a period of underperformance in the first part of 2017.
This positioning reflected our belief that small-cap companies were likely to be among the preferred beneficiaries of corporate tax reform, deregulation, trade negotiations and strong domestic consumption.
Another change was in the Portfolio’s exposure to high-yield bonds. As credit spreads5 compressed significantly throughout 2016, we elected to reduce the Portfolio’s exposure to Underlying Portfolios/Funds that invested in high-yield bonds. We finished the reporting period with high-yield exposure approximately neutral to that of the Moderate Allocation Composite Index.
Our perception of opportunities in Europe—and internationally in general—evolved during the reporting period. For some time, we have been encouraged by available economic data and have perceived relative equity valuations to be attractive. Even so, the potential for disruptive political events dissuaded us from investing heavily in international stocks. With polls suggesting a high likelihood that a centrist would win in France’s presidential election, we determined that we were more pessimistic than was justified, and we increased the Portfolio’s exposure at the margins. The Portfolio continued to add exposure to Underlying Portfolios/Funds that invest in international stocks, as we believed that U.S. economic expansion appeared quite mature while economies in other parts of the world appeared to be earlier in their respective cycles with more room for growth.
How did the Portfolio’s allocations change over the course of the reporting period?
A position in an Underlying Portfolio/Fund that invests in convertible bonds, first established late in 2016, was enlarged materially early in 2017. In our opinion, economic conditions were favorable for corporate profit growth and corresponding stock price gains, but investor sentiment appeared fragile and prone to being swayed by fast-changing political developments. Exposure to convertible bonds would allow the Portfolio to participate in the equity rally that we anticipated while providing a measure of protection on the downside should our expectations fail to be met.
We decided to increase the Portfolio’s exposure to international equities with an emphasis on European and emerging-market companies. This positioning reflected our belief that the discount on the valuation of these stocks was excessive and that these stocks offered more compelling growth opportunities than those in the United States.
We reduced the Portfolio’s exposure to high-yield bonds in response to narrowing credit spreads. A position in MainStay High Yield Opportunities Fund was eliminated, and we reduced the Portfolio’s allocation to MainStay VP High Yield Corporate Bond Portfolio. We also shifted some assets into IQ S&P High Yield Low Volatility Bond ETF, which seeks to avoid some of the most vulnerable credits within the high-yield universe, offering a more conservative way to access high-yield bonds.
The Portfolio also closed its position in MainStay High Yield Municipal Bond Fund. Municipal bonds became less expensive than taxable bonds following the U.S. election on fear that tax reform might limit or eliminate the tax advantages of municipal bonds. We saw the risk of a material change as relatively remote and bought shares of MainStay High Yield Municipal Bond Fund for the Portfolio in early December 2016. Over the winter months, prices on municipal bonds reverted back toward a more traditional relationship to taxable bonds, and we unwound the trade at a profit.
We initiated a position in MainStay VP Cornerstone Growth Portfolio, which the Portfolio had not owned for several years. A new management team assumed responsibility for MainStay VP Cornerstone Growth Portfolio last summer, introducing a quantitative discipline with which we were very familiar and altogether comfortable. The investment was funded primarily by reducing the Portfolio’s position in MainStay VP Large Cap Growth Portfolio.
The Portfolio increased its exposure to MainStay VP Cushing Renaissance Advantage Portfolio. We have witnessed domestic
| 5. | The terms “spread” and “yield spread” may refer to the difference in yield between a security or type of security and comparable U.S. Treasury issues. The terms may also refer to the difference in yield between two specific securities or types of securities at a given time. The term “credit spread” typically refers to the difference in yield between corporate or municipal bonds (or a specific category of these bonds) and comparable U.S. Treasury issues. |
unconventional energy production rebound despite efforts on the part of the Organization of the Petroleum Exporting Countries (OPEC) to drive shale drillers out of the market. In our opinion, the United States is poised to become the world’s dominant oil producer in the years ahead, benefiting not just energy companies but also domestic energy consumers.
Which Underlying Equity Portfolios/Funds had the highest total returns during the reporting period, and which Underlying Equity Portfolios/Funds had the lowest total returns?
Of the Underlying Portfolios/Funds held for the full reporting period, the highest returns came from MainStay VP Emerging Markets Equity Portfolio and MainStay VP International Equity Portfolio. The most substantial losses came from MainStay VP Cushing Renaissance Advantage Portfolio and MainStay Cushing MLP Premier Fund.
Which Underlying Equity Portfolios/Funds made the strongest positive contributions to the Portfolio’s overall performance, and which Underlying Equity Portfolios/Funds were the greatest detractors?
The most significant contributions to the Portfolio’s performance came from MainStay VP Large Cap Growth Portfolio and MainStay VP Emerging Markets Equity Portfolio. (Contributions take weightings and total returns into account.) The largest detractors from the Portfolio’s performance included MainStay VP Cushing Renaissance Advantage Portfolio and MainStay Cushing MLP Premier Fund.
What factors and risks affected the Portfolio’s Underlying Fixed-Income Portfolio/Fund investments during the reporting period?
Economic growth has been steady but modest, with labor markets showing little remaining slack. For these reasons, we were especially surprised that the Federal Reserve repeatedly
increased the federal funds target range during the reporting period, which raised the short end of the yield curve.6 Somewhat more surprising was how subdued inflation remained. Old rules of thumb connecting falling unemployment rates with more rapid rates of wage gains and higher inflation appeared inapplicable during the reporting period. The combination of lower-than-expected inflation and ongoing quantitative easing by some central banks outside the United States—most notably the European Central Bank—contributed to falling bond yields during the reporting period.
During the reporting period, which fixed-income market segments were the strongest positive contributors to the Portfolio’s performance and which segments were particularly weak?
Riskier fixed-income securities that are sensitive to economic developments, such as speculative-grade debt and convertible bonds, fared well during the reporting period. Higher-quality bonds with longer maturities also pushed higher as yields fell. Cash climbed above zero, but provided very low yields.
Which Underlying Fixed-Income Portfolios/Funds made the strongest positive contributions to the Portfolio’s performance, and which Underlying Fixed-Income Portfolios/Funds were the greatest detractors?
In the fixed-income portion of the Portfolio, MainStay VP Bond Portfolio made the largest positive contribution to performance, followed by MainStay VP Convertible Portfolio. Although not technically an Underlying Fixed-Income Portfolio, MainStay VP Absolute Return Multi-Strategy Portfolio is similar to a bond fund in light of its volatility characteristics and return objective. It was the only Underlying Portfolio/Fund in the Portfolio that provided a negative total return. Cash was positive, but its contribution was minimal. The next-smallest contribution came from MainStay VP PIMCO Real Return Portfolio.
| 6. | The yield curve is a line that plots the yields of various securities of similar quality—typically U.S. Treasury issues—across a range of maturities. The U.S. Treasury yield curve serves as a benchmark for other debt and is used in economic forecasting. |
The opinions expressed are those of the portfolio managers as of the date of this report and are subject to change. There is no guarantee that any forecasts made will come to pass. This material does not constitute investment advice and is not intended as an endorsement of any specific investment.
Not all MainStay VP Portfolios and/or share classes are available under all policies.
| | |
| 22 | | MainStay VP Moderate Allocation Portfolio |
Portfolio of Investments June 30, 2017 (Unaudited)
| | | | | | | | |
| | |
Shares | | | Value | |
| Affiliated Investment Companies 99.1%† | |
Equity Funds 65.9% | |
IQ 50 Percent Hedged FTSE Europe ETF (a) | | | 857,146 | | | $ | 16,431,489 | |
IQ 50 Percent Hedged FTSE International ETF (a) | | | 1,830,447 | | | | 36,865,203 | |
IQ Chaikin U.S. Small Cap ETF | | | 2,621 | | | | 66,809 | |
IQ Global Resources ETF (a) | | | 547,146 | | | | 13,941,280 | |
MainStay Cushing MLP Premier Fund Class I | | | 628,354 | | | | 8,388,529 | |
MainStay Emerging Markets Equity Fund Class I | | | 531,358 | | | | 5,143,541 | |
MainStay Epoch Capital Growth Fund Class I (a) | | | 882,227 | | | | 10,383,807 | |
MainStay Epoch Global Choice Fund Class I (a) | | | 1,447,863 | | | | 29,478,495 | |
MainStay Epoch International Choice Fund Class I (a) | | | 992,634 | | | | 33,908,371 | |
MainStay Epoch U.S. All Cap Fund Class I (a) | | | 2,259,658 | | | | 65,439,690 | |
MainStay Epoch U.S. Equity Yield Fund Class I | | | 827,858 | | | | 13,005,643 | |
MainStay International Opportunities Fund Class I (a) | | | 3,877,827 | | | | 34,706,549 | |
MainStay MAP Equity Fund Class I (a) | | | 1,692,143 | | | | 71,425,350 | |
MainStay U.S. Equity Opportunities Fund Class I (a) | | | 6,659,394 | | | | 65,661,620 | |
MainStay VP Absolute Return Multi-Strategy Portfolio Initial Class (a)(b) | | | 7,021,977 | | | | 62,267,508 | |
MainStay VP Cornerstone Growth Portfolio Initial Class (b) | | | 443,637 | | | | 11,919,969 | |
MainStay VP Cushing Renaissance Advantage Portfolio Initial Class (a)(b) | | | 2,177,927 | | | | 19,188,714 | |
MainStay VP Eagle Small Cap Growth Portfolio Initial Class (b) | | | 915,405 | | | | 12,237,731 | |
MainStay VP Emerging Markets Equity Portfolio Initial Class (a) | | | 7,293,931 | | | | 64,474,423 | |
MainStay VP Epoch U.S. Equity Yield Portfolio Initial Class | | | 1,090,598 | | | | 16,370,149 | |
MainStay VP Epoch U.S. Small Cap Portfolio Initial Class (a) | | | 2,800,872 | | | | 37,814,764 | |
MainStay VP International Equity Portfolio Initial Class | | | 439,458 | | | | 6,900,533 | |
MainStay VP Large Cap Growth Portfolio Initial Class (a)(b) | | | 2,871,489 | | | | 63,584,752 | |
MainStay VP Mid Cap Core Portfolio Initial Class (a) | | | 3,507,669 | | | | 50,000,395 | |
MainStay VP S&P 500 Index Portfolio Initial Class | | | 91,201 | | | | 4,385,788 | |
MainStay VP Small Cap Core Portfolio Initial Class (a) | | | 1,262,223 | | | | 15,279,117 | |
| | | | | | | | |
| | |
Shares | | | Value | |
Equity Funds (continued) | |
MainStay VP T. Rowe Price Equity Income Portfolio Initial Class (a) | | | 5,049,066 | | | $ | 69,204,503 | |
| | | | | | | | |
| | | | | | | 838,474,722 | |
| | | | | | | | |
Fixed Income Funds 33.2% | |
IQ Enhanced Core Plus Bond U.S. ETF (a) | | | 2,934,655 | | | | 58,869,179 | |
IQ S&P High Yield Low Volatility Bond ETF (a) | | | 283,251 | | | | 7,197,125 | |
MainStay Short Duration High Yield Fund Class I (a) | | | 3,136,989 | | | | 31,181,673 | |
MainStay Total Return Bond Fund Class I | | | 3,050,700 | | | | 32,337,419 | |
MainStay VP Bond Portfolio Initial Class (a) | | | 9,123,246 | | | | 133,234,528 | |
MainStay VP Convertible Portfolio Initial Class (a) | | | 1,973,340 | | | | 25,580,242 | |
MainStay VP Floating Rate Portfolio Initial Class (a) | | | 7,649,430 | | | | 69,553,983 | |
MainStay VP High Yield Corporate Bond Portfolio Initial Class | | | 2,204,554 | | | | 22,821,668 | |
MainStay VP Indexed Bond Portfolio Initial Class | | | 912 | | | | 9,166 | |
MainStay VP PIMCO Real Return Portfolio Initial Class (a) | | | 1,157,801 | | | | 9,849,237 | |
MainStay VP Unconstrained Bond Portfolio Initial Class (a) | | | 3,237,886 | | | | 32,462,466 | |
| | | | | | | | |
| | | | | | | 423,096,686 | |
| | | | | | | | |
Total Affiliated Investment Companies
(Cost $1,208,234,243) | | | | 1,261,571,408 | |
| | | | | | | | |
| | |
| | | | | | | | |
| | | Principal
Amount | | | | |
| Short-Term Investment 1.0% | |
Repurchase Agreement 1.0% | | | | | | | | |
Fixed Income Clearing Corp.
0.12%, dated 6/30/17
due 7/3/17
Proceeds at Maturity $11,922,064 (Collateralized by a United States Treasury Note with a rate of 2.00% and a maturity date of 8/31/21, with a Principal Amount of $11,960,000 and a Market Value of $12,160,402) | | $ | 11,921,945 | | | | 11,921,945 | |
| | | | | | | | |
Total Short-Term Investment
(Cost $11,921,945) | | | | | | | 11,921,945 | |
| | | | | | | | |
Total Investments
(Cost $1,220,156,188) (c) | | | 100.1 | % | | | 1,273,493,353 | |
Other Assets, Less Liabilities | | | (0.1 | ) | | | (690,707 | ) |
Net Assets | | | 100.0 | % | | $ | 1,272,802,646 | |
| | | | | | |
The notes to the financial statements are an integral part of,
and should be read in conjunction with, the financial statements. | | | | | 23 | |
Portfolio of Investments June 30, 2017 (Unaudited) (continued)
| † | Percentages indicated are based on Portfolio net assets. |
| (a) | The Portfolio’s ownership exceeds 5% of the outstanding shares of the Underlying Portfolio’s/Fund’s share class. (See Note 3) |
| (b) | Non-income producing Underlying Portfolio/Fund. |
| (c) | As of June 30, 2017, cost was $1,225,220,992 for federal income tax purposes and net unrealized appreciation was as follows: |
| | | | |
Gross unrealized appreciation | | $ | 58,051,000 | |
Gross unrealized depreciation | | | (9,778,639 | ) |
| | | | |
Net unrealized appreciation | | $ | 48,272,361 | |
| | | | |
The following abbreviation is used in the preceding pages:
ETF—Exchange-Traded Fund
The following is a summary of the fair valuations according to the inputs used as of June 30, 2017, for valuing the Portfolio’s assets.
Asset Valuation Inputs
| | | | | | | | | | | | | | | | |
Description | | Quoted
Prices in
Active
Markets for
Identical
Assets (Level 1) | | | Significant
Other
Observable
Inputs (Level 2) | | | Significant
Unobservable
Inputs (Level 3) | | | Total | |
| Investments (a) | | | | | | | | | | | | | | | | |
| Affiliated Investment Companies | | | | | | | | | | | | | | | | |
Equity Funds | | $ | 838,474,722 | | | $ | — | | | $ | — | | | $ | 838,474,722 | |
Fixed Income Funds | | | 423,096,686 | | | | — | | | | — | | | | 423,096,686 | |
| Short-Term Investment | | | | | | | | | | | | | | | | |
Repurchase Agreement | | | — | | | | 11,921,945 | | | | — | | | | 11,921,945 | |
| | | | | | | | | | | | | | | | |
| Total Investments in Securities | | $ | 1,261,571,408 | | | $ | 11,921,945 | | | $ | — | | | $ | 1,273,493,353 | |
| | | | | | | | | | | | | | | | |
| (a) | For a complete listing of investments, see the Portfolio of Investments. |
The Portfolio recognizes transfers between the levels as of the beginning of the period.
For the period ended June 30, 2017, the Portfolio did not have any transfers among levels. (See Note 2)
As of June 30, 2017, the Portfolio did not hold any investments with significant unobservable inputs (Level 3). (See Note 2)
| | | | |
| 24 | | MainStay VP Moderate Allocation Portfolio | | The notes to the financial statements are an integral part of,
and should be read in conjunction with, the financial statements. |
Statement of Assets and Liabilities as of June 30, 2017 (Unaudited)
| | | | |
| Assets | |
Investment in affiliated investment companies, at value (identified cost $1,208,234,243) | | $ | 1,261,571,408 | |
Repurchase agreement, at value
(identified cost $11,921,945) | | | 11,921,945 | |
Receivables: | | | | |
Fund shares sold | | | 412,260 | |
Dividends and interest | | | 40 | |
Other assets | | | 6,959 | |
| | | | |
Total assets | | | 1,273,912,612 | |
| | | | |
| |
| Liabilities | | | | |
Payables: | | | | |
Fund shares redeemed | | | 635,775 | |
NYLIFE Distributors (See Note 3) | | | 253,137 | |
Shareholder communication | | | 111,953 | |
Investment securities purchased | | | 85,166 | |
Professional fees | | | 12,713 | |
Trustees | | | 2,140 | |
Custodian | | | 674 | |
Accrued expenses | | | 8,408 | |
| | | | |
Total liabilities | | | 1,109,966 | |
| | | | |
Net assets | | $ | 1,272,802,646 | |
| | | | |
| |
| Composition of Net Assets | | | | |
Shares of beneficial interest outstanding (par value of $.001 per share) unlimited number of shares authorized | | $ | 113,768 | |
Additional paid-in capital | | | 1,236,982,222 | |
| | | | |
| | | 1,237,095,990 | |
Undistributed net investment income | | | 22,809,266 | |
Accumulated net realized gain (loss) on investments | | | (40,439,775 | ) |
Net unrealized appreciation (depreciation) on investments | | | 53,337,165 | |
| | | | |
Net assets | | $ | 1,272,802,646 | |
| | | | |
| | | | |
Initial Class | | | | |
Net assets applicable to outstanding shares | | $ | 46,277,268 | |
| | | | |
Shares of beneficial interest outstanding | | | 4,099,529 | |
| | | | |
Net asset value per share outstanding | | $ | 11.29 | |
| | | | |
Service Class | | | | |
Net assets applicable to outstanding shares | | $ | 1,226,525,378 | |
| | | | |
Shares of beneficial interest outstanding | | | 109,668,551 | |
| | | | |
Net asset value per share outstanding | | $ | 11.18 | |
| | | | |
| | | | | | |
The notes to the financial statements are an integral part of,
and should be read in conjunction with, the financial statements. | | | | | 25 | |
Statement of Operations for the six months ended June 30, 2017 (Unaudited)
| | | | |
| Investment Income (Loss) | |
Income | | | | |
Dividend distributions from affiliated investment companies | | $ | 5,430,916 | |
Interest | | | 9,348 | |
| | | | |
Total income | | | 5,440,264 | |
| | | | |
Expenses | | | | |
Distribution/Service—Service Class (See Note 3) | | | 1,496,998 | |
Shareholder communication | | | 77,839 | |
Professional fees | | | 39,439 | |
Trustees | | | 15,388 | |
Custodian | | | 4,747 | |
Miscellaneous | | | 18,376 | |
| | | | |
Total expenses | | | 1,652,787 | |
| | | | |
Net investment income (loss) | | | 3,787,477 | |
| | | | |
|
| Realized and Unrealized Gain (Loss) on Investments | |
Net realized gain (loss) on: | |
Affiliated investment company transactions | | | (1,503,175 | ) |
Realized capital gain distributions from affiliated investment companies | | | 1,919,276 | |
| | | | |
Net realized gain (loss) on investments and investments from affiliated investment companies | | | 416,101 | |
| | | | |
Net change in unrealized appreciation (depreciation) on investments | | | 76,840,197 | |
| | | | |
Net realized and unrealized gain (loss) on investments | | | 77,256,298 | |
| | | | |
Net increase (decrease) in net assets resulting from operations | | $ | 81,043,775 | |
| | | | |
| | | | |
| 26 | | MainStay VP Moderate Allocation Portfolio | | The notes to the financial statements are an integral part of,
and should be read in conjunction with, the financial statements. |
Statements of Changes in Net Assets
for the six months ended June 30, 2017 (Unaudited) and the year ended December 31, 2016
| | | | | | | | |
| | | 2017 | | | 2016 | |
| Increase (Decrease) in Net Assets | |
Operations: | | | | | | | | |
Net investment income (loss) | | $ | 3,787,477 | | | $ | 18,116,502 | |
Net realized gain (loss) on investments and investments from affiliated investment companies transactions | | | 416,101 | | | | 4,032,991 | |
Net change in unrealized appreciation (depreciation) on investments | | | 76,840,197 | | | | 49,485,941 | |
| | | | |
Net increase (decrease) in net assets resulting from operations | | | 81,043,775 | | | | 71,635,434 | |
| | | | |
Dividends and distributions to shareholders: | | | | | | | | |
From net investment income: | | | | | | | | |
Initial Class | | | — | | | | (933,806 | ) |
Service Class | | | — | | | | (22,878,180 | ) |
| | | | |
| | | — | | | | (23,811,986 | ) |
| | | | |
From net realized gain on investments: | | | | | | | | |
Initial Class | | | — | | | | (1,758,070 | ) |
Service Class | | | — | | | | (48,542,714 | ) |
| | | | |
| | | — | | | | (50,300,784 | ) |
| | | | |
Total dividends and distributions to shareholders | | | — | | | | (74,112,770 | ) |
| | | | |
Capital share transactions: | | | | | | | | |
Net proceeds from sale of shares | | | 61,657,115 | | | | 111,329,810 | |
Net asset value of shares issued to shareholders in reinvestment of dividends and distributions | | | — | | | | 74,112,770 | |
Cost of shares redeemed | | | (84,983,824 | ) | | | (147,049,787 | ) |
| | | | |
Increase (decrease) in net assets derived from capital share transactions | | | (23,326,709 | ) | | | 38,392,793 | |
| | | | |
Net increase (decrease) in net assets | | | 57,717,066 | | | | 35,915,457 | |
|
| Net Assets | |
Beginning of period | | | 1,215,085,580 | | | | 1,179,170,123 | |
| | | | |
End of period | | $ | 1,272,802,646 | | | $ | 1,215,085,580 | |
| | | | |
Undistributed net investment income at end of period | | $ | 22,809,266 | | | $ | 19,021,789 | |
| | | | |
| | | | | | |
The notes to the financial statements are an integral part of,
and should be read in conjunction with, the financial statements. | | | | | 27 | |
Financial Highlights selected per share data and ratios
| | | | | | | | | | | | | | | | | | | | | | | | | | | | |
| | | Six months
ended
June 30, | | | | | | Year ended December 31, | |
| Initial Class | | 2017* | | | | | | 2016 | | | 2015 | | | 2014 | | | 2013 | | | 2012 | |
Net asset value at beginning of period | | $ | 10.57 | | | | | | | $ | 10.59 | | | $ | 12.03 | | | $ | 12.61 | | | $ | 11.16 | | | $ | 10.76 | |
| | | | | | | | | | | | | | | | | | | | | | | | | | | | |
Net investment income (loss) (a) | | | 0.05 | | | | | | | | 0.19 | | | | 0.20 | | | | 0.23 | | | | 0.20 | | | | 0.21 | |
Net realized and unrealized gain (loss) on investments | | | 0.67 | | | | | | | | 0.48 | | | | (0.39 | ) | | | 0.33 | | | | 1.90 | | | | 1.14 | |
| | | | | | | | | | | | | | | | | | | | | | | | | | | | |
Total from investment operations | | | 0.72 | | | | | | | | 0.67 | | | | (0.19 | ) | | | 0.56 | | | | 2.10 | | | | 1.35 | |
| | | | | | | | | | | | | | | | | | | | | | | | | | | | |
| Less dividends and distributions: | | | | | | | | | | | | | | | | | | | | | | | | | | | | |
From net investment income | | | — | | | | | | | | (0.24 | ) | | | (0.30 | ) | | | (0.29 | ) | | | (0.25 | ) | | | (0.20 | ) |
From net realized gain on investments | | | — | | | | | | | | (0.45 | ) | | | (0.95 | ) | | | (0.85 | ) | | | (0.40 | ) | | | (0.75 | ) |
| | | | | | | | | | | | | | | | | | | | | | | | | | | | |
Total dividends and distributions | | | — | | | | | | | | (0.69 | ) | | | (1.25 | ) | | | (1.14 | ) | | | (0.65 | ) | | | (0.95 | ) |
| | | | | | | | | | | | | | | | | | | | | | | | | | | | |
Net asset value at end of period | | $ | 11.29 | | | | | | | $ | 10.57 | | | $ | 10.59 | | | $ | 12.03 | | | $ | 12.61 | | | $ | 11.16 | |
| | | | | | | | | | | | | | | | | | | | | | | | | | | | |
Total investment return (b) | | | 6.81 | %(c) | | | | | | | 6.41 | % | | | (1.61 | %) | | | 4.62 | % | | | 19.12 | % | | | 12.61 | % |
| Ratios (to average net assets)/Supplemental Data: | | | | | | | | | | | | | | | | | | | | | | | | | | | | |
Net investment income (loss) | | | 0.85 | %†† | | | | | | | 1.76 | % | | | 1.69 | % | | | 1.80 | % | | | 1.66 | % | | | 1.88 | % |
Net expenses (d) | | | 0.03 | %†† | | | | | | | 0.03 | % | | | 0.02 | % | | | 0.03 | % | | | 0.03 | % | | | 0.03 | % |
Portfolio turnover rate | | | 16 | % | | | | | | | 40 | % | | | 36 | % | | | 46 | % | | | 54 | % | | | 55 | % |
Net assets at end of period (in 000’s) | | $ | 46,277 | | | | | | | $ | 43,873 | | | $ | 41,551 | | | $ | 41,706 | | | $ | 37,869 | | | $ | 29,575 | |
| (a) | Per share data based on average shares outstanding during the period. |
| (b) | Total return does not reflect any deduction of sales charges, mortality and expense charges, contract charges or administrative charges. For periods of less than one year, total return is not annualized. |
| (c) | Total investment return may reflect adjustments to conform to generally accepted accounting principles. |
| (d) | In addition to the fees and expenses which the Portfolio bears directly, the Portfolio indirectly bears a pro-rata share of the fees and expenses of the Underlying Portfolios/Funds in which it invests. Such indirect expenses are not included in the above expense ratios. |
| | | | | | | | | | | | | | | | | | | | | | | | | | | | |
| | | Six months
ended
June 30, | | | | | | Year ended December 31, | |
| Service Class | | 2017* | | | | | | 2016 | | | 2015 | | | 2014 | | | 2013 | | | 2012 | |
Net asset value at beginning of period | | $ | 10.48 | | | | | | | $ | 10.51 | | | $ | 11.95 | | | $ | 12.53 | | | $ | 11.11 | | | $ | 10.71 | |
| | | | | | | | | | | | | | | | | | | | | | | | | | | | |
Net investment income (loss) (a) | | | 0.03 | | | | | | | | 0.16 | | | | 0.17 | | | | 0.19 | | | | 0.17 | | | | 0.19 | |
Net realized and unrealized gain (loss) on investments | | | 0.67 | | | | | | | | 0.47 | | | | (0.39 | ) | | | 0.34 | | | | 1.87 | | | | 1.14 | |
| | | | | | | | | | | | | | | | | | | | | | | | | | | | |
Total from investment operations | | | 0.70 | | | | | | | | 0.63 | | | | (0.22 | ) | | | 0.53 | | | | 2.04 | | | | 1.33 | |
| | | | | | | | | | | | | | | | | | | | | | | | | | | | |
| Less dividends and distributions: | | | | | | | | | | | | | | | | | | | | | | | | | | | | |
From net investment income | | | — | | | | | | | | (0.21 | ) | | | (0.27 | ) | | | (0.26 | ) | | | (0.22 | ) | | | (0.18 | ) |
From net realized gain on investments | | | — | | | | | | | | (0.45 | ) | | | (0.95 | ) | | | (0.85 | ) | | | (0.40 | ) | | | (0.75 | ) |
| | | | | | | | | | | | | | | | | | | | | | | | | | | | |
Total dividends and distributions | | | — | | | | | | | | (0.66 | ) | | | (1.22 | ) | | | (1.11 | ) | | | (0.62 | ) | | | (0.93 | ) |
| | | | | | | | | | | | | | | | | | | | | | | | | | | | |
Net asset value at end of period | | $ | 11.18 | | | | | | | $ | 10.48 | | | $ | 10.51 | | | $ | 11.95 | | | $ | 12.53 | | | $ | 11.11 | |
| | | | | | | | | | | | | | | | | | | | | | | | | | | | |
Total investment return (b) | | | 6.68 | %(c) | | | | | | | 6.14 | % | | | (1.86 | %) | | | 4.35 | % | | | 18.82 | % | | | 12.33 | % |
| Ratios (to average net assets)/Supplemental Data: | | | | | | | | | | | | | | | | | | | | | | | | | | | | |
Net investment income (loss) | | | 0.60 | %†† | | | | | | | 1.52 | % | | | 1.44 | % | | | 1.51 | % | | | 1.43 | % | | | 1.65 | % |
Net expenses (d) | | | 0.28 | %†† | | | | | | | 0.28 | % | | | 0.27 | % | | | 0.28 | % | | | 0.28 | % | | | 0.28 | % |
Portfolio turnover rate | | | 16 | % | | | | | | | 40 | % | | | 36 | % | | | 46 | % | | | 54 | % | | | 55 | % |
Net assets at end of period (in 000’s) | | $ | 1,226,525 | | | | | | | $ | 1,171,213 | | | $ | 1,137,619 | | | $ | 1,154,403 | | | $ | 1,071,424 | | | $ | 825,281 | |
| (a) | Per share data based on average shares outstanding during the period. |
| (b) | Total return does not reflect any deduction of sales charges, mortality and expense charges, contract charges or administrative charges. For periods of less than one year, total return is not annualized. |
| (c) | Total investment return may reflect adjustments to conform to generally accepted accounting principles. |
| (d) | In addition to the fees and expenses which the Portfolio bears directly, the Portfolio indirectly bears a pro-rata share of the fees and expenses of the Underlying Portfolios/Funds in which it invests. Such indirect expenses are not included in the above expense ratios. |
| | | | |
| 28 | | MainStay VP Moderate Allocation Portfolio | | The notes to the financial statements are an integral part of,
and should be read in conjunction with, the financial statements. |
MainStay VP Moderate Growth Allocation Portfolio
Investment and Performance Comparison1 (Unaudited)
Performance data quoted represents past performance. Past performance is no guarantee of future results. Because of market volatility and other factors, current performance may be lower or higher than the figures shown. Investment return and principal value will fluctuate, and as a result, when shares are redeemed, they may be worth more or less than their original cost. The performance table and graph do not reflect any deduction of sales charges mortality and expense charges, contract charges, or administrative charges. Please refer to the Performance Summary appropriate for your policy. For performance information current to the most recent month-end, please call 800-598-2019 or visit www.newyorklife.com.
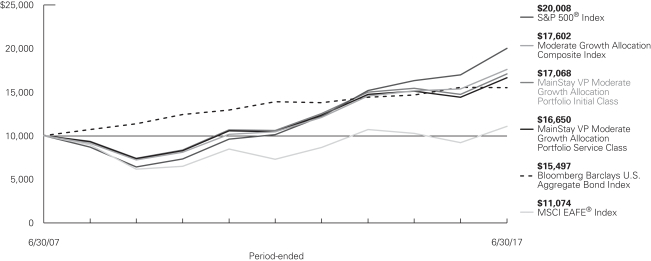
Average Annual Total Returns for the Period Ended June 30, 2017
| | | | | | | | | | | | | | | | | | |
| Class | | Inception
Date | | Six Months | | One Year | | Five Years | | | Ten Years | | | Gross
Expense
Ratio2 | |
| Initial Class Shares | | 2/13/2006 | | 8.17% | | 15.76% | | | 10.04 | % | | | 5.49 | % | | | 1.11 | % |
| Service Class Shares | | 2/13/2006 | | 8.03 | | 15.47 | | | 9.76 | | | | 5.23 | | | | 1.36 | |
| | | | | | | | | | | | | | | | |
| Benchmark Performance | | Six
Months | | | One
Year | | | Five
Years | | | Ten
Years | |
S&P 500® Index3 | | | 9.34 | % | | | 17.90 | % | | | 14.63 | % | | | 7.18 | % |
MSCI EAFE® Index4 | | | 13.81 | | | | 20.27 | | | | 8.69 | | | | 1.03 | |
Bloomberg Barclays U.S. Aggregate Bond Index5 | | | 2.27 | | | | –0.31 | | | | 2.21 | | | | 4.48 | |
Moderate Growth Allocation Composite Index6 | | | 8.79 | | | | 14.56 | | | | 10.98 | | | | 5.82 | |
Average Lipper Variable Products Mixed-Asset Target Allocation Growth Portfolio7 | | | 7.70 | | | | 12.52 | | | | 9.01 | | | | 5.17 | |
| 1. | Performance figures reflect certain fee waivers and/or expense limitations, without which total returns may have been different. For information on current fee waivers and/or expense limitations (if any), please refer to the Notes to Financial Statements. |
| 2. | The gross expense ratios presented reflect the Portfolio’s “Total Annual Portfolio Operating Expenses” from the most recent Prospectus and may differ from other expense ratios disclosed in this report. |
| 3. | The S&P 500® Index is the Portfolio’s primary broad-based securities market Index for comparison purposes. “S&P 500®” is a trademark of The McGraw-Hill Companies, Inc. The S&P 500® Index is widely regarded as the standard index for measuring large-cap U.S. stock market performance. Results assume reinvestment of all dividends and capital gains. An investment cannot be made directly in an index. |
| 4. | The MSCI EAFE® Index is the Portfolio’s secondary benchmark. The MSCI EAFE® Index consists of international stocks representing the developed world outside of North America. Results assume reinvestment of all dividends and capital gains. An investment cannot be made directly in an index. |
| 5. | The Portfolio has selected the Bloomberg Barclays U.S. Aggregate Bond Index as an additional benchmark. The Bloomberg Barclays U.S. Aggregate Bond Index is a broad-based benchmark that measures performance of the |
| | investment-grade, U.S. dollar-denominated, fixed-rate taxable bond market, including Treasurys, government-related and corporate securities, mortgage-backed securities (agency fixed-rate and hybrid adjustable-rate mortgage pass-throughs), asset-backed securities and commercial mortgage-backed securities. Results assume reinvestment of all dividends and capital gains. An investment cannot be made directly in an index. |
| 6. | The Portfolio has selected the Moderate Growth Allocation Composite Index as an additional benchmark. The Moderate Growth Allocation Composite Index consists of the S&P 500® Index, the MSCI EAFE® Index and the Bloomberg Barclays U.S. Aggregate Bond Index weighted 60%, 20% and 20%, respectively. Results assume reinvestment of all dividends and capital gains. An investment cannot be made directly in an index. |
| 7. | The Average Lipper Variable Products Mixed-Asset Target Allocation Growth Portfolio is representative of portfolios that, by portfolio practice, maintain a mix of between 60%-80% equity securities, with the remainder invested in bonds, cash, and cash equivalents. The benchmark is a product of Lipper Inc. Lipper Inc. is an independent monitor of fund performance. Results are based on average total returns of similar portfolios with all dividend and capital gain distributions reinvested. |
The footnotes are an integral part of the table and graph and should be carefully read in conjunction with them.
Cost in Dollars of a $1,000 Investment in MainStay VP Moderate Growth Allocation Portfolio (Unaudited)
The example below is intended to describe the fees and expenses borne by shareholders during the six-month period from January 1, 2017 to June 30, 2017, and the impact of those costs on your investment.
Example
As a shareholder of the Portfolio, you incur two types of costs: (1) transaction costs, including exchange fees and sales charges (loads) on purchases (as applicable), and (2) ongoing costs, including management fees, distribution and/or service (12b-1) fees, and other Portfolio expenses (as applicable). This example is intended to help you understand your ongoing costs (in dollars) of investing in the Portfolio and to compare these costs with the ongoing costs of investing in other mutual funds. The example is based on an investment of $1,000 made at the beginning of the six-month period and held for the entire period from January 1, 2017 to June 30, 2017. Shares are only sold in connection with variable life and annuity contracts and the example does not reflect any contract level or transactional fees or expenses. If these costs had been included, your costs would have been higher.
This example illustrates your Portfolio’s ongoing costs in two ways:
Actual Expenses
The second and third data columns in the table below provide information about actual account values and actual expenses. You may use the information in these columns, together with the amount you invested, to estimate the expenses that you paid during the six months ended June 30, 2017. Simply divide your account value by $1,000
(for example, an $8,600 account value divided by $1,000 = 8.6), then multiply the result by the number under the heading entitled “Expenses Paid During Period” to estimate the expenses you paid on your account during this period.
Hypothetical Example for Comparison Purposes
The fourth and fifth data columns in the table below provide information about hypothetical account values and hypothetical expenses based on the Portfolio’s actual expense ratio and an assumed rate of return of 5% per year before expenses, which is not the Portfolio’s actual return. The hypothetical account values and expenses may not be used to estimate the actual ending account balances or expenses you paid for the six-month period shown. You may use this information to compare the ongoing costs of investing in the Portfolio with the ongoing costs of investing in other mutual funds. To do so, compare this 5% hypothetical example with the 5% hypothetical examples that appear in the shareholder reports of the other mutual funds.
Please note that the expenses shown in the table are meant to highlight your ongoing costs only and do not reflect any transactional costs, such as exchange fees or sales charges (loads). Therefore, the fourth and fifth data columns of the table are useful in comparing ongoing costs only and will not help you determine the relative total costs of owning different funds. In addition, if these transactional costs were included, your costs would have been higher.
| | | | | | | | | | | | | | | | | | | | | | |
| | | | | | | | | | | | | | | | | | |
| Share Class | | Beginning
Account
Value
1/1/17 | | | Ending Account
Value (Based
on Actual
Returns and
Expenses)
6/30/17 | | | Expenses
Paid
During
Period1 | | | Ending Account
Value (Based
on Hypothetical
5% Annualized
Return and
Actual Expenses)
6/30/17 | | | Expenses
Paid
During
Period1 | | | Net Expense
Ratio
During
Period2 |
| | | | | | |
| Initial Class Shares | | $ | 1,000.00 | | | $ | 1,081.70 | | | $ | 0.10 | | | $ | 1,024.70 | | | $ | 0.10 | | | 0.02% |
| | | | | | |
| Service Class Shares | | $ | 1,000.00 | | | $ | 1,080.30 | | | $ | 1.39 | | | $ | 1,023.50 | | | $ | 1.35 | | | 0.27% |
| 1. | Expenses are equal to the Portfolio’s annualized expense ratio of each class multiplied by the average account value over the period, divided by 365 and multiplied by 181 (to reflect the six-month period). The table above represents the actual expenses incurred during the six-month period. In addition to the fees and expenses which the Portfolio bears directly, the Portfolio indirectly bears a pro rata share of the fees and expenses of the Underlying Portfolios/Funds in which it invests. Such indirect expenses are not included in the above-reported expense figures. |
| 2. | Expenses are equal to the Portfolio’s annualized expense ratio to reflect the six-month period. |
| | |
| 30 | | MainStay VP Moderate Growth Allocation Portfolio |
Investment Objectives of Underlying Portfolios/Funds as of June 30, 2017 (Unaudited)
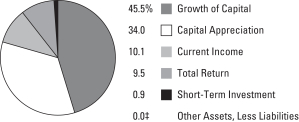
See Portfolio of Investments beginning on page 35 for specific holdings within these categories.
| ‡ | Less than one-tenth of a percent. |
Portfolio Management Discussion and Analysis (Unaudited)
Answers to the questions reflect the views of portfolio managers Jae S.Yoon, CFA, Jonathan Swaney, Poul Kristensen, CFA, and Amit Soni, CFA, of New York Life Investments,1 the Portfolio’s Manager.
How did MainStay VP Moderate Growth Allocation Portfolio perform relative to its benchmarks and peers during the six months ended June 30, 2017?
For the six months ended June 30, 2017, MainStay VP Moderate Growth Allocation Portfolio returned 8.17% for Initial Class shares and 8.03% for Service Class shares. Over the same period, both share classes underperformed the 9.34% return of the S&P 500® Index,2 which is the Portfolio’s primary benchmark, and the 13.81% return of the MSCI EAFE® Index,2 which is a secondary benchmark of the Portfolio. For the six months ended June 30, 2017, both share classes outperformed the 2.27% return of the Bloomberg Barclays U.S. Aggregate Bond Index2 but underperformed the 8.79% return of the Moderate Growth Allocation Composite Index.2 These two indices are additional benchmarks of the Portfolio. Over the same period, both share classes outperformed the 7.70% return of the Average Lipper3 Variable Products Mixed-Asset Target Allocation Growth Portfolio.
What factors affected the Portfolio’s relative performance during the reporting period?
The Portfolio is a “fund of funds,” meaning that it seeks to achieve its investment objective by investing primarily in mutual funds and exchange-traded funds (“ETFs”) managed by New York Life Investments or its affiliates (the “Underlying Portfolios/Funds”). The Underlying Portfolios/Funds may invest in various instruments, including fixed-income securities and domestic or international stocks at various capitalization levels. The Portfolio’s primary benchmark, the S&P 500® Index, on the other hand, consists entirely of U.S. large-cap stocks. These differences—particularly the Portfolio’s holdings in Underlying Portfolios/Funds that invest in investment-grade bonds—largely accounted for the Portfolio’s underperformance of its primary benchmark during the reporting period because investment-grade bonds in the aggregate tended to underperform U.S. large-cap stocks by a substantial margin during the reporting period. The Moderate Growth Allocation Composite Index reflects a broader mix of asset classes than the S&P 500® Index and offers an alternative yardstick against which to measure the performance of the Portfolio.
Asset class policy in the aggregate had relatively little impact on the Portfolio’s active return during the reporting period. Because we anticipated strong domestic growth spurred in part by policy stimulus, the Portfolio was skewed in favor of Underlying Equity Portfolios/Funds that invested in the United States rather than in
international markets. This positioning proved to be a drag on performance, as policy developments progressed more slowly than expected at home while growth overseas was stronger than expected. For similar reasons, a tilt toward small-cap stocks detracted from relative performance. Offsetting these factors was a bias toward emerging-market equities and an allocation to an Underlying Portfolio/Fund that invested in convertible bonds, which lifted returns in the fixed-income portion of the Portfolio.
More influential than asset allocation decisions were the Underlying Portfolios/Funds the Portfolio selected to gain exposure to those asset classes. A few Underlying Portfolio/Fund investments proved problematic, among them was a position in MainStay VP Absolute Return Multi-Strategy Portfolio that lost value while other Underlying Fixed-Income Portfolios/Funds from which this position was funded performed well. Returns were also reduced by investments in Underlying Portfolios/Funds that invested in commodity-related equities, such as MainStay Cushing MLP Premier Fund, MainStay VP Cushing Renaissance Advantage Portfolio and IndexIQ Global Resources ETF. Capital investment in supply capacity has been greatly curtailed over the past few years, even as global demand has continued to grow. We anticipated that this dynamic could lead to higher commodity prices and rising profits for commodity producers, but these results were not seen during the reporting period. In addition, the Portfolio’s use of a currency hedged fund to gain exposure to international equities also weighed on results, as foreign currencies generally strengthened in relation to the U.S. dollar. Together, these Underlying Portfolio/Fund selection decisions cost the Portfolio close to 0.5% in return.
How did you allocate the Portfolio’s assets during the reporting period and why?
We considered a variety of information, including the portfolio-level characteristics of the Underlying Portfolios/Funds, such as capitalization, style biases, sector exposures, credit quality and duration.4 We also examined the attributes of the holdings of the Underlying Portfolios/Funds, such as valuation metrics, earnings data and technical indicators. Generally speaking, we seek to invest the Portfolio’s assets in Underlying Portfolios/Funds that correspond well to our desired asset class exposures and appear positioned to benefit from the current economic environment. Our desired asset class exposures include attractively valued market segments that we believe enjoy strong price and earnings momentum.
| 1. | “New York Life Investments” is a service mark used by New York Life Investment Management Holdings LLC and its subsidiary New York Life Investment Management LLC. |
| 2. | See footnote on page 29 for more information on this index. |
| 3. | See footnote on page 29 for more information on Lipper Inc. |
| 4. | Duration is a measure of the price sensitivity of a fixed-income investment to changes in interest rates. Duration is expressed as a number of years and is considered a more accurate sensitivity gauge than average maturity. |
| | |
| 32 | | MainStay VP Moderate Growth Allocation Portfolio |
Risk exposure did not stray particularly far from that of the Moderate Growth Allocation Composite Index during the reporting period. Balancing our concerns over rich valuations and potentially destabilizing geopolitical risks with our assessment of an otherwise very healthy economy and the potential for policy stimulus to drive growth higher, the Portfolio came into the year roughly neutral in terms of its stock/bond blend, but with a bias toward U.S. companies over those based in other developed nations and with a moderate preference for small-cap companies. With the market leveling off through the winter, the Trump policy agenda stalling and events in Europe looking potentially ominous, we pulled back equity sensitivity slightly heading into the spring months. Following a strong earnings season, surprisingly robust growth abroad and a resounding defeat of Marine LePen and her National Front party in France, we retraced those steps and maintained a modest “risk-on” posture at the end of the reporting period.
There were also some policy adjustments within asset classes. Having tactically pulled back on small-cap stocks in the wake of a sharp rally late in 2016, we reversed course and reestablished a preference for small-cap companies after a period of underperformance in the first part of 2017. This positioning reflected our belief that small-cap companies were likely to be among the preferred beneficiaries of corporate tax reform, deregulation, trade negotiations and strong domestic consumption.
Another change was in the Portfolio’s exposure to high-yield bonds. As credit spreads5 compressed significantly throughout 2016, we elected to reduce the Portfolio’s exposure to Underlying Portfolios/Funds that invested in high-yield bonds. We finished the reporting period with high-yield exposure approximately neutral to that of the Moderate Growth Allocation Composite Index.
Our perception of opportunities in Europe—and internationally in general—evolved during the reporting period. For some time, we have been encouraged by available economic data and have perceived relative equity valuations to be attractive. Even so, the potential for disruptive political events dissuaded us from investing heavily in international stocks. With polls suggesting a high likelihood that a centrist would win in France’s presidential election, we determined that we were more pessimistic than was justified, and we increased the Portfolio’s exposure at the margins. The Portfolio continued to add exposure to Underlying Portfolios/Funds that invest in international stocks, as we believed that U.S. economic expansion appeared quite mature while economies in other parts of the world appeared to be earlier in their respective cycles with more room for growth.
How did the Portfolio’s allocations change over the course of the reporting period?
A position in an Underlying Portfolio/Fund that invests in convertible bonds, first established late in 2016, was enlarged materially early in 2017. In our opinion, economic conditions were favorable for corporate profit growth and corresponding stock price gains, but investor sentiment appeared fragile and prone to being swayed by fast-changing political developments. Exposure to convertible bonds would allow the Portfolio to participate in the equity rally that we anticipated while providing a measure of protection on the downside should our expectations fail to be met.
We decided to increase the Portfolio’s exposure to international equities with an emphasis on European and emerging-market companies. This positioning reflected our belief that the discount on the valuation of these stocks was excessive and that these stocks offered more compelling growth opportunities than those in the United States.
We reduced the Portfolio’s exposure to high-yield bonds in response to narrowing credit spreads. A position in MainStay High Yield Opportunities Fund was eliminated, and we reduced the Portfolio’s allocation to MainStay VP High Yield Corporate Bond Portfolio. We also shifted some assets into IQ S&P High Yield Low Volatility Bond ETF, which seeks to avoid some of the most vulnerable credits within the high-yield universe, offering a more conservative way to access high-yield bonds.
The Portfolio also closed its position in MainStay High Yield Municipal Bond Fund. Municipal bonds became less expensive than taxable bonds following the U.S. election on fear that tax reform might limit or eliminate the tax advantages of municipal bonds. We saw the risk of a material change as relatively remote and bought shares of MainStay High Yield Municipal Bond Fund for the Portfolio in early December 2016. Over the winter months, prices on municipal bonds reverted back toward a more traditional relationship to taxable bonds, and we unwound the trade at a profit.
We initiated a position in MainStay VP Cornerstone Growth Portfolio, which the Portfolio had not owned for several years. A new management team assumed responsibility for MainStay VP Cornerstone Growth Portfolio last summer, introducing a quantitative discipline with which we were very familiar and altogether comfortable. The investment was funded primarily by reducing the Portfolio’s position in MainStay VP Large Cap Growth Portfolio.
| 5. | The terms “spread” and “yield spread” may refer to the difference in yield between a security or type of security and comparable U.S. Treasury issues. The terms may also refer to the difference in yield between two specific securities or types of securities at a given time. The term “credit spread” typically refers to the difference in yield between corporate or municipal bonds (or a specific category of these bonds) and comparable U.S. Treasury issues. |
Which Underlying Equity Portfolios/Funds had the highest total returns during the reporting period, and which Underlying Equity Portfolios/Funds had the lowest total returns?
Of the Underlying Portfolios/Funds held for the full reporting period, the highest returns came from MainStay VP Emerging Markets Equity Portfolio and MainStay VP International Equity Portfolio. The most substantial losses came from MainStay VP Cushing Renaissance Advantage Portfolio and MainStay Cushing MLP Premier Fund.
Which Underlying Equity Portfolios/Funds made the strongest positive contributions to the Portfolio’s overall performance, and which Underlying Equity Portfolios/Funds were the greatest detractors?
The most significant contributions to the Portfolio’s performance came from MainStay VP Large Cap Growth Portfolio and MainStay VP Emerging Markets Equity Portfolio. (Contributions take weightings and total returns into account.) The largest detractors from the Portfolio’s performance included MainStay VP Cushing Renaissance Advantage Portfolio and MainStay Cushing MLP Premier Fund.
What factors and risks affected the Portfolio’s Underlying Fixed-Income Portfolio/Fund investments during the reporting period?
Economic growth has been steady but modest, with labor markets showing little remaining slack. For these reasons, we were especially surprised that the Federal Reserve repeatedly increased the federal funds target range during the reporting period, which raised the short end of the yield curve.6 Somewhat more surprising was how subdued inflation remained. Old rules of thumb connecting falling unemployment rates with
more rapid rates of wage gains and higher inflation appeared inapplicable during the reporting period. The combination of lower-than-expected inflation and ongoing quantitative easing by some central banks outside the United States—most notably the European Central Bank—contributed to falling bond yields during the reporting period.
During the reporting period, which fixed-income market segments were the strongest positive contributors to the Portfolio’s performance and which segments were particularly weak?
Riskier fixed-income securities that are sensitive to economic developments, such as speculative-grade debt and convertible bonds, fared well during the reporting period. Higher-quality bonds with longer maturities also pushed higher as yields fell. Cash climbed above zero, but provided very low yields.
Which Underlying Fixed-Income Portfolios/Funds made the strongest positive contributions to the Portfolio’s performance, and which Underlying Fixed-Income Portfolios/Funds were the greatest detractors?
In the fixed-income portion of the Portfolio, MainStay VP Convertible Portfolio made the largest positive contribution to performance, followed by MainStay VP High Yield Corporate Bond Portfolio. Although not technically an Underlying Fixed-Income Portfolio, MainStay VP Absolute Return Multi-Strategy Portfolio is similar to a bond fund in light of its volatility characteristics and return objective. It was the only Underlying Portfolio/Fund in the Portfolio that provided a negative total return. Cash was positive, but its contribution was minimal. MainStay VP PIMCO Real Return Portfolio also added very little to the Portfolio’s return.
| 6. | The yield curve is a line that plots the yields of various securities of similar quality—typically U.S. Treasury issues—across a range of maturities. The U.S. Treasury yield curve serves as a benchmark for other debt and is used in economic forecasting. |
The opinions expressed are those of the portfolio managers as of the date of this report and are subject to change. There is no guarantee that any forecasts made will come to pass. This material does not constitute investment advice and is not intended as an endorsement of any specific investment.
Not all MainStay VP Portfolios and/or share classes are available under all policies.
| | |
| 34 | | MainStay VP Moderate Growth Allocation Portfolio |
Portfolio of Investments June 30, 2017 (Unaudited)
| | | | | | | | |
| | |
Shares | | | Value | |
| Affiliated Investment Companies 99.1%† | |
Equity Funds 83.1% | |
IQ 50 Percent Hedged FTSE Europe ETF (a) | | | 1,304,893 | | | $ | 25,014,799 | |
IQ 50 Percent Hedged FTSE International ETF (a) | | | 2,983,744 | | | | 60,092,604 | |
IQ Chaikin U.S. Small Cap ETF (a) | | | 392,397 | | | | 10,002,200 | |
IQ Global Resources ETF (a) | | | 1,258,998 | | | | 32,079,269 | |
MainStay Cushing MLP Premier Fund Class I | | | 974,472 | | | | 13,009,198 | |
MainStay Emerging Markets Equity Fund Class I (a) | | | 1,199,544 | | | | 11,611,582 | |
MainStay Epoch Capital Growth Fund Class I (a) | | | 1,481,199 | | | | 17,433,716 | |
MainStay Epoch Global Choice Fund Class I (a) | | | 2,429,472 | | | | 49,464,050 | |
MainStay Epoch International Choice Fund Class I (a) | | | 2,956,478 | | | | 100,993,283 | |
MainStay Epoch U.S. All Cap Fund Class I (a) | | | 4,704,637 | | | | 136,246,285 | |
MainStay Epoch U.S. Equity Yield Fund Class I | | | 1,442,638 | | | | 22,663,840 | |
MainStay International Opportunities Fund Class I (a) | | | 10,587,654 | | | | 94,759,505 | |
MainStay MAP Equity Fund Class I (a) | | | 3,544,292 | | | | 149,604,547 | |
MainStay U.S. Equity Opportunities Fund Class I (a) | | | 13,911,275 | | | | 137,165,168 | |
MainStay VP Absolute Return Multi-Strategy Portfolio Initial Class (a)(b) | | | 5,204,864 | | | | 46,154,225 | |
MainStay VP Cornerstone Growth Portfolio Initial Class (b) | | | 760,457 | | | | 20,432,520 | |
MainStay VP Cushing Renaissance Advantage Portfolio Initial Class (a)(b) | | | 6,566,589 | | | | 57,855,203 | |
MainStay VP Eagle Small Cap Growth Portfolio Initial Class (a)(b) | | | 4,512,719 | | | | 60,328,978 | |
MainStay VP Emerging Markets Equity Portfolio Initial Class (a) | | | 14,613,746 | | | | 129,177,648 | |
MainStay VP Epoch U.S. Equity Yield Portfolio Initial Class | | | 2,308,458 | | | | 34,650,524 | |
MainStay VP Epoch U.S. Small Cap Portfolio Initial Class (a) | | | 8,151,627 | | | | 110,055,658 | |
MainStay VP International Equity Portfolio Initial Class (a) | | | 1,836,219 | | | | 28,833,016 | |
MainStay VP Large Cap Growth Portfolio Initial Class (a)(b) | | | 5,730,628 | | | | 126,896,032 | |
MainStay VP Mid Cap Core Portfolio Initial Class (a) | | | 8,726,418 | | | | 124,391,553 | |
MainStay VP S&P 500 Index Portfolio Initial Class | | | 152,573 | | | | 7,337,115 | |
MainStay VP Small Cap Core Portfolio Initial Class (a) | | | 6,190,216 | | | | 74,932,105 | |
| | | | | | | | |
| | |
Shares | | | Value | |
Equity Funds (continued) | |
MainStay VP T. Rowe Price Equity Income Portfolio Initial Class (a) | | | 10,666,384 | | | $ | 146,197,688 | |
| | | | | | | | |
| | | | | | | 1,827,382,311 | |
| | | | | | | | |
Fixed Income Funds 16.0% | |
IQ Enhanced Core Plus Bond U.S. ETF | | | 263,995 | | | | 5,295,740 | |
IQ S&P High Yield Low Volatility Bond ETF (a) | | | 159,031 | | | | 4,040,819 | |
MainStay Short Duration High Yield Fund Class I (a) | | | 5,153,568 | | | | 51,226,463 | |
MainStay Total Return Bond Fund Class I | | | 340,994 | | | | 3,614,535 | |
MainStay VP Bond Portfolio Initial Class | | | 350,149 | | | | 5,113,526 | |
MainStay VP Convertible Portfolio Initial Class (a) | | | 3,404,004 | | | | 44,125,822 | |
MainStay VP Floating Rate Portfolio Initial Class (a) | | | 13,040,458 | | | | 118,572,984 | |
MainStay VP High Yield Corporate Bond Portfolio Initial Class (a) | | | 4,696,737 | | | | 48,620,893 | |
MainStay VP PIMCO Real Return Portfolio Initial Class (a) | | | 1,822,054 | | | | 15,499,930 | |
MainStay VP Unconstrained Bond Portfolio Initial Class (a) | | | 5,659,219 | | | | 56,738,325 | |
| | | | | | | | |
| | | | | | | 352,849,037 | |
| | | | | | | | |
Total Affiliated Investment Companies
(Cost $2,063,495,255) | | | | 2,180,231,348 | |
| | | | | | | | |
| | |
| | | | | | | | |
| | | Principal
Amount | | | | |
| Short-Term Investment 0.9% | |
Repurchase Agreement 0.9% | |
Fixed Income Clearing Corp.
0.12%, dated 6/30/17
due 7/3/17
Proceeds at Maturity $19,477,489 (Collateralized by a Federal Home Loan Mortgage Corp. security with a rate of 0.75% and a maturity date of 7/14/17, with a Principal Amount of $19,770,000 and a Market Value of $19,836,566) | | $ | 19,447,294 | | | | 19,447,294 | |
| | | | | | | | |
Total Short-Term Investment
(Cost $19,447,294) | | | | 19,447,294 | |
| | | | | | | | |
Total Investments
(Cost $2,082,942,549) (c) | | | 100.0 | % | | | 2,199,678,642 | |
Other Assets, Less Liabilities | | | 0.0 | ‡ | | | 507,247 | |
Net Assets | | | 100.0 | % | | $ | 2,200,185,889 | |
| † | Percentages indicated are based on Portfolio net assets. |
| ‡ | Less than one-tenth of a percent. |
| | | | | | |
The notes to the financial statements are an integral part of,
and should be read in conjunction with, the financial statements. | | | | | 35 | |
Portfolio of Investments June 30, 2017 (Unaudited) (continued)
| (a) | The Portfolio’s ownership exceeds 5% of the outstanding shares of the Underlying Portfolio’s/Fund’s share class. (See Note 3) |
| (b) | Non-income producing Underlying Portfolio/Fund. |
| (c) | As of June 30, 2017, cost was $2,094,242,483 for federal income tax purposes and net unrealized appreciation was as follows: |
| | | | |
Gross unrealized appreciation | | $ | 130,135,091 | |
Gross unrealized depreciation | | | (24,698,932 | ) |
| | | | |
Net unrealized appreciation | | $ | 105,436,159 | |
| | | | |
The following abbreviation is used in the preceding pages:
ETF—Exchange-Traded Fund
The following is a summary of the fair valuations according to the inputs used as of June 30, 2017, for valuing the Portfolio’s assets.
Asset Valuation Inputs
| | | | | | | | | | | | | | | | |
Description | | Quoted
Prices in
Active
Markets for
Identical
Assets
(Level 1) | | | Significant
Other
Observable
Inputs
(Level 2) | | | Significant
Unobservable
Inputs
(Level 3) | | | Total | |
| Investments (a) | | | | | | | | | | | | | | | | |
| Affiliated Investment Companies | | | | | | | | | | | | | | | | |
Equity Funds | | $ | 1,827,382,311 | | | $ | — | | | $ | — | | | $ | 1,827,382,311 | |
Fixed Income Funds | | | 352,849,037 | | | | — | | | | — | | | | 352,849,037 | |
| Short-Term Investment | | | | | | | | | | | | | | | | |
Repurchase Agreement | | | — | | | | 19,447,294 | | | | — | | | | 19,447,294 | |
| | | | | | | | | | | | | | | | |
| Total Investments in Securities | | $ | 2,180,231,348 | | | $ | 19,447,294 | | | $ | — | | | $ | 2,199,678,642 | |
| | | | | | | | | | | | | | | | |
| (a) | For a complete listing of investments, see the Portfolio of Investments. |
The Portfolio recognizes transfers between the levels as of the beginning of the period.
For the period ended June 30, 2017, the Portfolio did not have any transfers among levels. (See Note 2)
As of June 30, 2017, the Portfolio did not hold any investments with significant unobservable inputs (Level 3). (See Note 2)
| | | | |
| 36 | | MainStay VP Moderate Growth Allocation Portfolio | | The notes to the financial statements are an integral part of,
and should be read in conjunction with, the financial statements. |
Statement of Assets and Liabilities as of June 30, 2017 (Unaudited)
| | | | |
| Assets | |
Investment in affiliated investment companies, at value
(identified cost $2,063,495,255) | | $ | 2,180,231,348 | |
Repurchase agreement, at value
(identified cost $19,447,294) | | | 19,447,294 | |
Cash | | | 56,399 | |
Receivables: | |
Fund shares sold | | | 1,312,003 | |
Investment securities sold | | | 421,200 | |
Dividends and interest | | | 65 | |
Other assets | | | 11,895 | |
| | | | |
Total assets | | | 2,201,480,204 | |
| | | | |
|
| Liabilities | |
Payables: | |
Fund shares redeemed | | | 638,932 | |
NYLIFE Distributors (See Note 3) | | | 436,118 | |
Shareholder communication | | | 191,097 | |
Professional fees | | | 9,875 | |
Directors | | | 3,617 | |
Custodian | | | 1,356 | |
Accrued expenses | | | 13,320 | |
| | | | |
Total liabilities | | | 1,294,315 | |
| | | | |
Net assets | | $ | 2,200,185,889 | |
| | | | |
|
| Composition of Net Assets | |
Shares of beneficial interest outstanding (par value of $.001 per share) unlimited number of shares authorized | | $ | 186,837 | |
Additional paid-in capital | | | 2,072,138,221 | |
| | | | |
| | | 2,072,325,058 | |
Undistributed net investment income | | | 32,016,730 | |
Accumulated net realized gain (loss) on investments | | | (20,891,992 | ) |
Net unrealized appreciation (depreciation) on investments | | | 116,736,093 | |
| | | | |
Net assets | | $ | 2,200,185,889 | |
| | | | |
| | | | |
Initial Class | |
Net assets applicable to outstanding shares | | $ | 83,662,612 | |
| | | | |
Shares of beneficial interest outstanding | | | 7,034,251 | |
| | | | |
Net asset value per share outstanding | | $ | 11.89 | |
| | | | |
Service Class | |
Net assets applicable to outstanding shares | | $ | 2,116,523,277 | |
| | | | |
Shares of beneficial interest outstanding | | | 179,803,206 | |
| | | | |
Net asset value per share outstanding | | $ | 11.77 | |
| | | | |
| | | | | | |
The notes to the financial statements are an integral part of,
and should be read in conjunction with, the financial statements. | | | | | 37 | |
Statement of Operations for the six months ended June 30, 2017 (Unaudited)
| | | | |
| Investment Income (Loss) | |
Income | |
Dividend distributions from affiliated investment companies | | $ | 6,959,764 | |
Interest | | | 21,749 | |
| | | | |
Total income | | | 6,981,513 | |
| | | | |
Expenses | |
Distribution/Service—Service Class (See Note 3) | | | 2,569,324 | |
Shareholder communication | | | 134,105 | |
Professional fees | | | 55,784 | |
Trustees | | | 26,187 | |
Custodian | | | 4,541 | |
Miscellaneous | | | 29,995 | |
| | | | |
Total expenses | | | 2,819,936 | |
| | | | |
Net investment income (loss) | | | 4,161,577 | |
| | | | |
|
| Realized and Unrealized Gain (Loss) on Investments | |
Net realized gain (loss) on: | |
Affiliated investment company transactions | | | (2,607,728 | ) |
Realized capital gain distributions from affiliated investment companies | | | 3,730,906 | |
| | | | |
Net realized gain (loss) on investments and investments from affiliated investment companies | | | 1,123,178 | |
| | | | |
Net change in unrealized appreciation (depreciation) on investments | | | 159,710,487 | |
| | | | |
Net realized and unrealized gain (loss) on investments | | | 160,833,665 | |
| | | | |
Net increase (decrease) in net assets resulting from operations | | $ | 164,995,242 | |
| | | | |
| | | | |
| 38 | | MainStay VP Moderate Growth Allocation Portfolio | | The notes to the financial statements are an integral part of,
and should be read in conjunction with, the financial statements. |
Statements of Changes in Net Assets
for the six months ended June 30, 2017 (Unaudited) and the year ended December 31, 2016
| | | | | | | | |
| | | 2017 | | | 2016 | |
| Increase (Decrease) in Net Assets | |
Operations: | |
Net investment income (loss) | | $ | 4,161,577 | | | $ | 26,143,853 | |
Net realized gain (loss) on investments and investments from affiliated investment companies transactions | | | 1,123,178 | | | | 46,192,018 | |
Net change in unrealized appreciation (depreciation) on investments | | | 159,710,487 | | | | 71,260,840 | |
| | | | |
Net increase (decrease) in net assets resulting from operations | | | 164,995,242 | | | | 143,596,711 | |
| | | | |
Dividends and distributions to shareholders: | | | | | | | | |
From net investment income: | | | | | | | | |
Initial Class | | | — | | | | (1,500,343 | ) |
Service Class | | | — | | | | (35,381,464 | ) |
| | | | |
| | | — | | | | (36,881,807 | ) |
| | | | |
From net realized gain on investments: | | | | | | | | |
Initial Class | | | — | | | | (4,237,806 | ) |
Service Class | | | — | | | | (113,382,136 | ) |
| | | | |
| | | — | | | | (117,619,942 | ) |
| | | | |
Total dividends and distributions to shareholders | | | — | | | | (154,501,749 | ) |
| | | | |
Capital share transactions: | |
Net proceeds from sale of shares | | | 90,088,647 | | | | 195,489,575 | |
Net asset value of shares issued to shareholders in reinvestment of dividends and distributions | | | — | | | | 154,501,749 | |
Cost of shares redeemed | | | (121,621,452 | ) | | | (210,331,533 | ) |
| | | | |
Increase (decrease) in net assets derived from capital share transactions | | | (31,532,805 | ) | | | 139,659,791 | |
| | | | |
Net increase (decrease) in net assets | | | 133,462,437 | | | | 128,754,753 | |
|
| Net Assets | |
Beginning of period | | | 2,066,723,452 | | | | 1,937,968,699 | |
| | | | |
End of period | | $ | 2,200,185,889 | | | $ | 2,066,723,452 | |
| | | | |
Undistributed net investment income at end of period | | $ | 32,016,730 | | | $ | 27,855,153 | |
| | | | |
| | | | | | |
The notes to the financial statements are an integral part of,
and should be read in conjunction with, the financial statements. | | | | | 39 | |
Financial Highlights selected per share data and ratios
| | | | | | | | | | | | | | | | | | | | | | | | | | | | |
| | | Six months
ended
June 30, | | | | | | Year ended December 31, | |
| Initial Class | | 2017* | | | | | | 2016 | | | 2015 | | | 2014 | | | 2013 | | | 2012 | |
Net asset value at beginning of period | | $ | 11.00 | | | | | | | $ | 11.08 | | | $ | 12.78 | | | $ | 13.36 | | | $ | 11.07 | | | $ | 10.16 | |
| | | | | | | | | | | | | | | | | | | | | | | | | | | | |
Net investment income (loss) (a) | | | 0.00 | ‡ | | | | | | | 0.18 | | | | 0.17 | | | | 0.20 | | | | 0.17 | | | | 0.16 | |
Net realized and unrealized gain (loss) on investments | | | 0.89 | | | | | | | | 0.64 | | | | (0.49 | ) | | | 0.39 | | | | 2.66 | | | | 1.32 | |
| | | | | | | | | | | | | | | | | | | | | | | | | | | | |
Total from investment operations | | | 0.89 | | | | | | | | 0.82 | | | | (0.32 | ) | | | 0.59 | | | | 2.83 | | | | 1.48 | |
| | | | | | | | | | | | | | | | | | | | | | | | | | | | |
| Less dividends and distributions: | | | | | | | | | | | | | | | | | | | | | | | | | | | | |
From net investment income | | | — | | | | | | | | (0.24 | ) | | | (0.30 | ) | | | (0.25 | ) | | | (0.17 | ) | | | (0.13 | ) |
From net realized gain on investments | | | — | | | | | | | | (0.66 | ) | | | (1.08 | ) | | | (0.92 | ) | | | (0.37 | ) | | | (0.44 | ) |
| | | | | | | | | | | | | | | | | | | | | | | | | | | | |
Total dividends and distributions | | | — | | | | | | | | (0.90 | ) | | | (1.38 | ) | | | (1.17 | ) | | | (0.54 | ) | | | (0.57 | ) |
| | | | | | | | | | | | | | | | | | | | | | | | | | | | |
Net asset value at end of period | | $ | 11.89 | | | | | | | $ | 11.00 | | | $ | 11.08 | | | $ | 12.78 | | | $ | 13.36 | | | $ | 11.07 | |
| | | | | | | | | | | | | | | | | | | | | | | | | | | | |
Total investment return (b) | | | 8.09 | %(c) | | | | | | | 7.56 | % | | | (2.35 | %) | | | 4.59 | % | | | 25.92 | % | | | 14.66 | % |
| Ratios (to average net assets)/Supplemental Data: | | | | | | | | | | | | | | | | | | | | | | | | | | | | |
Net investment income (loss) | | | 0.63 | %†† | | | | | | | 1.60 | % | | | 1.38 | % | | | 1.51 | % | | | 1.40 | % | | | 1.46 | % |
Net expenses (d) | | | 0.02 | %†† | | | | | | | 0.03 | % | | | 0.02 | % | | | 0.03 | % | | | 0.03 | % | | | 0.03 | % |
Portfolio turnover rate | | | 15 | % | | | | | | | 33 | % | | | 34 | % | | | 44 | % | | | 51 | % | | | 52 | % |
Net assets at end of period (in 000’s) | | $ | 83,663 | | | | | | | $ | 76,025 | | | $ | 68,000 | | | $ | 66,849 | | | $ | 58,341 | | | $ | 44,210 | |
| ‡ | Less than one cent per share. |
| (a) | Per share data based on average shares outstanding during the period. |
| (b) | Total return does not reflect any deduction of sales charges, mortality and expense charges, contract charges or administrative charges. For periods of less than one year, total return is not annualized. |
| (c) | Total investment return may reflect adjustments to conform to generally accepted accounting principles. |
| (d) | In addition to the fees and expenses which the Portfolio bears directly, the Portfolio indirectly bears a pro-rata share of the fees and expenses of the Underlying Portfolios/Funds in which it invests. Such indirect expenses are not included in the above expense ratios. |
| | | | | | | | | | | | | | | | | | | | | | | | | | | | |
| | | Six months
ended
June 30, | | | | | | Year ended December 31, | |
| Service Class | | 2017* | | | | | | 2016 | | | 2015 | | | 2014 | | | 2013 | | | 2012 | |
Net asset value at beginning of period | | $ | 10.90 | | | | | | | $ | 10.99 | | | $ | 12.68 | | | $ | 13.28 | | | $ | 11.02 | | | $ | 10.12 | |
| | | | | | | | | | | | | | | | | | | | | | | | | | | | |
Net investment income (loss) (a) | | | 0.56 | | | | | | | | 0.14 | | | | 0.14 | | | | 0.17 | | | | 0.15 | | | | 0.14 | |
Net realized and unrealized gain (loss) on investments | | | 0.31 | | | | | | | | 0.64 | | | | (0.47 | ) | | | 0.38 | | | | 2.63 | | | | 1.31 | |
| | | | | | | | | | | | | | | | | | | | | | | | | | | | |
Total from investment operations | | | 0.87 | | | | | | | | 0.78 | | | | (0.33 | ) | | | 0.55 | | | | 2.78 | | | | 1.45 | |
| | | | | | | | | | | | | | | | | | | | | | | | | | | | |
| Less dividends and distributions: | | | | | | | | | | | | | | | | | | | | | | | | | | | | |
From net investment income | | | — | | | | | | | | (0.21 | ) | | | (0.28 | ) | | | (0.23 | ) | | | (0.15 | ) | | | (0.11 | ) |
From net realized gain on investments | | | — | | | | | | | | (0.66 | ) | | | (1.08 | ) | | | (0.92 | ) | | | (0.37 | ) | | | (0.44 | ) |
| | | | | | | | | | | | | | | | | | | | | | | | | | | | |
Total dividends and distributions | | | — | | | | | | | | (0.87 | ) | | | (1.36 | ) | | | (1.15 | ) | | | (0.52 | ) | | | (0.55 | ) |
| | | | | | | | | | | | | | | | | | | | | | | | | | | | |
Net asset value at end of period | | $ | 11.77 | | | | | | | $ | 10.90 | | | $ | 10.99 | | | $ | 12.68 | | | $ | 13.28 | | | $ | 11.02 | |
| | | | | | | | | | | | | | | | | | | | | | | | | | | | |
Total investment return (b) | | | 7.98 | %(c) | | | | | | | 7.30 | % | | | (2.59 | %) | | | 4.33 | % | | | 25.61 | % | | | 14.37 | % |
| Ratios (to average net assets)/Supplemental Data: | | | | | | | | | | | | | | | | | | | | | | | | | | | | |
Net investment income (loss) | | | 0.38 | %†† | | | | | | | 1.32 | % | | | 1.13 | % | | | 1.28 | % | | | 1.18 | % | | | 1.28 | % |
Net expenses (d) | | | 0.27 | %†† | | | | | | | 0.28 | % | | | 0.27 | % | | | 0.28 | % | | | 0.28 | % | | | 0.28 | % |
Portfolio turnover rate | | | 15 | % | | | | | | | 33 | % | | | 34 | % | | | 44 | % | | | 51 | % | | | 52 | % |
Net assets at end of period (in 000’s) | | $ | 2,116,523 | | | | | | | $ | 1,990,699 | | | $ | 1,869,969 | | | $ | 1,855,721 | | | $ | 1,624,855 | | | $ | 1,113,622 | |
| (a) | Per share data based on average shares outstanding during the period. |
| (b) | Total return does not reflect any deduction of sales charges, mortality and expense charges, contract charges or administrative charges. For periods of less than one year, total return is not annualized. |
| (c) | Total investment return may reflect adjustments to conform to generally accepted accounting principles. |
| (d) | In addition to the fees and expenses which the Portfolio bears directly, the Portfolio indirectly bears a pro-rata share of the fees and expenses of the Underlying Portfolios/Funds in which it invests. Such indirect expenses are not included in the above expense ratios. |
| | | | |
| 40 | | MainStay VP Moderate Growth Allocation Portfolio | | The notes to the financial statements are an integral part of,
and should be read in conjunction with, the financial statements. |
MainStay VP Growth Allocation Portfolio
Investment and Performance Comparison1 (Unaudited)
Performance data quoted represents past performance. Past performance is no guarantee of future results. Because of market volatility and other factors, current performance may be lower or higher than the figures shown. Investment return and principal value will fluctuate, and as a result, when shares are redeemed, they may be worth more or less than their original cost. The performance table and graph do not reflect any deduction of sales charges, mortality and expense charges, contract charges or administrative charges. Please refer to the Performance Summary appropriate for your policy. For performance information current to the most recent month-end, please call 800-598-2019 or visit www.newyorklife.com.
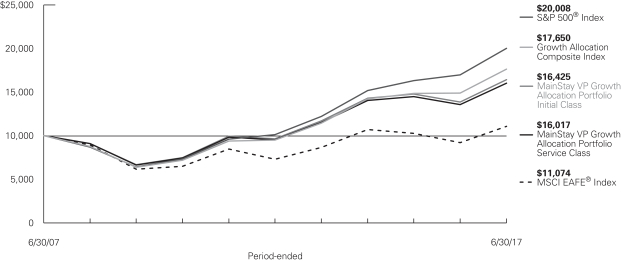
Average Annual Total Returns for the Period Ended June 30, 2017
| | | | | | | | | | | | | | | | | | |
| Class | | Inception
Date | | Six Months | | One Year | | Five Years | | | Ten Years | | | Gross
Expense
Ratio2 | |
| Initial Class Shares | | 2/13/2006 | | 9.81% | | 18.51% | | | 11.27 | % | | | 5.09 | % | | | 1.18 | % |
| Service Class Shares | | 2/13/2006 | | 9.68 | | 18.22 | | | 10.99 | | | | 4.82 | | | | 1.43 | |
| | | | | | | | | | | | | | | | |
| Benchmark Performance | | Six
Months | | | One
Year | | | Five
Years | | | Ten
Years | |
S&P 500® Index3 | | | 9.34 | % | | | 17.90 | % | | | 14.63 | % | | | 7.18 | % |
MSCI EAFE® Index4 | | | 13.81 | | | | 20.27 | | | | 8.69 | | | | 1.03 | |
Growth Allocation Composite Index5 | | | 10.46 | | | | 18.55 | | | | 13.17 | | | | 5.85 | |
Average Lipper Variable Products Mixed-Asset Target Allocation Aggressive Growth Portfolio6 | | | 9.71 | | | | 17.31 | | | | 10.48 | | | | 4.34 | |
| 1. | Performance figures reflect certain fee waivers and/or expense limitations, without which total returns may have been different. For information on current fee waivers and/or expense limitations (if any), please refer to the Notes to Financial Statements. |
| 2. | The gross expense ratios presented reflect the Portfolio’s “Total Annual Portfolio Operating Expenses” from the most recent Prospectus and may differ from other expense ratios disclosed in this report. |
| 3. | The S&P 500® Index is the Portfolio’s primary broad-based securities market index for comparison purposes. “S&P 500®” is a trademark of The McGraw-Hill Companies, Inc. The S&P 500® Index is widely regarded as the standard index for measuring large-cap U.S. stock market performance. Results assume reinvestment of all dividends and capital gains. An investment cannot be made directly in an index. |
| 4. | The MSCI EAFE® Index is the Portfolio’s secondary benchmark. The MSCI EAFE® Index consists of international stocks representing the developed |
| | world outside of North America. Results assume reinvestment of all dividends and capital gains. An investment cannot be made directly in an index. |
| 5. | The Portfolio has selected the Growth Allocation Composite Index as an additional benchmark. The Growth Allocation Composite Index consists of the S&P 500® Index and the MSCI EAFE® Index weighted 75% and 25%, respectively. Results assume reinvestment of all dividends and capital gains. An investment cannot be made directly in an index. |
| 6. | The Average Lipper Variable Products Mixed-Asset Target Allocation Aggressive Growth Portfolio is representative of portfolios that, by portfolio practice, maintain at least 80% of assets in equity securities, with the remainder invested in bonds, cash, and cash equivalents. This benchmark is a product of Lipper Inc. Lipper Inc. is an independent monitor of fund performance. Results are based on average total returns of similar portfolios with all dividend and capital gain distributions reinvested. |
The footnotes are an integral part of the table and graph and should be carefully read in conjunction with them.
Cost in Dollars of a $1,000 Investment in MainStay VP Growth Allocation Portfolio (Unaudited)
The example below is intended to describe the fees and expenses borne by shareholders during the six-month period from January 1, 2017 to June 30, 2017, and the impact of those costs on your investment.
Example
As a shareholder of the Portfolio, you incur two types of costs: (1) transaction costs, including exchange fees and sales charges (loads) on purchases (as applicable), and (2) ongoing costs, including management fees, distribution and/or service (12b-1) fees, and other Portfolio expenses (as applicable). This example is intended to help you understand your ongoing costs (in dollars) of investing in the Portfolio and to compare these costs with the ongoing costs of investing in other mutual funds. The example is based on an investment of $1,000 made at the beginning of the six-month period and held for the entire period from January 1, 2017 to June 30, 2017. Shares are only sold in connection with variable life and annuity contracts and the example does not reflect any contract level or transactional fees or expenses. If these costs had been included, your costs would have been higher.
This example illustrates your Portfolio’s ongoing costs in two ways:
Actual Expenses
The second and third data columns in the table below provide information about actual account values and actual expenses. You may use the information in these columns, together with the amount you invested, to estimate the expenses that you paid during the six months ended June 30, 2017. Simply divide your account value by $1,000 (for
example, an $8,600 account value divided by $1,000 = 8.6), then multiply the result by the number under the heading entitled “Expenses Paid During Period” to estimate the expenses you paid on your account during this period.
Hypothetical Example for Comparison Purposes
The fourth and fifth data columns in the table below provide information about hypothetical account values and hypothetical expenses based on the Portfolio’s actual expense ratio and an assumed rate of return of 5% per year before expenses, which is not the Portfolio’s actual return. The hypothetical account values and expenses may not be used to estimate the actual ending account balances or expenses you paid for the six-month period shown. You may use this information to compare the ongoing costs of investing in the Portfolio with the ongoing costs of investing in other mutual funds. To do so, compare this 5% hypothetical example with the 5% hypothetical examples that appear in the shareholder reports of the other mutual funds.
Please note that the expenses shown in the table are meant to highlight your ongoing costs only and do not reflect any transactional costs, such as exchange fees or sales charges (loads). Therefore, the fourth and fifth data columns of the table are useful in comparing ongoing costs only and will not help you determine the relative total costs of owning different funds. In addition, if these transactional costs were included, your costs would have been higher.
| | | | | | | | | | | | | | | | | | | | | | |
| | | | | | | | | | | | | | | | | | |
| Share Class | | Beginning
Account
Value
1/1/17 | | | Ending Account
Value (Based
on Actual
Returns and
Expenses)
6/30/17 | | | Expenses
Paid
During
Period1 | | | Ending Account
Value (Based
on Hypothetical
5% Annualized
Return and
Actual Expenses)
6/30/17 | | | Expenses
Paid
During
Period1 | | | Net Expense
Ratio
During
Period2 |
| | | | | | |
| Initial Class Shares | | $ | 1,000.00 | | | $ | 1,098.10 | | | $ | 0.16 | | | $ | 1,024.60 | | | $ | 0.15 | | | 0.03% |
| | | | | | |
| Service Class Shares | | $ | 1,000.00 | | | $ | 1,096.80 | | | $ | 1.46 | | | $ | 1,023.40 | | | $ | 1.40 | | | 0.28% |
| 1. | Expenses are equal to the Portfolio’s annualized expense ratio of each class multiplied by the average account value over the period, divided by 365 and multiplied by 181 (to reflect the six-month period). The table above represents the actual expenses incurred during the six-month period. In addition to the fees and expenses which the Portfolio bears directly, the Portfolio indirectly bears a pro rata share of the fees and expenses of the Underlying Portfolios/Funds in which it invests. Such indirect expenses are not included in the above-reported expense figures. |
| 2. | Expenses are equal to the Portfolio’s annualized expense ratio to reflect the six-month period. |
| | |
| 42 | | MainStay VP Growth Allocation Portfolio |
Investment Objectives of Underlying Portfolios/Funds as of June 30, 2017 (Unaudited)
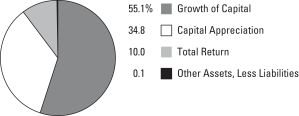
See Portfolio of Investments beginning on page 46 for specific holdings within these categories.
Portfolio Management Discussion and Analysis (Unaudited)
Answers to the questions reflect the views of portfolio managers Jae S.Yoon, CFA, Jonathan Swaney, Poul Kristensen, CFA, and Amit Soni, CFA, of New York Life Investments,1 the Portfolio’s Manager.
How did MainStay VP Growth Allocation Portfolio perform relative to its benchmarks and peers during the six months ended June 30, 2017?
For the six months ended June 30, 2017, MainStay VP Growth Allocation Portfolio returned 9.81% for Initial Class shares and 9.68% for Service Class shares. Over the same period, both share classes outperformed the 9.34% return of the S&P 500® Index,2 which is the Portfolio’s primary benchmark, but underperformed the 13.81% return of the MSCI EAFE® Index,2 which is a secondary benchmark of the Portfolio. For the six months ended June 30, 2017, both share classes underperformed the 10.46% return of the Growth Allocation Composite Index,2 which is an additional benchmark of the Portfolio. Over the same period, Initial Class shares outperformed—and Service Class shares underperformed—the 9.71% return of the Average Lipper3 Variable Products Mixed-Asset Target Allocation Aggressive Growth Portfolio.
What factors affected the Portfolio’s relative performance during the reporting period?
The Portfolio is a “fund of funds,” meaning that it seeks to achieve its investment objective by investing primarily in mutual funds and exchange-traded funds (“ETFs”) managed by New York Life Investments or its affiliates (the “Underlying Portfolios/Funds”). Although the Portfolio may invest up to 10% of its assets in Underlying Fixed-Income Portfolios/Funds, the Portfolio seeks to achieve its investment objective by normally investing substantially all of its assets in Underlying Equity Portfolios/Funds (normally within a range of 90% to 100%). The Underlying Equity Portfolios/Funds may invest in domestic or international stocks at various capitalization levels. The Portfolio’s primary benchmark, the S&P 500® Index, on the other hand, consists entirely of U.S. large-cap stocks. These differences—particularly the Portfolio’s exposure to international equities—accounted for the Portfolio’s outperformance of its primary benchmark because international equities in the aggregate generally outperformed U.S. large-cap stocks during the reporting period. The Growth Allocation Composite Index reflects a broader mix of asset classes than the S&P 500® Index and offers an alternative yardstick against which to measure the performance of the Portfolio.
Asset class policy in the aggregate had relatively little impact on the Portfolio’s active return during the reporting period. Because we anticipated strong domestic growth spurred in part by policy stimulus, the Portfolio was skewed in favor of Underlying Equity Portfolios/Funds that invested in the United States rather than in international markets. This positioning proved to be a drag on performance, as policy developments progressed more slowly
than expected at home while growth overseas was stronger than expected. For similar reasons, a tilt toward small-cap stocks detracted from relative performance. Offsetting these factors was a bias toward emerging-market equities.
More influential than asset allocation decisions were the Underlying Portfolios/Funds the Portfolio selected to gain exposure to those asset classes. A few Underlying Portfolio/Fund investments proved problematic, among them were Underlying Portfolios/Funds that invested in commodity-related equities, such as MainStay Cushing MLP Premier Fund, MainStay VP Cushing Renaissance Advantage Portfolio and IndexIQ Global Resources ETF. Capital investment in supply capacity has been greatly curtailed over the past few years, even as global demand has continued to grow. We anticipated that this dynamic could lead to higher commodity prices and rising profits for commodity producers, but these results were not seen during the reporting period. In addition, the Portfolio’s use of a currency hedged fund to gain exposure to international equities also weighed on results, as foreign currencies generally strengthened in relation to the U.S. dollar. Together, these Underlying Portfolio/Fund selection decisions cost the Portfolio close to 0.5% in return.
How did you allocate the Portfolio’s assets during the reporting period and why?
We considered a variety of information, including the portfolio-level characteristics of the Underlying Portfolios/Funds, such as capitalization, style biases and sector exposures. We also examined the attributes of the holdings of the Underlying Portfolios/Funds, such as valuation metrics, earnings data and technical indicators. Generally speaking, we seek to invest the Portfolio’s assets in Underlying Portfolios/Funds that correspond well to our desired asset class exposures and appear positioned to benefit from the current economic environment. Our desired asset class exposures include attractively valued market segments that we believe enjoy strong price and earnings momentum.
Risk exposure did not stray particularly far from that of the Growth Allocation Composite Index during the reporting period, but there were a few policy adjustments within asset classes. Having tactically pulled back on small-cap stocks in the wake of a sharp rally late in 2016, we reversed course and reestablished a preference for small-cap companies after a period of underperformance in the first part of 2017. This positioning reflected our belief that small-cap companies were likely to be among the preferred beneficiaries of corporate tax reform, deregulation, trade negotiations and strong domestic consumption.
| 1. | “New York Life Investments” is a service mark used by New York Life Investment Management Holdings LLC and its subsidiary New York Life Investment Management LLC. |
| 2. | See footnote on page 41 for more information on this index. |
| 3. | See footnote on page 41 for more information on Lipper Inc. |
| | |
| 44 | | MainStay VP Growth Allocation Portfolio |
Our perception of opportunities in Europe—and internationally in general—evolved during the reporting period. For some time, we have been encouraged by available economic data and have perceived relative equity valuations to be attractive. Even so, the potential for disruptive political events dissuaded us from investing heavily in international stocks. With polls suggesting a high likelihood that a centrist would win in France’s presidential election, we determined that we were more pessimistic than was justified, and we increased the Portfolio’s exposure at the margins. The Portfolio continued to add exposure to Underlying Portfolios/Funds that invest in international stocks, as we believed that U.S. economic expansion appeared quite mature while economies in other parts of the world appeared to be earlier in their respective cycles with more room for growth.
How did the Portfolio’s allocations change over the course of the reporting period?
We decided to increase the Portfolio’s exposure to international equities with an emphasis on European and emerging-market companies. This positioning reflected our belief that the discount on the valuation of these stocks was excessive and that these stocks offered more compelling growth opportunities than those in the United States.
We initiated a position in MainStay VP Cornerstone Growth Portfolio, which the Portfolio had not owned for several years. A new management team assumed responsibility for MainStay VP Cornerstone Growth Portfolio last summer, introducing a quantitative discipline with which we were very familiar and altogether comfortable. The investment was funded primarily by reducing the Portfolio’s position in MainStay VP Large Cap Growth Portfolio.
The Portfolio increased its exposure to MainStay VP Cushing Renaissance Advantage Portfolio. We have witnessed domestic unconventional energy production rebound despite efforts on the part of the Organization of Petroleum Exporting Countries (OPEC) to drive shale drillers out of the market. In our opinion, the United States is poised to become the world’s dominant producer in the years ahead, benefiting not just energy companies but also domestic energy consumers.
Which Underlying Portfolios/Funds had the highest total returns during the reporting period, and which Underlying Portfolios/Funds had the lowest total returns?
Of the Underlying Portfolios/Funds held for the full reporting period, the highest returns came from MainStay VP Emerging Markets Equity Portfolio and MainStay VP International Equity Portfolio. The most substantial losses came from MainStay VP Cushing Renaissance Advantage Portfolio and MainStay Cushing MLP Premier Fund.
Which Underlying Portfolios/Funds made the strongest positive contributions to the Portfolio’s overall performance, and which Underlying Portfolios/Funds were the greatest detractors?
The most significant contributions to the Portfolio’s performance came from MainStay VP Large Cap Growth Portfolio and MainStay VP Emerging Markets Equity Portfolio. (Contributions take weightings and total returns into account.) The largest detractors from the Portfolio’s performance included MainStay VP Cushing Renaissance Advantage Portfolio and MainStay Cushing MLP Premier Fund.
The opinions expressed are those of the portfolio managers as of the date of this report and are subject to change. There is no guarantee that any forecasts made will come to pass. This material does not constitute investment advice and is not intended as an endorsement of any specific investment.
Not all MainStay VP Portfolios and/or share classes are available under all policies.
Portfolio of Investments June 30, 2017 (Unaudited)
| | | | | | | | |
| | |
Shares | | | Value | |
| Affiliated Investment Companies 99.9%† | |
Equity Funds 99.9% | |
IQ 50 Percent Hedged FTSE Europe ETF (a) | | | 548,171 | | | $ | 10,508,438 | |
IQ 50 Percent Hedged FTSE International ETF (a) | | | 1,327,764 | | | | 26,741,167 | |
IQ Chaikin U.S. Small Cap ETF (a) | | | 464,381 | | | | 11,837,072 | |
IQ Global Resources ETF (a) | | | 734,071 | | | | 18,704,129 | |
MainStay Cushing MLP Premier Fund Class I | | | 439,892 | | | | 5,872,564 | |
MainStay Emerging Markets Equity Fund Class I | | | 667,090 | | | | 6,457,429 | |
MainStay Epoch Capital Growth Fund Class I (a) | | | 711,793 | | | | 8,377,804 | |
MainStay Epoch Global Choice Fund Class I (a) | | | 1,047,482 | | | | 21,326,742 | |
MainStay Epoch International Choice Fund Class I (a) | | | 1,850,038 | | | | 63,197,307 | |
MainStay Epoch U.S. All Cap Fund Class I (a) | | | 2,634,337 | | | | 76,290,388 | |
MainStay Epoch U.S. Equity Yield Fund Class I | | | 529,158 | | | | 8,313,067 | |
MainStay International Opportunities Fund Class I (a) | | | 6,317,285 | | | | 56,539,702 | |
MainStay MAP Equity Fund Class I (a) | | | 1,945,693 | | | | 82,127,697 | |
MainStay U.S. Equity Opportunities Fund Class I (a) | | | 7,785,341 | | | | 76,763,462 | |
MainStay VP Cornerstone Growth Portfolio Initial Class (b) | | | 358,364 | | | | 9,628,806 | |
MainStay VP Cushing Renaissance Advantage Portfolio Initial Class (a)(b) | | | 5,085,991 | | | | 44,810,332 | |
MainStay VP Eagle Small Cap Growth Portfolio Initial Class (a)(b) | | | 2,625,877 | | | | 35,104,441 | |
MainStay VP Emerging Markets Equity Portfolio Initial Class (a) | | | 8,337,420 | | | | 73,698,309 | |
MainStay VP Epoch U.S. Equity Yield Portfolio Initial Class | | | 1,724,627 | | | | 25,887,077 | |
MainStay VP Epoch U.S. Small Cap Portfolio Initial Class (a) | | | 4,190,179 | | | | 56,571,878 | |
| | | | | | | | |
| | |
Shares | | | Value | |
Equity Funds (continued) | |
MainStay VP International Equity Portfolio Initial Class (a) | | | 1,054,750 | | | $ | 16,562,089 | |
MainStay VP Large Cap Growth Portfolio Initial Class (a)(b) | | | 3,472,973 | | | | 76,903,694 | |
MainStay VP Mid Cap Core Portfolio Initial Class (a) | | | 4,618,977 | | | | 65,841,635 | |
MainStay VP S&P 500 Index Portfolio Initial Class | | | 265,537 | | | | 12,769,479 | |
MainStay VP Small Cap Core Portfolio Initial Class (a) | | | 3,652,448 | | | | 44,212,613 | |
MainStay VP T. Rowe Price Equity Income Portfolio Initial Class (a) | | | 5,957,508 | | | | 81,655,960 | |
| | | | | | | | |
| | | | | | | 1,016,703,281 | |
| | | | | | | | |
Total Affiliated Investment Companies
(Cost $956,753,817) | | | | | | | 1,016,703,281 | |
| | | | | | | | |
Total Investments
(Cost $956,753,817) (c) | | | 99.9 | % | | | 1,016,703,281 | |
Other Assets, Less Liabilities | | | 0.1 | | | | 587,210 | |
Net Assets | | | 100.0 | % | | $ | 1,017,290,491 | |
| † | Percentages indicated are based on Portfolio net assets. |
| (a) | The Portfolio’s ownership exceeds 5% of the outstanding shares of the Underlying Portfolio’s/Fund’s share class. (See Note 3) |
| (b) | Non-income producing Underlying Portfolio/Fund. |
| (c) | As of June 30, 2017, cost was $963,643,893 for federal income tax purposes and net unrealized appreciation was as follows: |
| | | | |
Gross unrealized appreciation | | $ | 65,836,810 | |
Gross unrealized depreciation | | | (12,777,422 | ) |
| | | | |
Net unrealized appreciation | | $ | 53,059,388 | |
| | | | |
The following abbreviation is used in the preceding pages:
ETF—Exchange-Traded Fund
The following is a summary of the fair valuations according to the inputs used as of June 30, 2017, for valuing the Portfolio’s assets.
Asset Valuation Inputs
| | | | | | | | | | | | | | | | |
Description | | Quoted
Prices in
Active
Markets for
Identical
Assets (Level 1) | | | Significant
Other
Observable
Inputs (Level 2) | | | Significant
Unobservable
Inputs (Level 3) | | | Total | |
| Investments (a) | | | | | | | | | | | | | | | | |
| Affiliated Investment Companies | | | | | | | | | | | | | | | | |
Equity Funds | | $ | 1,016,703,281 | | | $ | — | | | $ | — | | | $ | 1,016,703,281 | |
| | | | | | | | | | | | | | | | |
| Total Investments in Securities | | $ | 1,016,703,281 | | | $ | — | | | $ | — | | | $ | 1,016,703,281 | |
| | | | | | | | | | | | | | | | |
| (a) | For a complete listing of investments, see the Portfolio of Investments. |
The Portfolio recognizes transfers between the levels as of the beginning of the period.
For the period ended June 30, 2017, the Portfolio did not have any transfers among levels. (See Note 2)
As of June 30, 2017, the Portfolio did not hold any investments with significant unobservable inputs (Level 3). (See Note 2)
| | | | |
| 46 | | MainStay VP Growth Allocation Portfolio | | The notes to the financial statements are an integral part of,
and should be read in conjunction with, the financial statements. |
Statement of Assets and Liabilities as of June 30, 2017 (Unaudited)
| | | | |
Assets | | | | |
Investment in affiliated investment companies, at value (identified cost $956,753,817) | | $ | 1,016,703,281 | |
Cash | | | 667,441 | |
Receivables: | | | | |
Fund shares sold | | | 951,253 | |
Other assets | | | 5,135 | |
| | | | |
Total assets | | | 1,018,327,110 | |
| | | | |
| |
| Liabilities | | | | |
Payables: | |
Fund shares redeemed | | | 397,944 | |
Investment securities purchased | | | 337,663 | |
NYLIFE Distributors (See Note 3) | | | 194,910 | |
Shareholder communication | | | 84,081 | |
Professional fees | | | 12,948 | |
Trustees | | | 1,565 | |
Custodian | | | 998 | |
Accrued expenses | | | 6,510 | |
| | | | |
Total liabilities | | | 1,036,619 | |
| | | | |
Net assets | | $ | 1,017,290,491 | |
| | | | |
| |
| Composition of Net Assets | | | | |
Shares of beneficial interest outstanding (par value of $.001 per share) unlimited number of shares authorized | | $ | 88,221 | |
Additional paid-in capital | | | 973,550,503 | |
| | | | |
| | | 973,638,724 | |
Undistributed net investment income | | | 8,394,334 | |
Accumulated net realized gain (loss) on | | | (24,692,031 | ) |
Net unrealized appreciation (depreciation) on investments | | | 59,949,464 | |
| | | | |
Net assets | | $ | 1,017,290,491 | |
| | | | |
| | | | |
Initial Class | | | | |
Net assets applicable to outstanding shares | | $ | 67,305,711 | |
| | | | |
Shares of beneficial interest outstanding | | | 5,783,995 | |
| | | | |
Net asset value per share outstanding | | $ | 11.64 | |
| | | | |
Service Class | | | | |
Net assets applicable to outstanding shares | | $ | 949,984,780 | |
| | | | |
Shares of beneficial interest outstanding | | | 82,436,955 | |
| | | | |
Net asset value per share outstanding | | $ | 11.52 | |
| | | | |
| | | | | | |
The notes to the financial statements are an integral part of,
and should be read in conjunction with, the financial statements. | | | | | 47 | |
Statement of Operations for the six months ended June 30, 2017 (Unaudited)
| | | | |
| Investment Income (Loss) | |
Income | | | | |
Dividend distributions from affiliated investment companies | | $ | 975,072 | |
Interest | | | 3,420 | |
| | | | |
Total income | | | 978,492 | |
| | | | |
Expenses | | | | |
Distribution/Service—Service Class (See Note 3) | | | 1,115,507 | |
Shareholder communication | | | 59,854 | |
Professional fees | | | 33,616 | |
Trustees | | | 11,406 | |
Custodian | | | 3,433 | |
Miscellaneous | | | 14,024 | |
| | | | |
Total expenses | | | 1,237,840 | |
| | | | |
Net investment income (loss) | | | (259,348 | ) |
| | | | |
|
| Realized and Unrealized Gain (Loss) on Investments | |
Net realized gain (loss) on: | |
Affiliated investment company transactions | | | (5,041,946 | ) |
Realized capital gain distributions from affiliated investment companies | | | 1,433,215 | |
| | | | |
Net realized gain (loss) on investments and investments from affiliated investment companies | | | (3,608,731 | ) |
| | | | |
Net change in unrealized appreciation (depreciation) on investments | | | 91,296,874 | |
| | | | |
Net realized and unrealized gain (loss) on investments | | | 87,688,143 | |
| | | | |
Net increase (decrease) in net assets resulting from operations | | $ | 87,428,795 | |
| | | | |
| | | | |
| 48 | | MainStay VP Growth Allocation Portfolio | | The notes to the financial statements are an integral part of,
and should be read in conjunction with, the financial statements. |
Statements of Changes in Net Assets
for the six months ended June 30, 2017 (Unaudited) and the year ended December 31, 2016
| | | | | | | | |
| | | 2017 | | | 2016 | |
| Increase (Decrease) in Net Assets | |
Operations: | | | | | | | | |
Net investment income (loss) | | $ | (259,348 | ) | | $ | 7,721,498 | |
Net realized gain (loss) on investments and investments from affiliated investment companies transactions | | | (3,608,731 | ) | | | 17,384,684 | |
Net change in unrealized appreciation (depreciation) on investments | | | 91,296,874 | | | | 38,363,720 | |
| | | | |
Net increase (decrease) in net assets resulting from operations | | | 87,428,795 | | | | 63,469,902 | |
| | | | |
Dividends and distributions to shareholders: | | | | | | | | |
From net investment income: | | | | | | | | |
Initial Class | | | — | | | | (856,310 | ) |
Service Class | | | — | | | | (10,408,544 | ) |
| | | | |
| | | — | | | | (11,264,854 | ) |
| | | | |
From net realized gain on investments: | | | | | | | | |
Initial Class | | | — | | | | (3,389,322 | ) |
Service Class | | | — | | | | (47,414,966 | ) |
| | | | |
| | | — | | | | (50,804,288 | ) |
| | | | |
Total dividends and distributions to shareholders | | | — | | | | (62,069,142 | ) |
| | | | |
Capital share transactions: | | | | | | | | |
Net proceeds from sale of shares | | | 99,260,880 | | | | 181,085,639 | |
Net asset value of shares issued to shareholders in reinvestment of dividends and distributions | | | — | | | | 62,069,142 | |
Cost of shares redeemed | | | (59,249,547 | ) | | | (90,975,849 | ) |
| | | | |
Increase (decrease) in net assets derived from capital share transactions | | | 40,011,333 | | | | 152,178,932 | |
| | | | |
Net increase (decrease) in net assets | | | 127,440,128 | | | | 153,579,692 | |
|
| Net Assets | |
Beginning of period | | | 889,850,363 | | | | 736,270,671 | |
| | | | |
End of period | | $ | 1,017,290,491 | | | $ | 889,850,363 | |
| | | | |
Undistributed net investment income at end of period | | $ | 8,394,334 | | | $ | 8,653,682 | |
| | | | |
| | | | | | |
The notes to the financial statements are an integral part of,
and should be read in conjunction with, the financial statements. | | | | | 49 | |
Financial Highlights selected per share data and ratios
| | | | | | | | | | | | | | | | | | | �� | | | | | | | | | |
| | | Six months
ended
June 30, | | | | | | Year ended December 31, | |
| Initial Class | | 2017* | | | | | | 2016 | | | 2015 | | | 2014 | | | 2013 | | | 2012 | |
Net asset value at beginning of period | | $ | 10.60 | | | | | | | $ | 10.63 | | | $ | 12.12 | | | $ | 12.51 | | | $ | 10.11 | | | $ | 9.47 | |
| | | | | | | | | | | | | | | | | | | | | | | | | | | | |
Net investment income (loss) | | | 0.01 | (a) | | | | | | | 0.12 | (a) | | | 0.10 | (a) | | | 0.18 | (a) | | | 0.10 | | | | 0.10 | |
Net realized and unrealized gain (loss) on investments | | | 1.03 | | | | | | | | 0.68 | | | | (0.49 | ) | | | 0.40 | | | | 2.97 | | | | 1.35 | |
| | | | | | | | | | | | | | | | | | | | | | | | | | | | |
Total from investment operations | | | 1.04 | | | | | | | | 0.80 | | | | (0.39 | ) | | | 0.58 | | | | 3.07 | | | | 1.45 | |
| | | | | | | | | | | | | | | | | | | | | | | | | | | | |
| Less dividends and distributions: | | | | | | | | | | | | | | | | | | | | | | | | | | | | |
From net investment income | | | — | | | | | | | | (0.17 | ) | | | (0.22 | ) | | | (0.17 | ) | | | (0.12 | ) | | | (0.11 | ) |
From net realized gain on investments | | | — | | | | | | | | (0.66 | ) | | | (0.88 | ) | | | (0.80 | ) | | | (0.55 | ) | | | (0.70 | ) |
| | | | | | | | | | | | | | | | | | | | | | | | | | | | |
Total dividends and distributions | | | — | | | | | | | | (0.83 | ) | | | (1.10 | ) | | | (0.97 | ) | | | (0.67 | ) | | | (0.81 | ) |
| | | | | | | | | | | | | | | | | | | | | | | | | | | | |
Net asset value at end of period | | $ | 11.64 | | | | | | | $ | 10.60 | | | $ | 10.63 | | | $ | 12.12 | | | $ | 12.51 | | | $ | 10.11 | |
| | | | | | | | | | | | | | | | | | | | | | | | | | | | |
Total investment return (b) | | | 9.81 | % | | | | | | | 7.59 | % | | | (3.13 | %) | | | 4.88 | % | | | 30.85 | % | | | 15.47 | % |
| Ratios (to average net assets)/Supplemental Data: | | | | | | | | | | | | | | | | | | | | | | | | | | | | |
Net investment income (loss) | | | 0.18 | %†† | | | | | | | 1.19 | % | | | 0.85 | % | | | 1.43 | % | | | 0.98 | % | | | 0.92 | % |
Net expenses (c) | | | 0.03 | %†† | | | | | | | 0.03 | % | | | 0.03 | % | | | 0.03 | % | | | 0.04 | % | | | 0.04 | % |
Portfolio turnover rate | | | 13 | % | | | | | | | 21 | % | | | 29 | % | | | 27 | % | | | 41 | % | | | 42 | % |
Net assets at end of period (in 000’s) | | $ | 67,306 | | | | | | | $ | 60,070 | | | $ | 51,447 | | | $ | 48,088 | | | $ | 43,169 | | | $ | 31,447 | |
| (a) | Per share data based on average shares outstanding during the period. |
| (b) | Total return does not reflect any deduction of sales charges, mortality and expense charges, contract charges or administrative charges. For periods of less than one year, total return is not annualized. |
| (c) | In addition to the fees and expenses which the Portfolio bears directly, the Portfolio indirectly bears a pro-rata share of the fees and expenses of the Underlying Portfolios/Funds in which it invests. Such indirect expenses are not included in the above expense ratios. |
| | | | | | | | | | | | | | | | | | | | | | | | | | | | |
| | | Six months
ended
June 30, | | | | | | Year ended December 31, | |
| Service Class | | 2017* | | | | | | 2016 | | | 2015 | | | 2014 | | | 2013 | | | 2012 | |
Net asset value at beginning of period | | $ | 10.51 | | | | | | | $ | 10.55 | | | $ | 12.05 | | | $ | 12.45 | | | $ | 10.08 | | | $ | 9.44 | |
| | | | | | | | | | | | | | | | | | | | | | | | | | | | |
Net investment income (loss) | | | (0.00 | )(a)‡ | | | | | | | 0.10 | (a) | | | 0.08 | (a) | | | 0.13 | (a) | | | 0.06 | | | | 0.06 | |
Net realized and unrealized gain (loss) on investments | | | 1.01 | | | | | | | | 0.66 | | | | (0.50 | ) | | | 0.42 | | | | 2.95 | | | | 1.36 | |
| | | | | | | | | | | | | | | | | | | | | | | | | | | | |
Total from investment operations | | | 1.01 | | | | | | | | 0.76 | | | | (0.42 | ) | | | 0.55 | | | | 3.01 | | | | 1.42 | |
| | | | | | | | | | | | | | | | | | | | | | | | | | | | |
| Less dividends and distributions: | | | | | | | | | | | | | | | | | | | | | | | | | | | | |
From net investment income | | | — | | | | | | | | (0.14 | ) | | | (0.20 | ) | | | (0.15 | ) | | | (0.09 | ) | | | (0.08 | ) |
From net realized gain on investments | | | — | | | | | | | | (0.66 | ) | | | (0.88 | ) | | | (0.80 | ) | | | (0.55 | ) | | | (0.70 | ) |
| | | | | | | | | | | | | | | | | | | | | | | | | | | | |
Total dividends and distributions | | | — | | | | | | | | (0.80 | ) | | | (1.08 | ) | | | (0.95 | ) | | | (0.64 | ) | | | (0.78 | ) |
| | | | | | | | | | | | | | | | | | | | | | | | | | | | |
Net asset value at end of period | | $ | 11.52 | | | | | | | $ | 10.51 | | | $ | 10.55 | | | $ | 12.05 | | | $ | 12.45 | | | $ | 10.08 | |
| | | | | | | | | | | | | | | | | | | | | | | | | | | | |
Total investment return (b) | | | 9.61 | % (c) | | | | | | | 7.32 | % | | | (3.37 | %) | | | 4.62 | % | | | 30.53 | % | | | 15.18 | % |
| Ratios (to average net assets)/Supplemental Data: | | | | | | | | | | | | | | | | | | | | | | | | | | | | |
Net investment income (loss) | | | (0.07 | %)†† | | | | | | | 0.95 | % | | | 0.65 | % | | | 1.03 | % | | | 0.76 | % | | | 0.65 | % |
Net expenses (d) | | | 0.28 | % †† | | | | | | | 0.28 | % | | | 0.28 | % | | | 0.28 | % | | | 0.29 | % | | | 0.29 | % |
Portfolio turnover rate | | | 13 | % | | | | | | | 21 | % | | | 29 | % | | | 27 | % | | | 41 | % | | | 42 | % |
Net assets at end of period (in 000’s) | | $ | 949,985 | | | | | | | $ | 829,780 | | | $ | 684,824 | | | $ | 550,573 | | | $ | 351,563 | | | $ | 228,393 | |
| ‡ | Less than one cent per share. |
| (a) | Per share data based on average shares outstanding during the period. |
| (b) | Total return does not reflect any deduction of sales charges, mortality and expense charges, contract charges or administrative charges. For periods of less than one year, total return is not annualized. |
| (c) | Total investment return may reflect adjustments to conform to generally accepted accounting principles. |
| (d) | In addition to the fees and expenses which the Portfolio bears directly, the Portfolio indirectly bears a pro-rata share of the fees and expenses of the Underlying Portfolios/Funds in which it invests. Such indirect expenses are not included in the above expense ratios. |
| | | | |
| 50 | | MainStay VP Growth Allocation Portfolio | | The notes to the financial statements are an integral part of,
and should be read in conjunction with, the financial statements. |
Notes to Financial Statements (Unaudited)
Note 1–Organization and Business
MainStay VP Funds Trust (the “Fund”) was organized as a Delaware statutory trust on February 1, 2011. The Fund is registered under the Investment Company Act of 1940, as amended (the “1940 Act”), as an open-end management investment company. The Fund is comprised of thirty-two separate series (collectively referred to as the “Portfolios” and each individually referred to as a “Portfolio”). These financial statements and notes relate to the MainStay VP Conservative Allocation Portfolio, MainStay VP Moderate Allocation Portfolio, MainStay VP Moderate Growth Allocation Portfolio and MainStay VP Growth Allocation Portfolio (collectively referred to as the “Allocation Portfolios” and each individually referred to as an “Allocation Portfolio”). Each is a “diversified” portfolio, as that term is defined in the 1940 Act, as interpreted or modified by regulatory authorities having jurisdiction, from time to time.
Shares of the Allocation Portfolios are currently offered to certain separate accounts to fund variable annuity policies and variable universal life insurance policies issued by New York Life Insurance and Annuity Corporation (“NYLIAC”), a wholly-owned subsidiary of New York Life Insurance Company (“New York Life”). NYLIAC allocates shares of the Allocation Portfolios to, among others, NYLIAC Variable Annuity Separate Accounts-I, II, III and IV, VUL Separate Account-I and CSVUL Separate Account-I (collectively, the “Separate Accounts”).
The Allocation Portfolios each currently offer two classes of shares. Initial Class and Service Class shares commenced operations on February 13, 2006. Shares of the Allocation Portfolios are sold and are redeemed at a price equal to their respective net asset value (“NAV”) per share. No sales or redemption charge is applicable to the purchase or redemption of the Allocation Portfolios’ shares. Under the terms of the Fund’s multiple class plan, adopted pursuant to Rule 18f-3 under the 1940 Act, the classes differ in that, among other things, Service Class shares of the Portfolios pay a combined distribution and service fee of 0.25% of average daily net assets to the Distributor (as defined in Note 3(B)), pursuant to a plan adopted in accordance with Rule 12b-1 under the 1940 Act. Contract owners of variable annuity contracts purchased after June 2, 2003, are permitted to invest only in the Service Class shares.
The investment objective for each of the Allocation Portfolios is as follows:
The MainStay VP Conservative Allocation Portfolio seeks current income and, secondarily, long-term growth of capital.
The MainStay VP Moderate Allocation Portfolio seeks long-term growth of capital and, secondarily, current income.
The MainStay VP Moderate Growth Allocation Portfolio seeks long-term growth of capital and, secondarily, current income.
The MainStay VP Growth Allocation Portfolio seeks long-term growth of capital.
Each Allocation Portfolio is a “fund-of-funds,” meaning that each seeks to achieve their investment objectives by investing primarily in other mutual funds and exchange-traded funds (“ETFs”), for which New York Life Investment Management LLC (“New York Life Investments” or “Manager”) or its affiliates serve as manager (the “Underlying Portfolios/Funds”).
Note 2–Significant Accounting Policies
The Allocation Portfolios are investment companies and accordingly follow the investment company accounting and reporting guidance of the Financial Accounting Standards Board (“FASB”) Accounting Standard Codification Topic 946 Financial Services—Investment Companies. The Allocation Portfolios prepare their financial statements in accordance with generally accepted accounting principles (“GAAP”) in the United States of America and follow the significant accounting policies described below.
(A) Securities Valuation. Investments are usually valued as of the close of regular trading on the New York Stock Exchange (the “Exchange”) (usually 4:00 p.m. Eastern time) on each day the Allocation Portfolios are open for business (“valuation date”).
The Board of Trustees (the “Board”) of the Fund adopted procedures establishing methodologies for the valuation of the Allocation Portfolios’ securities and other assets and delegated the responsibility for valuation determinations under those procedures to the Valuation Committee of the Fund (the “Valuation Committee”). The Board authorized the Valuation Committee to appoint a Valuation Sub-Committee (the “Sub-Committee”) to deal in the first instance with establishing the prices of securities for which market quotations are not readily available or the prices of which are not otherwise readily determinable under these procedures. The Sub-Committee meets (in person, via electronic mail or via teleconference) on an as-needed basis. Subsequently, the Valuation Committee meets to ensure that actions taken by the Sub-Committee were appropriate. The procedures recognize that, subject to the oversight of the Board and unless otherwise noted, the responsibility for the day-to-day valuation of portfolio assets (including fair value measurements for the Allocation Portfolios’ assets and liabilities) rests with New York Life Investments.
To assess the appropriateness of security valuations, the Manager or the Allocation Portfolios’ third-party service provider, who is subject to oversight by the Manager, regularly compares prior day prices, prices on comparable securities, and the sale prices to the prior and current day prices and challenges prices with changes exceeding certain tolerance levels with third-party pricing services or broker sources. For those securities valued through either a standardized fair valuation methodology or a fair valuation measurement, the Sub-Committee deals in the first instance with such valuation and the Valuation Committee reviews and affirms, if appropriate, the reasonableness of the valuation based on such methodologies and measurements on a regular basis after considering all relevant information that is reasonably available. Any action taken by the Sub-Committee with respect to the valuation of a portfolio security or other asset is submitted by the Valuation Committee to the Board for its review and ratification, if appropriate, at its next regularly scheduled meeting.
“Fair value” is defined as the price an Allocation Portfolio would reasonably expect to receive upon selling an asset or liability in an orderly transaction to an independent buyer in the principal or most advantageous market for the asset or liability. Fair value measurements are determined within a framework that establishes a three-tier hierarchy which maximizes the use of observable market data and minimizes the use of unobservable inputs to establish a classification of fair value measurements for disclosure purposes. “Inputs” refer broadly to the
Notes to Financial Statements (Unaudited) (continued)
assumptions that market participants would use in pricing the asset or liability, including assumptions about risk, such as the risk inherent in a particular valuation technique used to measure fair value using a pricing model and/or the risk inherent in the inputs for the valuation technique. Inputs may be observable or unobservable. Observable inputs reflect the assumptions market participants would use in pricing the asset or liability based on market data obtained from sources independent of the Allocation Portfolios. Unobservable inputs reflect each Allocation Portfolio’s own assumptions about the assumptions market participants would use in pricing the asset or liability based on the information available. The inputs or methodology used for valuing assets or liabilities may not be an indication of the risks associated with investing in those assets or liabilities. The three-tier hierarchy of inputs is summarized below.
| • | | Level 1—quoted prices in active markets for an identical asset or liability |
| • | | Level 2—other significant observable inputs (including quoted prices for a similar asset or liability in active markets, interest rates and yield curves, prepayment speeds, credit risk, etc.) |
| • | | Level 3—significant unobservable inputs (including each Allocation Portfolio’s own assumptions about the assumptions that market participants would use in measuring fair value of an asset or liability) |
The level of an asset or liability within the fair value hierarchy is based on the lowest level of an input, both individually and in the aggregate, that is significant to the fair value measurement. As of June 30, 2017, the aggregate value by input level of each Allocation Portfolio’s assets and liabilities is included at the end of each Allocation Portfolio’s Portfolio of Investments.
Investments in Underlying Portfolios/Funds are valued at their respective NAVs at the close of business each day. These securities are generally categorized as Level 1 in the hierarchy.
Securities held by the Underlying Portfolios/Funds are valued using policies consistent with those used by the Underlying Portfolios/Funds. Equity securities and shares of ETFs are generally valued at the last quoted sales price as of the close of regular trading on the relevant exchange on each valuation date.
The information above is not intended to reflect an exhaustive list of the methodologies that may be used to value portfolio investments. The valuation procedures permit the use of a variety of valuation methodologies in connection with valuing portfolio investments. The methodology used for a specific type of investment may vary based on the
market data available or other considerations. The methodologies summarized above may not represent the specific means by which portfolio investments are valued on any particular business day.
(B) Income Taxes. The Allocation Portfolios’ policy is to comply with the requirements of the Internal Revenue Code of 1986, as amended (the “Internal Revenue Code”), applicable to regulated investment companies and to distribute all of its taxable income to the shareholders of each Allocation Portfolio within the allowable time limits. Therefore, no federal, state and local income tax provisions are required.
Management evaluates each Allocation Portfolio’s tax positions to determine if the tax positions taken meet the minimum recognition threshold in connection with accounting for uncertainties in income tax positions taken or expected to be taken for the purposes of measuring
and recognizing tax liabilities in the financial statements. Recognition of tax benefits of an uncertain tax position is permitted only to the extent the position is “more likely than not” to be sustained assuming examination by taxing authorities. Management has analyzed the Allocation Portfolios’ tax positions taken on federal, state and local income tax returns for all open tax years (for up to three tax years), and has concluded that no provisions for federal, state and local income tax are required in the Allocation Portfolios’ financial statements. The Allocation Portfolios’ federal, state and local income and federal excise tax returns for tax years for which the applicable statutes of limitations have not expired are subject to examination by the Internal Revenue Service and state and local departments of revenue.
(C) Dividends and Distributions to Shareholders. Dividends and distributions are recorded on the ex-dividend date. The Allocation Portfolios intend to declare and pay dividends from net investment income and distributions from net realized capital and currency gains, if any, at least annually. Unless the shareholder elects otherwise, all dividends and distributions are reinvested in the same class of shares of the respective Allocation Portfolio, at NAV. Dividends and distributions to shareholders are determined in accordance with federal income tax regulations and may differ from GAAP.
(D) Security Transactions and Investment Income. The Allocation Portfolios record security transactions on the trade date. Realized gains and losses on security transactions are determined using the identified cost method. Dividends and distributions received by the Allocation Portfolios from the Underlying Portfolios/Funds are recorded on the ex-dividend date.
Investment income and realized and unrealized gains and losses on investments of the Allocation Portfolios are allocated pro rata to the separate classes of shares based upon their relative net assets on the date the income is earned or realized and unrealized gains and losses are incurred.
(E) Expenses. Expenses of the Fund are allocated to the individual Allocation Portfolios in proportion to the net assets of the respective Allocation Portfolios when the expenses are incurred, except where direct allocations of expenses can be made. Expenses (other than fees incurred under the distribution and service plans, further discussed in Note 3(B), which are charged directly to the Service Class shares) are allocated to separate classes of shares pro rata based upon their relative net assets on the date the expenses are incurred. The expenses borne by the Allocation Portfolios, including those incurred with related parties to the Allocation Portfolios, are shown on the Statement of Operations. Additionally, the Allocation Portfolios may invest in shares of ETFs or mutual funds, which are subject to management fees and other fees that may increase their costs versus the costs of owning the underlying securities directly. These indirect expenses of ETFs or mutual funds are not included in the amounts shown as expenses on each Allocation Portfolios Statement of Operations or in the expense ratios included in the financial highlights. In addition, the Allocation Portfolios bear a pro rata share of the fees and expenses of the Underlying Portfolios/Funds in which they invest. Because the Underlying Portfolios/Funds have varied expense and fee levels and the Allocation Portfolios may own different proportions of the Underlying Portfolios/Funds at different times, the amount of fees and expenses incurred indirectly by each Allocation Portfolio may vary.
| | |
| 52 | | MainStay VP Allocation Portfolios |
(F) Use of Estimates. In preparing financial statements in conformity with GAAP, management makes estimates and assumptions that affect the reported amounts and disclosures in the financial statements. Actual results could differ from those estimates.
(G) Repurchase Agreements. The Allocation Portfolios may enter into repurchase agreements (i.e., buy a security from another party with the agreement that it be sold back in the future) to earn income. The Allocation Portfolios may enter into repurchase agreements only with counterparties, usually financial institutions that are deemed by the Manager to be creditworthy, pursuant to guidelines established by the Board. During the term of any repurchase agreement, the Manager will continue to monitor the creditworthiness of the seller. Under the 1940 Act, repurchase agreements are considered to be collateralized loans by the Allocation Portfolio to the counterparty secured by the securities transferred to the respective Allocation Portfolio.
Repurchase agreements are subject to counterparty risk, meaning an Allocation Portfolio could lose money by the counterparty’s failure to perform under the terms of the agreement. The Allocation Portfolios mitigates this risk by ensuring the repurchase agreement is collateralized by cash, U.S. government securities, fixed income securities and/or other securities. The collateral is held by the Allocation Portfolios’ custodian and valued daily on a mark to market basis to determine if the value, including accrued interest, exceeds the repurchase price. In the event of the counterparty default on the obligation to repurchase, the Allocation Portfolios have the right to liquidate the collateral and apply the proceeds in satisfaction of the obligation. Under certain circumstances, such as in the event of default or bankruptcy by the counterparty, realization and/or retention of the collateral may be limited or subject to delay, to legal proceedings and possible realized loss to the respective Allocation Portfolio.
(H) Indemnifications. Under the Fund’s organizational documents, its officers and trustees are indemnified against certain liabilities that may arise out of performance of their duties to the Fund. Additionally, in the normal course of business, each Allocation Portfolio enters into contracts with third-party service providers that contain a variety of representations and warranties and which may provide general indemnifications. The Allocation Portfolios’ maximum exposure under these arrangements is unknown, as this would involve future claims that may be made against the Allocation Portfolios that have not yet occurred. Based on experience, management is of the view that the risk of loss in connection with these potential indemnification obligations is remote. However, there can be no assurance that material liabilities related to such obligations will not arise in the future, which could adversely impact the Allocation Portfolios.
Note 3–Fees and Related Party Transactions
(A) Manager. New York Life Investments, a registered investment adviser and an indirect, wholly-owned subsidiary of New York Life, serves as the Allocation Portfolios’ Manager pursuant to an Amended and Restated Management Agreement (“Management Agreement”) and is responsible for the day-to-day portfolio management of the Allocation Portfolios. The Manager provides offices, conducts clerical, recordkeeping and bookkeeping services, and keeps most of the financial and accounting records required to be maintained by the Allocation Portfolios. Except for the portion of salaries and expenses that are the
responsibility of the Allocation Portfolios, the Manager pays the salaries and expenses of all personnel affiliated with the Allocation Portfolios and the operational expenses of the Allocation Portfolios. The Allocation Portfolios reimburse New York Life Investments in an amount equal to a portion of the compensation of the Chief Compliance Officer attributable to the Allocation Portfolios.
The Allocation Portfolios do not pay any fees to the Manager in return for the services performed. The Allocation Portfolios do, however, indirectly pay a proportionate share of the management fees paid to the managers of the Underlying Portfolios/Funds in which the Allocation Portfolios invest.
State Street Bank and Trust Company (“State Street”) provides sub-administration and sub-accounting services to the Allocation Portfolios pursuant to an agreement with New York Life Investments. These services include calculating the daily NAVs of the Allocation Portfolios, maintaining the general ledger and sub-ledger accounts for the calculation of the Allocation Portfolios’ respective NAVs, and assisting New York Life Investments in conducting various aspects of the Allocation Portfolios’ administrative operations. For providing these services to the Allocation Portfolios, State Street is compensated by New York Life Investments.
(B) Distribution and Service Fees. The Fund, on behalf of the Allocation Portfolios, has entered into a distribution agreement with NYLIFE Distributors LLC (the “Distributor”), an indirect, wholly-owned subsidiary of New York Life. The Allocation Portfolios have adopted a distribution plan (the “Plan”) in accordance with the provisions of Rule 12b-1 under the 1940 Act. Under the Plan, the Distributor has agreed to provide, through its affiliates or independent third parties, various distribution-related, shareholder and administrative support services to the Service Class shareholders. For its services, the Distributor is entitled to a combined distribution and service fee accrued daily and paid monthly at an annual rate of 0.25% of the average daily net assets attributable to the Service Class shares of each Allocation Portfolio.
Notes to Financial Statements (Unaudited) (continued)
(C) Investments in Affiliates (in 000’s). During the six-month period ended June 30, 2017, purchases and sales transactions, income earned from investments and percentage of outstanding shares of investment companies managed by New York Life or its affiliates were as follows:
MainStay VP Conservative Allocation Portfolio
| | | | | | | | | | | | | | | | | | | | | | | | | | | | |
Affiliated Investment Company | | Value,
beginning of
period | | | Cost of
Purchases | | | Proceeds of
Sales | | | Dividend
Income | | | Capital Gain
Distributions
Received | | | Value,
end of
period | | | % Ownership | |
IQ 50 Percent Hedged FTSE Europe ETF | | $ | — | | | $ | 11,568 | | | $ | (333 | ) | | $ | 155 | | | $ | — | | | $ | 11,514 | | | | 8.6 | |
IQ 50 Percent Hedged FTSE International ETF | | | 15,656 | | | | 9,112 | | | | (1,039 | ) | | | 360 | | | | — | | | | 25,327 | | | | 8.3 | |
IQ Chaikin U.S. Small Cap ETF | | | — | | | | 335 | | | | — | | | | — | (a) | | | — | | | | 347 | | | | 0.3 | |
IQ Enhanced Core Plus Bond U.S. ETF | | | 38,170 | | | | 2,731 | | | | (414 | ) | | | 531 | | | | — | | | | 41,210 | | | | 16.2 | |
IQ Global Resources ETF | | | 4,465 | | | | 1,608 | | | | (41 | ) | | | — | | | | — | | | | 6,063 | | | | 3.5 | |
IQ S&P High Yield Low Volatility Bond ETF | | | — | | | | 7,085 | | | | — | | | | — | | | | — | | | | 7,073 | | | | 9.0 | |
MainStay Cushing MLP Premier Fund Class I | | | 6,535 | | | | 286 | | | | (328 | ) | | | 286 | | | | — | | | | 5,778 | | | | 1.0 | |
MainStay Emerging Markets Equity Fund Class I | | | 1,946 | | | | 64 | | | | (10 | ) | | | — | | | | — | | | | 2,439 | | | | 1.5 | |
MainStay Epoch Capital Growth Fund Class I | | | 6,769 | | | | 56 | | | | (206 | ) | | | — | | | | — | | | | 7,545 | | | | 7.6 | |
MainStay Epoch Global Choice Fund Class I | | | 19,253 | | | | — | | | | (1,992 | ) | | | — | | | | — | | | | 20,283 | | | | 11.1 | |
MainStay Epoch International Choice Fund Class I (b) | | | 6,255 | | | | 19 | | | | (2,917 | ) | | | — | | | | — | | | | 4,087 | | | | 0.8 | |
MainStay Epoch U.S. All Cap Fund Class I | | | 28,047 | | | | — | | | | (8,213 | ) | | | — | | | | — | | | | 22,535 | | | | 2.9 | |
MainStay Epoch U.S. Equity Yield Fund Class I | | | 2,699 | | | | 2,807 | | | | (2,023 | ) | | | 31 | | | | — | | | | 3,365 | | | | 0.6 | |
MainStay High Yield Corporate Bond Fund Class I | | | — | | | | 4,745 | | | | (5,121 | ) | | | 54 | | | | — | | | | — | | | | — | |
MainStay High Yield Municipal Bond Fund Class I | | | 14,192 | | | | 178 | | | | (14,843 | ) | | | 165 | | | | — | | | | — | | | | — | |
MainStay High Yield Opportunities Fund Class I (c) | | | 5,153 | | | | 36 | | | | (4,850 | ) | | | 36 | | | | — | | | | — | | | | — | |
MainStay ICAP Equity Fund Class I (d) | | | 9,001 | | | | 472 | | | | (9,897 | ) | | | 23 | | | | 450 | | | | — | | | | — | |
MainStay International Opportunities Fund Class I | | | 5,317 | | | | 4,345 | | | | (3,503 | ) | | | — | | | | — | | | | 6,543 | | | | 1.3 | |
MainStay MAP Equity Fund Class I | | | 28,018 | | | | 120 | | | | (6,415 | ) | | | — | | | | — | | | | 24,551 | | | | 3.3 | |
MainStay Short Duration High Yield Fund Class I | | | 19,015 | | | | 3,382 | | | | (530 | ) | | | 452 | | | | — | | | | 21,927 | | | | 3.6 | |
MainStay Total Return Bond Fund Class I | | | 26,264 | | | | 20,010 | | | | (43,058 | ) | | | 285 | | | | — | | | | 3,563 | | | | 0.3 | |
MainStay U.S. Equity Opportunities Fund Class I | | | 28,086 | | | | 576 | | | | (7,593 | ) | | | — | | | | — | | | | 22,563 | | | | 3.2 | |
MainStay VP Absolute Return Multi-Strategy Portfolio Initial Class | | | 75,164 | | | | 66 | | | | (7,927 | ) | | | — | | | | — | | | | 65,895 | | | | 36.4 | |
MainStay VP Bond Portfolio Initial Class | | | 196,531 | | | | 6,910 | | | | (84,888 | ) | | | — | | | | — | | | | 122,562 | | | | 26.1 | |
MainStay VP Convertible Portfolio Initial Class | | | 4,347 | | | | 13,342 | | | | (489 | ) | | | 179 | | | | — | | | | 17,788 | | | | 7.6 | |
MainStay VP Cornerstone Growth Portfolio Initial Class | | | — | | | | 7,882 | | | | (177 | ) | | | — | | | | — | | | | 8,230 | | | | 2.0 | |
MainStay VP Cushing Renaissance Advantage Portfolio Initial Class | | | 6,944 | | | | 11,327 | | | | (661 | ) | | | — | | | | — | | | | 15,807 | | | | 11.4 | |
MainStay VP Eagle Small Cap Growth Portfolio Initial Class | | | 12,361 | | | | 114 | | | | (1,421 | ) | | | — | | | | — | | | | 12,365 | | | | 4.2 | |
MainStay VP Emerging Markets Equity Portfolio Initial Class | | | 23,755 | | | | 16,790 | | | | (3,372 | ) | | | — | | | | — | | | | 42,767 | | | | 11.1 | |
MainStay VP Epoch U.S. Equity Yield Portfolio Initial Class (d) | | | — | | | | 9,086 | | | | (391 | ) | | | — | | | | — | | | | 9,160 | | | | 1.2 | |
MainStay VP Epoch U.S. Small Cap Portfolio Initial Class | | | 22,293 | | | | 318 | | | | (6,458 | ) | | | — | | | | — | | | | 17,312 | | | | 5.9 | |
MainStay VP Floating Rate Portfolio Initial Class | | | 62,975 | | | | 6,431 | | | | (1,074 | ) | | | 1,277 | | | | — | | | | 68,163 | | | | 20.3 | |
MainStay VP High Yield Corporate Bond Portfolio Initial Class | | | 42,115 | | | | 1 | | | | (10,610 | ) | | | — | | | | — | | | | 32,945 | | | | 5.3 | |
MainStay VP Indexed Bond Portfolio Initial Class | | | — | | | | 94,976 | | | | (1,947 | ) | | | | | | | — | | | | 93,486 | | | | 99.0 | |
MainStay VP Large Cap Growth Portfolio Initial Class | | | 39,060 | | | | 110 | | | | (22,400 | ) | | | — | | | | — | | | | 22,216 | | | | 5.4 | |
MainStay VP Mid Cap Core Portfolio Initial Class | | | 26,697 | | | | 125 | | | | (7,664 | ) | | | — | | | | — | | | | 20,732 | | | | 4.4 | |
MainStay VP PIMCO Real Return Portfolio Initial Class | | | 6,036 | | | | 990 | | | | (14 | ) | | | — | | | | — | | | | 7,087 | | | | 17.3 | |
MainStay VP S&P 500 Index Portfolio Initial Class | | | 6,653 | | | | 2,455 | | | | (4,671 | ) | | | — | | | | — | | | | 5,066 | | | | 0.5 | |
MainStay VP Small Cap Core Portfolio Initial Class | | | 16,181 | | | | 378 | | | | (2,421 | ) | | | — | | | | — | | | | 14,583 | | | | 8.5 | |
MainStay VP T. Rowe Price Equity Income Portfolio Initial Class | | | 26,430 | | | | 662 | | | | (4,424 | ) | | | — | | | | — | | | | 24,105 | | | | 5.0 | |
MainStay VP Unconstrained Bond Portfolio Initial Class | | | 22,532 | | | | 381 | | | | (341 | ) | | | 354 | | | | — | | | | 22,867 | | | | 18.0 | |
| | | | | | | | |
Total | | $ | 854,915 | | | $ | 241,879 | | | $ | (274,676 | ) | | $ | 4,188 | | | $ | 450 | | | $ | 859,849 | | | | | |
| | | | | | | | |
| | |
| 54 | | MainStay VP Allocation Portfolios |
MainStay VP Moderate Allocation Portfolio
| | | | | | | | | | | | | | | | | | | | | | | | | | | | |
Affiliated Investment Company | | Value,
beginning of
period | | | Cost of
Purchases | | | Proceeds of
Sales | | | Dividend
Income | | | Capital Gain
Distributions
Received | | | Value,
end of
period | | | % Ownership | |
IQ 50 Percent Hedged FTSE Europe ETF | | $ | — | | | $ | 16,163 | | | $ | (10 | ) | | $ | 216 | | | $ | — | | | $ | 16,431 | | | | 12.3 | |
IQ 50 Percent Hedged FTSE International ETF | | | 19,387 | | | | 15,806 | | | | (307 | ) | | | 513 | | | | — | | | | 36,865 | | | | 12.1 | |
IQ Chaikin U.S. Small Cap ETF | | | — | | | | 65 | | | | — | | | | — | (a) | | | — | | | | 67 | | | | 0.1 | |
IQ Enhanced Core Plus Bond U.S. ETF | | | 52,753 | | | | 5,549 | | | | (458 | ) | | | 747 | | | | — | | | | 58,869 | | | | 23.2 | |
IQ Global Resources ETF | | | 9,730 | | | | 4,323 | | | | (164 | ) | | | — | | | | — | | | | 13,941 | | | | 7.9 | |
IQ S&P High Yield Low Volatility Bond ETF | | | — | | | | 7,209 | | | | — | | | | — | | | | — | | | | 7,197 | | | | 9.1 | |
MainStay Cushing MLP Premier Fund Class I | | | 9,147 | | | | 560 | | | | (288 | ) | | | 410 | | | | — | | | | 8,389 | | | | 1.5 | |
MainStay Emerging Markets Equity Fund Class I | | | 4,167 | | | | 92 | | | | (49 | ) | | | — | | | | — | | | | 5,144 | | | | 3.1 | |
MainStay Epoch Capital Growth Fund Class I | | | 9,191 | | | | 95 | | | | (164 | ) | | | — | | | | — | | | | 10,384 | | | | 10.4 | |
MainStay Epoch Global Choice Fund Class I | | | 26,033 | | | | 88 | | | | (845 | ) | | | — | | | | — | | | | 29,478 | | | | 16.2 | |
MainStay Epoch International Choice Fund Class I (b) | | | 31,503 | | | | 724 | | | | (3,555 | ) | | | — | | | | — | | | | 33,908 | | | | 6.6 | |
MainStay Epoch U.S. All Cap Fund Class I | | | 67,115 | | | | 199 | | | | (8,584 | ) | | | — | | | | — | | | | 65,440 | | | | 8.5 | |
MainStay Epoch U.S. Equity Yield Fund Class I | | | 6,473 | | | | 11,590 | | | | (4,551 | ) | | | 105 | | | | — | | | | 13,006 | | | | 2.2 | |
MainStay High Yield Corporate Bond Fund Class I | | | — | | | | 3,871 | | | | (4,187 | ) | | | 22 | | | | — | | | | — | | | | — | |
MainStay High Yield Municipal Bond Fund Class I | | | 12,911 | | | | 148 | | | | (13,491 | ) | | | 154 | | | | — | | | | — | | | | — | |
MainStay High Yield Opportunities Fund Class I (c) | | | 4,170 | | | | 29 | | | | (3,914 | ) | | | 29 | | | | — | | | | — | | | | — | |
MainStay ICAP Equity Fund Class I (d) | | | 29,729 | | | | 2,060 | | | | (32,615 | ) | | | 92 | | | | 1,919 | | | | — | | | | — | |
MainStay International Opportunities Fund Class I | | | 28,529 | | | | 9,471 | | | | (6,388 | ) | | | — | | | | — | | | | 34,707 | | | | 7.0 | |
MainStay MAP Equity Fund Class I | | | 68,008 | | | | 685 | | | | (4,455 | ) | | | — | | | | — | | | | 71,425 | | | | 9.7 | |
MainStay Short Duration High Yield Fund Class I | | | 27,571 | | | | 4,204 | | | | (677 | ) | | | 647 | | | | — | | | | 31,182 | | | | 5.1 | |
MainStay Total Return Bond Fund Class I | | | 33,192 | | | | 18,013 | | | | (19,537 | ) | | | 485 | | | | — | | | | 32,337 | | | | 3.1 | |
MainStay U.S. Equity Opportunities Fund Class I | | | 67,557 | | | | 1,919 | | | | (7,463 | ) | | | — | | | | — | | | | 65,662 | | | | 9.4 | |
MainStay VP Absolute Return Multi-Strategy Portfolio Initial Class | | | 69,276 | | | | 594 | | | | (6,296 | ) | | | — | | | | — | | | | 62,267 | | | | 34.4 | |
MainStay VP Bond Portfolio Initial Class | | | 138,895 | | | | 13,318 | | | | (21,992 | ) | | | — | | | | — | | | | 133,235 | | | | 28.4 | |
MainStay VP Convertible Portfolio Initial Class | | | 6,000 | | | | 18,916 | | | | (170 | ) | | | 257 | | | | — | | | | 25,580 | | | | 11.0 | |
MainStay VP Cornerstone Growth Portfolio Initial Class | | | — | | | | 11,172 | | | | — | | | | — | | | | — | | | | 11,920 | | | | 2.9 | |
MainStay VP Cushing Renaissance Advantage Portfolio Initial Class | | | 10,014 | | | | 12,049 | | | | (520 | ) | | | — | | | | — | | | | 19,189 | | | | 13.9 | |
MainStay VP Eagle Small Cap Growth Portfolio Initial Class | | | 11,123 | | | | 112 | | | | (221 | ) | | | — | | | | — | | | | 12,238 | | | | 4.1 | |
MainStay VP Emerging Markets Equity Portfolio Initial Class | | | 40,231 | | | | 17,001 | | | | (2,365 | ) | | | — | | | | — | | | | 64,474 | | | | 16.9 | |
MainStay VP Epoch U.S. Equity Yield Portfolio Initial Class (d) | | | — | | | | 15,721 | | | | (62 | ) | | | — | | | | — | | | | 16,370 | | | | 2.2 | |
MainStay VP Epoch U.S. Small Cap Portfolio Initial Class | | | 38,762 | | | | 249 | | | | (3,531 | ) | | | — | | | | — | | | | 37,815 | | | | 12.8 | |
MainStay VP Floating Rate Portfolio Initial Class | | | 55,611 | | | | 15,187 | | | | (1,046 | ) | | | 1,252 | | | | — | | | | 69,554 | | | | 20.7 | |
MainStay VP High Yield Corporate Bond Portfolio Initial Class | | | 37,106 | | | | 34 | | | | (15,466 | ) | | | — | | | | — | | | | 22,822 | | | | 3.7 | |
MainStay VP Indexed Bond Fund Portfolio Initial Class | | | — | | | | 9 | | | | — | | | | — | | | | — | | | | 9 | | | | — | (e) |
MainStay VP International Equity Portfolio Initial Class | | | 9,668 | | | | 5 | | | | (4,094 | ) | | | — | | | | — | | | | 6,901 | | | | 3.8 | |
MainStay VP Large Cap Growth Portfolio Initial Class | | | 88,211 | | | | 604 | | | | (38,647 | ) | | | — | | | | — | | | | 63,585 | | | | 15.4 | |
MainStay VP Mid Cap Core Portfolio Initial Class | | | 52,309 | | | | 92 | | | | (5,769 | ) | | | — | | | | — | | | | 50,000 | | | | 10.5 | |
MainStay VP PIMCO Real Return Portfolio Initial Class | | | 7,989 | | | | 1,763 | | | | (2 | ) | | | — | | | | — | | | | 9,849 | | | | 24.0 | |
MainStay VP S&P 500 Index Portfolio Initial Class | | | 8,025 | | | | 1,912 | | | | (6,225 | ) | | | — | | | | — | | | | 4,386 | | | | 0.4 | |
MainStay VP Small Cap Core Portfolio Initial Class | | | 14,870 | | | | 332 | | | | (400 | ) | | | — | | | | — | | | | 15,279 | | | | 8.9 | |
MainStay VP T. Rowe Price Equity Income Portfolio Initial Class | | | 66,502 | | | | 1,634 | | | | (2,628 | ) | | | — | | | | — | | | | 69,204 | | | | 14.3 | |
MainStay VP Unconstrained Bond Portfolio Initial Class | | | 31,837 | | | | 675 | | | | (466 | ) | | | 502 | | | | — | | | | 32,462 | | | | 25.5 | |
| | | | | | | | |
Total | | $ | 1,193,595 | | | $ | 214,242 | | | $ | (221,602 | ) | | $ | 5,431 | | | $ | 1,919 | | | $ | 1,261,571 | | | | | |
| | | | | | | | |
Notes to Financial Statements (Unaudited) (continued)
MainStay VP Moderate Growth Allocation Portfolio
| | | | | | | | | | | | | | | | | | | | | | | | | | | | |
Affiliated Investment Company | | Value,
beginning of
period | | | Cost of
Purchases | | | Proceeds of
Sales | | | Dividend
Income | | | Capital Gain
Distributions
Received | | | Value,
end of
period | | | % Ownership | |
IQ 50 Percent Hedged FTSE Europe ETF | | $ | — | | | $ | 24,627 | | | $ | (11 | ) | | $ | 328 | | | $ | — | | | $ | 25,015 | | | | 18.8 | |
IQ 50 Percent Hedged FTSE International ETF | | | 26,839 | | | | 30,496 | | | | (108 | ) | | | 833 | | | | — | | | | 60,093 | | | | 19.8 | |
IQ Chaikin U.S. Small Cap ETF | | | — | | | | 9,877 | | | | — | | | | 5 | | | | — | | | | 10,002 | | | | 9.0 | |
IQ Enhanced Core Plus Bond U.S. ETF | | | 21,329 | | | | 2,488 | | | | (18,637 | ) | | | 70 | | | | — | | | | 5,296 | | | | 2.1 | |
IQ Global Resources ETF | | | 21,992 | | | | 10,634 | | | | (644 | ) | | | — | | | | — | | | | 32,079 | | | | 18.3 | |
IQ S&P High Yield Low Volatility Bond ETF | | | — | | | | 4,047 | | | | — | | | | — | | | | — | | | | 4,041 | | | | 5.1 | |
MainStay Cushing MLP Premier Fund Class I | | | 14,369 | | | | 671 | | | | (425 | ) | | | 640 | | | | — | | | | 13,009 | | | | 2.3 | |
MainStay Emerging Markets Equity Fund Class I | | | 9,447 | | | | 131 | | | | (76 | ) | | | — | | | | — | | | | 11,612 | | | | 6.9 | |
MainStay Epoch Capital Growth Fund Class I | | | 15,228 | | | | 137 | | | | (24 | ) | | | — | | | | — | | | | 17,434 | | | | 17.5 | |
MainStay Epoch Global Choice Fund Class I | | | 43,253 | | | | 74 | | | | (844 | ) | | | — | | | | — | | | | 49,464 | | | | 27.2 | |
MainStay Epoch International Choice Fund Class I (b) | | | 91,660 | | | | 920 | | | | (7,135 | ) | | | — | | | | — | | | | 100,993 | | | | 19.6 | |
MainStay Epoch U.S. All Cap Fund Class I | | | 135,388 | | | | — | | | | (12,793 | ) | | | — | | | | — | | | | 136,246 | | | | 17.8 | |
MainStay Epoch U.S. Equity Yield Fund Class I | | | 14,089 | | | | 22,989 | | | | (13,238 | ) | | | 198 | | | | — | | | | 22,664 | | | | 3.9 | |
MainStay High Yield Corporate Bond Fund Class I | | | — | | | | 6,998 | | | | (7,559 | ) | | | 40 | | | | — | | | | — | | | | — | |
MainStay High Yield Municipal Bond Fund Class I | | | 3,437 | | | | 33 | | | | (3,563 | ) | | | 34 | | | | — | | | | — | | | | — | |
MainStay High Yield Opportunities Fund Class I (c) | | | 7,750 | | | | 53 | | | | (7,300 | ) | | | 54 | | | | — | | | | — | | | | — | |
MainStay ICAP Equity Fund Class I (d) | | | 52,857 | | | | 3,934 | | | | (58,848 | ) | | | 204 | | | | 3,731 | | | | — | | | | — | |
MainStay International Opportunities Fund Class I | | | 83,188 | | | | 16,733 | | | | (14,437 | ) | | | — | | | | — | | | | 94,759 | | | | 19.1 | |
MainStay MAP Equity Fund Class I | | | 138,408 | | | | 771 | | | | (4,256 | ) | | | — | | | | — | | | | 149,605 | | | | 20.3 | |
MainStay Short Duration High Yield Fund Class I | | | 47,035 | | | | 5,810 | | | | (1,734 | ) | | | 1,062 | | | | — | | | | 51,226 | | | | 8.3 | |
MainStay Total Return Bond Fund Class I | | | 21,408 | | | | 9,743 | | | | (27,633 | ) | | | 72 | | | | — | | | | 3,615 | | | | 0.3 | |
MainStay U.S. Equity Opportunities Fund Class I | | | 137,860 | | | | 1,092 | | | | (9,141 | ) | | | — | | | | — | | | | 137,165 | | | | 19.6 | |
MainStay VP Absolute Return Multi-Strategy Portfolio Initial Class | | | 49,821 | | | | 591 | | | | (3,308 | ) | | | — | | | | — | | | | 46,154 | | | | 25.5 | |
MainStay VP Bond Portfolio Initial Class | | | — | | | | 5,104 | | | | — | | | | — | | | | — | | | | 5,113 | | | | 1.1 | |
MainStay VP Convertible Portfolio Initial Class | | | 10,135 | | | | 32,765 | | | | (203 | ) | | | 442 | | | | — | | | | 44,126 | | | | 18.9 | |
MainStay VP Cornerstone Growth Portfolio Initial Class | | | — | | | | 19,151 | | | | — | | | | — | | | | — | | | | 20,432 | | | | 5.0 | |
MainStay VP Cushing Renaissance Advantage Portfolio Initial Class | | | 35,246 | | | | 30,825 | | | | (1,481 | ) | | | — | | | | — | | | | 57,855 | | | | 41.9 | |
MainStay VP Eagle Small Cap Growth Portfolio Initial Class | | | 56,127 | | | | 434 | | | | (2,369 | ) | | | — | | | | — | | | | 60,329 | | | | 20.4 | |
MainStay VP Emerging Markets Equity Portfolio Initial Class | | | 84,732 | | | | 28,231 | | | | (3,684 | ) | | | — | | | | — | | | | 129,178 | | | | 33.8 | |
MainStay VP Epoch U.S. Equity Yield Portfolio Initial Class (d) | | | — | | | | 33,368 | | | | (59 | ) | | | — | | | | — | | | | 34,650 | | | | 4.6 | |
MainStay VP Epoch U.S. Small Cap Portfolio Initial Class | | | 109,631 | | | | 642 | | | | (6,883 | ) | | | — | | | | — | | | | 110,056 | | | | 37.2 | |
MainStay VP Floating Rate Portfolio Initial Class | | | 93,939 | | | | 27,628 | | | | (2,655 | ) | | | 2,108 | | | | — | | | | 118,573 | | | | 35.4 | |
MainStay VP High Yield Corporate Bond Portfolio Initial Class | | | 67,014 | | | | 158 | | | | (20,517 | ) | | | — | | | | — | | | | 48,621 | | | | 7.8 | |
MainStay VP International Equity Portfolio Initial Class | | | 31,067 | | | | — | | | | (7,236 | ) | | | — | | | | — | | | | 28,833 | | | | 15.7 | |
MainStay VP Large Cap Growth Portfolio Initial Class | | | 175,446 | | | | 984 | | | | (75,679 | ) | | | — | | | | — | | | | 126,896 | | | | 30.7 | |
MainStay VP Mid Cap Core Portfolio Initial Class | | | 125,538 | | | | 413 | | | | (9,711 | ) | | | — | | | | — | | | | 124,392 | | | | 26.2 | |
MainStay VP PIMCO Real Return Portfolio Initial Class | | | 13,570 | | | | 1,868 | | | | (122 | ) | | | — | | | | — | | | | 15,500 | | | | 37.8 | |
MainStay VP S&P 500 Index Portfolio Initial Class | | | 14,813 | | | | 2,123 | | | | (10,713 | ) | | | — | | | | — | | | | 7,337 | | | | 0.7 | |
MainStay VP Small Cap Core Portfolio Initial Class | | | 72,823 | | | | 1,127 | | | | (1,340 | ) | | | — | | | | — | | | | 74,932 | | | | 43.8 | |
MainStay VP T. Rowe Price Equity Income Portfolio Initial Class | | | 141,671 | | | | 652 | | | | (3,960 | ) | | | — | | | | — | | | | 146,198 | | | | 30.2 | |
MainStay VP Unconstrained Bond Portfolio Initial Class | | | 54,983 | | | | 2,086 | | | | (1,046 | ) | | | 870 | | | | — | | | | 56,738 | | | | 44.6 | |
| | | | | | | | |
Total | | $ | 2,022,093 | | | $ | 340,408 | | | $ | (339,372 | ) | | $ | 6,960 | | | $ | 3,731 | | | $ | 2,180,231 | | | | | |
| | | | | | | | |
| | |
| 56 | | MainStay VP Allocation Portfolios |
MainStay VP Growth Allocation Portfolio
| | | | | | | | | | | | | | | | | | | | | | | | | | | | |
Affiliated Investment Company | | Value,
beginning of
period | | | Cost of
Purchases | | | Proceeds of
Sales | | | Dividend
Income | | | Capital Gain
Distributions
Received | | | Value,
end of
period | | | % Ownership | |
IQ 50 Percent Hedged FTSE Europe ETF | | $ | — | | | $ | 10,236 | | | $ | — | | | $ | 140 | | | $ | — | | | $ | 10,508 | | | | 7.9 | |
IQ 50 Percent Hedged FTSE International ETF | | | 13,375 | | | | 11,917 | | | | (19 | ) | | | 376 | | | | — | | | | 26,741 | | | | 8.8 | |
IQ Chaikin U.S. Small Cap ETF | | | — | | | | 11,587 | | | | — | | | | 6 | | | | — | | | | 11,837 | | | | 10.7 | |
IQ Global Resources ETF | | | 13,983 | | | | 4,758 | | | | (148 | ) | | | — | | | | — | | | | 18,704 | | | | 10.6 | |
MainStay Cushing MLP Premier Fund Class I | | | 6,562 | | | | 436 | | | | (407 | ) | | | 289 | | | | — | | | | 5,873 | | | | 1.0 | |
MainStay Emerging Markets Equity Fund Class I | | | 5,308 | | | | 165 | | | | (198 | ) | | | — | | | | — | | | | 6,457 | | | | 3.8 | |
MainStay Epoch Capital Growth Fund Class I | | | 6,692 | | | | 724 | | | | — | | | | — | | | | — | | | | 8,378 | | | | 8.4 | |
MainStay Epoch Global Choice Fund Class I | | | 17,631 | | | | 832 | | | | (37 | ) | | | — | | | | — | | | | 21,327 | | | | 11.7 | |
MainStay Epoch International Choice Fund Class I (b) | | | 51,313 | | | | 4,295 | | | | (1,568 | ) | | | — | | | | — | | | | 63,197 | | | | 12.3 | |
MainStay Epoch U.S. All Cap Fund Class I | | | 71,510 | | | | 985 | | | | (3,472 | ) | | | — | | | | — | | | | 76,290 | | | | 10.0 | |
MainStay Epoch U.S. Equity Yield Fund Class I | | | 7,545 | | | | 9,867 | | | | (8,853 | ) | | | 80 | | | | — | | | | 8,313 | | | | 1.4 | |
MainStay ICAP Equity Fund Class I (d) | | | 29,514 | | | | 1,678 | | | | (32,658 | ) | | | 84 | | | | 1,433 | | | | — | | | | — | |
MainStay International Opportunities Fund Class I | | | 46,655 | | | | 10,746 | | | | (6,340 | ) | | | — | | | | — | | | | 56,540 | | | | 11.4 | |
MainStay MAP Equity Fund Class I | | | 70,553 | | | | 4,683 | | | | (877 | ) | | | — | | | | — | | | | 82,128 | | | | 11.1 | |
MainStay U.S. Equity Opportunities Fund Class I | | | 78,048 | | | | 4,260 | | | | (9,733 | ) | | | — | | | | — | | | | 76,763 | | | | 11.0 | |
MainStay VP Absolute Return Multi-Strategy Portfolio Initial Class | | | 1,151 | | | | — | | | | (1,150 | ) | | | — | | | | — | | | | — | | | | — | |
MainStay VP Cornerstone Growth Portfolio Initial Class | | | — | | | | 9,043 | | | | — | | | | — | | | | — | | | | 9,629 | | | | 2.4 | |
MainStay VP Cushing Renaissance Advantage Portfolio Initial Class | | | 18,505 | | | | 35,027 | | | | (3,724 | ) | | | — | | | | — | | | | 44,810 | | | | 32.4 | |
MainStay VP Eagle Small Cap Growth Portfolio Initial Class | | | 30,844 | | | | 1,117 | | | | (314 | ) | | | — | | | | — | | | | 35,104 | | | | 11.9 | |
MainStay VP Emerging Markets Equity Portfolio Initial Class | | | 50,027 | | | | 13,201 | | | | (1,221 | ) | | | — | | | | — | | | | 73,698 | | | | 19.3 | |
MainStay VP Epoch U.S. Equity Yield Portfolio Initial Class (d) | | | — | | | | 25,351 | | | | (70 | ) | | | — | | | | — | | | | 25,887 | | | | 3.4 | |
MainStay VP Epoch U.S. Small Cap Portfolio Initial Class | | | 52,259 | | | | 2,163 | | | | (1,119 | ) | | | — | | | | — | | | | 56,572 | | | | 19.1 | |
MainStay VP International Equity Portfolio Initial Class | | | 16,812 | | | | 476 | | | | (3,505 | ) | | | — | | | | — | | | | 16,562 | | | | 9.0 | |
MainStay VP Large Cap Growth Portfolio Initial Class | | | 102,770 | | | | 6,241 | | | | (48,455 | ) | | | — | | | | — | | | | 76,904 | | | | 18.6 | |
MainStay VP Mid Cap Core Portfolio Initial Class | | | 60,836 | | | | 1,659 | | | | (703 | ) | | | — | | | | — | | | | 65,842 | | | | 13.9 | |
MainStay VP S&P 500 Index Portfolio Initial Class | | | 16,573 | | | | 107 | | | | (5,276 | ) | | | — | | | | — | | | | 12,770 | | | | 1.2 | |
MainStay VP Small Cap Core Portfolio Initial Class | | | 39,072 | | | | 4,123 | | | | (359 | ) | | | — | | | | — | | | | 44,213 | | | | 25.9 | |
MainStay VP T. Rowe Price Equity Income Portfolio Initial Class | | | 74,078 | | | | 4,307 | | | | (946 | ) | | | — | | | | — | | | | 81,656 | | | | 16.9 | |
| | | | | | | | |
Total | | $ | 881,616 | | | $ | 179,984 | | | $ | (131,152 | ) | | $ | 975 | | | $ | 1,433 | | | $ | 1,016,703 | | | | | |
| | | | | | | | |
| (b) | Prior to March 13, 2017, known as MainStay ICAP International Fund Class I. |
| (c) | Reorganized into the MainStay High Yield Corporate Bond Fund Class I on February 17, 2017. |
| (d) | Reorganized into the MainStay Epoch U.S. Equity Yield Fund Class I on May 8, 2017. |
| (e) | Less than one-tenth of a percent. |
Note 4–Federal Income Tax
During the year ended December 31, 2016, the tax character of distributions paid as reflected in the Statements of Changes in Net Assets was as follows:
| | | | | | | | |
| | | 2016 | |
| | | Tax Based
Distributions
from Ordinary
Income | | | Tax Based
Distributions
from Long-Term
Capital Gains | |
MainStay VP Conservative Allocation Portfolio | | $ | 20,586,751 | | | $ | 18,171,851 | |
MainStay VP Moderate Allocation Portfolio | | | 23,811,986 | | | | 50,300,784 | |
MainStay VP Moderate Growth Allocation Portfolio | | | 36,881,807 | | | | 117,619,942 | |
MainStay VP Growth Allocation Portfolio | | | 11,264,854 | | | | 50,804,288 | |
Note 5–Custodian
State Street is the custodian of cash and securities held by the Allocation Portfolios. Custodial fees are charged to each Allocation Portfolio based on the Allocation Portfolios’ net assets and/or the market value of securities held by each Allocation Portfolio and the number of certain transactions incurred by each Allocation Portfolio.
Note 6–Line of Credit
The Allocation Portfolios and certain other funds managed by New York Life Investments, maintain a line of credit with a syndicate of banks in order to secure a source of funds for temporary purposes to meet unanticipated or excessive redemption requests.
Notes to Financial Statements (Unaudited) (continued)
Effective August 1, 2017, under an amended and restated credit agreement (the “Credit Agreement”), the aggregate commitment amount is $600,000,000 with an additional uncommitted amount of $100,000,000. The commitment fee is an annual rate of 0.15% of the average commitment amount payable quarterly, regardless of usage, to State Street, who serves as the agent to the syndicate. The commitment fee is allocated among the Allocation Portfolios and certain affiliated funds based upon their respective net assets and other factors. Interest on any revolving credit loan is charged based upon the Federal Funds Rate or the one month London InterBank Offered Rate, whichever is higher. The Credit Agreement expires on July 31, 2018, although the Allocation Portfolios, certain affiliated funds and the syndicate of banks may renew the Credit Agreement for an additional year on the same or different terms. Prior to August 1, 2017, the aggregate commitment amount was $600,000,000 with an additional uncommitted amount of $100,000,000, and the commitment fee was at an annual rate of 0.15% of the average commitment amount. During the six-month period ended June 30, 2017, there were no borrowings made or outstanding with respect to the Allocation Portfolios under the credit agreement for which Bank of New York Mellon served as agent.
Note 7–Interfund Lending Program
Pursuant to an exemptive order issued by the SEC, the Allocation Portfolios, along with certain other funds managed by New York Life Investments, may participate in an interfund lending program. The interfund lending program provides an alternative credit facility that permits the Portfolio and certain other funds managed by New York Life Investments to lend or borrow money for temporary purposes directly to or from one another, subject to the conditions of the exemptive order. During the six-month period ended June 30, 2017, there were no interfund loans made or outstanding with respect to the Allocation Portfolios.
Note 8–Purchases and Sales of Securities (in 000’s)
During the six-month period ended June 30, 2017, purchases and sales of securities were as follows:
| | | | | | | | |
| | | Other | |
| | | Purchases | | | Sales | |
MainStay VP Conservative Allocation Portfolio | | $ | 234,386 | | | $ | 267,183 | |
MainStay VP Moderate Allocation Portfolio | | | 198,908 | | | | 206,289 | |
MainStay VP Moderate Growth Allocation Portfolio | | | 310,673 | | | | 309,638 | |
MainStay VP Growth Allocation Portfolio | | | 171,267 | | | | 122,435 | |
Note 9–Capital Share Transactions
Transactions in capital shares for the six-month period ended June 30, 2017, and the year ended December 31, 2016, were as follows:
MainStay VP Conservative Allocation Portfolio
| | | | | | | | |
Initial Class | | Shares | | | Amount | |
Six-month period ended June 30, 2017: | | | | | | | | |
Shares sold | | | 98,046 | | | $ | 1,099,349 | |
Shares redeemed | | | (135,451 | ) | | | (1,519,277 | ) |
| | | | | | | | |
Net increase (decrease) | | | (37,405 | ) | | $ | (419,928 | ) |
| | | | | | | | |
Year ended December 31, 2016: | | | | | | | | |
Shares sold | | | 265,516 | | | $ | 2,882,084 | |
Shares issued to shareholders in reinvestment of dividends and distributions | | | 68,787 | | | | 742,865 | |
Shares redeemed | | | (317,493 | ) | | | (3,420,875 | ) |
| | | | | | | | |
Net increase (decrease) | | | 16,810 | | | $ | 204,074 | |
| | | | | | | | |
| | |
| | | | | | | | |
Service Class | | Shares | | | Amount | |
Six-month period ended June 30, 2017: | | | | | | | | |
Shares sold | | | 3,342,551 | | | $ | 37,048,308 | |
Shares redeemed | | | (6,957,897 | ) | | | (77,136,305 | ) |
| | | | | | | | |
Net increase (decrease) | | | (3,615,346 | ) | | $ | (40,087,997 | ) |
| | | | | | | | |
Year ended December 31, 2016: | | | | | | | | |
Shares sold | | | 9,492,799 | | | $ | 102,040,691 | |
Shares issued to shareholders in reinvestment of dividends and distributions | | | 3,555,850 | | | | 38,015,737 | |
Shares redeemed | | | (18,938,102 | ) | | | (201,949,675 | ) |
| | | | | | | | |
Net increase (decrease) | | | (5,889,453 | ) | | $ | (61,893,247 | ) |
| | | | | | | | |
MainStay VP Moderate Allocation Portfolio
| | | | | | | | |
Initial Class | | Shares | | | Amount | |
Six-month period ended June 30, 2017: | |
Shares sold | | | 136,934 | | | $ | 1,515,227 | |
Shares redeemed | | | (190,017 | ) | | | (2,107,943 | ) |
| | | | | | | | |
Net increase (decrease) | | | (53,083 | ) | | $ | (592,716 | ) |
| | | | | | | | |
Year ended December 31, 2016: | |
Shares sold | | | 374,346 | | | $ | 3,936,769 | |
Shares issued to shareholders in reinvestment of dividends and distributions | | | 257,927 | | | | 2,691,876 | |
Shares redeemed | | | (404,128 | ) | | | (4,307,011 | ) |
| | | | | | | | |
Net increase (decrease) | | | 228,145 | | | $ | 2,321,634 | |
| | | | | | | | |
| | |
| | | | | | | | |
| | |
| 58 | | MainStay VP Allocation Portfolios |
| | | | | | | | |
Service Class | | Shares | | | Amount | |
Six-month period ended June 30, 2017: | |
Shares sold | | | 5,502,093 | | | $ | 60,141,888 | |
Shares redeemed | | | (7,588,058 | ) | | | (82,875,881 | ) |
| | | | | | | | |
Net increase (decrease) | | | (2,085,965 | ) | | $ | (22,733,993 | ) |
| | | | | | | | |
Year ended December 31, 2016: | |
Shares sold | | | 10,236,997 | | | $ | 107,393,041 | |
Shares issued to shareholders in reinvestment of dividends and distributions | | | 6,894,693 | | | | 71,420,894 | |
Shares redeemed | | | (13,638,661 | ) | | | (142,742,776 | ) |
| | | | | | | | |
Net increase (decrease) | | | 3,493,029 | | | $ | 36,071,159 | |
| | | | | | | | |
MainStay VP Moderate Growth Allocation Portfolio
| | | | | | | | |
Initial Class | | Shares | | | Amount | |
Six-month period ended June 30, 2017: | |
Shares sold | | | 283,460 | | | $ | 3,296,102 | |
Shares redeemed | | | (163,480 | ) | | | (1,896,430 | ) |
| | | | | | | | |
Net increase (decrease) | | | 119,980 | | | $ | 1,399,672 | |
| | | | | | | | |
Year ended December 31, 2016: | |
Shares sold | | | 634,498 | | | $ | 6,951,943 | |
Shares issued to shareholders in reinvestment of dividends and distributions | | | 533,964 | | | | 5,738,149 | |
Shares redeemed | | | (392,706 | ) | | | (4,293,871 | ) |
| | | | | | | | |
Net increase (decrease) | | | 775,756 | | | $ | 8,396,221 | |
| | | | | | | | |
| | |
| | | | | | | | |
Service Class | | Shares | | | Amount | |
Six-month period ended June 30, 2017: | |
Shares sold | | | 7,563,394 | | | $ | 86,792,545 | |
Shares redeemed | | | (10,463,596 | ) | | | (119,725,022 | ) |
| | | | | | | | |
Net increase (decrease) | | | (2,900,202 | ) | | $ | (32,932,477 | ) |
| | | | | | | | |
Year ended December 31, 2016: | |
Shares sold | | | 17,408,383 | | | $ | 188,537,632 | |
Shares issued to shareholders in reinvestment of dividends and distributions | | | 13,961,524 | | | | 148,763,600 | |
Shares redeemed | | | (18,889,898 | ) | | | (206,037,662 | ) |
| | | | | | | | |
Net increase (decrease) | | | 12,480,009 | | | $ | 131,263,570 | |
| | | | | | | | |
MainStay VP Growth Allocation Portfolio
| | | | | | | | |
Initial Class | | Shares | | | Amount | |
Six-month period ended June 30, 2017: | |
Shares sold | | | 339,938 | | | $ | 3,812,253 | |
Shares redeemed | | | (224,649 | ) | | | (2,527,257 | ) |
| | | | | | | | |
Net increase (decrease) | | | 115,289 | | | $ | 1,284,996 | |
| | | | | | | | |
Year ended December 31, 2016: | |
Shares sold | | | 694,599 | | | $ | 7,207,897 | |
Shares issued to shareholders in reinvestment of dividends and distributions | | | 411,315 | | | | 4,245,632 | |
Shares redeemed | | | (276,629 | ) | | | (2,919,034 | ) |
| | | | | | | | |
Net increase (decrease) | | | 829,285 | | | $ | 8,534,495 | |
| | | | | | | | |
| | |
| | | | | | | | |
| | | | | | | | |
Service Class | | Shares | | | Amount | |
Six-month period ended June 30, 2017: | |
Shares sold | | | 8,558,420 | | | $ | 95,448,627 | |
Shares redeemed | | | (5,094,428 | ) | | | (56,722,290 | ) |
| | | | | | | | |
Net increase (decrease) | | | 3,463,992 | | | $ | 38,726,337 | |
| | | | | | | | |
Year ended December 31, 2016: | |
Shares sold | | | 16,842,514 | | | $ | 173,877,742 | |
Shares issued to shareholders in reinvestment of dividends and distributions | | | 5,646,439 | | | | 57,823,510 | |
Shares redeemed | | | (8,412,098 | ) | | | (88,056,815 | ) |
| | | | | | | | |
Net increase (decrease) | | | 14,076,855 | | | $ | 143,644,437 | |
| | | | | | | | |
Note 10–Recent Accounting Pronouncement
In October 2016, the SEC adopted new rules and amended existing rules (together, “final rules”) intended to modernize the reporting and disclosure of information by registered investment companies. In part, the final rules amend Regulation S-X and require standardized, enhanced disclosure about derivatives in investment company financial statements, as well as other amendments. The compliance date for the amendments to Regulation S-X is August 1, 2017 and applies to shareholder reports for funds with fiscal periods ending after August 1, 2017.
Management is currently evaluating the impact that the adoption of the amendments to Regulation S-X will have on each Allocation Portfolio’s financial statements and related disclosures.
Note 11–Subsequent Events
In connection with the preparation of the financial statements of the Allocation Portfolios as of and for the six-month period ended June 30, 2017, events and transactions subsequent to June 30, 2017, through the date the financial statements were issued have been evaluated by the Allocation Portfolios’ management for possible adjustment and/or disclosure. No subsequent events requiring financial statement adjustment or disclosure have been identified.
Proxy Voting Policies and Procedures and Proxy Voting Record
A description of the policies and procedures that New York Life Investments uses to vote proxies related to the Portfolio’s securities is available without charge, upon request, (i) by calling 800-598-2019 or (ii) by visiting the SEC’s website at www.sec.gov.
The Portfolio is required to file with the SEC its proxy voting record for the 12-month period ending June 30 on Form N-PX. The Portfolio’s most recent Form N-PX or proxy voting record is available free of charge upon request (i) by calling 800-598-2019 or; (ii) by visiting the SEC’s website at www.sec.gov.
Shareholder Reports and Quarterly Portfolio Disclosure
The Portfolio is required to file its complete schedule of portfolio holdings with the SEC for its first and third fiscal quarters on Form N-Q. The Portfolio’s Form N-Q is available without charge on the SEC’s website at www.sec.gov or by calling MainStay Investments at 800-598-2019. You also can obtain and review copies of Form N-Q by visiting the SEC’s Public Reference Room in Washington, DC (information on the operation of the Public Reference Room may be obtained by calling 1-800-SEC-0330).
| | |
| 60 | | MainStay VP Allocation Portfolios |
This page intentionally left blank
This page intentionally left blank
MainStay VP Portfolios
MainStay VP offers a wide range of Portfolios. The full array of MainStay VP offerings is listed here, with information about the manager, subadvisors, legal counsel, and independent registered public accounting firm.
Equity Portfolios
MainStay VP Common Stock Portfolio
MainStay VP Cornerstone Growth Portfolio
MainStay VP Eagle Small Cap Growth Portfolio
MainStay VP Emerging Markets Equity Portfolio
MainStay VP Epoch U.S. Equity Yield Portfolio
MainStay VP Epoch U.S. Small Cap Portfolio
MainStay VP International Equity Portfolio
MainStay VP Large Cap Growth Portfolio
MainStay VP MFS® Utilities Portfolio
MainStay VP Mid Cap Core Portfolio
MainStay VP S&P 500 Index Portfolio
MainStay VP Small Cap Core Portfolio
MainStay VP T. Rowe Price Equity Income Portfolio
MainStay VP VanEck Global Hard Assets Portfolio
Mixed Asset Portfolios
MainStay VP Balanced Portfolio
MainStay VP Convertible Portfolio
MainStay VP Cushing Renaissance Advantage Portfolio
MainStay VP Income Builder Portfolio
MainStay VP Janus Henderson Balanced Portfolio
Income Portfolios
MainStay VP Bond Portfolio
MainStay VP Floating Rate Portfolio
MainStay VP Government Portfolio
MainStay VP High Yield Corporate Bond Portfolio
MainStay VP Indexed Bond Portfolio
MainStay VP PIMCO Real Return Portfolio
MainStay VP Unconstrained Bond Portfolio
Money Market
MainStay VP U.S. Government Money Market Portfolio
Alternative
MainStay VP Absolute Return Multi-Strategy Portfolio
Asset Allocation Portfolios
MainStay VP Conservative Allocation Portfolio
MainStay VP Growth Allocation Portfolio
MainStay VP Moderate Allocation Portfolio
MainStay VP Moderate Growth Allocation Portfolio
Manager
New York Life Investment Management LLC
New York, New York
Subadvisors
Candriam Belgium*
Brussels, Belgium
Candriam France S.A.S.*
Paris, France
Cornerstone Capital Management Holdings LLC*
New York, New York
Cushing Asset Management, LP
Dallas, Texas
Eagle Asset Management, Inc.
St Petersburg, Florida
Epoch Investment Partners, Inc.
New York, New York
Janus Capital Management LLC
Denver, Colorado
MacKay Shields LLC*
New York, New York
Massachusetts Financial Services Company
Boston, Massachusetts
NYL Investors LLC*
New York, New York
Pacific Investment Management Company LLC
Newport Beach, California
T. Rowe Price Associates, Inc.
Baltimore, Maryland
Van Eck Associates Corporation
New York, New York
Winslow Capital Management, LLC
Minneapolis, Minnesota
Distributor
NYLIFE Distributors LLC*
Jersey City, New Jersey
Custodian
State Street Bank and Trust Company
Boston, Massachusetts
Independent Registered Public Accounting Firm
PricewaterhouseCoopers LLP
New York, New York
Legal Counsel
Dechert LLP
Washington, District of Columbia
Some Portfolios may not be available in all products.
* An affiliate of New York Life Investment Management LLC
Not part of the Semiannual Report
2017 Semiannual Report
This report is for the general information of New York Life Variable Annuities and NYLIAC Variable Universal Life Insurance Products policyowners. It must be preceded or accompanied by the appropriate product(s) and funds prospectuses if it is given to anyone who is not an owner of a New York Life variable annuity policy or a NYLIAC Variable Universal Life Insurance Product. This report does not offer for sale or solicit orders to purchase securities.
The performance data quoted in this report represents past performance. Past performance is no guarantee of future results. Due to market volatility and other factors, current performance may be lower or higher than the figures shown. The most recent month-end performance summary for your variable annuity or variable life policy is available by calling 800-598-2019 and is updated periodically on www.newyorklife.com.
The New York Life Variable Annuities and NYLIAC Variable Universal Life Insurance Products are issued by New York Life Insurance and Annuity Corporation (a Delaware Corporation) and distributed by NYLIFE Distributors LLC (Member FINRA/SIPC).
New York Life Insurance Company
New York Life Insurance and Annuity Corporation (NYLIAC) (A Delaware Corporation)
51 Madison Avenue, Room 551
New York, NY 10010
www.newyorklife.com
Printed on recycled paper
mainstayinvestments.com
NYLIFE Distributors LLC, 30 Hudson Street, Jersey City, NJ 07302
New York Life Investment Management LLC is the investment manager to the MainStay VP Funds Trust
©2017 by NYLIFE Distributors LLC. All rights reserved.
You may obtain copies of the Prospectus and the Statement of Additional Information free of charge, upon request, by calling toll-free 800-598-2019 or writing to New York Life Insurance and Annuity Corporation, 51 Madison Avenue, New York, NY 10010.
| | | | |
| Not FDIC Insured | | No Bank Guarantee | | May Lose Value |
| | | | |
| 1743135 | | | | MSVPAA10-08/17 (NYLIAC) NI507 |
MainStay VP S&P 500 Index Portfolio
Message from the President and Semiannual Report
Unaudited | June 30, 2017

Sign up for electronic delivery of your shareholder reports. For full details on electronic delivery, including who can participate and what you
can receive via eDelivery, please log on to www.newyorklife.com/vsc

This page intentionally left blank
Message from the President
The six months ended June 30, 2017, brought positive results to many stock and bond investors. The year began with many investors hoping that Republican control of the White House, the Senate and the House of Representatives could bring an end to political gridlock; and while debate has continued on a number of issues, the U.S. stock market climbed relatively steadily throughout the first half of 2017.
According to FTSE-Russell U.S. market data, stocks at all capitalization levels tended to record positive total returns during the reporting period, with large-cap stocks generally outperforming stocks of smaller-capitalization companies. Growth stocks outpaced value stocks at every capitalization level by substantial margins—from more than six percentage points for micro-caps and mid-caps to more than 10 percentage points for the largest 200 U.S. companies by market capitalization.
Most sectors of the stock market advanced during the reporting period, with energy and telecommunication services being notable exceptions. Energy stocks declined as oil prices fell despite moves by the Organization of Petroleum Exporting Countries (OPEC) intended to limit oil production by its members. Telecommunication services stocks tended to decline as competition increased and rising interest rates made dividend payouts less appealing.
In March and June of 2017, the Federal Reserve announced successive increases in the target range for the federal funds rate, ultimately bringing the federal funds target range to 1.00% to 1.25%. While short-term U.S. Treasury yields rose in response, yields for U.S. Treasury securities with maturities of five years or longer declined. As the difference between short- and long-term yields narrowed, the advantages of higher-yielding long-term bonds became increasingly apparent.
Virtually all taxable and tax-exempt bond sectors provided positive total returns during the reporting period. Mortgage-backed
securities, though providing positive total returns, faced headwinds when the Federal Reserve announced plans to begin normalizing its balance sheet by reducing reinvestment of principal payments on mortgage-backed securities.
International stock and bond markets were also strong during the reporting period. International stocks provided double-digit total returns that were surpassed by emerging-market stocks as a whole. Global investment-grade bonds provided single-digit returns; and emerging-market debt was somewhat stronger.
Even during periods of favorable market performance and generally positive returns, MainStay believes that it is important to carefully monitor your investments. Your risk tolerance may
change over time, leading you to reevaluate which MainStay VP Portfolios are most appropriate for your long-term goals. Your goals themselves may also change, leading you to pursue investments with more or less risk. The portfolio managers of MainStay VP Portfolios seek to provide results consistent with the investment objectives of their respective Portfolios, to give you a wide range of choices suitable to various investment needs.
The report that follows provides more detailed information about the specific markets, securities and investment decisions that influenced your MainStay VP Portfolio during the six months ended June 30, 2017. We invite you to review the report carefully as part of your ongoing investment evaluation and review.
Sincerely,

Stephen P. Fisher
President
The opinions expressed are as of the date of the accompanying report and are subject to change. Past performance is no guarantee of future results. There is no guarantee that any forecasts made will come to pass. This material does not constitute investment advice and is not intended as an endorsement of any specific investment.
Not all MainStay VP Portfolios and/or share classes are available under all policies.
Not part of the Semiannual Report
Table of Contents
Investors should refer to the Portfolio’s Summary Prospectus and/or Prospectus and consider the Portfolio’s investment objectives, strategies, risks, charges and expenses carefully before investing. The Summary Prospectus and/or Prospectus contain this and other information about the Portfolio. You may obtain copies of the Portfolio’s Summary Prospectus and/or the Prospectus and the Statement of Additional Information free of charge, upon request, by calling toll-free 800-598-2019, by writing to New York Life Insurance and Annuity Corporation, 51 Madison Avenue, Room 251, New York, New York 10010 or by sending an email to MainStayShareholdersServices@nylim.com. These documents are also available at mainstayinvestments.com/vpdocuments. Please read the Summary Prospectus and/or Prospectus carefully before investing. MainStay VP Funds Trust portfolios are separate account options which are purchased through a variable insurance or variable annuity contract.
Investment and Performance Comparison1 (Unaudited)
Performance data quoted represents past performance. Past performance is no guarantee of future results. Because of market volatility and other factors, current performance may be lower or higher than the figures shown. Investment return and principal value will fluctuate, and as a result, when shares are redeemed, they may be worth more or less than their original cost. The performance table and graph do not reflect any deduction of sales charges, mortality and expense charges, contract charges or administrative charges. Please refer to the Performance Summary appropriate for your policy. For performance information current to the most recent month-end, please call 800-598-2019 or visit www.newyorklife.com.
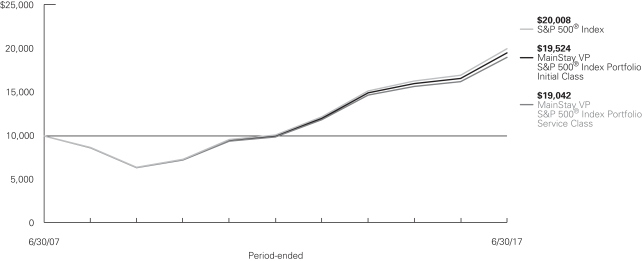
Average Annual Total Returns for the Period Ended June 30, 2017
| | | | | | | | | | | | | | | | | | | | | | |
| Class | | Inception
Date | | Six Months | | | One Year | | | Five Years | | | Ten Years | | | Gross
Expense
Ratio2 | |
Initial Class Shares | | 1/29/1993 | | | 9.16 | % | | | 17.54 | % | | | 14.29 | % | | | 6.92 | % | | | 0.28 | % |
Service Class Shares | | 6/5/2003 | | | 9.02 | | | | 17.25 | | | | 14.00 | | | | 6.65 | | | | 0.53 | |
| | | | | | | | | | | | | | | | |
| Benchmark Performance | | Six
Months | | | One
Year | | | Five
Years | | | Ten
Years | |
S&P 500® Index3 | | | 9.34 | % | | | 17.90 | % | | | 14.63 | % | | | 7.18 | % |
Average Lipper Variable Products S&P 500 Index Portfolio4 | | | 9.10 | | | | 17.28 | | | | 14.16 | % | | | 6.81 | |
| 1. | Performance figures reflect certain fee waivers and/or expense limitations, without which total returns may have been different. For information on current fee waivers and/or expense limitations (if any), please refer to the Notes to Financial Statements. |
| 2. | The gross expense ratios presented reflect the Portfolio’s “Total Annual Portfolio Operating Expenses” from the most recent Prospectus and may differ from other expense ratios disclosed in this report. |
| 3. | The S&P 500® Index is the Portfolio’s primary broad-based securities market index for comparison purposes. “S&P 500®” Index is a trademark of The McGraw-Hill Companies, Inc. The S&P 500® Index is widely regarded as the standard index for measuring large-cap U.S. stock market |
| | performance. Results assume reinvestment of all dividends and capital gains. An investment cannot be made directly in an index. |
| 4. | The Average Lipper Variable Products S&P 500 Index Portfolio is representative of portfolios that are passively managed and commit by prospectus language to replicate the performance of the S&P 500® Index (including reinvested dividends). In addition, S&P 500 Index portfolios have limited expenses (advisor fee no higher than 0.50%). The benchmark is a product of Lipper Inc. Lipper Inc. is an independent monitor of fund performance. Results are based on average total returns of similar portfolios with all dividend and capital gain distributions reinvested. |
Cost in Dollars of a $1,000 Investment in MainStay VP S&P 500 Portfolio (Unaudited)
The example below is intended to describe the fees and expenses borne by shareholders during the six-month period from January 1, 2017 to June 30, 2017, and the impact of those costs on your investment.
Example
As a shareholder of the Portfolio, you incur two types of costs: (1) transaction costs, including exchange fees and sales charges (loads) on purchases (as applicable), and (2) ongoing costs, including management fees, distribution and/or service (12b-1) fees, and other Portfolio expenses (as applicable). This example is intended to help you understand your ongoing costs (in dollars) of investing in the Portfolio and to compare these costs with the ongoing costs of investing in other mutual funds. The example is based on an investment of $1,000 made at the beginning of the six-month period and held for the entire period from January 1, 2017 to June 30, 2017. Shares are only sold in connection with variable life and annuity contracts and the example does not reflect any contract level or transactional fees or expenses. If these costs had been included, your costs would have been higher.
This example illustrates your Portfolio’s ongoing costs in two ways:
Actual Expenses
The second and third data columns in the table below provide information about actual account values and actual expenses. You may use the information in these columns, together with the amount you invested, to estimate the expenses that you paid during the six months ended June 30, 2017. Simply divide your account value by $1,000
(for example, an $8,600 account value divided by $1,000 = 8.6), then multiply the result by the number under the heading entitled “Expenses Paid During Period” to estimate the expenses you paid on your account during this period.
Hypothetical Example for Comparison Purposes
The fourth and fifth data columns in the table below provide information about hypothetical account values and hypothetical expenses based on the Portfolio’s actual expense ratio and an assumed rate of return of 5% per year before expenses, which is not the Portfolio’s actual return. The hypothetical account values and expenses may not be used to estimate the actual ending account balances or expenses you paid for the six-month period shown. You may use this information to compare the ongoing costs of investing in the Portfolio with the ongoing costs of investing in other mutual funds. To do so, compare this 5% hypothetical example with the 5% hypothetical examples that appear in the shareholder reports of the other mutual funds.
Please note that the expenses shown in the table are meant to highlight your ongoing costs only and do not reflect any transactional costs, such as exchange fees or sales charges (loads). Therefore, the fourth and fifth data columns of the table are useful in comparing ongoing costs only and will not help you determine the relative total costs of owning different funds. In addition, if these transactional costs were included, your costs would have been higher.
| | | | | | | | | | | | | | | | | | | | | | |
| | | | | | | | | | | | | | | | | | |
| Share Class | | Beginning
Account
Value
1/1/17 | | | Ending Account
Value (Based
on Actual
Returns and
Expenses)
6/30/17 | | | Expenses
Paid
During
Period1 | | | Ending Account
Value (Based
on Hypothetical
5% Annualized
Return and
Actual Expenses)
6/30/17 | | | Expenses
Paid
During
Period1 | | | Net Expense
Ratio
During
Period2 |
| | | | | | |
| Initial Class Shares | | $ | 1,000.00 | | | $ | 1,091.60 | | | $ | 1.40 | | | $ | 1,023.50 | | | $ | 1.35 | | | 0.27% |
| | | | | | |
| Service Class Shares | | $ | 1,000.00 | | | $ | 1,090.20 | | | $ | 2.69 | | | $ | 1,022.20 | | | $ | 2.61 | | | 0.52% |
| 1. | Expenses are equal to the Portfolio’s annualized expense ratio of each class multiplied by the average account value over the period, divided by 365 and multiplied by 181 (to reflect the six-month period). The table above represents the actual expenses incurred during the six-month period. |
| 2. | Expenses are equal to the Portfolio’s annualized expense ratio to reflect the six-month period. |
| | |
| 6 | | MainStay VP S&P 500 Index Portfolio |
Industry Composition as of June 30, 2017 (Unaudited)
| | | | |
| Banks | | | 5.7 | % |
| Oil, Gas & Consumable Fuels | | | 4.5 | |
| Pharmaceuticals | | | 4.4 | |
| Software | | | 4.3 | |
| Internet Software & Services | | | 4.0 | |
| Technology Hardware, Storage & Peripherals | | | 3.6 | |
| IT Services | | | 3.4 | |
| Semiconductors & Semiconductor Equipment | | | 3.0 | |
| Media | | | 2.7 | |
| Biotechnology | | | 2.6 | |
| Capital Markets | | | 2.6 | |
| Health Care Equipment & Supplies | | | 2.5 | |
| Health Care Providers & Services | | | 2.5 | |
| Equity Real Estate Investment Trusts (REITs) | | | 2.5 | |
| Insurance | | | 2.4 | |
| Internet & Direct Marketing Retail | | | 2.4 | |
| Aerospace & Defense | | | 2.1 | |
| Industrial Conglomerates | | | 2.0 | |
| Specialty Retail | | | 2.0 | |
| Chemicals | | | 1.9 | |
| Diversified Telecommunication Services | | | 1.9 | |
| Beverages | | | 1.8 | |
| Electric Utilities | | | 1.7 | |
| Food & Staples Retailing | | | 1.6 | |
| Hotels, Restaurants & Leisure | | | 1.6 | |
| Tobacco | | | 1.6 | |
| Household Products | | | 1.5 | |
| Diversified Financial Services | | | 1.4 | |
| Machinery | | | 1.4 | |
| Food Products | | | 1.2 | |
| Communications Equipment | | | 0.9 | |
| Multi-Utilities | | | 0.9 | |
| | | | |
| Energy Equipment & Services | | | 0.8 | % |
| Road & Rail | | | 0.8 | |
| Consumer Finance | | | 0.7 | |
| Air Freight & Logistics | | | 0.6 | |
| Airlines | | | 0.6 | |
| Life Sciences Tools & Services | | | 0.6 | |
| Textiles, Apparel & Luxury Goods | | | 0.6 | |
| Electrical Equipment | | | 0.5 | |
| Automobiles | | | 0.4 | |
| Household Durables | | | 0.4 | |
| Building Products | | | 0.3 | |
| Commercial Services & Supplies | | | 0.3 | |
| Containers & Packaging | | | 0.3 | |
| Electronic Equipment, Instruments & Components | | | 0.3 | |
| Multiline Retail | | | 0.3 | |
| Professional Services | | | 0.3 | |
| Auto Components | | | 0.2 | |
| Metals & Mining | | | 0.2 | |
| Construction & Engineering | | | 0.1 | |
| Construction Materials | | | 0.1 | |
| Distributors | | | 0.1 | |
| Health Care Technology | | | 0.1 | |
| Independent Power & Renewable Electricity Producers | | | 0.1 | |
| Leisure Products | | | 0.1 | |
| Personal Products | | | 0.1 | |
| Trading Companies & Distributors | | | 0.1 | |
| Water Utilities | | | 0.1 | |
| Diversified Consumer Services | | | 0.0 | ‡ |
| Real Estate Management & Development | | | 0.0 | ‡ |
| Short-Term Investments | | | 12.2 | |
| Other Assets, Less Liabilities | | | 0.1 | |
| | | | |
| | | 100.0 | % |
| | | | |
See Portfolio of Investments beginning on page 9 for specific holdings within these categories.
| ‡ | Less than one-tenth of a percent. |
Top Ten Holdings or Issuers as of June 30, 2017 (excluding short-term investments) (Unaudited)
| 9. | Berkshire Hathaway, Inc. Class B |
Portfolio Management Discussion and Analysis (Unaudited)
Answers to the questions reflect the views of portfolio managers Francis J. Ok and Lee Baker of Cornerstone Capital Management Holdings LLC, the Portfolio’s Subadvisor.
How did MainStay VP S&P 500 Index Portfolio perform relative to its benchmark and peers during the six months ended June 30, 2017?
For the six months ended June 30, 2017, MainStay VP S&P 500 Index Portfolio returned 9.16% for Initial Class shares and 9.02% for Service Class shares. Over the same period, both share classes underperformed the 9.34% return of the S&P 500® Index,1 which is the Portfolio’s benchmark. Although the Portfolio seeks investment results that correspond to the total return performance of common stocks in the aggregate as represented by the S&P 500® Index, the Portfolio’s net performance will typically lag that of the Index because the Portfolio incurs operating expenses that the Index does not. For the six months ended June 30, 2017, Initial Class shares outperformed—and Service Class shares underperformed—the 9.10% return of the Average Lipper2 Variable Products S&P 500 Index Portfolio.
During the reporting period, how was the Portfolio’s performance materially affected by investments in derivatives?
The Portfolio invests in futures contracts to provide an efficient means of maintaining liquidity while remaining fully invested in the market. Because these futures contracts closely track the performance of the S&P 500® Index, their overall impact on the Portfolio’s performance was positive.
During the reporting period, which S&P 500® industries had the highest total returns and which industries had the lowest total returns?
The S&P 500® industries that provided the highest total returns during the reporting period were heath care technology, diversified consumer services, and life sciences tools & services. Over the same period, the S&P 500® industries that provided the lowest total returns were energy equipment & services, multiline retail, and diversified telecommunication services.
During the reporting period, which industries made the strongest positive contributions to the Portfolio’s performance and which industries made the weakest contributions?
The S&P 500® industries that made the greatest positive contributions to the Portfolio’s performance during the reporting period were Internet software & services; software; and
technology hardware, storage & peripherals. (Contributions take weightings and total returns into account.) Over the same period, the industries that made the weakest contributions to the Portfolio’s performance were oil, gas & consumable fuels; diversified telecommunication services; and energy equipment & services.
During the reporting period, which individual stocks in the S&P 500® Index had the highest total returns and which individual stocks had the lowest total returns?
During the reporting period, the S&P 500® stocks with the highest total returns were biotechnology company Vertex Pharmaceuticals; software company Activision Blizzard; and hotels, restaurants & leisure company Wynn Resorts. Over the same period, the S&P 500® stocks with the lowest total returns were energy equipment & services company Transocean; multiline retailer Macy’s; and oil, gas & consumable fuels company Anadarko Petroleum.
During the reporting period, which S&P 500® stocks made the strongest positive contributions to the Portfolio’s absolute performance and which S&P 500® stocks made the weakest contributions?
The S&P 500® stocks that made the strongest positive contributions to the Portfolio’s absolute performance were technology hardware, storage & peripherals company Apple; Internet & catalog retail company Amazon.com; and Internet software & services company Facebook. Over the same period, the S&P 500® stocks that made the weakest contributions to the Portfolio’s performance were oil, gas & consumable fuels company Exxon Mobil; industrial conglomerate General Electric; and diversified telecommunication services company Verizon Communications.
Were there any changes in the S&P 500® Index during the reporting period?
During the reporting period, there were 20 additions to and 20 deletions from the S&P 500® Index. In terms of index weight, significant additions to the Index during the reporting period included biopharmaceutical research company Incyte and IT services company Computer Sciences Corporation. Significant deletions from the Index during the reporting period included Internet software & services company Yahoo! and oil, gas & consumable fuels company Spectra Energy.
| 1. | See footnote on page 5 for more information on the S&P 500® Index. |
| 2. | See footnote on page 5 for more information on Lipper Inc. |
The opinions expressed are those of the portfolio managers as of the date of this report and are subject to change. There is no guarantee that any forecasts made will come to pass. This material does not constitute investment advice and is not intended as an endorsement of any specific investment.
Not all MainStay VP Portfolios and/or share classes are available under all policies.
| | |
| 8 | | MainStay VP S&P 500 Index Portfolio |
Portfolio of Investments June 30, 2017 (Unaudited)
| | | | | | | | |
| | |
| | | Shares | | | Value | |
| Common Stocks 87.7%† | |
Aerospace & Defense 2.1% | |
Arconic, Inc. | | | 33,375 | | | $ | 755,945 | |
Boeing Co. | | | 42,631 | | | | 8,430,280 | |
General Dynamics Corp. | | | 21,519 | | | | 4,262,914 | |
L3 Technologies, Inc. | | | 5,852 | | | | 977,752 | |
Lockheed Martin Corp. | | | 18,915 | | | | 5,250,993 | |
Northrop Grumman Corp. | | | 13,228 | | | | 3,395,760 | |
Raytheon Co. | | | 22,184 | | | | 3,582,272 | |
Rockwell Collins, Inc. | | | 12,289 | | | | 1,291,328 | |
Textron, Inc. | | | 20,430 | | | | 962,253 | |
TransDigm Group, Inc. | | | 3,711 | | | | 997,777 | |
United Technologies Corp. | | | 56,542 | | | | 6,904,344 | |
| | | | | | | | |
| | | | | | | 36,811,618 | |
| | | | | | | | |
Air Freight & Logistics 0.6% | | | | | | | | |
C.H. Robinson Worldwide, Inc. | | | 10,722 | | | | 736,387 | |
Expeditors International of Washington, Inc. | | | 13,650 | | | | 770,952 | |
FedEx Corp. | | | 18,666 | | | | 4,056,682 | |
United Parcel Service, Inc. Class B | | | 52,127 | | | | 5,764,725 | |
| | | | | | | | |
| | | | | | | 11,328,746 | |
| | | | | | | | |
Airlines 0.6% | | | | | | | | |
Alaska Air Group, Inc. | | | 9,350 | | | | 839,256 | |
American Airlines Group, Inc. | | | 37,411 | | | | 1,882,522 | |
Delta Air Lines, Inc. | | | 55,632 | | | | 2,989,664 | |
Southwest Airlines Co. | | | 45,922 | | | | 2,853,593 | |
United Continental Holdings, Inc. (a) | | | 21,382 | | | | 1,608,995 | |
| | | | | | | | |
| | | | | | | 10,174,030 | |
| | | | | | | | |
Auto Components 0.2% | | | | | | | | |
BorgWarner, Inc. | | | 15,175 | | | | 642,813 | |
Delphi Automotive PLC | | | 20,328 | | | | 1,781,749 | |
Goodyear Tire & Rubber Co. | | | 19,117 | | | | 668,330 | |
| | | | | | | | |
| | | | | | | 3,092,892 | |
| | | | | | | | |
Automobiles 0.4% | | | | | | | | |
Ford Motor Co. | | | 296,780 | | | | 3,320,968 | |
General Motors Co. | | | 104,203 | | | | 3,639,811 | |
Harley-Davidson, Inc. | | | 13,471 | | | | 727,703 | |
| | | | | | | | |
| | | | | | | 7,688,482 | |
| | | | | | | | |
Banks 5.7% | | | | | | | | |
Bank of America Corp. | | | 755,158 | | | | 18,320,133 | |
BB&T Corp. | | | 61,301 | | | | 2,783,678 | |
Citigroup, Inc. | | | 208,919 | | | | 13,972,503 | |
Citizens Financial Group, Inc. | | | 38,671 | | | | 1,379,781 | |
Comerica, Inc. | | | 13,359 | | | | 978,413 | |
Fifth Third Bancorp | | | 57,102 | | | | 1,482,368 | |
Huntington Bancshares, Inc. | | | 81,524 | | | | 1,102,205 | |
¨JPMorgan Chase & Co. | | | 269,590 | | | | 24,640,526 | |
KeyCorp | | | 83,246 | | | | 1,560,030 | |
| | | | | | | | |
| | |
| | | Shares | | | Value | |
Banks (continued) | | | | | | | | |
M&T Bank Corp. | | | 11,714 | | | $ | 1,897,082 | |
People’s United Financial, Inc. | | | 26,000 | | | | 459,160 | |
PNC Financial Services Group, Inc. | | | 36,754 | | | | 4,589,472 | |
Regions Financial Corp. | | | 91,310 | | | | 1,336,778 | |
SunTrust Banks, Inc. | | | 36,718 | | | | 2,082,645 | |
U.S. Bancorp | | | 120,208 | | | | 6,241,199 | |
¨Wells Fargo & Co. | | | 341,150 | | | | 18,903,122 | |
Zions Bancorp. | | | 15,249 | | | | 669,584 | |
| | | | | | | | |
| | | | | | | 102,398,679 | |
| | | | | | | | |
Beverages 1.8% | | | | | | | | |
Brown-Forman Corp. Class B | | | 13,437 | | | | 653,038 | |
Coca-Cola Co. | | | 291,785 | | | | 13,086,557 | |
Constellation Brands, Inc. Class A | | | 13,010 | | | | 2,520,427 | |
Dr. Pepper Snapple Group, Inc. | | | 13,879 | | | | 1,264,516 | |
Molson Coors Brewing Co. Class B | | | 13,879 | | | | 1,198,313 | |
Monster Beverage Corp. (a) | | | 30,549 | | | | 1,517,675 | |
PepsiCo., Inc. | | | 108,396 | | | | 12,518,654 | |
| | | | | | | | |
| | | | | | | 32,759,180 | |
| | | | | | | | |
Biotechnology 2.6% | | | | | | | | |
AbbVie, Inc. | | | 120,755 | | | | 8,755,945 | |
Alexion Pharmaceuticals, Inc. (a) | | | 17,017 | | | | 2,070,458 | |
Amgen, Inc. | | | 55,794 | | | | 9,609,401 | |
Biogen, Inc. (a) | | | 16,209 | | | | 4,398,474 | |
Celgene Corp. (a) | | | 59,250 | | | | 7,694,798 | |
Gilead Sciences, Inc. | | | 99,023 | | | | 7,008,848 | |
Incyte Corp. (a) | | | 12,818 | | | | 1,613,914 | |
Regeneron Pharmaceuticals, Inc. (a) | | | 5,761 | | | | 2,829,458 | |
Vertex Pharmaceuticals, Inc. (a) | | | 18,822 | | | | 2,425,591 | |
| | | | | | | | |
| | | | | | | 46,406,887 | |
| | | | | | | | |
Building Products 0.3% | | | | | | | | |
Allegion PLC | | | 7,160 | | | | 580,819 | |
Fortune Brands Home & Security, Inc. | | | 11,518 | | | | 751,435 | |
Johnson Controls International PLC | | | 71,184 | | | | 3,086,538 | |
Masco Corp. | | | 24,333 | | | | 929,764 | |
| | | | | | | | |
| | | | | | | 5,348,556 | |
| | | | | | | | |
Capital Markets 2.6% | | | | | | | | |
Affiliated Managers Group, Inc. | | | 4,307 | | | | 714,359 | |
Ameriprise Financial, Inc. | | | 11,568 | | | | 1,472,491 | |
Bank of New York Mellon Corp. | | | 78,810 | | | | 4,020,886 | |
BlackRock, Inc. | | | 9,192 | | | | 3,882,793 | |
CBOE Holdings, Inc. | | | 6,905 | | | | 631,117 | |
Charles Schwab Corp. | | | 92,035 | | | | 3,953,824 | |
CME Group, Inc. | | | 25,783 | | | | 3,229,063 | |
E*TRADE Financial Corp. (a) | | | 20,637 | | | | 784,825 | |
Franklin Resources, Inc. | | | 26,126 | | | | 1,170,183 | |
Goldman Sachs Group, Inc. | | | 27,778 | | | | 6,163,938 | |
Intercontinental Exchange, Inc. | | | 45,002 | | | | 2,966,532 | |
| † | Percentages indicated are based on Portfolio net assets. |
| ¨ | | Among the Portfolio’s 10 largest holdings or issuers, as of June 30, 2017, excluding short-term investments. May be subject to change daily. |
| | | | | | |
The notes to the financial statements are an integral part of,
and should be read in conjunction with, the financial statements. | | | | | 9 | |
Portfolio of Investments June 30, 2017 (Unaudited) (continued)
| | | | | | | | |
| | |
| | | Shares | | | Value | |
| Common Stocks (continued) | |
Capital Markets (continued) | | | | | | | | |
Invesco, Ltd. | | | 30,899 | | | $ | 1,087,336 | |
Moody’s Corp. | | | 12,616 | | | | 1,535,115 | |
Morgan Stanley | | | 108,079 | | | | 4,816,000 | |
Nasdaq, Inc. | | | 8,582 | | | | 613,527 | |
Northern Trust Corp. | | | 16,337 | | | | 1,588,120 | |
Raymond James Financial, Inc. | | | 9,688 | | | | 777,171 | |
S&P Global, Inc. | | | 19,589 | | | | 2,859,798 | |
State Street Corp. | | | 26,859 | | | | 2,410,058 | |
T. Rowe Price Group, Inc. | | | 18,404 | | | | 1,365,761 | |
| | | | | | | | |
| | | | 46,042,897 | |
| | | | | | | | |
Chemicals 1.9% | |
Air Products & Chemicals, Inc. | | | 16,485 | | | | 2,358,344 | |
Albemarle Corp. | | | 8,411 | | | | 887,697 | |
CF Industries Holdings, Inc. | | | 17,400 | | | | 486,504 | |
Dow Chemical Co. | | | 85,362 | | | | 5,383,781 | |
E.I. du Pont de Nemours & Co. | | | 65,848 | | | | 5,314,592 | |
Eastman Chemical Co. | | | 11,094 | | | | 931,785 | |
Ecolab, Inc. | | | 19,846 | | | | 2,634,556 | |
FMC Corp. | | | 9,975 | | | | 728,674 | |
International Flavors & Fragrances, Inc. | | | 5,991 | | | | 808,785 | |
LyondellBasell Industries N.V. Class A | | | 25,007 | | | | 2,110,341 | |
Monsanto Co. | | | 33,297 | | | | 3,941,033 | |
Mosaic Co. | | | 26,425 | | | | 603,283 | |
PPG Industries, Inc. | | | 19,530 | | | | 2,147,519 | |
Praxair, Inc. | | | 21,597 | | | | 2,862,682 | |
Sherwin-Williams Co. | | | 6,107 | | | | 2,143,313 | |
| | | | | | | | |
| | | | 33,342,889 | |
| | | | | | | | |
Commercial Services & Supplies 0.3% | |
Cintas Corp. | | | 6,501 | | | | 819,386 | |
Republic Services, Inc. | | | 17,579 | | | | 1,120,310 | |
Stericycle, Inc. (a) | | | 6,345 | | | | 484,250 | |
Waste Management, Inc. | | | 30,869 | | | | 2,264,241 | |
| | | | | | | | |
| | | | 4,688,187 | |
| | | | | | | | |
Communications Equipment 0.9% | |
Cisco Systems, Inc. | | | 378,963 | | | | 11,861,542 | |
F5 Networks, Inc. (a) | | | 4,993 | | | | 634,410 | |
Harris Corp. | | | 9,259 | | | | 1,009,972 | |
Juniper Networks, Inc. | | | 28,878 | | | | 805,119 | |
Motorola Solutions, Inc. | | | 12,562 | | | | 1,089,628 | |
| | | | | | | | |
| | | | 15,400,671 | |
| | | | | | | | |
Construction & Engineering 0.1% | |
Fluor Corp. | | | 10,571 | | | | 483,941 | |
Jacobs Engineering Group, Inc. | | | 9,149 | | | | 497,614 | |
Quanta Services, Inc. (a) | | | 11,249 | | | | 370,317 | |
| | | | | | | | |
| | | | 1,351,872 | |
| | | | | | | | |
| | | | | | | | |
| | |
| | | Shares | | | Value | |
Construction Materials 0.1% | |
Martin Marietta Materials, Inc. | | | 4,752 | | | $ | 1,057,700 | |
Vulcan Materials Co. | | | 9,953 | | | | 1,260,846 | |
| | | | | | | | |
| | | | 2,318,546 | |
| | | | | | | | |
Consumer Finance 0.7% | |
American Express Co. | | | 56,969 | | | | 4,799,069 | |
Capital One Financial Corp. | | | 36,463 | | | | 3,012,573 | |
Discover Financial Services | | | 28,849 | | | | 1,794,119 | |
Navient Corp. | | | 21,640 | | | | 360,306 | |
Synchrony Financial | | | 58,511 | | | | 1,744,798 | |
| | | | | | | | |
| | | | 11,710,865 | |
| | | | | | | | |
Containers & Packaging 0.3% | |
Avery Dennison Corp. | | | 6,801 | | | | 601,004 | |
Ball Corp. | | | 26,567 | | | | 1,121,393 | |
International Paper Co. | | | 31,331 | | | | 1,773,648 | |
Sealed Air Corp. | | | 14,738 | | | | 659,673 | |
WestRock Co. | | | 19,194 | | | | 1,087,532 | |
| | | | | | | | |
| | | | 5,243,250 | |
| | | | | | | | |
Distributors 0.1% | |
Genuine Parts Co. | | | 11,255 | | | | 1,044,014 | |
LKQ Corp. (a) | | | 22,966 | | | | 756,729 | |
| | | | | | | | |
| | | | 1,800,743 | |
| | | | | | | | |
Diversified Consumer Services 0.0%‡ | |
H&R Block, Inc. | | | 15,641 | | | | 483,463 | |
| | | | | | | | |
|
Diversified Financial Services 1.4% | |
¨Berkshire Hathaway, Inc. Class B (a) | | | 144,135 | | | | 24,412,145 | |
Leucadia National Corp. | | | 24,186 | | | | 632,706 | |
| | | | | | | | |
| | | | 25,044,851 | |
| | | | | | | | |
Diversified Telecommunication Services 1.9% | |
AT&T, Inc. | | | 466,515 | | | | 17,601,611 | |
CenturyLink, Inc. | | | 41,644 | | | | 994,459 | |
Level 3 Communications, Inc. (a) | | | 22,212 | | | | 1,317,172 | |
Verizon Communications, Inc. | | | 309,546 | | | | 13,824,324 | |
| | | | | | | | |
| | | | 33,737,566 | |
| | | | | | | | |
Electric Utilities 1.7% | |
Alliant Energy Corp. | | | 17,073 | | | | 685,822 | |
American Electric Power Co., Inc. | | | 37,252 | | | | 2,587,897 | |
Duke Energy Corp. | | | 53,003 | | | | 4,430,521 | |
Edison International | | | 24,548 | | | | 1,919,408 | |
Entergy Corp. | | | 13,533 | | | | 1,038,928 | |
Eversource Energy | | | 23,964 | | | | 1,454,855 | |
Exelon Corp. | | | 70,198 | | | | 2,532,042 | |
FirstEnergy Corp. | | | 33,613 | | | | 980,155 | |
NextEra Energy, Inc. | | | 35,424 | | | | 4,963,965 | |
PG&E Corp. | | | 38,779 | | | | 2,573,762 | |
Pinnacle West Capital Corp. | | | 8,465 | | | | 720,879 | |
PPL Corp. | | | 51,885 | | | | 2,005,874 | |
| | | | |
| 10 | | MainStay VP S&P 500 Index Portfolio | | The notes to the financial statements are an integral part of,
and should be read in conjunction with, the financial statements. |
| | | | | | | | |
| | |
| | | Shares | | | Value | |
| Common Stocks (continued) | |
Electric Utilities (continued) | | | | | | | | |
Southern Co. | | | 75,471 | | | $ | 3,613,552 | |
Xcel Energy, Inc. | | | 38,272 | | | | 1,755,919 | |
| | | | | | | | |
| | | | 31,263,579 | |
| | | | | | | | |
Electrical Equipment 0.5% | |
Acuity Brands, Inc. | | | 3,280 | | | | 666,758 | |
AMETEK, Inc. | | | 17,385 | | | | 1,053,010 | |
Eaton Corp. PLC | | | 33,941 | | | | 2,641,628 | |
Emerson Electric Co. | | | 48,870 | | | | 2,913,629 | |
Rockwell Automation, Inc. | | | 9,687 | | | | 1,568,907 | |
| | | | | | | | |
| | | | 8,843,932 | |
| | | | | | | | |
Electronic Equipment, Instruments & Components 0.3% | |
Amphenol Corp. Class A | | | 23,280 | | | | 1,718,530 | |
Corning, Inc. | | | 69,828 | | | | 2,098,331 | |
FLIR Systems, Inc. | | | 10,312 | | | | 357,414 | |
TE Connectivity, Ltd. | | | 26,740 | | | | 2,103,903 | |
| | | | | | | | |
| | | | | | | 6,278,178 | |
| | | | | | | | |
Energy Equipment & Services 0.8% | |
Baker Hughes, Inc. | | | 32,310 | | | | 1,761,218 | |
Halliburton Co. | | | 65,679 | | | | 2,805,150 | |
Helmerich & Payne, Inc. | | | 8,046 | | | | 437,220 | |
National Oilwell Varco, Inc. | | | 28,533 | | | | 939,877 | |
Schlumberger, Ltd. | | | 105,619 | | | | 6,953,955 | |
TechnipFMC PLC (a) | | | 35,487 | | | | 965,247 | |
Transocean, Ltd. (a) | | | 29,193 | | | | 240,258 | |
| | | | | | | | |
| | | | | | | 14,102,925 | |
| | | | | | | | |
Equity Real Estate Investment Trusts (REITs) 2.5% | |
Alexandria Real Estate Equities, Inc. | | | 6,917 | | | | 833,291 | |
American Tower Corp. | | | 32,364 | | | | 4,282,404 | |
Apartment Investment & Management Co. Class A | | | 11,677 | | | | 501,761 | |
AvalonBay Communities, Inc. | | | 10,404 | | | | 1,999,337 | |
Boston Properties, Inc. | | | 11,580 | | | | 1,424,572 | |
Crown Castle International Corp. | | | 27,805 | | | | 2,785,505 | |
Digital Realty Trust, Inc. | | | 12,124 | | | | 1,369,406 | |
Equinix, Inc. | | | 5,885 | | | | 2,525,607 | |
Equity Residential | | | 27,860 | | | | 1,834,024 | |
Essex Property Trust, Inc. | | | 4,930 | | | | 1,268,341 | |
Extra Space Storage, Inc. | | | 9,375 | | | | 731,250 | |
Federal Realty Investment Trust | | | 5,427 | | | | 685,918 | |
GGP, Inc. | | | 43,996 | | | | 1,036,546 | |
HCP, Inc. | | | 35,115 | | | | 1,122,275 | |
Host Hotels & Resorts, Inc. | | | 56,109 | | | | 1,025,111 | |
Iron Mountain, Inc. | | | 18,447 | | | | 633,839 | |
Kimco Realty Corp. | | | 32,109 | | | | 589,200 | |
Macerich Co. | | | 9,206 | | | | 534,500 | |
Mid-America Apartment Communities, Inc. | | | 8,551 | | | | 901,104 | |
Prologis, Inc. | | | 40,241 | | | | 2,359,732 | |
Public Storage | | | 11,313 | | | | 2,359,100 | |
| | | | | | | | |
| | |
| | | Shares | | | Value | |
Equity Real Estate Investment Trusts (REITs) (continued) | |
Realty Income Corp. | | | 20,594 | | | $ | 1,136,377 | |
Regency Centers Corp. | | | 11,031 | | | | 690,982 | |
Simon Property Group, Inc. | | | 23,710 | | | | 3,835,330 | |
SL Green Realty Corp. | | | 7,734 | | | | 818,257 | |
UDR, Inc. | | | 20,092 | | | | 782,985 | |
Ventas, Inc. | | | 26,752 | | | | 1,858,729 | |
Vornado Realty Trust | | | 12,993 | | | | 1,220,043 | |
Welltower, Inc. | | | 27,809 | | | | 2,081,504 | |
Weyerhaeuser Co. | | | 57,009 | | | | 1,909,801 | |
| | | | | | | | |
| | | | | | | 45,136,831 | |
| | | | | | | | |
Food & Staples Retailing 1.6% | |
Costco Wholesale Corp. | | | 33,254 | | | | 5,318,312 | |
CVS Health Corp. | | | 77,307 | | | | 6,220,121 | |
Kroger Co. | | | 69,249 | | | | 1,614,887 | |
Sysco Corp. | | | 37,362 | | | | 1,880,430 | |
Wal-Mart Stores, Inc. | | | 112,181 | | | | 8,489,858 | |
Walgreens Boots Alliance, Inc. | | | 64,653 | | | | 5,062,976 | |
Whole Foods Market, Inc. | | | 24,332 | | | | 1,024,621 | |
| | | | | | | | |
| | | | | | | 29,611,205 | |
| | | | | | | | |
Food Products 1.2% | |
Archer-Daniels-Midland Co. | | | 43,470 | | | | 1,798,789 | |
Campbell Soup Co. | | | 14,430 | | | | 752,524 | |
Conagra Brands, Inc. | | | 30,700 | | | | 1,097,832 | |
General Mills, Inc. | | | 43,718 | | | | 2,421,977 | |
Hershey Co. | | | 10,634 | | | | 1,141,773 | |
Hormel Foods Corp. | | | 20,141 | | | | 687,010 | |
J.M. Smucker Co. | | | 8,779 | | | | 1,038,819 | |
Kellogg Co. | | | 19,048 | | | | 1,323,074 | |
Kraft Heinz Co. | | | 45,274 | | | | 3,877,265 | |
McCormick & Co., Inc. | | | 8,681 | | | | 846,484 | |
Mondelez International, Inc. Class A | | | 115,132 | | | | 4,972,551 | |
Tyson Foods, Inc. Class A | | | 21,951 | | | | 1,374,791 | |
| | | | | | | | |
| | | | | | | 21,332,889 | |
| | | | | | | | |
Health Care Equipment & Supplies 2.5% | |
Abbott Laboratories | | | 131,788 | | | | 6,406,215 | |
Align Technology, Inc. (a) | | | 5,730 | | | | 860,188 | |
Baxter International, Inc. | | | 36,881 | | | | 2,232,776 | |
Becton Dickinson & Co. | | | 17,252 | | | | 3,366,038 | |
Boston Scientific Corp. (a) | | | 103,911 | | | | 2,880,413 | |
C.R. Bard, Inc. | | | 5,472 | | | | 1,729,754 | |
Cooper Cos., Inc. | | | 3,667 | | | | 877,953 | |
Danaher Corp. | | | 46,345 | | | | 3,911,054 | |
DENTSPLY SIRONA, Inc. | | | 17,533 | | | | 1,136,840 | |
Edwards Lifesciences Corp. (a) | | | 15,934 | | | | 1,884,036 | |
Hologic, Inc. (a) | | | 20,920 | | | | 949,350 | |
IDEXX Laboratories, Inc. (a) | | | 6,685 | | | | 1,079,093 | |
Intuitive Surgical, Inc. (a) | | | 2,782 | | | | 2,602,199 | |
Medtronic PLC | | | 103,730 | | | | 9,206,037 | |
Stryker Corp. | | | 23,540 | | | | 3,266,881 | |
| | | | | | |
The notes to the financial statements are an integral part of,
and should be read in conjunction with, the financial statements. | | | | | 11 | |
Portfolio of Investments June 30, 2017 (Unaudited) (continued)
| | | | | | | | |
| | |
| | | Shares | | | Value | |
| Common Stocks (continued) | |
Health Care Equipment & Supplies (continued) | | | | | |
Varian Medical Systems, Inc. (a) | | | 6,981 | | | $ | 720,369 | |
Zimmer Biomet Holdings, Inc. | | | 15,269 | | | | 1,960,539 | |
| | | | | | | | |
| | | | | | | 45,069,735 | |
| | | | | | | | |
Health Care Providers & Services 2.5% | |
Aetna, Inc. | | | 25,134 | | | | 3,816,095 | |
AmerisourceBergen Corp. | | | 12,608 | | | | 1,191,834 | |
Anthem, Inc. | | | 20,029 | | | | 3,768,056 | |
Cardinal Health, Inc. | | | 24,024 | | | | 1,871,950 | |
Centene Corp. (a) | | | 13,033 | | | | 1,041,076 | |
Cigna Corp. | | | 19,396 | | | | 3,246,696 | |
DaVita, Inc. (a) | | | 11,939 | | | | 773,170 | |
Envision Healthcare Corp. (a) | | | 8,837 | | | | 553,815 | |
Express Scripts Holding Co. (a) | | | 45,076 | | | | 2,877,652 | |
HCA Holdings, Inc. (a) | | | 21,873 | | | | 1,907,326 | |
Henry Schein, Inc. (a) | | | 6,016 | | | | 1,101,048 | |
Humana, Inc. | | | 10,960 | | | | 2,637,195 | |
Laboratory Corp. of America Holdings (a) | | | 7,698 | | | | 1,186,570 | |
McKesson Corp. | | | 16,017 | | | | 2,635,437 | |
Patterson Cos., Inc. | | | 6,235 | | | | 292,733 | |
Quest Diagnostics, Inc. | | | 10,483 | | | | 1,165,290 | |
UnitedHealth Group, Inc. | | | 73,123 | | | | 13,558,467 | |
Universal Health Services, Inc. Class B | | | 6,807 | | | | 830,999 | |
| | | | | | | | |
| | | | | | | 44,455,409 | |
| | | | | | | | |
Health Care Technology 0.1% | |
Cerner Corp. (a) | | | 22,292 | | | | 1,481,749 | |
| | | | | | | | |
|
Hotels, Restaurants & Leisure 1.6% | |
Carnival Corp. | | | 31,702 | | | | 2,078,700 | |
Chipotle Mexican Grill, Inc. (a) | | | 2,195 | | | | 913,339 | |
Darden Restaurants, Inc. | | | 9,299 | | | | 841,002 | |
Hilton Worldwide Holdings, Inc. | | | 15,531 | | | | 960,592 | |
Marriott International, Inc. Class A | | | 23,575 | | | | 2,364,808 | |
McDonald’s Corp. | | | 61,848 | | | | 9,472,640 | |
Royal Caribbean Cruises, Ltd. | | | 12,622 | | | | 1,378,701 | |
Starbucks Corp. | | | 109,883 | | | | 6,407,278 | |
Wyndham Worldwide Corp. | | | 7,975 | | | | 800,770 | |
Wynn Resorts, Ltd. | | | 6,065 | | | | 813,438 | |
Yum! Brands, Inc. | | | 25,125 | | | | 1,853,220 | |
| | | | | | | | |
| | | | 27,884,488 | |
| | | | | | | | |
Household Durables 0.4% | |
D.R. Horton, Inc. | | | 25,526 | | | | 882,434 | |
Garmin, Ltd. | | | 8,681 | | | | 442,991 | |
Leggett & Platt, Inc. | | | 10,160 | | | | 533,705 | |
Lennar Corp. Class A | | | 15,435 | | | | 822,994 | |
Mohawk Industries, Inc. (a) | | | 4,749 | | | | 1,147,786 | |
Newell Brands, Inc. | | | 36,658 | | | | 1,965,602 | |
PulteGroup, Inc. | | | 21,730 | | | | 533,037 | |
Whirlpool Corp. | | | 5,613 | | | | 1,075,563 | |
| | | | | | | | |
| | | | 7,404,112 | |
| | | | | | | | |
| | | | | | | | |
| | |
| | | Shares | | | Value | |
Household Products 1.5% | |
Church & Dwight Co., Inc. | | | 18,930 | | | $ | 982,088 | |
Clorox Co. | | | 9,755 | | | | 1,299,756 | |
Colgate-Palmolive Co. | | | 66,885 | | | | 4,958,185 | |
Kimberly-Clark Corp. | | | 26,952 | | | | 3,479,773 | |
Procter & Gamble Co. | | | 194,074 | | | | 16,913,549 | |
| | | | | | | | |
| | | | 27,633,351 | |
| | | | | | | | |
Independent Power & Renewable Electricity Producers 0.1% | |
AES Corp. | | | 49,453 | | | | 549,423 | |
NRG Energy, Inc. | | | 23,454 | | | | 403,878 | |
| | | | | | | | |
| | | | 953,301 | |
| | | | | | | | |
Industrial Conglomerates 2.0% | |
3M Co. | | | 45,386 | | | | 9,448,911 | |
General Electric Co. | | | 660,990 | | | | 17,853,340 | |
Honeywell International, Inc. | | | 57,847 | | | | 7,710,427 | |
Roper Technologies, Inc. | | | 7,718 | | | | 1,786,948 | |
| | | | | | | | |
| | | | 36,799,626 | |
| | | | | | | | |
Insurance 2.4% | |
Aflac, Inc. | | | 30,139 | | | | 2,341,198 | |
Allstate Corp. | | | 27,819 | | | | 2,460,312 | |
American International Group, Inc. | | | 66,520 | | | | 4,158,830 | |
Aon PLC | | | 19,876 | | | | 2,642,514 | |
Arthur J. Gallagher & Co. | | | 13,569 | | | | 776,825 | |
Assurant, Inc. | | | 4,161 | | | | 431,454 | |
Chubb, Ltd. | | | 35,461 | | | | 5,155,320 | |
Cincinnati Financial Corp. | | | 11,169 | | | | 809,194 | |
Everest Re Group, Ltd. | | | 3,116 | | | | 793,302 | |
Hartford Financial Services Group, Inc. | | | 27,900 | | | | 1,466,703 | |
Lincoln National Corp. | | | 17,018 | | | | 1,150,077 | |
Loews Corp. | | | 20,844 | | | | 975,708 | |
Marsh & McLennan Cos., Inc. | | | 38,951 | | | | 3,036,620 | |
MetLife, Inc. | | | 81,985 | | | | 4,504,256 | |
Principal Financial Group, Inc. | | | 20,324 | | | | 1,302,159 | |
Progressive Corp. | | | 44,079 | | | | 1,943,443 | |
Prudential Financial, Inc. | | | 32,509 | | | | 3,515,523 | |
Torchmark Corp. | | | 8,454 | | | | 646,731 | |
Travelers Cos., Inc. | | | 21,246 | | | | 2,688,256 | |
Unum Group | | | 17,317 | | | | 807,492 | |
Willis Towers Watson PLC | | | 9,652 | | | | 1,403,980 | |
XL Group, Ltd. | | | 19,856 | | | | 869,693 | |
| | | | | | | | |
| | | | 43,879,590 | |
| | | | | | | | |
Internet & Direct Marketing Retail 2.4% | |
¨Amazon.com, Inc. (a) | | | 30,103 | | | | 29,139,704 | |
Expedia, Inc. | | | 9,225 | | �� | | 1,374,064 | |
Netflix, Inc. (a) | | | 32,608 | | | | 4,871,961 | |
Priceline Group, Inc. (a) | | | 3,732 | | | | 6,980,781 | |
TripAdvisor, Inc. (a) | | | 8,436 | | | | 322,255 | |
| | | | | | | | |
| | | | 42,688,765 | |
| | | | | | | | |
| | | | |
| 12 | | MainStay VP S&P 500 Index Portfolio | | The notes to the financial statements are an integral part of,
and should be read in conjunction with, the financial statements. |
| | | | | | | | |
| | |
| | | Shares | | | Value | |
| Common Stocks (continued) | |
Internet Software & Services 4.0% | |
Akamai Technologies, Inc. (a) | | | 13,283 | | | $ | 661,626 | |
¨Alphabet, Inc. (a) | |
Class A | | | 22,584 | | | | 20,995,893 | |
Class C | | | 22,642 | | | | 20,575,465 | |
eBay, Inc. (a) | | | 76,796 | | | | 2,681,716 | |
¨Facebook, Inc. Class A (a) | | | 179,362 | | | | 27,080,075 | |
VeriSign, Inc. (a) | | | 6,699 | | | | 622,739 | |
| | | | | | | | |
| | | | 72,617,514 | |
| | | | | | | | |
IT Services 3.4% | |
Accenture PLC Class A | | | 47,170 | | | | 5,833,986 | |
Alliance Data Systems Corp. | | | 4,248 | | | | 1,090,419 | |
Automatic Data Processing, Inc. | | | 33,950 | | | | 3,478,517 | |
Cognizant Technology Solutions Corp. Class A | | | 44,732 | | | | 2,970,205 | |
CSRA, Inc. | | | 11,104 | | | | 352,552 | |
DXC Technology Co. | | | 21,513 | | | | 1,650,477 | |
Fidelity National Information Services, Inc. | | | 25,107 | | | | 2,144,138 | |
Fiserv, Inc. (a) | | | 16,129 | | | | 1,973,222 | |
Gartner, Inc. (a) | | | 6,814 | | | | 841,597 | |
Global Payments, Inc. | | | 11,543 | | | | 1,042,564 | |
International Business Machines Corp. | | | 64,874 | | | | 9,979,567 | |
Mastercard, Inc. Class A | | | 71,176 | | | | 8,644,325 | |
Paychex, Inc. | | | 24,317 | | | | 1,384,610 | |
PayPal Holdings, Inc. (a) | | | 84,772 | | | | 4,549,713 | |
Total System Services, Inc. | | | 12,636 | | | | 736,047 | |
Visa, Inc. Class A | | | 140,095 | | | | 13,138,109 | |
Western Union Co. | | | 35,790 | | | | 681,800 | |
| | | | | | | | |
| | | | 60,491,848 | |
| | | | | | | | |
Leisure Products 0.1% | |
Hasbro, Inc. | | | 8,504 | | | | 948,281 | |
Mattel, Inc. | | | 25,841 | | | | 556,357 | |
| | | | | | | | |
| | | | 1,504,638 | |
| | | | | | | | |
Life Sciences Tools & Services 0.6% | |
Agilent Technologies, Inc. | | | 24,399 | | | | 1,447,105 | |
Illumina, Inc. (a) | | | 11,020 | | | | 1,912,190 | |
Mettler-Toledo International, Inc. (a) | | | 1,965 | | | | 1,156,481 | |
PerkinElmer, Inc. | | | 8,250 | | | | 562,155 | |
Thermo Fisher Scientific, Inc. | | | 29,656 | | | | 5,174,082 | |
Waters Corp. (a) | | | 6,071 | | | | 1,116,093 | |
| | | | | | | | |
| | | | 11,368,106 | |
| | | | | | | | |
Machinery 1.4% | |
Caterpillar, Inc. | | | 44,706 | | | | 4,804,107 | |
Cummins, Inc. | | | 11,690 | | | | 1,896,352 | |
Deere & Co. | | | 22,330 | | | | 2,759,765 | |
Dover Corp. | | | 11,781 | | | | 945,072 | |
Flowserve Corp. | | | 9,770 | | | | 453,621 | |
Fortive Corp. | | | 22,652 | | | | 1,435,004 | |
Illinois Tool Works, Inc. | | | 23,693 | | | | 3,394,022 | |
| | | | | | | | |
| | |
| | | Shares | | | Value | |
Machinery (continued) | |
Ingersoll-Rand PLC | | | 19,444 | | | $ | 1,776,987 | |
PACCAR, Inc. | | | 26,655 | | | | 1,760,296 | |
Parker-Hannifin Corp. | | | 10,151 | | | | 1,622,333 | |
Pentair PLC | | | 12,563 | | | | 835,942 | |
Snap-on, Inc. | | | 4,335 | | | | 684,930 | |
Stanley Black & Decker, Inc. | | | 11,591 | | | | 1,631,201 | |
Xylem, Inc. | | | 13,390 | | | | 742,208 | |
| | | | | | | | |
| | | | 24,741,840 | |
| | | | | | | | |
Media 2.7% | |
CBS Corp. Class B | | | 28,178 | | | | 1,797,193 | |
Charter Communications, Inc. Class A (a) | | | 16,330 | | | | 5,500,760 | |
Comcast Corp. Class A | | | 359,122 | | | | 13,977,028 | |
Discovery Communications, Inc. (a) | |
Class A | | | 11,160 | | | | 288,263 | |
Class C | | | 16,012 | | | | 403,662 | |
DISH Network Corp. Class A (a) | | | 17,191 | | | | 1,078,907 | |
Interpublic Group of Cos., Inc. | | | 30,334 | | | | 746,216 | |
News Corp. | |
Class A | | | 28,483 | | | | 390,217 | |
Class B | | | 8,047 | | | | 113,865 | |
Omnicom Group, Inc. | | | 17,661 | | | | 1,464,097 | |
Scripps Networks Interactive, Inc. Class A | | | 7,063 | | | | 482,474 | |
Time Warner, Inc. | | | 58,848 | | | | 5,908,928 | |
Twenty-First Century Fox, Inc. | |
Class A | | | 79,723 | | | | 2,259,350 | |
Class B | | | 36,700 | | | | 1,022,829 | |
Viacom, Inc. Class B | | | 26,324 | | | | 883,697 | |
Walt Disney Co. | | | 110,387 | | | | 11,728,619 | |
| | | | | | | | |
| | | | 48,046,105 | |
| | | | | | | | |
Metals & Mining 0.2% | |
Freeport-McMoRan, Inc. (a) | | | 101,283 | | | | 1,216,409 | |
Newmont Mining Corp. | | | 40,462 | | | | 1,310,564 | |
Nucor Corp. | | | 24,156 | | | | 1,397,908 | |
| | | | | | | | |
| | | | 3,924,881 | |
| | | | | | | | |
Multi-Utilities 0.9% | |
Ameren Corp. | | | 18,411 | | | | 1,006,529 | |
CenterPoint Energy, Inc. | | | 32,702 | | | | 895,381 | |
CMS Energy Corp. | | | 21,135 | | | | 977,494 | |
Consolidated Edison, Inc. | | | 23,111 | | | | 1,867,831 | |
Dominion Energy, Inc. | | | 47,586 | | | | 3,646,515 | |
DTE Energy Co. | | | 13,556 | | | | 1,434,089 | |
NiSource, Inc. | | | 24,504 | | | | 621,421 | |
Public Service Enterprise Group, Inc. | | | 38,118 | | | | 1,639,455 | |
SCANA Corp. | | | 10,669 | | | | 714,930 | |
Sempra Energy | | | 19,032 | | | | 2,145,858 | |
WEC Energy Group, Inc. | | | 23,844 | | | | 1,463,545 | |
| | | | | | | | |
| | | | 16,413,048 | |
| | | | | | | | |
| | | | | | |
The notes to the financial statements are an integral part of,
and should be read in conjunction with, the financial statements. | | | | | 13 | |
Portfolio of Investments June 30, 2017 (Unaudited) (continued)
| | | | | | | | |
| | |
| | | Shares | | | Value | |
| Common Stocks (continued) | |
Multiline Retail 0.3% | |
Dollar General Corp. | | | 19,201 | | | $ | 1,384,200 | |
Dollar Tree, Inc. (a) | | | 17,960 | | | | 1,255,763 | |
Kohl’s Corp. | | | 12,936 | | | | 500,235 | |
Macy’s, Inc. | | | 23,093 | | | | 536,681 | |
Nordstrom, Inc. | | | 8,755 | | | | 418,752 | |
Target Corp. | | | 42,134 | | | | 2,203,187 | |
| | | | | | | | |
| | | | 6,298,818 | |
| | | | | | | | |
Oil, Gas & Consumable Fuels 4.5% | |
Anadarko Petroleum Corp. | | | 42,254 | | | | 1,915,796 | |
Apache Corp. | | | 28,588 | | | | 1,370,223 | |
Cabot Oil & Gas Corp. | | | 35,324 | | | | 885,926 | |
Chesapeake Energy Corp. (a) | | | 56,138 | | | | 279,006 | |
Chevron Corp. | | | 143,761 | | | | 14,998,585 | |
Cimarex Energy Co. | | | 7,175 | | | | 674,522 | |
Concho Resources, Inc. (a) | | | 11,255 | | | | 1,367,820 | |
ConocoPhillips | | | 93,605 | | | | 4,114,876 | |
Devon Energy Corp. | | | 39,394 | | | | 1,259,426 | |
EOG Resources, Inc. | | | 43,804 | | | | 3,965,138 | |
EQT Corp. | | | 12,942 | | | | 758,272 | |
¨Exxon Mobil Corp. | | | 321,527 | | | | 25,956,875 | |
Hess Corp. | | | 20,281 | | | | 889,727 | |
Kinder Morgan, Inc. | | | 145,684 | | | | 2,791,305 | |
Marathon Oil Corp. | | | 63,245 | | | | 749,453 | |
Marathon Petroleum Corp. | | | 39,396 | | | | 2,061,593 | |
Murphy Oil Corp. | | | 12,195 | | | | 312,558 | |
Newfield Exploration Co. (a) | | | 14,853 | | | | 422,716 | |
Noble Energy, Inc. | | | 34,485 | | | | 975,925 | |
Occidental Petroleum Corp. | | | 57,903 | | | | 3,466,653 | |
ONEOK, Inc. | | | 18,290 | | | | 954,006 | |
Phillips 66 | | | 33,288 | | | | 2,752,585 | |
Pioneer Natural Resources Co. | | | 12,907 | | | | 2,059,699 | |
Range Resources Corp. | | | 14,165 | | | | 328,203 | |
Tesoro Corp. | | | 11,436 | | | | 1,070,410 | |
Valero Energy Corp. | | | 33,936 | | | | 2,289,323 | |
Williams Cos., Inc. | | | 62,564 | | | | 1,894,438 | |
| | | | | | | | |
| | | | 80,565,059 | |
| | | | | | | | |
Personal Products 0.1% | |
Coty, Inc. Class A | | | 35,511 | | | | 666,187 | |
Estee Lauder Cos., Inc. Class A | | | 16,840 | | | | 1,616,303 | |
| | | | | | | | |
| | | | 2,282,490 | |
| | | | | | | | |
Pharmaceuticals 4.4% | |
Allergan PLC | | | 25,486 | | | | 6,195,392 | |
Bristol-Myers Squibb Co. | | | 125,117 | | | | 6,971,519 | |
Eli Lilly & Co. | | | 73,559 | | | | 6,053,906 | |
¨Johnson & Johnson | | | 204,410 | | | | 27,041,399 | |
Mallinckrodt PLC (a) | | | 7,509 | | | | 336,478 | |
Merck & Co., Inc. | | | 207,547 | | | | 13,301,687 | |
Mylan N.V. (a) | | | 34,661 | | | | 1,345,540 | |
| | | | | | | | |
| | |
| | | Shares | | | Value | |
Pharmaceuticals (continued) | |
Perrigo Co. PLC | | | 10,768 | | | $ | 813,199 | |
Pfizer, Inc. | | | 452,845 | | | | 15,211,064 | |
Zoetis, Inc. | | | 37,329 | | | | 2,328,583 | |
| | | | | | | | |
| | | | 79,598,767 | |
| | | | | | | | |
Professional Services 0.3% | |
Equifax, Inc. | | | 9,122 | | | | 1,253,545 | |
IHS Markit, Ltd. (a) | | | 24,030 | | | | 1,058,281 | |
Nielsen Holdings PLC | | | 25,329 | | | | 979,219 | |
Robert Half International, Inc. | | | 9,905 | | | | 474,747 | |
Verisk Analytics, Inc. (a) | | | 11,722 | | | | 988,985 | |
| | | | | | | | |
| | | | 4,754,777 | |
| | | | | | | | |
Real Estate Management & Development 0.0%‡ | |
CBRE Group, Inc., Class A (a) | | | 22,524 | | | | 819,874 | |
| | | | | | | | |
|
Road & Rail 0.8% | |
CSX Corp. | | | 70,188 | | | | 3,829,457 | |
J.B. Hunt Transport Services, Inc. | | | 6,578 | | | | 601,098 | |
Kansas City Southern | | | 8,147 | | | | 852,583 | |
Norfolk Southern Corp. | | | 22,117 | | | | 2,691,639 | |
Union Pacific Corp. | | | 61,269 | | | | 6,672,807 | |
| | | | | | | | |
| | | | 14,647,584 | |
| | | | | | | | |
Semiconductors & Semiconductor Equipment 3.0% | |
Advanced Micro Devices, Inc. (a) | | | 58,443 | | | | 729,369 | |
Analog Devices, Inc. | | | 27,849 | | | | 2,166,652 | |
Applied Materials, Inc. | | | 81,732 | | | | 3,376,349 | |
Broadcom, Ltd. | | | 30,456 | | | | 7,097,771 | |
Intel Corp. | | | 357,323 | | | | 12,056,078 | |
KLA-Tencor Corp. | | | 11,874 | | | | 1,086,590 | |
Lam Research Corp. | | | 12,302 | | | | 1,739,872 | |
Microchip Technology, Inc. | | | 17,368 | | | | 1,340,462 | |
Micron Technology, Inc. (a) | | | 78,532 | | | | 2,344,965 | |
NVIDIA Corp. | | | 45,149 | | | | 6,526,739 | |
Qorvo, Inc. (a) | | | 9,630 | | | | 609,772 | |
QUALCOMM, Inc. | | | 111,901 | | | | 6,179,173 | |
Skyworks Solutions, Inc. | | | 14,038 | | | | 1,346,946 | |
Texas Instruments, Inc. | | | 75,586 | | | | 5,814,831 | |
Xilinx, Inc. | | | 18,859 | | | | 1,213,011 | |
| | | | | | | | |
| | | | 53,628,580 | |
| | | | | | | | |
Software 4.3% | |
Activision Blizzard, Inc. | | | 52,403 | | | | 3,016,841 | |
Adobe Systems, Inc. (a) | | | 37,544 | | | | 5,310,223 | |
ANSYS, Inc. (a) | | | 6,488 | | | | 789,460 | |
Autodesk, Inc. (a) | | | 14,712 | | | | 1,483,264 | |
CA, Inc. | | | 23,693 | | | | 816,698 | |
Citrix Systems, Inc. (a) | | | 11,479 | | | | 913,499 | |
Electronic Arts, Inc. (a) | | | 23,417 | | | | 2,475,645 | |
Intuit, Inc. | | | 18,462 | | | | 2,451,938 | |
¨Microsoft Corp. | | | 585,839 | | | | 40,381,882 | |
Oracle Corp. | | | 227,925 | | | | 11,428,159 | |
| | | | |
| 14 | | MainStay VP S&P 500 Index Portfolio | | The notes to the financial statements are an integral part of,
and should be read in conjunction with, the financial statements. |
| | | | | | | | |
| | |
| | | Shares | | | Value | |
| Common Stocks (continued) | |
Software (continued) | |
Red Hat, Inc. (a) | | | 13,646 | | | $ | 1,306,605 | |
salesforce.com, Inc. (a) | | | 50,782 | | | | 4,397,721 | |
Symantec Corp. | | | 46,154 | | | | 1,303,851 | |
Synopsys, Inc. (a) | | | 11,425 | | | | 833,225 | |
| | | | | | | | |
| | | | 76,909,011 | |
| | | | | | | | |
Specialty Retail 2.0% | |
Advance Auto Parts, Inc. | | | 5,564 | | | | 648,707 | |
AutoNation, Inc. (a) | | | 5,000 | | | | 210,800 | |
AutoZone, Inc. (a) | | | 2,157 | | | | 1,230,482 | |
Bed Bath & Beyond, Inc. | | | 11,024 | | | | 335,130 | |
Best Buy Co., Inc. | | | 20,132 | | | | 1,154,167 | |
CarMax, Inc. (a) | | | 14,054 | | | | 886,245 | |
Foot Locker, Inc. | | | 10,028 | | | | 494,180 | |
Gap, Inc. | | | 17,102 | | | | 376,073 | |
Home Depot, Inc. | | | 90,799 | | | | 13,928,567 | |
L Brands, Inc. | | | 18,211 | | | | 981,391 | |
Lowe’s Cos., Inc. | | | 65,110 | | | | 5,047,978 | |
O’Reilly Automotive, Inc. (a) | | | 6,961 | | | | 1,522,649 | |
Ross Stores, Inc. | | | 29,880 | | | | 1,724,972 | |
Signet Jewelers, Ltd. | | | 5,253 | | | | 332,200 | |
Staples, Inc. | | | 48,047 | | | | 483,833 | |
Tiffany & Co. | | | 8,093 | | | | 759,690 | |
TJX Cos., Inc. | | | 48,812 | | | | 3,522,762 | |
Tractor Supply Co. | | | 10,028 | | | | 543,618 | |
Ulta Salon Cosmetics & Fragrance, Inc. (a) | | | 4,417 | | | | 1,269,181 | |
| | | | | | | | |
| | | | 35,452,625 | |
| | | | | | | | |
Technology Hardware, Storage & Peripherals 3.6% | |
¨Apple, Inc. (b) | | | 395,630 | | | | 56,978,633 | |
Hewlett Packard Enterprise Co. | | | 125,862 | | | | 2,088,050 | |
HP, Inc. | | | 128,291 | | | | 2,242,527 | |
NetApp, Inc. | | | 20,527 | | | | 822,106 | |
Seagate Technology PLC | | | 22,323 | | | | 865,016 | |
Western Digital Corp. | | | 22,100 | | | | 1,958,060 | |
Xerox Corp. | | | 16,046 | | | | 461,002 | |
| | | | | | | | |
| | | | 65,415,394 | |
| | | | | | | | |
Textiles, Apparel & Luxury Goods 0.6% | |
Coach, Inc. | | | 21,181 | | | | 1,002,708 | |
Hanesbrands, Inc. | | | 27,656 | | | | 640,513 | |
Michael Kors Holdings, Ltd. (a) | | | 11,835 | | | | 429,019 | |
NIKE, Inc. Class B | | | 100,399 | | | | 5,923,541 | |
PVH Corp. | | | 5,988 | | | | 685,626 | |
Ralph Lauren Corp. | | | 4,248 | | | | 313,502 | |
Under Armour, Inc. (a) | |
Class A | | | 13,618 | | | | 296,328 | |
Class C | | | 13,714 | | | | 276,474 | |
VF Corp. | | | 24,331 | | | | 1,401,466 | |
| | | | | | | | |
| | | | 10,969,177 | |
| | | | | | | | |
| | | | | | | | |
| | |
| | | Shares | | | Value | |
Tobacco 1.6% | |
Altria Group, Inc. | | | 146,575 | | | $ | 10,915,440 | |
Philip Morris International, Inc. | | | 117,956 | | | | 13,853,932 | |
Reynolds American, Inc. | | | 62,657 | | | | 4,075,212 | |
| | | | | | | | |
| | | | 28,844,584 | |
| | | | | | | | |
Trading Companies & Distributors 0.1% | |
Fastenal Co. | | | 21,627 | | | | 941,423 | |
United Rentals, Inc. (a) | | | 6,363 | | | | 717,174 | |
W.W. Grainger, Inc. | | | 4,101 | | | | 740,354 | |
| | | | | | | | |
| | | | 2,398,951 | |
| | | | | | | | |
Water Utilities 0.1% | |
American Water Works Co., Inc. | | | 13,345 | | | | 1,040,243 | |
| | | | | | | | |
Total Common Stocks
(Cost $612,559,266) | | | | | | | 1,574,728,449 | (c) |
| | | | | | | | |
| | |
| | | | | | | | |
| | | Principal
Amount | | | | |
| Short-Term Investments 12.2% (d) | |
U.S. Government 12.2% | | | | | | | | |
United States Treasury Bills 12.2% | |
0.685—0.738%, due 7/6/17 | | $ | 2,500,000 | | | | 2,499,758 | |
0.678—0.883%, due 7/6/17 | | | 167,400,000 | | | | 167,383,322 | |
0.721—0.813%, due 7/6/17 | | | 28,600,000 | | | | 28,597,030 | |
0.776%, due 7/20/17 | | | 500,000 | | | | 499,798 | |
0.771%, due 7/27/17 (b) | | | 8,000,000 | | | | 7,995,618 | |
0.957—0.965%, due 8/24/17 | | | 3,700,000 | | | | 3,694,765 | |
0.992%, due 9/14/17 | | | 500,000 | | | | 499,040 | |
0.994—1.045%, due 10/5/17 | | | 5,500,000 | | | | 5,485,425 | |
1.011—1.012%, due 10/5/17 | | | 1,900,000 | | | | 1,894,965 | |
| | | | | | | | |
Total Short-Term Investments
(Cost $218,549,571) | | | | 218,549,721 | |
| | | | | | | | |
Total Investments
(Cost $831,108,837) (e) | | | 99.9 | % | | | 1,793,278,170 | |
Other Assets, Less Liabilities | | | 0.1 | | | | 1,313,650 | |
Net Assets | | | 100.0 | % | | $ | 1,794,591,820 | |
| ‡ | Less than one-tenth of a percent. |
| (a) | Non-income producing security. |
| (b) | Represents a security which was maintained at the broker as collateral for futures contracts. |
| (c) | The combined market value of common stocks and notional amount of Standard & Poor’s 500 Index futures contracts represents 100.0% of the Portfolio’s net assets. |
| (d) | Interest rate shown represents yield to maturity. |
| (e) | As of June 30, 2017, cost was $851,485,219 for federal income tax purposes and net unrealized appreciation was as follows: |
| | | | |
Gross unrealized appreciation | | $ | 974,926,939 | |
Gross unrealized depreciation | | | (33,133,988 | ) |
| | | | |
Net unrealized appreciation | | $ | 941,792,951 | |
| | | | |
| | | | | | |
The notes to the financial statements are an integral part of,
and should be read in conjunction with, the financial statements. | | | | | 15 | |
Portfolio of Investments June 30, 2017 (Unaudited) (continued)
As of June 30, 2017, the Portfolio held the following futures contract:
| | | | | | | | | | | | | | | | |
Type | | Number of
Contracts
Long | | | Expiration
Date | | | Notional
Amount | | | Unrealized
Appreciation
(Depreciation)1 | |
| Standard & Poor’s 500 Index Mini | | | 1,802 | | | | September 2017 | | | $ | 218,123,090 | | | $ | (1,272,732 | ) |
| | | | | | | | | | | | | | | | |
| 1. | Represents the difference between the value of the contracts at the time they were opened and the value as of June 30, 2017. |
The following is a summary of the fair valuations according to the inputs used as of June 30, 2017, for valuing the Portfolio’s assets.
Asset Valuation Inputs
| | | | | | | | | | | | | | | | |
Description | | Quoted
Prices in
Active
Markets for
Identical
Assets (Level 1) | | | Significant
Other
Observable
Inputs (Level 2) | | | Significant
Unobservable
Inputs (Level 3) | | | Total | |
| Investments in Securities (a) | | | | | | | | | | | | | | | | |
| Common Stocks | | $ | 1,574,728,449 | | | $ | — | | | $ | — | | | $ | 1,574,728,449 | |
| Short-Term Investments | | | — | | | | 218,549,721 | | | | — | | | | 218,549,721 | |
| | | | | | | | | | | | | | | | |
| Total Investments in Securities | | $ | 1,574,728,449 | | | $ | 218,549,721 | | | $ | — | | | $ | 1,793,278,170 | |
| | | | | | | | | | | | | | | | |
Liability Valuation Inputs
| | | | | | | | | | | | | | | | |
Description | | Quoted
Prices in
Active
Markets for
Identical
Assets (Level 1) | | | Significant
Other
Observable
Inputs (Level 2) | | | Significant
Unobservable
Inputs (Level 3) | | | Total | |
| Other Financial Instruments | | | | | | | | | | | | | | | | |
Futures Contracts (b) | | $ | (1,272,732 | ) | | $ | — | | | $ | — | | | $ | (1,272,732 | ) |
| | | | | | | | | | | | | | | | |
| Total Other Financial Instruments | | $ | (1,272,732 | ) | | $ | — | | | $ | — | | | $ | (1,272,732 | ) |
| | | | | | | | | | | | | | | | |
| (a) | For a complete listing of investments and their industries, see the Portfolio of Investments. |
| (b) | The value listed for these securities reflects unrealized appreciation (depreciation) as shown on the Portfolio of Investments. |
The Portfolio recognizes transfers between the levels as of the beginning of the period.
For the period ended June 30, 2017, the Portfolio did not have any transfers among levels. (See Note 2)
As of June 30, 2017, the Portfolio did not hold any investments with significant unobservable inputs (Level 3). (See Note 2)
| | | | |
| 16 | | MainStay VP S&P 500 Index Portfolio | | The notes to the financial statements are an integral part of,
and should be read in conjunction with, the financial statements. |
Statement of Assets and Liabilities as of June 30, 2017 (Unaudited)
| | | | |
| Assets | |
Investment in securities, at value
(identified cost $831,108,837) | | $ | 1,793,278,170 | |
Cash | | | 62,681 | |
Receivables: | | | | |
Dividends and interest | | | 1,573,409 | |
Fund shares sold | | | 1,033,356 | |
Investment securities sold | | | 518,872 | |
Variation margin on futures contracts | | | 82,393 | |
Other assets | | | 8,858 | |
| | | | |
Total assets | | | 1,796,557,739 | |
| | | | |
| |
| Liabilities | | | | |
Payables: | | | | |
Investment securities purchased | | | 1,000,185 | |
Manager (See Note 3) | | | 353,042 | |
Fund shares redeemed | | | 233,626 | |
NYLIFE Distributors (See Note 3) | | | 156,004 | |
Shareholder communication | | | 147,179 | |
Custodian | | | 32,181 | |
Professional fees | | | 21,311 | |
Trustees | | | 2,658 | |
Accrued expenses | | | 19,733 | |
| | | | |
Total liabilities | | | 1,965,919 | |
| | | | |
Net assets | | $ | 1,794,591,820 | |
| | | | |
| |
| Net Assets Consists of | | | | |
Shares of beneficial interest outstanding (par value of $.001 per share) unlimited number of shares authorized | | $ | 37,430 | |
Additional paid-in capital | | | 767,818,637 | |
| | | | |
| | | 767,856,067 | |
Undistributed net investment income | | | 36,338,140 | |
Accumulated net realized gain (loss) on investments and futures transactions | | | 29,501,012 | |
Net unrealized appreciation (depreciation) on investments and futures contracts | | | 960,896,601 | |
| | | | |
Net assets | | $ | 1,794,591,820 | |
| | | | |
| | | | |
Initial Class | | | | |
Net assets applicable to outstanding shares | | $ | 1,032,384,703 | |
| | | | |
Shares of beneficial interest outstanding | | | 21,468,186 | |
| | | | |
Net asset value per share outstanding | | $ | 48.09 | |
| | | | |
Service Class | | | | |
Net assets applicable to outstanding shares | | $ | 762,207,117 | |
| | | | |
Shares of beneficial interest outstanding | | | 15,961,834 | |
| | | | |
Net asset value per share outstanding | | $ | 47.75 | |
| | | | |
| | | | | | |
The notes to the financial statements are an integral part of,
and should be read in conjunction with, the financial statements. | | | | | 17 | |
Statement of Operations for the six months ended June 30, 2017 (Unaudited)
| | | | |
| Investment Income (Loss) | |
Income | | | | |
Dividends | | $ | 15,193,864 | |
Interest | | | 548,447 | |
| | | | |
Total income | | | 15,742,311 | |
| | | | |
Expenses | | | | |
Manager (See Note 3) | | | 2,014,142 | |
Distribution/Service—Service Class (See Note 3) | | | 864,734 | |
Shareholder communication | | | 115,920 | |
Professional fees | | | 57,215 | |
Trustees | | | 19,821 | |
Custodian | | | 8,459 | |
Miscellaneous | | | 39,026 | |
| | | | |
Total expenses | | | 3,119,317 | |
| | | | |
Net investment income (loss) | | | 12,622,994 | |
| | | | |
|
| Realized and Unrealized Gain (Loss) on Investments and Futures Contracts | |
| |
Net realized gain (loss) on: | | | | |
Investment transactions | | | 3,817,183 | |
Futures transactions | | | 14,685,830 | |
| | | | |
Net realized gain (loss) on investments and futures transactions | | | 18,503,013 | |
| | | | |
Net change in unrealized appreciation (depreciation) on: | | | | |
Investments | | | 112,582,895 | |
Futures contracts | | | (621,226 | ) |
| | | | |
Net change in unrealized appreciation (depreciation) on investments and futures contracts | | | 111,961,669 | |
| | | | |
Net realized and unrealized gain (loss) on investments and futures transactions | | | 130,464,682 | |
| | | | |
Net increase (decrease) in net assets resulting from operations | | $ | 143,087,676 | |
| | | | |
| | | | |
| 18 | | MainStay VP S&P 500 Index Portfolio | | The notes to the financial statements are an integral part of,
and should be read in conjunction with, the financial statements. |
Statements of Changes in Net Assets
for the six months ended June 30, 2017 (Unaudited) and the year ended December 31, 2016
| | | | | | | | |
| | | 2017 | | | 2016 | |
| Increase (Decrease) in Net Assets | |
Operations: | | | | | | | | |
Net investment income (loss) | | $ | 12,622,994 | | | $ | 22,346,018 | |
Net realized gain (loss) on investments and futures transactions | | | 18,503,013 | | | | 31,107,138 | |
Net change in unrealized appreciation (depreciation) on investments and futures contracts | | | 111,961,669 | | | | 96,773,823 | |
| | | | |
Net increase (decrease) in net assets resulting from operations | | | 143,087,676 | | | | 150,226,979 | |
| | | | |
Dividends and distributions to shareholders: | | | | | | | | |
From net investment income: | | | | | | | | |
Initial Class | | | — | | | | (13,902,852 | ) |
Service Class | | | — | | | | (7,713,633 | ) |
| | | | |
| | | — | | | | (21,616,485 | ) |
| | | | |
From net realized gain on investments: | | | | | | | | |
Initial Class | | | — | | | | (25,091,149 | ) |
Service Class | | | — | | | | (15,978,530 | ) |
| | | | |
| | | — | | | | (41,069,679 | ) |
| | | | |
Total dividends and distributions to shareholders | | | — | | | | (62,686,164 | ) |
| | | | |
Capital share transactions: | | | | | | | | |
Net proceeds from sale of shares | | | 237,901,119 | | | | 301,568,454 | |
Net asset value of shares issued to shareholders in reinvestment of dividends and distributions | | | — | | | | 62,686,163 | |
Cost of shares redeemed | | | (99,041,207 | ) | | | (433,810,967 | ) |
| | | | |
Increase (decrease) in net assets derived from capital share transactions | | | 138,859,912 | | | | (69,556,350 | ) |
| | | | |
Net increase (decrease) in net assets | | | 281,947,588 | | | | 17,984,465 | |
|
| Net Assets | |
Beginning of period | | | 1,512,644,232 | | | | 1,494,659,767 | |
| | | | |
End of period | | $ | 1,794,591,820 | | | $ | 1,512,644,232 | |
| | | | |
Undistributed net investment income at end of period | | $ | 36,338,140 | | | $ | 23,715,146 | |
| | | | |
| | | | | | |
The notes to the financial statements are an integral part of,
and should be read in conjunction with, the financial statements. | | | | | 19 | |
Financial Highlights selected per share data and ratios
| | | | | | | | | | | | | | | | | | | | | | | | | | | | |
| | | Six months
ended
June 30, | | | | | | Year ended December 31, | |
| Initial Class | | 2017* | | | | | | 2016 | | | 2015 | | | 2014 | | | 2013 | | | 2012 | |
Net asset value at beginning of period | | $ | 44.05 | | | | | | | $ | 41.29 | | | $ | 41.99 | | | $ | 37.58 | | | $ | 28.93 | | | $ | 25.42 | |
| | | | | | | | | | | | | | | | | | | | | | | | | | | | |
Net investment income (loss) | | | 0.37 | (a) | | | | | | | 0.70 | (a) | | | 0.70 | (a) | | | 0.66 | (a) | | | 0.59 | (a) | | | 0.54 | |
Net realized and unrealized gain (loss) on investments | | | 3.67 | | | | | | | | 4.02 | | | | (0.29 | ) | | | 4.34 | | | | 8.61 | | | | 3.45 | |
| | | | | | | | | | | | | | | | | | | | | | | | | | | | |
Total from investment operations | | | 4.04 | | | | | | | | 4.72 | | | | 0.41 | | | | 5.00 | | | | 9.20 | | | | 3.99 | |
| | | | | | | | | | | | | | | | | | | | | | | | | | | | |
| Less dividends and distributions: | | | | | | | | | | | | | | | | | | | | | | | | | | | | |
From net investment income | | | — | | | | | | | | (0.70 | ) | | | (0.60 | ) | | | (0.59 | ) | | | (0.55 | ) | | | (0.48 | ) |
From net realized gain on investments | | | — | | | | | | | | (1.26 | ) | | | (0.51 | ) | | | — | | | | — | | | | — | |
| | | | | | | | | | | | | | | | | | | | | | | | | | | | |
Total dividends and distributions | | | — | | | | | | | | (1.96 | ) | | | (1.11 | ) | | | (0.59 | ) | | | (0.55 | ) | | | (0.48 | ) |
| | | | | | | | | | | | | | | | | | | | | | | | | | | | |
Net asset value at end of period | | $ | 48.09 | | | | | | | $ | 44.05 | | | $ | 41.29 | | | $ | 41.99 | | | $ | 37.58 | | | $ | 28.93 | |
| | | | | | | | | | | | | | | | | | | | | | | | | | | | |
Total investment return (b) | | | 9.17 | %(c) | | | | | | | 11.62 | % | | | 1.10 | % | | | 13.35 | % | | | 32.01 | % | | | 15.66 | % |
| Ratios (to average net assets)/Supplemental Data: | | | | | | | | | | | | | | | | | | | | | | | | | | | | |
Net investment income (loss) | | | 1.61 | %†† | | | | | | | 1.66 | % | | | 1.67 | % | | | 1.68 | % | | | 1.76 | % | | | 1.93 | % |
Net expenses | | | 0.27 | %†† | | | | | | | 0.28 | % | | | 0.27 | % | | | 0.28 | % | | | 0.28 | % | | | 0.29 | % |
Expenses (before waiver/reimbursement) | | | 0.27 | %†† | | | | | | | 0.28 | % | | | 0.27 | % | | | 0.28 | % | | | 0.30 | % | | | 0.34 | % |
Portfolio turnover rate | | | 2 | % | | | | | | | 3 | % | | | 3 | % | | | 3 | % | | | 8 | % | | | 10 | % |
Net assets at end of period (in 000’s) | | $ | 1,032,385 | | | | | | | $ | 899,633 | | | $ | 1,017,929 | | | $ | 890,188 | | | $ | 853,187 | | | $ | 773,233 | |
| (a) | Per share data based on average shares outstanding during the period. |
| (b) | Total return does not reflect any deduction of sales charges, mortality and expense charges, contract charges or administrative charges. For periods of less than one year, total return is not annualized. |
| (c) | Total investment return may reflect adjustments to conform to generally accepted accounting principles. |
| | | | | | | | | | | | | | | | | | | | | | | | | | | | |
| | | Six months
ended
June 30, | | | | | | Year ended December 31, | |
| Service Class | | 2017* | | | | | | 2016 | | | 2015 | | | 2014 | | | 2013 | | | 2012 | |
Net asset value at beginning of period | | $ | 43.80 | | | | | | | $ | 41.08 | | | $ | 41.79 | | | $ | 37.44 | | | $ | 28.84 | | | $ | 25.34 | |
| | | | | | | | | | | | | | | | | | | | | | | | | | | | |
Net investment income (loss) | | | 0.31 | (a) | | | | | | | 0.59 | (a) | | | 0.60 | (a) | | | 0.56 | (a) | | | 0.51 | (a) | | | 0.47 | |
Net realized and unrealized gain (loss) on investments | | | 3.64 | | | | | | | | 4.00 | | | | (0.28 | ) | | | 4.30 | | | | 8.57 | | | | 3.44 | |
| | | | | | | | | | | | | | | | | | | | | | | | | | | | |
Total from investment operations | | | 3.95 | | | | | | | | 4.59 | | | | 0.32 | | | | 4.86 | | | | 9.08 | | | | 3.91 | |
| | | | | | | | | | | | | | | | | | | | | | | | | | | | |
| Less dividends and distributions: | | | | | | | | | | | | | | | | | | | | | | | | | | | | |
From net investment income | | | — | | | | | | | | (0.61 | ) | | | (0.52 | ) | | | (0.51 | ) | | | (0.48 | ) | | | (0.41 | ) |
From net realized gain on investments | | | — | | | | | | | | (1.26 | ) | | | (0.51 | ) | | | — | | | | — | | | | — | |
| | | | | | | | | | | | | | | | | | | | | | | | | | | | |
Total dividends and distributions | | | — | | | | | | | | (1.87 | ) | | | (1.03 | ) | | | (0.51 | ) | | | (0.48 | ) | | | (0.41 | ) |
| | | | | | | | | | | | | | | | | | | | | | | | | | | | |
Net asset value at end of period | | $ | 47.75 | | | | | | | $ | 43.80 | | | $ | 41.08 | | | $ | 41.79 | | | $ | 37.44 | | | $ | 28.84 | |
| | | | | | | | | | | | | | | | | | | | | | | | | | | | |
Total investment return (b) | | | 9.02 | % | | | | | | | 11.34 | % | | | 0.85 | % | | | 13.06 | % | | | 31.68 | % | | | 15.37 | % |
| Ratios (to average net assets)/Supplemental Data: | | | | | | | | | | | | | | | | | | | | | | | | | | | | |
Net investment income (loss) | | | 1.36 | %†† | | | | | | | 1.41 | % | | | 1.42 | % | | | 1.43 | % | | | 1.52 | % | | | 1.67 | % |
Net expenses | | | 0.52 | %†† | | | | | | | 0.53 | % | | | 0.52 | % | | | 0.53 | % | | | 0.53 | % | | | 0.54 | % |
Expenses (before waiver/reimbursement) | | | 0.52 | %†† | | | | | | | 0.53 | % | | | 0.52 | % | | | 0.53 | % | | | 0.55 | % | | | 0.59 | % |
Portfolio turnover rate | | | 2 | % | | | | | | | 3 | % | | | 3 | % | | | 3 | % | | | 8 | % | | | 10 | % |
Net assets at end of period (in 000’s) | | $ | 762,207 | | | | | | | $ | 613,011 | | | $ | 476,730 | | | $ | 423,009 | | | $ | 343,782 | | | $ | 248,084 | |
| (a) | Per share data based on average shares outstanding during the period. |
| (b) | Total return does not reflect any deduction of sales charges, mortality and expense charges, contract charges or administrative charges. For periods of less than one year, total return is not annualized. |
| | | | |
| 20 | | MainStay VP S&P 500 Index Portfolio | | The notes to the financial statements are an integral part of,
and should be read in conjunction with, the financial statements. |
Notes to Financial Statements (Unaudited)
Note 1–Organization and Business
MainStay VP Funds Trust (the “Fund”) was organized as a Delaware statutory trust on February 1, 2011. The Fund is registered under the Investment Company Act of 1940, as amended (the “1940 Act”), as an open-end management investment company. The Fund is comprised of thirty-two separate series (collectively referred to as the “Portfolios”). These financial statements and notes relate to the MainStay VP S&P 500 Index Portfolio (the “Portfolio”), a “diversified” portfolio, as that term is defined in the 1940 Act, as interpreted or modified by regulatory authorities having jurisdiction, from time to time.
Shares of the Portfolio are currently offered to certain separate accounts to fund variable annuity policies and variable universal life insurance policies issued by New York Life Insurance and Annuity Corporation (“NYLIAC”), a wholly-owned subsidiary of New York Life Insurance Company (“New York Life”). NYLIAC allocates shares of the Portfolios to, among others, NYLIAC Variable Annuity Separate Accounts-I, II, III and IV, VUL Separate Account-I and CSVUL Separate Account-I (collectively, the “Separate Accounts”). Shares of the Portfolio are also offered to the MainStay VP Conservative Allocation Portfolio, MainStay VP Moderate Allocation Portfolio, MainStay VP Moderate Growth Allocation Portfolio and MainStay VP Growth Allocation Portfolio, which operate as “funds-of-funds.”
The Portfolio currently offers two classes of shares. Initial Class shares commenced operations on January 29, 1993. Service Class shares commenced operations on June 5, 2003. Shares of the Portfolio are sold and are redeemed at a price equal to their respective net asset value (“NAV”) per share. No sales or redemption charge is applicable to the purchase or redemption of the Portfolio’s shares. Under the terms of the Fund’s multiple class plan, adopted pursuant to Rule 18f-3 under the 1940 Act, the classes differ in that, among other things, Service Class shares of the Portfolio pay a combined distribution and service fee of 0.25% of average daily net assets attributable to Service Class shares of the Portfolio to the Distributor (as defined in Note 3(b)) pursuant to a plan adopted in accordance with Rule 12b-1 under the 1940 Act. Contract owners of variable annuity contracts purchased after June 2, 2003, are permitted to invest only in the Service Class shares.
The Portfolio’s investment objective is to seek investment results that correspond to the total return performance (reflecting reinvestment of dividends) of common stocks in the aggregate as represented by the S&P 500® Index.
Note 2–Significant Accounting Policies
The Portfolio is an investment company and accordingly follows the investment company accounting and reporting guidance of the Financial Accounting Standards Board (“FASB”) Accounting Standard Codification Topic 946 Financial Services—Investment Companies. The Portfolio prepares its financial statements in accordance with generally accepted accounting principles (“GAAP”) in the United States of America and follows the significant accounting policies described below.
(A) Securities Valuation. Investments are usually valued as of the close of regular trading on the New York Stock Exchange (the “Exchange”) (usually 4:00 p.m. Eastern time) on each day the Portfolio is open for business (“valuation date”).
The Board of Trustees (the “Board”) of the Fund adopted procedures establishing methodologies for the valuation of the Portfolio’s securities
and other assets and delegated the responsibility for valuation determinations under those procedures to the Valuation Committee of the Fund (the “Valuation Committee”). The Board authorized the Valuation Committee to appoint a Valuation Sub-Committee (the “Sub-Committee”) to deal in the first instance with establishing the prices of securities for which market quotations are not readily available or the prices of which are not otherwise readily determinable under these procedures. The Sub-Committee meets (in person, via electronic mail or via teleconference) on an as-needed basis. Subsequently, the Valuation Committee meets to ensure that actions taken by the Sub-Committee were appropriate. The procedures recognize that, subject to the oversight of the Board and unless otherwise noted, the responsibility for the day-to-day valuation of portfolio assets (including fair value measurements for the Portfolio’s assets and liabilities) rests with New York Life Investment Management LLC (“New York Life Investments” or the “Manager”), aided to whatever extent necessary by the Subadvisor (as defined in Note 3(A)) to the Portfolio.
To assess the appropriateness of security valuations, the Manager, the Subadvisor or the Portfolio’s third party service provider, who is subject to oversight by the Manager, regularly compares prior day prices, prices on comparable securities and the sale prices to the prior and current day prices and challenges prices with changes exceeding certain tolerance levels with third party pricing services or broker sources. For those securities valued through either a standardized fair valuation methodology or a fair valuation measurement, the Sub-Committee deals in the first instance with such valuation and the Valuation Committee reviews and affirms, if appropriate, the reasonableness of the valuation based on such methodologies and measurements on a regular basis after considering all relevant information that is reasonably available. Any action taken by the Sub-Committee with respect to the valuation of a portfolio security or other asset is submitted by the Valuation Committee to the Board for its review and ratification, if appropriate, at its next regularly scheduled meeting.
“Fair value” is defined as the price the Portfolio would reasonably expect to receive upon selling an asset or liability in an orderly transaction to an independent buyer in the principal or most advantageous market for the asset or liability. Fair value measurements are determined within a framework that establishes a three-tier hierarchy which maximizes the use of observable market data and minimizes the use of unobservable inputs to establish a classification of fair value measurements for disclosure purposes. “Inputs” refer broadly to the assumptions that market participants would use in pricing the asset or liability, including assumptions about risk, such as the risk inherent in a particular valuation technique used to measure fair value using a pricing model and/or the risk inherent in the inputs for the valuation technique. Inputs may be observable or unobservable. Observable inputs reflect the assumptions market participants would use in pricing the asset or liability based on market data obtained from sources independent of the Portfolio. Unobservable inputs reflect the Portfolio’s own assumptions about the assumptions market participants would use in pricing the asset or liability based on the information available. The inputs or methodology used for valuing assets or liabilities may not be an indication of the risks associated with investing in those assets or liabilities. The three-tier hierarchy of inputs is summarized below.
| • | | Level 1—quoted prices in active markets for an identical asset or liability |
Notes to Financial Statements (Unaudited) (continued)
| • | | Level 2—other significant observable inputs (including quoted prices for a similar asset or liability in active markets, interest rates and yield curves, prepayment speeds, credit risk, etc.) |
| • | | Level 3—significant unobservable inputs (including the Portfolio’s own assumptions about the assumptions that market participants would use in measuring fair value of an asset or liability) |
The level of an asset or liability within the fair value hierarchy is based on the lowest level of an input, both individually and in the aggregate, that is significant to the fair value measurement. As of June 30, 2017, the aggregate value by input level of the Portfolio’s assets and liabilities is included at the end of the Portfolio’s Portfolio of Investments.
The Portfolio may use third party vendor evaluations, whose prices may be derived from one or more of the following standard inputs, among others:
| | |
• Broker/dealer quotes | | • Benchmark securities |
• Two-sided markets | | • Reference data (corporate actions or material event notices) |
• Bids/offers | | • Monthly payment information |
• Industry and economic events | | • Reported trades |
An asset or liability for which market values cannot be measured using the methodologies described above is valued by methods deemed reasonable in good faith by the Valuation Committee, following the procedures established by the Board, to represent fair value. Under these procedures, the Portfolio generally uses a market-based approach which may use related or comparable assets or liabilities, recent transactions, market multiples, book values, and other relevant information. The Portfolio may also use an income-based valuation approach in which the anticipated future cash flows of the asset or liability are discounted to calculate fair value. Discounts may also be applied due to the nature and/or duration of any restrictions on the disposition of the asset or liability. Fair value represents a good faith approximation of the value of a security. Fair value determinations involve the consideration of a number of subjective factors, an analysis of applicable facts and circumstances and the exercise of judgment. As a result, it is possible that the fair value for a security determined in good faith in accordance with the Portfolio’s valuation procedures may differ from valuations for the same security determined by other funds using their own valuation procedures. Although the Portfolio’s valuation procedures are designed to value a security at the price the Portfolio may reasonably expect to receive upon the security’s sale in an orderly transaction, there can be no assurance that any fair value determination thereunder would, in fact, approximate the amount that the Portfolio would actually realize upon the sale of the security or the price at which the security would trade if a reliable market price were readily available. During the six-month period ended June 30, 2017, there were no material changes to the fair value methodologies.
Securities which may be valued in this manner include, but are not limited to: (i) a security for which trading has been halted or suspended; (ii) a debt security that has recently gone into default and for which there is not a current market quotation; (iii) a security of an issuer that has entered into a restructuring; (iv) a security that has been de-listed from a national exchange; (v) a security for which the market price is not readily available from a third party pricing source or, if so provided, does
not, in the opinion of the Manager or Subadvisor, reflect the security’s market value; (vi) a security subject to trading collars for which no or limited trading takes place; and (vii) a security whose principal market has been temporarily closed at a time when, under normal conditions, it would be open. Securities for which market quotations or observable inputs are not readily available are generally categorized as Level 3 in the hierarchy. As of June 30, 2017, there were no securities held by the Portfolio that were fair valued in such a manner.
Equity securities are valued at the last quoted sales prices as of the close of regular trading on the relevant exchange on each valuation date. Securities that are not traded on the valuation date are valued at the mean of the last quoted bid and ask prices. Prices are normally taken from the principal market in which each security trades. Futures contracts are valued at the last posted settlement price on the market where such futures are primarily traded. These securities are generally categorized as Level 1 in the hierarchy.
Temporary cash investments acquired in excess of 60 days to maturity at the time of purchase are valued using the latest bid prices or using valuations based on a matrix system (which considers such factors as security prices, yields, maturities, and ratings), both as furnished by independent pricing services. Other temporary cash investments which mature in 60 days or less at the time of purchase (“Short-Term Investments”) are valued using the amortized cost method of valuation, unless the use of such method would be inappropriate. The amortized cost method involves valuing a security at its cost on the date of purchase and thereafter assuming a constant amortization to maturity of the difference between such cost and the value on maturity date. Amortized cost approximates the current fair value of a security. Securities valued using the amortized cost method are not valued using quoted prices in an active market and are generally categorized as Level 2 in the hierarchy.
The information above is not intended to reflect an exhaustive list of the methodologies that may be used to value portfolio investments. The valuation procedures permit the use of a variety of valuation methodologies in connection with valuing portfolio investments. The methodology used for a specific type of investment may vary based on the market data available or other considerations. The methodologies summarized above may not represent the specific means by which portfolio investments are valued on any particular business day.
A Portfolio security or other asset may be determined to be illiquid under procedures approved by the Board. Illiquidity of a security might prevent the sale of such security at a time when the Manager or Subadvisor might wish to sell, and these securities could have the effect of decreasing the overall level of the Portfolio’s liquidity. Further, the lack of an established secondary market may make it more difficult to value illiquid securities, requiring the Portfolio to rely on judgments that may be somewhat subjective in measuring value, which could vary materially from the amount that the Portfolio could realize upon disposition. Difficulty in selling illiquid securities may result in a loss or may be costly to the Portfolio. Under the supervision of the Board, the Manager or Subadvisor determines the liquidity of the Portfolio’s investments; in doing so, the Manager or Subadvisor may consider various factors, including (i) the frequency of trades and quotations, (ii) the number of dealers and prospective purchasers, (iii) dealer undertakings to make a market, and (iv) the nature of the security and the market in which it
| | |
| 22 | | MainStay VP S&P 500 Index Portfolio |
trades (e.g., the time needed to dispose of the security, the method of soliciting offers and the mechanics of transfer). Illiquid securities are often valued in accordance with methods deemed by the Board in good faith to be reasonable and appropriate to accurately reflect their fair value. The liquidity of the Portfolio’s investments, as shown in the Portfolio of Investments and was determined as of June 30, 2017 and can change at any time in response to, among other relevant factors, market conditions or events or developments with respect to an individual issuer or instrument.
(B) Income Taxes. The Portfolio’s policy is to comply with the requirements of the Internal Revenue Code of 1986, as amended (the “Internal Revenue Code”), applicable to regulated investment companies and to distribute all of its taxable income to the shareholders of the Portfolio within the allowable time limits. Therefore, no federal, state and local income tax provisions are required.
Management evaluates the Portfolio’s tax positions to determine if the tax positions taken meet the minimum recognition threshold in connection with accounting for uncertainties in income tax positions taken or expected to be taken for the purposes of measuring and recognizing tax liabilities in the financial statements. Recognition of tax benefits of an uncertain tax position is permitted only to the extent the position is “more likely than not” to be sustained assuming examination by taxing authorities. Management has analyzed the Portfolio’s tax positions taken on federal, state and local income tax returns for all open tax years (for up to three tax years), and has concluded that no provisions for federal, state and local income tax are required in the Portfolio’s financial statements. The Portfolio’s federal, state and local income and federal excise tax returns for tax years for which the applicable statutes of limitations have not expired are subject to examination by the Internal Revenue Service and state and local departments of revenue.
(C) Dividends and Distributions to Shareholders. Dividends and distributions are recorded on the ex-dividend date. The Portfolio intends to declare and pay dividends from net investment income and distributions from net realized capital and currency gains, if any, at least annually. Unless the shareholder elects otherwise, all dividends and distributions are reinvested in the same class of shares of the Portfolio, at NAV. Dividends and distributions to shareholders are determined in accordance with federal income tax regulations and may differ from GAAP.
(D) Security Transactions and Investment Income. The Portfolio records security transactions on the trade date. Realized gains and losses on security transactions are determined using the identified cost method. Dividend income is recognized on the ex-dividend date; net of any foreign tax withheld at the source, and interest income is accrued as earned using the effective interest rate method. Discounts and premiums on Short-Term Investments are accreted and amortized, respectively, on the straight-line method. The straight-line method approximates the effective interest method for Short-Term Investments.
Investment income and realized and unrealized gains and losses on investments of the Portfolio are allocated pro rata to the separate classes of shares based upon their relative net assets on the date the income is earned or realized and unrealized gains and losses are incurred.
(E) Expenses. Expenses of the Fund are allocated to the individual Portfolios in proportion to the net assets of the respective Portfolios when the expenses are incurred, except where direct allocations of expenses can be made. Expenses (other than fees incurred under the distribution and service plans, further discussed in Note 3(B), which are charged directly to the Service Class shares) are allocated to separate classes of shares pro rata based upon their relative net assets on the date the expenses are incurred. The expenses borne by the Portfolio, including those incurred with related parties to the Portfolio, are shown in the Statement of Operations.
(F) Use of Estimates. In preparing financial statements in conformity with GAAP, management makes estimates and assumptions that affect the reported amounts and disclosures in the financial statements. Actual results could differ from those estimates.
(G) Repurchase Agreements. The Portfolio may enter into repurchase agreements (i.e., buy a security from another party with the agreement that it be sold back in the future) to earn income. The Portfolio may enter into repurchase agreements only with counterparties, usually financial institutions, that are deemed by the Manager or Subadvisor to be creditworthy, pursuant to guidelines established by the Board. During the term of any repurchase agreement, the Manager or Subadvisor will continue to monitor the creditworthiness of the counterparty. Under the 1940 Act, repurchase agreements are considered to be collateralized loans by the Portfolio to the counterparty secured by the securities transferred to the Portfolio.
Repurchase agreements are subject to counterparty risk, meaning the Portfolio could lose money by the counterparty’s failure to perform under the terms of the agreement. The Portfolio mitigates this risk by ensuring the repurchase agreement is collateralized by cash, U.S. government securities, fixed income securities and/or other securities. The collateral is held by the Portfolio’s custodian valued daily on a mark to market basis to determine if the value, including accrued interest, exceeds the repurchase price. In the event of the counterparty’s default on the obligation to repurchase, the Portfolio has the right to liquidate the collateral and apply the proceeds in satisfaction of the obligation. Under certain circumstances, such as in the event of default or bankruptcy by the counterparty, realization and/or retention of the collateral may be limited or subject to delay, to legal proceedings and possible realized loss to the Portfolio.
(H) Futures Contracts. A futures contract is an agreement to purchase or sell a specified quantity of an underlying instrument at a specified future date and price, or to make or receive a cash payment based on the value of a financial instrument (e.g., foreign currency, interest rate, security, or securities index). The Portfolio is subject to risks such as market price risk and/or interest rate risk in the normal course of investing in these transactions. Upon entering into a futures contract, the Portfolio is required to pledge to the broker or futures commission merchant an amount of cash and/or U.S. Government securities equal to a certain percentage of the collateral amount, known as the “initial margin.” During the period the futures contract is open, changes in the value of the contract are recognized as unrealized appreciation or depreciation by marking to market such contract on a daily basis to reflect the market value of the contract at the end of each day’s trading. The Portfolio agrees to receive from or pay to the broker or futures commission merchant an amount of cash equal to the daily
Notes to Financial Statements (Unaudited) (continued)
fluctuation in the value of the contract. Such receipts or payments are known as “variation margin.” When the futures contract is closed, the Portfolio records a realized gain or loss equal to the difference between the proceeds from (or cost of) the closing transaction and the Portfolio’s basis in the contract.
The use of futures contracts involves, to varying degrees, elements of market risk in excess of the amount recognized in the Statement of Assets and Liabilities. The contract or notional amounts and variation margin reflect the extent of the Portfolio’s involvement in open futures positions. There are several risks associated with the use of futures contracts as hedging techniques. There can be no assurance that a liquid market will exist at the time when the Portfolio seeks to close out a futures contract. If no liquid market exists, the Portfolio would remain obligated to meet margin requirements until the position is closed. Futures may involve a small initial investment relative to the risk assumed, which could result in losses greater than if they had not been used. Futures may be more volatile than direct investments in the instrument underlying the futures, and may not correlate to the underlying instrument, causing a given hedge not to achieve its objectives. The Portfolio’s activities in futures contracts have minimal counterparty risk as they are conducted through regulated exchanges that guarantee the futures against default by the counterparty. In the event of a bankruptcy or insolvency of a futures commission merchant that holds margin on behalf of the Portfolio, the Portfolio may not be entitled to the return of the entire margin owed to the Portfolio, potentially resulting in a loss. The Portfolio’s investment in futures contracts and other derivatives may increase the volatility of the Portfolio’s NAV and may result in a loss to the Portfolio. As of June 30, 2017, all open futures contracts are shown in the Portfolio of Investments.
(I) Securities Lending. In order to realize additional income, the Portfolio may engage in securities lending, subject to the limitations set forth in the 1940 Act and relevant guidance by the staff of the Securities and Exchange Commission (“SEC”). In the event the Portfolio does engage in securities lending, the Portfolio will lend through its custodian, State Street Bank and Trust Company (“State Street”). State Street will manage the Portfolio’s collateral in accordance with the lending agreement between the Portfolio and State Street, and indemnify the Portfolio against counterparty risk. The loans will be collateralized by U.S. Treasury securities at least equal at all times to the market value of the securities loaned. The Portfolio may bear the risk of delay in recovery of, or loss of rights in, the securities loaned should the borrower of the securities experience financial difficulty. The Portfolio may also record a realized gain or loss on securities deemed sold due to a borrower’s inability to return securities on loan. The Portfolio bears the risk of any loss on investment of the collateral. The Portfolio will receive compensation for lending its securities in the form of fees or it will retain a portion of interest on the investment of any cash received as collateral. The Portfolio will also continue to receive interest and dividends on the securities loaned and any gain or loss in the market price of the securities loaned that may occur during the term of the loan will be for the account of the Portfolio. During the six-month period ended June 30, 2017, the Portfolio did not have any portfolio securities on loan.
(J) Indemnifications. Under the Fund’s organizational documents, its officers and trustees are indemnified against certain liabilities that
may arise out of performance of their duties to the Fund. Additionally, in the normal course of business, the Portfolio enters into contracts with third-party service providers that contain a variety of representations and warranties and which may provide general indemnifications. The Portfolio’s maximum exposure under these arrangements is unknown, as this would involve future claims that may be made against the Portfolio that have not yet occurred. Based on experience, management is of the view that the risk of loss in connection with these potential indemnification obligations is remote. However, there can be no assurance that material liabilities related to such obligations will not arise in the future, which could adversely impact the Portfolio.
(K) Quantitative Disclosure of Derivative Holdings. The following tables show additional disclosures related to the Portfolio’s derivative and hedging activities, including how such activities are accounted for and their effect on the Portfolio’s financial positions, performance and cash flows. The Portfolio entered into futures contracts to help manage the duration and yield curve of the portfolio while minimizing the exposure to wider bid/ask spreads in traditional bonds. These derivatives are not accounted for as hedging instruments.
Fair value of derivative instruments as of June 30, 2017:
Liability Derivatives
| | | | | | | | | | |
| | | Statement of
Assets and
Liabilities | | Equity
Contracts
Risk | | | Total | |
Futures Contracts | | Net Assets—Net unrealized appreciation (depreciation) on investments and future contracts (a) | | $ | (1,272,732 | ) | | $ | (1,272,732 | ) |
| | | | | | |
Total Fair Value | | | | $ | (1,272,732 | ) | | $ | (1,272,732 | ) |
| | | | | | |
| (a) | Includes cumulative appreciation (depreciation) of futures contracts as reported in the Portfolio of Investments. Only current day’s variation margin is reported within the Statement of Assets and Liabilities. |
The effect of derivative instruments on the Statement of Operations for the period ended June 30, 2017:
Realized Gain (Loss)
| | | | | | | | | | |
| | | Statement of
Operations
Location | | Equity
Contracts
Risk | | | Total | |
Futures Contracts | | Net realized gain (loss) on futures transactions | | $ | 14,685,830 | | | $ | 14,685,830 | |
| | | | | | |
Total Realized Gain (Loss) | | | | $ | 14,685,830 | | | $ | 14,685,830 | |
| | | | | | |
| | |
| 24 | | MainStay VP S&P 500 Index Portfolio |
Change in Unrealized Appreciation (Depreciation)
| | | | | | | | | | |
| | | Statement of
Operations
Location | | Equity
Contracts
Risk | | | Total | |
Futures Contracts | | Net change in unrealized appreciation (depreciation) on futures transactions | | $ | (621,226 | ) | | $ | (621,226 | ) |
| | | | | | |
Total Change in Unrealized Appreciation (Depreciation) | | | | $ | (621,226 | ) | | $ | (621,226 | ) |
| | | | | | |
Average Notional Amount
| | | | | | | | |
| | | Equity
Contracts
Risk | | | Total | |
Futures Contracts Long | | $ | 187,908,938 | | | $ | 187,908,938 | |
| | | | |
Note 3–Fees and Related Party Transactions
(A) Manager and Subadvisor. New York Life Investments, a registered investment adviser and an indirect, wholly-owned subsidiary of New York Life, serves as the Portfolio’s Manager, pursuant to an Amended and Restated Management Agreement (“Management Agreement”). The Manager provides offices, conducts clerical, recordkeeping and bookkeeping services, and keeps most of the financial and accounting records required to be maintained by the Portfolio. Except for the portion of salaries and expenses that are the responsibility of the Portfolio, the Manager pays the salaries and expenses of all personnel affiliated with the Portfolio and certain operational expenses of the Portfolio. The Portfolio reimburses New York Life Investments in an amount equal to a portion of the compensation of the Chief Compliance Officer attributable to the Portfolio. Cornerstone Capital Management Holdings (“Cornerstone Holdings” or “Subadvisor”), a registered investment adviser, serves as Subadvisor to the Portfolio and is responsible for the day-to-day portfolio management of the Portfolio. Pursuant to the terms of a Subadvisory Agreement (“Subadvisory Agreement”) between New York Life Investments and Cornerstone Holdings, New York Life Investments pays for the services of the Subadvisor.
The Fund, on behalf of the Portfolio, pays New York Life Investments in its capacity as the Portfolio’s investment manager and administrator, pursuant to the Management Agreement, a monthly fee for the services performed and the facilities furnished at an annual percentage of the average daily net assets as follows: 0.25 up to $1 billion; 0.225% from $1 billion to $2 billion; 0.215% from $2 billion to $3 billion; and 0.20% in excess of $3 billion. During the six-month period ended June 30, 2017, the effective management fee rate was 0.24%.
During the six-month period ended June 30, 2017, New York Life Investments earned fees from the Portfolio in the amount of $2,014,142.
State Street provides sub-administration and sub-accounting services to the Portfolio pursuant to an agreement with New York Life Investments. These services include calculating the daily NAVs of the Portfolio,
maintaining the general ledger and sub-ledger accounts for the calculation of the Portfolio’s NAVs, and assisting New York Life Investments in conducting various aspects of the Portfolio’s administrative operations. For providing these services to the Portfolio, State Street is compensated by New York Life Investments.
(B) Distribution and Service Fees. The Fund, on behalf of the Portfolio, has entered into a distribution agreement with NYLIFE Distributors LLC (the “Distributor”), an indirect, wholly-owned subsidiary of New York Life. The Portfolio has adopted a distribution plan (the “Plan”) in accordance with the provisions of Rule 12b-1 under the 1940 Act. Under the Plan, the Distributor has agreed to provide, through its affiliates or independent third parties, various distribution-related, shareholder and administrative support services to the Service Class shareholders. For its services, the Distributor is entitled to a combined distribution and service fee accrued daily and paid monthly at an annual rate of 0.25% of the average daily net assets attributable to the Service Class shares of the Portfolio.
Note 4–Federal Income Tax
During the year ended December 31, 2016, the tax character of distributions paid as reflected in the Statements of Changes in Net Assets was as follows:
| | |
| 2016 |
Tax-Based
Distributions
from Ordinary
Income | | Tax-Based
Distributions
from Long-Term
Gains |
| $24,647,392 | | $38,038,772 |
Note 5–Custodian
State Street is the custodian of cash and securities held by the Portfolio. Custodial fees are charged to the Portfolio based on the Portfolio’s net assets and/or the market value of securities held by the Portfolio and the number of certain transactions incurred by the Portfolio.
Note 6–Line of Credit
The Portfolio and certain other funds managed by New York Life Investments, maintain a line of credit with a syndicate of banks in order to secure a source of funds for temporary purposes to meet unanticipated or excessive redemption requests.
Effective August 1, 2017, under the credit agreement (the “Credit Agreement”), the aggregate commitment amount is $600,000,000 with an additional uncommitted amount of $100,000,000. The commitment fee is an annual rate of 0.15% of the average commitment amount payable quarterly, regardless of usage, to State Street, who serves as the agent to the syndicate. The commitment fee is allocated among the Portfolio and certain other funds managed by New York Life Investments based upon their respective net assets and other factors. Interest on any revolving credit loan is charged based upon the Federal Funds Rate or the one month LIBOR, whichever is higher. The Credit Agreement expires on July 31, 2018, although the Portfolio, certain other funds managed by New York Life Investments and the syndicate of banks may renew the Credit Agreement for an additional year on the same or
Notes to Financial Statements (Unaudited) (continued)
different terms. Prior to August 1, 2017, the aggregate commitment amount was $600,000,000 with an additional uncommitted amount of $100,000,000, and the commitment fee, under a credit agreement for which Bank of New York Mellon served as agent, was at an annual rate of 0.15% of the average commitment amount. During the six-month period ended June 30, 2017, there were no borrowings made or outstanding with respect to the Portfolio under the credit agreement for which Bank of New York Mellon served as agent.
Note 7–Interfund Lending Program
Pursuant to an exemptive order issued by the SEC, the Portfolio, along with certain other funds managed by New York Life Investments, may participate in an interfund lending program. The interfund lending program provides an alternative credit facility that permits the Portfolio and certain other funds managed by New York Life Investments to lend or borrow money for temporary purposes directly to or from one another, subject to the conditions of the exemptive order. During the six-month period ended June 30, 2017, there were no interfund loans made or outstanding with respect to the Portfolio.
Note 8–Purchases and Sales of Securities (in 000’s)
During the six-month period ended June 30, 2017, purchases and sales of securities, other than short-term securities and securities subject to repurchase transactions, were $115,644 and $25,963, respectively.
Note 9–Capital Share Transactions
Transactions in capital shares for the six-month period ended June 30, 2017, and the year ended December 31, 2016, were as follows:
| | | | | | | | |
Initial Class | | Shares | | | Amount | |
Six-month period ended June 30, 2017: | | | | | | | | |
Shares sold | | | 2,368,513 | | | $ | 109,634,191 | |
Shares redeemed | | | (1,321,417 | ) | | | (61,699,785 | ) |
| | | | |
Net increase (decrease) | | | 1,047,096 | | | $ | 47,934,406 | |
| | | | |
Year ended December 31, 2016: | | | | | | | | |
Shares sold | | | 3,752,930 | | | $ | 159,121,032 | |
Shares issued to shareholders in reinvestment of dividends and distributions | | | 920,911 | | | | 38,994,001 | |
Shares redeemed | | | (8,902,980 | ) | | | (369,138,236 | ) |
| | | | |
Net increase (decrease) | | | (4,229,139 | ) | | $ | (171,023,203 | ) |
| | | | |
| | |
| | | | | | | | |
Service Class | | Shares | | | Amount | |
Six-month period ended June 30, 2017: | | | | | | | | |
Shares sold | | | 2,772,456 | | | $ | 128,266,928 | |
Shares redeemed | | | (806,479 | ) | | | (37,341,422 | ) |
| | | | |
Net increase (decrease) | | | 1,965,977 | | | $ | 90,925,506 | |
| | | | |
Year ended December 31, 2016: | | | | | | | | |
Shares sold | | | 3,373,427 | | | $ | 142,447,422 | |
Shares issued to shareholders in reinvestment of dividends and distributions | | | 562,456 | | | | 23,692,162 | |
Shares redeemed | | | (1,543,767 | ) | | | (64,672,731 | ) |
| | | | |
Net increase (decrease) | | | 2,392,116 | | | $ | 101,466,853 | |
| | | | |
Note 10–Litigation
The Portfolio has been named as a defendant in the case entitled Kirschner v. FitzSimons, No. 12-2652 (S.D.N.Y.) (the “FitzSimons action”) as a result of its ownership of shares in the Tribune Company (“Tribune”) in 2007 when Tribune effected a leveraged buyout transaction (“LBO”) by which Tribune converted to a privately-held company. In its complaint, the plaintiff asserts claims against certain insiders, major shareholders, professional advisers, and others involved in the LBO. Separately, the complaint also seeks to obtain from former Tribune shareholders, including the Portfolios, any proceeds they received in connection with the LBO. The sole claim and cause of action brought against the Portfolios is for fraudulent conveyance pursuant to United States Bankruptcy Code Section 548(a)(1)(A).
In June 2011, certain Tribune creditors filed numerous additional actions asserting state law constructive fraudulent conveyance claims (the “SLCFC actions”) against specifically-named former Tribune shareholders and, in some cases, putative defendant classes comprised of former Tribune shareholders. One of the SLCFC actions, entitled Deutsche Bank Trust Co. Americas v. Blackrock Institutional Trust Co., No. 11-9319 (S.D.N.Y.) (the “Deutsche Bank action”), named the Portfolio as a defendant.
The FitzSimons action and Deutsche Bank action have been consolidated with the majority of the other Tribune LBO related lawsuits in a multidistrict litigation proceeding entitled In re Tribune Co. Fraudulent Conveyance Litig., No. 11-md-2296 (S.D.N.Y.) (the “MDL Proceeding”).
On September 23, 2013, the District Court granted the defendants’ motion to dismiss the SLCFC actions, including the Deutsche Bank action, on the basis that the plaintiffs did not have standing to pursue their claims. On September 30, 2013, the plaintiffs in the SLCFC actions filed a notice of appeal to the United States Court of Appeals for the Second Circuit. On October 28, 2013, the defendants filed a joint notice of cross-appeal of that same order. On March 29, 2016, the United States Court of Appeals for the Second Circuit issued its opinion on the appeal of the SLCFC actions. The appeals court affirmed the district court’s dismissal of those lawsuits, but on different grounds than the district court. The appeals court held that while the plaintiffs have standing under the U.S. Bankruptcy Code, their claims were preempted by Section 546(e) of the Bankruptcy Code-the statutory safe harbor for settlement payments. On April 12, 2016 the Plaintiffs in the SLCFC actions filed a petition seeking rehearing en banc before the appeals court. On July 22, 2016, the appeals court denied the petition. On September 9, 2016, the plaintiffs filed a petition for writ of certiorari in the U.S. Supreme Court challenging the Second Circuit’s decision that the safe harbor of Section 546(e) applied to their claims. Certain shareholder defendants filed a joint brief in opposition to the petition for certiorari on October 24, 2016. The plaintiffs filed a reply in support of the petition on November 4, 2016. The Supreme Court has not yet granted or denied the petition for certiorari.
On August 2, 2013, the plaintiff in the FitzSimons action filed a Fifth Amended Complaint. On May 23, 2014, the defendants filed motions to dismiss the FitzSimons action, including a global motion to dismiss Count I, which is the claim brought against former Tribune shareholders, for intentional fraudulent conveyance under U.S. federal law.
| | |
| 26 | | MainStay VP S&P 500 Index Portfolio |
On January 6, 2017, the United States District Court for the Southern District of New York granted the shareholder defendants’ motion to dismiss the intentional fraudulent conveyance claim in the FitzSimons action. The Court concluded that the plaintiff had failed to allege that Tribune entered the LBO with actual intent to hinder, delay, or defraud its creditors, and therefore the complaint failed to state a claim. In dismissing the intentional fraudulent conveyance claim, the Court denied the plaintiff’s request to amend the complaint. While the District Court’s order granting the motion to dismiss is not immediately appealable, the plaintiff has asked the Court to direct entry of a final judgment in order to make the order immediately appealable. On February 23, 2017, the Court issued an order stating that it intends to permit an interlocutory appeal of the dismissal order, but will wait to do so until it has resolved outstanding motions to dismiss filed by other defendants. Accordingly, the timing of the appeal is uncertain. The value of the proceeds received by the Portfolios in connection with the LBO and the Portfolio’s cost basis in shares of Tribune was as follows:
| | | | | | | | |
Portfolio | | Proceeds | | | Cost Basis | |
MainStay VP Common Stock Portfolio | | $ | 751,774 | | | $ | 729,369 | |
At this stage of the proceedings, it would be difficult to assess with any reasonable certainty the probable outcome of the pending litigation or the effect, if any, on the Portfolio’s net asset value.
Note 11–Recent Accounting Pronouncement
In October 2016, the SEC adopted new rules and amended existing rules (together, “final rules”) intended to modernize the reporting and disclosure of information by registered investment companies. In part,
the final rules amend Regulation S-X and require standardized, enhanced disclosure about derivatives in investment company financial statements, as well as other amendments. The compliance date for the amendments to Regulation S-X is August 1, 2017 and applies to shareholder reports for funds with fiscal periods ending after August 1, 2017. Management is currently evaluating the impact that the adoption of the amendments to Regulation S-X will have on the Portfolio’s financial statements and related disclosures.
Note 12–Subsequent Events
In connection with the preparation of the financial statements of the Portfolio as of and for the six-month period ended June 30, 2017, events and transactions subsequent to June 30, 2017, through the date the financial statements were issued have been evaluated by the Portfolio’s management for possible adjustment and/or disclosure. No subsequent events requiring financial statement adjustment or disclosure have been identified, other than the following: Effective August 4, 2017, the management fee the Fund pays New York Life Investments on behalf of the Portfolio is as follows: 0.16% on assets up to $2.5 billion and 0.15% on assets over $2.5 billion. As of the same date, New York Life Investments has contractually agreed to waive fees and/or reimburse expenses so that Total Annual Portfolio Operating Expenses (excluding taxes, interest, litigation, extraordinary expenses, brokerage and other transaction expenses related to the purchase or sale of portfolio investments, and acquired (underlying) portfolio/fund fees and expenses) of the Portfolio’s Initial Class shares do not exceed 0.16% of average daily net assets, with an equivalent waiver or reimbursement applied to Service Class shares. For more information on these changes, please see the Prospectus supplement dated August 4, 2017.
Proxy Voting Policies and Procedures and Proxy Voting Record
A description of the policies and procedures that New York Life Investments uses to vote proxies related to the Portfolio’s securities is available without charge, upon request, (i) by calling 800-598-2019 or (ii) by visiting the SEC’s website at www.sec.gov.
The Portfolio is required to file with the SEC its proxy voting record for the 12-month period ending June 30 on Form N-PX. The Portfolio’s most recent Form N-PX or proxy voting record is available free of charge upon request (i) by calling 800-598-2019 or; (ii) by visiting the SEC’s website at www.sec.gov.
Shareholder Reports and Quarterly Portfolio Disclosure
The Portfolio is required to file its complete schedule of portfolio holdings with the SEC for its first and third fiscal quarters on Form N-Q. The Portfolio’s Form N-Q is available without charge on the SEC’s website at www.sec.gov or by calling MainStay Investments at 800-598-2019. You also can obtain and review copies of Form N-Q by visiting the SEC’s Public Reference Room in Washington, DC (information on the operation of the Public Reference Room may be obtained by calling 1-800-SEC-0330).
| | |
| 28 | | MainStay VP S&P 500 Index Portfolio |
This page intentionally left blank
This page intentionally left blank
MainStay VP Portfolios
MainStay VP offers a wide range of Portfolios. The full array of MainStay VP offerings is listed here, with information about the manager, subadvisors, legal counsel, and independent registered public accounting firm.
Equity Portfolios
MainStay VP Common Stock Portfolio
MainStay VP Cornerstone Growth Portfolio
MainStay VP Eagle Small Cap Growth Portfolio
MainStay VP Emerging Markets Equity Portfolio
MainStay VP Epoch U.S. Equity Yield Portfolio
MainStay VP Epoch U.S. Small Cap Portfolio
MainStay VP International Equity Portfolio
MainStay VP Large Cap Growth Portfolio
MainStay VP MFS® Utilities Portfolio
MainStay VP Mid Cap Core Portfolio
MainStay VP S&P 500 Index Portfolio
MainStay VP Small Cap Core Portfolio
MainStay VP T. Rowe Price Equity Income Portfolio
MainStay VP VanEck Global Hard Assets Portfolio
Mixed Asset Portfolios
MainStay VP Balanced Portfolio
MainStay VP Convertible Portfolio
MainStay VP Cushing Renaissance Advantage Portfolio
MainStay VP Income Builder Portfolio
MainStay VP Janus Henderson Balanced Portfolio
Income Portfolios
MainStay VP Bond Portfolio
MainStay VP Floating Rate Portfolio
MainStay VP Government Portfolio
MainStay VP High Yield Corporate Bond Portfolio
MainStay VP Indexed Bond Portfolio
MainStay VP PIMCO Real Return Portfolio
MainStay VP Unconstrained Bond Portfolio
Money Market
MainStay VP U.S. Government Money Market Portfolio
Alternative
MainStay VP Absolute Return Multi-Strategy Portfolio
Asset Allocation Portfolios
MainStay VP Conservative Allocation Portfolio
MainStay VP Growth Allocation Portfolio
MainStay VP Moderate Allocation Portfolio
MainStay VP Moderate Growth Allocation Portfolio
Manager
New York Life Investment Management LLC
New York, New York
Subadvisors
Candriam Belgium*
Brussels, Belgium
Candriam France S.A.S.*
Paris, France
Cornerstone Capital Management Holdings LLC*
New York, New York
Cushing Asset Management, LP
Dallas, Texas
Eagle Asset Management, Inc.
St Petersburg, Florida
Epoch Investment Partners, Inc.
New York, New York
Janus Capital Management LLC
Denver, Colorado
MacKay Shields LLC*
New York, New York
Massachusetts Financial Services Company
Boston, Massachusetts
NYL Investors LLC*
New York, New York
Pacific Investment Management Company LLC
Newport Beach, California
T. Rowe Price Associates, Inc.
Baltimore, Maryland
Van Eck Associates Corporation
New York, New York
Winslow Capital Management, LLC
Minneapolis, Minnesota
Distributor
NYLIFE Distributors LLC*
Jersey City, New Jersey
Custodian
State Street Bank and Trust Company
Boston, Massachusetts
Independent Registered Public Accounting Firm
PricewaterhouseCoopers LLP
New York, New York
Legal Counsel
Dechert LLP
Washington, District of Columbia
Some Portfolios may not be available in all products.
* An affiliate of New York Life Investment Management LLC
Not part of the Semiannual Report
2017 Semiannual Report
This report is for the general information of New York Life Variable Annuities and NYLIAC Variable Universal Life Insurance Products policyowners. It must be preceded or accompanied by the appropriate product(s) and funds prospectuses if it is given to anyone who is not an owner of a New York Life variable annuity policy or a NYLIAC Variable Universal Life Insurance Product. This report does not offer for sale or solicit orders to purchase securities.
The performance data quoted in this report represents past performance. Past performance is no guarantee of future results. Due to market volatility and other factors, current performance may be lower or higher than the figures shown. The most recent month-end performance summary for your variable annuity or variable life policy is available by calling 800-598-2019 and is updated periodically on www.newyorklife.com.
The New York Life Variable Annuities and NYLIAC Variable Universal Life Insurance Products are issued by New York Life Insurance and Annuity Corporation (a Delaware Corporation) and distributed by NYLIFE Distributors LLC (Member FINRA/SIPC).
New York Life Insurance Company
New York Life Insurance and Annuity Corporation (NYLIAC) (A Delaware Corporation)
51 Madison Avenue, Room 551
New York, NY 10010
www.newyorklife.com
Printed on recycled paper
mainstayinvestments.com
NYLIFE Distributors LLC, 30 Hudson Street, Jersey City, NJ 07302
New York Life Investment Management LLC is the investment manager to the MainStay VP Funds Trust
©2017 by NYLIFE Distributors LLC. All rights reserved.
You may obtain copies of the Prospectus and the Statement of Additional Information free of charge, upon request, by calling toll-free 800-598-2019 or writing to New York Life Insurance and Annuity Corporation, 51 Madison Avenue, New York, NY 10010.
| | | | |
| Not FDIC Insured | | No Bank Guarantee | | May Lose Value |
| | | | |
1743150 | | | | MSVPSP10-08/17 (NYLIAC) NI529 |
MainStay VP Income Builder Portfolio
Message from the President and Semiannual Report
Unaudited | June 30, 2017

Sign up for electronic delivery of your shareholder reports. For full details on electronic delivery, including who can participate and what you
can receive via eDelivery, please log on to www.newyorklife.com/vsc

This page intentionally left blank
Message from the President
The six months ended June 30, 2017, brought positive results to many stock and bond investors. The year began with many investors hoping that Republican control of the White House, the Senate and the House of Representatives could bring an end to political gridlock; and while debate has continued on a number of issues, the U.S. stock market climbed relatively steadily throughout the first half of 2017.
According to FTSE-Russell U.S. market data, stocks at all capitalization levels tended to record positive total returns during the reporting period, with large-cap stocks generally outperforming stocks of smaller-capitalization companies. Growth stocks outpaced value stocks at every capitalization level by substantial margins—from more than six percentage points for micro-caps and mid-caps to more than 10 percentage points for the largest 200 U.S. companies by market capitalization.
Most sectors of the stock market advanced during the reporting period, with energy and telecommunication services being notable exceptions. Energy stocks declined as oil prices fell despite moves by the Organization of Petroleum Exporting Countries (OPEC) intended to limit oil production by its members. Telecommunication services stocks tended to decline as competition increased and rising interest rates made dividend payouts less appealing.
In March and June of 2017, the Federal Reserve announced successive increases in the target range for the federal funds rate, ultimately bringing the federal funds target range to 1.00% to 1.25%. While short-term U.S. Treasury yields rose in response, yields for U.S. Treasury securities with maturities of five years or longer declined. As the difference between short- and long-term yields narrowed, the advantages of higher-yielding long-term bonds became increasingly apparent.
Virtually all taxable and tax-exempt bond sectors provided positive total returns during the reporting period. Mortgage-backed
securities, though providing positive total returns, faced headwinds when the Federal Reserve announced plans to begin normalizing its balance sheet by reducing reinvestment of principal payments on mortgage-backed securities.
International stock and bond markets were also strong during the reporting period. International stocks provided double-digit total returns that were surpassed by emerging-market stocks as a whole. Global investment-grade bonds provided single-digit returns; and emerging-market debt was somewhat stronger.
Even during periods of favorable market performance and generally positive returns, MainStay believes that it is important to carefully monitor your investments. Your risk tolerance may
change over time, leading you to reevaluate which MainStay VP Portfolios are most appropriate for your long-term goals. Your goals themselves may also change, leading you to pursue investments with more or less risk. The portfolio managers of MainStay VP Portfolios seek to provide results consistent with the investment objectives of their respective Portfolios, to give you a wide range of choices suitable to various investment needs.
The report that follows provides more detailed information about the specific markets, securities and investment decisions that influenced your MainStay VP Portfolio during the six months ended June 30, 2017. We invite you to review the report carefully as part of your ongoing investment evaluation and review.
Sincerely,

Stephen P. Fisher
President
The opinions expressed are as of the date of the accompanying report and are subject to change. Past performance is no guarantee of future results. There is no guarantee that any forecasts made will come to pass. This material does not constitute investment advice and is not intended as an endorsement of any specific investment.
Not all MainStay VP Portfolios and/or share classes are available under all policies.
Not part of the Semiannual Report
Table of Contents
Investors should refer to the Portfolio’s Summary Prospectus and/or Prospectus and consider the Portfolio’s investment objectives, strategies, risks, charges and expenses carefully before investing. The Summary Prospectus and/or Prospectus contain this and other information about the Portfolio. You may obtain copies of the Portfolio’s Summary Prospectus and/or the Prospectus and the Statement of Additional Information free of charge, upon request, by calling toll-free 800-598-2019, by writing to New York Life Insurance and Annuity Corporation, 51 Madison Avenue, Room 251, New York, New York 10010 or by sending an email to MainStayShareholdersServices@nylim.com. These documents are also available at mainstayinvestments.com/vpdocuments. Please read the Summary Prospectus and/or Prospectus carefully before investing. MainStay VP Funds Trust portfolios are separate account options which are purchased through a variable insurance or variable annuity contract.
Investment and Performance Comparison (Unaudited)
Performance data quoted represents past performance. Past performance is no guarantee of future results. Because of market volatility and other factors, current performance may be lower or higher than the figures shown. Investment return and principal value will fluctuate, and as a result, when shares are redeemed, they may be worth more or less than their original cost. The performance table and graph do not reflect any deduction of sales charges, mortality and expense charges, contract charges or administrative charges. Please refer to the Performance Summary appropriate for your policy. For performance information current to the most recent month-end, please call 800-598-2019 or visit www.newyorklife.com.
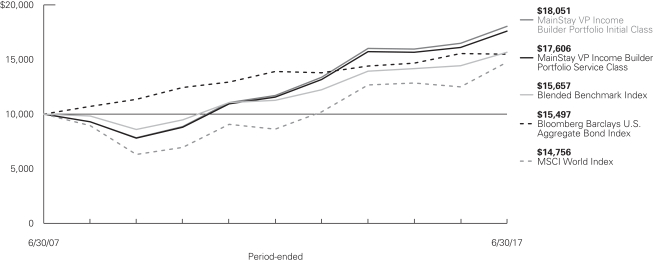
Average Annual Total Returns for the Period Ended June 30, 2017
| | | | | | | | | | | | | | | | | | | | | | |
| Class | | Inception
Date | | | Six Months | | | One Year | | Five Years | | | Ten Years | | | Gross
Expense
Ratio1 | |
| Initial Class Shares | | | 1/29/1993 | | | | 6.82 | % | | 9.54% | | | 9.07 | % | | | 6.08 | % | | | 0.63 | % |
| Service Class Shares | | | 6/4/2003 | | | | 6.69 | | | 9.27 | | | 8.79 | | | | 5.82 | | | | 0.88 | |
| | | | | | | | | | | | | | | | |
| Benchmark Performance | | Six
Months | | | One
Year | | | Five
Years | | | Ten
Years | |
MSCI World Index2 | | | 10.66 | % | | | 18.20 | % | | | 11.38 | % | | | 3.97 | % |
| Bloomberg Barclays U.S. Aggregate Bond Index3 | | | 2.27 | | | | –0.31 | | | | 2.21 | | | | 4.48 | |
Blended Benchmark Index4 | | | 6.40 | | | | 8.61 | | | | 6.84 | | | | 4.59 | |
Average Lipper Variable Products Mixed-Asset Target Allocation Growth Portfolio5 | | | 7.70 | | | | 12.52 | | | | 9.01 | | | | 5.17 | |
| 1. | The gross expense ratios presented reflect the Portfolio’s “Total Annual Portfolio Operating Expenses” from the most recent Prospectus and may differ from other expense ratios disclosed in this report. |
| 2. | The MSCI World Index is the Portfolio’s primary broad-based securities market index for comparison purposes. MSCI World Index is a free float-adjusted market-capitalization-weighted index that is designed to measure the equity market performance of developed markets. Results assume reinvestment of all dividends and capital gains. An investment cannot be made directly in an index. |
| 3. | The Portfolio has selected the Bloomberg Barclays U.S. Aggregate Bond Index as a secondary benchmark. Bloomberg Barclays U.S. Aggregate Bond Index is a broad-based benchmark that measures performance of the investment-grade, U.S. dollar denominated, fixed-rate taxable bond market, including Treasurys, government-related and corporate securities, mortgage-backed securities (agency fixed-rate and hybrid adjustable-rate mortgage pass-throughs), asset-backed securities and commercial |
| | mortgage-backed securities. Results assume reinvestment of all dividends and capital gains. An investment cannot be made directly in an index. |
| 4. | The Portfolio has selected the Blended Benchmark Index as an additional benchmark. The Blended Benchmark Index consists of the MSCI World Index and the Bloomberg Barclays U.S. Aggregate Bond Index, each weighted 50%. Results assume reinvestment of all dividends and capital gains. An investment cannot be made directly in an index. |
| 5. | The Average Lipper Variable Products Mixed-Asset Target Allocation Growth Portfolio is representative of portfolios that, by portfolio practice, maintain a mix of between 60%-80% equity securities, with the remainder invested in bonds, cash, and cash equivalents. This benchmark is a product of Lipper Inc. Lipper Inc. is an independent monitor of fund performance. Results are based on average total returns of similar portfolios with all dividends and capital gain distributions reinvested. |
Cost in Dollars of a $1,000 Investment in MainStay VP Income Builder Portfolio (Unaudited)
The example below is intended to describe the fees and expenses borne by shareholders during the six-month period from January 1, 2017 to June 30, 2017, and the impact of those costs on your investment.
Example
As a shareholder of the Portfolio, you incur two types of costs: (1) transaction costs, including exchange fees and sales charges (loads) on purchases (as applicable), and (2) ongoing costs, including management fees, distribution and/or service (12b-1) fees, and other Portfolio expenses (as applicable). This example is intended to help you understand your ongoing costs (in dollars) of investing in the Portfolio and to compare these costs with the ongoing costs of investing in other mutual funds. The example is based on an investment of $1,000 made at the beginning of the six-month period and held for the entire period from January 1, 2017 to June 30, 2017. Shares are only sold in connection with variable life and annuity contracts and the example does not reflect any contract level or transactional fees or expenses. If these costs had been included, your costs would have been higher.
This example illustrates your Portfolio’s ongoing costs in two ways:
Actual Expenses
The second and third data columns in the table below provide information about actual account values and actual expenses. You may use the information in these columns, together with the amount you invested, to estimate the expenses that you paid during the six months ended June 30, 2017. Simply divide your account value by $1,000
(for example, an $8,600 account value divided by $1,000 = 8.6), then multiply the result by the number under the heading entitled “Expenses Paid During Period” to estimate the expenses you paid on your account during this period.
Hypothetical Example for Comparison Purposes
The fourth and fifth data columns in the table below provide information about hypothetical account values and hypothetical expenses based on the Portfolio’s actual expense ratio and an assumed rate of return of 5% per year before expenses, which is not the Portfolio’s actual return. The hypothetical account values and expenses may not be used to estimate the actual ending account balances or expenses you paid for the six-month period shown. You may use this information to compare the ongoing costs of investing in the Portfolio with the ongoing costs of investing in other mutual funds. To do so, compare this 5% hypothetical example with the 5% hypothetical examples that appear in the shareholder reports of the other mutual funds.
Please note that the expenses shown in the table are meant to highlight your ongoing costs only and do not reflect any transactional costs, such as exchange fees or sales charges (loads). Therefore, the fourth and fifth data columns of the table are useful in comparing ongoing costs only and will not help you determine the relative total costs of owning different funds. In addition, if these transactional costs were included, your costs would have been higher.
| | | | | | | | | | | | | | | | | | | | | | |
| | | | | | | | | | | | | | | | | | |
| Share Class | | Beginning
Account
Value
1/1/17 | | | Ending Account
Value (Based
on Actual
Returns and
Expenses)
6/30/17 | | | Expenses
Paid
During
Period1 | | | Ending Account
Value (Based
on Hypothetical
5% Annualized
Return and
Actual Expenses)
6/30/17 | | | Expenses
Paid
During
Period1 | | | Net Expense
Ratio
During
Period2 |
| | | | | | |
| Initial Class Shares | | $ | 1,000.00 | | | $ | 1,068.20 | | | $ | 3.23 | | | $ | 1,021.70 | | | $ | 3.16 | | | 0.63% |
| | | | | | |
| Service Class Shares | | $ | 1,000.00 | | | $ | 1,066.90 | | | $ | 4.51 | | | $ | 1,020.40 | | | $ | 4.41 | | | 0.88% |
| 1. | Expenses are equal to the Portfolio’s annualized expense ratio of each class multiplied by the average account value over the period, divided by 365 and multiplied by 181 (to reflect the six-month period). The table above represents the actual expenses incurred during the six-month period. |
| 2. | Expenses are equal to the Portfolio’s annualized expense ratio to reflect the six-month period. |
| | |
| 6 | | MainStay VP Income Builder Portfolio |
Portfolio Composition as of June 30, 2017 (Unaudited)
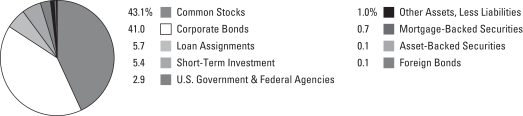
See Portfolio of Investments beginning on page 12 for specific holdings within these categories.
Top Ten Holdings or Issuers Held as of June 30, 2017 (excluding short-term investment) (Unaudited)
| 1. | United States Treasury Notes, 1.25%–2.25%, due 7/31/23–11/15/26 |
| 2. | Verizon Communications, Inc. |
| 4. | Morgan Stanley, 2.375%–6.25%, due 7/23/19–12/31/49 |
| 5. | Philip Morris International, Inc. |
Portfolio Management Discussion and Analysis (Unaudited)
Answers to the questions reflect the views of portfolio managers Dan Roberts, PhD, Michael Kimble, CFA and Louis N. Cohen, CFA, of MacKay Shields LLC, the Subadvisor for the fixed-income portion of the Portfolio, and Eric Sappenfield, William Priest, CFA, Michael Welhoelter, CFA, John Tobin and Kera Van Valen, CFA, of Epoch Investment Partners, Inc., the Subadvisor for the equity portion of the Portfolio.
How did MainStay VP Income Builder Portfolio perform relative to its benchmarks and peers for the six months ended June 30, 2017?
For the six months ended June 30, 2017, MainStay VP Income Builder Portfolio returned 6.82% for Initial Class shares and 6.69% for Service Class shares. Over the same period, both share classes underperformed the 10.66% return of the MSCI World Index,1 which is the Portfolio’s primary benchmark. Over the same period, both share classes outperformed the 2.27% return of the Bloomberg Barclays U.S. Aggregate Bond Index,1 which is the Portfolio’s secondary benchmark, and the 6.40% return of the Blended Benchmark Index,1 which is an additional benchmark of the Portfolio. Both share classes underperformed the 7.70% return of the Average Lipper2 Variable Products Mixed-Asset Target Allocation Growth Portfolio for the six months ended June 30, 2017.
What factors affected the relative performance of the equity portion of the Portfolio during the reporting period?
Investors deemphasized dividend-producing stocks during the reporting period in favor of stocks with above-average exposure to a cyclical economic upturn. Relative to the MSCI World Index, the performance of the equity portion of the Portfolio benefited from stock selection in the consumer staples, energy and telecommunication services sectors. Relative performance was hurt by having an overweight position relative to the benchmark in the telecommunication services sector and by stock selection and an underweight position relative to the MSCI World Index in the information technology sector. Many companies in the equity portion of the Portfolio continued to grow free cash flow and remained committed to consistently returning cash to shareholders through a combination of cash dividends, share buybacks and debt reduction.
Which market segments were the strongest positive contributors to the relative performance of the equity portion of the Portfolio, and which market segments detracted the most?
The strongest contributions to the performance of the equity portion of the Portfolio relative to the MSCI World Index came from the consumer staples and energy sectors. (Contributions take weightings and total returns into account.) Strong returns in the consumer staples sector were driven by stocks in the tobacco, food products and beverage industries. Energy holdings in the equity portion of the Portfolio, which tend to be larger integrated energy companies, held up better than the sector as a whole. The information technology sector, which
was the best-performing sector in the MSCI World Index during the reporting period, was the most substantial detractor from relative performance in the equity portion of the Portfolio because of stock selection and an underweight position. An overweight position in the telecommunication services sector also hurt relative performance, as this sector lagged the MSCI World Index because of price competition among major U.S. wireless providers. The telecommunication services holdings in the equity portion of the Portfolio, however, collectively out-performed the corresponding sector in the MSCI World Index.
During the reporting period, which individual stocks made the strongest positive contributions to the absolute performance of the equity portion of the Portfolio and which stocks detracted the most?
Tobacco stocks Philip Morris International and British American Tobacco made strong positive contributions to the absolute performance of the equity portion of the Portfolio during the reporting period. The tobacco industry continued to be rewarded for its consistent cash-flow generation supported by strong pricing power, disciplined cost controls and low reinvestment needs. Shares of both companies rose on news of a proposed merger of Reynolds American and British American Tobacco that could further consolidate the tobacco industry. Pharmaceutical company AstraZeneca was another strong contributor to absolute performance in the equity portion of the Portfolio. The stock was lifted by strong financial results, which conveyed higher confidence about the company’s growth outlook. Shares were further boosted by a favorable report on a cancer drug trial and a new drug marketing approval in China. Cash flow remains supportive of the company’s attractive dividend and a broad pipeline of drugs in development provides support for expected future cash-flow growth.
The largest detractor from absolute performance in the equity portion of the Portfolio was telecommunication services provider Verizon. The company’s shares were pressured when Verizon’s wireless segment faced an increased competitive environment that included a return to unlimited data offerings from all major carriers. Despite the current environment, Verizon remained focused on its network-first strategy, which we believe may allow the company to distinguish itself from the other industry participants over the longer term. Verizon has a well-covered dividend and has progressed on its debt-reduction plans. Occidental Petroleum, which explores, produces and markets crude oil and natural gas, was another weak performer in the equity portion of the Portfolio. During the reporting period, Occidental’s shares declined along with the slump in the energy sector. We believe that the company is well positioned in its
| 1. | See footnote on page 5 for more information on this index. |
| 2. | See footnote on page 5 for more information on Lipper Inc. |
| | |
| 8 | | MainStay VP Income Builder Portfolio |
industry and remains committed to returning cash to shareholders via an attractive dividend. In the equity portion of the Portfolio, shares of semiconductor company Qualcomm were hurt by a lawsuit from Apple that takes issue on the size of royalty rates and the way they are calculated and determined. In April 2017, Qualcomm confirmed that royalties were being withheld by contract manufacturers and Apple declared that it would cease paying contract manufacturers for Qualcomm’s patents until the dispute was resolved. Because of this matter, Qualcomm reduced its guidance for the full year. The company remains focused on closing its pending acquisition of industrial and automotive-focused company NXP Semiconductor. Qualcomm paid a growing dividend that remains covered even without Apple payments, and the company has an ongoing share repurchase program.
Did the equity portion of the Portfolio make any significant purchases or sales during the reporting period?
One recent addition to the equity portion of the Portfolio was Spanish regulated utility company Red Electrica, which owns and operates Spain’s electricity transmission network. The company also has small exposures to regulated transmission operations in Peru and Chile and to the management and leasing of fiber optic networks that service telecommunication companies in Spain. Red Electrica generates cash flows from operating, maintaining and upgrading Spain’s electricity transmission grid and serving as the country’s Transmission System Operator (TSO), balancing supply and demand for the nation’s entire electric system. We expect operating efficiency improvements to lead to margin expansion and to supplement rate base growth. Red Electrica consistently returns cash to shareholders through an attractive and growing dividend. The equity portion of the Portfolio also added Public Storage, the largest self-storage operator in the United States. The self-storage market has a long history of successfully increasing prices for both new and existing tenants to drive revenue growth. Expansion is also driven by tuck-in acquisitions which increase the company’s available rentable space. Public Storage announced plans to continue to invest in acquiring existing storage facilities and building greenfield projects.3 The company also reinvests in its properties to maintain industry-leading accommodations and amenities. As a real estate investment trust (REIT), the company pays out the majority of the cash it generates in the form of a growing dividend.
The only sale in the equity portion of the Portfolio during the reporting period was a position in Microchip Technology, the leading supplier of microcontrollers, analog microchips and memory devices. While the company continued to pay a well-covered dividend and was focused on deleveraging its balance sheet after the Atmel purchase, strong operating performance and solid demand drove shares higher, which compressed the yield. As a result, the Portfolio exited the stock to fund higher- yielding opportunities in the equity portion of the Portfolio.
How did sector weightings change in the equity portion of the Portfolio during the reporting period?
In the equity portion of the Portfolio, sector weightings did not change meaningfully during the reporting period. The most substantial weighting changes in the equity portion of the Portfolio included a slight increase in the utilities sector and slight decreases in the industrials, telecommunication services and information technology sectors.
How was the equity portion of the Portfolio positioned at the end of the reporting period?
As of June 30, 2017, the equity portion of the Portfolio held overweight positions relative to the MSCI World Index in the utilities, telecommunications services and consumer staples sectors. As of the same date, the equity portion of the Portfolio held underweight positions relative to the Index in the information technology, consumer discretionary and financials sectors. Sector weights in the equity portion of the Portfolio are the result of individual stock selection.
What factors affected the relative performance of the fixed-income portion of the Portfolio during the reporting period?
During the reporting period, the fixed-income portion of the Portfolio outperformed the Bloomberg Barclays U.S. Aggregate Bond Index primarily because of an overweight position in spread product—specifically high-yield bonds, bank loans and investment-grade credit—as credit spreads4 tightened during the reporting period. The fixed-income portion of the Portfolio retained overweight positions in investment-grade bonds, high-yield bonds and loans, while it maintained underweight positions in U.S. Treasury securities and mortgage-backed securities. Most industries held in the fixed-income portion of the Portfolio generated positive returns, with banking, insurance, basic industry, capital goods and technology being the primary
| 3. | In the storage industry, greenfield projects typically involve building new storage facilities on suitable undeveloped land; brownfield projects typically involve converting existing structures into storage facilities. |
| 4. | The terms “spread” and “yield spread” may refer to the difference in yield between a security or type of security and comparable U.S. Treasury issues. The terms may also refer to the difference in yield between two specific securities or types of securities at a given time. The term “credit spread” typically refers to the difference in yield between corporate or municipal bonds (or a specific category of these bonds) and comparable U.S. Treasury issues. |
contributors to relative performance. Although the fixed-income portion of the Portfolio remained overweight relative to the Bloomberg Barclays U.S. Aggregate Bond Index in spread product throughout the reporting period, the allocation to high-yield credits was reduced in favor of investment-grade credits as spreads tightened.
During the reporting period, how was the performance of the fixed-income portion of the Portfolio materially affected by investments in derivatives?
During the reporting period, the fixed-income portion of the Portfolio used S&P 500® futures, and to a lesser extent Euro Stoxx 50 and Nikkei 225 futures, to enhance the equity beta5 of the Portfolio. The futures added to the Portfolio’s performance. Foreign currency forward contracts had a negative effect on the Portfolio’s performance.
What was the duration6 strategy of the fixed-income portion of the Portfolio during the reporting period?
As of June 30, 2017, the duration of the fixed-income portion of the Portfolio was 5.5 years, which was shorter than the duration of the Bloomberg Barclays U.S. Aggregate Bond Index.
What specific factors, risks or market forces prompted significant decisions for the fixed-income portion of the Portfolio during the reporting period?
During the reporting period, we promoted credit risk as the principal driver of performance in the fixed-income portion of the Portfolio. We expected corporate bonds (both investment grade and high yield) to have superior returns compared to government-related debt, as a relatively low interest-rate environment could spark healthy demand for higher-yielding products. In addition, improving profitability signaled that corporations were doing more with less: less leverage, less short-term debt and smaller funding gaps, which in turn strengthened credit fundamentals and supported the narrowing of spreads. Although we continued to believe that credit spreads could tighten modestly, we reduced exposure to high-yield credits in the fixed-income portion of the Portfolio in favor of investment-grade credits as spreads continued to tighten. While we believed that valuations generally remained fair across all credit sectors, it was our opinion that greater vigilance was required to navigate what we saw as the late stages of the current economic cycle.
Which sectors were the strongest contributors to the performance of the fixed-income portion of the Portfolio, and which sectors were particularly weak?
During the reporting period, the high-yield bond position in the fixed-income portion of the Portfolio was the most significant contributor to the performance of the fixed-income portion of the Portfolio, both on an absolute and a relative basis. Bank loans and investment-grade corporate bonds also contributed positively to the relative performance of the fixed-income portion of the Portfolio.
In the high-yield component of the fixed-income portion of the Portfolio, transportation and telecommunications were the most substantial contributors. In the investment-grade component of the fixed-income portion of the Portfolio, financials and consumer-related holdings generated positive returns in excess of the Bloomberg Barclays U.S. Aggregate Bond Index.
Did the fixed-income portion of the Portfolio make any significant purchases or sales during the reporting period?
During the reporting period, the fixed-income portion of the Portfolio purchased loans of telecommunication services company Sprint and technology company Dell. Both were new issues and came at yields that we found attractive. During the reporting period, the fixed-income portion of the Portfolio sold bonds of trucking company XPO Logistics and health care company HCA. In both cases, the bonds had reached what we considered to be their fair value.
How did the sector weightings change in the fixed-income portion of the Portfolio during the reporting period?
During the reporting period, the fixed-income portion of the Portfolio trimmed its position in high-yield bonds while increasing its weighting in investment-grade credit as spreads in the high-yield universe continued to narrow. In the fixed-income portion of the Portfolio, the weighting in bank loans remained relatively flat throughout the reporting period.
How was the fixed-income portion of the Portfolio positioned at the end of the reporting period?
As of June 30, 2017, the fixed-income portion of the Portfolio maintained an overweight position relative to the Bloomberg
| 5. | Beta is a measure of volatility in relation to the market as a whole. A beta higher than 1 indicates that a security or portfolio will tend to exhibit higher volatility than the market. A beta lower than 1 indicates that a security or portfolio will tend to exhibit lower volatility than the market. |
| 6. | Duration is a measure of the price sensitivity of a fixed-income investment to changes in interest rates. Duration is expressed as a number of years and is considered a more accurate sensitivity gauge than average maturity. |
| | |
| 10 | | MainStay VP Income Builder Portfolio |
Barclays U.S. Aggregate Bond Index in high-yield bonds and bank loans, despite having reduced its allocation to high-yield bonds. As of the same date, the fixed-income portion of the Portfolio held an overweight position in investment-grade corporate bonds. As of June 30, 2017, the fixed-income portion of the Portfolio maintained a significantly underweight position in U.S. Treasury securities and, to a lesser degree, an underweight position in mortgage-backed securities.
The opinions expressed are those of the portfolio managers as of the date of this report and are subject to change. There is no guarantee that any forecasts made will come to pass. This material does not constitute investment advice and is not intended as an endorsement of any specific investment.
Not all MainStay VP Portfolios and/or share classes are available under all policies.
Portfolio of Investments June 30, 2017 (Unaudited)
| | | | | | | | |
| | | Principal
Amount | | | Value | |
Long-Term Bonds 50.5%† Asset-Backed Securities 0.1% | |
Home Equity 0.1% | |
Carrington Mortgage Loan Trust
Series 2006-NC4, Class A5
1.08%, due 10/25/36 (a) | | $ | 71,979 | | | $ | 71,552 | |
HSI Asset Securitization Corp. Trust
Series 2007-NC1, Class A1
1.124%, due 4/25/37 (a) | | | 2,350 | | | | 1,610 | |
JPMorgan Mortgage Acquisition Trust
Series 2007-HE1, Class AF1
1.124%, due 3/25/47 (a) | | | 198,964 | | | | 126,510 | |
MASTR Asset-Backed Securities Trust
Series 2006-HE4, Class A1
1.074%, due 11/25/36 (a) | | | 259,143 | | | | 121,650 | |
Soundview Home Loan Trust
Series 2006-EQ2, Class A2
1.134%, due 1/25/37 (a) | | | 392,578 | | | | 279,637 | |
Specialty Underwriting & Residential Finance Trust
Series 2006-BC4, Class A2B
1.134%, due 9/25/37 (a) | | | 322,689 | | | | 148,779 | |
| | | | | | | | |
| | | | | | | 749,738 | |
| | | | | | | | |
Student Loans 0.0%‡ | | | | | | | | |
KeyCorp Student Loan Trust
Series 2000-A, Class A2
1.372%, due 5/25/29 (a) | | | 152,437 | | | | 148,125 | |
| | | | | | | | |
Total Asset-Backed Securities
(Cost $1,156,117) | | | | | | | 897,863 | |
| | | | | | | | |
| | |
| Corporate Bonds 41.0% | | | | | | | | |
Advertising 0.2% | | | | | | | | |
Lamar Media Corp.
5.875%, due 2/1/22 | | | 1,105,000 | | | | 1,140,913 | |
| | | | | | | | |
|
Aerospace & Defense 0.5% | |
KLX, Inc.
5.875%, due 12/1/22 (b) | | | 1,355,000 | | | | 1,422,750 | |
Orbital ATK, Inc.
5.50%, due 10/1/23 | | | 1,135,000 | | | | 1,194,587 | |
Triumph Group, Inc.
4.875%, due 4/1/21 | | | 450,000 | | | | 447,188 | |
| | | | | | | | |
| | | | 3,064,525 | |
| | | | | | | | |
Agriculture 0.4% | |
Bunge, Ltd. Finance Corp.
3.25%, due 8/15/26 | �� | | 970,000 | | | | 926,823 | |
| | | | | | | | |
| | | Principal
Amount | | | Value | |
Agriculture (continued) | |
¨Philip Morris International, Inc.
1.625%, due 2/21/19 | | $ | 1,260,000 | | | $ | 1,256,042 | |
Reynolds American, Inc.
8.125%, due 6/23/19 | | | 165,000 | | | | 184,027 | |
| | | | | | | | |
| | | | 2,366,892 | |
| | | | | | | | |
Airlines 1.1% | |
American Airlines Group, Inc.
4.625%, due 3/1/20 (b) | | | 1,400,000 | | | | 1,447,978 | |
American Airlines, Inc.
Series 2015-2, Class AA
3.60%, due 3/22/29 | | | 952,663 | | | | 972,859 | |
Continental Airlines, Inc. | |
Series 2009-2, Class A
7.25%, due 5/10/21 | | | 292,888 | | | | 324,373 | |
Series 2003-ERJ1
7.875%, due 1/2/20 | | | 204,401 | | | | 207,978 | |
Northwest Airlines, Inc.
Series 2007-1, Class A
7.027%, due 5/1/21 | | | 1,053,725 | | | | 1,167,000 | |
U.S. Airways Group, Inc. | |
Series 2012-1, Class A
5.90%, due 4/1/26 | | | 810,604 | | | | 907,877 | |
Series 2010-1 Class A
6.25%, due 10/22/24 | | | 459,484 | | | | 511,176 | |
United Airlines, Inc. | |
Series 2014-2, Class B
4.625%, due 3/3/24 | | | 428,813 | | | | 441,678 | |
Series 2007-1
6.636%, due 1/2/24 | | | 539,303 | | | | 585,144 | |
| | | | | | | | |
| | | | 6,566,063 | |
| | | | | | | | |
Apparel 0.2% | |
Hanesbrands, Inc.
4.625%, due 5/15/24 (b) | | | 1,315,000 | | | | 1,334,725 | |
| | | | | | | | |
|
Auto Manufacturers 1.2% | |
Ford Motor Co. | |
6.625%, due 10/1/28 | | | 500,000 | | | | 590,561 | |
7.45%, due 7/16/31 | | | 455,000 | | | | 575,275 | |
Ford Motor Credit Co. LLC
5.875%, due 8/2/21 | | | 150,000 | | | | 167,270 | |
General Motors Financial Co., Inc. | |
3.15%, due 6/30/22 | | | 320,000 | | | | 320,495 | |
3.45%, due 4/10/22 | | | 1,500,000 | | | | 1,524,597 | |
3.70%, due 5/9/23 | | | 500,000 | | | | 507,730 | |
4.20%, due 3/1/21 | | | 925,000 | | | | 970,201 | |
| † | Percentages indicated are based on Portfolio net assets. |
| ¨ | | Among the Portfolio’s 10 largest holdings or issuers held, as of June 30, 2017, excluding short-term investment. May be subject to change daily. |
| | | | |
| 12 | | MainStay VP Income Builder Portfolio | | The notes to the financial statements are an integral part of,
and should be read in conjunction with, the financial statements. |
| | | | | | | | |
| | | Principal
Amount | | | Value | |
| Corporate Bonds (continued) | |
Auto Manufacturers (continued) | |
Toyota Motor Credit Corp. | |
1.25%, due 10/5/17 | | $ | 630,000 | | | $ | 629,877 | |
2.90%, due 4/17/24 | | | 1,670,000 | | | | 1,682,513 | |
| | | | | | | | |
| | | | 6,968,519 | |
| | | | | | | | |
Auto Parts & Equipment 0.7% | |
Goodyear Tire & Rubber Co.
5.125%, due 11/15/23 | | | 910,000 | | | | 953,225 | |
Schaeffler Finance B.V.
4.75%, due 5/15/23 (Germany) (b) | | | 1,245,000 | | | | 1,282,350 | |
Tenneco, Inc.
5.00%, due 7/15/26 | | | 605,000 | | | | 611,806 | |
ZF North America Capital, Inc.
4.75%, due 4/29/25 (Germany) (b) | | | 1,150,000 | | | | 1,213,250 | |
| | | | | | | | |
| | | | 4,060,631 | |
| | | | | | | | |
Banks 6.6% | |
Bank of America Corp. | |
3.50%, due 4/19/26 | | | 150,000 | | | | 150,511 | |
3.705%, due 4/24/28 (a) | | | 210,000 | | | | 211,538 | |
4.875%, due 4/1/44 | | | 170,000 | | | | 190,329 | |
5.00%, due 1/21/44 | | | 175,000 | | | | 197,829 | |
5.875%, due 2/7/42 | | | 180,000 | | | | 225,571 | |
6.11%, due 1/29/37 | | | 1,105,000 | | | | 1,352,465 | |
6.30%, due 12/29/49 (a) | | | 735,000 | | | | 824,119 | |
7.625%, due 6/1/19 | | | 680,000 | | | | 749,817 | |
Bank of New York Mellon Corp.
4.625%, due 12/29/49 (a) | | | 1,130,000 | | | | 1,139,718 | |
Barclays PLC (United Kingdom) | |
4.836%, due 5/9/28 | | | 705,000 | | | | 720,714 | |
4.95%, due 1/10/47 | | | 315,000 | | | | 336,149 | |
5.20%, due 5/12/26 | | | 580,000 | | | | 610,104 | |
BB&T Corp.
2.75%, due 4/1/22 | | | 1,470,000 | | | | 1,491,716 | |
Capital One Financial Corp. | |
4.20%, due 10/29/25 | | | 165,000 | | | | 166,376 | |
5.55%, due 12/29/49 (a) | | | 775,000 | | | | 813,750 | |
Citigroup, Inc. | |
3.40%, due 5/1/26 | | | 255,000 | | | | 252,254 | |
3.70%, due 1/12/26 | | | 545,000 | | | | 551,207 | |
4.05%, due 7/30/22 | | | 105,000 | | | | 109,766 | |
4.65%, due 7/30/45 | | | 430,000 | | | | 467,576 | |
5.30%, due 5/6/44 | | | 436,000 | | | | 493,369 | |
6.625%, due 6/15/32 | | | 190,000 | | | | 237,534 | |
Citizens Bank N.A.
2.55%, due 5/13/21 | | | 475,000 | | | | 475,262 | |
Citizens Financial Group, Inc.
4.30%, due 12/3/25 | | | 1,190,000 | | | | 1,240,700 | |
Discover Bank
8.70%, due 11/18/19 | | | 795,000 | | | | 898,286 | |
| | | | | | | | |
| | | Principal
Amount | | | Value | |
Banks (continued) | |
Goldman Sachs Group, Inc. | |
2.30%, due 12/13/19 | | $ | 625,000 | | | $ | 626,707 | |
3.625%, due 1/22/23 | | | 1,330,000 | | | | 1,372,717 | |
5.25%, due 7/27/21 | | | 1,295,000 | | | | 1,419,385 | |
5.30%, due 12/29/49 (a) | | | 1,029,000 | | | | 1,080,450 | |
Huntington Bancshares, Inc.
3.15%, due 3/14/21 | | | 1,295,000 | | | | 1,320,543 | |
JPMorgan Chase & Co. (a) | |
3.54%, due 5/1/28 | | | 800,000 | | | | 802,422 | |
5.15%, due 12/29/49 | | | 990,000 | | | | 1,019,205 | |
Kreditanstalt fuer Wiederaufbau
1.50%, due 2/6/19 (Germany) | | | 2,925,000 | | | | 2,924,965 | |
Lloyds Banking Group PLC (United Kingdom) | | | | | | | | |
4.582%, due 12/10/25 | | | 308,000 | | | | 319,327 | |
4.65%, due 3/24/26 | | | 585,000 | | | | 609,581 | |
¨Morgan Stanley | |
2.375%, due 7/23/19 | | | 1,565,000 | | | | 1,575,839 | |
4.875%, due 11/1/22 | | | 495,000 | | | | 537,444 | |
5.00%, due 11/24/25 | | | 1,150,000 | | | | 1,250,577 | |
5.45%, due 12/31/49 (a) | | | 790,000 | | | | 818,045 | |
6.25%, due 8/9/26 | | | 881,000 | | | | 1,054,672 | |
PNC Bank N.A. | |
1.70%, due 12/7/18 (France) | | | 1,170,000 | | | | 1,169,851 | |
2.55%, due 12/9/21 | | | 815,000 | | | | 820,294 | |
Royal Bank of Scotland Group PLC (United Kingdom) | | | | | | | | |
6.00%, due 12/19/23 | | | 70,000 | | | | 77,103 | |
6.125%, due 12/15/22 | | | 550,000 | | | | 602,160 | |
Santander UK Group Holdings PLC
3.571%, due 1/10/23 (United Kingdom) | | | 790,000 | | | | 807,977 | |
State Street Corp.
2.55%, due 8/18/20 | | | 915,000 | | | | 932,182 | |
Toronto-Dominion Bank
1.80%, due 7/13/21 (Canada) | | | 1,535,000 | | | | 1,503,714 | |
U.S. Bank N.A.
2.00%, due 1/24/20 | | | 1,500,000 | | | | 1,506,460 | |
Wachovia Corp.
5.75%, due 2/1/18 | | | 330,000 | | | | 337,730 | |
Wells Fargo & Co.
5.90%, due 12/29/49 (a) | | | 820,000 | | | | 878,220 | |
Wells Fargo Capital X
5.95%, due 12/1/86 | | | 255,000 | | | | 287,768 | |
| | | | | | | | |
| | | | 39,561,998 | |
| | | | | | | | |
Beverages 1.2% | |
Anheuser-Busch InBev Finance, Inc.
3.65%, due 2/1/26 (Belgium) | | | 2,040,000 | | | | 2,101,751 | |
Coca-Cola Co.
1.375%, due 5/30/19 | | | 1,390,000 | | | | 1,384,524 | |
Constellation Brands, Inc.
4.25%, due 5/1/23 | | | 760,000 | | | | 809,092 | |
Molson Coors Brewing Co.
3.00%, due 7/15/26 | | | 750,000 | | | | 721,384 | |
| | | | | | |
The notes to the financial statements are an integral part of,
and should be read in conjunction with, the financial statements. | | | | | 13 | |
Portfolio of Investments June 30, 2017 (Unaudited) (continued)
| | | | | | | | |
| | | Principal
Amount | | | Value | |
| Corporate Bonds (continued) | |
Beverages (continued) | |
PepsiCo, Inc. | |
1.35%, due 10/4/19 | | $ | 800,000 | | | $ | 792,936 | |
1.55%, due 5/2/19 | | | 600,000 | | | | 599,798 | |
2.375%, due 10/6/26 | | | 800,000 | | | | 761,932 | |
| | | | | | | | |
| | | | 7,171,417 | |
| | | | | | | | |
Biotechnology 0.5% | |
Biogen, Inc.
3.625%, due 9/15/22 | | | 1,240,000 | | | | 1,296,866 | |
Celgene Corp.
3.625%, due 5/15/24 | | | 1,400,000 | | | | 1,450,190 | |
| | | | | | | | |
| | | | 2,747,056 | |
| | | | | | | | |
Building Materials 0.4% | |
Johnson Controls International PLC
4.50%, due 2/15/47 | | | 470,000 | | | | 499,562 | |
Masco Corp.
4.375%, due 4/1/26 | | | 575,000 | | | | 613,352 | |
Standard Industries, Inc.
5.375%, due 11/15/24 (b) | | | 1,000,000 | | | | 1,053,750 | |
| | | | | | | | |
| | | | 2,166,664 | |
| | | | | | | | |
Chemicals 0.7% | |
Air Liquide Finance S.A. (b) | |
1.375%, due 9/27/19 | | | 900,000 | | | | 887,762 | |
1.75%, due 9/27/21 | | | 610,000 | | | | 593,848 | |
Ashland LLC
4.75%, due 8/15/22 | | | 1,000,000 | | | | 1,046,250 | |
Dow Chemical Co. | |
4.125%, due 11/15/21 | | | 710,000 | | | | 754,274 | |
8.55%, due 5/15/19 | | | 45,000 | | | | 50,402 | |
WR Grace & Co-Conn
5.125%, due 10/1/21 (b) | | | 765,000 | | | | 820,462 | |
| | | | | | | | |
| | | | 4,152,998 | |
| | | | | | | | |
Commercial Services 0.4% | |
Herc Rentals, Inc.
7.75%, due 6/1/24 (b) | | | 697,000 | | | | 735,335 | |
Service Corp. International
5.375%, due 1/15/22 | | | 1,005,000 | | | | 1,035,150 | |
United Rentals North America, Inc.
4.625%, due 7/15/23 | | | 510,000 | | | | 529,508 | |
| | | | | | | | |
| | | | 2,299,993 | |
| | | | | | | | |
Computers 0.6% | |
Apple, Inc. | |
1.55%, due 2/8/19 | | | 310,000 | | | | 309,910 | |
1.55%, due 8/4/21 | | | 545,000 | | | | 532,451 | |
3.20%, due 5/11/27 | | | 320,000 | | | | 323,737 | |
3.35%, due 2/9/27 | | | 1,250,000 | | | | 1,277,916 | |
3.85%, due 8/4/46 | | | 395,000 | | | | 394,730 | |
| | | | | | | | |
| | | Principal
Amount | | | Value | |
Computers (continued) | |
International Business Machines Corp.
1.90%, due 1/27/20 | | $ | 785,000 | | | $ | 785,217 | |
| | | | | | | | |
| | | | | | | 3,623,961 | |
| | | | | | | | |
Cosmetics & Personal Care 0.2% | |
Unilever Capital Corp.
1.80%, due 5/5/20 | | | 1,100,000 | | | | 1,097,972 | |
| | | | | | | | |
|
Diversified Financial Services 2.0% | |
AerCap Ireland Capital DAC / AerCap Global Aviation Trust
4.625%, due 10/30/20 (Ireland) | | | 1,200,000 | | | | 1,275,325 | |
Air Lease Corp.
2.125%, due 1/15/20 | | | 730,000 | | | | 726,509 | |
4.25%, due 9/15/24 | | | 420,000 | | | | 440,508 | |
Alterra Finance LLC
6.25%, due 9/30/20 | | | 75,000 | | | | 83,603 | |
Bear Stearns Cos. LLC
7.25%, due 2/1/18 | | | 544,000 | | | | 561,063 | |
CIT Group, Inc.
3.875%, due 2/19/19 | | | 890,000 | | | | 912,250 | |
GE Capital International Funding Co., Unlimited
2.342%, due 11/15/20 | | | 4,500,000 | | | | 4,535,977 | |
International Lease Finance Corp.
5.875%, due 4/1/19 | | | 460,000 | | | | 488,554 | |
OneMain Financial Holdings LLC
7.25%, due 12/15/21 (b) | | | 525,000 | | | | 552,956 | |
Peachtree Corners Funding Trust
3.976%, due 2/15/25 (b) | | | 425,000 | | | | 431,287 | |
Springleaf Finance Corp.
6.00%, due 6/1/20 | | | 210,000 | | | | 221,550 | |
Synchrony Financial
4.50%, due 7/23/25 | | | 1,735,000 | | | | 1,784,187 | |
| | | | | | | | |
| | | | | | | 12,013,769 | |
| | | | | | | | |
Electric 1.6% | |
AEP Transmission Co. LLC
3.10%, due 12/1/26 | | | 850,000 | | | | 847,589 | |
CMS Energy Corp.
3.875%, due 3/1/24 | | | 550,000 | | | | 575,302 | |
5.05%, due 3/15/22 | | | 430,000 | | | | 472,982 | |
6.25%, due 2/1/20 | | | 435,000 | | | | 478,853 | |
Consolidated Edison, Inc.
2.00%, due 3/15/20 | | | 435,000 | | | | 434,845 | |
FirstEnergy Transmission LLC
5.45%, due 7/15/44 (b) | | | 1,120,000 | | | | 1,279,321 | |
Great Plains Energy, Inc.
5.292%, due 6/15/22 (c) | | | 500,000 | | | | 547,414 | |
MidAmerican Energy Co.
3.95%, due 8/1/47 | | | 300,000 | | | | 308,504 | |
4.40%, due 10/15/44 | | | 790,000 | | | | 861,945 | |
| | | | |
| 14 | | MainStay VP Income Builder Portfolio | | The notes to the financial statements are an integral part of,
and should be read in conjunction with, the financial statements. |
| | | | | | | | |
| | | Principal
Amount | | | Value | |
| Corporate Bonds (continued) | |
Electric (continued) | |
Pacific Gas & Electric Co.
1.402%, due 11/30/17 (a) | | $ | 1,100,000 | | | $ | 1,100,265 | |
PECO Energy Co.
4.80%, due 10/15/43 | | | 425,000 | | | | 484,703 | |
PPL Electric Utilities Corp.
3.95%, due 6/1/47 | | | 780,000 | | | | 802,388 | |
Public Service Electric & Gas Co.
3.00%, due 5/15/27 | | | 800,000 | | | | 801,617 | |
Puget Energy, Inc.
5.625%, due 7/15/22 | | | 350,000 | | | | 391,009 | |
WEC Energy Group, Inc.
3.294%, due 5/15/67 (a) | | | 480,000 | | | | 464,400 | |
| | | | | | | | |
| | | | | | | 9,851,137 | |
| | | | | | | | |
Electronics 0.3% | |
Honeywell International, Inc.
1.40%, due 10/30/19 (France) | | | 1,600,000 | | | | 1,589,149 | |
| | | | | | | | |
|
Environmental Controls 0.2% | |
Republic Services, Inc.
4.75%, due 5/15/23 | | | 580,000 | | | | 637,593 | |
Waste Management, Inc.
2.40%, due 5/15/23 | | | 810,000 | | | | 799,320 | |
| | | | | | | | |
| | | | | | | 1,436,913 | |
| | | | | | | | |
Food 2.1% | |
J.M. Smucker Co.
1.75%, due 3/15/18 | | | 1,245,000 | | | | 1,245,610 | |
Kerry Group Financial Services
3.20%, due 4/9/23 (Ireland) (b) | | | 1,290,000 | | | | 1,281,616 | |
Kraft Heinz Foods Co.
3.00%, due 6/1/26 | | | 280,000 | | | | 267,974 | |
4.875%, due 2/15/25 (b) | | | 831,000 | | | | 890,658 | |
5.00%, due 6/4/42 | | | 585,000 | | | | 617,575 | |
Kroger Co.
1.50%, due 9/30/19 | | | 905,000 | | | | 891,565 | |
Mondelez International Holdings Netherlands B.V. (Netherlands) (b)
1.625%, due 10/28/19 | | | 985,000 | | | | 975,746 | |
2.00%, due 10/28/21 | | | 1,110,000 | | | | 1,081,493 | |
Smithfield Foods, Inc. (b)
2.70%, due 1/31/20 | | | 605,000 | | | | 608,190 | |
3.35%, due 2/1/22 | | | 565,000 | | | | 567,938 | |
Sysco Corp.
3.30%, due 7/15/26 | | | 865,000 | | | | 858,135 | |
Tyson Foods, Inc.
3.95%, due 8/15/24 | | | 1,810,000 | | | | 1,894,017 | |
Whole Foods Market, Inc.
5.20%, due 12/3/25 (France) | | | 1,210,000 | | | | 1,398,395 | |
| | | | | | | | |
| | | | | | | 12,578,912 | |
| | | | | | | | |
| | | | | | | | |
| | | Principal
Amount | | | Value | |
Gas 0.4% | |
AmeriGas Partners, L.P. / AmeriGas Finance Corp.
5.50%, due 5/20/25 | | $ | 320,000 | | | $ | 326,400 | |
5.625%, due 5/20/24 | | | 525,000 | | | | 540,750 | |
5.75%, due 5/20/27 | | | 220,000 | | | | 222,750 | |
NiSource Finance Corp.
3.49%, due 5/15/27 | | | 1,320,000 | | | | 1,329,083 | |
| | | | | | | | |
| | | | | | | 2,418,983 | |
| | | | | | | | |
Health Care—Products 1.0% | |
Baxter International, Inc.
3.50%, due 8/15/46 | | | 1,570,000 | | | | 1,406,871 | |
Becton Dickinson & Co.
3.70%, due 6/6/27 | | | 1,555,000 | | | | 1,559,915 | |
Medtronic Global Holdings SCA
1.70%, due 3/28/19 | | | 1,105,000 | | | | 1,105,700 | |
Stryker Corp.
2.625%, due 3/15/21 | | | 1,220,000 | | | | 1,232,682 | |
Thermo Fisher Scientific, Inc.
3.00%, due 4/15/23 | | | 525,000 | | | | 529,262 | |
| | | | | | | | |
| | | | | | | 5,834,430 | |
| | | | | | | | |
Health Care—Services 0.5% | |
Cigna Corp.
4.375%, due 12/15/20 | | | 135,000 | | | | 143,692 | |
Fresenius Medical Care U.S. Finance II, Inc.
5.875%, due 1/31/22 (Germany) (b) | | | 705,000 | | | | 780,788 | |
Laboratory Corp. of America Holdings
2.50%, due 11/1/18 | | | 1,255,000 | | | | 1,264,973 | |
Tenet Healthcare Corp.
4.746%, due 6/15/20 (a) | | | 700,000 | | | | 707,000 | |
| | | | | | | | |
| | | | | | | 2,896,453 | |
| | | | | | | | |
Home Builders 0.9% | |
CalAtlantic Group, Inc.
8.375%, due 5/15/18 | | | 800,000 | | | | 841,000 | |
Lennar Corp.
4.50%, due 6/15/19 | | | 1,100,000 | | | | 1,137,125 | |
4.50%, due 11/15/19 | | | 200,000 | | | | 207,500 | |
MDC Holdings, Inc.
5.625%, due 2/1/20 | | | 1,100,000 | | | | 1,174,250 | |
Toll Brothers Finance Corp.
5.875%, due 2/15/22 | | | 670,000 | | | | 742,025 | |
TRI Pointe Group, Inc. / TRI Pointe Homes, Inc.
5.875%, due 6/15/24 | | | 1,430,000 | | | | 1,508,650 | |
| | | | | | | | |
| | | | | | | 5,610,550 | |
| | | | | | | | |
Housewares 0.3% | |
Newell Brands, Inc.
3.85%, due 4/1/23 | | | 2,000,000 | | | | 2,099,878 | |
| | | | | | | | |
| | | | | | |
The notes to the financial statements are an integral part of,
and should be read in conjunction with, the financial statements. | | | | | 15 | |
Portfolio of Investments June 30, 2017 (Unaudited) (continued)
| | | | | | | | |
| | | Principal
Amount | | | Value | |
| Corporate Bonds (continued) | |
Insurance 3.1% | |
Berkshire Hathaway Finance Corp.
1.45%, due 3/7/18 | | $ | 1,280,000 | | | $ | 1,280,503 | |
Chubb Corp.
3.408%, due 3/29/67 (a) | | | 730,000 | | | | 724,525 | |
CNA Financial Corp.
4.50%, due 3/1/26 | | | 1,260,000 | | | | 1,351,766 | |
Jackson National Life Global Funding
2.20%, due 1/30/20 (b) | | | 1,295,000 | | | | 1,295,374 | |
Liberty Mutual Group, Inc. (b)
4.25%, due 6/15/23 | | | 295,000 | | | | 313,846 | |
6.50%, due 3/15/35 | | | 130,000 | | | | 162,541 | |
7.80%, due 3/7/87 | | | 1,195,000 | | | | 1,488,528 | |
Markel Corp.
5.00%, due 4/5/46 | | | 870,000 | | | | 951,704 | |
MassMutual Global Funding II (b)
2.10%, due 8/2/18 | | | 350,000 | | | | 351,596 | |
2.50%, due 10/17/22 (France) | | | 1,270,000 | | | | 1,265,469 | |
Oil Insurance, Ltd.
4.134%, due 12/29/49 (a)(b) | | | 580,000 | | | | 524,900 | |
Pacific Life Insurance Co.
7.90%, due 12/30/23 (b) | | | 1,000,000 | | | | 1,241,509 | |
Pricoa Global Funding I
2.55%, due 11/24/20 (b) | | | 765,000 | | | | 770,335 | |
Principal Life Global Funding II
2.375%, due 11/21/21 (b) | | | 1,470,000 | | | | 1,456,664 | |
Protective Life Corp.
8.45%, due 10/15/39 | | | 725,000 | | | | 1,075,219 | |
Provident Cos., Inc.
7.25%, due 3/15/28 | | | 925,000 | | | | 1,176,120 | |
Prudential Financial, Inc.
5.625%, due 6/15/43 (a) | | | 795,000 | | | | 873,506 | |
Validus Holdings, Ltd.
8.875%, due 1/26/40 | | | 310,000 | | | | 448,401 | |
Voya Financial, Inc.
3.65%, due 6/15/26 | | | 310,000 | | | | 310,589 | |
XLIT, Ltd. (Ireland)
4.45%, due 3/31/25 | | | 985,000 | | | | 1,015,457 | |
6.50%, due 10/29/49 (a) | | | 945,000 | | | | 881,213 | |
| | | | | | | | |
| | | | | | | 18,959,765 | |
| | | | | | | | |
Internet 0.8% | |
Amazon.com, Inc.
3.30%, due 12/5/21 | | | 755,000 | | | | 787,007 | |
eBay, Inc.
3.80%, due 3/9/22 | | | 1,380,000 | | | | 1,442,100 | |
Match Group, Inc.
6.375%, due 6/1/24 | | | 1,500,000 | | | | 1,631,250 | |
Priceline Group, Inc.
3.60%, due 6/1/26 | | | 795,000 | | | | 804,750 | |
| | | | | | | | |
| | | | | | | 4,665,107 | |
| | | | | | | | |
| | | | | | | | |
| | | Principal
Amount | | | Value | |
Iron & Steel 0.2% | |
ArcelorMittal
7.50%, due 10/15/39 (Luxembourg) | | $ | 1,000,000 | | | $ | 1,121,250 | |
| | | | | | | | |
|
Lodging 0.9% | |
Choice Hotels International, Inc.
5.75%, due 7/1/22 | | | 1,229,000 | | | | 1,367,262 | |
Hilton Domestic Operating Co., Inc.
4.25%, due 9/1/24 (b) | | | 865,000 | | | | 876,894 | |
Marriott International, Inc.
2.30%, due 1/15/22 | | | 890,000 | | | | 878,287 | |
6.75%, due 5/15/18 | | | 865,000 | | | | 901,461 | |
7.15%, due 12/1/19 | | | 125,000 | | | | 139,800 | |
MGM Resorts International
6.75%, due 10/1/20 | | | 840,000 | | | | 930,636 | |
Wyndham Worldwide Corp.
4.15%, due 4/1/24 | | | 300,000 | | | | 308,141 | |
4.50%, due 4/1/27 | | | 330,000 | | | | 340,194 | |
| | | | | | | | |
| | | | | | | 5,742,675 | |
| | | | | | | | |
Machinery—Diversified 0.4% | |
CNH Industrial Capital LLC
4.875%, due 4/1/21 | | | 1,445,000 | | | | 1,535,312 | |
Zebra Technologies Corp.
7.25%, due 10/15/22 | | | 605,000 | | | | 642,813 | |
| | | | | | | | |
| | | | | | | 2,178,125 | |
| | | | | | | | |
Media 0.8% | |
21st Century Fox America, Inc.
6.65%, due 11/15/37 | | | 605,000 | | | | 798,145 | |
DISH DBS Corp.
5.875%, due 7/15/22 | | | 725,000 | | | | 779,375 | |
Sky PLC
3.75%, due 9/16/24 (United Kingdom) (b) | | | 940,000 | | | | 965,560 | |
Time Warner Entertainment Co., L.P.
8.375%, due 3/15/23 | | | 355,000 | | | | 446,683 | |
Time Warner, Inc.
3.60%, due 7/15/25 | | | 1,000,000 | | | | 997,727 | |
UPCB Finance IV, Ltd.
5.375%, due 1/15/25 (Netherlands) (b) | | | 765,000 | | | | 800,381 | |
| | | | | | | | |
| | | | | | | 4,787,871 | |
| | | | | | | | |
Metal Fabricate & Hardware 0.2% | |
Precision Castparts Corp.
3.25%, due 6/15/25 | | | 1,455,000 | | | | 1,485,935 | |
| | | | | | | | |
|
Mining 0.2% | |
FMG Resources (August 2006) Pty, Ltd.
9.75%, due 3/1/22 (Australia) (b) | | | 1,155,000 | | | | 1,315,256 | |
| | | | | | | | |
|
Miscellaneous—Manufacturing 0.5% | |
Amsted Industries, Inc.
5.00%, due 3/15/22 (b) | | | 1,390,000 | | | | 1,435,175 | |
| | | | |
| 16 | | MainStay VP Income Builder Portfolio | | The notes to the financial statements are an integral part of,
and should be read in conjunction with, the financial statements. |
| | | | | | | | |
| | | Principal
Amount | | | Value | |
| Corporate Bonds (continued) | |
Miscellaneous—Manufacturing (continued) | |
Siemens Financieringsmaatschappij N.V.
2.70%, due 3/16/22 (Germany) (b) | | $ | 760,000 | | | $ | 769,881 | |
Textron Financial Corp.
2.917%, due 2/15/67 (a)(b) | | | 1,295,000 | | | | 1,116,937 | |
| | | | | | | | |
| | | | | | | 3,321,993 | |
| | | | | | | | |
Oil & Gas 0.9% | |
Chevron Corp.
1.686%, due 2/28/19 | | | 700,000 | | | | 700,489 | |
CITGO Petroleum Corp.
6.25%, due 8/15/22 (b) | | | 525,000 | | | | 532,875 | |
ConocoPhillips
6.50%, due 2/1/39 | | | 1,000,000 | | | | 1,313,008 | |
Petrobras Global Finance B.V.
7.375%, due 1/17/27 (Brazil) | | | 1,465,000 | | | | 1,549,970 | |
Tesoro Corp.
5.125%, due 12/15/26 (b) | | | 450,000 | | | | 489,699 | |
Valero Energy Corp.
3.65%, due 3/15/25 | | | 1,000,000 | | | | 1,019,651 | |
| | | | | | | | |
| | | | | | | 5,605,692 | |
| | | | | | | | |
Packaging & Containers 0.5% | |
Ball Corp.
5.00%, due 3/15/22 | | | 1,375,000 | | | | 1,467,813 | |
Reynolds Group Issuer, Inc. / Reynolds Group Issuer LLC
5.75%, due 10/15/20 (New Zealand) | | | 850,000 | | | | 869,839 | |
Sealed Air Corp.
5.50%, due 9/15/25 (b) | | | 750,000 | | | | 819,375 | |
| | | | | | | | |
| | | | | | | 3,157,027 | |
| | | | | | | | |
Pharmaceuticals 0.8% | |
Allergan Funding SCS
3.45%, due 3/15/22 | | | 1,530,000 | | | | 1,577,150 | |
Eli Lilly & Co.
3.10%, due 5/15/27 | | | 800,000 | | | | 807,864 | |
Johnson & Johnson
2.25%, due 3/3/22 | | | 1,275,000 | | | | 1,281,775 | |
Novartis Capital Corp.
1.80%, due 2/14/20 (Switzerland) | | | 1,475,000 | | | | 1,476,034 | |
| | | | | | | | |
| | | | | | | 5,142,823 | |
| | | | | | | | |
Pipelines 0.5% | |
Hiland Partners Holdings LLC / Hiland Partners Finance Corp.
5.50%, due 5/15/22 (b) | | | 725,000 | | | | 757,234 | |
MPLX, L.P.
5.50%, due 2/15/23 | | | 925,000 | | | | 949,762 | |
Southern Natural Gas Co. LLC
4.80%, due 3/15/47 (b) | | | 315,000 | | | | 333,343 | |
Spectra Energy Partners, L.P.
4.75%, due 3/15/24 | | | 795,000 | | | | 854,190 | |
| | | | | | | | |
| | | | | | | 2,894,529 | |
| | | | | | | | |
| | | | | | | | |
| | | Principal
Amount | | | Value | |
Real Estate Investment Trusts 1.1% | |
American Tower Corp.
3.375%, due 10/15/26 | | $ | 1,080,000 | | | $ | 1,056,662 | |
CoreCivic, Inc.
4.625%, due 5/1/23 | | | 310,000 | | | | 313,100 | |
Crown Castle International Corp.
3.40%, due 2/15/21 | | | 920,000 | | | | 944,700 | |
5.25%, due 1/15/23 | | | 1,290,000 | | | | 1,432,982 | |
Essex Portfolio, L.P.
3.375%, due 4/15/26 | | | 545,000 | | | | 534,504 | |
Iron Mountain, Inc.
5.75%, due 8/15/24 | | | 1,400,000 | | | | 1,428,000 | |
UDR, Inc.
3.50%, due 7/1/27 | | | 725,000 | | | | 715,255 | |
| | | | | | | | |
| | | | | | | 6,425,203 | |
| | | | | | | | |
Retail 2.0% | |
AutoZone, Inc.
3.75%, due 6/1/27 | | | 550,000 | | | | 550,155 | |
Brinker International, Inc.
2.60%, due 5/15/18 | | | 835,000 | | | | 835,877 | |
CVS Health Corp.
4.00%, due 12/5/23 | | | 1,355,000 | | | | 1,431,301 | |
CVS Pass-Through Trust
5.789%, due 1/10/26 (b)(d) | | | 39,779 | | | | 43,539 | |
Dollar General Corp.
3.25%, due 4/15/23 | | | 1,420,000 | | | | 1,446,332 | |
McDonald’s Corp.
3.70%, due 2/15/42 | | | 345,000 | | | | 322,691 | |
O’Reilly Automotive, Inc.
3.55%, due 3/15/26 | | | 1,000,000 | | | | 1,006,857 | |
QVC, Inc.
4.85%, due 4/1/24 | | | 945,000 | | | | 965,724 | |
Starbucks Corp.
2.45%, due 6/15/26 | | | 785,000 | | | | 757,099 | |
Suburban Propane Partners, L.P. / Suburban Energy Finance Corp.
5.50%, due 6/1/24 | | | 1,080,000 | | | | 1,074,600 | |
5.75%, due 3/1/25 | | | 90,000 | | | | 89,100 | |
Tiffany & Co.
3.80%, due 10/1/24 | | | 1,170,000 | | | | 1,186,465 | |
TJX Cos., Inc.
2.25%, due 9/15/26 | | | 2,310,000 | | | | 2,144,847 | |
| | | | | | | | |
| | | | | | | 11,854,587 | |
| | | | | | | | |
Semiconductors 0.8% | |
NXP B.V. / NXP Funding LLC (Netherlands) (b)
4.625%, due 6/15/22 | | | 590,000 | | | | 634,250 | |
4.625%, due 6/1/23 | | | 1,420,000 | | | | 1,531,825 | |
Qorvo, Inc.
7.00%, due 12/1/25 | | | 1,360,000 | | | | 1,543,600 | |
Sensata Technologies B.V.
5.00%, due 10/1/25 (Netherlands) (b) | | | 1,135,000 | | | | 1,186,983 | |
| | | | | | | | |
| | | | | | | 4,896,658 | |
| | | | | | | | |
| | | | | | |
The notes to the financial statements are an integral part of,
and should be read in conjunction with, the financial statements. | | | | | 17 | |
Portfolio of Investments June 30, 2017 (Unaudited) (continued)
| | | | | | | | |
| | | Principal
Amount | | | Value | |
| Corporate Bonds (continued) | |
Software 0.6% | |
Microsoft Corp.
1.85%, due 2/6/20 | | $ | 940,000 | | | $ | 942,396 | |
3.70%, due 8/8/46 | | | 750,000 | | | | 742,153 | |
MSCI, Inc.
5.75%, due 8/15/25 (b) | | | 1,315,000 | | | | 1,424,303 | |
PTC, Inc.
6.00%, due 5/15/24 | | | 516,000 | | | | 558,570 | |
| | | | | | | | |
| | | | | | | 3,667,422 | |
| | | | | | | | |
Telecommunications 2.0% | |
¨AT&T, Inc.
3.60%, due 2/17/23 | | | 1,400,000 | | | | 1,432,844 | |
Cisco Systems, Inc.
2.45%, due 6/15/20 | | | 1,000,000 | | | | 1,016,048 | |
CommScope Technologies Finance LLC
6.00%, due 6/15/25 (b) | | | 475,000 | | | | 507,063 | |
CommScope, Inc.
5.00%, due 6/15/21 (b) | | | 985,000 | | | | 1,007,162 | |
Hughes Satellite Systems Corp. | |
6.50%, due 6/15/19 | | | 405,000 | | | | 437,400 | |
7.625%, due 6/15/21 | | | 225,000 | | | | 255,656 | |
Rogers Communications, Inc.
5.45%, due 10/1/43 (Canada) | | | 135,000 | | | | 159,448 | |
Sprint Spectrum Co. LLC / Sprint Spectrum Co. II LLC / Sprint Spectrum Co. III LLC
3.36%, due 3/20/23 (b) | | | 1,910,000 | | | | 1,926,712 | |
T-Mobile USA, Inc.
6.625%, due 4/1/23 | | | 1,600,000 | | | | 1,693,120 | |
Telecom Italia Capital S.A.
7.721%, due 6/4/38 (Italy) | | | 135,000 | | | | 163,350 | |
Telefonica Emisiones SAU (Spain) | |
4.57%, due 4/27/23 | | | 1,139,000 | | | | 1,239,935 | |
5.213%, due 3/8/47 | | | 620,000 | | | | 669,434 | |
5.462%, due 2/16/21 | | | 175,000 | | | | 192,488 | |
¨Verizon Communications, Inc. | |
4.125%, due 3/16/27 | | | 400,000 | | | | 413,112 | |
5.15%, due 9/15/23 | | | 1,055,000 | | | | 1,171,880 | |
| | | | | | | | |
| | | | 12,285,652 | |
| | | | | | | | |
Textiles 0.3% | |
Cintas Corp. No 2
3.70%, due 4/1/27 | | | 1,540,000 | | | | 1,588,113 | |
| | | | | | | | |
|
Transportation 0.1% | |
XPO Logistics, Inc.
6.50%, due 6/15/22 (b) | | | 370,000 | | | | 388,500 | |
| | | | | | | | |
| | | | | | | | |
| | | Principal
Amount | | | Value | |
Trucking & Leasing 0.1% | |
Aviation Capital Group Corp.
2.875%, due 1/20/22 (b) | | $ | 930,000 | | | $ | 926,713 | |
| | | | | | | | |
Total Corporate Bonds
(Cost $240,694,034) | | | | | | | 247,065,397 | |
| | | | | | | | |
|
| Foreign Bonds 0.1% | |
Banks 0.1% | | | | | | | | |
Barclays Bank PLC
Series Reg S
10.00%, due 5/21/21 (United Kingdom) | | | GBP 525,000 | | | | 876,337 | |
| | | | | | | | |
Total Foreign Bonds
(Cost $864,842) | | | | | | | 876,337 | |
| | | | | | | | |
|
| Loan Assignments 5.7% (e) | |
Advertising 0.3% | | | | | | | | |
Allied Universal Holdco LLC
2015 Term Loan
5.05%, due 7/28/22 | | $ | 953,836 | | | | 955,029 | |
Outfront Media Capital LLC
2017 Term Loan B
3.46%, due 3/18/24 | | | 800,000 | | | | 802,500 | |
| | | | | | | | |
| | | | 1,757,529 | |
| | | | | | | | |
Building Materials 0.5% | |
Builders FirstSource, Inc.
2017 Term Loan B
4.30%, due 2/29/24 | | | 696,482 | | | | 695,032 | |
Forterra Finance LLC
2017 Term Loan B
4.23%, due 10/25/23 | | | 1,488,750 | | | | 1,402,402 | |
Quikrete Holdings, Inc.
2016 1st Lien Term Loan
3.98%, due 11/15/23 | | | 895,500 | | | | 893,386 | |
| | | | | | | | |
| | | | 2,990,820 | |
| | | | | | | | |
Chemicals 0.1% | |
Axalta Coating Systems U.S. Holdings, Inc.
Term Loan
3.30%, due 6/1/24 | | | 890,000 | | | | 892,336 | |
| | | | | | | | |
|
Commercial Services 0.5% | |
ExamWorks Group, Inc.
2017 Term Loan
4.48%, due 7/27/23 (New Zealand) | | | 1,329,967 | | | | 1,336,616 | |
Global Payments, Inc.
2017 1st Lien Term Loan
3.23%, due 4/22/23 | | | 478,800 | | | | 480,168 | |
U.S. Security Associates Holdings, Inc.
2016 Term Loan
6.30%, due 7/14/23 | | | 992,500 | | | | 996,222 | |
| | | | | | | | |
| | | | 2,813,006 | |
| | | | | | | | |
| | | | |
| 18 | | MainStay VP Income Builder Portfolio | | The notes to the financial statements are an integral part of,
and should be read in conjunction with, the financial statements. |
| | | | | | | | |
| | | Principal
Amount | | | Value | |
| Loan Assignments (continued) | |
Computers 0.1% | |
Tempo Acquisition LLC
Term Loan
4.06%, due 5/1/24 | | $ | 870,000 | | | $ | 871,450 | |
| | | | | | | | |
|
Containers, Packaging & Glass 0.2% | |
BWAY Holding Co.
2017 Term Loan B
4.33%, due 4/3/24 | | | 950,000 | | | | 948,643 | |
Reynolds Group Holdings, Inc.
2017 Term Loan
4.23%, due 2/5/23 | | | 297,754 | | | | 298,284 | |
| | | | | | | | |
| | | | 1,246,927 | |
| | | | | | | | |
Electrical Components & Equipment 0.1% | |
Electro Rent Corp.
1st Lien Term Loan
6.23%, due 1/19/24 | | | 746,250 | | | | 751,225 | |
| | | | | | | | |
|
Entertainment 0.3% | |
Regal Cinemas Corp.
Term Loan
3.23%, due 4/1/22 | | | 1,296,750 | | | | 1,298,566 | |
Scientific Games International, Inc.
2017 Term Loan B3
5.11%, due 10/1/21 | | | 835,771 | | | | 843,532 | |
| | | | | | | | |
| | | | 2,142,098 | |
| | | | | | | | |
Environmental Controls 0.4% | |
Advanced Disposal Services, Inc.
Term Loan B3
3.94%, due 11/10/23 | | | 1,247,375 | | | | 1,252,943 | |
GFL Environmental, Inc.
Term Loan B
4.05%, due 9/29/23 | | | 1,265,438 | | | | 1,267,020 | |
| | | | | | | | |
| | | | 2,519,963 | |
| | | | | | | | |
Food & Staples Retailing 0.3% | |
U.S. Foods, Inc.
2016 Term Loan B
3.98%, due 6/27/23 | | | 1,920,600 | | | | 1,927,385 | |
| | | | | | | | |
|
Health Care—Products 0.3% | |
Ortho-Clinical Diagnostics, Inc.
Term Loan B
5.05%, due 6/30/21 | | | 1,047,600 | | | | 1,041,424 | |
Sterigenics-Nordion Holdings, LLC
2017 Term Loan B
4.15%, due 5/15/22 | | | 1,072,313 | | | | 1,068,291 | |
| | | | | | | | |
| | | | 2,109,715 | |
| | | | | | | | |
| | | | | | | | |
| | | Principal
Amount | | | Value | |
Health Care—Services 0.6% | |
inVentiv Health, Inc.
2016 Term Loan B
4.95%, due 11/9/23 | | $ | 1,577,075 | | | $ | 1,581,018 | |
MPH Acquisition Holdings LLC
2016 Term Loan B
4.30%, due 6/7/23 | | | 1,363,833 | | | | 1,362,128 | |
U.S. Renal Care, Inc.
2015 2nd Lien Term Loan
9.30%, due 12/31/23 | | | 600,000 | | | | 563,250 | |
| | | | | | | | |
| | | | 3,506,396 | |
| | | | | | | | |
Household Products & Wares 0.6% | |
KIK Custom Products, Inc.
2015 Term Loan B
5.79%, due 8/26/22 | | | 2,488,603 | | | | 2,499,180 | |
Prestige Brands, Inc.
Term Loan B4
3.98%, due 1/26/24 | | | 945,825 | | | | 949,203 | |
| | | | | | | | |
| | | | 3,448,383 | |
| | | | | | | | |
Iron & Steel 0.2% | |
Signode Industrial Group U.S., Inc.
Term Loan B
4.01%, due 5/4/21 | | | 1,034,007 | | | | 1,031,422 | |
| | | | | | | | |
|
Media 0.3% | |
Nielsen Finance LLC
Term Loan B4
3.10%, due 10/4/23 | | | 320,000 | | | | 320,036 | |
Virgin Media Bristol LLC
Term Loan I
3.91%, due 1/31/25 | | | 1,300,000 | | | | 1,300,000 | |
| | | | | | | | |
| | | | 1,620,036 | |
| | | | | | | | |
Software 0.2% | |
First Data Corp.
2017 Term Loan
3.72%, due 4/26/24 | | | 1,000,000 | | | | 999,375 | |
| | | | | | | | |
|
Telecommunications 0.6% | |
Level 3 Financing, Inc.
2017 Term Loan B
3.47%, due 2/22/24 | | | 3,500,000 | | | | 3,506,562 | |
| | | | | | | | |
|
Transportation 0.1% | |
XPO Logistics, Inc.
2017 Term Loan B
3.41%, due 11/1/21 | | | 565,000 | | | | 565,989 | |
| | | | | | | | |
Total Loan Assignments
(Cost $34,666,365) | | | | 34,700,617 | |
| | | | | | | | |
| | | | | | |
The notes to the financial statements are an integral part of,
and should be read in conjunction with, the financial statements. | | | | | 19 | |
Portfolio of Investments June 30, 2017 (Unaudited) (continued)
| | | | | | | | |
| | | Principal
Amount | | | Value | |
| Mortgage-Backed Securities 0.7% | |
Commercial Mortgage Loans
(Collateralized Mortgage Obligations) 0.1% | |
Bayview Commercial Asset Trust
Series 2006-4A, Class A1
1.254%, due 12/25/36 (a)(b) | | $ | 83,470 | | | $ | 78,552 | |
Citigroup Commercial Mortgage Trust
Series 2008-C7, Class A4
6.385%, due 12/10/49 (f) | | | 89,431 | | | | 89,590 | |
Four Times Square Trust
Series 2006-4TS, Class A
5.401%, due 12/13/28 (b) | | | 473,813 | | | | 519,120 | |
| | | | | | | | |
| | | | 687,262 | |
| | | | | | | | |
Residential Mortgages (Collateralized Mortgage Obligations) 0.6% | |
Japan Finance Organization for Municipalities
Series Reg S
1.375%, due 2/5/18 (Japan) | | | 3,150,000 | | | | 3,139,999 | |
Mortgage Equity Conversion Asset Trust
Series 2007-FF2, Class A
1.50%, due 2/25/42 (a)(b)(d)(g) | | | 294,587 | | | | 251,190 | |
| | | | | | | | |
| | | | 3,391,189 | |
| | | | | | | | |
Total Mortgage-Backed Securities
(Cost $4,068,462) | | | | 4,078,451 | |
| | | | | | | | |
|
| U.S. Government & Federal Agencies 2.9% | |
Federal National Mortgage Association
(Mortgage Pass-Through Security) 0.0% ‡ | |
6.00%, due 4/1/37 | | | 26,937 | | | | 28,309 | |
| | | | | | | | |
|
United States Treasury Bonds 0.1% | |
3.00%, due 2/15/47 | | | 290,000 | | | | 299,153 | |
3.75%, due 11/15/43 | | | 350,000 | | | | 411,428 | |
| | | | | | | | |
| | | | 710,581 | |
| | | | | | | | |
¨United States Treasury Notes 2.8% | |
1.25%, due 7/31/23 | | | 8,965,000 | | | | 8,559,477 | |
2.00%, due 11/15/26 | | | 5,700,000 | | | | 5,557,945 | |
2.25%, due 11/15/24 | | | 2,440,000 | | | | 2,453,439 | |
| | | | | | | | |
| | | | | | | 16,570,861 | |
| | | | | | | | |
Total U.S. Government & Federal Agencies
(Cost $17,250,053) | | | | | | | 17,309,751 | |
| | | | | | | | |
Total Long-Term Bonds
(Cost $298,699,873) | | | | | | | 304,928,416 | |
| | | | | | | | |
| | |
| | | | | | | | |
| | |
| | | Shares | | | | |
| Common Stocks 43.1% | | | | | | | | |
Aerospace & Defense 0.8% | | | | | | | | |
BAE Systems PLC (United Kingdom) | | | 411,760 | | | | 3,397,440 | |
Lockheed Martin Corp. | | | 6,125 | | | | 1,700,361 | |
| | | | | | | | |
| | | | 5,097,801 | |
| | | | | | | | |
| | | | | | | | |
| | | Shares | | | Value | |
Agriculture 3.4% | |
Altria Group, Inc. | | | 59,978 | | | $ | 4,466,562 | |
British American Tobacco PLC (United Kingdom) | | | 57,120 | | | | 3,893,883 | |
¨Imperial Brands PLC (United Kingdom) | | | 104,242 | | | | 4,682,027 | |
¨Philip Morris International, Inc. | | | 33,657 | | | | 3,953,014 | |
Reynolds American, Inc. | | | 51,676 | | | | 3,361,007 | |
| | | | | | | | |
| | | | 20,356,493 | |
| | | | | | | | |
Auto Manufacturers 0.5% | |
Daimler A.G., Registered (Germany) | | | 40,325 | | | | 2,918,644 | |
| | | | | | | | |
|
Auto Parts & Equipment 0.4% | |
Cie Generale des Etablissements Michelin (France) | | | 18,295 | | | | 2,432,251 | |
| | | | | | | | |
|
Banks 1.6% | |
Commonwealth Bank of Australia (Australia) | | | 32,383 | | | | 2,061,106 | |
Royal Bank of Canada (Canada) | | | 26,481 | | | | 1,922,772 | |
Svenska Handelsbanken AB Class A (Sweden) | | | 125,774 | | | | 1,800,461 | |
Wells Fargo & Co. | | | 33,432 | | | | 1,852,467 | |
Westpac Banking Corp. (Australia) | | | 87,865 | | | | 2,060,433 | |
| | | | | | | | |
| | | | 9,697,239 | |
| | | | | | | | |
Beverages 0.9% | |
Coca-Cola Co. | | | 33,570 | | | | 1,505,614 | |
Diageo PLC (United Kingdom) | | | 65,100 | | | | 1,923,449 | |
PepsiCo., Inc. | | | 15,130 | | | | 1,747,364 | |
| | | | | | | | |
| | | | 5,176,427 | |
| | | | | | | | |
Chemicals 1.3% | |
Agrium, Inc. (Canada) | | | 15,880 | | | | 1,436,981 | |
BASF S.E. (Germany) | | | 30,923 | | | | 2,863,993 | |
Dow Chemical Co. | | | 54,542 | | | | 3,439,964 | |
| | | | | | | | |
| | | | 7,740,938 | |
| | | | | | | | |
Commercial Services 0.3% | |
Automatic Data Processing, Inc. | | | 17,800 | | | | 1,823,788 | |
| | | | | | | | |
|
Cosmetics & Personal Care 0.8% | |
Procter & Gamble Co. | | | 22,710 | | | | 1,979,176 | |
Unilever PLC (United Kingdom) | | | 51,545 | | | | 2,789,450 | |
| | | | | | | | |
| | | | 4,768,626 | |
| | | | | | | | |
Diversified Financial Services 0.5% | |
CME Group, Inc. | | | 11,649 | | | | 1,458,921 | |
Singapore Exchange, Ltd. (Singapore) | | | 260,022 | | | | 1,386,280 | |
| | | | | | | | |
| | | | 2,845,201 | |
| | | | | | | | |
Electric 5.5% | |
Ameren Corp. | | | 60,875 | | | | 3,328,036 | |
American Electric Power Co., Inc. | | | 20,614 | | | | 1,432,055 | |
Dominion Energy, Inc. | | | 33,431 | | | | 2,561,818 | |
| | | | |
| 20 | | MainStay VP Income Builder Portfolio | | The notes to the financial statements are an integral part of,
and should be read in conjunction with, the financial statements. |
| | | | | | | | |
| | | Shares | | | Value | |
| Common Stocks (continued) | |
Electric (continued) | |
Duke Energy Corp. | | | 52,287 | | | $ | 4,370,670 | |
Entergy Corp. | | | 38,529 | | | | 2,957,871 | |
¨PPL Corp. | | | 122,190 | | | | 4,723,866 | |
Red Electrica Corp. S.A. (Spain) | | | 101,111 | | | | 2,112,778 | |
Southern Co. | | | 40,715 | | | | 1,949,434 | |
SSE PLC (United Kingdom) | | | 114,695 | | | | 2,170,556 | |
Terna Rete Elettrica Nazionale S.p.A. (Italy) | | | 739,820 | | | | 3,993,400 | |
WEC Energy Group, Inc. | | | 59,758 | | | | 3,667,946 | |
| | | | | | | | |
| | | | 33,268,430 | |
| | | | | | | | |
Electrical Components & Equipment 0.3% | |
Emerson Electric Co. | | | 33,380 | | | | 1,990,116 | |
| | | | | | | | |
|
Engineering & Construction 0.3% | |
Vinci S.A. (France) | | | 24,310 | | | | 2,074,928 | |
| | | | | | | | |
|
Entertainment 0.3% | |
Regal Entertainment Group, Class A | | | 89,720 | | | | 1,835,671 | |
| | | | | | | | |
|
Environmental Controls 0.2% | |
Waste Management, Inc. | | | 20,013 | | | | 1,467,953 | |
| | | | | | | | |
|
Food 0.9% | |
Nestle S.A. Registered (Switzerland) | | | 35,985 | | | | 3,131,660 | |
Orkla ASA (Norway) | | | 239,160 | | | | 2,430,630 | |
| | | | | | | | |
| | | | 5,562,290 | |
| | | | | | | | |
Gas 1.4% | |
Gas Natural SDG S.A. (Spain) | | | 83,370 | | | | 1,951,079 | |
National Grid PLC | | | 301,280 | | | | 3,734,882 | |
Snam S.p.A. (Italy) | | | 615,609 | | | | 2,683,097 | |
| | | | | | | | |
| | | | 8,369,058 | |
| | | | | | | | |
Health Care—Services 0.3% | |
Sonic Healthcare, Ltd. (Australia) | | | 91,190 | | | | 1,697,546 | |
| | | | | | | | |
|
Household Products & Wares 0.4% | |
Kimberly-Clark Corp. | | | 20,160 | | | | 2,602,858 | |
| | | | | | | | |
|
Insurance 2.3% | |
Allianz S.E. Registered (Germany) | | | 15,892 | | | | 3,129,240 | |
Arthur J. Gallagher & Co. | | | 28,170 | | | | 1,612,732 | |
AXA S.A. (France) | | | 100,640 | | | | 2,752,955 | |
Muenchener Rueckversicherungs-Gesellschaft A.G. Registered (Germany) | | | 21,040 | | | | 4,242,643 | |
SCOR S.E. (France) | | | 50,169 | | | | 1,988,901 | |
| | | | | | | | |
| | | | 13,726,471 | |
| | | | | | | | |
Investment Management/Advisory Services 0.3% | |
BlackRock, Inc. | | | 4,425 | | | | 1,869,164 | |
| | | | | | | | |
| | | | | | | | |
| | | Shares | | | Value | |
Media 0.5% | |
ION Media Networks, Inc. (d)(g)(h)(i) | | | 8 | | | $ | 5,429 | |
Sky PLC (United Kingdom) | | | 219,806 | | | | 2,845,685 | |
| | | | | | | | |
| | | | 2,851,114 | |
| | | | | | | | |
Miscellaneous—Manufacturing 0.7% | |
Eaton Corp. PLC | | | 29,545 | | | | 2,299,487 | |
Siemens A.G. Registered (Germany) | | | 14,330 | | | | 1,969,769 | |
| | | | | | | | |
| | | | 4,269,256 | |
| | | | | | | | |
Oil & Gas 2.7% | |
Exxon Mobil Corp. | | | 35,935 | | | | 2,901,033 | |
Occidental Petroleum Corp. | | | 45,650 | | | | 2,733,065 | |
Royal Dutch Shell PLC Class A, Sponsored ADR (Netherlands) | | | 74,799 | | | | 3,978,559 | |
Statoil ASA (Norway) | | | 152,932 | | | | 2,535,205 | |
TOTAL S.A. (France) | | | 81,360 | | | | 4,022,271 | |
| | | | | | | | |
| | | | 16,170,133 | |
| | | | | | | | |
Pharmaceuticals 4.2% | |
AbbVie, Inc. | | | 42,570 | | | | 3,086,751 | |
AstraZeneca PLC Sponsored ADR (United Kingdom) | | | 103,520 | | | | 3,528,997 | |
GlaxoSmithKline PLC (United Kingdom) | | | 170,390 | | | | 3,629,573 | |
Johnson & Johnson | | | 14,635 | | | | 1,936,064 | |
Merck & Co., Inc. | | | 32,510 | | | | 2,083,566 | |
Novartis A.G. Registered (Switzerland) | | | 32,687 | | | | 2,720,224 | |
Pfizer, Inc. | | | 101,567 | | | | 3,411,635 | |
Roche Holding A.G. (Switzerland) | | | 11,242 | | | | 2,862,964 | |
Sanofi (France) | | | 24,190 | | | | 2,314,172 | |
| | | | | | | | |
| | | | 25,573,946 | |
| | | | | | | | |
Pipelines 0.5% | |
Enterprise Products Partners, L.P. | | | 101,475 | | | | 2,747,943 | |
| | | | | | | | |
|
Real Estate Investment Trusts 2.2% | |
Iron Mountain, Inc. | | | 76,060 | | | | 2,613,421 | |
Public Storage | | | 7,691 | | | | 1,603,804 | |
Unibail-Rodamco S.E. (France) | | | 15,574 | | | | 3,924,887 | |
¨Welltower, Inc. | | | 65,020 | | | | 4,866,747 | |
| | | | | | | | |
| | | | 13,008,859 | |
| | | | | | | | |
Retail 0.5% | |
McDonald’s Corp. | | | 17,626 | | | | 2,699,598 | |
| | | | | | | | |
|
Savings & Loans 0.3% | |
People’s United Financial, Inc. | | | 94,860 | | | | 1,675,228 | |
| | | | | | | | |
|
Semiconductors 1.5% | |
Intel Corp. | | | 44,902 | | | | 1,514,993 | |
QUALCOMM, Inc. | | | 63,417 | | | | 3,501,887 | |
Taiwan Semiconductor Manufacturing Co., Ltd., Sponsored ADR (Taiwan) | | | 58,591 | | | | 2,048,341 | |
Texas Instruments, Inc. | | | 27,934 | | | | 2,148,963 | |
| | | | | | | | |
| | | | 9,214,184 | |
| | | | | | | | |
| | | | | | |
The notes to the financial statements are an integral part of,
and should be read in conjunction with, the financial statements. | | | | | 21 | |
Portfolio of Investments June 30, 2017 (Unaudited) (continued)
| | | | | | | | |
| | | Shares | | | Value | |
| Common Stocks (continued) | |
Software 0.2% | |
Microsoft Corp. | | | 20,948 | | | $ | 1,443,946 | |
| | | | | | | | |
|
Telecommunications 6.2% | |
¨AT&T, Inc. | | | 112,015 | | | | 4,226,326 | |
¨BCE, Inc. (Canada) | | | 110,269 | | | | 4,965,846 | |
CenturyLink, Inc. | | | 58,685 | | | | 1,401,398 | |
Cisco Systems, Inc. | | | 85,471 | | | | 2,675,242 | |
Deutsche Telekom A.G. Registered (Germany) | | | 189,716 | | | | 3,406,274 | |
Rogers Communications, Inc. Class B (Canada) | | | 68,985 | | | | 3,258,275 | |
Singapore Telecommunications, Ltd. (Singapore) | | | 592,696 | | | | 1,674,659 | |
Swisscom A.G. Registered (Switzerland) | | | 6,640 | | | | 3,204,013 | |
Telstra Corp., Ltd. (Australia) | | | 480,294 | | | | 1,587,362 | |
TELUS Corp. (Canada) | | | 52,390 | | | | 1,808,683 | |
¨Verizon Communications, Inc. | | | 94,580 | | | | 4,223,943 | |
¨Vodafone Group PLC (United Kingdom) | | | 1,708,225 | | | | 4,844,670 | |
| | | | | | | | |
| | | | 37,276,691 | |
| | | | | | | | |
Transportation 0.9% | |
Deutsche Post A.G. Registered (Germany) | | | 75,527 | | | | 2,831,156 | |
United Parcel Service, Inc. Class B | | | 23,728 | | | | 2,624,080 | |
| | | | | | | | |
| | | | | | | 5,455,236 | |
| | | | | | | | |
Total Common Stocks
(Cost $229,532,004) | | | | | | | 259,708,027 | |
| | | | | | | | |
| | |
| | | | | | | | |
| | | Principal Amount | | | | |
| Short-Term Investment 5.4% | |
Repurchase Agreement 5.4% | | | | | | | | |
Fixed Income Clearing Corp.
0.12%, dated 6/30/17
due 7/3/17
Proceeds at Maturity $32,683,195 (Collateralized by a United States Treasury Note with a rate 2.00% and a maturity date 8/31/21, with a Principal Amount of $32,795,000 and a Market Value of $33,344,513) | | $ | 32,682,868 | | | | 32,682,868 | |
| | | | | | | | |
Total Short-Term Investment
(Cost $32,682,868) | | | | | | | 32,682,868 | |
| | | | | | | | |
Total Investments
(Cost $560,914,745) (j) | | | 99.0 | % | | | 597,319,311 | |
Other Assets, Less Liabilities | | | 1.0 | | | | 5,873,075 | |
Net Assets | | | 100.0 | % | | $ | 603,192,386 | |
| ‡ | Less than one-tenth of a percent. |
| (a) | Floating rate—Rate shown was the rate in effect as of June 30, 2017. |
| (b) | May be sold to institutional investors only under Rule 144A or securities offered pursuant to Section 4(a)(2) of the Securities Act of 1933, as amended. |
| (c) | Step coupon—Rate shown was the rate in effect as of June 30, 2017. |
| (d) | Fair valued security—Represents fair value as measured in good faith under procedures approved by the Board of Trustees. As of June 30, 2017, the total market value of these securities was $300,158, which represented less than one-tenth of a percent of the Portfolio’s net assets. |
| (e) | Floating Rate Loan—generally pays interest at rates which are periodically re-determined at a margin above the London InterBank Offered Rate or other short-term rates. The rate shown was the weighted average interest rate of all contracts within the floating rate loan facility as of June 30, 2017. |
| (f) | Collateral strip rate—A bond whose interest was based on the weighted net interest rate of the collateral. The coupon rate adjusts periodically based on a predetermined schedule. Rate shown was the rate in effect as of June 30, 2017. |
| (g) | Illiquid security—As of June 30, 2017, the total market value of these securities deemed illiquid under procedures approved by the Board of Trustees was $256,619, which represented less than one-tenth of a percent of the Portfolio’s net assets. |
| (h) | Non-income producing security. |
| (j) | As of June 30, 2017, cost was $561,323,652 for federal income tax purposes and net unrealized appreciation was as follows: |
| | | | |
Gross unrealized appreciation | | $ | 45,761,523 | |
Gross unrealized depreciation | | | (9,765,864 | ) |
| | | | |
Net unrealized appreciation | | $ | 35,995,659 | |
| | | | |
| | | | |
| 22 | | MainStay VP Income Builder Portfolio | | The notes to the financial statements are an integral part of,
and should be read in conjunction with, the financial statements. |
As of June 30, 2017, the Portfolio held the following foreign currency forward contracts:
| | | | | | | | | | | | | | | | | | | | | | | | | | | | | | |
Foreign Currency Buy Contracts | | Expiration
Date | | | Counterparty | | Contract
Amount
Purchased | | | Contract
Amount
Sold | | | Unrealized
Appreciation
(Depreciation) | |
Euro vs. U.S. Dollar | | | 8/1/17 | | | JPMorgan Chase Bank N.A. | | | EUR | | | | 645,000 | | | | | | | $ | 707,980 | | | | | | | $ | 29,724 | |
Pound Sterling vs. U.S. Dollar | | | 8/1/17 | | | JPMorgan Chase Bank N.A. | | | GBP | | | | 61,000 | | | | | | | | 78,135 | | | | | | | | 1,383 | |
| | | | | | | | |
| | | | | | | | | | | | | | | | | | | | | | | | | | | | | | |
Foreign Currency Sales Contracts | | | | | | | Contract
Amount
Sold | | | Contract
Amount
Purchased | | | Unrealized
Appreciation
(Depreciation) | |
Canadian Dollar vs. U.S. Dollar | | | 8/1/17 | | | JPMorgan Chase Bank N.A. | | | CAD | | | | 7,924,000 | | | | | | | | 5,869,847 | | | | | | | | (243,617 | ) |
Euro vs. U.S. Dollar | | | 8/1/17 | | | JPMorgan Chase Bank N.A. | | | EUR | | | | 33,357,000 | | | | | | | | 35,919,513 | | | | | | | | (2,231,840 | ) |
Pound Sterling vs. U.S. Dollar | | | 8/1/17 | | | JPMorgan Chase Bank N.A. | | | GBP | | | | 13,419,000 | | | | | | | | 17,204,920 | | | | | | | | (287,617 | ) |
Net unrealized appreciation (depreciation) on foreign currency forward contracts | | | | | | | | | | | | | | | | | | | $ | (2,731,967 | ) |
As of June 30, 2017, the Portfolio held the following futures contracts1:
| | | | | | | | | | | | | | | | |
Type | | Number of
Contracts
Long
(Short) | | | Expiration
Date | | | Notional
Amount | | | Unrealized
Appreciation
(Depreciation)2 | |
| 2-Year United States Treasury Note | | | (128 | ) | | | September 2017 | | | $ | (27,662,000 | ) | | $ | 37,723 | |
| 5-Year United States Treasury Note | | | 362 | | | | September 2017 | | | | 42,656,610 | | | | (72,940 | ) |
| 10-Year United States Treasury Note | | | (113 | ) | | | September 2017 | | | | (14,185,031 | ) | | | 5,995 | |
| EURO STOXX 50 | | | 675 | | | | September 2017 | | | | 26,451,330 | | | | (1,008,219 | ) |
| Standard & Poor’s 500 Index Mini | | | 505 | | | | September 2017 | | | | 61,127,725 | | | | (365,948 | ) |
| Nikkei 225 | | | 210 | | | | September 2017 | | | | 18,731,495 | | | | (61,346 | ) |
| United States Treasury Bond | | | 204 | | | | September 2017 | | | | 31,352,250 | | | | 208,310 | |
| | | | | | | | | | | | | | | | |
| | | | | | | | | | $ | 138,472,379 | | | $ | (1,256,425 | ) |
| | | | | | | | | | | | | | | | |
| 1. | As of June 30, 2017, cash in the amount of $5,637,893 was on deposit with a broker for futures transactions. |
| 2. | Represents the difference between the value of the contracts at the time they were opened and the value as of June 30, 2017. |
The following abbreviations are used in the preceding pages:
ADR—American Depositary Receipt
CAD—Canadian Dollar
EUR—Euro
GBP—British Pound Sterling
| | | | | | |
The notes to the financial statements are an integral part of,
and should be read in conjunction with, the financial statements. | | | | | 23 | |
Portfolio of Investments June 30, 2017 (Unaudited) (continued)
The following is a summary of the fair valuations according to the inputs used as of June 30, 2017, for valuing the Portfolio’s assets and liabilities.
Asset Valuation Inputs
| | | | | | | | | | | | | | | | |
Description | | Quoted Prices in Active Markets for
Identical Assets (Level 1) | | | Significant
Other
Observable
Inputs (Level 2) | | | Significant
Unobservable
Inputs (Level 3) | | | Total | |
| Investments in Securities (a) | | | | | | | | | | | | | | | | |
| Long-Term Bonds | | | | | | | | | | | | | | | | |
Asset-Backed Securities | | $ | — | | | $ | 897,863 | | | $ | — | | | $ | 897,863 | |
Corporate Bonds | | | — | | | | 247,065,397 | | | | — | | | | 247,065,397 | |
Foreign Bonds | | | — | | | | 876,337 | | | | — | | | | 876,337 | |
Loan Assignments (b) | | | — | | | | 32,600,904 | | | | 2,099,713 | | | | 34,700,617 | |
Mortgage-Backed Securities (c) | | | — | | | | 3,827,261 | | | | 251,190 | | | | 4,078,451 | |
U.S. Government & Federal Agencies | | | — | | | | 17,309,751 | | | | — | | | | 17,309,751 | |
| | | | | | | | | | | | | | | | |
| Total Long-Term Bonds | | | — | | | | 302,577,513 | | | | 2,350,903 | | | | 304,928,416 | |
| | | | | | | | | | | | | | | | |
| Common Stocks (d) | | | 259,702,598 | | | | — | | | | 5,429 | | | | 259,708,027 | |
| Short-Term Investment | | | | | | | | | | | | | | | | |
Repurchase Agreement | | | — | | | | 32,682,868 | | | | — | | | | 32,682,868 | |
| | | | | | | | | | | | | | | | |
| Total Investments in Securities | | | 259,702,598 | | | | 335,260,381 | | | | 2,356,332 | | | | 597,319,311 | |
| | | | | | | | | | | | | | | | |
| Other Financial Instruments | | | | | | | | | | | | | | | | |
Foreign Currency Forward Contract (e) | | | — | | | | 31,107 | | | | — | | | | 31,107 | |
Futures Contracts (e) | | | 252,028 | | | | — | | | | — | | | | 252,028 | |
| | | | | | | | | | | | | | | | |
| Total Investments in Securities and Other Financial Instruments | | $ | 259,954,626 | | | $ | 335,291,488 | | | $ | 2,356,332 | | | $ | 597,602,446 | |
| | | | | | | | | | | | | | | | |
Liability Valuation Inputs
| | | | | | | | | | | | | | | | |
Description | | Quoted
Prices in
Active
Markets for
Identical
Assets (Level 1) | | | Significant
Other
Observable
Inputs (Level 2) | | | Significant
Unobservable
Inputs (Level 3) | | | Total | |
| Other Financial Instruments | | | | | | | | | | | | | | | | |
Foreign Currency Forward Contract (e) | | $ | — | | | $ | (2,673,074 | ) | | $ | — | | | $ | (2,673,074 | ) |
Futures Contracts (e) | | | (1,508,453 | ) | | | — | | | | — | | | | (1,508,453 | ) |
| | | | | | | | | | | | | | | | |
| Total Other Financial Instruments | | $ | (1,508,453 | ) | | $ | (2,763,074 | ) | | $ | — | | | $ | (4,271,527 | ) |
| | | | | | | | | | | | | | | | |
| (a) | For a complete listing of investments and their industries, see the Portfolio of Investments. |
| (b) | The Level 3 securities valued at $1,068,291 and $1,031,422 are held in Health Care—Products and Iron & Steel, respectively, within the Loan Assignments section of the Portfolio of Investments. |
| (c) | The Level 3 security valued at $251,190 is held in Residential Mortgage (Collateralized Mortgage Obligation) within the Mortgage-Backed Securities section of the Portfolio of Investments. |
| (d) | The Level 3 security valued at $5,429 is held in Media within the Common Stocks section of the Portfolio of Investments. |
| (e) | The value listed for these securities reflects unrealized appreciation (depreciation) as shown on the Portfolio of Investments. |
The Portfolio recognizes transfers between the levels as of the beginning of the period.
As of June 30, 2017, certain foreign equity securities with a market value of $92,180,687 were transferred from Level 2 to Level 1 as the prices of these securities were based on observable quoted prices in active markets.
As of June 30, 2017, a loan assignment with a market value of $1,097,168 transferred from Level 2 to Level 3. The transfer occurred as a result of utilizing significant unobservable inputs. As of December 31, 2016, the fair value obtained for this loan assignment, from an independent pricing service, utilized significant observable inputs.
| | | | |
| 24 | | MainStay VP Income Builder Portfolio | | The notes to the financial statements are an integral part of,
and should be read in conjunction with, the financial statements. |
As of June 30, 2017, a loan assignment with a market value of $528,000 transferred from Level 3 to Level 2. The transfer occurred as a result of utilizing significant observable inputs. As of December 31, 2016, the fair value obtained for this loan assignment, from an independent pricing service, utilized significant unobservable inputs.
The following is a reconciliation of investments in which significant unobservable inputs (Level 3) were used in determining value:
| | | | | | | | | | | | | | | | | | | | | | | | | | | | | | | | | | | | | | | | |
Investments in Securities | | Balance as of
December 31,
2016 | | | Accrued
Discounts
(Premiums) | | | Realized
Gain
(Loss) | | | Change in
Unrealized
Appreciation
(Depreciation) | | | Purchases | | | Sales (a) | | | Transfers
in to Level 3 | | | Transfers
out of
Level 3 | | | Balance as of
June 30,
2017 | | | Change in
Unrealized
Appreciation
(Depreciation)
from
Investments
Still Held at
June 30,
2017 (b) | |
| Long-Term Bonds | | | | | | | | | | | | | | | | | | | | | | | | | | | | | | | | | | | | | | | | |
Loan Assignments | | | | | | | | | | | | | | | | | | | | | | | | | | | | | | | | | | | | | | | | |
Health Care—Services | | $ | 528,000 | | | $ | 356 | | | $ | 120 | | | $ | (7,813 | ) | | $ | 1,072,312 | | | $ | (62,430 | ) | | $ | 1,097,168 | | | $ | (528,000 | ) | | $ | 2,099,713 | | | $ | (7,813 | ) |
Mortgage-Backed Securities | | | | | | | | | | | | | | | | | | | | | | | | | | | | | | | | | | | | | | | | |
Residential Mortgages (Collateralized Mortgage Obligations) | | | 266,149 | | | | — | | | | — | | | | 3,796 | | | | — | | | | (18,755 | ) | | | — | | | | — | | | | 251,190 | | | | 3,796 | |
| Common Stocks | | | | | | | | | | | | | | | | | | | | | | | | | | | | | | | | | | | | | | | | |
Media | | | 4,283 | | | | — | | | | — | | | | 1,146 | | | | — | | | | — | | | | — | | | | — | | | | 5,429 | | | | 1,146 | |
| | | | | | | | | | | | | | | | | | | | | | | | | | | | | | | | | | | | | | | | |
| Total | | $ | 798,432 | | | $ | 356 | | | $ | 120 | | | $ | (2,871 | ) | | $ | 1,072,312 | | | $ | (81,185 | ) | | $ | 1,097,168 | | | $ | (528,000 | ) | | $ | 2,356,332 | | | $ | (2,871 | ) |
| | | | | | | | | | | | | | | | | | | | | | | | | | | | | | | | | | | | | | | | |
| (a) | Sales include principal reductions. |
| (b) | Included in “Net change in unrealized appreciation (depreciation) on investments” in the Statement of Operations. |
| | | | | | |
The notes to the financial statements are an integral part of,
and should be read in conjunction with, the financial statements. | | | | | 25 | |
Statement of Assets and Liabilities as of June 30, 2017 (Unaudited)
| | | | |
| Assets | |
Investment in securities, at value
(identified cost $560,914,745) | | $ | 597,319,311 | |
Cash collateral on deposit at broker | | | 5,637,893 | |
Cash denominated in foreign currencies
(identified cost $63,144) | | | 65,635 | |
Receivables: | | | | |
Dividends and interest | | | 4,130,078 | |
Fund shares sold | | | 340,844 | |
Investment securities sold | | | 38,215 | |
Variation margin on futures contracts | | | 13,333 | |
Other assets | | | 3,243 | |
Unrealized appreciation on foreign currency forward contracts | | | 31,107 | |
| | | | |
Total assets | | | 607,579,659 | |
| | | | |
|
| Liabilities | |
Due to custodian | | | 816 | |
Payables: | | | | |
Investment securities purchased | | | 807,024 | |
Fund shares redeemed | | | 297,832 | |
Manager (See Note 3) | | | 285,383 | |
NYLIFE Distributors (See Note 3) | | | 82,131 | |
Shareholder communication | | | 43,062 | |
Professional fees | | | 34,124 | |
Custodian | | | 30,453 | |
Trustees | | | 982 | |
Accrued expenses | | | 13,397 | |
Interest expense and fees payable | | | 28,995 | |
Unrealized depreciation on foreign currency forward contracts | | | 2,763,074 | |
| | | | |
Total liabilities | | | 4,387,273 | |
| | | | |
Net assets | | $ | 603,192,386 | |
| | | | |
|
| Composition of Net Assets | |
Shares of beneficial interest outstanding (par value of $.001 per share) unlimited number of shares authorized | | $ | 36,449 | |
Additional paid-in capital | | | 557,767,080 | |
| | | | |
| | | 557,803,529 | |
Undistributed net investment income | | | 1,185,359 | |
Accumulated net realized gain (loss) on investments, unfunded commitments, futures transactions and foreign currency transactions | | | 11,547,321 | |
Net unrealized appreciation (depreciation) on investments and futures contracts | | | 35,148,141 | |
Net unrealized appreciation (depreciation) on translation of other assets and liabilities in foreign currencies and foreign currency forward contracts | | | (2,491,964 | ) |
| | | | |
Net assets | | $ | 603,192,386 | |
| | | | |
| | | | |
Initial Class | | | | |
Net assets applicable to outstanding shares | | $ | 206,407,953 | |
| | | | |
Shares of beneficial interest outstanding | | | 12,413,539 | |
| | | | |
Net asset value per share outstanding | | $ | 16.63 | |
| | | | |
Service Class | | | | |
Net assets applicable to outstanding shares | | $ | 396,784,433 | |
| | | | |
Shares of beneficial interest outstanding | | | 24,035,793 | |
| | | | |
Net asset value per share outstanding | | $ | 16.51 | |
| | | | |
| | | | |
| 26 | | MainStay VP Income Builder Portfolio | | The notes to the financial statements are an integral part of,
and should be read in conjunction with, the financial statements. |
Statement of Operations for the six months ended June 30, 2017 (Unaudited)
| | | | |
| Investment Income (Loss) | |
Income | | | | |
Dividends (a) | | $ | 6,147,725 | |
Interest (b) | | | 5,595,196 | |
| | | | |
Total income | | | 11,742,921 | |
| | | | |
Expenses | | | | |
Manager (See Note 3) | | | 1,661,963 | |
Distribution/Service—Service Class (See Note 3) | | | 473,453 | |
Professional fees | | | 49,912 | |
Shareholder communication | | | 46,758 | |
Interest expense | | | 28,664 | |
Custodian | | | 18,575 | |
Trustees | | | 7,106 | |
Miscellaneous | | | 18,517 | |
| | | | |
Total expenses | | | 2,304,948 | |
| | | | |
Net investment income (loss) | | | 9,437,973 | |
| | | | |
|
| Realized and Unrealized Gain (Loss) on Investments, Futures Contracts and Foreign Currency Transactions | |
Net realized gain (loss) on: | | | | |
Investment transactions | | | 8,490,158 | |
Futures transactions | | | 10,850,561 | |
Foreign currency transactions | | | 434,952 | |
| | | | |
Net realized gain (loss) on investments, futures transactions and foreign currency transactions | | | 19,775,671 | |
| | | | |
Net change in unrealized appreciation (depreciation) on: | | | | |
Investments and unfunded commitments | | | 14,206,783 | |
Unfunded commitments | | | (521 | ) |
Futures contracts | | | (1,851,020 | ) |
Translation of other assets and liabilities in foreign currencies and foreign currency forward contracts | | | (3,492,446 | ) |
| | | | |
Net change in unrealized appreciation (depreciation) on investments, unfunded commitments, futures contracts and foreign currency transactions | | | 8,862,796 | |
| | | | |
Net realized and unrealized gain (loss) on investments, unfunded commitments, futures transactions and foreign currency transactions | | | 28,638,467 | |
| | | | |
Net increase (decrease) in net assets resulting from operations | | $ | 38,076,440 | |
| | | | |
| (a) | Dividends recorded net of foreign withholding taxes in the amount of $430,044. |
| (b) | Interest recorded net of foreign withholding taxes in the amount of $1,757. |
| | | | | | |
The notes to the financial statements are an integral part of,
and should be read in conjunction with, the financial statements. | | | | | 27 | |
Statements of Changes in Net Assets
for the six months ended June 30, 2017 (Unaudited) and the year ended December 31, 2016
| | | | | | | | |
| | | 2017 | | | 2016 | |
| Increase (Decrease) in Net Assets | |
Operations: | |
Net investment income (loss) | | $ | 9,437,973 | | | $ | 17,809,226 | |
Net realized gain (loss) on investments, futures transactions and foreign currency transactions | | | 19,775,671 | | | | (3,822,586 | ) |
Net change in unrealized appreciation (depreciation) on investments, unfunded commitments, futures contracts and foreign currency transactions | | | 8,862,796 | | | | 32,494,139 | |
| | | | |
Net increase (decrease) in net assets resulting from operations | | | 38,076,440 | | | | 46,480,779 | |
| | | | |
Dividends and distributions to shareholders: | | | | | | | | |
From net investment income: | | | | | | | | |
Initial Class | | | (4,915,801 | ) | | | (8,818,603 | ) |
Service Class | | | (8,833,325 | ) | | | (13,805,638 | ) |
| | | | |
| | | (13,749,126 | ) | | | (22,624,241 | ) |
| | | | |
From net realized gain on investments: | | | | | | | | |
Initial Class | | | — | | | | (1,109,115 | ) |
Service Class | | | — | | | | (1,918,180 | ) |
| | | | |
| | | — | | | | (3,027,295 | ) |
| | | | |
Total dividends and distributions to shareholders | | | (13,749,126 | ) | | | (25,651,536 | ) |
| | | | |
Capital share transactions: | | | | | | | | |
Net proceeds from sale of shares | | | 41,523,670 | | | | 79,279,643 | |
Net asset value of shares issued to shareholders in reinvestment of dividends and distributions | | | 13,749,126 | | | | 25,651,536 | |
Cost of shares redeemed | | | (40,215,057 | ) | | | (77,501,384 | ) |
| | | | |
Increase (decrease) in net assets derived from capital share transactions | | | 15,057,739 | | | | 27,429,795 | |
| | | | |
Net increase (decrease) in net assets | | | 39,385,053 | | | | 48,259,038 | |
|
| Net Assets | |
Beginning of period | | | 563,807,333 | | | | 515,548,295 | |
| | | | |
End of period | | $ | 603,192,386 | | | $ | 563,807,333 | |
| | | | |
Undistributed net investment income at end of period | | $ | 1,185,359 | | | $ | 5,496,512 | |
| | | | |
| | | | |
| 28 | | MainStay VP Income Builder Portfolio | | The notes to the financial statements are an integral part of,
and should be read in conjunction with, the financial statements. |
Financial Highlights selected per share data and ratios
| | | | | | | | | | | | | | | | | | | | | | | | | | | | |
| | | Six months
ended
June 30, | | | | | | Year ended December 31, | |
| Initial Class | | 2017* | | | | | | 2016 | | | 2015 | | | 2014 | | | 2013 | | | 2012 | |
Net asset value at beginning of period | | $ | 15.94 | | | | | | | $ | 15.31 | | | $ | 17.30 | | | $ | 17.70 | | | $ | 15.63 | | | $ | 14.18 | |
| | | | | | | | | | | | | | | | | | | | | | | | | | | | |
Net investment income (loss) (a) | | | 0.28 | | | | | | | | 0.54 | | | | 0.64 | | | | 0.80 | | | | 0.69 | | | | 0.68 | |
Net realized and unrealized gain (loss) on investments | | | 0.90 | | | | | | | | 0.72 | | | | (1.36 | ) | | | 0.36 | | | | 2.22 | | | | 1.48 | |
Net realized and unrealized gain (loss) on foreign currency transactions | | | (0.09 | ) | | | | | | | 0.14 | | | | 0.14 | | | | 0.23 | | | | (0.08 | ) | | | (0.04 | ) |
| | | | | | | | | | | | | | | | | | | | | | | | | | | | |
Total from investment operations | | | 1.09 | | | | | | | | 1.40 | | | | (0.58 | ) | | | 1.39 | | | | 2.83 | | | | 2.12 | |
| | | | | | | | | | | | | | | | | | | | | | | | | | | | |
| Less dividends and distributions: | | | | | | | | | | | | | | | | | | | | | | | | | | | | |
From net investment income | | | (0.40 | ) | | | | | | | (0.68 | ) | | | (0.80 | ) | | | (1.04 | ) | | | (0.76 | ) | | | (0.67 | ) |
From net realized gain on investments | | | — | | | | | | | | (0.09 | ) | | | (0.61 | ) | | | (0.75 | ) | | | — | | | | — | |
| | | | | | | | | | | | | | | | | | | | | | | | | | | | |
Total dividends and distributions | | | (0.40 | ) | | | | | | | (0.77 | ) | | | (1.41 | ) | | | (1.79 | ) | | | (0.76 | ) | | | (0.67 | ) |
| | | | | | | | | | | | | | | | | | | | | | | | | | | | |
Net asset value at end of period | | $ | 16.63 | | | | | | | $ | 15.94 | | | $ | 15.31 | | | $ | 17.30 | | | $ | 17.70 | | | $ | 15.63 | |
| | | | | | | | | | | | | | | | | | | | | | | | | | | | |
Total investment return (b) | | | 6.82 | % | | | | | | | 9.30 | % | | | (3.50 | %) | | | 8.10 | % | | | 18.38 | % | | | 15.00 | % |
| Ratios (to average net assets)/Supplemental Data: | | | | | | | | | | | | | | | | | | | | | | | | | | | | |
Net investment income (loss) | | | 3.39 | %†† | | | | | | | 3.47 | % | | | 3.79 | % | | | 4.44 | % | | | 4.05 | % | | | 4.44 | % |
Net expenses | | | 0.63 | %†† | | | | | | | 0.63 | % | | | 0.63 | % | | | 0.63 | % | | | 0.64 | % | | | 0.64 | % |
Portfolio turnover rate | | | 15 | % | | | | | | | 28 | % | | | 35 | % | | | 13 | % | | | 22 | % | | | 34 | % |
Net assets at end of period (in 000’s) | | $ | 206,408 | | | | | | | $ | 202,450 | | | $ | 206,198 | | | $ | 234,670 | | | $ | 234,999 | | | $ | 214,268 | |
| (a) | Per share data based on average shares outstanding during the period. |
| (b) | Total return does not reflect any deduction of sales charges, mortality and expense charges, contract charges or administrative charges. For periods of less than one year, total return is not annualized. |
| | | | | | | | | | | | | | | | | | | | | | | | | | | | |
| | | Six months
ended
June 30, | | | | | | Year ended December 31, | |
| Service Class | | 2017* | | | | | | 2016 | | | 2015 | | | 2014 | | | 2013 | | | 2012 | |
Net asset value at beginning of period | | $ | 15.83 | | | | | | | $ | 15.21 | | | $ | 17.20 | | | $ | 17.57 | | | $ | 15.54 | | | $ | 14.12 | |
| | | | | | | | | | | | | | | | | | | | | | | | | | | | |
Net investment income (loss) (a) | | | 0.26 | | | | | | | | 0.50 | | | | 0.59 | | | | 0.74 | | | | 0.63 | | | | 0.63 | |
Net realized and unrealized gain (loss) on investments | | | 0.89 | | | | | | | | 0.72 | | | | (1.35 | ) | | | 0.38 | | | | 2.22 | | | | 1.47 | |
Net realized and unrealized gain (loss) on foreign currency transactions | | | (0.09 | ) | | | | | | | 0.14 | | | | 0.14 | | | | 0.23 | | | | (0.08 | ) | | | (0.04 | ) |
| | | | | | | | | | | | | | | | | | | | | | | | | | | | |
Total from investment operations | | | 1.06 | | | | | | | | 1.36 | | | | (0.62 | ) | | | 1.35 | | | | 2.77 | | | | 2.06 | |
| | | | | | | | | | | | | | | | | | | | | | | | | | | | |
| Less dividends and distributions: | | | | | | | | | | | | | | | | | | | | | | | | | | | | |
From net investment income | | | (0.38 | ) | | | | | | | (0.65 | ) | | | (0.76 | ) | | | (0.97 | ) | | | (0.74 | ) | | | (0.64 | ) |
From net realized gain on investments | | | — | | | | | | | | (0.09 | ) | | | (0.61 | ) | | | (0.75 | ) | | | — | | | | — | |
| | | | | | | | | | | | | | | | | | | | | | | | | | | | |
Total dividends and distributions | | | (0.38 | ) | | | | | | | (0.74 | ) | | | (1.37 | ) | | | (1.72 | ) | | | (0.74 | ) | | | (0.64 | ) |
| | | | | | | | | | | | | | | | | | | | | | | | | | | | |
Net asset value at end of period | | $ | 16.51 | | | | | | | $ | 15.83 | | | $ | 15.21 | | | $ | 17.20 | | | $ | 17.57 | | | $ | 15.54 | |
| | | | | | | | | | | | | | | | | | | | | | | | | | | | |
Total investment return (b) | | | 6.69 | % | | | | | | | 9.03 | % | | | (3.74 | %) | | | 7.83 | % | | | 18.08 | % | | | 14.71 | % |
| Ratios (to average net assets)/Supplemental Data: | | | | | | | | | | | | | | | | | | | | | | | | | | | | |
Net investment income (loss) | | | 3.15 | %†† | | | | | | | 3.20 | % | | | 3.54 | % | | | 4.12 | % | | | 3.75 | % | | | 4.17 | % |
Net expenses | | | 0.88 | %†† | | | | | | | 0.88 | % | | | 0.88 | % | | | 0.88 | % | | | 0.89 | % | | | 0.89 | % |
Portfolio turnover rate | | | 15 | % | | | | | | | 28 | % | | | 35 | % | | | 13 | % | | | 22 | % | | | 34 | % |
Net assets at end of period (in 000’s) | | $ | 396,784 | | | | | | | $ | 361,357 | | | $ | 309,350 | | | $ | 284,391 | | | $ | 196,833 | | | $ | 102,993 | |
| (a) | Per share data based on average shares outstanding during the period. |
| (b) | Total return does not reflect any deduction of sales charges, mortality and expense charges, contract charges or administrative charges. For periods of less than one year, total return is not annualized. |
| | | | | | |
The notes to the financial statements are an integral part of,
and should be read in conjunction with, the financial statements. | | | | | 29 | |
Notes to Financial Statements (Unaudited)
Note 1–Organization and Business
MainStay VP Funds Trust (the “Fund”) was organized as a Delaware statutory trust on February 1, 2011. The Fund is registered under the Investment Company Act of 1940, as amended (the “1940 Act”), as an open-end management investment company. The Fund is comprised of thirty-two separate series (collectively referred to as the “Portfolios”). These financial statements and notes relate to the MainStay VP Income Builder Portfolio (the “Portfolio”), a “diversified” portfolio, as that term is defined in the 1940 Act, as interpreted or modified by regulatory authorities having jurisdiction, from time to time.
Shares of the Portfolio are currently offered to certain separate accounts to fund variable annuity policies and variable universal life insurance policies issued by New York Life Insurance and Annuity Corporation (“NYLIAC”), a wholly-owned subsidiary of New York Life Insurance Company (“New York Life”). NYLIAC allocates shares of the Portfolios to, among others, NYLIAC Variable Annuity Separate Accounts-I, II, III and IV, VUL Separate Account-I and CSVUL Separate Account-I (collectively, the “Separate Accounts”). Shares of the Portfolio are also offered to the MainStay VP Conservative Allocation Portfolio, MainStay VP Moderate Allocation Portfolio, MainStay VP Moderate Growth Allocation Portfolio and MainStay VP Growth Allocation Portfolio, which operate as “funds-of-funds.”
The Portfolio currently offers two classes of shares. Initial Class shares commenced operations on January 29, 1993. Service Class shares commenced operations on June 4, 2003. Shares of the Portfolio are sold and are redeemed at a price equal to their respective net asset value (“NAV”) per share. No sales or redemption charge is applicable to the purchase or redemption of the Portfolio’s shares. Under the terms of the Fund’s multiple class plan adopted pursuant to Rule 18f-3 under the 1940 Act, the classes differ in that, among other things, Service Class shares of the Portfolio pay a combined distribution and service fee of 0.25% of average daily net assets attributable to Service Class shares of the Portfolio to the Distributor (as defined in Note 3(B)) pursuant to a plan adopted in accordance with Rule 12b-1 under the 1940 Act. Contract owners of variable annuity contracts purchased after June 2, 2003, are permitted to invest only in the Service Class shares.
The Portfolio’s investment objective is to seek current income consistent with reasonable opportunity for future growth of capital and income.
Note 2–Significant Accounting Policies
The Portfolio is an investment company and accordingly follows the investment company accounting and reporting guidance of the Financial Accounting Standards Board (“FASB”) Accounting Standard Codification Topic 946 Financial Services—Investment Companies. The Portfolio prepares its financial statements in accordance with generally accepted accounting principles (“GAAP”) in the United States of America and follows the significant accounting policies described below.
(A) Securities Valuation. Investments are usually valued as of the close of regular trading on the New York Stock Exchange (the “Exchange”) (usually 4:00 p.m. Eastern time) on each day the Portfolio is open for business (“valuation date”).
The Board of Trustees (the “Board”) of the Fund adopted procedures establishing methodologies for the valuation of the Portfolio’s securities
and other assets and delegated the responsibility for valuation determinations under those procedures to the Valuation Committee of the Fund (the “Valuation Committee”). The Board authorized the Valuation Committee to appoint a Valuation Sub-Committee (the “Sub-Committee”) to deal in the first instance with establishing the prices of securities for which market quotations are not readily available or the prices of which are not otherwise readily determinable under these procedures. The Sub-Committee meets (in person, via electronic mail or via teleconference) on an as-needed basis. Subsequently, the Valuation Committee meets to ensure that actions taken by the Sub-Committee were appropriate. The procedures recognize that, subject to the oversight of the Board and unless otherwise noted, the responsibility for the day-to-day valuation of portfolio assets (including fair value measurements for the Portfolio’s assets and liabilities) rests with New York Life Investment Management LLC (“New York Life Investments” or the “Manager”), aided to whatever extent necessary by the Subadvisors (as defined in Note 3(A)) to the Portfolio.
To assess the appropriateness of security valuations, the Manager, the Subadvisors or the Portfolio’s third party service provider, who is subject to oversight by the Manager, regularly compares prior day prices, prices on comparable securities and the sale prices to the prior and current day prices and challenges prices with changes exceeding certain tolerance levels with third party pricing services or broker sources. For those securities valued through either a standardized fair valuation methodology or a fair valuation measurement, the Sub-Committee deals in the first instance with such valuation and the Valuation Committee reviews and affirms, if appropriate, the reasonableness of the valuation based on such methodologies and measurements on a regular basis after considering all relevant information that is reasonably available. Any action taken by the Sub-Committee with respect to the valuation of a portfolio security or other asset is submitted by the Valuation Committee to the Board for its review and ratification, if appropriate, at its next regularly scheduled meeting.
“Fair value” is defined as the price the Portfolio would reasonably expect to receive upon selling an asset or liability in an orderly transaction to an independent buyer in the principal or most advantageous market for the asset or liability. Fair value measurements are determined within a framework that establishes a three-tier hierarchy which maximizes the use of observable market data and minimizes the use of unobservable inputs to establish a classification of fair value measurements for disclosure purposes. “Inputs” refer broadly to the assumptions that market participants would use in pricing the asset or liability, including assumptions about risk, such as the risk inherent in a particular valuation technique used to measure fair value using a pricing model and/or the risk inherent in the inputs for the valuation technique. Inputs may be observable or unobservable. Observable inputs reflect the assumptions market participants would use in pricing the asset or liability based on market data obtained from sources independent of the Portfolio. Unobservable inputs reflect the Portfolio’s own assumptions about the assumptions market participants would use in pricing the asset or liability based on the information available. The inputs or methodology used for valuing assets or liabilities may not be an indication of the risks associated with investing in those assets or liabilities. The three-tier hierarchy of inputs is summarized below.
| • | | Level 1—quoted prices in active markets for an identical asset or liability |
| | |
| 30 | | MainStay VP Income Builder Portfolio |
| • | | Level 2—other significant observable inputs (including quoted prices for a similar asset or liability in active markets, interest rates and yield curves, prepayment speeds, credit risk, etc.) |
| • | | Level 3—significant unobservable inputs (including the Portfolio’s own assumptions about the assumptions that market participants would use in measuring fair value of an asset or liability) |
The level of an asset or liability within the fair value hierarchy is based on the lowest level of an input, both individually and in the aggregate, that is significant to the fair value measurement. As of June 30, 2017, the aggregate value by input level of the Portfolio’s assets and liabilities is included at the end of the Portfolio’s Portfolio of Investments.
The Portfolio may use third party vendor evaluations, whose prices may be derived from one or more of the following standard inputs, among others:
| | |
• Benchmark yields | | • Reported trades |
• Broker/dealer quotes | | • Issuer spreads |
• Two-sided markets | | • Benchmark securities |
• Bids/offers | | • Reference data (corporate actions or material event notices) |
• Industry and economic events | | • Comparable bonds |
• Monthly payment information | | |
An asset or liability for which market values cannot be measured using the methodologies described above is valued by methods deemed reasonable in good faith by the Valuation Committee, following the procedures established by the Board, to represent fair value. Under these procedures, the Portfolio generally uses a market-based approach which may use related or comparable assets or liabilities, recent transactions, market multiples, book values, and other relevant information. The Portfolio may also use an income-based valuation approach in which the anticipated future cash flows of the asset or liability are discounted to calculate fair value. Discounts may also be applied due to the nature and/or duration of any restrictions on the disposition of the asset or liability. Fair value represents a good faith approximation of the value of a security. Fair value determinations involve the consideration of a number of subjective factors, an analysis of applicable facts and circumstances and the exercise of judgment. As a result, it is possible that the fair value for a security determined in good faith in accordance with the Portfolio’s valuation procedures may differ from valuations for the same security determined by other funds using their own valuation procedures. Although the Portfolio’s valuation procedures are designed to value a security at the price the Portfolio may reasonably expect to receive upon the security’s sale in an orderly transaction, there can be no assurance that any fair value determination thereunder would, in fact, approximate the amount that the Portfolio would actually realize upon the sale of the security or the price at which the security would trade if a reliable market price were readily available. During the six-month period ended June 30, 2017, there were no material changes to the fair value methodologies.
Securities which may be valued in this manner include, but are not limited to: (i) a security for which trading has been halted or suspended; (ii) a debt security that has recently gone into default and for which there is not a current market quotation; (iii) a security of an issuer that
has entered into a restructuring; (iv) a security that has been de-listed from a national exchange; (v) a security for which the market price is not readily available from a third party pricing source or, if so provided, does not, in the opinion of the Manager or Subadvisors, reflect the security’s market value; (vi) a security subject to trading collars for which no or limited trading takes place; and (vii) a security whose principal market has been temporarily closed at a time when, under normal conditions, it would be open. Securities for which market quotations or observable inputs are not readily available are generally categorized as Level 3 in the hierarchy. As of June 30, 2017, securities that were fair valued in such a manner are shown in the Portfolio of Investments.
Certain securities held by the Portfolio may principally trade in foreign markets. Events may occur between the time the foreign markets close and the time at which the Portfolio’s NAVs are calculated. These events may include, but are not limited to, situations relating to a single issuer in a market sector, significant fluctuations in U.S. or foreign markets, natural disasters, armed conflicts, governmental actions or other developments not tied directly to the securities markets. Should the Manager or Subadvisors conclude that such events may have affected the accuracy of the last price of such securities reported on the local foreign market, the Sub-Committee may, pursuant to procedures adopted by the Board, adjust the value of the local price to reflect the estimated impact on the price of such securities as a result of such events. In this instance, securities are generally categorized as Level 3 in the hierarchy. Additionally, certain foreign equity securities are also fair valued whenever the movement of a particular index exceeds certain thresholds. In such cases, the securities are fair valued by applying factors provided by a third party vendor in accordance with valuation procedures adopted by the Board and are generally categorized as Level 2 in the hierarchy. As of June 30, 2017, no foreign equity securities held by the Portfolio were valued in such a manner.
Equity securities are valued at the last quoted sales prices as of the close of regular trading on the relevant exchange on each valuation date. Securities that are not traded on the valuation date are valued at the mean of the last quoted bid and ask prices. Prices are normally taken from the principal market in which each security trades. Futures contracts are valued at the last posted settlement price on the market where such futures are primarily traded. These securities are generally categorized as Level 1 in the hierarchy.
Debt securities (other than convertible and municipal bonds) are valued at the evaluated bid prices (evaluated mean prices in the case of convertible and municipal bonds) supplied by a pricing agent or brokers selected by the Manager, in consultation with the Subadvisors. Those values reflect broker/dealer supplied prices and electronic data processing techniques, if the evaluated bid or mean prices are deemed by the Manager, in consultation with the Subadvisors to be representative of market values at the regular close of trading of the Exchange on each valuation date. Debt securities purchased on a delayed delivery basis are marked to market daily until settlement at the forward settlement date. Debt securities, including corporate bonds, U.S. government & federal agency bonds, municipal bonds, foreign bonds, convertible bonds, asset-backed securities and mortgage-backed securities are generally categorized as Level 2 in the hierarchy.
Foreign currency forward contracts are valued at their fair market values measured on the basis of the mean between the last current bid and
Notes to Financial Statements (Unaudited) (continued)
ask prices based on dealer or exchange quotations and are generally categorized as Level 2 in the hierarchy.
Loan assignments, participations and commitments are valued at the average of bid quotations obtained from the engaged independent pricing service and are generally categorized as Level 2 in the hierarchy.
Certain loan assignments, participations and commitments may be valued by utilizing significant unobservable inputs obtained from the pricing service and are generally categorized as Level 3 in the hierarchy. As of June 30, 2017, the Portfolio held loan assignments categorized as Level 3 securities with a value of $2,099,713 that were valued by utilizing significant unobservable inputs.
Temporary cash investments acquired in excess of 60 days to maturity at the time of purchase are valued using the latest bid prices or using valuations based on a matrix system (which considers such factors as security prices, yields, maturities, and ratings), both as furnished by independent pricing services. Other temporary cash investments which mature in 60 days or less at the time of purchase (“Short-Term Investments”) are valued using the amortized cost method of valuation, unless the use of such method would be inappropriate. The amortized cost method involves valuing a security at its cost on the date of purchase and thereafter assuming a constant amortization to maturity of the difference between such cost and the value on maturity date. Amortized cost approximates the current fair value of a security. Securities valued using the amortized cost method are not valued using quoted prices in an active market and are generally categorized as Level 2 in the hierarchy.
The information above is not intended to reflect an exhaustive list of the methodologies that may be used to value portfolio investments. The valuation procedures permit the use of a variety of valuation methodologies in connection with valuing portfolio investments. The methodology used for a specific type of investment may vary based on the market data available or other considerations. The methodologies summarized above may not represent the specific means by which portfolio investments are valued on any particular business day.
A portfolio security or other asset may be determined to be illiquid under procedures approved by the Board. Illiquidity of a security might prevent the sale of such security at a time when the Manager or Subadvisors might wish to sell, and these securities could have the effect of decreasing the overall level of the Portfolio’s liquidity. Further, the lack of an established secondary market may make it more difficult to value illiquid securities, requiring the Portfolio to rely on judgments that may be somewhat subjective in measuring value, which could vary materially from the amount that the Portfolio could realize upon disposition. Difficulty in selling illiquid securities may result in a loss or may be costly to the Portfolio. Under the supervision of the Board, the Manager or Subadvisors determine the liquidity of the Portfolio’s investments; in doing so, the Manager or Subadvisors may consider various factors, including (i) the frequency of trades and quotations, (ii) the number of dealers and prospective purchasers, (iii) dealer undertakings to make a market, and (iv) the nature of the security and the market in which it trades (e.g., the time needed to dispose of the security, the method of soliciting offers and the mechanics of transfer). Illiquid securities are often valued in accordance with methods deemed by the Board in good faith to be reasonable and appropriate to accurately reflect their fair value. The liquidity of the Portfolio’s investments, as shown in the
Portfolio of Investments, was determined as of June 30, 2017 and can change at any time in response to, among other relevant factors, market conditions or events or developments with respect to an individual issuer or instrument. As of June 30, 2017, securities deemed to be illiquid under procedures approved by the Board are shown in the Portfolio of Investments.
(B) Income Taxes. The Portfolio’s policy is to comply with the requirements of the Internal Revenue Code of 1986, as amended (the “Internal Revenue Code”), applicable to regulated investment companies and to distribute all of its taxable income to the shareholders of the Portfolio within the allowable time limits. Therefore, no federal, state and local income tax provisions are required.
Management evaluates the Portfolio’s tax positions to determine if the tax positions taken meet the minimum recognition threshold in connection with accounting for uncertainties in income tax positions taken or expected to be taken for the purposes of measuring and recognizing tax liabilities in the financial statements. Recognition of tax benefits of an uncertain tax position is permitted only to the extent the position is “more likely than not” to be sustained assuming examination by taxing authorities. Management has analyzed the Portfolio’s tax positions taken on federal, state and local income tax returns for all open tax years (for up to three tax years), and has concluded that no provisions for federal, state and local income tax are required in the Portfolio’s financial statements. The Portfolio’s federal, state and local income and federal excise tax returns for tax years for which the applicable statutes of limitations have not expired are subject to examination by the Internal Revenue Service and state and local departments of revenue.
(C) Foreign Taxes. The Portfolio may be subject to foreign taxes on income and other transaction-based taxes imposed by certain countries in which it invests. A portion of the taxes on gains on investments or currency purchases/repatriation may be reclaimable. The Portfolio will accrue such taxes and reclaims as applicable, based upon its current interpretation of tax rules and regulations that exist in the markets in which it invests.
The Portfolio may be subject to taxation on realized capital gains, repatriation proceeds and other transaction-based taxes imposed by certain countries in which it invests. The Portfolio will accrue such taxes as applicable based upon its current interpretation of tax rules and regulations that exist in the market in which it invests. Capital gains taxes relating to positions still held are reflected as a liability on the Statement of Assets and Liabilities, as well as an adjustment to the Portfolio’s net unrealized appreciation (depreciation). Taxes related to capital gains realized, if any, are reflected as part of net realized gain (loss) in the Statement of Operations. Changes in tax liabilities related to capital gains taxes on unrealized investment gains if any, are reflected as part of the change in net unrealized appreciation (depreciation) on investments in the Statement of Operations. Transaction-based charges are generally assessed as a percentage of the transaction amount.
(D) Dividends and Distributions to Shareholders. Dividends and distributions are recorded on the ex-dividend date. The Portfolio intends to declare and pay dividends from net investment income, if any, at least quarterly and distributions from net realized capital and currency gains, if any, at least annually. Unless the shareholder elects otherwise, all dividends and distributions are reinvested in the same
| | |
| 32 | | MainStay VP Income Builder Portfolio |
class of shares of the Portfolio, at NAV. Dividends and distributions to shareholders are determined in accordance with federal income tax regulations and may differ from GAAP.
(E) Security Transactions and Investment Income. The Portfolio records security transactions on the trade date. Realized gains and losses on security transactions are determined using the identified cost method. Dividend income is recognized on the ex-dividend date; net of any foreign tax withheld at the source, and interest income is accrued as earned using the effective interest rate method and includes any realized gains and losses from repayment of principal on mortgage-backed securities. Discounts and premiums on securities purchased, other than Short-Term Investments, for the Portfolio are accreted and amortized, respectively, on the effective interest rate method over the life of the respective securities. Discounts and premiums on Short-Term Investments are accreted and amortized, respectively, on the straight-line method. The straight-line method approximates the effective interest method for Short-Term Investments.
Investment income and realized and unrealized gains and losses on investments of the Portfolio are allocated pro rata to the separate classes of shares based upon their relative net assets on the date the income is earned or realized and unrealized gains and losses are incurred.
The Portfolio may place a debt security on non-accrual status and reduce related interest income by ceasing current accruals and writing off all or a portion of any interest receivables when the collection of all or a portion of such interest has become doubtful. A debt security is removed from non-accrual status when the issuer resumes interest payments or when collectability of interest is reasonably assured.
(F) Expenses. Expenses of the Fund are allocated to the individual Portfolios in proportion to the net assets of the respective Portfolios when the expenses are incurred, except where direct allocations of expenses can be made. Expenses (other than fees incurred under the distribution and service plans, further discussed in Note 3(B), which are charged directly to the Service Class shares) are allocated to separate classes of shares pro rata based upon their relative net assets on the date the expenses are incurred. The expenses borne by the Portfolio, including those of related parties to the Portfolio, are shown in the Statement of Operations.
(G) Use of Estimates. In preparing financial statements in conformity with GAAP, management makes estimates and assumptions that affect the reported amounts and disclosures in the financial statements. Actual results could differ from those estimates.
(H) Repurchase Agreements. The Portfolio may enter into repurchase agreements (i.e., buy a security from another party with the agreement that it be sold back in the future) to earn income. The Portfolio may enter into repurchase agreements only with counterparties, usually financial institutions, that are deemed by the Manager or Subadvisors to be creditworthy, pursuant to guidelines established by the Board. During the term of any repurchase agreement, the Manager or Subadvisors will continue to monitor the creditworthiness of the counterparty. Under the 1940 Act, repurchase agreements are considered to be collateralized loans by the Portfolio to the counterparty secured by the securities transferred to the Portfolio.
Repurchase agreements are subject to counterparty risk, meaning the Portfolio could lose money by the counterparty’s failure to perform under the terms of the agreement. The Portfolio mitigates this risk by ensuring the repurchase agreement is collateralized by cash, U.S. government securities, fixed income securities and/or other securities. The collateral is held by the Portfolio’s custodian valued daily on a mark to market basis to determine if the value, including accrued interest, exceeds the repurchase price. In the event of the counterparty’s default on the obligation to repurchase, the Portfolio has the right to liquidate the collateral and apply the proceeds in satisfaction of the obligation. Under certain circumstances, such as in the event of default or bankruptcy by the counterparty, realization and/or retention of the collateral may be limited or subject to delay, to legal proceedings and possible realized loss to the Portfolio.
(I) Futures Contracts. A futures contract is an agreement to purchase or sell a specified quantity of an underlying instrument at a specified future date and price, or to make or receive a cash payment based on the value of a financial instrument (e.g., foreign currency, interest rate, security, or securities index). The Portfolio is subject to risks such as market price risk and/or interest rate risk in the normal course of investing in these transactions. Upon entering into a futures contract, the Portfolio is required to pledge to the broker or futures commission merchant an amount of cash and/or U.S. Government securities equal to a certain percentage of the collateral amount, known as the “initial margin.” During the period the futures contract is open, changes in the value of the contract are recognized as unrealized appreciation or depreciation by marking to market such contract on a daily basis to reflect the market value of the contract at the end of each day’s trading. The Portfolio agrees to receive from or pay to the broker or futures commission merchant an amount of cash equal to the daily fluctuation in the value of the contract. Such receipts or payments are known as “variation margin.” When the futures contract is closed, the Portfolio records a realized gain or loss equal to the difference between the proceeds from (or cost of) the closing transaction and the Portfolio’s basis in the contract.
The use of futures contracts involves, to varying degrees, elements of market risk in excess of the amount recognized in the Statement of Assets and Liabilities. The contract or notional amounts and variation margin reflect the extent of the Portfolio’s involvement in open futures positions. There are several risks associated with the use of futures contracts as hedging techniques. There can be no assurance that a liquid market will exist at the time when the Portfolio seeks to close out a futures contract. If no liquid market exists, the Portfolio would remain obligated to meet margin requirements until the position is closed. Futures may involve a small initial investment relative to the risk assumed, which could result in losses greater than if they had not been used. Futures may be more volatile than direct investments in the instrument underlying the futures, and may not correlate to the underlying instrument, causing a given hedge not to achieve its objectives. The Portfolio’s activities in futures contracts have minimal counterparty risk as they are conducted through regulated exchanges that guarantee the futures against default by the counterparty. In the event of a bankruptcy or insolvency of a futures commission merchant that holds margin on behalf of the Portfolio, the Portfolio may not be entitled to the return of the entire margin owed to the Portfolio, potentially resulting in a loss. The Portfolio may invest in futures contracts in order to hedge
Notes to Financial Statements (Unaudited) (continued)
against anticipated changes in interest rates that might otherwise have an adverse effect upon the value of the Portfolio’s securities. The Portfolio may also use equity index futures contracts to increase the equity sensitivity to the Portfolio. The Portfolio’s investment in futures contracts and other derivatives may increase the volatility of the Portfolio’s NAV and may result in a loss to the Portfolio. As of June 30, 2017, all open futures contracts are shown in the Portfolio of Investments.
(J) Foreign Currency Forward Contracts. The Portfolio may enter into foreign currency forward contracts, which are agreements to buy or sell foreign currencies on a specified future date at a specified rate. The Portfolio is subject to foreign currency exchange rate risk in the normal course of investing in these transactions. During the period the forward contract is open, changes in the value of the contract are recognized as unrealized appreciation or depreciation by marking to market such contract on a daily basis to reflect the market value of the contract at the end of each day’s trading. Cash movement occurs on settlement date. When the forward contract is closed, the Portfolio records a realized gain or loss equal to the difference between the proceeds from (or cost of) the closing transaction and the Portfolio’s basis in the contract. The Portfolio may purchase and sell foreign currency forward contracts for purposes of seeking to enhance portfolio returns and manage portfolio risk more efficiently. Foreign currency forward contracts may also be used to gain exposure to a particular currency or to hedge against the risk of loss due to changing currency exchange rates. Foreign currency forward contracts to purchase or sell a foreign currency may also be used in anticipation of future purchases or sales of securities denominated in foreign currency, even if the specific investments have not yet been selected.
The use of foreign currency forward contracts involves, to varying degrees, elements of risk in excess of the amount recognized in the Statement of Assets and Liabilities, including counterparty risk, market risk, and illiquidity risk. Counterparty risk is heightened for these instruments because foreign currency forward contracts are not exchange-traded and therefore no clearinghouse or exchange stands ready to meet the obligations under such contracts. Thus, the Portfolio faces the risk that its counterparties under such contracts may not perform their obligations. Market risk is the risk that the value of a foreign currency forward contract will depreciate due to unfavorable changes in exchange rates. Illiquidity risk arises because the secondary market for foreign currency forward contracts may have less liquidity relative to markets for other securities and financial instruments. Risks also arise from the possible movements in the foreign exchange rates underlying these instruments. While the Portfolio may enter into forward contracts to reduce currency exchange risks, changes in currency exchange rates may result in poorer overall performance for the Portfolio than if it had not engaged in such transactions. Exchange rate movements can be large, depending on the currency, and can last for extended periods of time, affecting the value of the Portfolio’s assets. Moreover, there may be an imperfect correlation between the Portfolio’s holdings of securities denominated in a particular currency and forward contracts entered into by the Portfolio. Such imperfect correlation may prevent the Portfolio from achieving the intended hedge or expose the Portfolio to the risk of currency exchange loss. The unrealized appreciation (depreciation) on forward contracts also reflects the Portfolio’s exposure at the valuation date to credit loss in the event of a counterparty’s failure to perform its obligations.
(K) Foreign Currency Transactions. The Portfolio’s books and records are maintained in U.S. dollars. Prices of securities denominated in foreign currency amounts are translated into U.S. dollars at the mean between the buying and selling rates last quoted by any major U.S. bank at the following dates:
| (i) | market value of investment securities, other assets and liabilities—at the valuation date; and |
| (ii) | purchases and sales of investment securities, income and expenses—at the date of such transactions. |
The assets and liabilities that are denominated in foreign currency amounts are presented at the exchange rates and market values at the close of the period. The realized and unrealized changes in net assets arising from fluctuations in exchange rates and market prices of securities are not separately presented.
Net realized gain (loss) on foreign currency transactions represents net gains and losses on foreign currency forward contracts, net currency gains or losses realized as a result of differences between the amounts of securities sale proceeds or purchase cost, dividends, interest and withholding taxes as recorded on the Portfolio’s books, and the U.S. dollar equivalent amount actually received or paid. Net currency gains or losses from valuing such foreign currency denominated assets and liabilities, other than investments at valuation date exchange rates, are reflected in unrealized foreign exchange gains or losses.
(L) Loan Assignments, Participations and Commitments. The Portfolio may invest in loan assignments and participations (“loans”). Commitments are agreements to make money available to a borrower in a specified amount, at a specified rate and within a specified time. The Portfolio records an investment when the borrower withdraws money on a commitment or when a funded loan is purchased (trade date) and records interest as earned. These loans pay interest at rates that are periodically reset by reference to a base lending rate plus a spread. These base lending rates are generally the prime rate offered by a designated U.S. bank or the London InterBank Offered Rate.
The loans in which the Portfolio may invest are generally readily marketable, but may be subject to some restrictions on resale. For example, the Portfolio may be contractually obligated to receive approval from the agent bank and/or borrower prior to the sale of these investments. If the Portfolio purchases an assignment from a lender, the Portfolio will generally have direct contractual rights against the borrower in favor of the lender. If the Portfolio purchases a participation interest either from a lender or a participant, the Portfolio typically will have established a direct contractual relationship with the seller of the participation interest, but not with the borrower. Consequently, the Portfolio is subject to the credit risk of the lender or participant who sold the participation interest to the Portfolio, in addition to the usual credit risk of the borrower. In the event that the borrower, selling participant or intermediate participants become insolvent or enters into bankruptcy, the Portfolio may incur certain costs and delays in realizing payment, or may suffer a loss of principal and/or interest.
Unfunded commitments represent the remaining obligation of the Portfolio to the borrower. At any point in time, up to the maturity date of the issue, the borrower may demand the unfunded portion. Unfunded amounts, if any, are marked to market and any unrealized gains or
| | |
| 34 | | MainStay VP Income Builder Portfolio |
losses are recorded in the Statement of Assets and Liabilities. As of June 30, 2017, the Portfolio did not hold any unfunded commitments.
(M) Securities Lending. In order to realize additional income, the Portfolio may engage in securities lending, subject to the limitations set forth in the 1940 Act and relevant guidance by the staff of the Securities and Exchange Commission (“SEC”). In the event the Portfolio does engage in securities lending, the Portfolio will lend through its custodian, State Street Bank and Trust Company (“State Street”). State Street will manage the Portfolio’s collateral in accordance with the lending agreement between the Portfolio and State Street, and indemnify the Portfolio against counterparty risk. The loans will be collateralized by U.S. Treasury securities at least equal at all times to the market value of the securities loaned. The Portfolio may bear the risk of delay in recovery of, or loss of rights in, the securities loaned should the borrower of the securities experience financial difficulty. The Portfolio may also record a realized gain or loss on securities deemed sold due to a borrower’s inability to return securities on loan. The Portfolio bears the risk of any loss on investment of the collateral. The Portfolio will receive compensation for lending its securities in the form of fees or it will retain a portion of interest on the investment of any cash received as collateral. The Portfolio will also continue to receive interest and dividends on the securities loaned and any gain or loss in the market price of the securities loaned that may occur during the term of the loan will be for the account of the Portfolio. During the six-month period ended June 30, 2017, the Portfolio did not have any portfolio securities on loan.
(N) Restricted Securities. Restricted securities, as disclosed in Note 5, are securities which have been purchased through a private offering and cannot be resold to the general public without prior registration under the Securities Act of 1933, as amended. Disposal of these securities may involve time-consuming negotiations and expenses, and it may be difficult to obtain a prompt sale at an acceptable price.
(O) Securities Risk. The Portfolio may invest in high-yield debt securities (sometimes called ‘‘junk bonds’’), which are generally considered speculative because they present a greater risk of loss, including default, than higher quality debt securities. These securities pay investors a premium—a higher interest rate or yield than investment grade debt securities—because of the increased risk of loss. These securities can also be subject to greater price volatility. In times of unusual or adverse market, economic or political conditions, these securities may experience higher than normal default rates.
The Portfolio may invest in foreign securities, which carry certain risks that are in addition to the usual risks inherent in domestic securities. These risks include those resulting from currency fluctuations, future adverse political or economic developments and possible imposition of currency exchange blockages or other foreign governmental laws or restrictions. These risks are likely to be greater in emerging markets than in developed markets. The ability of issuers of securities held by the Portfolio to meet their obligations may be affected, among other things, by economic or political developments in a specific country, industry or region.
The Portfolio may invest in loans which are usually rated below investment grade and are generally considered speculative because they present a greater risk of loss, including default, than higher rated debt
securities. These investments pay investors a higher interest rate than investment grade debt securities because of the increased risk of loss. Although certain loans are collateralized, there is no guarantee that the value of the collateral will be sufficient to repay the loan. In a recession or serious credit event, the value of these investments could decline significantly. As a result, the Portfolio’s NAVs could go down and you could lose money.
In addition, loans generally are subject to extended settlement periods that may be longer than seven days. As a result, the Portfolio may be adversely affected by selling other investments at an unfavorable time and/or under unfavorable conditions or engaging in borrowing transactions, such as borrowing against its credit facility, to raise cash to meet redemption obligations or pursue other investment opportunities.
In certain circumstances, loans may not be deemed to be securities. As a result, the Portfolio may not have the protection of anti-fraud provisions of the federal securities laws. In such cases, the Portfolio generally must rely on the contractual provisions in the loan agreement and common-law fraud protections under applicable state law.
(P) Indemnifications. Under the Fund’s organizational documents, its officers and trustees are indemnified against certain liabilities that may arise out of performance of their duties to the Fund. Additionally, in the normal course of business, the Portfolio enters into contracts with third-party service providers that contain a variety of representations and warranties and which may provide general indemnifications. The Portfolio maximum exposure under these arrangements is unknown, as this would involve future claims that may be made against the Portfolio that have not yet occurred. Based on experience, management is of the view that the risk of loss in connection with these potential indemnification obligations is remote. However, there can be no assurance that material liabilities related to such obligations will not arise in the future, which could adversely impact the Portfolio.
(Q) Quantitative Disclosure of Derivative Holdings. The following tables show additional disclosures related to the Portfolio’s derivative and hedging activities, including how such activities are accounted for and their effect on the Portfolio’s financial positions, performance and cash flows. The Portfolio entered into Treasury futures contracts in order to hedge against anticipated changes in interest rates that might otherwise have an adverse effect upon the value of the Portfolio’s securities. The Portfolio also entered into domestic and foreign equity index futures contracts to increase the equity sensitivity to the Portfolio. Foreign currency forward contracts were used to gain exposure to a particular currency or to hedge against the risk of loss due to changing currency exchange rates. These derivatives are not accounted for as hedging instruments.
Notes to Financial Statements (Unaudited) (continued)
Fair value of derivative instruments as of June 30, 2017:
Asset Derivatives
| | | | | | | | | | | | | | | | | | |
| | | Statement of Assets and Liabilities Location | | Foreign
Exchange
Contracts
Risk | | | Equity
Contracts
Risk | | | Interest
Rate
Contracts
Risk | | | Total | |
Futures Contracts | | Net Assets-Net unrealized appreciation on investments and futures contracts (a) | | $ | — | | | $ | — | | | $ | 252,028 | | | $ | 252,028 | |
Forward Contracts | | Unrealized appreciation on foreign currency forward contracts | | | 31,107 | | | | — | | | | — | | | | 31,107 | |
| | | | | | |
Total Fair Value | | | | $ | 31,107 | | | $ | — | | | $ | 252,028 | | | $ | 283,135 | |
| | | | | | |
Liability Derivatives
| | | | | | | | | | | | | | | | | | |
| | | Statement of Assets and Liabilities Location | | Foreign
Exchange
Contracts
Risk | | | Equity
Contracts
Risk | | | Interest
Rate
Contracts
Risk | | | Total | |
Futures Contracts | | Net Assets-Net unrealized depreciation on investments and futures contracts (a) | | $ | — | | | $ | (1,435,513 | ) | | $ | (72,940 | ) | | $ | (1,508,453 | ) |
Forward Contracts | | Unrealized depreciation on foreign currency forward contracts | | | (2,763,074 | ) | | | — | | | | — | | | | (2,763,074 | ) |
| | | | | | |
Total Fair Value | | | | $ | (2,763,074 | ) | | $ | (1,435,513 | ) | | $ | (72,940 | ) | | $ | (4,271,527 | ) |
| | | | | | |
| (a) | Includes cumulative appreciation (depreciation) of futures contracts as reported in the Portfolio of Investments. Only current day’s variation margin is reported within the Statement of Assets and Liabilities. |
The effect of derivative instruments on the Statement of Operations for the period ended June 30, 2017:
Realized Gain (Loss)
| | | | | | | | | | | | | | | | | | |
| | | Statement of
Operations
Location | | Foreign
Exchange
Contracts
Risk | | | Equity
Contracts
Risk | | | Interest
Rate
Contracts
Risk | | | Total | |
Futures Contracts | | Net realized gain (loss) on futures transactions | | $ | — | | | $ | 9,944,966 | | | $ | 905,595 | | | $ | 10,850,561 | |
Forward Contracts | | Net realized gain (loss) on foreign currency transactions | | | 444,109 | | | | — | | | | — | | | | 444,109 | |
| | | | | | |
Total Realized Gain (Loss) | | | | $ | 444,109 | | | $ | 9,944,966 | | | $ | 905,595 | | | $ | 11,294,670 | |
| | | | | | |
Change in Unrealized Appreciation (Depreciation)
| | | | | | | | | | | | | | | | | | |
| | | Statement of
Operations
Location | | Foreign
Exchange
Contracts
Risk | | | Equity
Contracts
Risk | | | Interest
Rate
Contracts
Risk | | | Total | |
Futures Contracts | | Net change in unrealized appreciation (depreciation) on futures contracts | | $ | — | | | $ | (2,257,384 | ) | | $ | 406,364 | | | $ | (1,851,020 | ) |
Forward Contracts | | Net change in unrealized appreciation (depreciation) on translation of other assets and liabilities in foreign currencies and foreign currency forward contracts | | | (3,937,406 | ) | | | — | | | | — | | | | (3,937,406 | ) |
| | | | | | |
Total Change in Unrealized Appreciation (Depreciation) | | | | $ | (3,937,406 | ) | | $ | (2,257,384 | ) | | $ | 406,364 | | | $ | (5,788,426 | ) |
| | | | | | |
| | |
| 36 | | MainStay VP Income Builder Portfolio |
Average Notional Amount
| | | | | | | | | | | | | | | | |
| | | Foreign
Exchange
Contracts
Risk | | | Equity
Contracts
Risk | | | Interest
Rate
Contracts
Risk | | | Total | |
Futures Contracts Long | | $ | — | | | $ | 103,150,930 | | | $ | 69,616,005 | | | $ | 172,766,935 | |
Futures Contracts Short | | $ | — | | | $ | — | | | $ | (13,678,255 | ) | | $ | (13,678,255 | ) |
Forward Contracts Long (a) | | $ | 23,263,489 | | | $ | — | | | $ | — | | | $ | 23,263,489 | |
Forward Contracts Short | | $ | (74,761,075 | ) | | $ | — | | | $ | — | | | $ | (74,761,075 | ) |
| | | | |
| (a) | Positions were open five months during reporting period. |
Note 3–Fees and Related Party Transactions
(A) Manager and Subadvisors. New York Life Investments, a registered investment adviser and an indirect, wholly-owned subsidiary of New York Life, serves as the Portfolio’s Manager, pursuant to an Amended and Restated Management Agreement (“Management Agreement”). The Manager provides offices, conducts clerical, recordkeeping and bookkeeping services, and keeps most of the financial and accounting records required to be maintained by the Portfolio. Except for the portion of salaries and expenses that are the responsibility of the Portfolio, the Manager pays the salaries and expenses of all personnel affiliated with the Portfolio and certain operational expenses of the Portfolio. The Portfolio reimburses New York Life Investments in an amount equal to a portion of the compensation of the Chief Compliance Officer attributable to the Portfolio. Pursuant to the terms of a Subadvisory Agreement with New York Life Investments, MacKay Shields LLC (“MacKay Shields” or “Subadvisor”), a registered investment adviser and an indirect, wholly-owned subsidiary of New York Life serves as a Subadvisor to the Portfolio and is responsible for the overall asset allocation decisions of the portfolio and is responsible for the day-to-day portfolio management of the fixed-income portion of the Portfolio. Pursuant to the terms of a Subadvisory Agreement with New York Life Investments, Epoch Investment Partners, Inc. (“Epoch” or “Subadvisor” and, together with MacKay Shields, the “Subadvisors”), a registered investment adviser, also serves as a Subadvisor to the Portfolio and is responsible for the day-to-day portfolio management of the equity portion of the Portfolio. New York Life Investments pays for the services of the Subadvisors.
The Fund, on behalf of the Portfolio, pays New York Life Investments in its capacity as the Portfolio’s investment manager and administrator, pursuant to the Management Agreement, a monthly fee for services performed and facilities furnished at an annual rate of the Portfolio’s average daily net assets as follows: 0.57% up to $1 billion; and 0.55% in excess of $1 billion. During the six-month period ended June 30, 2017, the effective management fee rate was 0.57%.
During the six-month period ended June 30, 2017, New York Life Investments earned fees from the Portfolio in the amount of $1,661,963.
State Street provides sub-administration and sub-accounting services to the Portfolio pursuant to an agreement with New York Life Investments. These services include calculating the daily NAVs of the Portfolio, maintaining the general ledger and sub-ledger accounts for the calculation of the Portfolio’s NAVs, and assisting New York Life Investments in conducting various aspects of the Portfolio’s administrative oper-
ations. For providing these services to the Portfolio, State Street is compensated by New York Life Investments.
(B) Distribution and Service Fees. The Fund, on behalf of the Portfolio, has entered into a distribution agreement with NYLIFE Distributors LLC (the “Distributor”), an indirect, wholly-owned subsidiary of New York Life. The Portfolio has adopted a distribution plan (the “Plan”) in accordance with the provisions of Rule 12b-1 under the 1940 Act. Under the Plan, the Distributor has agreed to provide, through its affiliates or independent third parties, various distribution-related, shareholder and administrative support services to the Service Class shareholders. For its services, the Distributor is entitled to a combined distribution and service fee accrued daily and paid monthly at an annual rate of 0.25% of the average daily net assets attributable to the Service Class shares of the Portfolio.
Note 4–Federal Income Tax
During the year ended December 31, 2016, the tax character of distributions paid as reflected in the Statement of Changes in Net Assets was as follows:
| | |
| 2016 |
Tax-Based
Distributions
from Ordinary
Income | | Tax-Based
Distributions
from Long-Term
Gains |
| $22,624,255 | | $3,027,281 |
Note 5–Restricted Securities
| | | | | | | | | | | | | | | | | | | | |
Security | | Date of
Acquisition | | | Shares | | | Cost | | | 6/30/17
Value | | | Percent of
Net Assets | |
ION Media Networks, Inc.
Common Stock | | | 3/11/14 | | | | 12 | | | $ | 21 | | | $ | 5,429 | | | | 0.0 | %‡ |
| ‡ | Less than one-tenth of a percent. |
Note 6–Custodian
State Street is the custodian of cash and securities held by the Portfolio. Custodial fees are charged to the Portfolio based on the Portfolio’s net assets and/or the market value of securities held by the Portfolio and the number of certain transactions incurred by the Portfolio.
Notes to Financial Statements (Unaudited) (continued)
Note 7–Line of Credit
The Portfolio and certain other funds managed by New York Life Investments, maintain a line of credit with a syndicate of banks in order to secure a source of funds for temporary purposes to meet unanticipated or excessive redemption requests.
Effective August 1, 2017, under the credit agreement (the “Credit Agreement”), the aggregate commitment amount is $600,000,000 with an additional uncommitted amount of $100,000,000. The commitment fee is an annual rate of 0.15% of the average commitment amount payable quarterly, regardless of usage, to State Street, who serves as the agent to the syndicate. The commitment fee is allocated among the Portfolio and certain other funds managed by New York Life Investments, based upon their respective net assets and other factors. Interest on any revolving credit loan is charged based upon the Federal Funds Rate or the one month LIBOR, whichever is higher. The Credit Agreement expires on July 31, 2018, although the Portfolio, certain other funds managed by New York Life Investments and the syndicate of banks may renew the Credit Agreement for an additional year on the same or different terms. Prior to August 1, 2017, the aggregate commitment amount was $600,000,000 with an additional uncommitted amount of $100,000,000, and the commitment fee, under a credit agreement for which Bank of New York Mellon served as agent, was at an annual rate of 0.15% of the average commitment amount. During the six-month period ended June 30, 2017, there were no borrowings made or outstanding with respect to the Portfolio under the credit agreement for which Bank of New York Mellon served as agent.
Note 8–Interfund Lending Program
Pursuant to an exemptive order issued by the SEC, the Portfolio, along with certain other funds managed by New York Life Investments, may participate in an interfund lending program. The interfund lending program provides an alternative credit facility that permits the Portfolio and certain other funds managed by New York Life Investments to lend or borrow money for temporary purposes directly to or from one another subject to the conditions of the exemptive order. During the six-month period ended June 30, 2017, there were no interfund loans made or outstanding with respect to the Portfolio.
Note 9–Purchases and Sales of Securities (in 000’s)
During the six-month period ended June 30, 2017, purchases and sales of U.S. government securities were $14,790 and $4,117, respectively. Purchases and sales of securities, other than U.S. government securities and short-term securities, were $103,534 and $77,696, respectively.
Note 10–Capital Share Transactions
Transactions in capital shares for the six-month period ended June 30, 2017, and the year ended December 31, 2016, were as follows:
| | | | | | | | |
Initial Class | | Shares | | | Amount | |
Six-month period ended June 30, 2017: | | | | | | | | |
Shares sold | | | 231,673 | | | $ | 3,804,204 | |
Shares issued to shareholders in reinvestment of dividends and distributions | | | 298,431 | | | | 4,915,800 | |
Shares redeemed | | | (814,693 | ) | | | (13,426,948 | ) |
| | | | |
Net increase (decrease) | | | (284,589 | ) | | $ | (4,706,944 | ) |
| | | | |
Year ended December 31, 2016: | | | | | | | | |
Shares sold | | | 315,429 | | | $ | 4,989,943 | |
Shares issued to shareholders in reinvestment of dividends and distributions | | | 630,119 | | | | 9,927,718 | |
Shares redeemed | | | (1,713,230 | ) | | | (26,757,579 | ) |
| | | | |
Net increase (decrease) | | | (767,682 | ) | | $ | (11,839,918 | ) |
| | | | |
| | |
| | | | | | | | |
Service Class | | Shares | | | Amount | |
Six-month period ended June 30, 2017: | | | | | | | | |
Shares sold | | | 2,307,548 | | | $ | 37,719,466 | |
Shares issued to shareholders in reinvestment of dividends and distributions | | | 540,102 | | | | 8,833,326 | |
Shares redeemed | | | (1,636,726 | ) | | | (26,788,109 | ) |
| | | | |
Net increase (decrease) | | | 1,210,924 | | | $ | 19,764,683 | |
| | | | |
Year ended December 31, 2016: | | | | | | | | |
Shares sold | | | 4,756,439 | | | $ | 74,289,700 | |
Shares issued to shareholders in reinvestment of dividends and distributions | | | 1,004,581 | | | | 15,723,818 | |
Shares redeemed | | | (3,272,535 | ) | | | (50,743,805 | ) |
| | | | |
Net increase (decrease) | | | 2,488,485 | | | $ | 39,269,713 | |
| | | | |
Note 11–Recent Accounting Pronouncement
In October 2016, the SEC adopted new rules and amended existing rules (together, “final rules”) intended to modernize the reporting and disclosure of information by registered investment companies. In part, the final rules amend Regulation S-X and require standardized, enhanced disclosure about derivatives in investment company financial statements, as well as other amendments. The compliance date for the amendments to Regulation S-X is August 1, 2017 and applies to shareholder reports for funds with fiscal periods ending after August 1, 2017. Management is currently evaluating the impact that the adoption of the amendments to Regulation S-X will have on the Portfolio’s financial statements and related disclosures.
Note 12–Subsequent Events
In connection with the preparation of the financial statements of the Portfolio as of and for the six-month period ended June 30, 2017, events and transactions subsequent to June 30, 2017, through the date the financial statements were issued have been evaluated by the Portfolio’s management for possible adjustment and/or disclosure. No subsequent events requiring financial statement adjustment or disclosure have been identified.
| | |
| 38 | | MainStay VP Income Builder Portfolio |
Proxy Voting Policies and Procedures and Proxy Voting Record
A description of the policies and procedures that New York Life Investments uses to vote proxies related to the Portfolio’s securities is available without charge, upon request, (i) by calling 800-598-2019 or (ii) by visiting the SEC’s website at www.sec.gov.
The Portfolio is required to file with the SEC its proxy voting record for the 12-month period ending June 30 on Form N-PX. The Portfolio’s most recent Form N-PX or proxy voting record is available free of charge upon request (i) by calling 800-598-2019 or; (ii) by visiting the SEC’s website at www.sec.gov.
Shareholder Reports and Quarterly Portfolio Disclosure
The Portfolio is required to file its complete schedule of portfolio holdings with the SEC for its first and third fiscal quarters on Form N-Q. The Portfolio’s Form N-Q is available without charge on the SEC’s website at www.sec.gov or by calling MainStay Investments at 800-598-2019. You also can obtain and review copies of Form N-Q by visiting the SEC’s Public Reference Room in Washington, DC (information on the operation of the Public Reference Room may be obtained by calling 1-800-SEC-0330).
This page intentionally left blank
This page intentionally left blank
This page intentionally left blank
MainStay VP Portfolios
MainStay VP offers a wide range of Portfolios. The full array of MainStay VP offerings is listed here, with information about the manager, subadvisors, legal counsel, and independent registered public accounting firm.
Equity Portfolios
MainStay VP Common Stock Portfolio
MainStay VP Cornerstone Growth Portfolio
MainStay VP Eagle Small Cap Growth Portfolio
MainStay VP Emerging Markets Equity Portfolio
MainStay VP Epoch U.S. Equity Yield Portfolio
MainStay VP Epoch U.S. Small Cap Portfolio
MainStay VP International Equity Portfolio
MainStay VP Large Cap Growth Portfolio
MainStay VP MFS® Utilities Portfolio
MainStay VP Mid Cap Core Portfolio
MainStay VP S&P 500 Index Portfolio
MainStay VP Small Cap Core Portfolio
MainStay VP T. Rowe Price Equity Income Portfolio
MainStay VP VanEck Global Hard Assets Portfolio
Mixed Asset Portfolios
MainStay VP Balanced Portfolio
MainStay VP Convertible Portfolio
MainStay VP Cushing Renaissance Advantage Portfolio
MainStay VP Income Builder Portfolio
MainStay VP Janus Henderson Balanced Portfolio
Income Portfolios
MainStay VP Bond Portfolio
MainStay VP Floating Rate Portfolio
MainStay VP Government Portfolio
MainStay VP High Yield Corporate Bond Portfolio
MainStay VP Indexed Bond Portfolio
MainStay VP PIMCO Real Return Portfolio
MainStay VP Unconstrained Bond Portfolio
Money Market
MainStay VP U.S. Government Money Market Portfolio
Alternative
MainStay VP Absolute Return Multi-Strategy Portfolio
Asset Allocation Portfolios
MainStay VP Conservative Allocation Portfolio
MainStay VP Growth Allocation Portfolio
MainStay VP Moderate Allocation Portfolio
MainStay VP Moderate Growth Allocation Portfolio
Manager
New York Life Investment Management LLC
New York, New York
Subadvisors
Candriam Belgium*
Brussels, Belgium
Candriam France S.A.S.*
Paris, France
Cornerstone Capital Management Holdings LLC*
New York, New York
Cushing Asset Management, LP
Dallas, Texas
Eagle Asset Management, Inc.
St Petersburg, Florida
Epoch Investment Partners, Inc.
New York, New York
Janus Capital Management LLC
Denver, Colorado
MacKay Shields LLC*
New York, New York
Massachusetts Financial Services Company
Boston, Massachusetts
NYL Investors LLC*
New York, New York
Pacific Investment Management Company LLC
Newport Beach, California
T. Rowe Price Associates, Inc.
Baltimore, Maryland
Van Eck Associates Corporation
New York, New York
Winslow Capital Management, LLC
Minneapolis, Minnesota
Distributor
NYLIFE Distributors LLC*
Jersey City, New Jersey
Custodian
State Street Bank and Trust Company
Boston, Massachusetts
Independent Registered Public Accounting Firm
PricewaterhouseCoopers LLP
New York, New York
Legal Counsel
Dechert LLP
Washington, District of Columbia
Some Portfolios may not be available in all products.
* An affiliate of New York Life Investment Management LLC
Not part of the Semiannual Report
2017 Semiannual Report
This report is for the general information of New York Life Variable Annuities and NYLIAC Variable Universal Life Insurance Products policyowners. It must be preceded or accompanied by the appropriate product(s) and funds prospectuses if it is given to anyone who is not an owner of a New York Life variable annuity policy or a NYLIAC Variable Universal Life Insurance Product. This report does not offer for sale or solicit orders to purchase securities.
The performance data quoted in this report represents past performance. Past performance is no guarantee of future results. Due to market volatility and other factors, current performance may be lower or higher than the figures shown. The most recent month-end performance summary for your variable annuity or variable life policy is available by calling 800-598-2019 and is updated periodically on www.newyorklife.com.
The New York Life Variable Annuities and NYLIAC Variable Universal Life Insurance Products are issued by New York Life Insurance and Annuity Corporation (a Delaware Corporation) and distributed by NYLIFE Distributors LLC (Member FINRA/SIPC).
New York Life Insurance Company
New York Life Insurance and Annuity Corporation (NYLIAC) (A Delaware Corporation)
51 Madison Avenue, Room 551
New York, NY 10010
www.newyorklife.com
Printed on recycled paper
mainstayinvestments.com
NYLIFE Distributors LLC, 30 Hudson Street, Jersey City, NJ 07302
New York Life Investment Management LLC is the investment manager to the MainStay VP Funds Trust
©2017 by NYLIFE Distributors LLC. All rights reserved.
You may obtain copies of the Prospectus and the Statement of Additional Information free of charge, upon request, by calling toll-free 800-598-2019 or writing to New York Life Insurance and Annuity Corporation, 51 Madison Avenue, New York, NY 10010.
| | | | |
| Not FDIC Insured | | No Bank Guarantee | | May Lose Value |
| | | | |
1744031 | | | | MSVPIB10-08/17 (NYLIAC) NI522 |
MainStay VP Bond Portfolio
Message from the President and Semiannual Report
Unaudited | June 30, 2017

Sign up for electronic delivery of your shareholder reports. For full details on electronic delivery, including who can participate and what you
can receive via eDelivery, please log on to www.newyorklife.com/vsc

This page intentionally left blank
Message from the President
The six months ended June 30, 2017, brought positive results to many stock and bond investors. The year began with many investors hoping that Republican control of the White House, the Senate and the House of Representatives could bring an end to political gridlock; and while debate has continued on a number of issues, the U.S. stock market climbed relatively steadily throughout the first half of 2017.
According to FTSE-Russell U.S. market data, stocks at all capitalization levels tended to record positive total returns during the reporting period, with large-cap stocks generally outperforming stocks of smaller-capitalization companies. Growth stocks outpaced value stocks at every capitalization level by substantial margins—from more than six percentage points for micro-caps and mid-caps to more than 10 percentage points for the largest 200 U.S. companies by market capitalization.
Most sectors of the stock market advanced during the reporting period, with energy and telecommunication services being notable exceptions. Energy stocks declined as oil prices fell despite moves by the Organization of Petroleum Exporting Countries (OPEC) intended to limit oil production by its members. Telecommunication services stocks tended to decline as competition increased and rising interest rates made dividend payouts less appealing.
In March and June of 2017, the Federal Reserve announced successive increases in the target range for the federal funds rate, ultimately bringing the federal funds target range to 1.00% to 1.25%. While short-term U.S. Treasury yields rose in response, yields for U.S. Treasury securities with maturities of five years or longer declined. As the difference between short- and long-term yields narrowed, the advantages of higher-yielding long-term bonds became increasingly apparent.
Virtually all taxable and tax-exempt bond sectors provided positive total returns during the reporting period. Mortgage-backed
securities, though providing positive total returns, faced headwinds when the Federal Reserve announced plans to begin normalizing its balance sheet by reducing reinvestment of principal payments on mortgage-backed securities.
International stock and bond markets were also strong during the reporting period. International stocks provided double-digit total returns that were surpassed by emerging-market stocks as a whole. Global investment-grade bonds provided single-digit returns; and emerging-market debt was somewhat stronger.
Even during periods of favorable market performance and generally positive returns, MainStay believes that it is important to carefully monitor your investments. Your risk tolerance may
change over time, leading you to reevaluate which MainStay VP Portfolios are most appropriate for your long-term goals. Your goals themselves may also change, leading you to pursue investments with more or less risk. The portfolio managers of MainStay VP Portfolios seek to provide results consistent with the investment objectives of their respective Portfolios, to give you a wide range of choices suitable to various investment needs.
The report that follows provides more detailed information about the specific markets, securities and investment decisions that influenced your MainStay VP Portfolio during the six months ended June 30, 2017. We invite you to review the report carefully as part of your ongoing investment evaluation and review.
Sincerely,

Stephen P. Fisher
President
The opinions expressed are as of the date of the accompanying report and are subject to change. Past performance is no guarantee of future results. There is no guarantee that any forecasts made will come to pass. This material does not constitute investment advice and is not intended as an endorsement of any specific investment.
Not all MainStay VP Portfolios and/or share classes are available under all policies.
Not part of the Semiannual Report
Table of Contents
Investors should refer to the Portfolio’s Summary Prospectus and/or Prospectus and consider the Portfolio’s investment objectives, strategies, risks, charges and expenses carefully before investing. The Summary Prospectus and/or Prospectus contain this and other information about the Portfolio. You may obtain copies of the Portfolio’s Summary Prospectus and/or the Prospectus and the Statement of Additional Information free of charge, upon request, by calling toll-free 800-598-2019, by writing to New York Life Insurance and Annuity Corporation, 51 Madison Avenue, Room 251, New York, New York 10010 or by sending an email to MainStayShareholdersServices@nylim.com. These documents are also available at mainstayinvestments.com/vpdocuments. Please read the Summary Prospectus and/or Prospectus carefully before investing. MainStay VP Funds Trust portfolios are separate account options which are purchased through a variable insurance or variable annuity contract.
Investment and Performance Comparison (Unaudited)
Performance data quoted represents past performance. Past performance is no guarantee of future results. Because of market volatility and other factors, current performance may be lower or higher than the figures shown. Investment return and principal value will fluctuate, and as a result, when shares are redeemed, they may be worth more or less than their original cost. The performance table and graph do not reflect any deduction of sales charges, mortality and expense charges, contract charges or administrative charges. Please refer to the Performance Summary appropriate for your policy. For performance information current to the most recent month-end, please call 800-598-2019 or visit www.newyorklife.com.
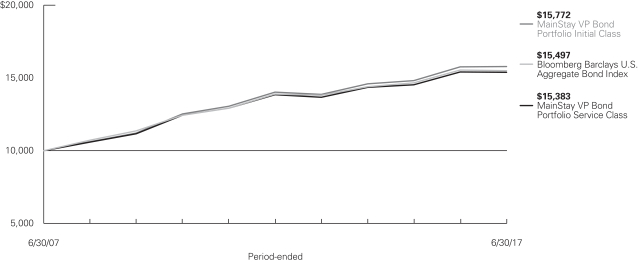
Average Annual Total Returns for the Period Ended June 30, 2017
| | | | | | | | | | | | | | | | | | | | | | | | |
| Class | | Inception
Date | | | Six Months | | | One Year | | | Five Years | | | Ten Years | | | Gross
Expense
Ratio1 | |
Initial Class Shares | | | 1/23/1984 | | | | 2.43 | % | | | 0.13 | % | | | 2.38 | % | | | 4.66 | % | | | 0.53 | % |
Service Class Shares | | | 6/4/2003 | | | | 2.31 | | | | –0.12 | | | | 2.12 | | | | 4.40 | | | | 0.78 | |
| | | | | | | | | | | | | | | | |
| Benchmark Performance | | Six
Months | | | One
Year | | | Five
Years | | | Ten
Years | |
Bloomberg Barclays U.S. Aggregate Bond Index2 | | | 2.27 | % | | | –0.31 | % | | | 2.21 | % | | | 4.48 | % |
Average Lipper Variable Products Core Bond Portfolio3 | | | 2.49 | | | | 0.41 | | | | 2.36 | | | | 4.22 | |
| 1. | The gross expense ratios presented reflect the Portfolio’s “Total Annual Portfolio Operating Expenses” from the most recent Prospectus and may differ from other expense ratios disclosed in this report. |
| 2. | The Bloomberg Barclays U.S. Aggregate Bond Index is the Portfolio’s primary broad-based securities market index for comparison purposes. The Bloomberg Barclays U.S. Aggregate Bond Index is a broad-based benchmark that measures performance of the investment-grade, U.S. dollar denominated, fixed-rate taxable bond market, including Treasurys, government-related and corporate securities, mortgage-backed securities (agency fixed-rate and hybrid adjustable-rate mortgage pass-throughs), asset-backed securities and commercial mortgage-backed securities. |
| | Results assume reinvestment of all dividends and capital gains. An investment cannot be made directly in an index. |
| 3. | The Average Lipper Variable Products Core Bond Portfolio is representative of portfolios that invest at least 85% in domestic investment-grade debt issues (rated in the top four grades) with any remaining investment in non-benchmark sectors such as high-yield, global and emerging market debt. These portfolios maintain dollar-weighted average maturities of five to ten years. The benchmark is a product of Lipper Inc. Lipper Inc. is an independent monitor of fund performance. Results are based on average total returns of similar portfolios with all dividends and capital gain distributions reinvested. |
Cost in Dollars of a $1,000 Investment in MainStay VP Bond Portfolio (Unaudited)
The example below is intended to describe the fees and expenses borne by shareholders during the six-month period from January 1, 2017 to June 30, 2017, and the impact of those costs on your investment.
Example
As a shareholder of the Portfolio, you incur two types of costs: (1) transaction costs, including exchange fees and sales charges (loads) on purchases (as applicable), and (2) ongoing costs, including management fees, distribution and/or service (12b-1) fees, and other Portfolio expenses (as applicable). This example is intended to help you understand your ongoing costs (in dollars) of investing in the Portfolio and to compare these costs with the ongoing costs of investing in other mutual funds. The example is based on an investment of $1,000 made at the beginning of the six-month period and held for the entire period from January 1, 2017 to June 30, 2017. Shares are only sold in connection with variable life and annuity contracts and the example does not reflect any contract level or transactional fees or expenses. If these costs had been included, your costs would have been higher.
This example illustrates your Portfolio’s ongoing costs in two ways:
Actual Expenses
The second and third data columns in the table below provide information about actual account values and actual expenses. You may use the information in these columns, together with the amount you invested, to estimate the expenses that you paid during the six months ended June 30, 2017. Simply divide your account value by $1,000
(for example, an $8,600 account value divided by $1,000 = 8.6), then multiply the result by the number under the heading entitled “Expenses Paid During Period” to estimate the expenses you paid on your account during this period.
Hypothetical Example for Comparison Purposes
The fourth and fifth data columns in the table below provide information about hypothetical account values and hypothetical expenses based on the Portfolio’s actual expense ratio and an assumed rate of return of 5% per year before expenses, which is not the Portfolio’s actual return. The hypothetical account values and expenses may not be used to estimate the actual ending account balances or expenses you paid for the six-month period shown. You may use this information to compare the ongoing costs of investing in the Portfolio with the ongoing costs of investing in other mutual funds. To do so, compare this 5% hypothetical example with the 5% hypothetical examples that appear in the shareholder reports of the other mutual funds.
Please note that the expenses shown in the table are meant to highlight your ongoing costs only and do not reflect any transactional costs, such as exchange fees or sales charges (loads). Therefore, the fourth and fifth data columns of the table are useful in comparing ongoing costs only and will not help you determine the relative total costs of owning different funds. In addition, if these transactional costs were included, your costs would have been higher.
| | | | | | | | | | | | | | | | | | | | | | | | |
| | | | | | | | | | | | | | | | | | | |
| Share Class | | Beginning
Account
Value
1/1/17 | | | Ending Account
Value (Based
on Actual
Returns and
Expenses)
6/30/17 | | | Expenses
Paid
During
Period1 | | | Ending Account
Value (Based
on Hypothetical
5% Annualized
Return and
Actual Expenses)
6/30/17 | | | Expenses
Paid
During
Period1 | | | Net Expense
Ratio
During
Period2 | |
| | | | | | |
| Initial Class Shares | | $ | 1,000.00 | | | $ | 1,024.30 | | | $ | 2.66 | | | $ | 1,022.20 | | | $ | 2.66 | | | | 0.53 | % |
| | | | | | |
| Service Class Shares | | $ | 1,000.00 | | | $ | 1,023.10 | | | $ | 3.91 | | | $ | 1,020.90 | | | $ | 3.91 | | | | 0.78 | % |
| 1. | Expenses are equal to the Portfolio’s annualized expense ratio of each class multiplied by the average account value over the period, divided by 365 and multiplied by 181 (to reflect the six-month period). The table above represents the actual expenses incurred during the six-month period. |
| 2. | Expenses are equal to the Portfolio’s annualized expense ratio to reflect the six-month period. |
| | |
| 6 | | MainStay VP Bond Portfolio |
Portfolio Composition as of June 30, 2017 (Unaudited)
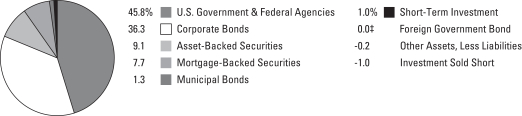
See Portfolio of Investments beginning on page 10 for specific holdings within these categories.
| ‡ | Less than one-tenth of a percent. |
Top Ten Issuers Held as of June 30, 2017 (excluding short-term investment) (Unaudited)
| 1. | United States Treasury Notes, 1.00%–2.375%, due 9/15/18–5/15/27 |
| 2. | Federal National Mortgage Association (Mortgage Pass-Through Securities), 2.50%–7.50%, due 8/1/18–7/1/47 |
| 3. | Government National Mortgage Association (Mortgage Pass-Through Securities), 2.50%–7.00%, due 7/15/31–7/1/47 |
| 4. | Federal Home Loan Mortgage Corporation (Mortgage Pass-Through Securities), 2.50%–7.00%, due 12/1/18–6/1/47 |
| 5. | Federal National Mortgage Association, 0.875%–6.25%, due 7/26/19–5/15/29 |
| 6. | United States Treasury Bonds, 3.00%–4.25%, due 5/15/39–2/15/47 |
| 7. | COMM Mortgage Trust, 2.139%–3.977%, due 6/8/30–10/10/49 |
| 8. | Federal Home Loan Mortgage Corporation, 1.00%–6.25%, due 9/27/17–7/15/32 |
| 9. | Morgan Stanley Bank of America Merrill Lynch Trust, 3.175%–4.259%, due 10/15/46–9/15/49 |
| 10. | Masco Corp., 3.50%–4.50%, due 4/1/21–5/15/47 |
Portfolio Management Discussion and Analysis (Unaudited)
Answers to the questions reflect the views of portfolio managers Donald F. Serek, CFA, Thomas J. Girard and George S. Cherpelis of NYL Investors LLC, the Portfolio’s Subadvisor.
How did MainStay VP Bond Portfolio perform relative to its benchmark and peers during the six months ended June 30, 2017?
For the six months ended June 30, 2017, MainStay VP Bond Portfolio returned 2.43% for Initial Class shares and 2.31% for Service Class shares. Over the same period, both share classes outperformed the 2.27% return of the Bloomberg Barclays U.S. Aggregate Bond Index,1 which is the Portfolio’s broad-based securities-market index. Both share classes underperformed the 2.49% return of the Average Lipper2 Variable Products Core Bond Portfolio for the six months ended June 30, 2017.
What factors affected the Portfolio’s relative performance during the reporting period?
The Portfolio maintained overweight positions relative to the Bloomberg Barclays U.S. Aggregate Bond Index in corporate bonds, asset-backed securities, commercial mortgage-backed securities and U.S. government agency securities throughout the reporting period. The Portfolio maintained an underweight position relative to the Index in the agency mortgage-backed securities sector. The corporate sector was the Portfolio’s bestperforming sector during the reporting period. Overweight positions in asset-backed securities, U.S. government agency securities and commercial mortgage-backed securities also added to performance during the six months ended June 30, 2017. Underweight positions relative to the Bloomberg Barclays U.S. Aggregate Bond Index in agency mortgage-backed securities also added to performance during the reporting period.
During the first half of the reporting period, non-corporate bonds represented the best-performing sector in the Index. The Portfolio’s underweight position relative to the benchmark in this sector detracted from relative performance during this portion of the reporting period. During the second half of the reporting period, the Portfolio earned a positive excess return from its overweight position relative to the benchmark in U.S. corporates, particularly the banking subsector, which benefited relative performance.
What was the Portfolio’s duration3 strategy during the reporting period?
The Portfolio maintained a duration close to that of the Bloomberg Barclays U.S. Aggregate Bond Index during the reporting period. There were two occasions when the duration of the Portfolio was shorter than that of the benchmark. This strategy had a slightly negative impact on the Portfolio’s performance. As of June 30, 2017, the Portfolio had a duration of 5.84 years, in line with the 5.84-year duration of the Bloomberg Barclays U.S. Aggregate Bond Index on the same date.
What specific factors, risks or market forces prompted significant decisions for the Portfolio during the reporting period?
The Portfolio maintained overweight positions relative to the Bloomberg Barclays U.S. Aggregate Bond Index in corporate bonds, commercial mortgage-backed securities and asset-backed securities. Toward the beginning of the reporting period, consistent economic data and a shift in tone at the Federal Reserve helped push interest rates higher. This provided a favorable backdrop for investment-grade corporate bonds and prompted us to increase the Portfolio’s already overweight position in that sector. During this early portion of the reporting period, we reduced the Portfolio’s allocation to residential mortgage-backed securities from equal to the Bloomberg Barclays U.S. Aggregate Bond Index to underweight relative to the benchmark. The decision to assume an underweight position in the sector was driven by the increased likelihood that the Federal Reserve would begin tapering its reinvestments of mortgage-backed security prepayments to shrink its balance sheet, which we believed would increase volatility in the mortgage market. Toward the end of the reporting period, strong fundamentals and a favorable yield profile in the commercial mortgage-backed securities sector led us to add to the Portfolio’s overweight position relative to the benchmark in that sector. During the latter portion of the reporting period, we also increased the Portfolio’s allocation to asset-backed securities by adding short-duration, high-quality assets to the Portfolio.
During the reporting period, which market segments were the strongest positive contributors to the Portfolio’s performance and which market segments were particularly weak?
During the reporting period, the Portfolio maintained overweight positions relative to the Bloomberg Barclays U.S. Aggregate Bond Index in the financials, industrials and utilities sectors. This positioning benefited the Portfolio’s performance relative to the Index. In financials, overweight positions in the banking and insurance subsectors had the greatest positive impact on the relative performance of the Portfolio. Overweight positions in banking companies BNP Paribas and Credit Suisse Group and insurance company Farmers Exchange Capital all contributed positively to the Portfolio’s relative performance. (Contributions take weightings and total returns into account.) In the industrials sector, the best-performing subsectors for the Portfolio were basic materials, communications and capital goods. Telecommunications company Telefonica, pharmaceutical company Mylan NV and building materials company Masco were among the best performers in the Portfolio.
| 1. | See footnote on page 5 for more information on the Bloomberg Barclays U.S. Aggregate Bond Index. |
| 2. | See footnote on page 5 for more information on Lipper Inc. |
| 3. | Duration is a measure of the price sensitivity of a fixed-income investment to changes in interest rates. Duration is expressed as a number of years and is considered a more accurate sensitivity gauge than average maturity |
| | |
| 8 | | MainStay VP Bond Portfolio |
Allocations that detracted from the performance of the Portfolio included energy and the non-corporate sectors. In energy, the Portfolio’s underperformance relative to the benchmark was driven primarily by positioning in the integrated energy industry. In non-corporate sectors, the Portfolio held underweight positions relative to the Bloomberg Barclays U.S. Aggregate Bond Index that detracted from performance.
Did the Portfolio make any significant purchases or sales during the reporting period?
During the reporting period, the Portfolio generally sought to purchase corporate bonds during periods of perceived market weakness and to sell corporate bonds as the market rallied.
How did the Portfolio’s sector weightings change during the reporting period?
The Portfolio had overweight allocations to the financials, industrials and utilities sectors. During the first half of the reporting period, these weightings were increased to take advantage of what we viewed to be a strong technical backdrop as well as a robust new issue calendar. The increase in overweight allocations relative to the Bloomberg Barclays U.S. Aggregate Bond Index was primarily concentrated in the banking, capital goods, communications and electric subsectors. Toward the end of the reporting period, we slightly reduced the Portfolio’s overweight position relative to the benchmark in corporate bonds. Although we still had a favorable view of the asset class, we remained cautious in the short term.
Summer months are often known for lower liquidity that can lead to higher volatility. During the latter part of the reporting period, we added to the Portfolio’s overweight positions in commercial mortgage-backed securities and asset-backed securities. Throughout the reporting period, we decreased the Portfolio’s weighting in the U.S. Treasury securities sector to fund the Portfolio’s purchases in spread assets.4
How was the Portfolio positioned at the end of the reporting period?
As of June 30, 2017, the Portfolio was overweight relative to the Bloomberg Barclays U.S. Aggregate Bond Index in corporate bonds. Within the corporate sector, the Portfolio was overweight in financials, industrials and utilities at the end of the reporting period. As of June 30, 2017, the Portfolio also held overweight positions in asset-backed securities, commercial mortgage-backed securities and U.S. government agencies. At period-end, the most substantially overweight position in spread assets was in the corporate sector.
As of June 30, 2017, the Portfolio held underweight positions in the sovereign, supranational and foreign agency sectors. As of the same date, the Portfolio held an underweight position in the residential mortgage-backed securities sector, specifically 30-year 3.5% conventional mortgages.
As of June 30, 2017, the Portfolio maintained a duration that was approximately equal to the duration of the Bloomberg Barclays U.S. Aggregate Bond Index.
| 4. | The terms “spread” and “yield spread” may refer to the difference in yield between a security or type of security and comparable U.S. Treasury issues. The terms may also refer to the difference in yield between two specific securities or types of securities at a given time. The term “spread assets” refers to asset classes that typically trade at a spread to comparable U.S. Treasury securities. |
The opinions expressed are those of the portfolio managers as of the date of this report and are subject to change. There is no guarantee that any forecasts made will come to pass. This material does not constitute investment advice and is not intended as an endorsement of any specific investment.
Not all MainStay VP Portfolios and/or share classes are available under all policies.
Portfolio of Investments June 30, 2017 (Unaudited)
| | | | | | | | |
| | | Principal
Amount | | | Value | |
Long-Term Bonds 100.2%† Asset-Backed Securities 9.1% | |
Automobile 0.5% | |
Capital Automotive REIT
Series 2017-1A, Class A1
3.87%, due 4/15/47 (a) | | $ | 2,196,333 | | | $ | 2,222,548 | |
Hertz Vehicle Financing LLC
Series 2016-1A, Class A
2.32%, due 3/25/20 (a) | | | 1,700,000 | | | | 1,694,104 | |
| | | | | | | | |
| | | | | | | 3,916,652 | |
| | | | | | | | |
Home Equity 0.2% | | | | | | | | |
Chase Funding Trust
Series 2002-2, Class 1A5
6.333%, due 4/25/32 (b) | | | 183,157 | | | | 186,587 | |
Morgan Stanley Mortgage Loan Trust
Series 2006-17XS, Class A3A
5.651%, due 10/25/46 (b) | | | 1,161,901 | | | | 652,624 | |
Saxon Asset Securities Trust
Series 2003-1, Class AF5
4.873%, due 6/25/33 (b) | | | 1,218,766 | | | | 1,219,144 | |
| | | | | | | | |
| | | | | | | 2,058,355 | |
| | | | | | | | |
Other ABS 8.4% | | | | | | | | |
AIMCO CLO
Series 2014-AA, Class AR
2.181%, due 7/20/26 (a)(c) | | | 2,100,000 | | | | 2,099,935 | |
Apidos CLO XXV
Series 2016-25A, Class A1
2.363%, due 10/20/28 (a)(c) | | | 5,300,000 | | | | 5,316,345 | |
Ares XXIX CLO, Ltd.
Series 2014-1A, Class A1R
2.038%, due 4/17/26 (a)(c) | | | 750,000 | | | | 751,477 | |
Babson CLO, Ltd.
Series 2013-IA, Class A
2.13%, due 4/20/25 (a)(c) | | | 5,400,000 | | | | 5,408,046 | |
Bain Capital Credit CLO
Series 2016-2A, Class A
2.437%, due 1/15/29 (a)(c) | | | 3,475,000 | | | | 3,481,290 | |
Cedar Funding IV CLO, Ltd.
Series 2014-4A, Class AR
2.386%, due 7/23/30 (a)(c) | | | 2,600,000 | | | | 2,599,984 | |
Dryden Senior Loan Fund
Series 2014-33A, Class AR
2.452%, due 10/15/28 (a)(c) | | | 700,000 | | | | 704,623 | |
Dryden XXXI Senior Loan Fund
Series 2014-31A, Class AR
2.238%, due 4/18/26 (a)(c) | | | 4,300,000 | | | | 4,299,996 | |
Finn Square CLO, Ltd.
Series 2012-1A, Class A1R
2.367%, due 12/24/23 (a)(c) | | | 536,236 | | | | 537,098 | |
| | | | | | | | |
| | | Principal
Amount | | | Value | |
Other ABS (continued) | | | | | | | | |
FOCUS Brands Funding LLC
Series 2017-1A, Class A2I
3.857%, due 4/30/47 (a) | | $ | 500,000 | | | $ | 506,865 | |
Galaxy XIV CLO, Ltd.
Series 2012-14A, Class AR
2.409%, due 11/15/26 (a)(c) | | | 2,500,000 | | | | 2,503,190 | |
Galaxy XVI CLO, Ltd.
Series 2013-16A, Class A1R
2.167%, due 11/16/25 (a)(c) | | | 1,000,000 | | | | 1,000,014 | |
Highbridge Loan Management, Ltd.
Series 2015-6A, Class A
2.484%, due 5/5/27 (a)(c) | | | 1,000,000 | | | | 1,000,688 | |
Hilton Grand Vacations Trust
Series 2013-A, Class A
2.28%, due 1/25/26 (a) | | | 1,055,188 | | | | 1,051,896 | |
HPS Loan Management, Ltd.
Series 2011 A-17, Class A
2.395%, due 5/6/30 (a)(c) | | | 3,000,000 | | | | 3,000,471 | |
JPMorgan Mortgage Acquisition Corp.
Series 2007-CH2, Class AF3
4.85%, due 10/25/30 (b) | | | 819,102 | | | | 601,868 | |
Magnetite VIII, Ltd.
Series 2014-8A, Class AR
2.323%, due 4/15/26 (a)(c) | | | 5,000,000 | | | | 5,030,010 | |
Magnetite XII, Ltd.
Series 2015-12A, Class AR
2.353%, due 4/15/27 (a)(c) | | | 500,000 | | | | 502,661 | |
MVW Owner Trust
Series 2014-1A, Class A
2.25%, due 9/22/31 (a) | | | 556,592 | | | | 552,788 | |
Neuberger Berman CLO XIX, Ltd. (a)(c) | | | | | | | | |
Series 2015-19A, Class A1R
(zero coupon), due 7/15/27 (d) | | | 4,300,000 | | | | 4,300,000 | |
Series 2015-19A, Class A1
2.443%, due 7/15/27 | | | 4,300,000 | | | | 4,311,911 | |
Octagon Loan Funding, Ltd.
Series 2014-1A, Class A1R
2.321%, due 11/18/26 (a)(c) | | | 5,200,000 | | | | 5,199,953 | |
Sierra Receivables Funding Co. LLC
Series 2014-1A, Class A
2.07%, due 3/20/30 (a) | | | 462,811 | | | | 462,205 | |
Sound Point CLO XVI, Ltd.
Series 2017-2A, Class A
2.567%, due 7/25/30 (a)(c)(d) | | | 1,500,000 | | | | 1,499,121 | |
THL Credit Wind River CLO, Ltd.
Series 2012-1A, Class AR
2.473%, due 1/15/26 (a)(c) | | | 2,500,000 | | | | 2,508,692 | |
Volvo Financial Equipment LLC
Series 2016-IA, Class A3
1.67%, due 2/18/20 (a) | | | 900,000 | | | | 900,461 | |
| † | Percentages indicated are based on Portfolio net assets. |
| ¨ | | Among the Portfolio’s 10 largest issuers held, as of June 30, 2017, excluding short-term investment. May be subject to change daily. |
| | | | |
| 10 | | MainStay VP Bond Portfolio | | The notes to the financial statements are an integral part of,
and should be read in conjunction with, the financial statements. |
| | | | | | | | |
| | | Principal
Amount | | | Value | |
| Asset-Backed Securities (continued) | |
Other ABS (continued) | | | | | | | | |
Voya CLO, Ltd. (a)(c) | | | | | | | | |
Series 2014-1A, Class A1R
2.354%, due 4/18/26 | | $ | 2,640,000 | | | $ | 2,651,207 | |
Series 2014-2A, Class A1R
2.408%, due 4/17/30 | | | 1,900,000 | | | | 1,900,325 | |
VSE VOI Mortgage LLC
Series 2016-A, Class A
2.54%, due 7/20/33 (a) | | | 3,356,311 | | | | 3,345,204 | |
| | | | | | | | |
| | | | | | | 68,028,324 | |
| | | | | | | | |
Total Asset-Backed Securities
(Cost $74,620,344) | | | | | | | 74,003,331 | |
| | | | | | | | |
|
| Corporate Bonds 36.3% | |
Aerospace & Defense 0.3% | |
BAE Systems PLC
4.75%, due 10/11/21 (a) | | | 2,000,000 | | | | 2,158,370 | |
| | | | | | | | |
|
Auto Manufacturers 1.6% | |
Daimler Finance North America LLC
2.85%, due 1/6/22 (a) | | | 2,925,000 | | | | 2,960,331 | |
Ford Motor Co.
5.291%, due 12/8/46 | | | 4,250,000 | | | | 4,361,860 | |
Ford Motor Credit Co. LLC
4.25%, due 9/20/22 | | | 2,525,000 | | | | 2,652,586 | |
General Motors Co.
4.875%, due 10/2/23 | | | 2,900,000 | | | | 3,107,854 | |
| | | | | | | | |
| | | | | | | 13,082,631 | |
| | | | | | | | |
Banks 10.6% | |
ABN AMRO Bank N.V.
2.10%, due 1/18/19 (a) | | | 4,100,000 | | | | 4,106,408 | |
Bank of America Corp. | | | | | | | | |
3.124%, due 1/20/23 (c) | | | 925,000 | | | | 935,158 | |
4.443%, due 1/20/48 (c) | | | 3,000,000 | | | | 3,173,043 | |
4.45%, due 3/3/26 | | | 1,570,000 | | | | 1,633,968 | |
5.00%, due 1/21/44 | | | 2,000,000 | | | | 2,260,900 | |
Bank of New York Mellon Corp.
2.661%, due 5/16/23 (c) | | | 1,400,000 | | | | 1,404,435 | |
Bank of Tokyo-Mitsubishi UFJ, Ltd.
2.35%, due 9/8/19 (a) | | | 2,500,000 | | | | 2,507,413 | |
BNP Paribas S.A.
3.80%, due 1/10/24 (a) | | | 5,200,000 | | | | 5,415,394 | |
Capital One N.A. | | | | | | | | |
2.35%, due 1/31/20 | | | 2,125,000 | | | | 2,125,693 | |
2.95%, due 7/23/21 | | | 3,300,000 | | | | 3,324,371 | |
Citigroup, Inc. | | | | | | | | |
4.60%, due 3/9/26 | | | 2,345,000 | | | | 2,460,702 | |
5.30%, due 5/6/44 | | | 4,000,000 | | | | 4,526,320 | |
Credit Agricole S.A.
3.375%, due 1/10/22 (a) | | | 4,100,000 | | | | 4,209,650 | |
| | | | | | | | |
| | | Principal
Amount | | | Value | |
Banks (continued) | |
Credit Suisse Group A.G.
4.282%, due 1/9/28 (a) | | $ | 4,500,000 | | | $ | 4,651,565 | |
Credit Suisse Group Funding Guernsey, Ltd.
3.80%, due 9/15/22 | | | 1,990,000 | | | | 2,067,572 | |
Discover Bank
3.20%, due 8/9/21 | | | 800,000 | | | | 814,795 | |
Fifth Third Bancorp
4.30%, due 1/16/24 | | | 3,875,000 | | | | 4,115,676 | |
Goldman Sachs Group, Inc. | | | | | | | | |
2.908%, due 6/5/23 (c) | | | 2,050,000 | | | | 2,045,935 | |
5.15%, due 5/22/45 | | | 2,475,000 | | | | 2,749,126 | |
5.25%, due 7/27/21 | | | 1,250,000 | | | | 1,370,063 | |
6.25%, due 2/1/41 | | | 550,000 | | | | 718,460 | |
HBOS PLC
6.75%, due 5/21/18 (a) | | | 7,547,000 | | | | 7,849,861 | |
HSBC Bank USA N.A.
4.875%, due 8/24/20 | | | 1,500,000 | | | | 1,613,277 | |
Huntington National Bank
2.875%, due 8/20/20 | | | 3,225,000 | | | | 3,279,873 | |
JPMorgan Chase & Co.
5.40%, due 1/6/42 | | | 2,425,000 | | | | 2,934,267 | |
Morgan Stanley | | | | | | | | |
2.75%, due 5/19/22 | | | 1,850,000 | | | | 1,849,600 | |
4.35%, due 9/8/26 | | | 1,556,000 | | | | 1,617,677 | |
4.375%, due 1/22/47 | | | 4,000,000 | | | | 4,172,816 | |
Sumitomo Mitsui Banking Corp.
2.25%, due 7/11/19 | | | 1,000,000 | | | | 1,004,357 | |
UBS Group Funding Switzerland A.G.
4.253%, due 3/23/28 (a) | | | 3,700,000 | | | | 3,865,501 | |
Wells Fargo & Co.
4.75%, due 12/7/46 | | | 1,000,000 | | | | 1,067,674 | |
| | | | | | | | |
| | | | | | | 85,871,550 | |
| | | | | | | | |
Building Materials 2.2% | |
CRH America, Inc.
5.125%, due 5/18/45 (a) | | | 3,200,000 | | | | 3,606,269 | |
Fortune Brands Home & Security, Inc.
4.00%, due 6/15/25 | | | 3,775,000 | | | | 3,921,319 | |
¨Masco Corp. | | | | | | | | |
3.50%, due 4/1/21 | | | 3,825,000 | | | | 3,928,160 | |
4.45%, due 4/1/25 | | | 3,175,000 | | | | 3,391,218 | |
4.50%, due 5/15/47 | | | 3,000,000 | | | | 3,013,713 | |
| | | | | | | | |
| | | | | | | 17,860,679 | |
| | | | | | | | |
Chemicals 1.2% | |
NewMarket Corp.
4.10%, due 12/15/22 | | | 5,536,000 | | | | 5,725,459 | |
NOVA Chemicals Corp.
5.00%, due 5/1/25 (a) | | | 2,140,000 | | | | 2,129,300 | |
Westlake Chemical Corp.
3.60%, due 8/15/26 | | | 2,000,000 | | | | 1,984,998 | |
| | | | | | | | |
| | | | | | | 9,839,757 | |
| | | | | | | | |
| | | | | | |
The notes to the financial statements are an integral part of,
and should be read in conjunction with, the financial statements. | | | | | 11 | |
Portfolio of Investments June 30, 2017 (Unaudited) (continued)
| | | | | | | | |
| | | Principal
Amount | | | Value | |
| Corporate Bonds (continued) | |
Commercial Services 0.3% | |
Equifax, Inc.
7.00%, due 7/1/37 | | $ | 1,799,000 | | | $ | 2,306,298 | |
| | | | | | | | |
| | |
Computers 0.5% | | | | | | | | |
Hewlett Packard Enterprise Co.
3.60%, due 10/15/20 | | | 3,600,000 | | | | 3,711,956 | |
| | | | | | | | |
|
Diversified Financial Services 0.6% | |
Discover Financial Services | | | | | | | | |
3.85%, due 11/21/22 | | | 3,302,000 | | | | 3,381,624 | |
5.20%, due 4/27/22 | | | 350,000 | | | | 380,993 | |
GE Capital International Funding Co.
4.418%, due 11/15/35 | | | 918,000 | | | | 999,140 | |
| | | | | | | | |
| | | | | | | 4,761,757 | |
| | | | | | | | |
Electric 3.6% | |
Appalachian Power Co.
6.375%, due 4/1/36 | | | 1,750,000 | | | | 2,229,146 | |
Arizona Public Service Co.
5.50%, due 9/1/35 | | | 1,275,000 | | | | 1,507,870 | |
Dominion Energy, Inc.
4.104%, due 4/1/21 (b) | | | 475,000 | | | | 498,551 | |
Duke Energy Progress LLC
6.125%, due 9/15/33 | | | 500,000 | | | | 639,480 | |
Electricite de France S.A.
2.35%, due 10/13/20 (a) | | | 2,000,000 | | | | 2,007,770 | |
Emera U.S. Finance, L.P.
4.75%, due 6/15/46 | | | 2,350,000 | | | | 2,480,042 | |
Entergy Corp.
4.00%, due 7/15/22 | | | 3,700,000 | | | | 3,910,560 | |
Exelon Corp. | | | | | | | | |
3.497%, due 6/1/22 | | | 2,750,000 | | | | 2,809,513 | |
5.10%, due 6/15/45 | | | 3,000,000 | | | | 3,361,623 | |
FirstEnergy Transmission LLC
4.35%, due 1/15/25 (a) | | | 3,455,000 | | | | 3,610,233 | |
Great Plains Energy, Inc.
4.85%, due 6/1/21 | | | 385,000 | | | | 410,288 | |
Kansas City Power & Light Co.
7.15%, due 4/1/19 | | | 900,000 | | | | 977,389 | |
Ohio Edison Co.
6.875%, due 7/15/36 | | | 2,500,000 | | | | 3,346,572 | |
Union Electric Co.
6.70%, due 2/1/19 | | | 1,500,000 | | | | 1,609,362 | |
| | | | | | | | |
| | | | | | | 29,398,399 | |
| | | | | | | | |
Electronics 0.6% | |
Amphenol Corp.
3.125%, due 9/15/21 | | | 1,700,000 | | | | 1,739,525 | |
Fortive Corp.
2.35%, due 6/15/21 | | | 3,000,000 | | | | 2,982,648 | |
| | | | | | | | |
| | | | | | | 4,722,173 | |
| | | | | | | | |
| | | | | | | | |
| | | Principal
Amount | | | Value | |
Food 1.0% | |
Ingredion, Inc. | | | | | | | | |
1.80%, due 9/25/17 | | $ | 1,600,000 | | | $ | 1,600,955 | |
4.625%, due 11/1/20 | | | 2,150,000 | | | | 2,304,471 | |
Kroger Co.
7.70%, due 6/1/29 | | | 1,000,000 | | | | 1,315,525 | |
Mondelez International Holdings Netherlands B.V.
2.00%, due 10/28/21 (a) | | | 3,000,000 | | | | 2,922,954 | |
| | | | | | | | |
| | | | | | | 8,143,905 | |
| | | | | | | | |
Gas 0.4% | |
NiSource Finance Corp. | | | | | | | | |
4.80%, due 2/15/44 | | | 1,325,000 | | | | 1,435,331 | |
5.65%, due 2/1/45 | | | 1,800,000 | | | | 2,164,342 | |
| | | | | | | | |
| | | | | | | 3,599,673 | |
| | | | | | | | |
Health Care—Products 0.2% | |
Becton Dickinson & Co.
2.894%, due 6/6/22 | | | 2,000,000 | | | | 2,006,252 | |
| | | | | | | | |
|
Insurance 1.6% | |
AXIS Specialty Finance PLC
5.15%, due 4/1/45 | | | 3,950,000 | | | | 4,196,132 | |
Farmers Exchange Capital III
5.454%, due 10/15/54 (a)(c) | | | 3,000,000 | | | | 3,263,310 | |
Nationwide Financial Services, Inc.
5.375%, due 3/25/21 (a) | | | 4,944,000 | | | | 5,422,184 | |
| | | | | | | | |
| | | | | | | 12,881,626 | |
| | | | | | | | |
Iron & Steel 0.5% | |
Carpenter Technology Corp.
4.45%, due 3/1/23 | | | 1,825,000 | | | | 1,857,874 | |
Reliance Steel & Aluminum Co.
4.50%, due 4/15/23 | | | 2,300,000 | | | | 2,429,534 | |
| | | | | | | | |
| | | | | | | 4,287,408 | |
| | | | | | | | |
Machinery—Diversified 0.2% | |
Deere & Co.
5.375%, due 10/16/29 | | | 1,100,000 | | | | 1,330,963 | |
| | | | | | | | |
| | |
Media 0.2% | | | | | | | | |
Charter Communications Operating LLC / Charter Communications Operating Capital
3.579%, due 7/23/20 | | | 1,750,000 | | | | 1,808,406 | |
| | | | | | | | |
| | |
Mining 1.0% | | | | | | | | |
Anglo American Capital PLC (a) | | | | | | | | |
4.75%, due 4/10/27 | | | 3,950,000 | | | | 4,057,835 | |
4.875%, due 5/14/25 | | | 3,625,000 | | | | 3,770,000 | |
| | | | | | | | |
| | | | | | | 7,827,835 | |
| | | | | | | | |
| | | | |
| 12 | | MainStay VP Bond Portfolio | | The notes to the financial statements are an integral part of,
and should be read in conjunction with, the financial statements. |
| | | | | | | | |
| | | Principal
Amount | | | Value | |
| Corporate Bonds (continued) | |
Miscellaneous—Manufacturing 0.0%‡ | |
General Electric Co.
5.875%, due 1/14/38 | | $ | 287,000 | | | $ | 371,414 | |
| | | | | | | | |
| | |
Oil & Gas 2.6% | | | | | | | | |
Anadarko Petroleum Corp.
4.85%, due 3/15/21 | | | 2,975,000 | | | | 3,175,336 | |
Cenovus Energy, Inc. (a) | | | | | | | | |
4.25%, due 4/15/27 | | | 2,200,000 | | | | 2,095,779 | |
5.40%, due 6/15/47 | | | 2,000,000 | | | | 1,866,780 | |
Helmerich & Payne International Drilling Co.
4.65%, due 3/15/25 | | | 2,900,000 | | | | 3,041,047 | |
Nabors Industries, Inc.
5.00%, due 9/15/20 | | | 4,250,000 | | | | 4,239,375 | |
Petroleos Mexicanos | | | | | | | | |
3.50%, due 7/23/20 | | | 1,450,000 | | | | 1,465,225 | |
3.50%, due 1/30/23 | | | 1,575,000 | | | | 1,509,638 | |
5.75%, due 3/1/18 | | | 2,000,000 | | | | 2,046,697 | |
Statoil ASA
5.25%, due 4/15/19 | | | 1,325,000 | | | | 1,402,873 | |
Valero Energy Corp.
6.625%, due 6/15/37 | | | 550,000 | | | | 679,305 | |
| | | | | | | | |
| | | | | | | 21,522,055 | |
| | | | | | | | |
Pharmaceuticals 0.3% | | | | | | | | |
Mylan N.V.
5.25%, due 6/15/46 | | | 2,000,000 | | | | 2,187,800 | |
| | | | | | | | |
| | |
Pipelines 2.6% | | | | | | | | |
Energy Transfer Partners, L.P.
6.50%, due 2/1/42 | | | 1,300,000 | | | | 1,452,153 | |
Enterprise Products Operating LLC
5.10%, due 2/15/45 | | | 3,600,000 | | | | 3,953,203 | |
Kinder Morgan Energy Partners, L.P.
6.375%, due 3/1/41 | | | 400,000 | | | | 451,037 | |
Kinder Morgan, Inc.
5.00%, due 2/15/21 (a) | | | 4,500,000 | | | | 4,824,684 | |
Regency Energy Partners, L.P. / Regency Energy Finance Corp.
5.875%, due 3/1/22 | | | 4,800,000 | | | | 5,287,599 | |
Spectra Energy Partners, L.P.
2.95%, due 9/25/18 | | | 2,750,000 | | | | 2,780,965 | |
Texas Eastern Transmission, L.P.
2.80%, due 10/15/22 (a) | | | 2,350,000 | | | | 2,305,470 | |
| | | | | | | | |
| | | | | | | 21,055,111 | |
| | | | | | | | |
Real Estate Investment Trusts 1.7% | | | | | | | | |
DDR Corp.
4.75%, due 4/15/18 | | | 2,000,000 | | | | 2,039,142 | |
Host Hotels & Resorts, L.P.
6.00%, due 10/1/21 | | | 1,700,000 | | | | 1,895,986 | |
| | | | | | | | |
| | | Principal
Amount | | | Value | |
Real Estate Investment Trusts (continued) | |
Mid-America Apartments, L.P.
3.60%, due 6/1/27 | | $ | 1,750,000 | | | $ | 1,745,275 | |
Regency Centers, L.P.
4.80%, due 4/15/21 | | | 1,050,000 | | | | 1,120,135 | |
Simon Property Group, L.P.
2.625%, due 6/15/22 | | | 1,875,000 | | | | 1,881,857 | |
VEREIT Operating Partnership, L.P.
4.875%, due 6/1/26 | | | 4,872,000 | | | | 5,150,532 | |
| | | | | | | | |
| | | | | | | 13,832,927 | |
| | | | | | | | |
Software 0.3% | | | | | | | | |
Fidelity National Information Services, Inc.
2.25%, due 8/15/21 | | | 1,150,000 | | | | 1,137,624 | |
Fiserv, Inc.
4.75%, due 6/15/21 | | | 1,355,000 | | | | 1,464,138 | |
| | | | | | | | |
| | | | | | | 2,601,762 | |
| | | | | | | | |
Sovereign 0.1% | | | | | | | | |
Export-Import Bank of Korea
1.75%, due 2/27/18 | | | 600,000 | | | | 599,400 | |
| | | | | | | | |
| | |
Telecommunications 1.9% | | | | | | | | |
AT&T, Inc. | | | | | | | | |
4.45%, due 4/1/24 | | | 2,000,000 | | | | 2,105,396 | |
4.50%, due 5/15/35 | | | 2,500,000 | | | | 2,459,480 | |
Deutsche Telekom International Finance B.V.
2.82%, due 1/19/22 (a) | | | 4,050,000 | | | | 4,073,203 | |
Orange S.A.
5.375%, due 1/13/42 | | | 1,675,000 | | | | 1,959,053 | |
Telefonica Emisiones SAU
5.213%, due 3/8/47 | | | 4,000,000 | | | | 4,318,928 | |
Verizon Communications, Inc.
4.272%, due 1/15/36 | | | 866,000 | | | | 835,825 | |
| | | | | | | | |
| | | | | | | 15,751,885 | |
| | | | | | | | |
Transportation 0.2% | | | | | | | | |
Norfolk Southern Corp.
5.64%, due 5/17/29 | | | 1,400,000 | | | | 1,614,726 | |
| | | | | | | | |
Total Corporate Bonds
(Cost $283,106,266) | | | | | | | 295,136,718 | |
| | | | | | | | |
|
| Foreign Government Bond 0.0%‡ | |
Sovereign 0.0%‡ | | | | | | | | |
Republic of Poland Government International Bond
5.00%, due 3/23/22 | | | 350,000 | | | | 388,500 | |
| | | | | | | | |
Total Foreign Government Bond
(Cost $347,457) | | | | | | | 388,500 | |
| | | | | | | | |
| | | | | | |
The notes to the financial statements are an integral part of,
and should be read in conjunction with, the financial statements. | | | | | 13 | |
Portfolio of Investments June 30, 2017 (Unaudited) (continued)
| | | | | | | | |
| | | Principal
Amount | | | Value | |
| Mortgage-Backed Securities 7.7% | |
Agency (Collateralized Mortgage Obligations) 0.6% | |
FHLMC Multifamily Structured Pass-Through Certificates | | | | | | | | |
Series K031, Class A2
3.30%, due 4/25/23 (c) | | $ | 2,300,000 | | | $ | 2,410,646 | |
Series K039, Class A2
3.303%, due 7/25/24 | | | 2,400,000 | | | | 2,515,420 | |
| | | | | | | | |
| | | | | | | 4,926,066 | |
| | | | | | | | |
Commercial Mortgage Loans
(Collateralized Mortgage Obligations) 6.5% | |
Citigroup Commercial Mortgage Trust | | | | | | | | |
Series 2016-P5, Class A4
2.941%, due 10/10/49 | | | 3,000,000 | | | | 2,954,672 | |
Series 2014-GC21, Class A5
3.855%, due 5/10/47 | | | 1,100,000 | | | | 1,160,384 | |
¨COMM Mortgage Trust | | | | | | | | |
Series 2013-THL, Class A2
2.139%, due 6/8/30 (a)(c) | | | 3,400,000 | | | | 3,403,176 | |
Series 2013-LC13, Class A2
3.009%, due 8/10/46 | | | 2,600,000 | | | | 2,636,471 | |
Series 2016-COR1, Class A4
3.091%, due 10/10/49 | | | 3,000,000 | | | | 2,981,305 | |
Series 2015-LC19, Class A4
3.183%, due 2/10/48 | | | 1,400,000 | | | | 1,416,932 | |
Series 2014-CR17, Class A5
3.977%, due 5/10/47 | | | 1,900,000 | | | | 2,016,087 | |
GRACE Mortgage Trust
Series 2014-GRCE, Class A
3.369%, due 6/10/28 (a) | | | 1,700,000 | | | | 1,765,673 | |
GS Mortgage Securities Trust | | | | | | | | |
Series 2016-GS3, Class AS
3.143%, due 10/10/49 | | | 4,000,000 | | | | 3,921,158 | |
Series 2014-GC22, Class A5
3.862%, due 6/10/47 | | | 2,600,000 | | | | 2,742,828 | |
Series 2015-GC32, Class AS
4.018%, due 7/10/48 (c) | | | 3,000,000 | | | | 3,157,131 | |
JPMBB Commercial Mortgage Securities Trust | | | | | | | | |
Series 2013-C14, Class A2
3.019%, due 8/15/46 | | | 1,975,184 | | | | 2,006,438 | |
Series 2014-C19, Class A4
3.997%, due 4/15/47 | | | 3,000,000 | | | | 3,192,718 | |
JPMorgan Chase Commercial Mortgage Securities Corp.
Series 2016-JP3, Class A2
2.435%, due 8/15/49 | | | 1,100,000 | | | | 1,102,411 | |
LB-UBS Commercial Mortgage Trust
Series 2007-C7, Class A3
5.866%, due 9/15/45 (c) | | | 1,875,803 | | | | 1,887,603 | |
| | | | | | | | |
| | | Principal
Amount | | | Value | |
Commercial Mortgage Loans
(Collateralized Mortgage Obligations) (continued) | |
¨Morgan Stanley Bank of America Merrill Lynch Trust | | | | | | | | |
Series 2016-C30, Class AS
3.175%, due 9/15/49 | | $ | 4,000,000 | | | $ | 3,908,227 | |
Series 2015-C21, Class AS
3.652%, due 3/15/48 | | | 1,000,000 | | | | 1,015,202 | |
Series 2013-C13, Class A4
4.039%, due 11/15/46 | | | 2,900,000 | | | | 3,097,863 | |
Series 2013-C12, Class A4
4.259%, due 10/15/46 (c) | | | 2,600,000 | | | | 2,810,503 | |
Morgan Stanley Capital I Trust
Series 2007-IQ16, Class A4
5.809%, due 12/12/49 | | | 1,192,869 | | | | 1,196,343 | |
Wells Fargo Commercial Mortgage Trust | | | | | | | | |
Series 2016-NXS6, Class A2
2.399%, due 11/15/49 | | | 1,900,000 | | | | 1,898,809 | |
Series 2016-LC24, Class A2
2.501%, due 10/15/49 | | | 1,500,000 | | | | 1,511,532 | |
Series 2016-C33, Class AS
3.749%, due 3/15/59 | | | 500,000 | | | | 514,079 | |
WFRBS Commercial Mortgage Trust
Series 2013-C11, Class A2
2.029%, due 3/15/45 | | | 83,114 | | | | 83,176 | |
| | | | | | | | |
| | | | | | | 52,380,721 | |
| | | | | | | | |
Whole Loan (Collateralized Mortgage Obligations) 0.6% | |
Banc of America Funding Corp.
Series 2006-7, Class T2A3
5.695%, due 10/25/36 (c) | | | 278,705 | | | | 242,052 | |
JPMorgan Mortgage Trust (a)(c) | | | | | | | | |
Series 2014-2, Class 1A1
3.00%, due 6/25/29 | | | 2,577,401 | | | | 2,600,958 | |
Series 2015-6, Class A5
3.50%, due 10/25/45 | | | 1,682,162 | | | | 1,715,543 | |
TBW Mortgage-Backed Pass-Through Certificates
Series 2006-6, Class A2B
5.66%, due 1/25/37 (b) | | | 1,117,052 | | | | 573,473 | |
| | | | | | | | |
| | | | | | | 5,132,026 | |
| | | | | | | | |
Total Mortgage-Backed Securities
(Cost $63,931,634) | | | | | | | 62,438,813 | |
| | | | | | | | |
| | |
| Municipal Bonds 1.3% | | | | | | | | |
California 0.3% | | | | | | | | |
Sacramento Municipal Utility District
6.322%, due 5/15/36 | | | 1,650,000 | | | | 2,118,287 | |
| | | | | | | | |
| | |
Connecticut 0.2% | | | | | | | | |
State of Connecticut Special Tax Revenue
5.74%, due 12/1/29 | | | 1,720,000 | | | | 2,023,253 | |
| | | | | | | | |
| | | | |
| 14 | | MainStay VP Bond Portfolio | | The notes to the financial statements are an integral part of,
and should be read in conjunction with, the financial statements. |
| | | | | | | | |
| | | Principal
Amount | | | Value | |
| Municipal Bonds (continued) | |
Texas 0.7% | | | | | | | | |
Dallas Area Rapid Transit
5.022%, due 12/1/48 | | $ | 700,000 | | | $ | 836,969 | |
San Antonio Water System
5.502%, due 5/15/29 | | | 2,000,000 | | | | 2,371,760 | |
Texas Transportation Commission State Highway Fund
5.178%, due 4/1/30 | | | 2,150,000 | | | | 2,547,685 | |
| | | | | | | | |
| | | | | | | 5,756,414 | |
| | | | | | | | |
Washington 0.1% | | | | | | | | |
City of Seattle, Washington, Water System Revenue
5.62%, due 8/1/30 | | | 340,000 | | | | 411,907 | |
| | | | | | | | |
Total Municipal Bonds
(Cost $9,958,079) | | | | | | | 10,309,861 | |
| | | | | | | | |
|
| U.S. Government & Federal Agencies 45.8% | |
Federal Home Loan Bank 0.2% | | | | | | | | |
1.00%, due 9/26/19 | | | 1,400,000 | | | | 1,385,779 | |
| | | | | | | | |
|
¨Federal Home Loan Mortgage Corporation 1.4% | |
1.00%, due 9/27/17 | | | 1,325,000 | | | | 1,324,693 | |
1.25%, due 8/15/19 | | | 2,000,000 | | | | 1,990,108 | |
1.35%, due 1/25/19 | | | 3,500,000 | | | | 3,495,159 | |
1.50%, due 1/17/20 | | | 2,500,000 | | | | 2,497,900 | |
6.25%, due 7/15/32 | | | 1,600,000 | | | | 2,274,467 | |
| | | | | | | | |
| | | | | | | 11,582,327 | |
| | | | | | | | |
¨Federal Home Loan Mortgage Corporation
(Mortgage Pass-Through Securities) 7.0% | |
2.50%, due 6/1/28 | | | 3,293,501 | | | | 3,334,314 | |
2.50%, due 1/1/31 | | | 1,379,797 | | | | 1,388,686 | |
2.50%, due 12/1/31 | | | 569,876 | | | | 573,547 | |
2.50%, due 2/1/32 | | | 673,761 | | | | 678,102 | |
3.00%, due 6/1/27 | | | 416,366 | | | | 427,908 | |
3.00%, due 9/1/30 | | | 2,969,381 | | | | 3,051,699 | |
3.00%, due 9/1/33 | | | 2,235,754 | | | | 2,288,987 | |
3.00%, due 8/1/43 | | | 3,899,764 | | | | 3,909,042 | |
3.00%, due 6/1/45 | | | 2,417,879 | | | | 2,414,216 | |
3.00%, due 11/1/46 | | | 883,740 | | | | 882,402 | |
3.50%, due 12/1/20 | | | 523,670 | | | | 545,752 | |
3.50%, due 9/1/25 | | | 47,500 | | | | 49,503 | |
3.50%, due 11/1/25 | | | 25,772 | | | | 26,859 | |
3.50%, due 3/1/26 | | | 169,433 | | | | 176,578 | |
3.50%, due 1/1/29 | | | 197,429 | | | | 205,981 | |
3.50%, due 3/1/29 | | | 22,840 | | | | 23,836 | |
3.50%, due 2/1/44 | | | 2,438,805 | | | | 2,516,447 | |
3.50%, due 1/1/45 | | | 1,655,919 | | | | 1,712,137 | |
3.50%, due 9/1/45 | | | 6,849,120 | | | | 7,041,786 | |
3.50%, due 10/1/45 | | | 771,301 | | | | 792,998 | |
3.50%, due 11/1/45 | | | 500,712 | | | | 514,797 | |
| | | | | | | | |
| | | Principal
Amount | | | Value | |
Federal Home Loan Mortgage Corporation
(Mortgage Pass-Through Securities) (continued) | |
3.50%, due 3/1/46 | | $ | 966,511 | | | $ | 993,699 | |
3.50%, due 4/1/46 | | | 990,804 | | | | 1,018,676 | |
3.50%, due 9/1/46 | | | 299,563 | | | | 307,990 | |
3.50%, due 12/1/46 | | | 489,770 | | | | 503,547 | |
3.50%, due 5/1/47 | | | 396,944 | | | | 408,110 | |
3.50%, due 6/1/47 | | | 300,001 | | | | 308,440 | |
4.00%, due 7/1/23 | | | 225,839 | | | | 238,314 | |
4.00%, due 8/1/25 | | | 88,698 | | | | 93,101 | |
4.00%, due 1/1/31 | | | 266,887 | | | | 283,579 | |
4.00%, due 11/1/41 | | | 141,304 | | | | 149,217 | |
4.00%, due 1/1/42 | | | 149,254 | | | | 157,615 | |
4.00%, due 4/1/42 | | | 3,390,904 | | | | 3,580,851 | |
4.00%, due 5/1/44 | | | 3,615,614 | | | | 3,805,461 | |
4.00%, due 7/1/45 | | | 350,445 | | | | 368,846 | |
4.00%, due 8/1/45 | | | 193,843 | | | | 204,022 | |
4.00%, due 10/1/45 | | | 161,678 | | | | 170,168 | |
4.00%, due 11/1/45 | | | 499,246 | | | | 525,460 | |
4.00%, due 9/1/46 | | | 361,251 | | | | 380,220 | |
4.00%, due 3/1/47 | | | 250,001 | | | | 263,128 | |
4.50%, due 4/1/22 | | | 45,494 | | | | 47,018 | |
4.50%, due 4/1/23 | | | 12,314 | | | | 13,041 | |
4.50%, due 6/1/24 | | | 35,446 | | | | 37,667 | |
4.50%, due 7/1/24 | | | 79,166 | | | | 83,888 | |
4.50%, due 5/1/25 | | | 151,350 | | | | 158,673 | |
4.50%, due 4/1/31 | | | 235,828 | | | | 253,044 | |
4.50%, due 11/1/39 | | | 1,355,493 | | | | 1,455,705 | |
4.50%, due 8/1/40 | | | 171,335 | | | | 184,224 | |
4.50%, due 9/1/40 | | | 994,244 | | | | 1,068,742 | |
4.50%, due 11/1/40 | | | 359,057 | | | | 384,618 | |
4.50%, due 7/1/41 | | | 293,835 | | | | 315,955 | |
5.00%, due 3/1/23 | | | 3,966 | | | | 4,070 | |
5.00%, due 6/1/23 | | | 71,554 | | | | 76,479 | |
5.00%, due 8/1/23 | | | 9,901 | | | | 10,576 | |
5.00%, due 7/1/24 | | | 59,005 | | | | 63,070 | |
5.00%, due 3/1/25 | | | 147,869 | | | | 157,507 | |
5.00%, due 6/1/30 | | | 176,188 | | | | 191,717 | |
5.00%, due 9/1/31 | | | 290,195 | | | | 315,012 | |
5.00%, due 8/1/35 | | | 71,420 | | | | 78,094 | |
5.00%, due 4/1/37 | | | 1,128,045 | | | | 1,233,240 | |
5.00%, due 8/1/37 | | | 203,780 | | | | 222,623 | |
5.00%, due 3/1/40 | | | 447,962 | | | | 490,904 | |
5.50%, due 12/1/18 | | | 12,347 | | | | 12,505 | |
5.50%, due 9/1/21 | | | 68,271 | | | | 71,219 | |
5.50%, due 9/1/22 | | | 70,592 | | | | 73,940 | |
5.50%, due 9/1/37 | | | 450,693 | | | | 501,912 | |
5.50%, due 8/1/38 | | | 197,818 | | | | 220,272 | |
5.50%, due 12/1/38 | | | 650,514 | | | | 722,771 | |
6.00%, due 7/1/21 | | | 204,095 | | | | 212,197 | |
6.00%, due 8/1/36 | | | 135,133 | | | | 152,858 | |
6.00%, due 9/1/37 | | | 193,626 | | | | 217,570 | |
| | | | | | |
The notes to the financial statements are an integral part of,
and should be read in conjunction with, the financial statements. | | | | | 15 | |
Portfolio of Investments June 30, 2017 (Unaudited) (continued)
| | | | | | | | |
| | | Principal
Amount | | | Value | |
| U.S. Government & Federal Agencies (continued) | |
Federal Home Loan Mortgage Corporation
(Mortgage Pass-Through Securities) (continued) | |
6.00%, due 5/1/40 | | $ | 500,311 | | | $ | 566,472 | |
6.50%, due 11/1/35 | | | 24,052 | | | | 26,705 | |
6.50%, due 8/1/37 | | | 30,015 | | | | 34,977 | |
6.50%, due 11/1/37 | | | 77,265 | | | | 88,208 | |
6.50%, due 9/1/39 | | | 152,694 | | | | 169,345 | |
7.00%, due 1/1/33 | | | 382,364 | | | | 421,881 | |
7.00%, due 9/1/33 | | | 73,613 | | | | 79,438 | |
| | | | | | | | |
| | | | | | | 56,734,158 | |
| | | | | | | | |
¨Federal National Mortgage Association 3.5% | |
0.875%, due 8/2/19 | | | 5,000,000 | | | | 4,939,890 | |
1.00%, due 10/24/19 | | | 2,000,000 | | | | 1,977,842 | |
1.25%, due 7/26/19 | | | 2,500,000 | | | | 2,480,850 | |
1.25%, due 8/17/21 | | | 2,000,000 | | | | 1,955,086 | |
1.375%, due 2/26/21 | | | 500,000 | | | | 493,863 | |
1.50%, due 2/28/20 | | | 1,200,000 | | | | 1,196,855 | |
1.875%, due 4/5/22 | | | 3,600,000 | | | | 3,588,696 | |
1.875%, due 9/24/26 | | | 6,100,000 | | | | 5,783,678 | |
2.125%, due 4/24/26 | | | 1,600,000 | | | | 1,559,506 | |
6.25%, due 5/15/29 | | | 3,000,000 | | | | 4,070,883 | |
| | | | | | | | |
| | | | | | | 28,047,149 | |
| | | | | | | | |
¨Federal National Mortgage Association
(Mortgage Pass-Through Securities) 10.9% | |
2.50%, due 2/1/23 | | | 699,076 | | | | 707,270 | |
2.50%, due 2/1/28 | | | 2,082,941 | | | | 2,106,979 | |
2.50%, due 5/1/28 | | | 1,275,488 | | | | 1,290,178 | |
2.50%, due 6/1/30 | | | 1,918,881 | | | | 1,935,672 | |
2.50%, due 1/1/31 | | | 230,979 | | | | 233,001 | |
2.50%, due 9/1/31 | | | 1,236,500 | | | | 1,243,778 | |
2.50%, due 5/1/32 | | | 591,454 | | | | 594,935 | |
2.50%, due 5/1/43 | | | 682,158 | | | | 660,974 | |
3.00%, due 12/1/24 | | | 390,979 | | | | 402,046 | |
3.00%, due 9/1/29 | | | 1,433,036 | | | | 1,471,824 | |
3.00%, due 3/1/30 | | | 798,279 | | | | 819,886 | |
3.00%, due 8/1/30 | | | 2,196,208 | | | | 2,255,653 | |
3.00%, due 10/1/30 | | | 76,989 | | | | 79,072 | |
3.00%, due 1/1/31 | | | 260,046 | | | | 267,084 | |
3.00%, due 3/1/32 | | | 693,979 | | | | 712,763 | |
3.00%, due 7/1/32 TBA (e) | | | 600,000 | | | | 615,797 | |
3.00%, due 3/1/35 | | | 503,571 | | | | 513,477 | |
3.00%, due 4/1/35 | | | 791,368 | | | | 806,925 | |
3.00%, due 9/1/43 | | | 1,762,136 | | | | 1,769,152 | |
3.00%, due 3/1/46 | | | 475,049 | | | | 474,832 | |
3.00%, due 5/1/46 | | | 360,624 | | | | 360,392 | |
3.00%, due 7/1/46 | | | 469,125 | | | | 468,823 | |
3.00%, due 9/1/46 | | | 2,112,608 | | | | 2,111,248 | |
3.00%, due 12/1/46 | | | 198,252 | | | | 198,124 | |
3.00%, due 1/1/47 | | | 495,245 | | | | 494,926 | |
3.00%, due 4/1/47 | | | 492,411 | | | | 492,094 | |
3.50%, due 10/1/20 | | | 558,541 | | | | 581,505 | |
| | | | | | | | |
| | | Principal
Amount | | | Value | |
Federal National Mortgage Association
(Mortgage Pass-Through Securities) (continued) | |
3.50%, due 9/1/21 | | $ | 50,056 | | | $ | 52,114 | |
3.50%, due 11/1/28 | | | 527,240 | | | | 548,990 | |
3.50%, due 4/1/29 | | | 146,634 | | | | 152,663 | |
3.50%, due 8/1/29 | | | 520,624 | | | | 542,697 | |
3.50%, due 2/1/32 | | | 509,483 | | | | 532,111 | |
3.50%, due 4/1/32 | | | 695,244 | | | | 726,171 | |
3.50%, due 10/1/34 | | | 453,572 | | | | 472,288 | |
3.50%, due 11/1/40 | | | 292,135 | | | | 301,797 | |
3.50%, due 6/1/41 | | | 911,662 | | | | 941,782 | |
3.50%, due 10/1/43 | | | 2,080,400 | | | | 2,141,090 | |
3.50%, due 11/1/43 | | | 3,731,846 | | | | 3,849,049 | |
3.50%, due 1/1/44 | | | 1,324,467 | | | | 1,366,577 | |
3.50%, due 2/1/45 | | | 588,177 | | | | 606,418 | |
3.50%, due 8/1/45 | | | 2,848,998 | | | | 2,927,912 | |
3.50%, due 9/1/45 | | | 605,074 | | | | 621,834 | |
3.50%, due 10/1/45 | | | 5,044,487 | | | | 5,184,215 | |
3.50%, due 2/1/46 | | | 1,532,150 | | | | 1,574,589 | |
3.50%, due 3/1/46 | | | 1,234,130 | | | | 1,268,314 | |
3.50%, due 4/1/46 | | | 426,325 | | | | 438,134 | |
3.50%, due 6/1/46 | | | 2,412,248 | | | | 2,479,065 | |
3.50%, due 10/1/46 | | | 278,928 | | | | 287,591 | |
3.50%, due 12/1/46 | | | 250,000 | | | | 256,925 | |
3.50%, due 5/1/47 | | | 493,825 | | | | 507,503 | |
4.00%, due 8/1/18 | | | 78,786 | | | | 81,562 | |
4.00%, due 4/1/20 | | | 61,312 | | | | 63,472 | |
4.00%, due 10/1/20 | | | 72 | | | | 75 | |
4.00%, due 3/1/22 | | | 79,074 | | | | 82,292 | |
4.00%, due 12/1/25 | | | 670,598 | | | | 706,003 | |
4.00%, due 4/1/31 | | | 405,063 | | | | 429,608 | |
4.00%, due 12/1/39 | | | 128,717 | | | | 135,925 | |
4.00%, due 7/1/40 | | | 669,477 | | | | 706,960 | |
4.00%, due 11/1/41 | | | 1,573,107 | | | | 1,659,955 | |
4.00%, due 3/1/42 | | | 862,296 | | | | 909,586 | |
4.00%, due 5/1/42 | | | 1,582,433 | | | | 1,669,829 | |
4.00%, due 11/1/42 | | | 779,799 | | | | 827,136 | |
4.00%, due 8/1/43 | | | 1,164,785 | | | | 1,225,060 | |
4.00%, due 11/1/44 | | | 3,012,322 | | | | 3,168,102 | |
4.00%, due 7/1/45 | | | 289,931 | | | | 304,925 | |
4.00%, due 9/1/45 | | | 329,331 | | | | 346,362 | |
4.00%, due 11/1/45 | | | 914,071 | | | | 961,342 | |
4.00%, due 12/1/45 | | | 581,593 | | | | 611,670 | |
4.00%, due 5/1/46 | | | 544,371 | | | | 572,523 | |
4.00%, due 6/1/46 | | | 1,500,742 | | | | 1,578,396 | |
4.00%, due 9/1/46 | | | 1,153,841 | | | | 1,213,511 | |
4.00%, due 12/1/46 | | | 684,541 | | | | 720,039 | |
4.00%, due 7/1/47 TBA (e) | | | 400,000 | | | | 420,484 | |
4.50%, due 5/1/24 | | | 318,796 | | | | 336,603 | |
4.50%, due 7/1/26 | | | 642,880 | | | | 679,389 | |
4.50%, due 4/1/31 | | | 329,328 | | | | 354,124 | |
4.50%, due 11/1/35 | | | 245,444 | | | | 264,345 | |
| | | | |
| 16 | | MainStay VP Bond Portfolio | | The notes to the financial statements are an integral part of,
and should be read in conjunction with, the financial statements. |
| | | | | | | | |
| | | Principal
Amount | | | Value | |
| U.S. Government & Federal Agencies (continued) | |
Federal National Mortgage Association
(Mortgage Pass-Through Securities) (continued) | |
4.50%, due 4/1/41 | | $ | 655,008 | | | $ | 708,121 | |
4.50%, due 5/1/41 | | | 961,684 | | | | 1,040,161 | |
4.50%, due 7/1/41 | | | 885,024 | | | | 955,079 | |
4.50%, due 9/1/41 | | | 496,203 | | | | 536,424 | |
4.50%, due 3/1/44 | | | 348,909 | | | | 374,877 | |
4.50%, due 8/1/44 | | | 1,775,743 | | | | 1,907,730 | |
4.50%, due 11/1/44 | | | 541,864 | | | | 581,623 | |
5.00%, due 9/1/23 | | | 252,092 | | | | 275,206 | |
5.00%, due 12/1/23 | | | 276,796 | | | | 292,927 | |
5.00%, due 9/1/25 | | | 1,511 | | | | 1,649 | |
5.00%, due 4/1/29 | | | 55,698 | | | | 60,805 | |
5.00%, due 4/1/31 | | | 276,965 | | | | 302,953 | |
5.00%, due 3/1/34 | | | 573,754 | | | | 634,934 | |
5.00%, due 4/1/34 | | | 333,374 | | | | 371,548 | |
5.00%, due 4/1/35 | | | 132,901 | | | | 145,885 | |
5.00%, due 2/1/36 | | | 228,410 | | | | 250,773 | |
5.00%, due 5/1/37 | | | 384 | | | | 420 | |
5.00%, due 6/1/37 | | | 261,173 | | | | 285,806 | |
5.00%, due 2/1/38 | | | 800,146 | | | | 874,107 | |
5.00%, due 5/1/38 | | | 358,529 | | | | 391,401 | |
5.00%, due 1/1/39 | | | 144,624 | | | | 157,884 | |
5.00%, due 3/1/44 | | | 202,161 | | | | 221,052 | |
5.50%, due 1/1/21 | | | 1,671 | | | | 1,733 | |
5.50%, due 12/1/21 | | | 5,468 | | | | 5,750 | |
5.50%, due 1/1/22 | | | 31,083 | | | | 32,398 | |
5.50%, due 2/1/22 | | | 1,959 | | | | 2,060 | |
5.50%, due 2/1/26 | | | 684,293 | | | | 761,889 | |
5.50%, due 10/1/28 | | | 496,127 | | | | 549,121 | |
5.50%, due 4/1/34 | | | 140,770 | | | | 157,333 | |
5.50%, due 8/1/37 | | | 123,861 | | | | 138,568 | |
5.50%, due 3/1/38 | | | 330,443 | | | | 367,968 | |
5.50%, due 6/1/38 | | | 292,222 | | | | 326,294 | |
5.50%, due 1/1/39 | | | 643,316 | | | | 718,319 | |
5.50%, due 11/1/39 | | | 121,146 | | | | 134,765 | |
5.50%, due 6/1/40 | | | 91,602 | | | | 102,236 | |
5.50%, due 2/1/42 | | | 652,957 | | | | 737,824 | |
6.00%, due 3/1/36 | | | 41,816 | | | | 47,429 | |
6.00%, due 11/1/37 | | | 119,574 | | | | 134,792 | |
6.00%, due 10/1/38 | | | 535,656 | | | | 605,658 | |
6.00%, due 12/1/38 | | | 448,501 | | | | 507,818 | |
6.00%, due 4/1/40 | | | 208,086 | | | | 236,672 | |
6.00%, due 10/1/40 | | | 279,742 | | | | 316,721 | |
6.50%, due 10/1/36 | | | 48,716 | | | | 54,578 | |
6.50%, due 1/1/37 | | | 221,649 | | | | 259,782 | |
6.50%, due 8/1/37 | | | 9,073 | | | | 10,134 | |
6.50%, due 10/1/37 | | | 86,777 | | | | 95,979 | |
7.00%, due 9/1/37 | | | 61,555 | | | | 71,088 | |
7.00%, due 10/1/37 | | | 1,061 | | | | 1,208 | |
7.00%, due 11/1/37 | | | 7,323 | | | | 8,306 | |
7.50%, due 7/1/28 | | | 24,031 | | | | 26,440 | |
| | | | | | | | |
| | | | | | | 88,261,745 | |
| | | | | | | | |
| | | | | | | | |
| | | Principal
Amount | | | Value | |
¨Government National Mortgage Association
(Mortgage Pass-Through Securities) 9.2% | |
2.50%, due 10/20/46 | | $ | 387,484 | | | $ | 378,272 | |
2.50%, due 1/20/47 | | | 296,256 | | | | 289,213 | |
3.00%, due 7/15/43 | | | 574,277 | | | | 582,465 | |
3.00%, due 7/20/43 | | | 308,392 | | | | 312,699 | |
3.00%, due 8/15/43 | | | 722,653 | | | | 732,927 | |
3.00%, due 8/20/43 | | | 64,803 | | | | 65,708 | |
3.00%, due 12/20/43 | | | 128,964 | | | | 130,766 | |
3.00%, due 4/20/45 | | | 147,384 | | | | 149,026 | |
3.00%, due 7/20/45 | | | 6,985,095 | | | | 7,062,889 | |
3.00%, due 8/20/45 | | | 408,036 | | | | 412,581 | |
3.00%, due 11/20/45 | | | 240,350 | | | | 243,027 | |
3.00%, due 12/20/45 | | | 80,749 | | | | 81,648 | |
3.00%, due 2/20/46 | | | 486,338 | | | | 491,754 | |
3.00%, due 8/20/46 | | | 4,898,160 | | | | 4,952,711 | |
3.00%, due 9/20/46 | | | 1,158,259 | | | | 1,171,159 | |
3.00%, due 10/20/46 | | | 689,900 | | | | 697,583 | |
3.00%, due 12/20/46 | | | 2,259,357 | | | | 2,284,520 | |
3.50%, due 6/20/42 | | | 1,587,541 | | | | 1,652,770 | |
3.50%, due 8/20/43 | | | 2,178,143 | | | | 2,265,653 | |
3.50%, due 11/20/43 | | | 2,095,954 | | | | 2,180,167 | |
3.50%, due 2/15/45 | | | 350,758 | | | | 363,614 | |
3.50%, due 4/20/45 | | | 1,737,882 | | | | 1,801,960 | |
3.50%, due 5/15/45 | | | 837,939 | | | | 868,652 | |
3.50%, due 7/20/45 | | | 1,249,430 | | | | 1,295,499 | |
3.50%, due 8/20/45 | | | 844,922 | | | | 876,076 | |
3.50%, due 12/20/45 | | | 3,360,702 | | | | 3,484,617 | |
3.50%, due 1/20/46 | | | 397,776 | | | | 412,443 | |
3.50%, due 2/20/46 | | | 1,216,560 | | | | 1,261,417 | |
3.50%, due 6/20/46 | | | 677,056 | | | | 702,020 | |
3.50%, due 10/20/46 | | | 1,732,829 | | | | 1,796,722 | |
3.50%, due 11/20/46 | | | 2,389,832 | | | | 2,477,950 | |
3.50%, due 1/20/47 | | | 2,752,871 | | | | 2,854,375 | |
3.50%, due 7/1/47 TBA (e) | | | 500,000 | | | | 517,890 | |
4.00%, due 1/20/42 | | | 1,519,813 | | | | 1,608,176 | |
4.00%, due 2/20/42 | | | 591,554 | | | | 625,605 | |
4.00%, due 8/20/43 | | | 1,850,922 | | | | 1,958,941 | |
4.00%, due 10/20/43 | | | 606,384 | | | | 641,249 | |
4.00%, due 3/15/44 | | | 111,133 | | | | 116,991 | |
4.00%, due 6/20/44 | | | 585,381 | | | | 616,478 | |
4.00%, due 7/15/44 | | | 600,578 | | | | 632,239 | |
4.00%, due 8/20/44 | | | 514,780 | | | | 542,126 | |
4.00%, due 9/20/44 | | | 529,368 | | | | 557,489 | |
4.00%, due 12/20/44 | | | 362,310 | | | | 381,557 | |
4.00%, due 1/20/45 | | | 284,098 | | | | 299,190 | |
4.00%, due 4/20/45 | | | 372,138 | | | | 391,907 | |
4.00%, due 7/15/45 | | | 456,927 | | | | 481,015 | |
4.00%, due 8/15/45 | | | 267,868 | | | | 281,997 | |
4.00%, due 9/20/45 | | | 192,413 | | | | 202,634 | |
4.00%, due 2/20/46 | | | 361,264 | | | | 380,455 | |
4.00%, due 8/20/46 | | | 373,115 | | | | 392,936 | |
| | | | | | |
The notes to the financial statements are an integral part of,
and should be read in conjunction with, the financial statements. | | | | | 17 | |
Portfolio of Investments June 30, 2017 (Unaudited) (continued)
| | | | | | | | |
| | | Principal
Amount | | | Value | |
| U.S. Government & Federal Agencies (continued) | |
Government National Mortgage Association
(Mortgage Pass-Through Securities) (continued) | |
4.00%, due 12/20/46 | | $ | 600,060 | | | $ | 631,936 | |
4.00%, due 7/1/47 TBA (e) | | | 8,300,000 | | | | 8,731,976 | |
4.50%, due 6/15/39 | | | 1,498,154 | | | | 1,610,955 | |
4.50%, due 6/15/40 | | | 355,212 | | | | 382,894 | |
4.50%, due 6/20/40 | | | 657,107 | | | | 706,060 | |
4.50%, due 3/20/41 | | | 261,430 | | | | 280,927 | |
4.50%, due 4/20/41 | | | 200,214 | | | | 215,131 | |
4.50%, due 9/20/41 | | | 395,223 | | | | 424,711 | |
4.50%, due 12/20/41 | | | 69,804 | | | | 75,014 | |
4.50%, due 4/20/42 | | | 138,565 | | | | 148,889 | |
4.50%, due 8/20/43 | | | 405,401 | | | | 431,782 | |
4.50%, due 3/20/44 | | | 631,962 | | | | 679,333 | |
4.50%, due 12/20/44 | | | 220,425 | | | | 234,392 | |
4.50%, due 4/20/45 | | | 175,204 | | | | 186,306 | |
5.00%, due 9/15/39 | | | 324,381 | | | | 359,749 | |
5.00%, due 6/15/40 | | | 391,763 | | | | 429,781 | |
5.00%, due 7/15/40 | | | 365,524 | | | | 401,692 | |
5.00%, due 9/20/40 | | | 1,356,893 | | | | 1,490,786 | |
5.00%, due 10/20/41 | | | 117,094 | | | | 128,865 | |
5.00%, due 8/20/43 | | | 91,396 | | | | 99,069 | |
5.50%, due 1/20/35 | | | 6,285 | | | | 7,027 | |
5.50%, due 7/15/35 | | | 106,829 | | | | 120,238 | |
5.50%, due 8/15/35 | | | 67,638 | | | | 76,108 | |
5.50%, due 5/15/36 | | | 55,394 | | | | 62,001 | |
5.50%, due 6/15/38 | | | 24,367 | | | | 27,136 | |
5.50%, due 1/15/39 | | | 143,430 | | | | 159,966 | |
5.50%, due 3/20/39 | | | 421,976 | | | | 460,267 | |
5.50%, due 7/15/39 | | | 98,015 | | | | 109,145 | |
5.50%, due 12/15/39 | | | 33,898 | | | | 37,960 | |
5.50%, due 2/15/40 | | | 194,569 | | | | 216,686 | |
6.00%, due 11/15/37 | | | 28,116 | | | | 31,898 | |
6.00%, due 12/15/37 | | | 248,778 | | | | 280,452 | |
6.00%, due 9/15/38 | | | 228,019 | | | | 257,049 | |
6.00%, due 10/15/38 | | | 62,522 | | | | 70,483 | |
6.50%, due 3/15/36 | | | 107,056 | | | | 119,093 | |
6.50%, due 6/15/36 | | | 85,031 | | | | 94,544 | |
6.50%, due 9/15/36 | | | 33,076 | | | | 37,029 | |
6.50%, due 7/15/37 | | | 90,729 | | | | 102,487 | |
7.00%, due 7/15/31 | | | 37,195 | | | | 39,536 | |
| | | | | | | | |
| | | | | | | 74,921,111 | |
| | | | | | | | |
¨United States Treasury Bonds 1.5% | | | | | | | | |
3.00%, due 2/15/47 | | | 3,275,000 | | | | 3,378,366 | |
4.25%, due 5/15/39 | | | 7,325,000 | | | | 9,175,991 | |
| | | | | | | | |
| | | | | | | 12,554,357 | |
| | | | | | | | |
¨United States Treasury Notes 12.1% | | | | | | | | |
1.00%, due 9/15/18 | | | 6,500,000 | | | | 6,475,625 | |
1.00%, due 10/15/19 | | | 16,900,000 | | | | 16,740,244 | |
1.125%, due 2/28/21 | | | 300,000 | | | | 293,906 | |
| | | | | | | | |
| | | Principal
Amount | | | Value | |
United States Treasury Notes (continued) | |
1.25%, due 6/30/19 | | $ | 12,500,000 | | | $ | 12,465,825 | |
1.50%, due 5/15/20 | | | 13,300,000 | | | | 13,284,931 | |
1.50%, due 6/15/20 | | | 20,000,000 | | | | 19,971,880 | |
1.75%, due 6/30/22 | | | 18,600,000 | | | | 18,479,398 | |
2.00%, due 4/30/24 | | | 3,300,000 | | | | 3,275,379 | |
2.125%, due 2/29/24 | | | 6,350,000 | | | | 6,357,690 | |
2.375%, due 5/15/27 | | | 1,400,000 | | | | 1,408,859 | |
| | | | | | | | |
| | | | | | | 98,753,737 | |
| | | | | | | | |
Total U.S. Government & Federal Agencies
(Cost $371,563,075) | | | | 372,240,363 | |
| | | | | | | | |
Total Long-Term Bonds
(Cost $803,526,855) | | | | | | | 814,517,586 | |
| | | | | | | | |
|
| Short-Term Investment 1.0% | |
Other Commercial Paper 1.0% | | | | | | | | |
Army and Air Force Exchange Service
1.105%, due 7/3/17 (a)(f) | | | 8,150,000 | | | | 8,149,506 | |
| | | | | | | | |
Total Short-Term Investment
(Cost $8,149,506) | | | | | | | 8,149,506 | |
| | | | | | | | |
Total Investments, Before Investments Sold Short
(Cost $811,676,361) (g) | | | 101.2 | % | | | 822,667,092 | |
| | | | | | | | |
|
| Investment Sold Short (1.0%) | |
Federal Agency Security Sold Short (1.0%) | |
Federal Home Loan Mortgage Corporation (Mortgage Pass-Through Securities)
4.00%, due 7/1/47 TBA (e) | | $ | (7,800,000 | ) | | | (8,203,192 | ) |
| | | | | | | | |
Total Investment Sold Short
(Proceeds $8,242,407) | | | | | | | (8,203,192 | ) |
| | | | | | | | |
Total Investments, Net of Investments Sold Short
(Cost $803,433,954) | | | 100.2 | % | | | 814,463,900 | |
Other Assets, Less Liabilities | | | (0.2 | ) | | | (1,274,258 | ) |
Net Assets | | | 100.0 | % | | $ | 813,189,642 | |
| ‡ | Less than one-tenth of a percent. |
| (a) | May be sold to institutional investors only under Rule 144A or securities offered pursuant to Section 4(a)(2) of the Securities Act of 1933, as amended. |
| (b) | Step coupon—Rate shown was the rate in effect as of June 30, 2017. |
| (c) | Floating rate—Rate shown was the rate in effect as of June 30, 2017. |
| (d) | Fair valued security—Represents fair value as measured in good faith under procedures approved by the Board of Trustees. As of June 30, 2017, the total market value of fair valued securities was $5,799,121, which represented 0.7% of the Portfolio’s net assets. |
| | | | |
| 18 | | MainStay VP Bond Portfolio | | The notes to the financial statements are an integral part of,
and should be read in conjunction with, the financial statements. |
| (e) | TBA—Securities purchased on a forward commitment basis with an approximate principal amount and maturity date. The actual principal amount and maturity date will be determined upon settlement. As of June 30, 2017, the total net market value of these securities was $2,082,955, which represented 0.3% of the Portfolio’s net assets. All or a portion of these securities are a part of a mortgage dollar roll agreement. |
| (f) | Interest rate shown represents yield to maturity. |
| (g) | As of June 30, 2017, cost was $812,398,097 for federal income tax purposes and net unrealized appreciation was as follows: |
| | | | |
Gross unrealized appreciation | | $ | 16,100,059 | |
Gross unrealized depreciation | | | (5,831,064 | ) |
| | | | |
Net unrealized appreciation | | $ | 10,268,995 | |
| | | | |
As of June 30, 2017, the Portfolio held the following futures contracts1:
| | | | | | | | | | | | | | | | |
Type | | Number of
Contracts
Long
(Short) | | | Expiration
Date | | | Notional
Amount | | | Unrealized
Appreciation
(Depreciation)2 | |
| 2-Year United States Treasury Note | | | 115 | | | | September 2017 | | | $ | 24,852,578 | | | $ | (18,806 | ) |
| 5-Year United States Treasury Note | | | 239 | | | | September 2017 | | | | 28,162,789 | | | | (119,312 | ) |
| 10-Year United States Treasury Note | | | 131 | | | | September 2017 | | | | 16,444,594 | | | | (17,914 | ) |
| Ultra Long United States Treasury Bond | | | 107 | | | | September 2017 | | | | 17,748,625 | | | | 336,470 | |
| Ultra 10-Year United States Treasury Note | | | (146 | ) | | | September 2017 | | | | (19,682,625 | ) | | | 38,740 | |
| United States Treasury Long Bond | | | 60 | | | | September 2017 | | | | 9,221,250 | | | | 97,271 | |
| | | | | | | | | | | | | | | | |
| | | $ | 76,747,211 | | | $ | 316,449 | |
| | | | | | | | | | | | | | | | |
| 1. | As of June 30, 2017, cash in the amount of $786,400 was on deposit with a broker or futures commission merchant for futures transactions. |
| 2. | Represents the difference between the value of the contracts at the time they were opened and the value as of June 30, 2017. |
The following is a summary of the fair valuations according to the inputs used as of June 30, 2017, for valuing the Portfolio’s assets and liabilities.
Asset Valuation Inputs
| | | | | | | | | | | | | | | | |
Description | | Quoted
Prices in
Active
Markets for
Identical
Assets (Level 1) | | | Significant
Other
Observable
Inputs (Level 2) | | | Significant
Unobservable
Inputs (Level 3) | | | Total | |
| Investments in Securities (a) | | | | | | | | | | | | | | | | |
| Long-Term Bonds | | | | | | | | | | | | | | | | |
Asset-Backed Securities | | $ | — | | | $ | 74,003,331 | | | $ | — | | | $ | 74,003,331 | |
Corporate Bonds | | | — | | | | 295,136,718 | | | | — | | | | 295,136,718 | |
Foreign Government Bond | | | — | | | | 388,500 | | | | — | | | | 388,500 | |
Mortgage-Backed Securities | | | — | | | | 62,438,813 | | | | — | | | | 62,438,813 | |
Municipal Bonds | | | — | | | | 10,309,861 | | | | — | | | | 10,309,861 | |
U.S. Government & Federal Agencies | | | — | | | | 372,240,363 | | | | — | | | | 372,240,363 | |
| | | | | | | | | | | | | | | | |
| Total Long-Term Bonds | | | — | | | | 814,517,586 | | | | — | | | | 814,517,586 | |
| | | | | | | | | | | | | | | | |
| Short-Term Investment | | | | | | | | | | | | | | | | |
Other Commercial Paper | | | — | | | | 8,149,506 | | | | — | | | | 8,149,506 | |
| | | | | | | | | | | | | | | | |
| Total Investments in Securities | | | — | | | | 822,667,092 | | | | — | | | | 822,667,092 | |
| | | | | | | | | | | | | | | | |
| Other Financial Instruments | | | | | | | | | | | | | | | | |
Futures Contracts (b) | | | 472,481 | | | | — | | | | — | | | | 472,481 | |
| | | | | | | | | | | | | | | | |
| Total Investments in Securities and Other Financial Instruments | | $ | 472,481 | | | $ | 822,667,092 | | | $ | — | | | $ | 823,139,573 | |
| | | | | | | | | | | | | | | | |
| | | | | | |
The notes to the financial statements are an integral part of,
and should be read in conjunction with, the financial statements. | | | | | 19 | |
Portfolio of Investments June 30, 2017 (Unaudited) (continued)
Liability Valuation Inputs
| | | | | | | | | | | | | | | | |
Description | | Quoted
Prices in
Active
Markets for
Identical
Assets (Level 1) | | | Significant
Other
Observable
Inputs (Level 2) | | | Significant
Unobservable
Inputs (Level 3) | | | Total | |
| Investment in Security Sold Short (a) | | | | | | | | | | | | | | | | |
Federal Agency Security Sold Short | | $ | — | | | $ | (8,203,192 | ) | | $ | — | | | $ | (8,203,192 | ) |
| Other Financial Instruments | | | | | | | | | | | | | | | | |
Futures Contracts (b) | | | (156,032 | ) | | | — | | | | — | | | | (156,032 | ) |
| | | | | | | | | | | | | | | | |
| Total Investments in Securities Sold Short and Other Financial Instruments | | $ | (156,032 | ) | | $ | (8,203,192 | ) | | $ | — | | | $ | (8,359,224 | ) |
| | | | | | | | | | | | | | | | |
| (a) | For a complete listing of investments and their industries, see the Portfolio of Investments. |
| (b) | The value listed for these securities reflects unrealized appreciation (depreciation) as shown on the Portfolio of Investments. |
The Portfolio recognizes transfers between the levels as of the beginning of the period.
For the period ended June 30, 2017, the Portfolio did not have any transfers between among levels. (See Note 2)
As of June 30, 2017, the Portfolio did not hold any investments with significant unobservable inputs (Level 3).
| | | | |
| 20 | | MainStay VP Bond Portfolio | | The notes to the financial statements are an integral part of,
and should be read in conjunction with, the financial statements. |
Statement of Assets and Liabilities as of June 30, 2017 (Unaudited)
| | | | |
| Assets | |
Investment in securities, at value
(identified cost $811,676,361) | | $ | 822,667,092 | |
Cash collateral on deposit at broker | | | 786,400 | |
Cash | | | 10,141 | |
Receivables: | | | | |
Investment securities sold | | | 19,708,065 | |
Interest | | | 4,906,700 | |
Fund shares sold | | | 102,243 | |
Other assets | | | 4,977 | |
| | | | |
Total assets | | | 848,185,618 | |
| | | | |
| |
| Liabilities | | | | |
Investments sold short
(proceeds $8,242,407) | | | 8,203,192 | |
Payables: | | | | |
Investment securities purchased | | | 25,830,618 | |
Manager (See Note 3) | | | 330,073 | |
Fund shares redeemed | | | 243,795 | |
Variation margin on futures contracts | | | 140,917 | |
Shareholder communication | | | 94,695 | |
NYLIFE Distributors (See Note 3) | | | 71,112 | |
Custodian | | | 37,506 | |
Professional fees | | | 31,624 | |
Interest on TBA securities | | | 4,133 | |
Trustees | | | 1,658 | |
Accrued expenses | | | 6,653 | |
| | | | |
Total liabilities | | | 34,995,976 | |
| | | | |
Net assets | | $ | 813,189,642 | |
| | | | |
| |
| Composition of Net Assets | | | | |
Shares of beneficial interest outstanding (par value of $.001 per share) unlimited number of shares authorized | | $ | 55,943 | |
Additional paid-in capital | | | 765,566,078 | |
| | | | |
| | | 765,622,021 | |
Undistributed net investment income | | | 28,875,927 | |
Accumulated net realized gain (loss) on investments, investments sold short and futures transactions | | | 7,345,299 | |
Net unrealized appreciation (depreciation) on investments and futures contracts | | | 11,307,180 | |
Net unrealized appreciation (depreciation) on investments sold short | | | 39,215 | |
| | | | |
Net assets | | $ | 813,189,642 | |
| | | | |
| | | | |
Initial Class | | | | |
Net assets applicable to outstanding shares | | $ | 469,906,344 | |
| | | | |
Shares of beneficial interest outstanding | | | 32,177,384 | |
| | | | |
Net asset value per share outstanding | | $ | 14.60 | |
| | | | |
Service Class | | | | |
Net assets applicable to outstanding shares | | $ | 343,283,298 | |
| | | | |
Shares of beneficial interest outstanding | | | 23,765,996 | |
| | | | |
Net asset value per share outstanding | | $ | 14.44 | |
| | | | |
| | | | | | |
The notes to the financial statements are an integral part of,
and should be read in conjunction with, the financial statements. | | | | | 21 | |
Statement of Operations for the six months ended June 30, 2017 (Unaudited)
| | | | |
| Investment Income (Loss) | |
Income | | | | |
Interest | | $ | 11,470,327 | |
| | | | |
Expenses | | | | |
Manager (See Note 3) | | | 2,067,460 | |
Distribution/Service—Service Class (See Note 3) | | | 430,804 | |
Shareholder communication | | | 72,281 | |
Professional fees | | | 49,998 | |
Custodian | | | 13,644 | |
Trustees | | | 11,418 | |
Miscellaneous | | | 18,654 | |
| | | | |
Total expenses | | | 2,664,259 | |
| | | | |
Net investment income (loss) | | | 8,806,068 | |
| | | | |
|
| Realized and Unrealized Gain (Loss) on Investments and Futures Contracts | |
Net realized gain (loss) on: | | | | |
Investment transactions | | | (630,842 | ) |
Futures transactions | | | 711,523 | |
| | | | |
Net realized gain (loss) on investments and futures transactions | | | 80,681 | |
| | | | |
Net change in unrealized appreciation (depreciation) on: | | | | |
Investments | | | 10,196,577 | |
Investments sold short | | | 32,359 | |
Futures contracts | | | 748,610 | |
| | | | |
Net change in unrealized appreciation (depreciation) on investments, investments sold short and futures contracts | | | 10,977,546 | |
| | | | |
Net realized and unrealized gain (loss) on investments, investments sold short and futures transactions | | | 11,058,227 | |
| | | | |
Net increase (decrease) in net assets resulting from operations | | $ | 19,864,295 | |
| | | | |
| | | | |
| 22 | | MainStay VP Bond Portfolio | | The notes to the financial statements are an integral part of,
and should be read in conjunction with, the financial statements. |
Statements of Changes in Net Assets
for the six months ended June 30, 2017 (Unaudited) and the year ended December 31, 2016
| | | | | | | | |
| | | 2017 | | | 2016 | |
| Increase (Decrease) in Net Assets | |
Operations: | | | | | | | | |
Net investment income (loss) | | $ | 8,806,068 | | | $ | 20,027,756 | |
Net realized gain (loss) on investments and futures transactions | | | 80,681 | | | | 7,718,265 | |
Net change in unrealized appreciation (depreciation) on investments, investments sold short and futures contracts | | | 10,977,546 | | | | 4,968,860 | |
| | | | |
Net increase (decrease) in net assets resulting from operations | | | 19,864,295 | | | | 32,714,881 | |
| | | | |
Dividends and distributions to shareholders: | | | | | | | | |
From net investment income: | | | | | | | | |
Initial Class | | | — | | | | (15,833,855 | ) |
Service Class | | | — | | | | (8,931,232 | ) |
| | | | |
| | | — | | | | (24,765,087 | ) |
| | | | |
From net realized gain on investments: | | | | | | | | |
Initial Class | | | — | | | | (2,339,844 | ) |
Service Class | | | — | | | | (1,449,728 | ) |
| | | | |
| | | — | | | | (3,789,572 | ) |
| | | | |
Total dividends and distributions to shareholders | | | — | | | | (28,554,659 | ) |
| | | | |
Capital share transactions: | | | | | | | | |
Net proceeds from sale of shares | | | 55,750,612 | | | | 138,388,078 | |
Net asset value of shares issued to shareholders in reinvestment of dividends and distributions | | | — | | | | 28,554,659 | |
Cost of shares redeemed | | | (153,251,464 | ) | | | (327,070,196 | ) |
| | | | |
Increase (decrease) in net assets derived from capital share transactions | | | (97,500,852 | ) | | | (160,127,459 | ) |
| | | | |
Net increase (decrease) in net assets | | | (77,636,557 | ) | | | (155,967,237 | ) |
| | |
| Net Assets | | | | | | | | |
Beginning of period | | | 890,826,199 | | | | 1,046,793,436 | |
| | | | |
End of period | | $ | 813,189,642 | | | $ | 890,826,199 | |
| | | | |
Undistributed net investment income at end of period | | $ | 28,875,927 | | | $ | 20,069,859 | |
| | | | |
| | | | | | |
The notes to the financial statements are an integral part of,
and should be read in conjunction with, the financial statements. | | | | | 23 | |
Financial Highlights selected per share data and ratios
| | | | | | | | | | | | | | | | | | | | | | | | | | | | |
| | | Six months
ended
June 30, | | | | | | Year ended December 31, | |
| Initial Class | | 2017* | | | | | | 2016 | | | 2015 | | | 2014 | | | 2013 | | | 2012 | |
Net asset value at beginning of period | | $ | 14.26 | | | | | | | $ | 14.19 | | | $ | 14.52 | | | $ | 14.00 | | | $ | 14.78 | | | $ | 14.97 | |
| | | | | | | | | | | | | | | | | | | | | | | | | | | | |
Net investment income (loss) (a) | | | 0.16 | | | | | | | | 0.32 | | | | 0.31 | | | | 0.33 | | | | 0.26 | | | | 0.28 | |
Net realized and unrealized gain (loss) on investments | | | 0.18 | | | | | | | | 0.20 | | | | (0.27 | ) | | | 0.49 | | | | (0.54 | ) | | | 0.41 | |
| | | | | | | | | | | | | | | | | | | | | | | | | | | | |
Total from investment operations | | | 0.34 | | | | | | | | 0.52 | | | | 0.04 | | | | 0.82 | | | | (0.28 | ) | | | 0.69 | |
| | | | | | | | | | | | | | | | | | | | | | | | | | | | |
| Less dividends and distributions: | | | | | | | | | | | | | | | | | | | | | | | | | | | | |
From net investment income | | | — | | | | | | | | (0.39 | ) | | | (0.36 | ) | | | (0.30 | ) | | | (0.27 | ) | | | (0.37 | ) |
From net realized gain on investments | | | — | | | | | | | | (0.06 | ) | | | (0.01 | ) | | | — | | | | (0.23 | ) | | | (0.51 | ) |
| | | | | | | | | | | | | | | | | | | | | | | | | | | | |
Total dividends and distributions | | | — | | | | | | | | (0.45 | ) | | | (0.37 | ) | | | (0.30 | ) | | | (0.50 | ) | | | (0.88 | ) |
| | | | | | | | | | | | | | | | | | | | | | | | | | | | |
Net asset value at end of period | | $ | 14.60 | | | | | | | $ | 14.26 | | | $ | 14.19 | | | $ | 14.52 | | | $ | 14.00 | | | $ | 14.78 | |
| | | | | | | | | | | | | | | | | | | | | | | | | | | | |
Total investment return (b) | | | 2.38 | %(c) | | | | | | | 3.53 | % | | | 0.22 | % | | | 5.82 | % | | | (1.82 | %) | | | 4.66 | % |
| Ratios (to average net assets)/Supplemental Data: | | | | | | | | | | | | | | | | | | | | | | | | | | | | |
Net investment income (loss) | | | 2.19 | %†† | | | | | | | 2.16 | %(d) | | | 2.14 | % | | | 2.29 | % | | | 1.82 | % | | | 1.84 | % |
Net expenses | | | 0.53 | %†† | | | | | | | 0.51 | %(e) | | | 0.52 | % | | | 0.53 | % | | | 0.53 | % | | | 0.53 | % |
Expenses (before waiver/reimbursement) | | | 0.53 | %†† | | | | | | | 0.53 | % | | | 0.52 | % | | | 0.53 | % | | | 0.53 | % | | | 0.53 | % |
Portfolio turnover rate (f) | | | 110 | % | | | | | | | 258 | % | | | 326 | % | | | 262 | % | | | 327 | % | | | 311 | % |
Net assets at end of period (in 000’s) | | $ | 469,906 | | | | | | | $ | 538,979 | | | $ | 707,265 | | | $ | 733,113 | | | $ | 676,544 | | | $ | 608,651 | |
| (a) | Per share data based on average shares outstanding during the period. |
| (b) | Total return does not reflect any deduction of sales charges, mortality and expense charges, contract charges or administrative charges. For periods of less than one year, total return is not annualized. |
| (c) | Total investment return may reflect adjustments to conform to generally accepted accounting principles. |
| (d) | Without the custody fee reimbursement, net investment income (loss) would have been 2.14%. |
| (e) | Without the custody fee reimbursement, net expenses would have been 0.53%. |
| (f) | The portfolio turnover rates not including mortgage dollar rolls were 103%, 223%, 191%, 116%, 170% and 222% for the six months ended June 30, 2017 and years ended December 31, 2016, 2015, 2014, 2013 and 2012, respectively. |
| | | | | | | | | | | | | | | | | | | | | | | | | | | | |
| | | Six months
ended
June 30, | | | | | | Year ended December 31, | |
| Service Class | | 2017* | | | | | | 2016 | | | 2015 | | | 2014 | | | 2013 | | | 2012 | |
Net asset value at beginning of period | | $ | 14.12 | | | | | | | $ | 14.06 | | | $ | 14.39 | | | $ | 13.87 | | | $ | 14.64 | | | $ | 14.85 | |
| | | | | | | | | | | | | | | | | | | | | | | | | | | | |
Net investment income (loss) (a) | | | 0.14 | | | | | | | | 0.28 | | | | 0.27 | | | | 0.29 | | | | 0.22 | | | | 0.24 | |
Net realized and unrealized gain (loss) on investments | | | 0.18 | | | | | | | | 0.19 | | | | (0.27 | ) | | | 0.48 | | | | (0.52 | ) | | | 0.40 | |
| | | | | | | | | | | | | | | | | | | | | | | | | | | | |
Total from investment operations | | | 0.32 | | | | | | | | 0.47 | | | | (0.00 | )‡ | | | 0.77 | | | | (0.30 | ) | | | 0.64 | |
| | | | | | | | | | | | | | | | | | | | | | | | | | | | |
| Less dividends and distributions: | | | | | | | | | | | | | | | | | | | | | | | | | | | | |
From net investment income | | | — | | | | | | | | (0.35 | ) | | | (0.32 | ) | | | (0.25 | ) | | | (0.24 | ) | | | (0.34 | ) |
From net realized gain on investments | | | — | | | | | | | | (0.06 | ) | | | (0.01 | ) | | | — | | | | (0.23 | ) | | | (0.51 | ) |
| | | | | | | | | | | | | | | | | | | | | | | | | | | | |
Total dividends and distributions | | | — | | | | | | | | (0.41 | ) | | | (0.33 | ) | | | (0.25 | ) | | | (0.47 | ) | | | (0.85 | ) |
| | | | | | | | | | | | | | | | | | | | | | | | | | | | |
Net asset value at end of period | | $ | 14.44 | | | | | | | $ | 14.12 | | | $ | 14.06 | | | $ | 14.39 | | | $ | 13.87 | | | $ | 14.64 | |
| | | | | | | | | | | | | | | | | | | | | | | | | | | | |
Total investment return (b) | | | 2.27 | %(c) | | | | | | | 3.27 | % | | | (0.03 | %) | | | 5.56 | % | | | (2.07 | %) | | | 4.40 | % |
| Ratios (to average net assets)/Supplemental Data: | | | | | | | | | | | | | | | | | | | | | | | | | | | | |
Net investment income (loss) | | | 1.94 | %†† | | | | | | | 1.90 | %(d) | | | 1.89 | % | | | 2.04 | % | | | 1.55 | % | | | 1.59 | % |
Net expenses | | | 0.78 | %†† | | | | | | | 0.76 | %(e) | | | 0.77 | % | | | 0.78 | % | | | 0.78 | % | | | 0.78 | % |
Expenses (before waiver/reimbursement) | | | 0.78 | %†† | | | | | | | 0.78 | % | | | 0.77 | % | | | 0.78 | % | | | 0.78 | % | | | 0.78 | % |
Portfolio turnover rate (f) | | | 110 | % | | | | | | | 258 | % | | | 326 | % | | | 262 | % | | | 327 | % | | | 311 | % |
Net assets at end of period (in 000’s) | | $ | 343,283 | | | | | | | $ | 351,848 | | | $ | 339,529 | | | $ | 358,663 | | | $ | 364,746 | | | $ | 442,860 | |
| ‡ | Less than one cent per share. |
| (a) | Per share data based on average shares outstanding during the period. |
| (b) | Total return does not reflect any deduction of sales charges, mortality and expense charges, contract charges or administrative charges. For periods of less than one year, total return is not annualized. |
| (c) | Total investment return may reflect adjustments to conform to generally accepted accounting principles. |
| (d) | Without the custody fee reimbursement, net investment income (loss) would have been 1.88%. |
| (e) | Without the custody fee reimbursement, net expenses would have been 0.78%. |
| (f) | The portfolio turnover rates not including mortgage dollar rolls were 103%, 223%, 191%, 116%, 170% and 222% for the six months ended June 30, 2017 and years ended December 31, 2016, 2015, 2014, 2013 and 2012, respectively. |
| | | | |
| 24 | | MainStay VP Bond Portfolio | | The notes to the financial statements are an integral part of,
and should be read in conjunction with, the financial statements. |
Notes to Financial Statements (Unaudited)
Note 1–Organization and Business
MainStay VP Funds Trust (the “Fund”) was organized as a Delaware statutory trust on February 1, 2011. The Fund is registered under the Investment Company Act of 1940, as amended (the “1940 Act”), as an open-end management investment company. The Fund is comprised of thirty-two separate series (collectively referred to as the “Portfolios”). These financial statements and notes relate to the MainStay VP Bond Portfolio (the “Portfolio”), a “diversified” portfolio, as that term is defined in the 1940 Act, as interpreted or modified by regulatory authorities having jurisdiction, from time to time.
Shares of the Portfolio are currently offered to certain separate accounts to fund variable annuity policies and variable universal life insurance policies issued by New York Life Insurance and Annuity Corporation (“NYLIAC”), a wholly-owned subsidiary of New York Life Insurance Company (“New York Life”). NYLIAC allocates shares of the Portfolios to, among others, NYLIAC Variable Annuity Separate Accounts-I, II, III and IV, VUL Separate Account-I and CSVUL Separate Account-I (collectively, the “Separate Accounts”). Shares of the Portfolio are also offered to the MainStay VP Conservative Allocation Portfolio, MainStay VP Moderate Allocation Portfolio, MainStay VP Moderate Growth Allocation Portfolio and MainStay VP Growth Allocation Portfolio, which operate as “funds-of-funds.”
The Portfolio currently offers two classes of shares. Initial Class shares commenced operations on January 23, 1984. Service Class shares commenced operations on June 4, 2003. Shares of the Portfolio are sold and are redeemed at a price equal to their respective net asset value (“NAV”) per share. No sales or redemption charge is applicable to the purchase or redemption of the Portfolio’s shares. Under the terms of the Fund’s multiple class plan, adopted pursuant to Rule 18f-3 under the 1940 Act, the classes differ in that, among other things, pursuant to a plan adopted in accordance with Rule 12b-1 under the 1940 Act, Service Class shares of the Portfolio pay a combined distribution and service fee of 0.25% of average daily net assets attributable to Service Class shares of the Portfolio to the Distributor (as defined in Note 3(B)) pursuant to a plan adopted in accordance with Rule 12b-1 under the 1940 Act. Contract owners of variable annuity contracts purchased after June 2, 2003, are permitted to invest only in the Service Class shares.
The Portfolio’s investment objective is to seek total return.
Note 2–Significant Accounting Policies
The Portfolio is an investment company and accordingly follows the investment company accounting and reporting guidance of the Financial Accounting Standards Board (“FASB”) Accounting Standard Codification Topic 946 Financial Services—Investment Companies. The Portfolio prepares its financial statements in accordance with generally accepted accounting principles (“GAAP”) in the United States of America and follows the significant accounting policies described below.
(A) Securities Valuation. Investments are usually valued as of the close of regular trading on the New York Stock Exchange (the “Exchange”) (usually 4:00 p.m. Eastern time) on each day the Portfolio is open for business (“valuation date”).
The Board of Trustees (the “Board”) of the Fund adopted procedures establishing methodologies for the valuation of the Portfolio’s securities and other assets and delegated the responsibility for valuation
determinations under those procedures to the Valuation Committee of the Fund (the “Valuation Committee”). The Board authorized the Valuation Committee to appoint a Valuation Sub-Committee (the “Sub-Committee”) to deal in the first instance with establishing the prices of securities for which market quotations are not readily available or the prices of which are not otherwise readily determinable under these procedures. The Sub-Committee meets (in person, via electronic mail or via teleconference) on an as-needed basis. Subsequently, the Valuation Committee meets to ensure that actions taken by the Sub-Committee were appropriate. The procedures recognize that, subject to the oversight of the Board and unless otherwise noted, the responsibility for the day-to-day valuation of portfolio assets (including fair value measurements for the Portfolio’s assets and liabilities) rests with New York Life Investment Management LLC (“New York Life Investments” or the “Manager”), aided to whatever extent necessary by the Subadvisor (as defined in Note 3(A)) to the Portfolio.
To assess the appropriateness of security valuations, the Manager, the Subadvisor or the Portfolio’s third party service provider, who is subject to oversight by the Manager, regularly compares prior day prices, prices on comparable securities and the sale prices to the prior and current day prices and challenges prices with changes exceeding certain tolerance levels with third party pricing services or broker sources. For those securities valued through either a standardized fair valuation methodology or a fair valuation measurement, the Sub-Committee deals in the first instance with such valuation and the Valuation Committee reviews and affirms, if appropriate, the reasonableness of the valuation based on such methodologies and measurements on a regular basis after considering all relevant information that is reasonably available. Any action taken by the Sub-Committee with respect to the valuation of a portfolio security or other asset is submitted by the Valuation Committee to the Board for its review and ratification, if appropriate, at its next regularly scheduled meeting.
“Fair value” is defined as the price the Portfolio would reasonably expect to receive upon selling an asset or liability in an orderly transaction to an independent buyer in the principal or most advantageous market for the asset or liability. Fair value measurements are determined within a framework that establishes a three-tier hierarchy which maximizes the use of observable market data and minimizes the use of unobservable inputs to establish a classification of fair value measurements for disclosure purposes. “Inputs” refer broadly to the assumptions that market participants would use in pricing the asset or liability, including assumptions about risk, such as the risk inherent in a particular valuation technique used to measure fair value using a pricing model and/or the risk inherent in the inputs for the valuation technique. Inputs may be observable or unobservable. Observable inputs reflect the assumptions market participants would use in pricing the asset or liability based on market data obtained from sources independent of the Portfolio. Unobservable inputs reflect the Portfolio’s own assumptions about the assumptions market participants would use in pricing the asset or liability based on the information available. The inputs or methodology used for valuing assets or liabilities may not be an indication of the risks associated with investing in those assets or liabilities. The three-tier hierarchy of inputs is summarized below.
| • | | Level 1—quoted prices in active markets for an identical asset or liability |
Notes to Financial Statements (Unaudited) (continued)
| • | | Level 2—other significant observable inputs (including quoted prices for a similar asset or liability in active markets, interest rates and yield curves, prepayment speeds, credit risk, etc.) |
| • | | Level 3—significant unobservable inputs (including the Portfolio’s own assumptions about the assumptions that market participants would use in measuring fair value of an asset or liability) |
The level of an asset or liability within the fair value hierarchy is based on the lowest level of an input, both individually and in the aggregate, that is significant to the fair value measurement. As of June 30, 2017, the aggregate value by input level of the Portfolio’s assets and liabilities is included at the end of the Portfolio’s Portfolio of Investments.
The Portfolio may use third party vendor evaluations, whose prices may be derived from one or more of the following standard inputs, among others:
| | |
• Benchmark yields | | • Reported trades |
• Broker/dealer quotes | | • Issuer spreads |
• Two-sided markets | | • Benchmark securities |
• Bids/offers | | • Reference data (corporate actions or material event notices) |
• Industry and economic events | | • Comparable bonds |
• Monthly payment information | | |
An asset or liability for which market values cannot be measured using the methodologies described above is valued by methods deemed reasonable in good faith by the Valuation Committee, following the procedures established by the Board, to represent fair value. Under these procedures, the Portfolio generally uses a market-based approach which may use related or comparable assets or liabilities, recent transactions, market multiples, book values, and other relevant information. The Portfolio may also use an income-based valuation approach in which the anticipated future cash flows of the asset or liability are discounted to calculate fair value. Discounts may also be applied due to the nature and/or duration of any restrictions on the disposition of the asset or liability. Fair value represents a good faith approximation of the value of a security. Fair value determinations involve the consideration of a number of subjective factors, an analysis of applicable facts and circumstances and the exercise of judgment. As a result, it is possible that the fair value for a security determined in good faith in accordance with the Portfolio’s valuation procedures may differ from valuations for the same security determined by other funds using their own valuation procedures. Although the Portfolio’s valuation procedures are designed to value a security at the price the Portfolio may reasonably expect to receive upon the security’s sale in an orderly transaction, there can be no assurance that any fair value determination thereunder would, in fact, approximate the amount that the Portfolio would actually realize upon the sale of the security or the price at which the security would trade if a reliable market price were readily available. During the six-month period ended June 30, 2017, there were no material changes to the fair value methodologies.
Securities which may be valued in this manner include, but are not limited to: (i) a security for which trading has been halted or suspended; (ii) a debt security that has recently gone into default and for which there is not a current market quotation; (iii) a security of an issuer that has entered into a restructuring; (iv) a security that has been de-listed
from a national exchange; (v) a security for which the market price is not readily available from a third party pricing source or, if so provided, does not, in the opinion of the Manager or Subadvisor, reflect the security’s market value; (vi) a security subject to trading collars for which no or limited trading takes place; and (vii) a security whose principal market has been temporarily closed at a time when, under normal conditions, it would be open. Securities for which market quotations or observable inputs are not readily available are generally categorized as Level 3 in the hierarchy. As of June 30, 2017, there were no securities held by the Portfolio that were fair valued in such a manner.
Futures contracts are valued at the last posted settlement price on the market where such futures are primarily traded. These securities are generally categorized as Level 1 in the hierarchy.
Debt securities (other than convertible and municipal bonds) are valued at the evaluated bid prices (evaluated mean prices in the case of convertible and municipal bonds) supplied by a pricing agent or brokers selected by the Manager, in consultation with the Subadvisor. Those values reflect broker/dealer supplied prices and electronic data processing techniques, if the evaluated bid or mean prices are deemed by the Manager, in consultation with the Subadvisor, to be representative of market values at the regular close of trading of the Exchange on each valuation date. Debt securities purchased on a delayed delivery basis are marked to market daily until settlement at the forward settlement date. Debt securities, including corporate bonds, U.S. government & federal agency bonds, municipal bonds, foreign bonds, convertible bonds, asset-backed securities and mortgage-backed securities are generally categorized as Level 2 in the hierarchy.
Temporary cash investments acquired in excess of 60 days to maturity at the time of purchase are valued using the latest bid prices or using valuations based on a matrix system (which considers such factors as security prices, yields, maturities, and ratings), both as furnished by independent pricing services. Other temporary cash investments which mature in 60 days or less at the time of purchase (“Short-Term Investments”) are valued using the amortized cost method of valuation, unless the use of such method would be inappropriate. The amortized cost method involves valuing a security at its cost on the date of purchase and thereafter assuming a constant amortization to maturity of the difference between such cost and the value on maturity date. Amortized cost approximates the current fair value of a security. Securities valued using the amortized cost method are not valued using quoted prices in an active market and are generally categorized as Level 2 in the hierarchy.
The information above is not intended to reflect an exhaustive list of the methodologies that may be used to value portfolio investments. The valuation procedures permit the use of a variety of valuation methodologies in connection with valuing portfolio investments. The methodology used for a specific type of investment may vary based on the market data available or other considerations. The methodologies summarized above may not represent the specific means by which portfolio investments are valued on any particular business day.
(B) Income Taxes. The Portfolio’s policy is to comply with the requirements of the Internal Revenue Code of 1986, as amended (the “Internal Revenue Code”), applicable to regulated investment companies and to distribute all of its taxable income to the shareholders of the Portfolio within the allowable time limits. Therefore, no federal, state and local income tax provisions are required.
| | |
| 26 | | MainStay VP Bond Portfolio |
Management evaluates the Portfolio’s tax positions to determine if the tax positions taken meet the minimum recognition threshold in connection with accounting for uncertainties in income tax positions taken or expected to be taken for the purposes of measuring and recognizing tax liabilities in the financial statements. Recognition of tax benefits of an uncertain tax position is permitted only to the extent the position is “more likely than not” to be sustained assuming examination by taxing authorities. Management has analyzed the Portfolio’s tax positions taken on federal, state and local income tax returns for all open tax years (for up to three tax years), and has concluded that no provisions for federal, state and local income tax are required in the Portfolio’s financial statements. The Portfolio’s federal, state and local income and federal excise tax returns for tax years for which the applicable statutes of limitations have not expired are subject to examination by the Internal Revenue Service and state and local departments of revenue.
(C) Dividends and Distributions to Shareholders. Dividends and distributions are recorded on the ex-dividend date. The Portfolio intends to declare and pay dividends from net investment income and distributions from net realized capital and currency gains, if any, at least annually. Unless the shareholder elects otherwise, all dividends and distributions are reinvested in the same class of shares of the Portfolio, at NAV. Dividends and distributions to shareholders are determined in accordance with federal income tax regulations and may differ from GAAP.
(D) Security Transactions and Investment Income. The Portfolio records security transactions on the trade date. Realized gains and losses on security transactions are determined using the identified cost method. Dividend income is recognized on the ex-dividend date; net of any foreign tax withheld at the source, and interest income is accrued as earned using the effective interest rate method. Discounts and premiums on securities purchased, other than Short-Term Investments, for the Portfolio are accreted and amortized, respectively, on the effective interest rate method over the life of the respective securities. Discounts and premiums on Short-Term Investments are accreted and amortized, respectively, on the straight-line method. The straight-line method approximates the effective interest method for Short-Term Investments.
Investment income and realized and unrealized gains and losses on investments of the Portfolio are allocated pro rata to the separate classes of shares based upon their relative net assets on the date the income is earned or realized and unrealized gains and losses are incurred.
The Portfolio may place a debt security on non-accrual status and reduce related interest income by ceasing current accruals and writing off all or a portion of any interest receivables when the collection of all or a portion of such interest has become doubtful. A debt security is removed from non-accrual status when the issuer resumes interest payments or when collectability of interest is reasonably assured.
(E) Expenses. Expenses of the Fund are allocated to the individual Portfolios in proportion to the net assets of the respective Portfolios when the expenses are incurred, except where direct allocations of expenses can be made. Expenses (other than fees incurred under the distribution and service plans, further discussed in Note 3(B), which are charged directly to the Service Class shares) are allocated to separate
classes of shares pro rata based upon their relative net assets on the date the expenses are incurred. The expenses borne by the Portfolio, including those of related parties to the Portfolio, are shown in the Statement of Operations.
(F) Use of Estimates. In preparing financial statements in conformity with GAAP, management makes estimates and assumptions that affect the reported amounts and disclosures in the financial statements. Actual results could differ from those estimates.
(G) Repurchase Agreements. The Portfolio may enter into repurchase agreements (i.e., buy a security from another party with the agreement that it be sold back in the future) to earn income. The Portfolio may enter into repurchase agreements only with counterparties, usually financial institutions, that are deemed by the Manager or Subadvisor to be creditworthy, pursuant to guidelines established by the Board. During the term of any repurchase agreement, the Manager or Subadvisor will continue to monitor the creditworthiness of the counterparty. Under the 1940 Act, repurchase agreements are considered to be collateralized loans by the Portfolio to the counterparty secured by the securities transferred to the Portfolio.
Repurchase agreements are subject to counterparty risk, meaning the Portfolio could lose money by the counterparty’s failure to perform under the terms of the agreement. The Portfolio mitigates this risk by ensuring the repurchase agreement is collateralized by cash, U.S. government securities, fixed income securities and/or other securities. The collateral is held by the Portfolio’s custodian valued daily on a mark to market basis to determine if the value, including accrued interest, exceeds the repurchase price. In the event of the counterparty’s default on the obligation to repurchase, the Portfolio has the right to liquidate the collateral and apply the proceeds in satisfaction of the obligation. Under certain circumstances, such as in the event of default or bankruptcy by the counterparty, realization and/or retention of the collateral may be limited or subject to delay, to legal proceedings and possible realized loss to the Portfolio.
(H) Securities Sold Short. The Portfolio may engage in sales of securities it does not own (“short sales”) as part of its investment strategies. When the Portfolio enters into a short sale, it must segregate or maintain with a broker the cash proceeds from the security sold short or other securities as collateral for its obligation to deliver the security upon conclusion of the sale. During the period a short position is open, depending on the nature and type of security, a short position is reflected as a liability and is marked to market in accordance with the valuation methodologies previously detailed (See Note 2(B)). Liabilities for securities sold short are closed out by purchasing the applicable securities for delivery to the counterparty broker. A gain, limited to the price at which the Portfolio sold the security short, or a loss, unlimited as to dollar amount, will be recognized upon termination of a short sale if the market price on the date the short position is closed out is less or greater, respectively, than the proceeds originally received. Any such gain or loss may be offset, completely or in part, by the change in the value of the hedged investments. Short sales involve risk of loss in excess of the related amounts reflected in the Statement of Assets and Liabilities.
(I) Futures Contracts. A futures contract is an agreement to purchase or sell a specified quantity of an underlying instrument at a specified future date and price, or to make or receive a cash payment based
Notes to Financial Statements (Unaudited) (continued)
on the value of a financial instrument (e.g., foreign currency, interest rate, security, or securities index). The Portfolio is subject to risks such as market price risk and/or interest rate risk in the normal course of investing in these transactions. Upon entering into a futures contract, the Portfolio is required to pledge to the broker or futures commission merchant an amount of cash and/or U.S. Government securities equal to a certain percentage of the collateral amount, known as the “initial margin.” During the period the futures contract is open, changes in the value of the contract are recognized as unrealized appreciation or depreciation by marking to market such contract on a daily basis to reflect the market value of the contract at the end of each day’s trading. The Portfolio agrees to receive from or pay to the broker or futures commission merchant an amount of cash equal to the daily fluctuation in the value of the contract. Such receipts or payments are known as “variation margin.” When the futures contract is closed, the Portfolio records a realized gain or loss equal to the difference between the proceeds from (or cost of) the closing transaction and the Portfolio’s basis in the contract.
The use of futures contracts involves, to varying degrees, elements of market risk in excess of the amount recognized in the Statement of Assets and Liabilities. The contract or notional amounts and variation margin reflect the extent of the Portfolio’s involvement in open futures positions. There are several risks associated with the use of futures contracts as hedging techniques. There can be no assurance that a liquid market will exist at the time when the Portfolio seeks to close out a futures contract. If no liquid market exists, the Portfolio would remain obligated to meet margin requirements until the position is closed. Futures may involve a small initial investment relative to the risk assumed, which could result in losses greater than if they had not been used. Futures may be more volatile than direct investments in the instrument underlying the futures, and may not correlate to the underlying instrument, causing a given hedge not to achieve its objectives. The Portfolio’s activities in futures contracts have minimal counterparty risk as they are conducted through regulated exchanges that guarantee the futures against default by the counterparty. In the event of a bankruptcy or insolvency of a futures commission merchant that holds margin on behalf of the Portfolio, the Portfolio may not be entitled to the return of the entire margin owed to the Portfolio, potentially resulting in a loss. The Portfolio’s investment in futures contracts and other derivatives may increase the volatility of the Portfolio’s NAV and may result in a loss to the Portfolio. As of June 30, 2017, all open futures contracts are shown in the Portfolio of Investments.
(J) Dollar Rolls. The Portfolio may enter into dollar roll transactions in which it sells mortgage-backed securities (“MBS”) from its portfolio to a counterparty from whom it simultaneously agrees to buy a similar security on a delayed delivery basis. The Portfolio generally transfers MBS where the MBS are “to be announced,” therefore, the Portfolio accounts for these transactions as purchases and sales.
The securities sold in connection with the dollar rolls are removed from the portfolio and a realized gain or loss is recognized. The securities the Portfolio has agreed to acquire are included at market value in the Portfolio of Investments and liabilities for such purchase commitments are included as payables for investments purchased. During the roll period, the Portfolio foregoes principal and interest paid on the securities. The Portfolio is compensated by the difference between the current sales price and the forward price for the future as well as by the earnings on the cash proceeds of the initial sale. Dollar rolls may be renewed without physical delivery of the securities subject to the contract. The Portfolio maintains liquid assets from
its portfolio having a value not less than the repurchase price, including accrued interest. Dollar roll transactions involve certain risks, including the risk that the securities returned to the Portfolio at the end of the roll period, while substantially similar, could be inferior to what was initially sold to the counterparty.
The Portfolio accounts for a dollar roll transaction as a purchase and sale whereby the difference in the sales price and purchase price of the security sold is recorded as a realized gain (loss).
(K) Securities Lending. In order to realize additional income, the Portfolio may engage in securities lending, subject to the limitations set forth in the 1940 Act and relevant guidance by the staff of the Securities and Exchange Commission (“SEC”). In the event the Portfolio does engage in securities lending, the Portfolio will lend through its custodian, State Street Bank and Trust Company (“State Street”). State Street will manage the Portfolio’s collateral in accordance with the lending agreement between the Portfolio and State Street, and indemnify the Portfolio against counterparty risk. The loans will be collateralized by U.S. Treasury securities at least equal at all times to the market value of the securities loaned. The Portfolio may bear the risk of delay in recovery of, or loss of rights in, the securities loaned should the borrower of the securities experience financial difficulty. The Portfolio may also record a realized gain or loss on securities deemed sold due to a borrower’s inability to return securities on loan. The Portfolio bears the risk of any loss on investment of the collateral. The Portfolio will receive compensation for lending its securities in the form of fees or it will retain a portion of interest on the investment of any cash received as collateral. The Portfolio will also continue to receive interest and dividends on the securities loaned and any gain or loss in the market price of the securities loaned that may occur during the term of the loan will be for the account of the Portfolio. During the six-month period ended June 30, 2017, the Portfolio did not have any portfolio securities on loan.
(L) Securities Risk. Investments in the Portfolio are not guaranteed, even though some of the Portfolio’s underlying investments are guaranteed by the U.S. government or its agencies or instrumentalities. The principal risk of mortgage-related and asset-backed securities is that the underlying debt may be prepaid ahead of schedule, if interest rates fall, thereby reducing the value of the Portfolio’s investment. If interest rates rise, less of the debt may be prepaid and the Portfolio may lose money. The Portfolio is subject to interest-rate risk and its holdings in bonds can lose principal value when interest rates rise. Bonds are also subject to credit risk, in which the bond issuer may fail to pay interest and principal in a timely manner.
The Portfolio may invest in foreign debt securities, which carry certain risks that are in addition to the usual risks inherent in domestic debt securities. These risks include those resulting from currency fluctuations, future adverse political or economic developments and possible imposition of currency exchange blockages or other foreign governmental laws or restrictions. These risks are likely to be greater in emerging markets than in developed markets. The ability of issuers of debt securities held by the Portfolio to meet their obligations may be affected by economic or political developments in a specific country, industry or region.
(M) Indemnifications. Under the Fund’s organizational documents, its officers and trustees are indemnified against certain liabilities that may arise out of performance of their duties to the Fund. Additionally, in the normal course of business, the Portfolio enters into contracts with
| | |
| 28 | | MainStay VP Bond Portfolio |
third-party service providers that contain a variety of representations and warranties and which may provide general indemnifications. The Portfolio’s maximum exposure under these arrangements is unknown, as this would involve future claims that may be made against the Portfolio that have not yet occurred. Based on experience, management is of the view that the risk of loss in connection with these potential indemnification obligations is remote. However, there can be no assurance that material liabilities related to such obligations will not arise in the future, which could adversely impact the Portfolio.
(N) Quantitative Disclosure of Derivative Holdings. The following tables show additional disclosures related to the Portfolio’s derivative and hedging activities, including how such activities are accounted for and their effect on the Portfolio’s financial positions, performance and cash flows. The Portfolio entered into futures contracts in order to provide an efficient means of maintaining liquidity while remaining fully invested in the market. These derivatives are not accounted for as hedging instruments.
Fair value of derivative instruments as of June 30, 2017:
Asset Derivatives
| | | | | | | | | | |
| | | Statement of
Assets and
Liabilities | | Interest
Rate
Contracts
Risk | | | Total | |
Futures Contracts | | Net Assets—Net unrealized appreciation (depreciation) on investments and futures contracts (a) | | $ | 472,481 | | | $ | 472,481 | |
| | | | | | | | | | |
Total Fair Value | | | | $ | 472,481 | | | $ | 472,481 | |
| | | | | | | | | | |
Liability Derivatives
| | | | | | | | | | |
| | | Statement of
Assets and
Liabilities | | Interest
Rate
Contracts
Risk | | | Total | |
Futures Contracts | | Net Assets—Net unrealized appreciation (depreciation) on investments and futures contracts (a) | | $ | (156,032 | ) | | $ | (156,032 | ) |
| | | | | | | | | | |
Total Fair Value | | | | $ | (156,032 | ) | | $ | (156,032 | ) |
| | | | | | | | | | |
| (a) | Includes cumulative appreciation (depreciation) of futures contracts as reported in the Portfolio of Investments. Only current day’s variation margin is reported within the Statement of Assets and Liabilities. |
The effect of derivative instruments on the Statement of Operations for the six-month period ended June 30, 2017:
Realized Gain (Loss)
| | | | | | | | | | |
| | | Statement of
Operations
Location | | Interest
Rate
Contracts
Risk | | | Total | |
Futures Contracts | | Net realized gain (loss) on futures transactions | | $ | 711,523 | | | $ | 711,523 | |
| | | | | | | | | | |
Total Realized Gain (Loss) | | | | $ | 711,523 | | | $ | 711,523 | |
| | | | | | | | | | |
Change in Unrealized Appreciation (Depreciation)
| | | | | | | | | | |
| | | Statement of
Operations
Location | | Interest
Rate
Contracts
Risk | | | Total | |
Futures Contracts | | Net change in unrealized appreciation (depreciation) on futures transactions | | $ | 748,610 | | | $ | 748,610 | |
| | | | | | | | | | |
Total Change in Unrealized Appreciation (Depreciation) | | | | $ | 748,610 | | | $ | 748,610 | |
| | | | | | | | | | |
Average Notional Amount
| | | | | | | | |
| | | Interest Rate
Contracts
Risk | | | Total | |
Futures Contracts Long | | $ | 107,721,503 | | | $ | 107,721,503 | |
Futures Contracts Short | | $ | (22,119,740 | ) | | $ | (22,119,740 | ) |
| | | | |
Note 3–Fees and Related Party Transactions
(A) Manager and Subadvisor. New York Life Investments, a registered investment adviser and an indirect, wholly-owned subsidiary of New York Life, serves as the Portfolio’s Manager pursuant to an Amended and Restated Management Agreement (“Management Agreement”). The Manager provides offices, conducts clerical, recordkeeping and bookkeeping services, and keeps most of the financial and accounting records required to be maintained by the Portfolio. Except for the portion of salaries and expenses that are the responsibility of the Portfolio, the Manager pays the salaries and expenses of all personnel affiliated with the Portfolio and certain operational expenses of the Portfolio. The Portfolio reimburses New York Life Investments in an amount equal to a portion of the compensation of the Chief Compliance Officer attributable to the Portfolio. Pursuant to the terms of a Subadvisory Agreement with New York Life Investments, NYL Investors LLC (“NYL Investors”), a registered investment adviser and a direct, wholly-owned subsidiary of New York Life, serves as Subadvisor to the Portfolio. New York Life Investments pays for the services of the Subadvisor.
Notes to Financial Statements (Unaudited) (continued)
The Fund, on behalf of the Portfolio, pays New York Life Investments in its capacity as the Portfolio’s investment manager and administrator, pursuant to the Management Agreement, a monthly fee for services performed and facilities furnished at an annual percentage of the Portfolio’s average daily net assets as follows: 0.50% up to $500 million; 0.475% from $500 million to $1 billion; 0.45% from $1 billion to $3 billion; and 0.44% in excess of $3 billion. During the six-month period ended June 30, 2017, the effective management fee rate was 0.49%.
During the six-month period ended June 30, 2017, New York Life Investments earned fees from the Portfolio in the amount of $2,067,460.
State Street provides sub-administration and sub-accounting services to the Portfolio pursuant to an agreement with New York Life Investments. These services include calculating the daily NAVs of the Portfolio, maintaining the general ledger and sub-ledger accounts for the calculation of the Portfolio’s NAVs, and assisting New York Life Investments in conducting various aspects of the Portfolio’s administrative operations. For providing these services to the Portfolio, State Street is compensated by New York Life Investments.
(B) Distribution and Service Fees. The Fund, on behalf of the Portfolio, has entered into a distribution agreement with NYLIFE Distributors LLC (the “Distributor”), an indirect, wholly-owned subsidiary of New York Life. The Portfolio has adopted a distribution plan (the “Plan”) in accordance with the provisions of Rule 12b-1 under the 1940 Act. Under the Plan, the Distributor has agreed to provide, through its affiliates or independent third parties, various distribution-related, shareholder and administrative support services to the Service Class shareholders. For its services, the Distributor is entitled to a combined distribution and service fee accrued daily and paid monthly at an annual rate of 0.25% of the average daily net assets attributable to the Service Class shares of the Portfolio.
Note 4–Federal Income Tax
During the year ended December 31, 2016, the tax character of distributions paid as reflected in the Statement of Changes in Net Assets was as follows:
| | |
| 2016 |
Tax-Based
Distributions
from Ordinary
Income | | Tax-Based
Distributions
from Long-Term
Gains |
| $26,377,424 | | $2,177,235 |
Note 5–Custodian
State Street is the custodian of cash and securities held by the Portfolio. Custodial fees are charged to the Portfolio based on the Portfolio’s net assets and/or the market value of securities held by the Portfolio and the number of certain transactions incurred by the Portfolio.
Note 6–Line of Credit
The Portfolio and certain other funds managed by New York Life Investments, maintain a line of credit with a syndicate of banks in order to
secure a source of funds for temporary purposes to meet unanticipated or excessive redemption requests.
Effective August 1, 2017, under the credit agreement (the “Credit Agreement”), the aggregate commitment amount is $600,000,000 with an additional uncommitted amount of $100,000,000. The commitment fee is an annual rate of 0.15% of the average commitment amount payable quarterly, regardless of usage, to State Street, who serves as the agent to the syndicate. The commitment fee is allocated among the Portfolio and other funds managed by New York Life Investments based upon their respective net assets and other factors. Interest on any revolving credit loan is charged based upon the Federal Funds Rate or the one month London InterBank Offered Rate, whichever is higher. The Credit Agreement expires on July 31, 2018, although the Portfolio, certain other funds managed by New York Life Investments and the syndicate of banks may renew the Credit Agreement for an additional year on the same or different terms. Prior to August 1, 2017, the aggregate commitment amount was $600,000,000 with an additional uncommitted amount of $100,000,000, and the commitment fee under a credit agreement for which Bank of New York Mellon served as agent was at an annual rate of 0.15% of the average commitment amount. During the six-month period ended June 30, 2017, there were no borrowings made or outstanding with respect to the Portfolio under the credit agreement for which Bank of New York Mellon served as agent.
Note 7–Interfund Lending Program
Pursuant to an exemptive order issued by the SEC, the Portfolio, along with certain other funds managed by New York Life Investments, may participate in an interfund lending program. The interfund lending program provides an alternative credit facility that permits the Portfolio and certain other funds managed by New York Life Investments to lend or borrow money for temporary purposes directly to or from one another subject to the conditions of the exemptive order. During the six-month period ended June 30, 2017, there were no interfund loans made or outstanding with respect to the Portfolio.
Note 8–Purchases and Sales of Securities (in 000’s)
During the six-month period ended June 30, 2017, purchases and sales of U.S. government securities were $756,563 and $811,185, respectively. Purchases and sales of securities, other than U.S. government securities and short-term securities, were $183,005 and $208,390, respectively.
| | |
| 30 | | MainStay VP Bond Portfolio |
Note 9–Capital Share Transactions
Transactions in capital shares for the six-month period ended June 30, 2017, and the year ended December 31, 2016, were as follows:
| | | | | | | | |
Initial Class | | Shares | | | Amount | |
Six-month period ended June 30, 2017: | | | | | | | | |
Shares sold | | | 2,591,611 | | | $ | 37,524,068 | |
Shares redeemed | | | (8,217,620 | ) | | | (118,563,157 | ) |
| | | | |
Net increase (decrease) | | | (5,626,009 | ) | | $ | (81,039,089 | ) |
| | | | |
Year ended December 31, 2016: | | | | | | | | |
Shares sold | | | 4,778,721 | | | $ | 70,239,158 | |
Shares issued to shareholders in reinvestment of dividends and distributions | | | 1,243,124 | | | | 18,173,699 | |
Shares redeemed | | | (18,055,013 | ) | | | (260,554,445 | ) |
| | | | |
Net increase (decrease) | | | (12,033,168 | ) | | $ | (172,141,588 | ) |
| | | | |
|
| |
Service Class | | Shares | | | Amount | |
Six-month period ended June 30, 2017: | | | | | | | | |
Shares sold | | | 1,278,551 | | | $ | 18,226,544 | |
Shares redeemed | | | (2,432,073 | ) | | | (34,688,307 | ) |
| | | | |
Net increase (decrease) | | | (1,153,522 | ) | | $ | (16,461,763 | ) |
| | | | |
Year ended December 31, 2016: | | | | | | | | |
Shares sold | | | 4,678,373 | | | $ | 68,148,920 | |
Shares issued to shareholders in reinvestment of dividends and distributions | | | 716,600 | | | | 10,380,960 | |
Shares redeemed | | | (4,623,259 | ) | | | (66,515,751 | ) |
| | | | |
Net increase (decrease) | | | 771,714 | | | $ | 12,014,129 | |
| | | | |
Note 10–Recent Accounting Pronouncement
In October 2016, the SEC adopted new rules and amended existing rules (together, “final rules”) intended to modernize the reporting and disclosure of information by registered investment companies. In part, the final rules amend Regulation S-X and require standardized, enhanced disclosure about derivatives in investment company financial statements, as well as other amendments. The compliance date for the amendments to Regulation S-X is August 1, 2017 and applies to shareholder reports for funds with fiscal periods ending after August 1, 2017. Management is currently evaluating the impact that the adoption of the amendments to Regulation S-X will have on the Portfolio’s financial statements and related disclosures.
Note 11–Subsequent Events
In connection with the preparation of the financial statements of the Portfolio as of and for the six-month period ended June 30, 2017, events and transactions subsequent to June 30, 2017, through the date the financial statements were issued have been evaluated by the Portfolio’s management for possible adjustment and/or disclosure. No subsequent events requiring financial statement adjustment or disclosure have been identified.
Proxy Voting Policies and Procedures and Proxy Voting Record
A description of the policies and procedures that New York Life Investments uses to vote proxies related to the Portfolio’s securities is available without charge, upon request, (i) by calling 800-598-2019 or (ii) by visiting the SEC’s website at www.sec.gov.
The Portfolio is required to file with the SEC its proxy voting record for the 12-month period ending June 30 on Form N-PX. The Portfolio’s most recent Form N-PX or proxy voting record is available free of charge upon request (i) by calling 800-598-2019 or; (ii) by visiting the SEC’s website at www.sec.gov.
Shareholder Reports and Quarterly Portfolio Disclosure
The Portfolio is required to file its complete schedule of portfolio holdings with the SEC for its first and third fiscal quarters on Form N-Q. The Portfolio’s Form N-Q is available without charge on the SEC’s website at www.sec.gov or by calling MainStay Investments at 800-598-2019. You also can obtain and review copies of Form N-Q by visiting the SEC’s Public Reference Room in Washington, DC (information on the operation of the Public Reference Room may be obtained by calling 1-800-SEC-0330).
| | |
| 32 | | MainStay VP Bond Portfolio |
This page intentionally left blank
This page intentionally left blank
MainStay VP Portfolios
MainStay VP offers a wide range of Portfolios. The full array of MainStay VP offerings is listed here, with information about the manager, subadvisors, legal counsel, and independent registered public accounting firm.
Equity Portfolios
MainStay VP Common Stock Portfolio
MainStay VP Cornerstone Growth Portfolio
MainStay VP Eagle Small Cap Growth Portfolio
MainStay VP Emerging Markets Equity Portfolio
MainStay VP Epoch U.S. Equity Yield Portfolio
MainStay VP Epoch U.S. Small Cap Portfolio
MainStay VP International Equity Portfolio
MainStay VP Large Cap Growth Portfolio
MainStay VP MFS® Utilities Portfolio
MainStay VP Mid Cap Core Portfolio
MainStay VP S&P 500 Index Portfolio
MainStay VP Small Cap Core Portfolio
MainStay VP T. Rowe Price Equity Income Portfolio
MainStay VP VanEck Global Hard Assets Portfolio
Mixed Asset Portfolios
MainStay VP Balanced Portfolio
MainStay VP Convertible Portfolio
MainStay VP Cushing Renaissance Advantage Portfolio
MainStay VP Income Builder Portfolio
MainStay VP Janus Henderson Balanced Portfolio
Income Portfolios
MainStay VP Bond Portfolio
MainStay VP Floating Rate Portfolio
MainStay VP Government Portfolio
MainStay VP High Yield Corporate Bond Portfolio
MainStay VP Indexed Bond Portfolio
MainStay VP PIMCO Real Return Portfolio
MainStay VP Unconstrained Bond Portfolio
Money Market
MainStay VP U.S. Government Money Market Portfolio
Alternative
MainStay VP Absolute Return Multi-Strategy Portfolio
Asset Allocation Portfolios
MainStay VP Conservative Allocation Portfolio
MainStay VP Growth Allocation Portfolio
MainStay VP Moderate Allocation Portfolio
MainStay VP Moderate Growth Allocation Portfolio
Manager
New York Life Investment Management LLC
New York, New York
Subadvisors
Candriam Belgium*
Brussels, Belgium
Candriam France S.A.S.*
Paris, France
Cornerstone Capital Management Holdings LLC*
New York, New York
Cushing Asset Management, LP
Dallas, Texas
Eagle Asset Management, Inc.
St Petersburg, Florida
Epoch Investment Partners, Inc.
New York, New York
Janus Capital Management LLC
Denver, Colorado
MacKay Shields LLC*
New York, New York
Massachusetts Financial Services Company
Boston, Massachusetts
NYL Investors LLC*
New York, New York
Pacific Investment Management Company LLC
Newport Beach, California
T. Rowe Price Associates, Inc.
Baltimore, Maryland
Van Eck Associates Corporation
New York, New York
Winslow Capital Management, LLC
Minneapolis, Minnesota
Distributor
NYLIFE Distributors LLC*
Jersey City, New Jersey
Custodian
State Street Bank and Trust Company
Boston, Massachusetts
Independent Registered Public Accounting Firm
PricewaterhouseCoopers LLP
New York, New York
Legal Counsel
Dechert LLP
Washington, District of Columbia
Some Portfolios may not be available in all products.
* An affiliate of New York Life Investment Management LLC
Not part of the Semiannual Report
2017 Semiannual Report
This report is for the general information of New York Life Variable Annuities and NYLIAC Variable Universal Life Insurance Products policyowners. It must be preceded or accompanied by the appropriate product(s) and funds prospectuses if it is given to anyone who is not an owner of a New York Life variable annuity policy or a NYLIAC Variable Universal Life Insurance Product. This report does not offer for sale or solicit orders to purchase securities.
The performance data quoted in this report represents past performance. Past performance is no guarantee of future results. Due to market volatility and other factors, current performance may be lower or higher than the figures shown. The most recent month-end performance summary for your variable annuity or variable life policy is available by calling 800-598-2019 and is updated periodically on www.newyorklife.com.
The New York Life Variable Annuities and NYLIAC Variable Universal Life Insurance Products are issued by New York Life Insurance and Annuity Corporation (a Delaware Corporation) and distributed by NYLIFE Distributors LLC (Member FINRA/SIPC).
New York Life Insurance Company
New York Life Insurance and Annuity Corporation (NYLIAC) (A Delaware Corporation)
51 Madison Avenue, Room 551
New York, NY 10010
www.newyorklife.com
Printed on recycled paper
mainstayinvestments.com
NYLIFE Distributors LLC, 30 Hudson Street, Jersey City, NJ 07302
New York Life Investment Management LLC is the investment manager to the MainStay VP Funds Trust
©2017 by NYLIFE Distributors LLC. All rights reserved.
You may obtain copies of the Prospectus and the Statement of Additional Information free of charge, upon request, by calling toll-free 800-598-2019 or writing to New York Life Insurance and Annuity Corporation, 51 Madison Avenue, New York, NY 10010.
| | | | |
| Not FDIC Insured | | No Bank Guarantee | | May Lose Value |
| | | | |
| 1744030 | | | | MSVPB10-08/17 (NYLIAC) NI509 |
MainStay VP Government Portfolio
Message from the President and Semiannual Report
Unaudited | June 30, 2017

Sign up for electronic delivery of your shareholder reports. For full details on electronic delivery, including who can participate and what you
can receive via eDelivery, please log on to www.newyorklife.com/vsc

This page intentionally left blank
Message from the President
The six months ended June 30, 2017, brought positive results to many stock and bond investors. The year began with many investors hoping that Republican control of the White House, the Senate and the House of Representatives could bring an end to political gridlock; and while debate has continued on a number of issues, the U.S. stock market climbed relatively steadily throughout the first half of 2017.
According to FTSE-Russell U.S. market data, stocks at all capitalization levels tended to record positive total returns during the reporting period, with large-cap stocks generally outperforming stocks of smaller-capitalization companies. Growth stocks outpaced value stocks at every capitalization level by substantial margins—from more than six percentage points for micro-caps and mid-caps to more than 10 percentage points for the largest 200 U.S. companies by market capitalization.
Most sectors of the stock market advanced during the reporting period, with energy and telecommunication services being notable exceptions. Energy stocks declined as oil prices fell despite moves by the Organization of Petroleum Exporting Countries (OPEC) intended to limit oil production by its members. Telecommunication services stocks tended to decline as competition increased and rising interest rates made dividend payouts less appealing.
In March and June of 2017, the Federal Reserve announced successive increases in the target range for the federal funds rate, ultimately bringing the federal funds target range to 1.00% to 1.25%. While short-term U.S. Treasury yields rose in response, yields for U.S. Treasury securities with maturities of five years or longer declined. As the difference between short- and long-term yields narrowed, the advantages of higher-yielding long-term bonds became increasingly apparent.
Virtually all taxable and tax-exempt bond sectors provided positive total returns during the reporting period. Mortgage-backed
securities, though providing positive total returns, faced headwinds when the Federal Reserve announced plans to begin normalizing its balance sheet by reducing reinvestment of principal payments on mortgage-backed securities.
International stock and bond markets were also strong during the reporting period. International stocks provided double-digit total returns that were surpassed by emerging-market stocks as a whole. Global investment-grade bonds provided single-digit returns; and emerging-market debt was somewhat stronger.
Even during periods of favorable market performance and generally positive returns, MainStay believes that it is important to carefully monitor your investments. Your risk tolerance may
change over time, leading you to reevaluate which MainStay VP Portfolios are most appropriate for your long-term goals. Your goals themselves may also change, leading you to pursue investments with more or less risk. The portfolio managers of MainStay VP Portfolios seek to provide results consistent with the investment objectives of their respective Portfolios, to give you a wide range of choices suitable to various investment needs.
The report that follows provides more detailed information about the specific markets, securities and investment decisions that influenced your MainStay VP Portfolio during the six months ended June 30, 2017. We invite you to review the report carefully as part of your ongoing investment evaluation and review.
Sincerely,

Stephen P. Fisher
President
The opinions expressed are as of the date of the accompanying report and are subject to change. Past performance is no guarantee of future results. There is no guarantee that any forecasts made will come to pass. This material does not constitute investment advice and is not intended as an endorsement of any specific investment.
Not all MainStay VP Portfolios and/or share classes are available under all policies.
Not part of the Semiannual Report
Table of Contents
Investors should refer to the Portfolio’s Summary Prospectus and/or Prospectus and consider the Portfolio’s investment objectives, strategies, risks, charges and expenses carefully before investing. The Summary Prospectus and/or Prospectus contain this and other information about the Portfolio. You may obtain copies of the Portfolio’s Summary Prospectus and/or the Prospectus and the Statement of Additional Information free of charge, upon request, by calling toll-free 800-598-2019, by writing to New York Life Insurance and Annuity Corporation, 51 Madison Avenue, Room 251, New York, New York 10010 or by sending an email to MainStayShareholdersServices@nylim.com. These documents are also available at mainstayinvestments.com/vpdocuments. Please read the Summary Prospectus and/or Prospectus carefully before investing. MainStay VP Funds Trust portfolios are separate account options which are purchased through a variable insurance or variable annuity contract.
Investment and Performance Comparison (Unaudited)
Performance data quoted represents past performance. Past performance is no guarantee of future results. Because of market volatility and other factors, current performance may be lower or higher than the figures shown. Investment return and principal value will fluctuate, and as a result, when shares are redeemed, they may be worth more or less than their original cost. The performance table and graph do not reflect any deduction of sales charges, mortality and expense charges, contract charges or administrative charges. Please refer to the Performance Summary appropriate for your policy. For performance information current to the most recent month-end, please call 800-598-2019 or visit www.newyorklife.com.
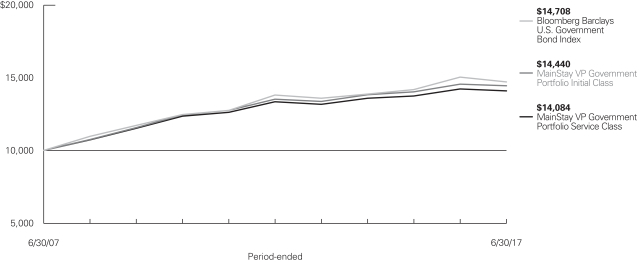
Average Annual Total Returns for the Period Ended June 30, 2017
| | | | | | | | | | | | | | | | | | | | | | |
| Class | | Inception
Date | | Six Months | | | One Year | | | Five Years | | | Ten Years | | | Gross
Expense
Ratio1 | |
| Initial Class Shares | | 1/29/1993 | | | 1.49 | % | | | –0.71 | % | | | 1.35 | % | | | 3.74 | % | | | 0.56 | % |
| Service Class Shares | | 6/4/2003 | | | 1.36 | | | | –0.96 | | | | 1.10 | | | | 3.48 | | | | 0.81 | |
| | | | | | | | | | | | | | | | |
| Benchmark Performance | | Six
Months | | | One
Year | | | Five
Years | | | Ten
Years | |
Bloomberg Barclays U.S. Government Bond Index2 | | | 1.86 | % | | | –2.18 | % | | | 1.30 | % | | | 3.93 | % |
Morningstar Intermediate Government Category Average3 | | | 1.18 | | | | –1.24 | | | | 1.04 | % | | | 3.57 | |
| 1. | The gross expense ratios presented reflect the Portfolio’s “Total Annual Portfolio Operating Expenses” from the most recent Prospectus and may differ from other expense ratios disclosed in this report. |
| 2. | The Bloomberg Barclays U.S. Government Bond Index is the Portfolio’s primary broad-based securities market index for comparison purposes. The Bloomberg Barclays U.S. Government Bond Index consists of publicly issued debt of the U.S. Treasury and government agencies. Results assume the reinvestment of all income and capital gains. An investment cannot be made directly in an index. |
| 3. | The Morningstar Intermediate Government Category Average is representative of funds that have at least 90% of their bond holdings in bonds backed by U.S. government or by U.S. government-linked agencies. These funds have durations between 3.5 and 6 years and/or average effective maturities between 4 and 10 years. Results are based on average total returns of similar portfolios with all dividends and capital gain distributions reinvested. |
Cost in Dollars of a $1,000 Investment in MainStay VP Government Portfolio (Unaudited)
The example below is intended to describe the fees and expenses borne by shareholders during the six-month period from January 1, 2017 to June 30, 2017, and the impact of those costs on your investment.
Example
As a shareholder of the Portfolio, you incur two types of costs: (1) transaction costs, including exchange fees and sales charges (loads) on purchases (as applicable), and (2) ongoing costs, including management fees, distribution and/or service (12b-1) fees, and other Portfolio expenses (as applicable). This example is intended to help you understand your ongoing costs (in dollars) of investing in the Portfolio and to compare these costs with the ongoing costs of investing in other mutual funds. The example is based on an investment of $1,000 made at the beginning of the six-month period and held for the entire period from January 1, 2017 to June 30, 2017. Shares are only sold in connection with variable life and annuity contracts and the example does not reflect any contract level or transactional fees or expenses. If these costs had been included, your costs would have been higher.
This example illustrates your Portfolio’s ongoing costs in two ways:
Actual Expenses
The second and third data columns in the table below provide information about actual account values and actual expenses. You may use the information in these columns, together with the amount you invested, to estimate the expenses that you paid during the six months ended June 30, 2017. Simply divide your account value by $1,000
(for example, an $8,600 account value divided by $1,000 = 8.6), then multiply the result by the number under the heading entitled “Expenses Paid During Period” to estimate the expenses you paid on your account during this period.
Hypothetical Example for Comparison Purposes
The fourth and fifth data columns in the table below provide information about hypothetical account values and hypothetical expenses based on the Portfolio’s actual expense ratio and an assumed rate of return of 5% per year before expenses, which is not the Portfolio’s actual return. The hypothetical account values and expenses may not be used to estimate the actual ending account balances or expenses you paid for the six-month period shown. You may use this information to compare the ongoing costs of investing in the Portfolio with the ongoing costs of investing in other mutual funds. To do so, compare this 5% hypothetical example with the 5% hypothetical examples that appear in the shareholder reports of the other mutual funds.
Please note that the expenses shown in the table are meant to highlight your ongoing costs only and do not reflect any transactional costs, such as exchange fees or sales charges (loads). Therefore, the fourth and fifth data columns of the table are useful in comparing ongoing costs only and will not help you determine the relative total costs of owning different funds. In addition, if these transactional costs were included, your costs would have been higher.
| | | | | | | | | | | | | | | | | | | | | | | | |
| | | | | | | | | | | | | | | | | | | |
| Share Class | | Beginning
Account
Value
1/1/17 | | | Ending Account
Value (Based
on Actual
Returns and
Expenses)
6/30/17 | | | Expenses
Paid
During
Period1 | | | Ending Account
Value (Based
on Hypothetical
5% Annualized
Return and
Actual Expenses)
6/30/17 | | | Expenses
Paid
During
Period1 | | | Net Expense
Ratio
During
Period2 | |
| | | | | | |
| Initial Class Shares | | $ | 1,000.00 | | | $ | 1,014.90 | | | $ | 2.80 | | | $ | 1,022.00 | | | $ | 2.81 | | | | 0.56 | % |
| | | | | | |
| Service Class Shares | | $ | 1,000.00 | | | $ | 1,013.60 | | | $ | 4.04 | | | $ | 1,020.80 | | | $ | 4.06 | | | | 0.81 | % |
| 1. | Expenses are equal to the Portfolio’s annualized expense ratio of each class multiplied by the average account value over the period, divided by 365 and multiplied by 181 (to reflect the six-month period). The table above represents the actual expenses incurred during the six-month period. |
| 2. | Expenses are equal to the Portfolio’s annualized expense ratio to reflect the six-month period. |
| | |
| 6 | | MainStay VP Government Portfolio |
Portfolio Composition as of June 30, 2017 (Unaudited)
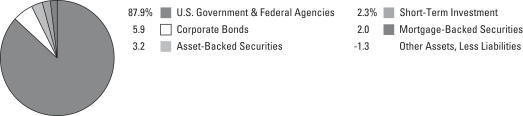
See Portfolio of Investments beginning on page 10 for specific holdings within these categories.
Top Ten Holdings as of June 30, 2017 (excluding short-term investment) (Unaudited)
| 1. | Federal National Mortgage Association (Mortgage Pass-Through Securities), 3.50%, due 11/1/25 |
| 2. | Federal Home Loan Mortgage Corporation (Mortgage Pass-Through Securities), 4.00%, due 3/1/41 |
| 3. | United States Treasury Notes, 2.00%, due 8/31/21 |
| 4. | United States Treasury Notes, 2.375%, due 8/15/24 |
| 5. | Tennessee Valley Authority, 4.65%, due 6/15/35 |
| 6. | Federal Home Loan Mortgage Corporation (Mortgage Pass-Through Securities), 4.00%, due 2/1/41 |
| 7. | Government National Mortgage Association (Mortgage Pass-Through Securities), 4.00%, due 10/15/41 |
| 8. | Federal National Mortgage Association (Mortgage Pass-Through Securities), 4.50%, due 1/1/41 |
| 9. | Government National Mortgage Association (Mortgage Pass-Through Securities), 4.50%, due 5/20/40 |
| 10. | Federal Home Loan Mortgage Corporation (Mortgage Pass-Through Securities), 3.00%, due 4/1/45 |
Portfolio Management Discussion and Analysis (Unaudited)
Answers to the questions reflect the views of portfolio managers Dan Roberts, PhD, Louis Cohen, CFA, and Steven H. Rich of MacKay Shields LLC, the Portfolio’s Subadvisor.
How did MainStay VP Government Portfolio perform relative to its benchmark and peers for the six months ended June 30, 2017?
For the six months ended June 30, 2017, MainStay VP Government Portfolio returned 1.49% for Initial Class shares and 1.36% for Service Class shares. Over the same period, both share classes underperformed the 1.86% return of the Bloomberg Barclays U.S. Government Bond Index,1 which is the Portfolio’s benchmark, but outperformed the 1.18% return of the Morningstar Intermediate Government Category Average.2
What factors affected the Portfolio’s relative performance during the reporting period?
Duration,3 yield-curve4 posture, sector weighting and issue selection are four factors that affected the Portfolio’s relative performance during the reporting period.
The Portfolio’s duration was shorter than the duration of the Bloomberg Barclays U.S. Government Bond Index. Because of its shorter duration, the Portfolio was less sensitive than the benchmark and longer-duration peers to changes in U.S. Treasury yields. The Portfolio’s short-duration posture detracted from the Portfolio’s relative performance, as yields fell for maturities longer than 3 years.
During the reporting period, the spread5 between the 2- and 30-year benchmark yields on the U.S. Treasury curve narrowed. The flatter yield curve benefited the benchmark and peer portfolios that were more concentrated in longer-duration securities.
Agency mortgage pass-through securities were the largest class of securities in the Portfolio. Our commitment to agency mortgage pass-throughs imparted a yield advantage over lower-yielding U.S. Treasury securities and agency debentures. This benefit, however, was offset by the underperformance of agency mortgage-backed securities relative to comparable-duration U.S. Treasury securities. Indeed, the mortgage sector was unnerved by the Federal Reserve’s preparations to trim its balance sheet by ceasing to reinvest principal runoff from a portion of its mortgage position. The Portfolio’s commitment to mortgage-backed securities slowed its performance relative to the Bloomberg Barclays U.S. Government Bond Index, which holds no mortgage-backed securities, and relative to peers with less exposure to the mortgage sector.
The Portfolio’s mortgage allocation favored mortgage-backed securities issued by Fannie Mae and Freddie Mac. Relative to peers, the Portfolio may have been underweight Ginnie Mae issues. Because Fannie Mae and Freddie Mac securities outperformed Ginnie Mae securities during the reporting period, the Portfolio benefited relative to peers with larger Ginnie Mae commitments. Ginnie Mae securities typically exhibit faster prepayment speeds as mortgage-rates fall because Ginnie Mae–eligible borrowers can be more responsive to refinancing opportunities. Faster prepayment rates can hamper the returns of mortgage-backed securities because the majority of the mortgage market was priced above par and prepayments return principal to investors at par.
Underweighting the Ginnie Mae sector was one step the Portfolio took to cushion against faster prepayment rates. A second strategy to moderate the effect of faster prepayments was to own mortgage-securities backed by loans whose borrowers are less responsive to lower mortgage rates. An example might be a mortgage security associated with a pool of smaller-balance loans. Borrowers with smaller outstanding loan balances have less incentive to respond to lower mortgage rates because the economic benefits associated with refinancing tend to correlate with loan size.
The Portfolio favored mortgage securities backed by 30-year loans, whose longer loan term offered exposure to a broader segment of the U.S. Treasury yield curve. The resulting wide cash-flow window aligned well with a flatter yield curve. As a consequence, the yield-curve trajectory during the reporting period would have been less promising for peers with larger commitments to mortgage securities backed by shorter loan terms, such as 15- or 20-year loans.
Low turnover helped the Portfolio relative to peers by limiting transaction costs. The Portfolio also preserved yield by avoiding large cash balances.
What was the Portfolio’s duration strategy during the reporting period?
The Portfolio’s duration extended from 4.5 to 4.7 years during the reporting period. The benchmark’s duration ranged from 5.9 to 6.1 years. Because the Portfolio’s duration was shorter than that of the benchmark, the Portfolio’s duration posture had a negative impact on relative performance as U.S. Treasury yields fell, on average, across the yield curve.
| 1. | See footnote on page 5 for more information on the Bloomberg Barclays U.S. Government Bond Index. |
| 2. | See footnote on page 5 for more information on the Morningstar Intermediate Government Category Average. |
| 3. | Duration is a measure of the price sensitivity of a fixed-income investment to changes in interest rates. Duration is expressed as a number of years and is considered a more accurate sensitivity gauge than average maturity. |
| 4. | The yield curve is a line that plots the yields of various securities of similar quality—typically U.S. Treasury issues—across a range of maturities. The U.S. Treasury yield curve serves as a benchmark for other debt and is used in economic forecasting. |
| 5. | The terms “spread” and “yield spread” may refer to the difference in yield between a security or type of security and comparable U.S. Treasury issues. The terms may also refer to the difference in yield between two specific securities or types of securities at a given time. |
| | |
| 8 | | MainStay VP Government Portfolio |
What specific factors, risks or market forces prompted significant decisions for the Portfolio during the reporting period?
Most of the Portfolio’s residential mortgage exposure was taken through mortgage pass-through securities rather than collateralized mortgage obligations (CMOs). In our opinion, the compensation demanded by the market for the better predictability of CMO cash-flows was excessive.
The reporting period highlighted a housing market on a cusp. The market was buoyed by rising home prices (which tend to promote turnover) and lower mortgage rates (which tend to promote affordability). Seeking to mute the impact of these changes, the Portfolio emphasized mortgage pass-through securities whose underlying loan pools were expected to be less sensitive to mortgage-rate changes. These “call-protected” pass-throughs can be a source of better value because the loan pools tend to be less responsive to mortgage-rate volatility, thereby stabilizing prepayment speeds and enabling the investor to preserve more of the security’s yield. A loan pool comprised of smaller-balance loans (for example, a loan pool where no mortgage is larger than $150,000) is one instance of a mortgage-backed security with superior call protection.
We diversified a portion of the Portfolio away from agency mortgage securities in an effort to lessen the risks associated with a large allocation to these securities. Other investments of the Portfolio included U.S. Treasury securities, agency debentures, commercial mortgage-backed securities, asset-backed securities and investment-grade corporate bonds. The Portfolio ended the reporting period with 76% exposure to agency mortgage securities, 12% exposure to other government-related sectors (of which 3% of the 12% was synthetic exposure through U.S. Treasury futures), 11% exposure to non-government-related securities and 2% in cash or cash equivalents.
Which market segments were the strongest contributors to the Portfolio’s performance, and which market segments were particularly weak?
Relative to the Bloomberg Barclays U.S. Government Bond Index, duration was the principal performance headwind for the Portfolio. The Portfolio was positioned to be less sensitive to changes in U.S. Treasury yields and was disadvantaged by falling yields during the reporting period.
The yield advantage of mortgage-backed securities relative to comparable-duration U.S. Treasury securities contributed positively to the Portfolio’s absolute and relative performance. (Contributions take weightings and total returns into account.)
The Portfolio’s commitment to mortgage-backed securities, which modestly underperformed comparable-duration U.S. Treasury securities, was a performance headwind during the reporting period. We offset some of this drag by favoring mortgage-backed securities with stable cash flows, which better positioned the Portfolio to withstand a backdrop of lower mortgage rates.
Issue selection, specifically our willingness to favor Fannie Mae and Freddie Mac pass-through securities over Ginnie Mae issues, added value. Ginnie Mae prepayment rates accelerated as mortgage rates declined, causing Ginnie Mae performance to lag. Another aspect of issue selection, our willingness to favor 30-year loan terms over shorter (15- and 20-year) loan terms, helped the Portfolio’s performance. Mortgage-backed securities with 30-year loan terms enjoyed greater sensitivity to falling rates (because of their longer durations) and greater sensitivity to a flatter curve (because of their wider cash-flow windows, as a longer loan-term expands the window over which borrowers may prepay). As a result, these securities tended to outperform during the reporting period.
Did the Portfolio make any significant purchases or sales during the reporting period?
Sector exposures were relatively stable during the reporting period. We were inclined to recycle mortgage prepayments back into the mortgage sector.
How did the Portfolio’s sector weightings change during the reporting period?
Although there were no major changes to the Portfolio’s sector weightings during the reporting period, the Portfolio slightly reduced its weighting in U.S. Treasury securities and slightly increased its weighting in mortgage securities.
How was the Fund positioned at the end of the reporting period?
As of June 30, 2017, the Portfolio held underweight positions relative to the Bloomberg Barclays U.S. Government Bond Index in U.S. Treasury securities and agency debentures. As of the same date, the Portfolio held overweight positions relative to the benchmark in agency mortgage pass-through securities. As of June 30, 2017, the Portfolio had modestly overweight positions in asset-backed securities, commercial mortgage-backed securities and corporate bonds. As of the same date, the Portfolio’s collective non-government exposure was roughly 11% of net assets, and the Portfolio held about 2% of its net assets in cash or cash equivalents.
The opinions expressed are those of the portfolio managers as of the date of this report and are subject to change. There is no guarantee that any forecasts made will come to pass. This material does not constitute investment advice and is not intended as an endorsement of any specific investment.
Not all MainStay VP Portfolios and/or share classes are available under all policies.
Portfolio of Investments June 30, 2017 (Unaudited)
| | | | | | | | |
| | | Principal
Amount | | | Value | |
Long-Term Bonds 99.0%† Asset-Backed Securities 3.2% | |
Other ABS 2.6% | |
Small Business Administration Participation Certificates | | | | | | | | |
Series 2012-20L, Class 1
1.930%, due 12/1/32 | | $ | 723,290 | | | $ | 700,948 | |
Series 2014-20H, Class 1
2.880%, due 8/1/34 | | | 808,796 | | | | 816,298 | |
Series 2015-20G, Class 1
2.880%, due 7/1/35 | | | 1,829,641 | | | | 1,844,244 | |
Series 2014-20I, Class 1
2.920%, due 9/1/34 | | | 808,783 | | | | 823,389 | |
Series 2014-20C, Class 1
3.210%, due 3/1/34 | | | 1,566,421 | | | | 1,616,940 | |
| | | | | | | | |
| | | | 5,801,819 | |
| | | | | | | | |
Utilities 0.6% | | | | | | | | |
Atlantic City Electric Transition Funding LLC
Series 2002-1, Class A4
5.55%, due 10/20/23 | | | 1,174,926 | | | | 1,264,958 | |
| | | | | | | | |
Total Asset-Backed Securities
(Cost $6,989,405) | | | | | | | 7,066,777 | |
| | | | | | | | |
|
| Corporate Bonds 5.9% | |
Agriculture 0.5% | |
Altria Group, Inc.
2.85%, due 8/9/22 | | | 1,170,000 | | | | 1,188,254 | |
| | | | | | | | |
| | |
Banks 0.4% | | | | | | | | |
Bank of America Corp.
6.875%, due 4/25/18 | | | 900,000 | | | | 936,566 | |
| | | | | | | | |
| | |
Electric 1.9% | | | | | | | | |
Duke Energy Florida Project Finance LLC
2.538%, due 9/1/31 | | | 1,900,000 | | | | 1,845,406 | |
PECO Energy Co.
1.700%, due 9/15/21 | | | 2,420,000 | | | | 2,371,070 | |
| | | | | | | | |
| | | | 4,216,476 | |
| | | | | | | | |
Pipelines 0.6% | | | | | | | | |
Plains All American Pipeline, L.P. / PAA Finance Corp.
5.00%, due 2/1/21 | | | 1,200,000 | | | | 1,281,757 | |
| | | | | | | | |
| | |
Real Estate Investment Trusts 1.0% | | | | | | | | |
Host Hotels & Resorts, L.P.
3.75%, due 10/15/23 | | | 2,350,000 | | | | 2,396,262 | |
| | | | | | | | |
| | | | | | | | |
| | | Principal
Amount | | | Value | |
Telecommunications 1.5% | | | | | | | | |
Crown Castle Towers LLC
4.883%, due 8/15/40 (a) | | $ | 3,100,000 | | | $ | 3,308,070 | |
| | | | | | | | |
Total Corporate Bonds
(Cost $13,421,355) | | | | | | | 13,327,385 | |
| | | | | | | | |
|
| Mortgage-Backed Securities 2.0% | |
Commercial Mortgage Loans
(Collateralized Mortgage Obligations) 1.5% | |
BXP Trust
Series 2017-GM, Class A
3.379%, due 6/13/39 (a) | | | 1,300,000 | | | | 1,324,219 | |
CD Mortgage Trust
Series 2007-CD5, Class A4
5.886%, due 11/15/44 (b) | | | 99,354 | | | | 99,436 | |
Four Times Square Trust
Series 2006-4TS, Class A
5.401%, due 12/13/28 (a) | | | 523,168 | | | | 573,195 | |
JP Morgan Chase Commercial Mortgage Securities Trust
Series 2011-C4, Class A3
4.106%, due 7/15/46 (a) | | | 1,412,330 | | | | 1,436,470 | |
| | | | | | | | |
| | | | | | | 3,433,320 | |
| | | | | | | | |
Residential Mortgages
(Collateralized Mortgage Obligations) 0.5% | |
Citigroup Mortgage Loan Trust, Inc.
Series 2006-AR6, Class 1A1
3.203%, due 8/25/36 (c) | | | 242,448 | | | | 215,148 | |
Mortgage Equity Conversion Asset Trust
Series 2007-FF2, Class A
1.500%, due 2/25/42 (a)(b)(d)(e) | | | 933,785 | | | | 796,225 | |
| | | | | | | | |
| | | | | | | 1,011,373 | |
| | | | | | | | |
Total Mortgage-Backed Securities
(Cost $4,582,962) | | | | | | | 4,444,693 | |
| | | | | | | | |
|
| U.S. Government & Federal Agencies 87.9% | |
Fannie Mae Strip
(Collateralized Mortgage Obligations) 0.0% ‡(f) | |
Series 360, Class 2, IO
5.000%, due 8/25/35 | | | 138,944 | | | | 28,424 | |
Series 361, Class 2, IO
6.000%, due 10/25/35 | | | 29,900 | | | | 5,982 | |
| | | | | | | | |
| | | | | | | 34,406 | |
| | | | | | | | |
Federal Home Loan Mortgage Corporation
(Mortgage Pass-Through Securities) 24.9% | |
2.500%, due 1/1/32 | | | 386,514 | | | | 389,004 | |
2.500%, due 8/1/46 | | | 1,964,314 | | | | 1,895,491 | |
| † | Percentages indicated are based on Portfolio net assets. |
| ¨ | | Among the Portfolio’s 10 largest holdings, as of June 30, 2017, excluding short-term investment. May be subject to change daily. |
| | | | |
| 10 | | MainStay VP Government Portfolio | | The notes to the financial statements are an integral part of,
and should be read in conjunction with, the financial statements. |
| | | | | | | | |
| | | Principal
Amount | | | Value | |
| U.S. Government & Federal Agencies (continued) | |
Federal Home Loan Mortgage Corporation
(Mortgage Pass-Through Securities) (continued) | |
2.756%, due 6/1/35 (b) | | $ | 132,138 | | | $ | 138,795 | |
2.914%, due 2/1/37 (b) | | | 87,902 | | | | 92,307 | |
¨3.000%, due 4/1/45 | | | 3,368,876 | | | | 3,363,772 | |
3.000%, due 5/1/45 | | | 2,459,746 | | | | 2,456,019 | |
3.000%, due 6/1/45 | | | 2,334,504 | | | | 2,330,967 | |
3.000%, due 7/1/45 | | | 1,262,280 | | | | 1,260,368 | |
3.000%, due 5/1/46 | | | 1,350,531 | | | | 1,348,485 | |
3.351%, due 3/1/35 (b) | | | 19,958 | | | | 20,916 | |
3.500%, due 10/1/25 | | | 350,098 | | | | 366,337 | |
3.500%, due 11/1/25 | | | 2,212,188 | | | | 2,313,990 | |
3.500%, due 12/1/41 | | | 285,598 | | | | 295,812 | |
3.500%, due 5/1/42 | | | 381,979 | | | | 394,146 | |
3.500%, due 7/1/42 | | | 295,277 | | | | 304,683 | |
3.500%, due 8/1/42 | | | 1,005,780 | | | | 1,044,262 | |
3.500%, due 6/1/43 | | | 1,461,384 | | | | 1,507,927 | |
3.500%, due 8/1/43 | | | 1,241,672 | | | | 1,281,211 | |
3.500%, due 1/1/44 | | | 1,225,458 | | | | 1,264,448 | |
3.500%, due 5/1/44 | | | 1,599,239 | | | | 1,653,441 | |
3.500%, due 12/1/45 | | | 2,093,115 | | | | 2,151,994 | |
3.500%, due 5/1/46 | | | 1,148,088 | | | | 1,180,384 | |
4.000%, due 3/1/25 | | | 770,925 | | | | 809,022 | |
4.000%, due 7/1/25 | | | 308,588 | | | | 323,935 | |
4.000%, due 8/1/31 | | | 546,134 | | | | 580,336 | |
4.000%, due 8/1/39 | | | 567,364 | | | | 604,726 | |
4.000%, due 12/1/40 | | | 2,849,075 | | | | 3,041,337 | |
¨4.000%, due 2/1/41 | | | 4,808,460 | | | | 5,120,866 | |
¨4.000%, due 3/1/41 | | | 5,241,147 | | | | 5,595,143 | |
4.000%, due 1/1/42 | | | 2,702,279 | | | | 2,884,856 | |
4.000%, due 12/1/42 | | | 1,046,661 | | | | 1,110,181 | |
4.000%, due 8/1/44 | | | 528,014 | | | | 563,111 | |
4.000%, due 12/1/45 | | | 731,104 | | | | 769,493 | |
4.000%, due 2/1/46 | | | 2,121,308 | | | | 2,232,692 | |
4.500%, due 3/1/41 | | | 581,844 | | | | 631,124 | |
4.500%, due 5/1/41 | | | 931,554 | | | | 1,011,797 | |
4.500%, due 8/1/41 | | | 1,042,230 | | | | 1,132,010 | |
5.000%, due 1/1/20 | | | 113,567 | | | | 116,659 | |
5.000%, due 6/1/33 | | | 425,280 | | | | 465,260 | |
5.000%, due 8/1/33 | | | 236,141 | | | | 258,200 | |
5.000%, due 5/1/36 | | | 140,856 | | | | 153,663 | |
5.000%, due 10/1/39 | | | 747,246 | | | | 827,266 | |
5.500%, due 1/1/21 | | | 118,804 | | | | 124,246 | |
5.500%, due 1/1/33 | | | 338,694 | | | | 378,339 | |
6.500%, due 4/1/37 | | | 58,982 | | | | 67,216 | |
| | | | | | | | |
| | | | 55,856,237 | |
| | | | | | | | |
| | | | | | | | |
| | | Principal
Amount | | | Value | |
Federal National Mortgage Association
(Mortgage Pass-Through Securities) 41.2% | |
2.000%, due 11/1/31 | | $ | 2,626,054 | | | $ | 2,570,926 | |
2.500%, due 9/1/46 | | | 289,780 | | | | 279,600 | |
2.924%, due 11/1/34 (b) | | | 107,456 | | | | 111,527 | |
3.000%, due 10/1/32 | | | 958,016 | | | | 980,721 | |
3.000%, due 4/1/43 | | | 1,535,124 | | | | 1,541,555 | |
3.000%, due 3/1/46 | | | 932,674 | | | | 932,074 | |
3.000%, due 9/1/46 | | | 2,859,420 | | | | 2,844,956 | |
3.000%, due 10/1/46 | | | 2,345,097 | | | | 2,333,226 | |
3.356%, due 4/1/34 (b) | | | 185,350 | | | | 198,386 | |
3.500%, due 11/1/20 | | | 920,883 | | | | 958,746 | |
3.500%, due 10/1/25 | | | 807,670 | | | | 841,954 | |
¨3.500%, due 11/1/25 | | | 5,695,405 | | | | 5,936,757 | |
3.500%, due 9/1/32 | | | 2,892,219 | | | | 3,020,902 | |
3.500%, due 11/1/32 | | | 688,469 | | | | 719,106 | |
3.500%, due 2/1/41 | | | 1,574,853 | | | | 1,626,080 | |
3.500%, due 11/1/41 | | | 2,660,377 | | | | 2,751,282 | |
3.500%, due 12/1/41 | | | 961,398 | | | | 994,507 | |
3.500%, due 1/1/42 | | | 2,283,998 | | | | 2,370,036 | |
3.500%, due 3/1/42 | | | 2,148,462 | | | | 2,217,016 | |
3.500%, due 5/1/42 | | | 1,005,024 | | | | 1,036,869 | |
3.500%, due 8/1/42 | | | 2,527,788 | | | | 2,608,412 | |
3.500%, due 11/1/42 | | | 1,008,780 | | | | 1,041,186 | |
3.500%, due 12/1/42 | | | 1,363,509 | | | | 1,409,989 | |
3.500%, due 2/1/43 | | | 1,338,542 | | | | 1,384,161 | |
3.500%, due 5/1/43 | | | 2,429,115 | | | | 2,508,265 | |
3.500%, due 6/1/43 | | | 750,443 | | | | 774,599 | |
3.500%, due 3/1/45 | | | 1,405,772 | | | | 1,451,710 | |
4.000%, due 9/1/31 | | | 1,176,993 | | | | 1,250,690 | |
4.000%, due 1/1/41 | | | 836,488 | | | | 891,844 | |
4.000%, due 2/1/41 | | | 1,092,270 | | | | 1,160,622 | |
4.000%, due 3/1/41 | | | 1,771,754 | | | | 1,893,350 | |
4.000%, due 10/1/41 | | | 511,966 | | | | 547,102 | |
4.000%, due 3/1/42 | | | 1,398,419 | | | | 1,484,164 | |
4.000%, due 6/1/42 | | | 709,564 | | | | 752,135 | |
4.000%, due 7/1/42 | | | 2,029,163 | | | | 2,150,256 | |
4.000%, due 8/1/42 | | | 1,075,605 | | | | 1,140,231 | |
4.000%, due 9/1/42 | | | 1,004,578 | | | | 1,059,854 | |
4.000%, due 7/13/47 TBA (g) | | | 1,350,000 | | | | 1,419,135 | |
4.500%, due 7/1/18 | | | 140,946 | | | | 144,334 | |
4.500%, due 11/1/18 | | | 134,951 | | | | 138,195 | |
4.500%, due 6/1/23 | | | 283,353 | | | | 296,967 | |
4.500%, due 10/1/33 | | | 494,745 | | | | 533,169 | |
4.500%, due 5/1/39 | | | 459,983 | | | | 501,111 | |
4.500%, due 6/1/39 | | | 616,599 | | | | 671,154 | |
4.500%, due 7/1/39 | | | 2,093,073 | | | | 2,286,144 | |
4.500%, due 8/1/39 | | | 2,688,020 | | | | 2,929,621 | |
4.500%, due 9/1/39 | | | 89,266 | | | | 97,503 | |
4.500%, due 9/1/40 | | | 2,475,080 | | | | 2,704,605 | |
4.500%, due 12/1/40 | | | 1,900,776 | | | | 2,057,730 | |
¨4.500%, due 1/1/41 | | | 4,231,567 | | | | 4,623,171 | |
| | | | | | |
The notes to the financial statements are an integral part of,
and should be read in conjunction with, the financial statements. | | | | | 11 | |
Portfolio of Investments June 30, 2017 (Unaudited) (continued)
| | | | | | | | |
| | | Principal
Amount | | | Value | |
| U.S. Government & Federal Agencies (continued) | |
Federal National Mortgage Association
(Mortgage Pass-Through Securities) (continued) | |
4.500%, due 2/1/41 | | $ | 366,767 | | | $ | 399,967 | |
4.500%, due 8/1/41 | | | 1,780,314 | | | | 1,932,751 | |
5.000%, due 11/1/17 | | | 20,468 | | | | 20,960 | |
5.000%, due 9/1/20 | | | 3,757 | | | | 3,847 | |
5.000%, due 11/1/33 | | | 811,411 | | | | 890,142 | |
5.000%, due 7/1/34 | | | 94,754 | | | | 104,011 | |
5.000%, due 6/1/35 | | | 582,589 | | | | 637,806 | |
5.000%, due 10/1/35 | | | 151,333 | | | | 166,182 | |
5.000%, due 1/1/36 | | | 69,442 | | | | 76,255 | |
5.000%, due 2/1/36 | | | 819,861 | | | | 900,134 | |
5.000%, due 5/1/36 | | | 789,487 | | | | 866,690 | |
5.000%, due 3/1/40 | | | 1,070,748 | | | | 1,180,883 | |
5.000%, due 2/1/41 | | | 2,171,603 | | | | 2,417,445 | |
5.500%, due 11/1/17 | | | 11,045 | | | | 11,075 | |
5.500%, due 6/1/19 | | | 107,029 | | | | 109,335 | |
5.500%, due 11/1/19 | | | 135,249 | | | | 138,579 | |
5.500%, due 4/1/21 | | | 220,114 | | | | 228,926 | |
5.500%, due 6/1/21 | | | 21,207 | | | | 22,210 | |
5.500%, due 6/1/33 | | | 996,939 | | | | 1,117,782 | |
5.500%, due 11/1/33 | | | 645,599 | | | | 722,852 | |
5.500%, due 12/1/33 | | | 672,920 | | | | 753,927 | |
5.500%, due 6/1/34 | | | 211,823 | | | | 237,404 | |
5.500%, due 3/1/35 | | | 314,369 | | | | 351,832 | |
5.500%, due 12/1/35 | | | 113,391 | | | | 126,983 | |
5.500%, due 4/1/36 | | | 562,743 | | | | 629,684 | |
5.500%, due 1/1/37 | | | 199,911 | | | | 227,381 | |
5.500%, due 7/1/37 | | | 185,657 | | | | 211,896 | |
5.500%, due 8/1/37 | | | 141,112 | | | | 157,982 | |
6.000%, due 1/1/33 | | | 103,063 | | | | 117,255 | |
6.000%, due 3/1/33 | | | 101,904 | | | | 114,920 | |
6.000%, due 9/1/34 | | | 23,766 | | | | 27,125 | |
6.000%, due 9/1/35 | | | 321,303 | | | | 368,779 | |
6.000%, due 10/1/35 | | | 79,629 | | | | 91,486 | |
6.000%, due 4/1/36 | | | 251,412 | | | | 286,486 | |
6.000%, due 6/1/36 | | | 167,928 | | | | 190,248 | |
6.000%, due 11/1/36 | | | 191,432 | | | | 216,033 | |
6.000%, due 4/1/37 | | | 30,036 | | | | 31,566 | |
6.500%, due 10/1/31 | | | 44,194 | | | | 50,329 | |
6.500%, due 7/1/32 | | | 12,745 | | | | 14,096 | |
6.500%, due 2/1/37 | | | 44,852 | | | | 50,222 | |
6.500%, due 8/1/47 | | | 26,142 | | | | 28,114 | |
| | | | | | | | |
| | | | 92,409,215 | |
| | | | | | | | |
Government National Mortgage Association
(Mortgage Pass-Through Securities) 10.1% | |
3.000%, due 8/20/45 | | | 2,273,870 | | | | 2,299,194 | |
3.000%, due 6/20/46 | | | 1,313,331 | | | | 1,313,802 | |
3.500%, due 12/20/46 | | | 1,237,828 | | | | 1,289,429 | |
| | | | | | | | |
| | | Principal
Amount | | | Value | |
Government National Mortgage Association
(Mortgage Pass-Through Securities) (continued) | |
3.500%, due 7/20/47 TBA (g) | | $ | 250,000 | | | $ | 258,945 | |
4.000%, due 7/15/39 | | | 408,151 | | | | 429,668 | |
4.000%, due 9/20/40 | | | 1,596,283 | | | | 1,698,248 | |
4.000%, due 11/20/40 | | | 255,306 | | | | 271,495 | |
4.000%, due 1/15/41 | | | 1,792,856 | | | | 1,892,642 | |
¨4.000%, due 10/15/41 | | | 4,515,019 | | | | 4,861,785 | |
4.000%, due 6/20/47 | | | 1,841,451 | | | | 1,911,177 | |
¨4.500%, due 5/20/40 | | | 3,434,656 | | | | 3,690,527 | |
5.000%, due 4/15/34 | | | 589,713 | | | | 647,979 | |
5.000%, due 2/20/41 | | | 388,830 | | | | 427,393 | |
5.500%, due 6/15/33 | | | 877,403 | | | | 990,856 | |
5.500%, due 12/15/35 | | | 103,726 | | | | 115,814 | |
6.000%, due 8/15/32 | | | 132,655 | | | | 151,015 | |
6.000%, due 10/15/32 | | | 213,587 | | | | 241,365 | |
6.500%, due 7/15/28 | | | 27,800 | | | | 31,682 | |
6.500%, due 8/15/28 | | | 31,892 | | | | 35,570 | |
6.500%, due 7/15/32 | | | 130,254 | | | | 153,653 | |
| | | | | | | | |
| | | | 22,712,239 | |
| | | | | | | | |
Overseas Private Investment Corporation 1.1% | |
5.142%, due 12/15/23 | | | 2,222,401 | | | | 2,438,165 | |
| | | | | | | | |
| | |
Tennessee Valley Authority 2.3% | | | | | | | | |
¨4.650%, due 6/15/35 | | | 4,395,000 | | | | 5,273,345 | |
| | | | | | | | |
| | |
United States Treasury Notes 8.3% | | | | | | | | |
1.625%, due 8/15/22 | | | 2,170,000 | | | | 2,140,755 | |
1.750%, due 9/30/22 | | | 2,000,000 | | | | 1,981,954 | |
1.750%, due 5/15/23 | | | 2,500,000 | | | | 2,462,890 | |
¨2.000%, due 8/31/21 | | | 5,295,000 | | | | 5,341,538 | |
2.000%, due 8/15/25 | | | 1,500,000 | | | | 1,474,512 | |
¨2.375%, due 8/15/24 | | | 5,200,000 | | | | 5,279,217 | |
| | | | | | | | |
| | | | 18,680,866 | |
| | | | | | | | |
Total U.S. Government & Federal Agencies
(Cost $193,987,819) | | | | | | | 197,404,473 | |
| | | | | | | | |
Total Long-Term Bonds
(Cost $218,981,541) | | | | | | | 222,243,328 | |
| | | | | | | | |
| | | | |
| 12 | | MainStay VP Government Portfolio | | The notes to the financial statements are an integral part of,
and should be read in conjunction with, the financial statements. |
| | | | | | | | |
| | | Principal
Amount | | | Value | |
| Short-Term Investment 2.3% | |
Repurchase Agreement 2.3% | | | | | | | | |
Fixed Income Clearing Corp.
0.12%, dated 6/30/17
due 7/3/17
Proceeds at Maturity $5,261,814 (Collateralized by a United States Treasury Note with a rate of 1.125% and a maturity date of 9/30/21, with a Principal Amount of $5,495,000 and a Market Value of $5,367,428) | | $ | 5,261,762 | | | $ | 5,261,762 | |
| | | | | | | | |
Total Short-Term Investment
(Cost $5,261,762) | | | | | | | 5,261,762 | |
| | | | | | | | |
Total Investments
(Cost $224,243,303) (h) | | | 101.3 | % | | | 227,505,090 | |
Other Assets, Less Liabilities | | | (1.3 | ) | | | (2,973,247 | ) |
Net Assets | | | 100.0 | % | | $ | 224,531,843 | |
| ‡ | Less than one-tenth of a percent. |
| (a) | May be sold to institutional investors only under Rule 144A or securities offered pursuant to Section 4(a)(2) of the Securities Act of 1933, as amended. |
| (b) | Floating rate—Rate shown was the rate in effect as of June 30, 2017. |
| (c) | Collateral strip rate—A bond whose interest was based on the weighted net interest rate of the collateral. The coupon rate adjusts periodically based on a predetermined schedule. Rate shown was the rate in effect as of June 30, 2017. |
| (d) | Illiquid security—As of June 30, 2017, the total market value of the security deemed illiquid under procedures approved by the Board of Trustees was $796,225, which represented 0.4% of the Portfolio’s net assets. |
| (e) | Fair valued security—Represents fair value as measured in good faith under procedures approved by the Board of Trustees. As of June 30, 2017, the total market value of the fair valued security was $796,225, which represented 0.4% of the Portfolio’s net assets. |
| (f) | Collateralized Mortgage Obligation Interest Only Strip—Pays a fixed or variable rate of interest based on mortgage loans or mortgage pass-through securities. The principal amount of the underlying pool represents the notional amount on which the current interest was calculated. The value of these stripped securities may be particularly sensitive to changes in prevailing interest rates and are typically more sensitive to changes in prepayment rates than traditional mortgage-backed securities. |
| (g) | TBA—Securities purchased on a forward commitment basis with an approximate principal amount and maturity date. The actual principal amount and maturity date will be determined upon settlement. As of June 30, 2017, the total net market value of these securities was $1,678,080, which represented 0.7% of the Portfolio’s net assets. All or a portion of these securities are a part of a mortgage dollar roll agreement. |
| (h) | As of June 30, 2017, cost was $224,243,303 for federal income tax purposes and net unrealized appreciation was as follows: |
| | | | |
Gross unrealized appreciation | | $ | 5,575,643 | |
Gross unrealized depreciation | | | (2,313,856 | ) |
| | | | |
Net unrealized appreciation | | $ | 3,261,787 | |
| | | | |
As of June 30, 2017, the Portfolio held the following futures contracts1:
| | | | | | | | | | | | | | | | |
Type | | Number of
Contracts
Long | | | Expiration
Date | | | Notional
Amount | | | Unrealized
Appreciation
(Depreciation)2 | |
| 5-Year United States Treasury Note | | | 69 | | | | September 2017 | | | $ | 8,130,680 | | | $ | (19,687 | ) |
| | | | | | | | | | | | | | | | |
| 1. | As of June 30, 2017, cash in the amount of $48,300 was on deposit with a broker for futures transactions. |
| 2. | Represents the difference between the value of the contracts at the time they were opened and the value as of June 30, 2017. |
The following abbreviation is used in the preceding pages:
IO—Interest Only
| | | | | | |
The notes to the financial statements are an integral part of,
and should be read in conjunction with, the financial statements. | | | | | 13 | |
Portfolio of Investments June 30, 2017 (Unaudited) (continued)
The following is a summary of the fair valuations according to the inputs used as of June 30, 2017, for valuing the Portfolio’s assets.
Asset Valuation Inputs
| | | | | | | | | | | | | | | | |
Description | | Quoted
Prices in
Active
Markets for
Identical
Assets (Level 1) | | | Significant
Other
Observable
Inputs (Level 2) | | | Significant
Unobservable
Inputs (Level 3) | | | Total | |
| Investments in Securities (a) | | | | | | | | | | | | | | | | |
| Long-Term Bonds | | | | | | | | | | | | | | | | |
Asset-Backed Securities | | $ | — | | | $ | 7,066,777 | | | $ | — | | | $ | 7,066,777 | |
Corporate Bonds | | | — | | | | 13,327,385 | | | | — | | | | 13,327,385 | |
Mortgage-Backed Securities (b) | | | — | | | | 3,648,468 | | | | 796,225 | | | | 4,444,693 | |
U.S. Government & Federal Agencies | | | — | | | | 197,404,473 | | | | — | | | | 197,404,473 | |
| | | | | | | | | | | | | | | | |
| Total Long-Term Bonds | | | — | | | | 221,447,103 | | | | 796,225 | | | | 222,243,328 | |
| | | | | | | | | | | | | | | | |
| Short-Term Investment | | | | | | | | | | | | | | | | |
Repurchase Agreement | | | — | | | | 5,261,762 | | | | — | | | | 5,261,762 | |
| | | | | | | | | | | | | | | | |
| Total Investments in Securities | | $ | — | | | $ | 226,708,865 | | | $ | 796,225 | | | $ | 227,505,090 | |
| | | | | | | | | | | | | | | | |
Liability Valuation Inputs
| | | | | | | | | | | | | | | | |
Description | | Quoted
Prices in
Active
Markets for
Identical
Assets (Level 1) | | | Significant
Other
Observable
Inputs (Level 2) | | | Significant
Unobservable
Inputs (Level 3) | | | Total | |
| Other Financial Instruments | | | | | | | | | | | | | | | | |
Futures Contracts (c) | | $ | (19,687 | ) | | $ | — | | | $ | — | | | $ | (19,687 | ) |
| | | | | | | | | | | | | | | | |
| Total Short-Term Investments Sold Short and Other Financial Instruments | | $ | (19,687 | ) | | $ | — | | | $ | — | | | $ | (19,687 | ) |
| | | | | | | | | | | | | | | | |
| (a) | For a complete listing of investments and their industries, see the Portfolio of Investments. |
| (b) | The Level 3 security valued at $796,225 is held in Residential Mortgages (Collateralized Mortgage Obligations) within the Mortgage-Backed Securities section of the Portfolio of Investments. |
| (c) | The value listed for these securities reflects unrealized appreciation (depreciation) as shown on the Portfolio of Investments. |
The Portfolio recognizes transfers between the levels as of the beginning of the period.
For the period ended June 30, 2017, the Portfolio did not have any transfers among levels. (See Note 2)
The following is a reconciliation of investments in which significant unobservable inputs (Level 3) were used in determining value:
| | | | | | | | | | | | | | | | | | | | | | | | | | | | | | | | | | | | | | | | |
Investments in Securities | | Balance
as of
December 31,
2016 | | | Accrued
Discounts
(Premiums) | | | Realized
Gain
(Loss) | | | Change in
Unrealized
Appreciation
(Depreciation) | | | Purchases | | | Sales (a) | | | Transfers
into
Level 3 | | | Transfers
out of
Level 3 | | | Balance
as of
June 30,
2017 | | | Change in
Unrealized
Appreciation
(Depreciation)
from
Investments
Still Held at
June 30,
2017 (b) | |
| Long-Term Bonds | | | | | | | | | | | | | | | | | | | | | | | | | | | | | | | | | | | | | | | | |
Mortgage-Backed Securities | | | | | | | | | | | | | | | | | | | | | | | | | | | | | | | | | | | | | | | | |
Residential Mortgages (Collateralized Mortgage Obligations) | | $ | 843,642 | | | $ | 622 | | | $ | 2,051 | | | $ | 9,358 | | | $ | — | | | $ | (59,448 | ) | | $ | — | | | $ | — | | | $ | 796,225 | | | $ | 2,455 | |
| | | | | | | | | | | | | | | | | | | | | | | | | | | | | | | | | | | | | | | | |
| (a) | Sales include principal reductions. |
| (b) | Included in “Net change in unrealized appreciation (depreciation) on investments” in the Statement of Operations. |
| | | | |
| 14 | | MainStay VP Government Portfolio | | The notes to the financial statements are an integral part of,
and should be read in conjunction with, the financial statements. |
Statement of Assets and Liabilities as of June 30, 2017 (Unaudited)
| | | | |
| Assets | |
Investment in securities, at value (identified cost $224,243,303) | | $ | 227,505,090 | |
Cash collateral on deposit at broker | | | 48,300 | |
Receivables: | | | | |
Interest | | | 854,027 | |
Fund shares sold | | | 85,709 | |
Other assets | | | 1,410 | |
| | | | |
Total assets | | | 228,494,536 | |
| | | | |
| |
| Liabilities | | | | |
Due to custodian | | | 2,696 | |
Payables: | | | | |
Investment securities purchased | | | 3,595,084 | |
Fund shares redeemed | | | 167,435 | |
Manager (See Note 3) | | | 93,610 | |
NYLIFE Distributors (See Note 3) | | | 34,225 | |
Professional fees | | | 26,173 | |
Shareholder communication | | | 17,603 | |
Custodian | | | 13,185 | |
Variation margin on futures contracts | | | 9,171 | |
Trustees | | | 456 | |
Accrued expenses | | | 3,055 | |
| | | | �� |
Total liabilities | | | 3,962,693 | |
| | | | |
Net assets | | $ | 224,531,843 | |
| | | | |
| |
| Composition of Net Assets | | | | |
Shares of beneficial interest outstanding (par value of $.001 per share) unlimited number of shares authorized | | $ | 20,542 | |
Additional paid-in capital | | | 216,053,088 | |
| | | | |
| | | 216,073,630 | |
Undistributed net investment income | | | 7,916,581 | |
Accumulated net realized gain (loss) on investments and futures transactions | | | (2,700,468 | ) |
Net unrealized appreciation (depreciation) on investments and futures contracts | | | 3,242,100 | |
| | | | |
Net assets | | $ | 224,531,843 | |
| | | | |
| | | | |
Initial Class | | | | |
Net assets applicable to outstanding shares | | $ | 60,525,738 | |
| | | | |
Shares of beneficial interest outstanding | | | 5,498,104 | |
| | | | |
Net asset value per share outstanding | | $ | 11.01 | |
| | | | |
Service Class | | | | |
Net assets applicable to outstanding shares | | $ | 164,006,105 | |
| | | | |
Shares of beneficial interest outstanding | | | 15,043,515 | |
| | | | |
Net asset value per share outstanding | | $ | 10.90 | |
| | | | |
| | | | | | |
The notes to the financial statements are an integral part of,
and should be read in conjunction with, the financial statements. | | | | | 15 | |
Statement of Operations for the six months ended June 30, 2017 (Unaudited)
| | | | |
| Investment Income (Loss) | |
Income | | | | |
Interest | | $ | 3,333,957 | |
| | | | |
Expenses | | | | |
Manager (See Note 3) | | | 584,990 | |
Distribution/Service—Service Class (See Note 3) | | | 214,696 | |
Professional fees | | | 30,778 | |
Shareholder communication | | | 21,575 | |
Custodian | | | 7,160 | |
Trustees | | | 3,160 | |
Miscellaneous | | | 6,340 | |
| | | | |
Total expenses | | | 868,699 | |
| | | | |
Net investment income (loss) | | | 2,465,258 | |
| | | | |
|
| Realized and Unrealized Gain (Loss) on Investments and Futures Contracts | |
Net realized gain (loss) on: | | | | |
Investment transactions | | | (47,882 | ) |
Futures transactions | | | 62,107 | |
| | | | |
Net realized gain (loss) on investments and futures transactions | | | 14,225 | |
| | | | |
Net change in unrealized appreciation (depreciation) on: | | | | |
Investments | | | 743,602 | |
Futures contracts | | | 11,191 | |
| | | | |
Net change in unrealized appreciation (depreciation) on investments and futures contracts | | | 754,793 | |
| | | | |
Net realized and unrealized gain (loss) on investments and futures transactions | | | 769,018 | |
| | | | |
Net increase (decrease) in net assets resulting from operations | | $ | 3,234,276 | |
| | | | |
| | | | |
| 16 | | MainStay VP Government Portfolio | | The notes to the financial statements are an integral part of,
and should be read in conjunction with, the financial statements. |
Statements of Changes in Net Assets
for the six months ended June 30, 2017 (Unaudited) and the year ended December 31, 2016
| | | | | | | | |
| | | 2017 | | | 2016 | |
| Increase (Decrease) in Net Assets | |
Operations: | | | | | | | | |
Net investment income (loss) | | $ | 2,465,258 | | | $ | 5,303,753 | |
Net realized gain (loss) on investments and futures transactions | | | 14,225 | | | | (25,157 | ) |
Net change in unrealized appreciation (depreciation) on investments and futures contracts | | | 754,793 | | | | (3,110,318 | ) |
| | | | |
Net increase (decrease) in net assets resulting from operations | | | 3,234,276 | | | | 2,168,278 | |
| | | | |
Dividends to shareholders: | | | | | | | | |
From net investment income: | | | | | | | | |
Initial Class | | | — | | | | (1,653,503 | ) |
Service Class | | | — | | | | (4,453,387 | ) |
| | | | |
Total dividends to shareholders | | | — | | | | (6,106,890 | ) |
| | | | |
Capital share transactions: | | | | | | | | |
Net proceeds from sale of shares | | | 8,551,559 | | | | 71,870,776 | |
Net asset value of shares issued to shareholders in reinvestment of dividends | | | — | | | | 6,106,890 | |
Cost of shares redeemed | | | (38,391,044 | ) | | | (74,085,100 | ) |
| | | | |
Increase (decrease) in net assets derived from capital share transactions | | | (29,839,485 | ) | | | 3,892,566 | |
| | | | |
Net increase (decrease) in net assets | | | (26,605,209 | ) | | | (46,046 | ) |
| | |
| Net Assets | | | | | | | | |
Beginning of period | | | 251,137,052 | | | | 251,183,098 | |
| | | | |
End of period | | $ | 224,531,843 | | | $ | 251,137,052 | |
| | | | |
Undistributed net investment income at end of period | | $ | 7,916,581 | | | $ | 5,451,323 | |
| | | | |
| | | | | | |
The notes to the financial statements are an integral part of,
and should be read in conjunction with, the financial statements. | | | | | 17 | |
Financial Highlights selected per share data and ratios
| | | | | | | | | | | | | | | | | | | | | | | | | | | | |
| | | Six months
ended
June 30, | | | | | | Year ended December 31, | |
| Initial Class | | 2017* | | | | | | 2016 | | | 2015 | | | 2014 | | | 2013 | | | 2012 | |
Net asset value at beginning of period | | $ | 10.85 | | | | | | | $ | 10.99 | | | $ | 11.25 | | | $ | 11.13 | | | $ | 11.84 | | | $ | 11.74 | |
| | | | | | | | | | | | | | | | | | | | | | | | | | | | |
Net investment income (loss) (a) | | | 0.12 | | | | | | | | 0.24 | | | | 0.29 | | | | 0.31 | | | | 0.30 | | | | 0.33 | |
Net realized and unrealized gain (loss) on investments | | | 0.04 | | | | | | | | (0.11 | ) | | | (0.23 | ) | | | 0.21 | | | | (0.60 | ) | | | 0.13 | |
| | | | | | | | | | | | | | | | | | | | | | | | | | | | |
Total from investment operations | | | 0.16 | | | | | | | | 0.13 | | | | 0.06 | | | | 0.52 | | | | (0.30 | ) | | | 0.46 | |
| | | | | | | | | | | | | | | | | | | | | | | | | | | | |
| Less dividends and distributions: | | | | | | | | | | | | | | | | | | | | | | | | | | | | |
From net investment income | | | — | | | | | | | | (0.27 | ) | | | (0.32 | ) | | | (0.36 | ) | | | (0.39 | ) | | | (0.36 | ) |
From net realized gain on investments | | | — | | | | | | | | — | | | | — | | | | (0.04 | ) | | | (0.02 | ) | | | — | |
| | | | | | | | | | | | | | | | | | | | | | | | | | | | |
Total dividends and distributions | | | — | | | | | | | | (0.27 | ) | | | (0.32 | ) | | | (0.40 | ) | | | (0.41 | ) | | | (0.36 | ) |
| | | | | | | | | | | | | | | | | | | | | | | | | | | | |
Net asset value at end of period | | $ | 11.01 | | | | | | | $ | 10.85 | | | $ | 10.99 | | | $ | 11.25 | | | $ | 11.13 | | | $ | 11.84 | |
| | | | | | | | | | | | | | | | | | | | | | | | | | | | |
Total investment return (b) | | | 1.47 | %(c) | | | | | | | 1.07 | % | | | 0.53 | % | | | 4.61 | % | | | (2.46 | %) | | | 3.96 | % |
| Ratios (to average net assets)/Supplemental Data: | | | | | | | | | | | | | | | | | | | | | | | | | | | | |
Net investment income (loss) | | | 2.29 | %†† | | | | | | | 2.14 | %(d) | | | 2.54 | % | | | 2.70 | % | | | 2.56 | % | | | 2.78 | % |
Net expenses | | | 0.56 | %†† | | | | | | | 0.55 | %(e) | | | 0.55 | % | | | 0.55 | % | | | 0.54 | % | | | 0.54 | % |
Expenses (before waiver/reimbursement) | | | 0.56 | %†† | | | | | | | 0.56 | % | | | 0.55 | % | | | 0.55 | % | | | 0.54 | % | | | 0.54 | % |
Portfolio turnover rate (f) | | | 5 | % | | | | | | | 64 | % | | | 12 | % | | | 7 | % | | | 25 | % | | | 40 | % |
Net assets at end of period (in 000’s) | | $ | 60,526 | | | | | | | $ | 64,930 | | | $ | 72,924 | | | $ | 83,172 | | | $ | 89,165 | | | $ | 117,126 | |
| (a) | Per share data based on average shares outstanding during the period. |
| (b) | Total return does not reflect any deduction of sales charges, mortality and expense charges, contract charges or administrative charges. For periods of less than one year, total return is not annualized. |
| (c) | Total investment return may reflect adjustments to conform to generally accepted accounting principles. |
| (d) | Without the custody fee reimbursement, net investment income (loss) would have been 2.13%. |
| (e) | Without the custody fee reimbursement, net expenses would have been 0.56%. |
| (f) | The portfolio turnover rates not including mortgage dollar rolls were 2%, 19%, 11%, 8% and 20% for the six months ended June 30, 2017 and years ended December 31, 2016, 2015, 2013 and 2012, respectively. |
| | | | |
| 18 | | MainStay VP Government Portfolio | | The notes to the financial statements are an integral part of,
and should be read in conjunction with, the financial statements. |
Financial Highlights selected per share data and ratios
| | | | | | | | | | | | | | | | | | | | | | | | | | | | | | | | | | | |
| | | Six months
ended
June 30, | | | | Year ended December 31, |
| Service Class | | 2017* | | | | 2016 | | 2015 | | 2014 | | 2013 | | 2012 |
Net asset value at beginning of period | | | $ | 10.76 | | | | | | | | | $ | 10.90 | | | | $ | 11.16 | | | | $ | 11.04 | | | | $ | 11.74 | | | | $ | 11.65 | |
| | | | | | | | | | | | | | | | | | | | | | | | | | | | | | | | | | | |
Net investment income (loss) (a) | | | | 0.11 | | | | | | | | | | 0.21 | | | | | 0.26 | | | | | 0.27 | | | | | 0.26 | | | | | 0.30 | |
Net realized and unrealized gain (loss) on investments | | | | 0.03 | | | | | | | | | | (0.11 | ) | | | | (0.23 | ) | | | | 0.21 | | | | | (0.58 | ) | | | | 0.13 | |
| | | | | | | | | | | | | | | | | | | | | | | | | | | | | | | | | | | |
Total from investment operations | | | | 0.14 | | | | | | | | | | 0.10 | | | | | 0.03 | | | | | 0.48 | | | | | (0.32 | ) | | | | 0.43 | |
| | | | | | | | | | | | | | | | | | | | | | | | | | | | | | | | | | | |
| Less dividends and distributions: | | | | | | | | | | | | | | | | | | | | | | | | | | | | | | | | | | | |
From net investment income | | | | — | | | | | | | | | | (0.24 | ) | | | | (0.29 | ) | | | | (0.32 | ) | | | | (0.36 | ) | | | | (0.34 | ) |
From net realized gain on investments | | | | — | | | | | | | | | | — | | | | | — | | | | | (0.04 | ) | | | | (0.02 | ) | | | | — | |
| | | | | | | | | | | | | | | | | | | | | | | | | | | | | | | | | | | |
Total dividends and distributions | | | | — | | | | | | | | | | (0.24 | ) | | | | (0.29 | ) | | | | (0.36 | ) | | | | (0.38 | ) | | | | (0.34 | ) |
| | | | | | | | | | | | | | | | | | | | | | | | | | | | | | | | | | | |
Net asset value at end of period | | | $ | 10.90 | | | | | | | | | $ | 10.76 | | | | $ | 10.90 | | | | $ | 11.16 | | | | $ | 11.04 | | | | $ | 11.74 | |
| | | | | | | | | | | | | | | | | | | | | | | | | | | | | | | | | | | |
Total investment return (b) | | | | 1.30 | %(c) | | | | | | | | | 0.82 | % | | | | 0.28 | % | | | | 4.35 | % | | | | (2.70 | %) | | | | 3.70 | % |
| Ratios (to average net assets)/Supplemental Data: | | | | | | | | | | | | | | | | | | | | | | | | | | | | | | | | | | | |
Net investment income (loss) | | | | 2.04 | %†† | | | | | | | | | 1.89 | %(d) | | | | 2.29 | % | | | | 2.45 | % | | | | 2.31 | % | | | | 2.53 | % |
Net expenses | | | | 0.81 | %†† | | | | | | | | | 0.80 | %(e) | | | | 0.80 | % | | | | 0.80 | % | | | | 0.79 | % | | | | 0.79 | % |
Expenses (before waiver/reimbursement) | | | | 0.81 | %†† | | | | | | | | | 0.81 | % | | | | 0.80 | % | | | | 0.80 | % | | | | 0.79 | % | | | | 0.79 | % |
Portfolio turnover rate (f) | | | | 5 | % | | | | | | | | | 64 | % | | | | 12 | % | | | | 7 | % | | | | 25 | % | | | | 40 | % |
Net assets at end of period (in 000’s) | | | $ | 164,006 | | | | | | | | | $ | 186,207 | | | | $ | 178,259 | | | | $ | 185,243 | | | | $ | 195,153 | | | | $ | 256,382 | |
| (a) | Per share data based on average shares outstanding during the period. |
| (b) | Total return does not reflect any deduction of sales charges, mortality and expense charges, contract charges or administrative charges. For periods of less than one year, total return is not annualized. |
| (c) | Total investment return may reflect adjustments to conform to generally accepted accounting principles. |
| (d) | Without the custody fee reimbursement, net investment income (loss) would have been 1.88%. |
| (e) | Without the custody fee reimbursement, net expenses would have been 0.81%. |
| (f) | The portfolio turnover rates not including mortgage dollar rolls were 2%, 19%, 11%, 8% and 20% for the six months ended June 30, 2017 and years ended December 31, 2016, 2015, 2013 and 2012, respectively. |
| | | | | | |
The notes to the financial statements are an integral part of,
and should be read in conjunction with, the financial statements. | | | | | 19 | |
Notes to Financial Statements (Unaudited)
Note 1–Organization and Business
MainStay VP Funds Trust (the “Fund”) was organized as a Delaware statutory trust on February 1, 2011. The Fund is registered under the Investment Company Act of 1940, as amended (the “1940 Act”), as an open-end management investment company. The Fund is comprised of thirty-two separate series (collectively referred to as the “Portfolios”). These financial statements and notes relate to the MainStay VP Government Portfolio (the “Portfolio”), a “diversified” portfolio, as that term is defined in the 1940 Act, as interpreted or modified by regulatory authorities having jurisdiction, from time to time.
Shares of the Portfolio are currently offered to certain separate accounts to fund variable annuity policies and variable universal life insurance policies issued by New York Life Insurance and Annuity Corporation (“NYLIAC”), a wholly-owned subsidiary of New York Life Insurance Company (“New York Life”). NYLIAC allocates shares of the Portfolios to, among others, NYLIAC Variable Annuity Separate Accounts-I, II, III and IV, VUL Separate Account-I and CSVUL Separate Account-I (collectively, the “Separate Accounts”). Shares of the Portfolio are also offered to the MainStay VP Conservative Allocation Portfolio, MainStay VP Moderate Allocation Portfolio, MainStay VP Moderate Growth Allocation Portfolio and MainStay VP Growth Allocation Portfolio, which operate as “funds-of-funds.”
The Portfolio currently offers two classes of shares. Initial Class shares commenced operations on January 29, 1993. Service Class shares commenced operations on June 4, 2003. Shares of the Portfolio are sold and are redeemed at a price equal to their respective net asset value (“NAV”) per share. No sales or redemption charge is applicable to the purchase or redemption of the Portfolio’s shares. Under the terms of the Fund’s multiple class plan, adopted pursuant to Rule 18f-3 under the 1940 Act, the classes differ in that, among other things, Service Class shares of the Portfolio pay a combined distribution and service fee of 0.25% of average daily net assets attributable to Service Class shares of the Portfolio to the Distributor (as defined in Note 3 (B)) pursuant to a plan adopted in accordance with Rule 12b-1 under the 1940 Act. Contract owners of variable annuity contracts purchased after June 2, 2003, are permitted to invest only in the Service Class shares.
The Portfolio’s investment objective is to seek current income.
Note 2–Significant Accounting Policies
The Portfolio is an investment company and accordingly follows the investment company accounting and reporting guidance of the Financial Accounting Standards Board (“FASB”) Accounting Standard Codification Topic 946 Financial Services—Investment Companies. The Portfolio prepares its financial statements in accordance with generally accepted accounting principles (“GAAP”) in the United States of America and follows the significant accounting policies described below.
(A) Securities Valuation. Investments are usually valued as of the close of regular trading on the New York Stock Exchange (the “Exchange”) (usually 4:00 p.m. Eastern time) on each day the Portfolio is open for business (“valuation date”).
The Board of Trustees (the “Board”) of the Fund adopted procedures establishing methodologies for the valuation of the Portfolio’s securities and other assets and delegated the responsibility for valuation determinations under those procedures to the Valuation Committee of the Fund
(the “Valuation Committee”). The Board authorized the Valuation Committee to appoint a Valuation Sub-Committee (the “Sub-Committee”) to deal in the first instance with establishing the prices of securities for which market quotations are not readily available or the prices of which are not otherwise readily determinable under these procedures. The Sub-Committee meets (in person, via electronic mail or via teleconference) on an as-needed basis. Subsequently, the Valuation Committee meets to ensure that actions taken by the Sub-Committee were appropriate. The procedures recognize that, subject to the oversight of the Board and unless otherwise noted, the responsibility for the day-to-day valuation of portfolio assets (including fair value measurements for the Portfolio’s assets and liabilities) rests with New York Life Investment Management LLC (“New York Life Investments” or the “Manager”), aided to whatever extent necessary by the Subadvisor (as defined in Note 3(A)) to the Portfolio.
To assess the appropriateness of security valuations, the Manager, the Subadvisor or the Portfolio’s third party service provider, who is subject to oversight by the Manager, regularly compares prior day prices, prices on comparable securities and the sale prices to the prior and current day prices and challenges prices with changes exceeding certain tolerance levels with third party pricing services or broker sources. For those securities valued through either a standardized fair valuation methodology or a fair valuation measurement, the Sub-Committee deals in the first instance with such valuation and the Valuation Committee reviews and affirms, if appropriate, the reasonableness of the valuation based on such methodologies and measurements on a regular basis after considering all relevant information that is reasonably available. Any action taken by the Sub-Committee with respect to the valuation of a portfolio security or other asset is submitted by the Valuation Committee to the Board for its review and ratification, if appropriate, at its next regularly scheduled meeting.
“Fair value” is defined as the price the Portfolio would reasonably expect to receive upon selling an asset or liability in an orderly transaction to an independent buyer in the principal or most advantageous market for the asset or liability. Fair value measurements are determined within a framework that establishes a three-tier hierarchy which maximizes the use of observable market data and minimizes the use of unobservable inputs to establish a classification of fair value measurements for disclosure purposes. “Inputs” refer broadly to the assumptions that market participants would use in pricing the asset or liability, including assumptions about risk, such as the risk inherent in a particular valuation technique used to measure fair value using a pricing model and/or the risk inherent in the inputs for the valuation technique. Inputs may be observable or unobservable. Observable inputs reflect the assumptions market participants would use in pricing the asset or liability based on market data obtained from sources independent of the Portfolio. Unobservable inputs reflect the Portfolio’s own assumptions about the assumptions market participants would use in pricing the asset or liability based on the information available. The inputs or methodology used for valuing assets or liabilities may not be an indication of the risks associated with investing in those assets or liabilities. The three-tier hierarchy of inputs is summarized below.
| • | | Level 1—quoted prices in active markets for an identical asset or liability |
| | |
| 20 | | MainStay VP Government Portfolio |
| • | | Level 2—other significant observable inputs (including quoted prices for a similar asset or liability in active markets, interest rates and yield curves, prepayment speeds, credit risk, etc.) |
| • | | Level 3—significant unobservable inputs (including the Portfolio’s own assumptions about the assumptions that market participants would use in measuring fair value of an asset or liability) |
The level of an asset or liability within the fair value hierarchy is based on the lowest level of an input, both individually and in the aggregate, that is significant to the fair value measurement. As of June 30, 2017, the aggregate value by input level of the Portfolio’s assets and liabilities is included at the end of the Portfolio’s Portfolio of Investments.
The Portfolio may use third party vendor evaluations, whose prices may be derived from one or more of the following standard inputs, among others:
| | |
• Benchmark yields | | • Reported trades |
• Broker/dealer quotes | | • Issuer spreads |
• Two-sided markets | | • Benchmark securities |
• Bids/offers | | • Reference data (corporate actions or material event notices) |
• Industry and economic events | | • Comparable bonds |
• Monthly payment information | | |
An asset or liability for which market values cannot be measured using the methodologies described above is valued by methods deemed reasonable in good faith by the Valuation Committee, following the procedures established by the Board, to represent fair value. Under these procedures, the Portfolio generally uses a market-based approach which may use related or comparable assets or liabilities, recent transactions, market multiples, book values, and other relevant information. The Portfolio may also use an income-based valuation approach in which the anticipated future cash flows of the asset or liability are discounted to calculate fair value. Discounts may also be applied due to the nature and/or duration of any restrictions on the disposition of the asset or liability. Fair value represents a good faith approximation of the value of a security. Fair value determinations involve the consideration of a number of subjective factors, an analysis of applicable facts and circumstances and the exercise of judgment. As a result, it is possible that the fair value for a security determined in good faith in accordance with the Portfolio’s valuation procedures may differ from valuations for the same security determined by other funds using their own valuation procedures. Although the Portfolio’s valuation procedures are designed to value a security at the price the Portfolio may reasonably expect to receive upon the security’s sale in an orderly transaction, there can be no assurance that any fair value determination thereunder would, in fact, approximate the amount that the Portfolio would actually realize upon the sale of the security or the price at which the security would trade if a reliable market price were readily available. During the six-month period ended June 30, 2017, there were no material changes to the fair value methodologies.
Securities which may be valued in this manner include, but are not limited to: (i) a security for which trading has been halted or suspended; (ii) a debt security that has recently gone into default and for which there is not a current market quotation; (iii) a security of an issuer that has entered into a restructuring; (iv) a security that has been de-listed
from a national exchange; (v) a security for which the market price is not readily available from a third party pricing source or, if so provided, does not, in the opinion of the Manager or Subadvisor, reflect the security’s market value; (vi) a security subject to trading collars for which no or limited trading takes place; and (vii) a security whose principal market has been temporarily closed at a time when, under normal conditions, it would be open. Securities for which market quotations or observable inputs are not readily available are generally categorized as Level 3 in the hierarchy. As of June 30, 2017, a security that was fair valued in such a manner is shown in the Portfolio of Investments.
Futures contracts are valued at the last posted settlement price on the market where such futures are primarily traded. Investments in mutual funds, including money market funds, are valued at their respective NAVs as of the close of the Exchange on the valuation date. These securities are generally categorized as Level 1 in the hierarchy.
Debt securities (other than convertible and municipal bonds) are valued at the evaluated bid prices (evaluated mean prices in the case of convertible and municipal bonds) supplied by a pricing agent or brokers selected by the Manager, in consultation with the Subadvisor. Those values reflect broker/dealer supplied prices and electronic data processing techniques, if the evaluated bid or mean prices are deemed by the Manager, in consultation with the Subadvisor, to be representative of market values at the regular close of trading of the Exchange on each valuation date. Debt securities purchased on a delayed delivery basis are marked to market daily until settlement at the forward settlement date. Debt securities, including corporate bonds, U.S. government & federal agency bonds, municipal bonds, foreign bonds, convertible bonds, asset-backed securities and mortgage-backed securities are generally categorized as Level 2 in the hierarchy.
Temporary cash investments acquired in excess of 60 days to maturity at the time of purchase are valued using the latest bid prices or using valuations based on a matrix system (which considers such factors as security prices, yields, maturities, and ratings), both as furnished by independent pricing services. Other temporary cash investments which mature in 60 days or less at the time of purchase (“Short-Term Investments”) are valued using the amortized cost method of valuation, unless the use of such method would be inappropriate. The amortized cost method involves valuing a security at its cost on the date of purchase and thereafter assuming a constant amortization to maturity of the difference between such cost and the value on maturity date. Amortized cost approximates the current fair value of a security. Securities valued using the amortized cost method are not valued using quoted prices in an active market and are generally categorized as Level 2 in the hierarchy.
The information above is not intended to reflect an exhaustive list of the methodologies that may be used to value portfolio investments. The valuation procedures permit the use of a variety of valuation methodologies in connection with valuing portfolio investments. The methodology used for a specific type of investment may vary based on the market data available or other considerations. The methodologies summarized above may not represent the specific means by which portfolio investments are valued on any particular business day.
A portfolio security or other asset may be determined to be illiquid under procedures approved by the Board. Illiquidity of a security might prevent
Notes to Financial Statements (Unaudited) (continued)
the sale of such security at a time when the Manager or Subadvisor might wish to sell, and these securities could have the effect of decreasing the overall level of the Portfolio’s liquidity. Further, the lack of an established secondary market may make it more difficult to value illiquid securities, requiring the Portfolio to rely on judgments that may be somewhat subjective in measuring value, which could vary materially from the amount that the Portfolio could realize upon disposition. Difficulty in selling illiquid securities may result in a loss or may be costly to the Portfolio. Under the supervision of the Board, the Manager or Subadvisor determines the liquidity of the Portfolio’s investments; in doing so, the Manager or Subadvisor may consider various factors, including (i) the frequency of trades and quotations, (ii) the number of dealers and prospective purchasers, (iii) dealer undertakings to make a market, and (iv) the nature of the security and the market in which it trades (e.g., the time needed to dispose of the security, the method of soliciting offers and the mechanics of transfer). Illiquid securities are often valued in accordance with methods deemed by the Board in good faith to be reasonable and appropriate to accurately reflect their fair value. The liquidity of the Portfolio’s investments, as shown in the Portfolio of Investments and was determined as of June 30, 2017 and can change at any time in response to, among other relevant factors, market conditions or events or developments with respect to an individual issuer or instrument. As of June 30, 2017, securities deemed to be illiquid under procedures approved by the Board are shown in the Portfolio of Investments.
(B) Income Taxes. The Portfolio’s policy is to comply with the requirements of the Internal Revenue Code of 1986, as amended (the “Internal Revenue Code”), applicable to regulated investment companies and to distribute all of its taxable income to the shareholders of the Portfolio within the allowable time limits. Therefore, no federal, state and local income tax provisions are required.
Management evaluates the Portfolio’s tax positions to determine if the tax positions taken meet the minimum recognition threshold in connection with accounting for uncertainties in income tax positions taken or expected to be taken for the purposes of measuring and recognizing tax liabilities in the financial statements. Recognition of tax benefits of an uncertain tax position is permitted only to the extent the position is “more likely than not” to be sustained assuming examination by taxing authorities. Management has analyzed the Portfolio’s tax positions taken on federal, state and local income tax returns for all open tax years (for up to three tax years), and has concluded that no provisions for federal, state and local income tax are required in the Portfolio’s financial statements. The Portfolio’s federal, state and local income and federal excise tax returns for tax years for which the applicable statutes of limitations have not expired are subject to examination by the Internal Revenue Service and state and local departments of revenue.
(C) Dividends and Distributions to Shareholders. Dividends and distributions are recorded on the ex-dividend date. The Portfolio intends to declare and pay dividends from net investment income and distributions from net realized capital and currency gains, if any, at least annually. All dividends and distributions are reinvested in the same class of shares of the Portfolio, at NAV. Dividends and distributions to shareholders are determined in accordance with federal income tax regulations and may differ from GAAP.
(D) Security Transactions and Investment Income. The Portfolio records security transactions on the trade date. Realized gains and losses on security transactions are determined using the identified cost method. Interest income is accrued as earned using the effective interest rate method and includes any realized gains and losses from repayments of principal on mortgage-backed securities. Discounts and premiums on securities purchased, other than Short-Term Investments, for the Portfolio are accreted and amortized, respectively, on the effective interest rate method over the life of the respective securities. Discounts and premiums on Short-Term Investments are accreted and amortized, respectively, on the straight-line method. The straight-line method approximates the effective interest method for Short-Term Investments.
Investment income and realized and unrealized gains and losses on investments of the Portfolio are allocated pro rata to the separate classes of shares based upon their relative net assets on the date the income is earned or realized and unrealized gains and losses are incurred.
The Portfolio may place a debt security on non-accrual status and reduce related interest income by ceasing current accruals and writing off all or a portion of any interest receivables when the collection of all or a portion of such interest has become doubtful. A debt security is removed from non-accrual status when the issuer resumes interest payments or when collectability of interest is reasonably assured.
(E) Expenses. Expenses of the Fund are allocated to the individual Portfolios in proportion to the net assets of the respective Portfolios when the expenses are incurred, except where direct allocations of expenses can be made. Expenses (other than fees incurred under the distribution and service plans, further discussed in Note 3(B), which are charged directly to the Service Class shares) are allocated to separate classes of shares pro rata based upon their relative net assets on the date the expenses are incurred. The expenses borne by the Portfolio, including those of related parties to the Portfolio, are shown in the Statement of Operations.
(F) Use of Estimates. In preparing financial statements in conformity with GAAP, management makes estimates and assumptions that affect the reported amounts and disclosures in the financial statements. Actual results could differ from those estimates.
(G) Repurchase Agreements. The Portfolio may enter into repurchase agreements (i.e., buy a security from another party with the agreement that it be sold back in the future) to earn income. The Portfolio may enter into repurchase agreements only with counterparties, usually financial institutions, that are deemed by the Manager or Subadvisor to be creditworthy, pursuant to guidelines established by the Board. During the term of any repurchase agreement, the Manager or Subadvisor will continue to monitor the creditworthiness of the counterparty. Under the 1940 Act, repurchase agreements are considered to be collateralized loans by the Portfolio to the counterparty secured by the securities transferred to the Portfolio.
Repurchase agreements are subject to counterparty risk, meaning the Portfolio could lose money by the counterparty’s failure to perform under the terms of the agreement. The Portfolio mitigates this risk by ensuring the repurchase agreement is collateralized by cash, U.S. government securities, fixed income securities and/or other securities.
| | |
| 22 | | MainStay VP Government Portfolio |
The collateral is held by the Portfolio’s custodian and valued daily on a mark to market basis to determine if the value, including accrued interest, exceeds the repurchase price. In the event of the counterparty’s default on the obligation to repurchase, the Portfolio has the right to liquidate the collateral and apply the proceeds in satisfaction of the obligation. Under certain circumstances, such as in the event of default or bankruptcy by the counterparty, realization and/or retention of the collateral may be limited or subject to delay, to legal proceedings and possible realized loss to the Portfolio.
(H) Futures Contracts. A futures contract is an agreement to purchase or sell a specified quantity of an underlying instrument at a specified future date and price, or to make or receive a cash payment based on the value of a financial instrument (e.g., foreign currency, interest rate, security, or securities index). The Portfolio is subject to risks such as market price risk and/or interest rate risk in the normal course of investing in these transactions. Upon entering into a futures contract, the Portfolio is required to pledge to the broker or futures commission merchant an amount of cash and/or U.S. Government securities equal to a certain percentage of the collateral amount, known as the “initial margin.” During the period the futures contract is open, changes in the value of the contract are recognized as unrealized appreciation or depreciation by marking to market such contract on a daily basis to reflect the market value of the contract at the end of each day’s trading. The Portfolio agrees to receive from or pay to the broker or futures commission merchant an amount of cash equal to the daily fluctuation in the value of the contract. Such receipts or payments are known as “variation margin.” When the futures contract is closed, the Portfolio records a realized gain or loss equal to the difference between the proceeds from (or cost of) the closing transaction and the Portfolio’s basis in the contract.
The use of futures contracts involves, to varying degrees, elements of market risk in excess of the amount recognized in the Statement of Assets and Liabilities. The contract or notional amounts and variation margin reflect the extent of the Portfolio’s involvement in open futures positions. There are several risks associated with the use of futures contracts as hedging techniques. There can be no assurance that a liquid market will exist at the time when the Portfolio seeks to close out a futures contract. If no liquid market exists, the Portfolio would remain obligated to meet margin requirements until the position is closed. Futures may involve a small initial investment relative to the risk assumed, which could result in losses greater than if they had not been used. Futures may be more volatile than direct investments in the instrument underlying the futures, and may not correlate to the underlying instrument, causing a given hedge not to achieve its objectives. The Portfolio’s activities in futures contracts have minimal counterparty risk as they are conducted through regulated exchanges that guarantee the futures against default by the counterparty. In the event of a bankruptcy or insolvency of a futures commission merchant that holds margin on behalf of the Portfolio, the Portfolio may not be entitled to the return of the entire margin owed to the Portfolio, potentially resulting in a loss. The Portfolio’s investment in futures contracts and other derivatives may increase the volatility of the Portfolio’s NAV and may result in a loss to the Portfolio. As of June 30, 2017, all open futures contracts are shown in the Portfolio of Investments.
(I) Dollar Rolls. The Portfolio may enter into dollar roll transactions in which it sells mortgage-backed securities (“MBS”) from its portfolio to
a counterparty from whom it simultaneously agrees to buy a similar security on a delayed delivery basis. The Portfolio generally transfers MBS where the MBS are “to be announced,” therefore, the Portfolio accounts for these transactions as purchases and sales.
The securities sold in connection with the dollar rolls are removed from the portfolio and a realized gain or loss is recognized. The securities the Portfolio has agreed to acquire are included at market value in the Portfolio of Investments and liabilities for such purchase commitments are included as payables for investments purchased. During the roll period, the Portfolio foregoes principal and interest paid on the securities. The Portfolio is compensated by the difference between the current sales price and the forward price for the future as well as by the earnings on the cash proceeds of the initial sale. Dollar rolls may be renewed without physical delivery of the securities subject to the contract. The Portfolio maintains liquid assets from its portfolio having a value not less than the repurchase price, including accrued interest. Dollar roll transactions involve certain risks, including the risk that the securities returned to the Portfolio at the end of the roll period, while substantially similar, could be inferior to what was initially sold to the counterparty.
The Portfolio accounts for a dollar roll transaction as a purchase and sale whereby the difference in the sales price and purchase price of the security sold is recorded as a realized gain (loss).
(J) Securities Lending. In order to realize additional income, the Portfolio may engage in securities lending, subject to the limitations set forth in the 1940 Act and relevant guidance by the staff of the Securities and Exchange Commission (“SEC”). In the event the Portfolio does engage in securities lending, the Portfolio will lend through its custodian, State Street Bank and Trust Company (“State Street”). State Street will manage the Portfolio’s collateral in accordance with the lending agreement between the Portfolio and State Street, and indemnify the Portfolio against counterparty risk. The loans will be collateralized by securities at least equal at all times to the market value of the securities loaned. The Portfolio may bear the risk of delay in recovery of, or loss of rights in, the securities loaned should the borrower of the securities experience financial difficulty. The Portfolio may also record a realized gain or loss on securities deemed sold due to a borrower’s inability to return securities on loan. The Portfolio bears the risk of any loss on investment of the collateral. The Portfolio will receive compensation for lending its securities in the form of fees or it will retain a portion of interest on the investment of any cash received as collateral. The Portfolio will also continue to receive interest and dividends on the securities loaned and any gain or loss in the market price of the securities loaned that may occur during the term of the loan will be for the account of the Portfolio. During the six-month period ended June 30, 2017, the Portfolio did not have any portfolio securities on loan.
(K) Government Risk. Investments in the Portfolio are not guaranteed, even though some of the Portfolio’s underlying investments are guaranteed by the U.S. government or its agencies or instrumentalities. The principal risk of mortgage-related and asset-backed securities is that the underlying debt may be prepaid ahead of schedule, if interest rates fall, thereby reducing the value of the Portfolio’s investment. If interest rates rise, less of the debt may be prepaid and the Portfolio may lose money because the Portfolio may be unable to invest in higher
Notes to Financial Statements (Unaudited) (continued)
yielding assets. The Portfolio is subject to interest-rate risk and can lose principal value when interest rates rise. Bonds are also subject to credit risk, in which the bond issuer may fail to pay interest and principal in a timely manner.
(L) Indemnifications. Under the Fund’s organizational documents, its officers and trustees are indemnified against certain liabilities that may arise out of performance of their duties to the Fund. Additionally, in the normal course of business, the Portfolio enters into contracts with third-party service providers that contain a variety of representations and warranties and which may provide general indemnifications. The Portfolio’s maximum exposure under these arrangements is unknown, as this would involve future claims that may be made against the Portfolio that have not yet occurred. Based on experience, management is of the view that the risk of loss in connection with these potential indemnification obligations is remote. However, there can be no assurance that material liabilities related to such obligations will not arise in the future, which could adversely impact the Portfolio.
(M) Quantitative Disclosure of Derivative Holdings. The following tables show additional disclosures related to the Portfolio’s derivative and hedging activities, including how such activities are accounted for and their effect on the Portfolio’s financial positions, performance and cash flows. The Portfolio entered into futures contracts to help manage the duration and yield curve positioning of the portfolio while minimizing the exposure to wider bid/ask spreads in traditional bonds. These derivatives are not accounted for as hedging instruments.
Fair value of derivative instruments as of June 30, 2017:
Liability Derivatives
| | | | | | | | | | |
| | | Statement of
Assets and
Liabilities
Location | | Interest
Rate
Contracts
Risk | | | Total | |
Futures Contracts | | Net Assets—Net unrealized appreciation (depreciation) on investments and futures contracts (a) | | $ | (19,687 | ) | | $ | (19,687 | ) |
| | | | | | |
Total Fair Value | | $ | (19,687 | ) | | $ | (19,687 | ) |
| | | | | | |
| (a) | Includes cumulative appreciation (depreciation) of futures contracts as reported in the Portfolio of Investments. Only current day’s variation margin is reported within the Statement of Assets and Liabilities. |
The effect of derivative instruments on the Statement of Operations for the six-month period ended June 30, 2017:
Realized Gain (Loss)
| | | | | | | | | | |
| | | Statement of
Operations Location | | Interest
Rate
Contracts
Risk | | | Total | |
Futures Contracts | | Net realized gain (loss)
on futures transactions | | $ | 62,107 | | | $ | 62,107 | |
| | | | | | |
Total Realized Gain (Loss) | | | | $ | 62,107 | | | $ | 62,107 | |
| | | | | | |
Change in Unrealized Appreciation (Depreciation)
| | | | | | | | | | |
| | | Statement of
Operations Location | | Interest
Rate
Contracts
Risk | | | Total | |
Futures Contracts | | Net change in unrealized appreciation (depreciation) on futures transactions | | $ | 11,191 | | | $ | 11,191 | |
| | | | | | |
Total Change in Unrealized Appreciation (Depreciation) | | | | $ | 11,191 | | | $ | 11,191 | |
| | | | | | |
Average Notional Amount
| | | | | | | | | | |
| | | | | Interest
Rate
Contracts
Risk | | | Total | |
Futures Contracts Long | | | | $ | 8,140,293 | | | $ | 8,140,293 | |
| | | | | | |
Note 3–Fees and Related Party Transactions
(A) Manager and Subadvisor. New York Life Investments, a registered investment adviser and an indirect, wholly-owned subsidiary of New York Life, serves as the Portfolio’s Manager pursuant to an Amended and Restated Management Agreement (“Management Agreement”). The Manager provides offices, conducts clerical, recordkeeping and bookkeeping services, and keeps most of the financial and accounting records required to be maintained by the Portfolio. Except for the portion of salaries and expenses that are the responsibility of the Portfolio, the Manager pays the salaries and expenses of all personnel affiliated with the Portfolio and certain operational expenses of the Portfolio. The Portfolio reimburses New York Life Investments in an amount equal to a portion of the compensation of the Chief Compliance Officer attributable to the Portfolio. MacKay Shields LLC (“MacKay Shields” or “Subadvisor”), a registered investment adviser and an indirect, wholly-owned subsidiary of New York Life, serves as Subadvisor to the Portfolio and is responsible for the day-to-day portfolio management of the Portfolio. Pursuant to the terms of a Subadvisory Agreement (“Subadvisory Agreement”) between New York Life Investments and MacKay Shields, New York Life Investments pays for the services of the Subadvisor.
The Fund, on behalf of the Portfolio, pays New York Life Investments in its capacity as the Portfolio’s investment manager and administrator, pursuant to the Management Agreement, a monthly fee for the services performed and facilities furnished at an annual rate of the Portfolio’s average daily net assets as follows: 0.50% up to $500 million; 0.475% from $500 million to $1 billion; and 0.45% in excess of $1 billion. During the six-month period ended June 30, 2017, the effective management fee rate was 0.50%.
During the six-month period ended June 30, 2017, New York Life Investments earned fees from the Portfolio in the amount of $584,990.
State Street provides sub-administration and sub-accounting services to the Portfolio pursuant to an agreement with New York Life Investments. These services include calculating the daily NAVs of the Portfolio, maintaining the general ledger and sub-ledger accounts for the calculation of the Portfolio’s NAVs, and assisting New York Life Investments
| | |
| 24 | | MainStay VP Government Portfolio |
in conducting various aspects of the Portfolio’s administrative operations. For providing these services to the Portfolio, State Street is compensated by New York Life Investments.
(B) Distribution and Service Fees. The Fund, on behalf of the Portfolio, has entered into a distribution agreement with NYLIFE Distributors LLC (the “Distributor”), an indirect, wholly-owned subsidiary of New York Life. The Portfolio has adopted a distribution plan (the “Plan”) in accordance with the provisions of Rule 12b-1 under the 1940 Act. Under the Plan, the Distributor has agreed to provide, through its affiliates or independent third parties, various distribution-related, shareholder and administrative support services to the Service Class shareholders. For its services, the Distributor is entitled to a combined distribution and service fee accrued daily and paid monthly at an annual rate of 0.25% of the average daily net assets attributable to the Service Class shares of the Portfolio.
Note 4–Federal Income Tax
As of December 31, 2016, for federal income tax purposes, capital loss carryforwards of $2,745,571, as shown in the table below, were available to the extent provided by the regulations to offset future realized gains of the Portfolio through the years indicated. Accordingly, no capital gains distributions are expected to be paid to shareholders until net gains have been realized in excess of such amounts.
| | | | |
Capital Loss
Available through | | Short-Term
Amounts (000’s) | | Long-Term
Amounts (000’s) |
| Unlimited | | $1,232 | | $1,514 |
During the year ended December 31, 2016, the tax character of distributions paid as reflected in the Statement of Changes in Net Assets was as follows:
| | |
| 2016 |
Tax-Based
Distributions
from
Ordinary Income | | Tax-Based
Distributions
from Long-Term
Gains |
| $6,106,890 | | $— |
Note 5–Custodian
State Street is the custodian of cash and securities held by the Portfolio. Custodial fees are charged to the Portfolio based on the Portfolio’s net assets and/or the market value of securities held by the Portfolio and the number of certain transactions incurred by the Portfolio.
Note 6–Line of Credit
The Portfolio and certain other funds managed by New York Life Investments, maintain a line of credit with a syndicate of banks in order to secure a source of funds for temporary purposes to meet unanticipated or excessive redemption requests.
Effective August 1, 2017, under the credit agreement (the “Credit Agreement”), the aggregate commitment amount is $600,000,000 with an additional uncommitted amount of $100,000,000. The commitment fee is an annual rate of 0.15% of the average commitment amount payable quarterly, regardless of usage, to State Street, who serves as
the agent to the syndicate. The commitment fee is allocated among the Portfolio and certain other funds managed by New York Life Investments based upon their respective net assets and other factors. Interest on any revolving credit loan is charged based upon the Federal Funds Rate or the one month LIBOR, whichever is higher. The Credit Agreement expires on July 31, 2018, although the Portfolio, certain other funds managed by New York Life Investments and the syndicate of banks may renew the Credit Agreement for an additional year on the same or different terms. Prior to August 1, 2017, the aggregate commitment amount was $600,000,000 with an additional uncommitted amount of $100,000,000, and the commitment fee, under a credit agreement for which Bank of New York Mellon served as agent, was at an annual rate of 0.15% of the average commitment amount. During the six-month period ended June 30, 2017, there were no borrowings made or outstanding with respect to the Portfolio under the credit agreement for which Bank of New York Mellon served as agent.
Note 7–Interfund Lending Program
Pursuant to an exemptive order issued by the SEC, the Portfolio, along with certain other funds managed by New York Life Investments, may participate in an interfund lending program. The interfund lending program provides an alternative credit facility that permits the Portfolio and certain other funds managed by New York Life Investments to lend or borrow money for temporary purposes directly to or from one another subject to the conditions of the exemptive order. During the six-month period ended June 30, 2017, there were no interfund loans made or outstanding with respect to the Portfolio.
Note 8–Purchases and Sales of Securities (in 000’s)
During the six-month period ended June 30, 2017, purchases and sales of U.S. government securities were $10,526 and $37,292, respectively. Purchases and sales of securities, other than U.S. government securities and short-term securities, were $1,339 and $1,592, respectively.
Note 9–Capital Share Transactions
Transactions in capital shares for the six-month period ended June 30, 2017, and the year ended December 31, 2016, were as follows:
| | | | | | | | |
Initial Class | | Shares | | | Amount | |
Six-month period ended June 30, 2017: | | | | | | | | |
Shares sold | | | 76,393 | | | $ | 832,741 | |
Shares redeemed | | | (564,163 | ) | | | (6,162,954 | ) |
| | | | |
Net increase (decrease) | | | (487,770 | ) | | $ | (5,330,213 | ) |
| | | | |
Year ended December 31, 2016: | | | | | | | | |
Shares sold | | | 701,525 | | | $ | 7,830,148 | |
Shares issued to shareholders in reinvestment of dividends and distributions | | | 148,846 | | | | 1,653,503 | |
Shares redeemed | | | (1,499,193 | ) | | | (16,706,781 | ) |
| | | | |
Net increase (decrease) | | | (648,822 | ) | | $ | (7,223,130 | ) |
| | | | |
|
| |
Notes to Financial Statements (Unaudited) (continued)
| | | | | | | | |
Service Class | | Shares | | | Amount | |
Six-month period ended June 30, 2017: | | | | | | | | |
Shares sold | | | 714,235 | | | $ | 7,718,818 | |
Shares redeemed | | | (2,982,984 | ) | | | (32,228,090 | ) |
| | | | |
Net increase (decrease) | | | (2,268,749 | ) | | $ | (24,509,272 | ) |
| | | | |
Year ended December 31, 2016: | | | | | | | | |
Shares sold | | | 5,768,670 | | | $ | 64,040,628 | |
Shares issued to shareholders in reinvestment of dividends and distributions | | | 404,060 | | | | 4,453,387 | |
Shares redeemed | | | (5,208,256 | ) | | | (57,378,319 | ) |
| | | | |
Net increase (decrease) | | | 964,474 | | | $ | 11,115,696 | |
| | | | |
Note 10–Recent Accounting Pronouncement
In October 2016, the SEC adopted new rules and amended existing rules (together, “final rules”) intended to modernize the reporting and disclosure of information by registered investment companies. In part, the final rules amend Regulation S-X and require standardized,
enhanced disclosure about derivatives in investment company financial statements, as well as other amendments. The compliance date for the amendments to Regulation S-X is August 1, 2017 and applies to shareholder reports for funds with fiscal periods ending after August 1, 2017. Management is currently evaluating the impact that the adoption of the amendments to Regulation S-X will have on the Portfolio’s financial statements and related disclosures.
Note 11–Subsequent Events
In connection with the preparation of the financial statements of the Portfolio as of and for the six-month period ended June 30, 2017, events and transactions subsequent to June 30, 2017, through the date the financial statements were issued have been evaluated by the Portfolio’s management for possible adjustment and/or disclosure. No subsequent events requiring financial statement adjustment or disclosure have been identified.
| | |
| 26 | | MainStay VP Government Portfolio |
Proxy Voting Policies and Procedures and Proxy Voting Record
A description of the policies and procedures that New York Life Investments uses to vote proxies related to the Portfolio’s securities is available without charge, upon request, (i) by calling 800-598-2019 or (ii) by visiting the SEC’s website at www.sec.gov.
The Portfolio is required to file with the SEC its proxy voting record for the 12-month period ending June 30 on Form N-PX. The Portfolio’s most recent Form N-PX or proxy voting record is available free of charge upon request (i) by calling 800-598-2019 or; (ii) by visiting the SEC’s website at www.sec.gov.
Shareholder Reports and Quarterly Portfolio Disclosure
The Portfolio is required to file its complete schedule of portfolio holdings with the SEC for its first and third fiscal quarters on Form N-Q. The Portfolio’s Form N-Q is available without charge on the SEC’s website at www.sec.gov or by calling MainStay Investments at 800-598-2019. You also can obtain and review copies of Form N-Q by visiting the SEC’s Public Reference Room in Washington, DC (information on the operation of the Public Reference Room may be obtained by calling 1-800-SEC-0330).
This page intentionally left blank
This page intentionally left blank
This page intentionally left blank
MainStay VP Portfolios
MainStay VP offers a wide range of Portfolios. The full array of MainStay VP offerings is listed here, with information about the manager, subadvisors, legal counsel, and independent registered public accounting firm.
Equity Portfolios
MainStay VP Common Stock Portfolio
MainStay VP Cornerstone Growth Portfolio
MainStay VP Eagle Small Cap Growth Portfolio
MainStay VP Emerging Markets Equity Portfolio
MainStay VP Epoch U.S. Equity Yield Portfolio
MainStay VP Epoch U.S. Small Cap Portfolio
MainStay VP International Equity Portfolio
MainStay VP Large Cap Growth Portfolio
MainStay VP MFS® Utilities Portfolio
MainStay VP Mid Cap Core Portfolio
MainStay VP S&P 500 Index Portfolio
MainStay VP Small Cap Core Portfolio
MainStay VP T. Rowe Price Equity Income Portfolio
MainStay VP VanEck Global Hard Assets Portfolio
Mixed Asset Portfolios
MainStay VP Balanced Portfolio
MainStay VP Convertible Portfolio
MainStay VP Cushing Renaissance Advantage Portfolio
MainStay VP Income Builder Portfolio
MainStay VP Janus Henderson Balanced Portfolio
Income Portfolios
MainStay VP Bond Portfolio
MainStay VP Floating Rate Portfolio
MainStay VP Government Portfolio
MainStay VP High Yield Corporate Bond Portfolio
MainStay VP Indexed Bond Portfolio
MainStay VP PIMCO Real Return Portfolio
MainStay VP Unconstrained Bond Portfolio
Money Market
MainStay VP U.S. Government Money Market Portfolio
Alternative
MainStay VP Absolute Return Multi-Strategy Portfolio
Asset Allocation Portfolios
MainStay VP Conservative Allocation Portfolio
MainStay VP Growth Allocation Portfolio
MainStay VP Moderate Allocation Portfolio
MainStay VP Moderate Growth Allocation Portfolio
Manager
New York Life Investment Management LLC
New York, New York
Subadvisors
Candriam Belgium*
Brussels, Belgium
Candriam France S.A.S.*
Paris, France
Cornerstone Capital Management Holdings LLC*
New York, New York
Cushing Asset Management, LP
Dallas, Texas
Eagle Asset Management, Inc.
St Petersburg, Florida
Epoch Investment Partners, Inc.
New York, New York
Janus Capital Management LLC
Denver, Colorado
MacKay Shields LLC*
New York, New York
Massachusetts Financial Services Company
Boston, Massachusetts
NYL Investors LLC*
New York, New York
Pacific Investment Management Company LLC
Newport Beach, California
T. Rowe Price Associates, Inc.
Baltimore, Maryland
Van Eck Associates Corporation
New York, New York
Winslow Capital Management, LLC
Minneapolis, Minnesota
Distributor
NYLIFE Distributors LLC*
Jersey City, New Jersey
Custodian
State Street Bank and Trust Company
Boston, Massachusetts
Independent Registered Public Accounting Firm
PricewaterhouseCoopers LLP
New York, New York
Legal Counsel
Dechert LLP
Washington, District of Columbia
Some Portfolios may not be available in all products.
* An affiliate of New York Life Investment Management LLC
Not part of the Semiannual Report
2017 Semiannual Report
This report is for the general information of New York Life Variable Annuities and NYLIAC Variable Universal Life Insurance Products policyowners. It must be preceded or accompanied by the appropriate product(s) and funds prospectuses if it is given to anyone who is not an owner of a New York Life variable annuity policy or a NYLIAC Variable Universal Life Insurance Product. This report does not offer for sale or solicit orders to purchase securities.
The performance data quoted in this report represents past performance. Past performance is no guarantee of future results. Due to market volatility and other factors, current performance may be lower or higher than the figures shown. The most recent month-end performance summary for your variable annuity or variable life policy is available by calling 800-598-2019 and is updated periodically on www.newyorklife.com.
The New York Life Variable Annuities and NYLIAC Variable Universal Life Insurance Products are issued by New York Life Insurance and Annuity Corporation (a Delaware Corporation) and distributed by NYLIFE Distributors LLC (Member FINRA/SIPC).
New York Life Insurance Company
New York Life Insurance and Annuity Corporation (NYLIAC) (A Delaware Corporation)
51 Madison Avenue, Room 551
New York, NY 10010
www.newyorklife.com
Printed on recycled paper
mainstayinvestments.com
NYLIFE Distributors LLC, 30 Hudson Street, Jersey City, NJ 07302
New York Life Investment Management LLC is the investment manager to the MainStay VP Funds Trust
©2017 by NYLIFE Distributors LLC. All rights reserved.
You may obtain copies of the Prospectus and the Statement of Additional Information free of charge, upon request, by calling toll-free 800-598-2019 or writing to New York Life Insurance and Annuity Corporation, 51 Madison Avenue, New York, NY 10010.
| | | | |
| Not FDIC Insured | | No Bank Guarantee | | May Lose Value |
| | | | |
| 1743292 | | | | MSVPG10-08/17 (NYLIAC) NI519 |
MainStay VP U.S. Government Money Market Portfolio
Message from the President and Semiannual Report
Unaudited | June 30, 2017

Sign up for electronic delivery of your shareholder reports. For full details on electronic delivery, including who can participate and what you
can receive via eDelivery, please log on to www.newyorklife.com/vsc

This page intentionally left blank
Message from the President
The six months ended June 30, 2017, brought positive results to many stock and bond investors. The year began with many investors hoping that Republican control of the White House, the Senate and the House of Representatives could bring an end to political gridlock; and while debate has continued on a number of issues, the U.S. stock market climbed relatively steadily throughout the first half of 2017.
According to FTSE-Russell U.S. market data, stocks at all capitalization levels tended to record positive total returns during the reporting period, with large-cap stocks generally outperforming stocks of smaller-capitalization companies. Growth stocks outpaced value stocks at every capitalization level by substantial margins—from more than six percentage points for micro-caps and mid-caps to more than 10 percentage points for the largest 200 U.S. companies by market capitalization.
Most sectors of the stock market advanced during the reporting period, with energy and telecommunication services being notable exceptions. Energy stocks declined as oil prices fell despite moves by the Organization of Petroleum Exporting Countries (OPEC) intended to limit oil production by its members. Telecommunication services stocks tended to decline as competition increased and rising interest rates made dividend payouts less appealing.
In March and June of 2017, the Federal Reserve announced successive increases in the target range for the federal funds rate, ultimately bringing the federal funds target range to 1.00% to 1.25%. While short-term U.S. Treasury yields rose in response, yields for U.S. Treasury securities with maturities of five years or longer declined. As the difference between short- and long-term yields narrowed, the advantages of higher-yielding long-term bonds became increasingly apparent.
Virtually all taxable and tax-exempt bond sectors provided positive total returns during the reporting period. Mortgage-backed
securities, though providing positive total returns, faced headwinds when the Federal Reserve announced plans to begin normalizing its balance sheet by reducing reinvestment of principal payments on mortgage-backed securities.
International stock and bond markets were also strong during the reporting period. International stocks provided double-digit total returns that were surpassed by emerging-market stocks as a whole. Global investment-grade bonds provided single-digit returns; and emerging-market debt was somewhat stronger.
Even during periods of favorable market performance and generally positive returns, MainStay believes that it is important to carefully monitor your investments. Your risk tolerance may
change over time, leading you to reevaluate which MainStay VP Portfolios are most appropriate for your long-term goals. Your goals themselves may also change, leading you to pursue investments with more or less risk. The portfolio managers of MainStay VP Portfolios seek to provide results consistent with the investment objectives of their respective Portfolios, to give you a wide range of choices suitable to various investment needs.
The report that follows provides more detailed information about the specific markets, securities and investment decisions that influenced your MainStay VP Portfolio during the six months ended June 30, 2017. We invite you to review the report carefully as part of your ongoing investment evaluation and review.
Sincerely,

Stephen P. Fisher
President
The opinions expressed are as of the date of the accompanying report and are subject to change. Past performance is no guarantee of future results. There is no guarantee that any forecasts made will come to pass. This material does not constitute investment advice and is not intended as an endorsement of any specific investment.
Not all MainStay VP Portfolios and/or share classes are available under all policies.
Not part of the Semiannual Report
Table of Contents
An investment in the Portfolio is not insured or guaranteed by the Federal Deposit Insurance Corporation or any other government agency. Although the Portfolio seeks to preserve the value of your investment at $1.00 per share, it cannot guarantee it will do so. You could lose money by investing in the Portfolio. The Portfolio’s sponsor has no legal obligation to provide financial support to the Portfolio, and you should not expect that the sponsor will provide financial support to the Portfolio at any time.
Investors should refer to the Portfolio’s Summary Prospectus and/or Prospectus and consider the Portfolio’s investment objectives, strategies, risks, charges and expenses carefully before investing. The Summary Prospectus and/or Prospectus contain this and other information about the Portfolio. You may obtain copies of the Portfolio’s Summary Prospectus and/or the Prospectus and the Statement of Additional Information free of charge, upon request, by calling toll-free 800-598-2019, by writing to New York Life Insurance and Annuity Corporation, 51 Madison Avenue, Room 251, New York, New York 10010 or by sending an email to MainStayShareholdersServices@nylim.com. These documents are also available at mainstayinvestments.com/vpdocuments. Please read the Summary Prospectus and/or Prospectus carefully before investing. MainStay VP Funds Trust portfolios are separate account options which are purchased through a variable insurance or variable annuity contract.
Investment and Performance Comparison1 (Unaudited)
Performance data quoted represents past performance. Past performance is no guarantee of future results. Because of market volatility and other factors, current performance may be lower or higher than the figures shown. Investment return and principal value will fluctuate, and as a result, when shares are redeemed, they may be worth more or less than their original cost. The performance table and graph do not reflect any deduction for separate account or policy fees or charges imposed under the variable annuity policies and variable universal life insurance policies for which the Portfolio is an investment option. Please refer to the Performance Summary appropriate for your policy. For performance information current to the most recent month-end, please call 800-598-2019 or visit www.newyorklife.com.
An investment in the Portfolio is not insured or guaranteed by the Federal Deposit Insurance Corporation or any other government agency. Although the Portfolio seeks to preserve the value of your investment at $1.00 per share, it is possible to lose money by investing in the Portfolio.
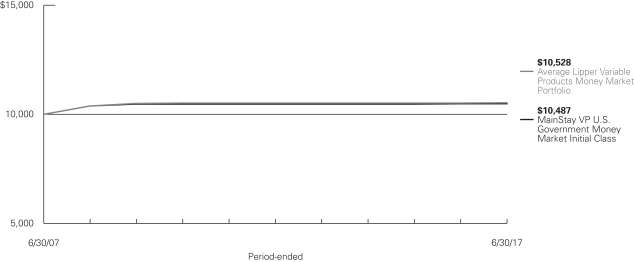
Average Annual Total Returns for the Period Ended June 30, 2017
| | | | | | | | | | | | | | | | |
| Class | | Inception Date | | Six Months | | One Year | | Five Years | | Ten Years | | | Gross
Expense
Ratio2 | |
| Initial Class Shares | | 1/29/1993 | | 0.10% | | 0.11% | | 0.03% | | | 0.47 | % | | | 0.44 | % |
| | | |
| 7-Day Current Yield: 0.53%3 | | | | | | | | | | |
| | | | | | | | | | | | | | | | |
| Benchmark Performance | | Six
Months | | | One
Year | | | Five
Years | | | Ten
Years | |
Average Lipper Variable Products Money Market Portfolio4 | | | 0.12 | % | | | 0.15 | % | | | 0.04 | % | | | 0.52 | % |
| 1. | Performance figures reflect certain fee waivers and/or expense limitations, without which total returns may have been lower. For information on current fee waivers and/or expense limitations (if any), please refer to the Notes to Financial Statements. |
| 2. | The gross expense ratios presented reflect the Portfolio’s “Total Annual Portfolio Operating Expenses” from the most recent Prospectus and may differ from other expense ratios disclosed in this report. |
| 3. | As of June 30, 2017, MainStay VP U.S. Government Money Market Portfolio had an effective 7-day yield of 0.53% and a 7-day current yield of 0.53%. The current yield is more reflective of the Portfolio’s earnings than the total return. |
| 4. | The Average Lipper Variable Products Money Market Portfolio is an equally weighted performance average adjusted for capital gains distributions and income dividends of all of the money market portfolios in the Lipper Universe, which may include portfolios that do not maintain a stable net asset value of $1.00 per share. This benchmark is a product of Lipper Inc. Lipper Inc. is an independent monitor of fund performance. Results are based on average total returns of similar portfolios with all dividend and capital gain distributions reinvested. |
Cost in Dollars of a $1,000 Investment in MainStay VP U.S. Government Money Market Portfolio (Unaudited)
The example below is intended to describe the fees and expenses borne by shareholders during the six-month period from January 1, 2017 to June 30, 2017, and the impact of those costs on your investment.
Example
As a shareholder of the Portfolio, you incur two types of costs: (1) transaction costs, including exchange fees and sales charges (loads) on purchases (as applicable), and (2) ongoing costs, including management fees, distribution and/or service (12b-1) fees, and other Portfolio expenses (as applicable). This example is intended to help you understand your ongoing costs (in dollars) of investing in the Portfolio and to compare these costs with the ongoing costs of investing in other mutual funds. The example is based on an investment of $1,000 made at the beginning of the six-month period and held for the entire period from January 1, 2017 to June 30, 2017.
This example illustrates your Portfolio’s ongoing costs in two ways:
Actual Expenses
The second and third data columns in the table below provide information about actual account values and actual expenses. You may use the information in these columns, together with the amount you invested, to estimate the expenses that you paid during the six months ended June 30, 2017. Simply divide your account value by $1,000 (for example, an $8,600 account value divided by $1,000 = 8.6), then
multiply the result by the number under the heading entitled “Expenses Paid During Period” to estimate the expenses you paid on your account during this period.
Hypothetical Example for Comparison Purposes
The fourth and fifth data columns in the table below provide information about hypothetical account values and hypothetical expenses based on the Portfolio’s actual expense ratio and an assumed rate of return of 5% per year before expenses, which is not the Portfolio’s actual return. The hypothetical account values and expenses may not be used to estimate the actual ending account balances or expenses you paid for the six-month period shown. You may use this information to compare the ongoing costs of investing in the Portfolio with the ongoing costs of investing in other mutual funds. To do so, compare this 5% hypothetical example with the 5% hypothetical examples that appear in the shareholder reports of the other mutual funds.
Please note that the expenses shown in the table are meant to highlight your ongoing costs only and do not reflect any transactional costs, such as exchange fees or sales charges (loads). Therefore, the fourth and fifth data columns of the table are useful in comparing ongoing costs only and will not help you determine the relative total costs of owning different funds. In addition, if these transactional costs were included, your costs would have been higher.
| | | | | | | | | | | | | | | | | | | | | | | | |
| | | | | | | | | | | | | | | | | | | |
| Share Class | | Beginning
Account
Value
1/1/17 | | | Ending Account
Value (Based
on Actual
Returns and
Expenses)
6/30/17 | | | Expenses
Paid
During
Period1 | | | Ending Account
Value (Based
on Hypothetical
5% Annualized
Return and
Actual Expenses)
6/30/17 | | | Expenses
Paid
During
Period1 | | | Net Expense
Ratio
During
Period2 | |
| | | | | | |
| Initial Class Shares | | $ | 1,000.00 | | | $ | 1,001.00 | | | $ | 2.33 | | | $ | 1,022.50 | | | $ | 2.36 | | | | 0.47 | % |
| 1. | Expenses are equal to the Portfolio’s annualized expense ratio multiplied by the average account value over the period, divided by 365 and multiplied by 181 (to reflect the six-month period). The table above represents the actual expenses incurred during the six-month period. |
| 2. | Expenses are equal to the Portfolio’s annualized expense ratio to reflect the six-month period. |
| | |
| 6 | | MainStay VP U.S. Government Money Market Portfolio |
Portfolio Composition as of June 30, 2017 (Unaudited)

See Portfolio of Investments beginning on page 9 for specific holdings within these categories.
| ‡ | Less than one-tenth of a percent. |
Portfolio Management Discussion and Analysis (Unaudited)
Answers to the questions reflect the views of portfolio managers Thomas J. Girard and David E. Clement, CFA, of NYL Investors LLC, the Portfolio’s Subadvisor.
How did MainStay VP U.S. Government Money Market Portfolio perform relative to its peers during the six months ended June 30, 2017?
As of June 30, 2017, Initial Class shares of MainStay VP U.S. Government Money Market Portfolio provided a 7-day current yield of 0.53% and a 7-day effective yield of 0.53%. For the six months ended June 30, 2017, Initial Class shares of MainStay VP U.S. Government Money Market Portfolio returned 0.10%. The Portfolio underperformed the 0.12% return of the Average Lipper1 Variable Products Money Market Portfolio for the six months ended June 30, 2017. Performance figures for the Portfolio reflect certain fee waivers and/or expense limitations without which total returns may have been lower.
What was the Portfolio’s duration2 strategy during the reporting period?
The Portfolio’s duration target was extended from 30 days at the beginning of the reporting period to 36 days at the end of the reporting period. The duration was extended primarily for two reasons. First, with short-term interest rates rising, longer maturities became more attractive relative to shorter maturities. Second, following the uncertainty in the market caused by the Securities and Exchange Commission’s 2014 money-market fund reforms, which were completed in late 2016, the Portfolio reduced the amount of short-term securities that were held to meet potential redemptions resulting from the reforms.
What specific factors, risks or market forces prompted significant decisions for the Portfolio during the reporting period?
During the reporting period, the primary factor that prompted significant decisions for the Portfolio was the Federal Reserve’s
decision to repeatedly increase the federal funds target range. By the end of the reporting period, the federal funds target range was 1.00% to 1.25%. The rise in short-term rates was one factor that led us to extend the Portfolio’s duration.
During the reporting period, which market segments were the strongest contributors to the Portfolio’s performance and which market segments were particularly weak?
The primary contributors to the Portfolio’s performance during the reporting period were investments in overnight repurchase agreements and U.S. Treasury coupon securities with maturities of 13 months at the time of investment. U.S. Treasury bills continued to find solid demand during the reporting period and were the most liquid securities in the Portfolio, but they were also the lowest-yielding securities in the Portfolio.
Did the Portfolio make any significant purchases or sales during the reporting period?
Among the Portfolio’s significant purchases during the reporting period were a 0.875% U.S. Treasury note due 5/31/18 and a 0.625% U.S. Treasury note due 6/30/18. There were no significant sales during the reporting period.
How did the Portfolio’s sector weightings change during the reporting period?
During the reporting period, the Portfolio increased its weighting in repurchase agreements and decreased its weighting in U.S. Treasury bills.
| 1. | See footnote on page 5 for more information on Lipper Inc. |
| 2. | Duration is a measure of the price sensitivity of a fixed-income investment to changes in interest rates. Duration is expressed as a number of days or years and is considered a more accurate sensitivity gauge than average maturity. |
The opinions expressed are those of the portfolio managers as of the date of this report and are subject to change. There is no guarantee that any forecasts made will come to pass. This material does not constitute investment advice and is not intended as an endorsement of any specific investment.
Not all MainStay VP Portfolios and/or share classes are available under all policies.
| | |
| 8 | | MainStay VP U.S. Government Money Market Portfolio |
Portfolio of Investments June 30, 2017 (Unaudited)
| | | | | | | | |
| | | Principal
Amount | | | Amortized
Cost | |
| Short-Term Investments 100.0%† | |
Government Agency Debt 47.3% | |
Federal Agricultural Mortgage Corp. 1.01%, due 7/5/17 | | $ | 10,000,000 | | | $ | 9,998,911 | |
1.01%, due 7/6/17 | | | 10,000,000 | | | | 9,998,750 | |
1.01%, due 7/7/17 | | | 10,000,000 | | | | 9,998,350 | |
1.01%, due 7/27/17 | | | 10,000,000 | | | | 9,992,597 | |
1.01%, due 7/28/17 | | | 5,000,000 | | | | 4,996,400 | |
1.101%, due 8/1/17 (a) | | | 5,000,000 | | | | 5,000,092 | |
Federal Farm Credit Bank
1.01%, due 7/11/17 | | | 10,000,000 | | | | 9,997,500 | |
1.01%, due 7/6/17 | | | 6,750,000 | | | | 6,749,250 | |
1.01%, due 7/25/17 | | | 10,000,000 | | | | 9,993,400 | |
1.05%, due 9/6/17 | | | 10,000,000 | | | | 9,982,692 | |
1.264%, due 8/29/17 (a) | | | 10,000,000 | | | | 10,000,842 | |
Federal Home Loan Bank
1.004%, due 7/28/17 | | | 15,000,000 | | | | 14,988,863 | |
1.01%, due 7/7/17 | | | 10,000,000 | | | | 9,998,417 | |
1.01%, due 7/14/17 | | | 30,000,000 | | | | 29,989,744 | |
1.04%, due 8/2/17 | | | 10,000,000 | | | | 9,991,111 | |
1.04%, due 8/7/17 | | | 15,000,000 | | | | 14,984,121 | |
1.04%, due 8/15/17 | | | 10,000,000 | | | | 9,987,125 | |
Federal National Mortgage Association 1.01%, due 7/12/17 | | | 8,333,000 | | | | 8,330,963 | |
1.04%, due 8/16/17 | | | 15,000,000 | | | | 14,980,968 | |
1.04%, due 8/23/17 | | | 25,000,000 | | | | 24,963,967 | |
Tennessee Valley Authority
0.984%, due 7/11/17 | | | 10,000,000 | | | | 9,997,306 | |
1.01%, due 7/5/17 | | | 15,000,000 | | | | 14,998,336 | |
| | | | | | | | |
Total Government Agency Debt
(Cost $259,919,705) | | | | 259,919,705 | |
| | | | | | | | |
|
Treasury Debt 20.9% | |
United States Treasury Bills
0.77%, due 7/6/17 | | | 10,000,000 | | | | 9,998,965 | |
0.79%, due 7/13/17 | | | 15,000,000 | | | | 14,996,053 | |
0.79%, due 7/20/17 | | | 15,000,000 | | | | 14,993,508 | |
0.83%, due 7/27/17 | | | 15,000,000 | | | | 14,991,496 | |
United States Treasury Notes
0.625%, due 7/31/17 | | | 5,000,000 | | | | 5,000,063 | |
0.625%, due 8/31/17 | | | 5,000,000 | | | | 5,000,121 | |
0.625%, due 9/30/17 | | | 5,000,000 | | | | 4,999,234 | |
0.625%, due 6/30/18 | | | 5,000,000 | | | | 4,971,751 | |
0.75%, due 10/31/17 | | | 5,000,000 | | | | 5,001,145 | |
0.75%, due 12/31/17 | | | 5,000,000 | | | | 4,995,386 | |
0.75%, due 4/30/18 | | | 5,000,000 | | | | 4,985,215 | |
0.875%, due 11/30/17 | | | 5,000,000 | | | | 4,999,834 | |
0.875%, due 1/31/18 | | | 10,000,000 | | | | 9,997,769 | |
0.875%, due 3/31/18 | | | 5,000,000 | | | | 4,993,899 | |
0.875%, due 5/31/18 | | | 5,000,000 | | | | 4,986,679 | |
| | | | | | | | |
Total Treasury Debt
(Cost $114,911,118) | | | | 114,911,118 | |
| | | | | | | | |
| | | | | | | | |
| | | Principal
Amount | | | Amortized
Cost | |
Treasury Repurchase Agreements 31.8% | |
Bank of America N.A.
1.07%, dated 6/30/17
due 7/3/17
Proceeds at Maturity $50,004,458 (Collateralized by a United States Treasury Note with a rate of 2.125% and a maturity date of 8/15/21, with a Principal Amount of $49,842,000 and a Market Value of $51,000,065) | | $ | 50,000,000 | | | $ | 50,000,000 | |
Bank of Montreal
1.05%, dated 6/30/17
due 7/3/17
Proceeds at Maturity $50,004,375 (Collateralized by United States Treasury securities with rates between 1.50% and 4.75% and maturity dates between 3/31/19 and 2/15/41, with a Principal Amount of $50,024,700 and a Market Value of $51,000,066) | | | 50,000,000 | | | | 50,000,000 | |
RBC Capital Markets
1.05%, dated 6/30/17
due 7/3/17
Proceeds at Maturity $25,002,188 (Collateralized by a United States Treasury securities with rates between 0.00% and 7.25% and maturity dates between 9/28/17 and 2/15/44, with a Principal Amount of $24,510,900 and a Market Value of $25,500,020) | | | 25,000,000 | | | | 25,000,000 | |
Toronto Dominion Bank
1.10%, dated 6/30/17
due 7/3/17
Proceeds at Maturity $49,598,546 (Collateralized by a United States Treasury securities with rates between 1.00% and 6.25% and maturity dates between 11/15/19 and 2/15/40, with a Principal Amount of $43,309,600 and a Market Value of $50,585,926) | | | 49,594,000 | | | | 49,594,000 | |
| | | | | | | | |
Total Treasury Repurchase Agreements
(Cost $174,594,000) | | | | | | | 174,594,000 | |
| | | | | | | | |
Total Short-Term Investments
(Amortized Cost $549,424,823) (b) | | | 100.0 | % | | | 549,424,823 | |
| | | | | | | | |
Other Assets, Less Liabilities | | | (0.0 | )‡ | | | (248,317 | ) |
Net Assets | | | 100.0 | % | | $ | 549,176,506 | |
| † | Percentages indicated are based on Portfolio net assets. |
| ‡ | Less than one-tenth of a percent. |
| (a) | Floating rate—Rate shown was the rate in effect as of June 30, 2017. |
| (b) | The amortized cost also represents the aggregate cost for federal income tax purposes. |
| | | | | | |
The notes to the financial statements are an integral part of,
and should be read in conjunction with, the financial statements. | | | | | 9 | |
Portfolio of Investments June 30, 2017 (Unaudited) (continued)
The following is a summary of the fair valuations according to the inputs used as of June 30, 2017, for valuing the Portfolio’s assets.
Asset Valuation Inputs
| | | | | | | | | | | | | | | | |
Description | | Quoted
Prices in
Active
Markets for
Identical
Assets (Level 1) | | | Significant
Other
Observable
Inputs (Level 2) | | | Significant
Unobservable
Inputs (Level 3) | | | Total | |
| Investments in Securities (a) | | | | | | | | | | | | | | | | |
| Short-Term Investments | | | | | | | | | | | | | | | | |
Government Agency Debt | | $ | — | | | $ | 259,919,705 | | | $ | — | | | $ | 259,919,705 | |
Treasury Debt | | | — | | | | 114,911,118 | | | | — | | | | 114,911,118 | |
Treasury Repurchase Agreements | | | — | | | | 174,594,000 | | | | — | | | | 174,594,000 | |
| | | | | | | | | | | | | | | | |
| Total Investments in Securities | | $ | — | | | $ | 549,424,823 | | | $ | — | | | $ | 549,424,823 | |
| | | | | | | | | | | | | | | | |
| (a) | For a complete listing of investments and their industries, see the Portfolio of Investments. |
The Portfolio recognizes transfers between the levels as of the beginning of the period.
For the period ended June 30, 2017, the Portfolio did not have any transfers among levels. (See Note 2)
As of June 30, 2017, the Portfolio did not hold any investments with significant unobservable inputs (Level 3). (See Note 2)
| | | | |
| 10 | | MainStay VP U.S. Government Money Market Portfolio | | The notes to the financial statements are an integral part of,
and should be read in conjunction with, the financial statements. |
Statement of Assets and Liabilities as of June 30, 2017 (Unaudited)
| | | | |
| Assets | |
Investment in securities, at value
(amortized cost $374,830,823) | | $ | 374,830,823 | |
Repurchase agreements, at value
(amortized cost $174,594,000) | | | 174,594,000 | |
Cash | | | 127 | |
Receivables: | | | | |
Fund shares sold | | | 270,054 | |
Interest | | | 109,541 | |
Other assets | | | 3,699 | |
| | | | |
Total assets | | | 549,808,244 | |
| | | | |
| |
| Liabilities | | | | |
Payables: | | | | |
Fund shares redeemed | | | 336,381 | |
Manager (See Note 3) | | | 190,010 | |
Shareholder communication | | | 57,466 | |
Professional fees | | | 29,673 | |
Custodian | | | 15,715 | |
Trustees | | | 1,188 | |
Accrued expenses | | | 1,224 | |
Dividend payable | | | 81 | |
| | | | |
Total liabilities | | | 631,738 | |
| | | | |
Net assets | | $ | 549,176,506 | |
| | | | |
| |
| Composition of Net Assets | | | | |
Shares of beneficial interest outstanding (par value of $.001 per share) unlimited number of shares authorized | | $ | 549,134 | |
Additional paid-in capital | | | 548,627,848 | |
| | | | |
| | | 549,176,982 | |
Undistributed net investment income | | | 137 | |
Accumulated net realized gain (loss) on investments | | | (613 | ) |
| | | | |
Net assets applicable to outstanding shares | | $ | 549,176,506 | |
| | | | |
Shares of beneficial interest outstanding | | | 549,134,142 | |
| | | | |
Net asset value per share outstanding | | $ | 1.00 | |
| | | | |
| | | | | | |
The notes to the financial statements are an integral part of,
and should be read in conjunction with, the financial statements. | | | | | 11 | |
Statement of Operations for the six months ended June 30, 2017 (Unaudited)
| | | | |
| Investment Income (Loss) | |
Income | | | | |
Interest | | $ | 2,043,460 | |
| | | | |
Expenses | | | | |
Manager (See Note 3) | | | 1,288,387 | |
Shareholder communication | | | 55,142 | |
Professional fees | | | 35,400 | |
Custodian | | | 16,803 | |
Trustees | | | 8,233 | |
Miscellaneous | | | 9,280 | |
| | | | |
Total expenses | | | 1,413,245 | |
| | | | |
Net investment income (loss) | | | 630,215 | |
| | | | |
|
| Realized Gain (Loss) on Investments | |
Net realized gain (loss) on investments | | | 12 | |
| | | | |
Net increase (decrease) in net assets resulting from operations | | $ | 630,227 | |
| | | | |
| | | | |
| 12 | | MainStay VP U.S. Government Money Market Portfolio | | The notes to the financial statements are an integral part of,
and should be read in conjunction with, the financial statements. |
Statements of Changes in Net Assets
for the six months ended June 30, 2017 (Unaudited) and the year ended December 31, 2016
| | | | | | | | |
| | | 2017 | | | 2016 | |
| Increase (Decrease) in Net Assets | |
Operations: | | | | | | | | |
Net investment income (loss) | | $ | 630,215 | | | $ | 122,206 | |
Net realized gain (loss) on investments | | | 12 | | | | (503 | ) |
| | | | |
Net increase (decrease) in net assets resulting from operations | | | 630,227 | | | | 121,703 | |
| | | | |
Dividends to shareholders: | | | | | | | | |
From net investment income | | | (687,668 | ) | | | (64,780 | ) |
| | | | |
Capital share transactions: | | | | | | | | |
Net proceeds from sale of shares | | | 118,511,492 | | | | 439,619,371 | |
Net asset value of shares issued to shareholders in reinvestment of dividends | | | 687,668 | | | | 64,780 | |
Cost of shares redeemed | | | (227,452,679 | ) | | | (402,540,101 | ) |
| | | | |
Increase (decrease) in net assets derived from capital share transactions | | | (108,253,519 | ) | | | 37,144,050 | |
| | | | |
Net increase (decrease) in net assets | | | (108,310,960 | ) | | | 37,200,973 | |
|
| Net Assets | |
Beginning of period | | | 657,487,466 | | | | 620,286,493 | |
| | | | |
End of period | | $ | 549,176,506 | | | $ | 657,487,466 | |
| | | | |
Undistributed net investment income at end of period | | $ | 137 | | | $ | 57,590 | |
| | | | |
| | | | | | |
The notes to the financial statements are an integral part of,
and should be read in conjunction with, the financial statements. | | | | | 13 | |
Financial Highlights selected per share data and ratios
| | | | | | | | | | | | | | | | | | | | | | | | | | | | |
| | | Six months
ended
June 30, | | | | | | Year ended December 31, | |
| | | 2017* | | | | | | 2016 | | | 2015 | | | 2014 | | | 2013 | | | 2012 | |
Net asset value at beginning of period | | $ | 1.00 | | | | | | | $ | 1.00 | | | $ | 1.00 | | | $ | 1.00 | | | $ | 1.00 | | | $ | 1.00 | |
| | | | | | | | | | | | | | | | | | | | | | | | | | | | |
Net investment income (loss) | | | 0.00 | ‡ | | | | | | | 0.00 | ‡ | | | 0.00 | ‡ | | | 0.00 | ‡ | | | 0.00 | ‡ | | | 0.00 | ‡ |
Net realized and unrealized gain (loss) on investments | | | 0.00 | ‡ | | | | | | | (0.00 | )‡ | | | 0.00 | ‡ | | | (0.00 | )‡ | | | 0.00 | ‡ | | | 0.00 | ‡ |
| | | | | | | | | | | | | | | | | | | | | | | | | | | | |
Total from investment operations | | | 0.00 | ‡ | | | | | | | 0.00 | ‡ | | | 0.00 | ‡ | | | 0.00 | ‡ | | | 0.00 | ‡ | | | 0.00 | ‡ |
| | | | | | | | | | | | | | | | | | | | | | | | | | | | |
| Less dividends: | | | | | | | | | | | | | | | | | | | | | | | | | | | | |
From net investment income | | | (0.00 | )‡ | | | | | | | (0.00 | )‡ | | | (0.00 | )‡ | | | (0.00 | )‡ | | | (0.00 | )‡ | | | (0.00 | )‡ |
| | | | | | | | | | | | | | | | | | | | | | | | | | | | |
Net asset value at end of period | | $ | 1.00 | | | | | | | $ | 1.00 | | | $ | 1.00 | | | $ | 1.00 | | | $ | 1.00 | | | $ | 1.00 | |
| | | | | | | | | | | | | | | | | | | | | | | | | | | | |
Total investment return (a) | | | 0.10 | % | | | | | | | 0.02 | % | | | 0.01 | % | | | 0.01 | % | | | 0.02 | % | | | 0.01 | % |
| Ratios (to average net assets)/Supplemental Data: | | | | | | | | | | | | | | | | | | | | | | | | | | | | |
Net investment income (loss) | | | 0.21 | %†† | | | | | | | 0.02 | %(b) | | | 0.01 | % | | | 0.01 | % | | | 0.01 | % | | | 0.01 | % |
Net expenses | | | 0.47 | %†† | | | | | | | 0.39 | %(c) | | | 0.15 | % | | | 0.11 | % | | | 0.14 | % | | | 0.18 | % |
Expenses (before waiver/reimbursement) | | | 0.47 | %†† | | | | | | | 0.49 | % | | | 0.48 | % | | | 0.47 | % | | | 0.47 | % | | | 0.47 | % |
Net assets at end of period (in 000’s) | | $ | 549,177 | | | | | | | $ | 657,487 | | | $ | 620,286 | | | $ | 578,509 | | | $ | 784,842 | | | $ | 728,706 | |
| ‡ | Less than one cent per share. |
| (a) | Total return does not reflect any deduction of sales charges, mortality and expense charges, contract charges or administrative charges. For periods of less than one year, total return is not annualized. |
| (b) | Without the custody fee reimbursement, net investment income (loss) would have been 0.01%. |
| (c) | Without the custody fee reimbursement, net expenses would have been 0.40%. |
| | | | |
| 14 | | MainStay VP U.S. Government Money Market Portfolio | | The notes to the financial statements are an integral part of,
and should be read in conjunction with, the financial statements. |
Notes to Financial Statements (Unaudited)
Note 1–Organization and Business
MainStay VP Funds Trust (the “Fund”) was organized as a Delaware statutory trust on February 1, 2011. The Fund is registered under the Investment Company Act of 1940, as amended (the “1940 Act”), as an open-end management investment company. The Fund is comprised of thirty-two separate series (collectively referred to as the “Portfolios”). These financial statements and notes relate to the MainStay VP U.S. Government Money Market Portfolio (formerly known as MainStay VP Cash Management Portfolio) (the “Portfolio”), a “diversified” portfolio, as that term is defined in the 1940 Act, as interpreted or modified by regulatory authorities having jurisdiction, from time to time.
Shares of the Portfolio are currently offered to certain separate accounts to fund variable annuity policies and variable universal life insurance policies issued by New York Life Insurance and Annuity Corporation (“NYLIAC”), a wholly-owned subsidiary of New York Life Insurance Company (“New York Life”). NYLIAC allocates shares of the Portfolios to, among others, NYLIAC Variable Annuity Separate Accounts-I, II, III and IV, VUL Separate Account-I and CSVUL Separate Account-I (collectively, the “Separate Accounts”). Shares of the Portfolio are also offered to the MainStay VP Conservative Allocation Portfolio, MainStay VP Moderate Allocation Portfolio, MainStay VP Moderate Growth Allocation Portfolio and MainStay VP Growth Allocation Portfolio, which operate as “funds-of-funds.”
The Portfolio currently offers one class of shares. Initial Class shares commenced operations on January 29, 1993. Shares of the Portfolio are offered and are redeemed at a price equal to their net asset value (“NAVs”) per share. No sales or redemption charge is applicable to the purchase or redemption of the Portfolio’s shares.
The Portfolio’s investment objective is to seek a high level of current income while preserving capital and maintaining liquidity.
Note 2–Significant Accounting Policies
The Portfolio is an investment company and accordingly follows the investment company accounting and reporting guidance of the Financial Accounting Standards Board (“FASB”) Accounting Standard Codification Topic 946 Financial Services—Investment Companies. The Portfolio prepares its financial statements in accordance with generally accepted accounting principles (“GAAP”) in the United States of America and follows the significant accounting policies described below.
(A) Valuation of Shares. The Portfolio seeks to maintain a NAV of $1.00 per share, although there is no assurance that it will be able to do so. An investment in the Portfolio, is not insured or guaranteed by the Federal Deposit Insurance Corporation or any other government agency. The Portfolio’s sponsor has no legal obligation to provide financial support to the Portfolio, and you should not expect that the sponsor will provide financial support to the Portfolio at any time.
(B) Securities Valuation. Investments are usually valued as of the close of regular trading on the New York Stock Exchange (the “Exchange”) (generally 4:00 p.m. Eastern time) on each day the Portfolio is open for business (“valuation date”). Securities are valued using the amortized cost method of valuation, unless the use of such method would be inappropriate per the requirements of Rule 2a-7 under the 1940 Act. The amortized cost method involves valuing a security at
its cost on the date of purchase and thereafter assuming a constant amortization to maturity of the difference between such cost and the value on maturity date. Amortized cost approximates the current fair value of a security. Securities valued using the amortized cost method are not valued using quoted prices in an active market and are generally categorized as Level 2 in the hierarchy.
The Board of Trustees (the “Board”) of the Fund adopted procedures establishing methodologies for the valuation of the Portfolio’s securities and other assets and delegated the responsibility for valuation determinations under those procedures to the Valuation Committee of the Fund (the “Valuation Committee”). The Board authorized the Valuation Committee to appoint a Valuation Sub-Committee (the “Sub-Committee”) to deal in the first instance with establishing the prices of securities for which market quotations are not readily available or the prices of which are not otherwise readily determinable under these procedures. The Sub-Committee meets (in person, via electronic mail or via teleconference) on an as-needed basis. Subsequently, the Valuation Committee meets to ensure that actions taken by the Sub-Committee were appropriate. The procedures recognize that, subject to the oversight of the Board and unless otherwise noted, the responsibility for the day-to-day valuation of portfolio assets (including fair value measurements for the Portfolio’s assets and liabilities) rests with New York Life Investment Management LLC (“New York Life Investments” or the “Manager”), aided to whatever extent necessary by the Subadvisor (as defined in Note 3(A)) to the Portfolio.
To assess the appropriateness of security valuations, the Manager, the Subadvisor or the Portfolio’s third party service provider, who is subject to oversight by the Manager, regularly compares prior day prices, prices on comparable securities and the sale prices to the prior and current day prices and challenges prices with changes exceeding certain tolerance levels with third party pricing services or broker sources. For those securities valued through either a standardized fair valuation methodology or a fair valuation measurement, the Sub-Committee deals in the first instance with such valuation and the Valuation Committee reviews and affirms, if appropriate, the reasonableness of the valuation based on such methodologies and measurements on a regular basis after considering all relevant information that is reasonably available. Any action taken by the Sub-Committee with respect to the valuation of a portfolio security or other asset is submitted by the Valuation Committee to the Board for its review and ratification, if appropriate, at its next regularly scheduled meeting.
“Fair value” is defined as the price the Portfolio would reasonably expect to receive upon selling an asset or liability in an orderly transaction to an independent buyer in the principal or most advantageous market for the asset or liability. Fair value measurements are determined within a framework that establishes a three-tier hierarchy which maximizes the use of observable market data and minimizes the use of unobservable inputs to establish a classification of fair value measurements for disclosure purposes. “Inputs” refer broadly to the assumptions that market participants would use in pricing the asset or liability, including assumptions about risk, such as the risk inherent in a particular valuation technique used to measure fair value using a pricing model and/or the risk inherent in the inputs for the valuation technique. Inputs may be observable or unobservable. Observable inputs reflect the assumptions market participants would use in pricing the asset or liability based on
Notes to Financial Statements (Unaudited) (continued)
market data obtained from sources independent of the Portfolio. Unobservable inputs reflect the Portfolio’s own assumptions about the assumptions market participants would use in pricing the asset or liability based on the information available. The inputs or methodology used for valuing assets or liabilities may not be an indication of the risks associated with investing in those assets or liabilities. The three-tier hierarchy of inputs is summarized below.
| • | | Level 1—quoted prices in active markets for an identical asset or liability |
| • | | Level 2—other significant observable inputs (including quoted prices for a similar asset or liability in active markets, interest rates and yield curves, prepayment speeds, credit risk, etc.) |
| • | | Level 3—significant unobservable inputs (including the Portfolio’s own assumptions about the assumptions that market participants would use in measuring fair value of an asset or liability) |
Securities valued at amortized cost are not obtained from a quoted price in an active market and are generally categorized as Level 2 in the hierarchy. The level of an asset or liability within the fair value hierarchy is based on the lowest level of an input, both individually and in the aggregate, that is significant to the fair value measurement. As of June 30, 2017, the aggregate value by input level of the Portfolio’s assets and liabilities is included at the end of the Portfolio of Investments.
The Portfolio may use third party vendor evaluations, whose prices may be derived from one or more of the following standard inputs, among others:
| | |
• Benchmark yields | | • Reported trades |
• Broker/dealer quotes | | • Issuer spreads |
• Two-sided markets | | • Benchmark securities |
• Bids/offers | | • Reference data (corporate actions or material event notices) |
• Industry and economic events | | • Comparable bonds |
• Monthly payment information | | |
An asset or liability for which market values cannot be measured using the methodologies described above is valued by methods deemed reasonable in good faith by the Valuation Committee, following the procedures established by the Board, to represent fair value. Under these procedures, the Portfolio may utilize some of the following fair value techniques: multi-dimensional relational pricing models and option adjusted spread pricing. During the six-month period ended June 30, 2017, there were no material changes to the fair value methodologies.
The information above is not intended to reflect an exhaustive list of the methodologies that may be used to value portfolio investments. The valuation procedures permit the use of a variety of valuation methodologies in connection with valuing portfolio investments. The methodology used for a specific type of investment may vary based on the market data available or other considerations. The methodologies summarized above may not represent the specific means by which portfolio investments are valued on any particular business day.
A Portfolio security or other asset may be determined to be illiquid under procedures approved by the Board. Illiquidity of a security might prevent
the sale of such security at a time when the Manager or Subadvisor might wish to sell, and these securities could have the effect of decreasing the overall level of the Portfolio’s liquidity. Further, the lack of an established secondary market may make it more difficult to value illiquid securities, requiring the Portfolio to rely on judgments that may be somewhat subjective in measuring value, which could vary materially from the amount that the Portfolio could realize upon disposition. Difficulty in selling illiquid securities may result in a loss or may be costly to the Portfolio. Under the supervision of the Board, the Manager or Subadvisor determines the liquidity of the Portfolio’s investments; in doing so, the Manager or Subadvisor may consider various factors, including (i) the frequency of trades and quotations, (ii) the number of dealers and prospective purchasers, (iii) dealer undertakings to make a market, and (iv) the nature of the security and the market in which it trades (e.g., the time needed to dispose of the security, the method of soliciting offers and the mechanics of transfer). Illiquid securities are often valued in accordance with methods deemed by the Board in good faith to be reasonable and appropriate to accurately reflect their fair value. The liquidity of the Portfolio’s investments, as shown in the Portfolio of Investments and was determined as of June 30, 2017 and can change at any time in response to, among other relevant factors, market conditions or events or developments with respect to an individual issuer or instrument. As of June 30, 2017, the Portfolio did not hold any securities deemed to be illiquid under procedures approved by the Board.
(C) Income Taxes. The Portfolio’s policy is to comply with the requirements of the Internal Revenue Code of 1986, as amended (the “Internal Revenue Code”), applicable to regulated investment companies and to distribute all of its taxable income to the shareholders of the Portfolio within the allowable time limits. Therefore, no federal, state and local income tax provisions are required.
Management evaluates the Portfolio’s tax positions to determine if the tax positions taken meet the minimum recognition threshold in connection with accounting for uncertainties in income tax positions taken or expected to be taken for the purposes of measuring and recognizing tax liabilities in the financial statements. Recognition of tax benefits of an uncertain tax position is permitted only to the extent the position is “more likely than not” to be sustained assuming examination by taxing authorities. Management has analyzed the Portfolio’s tax positions taken on federal, state and local income tax returns for all open tax years (for up to three tax years), and has concluded that no provisions for federal, state and local income tax are required in the Portfolio’s financial statements. The Portfolio’s federal, state and local income and federal excise tax returns for tax years for which the applicable statutes of limitations have not expired are subject to examination by the Internal Revenue Service and state and local departments of revenue.
(D) Dividends and Distributions to Shareholders. Dividends and distributions are recorded on the ex-dividend date. Dividends from net investment income, if any, are declared daily and paid monthly and distributions from net realized capital and currency gains, if any, are declared and paid at least annually. Unless the shareholder elects otherwise, all dividends and distributions are reinvested in the same class of shares of the Portfolio, at NAV. Dividends and distributions to shareholders are determined in accordance with federal income tax regulations and may differ from GAAP.
| | |
| 16 | | MainStay VP U.S. Government Money Market Portfolio |
(E) Security Transactions and Investment Income. The Portfolio records security transactions on the trade date. Realized gains and losses on security transactions are determined using the identified cost method. Dividend income is recognized on the ex-dividend date; net of any foreign tax withheld at the source, and interest income is accrued as earned using the effective interest rate method. Discounts and premiums on securities purchased, other than temporary cash investments which mature in 60 days or less at the time of purchase (“Short-Term Investments”), for the Portfolio are accreted and amortized, respectively, on the effective interest rate method over the life of the respective securities. Discounts and premiums on Short-Term Investments are accreted and amortized, respectively, on the straight-line method. The straight-line method approximates the effective interest method for Short-Term Investments.
(F) Expenses. Expenses of the Fund are allocated to the individual Portfolios in proportion to the net assets of the respective Portfolios when the expenses are incurred, except where direct allocations of expenses can be made. The expenses borne by the Portfolio, including those incurred with related parties to the Portfolio, are shown on the Statement of Operations. Additionally, the Portfolio may invest in shares of mutual funds, which are subject to management fees and other fees that may increase their costs versus the costs of owning the underlying securities directly. These indirect expenses of mutual funds are not included in the amounts shown as expenses on the Portfolio’s Statement of Operations or in the expense ratios included in the financial highlights.
(G) Use of Estimates. In preparing financial statements in conformity with GAAP, management makes estimates and assumptions that affect the reported amounts and disclosures in the financial statements. Actual results could differ from those estimates.
(H) Repurchase Agreements. The Portfolio may enter into repurchase agreements (i.e., buy a security from another party with the agreement that it be sold back in the future) to earn income. The Portfolio may enter into repurchase agreements only with counterparties, usually financial institutions, that are deemed by the Manager or Subadvisor to be creditworthy, pursuant to guidelines established by the Board. During the term of any repurchase agreement, the Manager or Subadvisor will continue to monitor the creditworthiness of the counterparty. Under the 1940 Act, repurchase agreements are considered to be collateralized loans by the Portfolio to the counterparty secured by the securities transferred to the Portfolio.
Repurchase agreements are subject to counterparty risk, meaning the Portfolio could lose money by the counterparty’s failure to perform under the terms of the agreement. The Portfolio mitigates this risk by ensuring the repurchase agreement is collateralized by cash, U.S. government securities, fixed income securities and/or other securities. The collateral is held by the Portfolio’s custodian valued daily on a mark to market basis to determine if the value, including accrued interest, exceeds the repurchase price. In the event of the counterparty’s default on the obligation to repurchase, the Portfolio has the right to liquidate the collateral and apply the proceeds in satisfaction of the obligation. Under certain circumstances, such as in the event of default or bankruptcy by the counterparty, realization and/or retention of the collateral may be limited or subject to delay, to legal proceedings and possible realized loss to the Portfolio.
(I) Indemnifications. Under the Fund’s organizational documents, its officers and trustees are indemnified against certain liabilities that may arise out of performance of their duties to the Fund. Additionally, in the normal course of business, the Portfolio enters into contracts with third-party service providers that contain a variety of representations and warranties and which may provide general indemnifications. The Portfolio’s maximum exposure under these arrangements is unknown, as this would involve future claims that may be made against the Portfolio that have not yet occurred. Based on experience, management is of the view that the risk of loss in connection with these potential indemnification obligations is remote. However, there can be no assurance that material liabilities related to such obligations will not arise in the future, which could adversely impact the Portfolio.
Note 3–Fees and Related Party Transactions
(A) Manager and Subadvisor. New York Life Investments, a registered investment adviser and an indirect, wholly-owned subsidiary of New York Life, serves as the Portfolio’s Manager pursuant to an Amended and Restated Management Agreement (“Management Agreement”). The Manager provides offices, conducts clerical, recordkeeping and bookkeeping services, and keeps most of the financial and accounting records required to be maintained by the Portfolio. Except for the portion of salaries and expenses that are the responsibility of the Portfolio, the Manager pays the salaries and expenses of all personnel affiliated with the Portfolio and the operational expenses of the Portfolio. The Portfolio reimburses New York Life Investments in an amount equal to a portion of the compensation of the Chief Compliance Officer attributable to the Portfolio. Pursuant to the terms of a Subadvisory Agreement with New York Life Investments, NYL Investors LLC (“NYL Investors”), a registered investment adviser and a direct wholly-owned subsidiary of New York Life, serves as Subadvisor to the Portfolio. New York Life Investments pays for the services of the Subadvisor.
The Fund, on behalf of the Portfolio, pays New York Life Investments in its capacity as the Portfolio’s investment manager and administrator, pursuant to the Management Agreement, a monthly fee for the services performed and the facilities furnished at an annual percentage of the average daily net assets. Effective May 1, 2017, the Fund, on behalf of the Portfolio, pays New York Life Investments at the rate of 0.40% up to $500 million; 0.35% from $500 million to $1 billion; and 0.30% in excess of $1 billion. Prior to May 1, 2017, the Fund, on behalf of the Portfolio, paid New York Life Investments at the rate of: 0.45% up to $500 million; 0.40% from $500 million to $1 billion; and 0.35% in excess of $1 billion. During the six-month period ended June 30, 2017, the effective management fee rate was 0.43%.
New York Life Investments may voluntarily waive fees or reimburse expenses of the Portfolio’s to the extent it deems appropriate to enhance the Portfolio’s yield during periods when expenses may have a significant impact on yield because of low interest rates. This expense limitation policy is voluntary and may be revised or terminated by the Manager at any time without notice.
During the six-month period ended June 30, 2017, New York Life Investments earned fees from the Portfolio in the amount of $1,288,387.
State Street provides sub-administration and sub-accounting services to the Portfolio pursuant to an agreement with New York Life Investments.
Notes to Financial Statements (Unaudited) (continued)
These services include calculating the daily NAVs of the Portfolio, maintaining the general ledger and sub-ledger accounts for the calculation of the Portfolio’s respective NAVs, and assisting New York Life Investments in conducting various aspects of the Portfolio’s administrative operations. For providing these services to the Portfolio, State Street is compensated by New York Life Investments.
Note 4–Federal Income Tax
During the year ended December 31, 2016, the tax character of distributions paid as reflected in the Statements of Changes in Net Assets was as follows:
| | |
| 2016 |
Tax-Based
Distributions
from Ordinary
Income | | Tax-Based
Distributions
from Long-
Term Gains |
| $64,780 | | $— |
Note 5–Custodian
State Street is the custodian of cash and securities held by the Portfolio. Custodial fees are charged to the Portfolio based on the Portfolio’s net assets and/or the market value of securities held by the Portfolio and the number of certain transactions incurred by the Portfolio.
Note 6–Capital Share Transactions
Transactions in capital shares for the six-month period ended June 30, 2017, and the year ended December 31, 2016, were as follows:
| | | | |
Initial Class (at $1 per share) | | Shares | |
Six-month period ended June 30, 2017: | | | | |
Shares sold | | | 118,502,288 | |
Shares issued to shareholders in reinvestment of dividends and distributions | | | 687,576 | |
Shares redeemed | | | (227,434,939 | ) |
| | | | |
Net increase (decrease) | | | (108,245,075 | ) |
| | | | |
Year ended December 31, 2016: | | | | |
Shares sold | | | 439,568,908 | |
Shares issued to shareholders in reinvestment of dividends and distributions | | | 64,765 | |
Shares redeemed | | | (402,492,912 | ) |
| | | | |
Net increase (decrease) | | | 37,140,761 | |
| | | | |
Note 7–Recent Accounting Pronouncement
In October 2016, the SEC adopted new rules and amended existing rules (together, “final rules”) intended to modernize the reporting and disclosure of information by registered investment companies. In part, the final rules amend Regulation S-X and require standardized, enhanced disclosure about derivatives in investment company financial statements, as well as other amendments. The compliance date for the amendments to Regulation S-X is August 1, 2017 and applies to shareholder reports for funds with fiscal periods ending after August 1, 2017. Management is currently evaluating the impact that the adoption of the amendments to Regulation S-X will have on the Portfolio’s financial statements and related disclosures.
Note 8–Subsequent Events
In connection with the preparation of the financial statements of the Portfolio as of and for the six-month period ended June 30, 2017, events and transactions subsequent to June 30, 2017, through the date the financial statements were issued have been evaluated by the Portfolio’s management for possible adjustment and/or disclosure. No subsequent events requiring financial statement adjustment or disclosure have been identified.
| | |
| 18 | | MainStay VP U.S. Government Money Market Portfolio |
Proxy Voting Policies and Procedures and Proxy Voting Record
A description of the policies and procedures that New York Life Investments uses to vote proxies related to the Portfolio’s securities is available without charge, upon request, (i) by calling 800-598-2019 or (ii) by visiting the Securities and Exchange Commission’s (“SEC”) website at www.sec.gov.
The Portfolio is required to file with the SEC its proxy voting record for the 12-month period ending June 30 on Form N-PX. The Portfolio’s most recent Form N-PX or proxy voting record is available free of charge upon request (i) by calling 800-598-2019 or; (ii) by visiting the SEC’s website at www.sec.gov.
Shareholder Reports and Quarterly Portfolio Disclosure
The Portfolio is required to file its complete schedule of portfolio holdings with the SEC for its first and third fiscal quarters on Form N-Q. The Portfolio’s Form N-Q is available without charge on the SEC’s website at www.sec.gov or by calling MainStay Investments at 800-598-2019. You also can obtain and review copies of Form N-Q by visiting the SEC’s Public Reference Room in Washington, DC (information on the operation of the Public Reference Room may be obtained by calling 1-800-SEC-0330).
This page intentionally left blank
This page intentionally left blank
This page intentionally left blank
MainStay VP Portfolios
MainStay VP offers a wide range of Portfolios. The full array of MainStay VP offerings is listed here, with information about the manager, subadvisors, legal counsel, and independent registered public accounting firm.
Equity Portfolios
MainStay VP Common Stock Portfolio
MainStay VP Cornerstone Growth Portfolio
MainStay VP Eagle Small Cap Growth Portfolio
MainStay VP Emerging Markets Equity Portfolio
MainStay VP Epoch U.S. Equity Yield Portfolio
MainStay VP Epoch U.S. Small Cap Portfolio
MainStay VP International Equity Portfolio
MainStay VP Large Cap Growth Portfolio
MainStay VP MFS® Utilities Portfolio
MainStay VP Mid Cap Core Portfolio
MainStay VP S&P 500 Index Portfolio
MainStay VP Small Cap Core Portfolio
MainStay VP T. Rowe Price Equity Income Portfolio
MainStay VP VanEck Global Hard Assets Portfolio
Mixed Asset Portfolios
MainStay VP Balanced Portfolio
MainStay VP Convertible Portfolio
MainStay VP Cushing Renaissance Advantage Portfolio
MainStay VP Income Builder Portfolio
MainStay VP Janus Henderson Balanced Portfolio
Income Portfolios
MainStay VP Bond Portfolio
MainStay VP Floating Rate Portfolio
MainStay VP Government Portfolio
MainStay VP High Yield Corporate Bond Portfolio
MainStay VP Indexed Bond Portfolio
MainStay VP PIMCO Real Return Portfolio
MainStay VP Unconstrained Bond Portfolio
Money Market
MainStay VP U.S. Government Money Market Portfolio
Alternative
MainStay VP Absolute Return Multi-Strategy Portfolio
Asset Allocation Portfolios
MainStay VP Conservative Allocation Portfolio
MainStay VP Growth Allocation Portfolio
MainStay VP Moderate Allocation Portfolio
MainStay VP Moderate Growth Allocation Portfolio
Manager
New York Life Investment Management LLC
New York, New York
Subadvisors
Candriam Belgium*
Brussels, Belgium
Candriam France S.A.S.*
Paris, France
Cornerstone Capital Management Holdings LLC*
New York, New York
Cushing Asset Management, LP
Dallas, Texas
Eagle Asset Management, Inc.
St Petersburg, Florida
Epoch Investment Partners, Inc.
New York, New York
Janus Capital Management LLC
Denver, Colorado
MacKay Shields LLC*
New York, New York
Massachusetts Financial Services Company
Boston, Massachusetts
NYL Investors LLC*
New York, New York
Pacific Investment Management Company LLC
Newport Beach, California
T. Rowe Price Associates, Inc.
Baltimore, Maryland
Van Eck Associates Corporation
New York, New York
Winslow Capital Management, LLC
Minneapolis, Minnesota
Distributor
NYLIFE Distributors LLC*
Jersey City, New Jersey
Custodian
State Street Bank and Trust Company
Boston, Massachusetts
Independent Registered Public Accounting Firm
PricewaterhouseCoopers LLP
New York, New York
Legal Counsel
Dechert LLP
Washington, District of Columbia
Some Portfolios may not be available in all products.
* An affiliate of New York Life Investment Management LLC
Not part of the Semiannual Report
2017 Semiannual Report
This report is for the general information of New York Life Variable Annuities and NYLIAC Variable Universal Life Insurance Products policyowners. It must be preceded or accompanied by the appropriate product(s) and funds prospectuses if it is given to anyone who is not an owner of a New York Life variable annuity policy or a NYLIAC Variable Universal Life Insurance Product. This report does not offer for sale or solicit orders to purchase securities.
The performance data quoted in this report represents past performance. Past performance is no guarantee of future results. Due to market volatility and other factors, current performance may be lower or higher than the figures shown. The most recent month-end performance summary for your variable annuity or variable life policy is available by calling 800-598-2019 and is updated periodically on www.newyorklife.com.
The New York Life Variable Annuities and NYLIAC Variable Universal Life Insurance Products are issued by New York Life Insurance and Annuity Corporation (a Delaware Corporation) and distributed by NYLIFE Distributors LLC (Member FINRA/SIPC).
New York Life Insurance Company
New York Life Insurance and Annuity Corporation (NYLIAC) (A Delaware Corporation)
51 Madison Avenue, Room 551
New York, NY 10010
www.newyorklife.com
Printed on recycled paper
mainstayinvestments.com
NYLIFE Distributors LLC, 30 Hudson Street, Jersey City, NJ 07302
New York Life Investment Management LLC is the investment manager to the MainStay VP Funds Trust
©2017 by NYLIFE Distributors LLC. All rights reserved.
You may obtain copies of the Prospectus and the Statement of Additional Information free of charge, upon request, by calling toll-free 800-598-2019 or writing to New York Life Insurance and Annuity Corporation, 51 Madison Avenue, New York, NY 10010.
| | | | |
| Not FDIC Insured | | No Bank Guarantee | | May Lose Value |
| | | | |
1743157 | | | | MSVPUSGMM10-08/17 (NYLIAC) NI510 |
MainStay VP High Yield Corporate Bond Portfolio
Message from the President and Semiannual Report
Unaudited | June 30, 2017

Sign up for electronic delivery of your shareholder reports. For full details on electronic delivery, including who can participate and what you
can receive via eDelivery, please log on to www.newyorklife.com/vsc

This page intentionally left blank
Message from the President
The six months ended June 30, 2017, brought positive results to many stock and bond investors. The year began with many investors hoping that Republican control of the White House, the Senate and the House of Representatives could bring an end to political gridlock; and while debate has continued on a number of issues, the U.S. stock market climbed relatively steadily throughout the first half of 2017.
According to FTSE-Russell U.S. market data, stocks at all capitalization levels tended to record positive total returns during the reporting period, with large-cap stocks generally outperforming stocks of smaller-capitalization companies. Growth stocks outpaced value stocks at every capitalization level by substantial margins—from more than six percentage points for micro-caps and mid-caps to more than 10 percentage points for the largest 200 U.S. companies by market capitalization.
Most sectors of the stock market advanced during the reporting period, with energy and telecommunication services being notable exceptions. Energy stocks declined as oil prices fell despite moves by the Organization of Petroleum Exporting Countries (OPEC) intended to limit oil production by its members. Telecommunication services stocks tended to decline as competition increased and rising interest rates made dividend payouts less appealing.
In March and June of 2017, the Federal Reserve announced successive increases in the target range for the federal funds rate, ultimately bringing the federal funds target range to 1.00% to 1.25%. While short-term U.S. Treasury yields rose in response, yields for U.S. Treasury securities with maturities of five years or longer declined. As the difference between short- and long-term yields narrowed, the advantages of higher-yielding long-term bonds became increasingly apparent.
Virtually all taxable and tax-exempt bond sectors provided positive total returns during the reporting period. Mortgage-backed
securities, though providing positive total returns, faced headwinds when the Federal Reserve announced plans to begin normalizing its balance sheet by reducing reinvestment of principal payments on mortgage-backed securities.
International stock and bond markets were also strong during the reporting period. International stocks provided double-digit total returns that were surpassed by emerging-market stocks as a whole. Global investment-grade bonds provided single-digit returns; and emerging-market debt was somewhat stronger.
Even during periods of favorable market performance and generally positive returns, MainStay believes that it is important to carefully monitor your investments. Your risk tolerance may
change over time, leading you to reevaluate which MainStay VP Portfolios are most appropriate for your long-term goals. Your goals themselves may also change, leading you to pursue investments with more or less risk. The portfolio managers of MainStay VP Portfolios seek to provide results consistent with the investment objectives of their respective Portfolios, to give you a wide range of choices suitable to various investment needs.
The report that follows provides more detailed information about the specific markets, securities and investment decisions that influenced your MainStay VP Portfolio during the six months ended June 30, 2017. We invite you to review the report carefully as part of your ongoing investment evaluation and review.
Sincerely,

Stephen P. Fisher
President
The opinions expressed are as of the date of the accompanying report and are subject to change. Past performance is no guarantee of future results. There is no guarantee that any forecasts made will come to pass. This material does not constitute investment advice and is not intended as an endorsement of any specific investment.
Not all MainStay VP Portfolios and/or share classes are available under all policies.
Not part of the Semiannual Report
Table of Contents
Investors should refer to the Portfolio’s Summary Prospectus and/or Prospectus and consider the Portfolio’s investment objectives, strategies, risks, charges and expenses carefully before investing. The Summary Prospectus and/or Prospectus contain this and other information about the Portfolio. You may obtain copies of the Portfolio’s Summary Prospectus and/or the Prospectus and the Statement of Additional Information free of charge, upon request, by calling toll-free 800-598-2019, by writing to New York Life Insurance and Annuity Corporation, 51 Madison Avenue, Room 251, New York, New York 10010 or by sending an email to MainStayShareholdersServices@nylim.com. These documents are also available at mainstayinvestments.com/vpdocuments. Please read the Summary Prospectus and/or Prospectus carefully before investing. MainStay VP Funds Trust portfolios are separate account options which are purchased through a variable insurance or variable annuity contract.
Investment and Performance Comparison (Unaudited)
Performance data quoted represents past performance. Past performance is no guarantee of future results. Because of market volatility and other factors, current performance may be lower or higher than the figures shown. Investment return and principal value will fluctuate, and as a result, when shares are redeemed, they may be worth more or less than their original cost. The performance table and graph do not reflect any deduction of sales charges, mortality and expense charges, contract charges or administrative charges. Please refer to the Performance Summary appropriate for your policy. For performance information current to the most recent month-end, please call 800-598-2019 or visit www.newyorklife.com.
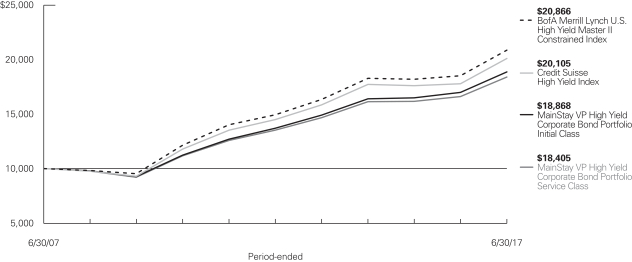
Average Annual Total Returns for the Period Ended June 30, 2017
| | | | | | | | | | | | | | | | | | | | | | |
| Class | | Inception
Date | | Six Months | | | One Year | | | Five Years | | | Ten Years | | | Gross
Expense
Ratio1 | |
| Initial Class Shares | | 5/1/1995 | | | 3.65 | % | | | 11.04 | % | | | 6.61 | % | | | 6.55 | % | | | 0.59 | % |
| Service Class Shares | | 6/4/2003 | | | 3.52 | | | | 10.76 | | | | 6.35 | | | | 6.29 | | | | 0.84 | % |
| | | | | | | | | | | | | | | | |
| Benchmark Performance | | Six
Months | | | One
Year | | | Five
Years | | | Ten
Years | |
BofA Merrill Lynch U.S. High Yield Master II Constrained Index2 | | | 4.90 | % | | | 12.74 | % | | | 6.92 | % | | | 7.63 | % |
Credit Suisse High Yield Index3 | | | 4.37 | | | | 13.02 | | | | 6.74 | | | | 7.23 | |
Average Lipper Variable Products High Yield Portfolio4 | | | 4.08 | | | | 10.41 | | | | 5.71 | | | | 6.15 | |
| 1. | The gross expense ratios presented reflect the Portfolio’s “Total Annual Portfolio Operating Expenses” from the most recent Prospectus and may differ from other expense ratios disclosed in this report. |
| 2. | The BofA Merrill Lynch U.S. High Yield Master II Constrained Index is the Portfolio’s primary broad-based securities market index for comparison purposes. The BofA Merrill Lynch U.S. High Yield Master II Constrained Index is a market value-weighted index of all domestic and Yankee high-yield bonds, including deferred interest bonds and payment-in-kind securities. Issuers included in the Index have maturities of one year or more and have a credit rating lower than BBB-/Baa3, but are not in default. No single issuer may constitute greater than 2% of the Index. Results assume reinvestment of all dividends and capital gains. An investment cannot be made directly in an index. |
| 3. | The Credit Suisse High Yield Index is the Portfolio’s secondary benchmark. The Credit Suisse High Yield Index is a market-weighted index that includes publicly traded bonds rated below BBB by Standard & Poor’s and below Baa by Moody’s. Results assume reinvestment of all dividends and capital gains. An investment cannot be made directly in an index. |
| 4. | The Average Lipper Variable Products High Yield Portfolio is representative of portfolios that aim at high (relative) current yield from fixed-income securities, have no quality or maturity restrictions, and tend to invest in lower-grade debt issues. The benchmark is a product of Lipper Inc. Lipper Inc. is an independent monitor of fund performance. Results are based on average total returns of similar portfolios with all dividend and capital gain distributions reinvested. |
Cost in Dollars of a $1,000 Investment in MainStay VP High Yield Corporate Bond Portfolio (Unaudited)
The example below is intended to describe the fees and expenses borne by shareholders during the six-month period from January 1, 2017 to June 30, 2017, and the impact of those costs on your investment.
Example
As a shareholder of the Portfolio, you incur two types of costs: (1) transaction costs, including exchange fees and sales charges (loads) on purchases (as applicable), and (2) ongoing costs, including management fees, distribution and/or service (12b-1) fees, and other funds expenses (as applicable). This example is intended to help you understand your ongoing costs (in dollars) of investing in the Portfolio and to compare these costs with the ongoing costs of investing in other mutual funds. The example is based on an investment of $1,000 made at the beginning of the six-month period and held for the entire period from January 1, 2017 to June 30, 2017. Shares are only sold in connection with variable life and annuity contracts and the example does not reflect any contract level or transactional fees or expenses. If these costs had been included, your costs would have been higher.
This example illustrates your Portfolio’s ongoing costs in two ways:
Actual Expenses
The second and third data columns in the table below provide information about actual account values and actual expenses. You may use the information in these columns, together with the amount you invested, to estimate the expenses that you paid during the six months ended June 30, 2017. Simply divide your account value by $1,000
(for example, an $8,600 account value divided by $1,000 = 8.6), then multiply the result by the number under the heading entitled “Expenses Paid During Period” to estimate the expenses you paid on your account during this period.
Hypothetical Example for Comparison Purposes
The fourth and fifth data columns in the table below provide information about hypothetical account values and hypothetical expenses based on the Portfolio’s actual expense ratio and an assumed rate of return of 5% per year before expenses, which is not the Portfolio’s actual return. The hypothetical account values and expenses may not be used to estimate the actual ending account balances or expenses you paid for the six-month period shown. You may use this information to compare the ongoing costs of investing in the Portfolio with the ongoing costs of investing in other mutual funds. To do so, compare this 5% hypothetical example with the 5% hypothetical examples that appear in the shareholder reports of the other mutual funds.
Please note that the expenses shown in the table are meant to highlight your ongoing costs only and do not reflect any transactional costs, such as exchange fees or sales charges (loads). Therefore, the fourth and fifth data columns of the table are useful in comparing ongoing costs only and will not help you determine the relative total costs of owning different funds. In addition, if these transactional costs were included, your costs would have been higher.
| | | | | | | | | | | | | | | | | | | | | | | | |
| | | | | | | | | | | | | | | | | | | |
| Share Class | | Beginning
Account
Value
1/1/17 | | | Ending Account
Value (Based
on Actual
Returns and
Expenses)
6/30/17 | | | Expenses
Paid
During
Period1 | | | Ending Account
Value (Based
on Hypothetical
5% Annualized
Return and
Actual Expenses)
6/30/17 | | | Expenses
Paid
During
Period1 | | | Net Expense
Ratio
During
Period2 | |
| | | | | | |
| Initial Class Shares | | $ | 1,000.00 | | | $ | 1,036.50 | | | $ | 2.98 | | | $ | 1,021.90 | | | $ | 2.96 | | | | 0.59 | % |
| | | | | | |
| Service Class Shares | | $ | 1,000.00 | | | $ | 1,035.20 | | | $ | 4.24 | | | $ | 1,020.60 | | | $ | 4.21 | | | | 0.84 | % |
| 1. | Expenses are equal to the Portfolio’s annualized expense ratio of each class multiplied by the average account value over the period, divided by 365 and multiplied by 181 (to reflect the six-month period). The table above represents the actual expenses incurred during the six-month period. |
| 2. | Expenses are equal to the Portfolio’s annualized expense ratio to reflect the six-month period. |
| | |
| 6 | | MainStay VP High Yield Corporate Bond Portfolio |
Portfolio Composition as of June 30, 2017 (Unaudited)

See Portfolio of Investments beginning on page 10 for specific holdings within these categories.
Top Ten Holdings or Issuers Held as of June 30, 2017 (excluding short-term investment) (Unaudited)
| 1. | T-Mobile USA, Inc., 5.125%–6.625%, due 1/15/22–4/15/27 |
| 2. | HCA, Inc., 5.00%–8.36%, due 10/1/18–6/15/26 |
| 3. | Equinix, Inc., 5.375%–5.875%, due 1/1/22–5/15/27 |
| 4. | CCO Holdings LLC / CCO Holdings Capital Corp., 5.125%–5.875%, due 9/30/22–5/1/27 |
| 5. | Freeport McMoRan, Inc., 6.50%–6.875%, due 11/15/20–2/15/23 |
| 7. | Crown Castle International Corp., 5.25%, due 1/15/23 |
| 8. | Micron Technology, Inc., 5.25%–7.50%, due 8/1/23–2/1/25 |
| 9. | Hughes Satellite Systems Corp., 5.25%–7.625%, due 6/15/19–8/1/26 |
| 10. | Carlson Travel, Inc., 6.75%–9.50%, due 12/15/23–12/15/24 |
Portfolio Management Discussion and Analysis (Unaudited)
Answers to the questions reflect the views of portfolio manager Andrew Susser of MacKay Shields LLC, the Portfolio’s Subadvisor.
How did MainStay VP High Yield Corporate Bond Portfolio perform relative to its benchmark and peers during the six months ended June 30, 2017?
For the six months ended June 30, 2017, MainStay VP High Yield Corporate Bond Portfolio returned 3.65% for Initial Class shares and 3.52% for Service Class shares. Over the same period, both share classes underperformed the 4.90% return of the BofA Merrill Lynch U.S. High Yield Master II Constrained Index,1 which is the Portfolio’s primary benchmark; the 4.37% return of the Credit Suisse High Yield Index,1 which formerly was the Portfolio’s primary benchmark; and the 4.08% return of the Average Lipper2 Variable Products High Yield Portfolio for the six months ended June 30, 2017.
Were there any changes to the Portfolio during the reporting period?
Effective May 1, 2017, the Portfolio selected the BofA Merrill Lynch U.S. High Yield Master II Constrained Index as its primary benchmark as a replacement for the Credit Suisse High Yield Index. The Portfolio selected the BofA Merrill Lynch U.S. High Yield Master II Constrained Index as its primary benchmark because it believes that this index is more reflective of its current investment style.
What factors affected the Portfolio’s relative performance during the reporting period?
Positioning and security selection in the energy sector helped the Portfolio’s relative performance. The Portfolio held an underweight position relative to the BofA Merrill Lynch U.S. High Yield Master II Constrained Index in the oil field equipment & services subsector, which was a bottom performer within the Index in the second half of the reporting period. Security selection in the automotive sector helped the Portfolio’s relative performance as select auto parts manufacturers outperformed the Index. Positive security selection also added to relative performance in the support-services sector.
The Portfolio’s underweight position in the banking industry detracted from relative performance as the sector outperformed during the reporting period. An underweight position and security selection in health care also detracted from relative performance as lower-quality pharmaceutical companies and
rural hospital operators rebounded. Security selection in the utilities sector hurt relative performance because the Portfolio owned a Texas-based electricity provider that underperformed.
What was the Portfolio’s duration3 strategy during the reporting period?
The Portfolio is not managed to a duration strategy, and the duration positioning is the result of the Subadvisor’s bottom-up investment process. As of June 30, 2017, the modified duration to worst of the Portfolio was 3.04 years, which was shorter than the 3.63-year modified duration to worst of the BofA Merrill Lynch U.S. High Yield Constrained Index on the same date.
What specific factors, risks or market forces prompted significant decisions for the Portfolio during the reporting period?
During the reporting period, the high-yield market continued to rebound. Spreads4 tightened significantly, especially in the commodity and CCC-rated5 sectors, which outperformed all other credit quality components of the high-yield market in the first half of 2017. As a result, the Portfolio began to reduce positions in these sectors, which had appreciated in price because of relative value, and began adding to higher-quality positions at risk-adjusted yields that we found relatively attractive.
During the reporting period, which market segments were the strongest positive contributors to the Portfolio’s performance and which market segments were particularly weak?
Positioning and security selection in the energy sector were strong positive contributors to the Portfolio’s performance, aided by an underweight position in the oil field equipment & services subsector. (Contributions take weightings and total returns into account.) Security selection in the automotive sector was another positive contributor, as was security selection in the support-services sector.
Aspects of the Portfolio that detracted from performance during the reporting period included an underweight position in the banking industry, an underweight position and security selection in health care, and security selection in the utilities sector.
| 1. | See footnote on page 5 for more information on this index. |
| 2. | See footnote on page 5 for more information on Lipper Inc. |
| 3. | Duration is a measure of the price sensitivity of a fixed-income investment to changes in interest rates. Duration is expressed as a number of years and is considered a more accurate sensitivity gauge than average maturity. Modified duration is inversely related to the approximate percentage change in price for a given change in yield. Duration to worst is the duration of a bond computed using the bond’s nearest call date or maturity, whichever comes first. This measure ignores future cash flow fluctuations due to embedded optionality. |
| 4. | The terms “spread” and “yield spread” may refer to the difference in yield between a security or type of security and comparable U.S. Treasury issues. The terms may also refer to the difference in yield between two specific securities or types of securities at a given time. |
| 5. | An obligation rated ‘CCC’ by Standard & Poor’s (“S&P”) is deemed by S&P to be currently vulnerable to nonpayment and is dependent upon favorable business, financial and economic conditions for the obligor to meet its financial commitment on the obligation. It is the opinion of S&P that in the event of adverse business, financial or economic conditions, the obligor is not likely to have the capacity to meet its financial commitment on the obligation. When applied to Portfolio holdings, ratings are based solely on the creditworthiness of the bonds in the portfolio and are not meant to represent the security or safety of the Portfolio. |
| | |
| 8 | | MainStay VP High Yield Corporate Bond Portfolio |
Did the Portfolio make any significant purchases or sales during the reporting period?
During the reporting period, the Portfolio purchased a new issue of Grinding Media, the financing subsidiary of Moly-Cop, a manufacturer and supplier of grinding materials for mining operations. The bonds came at a yield we found attractive, and the securities had a first lien on most of the company’s non-working capital assets. In addition, no debt stood ahead of the bonds in the capital structure. The company has a leading position in a growing industry with stable margins and free cash flow. The Portfolio also added to its position in bonds of OpenText, a developer of enterprise information-management software. OpenText generates a steady and meaningful amount of free cash flow, and sector trends have remained positive as the world becomes more complex and data dependent.
During the reporting period, the Portfolio sold out of its position in energy exploration & production company Halcon Resources. The sale reflected the Portfolio’s efforts to reduce energy exposure as spreads in the sector have moved closer to those in the broader market. The Portfolio also sold its position in musical instruments retailer Guitar Center. The company continued to see declining same-store sales and weakening margin trends across its businesses.
How did the Portfolio’s sector weightings change during the reporting period?
During the reporting period, there were no material changes to the Portfolio’s sector weightings and the Portfolio’s risk position remained relatively consistent. The Portfolio incrementally increased its exposure to media and capital goods because of attractive valuations and yield levels. During the reporting period, the Portfolio reduced its exposure to energy and basic industries.
How was the Portfolio positioned at the end of the reporting period?
As of June 30, 2017, the Portfolio held overweight positions relative to the BofA Merrill Lynch U.S. High Yield Master II Constrained Index in the automotive, basic industry and consumer goods market segments. As of the same date, the Portfolio held underweight positions relative to the Index in the oil field equipment & services, banking and health care market segments.
The opinions expressed are those of the portfolio manager as of the date of this report and are subject to change. There is no guarantee that any forecasts made will come to pass. This material does not constitute investment advice and is not intended as an endorsement of any specific investment.
Not all MainStay VP Portfolios and/or share classes are available under all policies.
Portfolio of Investments June 30, 2017 (Unaudited)
| | | | | | | | |
| | | Principal
Amount | | | Value | |
Long-Term Bonds 94.4%† Convertible Bonds 2.2% | | | | | | | | |
Auto Parts & Equipment 0.5% | | | | | | | | |
¨Exide Technologies | | | | | | | | |
7.00% (7.00% PIK),
due 4/30/25 (a)(b)(c)(d) | | $ | 25,596,078 | | | $ | 11,748,600 | |
7.25% (7.25% PIK),
due 4/30/25 (a)(b)(c)(d) | | | 4,600,000 | | | | 4,222,800 | |
| | | | | | | | |
| | | | 15,971,400 | |
| | | | | | | | |
Media 0.3% | |
DISH Network Corp.
3.375%, due 8/15/26 (d) | | | 7,705,000 | | | | 9,380,837 | |
| | | | | | | | |
|
Mining 0.6% | |
Detour Gold Corp.
5.50%, due 11/30/17 | | | 18,642,000 | | | | 19,061,445 | |
| | | | | | | | |
|
Oil & Gas 0.3% | |
Comstock Resources, Inc. | |
7.75% (7.75% PIK), due 4/1/19 (a) | | | 4,792,509 | | | | 3,738,157 | |
9.50% (9.50% PIK), due 6/15/20 (a) | | | 8,018,568 | | | | 6,174,297 | |
| | | | | | | | |
| | | | 9,912,454 | |
| | | | | | | | |
Real Estate Investment Trusts 0.5% | |
VEREIT, Inc.
3.75%, due 12/15/20 | | | 12,820,000 | | | | 13,212,677 | |
| | | | | | | | |
Total Convertible Bonds
(Cost $76,549,751) | | | | | | | 67,538,813 | |
| | | | | | | | |
| | |
| Corporate Bonds 91.6% | | | | | | | | |
Advertising 0.6% | | | | | | | | |
Lamar Media Corp. | | | | | | | | |
5.375%, due 1/15/24 | | | 5,447,000 | | | | 5,692,115 | |
5.75%, due 2/1/26 | | | 2,935,000 | | | | 3,162,462 | |
5.875%, due 2/1/22 | | | 1,525,000 | | | | 1,574,563 | |
Outfront Media Capital LLC / Outfront Media Capital Corp. | | | | | | | | |
5.25%, due 2/15/22 | | | 3,495,000 | | | | 3,621,694 | |
5.625%, due 2/15/24 | | | 3,830,000 | | | | 3,997,562 | |
| | | | | | | | |
| | | | 18,048,396 | |
| | | | | | | | |
Aerospace & Defense 1.4% | |
KLX, Inc.
5.875%, due 12/1/22 (d) | | | 10,925,000 | | | | 11,471,250 | |
Orbital ATK, Inc. | |
5.25%, due 10/1/21 | | | 4,270,000 | | | | 4,408,775 | |
5.50%, due 10/1/23 | | | 3,775,000 | | | | 3,973,188 | |
Spirit AeroSystems, Inc.
5.25%, due 3/15/22 | | | 2,494,000 | | | | 2,587,794 | |
| | | | | | | | |
| | | Principal
Amount | | | Value | |
Aerospace & Defense (continued) | �� |
TransDigm, Inc. | |
5.50%, due 10/15/20 | | $ | 5,780,000 | | | $ | 5,895,600 | |
6.00%, due 7/15/22 | | | 2,760,000 | | | | 2,842,800 | |
6.50%, due 7/15/24 | | | 2,000,000 | | | | 2,065,000 | |
6.50%, due 5/15/25 | | | 9,350,000 | | | | 9,513,625 | |
| | | | | | | | |
| | | | 42,758,032 | |
| | | | | | | | |
Apparel 0.3% | |
Hanesbrands, Inc.
4.875%, due 5/15/26 (d) | | | 2,750,000 | | | | 2,791,250 | |
William Carter Co. (The)
5.25%, due 8/15/21 | | | 5,380,000 | | | | 5,534,675 | |
| | | | | | | | |
| | | | 8,325,925 | |
| | | | | | | | |
Auto Manufacturers 0.8% | |
BCD Acquisition, Inc.
9.625%, due 9/15/23 (d) | | | 6,625,000 | | | | 7,155,000 | |
Ford Holdings LLC
9.30%, due 3/1/30 | | | 6,970,000 | | | | 9,687,659 | |
General Motors Financial Co., Inc.
6.75%, due 6/1/18 | | | 6,125,000 | | | | 6,389,208 | |
| | | | | | | | |
| | | | 23,231,867 | |
| | | | | | | | |
Auto Parts & Equipment 3.6% | |
Adient Global Holdings, Ltd.
4.875%, due 8/15/26 (d) | | | 8,100,000 | | | | 8,120,250 | |
American Axle & Manufacturing, Inc. | |
6.25%, due 4/1/25 (d) | | | 4,180,000 | | | | 4,075,500 | |
6.50%, due 4/1/27 (d) | | | 5,465,000 | | | | 5,314,712 | |
Cooper-Standard Automotive, Inc.
5.625%, due 11/15/26 (d) | | | 3,030,000 | | | | 3,041,363 | |
Dana Financing Luxembourg S.A.R.L.
5.75%, due 4/15/25 (d) | | | 4,515,000 | | | | 4,673,025 | |
¨Exide Technologies
11.00% (4.00% Cash and 7.00% PIK), due 4/30/22 (a)(b)(c)(d) | | | 29,199,860 | | | | 23,447,488 | |
¨Exide Technologies (Escrow Claim Shares)
8.625%, due 2/1/18 (b)(c)(d)(e) | | | 20,190,000 | | | | 20,190 | |
Goodyear Tire & Rubber Co. (The) | |
4.875%, due 3/15/27 | | | 3,490,000 | | | | 3,542,350 | |
5.125%, due 11/15/23 | | | 2,000,000 | | | | 2,095,000 | |
IHO Verwaltungs GmbH | |
4.125% (4.125% Cash or 4.875% PIK), due 9/15/21 (a)(d) | | | 8,210,000 | | | | 8,363,937 | |
4.50% (4.50% Cash or 5.25% PIK), due 9/15/23 (a)(d) | | | 8,830,000 | | | | 8,962,450 | |
4.75% (4.75% Cash or 5.50% PIK), due 9/15/26 (a)(d) | | | 5,510,000 | | | | 5,571,987 | |
| † | Percentages indicated are based on Portfolio net assets. |
| ¨ | | Among the Portfolio’s 10 largest holdings or issuers held, as of June 30, 2017, excluding short-term investment. May be subject to change daily. |
| | | | |
| 10 | | MainStay VP High Yield Corporate Bond Portfolio | | The notes to the financial statements are an integral part of,
and should be read in conjunction with, the financial statements. |
| | | | | | | | |
| | | Principal
Amount | | | Value | |
| Corporate Bonds (continued) | |
Auto Parts & Equipment (continued) | |
International Automotive Components Group S.A.
9.125%, due 6/1/18 (d) | | $ | 4,775,000 | | | $ | 4,667,563 | |
Meritor, Inc.
6.75%, due 6/15/21 | | | 970,000 | | | | 1,003,950 | |
Nexteer Automotive Group, Ltd.
5.875%, due 11/15/21 (d) | | | 6,640,000 | | | | 6,889,000 | |
Schaeffler Finance B.V.
4.75%, due 5/15/23 (d) | | | 8,835,000 | | | | 9,100,050 | |
Tenneco, Inc.
5.00%, due 7/15/26 | | | 4,910,000 | | | | 4,965,238 | |
Titan International, Inc.
6.875%, due 10/1/20 | | | 1,480,000 | | | | 1,535,500 | |
ZF North America Capital, Inc.
4.75%, due 4/29/25 (d) | | | 4,945,000 | | | | 5,216,975 | |
| | | | | | | | |
| | | | | | | 110,606,528 | |
| | | | | | | | |
Banks 0.2% | |
Provident Funding Associates, L.P. /
PFG Finance Corp.
6.375%, due 6/15/25 (d) | | | 4,920,000 | | | | 5,043,000 | |
| | | | | | | | |
|
Biotechnology 0.3% | |
AMAG Pharmaceuticals, Inc.
7.875%, due 9/1/23 (d) | | | 8,310,000 | | | | 7,987,988 | |
| | | | | | | | |
|
Building Materials 1.5% | |
Airxcel, Inc.
8.50%, due 2/15/22 (d) | | | 2,750,000 | | | | 2,894,375 | |
BMC East LLC
5.50%, due 10/1/24 (d) | | | 3,795,000 | | | | 3,965,775 | |
Gibraltar Industries, Inc.
6.25%, due 2/1/21 | | | 5,525,000 | | | | 5,718,375 | |
James Hardie International Finance, Ltd.
5.875%, due 2/15/23 (d) | | | 8,965,000 | | | | 9,390,837 | |
RSI Home Products, Inc.
6.50%, due 3/15/23 (d) | | | 1,813,000 | | | | 1,908,183 | |
Standard Industries, Inc.
5.125%, due 2/15/21 (d) | | | 2,500,000 | | | | 2,596,875 | |
Summit Materials LLC / Summit Materials Finance Corp. 5.125%, due 6/1/25 (d) | | | 1,845,000 | | | | 1,891,125 | |
6.125%, due 7/15/23 | | | 10,905,000 | | | | 11,422,987 | |
8.50%, due 4/15/22 | | | 3,860,000 | | | | 4,361,800 | |
USG Corp.
4.875%, due 6/1/27 (d) | | | 1,500,000 | | | | 1,543,125 | |
| | | | | | | | |
| | | | | | | 45,693,457 | |
| | | | | | | | |
| | | | | | | | |
| | | Principal
Amount | | | Value | |
Chemicals 2.3% | |
Blue Cube Spinco, Inc.
9.75%, due 10/15/23 | | $ | 11,870,000 | | | $ | 14,362,700 | |
10.00%, due 10/15/25 | | | 6,875,000 | | | | 8,473,437 | |
GCP Applied Technologies, Inc.
9.50%, due 2/1/23 (d) | | | 7,795,000 | | | | 8,866,812 | |
Kissner Holdings, L.P. / Kissner Milling Co., Ltd. / BSC Holding, Inc. / Kissner USA
8.375%, due 12/1/22 (d) | | | 5,760,000 | | | | 5,976,000 | |
NOVA Chemicals Corp.
4.875%, due 6/1/24 (d) | | | 5,830,000 | | | | 5,808,138 | |
5.00%, due 5/1/25 (d) | | | 2,500,000 | | | | 2,487,500 | |
5.25%, due 8/1/23 (d) | | | 3,135,000 | | | | 3,221,213 | |
5.25%, due 6/1/27 (d) | | | 3,210,000 | | | | 3,193,950 | |
Olin Corp.
5.50%, due 8/15/22 | | | 3,261,000 | | | | 3,424,050 | |
PolyOne Corp.
5.25%, due 3/15/23 | | | 8,884,000 | | | | 9,328,200 | |
Trinseo Materials Operating SCA / Trinseo Materials Finance, Inc.
6.75%, due 5/1/22 (d) | | | 4,840,000 | | | | 5,130,400 | |
Westlake Chemical Corp.
4.625%, due 2/15/21 | | | 1,000,000 | | | | 1,035,000 | |
| | | | | | | | |
| | | | | | | 71,307,400 | |
| | | | | | | | |
Coal 0.4% | |
CONSOL Energy, Inc.
5.875%, due 4/15/22 | | | 6,895,000 | | | | 6,774,337 | |
8.00%, due 4/1/23 | | | 5,435,000 | | | | 5,706,750 | |
| | | | | | | | |
| | | | | | | 12,481,087 | |
| | | | | | | | |
Commercial Services 4.9% | |
Alpine Finance Merger Sub LLC
6.875%, due 8/1/25 (d) | | | 4,760,000 | | | | 4,843,300 | |
Ashtead Capital, Inc.
5.625%, due 10/1/24 (d) | | | 4,245,000 | | | | 4,563,375 | |
6.50%, due 7/15/22 (d) | | | 14,466,000 | | | | 14,990,392 | |
Avis Budget Car Rental LLC / Avis Budget Finance, Inc.
5.50%, due 4/1/23 | | | 10,250,000 | | | | 10,185,937 | |
6.375%, due 4/1/24 (d) | | | 8,715,000 | | | | 8,693,212 | |
Booz Allen Hamilton, Inc.
5.125%, due 5/1/25 (d) | | | 1,000,000 | | | | 982,500 | |
Cimpress N.V.
7.00%, due 4/1/22 (d) | | | 11,005,000 | | | | 11,390,175 | |
Flexi-Van Leasing, Inc.
7.875%, due 8/15/18 (d) | | | 4,010,000 | | | | 3,969,900 | |
Gartner, Inc.
5.125%, due 4/1/25 (d) | | | 8,907,000 | | | | 9,356,002 | |
Great Lakes Dredge & Dock Corp.
8.00%, due 5/15/22 (d) | | | 4,610,000 | | | | 4,696,438 | |
| | | | | | |
The notes to the financial statements are an integral part of,
and should be read in conjunction with, the financial statements. | | | | | 11 | |
Portfolio of Investments June 30, 2017 (Unaudited) (continued)
| | | | | | | | |
| | | Principal
Amount | | | Value | |
| Corporate Bonds (continued) | |
Commercial Services (continued) | |
IHS Markit, Ltd.
4.75%, due 2/15/25 (d) | | $ | 3,030,000 | | | $ | 3,253,463 | |
5.00%, due 11/1/22 (d) | | | 20,705,000 | | | | 22,348,356 | |
Jaguar Holding Co. II / Pharmaceutical Product Development LLC
6.375%, due 8/1/23 (d) | | | 4,370,000 | | | | 4,604,888 | |
Laureate Education, Inc.
8.25%, due 5/1/25 (d) | | | 3,340,000 | | | | 3,582,150 | |
Nielsen Co. Luxembourg S.A.R.L.
5.00%, due 2/1/25 (d) | | | 4,860,000 | | | | 4,981,500 | |
5.50%, due 10/1/21 (d) | | | 1,340,000 | | | | 1,386,900 | |
Nielsen Finance LLC / Nielsen Finance Co.
4.50%, due 10/1/20 | | | 6,120,000 | | | | 6,213,514 | |
5.00%, due 4/15/22 (d) | | | 20,569,000 | | | | 21,340,337 | |
Ritchie Bros. Auctioneers, Inc.
5.375%, due 1/15/25 (d) | | | 540,000 | | | | 562,950 | |
United Rentals North America, Inc.
4.625%, due 7/15/23 | | | 1,980,000 | | | | 2,055,735 | |
7.625%, due 4/15/22 | | | 324,000 | | | | 338,580 | |
WEX, Inc.
4.75%, due 2/1/23 (d) | | | 4,915,000 | | | | 4,939,575 | |
| | | | | | | | |
| | | | | | | 149,279,179 | |
| | | | | | | | |
Computers 0.7% | |
Conduent Finance, Inc. / Xerox Business Services LLC
10.50%, due 12/15/24 (d) | | | 1,000,000 | | | | 1,165,000 | |
NCR Corp.
6.375%, due 12/15/23 | | | 6,300,000 | | | | 6,764,625 | |
NeuStar, Inc.
4.50%, due 1/15/23 | | | 13,365,000 | | | | 13,732,537 | |
| | | | | | | | |
| | | | | | | 21,662,162 | |
| | | | | | | | |
Cosmetics & Personal Care 0.5% | |
Edgewell Personal Care Co.
4.70%, due 5/19/21 | | | 6,235,000 | | | | 6,640,275 | |
4.70%, due 5/24/22 | | | 8,070,000 | | | | 8,614,725 | |
| | | | | | | | |
| | | | | | | 15,255,000 | |
| | | | | | | | |
Distribution & Wholesale 0.4% | |
American Tire Distributors, Inc.
10.25%, due 3/1/22 (d) | | | 5,885,000 | | | | 6,090,975 | |
H&E Equipment Services, Inc.
7.00%, due 9/1/22 | | | 5,740,000 | | | | 5,969,600 | |
| | | | | | | | |
| | | | | | | 12,060,575 | |
| | | | | | | | |
Diversified Financial Services 3.5% | |
AerCap Ireland Capital DAC / AerCap Global Aviation Trust
4.625%, due 10/30/20 | | | 2,495,000 | | | | 2,651,614 | |
5.00%, due 10/1/21 | | | 5,465,000 | | | | 5,914,381 | |
| | | | | | | | |
| | | Principal
Amount | | | Value | |
Diversified Financial Services (continued) | |
Ally Financial, Inc.
6.25%, due 12/1/17 | | $ | 1,395,000 | | | $ | 1,419,134 | |
CFG Holdings, Ltd. / CFG Finance LLC
11.50%, due 11/15/19 (d) | | | 6,915,000 | | | | 7,087,875 | |
Credit Acceptance Corp.
6.125%, due 2/15/21 | | | 3,700,000 | | | | 3,792,500 | |
7.375%, due 3/15/23 | | | 5,795,000 | | | | 6,026,800 | |
E*TRADE Financial Corp.
4.625%, due 9/15/23 | | | 2,500,000 | | | | 2,600,000 | |
5.375%, due 11/15/22 | | | 5,700,000 | | | | 5,991,857 | |
5.875%, due 12/29/49 (f) | | | 1,475,000 | | | | 1,563,500 | |
Exela Intermediate LLC / Exela Finance, Inc.
10.00%, due 7/15/23 (d) | | | 7,135,000 | | | | 7,045,812 | |
KCG Holdings, Inc.
6.875%, due 3/15/20 (d) | | | 8,775,000 | | | | 9,082,125 | |
Ladder Capital Finance Holdings LLLP / Ladder Capital Finance Corp.
5.25%, due 3/15/22 (d) | | | 6,685,000 | | | | 6,868,837 | |
5.875%, due 8/1/21 (d) | | | 8,560,000 | | | | 8,752,600 | |
Lincoln Finance, Ltd.
7.375%, due 4/15/21 (d) | | | 5,545,000 | | | | 5,877,700 | |
Nationstar Mortgage LLC / Nationstar Capital Corp.
6.50%, due 8/1/18 | | | 1,304,000 | | | | 1,307,260 | |
7.875%, due 10/1/20 | | | 5,476,000 | | | | 5,626,590 | |
Ocwen Loan Servicing LLC
8.375%, due 11/15/22 (d) | | | 4,025,000 | | | | 3,793,562 | |
OneMain Financial Holdings LLC
6.75%, due 12/15/19 (d) | | | 2,600,000 | | | | 2,730,000 | |
7.25%, due 12/15/21 (d) | | | 3,326,000 | | | | 3,503,110 | |
Orchestra Borrower LLC / Orchestra Co-issuer, Inc.
6.75%, due 6/15/22 (d) | | | 7,900,000 | | | | 8,140,160 | |
Springleaf Finance Corp.
8.25%, due 12/15/20 | | | 2,725,000 | | | | 3,058,813 | |
Werner FinCo, L.P. / Werner FinCo, Inc.
8.75%, due 7/15/25 (d) | | | 3,380,000 | | | | 3,405,350 | |
| | | | | | | | |
| | | | | | | 106,239,580 | |
| | | | | | | | |
Electric 1.9% | |
Calpine Corp.
5.875%, due 1/15/24 (d) | | | 6,235,000 | | | | 6,422,050 | |
6.00%, due 1/15/22 (d) | | | 8,255,000 | | | | 8,533,606 | |
GenOn Energy, Inc.
7.875%, due 6/15/18 (g)(h) | | | 22,767,000 | | | | 13,660,200 | |
9.50%, due 10/15/18 (g)(h) | | | 19,471,000 | | | | 11,585,245 | |
NRG Energy, Inc.
6.625%, due 1/15/27 | | | 6,300,000 | | | | 6,307,875 | |
| | | | |
| 12 | | MainStay VP High Yield Corporate Bond Portfolio | | The notes to the financial statements are an integral part of,
and should be read in conjunction with, the financial statements. |
| | | | | | | | |
| | | Principal
Amount | | | Value | |
| Corporate Bonds (continued) | |
Electric (continued) | |
NRG REMA LLC | |
Series B
9.237%, due 7/2/17 | | $ | 970,546 | | | $ | 960,841 | |
Series C
9.681%, due 7/2/26 | | | 11,280,000 | | | | 8,460,000 | |
Public Service Co. of New Mexico
7.95%, due 5/15/18 | | | 1,805,000 | | | | 1,899,346 | |
| | | | | | | | |
| | | | | | | 57,829,163 | |
| | | | | | | | |
Electrical Components & Equipment 1.2% | |
Belden, Inc.
5.50%, due 9/1/22 (d) | | | 15,333,000 | | | | 15,792,990 | |
General Cable Corp.
5.75%, due 10/1/22 | | | 14,730,000 | | | | 14,730,000 | |
WESCO Distribution, Inc.
5.375%, due 12/15/21 | | | 7,160,000 | | | | 7,437,450 | |
| | | | | | | | |
| | | | | | | 37,960,440 | |
| | | | | | | | |
Electronics 0.4% | |
Allegion PLC
5.875%, due 9/15/23 | | | 3,000,000 | | | | 3,217,500 | |
Allegion U.S. Holding Co., Inc.
5.75%, due 10/1/21 | | | 7,105,000 | | | | 7,371,438 | |
| | | | | | | | |
| | | | | | | 10,588,938 | |
| | | | | | | | |
Engineering & Construction 0.3% | |
Tutor Perini Corp.
6.875%, due 5/1/25 (d) | | | 2,700,000 | | | | 2,841,750 | |
Weekley Homes LLC / Weekley Finance Corp.
6.00%, due 2/1/23 | | | 7,219,000 | | | | 7,020,478 | |
| | | | | | | | |
| | | | | | | 9,862,228 | |
| | | | | | | | |
Entertainment 1.1% | |
Churchill Downs, Inc.
5.375%, due 12/15/21 | | | 7,965,000 | | | | 8,263,688 | |
GLP Capital, L.P. / GLP Financing II, Inc. 4.875%, due 11/1/20 | | | 2,420,000 | | | | 2,580,325 | |
5.375%, due 4/15/26 | | | 1,660,000 | | | | 1,813,201 | |
Jacobs Entertainment, Inc.
7.875%, due 2/1/24 (d) | | | 2,193,000 | | | | 2,379,405 | |
NAI Entertainment Holdings / NAI Entertainment Holdings Finance Corp.
5.00%, due 8/1/18 (d) | | | 4,830,000 | | | | 4,830,000 | |
Rivers Pittsburgh Borrower, L.P. / Rivers Pittsburgh Finance Corp.
6.125%, due 8/15/21 (d) | | | 4,270,000 | | | | 4,334,050 | |
Sterling Entertainment Enterprises LLC
9.75%, due 12/15/19 (b)(c)(e) | | | 10,000,000 | | | | 10,375,000 | |
| | | | | | | | |
| | | | 34,575,669 | |
| | | | | | | | |
| | | | | | | | |
| | | Principal
Amount | | | Value | |
Food 2.3% | |
B&G Foods, Inc. | |
5.25%, due 4/1/25 | | $ | 4,795,000 | | | $ | 4,890,900 | |
4.625%, due 6/1/21 | | | 5,000,000 | | | | 5,106,250 | |
C&S Group Enterprises LLC
5.375%, due 7/15/22 (d) | | | 15,530,000 | | | | 15,297,050 | |
Ingles Markets, Inc.
5.75%, due 6/15/23 | | | 4,880,000 | | | | 4,800,700 | |
KeHE Distributors LLC / KeHE Finance Corp.
7.625%, due 8/15/21 (d) | | | 7,540,000 | | | | 7,558,850 | |
Lamb Weston Holdings, Inc. | |
4.625%, due 11/1/24 (d) | | | 2,340,000 | | | | 2,410,200 | |
4.875%, due 11/1/26 (d) | | | 2,500,000 | | | | 2,590,625 | |
Land O’ Lakes, Inc.
6.00%, due 11/15/22 (d) | | | 7,880,000 | | | | 8,746,800 | |
Land O’Lakes Capital Trust I
7.45%, due 3/15/28 (d) | | | 5,130,000 | | | | 5,886,675 | |
TreeHouse Foods, Inc.
6.00%, due 2/15/24 (d) | | | 6,155,000 | | | | 6,555,075 | |
Wells Enterprises, Inc.
6.75%, due 2/1/20 (d) | | | 6,897,000 | | | | 7,129,774 | |
| | | | | | | | |
| | | | 70,972,899 | |
| | | | | | | | |
Forest Products & Paper 0.8% | |
Mercer International, Inc.
6.50%, due 2/1/24 (d) | | | 6,005,000 | | | | 6,270,361 | |
Smurfit Kappa Treasury Funding, Ltd.
7.50%, due 11/20/25 | | | 15,768,000 | | | | 18,842,760 | |
| | | | | | | | |
| | | | 25,113,121 | |
| | | | | | | | |
Gas 0.7% | |
AmeriGas Partners, L.P. / AmeriGas Finance Corp. | | | | | | | | |
5.50%, due 5/20/25 | | | 2,050,000 | | | | 2,091,000 | |
5.625%, due 5/20/24 | | | 7,385,000 | | | | 7,606,550 | |
5.75%, due 5/20/27 | | | 5,455,000 | | | | 5,523,187 | |
5.875%, due 8/20/26 | | | 6,495,000 | | | | 6,657,375 | |
| | | | | | | | |
| | | | 21,878,112 | |
| | | | | | | | |
Health Care—Products 0.3% | |
Alere, Inc.
6.375%, due 7/1/23 (d) | | | 600,000 | | | | 644,250 | |
Hill-Rom Holdings, Inc.
5.75%, due 9/1/23 (d) | | | 4,705,000 | | | | 4,952,013 | |
Hologic, Inc.
5.25%, due 7/15/22 (d) | | | 3,760,000 | | | | 3,948,000 | |
| | | | | | | | |
| | | | 9,544,263 | |
| | | | | | | | |
Health Care—Services 4.7% | |
Acadia Healthcare Co., Inc. | |
5.625%, due 2/15/23 | | | 6,640,000 | | | | 6,868,250 | |
6.50%, due 3/1/24 | | | 1,865,000 | | | | 1,990,888 | |
| | | | | | |
The notes to the financial statements are an integral part of,
and should be read in conjunction with, the financial statements. | | | | | 13 | |
Portfolio of Investments June 30, 2017 (Unaudited) (continued)
| | | | | | | | |
| | | Principal
Amount | | | Value | |
| Corporate Bonds (continued) | |
Health Care—Services (continued) | |
Centene Corp. | |
4.75%, due 1/15/25 | | $ | 4,605,000 | | | $ | 4,731,637 | |
5.625%, due 2/15/21 | | | 5,305,000 | | | | 5,530,462 | |
6.125%, due 2/15/24 | | | 6,315,000 | | | | 6,827,652 | |
CHS / Community Health Systems, Inc.
6.25%, due 3/31/23 | | | 4,165,000 | | | | 4,299,738 | |
Fresenius Medical Care U.S. Finance II, Inc. | | | | | | | | |
4.75%, due 10/15/24 (d) | | | 2,970,000 | | | | 3,118,500 | |
5.625%, due 7/31/19 (d) | | | 460,000 | | | | 486,450 | |
6.50%, due 9/15/18 (d) | | | 3,750,000 | | | | 3,939,825 | |
¨HCA, Inc. | |
5.00%, due 3/15/24 | | | 8,637,000 | | | | 9,144,424 | |
5.25%, due 4/15/25 | | | 7,985,000 | | | | 8,583,875 | |
5.25%, due 6/15/26 | | | 2,875,000 | | | | 3,100,688 | |
5.375%, due 2/1/25 | | | 2,320,000 | | | | 2,447,136 | |
5.875%, due 3/15/22 | | | 5,130,000 | | | | 5,687,887 | |
5.875%, due 5/1/23 | | | 4,200,000 | | | | 4,572,750 | |
5.875%, due 2/15/26 | | | 3,655,000 | | | | 3,947,400 | |
7.50%, due 2/15/22 | | | 1,570,000 | | | | 1,807,463 | |
7.58%, due 9/15/25 | | | 1,770,000 | | | | 2,031,075 | |
7.69%, due 6/15/25 | | | 6,490,000 | | | | 7,528,400 | |
8.00%, due 10/1/18 | | | 1,738,000 | | | | 1,868,350 | |
8.36%, due 4/15/24 | | | 1,020,000 | | | | 1,218,900 | |
HealthSouth Corp.
5.75%, due 11/1/24 | | | 4,675,000 | | | | 4,797,719 | |
IASIS Healthcare LLC / IASIS Capital Corp.
8.375%, due 5/15/19 | | | 3,415,000 | | | | 3,432,075 | |
Molina Healthcare, Inc.
5.375%, due 11/15/22 | | | 6,615,000 | | | | 7,003,631 | |
MPH Acquisition Holdings LLC
7.125%, due 6/1/24 (d) | | | 17,330,000 | | | | 18,478,112 | |
Quorum Health Corp.
11.625%, due 4/15/23 | | | 2,565,000 | | | | 2,263,613 | |
Tenet Healthcare Corp. | |
4.625%, due 7/15/24 (d) | | | 1,285,000 | | | | 1,286,606 | |
5.125%, due 5/1/25 (d) | | | 3,140,000 | | | | 3,151,775 | |
6.75%, due 6/15/23 | | | 2,585,000 | | | | 2,585,000 | |
7.50%, due 1/1/22 (d) | | | 1,785,000 | | | | 1,936,368 | |
8.125%, due 4/1/22 | | | 3,150,000 | | | | 3,342,937 | |
THC Escrow Corp. III
4.625%, due 7/15/24 (d) | | | 1,605,000 | | | | 1,609,334 | |
WellCare Health Plans, Inc.
5.25%, due 4/1/25 | | | 4,455,000 | | | | 4,666,612 | |
| | | | | | | | |
| | | | 144,285,532 | |
| | | | | | | | |
Home Builders 2.4% | |
Ashton Woods USA LLC / Ashton Woods Finance Co.
6.875%, due 2/15/21 (d) | | | 11,465,000 | | | | 11,694,300 | |
| | | | | | | | |
| | | Principal
Amount | | | Value | |
Home Builders (continued) | |
AV Homes, Inc.
8.50%, due 7/1/19 | | $ | 8,215,000 | | | $ | 8,476,894 | |
Brookfield Residential Properties, Inc. | |
6.375%, due 5/15/25 (d) | | | 3,520,000 | | | | 3,643,200 | |
6.50%, due 12/15/20 (d) | | | 12,995,000 | | | | 13,417,337 | |
Brookfield Residential Properties, Inc. / Brookfield Residential U.S. Corp.
6.125%, due 7/1/22 (d) | | | 4,100,000 | | | | 4,243,500 | |
CalAtlantic Group, Inc.
6.625%, due 5/1/20 | | | 2,460,000 | | | | 2,724,450 | |
Century Communities, Inc.
6.875%, due 5/15/22 | | | 10,140,000 | | | | 10,647,000 | |
Mattamy Group Corp.
6.50%, due 11/15/20 (d) | | | 9,465,000 | | | | 9,654,300 | |
New Home Co., Inc.
7.25%, due 4/1/22 (d) | | | 5,400,000 | | | | 5,589,000 | |
Taylor Morrison Communities, Inc. / Monarch Communities, Inc.
5.25%, due 4/15/21 (d) | | | 968,000 | | | | 992,200 | |
WCI Communities, Inc. / Lennar Corp.
6.875%, due 8/15/21 | | | 3,175,000 | | | | 3,304,191 | |
| | | | | | | | |
| | | | 74,386,372 | |
| | | | | | | | |
Household Products & Wares 0.7% | |
Prestige Brands, Inc. | |
5.375%, due 12/15/21 (d) | | | 2,665,000 | | | | 2,748,281 | |
6.375%, due 3/1/24 (d) | | | 5,690,000 | | | | 6,081,188 | |
Spectrum Brands, Inc. | |
5.75%, due 7/15/25 | | | 6,205,000 | | | | 6,655,483 | |
6.625%, due 11/15/22 | | | 6,590,000 | | | | 6,903,025 | |
| | | | | | | | |
| | | | 22,387,977 | |
| | | | | | | | |
Insurance 1.4% | |
American Equity Investment Life Holding Co. | | | | | | | | |
5.00%, due 6/15/27 | | | 8,145,000 | | | | 8,384,259 | |
6.625%, due 7/15/21 | | | 7,970,000 | | | | 8,244,367 | |
Fairfax Financial Holdings, Ltd.
8.30%, due 4/15/26 | | | 4,645,000 | | | | 5,779,564 | |
Fidelity & Guaranty Life Holdings, Inc.
6.375%, due 4/1/21 (d) | | | 7,858,000 | | | | 8,093,740 | |
MGIC Investment Corp.
5.75%, due 8/15/23 | | | 6,925,000 | | | | 7,461,688 | |
USIS Merger Sub, Inc.
6.875%, due 5/1/25 (d) | | | 5,745,000 | | | | 5,845,538 | |
| | | | | | | | |
| | | | 43,809,156 | |
| | | | | | | | |
Internet 2.0% | |
Cogent Communications Group, Inc.
5.375%, due 3/1/22 (d) | | | 2,870,000 | | | | 3,013,500 | |
Match Group, Inc. | |
6.375%, due 6/1/24 | | | 1,250,000 | | | | 1,359,375 | |
6.75%, due 12/15/22 | | | 17,140,000 | | | | 17,825,600 | |
| | | | |
| 14 | | MainStay VP High Yield Corporate Bond Portfolio | | The notes to the financial statements are an integral part of,
and should be read in conjunction with, the financial statements. |
| | | | | | | | |
| | | Principal
Amount | | | Value | |
| Corporate Bonds (continued) | |
Internet (continued) | |
Netflix, Inc. | |
5.50%, due 2/15/22 | | $ | 7,455,000 | | | $ | 8,095,608 | |
5.75%, due 3/1/24 | | | 10,139,000 | | | | 11,064,184 | |
5.875%, due 2/15/25 | | | 3,080,000 | | | | 3,411,100 | |
Symantec Corp.
5.00%, due 4/15/25 (d) | | | 3,540,000 | | | | 3,704,822 | |
VeriSign, Inc. | |
4.75%, due 7/15/27 (d) | �� | | 3,690,000 | | | | 3,731,513 | |
5.25%, due 4/1/25 | | | 8,065,000 | | | | 8,609,387 | |
| | | | | | | | |
| | | | 60,815,089 | |
| | | | | | | | |
Investment Management/Advisory Services 0.4% | |
Drawbridge Special Opportunities Fund, L.P. / Drawbridge Special Opportunities Finance
5.00%, due 8/1/21 (d) | | | 7,115,000 | | | | 7,174,944 | |
NFP Corp.
9.00%, due 7/15/21 (d) | | | 4,170,000 | | | | 4,375,581 | |
| | | | | | | | |
| | | | 11,550,525 | |
| | | | | | | | |
Iron & Steel 0.8% | |
Allegheny Ludlum LLC
6.95%, due 12/15/25 | | | 4,355,000 | | | | 4,235,237 | |
Allegheny Technologies, Inc.
7.875%, due 8/15/23 | | | 6,833,000 | | | | 7,140,485 | |
BlueScope Steel Finance, Ltd. / BlueScope Steel Finance USA LLC
6.50%, due 5/15/21 (d) | | | 11,939,000 | | | | 12,595,645 | |
Evraz, Inc. N.A.
7.50%, due 11/15/19 (d) | | | 85,000 | | | | 86,913 | |
| | | | | | | | |
| | | | 24,058,280 | |
| | | | | | | | |
Leisure Time 1.5% | |
Brunswick Corp.
4.625%, due 5/15/21 (d) | | | 5,900,000 | | | | 6,028,160 | |
¨Carlson Travel, Inc. | |
6.75%, due 12/15/23 (d) | | | 18,640,000 | | | | 18,966,200 | |
9.50%, due 12/15/24 (d) | | | 11,438,000 | | | | 11,709,652 | |
Vista Outdoor, Inc.
5.875%, due 10/1/23 | | | 10,284,000 | | | | 10,566,810 | |
| | | | | | | | |
| | | | 47,270,822 | |
| | | | | | | | |
Lodging 0.7% | |
Boyd Gaming Corp.
6.375%, due 4/1/26 | | | 2,935,000 | | | | 3,173,469 | |
Choice Hotels International, Inc.
5.75%, due 7/1/22 | | | 8,283,000 | | | | 9,214,837 | |
Hilton Domestic Operating Co., Inc.
4.25%, due 9/1/24 (d) | | | 1,200,000 | | | | 1,216,500 | |
Jack Ohio Finance LLC / Jack Ohio Finance 1 Corp.
6.75%, due 11/15/21 (d) | | | 5,940,000 | | | | 6,207,300 | |
| | | | | | | | |
| | | | 19,812,106 | |
| | | | | | | | |
| | | | | | | | |
| | | Principal
Amount | | | Value | |
Machinery—Construction & Mining 0.2% | |
BlueLine Rental Finance Corp. / BlueLine Rental LLC
9.25%, due 3/15/24 (d) | | $ | 6,270,000 | | | $ | 6,520,800 | |
| | | | | | | | |
|
Machinery—Diversified 0.6% | |
Briggs & Stratton Corp.
6.875%, due 12/15/20 | | | 5,030,000 | | | | 5,545,575 | |
Tennant Co.
5.625%, due 5/1/25 (d) | | | 3,035,000 | | | | 3,186,750 | |
Zebra Technologies Corp.
7.25%, due 10/15/22 | | | 8,520,000 | | | | 9,052,500 | |
| | | | | | | | |
| | | | 17,784,825 | |
| | | | | | | | |
Media 6.4% | |
Altice Financing S.A.
7.50%, due 5/15/26 (d) | | | 4,965,000 | | | | 5,511,150 | |
Altice U.S. Finance I Corp.
5.375%, due 7/15/23 (d) | | | 6,840,000 | | | | 7,117,875 | |
Block Communications, Inc.
6.875%, due 2/15/25 (d) | | | 10,175,000 | | | | 10,912,687 | |
Cablevision Systems Corp.
7.75%, due 4/15/18 | | | 4,826,000 | | | | 5,006,975 | |
¨CCO Holdings LLC / CCO Holdings Capital Corp. | | | | | | | | |
5.125%, due 2/15/23 | | | 5,130,000 | | | | 5,293,519 | |
5.125%, due 5/1/23 (d) | | | 5,805,000 | | | | 6,095,250 | |
5.125%, due 5/1/27 (d) | | | 12,680,000 | | | | 12,965,300 | |
5.25%, due 9/30/22 | | | 500,000 | | | | 514,700 | |
5.375%, due 5/1/25 (d) | | | 2,596,000 | | | | 2,764,740 | |
5.75%, due 1/15/24 | | | 4,118,000 | | | | 4,339,343 | |
5.75%, due 2/15/26 (d) | | | 3,335,000 | | | | 3,568,450 | |
5.875%, due 4/1/24 (d) | | | 8,005,000 | | | | 8,545,337 | |
5.875%, due 5/1/27 (d) | | | 3,750,000 | | | | 4,007,813 | |
Cogeco Communications, Inc.
4.875%, due 5/1/20 (d) | | | 7,110,000 | | | | 7,269,975 | |
CSC Holdings LLC | |
7.625%, due 7/15/18 | | | 95,000 | | | | 100,225 | |
7.875%, due 2/15/18 | | | 965,000 | | | | 995,156 | |
DISH DBS Corp. | |
5.875%, due 7/15/22 | | | 3,320,000 | | | | 3,569,000 | |
5.875%, due 11/15/24 | | | 9,060,000 | | | | 9,666,748 | |
Midcontinent Communications / Midcontinent Finance Corp.
6.875%, due 8/15/23 (d) | | | 4,205,000 | | | | 4,530,888 | |
Quebecor Media, Inc.
5.75%, due 1/15/23 | | | 15,647,000 | | | | 16,507,585 | |
SFR Group S.A. | |
6.00%, due 5/15/22 (d) | | | 7,320,000 | | | | 7,658,550 | |
6.25%, due 5/15/24 (d) | | | 1,000,000 | | | | 1,056,250 | |
7.375%, due 5/1/26 (d) | | | 13,000,000 | | | | 14,105,000 | |
| | | | | | |
The notes to the financial statements are an integral part of,
and should be read in conjunction with, the financial statements. | | | | | 15 | |
Portfolio of Investments June 30, 2017 (Unaudited) (continued)
| | | | | | | | |
| | | Principal
Amount | | | Value | |
| Corporate Bonds (continued) | |
Media (continued) | |
Sirius XM Radio, Inc.
5.00%, due 8/1/27 (d) | | $ | 4,640,000 | | | $ | 4,674,800 | |
Videotron, Ltd. | |
5.00%, due 7/15/22 | | | 4,865,000 | | | | 5,144,738 | |
5.125%, due 4/15/27 (d) | | | 5,890,000 | | | | 6,051,975 | |
5.375%, due 6/15/24 (d) | | | 11,450,000 | | | | 12,094,062 | |
Virgin Media Secured Finance PLC
5.25%, due 1/15/21 | | | 23,257,000 | | | | 24,884,990 | |
| | | | | | | | |
| | | | 194,953,081 | |
| | | | | | | | |
Metal Fabricate & Hardware 1.2% | |
Grinding Media, Inc. / MC Grinding Media Canada, Inc.
7.375%, due 12/15/23 (d) | | | 11,460,000 | | | | 12,462,750 | |
Novelis Corp. | |
5.875%, due 9/30/26 (d) | | | 7,240,000 | | | | 7,457,200 | |
6.25%, due 8/15/24 (d) | | | 6,385,000 | | | | 6,704,250 | |
Optimas OE Solutions Holding LLC / Optimas OE Solutions, Inc.
8.625%, due 6/1/21 (d) | | | 5,300,000 | | | | 5,233,750 | |
Park-Ohio Industries, Inc.
6.625%, due 4/15/27 (d) | | | 5,325,000 | | | | 5,591,250 | |
| | | | | | | | |
| | | | 37,449,200 | |
| | | | | | | | |
Mining 3.3% | |
Alcoa Nederland Holding B.V. | |
6.75%, due 9/30/24 (d) | | | 2,315,000 | | | | 2,511,775 | |
7.00%, due 9/30/26 (d) | | | 4,295,000 | | | | 4,713,763 | |
Aleris International, Inc. | |
7.875%, due 11/1/20 | | | 9,205,000 | | | | 8,675,713 | |
9.50%, due 4/1/21 (d) | | | 13,015,000 | | | | 13,383,194 | |
First Quantum Minerals, Ltd.
7.25%, due 4/1/23 (d) | | | 4,880,000 | | | | 4,770,200 | |
¨Freeport McMoRan, Inc. | |
6.50%, due 11/15/20 | | | 8,530,000 | | | | 8,753,912 | |
6.625%, due 5/1/21 | | | 7,725,000 | | | | 7,879,500 | |
6.75%, due 2/1/22 | | | 4,079,000 | | | | 4,221,765 | |
6.875%, due 2/15/23 | | | 22,020,000 | | | | 23,244,752 | |
Hecla Mining Co.
6.875%, due 5/1/21 | | | 13,260,000 | | | | 13,757,250 | |
Joseph T. Ryerson & Son, Inc.
11.00%, due 5/15/22 (d) | | | 2,175,000 | | | | 2,460,469 | |
Lundin Mining Corp.
7.50%, due 11/1/20 (d) | | | 860,000 | | | | 904,204 | |
Petra Diamonds U.S. Treasury PLC
7.25%, due 5/1/22 (d) | | | 6,750,000 | | | | 6,908,271 | |
| | | | | | | | |
| | | | 102,184,768 | |
| | | | | | | | |
Miscellaneous—Manufacturing 1.0% | |
Amsted Industries, Inc.
5.00%, due 3/15/22 (d) | | | 2,715,000 | | | | 2,803,238 | |
| | | | | | | | |
| | | Principal
Amount | | | Value | |
Miscellaneous—Manufacturing (continued) | |
CTP Transportation Products LLC / CTP Finance, Inc.
8.25%, due 12/15/19 (d) | | $ | 8,205,000 | | | $ | 7,640,906 | |
EnPro Industries, Inc. | |
5.875%, due 9/15/22 | | | 5,180,000 | | | | 5,400,150 | |
5.875%, due 9/15/22 (d) | | | 1,000,000 | | | | 1,042,500 | |
Gates Global LLC / Gates Global Co.
6.00%, due 7/15/22 (d) | | | 10,480,000 | | | | 10,506,200 | |
Koppers, Inc.
6.00%, due 2/15/25 (d) | | | 4,100,000 | | | | 4,356,250 | |
| | | | | | | | |
| | | | 31,749,244 | |
| | | | | | | | |
Oil & Gas 7.9% | |
Ascent Resources Utica Holdings LLC / ARU Finance Corp.
10.00%, due 4/1/22 (d) | | | 4,945,000 | | | | 4,945,000 | |
California Resources Corp. | |
5.00%, due 1/15/20 | | | 15,330,000 | | | | 10,271,100 | |
8.00%, due 12/15/22 (d) | | | 7,385,000 | | | | 4,671,013 | |
Callon Petroleum Co. | |
6.125%, due 10/1/24 (d) | | | 2,000,000 | | | | 2,035,000 | |
6.125%, due 10/1/24 | | | 3,950,000 | | | | 4,019,125 | |
Calumet Specialty Products Partners, L.P. / Calumet Finance Corp. | | | | | | | | |
6.50%, due 4/15/21 | | | 996,000 | | | | 861,540 | |
7.625%, due 1/15/22 | | | 2,815,000 | | | | 2,463,125 | |
11.50%, due 1/15/21 (d) | | | 10,555,000 | | | | 12,191,025 | |
Carrizo Oil & Gas, Inc.
7.50%, due 9/15/20 | | | 4,480,000 | | | | 4,558,400 | |
Comstock Resources, Inc.
10.00% (10.00% Cash or 12.25% PIK), due 3/15/20 (a) | | | 20,760,000 | | | | 20,708,100 | |
Concho Resources, Inc.
5.50%, due 10/1/22 | | | 3,255,000 | | | | 3,340,444 | |
Continental Resources, Inc.
5.00%, due 9/15/22 | | | 7,000,000 | | | | 6,868,750 | |
Delek Logistics Partners LP
6.75%, due 5/15/25 (d) | | | 3,075,000 | | | | 3,105,750 | |
Gulfport Energy Corp. | |
6.00%, due 10/15/24 (d) | | | 12,235,000 | | | | 11,898,537 | |
6.375%, due 5/15/25 (d) | | | 7,115,000 | | | | 7,008,275 | |
Jones Energy Holdings LLC / Jones Energy Finance Corp.
6.75%, due 4/1/22 | | | 3,190,000 | | | | 2,248,950 | |
Matador Resources Co.
6.875%, due 4/15/23 | | | 4,390,000 | | | | 4,554,625 | |
Murphy Oil Corp.
6.875%, due 8/15/24 | | | 3,315,000 | | | | 3,464,175 | |
Murphy Oil USA, Inc. | |
5.625%, due 5/1/27 | | | 635,000 | | | | 660,400 | |
6.00%, due 8/15/23 | | | 7,150,000 | | | | 7,543,250 | |
| | | | |
| 16 | | MainStay VP High Yield Corporate Bond Portfolio | | The notes to the financial statements are an integral part of,
and should be read in conjunction with, the financial statements. |
| | | | | | | | |
| | �� | Principal
Amount | | | Value | |
| Corporate Bonds (continued) | |
Oil & Gas (continued) | |
Newfield Exploration Co. | |
5.625%, due 7/1/24 | | $ | 6,565,000 | | | $ | 6,844,012 | |
5.75%, due 1/30/22 | | | 3,715,000 | | | | 3,910,038 | |
Oasis Petroleum, Inc. | |
6.50%, due 11/1/21 | | | 3,166,000 | | | | 3,071,020 | |
6.875%, due 3/15/22 | | | 1,480,000 | | | | 1,435,600 | |
Parsley Energy LLC / Parsley Finance Corp.
5.25%, due 8/15/25 (d) | | | 4,140,000 | | | | 4,129,650 | |
PDC Energy, Inc. | |
6.125%, due 9/15/24 (d) | | | 705,000 | | | | 715,575 | |
7.75%, due 10/15/22 | | | 11,090,000 | | | | 11,505,875 | |
PetroQuest Energy, Inc.
10.00% (1.00% Cash and 9.00% PIK), due 2/15/21 (a)(d) | | | 18,693,415 | | | | 13,412,525 | |
Range Resources Corp. | |
5.75%, due 6/1/21 (d) | | | 6,610,000 | | | | 6,742,200 | |
5.875%, due 7/1/22 (d) | | | 6,400,000 | | | | 6,496,000 | |
Rex Energy Corp.
1.00%, due 10/1/20 (i) | | | 40,580,000 | | | | 22,116,100 | |
RSP Permian, Inc. | |
5.25%, due 1/15/25 (d) | | | 3,000,000 | | | | 3,003,750 | |
6.625%, due 10/1/22 | | | 5,935,000 | | | | 6,157,562 | |
SM Energy Co. | |
6.50%, due 11/15/21 | | | 3,090,000 | | | | 3,005,025 | |
6.50%, due 1/1/23 | | | 2,935,000 | | | | 2,795,588 | |
Stone Energy Corp.
7.50%, due 5/31/22 | | | 7,553,857 | | | | 7,138,395 | |
WPX Energy, Inc. | |
6.00%, due 1/15/22 | | | 10,025,000 | | | | 9,924,750 | |
7.50%, due 8/1/20 | | | 11,785,000 | | | | 12,374,250 | |
| | | | | | | | |
| | | | 242,194,499 | |
| | | | | | | | |
Oil & Gas Services 0.4% | |
Forum Energy Technologies, Inc.
6.25%, due 10/1/21 | | | 13,290,000 | | | | 12,957,750 | |
| | | | | | | | |
|
Pharmaceuticals 1.3% | |
Endo Finance LLC
5.75%, due 1/15/22 (d) | | | 2,150,000 | | | | 1,934,570 | |
Endo Finance LLC / Endo Finco, Inc.
5.375%, due 1/15/23 (d) | | | 4,085,000 | | | | 3,410,975 | |
Endo Ltd. / Endo Finance LLC /
Endo Finco, Inc. | | | | | | | | |
5.875%, due 10/15/24 (d) | | | 1,000,000 | | | | 1,030,000 | |
6.00%, due 2/1/25 (d) | | | 4,735,000 | | | | 3,859,025 | |
inVentiv Group Holdings, Inc. / inVentiv Health, Inc. / inVentiv Health Clinical, Inc.
7.50%, due 10/1/24 (d) | | | 1,500,000 | | | | 1,627,500 | |
| | | | | | | | |
| | | Principal
Amount | | | Value | |
Pharmaceuticals (continued) | |
Nature’s Bounty Co. (The)
7.625%, due 5/15/21 (d) | | $ | 13,285,000 | | | $ | 14,115,313 | |
Patheon Holdings I B.V.
7.50%, due 2/1/22 (d) | | | 7,790,000 | | | | 8,276,875 | |
Valeant Pharmaceuticals International, Inc. | | | | | | | | |
7.00%, due 10/1/20 (d) | | | 1,975,000 | | | | 1,942,906 | |
7.50%, due 7/15/21 (d) | | | 3,320,000 | | | | 3,216,250 | |
| | | | | | | | |
| | | | 39,413,414 | |
| | | | | | | | |
Pipelines 3.7% | |
ANR Pipeline Co. | |
7.375%, due 2/15/24 | | | 395,000 | | | | 473,211 | |
9.625%, due 11/1/21 | | | 5,950,000 | | | | 7,584,774 | |
Antero Midstream Partners, L.P. / Antero Midstream Finance Corp.
5.375%, due 9/15/24 (d) | | | 3,115,000 | | | | 3,185,088 | |
Cheniere Corpus Christi Holdings LLC | |
5.875%, due 3/31/25 | | | 5,295,000 | | | | 5,645,794 | |
7.00%, due 6/30/24 | | | 1,100,000 | | | | 1,223,750 | |
EnLink Midstream Partners, L.P.
4.15%, due 6/1/25 | | | 2,246,000 | | | | 2,217,954 | |
Genesis Energy, L.P. / Genesis Energy Finance Corp. | | | | | | | | |
5.75%, due 2/15/21 | | | 2,570,000 | | | | 2,563,575 | |
6.75%, due 8/1/22 | | | 12,305,000 | | | | 12,335,762 | |
Holly Energy Partners, L.P. / Holly Energy Finance Corp.
6.00%, due 8/1/24 (d) | | | 4,340,000 | | | | 4,513,600 | |
MPLX, L.P. | |
4.875%, due 12/1/24 | | | 5,790,000 | | | | 6,173,101 | |
4.875%, due 6/1/25 | | | 9,383,000 | | | | 9,949,714 | |
5.50%, due 2/15/23 | | | 13,367,000 | | | | 13,724,835 | |
Northwest Pipeline LLC
7.125%, due 12/1/25 | | | 2,195,000 | | | | 2,636,904 | |
NuStar Logistics, L.P. | |
6.75%, due 2/1/21 | | | 6,125,000 | | | | 6,676,250 | |
8.15%, due 4/15/18 | | | 1,000,000 | | | | 1,045,000 | |
Rockies Express Pipeline LLC
6.00%, due 1/15/19 (d) | | | 4,463,000 | | | | 4,652,678 | |
Sabine Pass Liquefaction LLC
5.875%, due 6/30/26 | | | 6,485,000 | | | | 7,247,908 | |
SemGroup Corp.
6.375%, due 3/15/25 (d) | | | 3,640,000 | | | | 3,521,700 | |
Tallgrass Energy Partners, L.P. / Tallgrass Energy Finance Corp.
5.50%, due 9/15/24 (d) | | | 8,375,000 | | | | 8,479,687 | |
Tesoro Logistics, L.P. / Tesoro Logistics Finance Corp. | | | | | | | | |
6.125%, due 10/15/21 | | | 2,890,000 | | | | 3,005,600 | |
6.25%, due 10/15/22 | | | 1,405,000 | | | | 1,492,813 | |
6.375%, due 5/1/24 | | | 1,690,000 | | | | 1,829,425 | |
| | | | | | |
The notes to the financial statements are an integral part of,
and should be read in conjunction with, the financial statements. | | | | | 17 | |
Portfolio of Investments June 30, 2017 (Unaudited) (continued)
| | | | | | | | |
| | | Principal
Amount | | | Value | |
| Corporate Bonds (continued) | |
Pipelines (continued) | |
Williams Partners, L.P. / ACMP Finance Corp.
4.875%, due 3/15/24 | | $ | 3,760,000 | | | $ | 3,940,179 | |
| | | | | | | | |
| | | | 114,119,302 | |
| | | | | | | | |
Real Estate 1.7% | |
AAF Holdings LLC / AAF Finance Co.
12.00% (12.00% Cash or
12.75% PIK), due 7/1/19 (a)(d) | | | 10,293,755 | | | | 10,756,974 | |
CBRE Services, Inc. | |
5.00%, due 3/15/23 | | | 13,060,000 | | | | 13,606,718 | |
5.25%, due 3/15/25 | | | 2,895,000 | | | | 3,152,562 | |
Howard Hughes Corp. (The)
5.375%, due 3/15/25 (d) | | | 8,950,000 | | | | 9,151,375 | |
Realogy Group LLC / Realogy Co-Issuer Corp.
4.875%, due 6/1/23 (d) | | | 6,121,000 | | | | 6,166,908 | |
Rialto Holdings LLC / Rialto Corp.
7.00%, due 12/1/18 (d) | | | 10,480,000 | | | | 10,637,200 | |
| | | | | | | | |
| | | | 53,471,737 | |
| | | | | | | | |
Real Estate Investment Trusts 4.2% | |
¨Crown Castle International Corp.
5.25%, due 1/15/23 | | | 32,390,000 | | | | 35,980,075 | |
CTR Partnership LP / CareTrust Capital Corp.
5.25%, due 6/1/25 | | | 3,000,000 | | | | 3,090,000 | |
¨Equinix, Inc. | |
5.375%, due 1/1/22 | | | 4,715,000 | | | | 4,974,325 | |
5.375%, due 4/1/23 | | | 10,555,000 | | | | 10,964,006 | |
5.375%, due 5/15/27 | | | 13,760,000 | | | | 14,671,600 | |
5.75%, due 1/1/25 | | | 6,980,000 | | | | 7,512,225 | |
5.875%, due 1/15/26 | | | 10,114,000 | | | | 11,027,396 | |
FelCor Lodging, L.P.
5.625%, due 3/1/23 | | | 7,390,000 | | | | 7,667,125 | |
MGM Growth Properties Operating Partnership, L.P. / MGP Finance Co-Issuer, Inc. | | | | | | | | |
4.50%, due 9/1/26 | | | 2,000,000 | | | | 2,012,500 | |
5.625%, due 5/1/24 | | | 17,860,000 | | | | 19,467,400 | |
MPT Operating Partnership, L.P. /
MPT Finance Corp.
6.375%, due 2/15/22 | | | 800,000 | | | | 826,000 | |
Sabra Health Care, L.P. / Sabra Capital Corp. | | | | | | | | |
5.375%, due 6/1/23 | | | 2,000,000 | | | | 2,070,000 | |
5.50%, due 2/1/21 | | | 2,350,000 | | | | 2,444,000 | |
Starwood Property Trust
5.00%, due 12/15/21 (d) | | | 3,755,000 | | | | 3,905,200 | |
VEREIT Operating Partnership, L.P.
4.125%, due 6/1/21 | | | 1,285,000 | | | | 1,340,332 | |
| | | | | | | | |
| | | | 127,952,184 | |
| | | | | | | | |
| | | | | | | | |
| | | Principal
Amount | | | Value | |
Retail 3.9% | |
Asbury Automotive Group, Inc.
6.00%, due 12/15/24 | | $ | 14,385,000 | | | $ | 14,636,737 | |
AutoNation, Inc.
6.75%, due 4/15/18 | | | 3,926,000 | | | | 4,073,594 | |
Cumberland Farms, Inc.
6.75%, due 5/1/25 (d) | | | 5,860,000 | | | | 6,167,650 | |
Dollar Tree, Inc.
5.75%, due 3/1/23 | | | 8,000,000 | | | | 8,442,400 | |
DriveTime Automotive Group, Inc. / Bridgecrest Acceptance Corp.
8.00%, due 6/1/21 (d) | | | 13,440,000 | | | | 13,473,600 | |
GameStop Corp. | |
5.50%, due 10/1/19 (d) | | | 5,795,000 | | | | 5,961,606 | |
6.75%, due 3/15/21 (d) | | | 1,000,000 | | | | 1,039,000 | |
Group 1 Automotive, Inc. | |
5.00%, due 6/1/22 | | | 6,735,000 | | | | 6,836,025 | |
5.25%, due 12/15/23 (d) | | | 2,740,000 | | | | 2,767,400 | |
KFC Holding Co. / Pizza Hut Holdings LLC / Taco Bell of America LLC | | | | | | | | |
4.75%, due 6/1/27 (d) | | | 2,945,000 | | | | 3,007,581 | |
5.00%, due 6/1/24 (d) | | | 7,615,000 | | | | 7,938,637 | |
5.25%, due 6/1/26 (d) | | | 3,115,000 | | | | 3,278,538 | |
L Brands, Inc. | |
5.625%, due 2/15/22 | | | 4,330,000 | | | | 4,633,100 | |
6.625%, due 4/1/21 | | | 3,610,000 | | | | 3,998,075 | |
6.75%, due 7/1/36 | | | 6,045,000 | | | | 5,803,200 | |
6.875%, due 11/1/35 | | | 1,000,000 | | | | 965,000 | |
8.50%, due 6/15/19 | | | 1,555,000 | | | | 1,727,994 | |
Men’s Wearhouse, Inc. (The)
7.00%, due 7/1/22 | | | 13,755,000 | | | | 12,035,625 | |
Penske Automotive Group, Inc.
5.75%, due 10/1/22 | | | 6,670,000 | | | | 6,886,775 | |
Rite Aid Corp.
6.125%, due 4/1/23 (d) | | | 6,780,000 | | | | 6,657,113 | |
| | | | | | | | |
| | | | 120,329,650 | |
| | | | | | | | |
Semiconductors 1.3% | |
¨Micron Technology, Inc. | |
5.25%, due 8/1/23 (d) | | | 5,172,000 | | | | 5,371,122 | |
5.25%, due 1/15/24 (d) | | | 2,000,000 | | | | 2,070,000 | |
5.50%, due 2/1/25 | | | 6,493,000 | | | | 6,850,115 | |
7.50%, due 9/15/23 | | | 19,170,000 | | | | 21,432,060 | |
Qorvo, Inc.
7.00%, due 12/1/25 | | | 2,185,000 | | | | 2,479,975 | |
| | | | | | | | |
| | | | 38,203,272 | |
| | | | | | | | |
Software 2.8% | |
ACI Worldwide, Inc.
6.375%, due 8/15/20 (d) | | | 12,995,000 | | | | 13,271,144 | |
Activision Blizzard, Inc.
6.125%, due 9/15/23 (d) | | | 2,372,000 | | | | 2,559,625 | |
| | | | |
| 18 | | MainStay VP High Yield Corporate Bond Portfolio | | The notes to the financial statements are an integral part of,
and should be read in conjunction with, the financial statements. |
| | | | | | | | |
| | | Principal
Amount | | | Value | |
| Corporate Bonds (continued) | |
Software (continued) | |
Camelot Finance S.A.
7.875%, due 10/15/24 (d) | | $ | 1,540,000 | | | $ | 1,659,350 | |
Donnelley Financial Solutions, Inc.
8.25%, due 10/15/24 | | | 7,320,000 | | | | 7,759,200 | |
First Data Corp.
5.00%, due 1/15/24 (d) | | | 2,045,000 | | | | 2,103,139 | |
MSCI, Inc. | |
4.75%, due 8/1/26 (d) | | | 3,290,000 | | | | 3,381,462 | |
5.25%, due 11/15/24 (d) | | | 3,682,000 | | | | 3,902,920 | |
5.75%, due 8/15/25 (d) | | | 8,530,000 | | | | 9,239,014 | |
OpenText Corp.
5.875%, due 6/1/26 (d) | | | 10,350,000 | | | | 11,132,667 | |
PTC, Inc.
6.00%, due 5/15/24 | | | 14,035,000 | | | | 15,192,887 | |
Quintiles IMS, Inc. | |
4.875%, due 5/15/23 (d) | | | 4,870,000 | | | | 4,985,663 | |
5.00%, due 10/15/26 (d) | | | 9,792,000 | | | | 10,098,000 | |
RP Crown Parent LLC
7.375%, due 10/15/24 (d) | | | 1,480,000 | | | | 1,539,200 | |
| | | | | | | | |
| | | | 86,824,271 | |
| | | | | | | | |
Storage & Warehousing 0.2% | |
Algeco Scotsman Global Finance PLC
8.50%, due 10/15/18 (d) | | | 6,455,000 | | | | 6,035,425 | |
| | | | | | | | |
|
Telecommunications 5.3% | |
Anixter, Inc.
5.125%, due 10/1/21 | | | 2,895,000 | | | | 3,083,175 | |
CenturyLink, Inc.
5.625%, due 4/1/25 | | | 3,120,000 | | | | 3,114,789 | |
Cogent Communications Finance, Inc.
5.625%, due 4/15/21 (d) | | | 11,910,000 | | | | 12,237,525 | |
Frontier Communications Corp. | |
10.50%, due 9/15/22 | | | 4,475,000 | | | | 4,279,219 | |
11.00%, due 9/15/25 | | | 6,280,000 | | | | 5,824,700 | |
¨Hughes Satellite Systems Corp. | |
5.25%, due 8/1/26 | | | 7,035,000 | | | | 7,351,575 | |
6.50%, due 6/15/19 | | | 4,239,000 | | | | 4,578,120 | |
6.625%, due 8/1/26 | | | 6,710,000 | | | | 7,213,250 | |
7.625%, due 6/15/21 | | | 10,195,000 | | | | 11,584,069 | |
Inmarsat Finance PLC
4.875%, due 5/15/22 (d) | | | 5,925,000 | | | | 6,013,875 | |
Level 3 Communications, Inc.
5.75%, due 12/1/22 | | | 1,920,000 | | | | 1,992,000 | |
Level 3 Financing, Inc. | |
5.375%, due 1/15/24 | | | 2,300,000 | | | | 2,400,625 | |
5.625%, due 2/1/23 | | | 3,000,000 | | | | 3,120,000 | |
Sprint Capital Corp. | |
6.875%, due 11/15/28 | | | 11,425,000 | | | | 12,699,687 | |
8.75%, due 3/15/32 | | | 1,000,000 | | | | 1,260,000 | |
| | | | | | | | |
| | | Principal
Amount | | | Value | |
Telecommunications (continued) | |
Sprint Communications, Inc. | |
7.00%, due 3/1/20 (d) | | $ | 12,085,000 | | | $ | 13,267,155 | |
9.00%, due 11/15/18 (d) | | | 371,000 | | | | 402,650 | |
9.25%, due 4/15/22 | | | 1,750,000 | | | | 2,170,000 | |
¨T-Mobile USA, Inc. | |
5.125%, due 4/15/25 | | | 7,520,000 | | | | 7,896,000 | |
5.375%, due 4/15/27 | | | 7,560,000 | | | | 8,108,100 | |
6.00%, due 4/15/24 | | | 6,840,000 | | | | 7,318,800 | |
6.125%, due 1/15/22 | | | 6,844,000 | | | | 7,192,620 | |
6.375%, due 3/1/25 | | | 8,670,000 | | | | 9,374,437 | |
6.50%, due 1/15/24 | | | 7,505,000 | | | | 8,067,875 | |
6.50%, due 1/15/26 | | | 6,415,000 | | | | 7,080,556 | |
6.625%, due 4/1/23 | | | 5,470,000 | | | | 5,788,354 | |
| | | | | | | | |
| | | | 163,419,156 | |
| | | | | | | | |
Transportation 1.0% | |
Florida East Coast Holdings Corp. | |
6.75%, due 5/1/19 (d) | | | 15,695,000 | | | | 16,093,653 | |
9.75%, due 5/1/20 (d) | | | 12,970,000 | | | | 13,926,537 | |
| | | | | | | | |
| | | | 30,020,190 | |
| | | | | | | | |
Trucking & Leasing 0.2% | |
Fortress Transportation & Infrastructure Investors LLC
6.75%, due 3/15/22 (d) | | | 6,235,000 | | | | 6,344,113 | |
| | | | | | | | |
Total Corporate Bonds
(Cost $2,694,447,993) | | | | | | | 2,808,607,749 | |
| | | | | | | | |
|
| Loan Assignments 0.6% (j) | |
Diversified Financial Services 0.1% | |
VFH Parent LLC
2017 Term Loan
4.98%, due 10/15/21 | | | 4,000,000 | | | | 4,021,668 | |
| | | | | | | | |
|
Electronics 0.1% | |
Kemet Electronic Corp.
Term Loan B
7.17%, due 4/26/24 | | | 1,000,000 | | | | 1,002,500 | |
| | | | | | | | |
|
Household Products & Wares 0.1% | |
Prestige Brands, Inc.
Term Loan B4
3.98%, due 1/26/24 | | | 2,240,224 | | | | 2,248,224 | |
| | | | | | | | |
|
Retail 0.2% | |
Bass Pro Group LLC
Term Loan B
6.30%, due 12/16/23 | | | 6,700,000 | | | | 6,502,591 | |
| | | | | | | | |
| | | | | | |
The notes to the financial statements are an integral part of,
and should be read in conjunction with, the financial statements. | | | | | 19 | |
Portfolio of Investments June 30, 2017 (Unaudited) (continued)
| | | | | | | | |
| | | Principal
Amount | | | Value | |
| Loan Assignments (continued) | |
Transportation 0.1% | |
Commercial Barge Line Co.
2015 1st Lien Term Loan
9.98%, due 11/12/20 | | $ | 3,750,000 | | | $ | 3,239,063 | |
| | | | | | | | |
Total Loan Assignments
(Cost $17,446,099) | | | | | | | 17,014,046 | |
| | | | | | | | |
Total Long-Term Bonds
(Cost $2,788,443,843) | | | | | | | 2,893,160,608 | |
| | | | | | | | |
| | |
| | | | | | | | |
| | |
| | | Shares | | | | |
| Common Stocks 0.9% | | | | | | | | |
Auto Parts & Equipment 0.1% | | | | | | | | |
¨Exide Technologies
(b)(c)(d)(e)(k) | | | 612,830 | | | | 888,603 | |
| | | | | | | | |
|
Electric 0.0%‡ | |
Upstate New York Power
Producers, Inc. (b)(c)(e)(k) | | | 130,037 | | | | 156,044 | |
| | | | | | | | |
|
Home Builders 0.1% | |
Modular Space Corp. (b)(c)(e) | | | 239,066 | | | | 3,129,376 | |
| | | | | | | | |
|
Media 0.0%‡ | |
ION Media Networks, Inc.
(b)(c)(e) | | | 725 | | | | 491,978 | |
| | | | | | | | |
|
Metal Fabricate & Hardware 0.1% | |
Neenah Enterprises, Inc.
(b)(c)(e)(k) | | | 230,859 | | | | 2,541,758 | |
| | | | | | | | |
|
Oil & Gas 0.4% | |
PetroQuest Energy, Inc. (k) | | | 261,032 | | | | 516,843 | |
Rex Energy Corp. (b)(k) | | | 27,264 | | | | 78,793 | |
Stone Energy Corp. (b)(e)(k) | | | 637,880 | | | | 11,724,235 | |
Titan Energy LLC (k) | | | 25,911 | | | | 200,810 | |
| | | | | | | | |
| | | | 12,520,681 | |
| | | | | | | | |
Retail 0.2% | |
American Eagle Outfitters, Inc. | | | 556,651 | | | | 6,707,644 | |
| | | | | | | | |
Total Common Stocks
(Cost $52,832,113) | | | | | | | 26,436,084 | |
| | | | | | | | |
| | |
| Preferred Stock 0.1% | | | | | | | | |
Banks 0.1% | | | | | | | | |
GMAC Capital Trust I
6.967% (f) | | | 124,200 | | | | 3,254,040 | |
| | | | | | | | |
Total Preferred Stock
(Cost $3,028,994) | | | | 3,254,040 | |
| | | | | | | | |
| | | | | | | | |
| | | Principal
Amount | | | Value | |
| Short-Term Investment 3.9% | |
Money Market Funds 3.9% | |
State Street Institutional U.S. Government Money Market Fund, Premier Class 0.86% | | $ | 121,136,308 | | | $ | 121,136,308 | |
| | | | | | | | |
Total Short-Term Investment
(Cost $121,136,308) | | | | | | | 121,136,308 | |
| | | | | | | | |
Total Investments
(Cost $2,965,441,258) (l) | | | 99.3 | % | | | 3,043,987,040 | |
Other Assets, Less Liabilities | | | 0.7 | | | | 21,264,684 | |
Net Assets | | | 100.0 | % | | $ | 3,065,251,724 | |
| ‡ | Less than one-tenth of a percent. |
| (a) | PIK (“Payment-in-Kind”)—issuer may pay interest or dividends with additional securities and/or in cash. |
| (b) | Illiquid security—As of June 30, 2017, the total market value of these securities deemed illiquid under procedures approved by the Board of Trustees was $68,824,865, which represented 2.2% of the Portfolio’s net assets. |
| (c) | Fair valued security—Represents fair value as measured in good faith under procedures approved by the Board of Trustees. As of June 30, 2017, the total market value of fair valued securities was $57,021,837, which represented 1.9% of the Portfolio’s net assets. |
| (d) | May be sold to institutional investors only under Rule 144A or securities offered pursuant to Section 4(a)(2) of the Securities Act of 1933, as amended. |
| (f) | Floating rate—Rate shown was the rate in effect as of June 30, 2017. |
| (h) | Issue in non-accrual status. |
| (i) | Step coupon—Rate shown was the rate in effect as of June 30, 2017. |
| (j) | Floating Rate Loan—generally pays interest at rates which are periodically re-determined at a margin above the London InterBank Offered Rate or other short-term rates. The rate shown was the weighted average interest rate of all contracts within the floating rate loan facility as of June 30, 2017. |
| (k) | Non-income producing security. |
| (l) | As of June 30, 2017, cost was $2,965,880,912 for federal income tax purposes and net unrealized appreciation was as follows: |
| | | | |
Gross unrealized appreciation | | $ | 146,784,462 | |
Gross unrealized depreciation | | | (68,678,334 | ) |
| | | | |
Net unrealized appreciation | | $ | 78,106,128 | |
| | | | |
| | | | |
| 20 | | MainStay VP High Yield Corporate Bond Portfolio | | The notes to the financial statements are an integral part of,
and should be read in conjunction with, the financial statements. |
The following is a summary of the fair valuations according to the inputs used as of June 30, 2017, for valuing the Portfolio’s assets.
Asset Valuation Inputs
| | | | | | | | | | | | | | | | |
Description | | Quoted Prices in Active Markets for
Identical Assets (Level 1) | | | Significant Other Observable Inputs (Level 2) | | | Significant
Unobservable
Inputs (Level 3) | | | Total | |
| Investments in Securities (a) | | | | | | | | | |
| Long-Term Bonds | | | | | | | | | |
Convertible Bonds (b) | | $ | — | | | $ | 51,567,413 | | | $ | 15,971,400 | | | $ | 67,538,813 | |
Corporate Bonds (c) | | | — | | | | 2,774,765,071 | | | | 33,842,678 | | | | 2,808,607,749 | |
Loan Assignments (d) | | | — | | | | 16,011,546 | | | | 1,002,500 | | | | 17,014,046 | |
| | | | | | | | | | | | | | | | |
| Total Long-Term Bonds | | | — | | | | 2,842,344,030 | | | | 50,816,578 | | | | 2,893,160,608 | |
| | | | | | | | | | | | | | | | |
| Common Stocks (e) | | | 19,228,325 | | | | — | | | | 7,207,759 | | | | 26,436,084 | |
| Preferred Stock | | | 3,254,040 | | | | — | | | | — | | | | 3,254,040 | |
| Short-Term Investment | | | 121,136,308 | | | | — | | | | — | | | | 121,136,308 | |
| | | | | | | | | | | | | | | | |
| Total Investments in Securities | | $ | 143,618,673 | | | $ | 2,842,344,030 | | | $ | 58,024,337 | | | $ | 3,043,987,040 | |
| | | | | | | | | | | | | | | | |
| (a) | For a complete listing of investments and their industries, see the Portfolio of Investments. |
| (b) | The Level 3 securities valued at $15,971,400 are held in Auto Parts & Equipment within the Convertible Bonds section of the Portfolio of Investments. |
| (c) | The Level 3 securities valued at $23,467,678 and $10,375,000 are held in Auto Parts & Equipment and Entertainment, respectively, within the Corporate Bonds section of the Portfolio of Investments. |
| (d) | The Level 3 security valued at $1,002,500 is held in Pharmaceuticals within the Loan Assignments section of the Portfolio of Investments. |
| (e) | The Level 3 securities valued at $888,603, $156,044, $3,129,376, $491,978, and $2,541,758 are held in Auto Parts & Equipment, Electric, Home Builders, Media, and Metal Fabricate & Hardware, respectively, within the Common Stocks section of the Portfolio of Investments. |
The Portfolio recognizes transfers between the levels as of the beginning of the period.
For the period ended June 30, 2017, the Portfolio did not have any transfers among levels. (See Note 2)
The following is a reconciliation of investments in which significant unobservable inputs (Level 3) were used in determining value:
| | | | | | | | | | | | | | | | | | | | | | | | | | | | | | | | | | | | | | | | |
Investments in Securities | | Balance as of
December 31,
2016 | | | Accrued
Discounts
(Premiums) | | | Realized Gain (Loss) | | | Change in
Unrealized
Appreciation
(Depreciation) | | | Purchases | | | Sales | | | Transfers in to Level 3 | | | Transfers out of Level 3 | | | Balance as of
June 30,
2017 | | | Change in
Unrealized
Appreciation
(Depreciation)
from
Investments
Still Held at
June 30,
2017 (a) | |
| Long-Term Bonds | | | | | | | | | | | | | | | | | | | | | | | | | | | | | | | | | | | | | | | | |
Convertible Bonds | | | | | | | | | | | | | | | | | | | | | | | | | | | | | | | | | | | | | | | | |
Auto Parts & Equipment | | $ | 15,036,151 | | | $ | 128,715 | | | $ | 5,409 | | | $ | (4,198,278 | ) | | $ | 5,815,568 | (b) | | $ | (816,165 | ) | | $ | — | | | $ | — | | | $ | 15,971,400 | | | $ | (4,198,278 | ) |
Corporate Bonds | | | | | | | | | | | | | | | | | | | | | | | | | | | | | | | | | | | | | | | | |
Auto Parts & Equipment | | | 18,885,856 | | | | 161,058 | | | | (1,338,433 | ) | | | (503,021 | ) | | | 25,795,405 | (b) | | | (19,533,187 | ) | | | — | | | | — | | | | 23,467,678 | | | | (2,400,040 | ) |
Entertainment | | | 10,375,000 | | | | — | | | | — | | | | — | | | | — | | | | — | | | | — | | | | — | | | | 10,375,000 | | | | — | |
Oil & Gas | | | 2,182,400 | | | | — | | | | — | | | | (2,182,400 | ) | | | — | | | | — | | | | — | | | | — | | | | — | | | | — | |
Loan Assignments | | | | | | | | | | | | | | | | | | | | | | | | | | | | | | | | | | | | | | | | |
Pharmaceuticals | | | — | | | | 381 | | | | — | | | | 32,119 | | | | 970,000 | | | | — | | | | — | | | | — | | | | 1,002,500 | | | | 32,119 | |
Common Stocks | | | | | | | | | | | | | | | | | | | | | | | | | | | | | | | | | | | | | | | | |
Auto Parts & Equipment | | | 393,404 | | | | — | | | | — | | | | 495,199 | | | | — | | | | — | | | | — | | | | — | | | | 888,603 | | | | 495,199 | |
Electric | | | 156,044 | | | | — | | | | — | | | | — | | | | — | | | | — | | | | — | | | | — | | | | 156,044 | | | | — | |
Home Builders | | | — | | | | — | | | | — | | | | (353,735 | ) | | | 3,483,111 | | | | — | | | | — | | | | — | | | | 3,129,376 | | | | (353,735 | ) |
Media | | | 388,150 | | | | — | | | | — | | | | 103,828 | | | | — | | | | — | | | | — | | | | — | | | | 491,978 | | | | 103,828 | |
Metal Fabricate & Hardware | | | 2,541,758 | | | | — | | | | — | | | | — | | | | — | | | | — | | | | — | | | | — | | | | 2,541,758 | | | | — | |
| | | | | | | | | | | | | | | | | | | | | | | | | | | | | | | | | | | | | | | | |
Total | | $ | 49,958,763 | | | $ | 290,154 | | | $ | (1,333,024 | ) | | $ | (6,606,288 | ) | | $ | 36,064,084 | | | $ | (20,349,352 | ) | | $ | — | | | $ | — | | | $ | 58,024,337 | | | $ | (6,320,907 | ) |
| | | | | | | | | | | | | | | | | | | | | | | | | | | | | | | | | | | | | | | | |
| (a) | Included in “Net change in unrealized appreciation (depreciation) on investments” in the Statement of Operations. |
| (b) | Purchases include PIK securities. |
| | | | | | |
The notes to the financial statements are an integral part of,
and should be read in conjunction with, the financial statements. | | | | | 21 | |
Statement of Assets and Liabilities as of June 30, 2017 (Unaudited)
| | | | |
| Assets | |
Investment in securities, at value
(identified cost $2,965,441,258) | | $ | 3,043,987,040 | |
Receivables: | | | | |
Dividends and interest | | | 45,389,762 | |
Investment securities sold | | | 8,226,549 | |
Fund shares sold | | | 1,329,368 | |
Other assets | | | 17,117 | |
| | | | |
Total assets | | | 3,098,949,836 | |
| | | | |
| |
| Liabilities | | | | |
Payables: | | | | |
Investment securities purchased | | | 30,081,264 | |
Manager (See Note 3) | | | 1,408,724 | |
Fund shares redeemed | | | 1,326,523 | |
NYLIFE Distributors (See Note 3) | | | 503,713 | |
Shareholder communication | | | 282,879 | |
Professional fees | | | 44,703 | |
Custodian | | | 30,824 | |
Trustees | | | 5,205 | |
Accrued expenses | | | 14,277 | |
| | | | |
Total liabilities | | | 33,698,112 | |
| | | | |
Net assets | | $ | 3,065,251,724 | |
| | | | |
| |
| Composition of Net Assets | | | | |
Shares of beneficial interest outstanding (par value of $.001 per share) unlimited number of shares authorized | | $ | 299,341 | |
Additional paid-in capital | | | 2,833,556,676 | |
| | | | |
| | | 2,833,856,017 | |
Undistributed net investment income | | | 262,186,649 | |
Accumulated net realized gain (loss) on investments | | | (109,336,724 | ) |
Net unrealized appreciation (depreciation) on investments | | | 78,545,782 | |
| | | | |
Net assets | | $ | 3,065,251,724 | |
| | | | |
Initial Class | | | | |
Net assets applicable to outstanding shares | | $ | 622,436,817 | |
| | | | |
Shares of beneficial interest outstanding | | | 60,126,876 | |
| | | | |
Net asset value per share outstanding | | $ | 10.35 | |
| | | | |
Service Class | | | | |
Net assets applicable to outstanding shares | | $ | 2,442,814,907 | |
| | | | |
Shares of beneficial interest outstanding | | | 239,214,074 | |
| | | | |
Net asset value per share outstanding | | $ | 10.21 | |
| | | | |
| | | | |
| 22 | | MainStay VP High Yield Corporate Bond Portfolio | | The notes to the financial statements are an integral part of,
and should be read in conjunction with, the financial statements. |
Statement of Operations for the six months ended June 30, 2017 (Unaudited)
| | | | |
| Investment Income (Loss) | |
Income | | | | |
Interest | | $ | 96,754,289 | |
Dividends | | | 53,872 | |
| | | | |
Total income | | | 96,808,161 | |
| | | | |
Expenses | | | | |
Manager (See Note 3) | | | 8,393,809 | |
Distribution/Service—Service Class (See Note 3) | | | 2,965,099 | |
Shareholder communication | | | 226,381 | |
Professional fees | | | 109,167 | |
Trustees | | | 37,559 | |
Custodian | | | 12,049 | |
Miscellaneous | | | 57,085 | |
| | | | |
Total expenses | | | 11,801,149 | |
| | | | |
Net investment income (loss) | | | 85,007,012 | |
| | | | |
|
| Realized and Unrealized Gain (Loss) on Investments | |
Net realized gain (loss) on investments | | | 10,828,277 | |
Net change in unrealized appreciation (depreciation) on investments | | | 9,490,312 | |
| | | | |
Net realized and unrealized gain (loss) on investments | | | 20,318,589 | |
| | | | |
Net increase (decrease) in net assets resulting from operations | | $ | 105,325,601 | |
| | | | |
| | | | | | |
The notes to the financial statements are an integral part of,
and should be read in conjunction with, the financial statements. | | | | | 23 | |
Statements of Changes in Net Assets
for the six months ended June 30, 2017 (Unaudited) and the year ended December 31, 2016
| | | | | | | | |
| | | 2017 | | | 2016 | |
| Increase (Decrease) in Net Assets | |
Operations: | | | | | | | | |
Net investment income (loss) | | $ | 85,007,012 | | | $ | 176,767,723 | |
Net realized gain (loss) on investments | | | 10,828,277 | | | | (49,477,474 | ) |
Net change in unrealized appreciation (depreciation) on investments | | | 9,490,312 | | | | 294,691,720 | |
| | | | |
Net increase (decrease) in net assets resulting from operations | | | 105,325,601 | | | | 421,981,969 | |
| | | | |
Dividends to shareholders: | | | | | | | | |
From net investment income: | | | | | | | | |
Initial Class | | | — | | | | (37,709,814 | ) |
Service Class | | | — | | | | (124,197,329 | ) |
| | | | |
Total dividends to shareholders | | | — | | | | (161,907,143 | ) |
| | | | |
Capital share transactions: | | | | | | | | |
Net proceeds from sale of shares | | | 201,247,204 | | | | 330,225,247 | |
Net asset value of shares issued to shareholders in reinvestment of dividends | | | — | | | | 161,907,143 | |
Cost of shares redeemed | | | (222,642,753 | ) | | | (448,926,970 | ) |
| | | | |
Increase (decrease) in net assets derived from capital share transactions | | | (21,395,549 | ) | | | 43,205,420 | |
| | | | |
Net increase (decrease) in net assets | | | 83,930,052 | | | | 303,280,246 | |
|
| Net Assets | |
Beginning of period | | | 2,981,321,672 | | | | 2,678,041,426 | |
| | | | |
End of period | | $ | 3,065,251,724 | | | $ | 2,981,321,672 | |
| | | | |
Undistributed net investment income at end of period | | $ | 262,186,649 | | | $ | 177,179,637 | |
| | | | |
| | | | |
| 24 | | MainStay VP High Yield Corporate Bond Portfolio | | The notes to the financial statements are an integral part of,
and should be read in conjunction with, the financial statements. |
Financial Highlights selected per share data and ratios
| | | | | | | | | | | | | | | | | | | | | | | | | | | | |
| | | Six months
ended
June 30, | | | | | | Year ended December 31, | |
| Initial Class | | 2017* | | | | | | 2016 | | | 2015 | | | 2014 | | | 2013 | | | 2012 | |
Net asset value at beginning of period | | $ | 9.99 | | | | | | | $ | 9.10 | | | $ | 9.84 | | | $ | 10.26 | | | $ | 10.19 | | | $ | 9.52 | |
| | | | | | | | | | | | | | | | | | | | | | | | | | | | |
Net investment income (loss) (a) | | | 0.30 | | | | | | | | 0.62 | | | | 0.59 | | | | 0.61 | | | | 0.65 | | | | 0.69 | |
Net realized and unrealized gain (loss) on investments | | | 0.06 | | | | | | | | 0.85 | | | | (0.73 | ) | | | (0.42 | ) | | | 0.01 | | | | 0.57 | |
| | | | | | | | | | | | | | | | | | | | | | | | | | | | |
Total from investment operations | | | 0.36 | | | | | | | | 1.47 | | | | (0.14 | ) | | | 0.19 | | | | 0.66 | | | | 1.26 | |
| | | | | | | | | | | | | | | | | | | | | | | | | | | | |
| Less dividends: | | | | | | | | | | | | | | | | | | | | | | | | | | | | |
From net investment income | | | — | | | | | | | | (0.58 | ) | | | (0.60 | ) | | | (0.61 | ) | | | (0.59 | ) | | | (0.59 | ) |
| | | | | | | | | | | | | | | | | | | | | | | | | | | | |
Net asset value at end of period | | $ | 10.35 | | | | | | | $ | 9.99 | | | $ | 9.10 | | | $ | 9.84 | | | $ | 10.26 | | | $ | 10.19 | |
| | | | | | | | | | | | | | | | | | | | | | | | | | | | |
Total investment return (b) | | | 3.60 | %(c) | | | | | | | 16.23 | % | | | (1.57 | %) | | | 1.78 | % | | | 6.63 | % | | | 13.42 | % |
| Ratios (to average net assets)/Supplemental Data: | | | | | | | | | | | | | | | | | | | | | | | | | | | | |
Net investment income (loss) | | | 5.84 | %†† | | | | | | | 6.41 | % | | | 5.99 | % | | | 5.85 | % | | | 6.24 | % | | | 6.86 | % |
Net expenses | | | 0.59 | %†† | | | | | | | 0.59 | % | | | 0.58 | % | | | 0.59 | % | | | 0.59 | % | | | 0.59 | % |
Portfolio turnover rate | | | 21 | % | | | | | | | 39 | % | | | 37 | % | | | 42 | % | | | 40 | % | | | 30 | % |
Net assets at end of period (in 000’s) | | $ | 622,437 | | | | | | | $ | 665,881 | | | $ | 642,186 | | | $ | 641,024 | | | $ | 703,362 | | | $ | 718,047 | |
| (a) | Per share data based on average shares outstanding during the period. |
| (b) | Total return does not reflect any deduction of sales charges, mortality and expense charges, contract charges or administrative charges. For periods of less than one year, total return is not annualized. |
| (c) | Total investment return may reflect adjustments to conform to generally accepted accounting principles. |
| | | | | | | | | | | | | | | | | | | | | | | | | | | | |
| | | Six months
ended
June 30, | | | | | | Year ended December 31, | |
| Service Class | | 2017* | | | | | | 2016 | | | 2015 | | | 2014 | | | 2013 | | | 2012 | |
Net asset value at beginning of period | | $ | 9.86 | | | | | | | $ | 8.99 | | | $ | 9.73 | | | $ | 10.16 | | | $ | 10.10 | | | $ | 9.44 | |
| | | | | | | | | | | | | | | | | | | | | | | | | | | | |
Net investment income (loss) (a) | | | 0.28 | | | | | | | | 0.59 | | | | 0.56 | | | | 0.58 | | | | 0.62 | | | | 0.66 | |
Net realized and unrealized gain (loss) on investments | | | 0.07 | | | | | | | | 0.83 | | | | (0.72 | ) | | | (0.42 | ) | | | 0.01 | | | | 0.57 | |
| | | | | | | | | | | | | | | | | | | | | | | | | | | | |
Total from investment operations | | | 0.35 | | | | | | | | 1.42 | | | | (0.16 | ) | | | 0.16 | | | | 0.63 | | | | 1.23 | |
| | | | | | | | | | | | | | | | | | | | | | | | | | | | |
| Less dividends and distributions: | | | | | | | | | | | | | | | | | | | | | | | | | | | | |
From net investment income | | | — | | | | | | | | (0.55 | ) | | | (0.58 | ) | | | (0.59 | ) | | | (0.57 | ) | | | (0.57 | ) |
| | | | | | | | | | | | | | | | | | | | | | | | | | | | |
Net asset value at end of period | | $ | 10.21 | | | | | | | $ | 9.86 | | | $ | 8.99 | | | $ | 9.73 | | | $ | 10.16 | | | $ | 10.10 | |
| | | | | | | | | | | | | | | | | | | | | | | | | | | | |
Total investment return (b) | | | 3.55 | %(c) | | | | | | | 15.94 | % | | | (1.82 | %) | | | 1.53 | % | | | 6.36 | % | | | 13.14 | % |
| Ratios (to average net assets)/Supplemental Data: | | | | | | | | | | | | | | | | | | | | | | | | | | | | |
Net investment income (loss) | | | 5.58 | %†† | | | | | | | 6.15 | % | | | 5.74 | % | | | 5.60 | % | | | 5.99 | % | | | 6.61 | % |
Net expenses | | | 0.84 | %†† | | | | | | | 0.84 | % | | | 0.83 | % | | | 0.84 | % | | | 0.84 | % | | | 0.84 | % |
Portfolio turnover rate | | | 21 | % | | | | | | | 39 | % | | | 37 | % | | | 42 | % | | | 40 | % | | | 30 | % |
Net assets at end of period (in 000’s) | | $ | 2,442,815 | | | | | | | $ | 2,315,441 | | | $ | 2,035,855 | | | $ | 2,147,611 | | | $ | 2,046,388 | | | $ | 1,831,455 | |
| (a) | Per share data based on average shares outstanding during the period. |
| (b) | Total return does not reflect any deduction of sales charges, mortality and expense charges, contract charges or administrative charges. For periods of less than one year, total return is not annualized. |
| (c) | Total investment return may reflect adjustments to conform to generally accepted accounting principles. |
| | | | | | |
The notes to the financial statements are an integral part of,
and should be read in conjunction with, the financial statements. | | | | | 25 | |
Notes to Financial Statements (Unaudited)
Note 1–Organization and Business
MainStay VP Funds Trust (the “Fund”) was organized as a Delaware statutory trust on February 1, 2011. The Fund is registered under the Investment Company Act of 1940, as amended (the “1940 Act”), as an open-end management investment company. The Fund is comprised of thirty-two separate series (collectively referred to as the “Portfolios”). These financial statements and notes relate to the MainStay VP High Yield Corporate Bond Portfolio (the “Portfolio”), a “diversified” portfolio, as that term is defined in the 1940 Act, as interpreted or modified by regulatory authorities having jurisdiction, from time to time.
Shares of the Portfolio are currently offered to certain separate accounts to fund variable annuity policies and variable universal life insurance policies issued by New York Life Insurance and Annuity Corporation (“NYLIAC”), a wholly-owned subsidiary of New York Life Insurance Company (“New York Life”). NYLIAC allocates shares of the Portfolios to, among others, NYLIAC Variable Annuity Separate Accounts-I, II, III and IV, VUL Separate Account-I and CSVUL Separate Account-I (collectively, the “Separate Accounts”). Shares of the Portfolio are also offered to the MainStay VP Conservative Allocation Portfolio, MainStay VP Moderate Allocation Portfolio, MainStay VP Moderate Growth Allocation Portfolio and MainStay VP Growth Allocation Portfolio, which operate as “funds-of-funds.”
The Portfolio currently offers two classes of shares. Initial Class shares commenced operations on May 1, 1995. Service Class shares commenced operations on June 4, 2003. Shares of the Portfolio are sold and are redeemed at a price equal to their respective net asset value (“NAV”) per share. No sales or redemption charge is applicable to the purchase or redemption of the Portfolio’s shares. Under the terms of the Fund’s multiple class plan, adopted pursuant to Rule 18f-3 under the 1940 Act, the classes differ in that, among other things, Service Class shares of the Portfolio pay a combined distribution and service fee of 0.25% of average daily net assets attributable to Service Class shares of the Portfolio to the Distributor (as defined in Note 3(B)) pursuant to a plan adopted in accordance with Rule 12b-1 under the 1940 Act. Contract owners of variable annuity contracts purchased after June 2, 2003, are permitted to invest only in the Service Class shares.
The Portfolio’s investment objective is to seek maximum current income through investment in a diversified portfolio of high-yield debt securities. Capital appreciation is a secondary objective.
Note 2–Significant Accounting Policies
The Portfolio is an investment company and accordingly follows the investment company accounting and reporting guidance of the Financial Accounting Standards Board (“FASB”) Accounting Standard Codification Topic 946 Financial Services—Investment Companies. The Portfolio prepares its financial statements in accordance with generally accepted accounting principles (“GAAP”) in the United States of America and follows the significant accounting policies described below.
(A) Securities Valuation. Investments are usually valued as of the close of regular trading on the New York Stock Exchange (the “Exchange”) (usually 4:00 p.m. Eastern time) on each day the Portfolio is open for business (“valuation date”).
The Board of Trustees (the “Board”) of the Fund adopted procedures establishing methodologies for the valuation of the Portfolio’s securities
and other assets and delegated the responsibility for valuation determinations under those procedures to the Valuation Committee of the Fund (the “Valuation Committee”). The Board authorized the Valuation Committee to appoint a Valuation Sub-Committee (the “Sub-Committee”) to deal in the first instance with establishing the prices of securities for which market quotations are not readily available or the prices of which are not otherwise readily determinable under these procedures. The Sub-Committee meets (in person, via electronic mail or via teleconference) on an as-needed basis. Subsequently, the Valuation Committee meets to ensure that actions taken by the Sub-Committee were appropriate. The procedures recognize that, subject to the oversight of the Board and unless otherwise noted, the responsibility for the day-to-day valuation of portfolio assets (including fair value measurements for the Portfolio’s assets and liabilities) rests with New York Life Investment Management LLC (“New York Life Investments” or the “Manager”), aided to whatever extent necessary by the Subadvisor (as defined in Note 3(A)) to the Portfolio.
To assess the appropriateness of security valuations, the Manager, the Subadvisor or the Portfolio’s third party service provider, who is subject to oversight by the Manager, regularly compares prior day prices, prices on comparable securities and the sale prices to the prior and current day prices and challenges prices with changes exceeding certain tolerance levels with third party pricing services or broker sources. For those securities valued through either a standardized fair valuation methodology or a fair valuation measurement, the Sub-Committee deals in the first instance with such valuation and the Valuation Committee reviews and affirms, if appropriate, the reasonableness of the valuation based on such methodologies and measurements on a regular basis after considering all relevant information that is reasonably available. Any action taken by the Sub-Committee with respect to the valuation of a portfolio security or other asset is submitted by the Valuation Committee to the Board for its review and ratification, if appropriate, at its next regularly scheduled meeting.
“Fair value” is defined as the price the Portfolio would reasonably expect to receive upon selling an asset or liability in an orderly transaction to an independent buyer in the principal or most advantageous market for the asset or liability. Fair value measurements are determined within a framework that establishes a three-tier hierarchy which maximizes the use of observable market data and minimizes the use of unobservable inputs to establish a classification of fair value measurements for disclosure purposes. “Inputs” refer broadly to the assumptions that market participants would use in pricing the asset or liability, including assumptions about risk, such as the risk inherent in a particular valuation technique used to measure fair value using a pricing model and/or the risk inherent in the inputs for the valuation technique. Inputs may be observable or unobservable. Observable inputs reflect the assumptions market participants would use in pricing the asset or liability based on market data obtained from sources independent of the Portfolio. Unobservable inputs reflect the Portfolio’s own assumptions about the assumptions market participants would use in pricing the asset or liability based on the information available. The inputs or methodology used for valuing assets or liabilities may not be an indication of the risks associated with investing in those assets or liabilities. The three-tier hierarchy of inputs is summarized below.
| • | | Level 1—quoted prices in active markets for an identical asset or liability |
| | |
| 26 | | MainStay VP High Yield Corporate Bond Portfolio |
| • | | Level 2—other significant observable inputs (including quoted prices for a similar asset or liability in active markets, interest rates and yield curves, prepayment speeds, credit risk, etc.) |
| • | | Level 3—significant unobservable inputs (including the Portfolio’s own assumptions about the assumptions that market participants would use in measuring fair value of an asset or liability) |
The level of an asset or liability within the fair value hierarchy is based on the lowest level of an input, both individually and in the aggregate, that is significant to the fair value measurement. As of June 30, 2017, the aggregate value by input level of the Portfolio’s assets and liabilities is included at the end of the Portfolio’s Portfolio of Investments.
The Portfolio may use third party vendor evaluations, whose prices may be derived from one or more of the following standard inputs, among others:
| | |
• Benchmark yields | | • Reported trades |
• Broker/dealer quotes | | • Issuer spreads |
• Two-sided markets | | • Benchmark securities |
• Bids/offers | | • Reference data (corporate actions or material event notices) |
• Industry and economic events | | • Comparable bonds |
• Monthly payment information | | |
An asset or liability for which market values cannot be measured using the methodologies described above is valued by methods deemed reasonable in good faith by the Valuation Committee, following the procedures established by the Board, to represent fair value. Under these procedures, the Portfolio generally uses a market-based approach which may use related or comparable assets or liabilities, recent transactions, market multiples, book values, and other relevant information. The Portfolio may also use an income-based valuation approach in which the anticipated future cash flows of the asset or liability are discounted to calculate fair value. Discounts may also be applied due to the nature and/or duration of any restrictions on the disposition of the asset or liability. Fair value represents a good faith approximation of the value of a security. Fair value determinations involve the consideration of a number of subjective factors, an analysis of applicable facts and circumstances and the exercise of judgment. As a result, it is possible that the fair value for a security determined in good faith in accordance with the Portfolio’s valuation procedures may differ from valuations for the same security determined by other funds using their own valuation procedures. Although the Portfolio’s valuation procedures are designed to value a security at the price the Portfolio may reasonably expect to receive upon the security’s sale in an orderly transaction, there can be no assurance that any fair value determination thereunder would, in fact, approximate the amount that the Portfolio would actually realize upon the sale of the security or the price at which the security would trade if a reliable market price were readily available. During the six-month period ended June 30, 2017, there were no material changes to the fair value methodologies.
Securities which may be valued in this manner include, but are not limited to: (i) a security for which trading has been halted or suspended; (ii) a debt security that has recently gone into default and for which there is not a current market quotation; (iii) a security of an issuer that
has entered into a restructuring; (iv) a security that has been de-listed from a national exchange; (v) a security for which the market price is not readily available from a third party pricing source or, if so provided, does not, in the opinion of the Manager or Subadvisor, reflect the security’s market value; (vi) a security subject to trading collars for which no or limited trading takes place; and (vii) a security whose principal market has been temporarily closed at a time when, under normal conditions, it would be open. Securities for which market quotations or observable inputs are not readily available are generally categorized as Level 3 in the hierarchy. As of June 30, 2017, securities that were fair valued in such a manner are shown in the Portfolio of Investments.
Equity securities are valued at the last quoted sales prices as of the close of regular trading on the relevant exchange on each valuation date. Securities that are not traded on the valuation date are valued at the mean of the last quoted bid and ask prices. Prices are normally taken from the principal market in which each security trades. Investments in mutual funds, including money market funds, are valued at their respective NAVs as of the close of the Exchange on the valuation date. These securities are generally categorized as Level 1 in the hierarchy.
Debt securities (other than convertible and municipal bonds) are valued at the evaluated bid prices (evaluated mean prices in the case of convertible and municipal bonds) supplied by a pricing agent or brokers selected by the Manager, in consultation with the Subadvisor. Those values reflect broker/dealer supplied prices and electronic data processing techniques, if the evaluated bid or mean prices are deemed by the Manager, in consultation with the Subadvisor, to be representative of market values at the regular close of trading of the Exchange on each valuation date. Debt securities purchased on a delayed delivery basis are marked to market daily until settlement at the forward settlement date. Debt securities, including corporate bonds, U.S. government & federal agency bonds, municipal bonds, foreign bonds, convertible bonds, asset-backed securities and mortgage-backed securities are generally categorized as Level 2 in the hierarchy.
Loan assignments, participations and commitments are valued at the average of bid quotations obtained from the engaged independent pricing service and are generally categorized as Level 2 in the hierarchy. Certain loan assignments, participations and commitments may be valued by utilizing significant unobservable inputs obtained from the pricing service and are generally categorized as Level 3 in the hierarchy.
As of June 30, 2017, the Portfolio held loan assignments categorized as Level 3 securities with a value of $1,002,500 that were valued by utilizing significant unobservable inputs.
Temporary cash investments acquired in excess of 60 days to maturity at the time of purchase are valued using the latest bid prices or using valuations based on a matrix system (which considers such factors as security prices, yields, maturities, and ratings), both as furnished by independent pricing services. Other temporary cash investments which mature in 60 days or less at the time of purchase (“Short-Term Investments”) are valued using the amortized cost method of valuation, unless the use of such method would be inappropriate. The amortized cost method involves valuing a security at its cost on the date of purchase and thereafter assuming a constant amortization to maturity of the difference between such cost and the value on maturity date. Amortized cost approximates the current fair value of a security. Securities
Notes to Financial Statements (Unaudited) (continued)
valued using the amortized cost method are not valued using quoted prices in an active market and are generally categorized as Level 2 in the hierarchy.
The information above is not intended to reflect an exhaustive list of the methodologies that may be used to value portfolio investments. The valuation procedures permit the use of a variety of valuation
methodologies in connection with valuing portfolio investments. The methodology used for a specific type of investment may vary based on the market data available or other considerations. The methodologies summarized above may not represent the specific means by which portfolio investments are valued on any particular business day.
The valuation techniques and significant amounts of unobservable inputs used in the fair valuation measurement of the Portfolio’s Level 3 securities are outlined in the table below. A significant increase or decrease in any of those inputs in isolation would result in a significantly higher or lower fair value measurement.
| | | | | | | | | | | | |
Asset Class | | Fair Value
at 6/30/17* | | | Valuation
Technique | | Unobservable
Inputs | | Range | |
Convertible Bond (2) | | $ | 15,971,400 | | | Market Approach | | Estimated Enterprise Value | | | $783.0m–$919.9m | |
Corporate Bonds (2) | | | 23,447,488 | | | Income Approach | | Estimated Yield | | | 17.29 | % |
| | | | | | | | Spread Adjustment | | | 5.28 | % |
| | | 20,190 | | | Market Approach | | Estimated Remaining Claims/Value | | | $0.001 | |
Common Stocks (5) | | | 648,022 | | | Income Approach | | Discount Rate | | | 15.00 | % |
| | | | | | | | Liquidity Discount | | | 20.00 | % |
| | | 6,559,737 | | | Market Approach | | EBITDA Multiple | | | 5.75x | |
| | | | | | | | Estimated Enterprise Value | | | $783.0m–$919.9m | |
| | | | | | | | Estimated Volatility | | | 25.00 | % |
| | | | | | | | Last Traded Price | | | $75.00 | |
| | | | | | | | Subscription Price | | | $4.91 | |
| | | | | | | | | | | | |
| | $ | 46,646,837 | | | | | | | | | |
| | | | | | | | | | | | |
| * | The table above does not include certain Level 3 investments that were valued by brokers and pricing services without adjustment. As of June 30, 2017, the value of these investments was $11,377,500. The inputs for these investments were not readily available or cannot be reasonably estimated. |
A portfolio security or other asset may be determined to be illiquid under procedures approved by the Board. Illiquidity of a security might prevent the sale of such security at a time when the Manager or Subadvisor might wish to sell, and these securities could have the effect of decreasing the overall level of the Portfolio’s liquidity. Further, the lack of an established secondary market may make it more difficult to value illiquid securities, requiring the Portfolio to rely on judgments that may be somewhat subjective in measuring value, which could vary materially from the amount that the Portfolio could realize upon disposition. Difficulty in selling illiquid securities may result in a loss or may be costly to the Portfolio. Under the supervision of the Board, the Manager or Subadvisor determines the liquidity of the Portfolio’s investments; in doing so, the Manager or Subadvisor may consider various factors, including (i) the frequency of trades and quotations, (ii) the number of dealers and prospective purchasers, (iii) dealer undertakings to make a market, and (iv) the nature of the security and the market in which it trades (e.g., the time needed to dispose of the security, the method of soliciting offers and the mechanics of transfer). Illiquid securities are often valued in accordance with methods deemed by the Board in good faith to be reasonable and appropriate to accurately reflect their fair value. The liquidity of the Portfolio’s investments, as shown in the Portfolio of Investments and was determined as of June 30, 2017 and can change at any time in response to, among other relevant factors, market conditions or events or developments with respect to an individual issuer or instrument. As of June 30, 2017, securities deemed to be illiquid under procedures approved by the Board are shown in the Portfolio of Investments.
(B) Income Taxes. The Portfolio’s policy is to comply with the requirements of the Internal Revenue Code of 1986, as amended (the “Internal Revenue Code”), applicable to regulated investment companies and to distribute all of its taxable income to the shareholders of the Portfolio within the allowable time limits. Therefore, no federal, state and local income tax provisions are required.
Management evaluates the Portfolio’s tax positions to determine if the tax positions taken meet the minimum recognition threshold in connection with accounting for uncertainties in income tax positions taken or expected to be taken for the purposes of measuring and recognizing tax liabilities in the financial statements. Recognition of tax benefits of an uncertain tax position is permitted only to the extent the position is “more likely than not” to be sustained assuming examination by taxing authorities. Management has analyzed the Portfolio’s tax positions taken on federal, state and local income tax returns for all open tax years (for up to three tax years), and has concluded that no provisions for federal, state and local income tax are required in the Portfolio’s financial statements. The Portfolio’s federal, state and local income and federal excise tax returns for tax years for which the applicable statutes of limitations have not expired are subject to examination by the Internal Revenue Service and state and local departments of revenue.
(C) Dividends and Distributions to Shareholders. Dividends and distributions are recorded on the ex-dividend date. The Portfolio intends to declare and pay dividends from net investment income and distributions from net realized capital and currency gains, if any, at least annually. All dividends and distributions are reinvested in the same class of shares of the Portfolio, at NAV. Dividends and distributions to
| | |
| 28 | | MainStay VP High Yield Corporate Bond Portfolio |
shareholders are determined in accordance with federal income tax regulations and may differ from GAAP.
(D) Security Transactions and Investment Income. The Portfolio records security transactions on the trade date. Realized gains and losses on security transactions are determined using the identified cost method. Dividend income is recognized on the ex-dividend date; net of any foreign tax withheld at the source, and interest income is accrued as earned using the effective interest rate method. Discounts and premiums on securities purchased, other than Short-Term Investments, for the Portfolio are accreted and amortized, respectively, on the effective interest rate method over the life of the respective securities. Discounts and premiums on Short-Term Investments are accreted and amortized, respectively, on the straight-line method. The straight-line method approximates the effective interest method for Short-Term Investments. Income from payment-in-kind securities is accreted daily based on the effective interest method.
Investment income and realized and unrealized gains and losses on investments of the Portfolio are allocated pro rata to the separate classes of shares based upon their relative net assets on the date the income is earned or realized and unrealized gains and losses are incurred.
The Portfolio may place a debt security on non-accrual status and reduce related interest income by ceasing current accruals and writing off all or a portion of any interest receivables when the collection of all or a portion of such interest has become doubtful. A debt security is removed from non-accrual status when the issuer resumes interest payments or when collectability of interest is reasonably assured.
(E) Expenses. Expenses of the Fund are allocated to the individual Portfolios in proportion to the net assets of the respective Portfolios when the expenses are incurred, except where direct allocations of expenses can be made. Expenses (other than fees incurred under the distribution and service plans, further discussed in Note 3(B), which are charged directly to the Service Class shares) are allocated to separate classes of shares pro rata based upon their relative net assets on the date the expenses are incurred. The expenses borne by the Portfolio, including those of related parties to the Portfolio, are shown in the Statement of Operations. Additionally, the Portfolio may invest in shares of mutual funds, which are subject to management fees and other fees that may increase their costs versus the cost of owning the underlying securities directly. These indirect expenses of mutual funds are not included in the amounts shown as expenses in the Portfolio’s Statement of Operations or in the expense ratios included in the financial highlights.
(F) Use of Estimates. In preparing financial statements in conformity with GAAP, management makes estimates and assumptions that affect the reported amounts and disclosures in the financial statements. Actual results could differ from those estimates.
(G) Repurchase Agreements. The Portfolio may enter into repurchase agreements (i.e., buy a security from another party with the agreement that it be sold back in the future) to earn income. The Portfolio may enter into repurchase agreements only with counterparties, usually financial institutions, that are deemed by the Manager or Subadvisor to be creditworthy, pursuant to guidelines established by the Board. During the term of any repurchase agreement, the Manager or Subadvisor will continue to monitor the creditworthiness of the counterparty. Under the 1940 Act, repurchase agreements are considered to be
collateralized loans by the Portfolio to the counterparty secured by the securities transferred to the Portfolio.
Repurchase agreements are subject to counterparty risk, meaning the Portfolio could lose money by the counterparty’s failure to perform under the terms of the agreement. The Portfolio mitigates this risk by ensuring the repurchase agreement is collateralized by cash, U.S. government securities, fixed income securities and/or other securities. The collateral is held by the Portfolio’s custodian and valued daily on a mark to market basis to determine if the value, including accrued interest, exceeds the repurchase price. In the event of the counterparty’s default on the obligation to repurchase, the Portfolio has the right to liquidate the collateral and apply the proceeds in satisfaction of the obligation. Under certain circumstances, such as in the event of default or bankruptcy by the counterparty, realization and/or retention of the collateral may be limited or subject to delay, to legal proceedings and possible realized loss to the Portfolio.
(H) Loan Assignments, Participations and Commitments. The Portfolio’s principal investments may include loan assignments and participations (“loans”). Commitments are agreements to make money available to a borrower in a specified amount, at a specified rate and within a specified time. The Portfolio records an investment when the borrower withdraws money on a commitment or when a funded loan is purchased (trade date) and records interest as earned. These loans pay interest at rates that are periodically reset by reference to a base lending rate plus a spread. These base lending rates are generally the prime rate offered by a designated U.S. bank or the London InterBank Offered Rate.
The loans in which the Portfolio may invest are generally readily marketable, but may be subject to some restrictions on resale. For example, the Portfolio may be contractually obligated to receive approval from the agent bank and/or borrower prior to the sale of these investments. If the Portfolio purchases an assignment from a lender, the Portfolio will generally have direct contractual rights against the borrower in favor of the lender. If the Portfolio purchases a participation interest either from a lender or a participant, the Portfolio typically will have established a direct contractual relationship with the seller of the participation interest, but not with the borrower. Consequently, the Portfolio is subject to the credit risk of the lender or participant who sold the participation interest to the Portfolio, in addition to the usual credit risk of the borrower. In the event that the borrower, selling participant or intermediate participants become insolvent or enters into bankruptcy, the Portfolio may incur certain costs and delays in realizing payment, or may suffer a loss of principal and/or interest.
Unfunded commitments represent the remaining obligation of the Portfolio to the borrower. At any point in time, up to the maturity date of the issue, the borrower may demand the unfunded portion. Unfunded amounts, if any, are marked to market and any unrealized gains or losses are recorded in the Statement of Assets and Liabilities. As of June 30, 2017, the Portfolio did not hold any unfunded commitments.
(I) Foreign Currency Transactions. The Portfolio’s books and records are maintained in U.S. dollars. Prices of securities denominated in foreign currency amounts are translated into U.S. dollars at the mean between the buying and selling rates last quoted by any major U.S. bank at the following dates:
| (i) | market value of investment securities, other assets and liabilities—at the valuation date; and |
Notes to Financial Statements (Unaudited) (continued)
| (ii) | purchases and sales of investment securities, income and expenses—at the date of such transactions. |
The assets and liabilities that are denominated in foreign currency amounts are presented at the exchange rates and market values at the close of the period. The realized and unrealized changes in net assets arising from fluctuations in exchange rates and market prices of securities are not separately presented.
Net realized gain (loss) on foreign currency transactions represents net gains and losses on foreign currency forward contracts, net currency gains or losses realized as a result of differences between the amounts of securities sale proceeds or purchase cost, dividends, interest and withholding taxes as recorded on the Portfolio’s books, and the U.S. dollar equivalent amount actually received or paid. Net currency gains or losses from valuing such foreign currency denominated assets and liabilities, other than investments at valuation date exchange rates, are reflected in unrealized foreign exchange gains or losses.
(J) Securities Lending. In order to realize additional income, the Portfolio may engage in securities lending, subject to the limitations set forth in the 1940 Act and relevant guidance by the staff of the Securities and Exchange Commission (“SEC”). In the event the Portfolio does engage in securities lending, the Portfolio will lend through its custodian, State Street Bank and Trust Company (“State Street”). State Street will manage the Portfolio’s collateral in accordance with the lending agreement between the Portfolio and State Street, and indemnify the Portfolio against counterparty risk. The loans will be collateralized by U.S. Treasury securities at least equal at all times to the market value of the securities loaned. The Portfolio may bear the risk of delay in recovery of, or loss of rights in, the securities loaned should the borrower of the securities experience financial difficulty. The Portfolio may also record a realized gain or loss on securities deemed sold due to a borrower’s inability to return securities on loan. The Portfolio bears the risk of any loss on investment of the collateral. The Portfolio will receive compensation for lending its securities in the form of fees or it will retain a portion of interest on the investment of any cash received as collateral. The Portfolio will also continue to receive interest and dividends on the securities loaned and any gain or loss in the market price of the securities loaned that may occur during the term of the loan will be for the account of the Portfolio. During the six-month period ended June 30, 2017, the Portfolio did not have any portfolio securities on loan.
(K) Restricted Securities. Restricted securities, as disclosed in Note 5, are securities which have been purchased through a private offering and cannot be resold to the general public without prior registration under the Securities Act of 1933, as amended. Disposal of these securities may involve time-consuming negotiations and expenses, and it may be difficult to obtain a prompt sale at an acceptable price.
(L) Securities Risk. The Portfolio primarily invests in high-yield debt securities (commonly referred to as ‘‘junk bonds’’), which are considered speculative because they present a greater risk of loss, including default, than higher quality debt securities. These securities pay investors a premium—a higher interest rate or yield than investment grade debt securities—because of the increased risk of loss. These securities can also be subject to greater price volatility. In times of unusual or adverse market, economic or political conditions, these securities may experience higher than normal default rates.
The Portfolio may invest in foreign securities, which carry certain risks that are in addition to the usual risks inherent in domestic securities. These risks include those resulting from currency fluctuations, future adverse political or economic developments and possible imposition of currency exchange blockages or other foreign governmental laws or restrictions. These risks are likely to be greater in emerging markets than in developed markets. The ability of issuers of debt securities held by the Portfolio to meet their obligations may be affected, among other things, by economic or political developments in a specific country, industry or region.
The Portfolio may invest in loans which are usually rated below investment grade and are generally considered speculative because they present a greater risk of loss, including default, than higher rated debt securities. These investments pay investors a higher interest rate than investment grade debt securities because of the increased risk of loss. Although certain loans are collateralized, there is no guarantee that the value of the collateral will be sufficient to repay the loan. In a recession or serious credit event, the value of these investments could decline significantly. As a result of these and other events, the Portfolio’s NAVs could go down and you could lose money.
In addition, loans generally are subject to the extended settlement periods that may be longer than seven days. As a result, the Portfolio may be adversely affected by selling other investments at an unfavorable time and/or under unfavorable conditions or engaging in borrowing transactions, such as borrowing against its credit facility, to raise cash to meet redemption obligations or pursue other investment opportunities. In certain circumstances, loans may not be deemed to be securities. As a result, the Portfolio may not have the protection of anti-fraud provisions of the federal securities laws. In such cases, the Portfolio generally must rely on the contractual provisions in the loan agreement and common-law fraud protections under applicable state law.
(M) Indemnifications. Under the Fund’s organizational documents, its officers and trustees are indemnified against certain liabilities that may arise out of performance of their duties to the Fund. Additionally, in the normal course of business, the Portfolio enters into contracts with third-party service providers that contain a variety of representations and warranties and which may provide general indemnifications. The Portfolio’s maximum exposure under these arrangements is unknown, as this would involve future claims that may be made against the Portfolio that have not yet occurred. Based on experience, management is of the view that the risk of loss in connection with these potential indemnification obligations is remote. However, there can be no assurance that material liabilities related to such obligations will not arise in the future, which could adversely impact the Portfolio.
Note 3–Fees and Related Party Transactions
(A) Manager and Subadvisor. New York Life Investments, a registered investment adviser and an indirect, wholly-owned subsidiary of New York Life, serves as the Portfolio’s Manager pursuant to an Amended and Restated Management Agreement (“Management Agreement”). The Manager provides offices, conducts clerical, recordkeeping and bookkeeping services, and keeps most of the financial and accounting records required to be maintained by the Portfolio. Except for the portion of salaries and expenses that are the responsibility of the
| | |
| 30 | | MainStay VP High Yield Corporate Bond Portfolio |
Portfolio, the Manager pays the salaries and expenses of all personnel affiliated with the Portfolio and certain operational expenses of the Portfolio. The Portfolio reimburses New York Life Investments in an amount equal to a portion of the compensation of the Chief Compliance Officer attributable to the Portfolio. MacKay Shields LLC (“MacKay Shields” or “Subadvisor”), a registered investment adviser and an indirect, wholly-owned subsidiary of New York Life, serves as Subadvisor to the Portfolio and is responsible for the day-to-day portfolio management of the Portfolio. Pursuant to the terms of a Subadvisory Agreement (“Subavisory Agreement”) between New York Life Investments and MacKay Shields, New York Life Investments pays for the services of the Subadvisor.
The Fund, on behalf of the Portfolio, pays New York Life Investments in its capacity as the Portfolio’s investment manager and administrator, pursuant to the Management Agreement, a monthly fee for services performed and facilities furnished at an annual rate of the Portfolio’s average daily net assets as follows: 0.57% up to $1 billion; 0.55% from $1 billion up to $5 billion; and 0.525% in excess of $5 billion. During the six-month period ended June 30, 2017, the effective management fee rate was 0.56%.
During the six-month period ended June 30, 2017, New York Life Investments earned fees from the Portfolio in the amount of $8,393,809.
State Street provides sub-administration and sub-accounting services to the Portfolio pursuant to an agreement with New York Life Investments. These services include calculating the daily NAVs of the Portfolio, maintaining the general ledger and sub-ledger accounts for the calculation of the Portfolio’s NAVs, and assisting New York Life Investments in conducting various aspects of the Portfolio’s administrative operations. For providing these services to the Portfolio, State Street is compensated by New York Life Investments.
(B) Distribution and Service Fees. The Fund, on behalf of the Portfolio, has entered into a distribution agreement with NYLIFE Distributors LLC (the “Distributor”), an indirect, wholly-owned subsidiary of
New York Life. The Portfolio has adopted a distribution plan (the “Plan”) in accordance with the provisions of Rule 12b-1 under the 1940 Act. Under the Plan, the Distributor has agreed to provide, through its affiliates or independent third parties, various distribution-related, shareholder and administrative support services to the Service Class shareholders. For its services, the Distributor is entitled to a combined distribution and service fee accrued daily and paid monthly at an annual rate of 0.25% of the average daily net assets attributable to the Service Class shares of the Portfolio.
Note 4–Federal Income Tax
As of December 31, 2016, for federal income tax purposes, capital loss carryforwards of $119,725,348, as shown in the table below, were available to the extent provided by the regulations to offset future realized gains of the Portfolio through the years indicated. Accordingly, no capital gains distributions are expected to be paid to shareholders until net gains have been realized in excess of such amounts.
| | | | | | | | |
Capital Loss
Available Through | | Short-Term
Amounts (000’s) | | | Long-Term
Amounts (000’s) | |
| 2017 | | $ | 17,478 | | | $ | — | |
| Unlimited | | | 18,078 | | | | 84,169 | |
| Total | | $ | 35,556 | | | $ | 84,169 | |
During the year ended December 31, 2016, the tax character of distributions paid as reflected in the Statement of Changes in Net Assets was as follows:
| | |
| 2016 |
Tax-Based
Distributions
from Ordinary
Income | | Tax-Based
Distributions
from Long-
Term Gains |
| $161,907,143 | | $ — |
Note 5–Restricted Securities
| | | | | | | | | | | | | | | | | | | | |
Security | | Date(s) of
Acquisition | | | Principal
Amount/
Shares | | | Cost | | | 6/30/17 Value | | | Percent of
Net Assets | |
Exide Technologies, Inc.
Common Stock | | | 4/30/15–5/24/17 | | | | 612,830 | | | $ | 16,582,658 | | | $ | 888,603 | | | | 0.1 | % |
Exide Technologies, Inc. (Escrow Claim Shares)
Corporate Bond
8.625%, due 2/1/18 | | | 8/28/15 | | | $ | 20,190,000 | | | | — | | | | 20,190 | | | | 0.0 | |
ION Media Networks, Inc.
Common Stock | | | 3/12/10–12/20/10 | | | | 725 | | | | — | | | | 491,978 | | | | 0.0 | |
Modular Space Corp.
Common Stock | | | 2/8/17–3/10/17 | | | | 239,066 | | | | 3,483,111 | | | | 3,129,376 | | | | 0.1 | |
Neenah Enterprises, Inc.
Common Stock | | | 7/29/10 | | | | 230,859 | | | | 1,955,376 | | | | 2,541,758 | | | | 0.1 | |
Stone Energy Corp.
Common Stock | | | 3/3/17 | | | | 637,880 | | | | 21,438,407 | | | | 11,724,235 | | | | 0.4 | |
Sterling Entertainment Enterprises LLC
Corporate Bond
9.75%, due 12/15/19 | | | 12/21/12 | | | $ | 10,000,000 | | | | 10,000,000 | | | | 10,375,000 | | | | 0.3 | |
Upstate New York Power Producers, Inc.
Common Stock | | | 6/29/12–5/23/16 | | | | 130,037 | | | | — | | | | 156,044 | | | | 0.0 | |
Total | | | | | | | | | | $ | 53,459,552 | | | $ | 29,327,184 | | | | 1.0 | % |
| ‡ | Less than one-tenth of a percent. |
Notes to Financial Statements (Unaudited) (continued)
Note 6–Custodian
State Street is the custodian of cash and securities held by the Portfolio. Custodial fees are charged to the Portfolio based on the Portfolio’s net assets and/or the market value of securities held by the Portfolio and the number of certain transactions incurred by the Portfolio.
Note 7–Line of Credit
The Portfolio and certain other funds managed by New York Life Investments, maintain a line of credit with a syndicate of banks in order to secure a source of funds for temporary purposes to meet unanticipated or excessive redemption requests.
Effective August 1, 2017, under the credit agreement (the “Credit Agreement”), the aggregate commitment amount is $600,000,000 with an additional uncommitted amount of $100,000,000. The commitment fee is an annual rate of 0.15% of the average commitment amount payable quarterly, regardless of usage, to State Street, who serves as the agent to the syndicate. The commitment fee is allocated among the Portfolio and certain other funds managed by New York Life Investments based upon their respective net assets and other factors. Interest on any revolving credit loan is charged based upon the Federal Funds Rate or the one month LIBOR, whichever is higher. The Credit Agreement expires on July 31, 2018, although the Portfolio, certain other funds managed by New York Life Investments and the syndicate of banks may renew the Credit Agreement for an additional year on the same or different terms. Prior to August 1, 2017, the aggregate commitment amount was $600,000,000 with an additional uncommitted amount of $100,000,000, and the commitment fee, under a credit agreement for which Bank of New York Mellon served as agent, was at an annual rate of 0.15% of the average commitment amount. During the six-month period ended June 30, 2017, there were no borrowings made or outstanding with respect to the Portfolio under the credit agreement for which Bank of New York Mellon served as agent.
Note 8–Interfund Lending Program
Pursuant to an exemptive order issued by the SEC, the Portfolio, along with certain other funds managed by New York Life Investments, may participate in an interfund lending program. The interfund lending program provides an alternative credit facility that permits the Portfolio and certain other funds managed by New York Life Investments to lend or borrow money for temporary purposes directly to or from one another subject to the conditions of the exemptive order. During the six-month period ended June 30, 2017, there were no interfund loans made or outstanding with respect to the Portfolio.
Note 9–Purchases and Sales of Securities (in 000’s)
During the six-month period ended June 30, 2017, purchases and sales of securities, other than short-term securities, were $661,419 and $597,576, respectively.
The Portfolio may purchase securities from or sell securities to other portfolios managed by the Subadvisor. These interportfolio transactions are primarily used for cash management purposes and are made pursuant to Rule 17a-7 of the 1940 Act. During the six-month period ended June 30, 2017, such purchases were $492.
Note 10–Capital Share Transactions
Transactions in capital shares for the six-month period ended June 30, 2017, and the year ended December 31, 2016, were as follows:
| | | | | | | | |
Initial Class | | Shares | | | Amount | |
Six-month period ended June 30, 2017: | | | | | | | | |
Shares sold | | | 2,238,162 | | | $ | 22,772,970 | |
Shares redeemed | | | (8,780,137 | ) | | | (89,594,263 | ) |
| | | | |
Net increase (decrease) | | | (6,541,975 | ) | | $ | (66,821,293 | ) |
| | | | |
Year ended December 31, 2016: | | | | | | | | |
Shares sold | | | 8,909,212 | | | $ | 83,696,838 | |
Shares issued to shareholders in reinvestment of dividends and distributions | | | 3,819,868 | | | | 37,709,814 | |
Shares redeemed | | | (16,660,873 | ) | | | (162,031,468 | ) |
| | | | |
Net increase (decrease) | | | (3,931,793 | ) | | $ | (40,624,816 | ) |
| | | | |
|
| |
Service Class | | Shares | | | Amount | |
Six-month period ended June 30, 2017: | | | | | | | | |
Shares sold | | | 17,677,026 | | | $ | 178,474,234 | |
Shares redeemed | | | (13,180,239 | ) | | | (133,048,490 | ) |
| | | | |
Net increase (decrease) | | | 4,496,787 | | | $ | 45,425,744 | |
| | | | |
Year ended December 31, 2016: | | | | | | | | |
Shares sold | | | 25,656,380 | | | $ | 246,528,409 | |
Shares issued to shareholders in reinvestment of dividends and distributions | | | 12,730,220 | | | | 124,197,329 | |
Shares redeemed | | | (30,092,219 | ) | | | (286,895,502 | ) |
| | | | |
Net increase (decrease) | | | 8,294,381 | | | $ | 83,830,236 | |
| | | | |
Note 11–Recent Accounting Pronouncement
In October 2016, the SEC adopted new rules and amended existing rules (together, “final rules”) intended to modernize the reporting and disclosure of information by registered investment companies. In part, the final rules amend Regulation S-X and require standardized, enhanced disclosure about derivatives in investment company financial statements, as well as other amendments. The compliance date for the amendments to Regulation S-X is August 1, 2017 and applies to shareholder reports for funds with fiscal periods ending after August 1, 2017. Management is currently evaluating the impact that the adoption of the amendments to Regulation S-X will have on Portfolio’s financial statements and related disclosures.
Note 12–Subsequent Events
In connection with the preparation of the financial statements of the Portfolio as of and for the six-month period ended June 30, 2017, events and transactions subsequent to June 30, 2017, through the date the financial statements were issued have been evaluated by the Portfolio’s management for possible adjustment and/or disclosure. No subsequent events requiring financial statement adjustment or disclosure have been identified.
| | |
| 32 | | MainStay VP High Yield Corporate Bond Portfolio |
Proxy Voting Policies and Procedures and Proxy Voting Record
A description of the policies and procedures that New York Life Investments uses to vote proxies related to the Portfolio’s securities is available without charge, upon request, (i) by calling 800-598-2019 or (ii) by visiting the SEC’s website at www.sec.gov.
The Portfolio is required to file with the SEC its proxy voting record for the 12-month period ending June 30 on Form N-PX. The Portfolio’s most recent Form N-PX or proxy voting record is available free of charge upon request (i) by calling 800-598-2019 or; (ii) by visiting the SEC’s website at www.sec.gov.
Shareholder Reports and Quarterly Portfolio Disclosure
The Portfolio is required to file its complete schedule of portfolio holdings with the SEC for its first and third fiscal quarters on Form N-Q. The Portfolio’s Form N-Q is available without charge on the SEC’s website at www.sec.gov or by calling MainStay Investments at 800-598-2019. You also can obtain and review copies of Form N-Q by visiting the SEC’s Public Reference Room in Washington, DC (information on the operation of the Public Reference Room may be obtained by calling 1-800-SEC-0330).
This page intentionally left blank
MainStay VP Portfolios
MainStay VP offers a wide range of Portfolios. The full array of MainStay VP offerings is listed here, with information about the manager, subadvisors, legal counsel, and independent registered public accounting firm.
Equity Portfolios
MainStay VP Common Stock Portfolio
MainStay VP Cornerstone Growth Portfolio
MainStay VP Eagle Small Cap Growth Portfolio
MainStay VP Emerging Markets Equity Portfolio
MainStay VP Epoch U.S. Equity Yield Portfolio
MainStay VP Epoch U.S. Small Cap Portfolio
MainStay VP International Equity Portfolio
MainStay VP Large Cap Growth Portfolio
MainStay VP MFS® Utilities Portfolio
MainStay VP Mid Cap Core Portfolio
MainStay VP S&P 500 Index Portfolio
MainStay VP Small Cap Core Portfolio
MainStay VP T. Rowe Price Equity Income Portfolio
MainStay VP VanEck Global Hard Assets Portfolio
Mixed Asset Portfolios
MainStay VP Balanced Portfolio
MainStay VP Convertible Portfolio
MainStay VP Cushing Renaissance Advantage Portfolio
MainStay VP Income Builder Portfolio
MainStay VP Janus Henderson Balanced Portfolio
Income Portfolios
MainStay VP Bond Portfolio
MainStay VP Floating Rate Portfolio
MainStay VP Government Portfolio
MainStay VP High Yield Corporate Bond Portfolio
MainStay VP Indexed Bond Portfolio
MainStay VP PIMCO Real Return Portfolio
MainStay VP Unconstrained Bond Portfolio
Money Market
MainStay VP U.S. Government Money Market Portfolio
Alternative
MainStay VP Absolute Return Multi-Strategy Portfolio
Asset Allocation Portfolios
MainStay VP Conservative Allocation Portfolio
MainStay VP Growth Allocation Portfolio
MainStay VP Moderate Allocation Portfolio
MainStay VP Moderate Growth Allocation Portfolio
Manager
New York Life Investment Management LLC
New York, New York
Subadvisors
Candriam Belgium*
Brussels, Belgium
Candriam France S.A.S.*
Paris, France
Cornerstone Capital Management Holdings LLC*
New York, New York
Cushing Asset Management, LP
Dallas, Texas
Eagle Asset Management, Inc.
St Petersburg, Florida
Epoch Investment Partners, Inc.
New York, New York
Janus Capital Management LLC
Denver, Colorado
MacKay Shields LLC*
New York, New York
Massachusetts Financial Services Company
Boston, Massachusetts
NYL Investors LLC*
New York, New York
Pacific Investment Management Company LLC
Newport Beach, California
T. Rowe Price Associates, Inc.
Baltimore, Maryland
Van Eck Associates Corporation
New York, New York
Winslow Capital Management, LLC
Minneapolis, Minnesota
Distributor
NYLIFE Distributors LLC*
Jersey City, New Jersey
Custodian
State Street Bank and Trust Company
Boston, Massachusetts
Independent Registered Public Accounting Firm
PricewaterhouseCoopers LLP
New York, New York
Legal Counsel
Dechert LLP
Washington, District of Columbia
Some Portfolios may not be available in all products.
* An affiliate of New York Life Investment Management LLC
Not part of the Semiannual Report
2017 Semiannual Report
This report is for the general information of New York Life Variable Annuities and NYLIAC Variable Universal Life Insurance Products policyowners. It must be preceded or accompanied by the appropriate product(s) and funds prospectuses if it is given to anyone who is not an owner of a New York Life variable annuity policy or a NYLIAC Variable Universal Life Insurance Product. This report does not offer for sale or solicit orders to purchase securities.
The performance data quoted in this report represents past performance. Past performance is no guarantee of future results. Due to market volatility and other factors, current performance may be lower or higher than the figures shown. The most recent month-end performance summary for your variable annuity or variable life policy is available by calling 800-598-2019 and is updated periodically on www.newyorklife.com.
The New York Life Variable Annuities and NYLIAC Variable Universal Life Insurance Products are issued by New York Life Insurance and Annuity Corporation (a Delaware Corporation) and distributed by NYLIFE Distributors LLC (Member FINRA/SIPC).
New York Life Insurance Company
New York Life Insurance and Annuity Corporation (NYLIAC) (A Delaware Corporation)
51 Madison Avenue, Room 551
New York, NY 10010
www.newyorklife.com
Printed on recycled paper
mainstayinvestments.com
NYLIFE Distributors LLC, 30 Hudson Street, Jersey City, NJ 07302
New York Life Investment Management LLC is the investment manager to the MainStay VP Funds Trust
©2017 by NYLIFE Distributors LLC. All rights reserved.
You may obtain copies of the Prospectus and the Statement of Additional Information free of charge, upon request, by calling toll-free 800-598-2019 or writing to New York Life Insurance and Annuity Corporation, 51 Madison Avenue, New York, NY 10010.
| | | | |
| Not FDIC Insured | | No Bank Guarantee | | May Lose Value |
| | | | |
1744026 | | | | MSVPHYCB10-08/17 (NYLIAC) NI520 |
MainStay VP International
Equity Portfolio
Message from the President and Semiannual Report
Unaudited | June 30, 2017

Sign up for electronic delivery of your shareholder reports. For full details on electronic delivery, including who can participate and what you
can receive via eDelivery, please log on to www.newyorklife.com/vsc

This page intentionally left blank
Message from the President
The six months ended June 30, 2017, brought positive results to many stock and bond investors. The year began with many investors hoping that Republican control of the White House, the Senate and the House of Representatives could bring an end to political gridlock; and while debate has continued on a number of issues, the U.S. stock market climbed relatively steadily throughout the first half of 2017.
According to FTSE-Russell U.S. market data, stocks at all capitalization levels tended to record positive total returns during the reporting period, with large-cap stocks generally outperforming stocks of smaller-capitalization companies. Growth stocks outpaced value stocks at every capitalization level by substantial margins—from more than six percentage points for micro-caps and mid-caps to more than 10 percentage points for the largest 200 U.S. companies by market capitalization.
Most sectors of the stock market advanced during the reporting period, with energy and telecommunication services being notable exceptions. Energy stocks declined as oil prices fell despite moves by the Organization of Petroleum Exporting Countries (OPEC) intended to limit oil production by its members. Telecommunication services stocks tended to decline as competition increased and rising interest rates made dividend payouts less appealing.
In March and June of 2017, the Federal Reserve announced successive increases in the target range for the federal funds rate, ultimately bringing the federal funds target range to 1.00% to 1.25%. While short-term U.S. Treasury yields rose in response, yields for U.S. Treasury securities with maturities of five years or longer declined. As the difference between short- and long-term yields narrowed, the advantages of higher-yielding long-term bonds became increasingly apparent.
Virtually all taxable and tax-exempt bond sectors provided positive total returns during the reporting period. Mortgage-backed
securities, though providing positive total returns, faced headwinds when the Federal Reserve announced plans to begin normalizing its balance sheet by reducing reinvestment of principal payments on mortgage-backed securities.
International stock and bond markets were also strong during the reporting period. International stocks provided double-digit total returns that were surpassed by emerging-market stocks as a whole. Global investment-grade bonds provided single-digit returns; and emerging-market debt was somewhat stronger.
Even during periods of favorable market performance and generally positive returns, MainStay believes that it is important to carefully monitor your investments. Your risk tolerance may
change over time, leading you to reevaluate which MainStay VP Portfolios are most appropriate for your long-term goals. Your goals themselves may also change, leading you to pursue investments with more or less risk. The portfolio managers of MainStay VP Portfolios seek to provide results consistent with the investment objectives of their respective Portfolios, to give you a wide range of choices suitable to various investment needs.
The report that follows provides more detailed information about the specific markets, securities and investment decisions that influenced your MainStay VP Portfolio during the six months ended June 30, 2017. We invite you to review the report carefully as part of your ongoing investment evaluation and review.
Sincerely,

Stephen P. Fisher
President
The opinions expressed are as of the date of the accompanying report and are subject to change. Past performance is no guarantee of future results. There is no guarantee that any forecasts made will come to pass. This material does not constitute investment advice and is not intended as an endorsement of any specific investment.
Not all MainStay VP Portfolios and/or share classes are available under all policies.
Not part of the Semiannual Report
Table of Contents
Investors should refer to the Portfolio’s Summary Prospectus and/or Prospectus and consider the Portfolio’s investment objectives, strategies, risks, charges and expenses carefully before investing. The Summary Prospectus and/or Prospectus contain this and other information about the Portfolio. You may obtain copies of the Portfolio’s Summary Prospectus and/or the Prospectus and the Statement of Additional Information free of charge, upon request, by calling toll-free 800-598-2019, by writing to New York Life Insurance and Annuity Corporation, 51 Madison Avenue, Room 251, New York, New York 10010 or by sending an email to MainStayShareholdersServices@nylim.com. These documents are also available at mainstayinvestments.com/vpdocuments. Please read the Summary Prospectus and/or Prospectus carefully before investing. MainStay VP Funds Trust portfolios are separate account options which are purchased through a variable insurance or variable annuity contract.
Investment and Performance Comparison (Unaudited)
Performance data quoted represents past performance. Past performance is no guarantee of future results. Because of market volatility and other factors, current performance may be lower or higher than the figures shown. Investment return and principal value will fluctuate, and as a result, when shares are redeemed, they may be worth more or less than their original cost. The performance table and graph do not reflect any deduction of sales charges, mortality and expense charges, contract charges or administrative charges. Please refer to the Performance Summary appropriate for your policy. For performance information current to the most recent month-end, please call 800-598-2019 or visit www.newyorklife.com.
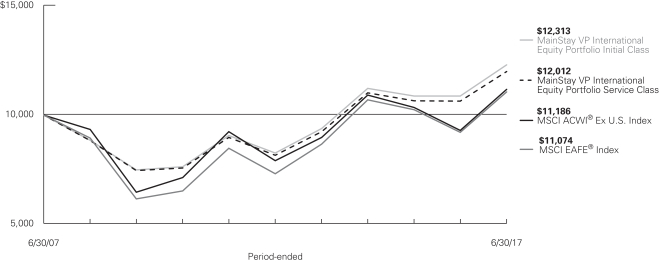
Average Annual Total Returns for the Period Ended June 30, 2017
| | | | | | | | | | | | | | | | | | | | | | |
| Class | | Inception Date | | | Six Months | | | One Year | | Five Years | | | Ten Years | | | Gross
Expense
Ratio1 | |
| Initial Class Shares | | | 5/1/1995 | | | | 18.58 | % | | 13.16% | | | 8.34 | % | | | 2.10 | % | | | 0.96 | % |
| Service Class Shares | | | 6/5/2003 | | | | 18.44 | | | 12.88 | | | 8.08 | | | | 1.85 | | | | 1.21 | |
| | | | | | | | | | | | | | | | |
| Benchmark Performance | | Six
Months | | | One
Year | | | Five
Years | | | Ten
Years | |
MSCI ACWI® Ex U.S. Index2 | | | 14.10 | % | | | 20.45 | % | | | 7.22 | % | | | 1.13 | % |
MSCI EAFE® Index3 | | | 13.81 | | | | 20.27 | | | | 8.69 | | | | 1.03 | |
Average Lipper Variable Products International Multi-Cap Growth Portfolio4 | | | 17.53 | | | | 19.21 | | | | 8.57 | | | | 1.93 | |
| 1. | The gross expense ratios presented reflect the Portfolio’s “Total Annual Portfolio Operating Expenses” from the most recent Prospectus and may differ from other expense ratios disclosed in this report. |
| 2. | The Portfolio has selected the MSCI ACWI® (All Country World Index) Ex U.S. Index as its primary broad-based securities market index. The MSCI ACWI® Ex U.S. Index is a free float-adjusted market capitalization weighted index that is designed to measure the equity market performance of developed and emerging markets, excluding the U.S. Results assume reinvestment of all dividends and capital gains. An investment cannot be made directly in an index. |
| 3. | The MSCI EAFE® Index is the Portfolio’s secondary benchmark. The MSCI EAFE® Index consists of international stocks representing the developed |
| | world outside of North America. Results assume reinvestment of all dividends and capital gains. An investment cannot be made directly in an index. |
| 4. | The Average Lipper Variable Products International Multi-Cap Growth Portfolio is representative of portfolios that, by portfolio practice, invest in a variety of market capitalization ranges without concentrating 75% of their equity assets in any one market capitalization range over an extended period of time. International multi-cap growth portfolios typically have above-average characteristics compared to the MSCI EAFE® Index. This benchmark is a product of Lipper Inc. Lipper Inc. is an independent monitor of fund performance. Results are based on average total returns of similar portfolios with all dividend and capital gain distributions reinvested. |
Cost in Dollars of a $1,000 Investment in MainStay VP International Equity Portfolio (Unaudited)
The example below is intended to describe the fees and expenses borne by shareholders during the six-month period from January 1, 2017 to June 30, 2017, and the impact of those costs on your investment.
Example
As a shareholder of the Portfolio, you incur two types of costs: (1) transaction costs, including exchange fees and sales charges (loads) on purchases (as applicable), and (2) ongoing costs, including management fees, distribution and/or service (12b-1) fees, and other Portfolio expenses (as applicable). This example is intended to help you understand your ongoing costs (in dollars) of investing in the Portfolio and to compare these costs with the ongoing costs of investing in other mutual funds. The example is based on an investment of $1,000 made at the beginning of the six-month period and held for the entire period from January 1, 2017 to June 30, 2017. Shares are only sold in connection with variable life and annuity contracts and the example does not reflect any contract level or transactional fees or expenses. If these costs had been included, your costs would have been higher.
This example illustrates your Portfolio’s ongoing costs in two ways:
Actual Expenses
The second and third data columns in the table below provide information about actual account values and actual expenses. You may use the information in these columns, together with the amount you
invested, to estimate the expenses that you paid during the six months
ended June 30, 2017. Simply divide your account value by $1,000 (for example, an $8,600 account value divided by $1,000 = 8.6), then multiply the result by the number under the heading entitled “Expenses Paid During Period” to estimate the expenses you paid on your account during this period.
Hypothetical Example for Comparison Purposes
The fourth and fifth data columns in the table below provide information about hypothetical account values and hypothetical expenses based on the Portfolio’s actual expense ratio and an assumed rate of return of 5% per year before expenses, which is not the Portfolio’s actual return. The hypothetical account values and expenses may not be used to estimate the actual ending account balances or expenses you paid for the six-month period shown. You may use this information to compare the ongoing costs of investing in the Portfolio with the ongoing costs of investing in other mutual funds. To do so, compare this 5% hypothetical example with the 5% hypothetical examples that appear in the shareholder reports of the other mutual funds.
Please note that the expenses shown in the table are meant to highlight your ongoing costs only and do not reflect any transactional costs, such as exchange fees or sales charges (loads). Therefore, the fourth and fifth data columns of the table are useful in comparing ongoing costs only and will not help you determine the relative total costs of owning different funds. In addition, if these transactional costs were included, your costs would have been higher.
| | | | | | | | | | | | | | | | | | | | | | |
| | | | | | | | | | | | | | | | | | |
| Share Class | | Beginning Account Value
1/1/17 | | | Ending Account Value (Based on Actual Returns and Expenses) 6/30/17 | | | Expenses Paid
During Period1 | | | Ending Account Value (Based on Hypothetical 5% Annualized Return and Actual Expenses) 6/30/17 | | | Expenses Paid During Period1 | | | Net Expense Ratio During Period2 |
| | | | | | |
| Initial Class Shares | | $ | 1,000.00 | | | $ | 1,185.80 | | | $ | 5.20 | | | $ | 1,020.00 | | | $ | 4.81 | | | 0.96% |
| | | | | | |
| Service Class Shares | | $ | 1,000.00 | | | $ | 1,184.40 | | | $ | 6.55 | | | $ | 1,018.80 | | | $ | 6.06 | | | 1.21% |
| 1. | Expenses are equal to the Portfolio’s annualized expense ratio of each class multiplied by the average account value over the period, divided by 365 and multiplied by 181 (to reflect the six-month period). The table above represents the actual expenses incurred during the six-month period. |
| 2. | Expenses are equal to the Portfolio’s annualized expense ratio to reflect the six-month period. |
| | |
| 6 | | MainStay VP International Equity Portfolio |
Country Composition as of June 30, 2017 (Unaudited)
| | | | |
| United Kingdom | | | 13.0 | % |
| Japan | | | 10.5 | |
| United States | | | 9.7 | |
| Germany | | | 9.0 | |
| Switzerland | | | 6.4 | |
| China | | | 5.6 | |
| Ireland | | | 4.8 | |
| Brazil | | | 4.4 | |
| India | | | 4.4 | |
| Belgium | | | 3.9 | |
| Sweden | | | 3.9 | |
| Spain | | | 3.0 | |
| Netherlands | | | 2.8 | |
| | | | |
| Canada | | | 2.2 | % |
| Australia | | | 2.0 | |
| Jordan | | | 2.0 | |
| Israel | | | 1.8 | |
| Thailand | | | 1.7 | |
| Denmark | | | 1.6 | |
| Taiwan | | | 1.6 | |
| Italy | | | 1.2 | |
| South Africa | | | 0.5 | |
| Mexico | | | 0.2 | |
| Other Assets, Less Liabilities | | | 3.8 | |
| | | | |
| | | 100.0 | % |
| | | | |
See Portfolio of Investments beginning on page 10 for specific holdings within these categories.
Top Ten Holdings as of June 30, 2017 (excluding short-term investment) (Unaudited)
| 3. | Fresenius Medical Care A.G. & Co. KGaA |
| 5. | United Internet A.G. Registered |
Portfolio Management Discussion and Analysis (Unaudited)
Answers to the questions reflect the views of portfolio managers Edward Ramos, CFA, and Carlos Garcia-Tunon, CFA, of Cornerstone Capital Management Holdings LLC, the Portfolio’s Subadvisor.
How did MainStay VP International Equity Portfolio perform relative to its benchmarks and peers during the six months ended June 30, 2017?
For the six months ended June 30, 2017, MainStay VP International Equity Portfolio returned 18.58% for Initial Class shares and 18.44% for Service Class shares. Over the same period, both share classes outperformed the 14.10% return of the MSCI ACWI® (All Country World Index) Ex U.S. Index,1 which is the Portfolio’s primary benchmark; the 13.81% return of the MSCI EAFE® Index,1 which is a secondary benchmark of the Portfolio; and the 17.53% return of the Average Lipper2 Variable Products International Multi-Cap Growth Portfolio.
Were there any changes to the Portfolio during the reporting period?
Effective April 28, 2017, Eve Glatt no longer serves as a portfolio manager of the Portfolio. As of the end of the reporting period, Edward Ramos and Carlos Garcia-Tunon continued to serve as portfolio managers of the Portfolio.3
What factors affected the Portfolio’s relative performance during the reporting period?
The Portfolio’s relative performance benefited from positive contributions from stock selection and sector allocation, partially offset by a negative contribution from country allocation. (Contributions take weightings and total returns into account.) Stock selection on a country basis helped the Portfolio’s relative performance, with notable strength in Japan, Brazil and Israel. Stock selection on a sector basis also contributed positively, with consumer discretionary, financials and real estate providing the strongest contributions. The positive effects of sector allocation were driven by overweight allocations relative to the MSCI ACWI® Ex U.S. Index to information technology and health care and by an underweight allocation to energy. The negative effects from country allocation were driven by overweight positions relative to this Index in Ireland and Brazil and an underweight position in South Korea.
Which sectors were the strongest positive contributors to the Portfolio’s relative performance, and which sectors were particularly weak?
The sectors that made the strongest positive contributions to the Portfolio’s performance relative to the MSCI ACWI® Ex U.S. Index were consumer discretionary and financials. Consumer discretionary and financials benefited from favorable stock selection. The Portfolio’s lack of exposure to the energy sector also contributed to relative performance. The allocation effect from consumer discretionary was slightly negative, while the allocation
effect from financials and energy was positive. The Portfolio suffered from an overweight position in the consumer discretionary sector, which underperformed the MSCI ACWI® Ex U.S. Index, and benefited from underweight positions in the financials and energy sectors, which also underperformed the Index.
The sectors that made the strongest negative contributions to the Portfolio’s performance relative to the MSCI ACWI® Ex U.S. Index were health care, materials and consumer staples. All of these sectors suffered from unfavorable selection effects, with the allocation effect being positive for health care and materials and negative for consumer staples. The Portfolio held an overweight position in the health care sector, which outperformed the MSCI ACWI® Ex U.S. Index. The Portfolio held an underweight position in the materials sector, which underperformed the Index, and an underweight position in consumer staples sector, which outperformed this Index.
During the reporting period, which individual stocks made the strongest positive contributions to the Portfolio’s absolute performance and which stocks detracted the most?
During the reporting period, the stocks that made the strongest positive contributions to the Portfolio’s absolute performance were Japanese online apparel shopping site operator Start Today, Chinese online gaming and services company NetEase and Israeli IT security provider Check Point Software. All of these stocks outperformed on continued strong growth and strategy execution.
The most significant detractors from the Portfolio’s absolute performance were Jordanian pharmaceutical company Hikma Pharmaceuticals, Indian generic pharmaceutical company Lupin Limited and Irish private-label over-the-counter pharmaceutical company Perrigo. Hikma Pharmaceuticals underperformed after the company reduced its financial guidance because of a delay in the introduction of a widely anticipated generic drug and more broadly because of the potential for greater pricing pressure across the company’s generics portfolio. Lupin declined on the anticipation of greater generic pricing pressure owing to higher competition and channel consolidation in the United States. Perrigo suffered from disappointing business trends and earnings guidance.
Did the Portfolio make any significant purchases or sales during the reporting period?
Notable purchases during the reporting period included Brazilian payments processor Cielo, Japanese corporate fringe benefits outsourcer Relo Group and Canadian software holding company
| 1. | See footnote on page 6 for more information on this index. |
| 2. | See footnote on page 6 for more information on Lipper Inc. |
| 3. | Effective August 1, 2017, Edward Ramos no longer serves as a portfolio manager of the Portfolio. As of the same date, Ian Murdoch and Lawrence Rosenberg joined Carlos Garcia-Tunon as portfolio managers of the Portfolio. |
| | |
| 8 | | MainStay VP International Equity Portfolio |
Constellation Software. Notable sales during the reporting period included Japanese provider of clinical test reagents Sysmex, Irish private-label over-the-counter pharmaceutical company Perrigo and Italian biotechnology company DiaSorin.
How did the Portfolio’s sector weightings change during the reporting period?
During the reporting period, the Portfolio increased its exposure to the information technology and real estate sectors. Over the same period, the Portfolio reduced its exposure to the health care and consumer discretionary sectors.
How was the Portfolio positioned at the end of the reporting period?
As of June 30, 2017, the Portfolio held overweight positions relative to the MSCI ACWI® Ex U.S. Index in the information technology, health care and consumer discretionary sectors. As of the same date, the Portfolio held underweight positions in the financials, industrials and energy sectors.
The opinions expressed are those of the portfolio managers as of the date of this report and are subject to change. There is no guarantee that any forecasts made will come to pass. This material does not constitute investment advice and is not intended as an endorsement of any specific investment.
Not all MainStay VP Portfolios and/or share classes are available under all policies.
Portfolio of Investments June 30, 2017 (Unaudited)
| | | | | | | | |
| | |
| | | Shares | | | Value | |
| Common Stocks 95.9%† | |
Australia 2.0% | |
Corporate Travel Management, Ltd. (Hotels, Restaurants & Leisure) | | | 289,365 | | | $ | 5,101,992 | |
Gateway Lifestyle (Real Estate Management & Development) | | | 2,745,698 | | | | 4,115,169 | |
| | | | | | | | |
| | | | | | | 9,217,161 | |
| | | | | | | | |
Belgium 3.9% | | | | | | | | |
Ontex Group N.V. (Personal Products) | | | 297,582 | | | | 10,573,766 | |
UCB S.A. (Pharmaceuticals) | | | 114,335 | | | | 7,865,296 | |
| | | | | | | | |
| | | | | | | 18,439,062 | |
| | | | | | | | |
Brazil 4.4% | | | | | | | | |
Cielo S.A. (IT Services) | | | 1,539,120 | | | | 11,428,764 | |
Qualicorp S.A. (Health Care Providers & Services) | | | 1,080,200 | | | | 9,357,886 | |
| | | | | | | | |
| | | | | | | 20,786,650 | |
| | | | | | | | |
Canada 2.2% | | | | | | | | |
Constellation Software, Inc. (Software) | | | 19,600 | | | | 10,253,575 | |
| | | | | | | | |
| | |
China 5.6% | | | | | | | | |
51job, Inc., ADR (Professional
Services) (a) | | | 58,696 | | | | 2,625,472 | |
Baidu, Inc., Sponsored ADR (Internet Software & Services) (a) | | | 39,833 | | | | 7,124,530 | |
China Biologic Products, Inc. (Biotechnology) (a) | | | 58,357 | | | | 6,600,177 | |
NetEase, Inc., ADR (Internet Software & Services) | | | 33,051 | | | | 9,936,122 | |
| | | | | | | | |
| | | | | | | 26,286,301 | |
| | | | | | | | |
Denmark 1.6% | | | | | | | | |
Novo Nordisk A/S Class B (Pharmaceuticals) | | | 173,323 | | | | 7,422,405 | |
| | | | | | | | |
| | |
Germany 9.0% | | | | | | | | |
¨Fresenius Medical Care A.G. & Co. KGaA (Health Care Providers & Services) | | | 216,348 | | | | 20,798,558 | |
Scout24 A.G. (Internet Software & Services) (b) | | | 124,264 | | | | 4,576,471 | |
¨United Internet A.G. Registered (Internet Software & Services) | | | 305,702 | | | | 16,810,185 | |
| | | | | | | | |
| | | | | | | 42,185,214 | |
| | | | | | | | |
India 4.4% | | | | | | | | |
Housing Development Finance Corp., Ltd. (Thrifts & Mortgage Finance) | | | 317,340 | | | | 7,913,678 | |
Lupin, Ltd. (Pharmaceuticals) | | | 329,635 | | | | 5,396,299 | |
Yes Bank, Ltd. (Banks) | | | 320,360 | | | | 7,265,375 | |
| | | | | | | | |
| | | | | | | 20,575,352 | |
| | | | | | | | |
| | | | | | | | |
| | |
| | | Shares | | | Value | |
Ireland 4.8% | | | | | | | | |
Experian PLC (Professional Services) | | | 308,156 | | | $ | 6,321,383 | |
Paddy Power Betfair PLC (Hotels, Restaurants & Leisure) | | | 59,913 | | | | 6,396,116 | |
Shire PLC (Biotechnology) | | | 173,887 | | | | 9,598,183 | |
| | | | | | | | |
| | | | | | | 22,315,682 | |
| | | | | | | | |
Israel 1.8% | | | | | | | | |
Check Point Software Technologies, Ltd. (Software) (a) | | | 79,286 | | | | 8,648,517 | |
| | | | | | | | |
| | |
Italy 1.2% | | | | | | | | |
De’Longhi S.p.A. (Household Durables) | | | 175,992 | | | | 5,515,692 | |
| | | | | | | | |
| | |
Japan 10.5% | | | | | | | | |
CyberAgent, Inc. (Media) | | | 360,200 | | | | 11,160,676 | |
Relo Group, Inc. (Real Estate Management & Development) | | | 574,700 | | | | 11,174,651 | |
¨Start Today Co., Ltd. (Internet & Direct Marketing Retail) | | | 526,158 | | | | 12,934,669 | |
¨Tsuruha Holdings, Inc. (Food & Staples Retailing) | | | 129,840 | | | | 13,771,871 | |
| | | | | | | | |
| | | | | | | 49,041,867 | |
| | | | | | | | |
Jordan 2.0% | | | | | | | | |
Hikma Pharmaceuticals PLC (Pharmaceuticals) | | | 502,607 | | | | 9,622,918 | |
| | | | | | | | |
| | |
Mexico 0.2% | | | | | | | | |
Banregio Grupo Financiero S.A.B. de C.V. (Banks) | | | 140,804 | | | | 892,208 | |
| | | | | | | | |
| | |
Netherlands 2.8% | | | | | | | | |
GrandVision N.V. (Specialty Retail) (b) | | | 290,031 | | | | 7,768,019 | |
IMCD Group N.V. (Trading Companies & Distributors) | | | 96,347 | | | | 5,222,076 | |
| | | | | | | | |
| | | | | | | 12,990,095 | |
| | | | | | | | |
South Africa 0.5% | | | | | | | | |
Mediclinic International PLC (Health Care Providers & Services) | | | 261,129 | | | | 2,521,896 | |
| | | | | | | | |
| | |
Spain 3.0% | | | | | | | | |
Almirall S.A. (Pharmaceuticals) | | | 274,111 | | | | 4,464,461 | |
Grifols S.A. (Biotechnology) | | | 337,642 | | | | 9,403,775 | |
| | | | | | | | |
| | | | | | | 13,868,236 | |
| | | | | | | | |
Sweden 3.9% | | | | | | | | |
¨Hexagon AB Class B (Electronic Equipment, Instruments & Components) | | | 386,133 | | | | 18,356,294 | |
| | | | | | | | |
| † | Percentages indicated are based on Portfolio net assets. |
| ¨ | | Among the Portfolio’s 10 largest holdings, as of June 30, 2017, excluding short-term investment. May be subject to change daily. |
| | | | |
| 10 | | MainStay VP International Equity Portfolio | | The notes to the financial statements are an integral part of,
and should be read in conjunction with, the financial statements. |
| | | | | | | | |
| | |
| | | Shares | | | Value | |
| Common Stocks (continued) | |
Switzerland 6.4% | | | | | | | | |
DKSH Holding A.G. (Professional Services) | | | 55,413 | | | $ | 4,498,803 | |
¨TE Connectivity, Ltd. (Electronic Equipment, Instruments & Components) | | | 267,116 | | | | 21,016,687 | |
Tecan Group A.G. Registered (Life Sciences Tools & Services) | | | 24,843 | | | | 4,671,178 | |
| | | | | | | | |
| | | | | | | 30,186,668 | |
| | | | | | | | |
Taiwan 1.6% | | | | | | | | |
Taiwan Semiconductor Manufacturing Co., Ltd., Sponsored ADR (Semiconductors & Semiconductor Equipment) | | | 218,921 | | | | 7,653,478 | |
| | | | | | | | |
| | |
Thailand 1.7% | | | | | | | | |
Kasikornbank PCL (Banks) | | | 1,359,838 | | | | 7,986,096 | |
| | | | | | | | |
| | |
United Kingdom 13.0% | | | | | | | | |
Big Yellow Group PLC (Equity Real Estate Investment Trusts (REITs)) | | | 329,499 | | | | 3,398,914 | |
BTG PLC (Pharmaceuticals) (a) | | | 90,277 | | | | 820,717 | |
HomeServe PLC (Commercial Services & Supplies) | | | 431,241 | | | | 4,131,081 | |
¨Johnson Matthey PLC (Chemicals) | | | 409,627 | | | | 15,317,317 | |
¨Prudential PLC (Insurance) | | | 1,000,279 | | | | 22,942,537 | |
Sage Group PLC (Software) | | | 664,638 | | | | 5,955,724 | |
Telit Communications PLC (Communications Equipment) | | | 512,402 | | | | 2,082,219 | |
Whitbread PLC (Hotels, Restaurants & Leisure) | | | 123,438 | | | | 6,377,817 | |
| | | | | | | | |
| | | | | | | 61,026,326 | |
| | | | | | | | |
United States 9.4% | | | | | | | | |
¨Accenture PLC Class A (IT Services) | | | 93,885 | | | | 11,611,697 | |
ICON PLC (Life Sciences Tools & Services) (a) | | | 96,465 | | | | 9,433,313 | |
¨LivaNova PLC (Health Care Equipment & Supplies) (a) | | | 205,192 | | | | 12,559,802 | |
Samsonite International S.A. (Textiles, Apparel & Luxury Goods) | | | 2,484,300 | | | | 10,373,192 | |
| | | | | | | | |
| | | | | | | 43,978,004 | |
| | | | | | | | |
Total Common Stocks
(Cost $380,788,844) | | | | | | | 449,769,697 | |
| | | | | | | | |
| | |
| | | | | | | | |
| | | | | | | | |
| | | Principal
Amount | | | Value | |
| Short-Term Investment 0.3% | |
Repurchase Agreement 0.3% | | | | | | | | |
Fixed Income Clearing Corp.
0.12%, dated 6/30/17
due 7/3/17
Proceeds at Maturity $1,215,649 (Collateralized by a United States Treasury Note with a rate of 1.125% and a maturity date of 9/30/21, with a Principal Amount of $1,270,000 and a Market Value of $1,240,516) | | $ | 1,215,637 | | | $ | 1,215,637 | |
| | | | | | | | |
Total Short-Term Investment
(Cost $1,215,637) | | | | | | | 1,215,637 | |
| | | | | | | | |
Total Investments
(Cost $382,004,481) (c) | | | 96.2 | % | | | 450,985,334 | |
Other Assets, Less Liabilities | | | 3.8 | | | | 18,055,813 | |
Net Assets | | | 100.0 | % | | $ | 469,041,147 | |
| (a) | Non-income producing security. |
| (b) | May be sold to institutional investors only under Rule 144A or securities offered pursuant to Section 4(a)(2) of the Securities Act of 1933, as amended. |
| (c) | As of June 30, 2017, cost was $384,744,304 for federal income tax purposes and net unrealized appreciation was as follows: |
| | | | |
Gross unrealized appreciation | | $ | 81,127,081 | |
Gross unrealized depreciation | | | (14,886,051 | ) |
| | | | |
Net unrealized appreciation | | $ | 66,241,030 | |
| | | | |
The following abbreviation is used in the preceding pages:
ADR—American Depositary Receipt
| | | | | | |
The notes to the financial statements are an integral part of,
and should be read in conjunction with, the financial statements. | | | | | 11 | |
Portfolio of Investments June 30, 2017 (Unaudited) (continued)
The table below sets forth the diversification of MainStay VP International Equity Portfolio investments by industry.
Industry Diversification
| | | | | | | | |
| | | Value | | | Percent † | |
Banks | | $ | 16,143,679 | | | | 3.4 | % |
Biotechnology | | | 25,602,135 | | | | 5.5 | |
Capital Markets | | | 1,215,637 | | | | 0.3 | |
Chemicals | | | 15,317,317 | | | | 3.3 | |
Commercial Services & Supplies | | | 4,131,081 | | | | 0.9 | |
Communications Equipment | | | 2,082,219 | | | | 0.4 | |
Electronic Equipment, Instruments & Components | | | 39,372,981 | | | | 8.4 | |
Equity Real Estate Investment Trusts (REITs) | | | 3,398,914 | | | | 0.7 | |
Food & Staples Retailing | | | 13,771,871 | | | | 2.9 | |
Health Care Equipment & Supplies | | | 12,559,802 | | | | 2.7 | |
Health Care Providers & Services | | | 32,678,340 | | | | 7.0 | |
Hotels, Restaurants & Leisure | | | 17,875,925 | | | | 3.8 | |
Household Durables | | | 5,515,692 | | | | 1.2 | |
Insurance | | | 22,942,537 | | | | 4.9 | |
Internet & Direct Marketing Retail | | | 12,934,669 | | | | 2.8 | |
Internet Software & Services | | | 38,447,308 | | | | 8.2 | |
IT Services | | | 23,040,461 | | | | 4.9 | |
Life Sciences Tools & Services | | | 14,104,491 | | | | 3.0 | |
Media | | | 11,160,676 | | | | 2.4 | |
Personal Products | | | 10,573,766 | | | | 2.2 | |
Pharmaceuticals | | | 35,592,096 | | | | 7.6 | |
Professional Services | | | 13,445,658 | | | | 2.9 | |
Real Estate Management & Development | | | 15,289,820 | | | | 3.3 | |
Semiconductors & Semiconductor Equipment | | | 7,653,478 | | | | 1.6 | |
Software | | | 24,857,816 | | | | 5.3 | |
Specialty Retail | | | 7,768,019 | | | | 1.6 | |
Textiles, Apparel & Luxury Goods | | | 10,373,192 | | | | 2.2 | |
Thrifts & Mortgage Finance | | | 7,913,678 | | | | 1.7 | |
Trading Companies & Distributors | | | 5,222,076 | | | | 1.1 | |
| | | | | | | | |
| | | 450,985,334 | | | | 96.2 | |
Other Assets, Less Liabilities | | | 18,055,813 | | | | 3.8 | |
| | | | | | | | |
Net Assets | | $ | 469,041,147 | | | | 100.0 | % |
| | | | | | | | |
| † | Percentages indicated are based on Portfolio net assets. |
| | | | |
| 12 | | MainStay VP International Equity Portfolio | | The notes to the financial statements are an integral part of,
and should be read in conjunction with, the financial statements. |
The following is a summary of the fair valuations according to the inputs used as of June 30, 2017, for valuing the Portfolio’s assets.
Asset Valuation Inputs
| | | | | | | | | | | | | | | | | | | | |
Description | | Quoted
Prices in
Active
Markets for
Identical
Assets (Level 1) | | | Significant
Other
Observable
Inputs (Level 2) | | | Significant
Unobservable
Inputs (Level 3) | | | Total | | | | |
| Investments in Securities (a) | | | | | | | | | | | | | | | | | | | | |
| Common Stocks | | $ | 449,769,697 | | | $ | — | | | $ | — | | | $ | 449,769,697 | | | | | |
| Short-Term Investment | | | | | | | | | | | | | | | | | | | | |
Repurchase Agreement | | | — | | | | 1,215,637 | | | | — | | | | 1,215,637 | | | | | |
| | | | | | | | | | | | | | | | | | | | |
| Total Investments in Securities | | $ | 449,769,697 | | | $ | 1,215,637 | | | $ | — | | | $ | 450,985,334 | | | | | |
| | | | | | | | | | | | | | | | | | | | |
| (a) | For a complete listing of investments and their industries, see the Portfolio of Investments. |
The Portfolio recognizes transfers between the levels as of the beginning of the period.
As of June 30,2017, certain foreign equity securities with a market value of $276,179,741 held by the Portfolio as of December 31, 2016, transferred from Level 2 to Level 1 due to these securities being fair valued at period end by applying factors provided by a third party vendor in accordance with the Portfolio’s policies and procedures. (See Note 2)
As of June 30, 2017, the Portfolio did not hold any investments with significant unobservable inputs (Level 3). (See Note 2)
| | | | | | |
The notes to the financial statements are an integral part of,
and should be read in conjunction with, the financial statements. | | | | | 13 | |
Statement of Assets and Liabilities as of June 30, 2017 (Unaudited)
| | | | |
| Assets | |
Investment in securities, at value
(identified cost $382,004,481) | | $ | 450,985,334 | |
Cash denominated in foreign currencies
(identified cost $18,497,924) | | | 18,820,352 | |
Receivables: | | | | |
Dividends and interest | | | 1,605,275 | |
Fund shares sold | | | 123,612 | |
Investment securities sold | | | 27 | |
Other assets | | | 2,429 | |
| | | | |
Total assets | | | 471,537,029 | |
| | | | |
| |
| Liabilities | | | | |
Payables: | | | | |
Investment securities purchased | | | 1,650,649 | |
Manager (See Note 3) | | | 348,941 | |
Foreign capital gains tax (See Note 2(C)) | | | 255,104 | |
Fund shares redeemed | | | 111,736 | |
NYLIFE Distributors (See Note 3) | | | 59,830 | |
Shareholder communication | | | 31,070 | |
Professional fees | | | 25,112 | |
Custodian | | | 3,053 | |
Trustees | | | 751 | |
Accrued expenses | | | 9,636 | |
| | | | |
Total liabilities | | | 2,495,882 | |
| | | | |
Net assets | | $ | 469,041,147 | |
| | | | |
| |
| Net Assets Consist of | | | | |
Shares of beneficial interest outstanding (par value of $.001 per share) unlimited number of shares authorized | | $ | 30,042 | |
Additional paid-in capital | | | 406,734,357 | |
| | | | |
| | | 406,764,399 | |
Undistributed net investment income | | | 2,129,680 | |
Accumulated net realized gain (loss) on investments and foreign currency transactions (a) | | | (8,903,688 | ) |
Net unrealized appreciation (depreciation) on investments (b) | | | 68,725,749 | |
Net unrealized appreciation (depreciation) on translation of other assets and liabilities in foreign currencies | | | 325,007 | |
| | | | |
Net assets | | $ | 469,041,147 | |
| | | | |
| | | | |
Initial Class | | | | |
Net assets applicable to outstanding shares | | $ | 183,721,835 | |
| | | | |
Shares of beneficial interest outstanding | | | 11,700,457 | |
| | | | |
Net asset value per share outstanding | | $ | 15.70 | |
| | | | |
Service Class | | | | |
Net assets applicable to outstanding shares | | $ | 285,319,312 | |
| | | | |
Shares of beneficial interest outstanding | | | 18,341,052 | |
| | | | |
Net asset value per share outstanding | | $ | 15.56 | |
| | | | |
| (a) | Realized gain (loss) on security transactions recorded net of foreign capital gains tax. |
| (b) | Unrealized appreciation (depreciation) on investments recorded net of foreign capital gains tax in the amount of $255,104. |
| | | | |
| 14 | | MainStay VP International Equity Portfolio | | The notes to the financial statements are an integral part of,
and should be read in conjunction with, the financial statements. |
Statement of Operations for the six months ended June 30, 2017 (Unaudited)
| | | | |
| Investment Income (Loss) | |
Income | | | | |
Dividends (a) | | $ | 4,552,746 | |
Interest | | | 376 | |
| | | | |
Total income | | | 4,553,122 | |
| | | | |
Expenses | | | | |
Manager (See Note 3) | | | 1,998,463 | |
Distribution/Service—Service Class (See Note 3) | | | 341,684 | |
Custodian | | | 51,361 | |
Professional fees | | | 38,285 | |
Shareholder communication | | | 37,223 | |
Trustees | | | 5,424 | |
Miscellaneous | | | 14,344 | |
| | | | |
Total expenses | | | 2,486,784 | |
| | | | |
Net investment income (loss) | | | 2,066,338 | |
| | | | |
|
| Realized and Unrealized Gain (Loss) on Investments and Foreign Currency Transactions | |
Net realized gain (loss) on: | |
Investment transactions | | | 31,482,207 | |
Foreign currency transactions | | | (100,807 | ) |
| | | | |
Net realized gain (loss) on investments and foreign currency transactions | | | 31,381,400 | |
| | | | |
Net change in unrealized appreciation (depreciation) on: | |
Investments (b) | | | 41,860,794 | |
Translation of other assets and liabilities in foreign currencies | | | 553,518 | |
| | | | |
Net change in unrealized appreciation (depreciation) on investments and foreign currency transactions | | | 42,414,312 | |
| | | | |
Net realized and unrealized gain (loss) on investments and foreign currency transactions | | | 73,795,712 | |
| | | | |
Net increase (decrease) in net assets resulting from operations | | $ | 75,862,050 | |
| | | | |
| (a) | Dividends recorded net of foreign withholding taxes in the amount of $471,508. |
| (b) | Unrealized appreciation (depreciation) on investments recorded net of foreign capital gains tax in the amount of $(68,557). |
| | | | | | |
The notes to the financial statements are an integral part of,
and should be read in conjunction with, the financial statements. | | | | | 15 | |
Statements of Changes in Net Assets
for the six months ended June 30, 2017 (Unaudited) and the year ended December 31, 2016
| | | | | | | | |
| | | 2017 | | | 2016 | |
| Increase (Decrease) in Net Assets | |
Operations: | | | | | | | | |
Net investment income (loss) | | $ | 2,066,338 | | | $ | 2,561,829 | |
Net realized gain (loss) on investments and foreign currency transactions | | | 31,381,400 | | | | 27,738,323 | |
Net change in unrealized appreciation (depreciation) on investments and foreign currency transactions | | | 42,414,312 | | | | (53,222,002 | ) |
| | | | |
Net increase (decrease) in net assets resulting from operations | | | 75,862,050 | | | | (22,921,850 | ) |
| | | | |
Dividends to shareholders: | | | | | | | | |
From net investment income: | | | | | | | | |
Initial Class | | | — | | | | (1,470,669 | ) |
Service Class | | | — | | | | (1,457,492 | ) |
| | | | |
Total dividends to shareholders | | | — | | | | (2,928,161 | ) |
| | | | |
Capital share transactions: | | | | | | | | |
Net proceeds from sale of shares | | | 23,849,841 | | | | 32,512,455 | |
Net asset value of shares issued to shareholders in reinvestment of dividends | | | — | | | | 2,928,161 | |
Cost of shares redeemed | | | (53,192,807 | ) | | | (130,328,921 | ) |
| | | | |
Increase (decrease) in net assets derived from capital share transactions | | | (29,342,966 | ) | | | (94,888,305 | ) |
| | | | |
Net increase (decrease) in net assets | | | 46,519,084 | | | | (120,738,316 | ) |
|
| Net Assets | |
Beginning of period | | | 422,522,063 | | | | 543,260,379 | |
| | | | |
End of period | | $ | 469,041,147 | | | $ | 422,522,063 | |
| | | | |
Undistributed net investment income at end of period | | $ | 2,129,680 | | | $ | 63,342 | |
| | | | |
| | | | |
| 16 | | MainStay VP International Equity Portfolio | | The notes to the financial statements are an integral part of,
and should be read in conjunction with, the financial statements. |
Financial Highlights selected per share data and ratios
| | | | | | | | | | | | | | | | | | | | | | | | | | | | |
| | | Six months
ended June 30, | | | | | | Year ended December 31, | |
| Initial Class | | 2017* | | | | | | 2016 | | | 2015 | | | 2014 | | | 2013 | | | 2012 | |
Net asset value at beginning of period | | $ | 13.24 | | | | | | | $ | 14.04 | | | $ | 13.36 | | | $ | 13.81 | | | $ | 12.14 | | | $ | 10.34 | |
| | | | | | | | | | | | | | | | | | | | | | | | | | | | |
Net investment income (loss) (a) | | | 0.08 | | | | | | | | 0.10 | | | | 0.10 | | | | 0.12 | | | | 0.10 | | | | 0.13 | |
Net realized and unrealized gain (loss) on investments | | | 2.37 | | | | | | | | (0.77 | ) | | | 0.75 | | | | (0.44 | ) | | | 1.72 | | | | 1.86 | |
Net realized and unrealized gain (loss) on foreign currency transactions | | | 0.01 | | | | | | | | (0.02 | ) | | | (0.03 | ) | | | (0.04 | ) | | | (0.00 | )‡ | | | 0.02 | |
| | | | | | | | | | | | | | | | | | | | | | | | | | | | |
Total from investment operations | | | 2.46 | | | | | | | | (0.69 | ) | | | 0.82 | | | | (0.36 | ) | | | 1.82 | | | | 2.01 | |
| | | | | | | | | | | | | | | | | | | | | | | | | | | | |
| Less dividends and distributions: | | | | | | | | | | | | | | | | | | | | | | | | | | | | |
From net investment income | | | — | | | | | | | | (0.11 | ) | | | (0.14 | ) | | | (0.09 | ) | | | (0.15 | ) | | | (0.21 | ) |
| | | | | | | | | | | | | | | | | | | | | | | | | | | | |
Net asset value at end of period | | $ | 15.70 | | | | | | | $ | 13.24 | | | $ | 14.04 | | | $ | 13.36 | | | $ | 13.81 | | | $ | 12.14 | |
| | | | | | | | | | | | | | | | | | | | | | | | | | | | |
Total investment return (b) | | | 18.58 | % | | | | | | | (4.95 | %) | | | 6.17 | % | | | (2.62 | %) | | | 15.11 | % | | | 19.48 | % |
| Ratios (to average net assets)/Supplemental Data: | | | | | | | | | | | | | | | | | | | | | | | | | | | | |
Net investment income (loss) | | | 1.06 | %†† | | | | | | | 0.71 | % (c) | | | 0.74 | % | | | 0.85 | % | | | 0.78 | % | | | 1.14 | % |
Net expenses | | | 0.96 | %†† | | | | | | | 0.95 | % (d) | | | 0.95 | % | | | 0.95 | % | | | 0.95 | % | | | 0.95 | % |
Portfolio turnover rate | | | 24 | % | | | | | | | 28 | % | | | 40 | % | | | 38 | % | | | 34 | % | | | 42 | % |
Net assets at end of period (in 000’s) | | $ | 183,722 | | | | | | | $ | 171,048 | | | $ | 243,076 | | | $ | 217,936 | | | $ | 208,807 | | | $ | 180,124 | |
| ‡ | Less than one cent per share. |
| (a) | Per share data based on average shares outstanding during the period. |
| (b) | Total return does not reflect any deduction of sales charges, mortality and expense charges, contract charges or administrative charges. For periods of less than one year, total return is not annualized. |
| (c) | Without the custody fee reimbursement, net investment income (loss) would have been 0.70%. |
| (d) | Without the custody fee reimbursement, net expenses would have been 0.96%. |
| | | | | | | | | | | | | | | | | | | | | | | | | | | | |
| | | Six months
ended June 30, | | | | | | Year ended December 31, | |
| Service Class | | 2017* | | | | | | 2016 | | | 2015 | | | 2014 | | | 2013 | | | 2012 | |
Net asset value at beginning of period | | $ | 13.13 | | | | | | | $ | 13.92 | | | $ | 13.24 | | | $ | 13.70 | | | $ | 12.04 | | | $ | 10.26 | |
| | | | | | | | | | | | | | | | | | | | | | | | | | | | |
Net investment income (loss) (a) | | | 0.06 | | | | | | | | 0.05 | | | | 0.07 | | | | 0.08 | | | | 0.07 | | | | 0.10 | |
Net realized and unrealized gain (loss) on investments | | | 2.36 | | | | | | | | (0.74 | ) | | | 0.74 | | | | (0.44 | ) | | | 1.71 | | | | 1.84 | |
Net realized and unrealized gain (loss) on foreign currency transactions | | | 0.01 | | | | | | | | (0.03 | ) | | | (0.03 | ) | | | (0.04 | ) | | | (0.00 | )‡ | | | 0.02 | |
| | | | | | | | | | | | | | | | | | | | | | | | | | | | |
Total from investment operations | | | 2.43 | | | | | | | | (0.72 | ) | | | 0.78 | | | | (0.40 | ) | | | 1.78 | | | | 1.96 | |
| | | | | | | | | | | | | | | | | | | | | | | | | | | | |
| Less dividends and distributions: | | | | | | | | | | | | | | | | | | | | | | | | | | | | |
From net investment income | | | — | | | | | | | | (0.07 | ) | | | (0.10 | ) | | | (0.06 | ) | | | (0.12 | ) | | | (0.18 | ) |
| | | | | | | | | | | | | | | | | | | | | | | | | | | | |
Net asset value at end of period | | $ | 15.56 | | | | | | | $ | 13.13 | | | $ | 13.92 | | | $ | 13.24 | | | $ | 13.70 | | | $ | 12.04 | |
| | | | | | | | | | | | | | | | | | | | | | | | | | | | |
Total investment return (b) | | | 18.51 | %(c) | | | | | | | (5.17 | %) | | | 5.90 | % | | | (2.86 | %) | | | 14.82 | % | | | 19.18 | % |
| Ratios (to average net assets)/Supplemental Data: | | | | | | | | | | | | | | | | | | | | | | | | | | | | |
Net investment income (loss) | | | 0.83 | %†† | | | | | | | 0.40 | % (d) | | | 0.48 | % | | | 0.60 | % | | | 0.55 | % | | | 0.88 | % |
Net expenses | | | 1.21 | %†† | | | | | | | 1.20 | % (e) | | | 1.20 | % | | | 1.20 | % | | | 1.20 | % | | | 1.20 | % |
Portfolio turnover rate | | | 24 | % | | | | | | | 28 | % | | | 40 | % | | | 38 | % | | | 34 | % | | | 42 | % |
Net assets at end of period (in 000’s) | | $ | 285,319 | | | | | | | $ | 251,474 | | | $ | 300,184 | | | $ | 309,428 | | | $ | 316,211 | | | $ | 275,852 | |
| ‡ | Less than one cent per share. |
| (a) | Per share data based on average shares outstanding during the period. |
| (b) | Total return does not reflect any deduction of sales charges, mortality and expense charges, contract charges or administrative charges. For periods of less than one year, total return is not annualized. |
| (c) | Total investment return may reflect adjustments to conform to generally accepted accounting principles. |
| (d) | Without the custody fee reimbursement, net investment income (loss) would have been 0.39%. |
| (e) | Without the custody fee reimbursement, net expenses would have been 1.21%. |
| | | | | | |
The notes to the financial statements are an integral part of,
and should be read in conjunction with, the financial statements. | | | | | 17 | |
Notes to Financial Statements (Unaudited)
Note 1–Organization and Business
MainStay VP Funds Trust (the ‘‘Fund’’) was organized as a Delaware statutory trust on February 1, 2011. The Fund is registered under the Investment Company Act of 1940, as amended (the “1940 Act”), as an open-end management investment company. The Fund is comprised of thirty-two separate series (collectively referred to as the “Portfolios”). These financial statements and notes relate to the MainStay VP International Equity Portfolio (the “Portfolio”), a “diversified” portfolio, as that term is defined in the 1940 Act, as interpreted or modified by regulatory authorities having jurisdiction, from time to time.
Shares of the Portfolio are currently offered to certain separate accounts to fund variable annuity policies and variable universal life insurance policies issued by New York Life Insurance and Annuity Corporation (“NYLIAC”), a wholly-owned subsidiary of New York Life Insurance Company (“New York Life”). NYLIAC allocates shares of the Portfolios to, among others, NYLIAC Variable Annuity Separate Accounts-I, II, III and IV, VUL Separate Account-I and CSVUL Separate Account-I (collectively, the “Separate Accounts”). Shares of the Portfolio are also offered to the MainStay VP Conservative Allocation Portfolio, MainStay VP Moderate Allocation Portfolio, MainStay VP Moderate Growth Allocation Portfolio and MainStay VP Growth Allocation Portfolio, which operate as “funds-of-funds.”
The Portfolio currently offers two classes of shares. Initial Class shares commenced operations on May 1, 1995. Service Class shares commenced operations on June 4, 2003. Shares of the Portfolio are sold and are redeemed at a price equal to their respective net asset value (“NAV”) per share. No sales or redemption charge is applicable to the purchase or redemption of the Portfolio’s shares. Under the terms of the Fund’s multiple class plan, adopted pursuant to Rule 18f-3 under the 1940 Act, the classes differ in that, among other things, Service Class shares of the Portfolio pay a combined distribution and service fee of 0.25% of average daily net assets attributable to Service Class shares of the Portfolio to the Distributor (as defined in Note 3(B)) pursuant to a plan adopted in accordance with Rule 12b-1 under the 1940 Act. Contract owners of variable annuity contracts purchased after June 2, 2003, are permitted to invest only in the Service Class shares.
The Portfolio’s investment objective is to seek long-term growth of capital.
Note 2–Significant Accounting Policies
The Portfolio is an investment company and accordingly follows the investment company accounting and reporting guidance of the Financial Accounting Standards Board (“FASB”) Accounting Standard Codification Topic 946 Financial Services—Investment Companies. The Portfolio prepares its financial statements in accordance with generally accepted accounting principles (“GAAP”) in the United States of America and follows the significant accounting policies described below.
(A) Securities Valuation. Investments are usually valued as of the close of regular trading on the New York Stock Exchange (the “Exchange”) (usually 4:00 p.m. Eastern time) on each day the Portfolio is open for business (“valuation date”).
The Board of Trustees (the “Board”) of the Fund adopted procedures establishing methodologies for the valuation of the Portfolio’s securities and other assets and delegated the responsibility for valuation
determinations under those procedures to the Valuation Committee of the Fund (the “Valuation Committee”). The Board authorized the Valuation Committee to appoint a Valuation Sub-Committee (the “Sub-Committee”) to deal in the first instance with establishing the prices of securities for which market quotations are not readily available or the prices of which are not otherwise readily determinable under these procedures. The Sub-Committee meets (in person, via electronic mail or via teleconference) on an as-needed basis. Subsequently, the Valuation Committee meets to ensure that actions taken by the Sub-Committee were appropriate. The procedures recognize that, subject to the oversight of the Board and unless otherwise noted, the responsibility for the day-to-day valuation of portfolio assets (including fair value measurements for the Portfolio’s assets and liabilities) rests with New York Life Investment Management LLC (“New York Life Investments” or the “Manager”), aided to whatever extent necessary by the Subadvisor (as defined in Note 3(A)) to the Portfolio.
To assess the appropriateness of security valuations, the Manager, the Subadvisor or the Portfolio’s third party service provider, who is subject to oversight by the Manager, regularly compares prior day prices, prices on comparable securities and the sale prices to the prior and current day prices and challenges prices with changes exceeding certain tolerance levels with third party pricing services or broker sources. For those securities valued through either a standardized fair valuation methodology or a fair valuation measurement, the Sub-Committee deals in the first instance with such valuation and the Valuation Committee reviews and affirms, if appropriate, the reasonableness of the valuation based on such methodologies and measurements on a regular basis after considering all relevant information that is reasonably available. Any action taken by the Sub-Committee with respect to the valuation of a portfolio security or other asset is submitted by the Valuation Committee to the Board for its review and ratification, if appropriate, at its next regularly scheduled meeting.
“Fair value” is defined as the price the Portfolio would reasonably expect to receive upon selling an asset or liability in an orderly transaction to an independent buyer in the principal or most advantageous market for the asset or liability. Fair value measurements are determined within a framework that establishes a three-tier hierarchy which maximizes the use of observable market data and minimizes the use of unobservable inputs to establish a classification of fair value measurements for disclosure purposes. “Inputs” refer broadly to the assumptions that market participants would use in pricing the asset or liability, including assumptions about risk, such as the risk inherent in a particular valuation technique used to measure fair value using a pricing model and/or the risk inherent in the inputs for the valuation technique. Inputs may be observable or unobservable. Observable inputs reflect the assumptions market participants would use in pricing the asset or liability based on market data obtained from sources independent of the Portfolio. Unobservable inputs reflect the Portfolio’s own assumptions about the assumptions market participants would use in pricing the asset or liability based on the information available. The inputs or methodology used for valuing assets or liabilities may not be an indication of the risks associated with investing in those assets or liabilities. The three-tier hierarchy of inputs is summarized below.
| • | | Level 1—quoted prices in active markets for an identical asset or liability |
| | |
| 18 | | MainStay VP International Equity Portfolio |
| • | | Level 2—other significant observable inputs (including quoted prices for a similar asset or liability in active markets, interest rates and yield curves, prepayment speeds, credit risk, etc.) |
| • | | Level 3—significant unobservable inputs (including the Portfolio’s own assumptions about the assumptions that market participants would use in measuring fair value of an asset or liability) |
The level of an asset or liability within the fair value hierarchy is based on the lowest level of an input, both individually and in the aggregate, that is significant to the fair value measurement. As of June 30, 2017, the aggregate value by input level of the Portfolio’s assets and liabilities is included at the end of the Portfolio’s Portfolio of Investments.
The Portfolio may use third party vendor evaluations, whose prices may be derived from one or more of the following standard inputs, among others:
| | |
• Broker/dealer quotes | | • Benchmark securities |
• Two-sided markets | | • Reference data (corporate actions or material event notices) |
• Bids/offers | | • Monthly payment information |
• Industry and economic events | | • Reported trades |
An asset or liability for which market values cannot be measured using the methodologies described above is valued by methods deemed reasonable in good faith by the Valuation Committee, following the procedures established by the Board, to represent fair value. Under these procedures, the Portfolio generally uses a market-based approach which may use related or comparable assets or liabilities, recent transactions, market multiples, book values, and other relevant information. The Portfolio may also use an income-based valuation approach in which the anticipated future cash flows of the asset or liability are discounted to calculate fair value. Discounts may also be applied due to the nature and/or duration of any restrictions on the disposition of the asset or liability. Fair value represents a good faith approximation of the value of a security. Fair value determinations involve the consideration of a number of subjective factors, an analysis of applicable facts and circumstances and the exercise of judgment. As a result, it is possible that the fair value for a security determined in good faith in accordance with the Portfolio’s valuation procedures may differ from valuations for the same security determined by other funds using their own valuation procedures. Although the Portfolio’s valuation procedures are designed to value a security at the price the Portfolio may reasonably expect to receive upon the security’s sale in an orderly transaction, there can be no assurance that any fair value determination thereunder would, in fact, approximate the amount that the Portfolio would actually realize upon the sale of the security or the price at which the security would trade if a reliable market price were readily available. During the six-month period ended June 30, 2017, there were no material changes to the fair value methodologies.
Securities which may be valued in this manner include, but are not limited to: (i) a security for which trading has been halted or suspended; (ii) a debt security that has recently gone into default and for which there is not a current market quotation; (iii) a security of an issuer that has entered into a restructuring; (iv) a security that has been de-listed from a national exchange; (v) a security for which the market price is not readily available from a third party pricing source or, if so provided, does
not, in the opinion of the Manager or Subadvisor, reflect the security’s market value; (vi) a security subject to trading collars for which no or limited trading takes place; and (vii) a security whose principal market has been temporarily closed at a time when, under normal conditions, it would be open. Securities for which market quotations or observable inputs are not readily available are generally categorized as Level 3 in the hierarchy. As of June 30, 2017, there were no securities held by the Portfolio that were fair valued in such a manner.
Certain securities held by the Portfolio may principally trade in foreign markets. Events may occur between the time the foreign markets close and the time at which the Portfolio’s NAVs are calculated. These events may include, but are not limited to, situations relating to a single issuer in a market sector, significant fluctuations in U.S. or foreign markets, natural disasters, armed conflicts, governmental actions or other developments not tied directly to the securities markets. Should the Manager or Subadvisor conclude that such events may have affected the accuracy of the last price of such securities reported on the local foreign market, the Sub-Committee may, pursuant to procedures adopted by the Board, adjust the value of the local price to reflect the estimated impact on the price of such securities as a result of such events. In this instance, securities are generally categorized as Level 3 in the hierarchy. Additionally, certain foreign equity securities are also fair valued whenever the movement of a particular index exceeds certain thresholds. In such cases, the securities are fair valued by applying factors provided by a third party vendor in accordance with valuation procedures adopted by the Board and are generally categorized as Level 2 in the hierarchy. As of June 30, 2017, securities that were fair valued in such a manner are shown in the Portfolio of Investments.
Equity securities are valued at the last quoted sales prices as of the close of regular trading on the relevant exchange on each valuation date. Securities that are not traded on the valuation date are valued at the mean of the last quoted bid and ask prices. Prices are normally taken from the principal market in which each security trades.
Investments in mutual funds, including money market funds, are valued at their respective NAVs as of the close of the Exchange on the valuation date. These securities are generally categorized as Level 1 in the hierarchy.
Temporary cash investments acquired in excess of 60 days to maturity at the time of purchase are valued using the latest bid prices or using valuations based on a matrix system (which considers such factors as security prices, yields, maturities, and ratings), both as furnished by independent pricing services. Other temporary cash investments which mature in 60 days or less at the time of purchase (“Short-Term Investments”) are valued using the amortized cost method of valuation, unless the use of such method would be inappropriate. The amortized cost method involves valuing a security at its cost on the date of purchase and thereafter assuming a constant amortization to maturity of the difference between such cost and the value on maturity date. Amortized cost approximates the current fair value of a security. Securities valued using the amortized cost method are not valued using quoted prices in an active market and are generally categorized as Level 2 in the hierarchy.
The information above is not intended to reflect an exhaustive list of the methodologies that may be used to value portfolio investments. The valuation procedures permit the use of a variety of valuation methodologies in connection with valuing portfolio investments. The methodology used for a
Notes to Financial Statements (Unaudited) (continued)
specific type of investment may vary based on the market data available or other considerations. The methodologies summarized above may not represent the specific means by which portfolio investments are valued on any particular business day.
A portfolio security or other asset may be determined to be illiquid under procedures approved by the Board. Illiquidity of a security might prevent the sale of such security at a time when the Manager or Subadvisor might wish to sell, and these securities could have the effect of decreasing the overall level of the Portfolio’s liquidity. Further, the lack of an established secondary market may make it more difficult to value illiquid securities, requiring the Portfolio to rely on judgments that may be somewhat subjective in measuring value, which could vary materially from the amount that the Portfolio could realize upon disposition. Difficulty in selling illiquid securities may result in a loss or may be costly to the Portfolio. Under the supervision of the Board, the Manager or Subadvisor determines the liquidity of the Portfolio’s investments; in doing so, the Manager or Subadvisor may consider various factors, including (i) the frequency of trades and quotations, (ii) the number of dealers and prospective purchasers, (iii) dealer undertakings to make a market, and (iv) the nature of the security and the market in which it trades (e.g., the time needed to dispose of the security, the method of soliciting offers and the mechanics of transfer). Illiquid securities are often valued in accordance with methods deemed by the board in good faith to be reasonable and appropriate to accurately reflect their fair value. The liquidity of the Portfolio’s investments, as shown in the Portfolio of Investments, was determined as of June 30, 2017 and can change at any time in response to, among other relevant factors, market conditions or events or developments with respect to an individual issuer or instrument. As of June 30, 2017, the Portfolio did not hold any securities deemed to be illiquid under procedures approved by the Board.
(B) Income Taxes. The Portfolio’s policy is to comply with the requirements of the Internal Revenue Code of 1986, as amended (the “Internal Revenue Code”), applicable to regulated investment companies and to distribute all of its taxable income to the shareholders of the Portfolio within the allowable time limits. Therefore, no federal, state and local income tax provisions are required.
Management evaluates the Portfolio’s tax positions to determine if the tax positions taken meet the minimum recognition threshold in connection with accounting for uncertainties in income tax positions taken or expected to be taken for the purposes of measuring and recognizing tax liabilities in the financial statements. Recognition of tax benefits of an uncertain tax position is permitted only to the extent the position is “more likely than not” to be sustained assuming examination by taxing authorities. Management has analyzed the Portfolio’s tax positions taken on federal, state and local income tax returns for all open tax years (for up to three tax years), and has concluded that no provisions for federal, state and local income tax are required in the Portfolio’s financial statements. The Portfolio’s federal, state and local income and federal excise tax returns for tax years for which the applicable statutes of limitations have not expired are subject to examination by the Internal Revenue Service and state and local departments of revenue.
(C) Foreign Taxes. The Portfolio may be subject to foreign taxes on income and other transaction-based taxes imposed by certain countries in which it invests. A portion of the taxes on gains on investments or
currency purchases/repatriation may be reclaimable. The Portfolio will accrue such taxes and reclaims as applicable, based upon its current interpretation of tax rules and regulations that exist in the markets in which it invests.
The Portfolio may be subject to taxation on realized capital gains, repatriation proceeds and other transaction-based taxes imposed by certain countries in which it invests. The Portfolio will accrue such taxes as applicable based upon its current interpretation of tax rules and regulations that exist in the market in which it invests. Capital gains taxes relating to positions still held are reflected as a liability on the Statement of Assets and Liabilities, as well as an adjustment to the Portfolio’s net unrealized appreciation (depreciation). Taxes related to capital gains realized, if any, are reflected as part of net realized gain (loss) in the Statement of Operations. Changes in tax liabilities related to capital gains taxes on unrealized investment gains, if any, are reflected as part of the change in net unrealized appreciation (depreciation) on investments in the Statement of Operations. Transaction-based charges are generally assessed as a percentage of the transaction amount.
(D) Dividends and Distributions to Shareholders. Dividends and distributions are recorded on the ex-dividend date. The Portfolio intend to declare and pay dividends from net investment income and distributions from net realized capital and currency gains, if any, at least annually. Unless the shareholder elects otherwise, all dividends and distributions are reinvested in the same class of shares of the Portfolio, at NAV. Dividends and distributions to shareholders are determined in accordance with federal income tax regulations and may differ from GAAP.
(E) Security Transactions and Investment Income. The Portfolio records security transactions on the trade date. Realized gains and losses on security transactions are determined using the identified cost method. Dividend income is recognized on the ex-dividend date; net of any foreign tax withheld at the source, and interest income is accrued as earned using the effective interest rate method.
Discounts and premiums on securities purchased, other than Short-Term Investments, for the Portfolio are accreted and amortized, respectively, on the effective interest rate method over the life of the respective securities. Discounts and premiums on Short-Term Investments are accreted and amortized, respectively, on the straight-line method. The straight-line method approximates the effective interest method for Short-Term Investments.
Investment income and realized and unrealized gains and losses on investments of the Portfolio are allocated pro rata to the separate classes of shares based upon their relative net assets on the date the income is earned or realized and unrealized gains and losses are incurred.
(F) Expenses. Expenses of the Fund are allocated to the individual Portfolios in proportion to the net assets of the respective Portfolios when the expenses are incurred, except where direct allocations of expenses can be made. Expenses (other than fees incurred under the distribution and service plans, further discussed in Note 3(B), which are charged directly to the Service Class shares) are allocated to separate classes of shares pro rata based upon their relative net assets on the date the expenses are incurred. The expenses borne by the Portfolio, including those incurred with related parties to the Portfolio, are shown in the Statement of Operations.
| | |
| 20 | | MainStay VP International Equity Portfolio |
(G) Use of Estimates. In preparing financial statements in conformity with GAAP, management makes estimates and assumptions that affect the reported amounts and disclosures in the financial statements. Actual results could differ from those estimates.
(H) Repurchase Agreements. The Portfolio may enter into repurchase agreements (i.e., buy a security from another party with the agreement that it be sold back in the future) to earn income. The Portfolio may enter into repurchase agreements only with counterparties, usually financial institutions, that are deemed by the Manager or Subadvisor to be creditworthy, pursuant to guidelines established by the Board. During the term of any repurchase agreement, the Manager or Subadvisor will continue to monitor the creditworthiness of the counterparty. Under the 1940 Act, repurchase agreements are considered to be collateralized loans by the Portfolio to the counterparty secured by the securities transferred to the Portfolio.
Repurchase agreements are subject to counterparty risk, meaning the Portfolio could lose money by the counterparty’s failure to perform under the terms of the agreement. The Portfolio mitigates this risk by ensuring the repurchase agreement is collateralized by cash, U.S. government securities, fixed income securities and/or other securities. The collateral is held by the Portfolio’s custodian valued daily on a mark to market basis to determine if the value, including accrued interest, exceeds the repurchase price. In the event of the counterparty’s default on the obligation to repurchase, the Portfolio has the right to liquidate the collateral and apply the proceeds in satisfaction of the obligation. Under certain circumstances, such as in the event of default or bankruptcy by the counterparty, realization and/or retention of the collateral may be limited or subject to delay, to legal proceedings and possible realized loss to the Portfolio.
(I) Foreign Currency Transactions. The Portfolio’s books and records are maintained in U.S. dollars. Prices of securities denominated in foreign currency amounts are translated into U.S. dollars at the mean between the buying and selling rates last quoted by any major U.S. bank at the following dates:
| (i) | market value of investment securities, other assets and liabilities—at the valuation date; and |
| (ii) | purchases and sales of investment securities, income and expenses—at the date of such transactions. |
The assets and liabilities that are denominated in foreign currency amounts are presented at the exchange rates and market values at the close of the period. The realized and unrealized changes in net assets arising from fluctuations in exchange rates and market prices of securities are not separately presented.
Net realized gain (loss) on foreign currency transactions represents net gains and losses on foreign currency forward contracts, net currency gains or losses realized as a result of differences between the amounts of securities sale proceeds or purchase cost, dividends, interest and withholding taxes as recorded on the Portfolio’s books, and the U.S. dollar equivalent amount actually received or paid. Net currency gains or losses from valuing such foreign currency denominated assets and liabilities, other than investments at valuation date exchange rates, are reflected in unrealized foreign exchange gains or losses.
(J) Securities Lending. In order to realize additional income, the Portfolio may engage in securities lending, subject to the limitations set forth in the 1940 Act and relevant guidance by the staff of the Securities and Exchange Commission (“SEC”). In the event the Portfolio does engage in securities lending, the Portfolio will lend through its custodian, State Street Bank and Trust Company (“State Street”). State Street will manage the Portfolio’s collateral in accordance with the lending agreement between the Portfolio and State Street, and indemnify the Portfolio against counterparty risk. The loans will be collateralized by U.S. Treasury securities at least equal at all times to the market value of the securities loaned. The Portfolio may bear the risk of delay in recovery of, or loss of rights in, the securities loaned should the borrower of the securities experience financial difficulty. The Portfolio may also record a realized gain or loss on securities deemed sold due to a borrower’s inability to return securities on loan. The Portfolio bears the risk of any loss on investment of the collateral. The Portfolio will receive compensation for lending its securities in the form of fees or it will retain a portion of interest on the investment of any cash received as collateral. The Portfolio will also continue to receive interest and dividends on the securities loaned and any gain or loss in the market price of the securities loaned that may occur during the term of the loan will be for the account of the Portfolio. During the six-month period ended June 30, 2017, the Portfolio did not have any portfolio securities on loan.
(K) Foreign Securities Risk. The Portfolio invests in foreign securities, which carry certain risks that are in addition to the usual risks inherent in domestic securities. These risks include those resulting from currency fluctuations, future adverse political or economic developments and possible imposition of currency exchange blockages or other foreign governmental laws or restrictions. These risks are likely to be greater in emerging markets than in developed markets. The ability of issuers of securities held by the Portfolio to meet their obligations may be affected by economic and political developments in a specific country, industry or region.
(L) Indemnifications. Under the Fund’s organizational documents, its officers and trustees are indemnified against certain liabilities that may arise out of performance of their duties to the Fund. Additionally, in the normal course of business, the Portfolio enters into contracts with third-party service providers that contain a variety of representations and warranties and which may provide general indemnifications. The Portfolio’s maximum exposure under these arrangements is unknown, as this would involve future claims that may be made against the Portfolio that have not yet occurred. Based on experience, management is of the view that the risk of loss in connection with these potential indemnification obligations is remote. However, there can be no assurance that material liabilities related to such obligations will not arise in the future, which could adversely impact the Portfolio.
Note 3–Fees and Related Party Transactions
(A) Manager and Subadvisor. New York Life Investments, a registered investment adviser and an indirect, wholly-owned subsidiary of New York Life, serves as the Portfolio’s Manager pursuant to an Amended and Restated Management Agreement (“Management Agreement”). The Manager provides offices, conducts clerical, recordkeeping and bookkeeping services, and keeps most of the financial and accounting records
Notes to Financial Statements (Unaudited) (continued)
required to be maintained by the Portfolio. Except for the portion of salaries and expenses that are the responsibility of the Portfolio, the Manager pays the salaries and expenses of all personnel affiliated with the Portfolio and the operational expenses of the Portfolio. The Portfolio reimburses New York Life Investments in an amount equal to a portion of the compensation of the Chief Compliance Officer attributable to the Portfolio. Pursuant to the terms of a Subadvisory Agreement with New York Life Investments, Cornerstone Capital Management Holdings LLC (“Cornerstone Holdings” or “Subadvisor”), a registered investment adviser and an indirect, wholly-owned subsidiary of New York Life, serves as Subadvisor to the Portfolio. New York Life Investments pays for the services of the Subadvisor.
The Fund, on behalf of the Portfolio, pays New York Life Investments in its capacity as the Portfolio’s investment manager and administrator, pursuant to the Management Agreement, a monthly fee for the services performed and the facilities furnished at an annual rate of the Portfolio’s average daily net assets as follows: 0.89% up to $500 million; and 0.85% in excess of $500 million. During the six-month period ended June 30, 2017, the effective management fee rate was 0.89%.
During the six-month period ended June 30, 2017, New York Life Investments earned fees from the Portfolio in the amount of $1,998,463.
State Street provides sub-administration and sub-accounting services to the Portfolio pursuant to an agreement with New York Life Investments. These services include calculating the daily NAVs of the Portfolio, maintaining the general ledger and sub-ledger accounts for the calculation of the Portfolio’s NAVs, and assisting New York Life Investments in conducting various aspects of the Portfolio’s administrative operations. For providing these services to the Portfolio, State Street is compensated by New York Life Investments.
(B) Distribution and Service Fees. The Fund, on behalf of the Portfolio, has entered into a distribution agreement with NYLIFE Distributors LLC (the “Distributor”), an indirect, wholly-owned subsidiary of New York Life. The Portfolio has adopted a distribution plan (the “Plan”) in accordance with the provisions of Rule 12b-1 under the 1940 Act. Under the Plan, the Distributor has agreed to provide, through its affiliates or independent third parties, various distribution-related, shareholder and administrative support services to the Service Class shareholders. For its services, the Distributor is entitled to a combined distribution and service fee accrued daily and paid monthly at an annual rate of 0.25% of the average daily net assets attributable to the Service Class shares of the Portfolio.
Note 4–Federal Income Tax
During the year ended December 31, 2016, the tax character of distributions paid as reflected in the Statements of Changes in Net Assets was as follows:
| | |
| 2016 |
Tax-Based
Distributions
from Ordinary
Income | | Tax-Based
Distributions
from Long-Term
Gains |
| $2,928,161 | | $— |
The Portfolio utilized $25,423,621 of capital loss carryforwards during the year ended December 31, 2016.
Note 5–Custodian
State Street is the custodian of cash and securities held by the Portfolio. Custodial fees are charged to the Portfolio based on the Portfolio’s net assets and/or the market value of securities held by the Portfolio and the number of certain transactions incurred by the Portfolio.
Note 6–Line of Credit
The Portfolio and certain other funds managed by New York Life Investments, maintain a line of credit with a syndicate of banks in order to secure a source of funds for temporary purposes to meet unanticipated or excessive redemption requests.
Effective August 1, 2017, under an amended and restated credit agreement (the “Credit Agreement”), the aggregate commitment amount is $600,000,000 with an additional uncommitted amount of $100,000,000. The commitment fee is an annual rate of 0.15% of the average commitment amount payable quarterly, regardless of usage, to Bank of New York Mellon, who serves as the agent to the syndicate. The commitment fee is allocated among the Portfolio and certain affiliated funds based upon their respective net assets and other factors. Interest on any revolving credit loan is charged based upon the Federal Funds Rate or the one month London InterBank Offered Rate, whichever is higher. The Credit Agreement expires on July 31, 2018, although the Portfolio, certain affiliated funds and the syndicate of banks may renew the Credit Agreement for an additional year on the same or different terms. Prior to August 1, 2017, the aggregate commitment amount was $600,000,000 with an additional uncommitted amount of $100,000,000, and the commitment fee was at an annual rate of 0.10% of the average commitment amount. During the six-month period ended June 30, 2017, there were no borrowings made or outstanding with respect to the Portfolio under the credit agreement for which Bank of New York Mellon served as agent.
Note 7–Interfund Lending Program
Pursuant to an exemptive order issued by the SEC, the Portfolio, along with certain other funds managed by New York Life Investments, may participate in an interfund lending program. The interfund lending program provides an alternative credit facility that permits the Portfolio and certain other funds managed by New York Life Investments to lend or borrow money for temporary purposes directly to or from one another, subject to the conditions of the exemptive order. During the six-month period ended June 30, 2017, there were no interfund loans made or outstanding with respect to the Portfolio.
Note 8–Purchases and Sales of Securities (in 000’s)
During the six-month period ended June 30, 2017, purchases and sales of securities, other than short-term securities, were $103,580 and $138,976, respectively.
| | |
| 22 | | MainStay VP International Equity Portfolio |
Note 9–Capital Share Transactions
Transactions in capital shares for the six-month period ended June 30, 2017, and the year ended December 31, 2016, were as follows:
| | | | | | | | |
Initial Class | | Shares | | | Amount | |
Six-month period ended June 30, 2017: | |
Shares sold | | | 350,970 | | | $ | 5,284,753 | |
Shares redeemed | | | (1,567,852 | ) | | | (22,427,177 | ) |
| | | | |
Net increase (decrease) | | | (1,216,882 | ) | | $ | (17,142,424 | ) |
| | | | |
Year ended December 31, 2016: | |
Shares sold | | | 1,002,703 | | | $ | 13,265,933 | |
Shares issued to shareholders in reinvestment of dividends and distributions | | | 102,347 | | | | 1,470,669 | |
Shares redeemed | | | (5,498,932 | ) | | | (76,560,530 | ) |
| | | | |
Net increase (decrease) | | | (4,393,882 | ) | | $ | (61,823,928 | ) |
| | | | |
| | |
| | | | | | | | |
Service Class | | Shares | | | Amount | |
Six-month period ended June 30, 2017: | |
Shares sold | | | 1,291,730 | | | $ | 18,565,088 | |
Shares redeemed | | | (2,096,089 | ) | | | (30,765,630 | ) |
| | | | |
Net increase (decrease) | | | (804,359 | ) | | $ | (12,200,542 | ) |
| | | | |
Year ended December 31, 2016: | |
Shares sold | | | 1,430,283 | | | $ | 19,246,522 | |
Shares issued to shareholders in reinvestment of dividends and distributions | | | 102,194 | | | | 1,457,492 | |
Shares redeemed | | | (3,946,901 | ) | | | (53,768,391 | ) |
| | | | |
Net increase (decrease) | | | (2,414,424 | ) | | $ | (33,064,377 | ) |
| | | | |
Note 10–Recent Accounting Pronouncement
In October 2016, the SEC adopted new rules and amended existing rules (together, “final rules”) intended to modernize the reporting and disclosure of information by registered investment companies. In part, the final rules amend Regulation S-X and require standardized, enhanced disclosure about derivatives in investment company financial statements, as well as other amendments. The compliance date for the amendments to Regulation S-X is August 1, 2017 and applies to shareholder reports for funds with fiscal periods ending after August 1, 2017. Management is currently evaluating the impact that the adoption of the amendments to Regulation S-X will have on the Portfolio’s financial statements and related disclosures.
Note 11–Subsequent Events
In connection with the preparation of the financial statements of the Portfolio as of and for the six-month period ended June 30, 2017, events and transactions subsequent to June 30, 2017, through the date the financial statements were issued have been evaluated by the Portfolio’s management for possible adjustment and/or disclosure. No subsequent events requiring financial statement adjustment or disclosure have been identified.
Proxy Voting Policies and Procedures and Proxy Voting Record
A description of the policies and procedures that New York Life Investments uses to vote proxies related to the Portfolio’s securities is available without charge, upon request, (i) by calling 800-598-2019 or (ii) by visiting SEC’s website at www.sec.gov.
The Portfolio is required to file with the SEC its proxy voting record for the 12-month period ending June 30 on Form N-PX. The Portfolio’s most recent Form N-PX or proxy voting record is available free of charge upon request (i) by calling 800-598-2019 or; (ii) by visiting the SEC’s website at www.sec.gov.
Shareholder Reports and Quarterly Portfolio Disclosure
The Portfolio is required to file its complete schedule of portfolio holdings with the SEC for its first and third fiscal quarters on Form N-Q. The Portfolio’s Form N-Q is available without charge on the SEC’s website at www.sec.gov or by calling MainStay Investments at 800-598-2019. You also can obtain and review copies of Form N-Q by visiting the SEC’s Public Reference Room in Washington, DC (information on the operation of the Public Reference Room may be obtained by calling 1-800-SEC-0330).
| | |
| 24 | | MainStay VP International Equity Portfolio |
This page intentionally left blank
This page intentionally left blank
MainStay VP Portfolios
MainStay VP offers a wide range of Portfolios. The full array of MainStay VP offerings is listed here, with information about the manager, subadvisors, legal counsel, and independent registered public accounting firm.
Equity Portfolios
MainStay VP Common Stock Portfolio
MainStay VP Cornerstone Growth Portfolio
MainStay VP Eagle Small Cap Growth Portfolio
MainStay VP Emerging Markets Equity Portfolio
MainStay VP Epoch U.S. Equity Yield Portfolio
MainStay VP Epoch U.S. Small Cap Portfolio
MainStay VP International Equity Portfolio
MainStay VP Large Cap Growth Portfolio
MainStay VP MFS® Utilities Portfolio
MainStay VP Mid Cap Core Portfolio
MainStay VP S&P 500 Index Portfolio
MainStay VP Small Cap Core Portfolio
MainStay VP T. Rowe Price Equity Income Portfolio
MainStay VP VanEck Global Hard Assets Portfolio
Mixed Asset Portfolios
MainStay VP Balanced Portfolio
MainStay VP Convertible Portfolio
MainStay VP Cushing Renaissance Advantage Portfolio
MainStay VP Income Builder Portfolio
MainStay VP Janus Henderson Balanced Portfolio
Income Portfolios
MainStay VP Bond Portfolio
MainStay VP Floating Rate Portfolio
MainStay VP Government Portfolio
MainStay VP High Yield Corporate Bond Portfolio
MainStay VP Indexed Bond Portfolio
MainStay VP PIMCO Real Return Portfolio
MainStay VP Unconstrained Bond Portfolio
Money Market
MainStay VP U.S. Government Money Market Portfolio
Alternative
MainStay VP Absolute Return Multi-Strategy Portfolio
Asset Allocation Portfolios
MainStay VP Conservative Allocation Portfolio
MainStay VP Growth Allocation Portfolio
MainStay VP Moderate Allocation Portfolio
MainStay VP Moderate Growth Allocation Portfolio
Manager
New York Life Investment Management LLC
New York, New York
Subadvisors
Candriam Belgium*
Brussels, Belgium
Candriam France S.A.S.*
Paris, France
Cornerstone Capital Management Holdings LLC*
New York, New York
Cushing Asset Management, LP
Dallas, Texas
Eagle Asset Management, Inc.
St Petersburg, Florida
Epoch Investment Partners, Inc.
New York, New York
Janus Capital Management LLC
Denver, Colorado
MacKay Shields LLC*
New York, New York
Massachusetts Financial Services Company
Boston, Massachusetts
NYL Investors LLC*
New York, New York
Pacific Investment Management Company LLC
Newport Beach, California
T. Rowe Price Associates, Inc.
Baltimore, Maryland
Van Eck Associates Corporation
New York, New York
Winslow Capital Management, LLC
Minneapolis, Minnesota
Distributor
NYLIFE Distributors LLC*
Jersey City, New Jersey
Custodian
State Street Bank and Trust Company
Boston, Massachusetts
Independent Registered Public Accounting Firm
PricewaterhouseCoopers LLP
New York, New York
Legal Counsel
Dechert LLP
Washington, District of Columbia
Some Portfolios may not be available in all products.
* An affiliate of New York Life Investment Management LLC
Not part of the Semiannual Report
2017 Semiannual Report
This report is for the general information of New York Life Variable Annuities and NYLIAC Variable Universal Life Insurance Products policyowners. It must be preceded or accompanied by the appropriate product(s) and funds prospectuses if it is given to anyone who is not an owner of a New York Life variable annuity policy or a NYLIAC Variable Universal Life Insurance Product. This report does not offer for sale or solicit orders to purchase securities.
The performance data quoted in this report represents past performance. Past performance is no guarantee of future results. Due to market volatility and other factors, current performance may be lower or higher than the figures shown. The most recent month-end performance summary for your variable annuity or variable life policy is available by calling 800-598-2019 and is updated periodically on www.newyorklife.com.
The New York Life Variable Annuities and NYLIAC Variable Universal Life Insurance Products are issued by New York Life Insurance and Annuity Corporation (a Delaware Corporation) and distributed by NYLIFE Distributors LLC (Member FINRA/SIPC).
New York Life Insurance Company
New York Life Insurance and Annuity Corporation (NYLIAC) (A Delaware Corporation)
51 Madison Avenue, Room 551
New York, NY 10010
www.newyorklife.com
Printed on recycled paper
mainstayinvestments.com
NYLIFE Distributors LLC, 30 Hudson Street, Jersey City, NJ 07302
New York Life Investment Management LLC is the investment manager to the MainStay VP Funds Trust
©2017 by NYLIFE Distributors LLC. All rights reserved.
You may obtain copies of the Prospectus and the Statement of Additional Information free of charge, upon request, by calling toll-free 800-598-2019 or writing to New York Life Insurance and Annuity Corporation, 51 Madison Avenue, New York, NY 10010.
| | | | |
| Not FDIC Insured | | No Bank Guarantee | | May Lose Value |
| | | | |
| 1743132 | | | | MSVPIE10-08/17 (NYLIAC) NI523 |
MainStay VP Unconstrained
Bond Portfolio
Message from the President and Semiannual Report
Unaudited | June 30, 2017

Sign up for electronic delivery of your shareholder reports. For full details on electronic delivery, including who can participate and what you
can receive via eDelivery, please log on to www.newyorklife.com/vsc

This page intentionally left blank
Message from the President
The six months ended June 30, 2017, brought positive results to many stock and bond investors. The year began with many investors hoping that Republican control of the White House, the Senate and the House of Representatives could bring an end to political gridlock; and while debate has continued on a number of issues, the U.S. stock market climbed relatively steadily throughout the first half of 2017.
According to FTSE-Russell U.S. market data, stocks at all capitalization levels tended to record positive total returns during the reporting period, with large-cap stocks generally outperforming stocks of smaller-capitalization companies. Growth stocks outpaced value stocks at every capitalization level by substantial margins—from more than six percentage points for micro-caps and mid-caps to more than 10 percentage points for the largest 200 U.S. companies by market capitalization.
Most sectors of the stock market advanced during the reporting period, with energy and telecommunication services being notable exceptions. Energy stocks declined as oil prices fell despite moves by the Organization of Petroleum Exporting Countries (OPEC) intended to limit oil production by its members. Telecommunication services stocks tended to decline as competition increased and rising interest rates made dividend payouts less appealing.
In March and June of 2017, the Federal Reserve announced successive increases in the target range for the federal funds rate, ultimately bringing the federal funds target range to 1.00% to 1.25%. While short-term U.S. Treasury yields rose in response, yields for U.S. Treasury securities with maturities of five years or longer declined. As the difference between short- and long-term yields narrowed, the advantages of higher-yielding long-term bonds became increasingly apparent.
Virtually all taxable and tax-exempt bond sectors provided positive total returns during the reporting period. Mortgage-backed
securities, though providing positive total returns, faced headwinds when the Federal Reserve announced plans to begin normalizing its balance sheet by reducing reinvestment of principal payments on mortgage-backed securities.
International stock and bond markets were also strong during the reporting period. International stocks provided double-digit total returns that were surpassed by emerging-market stocks as a whole. Global investment-grade bonds provided single-digit returns; and emerging-market debt was somewhat stronger.
Even during periods of favorable market performance and generally positive returns, MainStay believes that it is important to carefully monitor your investments. Your risk tolerance may
change over time, leading you to reevaluate which MainStay VP Portfolios are most appropriate for your long-term goals. Your goals themselves may also change, leading you to pursue investments with more or less risk. The portfolio managers of MainStay VP Portfolios seek to provide results consistent with the investment objectives of their respective Portfolios, to give you a wide range of choices suitable to various investment needs.
The report that follows provides more detailed information about the specific markets, securities and investment decisions that influenced your MainStay VP Portfolio during the six months ended June 30, 2017. We invite you to review the report carefully as part of your ongoing investment evaluation and review.
Sincerely,

Stephen P. Fisher
President
The opinions expressed are as of the date of the accompanying report and are subject to change. Past performance is no guarantee of future results. There is no guarantee that any forecasts made will come to pass. This material does not constitute investment advice and is not intended as an endorsement of any specific investment.
Not all MainStay VP Portfolios and/or share classes are available under all policies.
Not part of the Semiannual Report
Table of Contents
Investors should refer to the Portfolio’s Summary Prospectus and/or Prospectus and consider the Portfolio’s investment objectives, strategies, risks, charges and expenses carefully before investing. The Summary Prospectus and/or Prospectus contain this and other information about the Portfolio. You may obtain copies of the Portfolio’s Summary Prospectus and/or the Prospectus and the Statement of Additional Information free of charge, upon request, by calling toll-free 800-598-2019, by writing to New York Life Insurance and Annuity Corporation, 51 Madison Avenue, Room 251, New York, New York 10010 or by sending an email to MainStayShareholdersServices@nylim.com. These documents are also available at mainstayinvestments.com/vpdocuments. Please read the Summary Prospectus and/or Prospectus carefully before investing. MainStay VP Funds Trust portfolios are separate account options which are purchased through a variable insurance or variable annuity contract.
Investment and Performance Comparison (Unaudited)
Performance data quoted represents past performance. Past performance is no guarantee of future results. Because of market volatility and other factors, current performance may be lower or higher than the figures shown. Investment return and principal value will fluctuate, and as a result, when shares are redeemed, they may be worth more or less than their original cost. The performance table and graph do not reflect any deduction of sales charges, mortality and expense charges, contract charges or administrative charges. Please refer to the Performance Summary appropriate for your policy. For performance information current to the most recent month-end, please call 800-598-2019 or visit www.newyorklife.com.
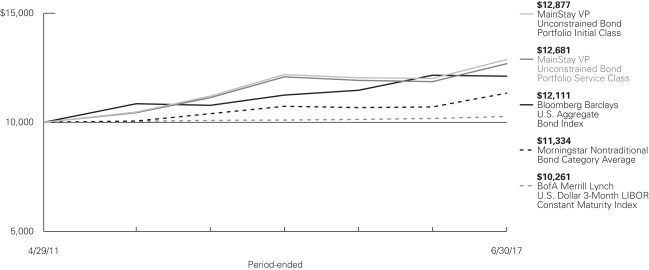
Average Annual Total Returns for the Period Ended June 30, 2017
| | | | | | | | | | | | | | | | |
| Class | | Inception Date | | Six Months | | One Year | | Five Years | | Ten Years or Since Inception | | | Gross
Expense
Ratio1 | |
| Initial Class Shares | | 4/29/2011 | | 2.90% | | 7.21% | | 4.23% | | | 4.18 | % | | | 0.72 | % |
| Service Class Shares | | 4/29/2011 | | 2.77 | | 6.95 | | 3.97 | �� | | 3.92 | | | | 0.97 | |
| | | | | | | | | | | | | | | | |
| Benchmark Performance | | Six
Months | | | One
Year | | | Five
Years | | | Ten Years or Since Inception | |
Bloomberg Barclays U.S. Aggregate Bond Index2 | | | 2.27 | % | | | –0.31 | % | | | 2.21 | % | | | 3.15 | % |
BofA Merrill Lynch U.S. Dollar 3-Month LIBOR Constant Maturity Index3 | | | 0.50 | | | | 0.85 | | | | 0.43 | | | | 0.42 | |
Morningstar Nontraditional Bond Category Average4 | | | 2.85 | | | | 5.92 | | | | 2.69 | | | | 2.05 | |
| 1. | The gross expense ratios presented reflect the Portfolio’s “Total Annual Portfolio Operating Expenses” from the most recent Prospectus and may differ from other expense ratios disclosed in this report. |
| 2. | The Bloomberg Barclays U.S. Aggregate Bond Index is the Portfolio’s primary broad-based securities market index for comparison purposes. The Bloomberg Barclays U.S. Aggregate Bond Index is a broad-based benchmark that measures performance of the investment-grade, U.S. dollar denominated, fixed-rate taxable bond market, including Treasurys, government-related and corporate securities, mortgage-backed securities (agency fixed-rate and hybrid adjustable-rate mortgage pass-throughs), asset-backed securities and commercial mortgage-backed securities. Results assume reinvestment of all dividends and capital gains. An investment cannot be made directly in an index. |
| 3. | The Portfolio has selected the BofA Merrill Lynch U.S. Dollar 3-Month LIBOR Constant Maturity Index as a secondary benchmark. The BofA Merrill Lynch U.S. Dollar 3-Month LIBOR Constant Maturity Index represents the London InterBank Offered Rate (“LIBOR”) with a constant 3-month average maturity. Results assume reinvestment of all dividends and capital gains. An investment cannot be made directly in an index. |
| 4. | The Portfolio has selected the Morningstar Nontraditional Bond Category Average as an additional benchmark. The Morningstar Nontraditional Bond Category Average contains funds that pursue strategies divergent in one or more ways from conventional practice in the broader bond-fund universe. Morningstar category averages are equal-weighted returns based on constituents of the category at the end of the period. Results assume reinvestment of all dividends and capital gains. An investment cannot be made directly in an index. |
Cost in Dollars of a $1,000 Investment in MainStay VP Unconstrained Bond Portfolio (Unaudited)
The example below is intended to describe the fees and expenses borne by shareholders during the six-month period from January 1, 2017 to June 30, 2017, and the impact of those costs on your investment.
Example
As a shareholder of the Portfolio, you incur two types of costs: (1) transaction costs, including exchange fees and sales charges (loads) on purchases (as applicable), and (2) ongoing costs, including management fees, distribution and/or service (12b-1) fees, and other Portfolio expenses (as applicable). This example is intended to help you understand your ongoing costs (in dollars) of investing in the Portfolio and to compare these costs with the ongoing costs of investing in other mutual funds. The example is based on an investment of $1,000 made at the beginning of the six-month period and held for the entire period from January 1, 2017 to June 30, 2017. Shares are only sold in connection with variable life and annuity contracts and the example does not reflect any contract level or transactional fees or expenses. If these costs had been included, your costs would have been higher.
This example illustrates your Portfolio’s ongoing costs in two ways:
Actual Expenses
The second and third data columns in the table below provide information about actual account values and actual expenses. You may use the information in these columns, together with the amount you invested, to estimate the expenses that you paid during the six months ended June 30, 2017. Simply divide your account value by $1,000 (for
example, an $8,600 account value divided by $1,000 = 8.6), then multiply the result by the number under the heading entitled “Expenses Paid During Period” to estimate the expenses you paid on your account during this period.
Hypothetical Example for Comparison Purposes
The fourth and fifth data columns in the table below provide information about hypothetical account values and hypothetical expenses based on the Portfolio’s actual expense ratio and an assumed rate of return of 5% per year before expenses, which is not the Portfolio’s actual return. The hypothetical account values and expenses may not be used to estimate the actual ending account balances or expenses you paid for the six-month period shown. You may use this information to compare the ongoing costs of investing in the Portfolio with the ongoing costs of investing in other mutual funds. To do so, compare this 5% hypothetical example with the 5% hypothetical examples that appear in the shareholder reports of the other mutual funds.
Please note that the expenses shown in the table are meant to highlight your ongoing costs only and do not reflect any transactional costs, such as exchange fees or sales charges (loads). Therefore, the fourth and fifth data columns of the table are useful in comparing ongoing costs only and will not help you determine the relative total costs of owning different funds. In addition, if these transactional costs were included, your costs would have been higher.
| | | | | | | | | | | | | | | | | | | | | | | | |
| | | | | | | | | | | | | | | | | | | |
| Share Class | | Beginning
Account
Value
1/1/17 | | | Ending Account
Value (Based
on Actual
Returns and
Expenses)
6/30/17 | | | Expenses
Paid
During
Period1 | | | Ending Account
Value (Based
on Hypothetical
5% Annualized
Return and
Actual Expenses)
6/30/17 | | | Expenses
Paid
During
Period1 | | | Net Expense
Ratio
During
Period2 | |
| | | | | | |
| Initial Class Shares | | $ | 1,000.00 | | | $ | 1,029.00 | | | $ | 3.37 | | | $ | 1,021.50 | | | $ | 3.36 | | | | 0.67 | % |
| | | | | | |
| Service Class Shares | | $ | 1,000.00 | | | $ | 1,027.70 | | | $ | 4.63 | | | $ | 1,020.20 | | | $ | 4.61 | | | | 0.92 | % |
| 1. | Expenses are equal to the Portfolio’s annualized expense ratio of each class multiplied by the average account value over the period, divided by 365 and multiplied by 181 (to reflect the six-month period). The table above represents the actual expenses incurred during the six-month period. |
| 2. | Expenses are equal to the Portfolio’s annualized expense ratio to reflect the six-month period. |
| | |
| 6 | | MainStay VP Unconstrained Bond Portfolio |
Portfolio Composition as of June 30, 2017 (Unaudited)
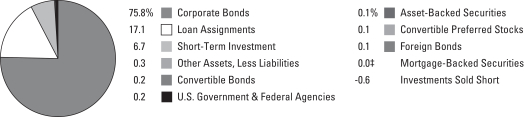
See Portfolio of Investments beginning on page 10 for specific holdings within these categories.
| ‡ | Less than one-tenth of a percent. |
Top Ten Holdings or Issuers Held as of June 30, 2017 (excluding short-term investment) (Unaudited)
| 1. | Bank of America Corp., 1.131%–8.57%, 5/6/19–12/29/49 |
| 2. | Goldman Sachs Group, Inc., 2.30%–6.75%, due 12/13/19–12/29/49 |
| 3. | Morgan Stanley, 3.875%–6.375%, due 11/1/22–7/29/49 |
| 4. | Citigroup, Inc., 2.50%–6.30%, due 7/29/19–12/29/49 |
| 5. | JPMorgan Chase & Co., 3.54%–6.40%, due 5/1/28–12/29/49 |
| 6. | Kreditanstalt Fuer Wiederaufbau, 1.50%, due 2/6/19 |
| 7. | Toyota Motor Credit Corp., 1.25%–1.95%,
due 10/5/17–4/17/20 |
| 8. | Microsoft Corp., 1.10%–1.85%, due 8/8/19–2/6/20 |
| 9. | Petrobras Global Finance B.V., 7.375%, due 1/17/27 |
| 10. | Apple, Inc., 1.55%–3.85%, due 2/8/19–8/4/46 |
Portfolio Management Discussion and Analysis (Unaudited)
Answers to the questions reflect the views of portfolio managers Dan Roberts, PhD, Michael Kimble, CFA, and Louis N. Cohen, CFA, of MacKay Shields LLC, the Portfolio’s Subadvisor.
How did MainStay VP Unconstrained Bond Portfolio perform relative to its benchmarks and peers during the six months ended June 30, 2017?
For the six months ended June 30, 2017, MainStay VP Unconstrained Bond Portfolio returned 2.90% for Initial Class shares and 2.77% for Service Class shares. Over the same period, both share classes outperformed the 2.27% return of the Bloomberg Barclays U.S. Aggregate Bond Index,1 which is the Portfolio’s primary benchmark and the 0.50% return of the BofA Merrill Lynch U.S. Dollar 3-Month LIBOR2 Constant Maturity Index,1 which is a secondary benchmark of the Portfolio. Initial Class shares outperformed—and Service Class shares underperformed—the 2.85% return of the Morningstar Nontraditional Bond Category Average3 for the six months ended June 30, 2017.
What factors affected the Fund’s relative performance during the reporting period?
During the reporting period, the Portfolio’s outperformance relative to the Bloomberg Barclays U.S. Aggregate Bond Index resulted primarily from the Portfolio’s overweight position in spread product.4 Specifically, the Portfolio maintained overweight positions in high-yield bonds and bank loans as credit spreads tightened. The Portfolio maintained allocations to investment-grade bonds, high-yield bonds and loans. At the same time, the Portfolio held a short position in U.S. Treasury futures that contributed to a lower interest-rate duration5 profile.
During the reporting period, the U.S. Treasury yield curve6 flattened, as the Federal Reserve continued on its slow path toward normalizing policy rates. Most industries that were held in the Portfolio generated positive returns, with banking, insurance, basic industry, capital goods and technology providing the strongest contributions to relative performance. (Contributions take weightings and total returns into account.) Although we focused on spread product throughout the reporting period, we reduced the Portfolio’s allocation to high-yield credits in favor of investment-grade credits during the reporting period.
What was the Portfolio’s duration strategy during the reporting period?
To reduce the Portfolio’s sensitivity to interest rates, the Portfolio maintained a shorter duration than the Bloomberg
Barclays U.S. Aggregate Bond Index. As of June 30, 2017, the Portfolio’s effective duration was 1.2 years.
What specific factors, risks or market forces prompted significant decisions for the Portfolio during the reporting period?
Throughout the reporting period, we promoted credit risk as the anticipated principal driver of performance. We expected corporate bonds (both investment grade and high yield) to have returns superior to those of government-related bonds, as a relatively low interest-rate environment could spark healthy demand for higher-yielding products. In addition, improving profitability signaled that corporations were doing more with less: less leverage, less short-term debt and smaller funding gaps, which in turn strengthened credit fundamentals and supported the narrowing of spreads. Although we continued to believe that credit spreads could tighten modestly, we reduced the Portfolio’s exposure to high-yield credits in favor of investment-grade credits as spreads continued to tighten. While we believed that valuations generally remained fair across all credit sectors it was our opinion that greater vigilance was required to navigate what we saw as the late stages of the current economic cycle.
Which sectors were the strongest contributors to the Portfolio’s performance, and which sectors were particularly weak?
During the reporting period, the Portfolio’s position in high-yield bonds was the most significant contributor to the Portfolio’s performance, both on an absolute and a relative basis. Bank loans and investment-grade corporate bonds also contributed positively to the Portfolio’s relative performance.
In the high-yield component of the Portfolio, transportation and telecommunications were the most substantial contributors. In the investment-grade component of the Portfolio, financial and consumer-related holdings generated positive excess returns. Positions within the energy sector underperformed the broad market.
Did the Portfolio make any significant purchases or sales during the reporting period?
During the reporting period, the Portfolio purchased loans in telecommunication services company Sprint and technology
| 1. | See footnote on page 5 for more information on this index. |
| 2. | The London InterBank Offered Rate (LIBOR) is a composite of interest rates at which banks borrow from one another in the London market, and it is a widely used benchmark for short-term interest rates. |
| 3. | See footnote on page 5 for more information on the Morningstar Nontraditional Bond Category Average. |
| 4. | The terms “spread” and “yield spread” may refer to the difference in yield between a security or type of security and comparable U.S. Treasury issues. The terms may also refer to the difference in yield between two specific securities or types of securities at a given time. The term “spread product” refers to asset classes that typically trade at a spread to comparable U.S. Treasury securities. The term “credit spread” typically refers to the difference in yield between corporate or municipal bonds (or a specific category of these bonds) and comparable U.S. Treasury issues. |
| 5. | Duration is a measure of the price sensitivity of a fixed-income investment to changes in interest rates. Duration is expressed as a number of years and is considered a more accurate sensitivity gauge than average maturity. |
| 6. | The yield curve is a line that plots the yields of various securities of similar quality—typically U.S. Treasury issues—across a range of maturities. The U.S. Treasury yield curve serves as a benchmark for other debt and is used in economic forecasting. |
| | |
| 8 | | MainStay VP Unconstrained Bond Portfolio |
company Dell. Both were new issues and came at yields that we found attractive. During the reporting period, the Portfolio sold bonds of trucking company XPO Logistics and health care company HCA. In both cases, the bonds had reached what we considered to be their fair value.
How did the Portfolio’s sector weightings change during the reporting period?
During the reporting period, we trimmed the Portfolio’s position in high-yield credit while increasing the Portfolio’s weighting in investment-grade credit as spreads in the high-yield universe continued to narrow. The Portfolio’s weighting in bank loans remained relatively flat throughout the reporting period.
How was the Portfolio positioned at the end of the reporting period?
As of June 30, 2017, the Portfolio remained overweight relative to the Bloomberg Barclays U.S. Aggregate Bond Index in high-yield bonds and in bank loans, despite the reduced allocation to high-yield bonds. As of the same date, the Portfolio held an overweight position in investment-grade corporate bonds. As of June 30, 2017, the Portfolio was significantly underweight relative to the Index in U.S. Treasury securities and, to a lesser degree, in mortgage-backed securities.
The opinions expressed are those of the portfolio managers as of the date of this report and are subject to change. There is no guarantee that any forecasts made will come to pass. This material does not constitute investment advice and is not intended as an endorsement of any specific investment.
Not all MainStay VP Portfolios and/or share classes are available under all policies.
Portfolio of Investments June 30, 2017 (Unaudited)
| | | | | | | | |
| | | Principal
Amount | | | Value | |
| | | | | | | | |
Long-Term Bonds 93.5%† Asset-Backed Securities 0.1% | |
Home Equity 0.0%‡ | |
First NLC Trust
Series 2007-1, Class A1
1.094%, due 8/25/37 (a)(b) | | $ | 80,992 | | | $ | 45,484 | |
MASTR Asset Backed Securities Trust
Series 2006-HE4, Class A1
1.074%, due 11/25/36 (a) | | | 21,150 | | | | 9,928 | |
Morgan Stanley ABS Capital I Trust (a) | |
Series 2006-HE6, Class A2B
1.124%, due 9/25/36 | | | 76,429 | | | | 36,470 | |
Series 2006-HE8, Class A2B
1.124%, due 10/25/36 | | | 38,713 | | | | 21,089 | |
Series 2007-HE4, Class A2A
1.134%, due 2/25/37 | | | 20,746 | | | | 9,045 | |
Series 2007-NC2, Class A2FP
1.174%, due 2/25/37 | | | 77,935 | | | | 45,853 | |
Soundview Home Equity Loan Trust (a) | |
Series 2007-OPT1, Class 2A1
1.104%, due 6/25/37 | | | 78,696 | | | | 52,161 | |
Series 2006-EQ2, Class A2
1.134%, due 1/25/37 | | | 47,713 | | | | 33,986 | |
| | | | | | | | |
| | | | | | | 254,016 | |
| | | | | | | | |
Other ABS 0.1% | |
Carrington Mortgage Loan Trust
Series 2006-NC4, Class A5
1.084%, due 10/25/36 (a) | | | 21,329 | | | | 21,202 | |
Home Equity Loan Trust
Series 2007-FRE1, Class 2AV1
1.154%, due 4/25/37 (a) | | | 4,633 | | | | 4,629 | |
HSI Asset Securitization Corp. Trust
Series 2007-NC1, Class A1
1.124%, due 4/25/37 (a) | | | 772 | | | | 529 | |
JPMorgan Mortgage Acquisition Trust
Series 2007-HE1, Class AF1
1.124%, due 3/25/47 (a) | | | 31,321 | | | | 19,915 | |
Securitized Asset-Backed Receivables LLC Trust
Series 2007-BR4, Class A2A
1.114%, due 5/25/37 (a) | | | 89,804 | | | | 61,388 | |
Specialty Underwriting & Residential Finance Trust
Series 2006-BC4, Class A2B
1.134%, due 9/25/37 (a) | | | 537,814 | | | | 247,966 | |
| | | | | | | | |
| | | | | | | 355,629 | |
| | | | | | | | |
| | | | | | | | |
| | | Principal
Amount | | | Value | |
| | | | | | | | |
Student Loans 0.0%‡ | |
KeyCorp Student Loan Trust
Series 2000-A, Class A2
1.372%, due 5/25/29 (a) | | $ | 145,425 | | | $ | 141,311 | |
| | | | | | | | |
Total Asset-Backed Securities
(Cost $1,033,992) | | | | | | | 750,956 | |
| | | | | | | | |
|
| Convertible Bonds 0.2% | |
Health Care—Products 0.1% | | | | | | | | |
Danaher Corp.
(zero coupon), due 1/22/21 | | | 266,000 | | | | 858,182 | |
| | | | | | | | |
|
Health Care—Services 0.0%‡ | |
Anthem, Inc.
2.750%, due 10/15/42 | | | 160,000 | | | | 412,900 | |
| | | | | | | | |
|
Internet 0.1% | |
Priceline Group, Inc.
1.000%, due 3/15/18 | | | 305,000 | | | | 602,947 | |
| | | | | | | | |
|
Pharmaceuticals 0.0%‡ | |
Teva Pharmaceutical Finance Co. LLC
0.250%, due 2/1/26 | | | 295,000 | | | | 317,863 | |
| | | | | | | | |
|
Real Estate Investment Trusts 0.0%‡ | |
SL Green Operating Partnership, L.P.
3.000%, due 10/15/17 | | | 250,000 | | | | 340,000 | |
| | | | | | | | |
|
Software 0.0%‡ | |
Salesforce.com, Inc.
0.250%, due 4/1/18 | | | 190,000 | | | | 251,750 | |
| | | | | | | | |
Total Convertible Bonds
(Cost $1,744,382) | | | | | | | 2,783,642 | |
| | | | | | | | |
|
| Corporate Bonds 75.8% | |
Advertising 0.1% | | | | | | | | |
Lamar Media Corp.
5.000%, due 5/1/23 | | | 900,000 | | | | 936,000 | |
| | | | | | | | |
|
Aerospace & Defense 0.5% | |
Boeing Co.
2.125%, due 3/1/22 | | | 2,400,000 | | | | 2,395,529 | |
Orbital ATK, Inc.
5.500%, due 10/1/23 | | | 2,885,000 | | | | 3,036,462 | |
| | | | | | | | |
| | | | | | | 5,431,991 | |
| | | | | | | | |
| † | Percentages indicated are based on Portfolio net assets. |
| ¨ | | Among the Portfolio’s 10 largest holdings or issuers held, as of June 30, 2017, excluding short-term investment. May be subject to change daily. |
| | | | |
| 10 | | MainStay VP Unconstrained Bond Portfolio | | The notes to the financial statements are an integral part of,
and should be read in conjunction with, the financial statements. |
| | | | | | | | |
| | | Principal
Amount | | | Value | |
| Corporate Bonds (continued) | |
Agriculture 1.0% | |
Bunge, Ltd. Finance Corp.
3.500%, due 11/24/20 | | $ | 4,435,000 | | | $ | 4,546,806 | |
Philip Morris International, Inc.
1.625%, due 2/21/19 | | | 6,500,000 | | | | 6,479,584 | |
| | | | | | | | |
| | | | | | | 11,026,390 | |
| | | | | | | | |
Airlines 0.9% | |
American Airlines Pass-Through Trust | | | | | | | | |
Series 2015-2, Class AA
3.600%, due 3/22/29 | | | 952,663 | | | | 972,859 | |
Series 2015-2, Class A
4.000%, due 3/22/29 | | | 952,668 | | | | 994,347 | |
Continental Airlines, Inc. | | | | | | | | |
Series 2007-1, Class A
5.983%, due 10/19/23 | | | 615,097 | | | | 676,607 | |
Series 2003-ERJ1
7.875%, due 1/2/20 | | | 66,226 | | | | 67,385 | |
Series 2004-ERJ1
9.558%, due 3/1/21 | | | 8,326 | | | | 8,847 | |
Series 2005-ERJ1
9.798%, due 10/1/22 | | | 358,764 | | | | 393,744 | |
Delta Air Lines, Inc. | | | | | | | | |
Series 2011-1, Class A
5.300%, due 10/15/20 | | | 178,586 | | | | 187,515 | |
Series 2010-1, Class A
6.200%, due 1/2/20 | | | 44,022 | | | | 45,727 | |
Northwest Airlines, Inc.
Series 2007-1, Class A
7.027%, due 5/1/21 | | | 60,882 | | | | 67,427 | |
U.S. Airways Group, Inc. | | | | | | | | |
Series 2012-1, Class A
5.900%, due 4/1/26 | | | 1,410,301 | | | | 1,579,537 | |
Series 2010-1, Class A
6.250%, due 10/22/24 | | | 1,010,866 | | | | 1,124,588 | |
UAL Pass Through Trust
Series 2007-1
6.636%, due 1/2/24 | | | 2,157,211 | | | | 2,340,574 | |
United Airlines, Inc.
Series 2014-2, Class B
4.625%, due 3/3/24 | | | 1,500,846 | | | | 1,545,872 | |
| | | | | | | | |
| | | | | | | 10,005,029 | |
| | | | | | | | |
Apparel 0.2% | |
VF Corp.
3.500%, due 9/1/21 | | | 2,185,000 | | | | 2,278,826 | |
| | | | | | | | |
|
Auto Manufacturers 2.0% | |
Daimler Finance North America LLC
2.300%, due 1/6/20 (b) | | | 5,000,000 | | | | 5,015,990 | |
Ford Holdings LLC
9.300%, due 3/1/30 | | | 215,000 | | | | 298,830 | |
| | | | | | | | |
| | | Principal
Amount | | | Value | |
Auto Manufacturers (continued) | |
Ford Motor Co. | | | | | | | | |
6.625%, due 10/1/28 | | $ | 51,000 | | | $ | 60,237 | |
7.450%, due 7/16/31 | | | 614,000 | | | | 776,305 | |
8.900%, due 1/15/32 | | | 135,000 | | | | 183,424 | |
Ford Motor Credit Co. LLC
8.125%, due 1/15/20 | | | 1,584,000 | | | | 1,798,526 | |
General Motors Financial Co., Inc. | | | | | | | | |
3.450%, due 4/10/22 | | | 4,000,000 | | | | 4,065,592 | |
5.250%, due 3/1/26 | | | 652,000 | | | | 704,233 | |
¨Toyota Motor Credit Corp. | | | | | | | | |
1.950%, due 4/17/20 | | | 4,300,000 | | | | 4,298,671 | |
1.250%, due 10/5/17 | | | 4,924,000 | | | | 4,923,040 | |
| | | | | | | | |
| | | | | | | 22,124,848 | |
| | | | | | | | |
Auto Parts & Equipment 0.9% | |
Dana, Inc.
5.375%, due 9/15/21 | | | 4,450,000 | | | | 4,577,937 | |
Schaeffler Finance B.V.
4.750%, due 5/15/23 (b) | | | 2,195,000 | | | | 2,260,850 | |
ZF North America Capital, Inc.
4.500%, due 4/29/22 (b) | | | 3,380,000 | | | | 3,549,000 | |
| | | | | | | | |
| | | | | | | 10,387,787 | |
| | | | | | | | |
Banks 14.0% | |
¨Bank of America Corp. | | | | | | | | |
1.131%, due 5/6/19 (a) | | EUR | 1,000,000 | | | | 1,163,279 | |
3.248%, due 10/21/27 | | $ | 7,705,000 | | | | 7,445,596 | |
3.500%, due 4/19/26 | | | 6,165,000 | | | | 6,185,998 | |
3.705%, due 4/24/28 (a) | | | 640,000 | | | | 644,688 | |
4.875%, due 4/1/44 | | | 515,000 | | | | 576,585 | |
5.000%, due 1/21/44 | | | 540,000 | | | | 610,443 | |
5.125%, due 12/29/49 (a) | | | 2,010,000 | | | | 2,052,712 | |
5.625%, due 7/1/20 | | | 1,390,000 | | | | 1,522,197 | |
5.875%, due 2/7/42 | | | 465,000 | | | | 582,724 | |
6.110%, due 1/29/37 | | | 1,438,000 | | | | 1,760,040 | |
6.300%, due 12/29/49 (a) | | | 1,810,000 | | | | 2,029,462 | |
7.625%, due 6/1/19 | | | 95,000 | | | | 104,754 | |
8.570%, due 11/15/24 | | | 455,000 | | | | 579,282 | |
Bank of New York Mellon Corp. (a) | | | | | | | | |
2.661%, due 5/16/23 | | | 3,715,000 | | | | 3,726,769 | |
4.625%, due 12/29/49 | | | 3,740,000 | | | | 3,772,164 | |
Barclays Bank PLC
5.140%, due 10/14/20 | | | 4,249,000 | | | | 4,547,645 | |
BB&T Corp.
2.750%, due 4/1/22 | | | 4,790,000 | | | | 4,860,763 | |
Capital One Financial Corp. | | | | | | | | |
4.200%, due 10/29/25 | | | 470,000 | | | | 473,921 | |
5.550%, due 12/29/49 (a) | | | 2,365,000 | | | | 2,483,250 | |
¨Citigroup, Inc. | | | | | | | | |
2.500%, due 7/29/19 | | | 2,540,000 | | | | 2,562,812 | |
4.650%, due 7/30/45 | | | 1,322,000 | | | | 1,437,523 | |
5.500%, due 9/13/25 | | | 2,710,000 | | | | 3,013,582 | |
6.300%, due 12/29/49 (a) | | | 4,290,000 | | | | 4,568,850 | |
| | | | | | |
The notes to the financial statements are an integral part of,
and should be read in conjunction with, the financial statements. | | | | | 11 | |
Portfolio of Investments June 30, 2017 (Unaudited) (continued)
| | | | | | | | |
| | | Principal
Amount | | | Value | |
| Corporate Bonds (continued) | |
Banks (continued) | |
Citizens Bank N.A.
2.550%, due 5/13/21 | | $ | 1,145,000 | | | $ | 1,145,632 | |
Citizens Financial Group, Inc. | | | | | | | | |
4.150%, due 9/28/22 (b) | | | 1,450,000 | | | | 1,511,840 | |
4.300%, due 12/3/25 | | | 2,550,000 | | | | 2,658,643 | |
Discover Bank | | | | | | | | |
7.000%, due 4/15/20 | | | 1,005,000 | | | | 1,115,496 | |
8.700%, due 11/18/19 | | | 420,000 | | | | 474,566 | |
¨Goldman Sachs Group, Inc. | | | | | | | | |
2.300%, due 12/13/19 | | | 2,100,000 | | | | 2,105,735 | |
3.625%, due 1/22/23 | | | 2,813,000 | | | | 2,903,348 | |
3.850%, due 1/26/27 | | | 2,700,000 | | | | 2,746,732 | |
5.250%, due 7/27/21 | | | 1,900,000 | | | | 2,082,495 | |
5.300%, due 12/29/49 (a)(c) | | | 2,537,000 | | | | 2,663,850 | |
6.750%, due 10/1/37 | | | 4,225,000 | | | | 5,484,223 | |
Huntington Bancshares, Inc.
3.150%, due 3/14/21 | | | 3,910,000 | | | | 3,987,121 | |
¨JPMorgan Chase & Co. | | | | | | | | |
3.540%, due 5/1/28 (a) | | | 6,265,000 | | | | 6,283,970 | |
6.125%, due 12/29/49 (a) | | | 2,660,000 | | | | 2,876,125 | |
6.400%, due 5/15/38 | | | 920,000 | | | | 1,232,641 | |
¨Kreditanstalt Fuer Wiederaufbau
1.500%, due 2/6/19 | | | 9,435,000 | | | | 9,434,887 | |
¨Morgan Stanley | | | | | | | | |
3.875%, due 1/27/26 | | | 400,000 | | | | 411,792 | |
4.300%, due 1/27/45 | | | 3,710,000 | | | | 3,836,578 | |
4.875%, due 11/1/22 | | | 1,931,000 | | | | 2,096,576 | |
5.000%, due 11/24/25 | | | 3,450,000 | | | | 3,751,730 | |
5.450%, due 7/29/49 (a) | | | 2,600,000 | | | | 2,692,300 | |
6.375%, due 7/24/42 | | | 595,000 | | | | 790,934 | |
PNC Bank N.A.
1.700%, due 12/7/18 | | | 3,530,000 | | | | 3,529,552 | |
Royal Bank of Canada
2.500%, due 1/19/21 | | | 3,860,000 | | | | 3,886,287 | |
Royal Bank of Scotland Group PLC | | | | | | | | |
5.125%, due 5/28/24 | | | 3,589,000 | | | | 3,770,137 | |
6.000%, due 12/19/23 | | | 205,000 | | | | 225,801 | |
6.125%, due 12/15/22 | | | 970,000 | | | | 1,061,991 | |
Santander UK Group Holdings PLC
3.571%, due 1/10/23 | | | 2,030,000 | | | | 2,076,195 | |
Toronto-Dominion Bank
1.800%, due 7/13/21 | | | 4,695,000 | | | | 4,599,306 | |
US Bancorp
2.200%, due 4/25/19 | | | 2,385,000 | | | | 2,404,855 | |
US Bank N.A. | | | | | | | | |
2.000%, due 1/24/20 | | | 2,500,000 | | | | 2,510,767 | |
1.400%, due 4/26/19 | | | 2,615,000 | | | | 2,598,879 | |
Wachovia Corp.
5.500%, due 8/1/35 | | | 655,000 | | | | 759,588 | |
| | | | | | | | |
| | | Principal
Amount | | | Value | |
Banks (continued) | | | | | | | | |
Wells Fargo & Co. | | | | | | | | |
3.000%, due 10/23/26 | | $ | 1,640,000 | | | $ | 1,596,961 | |
4.900%, due 11/17/45 | | | 115,000 | | | | 125,393 | |
5.375%, due 11/2/43 | | | 775,000 | | | | 896,566 | |
5.875%, due 12/29/49 (a) | | | 595,000 | | | | 655,672 | |
5.900%, due 12/29/49 (a) | | | 3,270,000 | | | | 3,502,170 | |
Wells Fargo Bank N.A.
5.850%, due 2/1/37 | | | 300,000 | | | | 374,603 | |
Wells Fargo Capital X
5.950%, due 12/1/86 | | | 1,925,000 | | | | 2,172,362 | |
| | | | | | | | |
| | | | | | | 155,739,338 | |
| | | | | | | | |
Beverages 2.8% | |
Anheuser-Busch InBev Finance, Inc. | | | | | | | | |
3.650%, due 2/1/26 | | | 4,185,000 | | | | 4,311,680 | |
4.900%, due 2/1/46 | | | 2,000,000 | | | | 2,257,282 | |
Constellation Brands, Inc. | | | | | | | | |
3.700%, due 12/6/26 | | | 915,000 | | | | 931,215 | |
4.250%, due 5/1/23 | | | 2,985,000 | | | | 3,177,816 | |
4.750%, due 11/15/24 | | | 2,195,000 | | | | 2,392,594 | |
Dr. Pepper Snapple Group, Inc.
3.200%, due 11/15/21 | | | 3,230,000 | | | | 3,317,782 | |
Molson Coors Brewing Co. | | | | | | | | |
2.100%, due 7/15/21 | | | 3,129,000 | | | | 3,076,971 | |
3.000%, due 7/15/26 | | | 4,720,000 | | | | 4,539,908 | |
PepsiCo, Inc. | |
1.550%, due 5/2/19 | | | 2,110,000 | | | | 2,109,291 | |
1.350%, due 10/4/19 | | | 4,900,000 | | | | 4,856,733 | |
| | | | | | | | |
| | | | 30,971,272 | |
| | | | | | | | |
Biotechnology 0.5% | |
Biogen, Inc.
3.625%, due 9/15/22 | | | 3,560,000 | | | | 3,723,262 | |
Gilead Sciences, Inc.
4.500%, due 2/1/45 | | | 2,000,000 | | | | 2,073,280 | |
| | | | | | | | |
| | | | 5,796,542 | |
| | | | | | | | |
Building Materials 1.4% | |
Fortune Brands Home & Security, Inc.
4.000%, due 6/15/25 | | | 4,630,000 | | | | 4,809,459 | |
Masco Corp. | |
4.375%, due 4/1/26 | | | 1,745,000 | | | | 1,861,392 | |
7.125%, due 3/15/20 | | | 142,000 | | | | 159,192 | |
Masonite International Corp.
5.625%, due 3/15/23 (b) | | | 4,000,000 | | | | 4,180,000 | |
Standard Industries, Inc.
5.375%, due 11/15/24 (b) | | | 4,290,000 | | | | 4,520,587 | |
USG Corp.
5.500%, due 3/1/25 (b) | | | 320,000 | | | | 340,000 | |
| | | | | | | | |
| | | | 15,870,630 | |
| | | | | | | | |
| | | | |
| 12 | | MainStay VP Unconstrained Bond Portfolio | | The notes to the financial statements are an integral part of,
and should be read in conjunction with, the financial statements. |
| | | | | | | | |
| | | Principal
Amount | | | Value | |
| Corporate Bonds (continued) | |
Chemicals 1.0% | |
Air Liquide Finance S.A. | |
1.375%, due 9/27/19 (b) | | $ | 2,780,000 | | | $ | 2,742,198 | |
1.750%, due 9/27/21 (b) | | | 1,895,000 | | | | 1,844,822 | |
Ashland LLC
4.750%, due 8/15/22 | | | 2,525,000 | | | | 2,641,781 | |
Dow Chemical Co.
8.550%, due 5/15/19 | | | 197,000 | | | | 220,647 | |
Huntsman International LLC
5.125%, due 11/15/22 | | | 970,000 | | | | 1,037,900 | |
W.R. Grace & Co.
5.125%, due 10/1/21 (b) | | | 2,915,000 | | | | 3,126,338 | |
| | | | | | | | |
| | | | 11,613,686 | |
| | | | | | | | |
Commercial Services 0.6% | |
IHS Markit, Ltd.
4.750%, due 2/15/25 (b) | | | 2,105,000 | | | | 2,260,244 | |
Service Corp. International | |
5.375%, due 1/15/22 | | | 3,699,000 | | | | 3,809,970 | |
5.375%, due 5/15/24 | | | 530,000 | | | | 559,759 | |
| | | | | | | | |
| | | | 6,629,973 | |
| | | | | | | | |
Computers 1.6% | |
¨Apple, Inc. | |
1.550%, due 2/8/19 | | | 4,970,000 | | | | 4,968,554 | |
1.550%, due 8/4/21 | | | 1,620,000 | | | | 1,582,698 | |
3.850%, due 8/4/46 | | | 1,170,000 | | | | 1,169,200 | |
Dell International LLC / EMC Corp.
6.020%, due 6/15/26 | | | 625,000 | | | | 688,443 | |
Hewlett Packard Enterprise Co.
3.600%, due 10/15/20 | | | 2,000,000 | | | | 2,062,198 | |
International Business Machines Corp.
1.900%, due 1/27/20 | | | 3,255,000 | | | | 3,255,898 | |
NCR Corp.
5.000%, due 7/15/22 | | | 3,545,000 | | | | 3,615,900 | |
| | | | | | | | |
| | | | 17,342,891 | |
| | | | | | | | |
Cosmetics & Personal Care 0.5% | |
Estee Lauder Cos., Inc.
1.800%, due 2/7/20 | | | 2,050,000 | | | | 2,051,291 | |
Unilever Capital Corp.
1.800%, due 5/5/20 | | | 3,500,000 | | | | 3,493,546 | |
| | | | | | | | |
| | | | 5,544,837 | |
| | | | | | | | |
Diversified Financial Services 2.8% | |
AerCap Ireland Capital DAC / AerCap Global Aviation Trust
4.625%, due 10/30/20 | | | 3,585,000 | | | | 3,810,034 | |
Air Lease Corp. | |
2.625%, due 7/1/22 | | | 2,155,000 | | | | 2,135,905 | |
2.125%, due 1/15/20 | | | 2,215,000 | | | | 2,204,408 | |
Ally Financial, Inc. | |
3.500%, due 1/27/19 | | | 3,175,000 | | | | 3,218,656 | |
8.000%, due 11/1/31 | | | 2,565,000 | | | | 3,142,125 | |
| | | | | | | | |
| | | Principal
Amount | | | Value | |
Diversified Financial Services (continued) | |
CIT Group, Inc.
3.875%, due 2/19/19 | | $ | 810,000 | | | $ | 830,250 | |
Discover Financial Services
3.850%, due 11/21/22 | | | 300,000 | | | | 307,234 | |
GE Capital International Funding Co.
2.342%, due 11/15/20 | | | 7,300,000 | | | | 7,358,363 | |
International Lease Finance Corp.
5.875%, due 4/1/19 | | | 1,385,000 | | | | 1,470,971 | |
Peachtree Corners Funding Trust
3.976%, due 2/15/25 (b) | | | 560,000 | | | | 568,284 | |
Protective Life Global Funding
1.555%, due 9/13/19 (b) | | | 1,200,000 | | | | 1,182,392 | |
Springleaf Finance Corp.
5.250%, due 12/15/19 | | | 1,140,000 | | | | 1,185,714 | |
Synchrony Financial
4.500%, due 7/23/25 | | | 4,000,000 | | | | 4,113,400 | |
| | | | | | | | |
| | | | 31,527,736 | |
| | | | | | | | |
Electric 3.7% | |
AEP Transmission Co. LLC
3.100%, due 12/1/26 | | | 3,360,000 | | | | 3,350,468 | |
Appalachian Power Co.
3.300%, due 6/1/27 | | | 1,400,000 | | | | 1,417,821 | |
Baltimore Gas & Electric Co.
2.400%, due 8/15/26 | | | 3,260,000 | | | | 3,085,515 | |
CMS Energy Corp. | |
3.875%, due 3/1/24 | | | 1,705,000 | | | | 1,783,437 | |
5.050%, due 3/15/22 | | | 1,350,000 | | | | 1,484,943 | |
6.250%, due 2/1/20 | | | 1,360,000 | | | | 1,497,104 | |
Consolidated Edison, Inc.
2.000%, due 3/15/20 | | | 2,090,000 | | | | 2,089,256 | |
Duquesne Light Holdings, Inc.
5.900%, due 12/1/21 (b) | | | 1,494,000 | | | | 1,669,954 | |
Entergy Arkansas, Inc.
3.500%, due 4/1/26 | | | 960,000 | | | | 991,098 | |
FirstEnergy Transmission LLC | |
4.350%, due 1/15/25 (b) | | | 1,675,000 | | | | 1,750,258 | |
5.450%, due 7/15/44 (b) | | | 2,370,000 | | | | 2,707,135 | |
Florida Power & Light Co.
2.750%, due 6/1/23 | | | 2,155,000 | | | | 2,178,190 | |
Great Plains Energy, Inc.
2.500%, due 3/9/20 | | | 1,700,000 | | | | 1,715,864 | |
4.850%, due 6/1/21 | | | 1,455,000 | | | | 1,550,569 | |
5.292%, due 6/15/22 (d) | | | 795,000 | | | | 870,389 | |
MidAmerican Energy Co.
3.100%, due 5/1/27 | | | 4,500,000 | | | | 4,530,731 | |
Pacific Gas & Electric Co.
1.402%, due 11/30/17 (a) | | | 3,800,000 | | | | 3,800,916 | |
Public Service Electric & Gas Co.
3.000%, due 5/15/27 | | | 2,635,000 | | | | 2,640,325 | |
Puget Energy, Inc.
5.625%, due 7/15/22 | | | 585,000 | | | | 653,544 | |
| | | | | | |
The notes to the financial statements are an integral part of,
and should be read in conjunction with, the financial statements. | | | | | 13 | |
Portfolio of Investments June 30, 2017 (Unaudited) (continued)
| | | | | | | | |
| | | Principal
Amount | | | Value | |
| Corporate Bonds (continued) | |
Electric (continued) | | | | | | | | |
WEC Energy Group, Inc.
3.294%, due 5/15/67 (a) | | $ | 1,860,340 | | | $ | 1,799,879 | |
| | | | | | | | |
| | | | | | | 41,567,396 | |
| | | | | | | | |
Electronics 0.4% | |
Honeywell International, Inc.
1.400%, due 10/30/19 | | | 990,000 | | | | 983,286 | |
5.375%, due 3/1/41 | | | 3,000,000 | | | | 3,731,604 | |
| | | | | | | | |
| | | | | | | 4,714,890 | |
| | | | | | | | |
Entertainment 0.3% | |
International Game Technology PLC
6.250%, due 2/15/22 | | | 2,595,000 | | | | 2,835,038 | |
| | | | | | | | |
|
Environmental Controls 0.6% | |
Republic Services, Inc.
4.750%, due 5/15/23 | | | 3,665,000 | | | | 4,028,927 | |
Waste Management, Inc.
2.400%, due 5/15/23 | | | 505,000 | | | | 498,342 | |
4.600%, due 3/1/21 | | | 1,800,000 | | | | 1,942,484 | |
| | | | | | | | |
| | | | | | | 6,469,753 | |
| | | | | | | | |
Food 3.2% | |
Ingredion, Inc.
3.200%, due 10/1/26 | | | 1,935,000 | | | | 1,904,450 | |
J.M. Smucker Co.
1.750%, due 3/15/18 | | | 3,865,000 | | | | 3,866,894 | |
Kerry Group Financial Services
3.200%, due 4/9/23 (b) | | | 2,151,000 | | | | 2,137,021 | |
Kraft Heinz Foods Co.
4.875%, due 2/15/25 (b) | | | 2,252,000 | | | | 2,413,671 | |
5.000%, due 6/4/42 | | | 1,840,000 | | | | 1,942,458 | |
Kroger Co.
1.500%, due 9/30/19 | | | 2,805,000 | | | | 2,763,360 | |
Mondelez International Holdings Netherlands B.V.
1.625%, due 10/28/19 (b) | | | 3,060,000 | | | | 3,031,251 | |
2.000%, due 10/28/21 (b) | | | 3,355,000 | | | | 3,268,837 | |
Smithfield Foods, Inc.
2.700%, due 1/31/20 (b) | | | 1,940,000 | | | | 1,950,228 | |
3.350%, due 2/1/22 (b) | | | 1,805,000 | | | | 1,814,387 | |
Sysco Corp.
3.250%, due 7/15/27 | | | 4,145,000 | | | | 4,081,142 | |
3.300%, due 7/15/26 | | | 1,735,000 | | | | 1,721,231 | |
Whole Foods Market, Inc.
5.200%, due 12/3/25 | | | 4,210,000 | | | | 4,865,489 | |
| | | | | | | | |
| | | | | | | 35,760,419 | |
| | | | | | | | |
Food Services 0.3% | |
Aramark Services, Inc.
4.750%, due 6/1/26 | | | 2,790,000 | | | | 2,894,625 | |
| | | | | | | | |
| | | | | | | | |
| | | Principal
Amount | | | Value | |
Forest Products & Paper 0.3% | |
Georgia-Pacific LLC
8.000%, due 1/15/24 | | $ | 2,180,000 | | | $ | 2,798,015 | |
International Paper Co.
7.300%, due 11/15/39 | | | 157,000 | | | | 212,316 | |
| | | | | | | | |
| | | | | | | 3,010,331 | |
| | | | | | | | |
Gas 0.6% | |
AmeriGas Partners, L.P. / AmeriGas Finance Corp.
5.500%, due 5/20/25 | | | 500,000 | | | | 510,000 | |
5.750%, due 5/20/27 | | | 350,000 | | | | 354,375 | |
5.625%, due 5/20/24 | | | 2,754,000 | | | | 2,836,620 | |
NiSource Finance Corp.
3.490%, due 5/15/27 | | | 2,600,000 | | | | 2,617,891 | |
| | | | | | | | |
| | | | | | | 6,318,886 | |
| | | | | | | | |
Health Care—Products 1.5% | |
Alere, Inc.
6.500%, due 6/15/20 | | | 1,969,000 | | | | 1,998,535 | |
Baxter International, Inc.
2.600%, due 8/15/26 | | | 6,085,000 | | | | 5,790,547 | |
Becton Dickinson & Co.
3.363%, due 6/6/24 | | | 2,245,000 | | | | 2,250,132 | |
Medtronic Global Holdings SCA
1.700%, due 3/28/19 | | | 3,605,000 | | | | 3,607,286 | |
Stryker Corp.
2.625%, due 3/15/21 | | | 1,500,000 | | | | 1,515,592 | |
Zimmer Biomet Holdings, Inc.
2.700%, due 4/1/20 | | | 1,190,000 | | | | 1,200,849 | |
| | | | | | | | |
| | | | | | | 16,362,941 | |
| | | | | | | | |
Health Care—Services 1.0% | |
HCA, Inc.
5.875%, due 3/15/22 | | | 1,000,000 | | | | 1,108,750 | |
Laboratory Corp. of America Holdings
2.500%, due 11/1/18 | | | 4,100,000 | | | | 4,132,583 | |
Tenet Healthcare Corp.
4.746%, due 6/15/20 (a) | | | 3,250,000 | | | | 3,282,500 | |
UnitedHealth Group, Inc.
1.400%, due 10/15/17 | | | 2,820,000 | | | | 2,818,818 | |
| | | | | | | | |
| | | | | | | 11,342,651 | |
| | | | | | | | |
Home Builders 2.5% | |
CalAtlantic Group, Inc.
5.875%, due 11/15/24 (c) | | | 800,000 | | | | 867,000 | |
6.250%, due 12/15/21 | | | 1,150,000 | | | | 1,288,000 | |
8.375%, due 5/15/18 | | | 885,000 | | | | 930,356 | |
D.R. Horton, Inc.
3.750%, due 3/1/19 | | | 3,905,000 | | | | 3,994,725 | |
4.375%, due 9/15/22 | | | 3,350,000 | | | | 3,565,680 | |
KB Home
8.000%, due 3/15/20 | | | 1,925,000 | | | | 2,165,625 | |
| | | | |
| 14 | | MainStay VP Unconstrained Bond Portfolio | | The notes to the financial statements are an integral part of,
and should be read in conjunction with, the financial statements. |
| | | | | | | | |
| | | Principal
Amount | | | Value | |
| Corporate Bonds (continued) | |
Home Builders (continued) | | | | | | | | |
Lennar Corp.
4.500%, due 6/15/19 | | $ | 2,970,000 | | | $ | 3,070,237 | |
4.500%, due 11/15/19 | | | 1,300,000 | | | | 1,348,750 | |
6.950%, due 6/1/18 | | | 46,000 | | | | 47,877 | |
MDC Holdings, Inc.
5.500%, due 1/15/24 | | | 2,425,000 | | | | 2,564,438 | |
5.625%, due 2/1/20 | | | 1,072,000 | | | | 1,144,360 | |
Toll Brothers Finance Corp.
5.875%, due 2/15/22 | | | 2,475,000 | | | | 2,741,062 | |
TRI Pointe Group, Inc. / TRI Pointe Homes, Inc.
4.375%, due 6/15/19 (c) | | | 4,230,000 | | | | 4,332,366 | |
| | | | | | | | |
| | | | | | | 28,060,476 | |
| | | | | | | | |
Housewares 0.6% | |
Newell Brands, Inc.
3.850%, due 4/1/23 | | | 6,000,000 | | | | 6,299,634 | |
| | | | | | | | |
|
Insurance 4.4% | |
Berkshire Hathaway Finance Corp.
1.450%, due 3/7/18 | | | 3,895,000 | | | | 3,896,531 | |
Chubb Corp.
3.408%, due 3/29/67 (a) | | | 2,495,000 | | | | 2,476,288 | |
Jackson National Life Global Funding
2.200%, due 1/30/20 (b) | | | 2,055,000 | | | | 2,055,594 | |
Liberty Mutual Group, Inc.
4.250%, due 6/15/23 (b) | | | 2,695,000 | | | | 2,867,170 | |
7.800%, due 3/7/87 (b) | | | 102,000 | | | | 127,054 | |
10.750%, due 6/15/88 (a)(b) | | | 987,000 | | | | 1,564,395 | |
Lincoln National Corp.
3.537%, due 5/17/66 (a) | | | 7,583,000 | | | | 7,111,413 | |
Markel Corp.
5.000%, due 4/5/46 | | | 2,600,000 | | | | 2,844,174 | |
MassMutual Global Funding II
2.100%, due 8/2/18 (b) | | | 1,400,000 | | | | 1,406,384 | |
2.500%, due 10/17/22 (b) | | | 3,670,000 | | | | 3,656,905 | |
Oil Insurance, Ltd.
4.278%, due 12/29/49 (a)(b) | | | 1,648,000 | | | | 1,491,440 | |
Pacific Life Insurance Co.
9.250%, due 6/15/39 (b) | | | 986,000 | | | | 1,607,208 | |
Pricoa Global Funding I
2.550%, due 11/24/20 (b) | | | 2,025,000 | | | | 2,039,122 | |
Principal Life Global Funding II
2.375%, due 11/21/21 (b) | | | 5,550,000 | | | | 5,499,650 | |
Protective Life Corp.
8.450%, due 10/15/39 | | | 1,564,000 | | | | 2,319,506 | |
Prudential Financial, Inc.
5.625%, due 6/15/43 (a) | | | 1,245,000 | | | | 1,367,944 | |
Validus Holdings, Ltd.
8.875%, due 1/26/40 | | | 1,050,000 | | | | 1,518,779 | |
| | | | | | | | |
| | | Principal
Amount | | | Value | |
Insurance (continued) | | | | | | | | |
Voya Financial, Inc.
2.900%, due 2/15/18 | | $ | 378,000 | | | $ | 380,557 | |
3.650%, due 6/15/26 | | | 410,000 | | | | 410,779 | |
XLIT, Ltd.
3.616%, due 10/29/49 (a) | | | 1,516,000 | | | | 1,413,670 | |
4.450%, due 3/31/25 | | | 2,665,000 | | | | 2,747,404 | |
| | | | | | | | |
| | | | | | | 48,801,967 | |
| | | | | | | | |
Internet 1.6% | |
Amazon.com, Inc.
1.200%, due 11/29/17 | | | 4,850,000 | | | | 4,848,327 | |
eBay, Inc.
1.350%, due 7/15/17 | | | 3,320,000 | | | | 3,319,621 | |
Match Group, Inc.
6.750%, due 12/15/22 | | | 1,760,000 | | | | 1,830,400 | |
Priceline Group, Inc.
3.600%, due 6/1/26 | | | 3,935,000 | | | | 3,983,263 | |
VeriSign, Inc.
4.625%, due 5/1/23 | | | 3,670,000 | | | | 3,761,750 | |
| | | | | | | | |
| | | | | | | 17,743,361 | |
| | | | | | | | |
Iron & Steel 1.0% | |
AK Steel Corp.
7.625%, due 10/1/21 | | | 2,860,000 | | | | 2,975,315 | |
ArcelorMittal
6.750%, due 2/25/22 | | | 1,575,000 | | | | 1,771,875 | |
7.500%, due 10/15/39 | | | 1,500,000 | | | | 1,681,875 | |
Steel Dynamics, Inc.
5.250%, due 4/15/23 | | | 2,100,000 | | | | 2,181,375 | |
Vale Overseas, Ltd.
6.250%, due 8/10/26 | | | 2,780,000 | | | | 2,998,925 | |
| | | | | | | | |
| | | | | | | 11,609,365 | |
| | | | | | | | |
Leisure Time 0.2% | |
NCL Corp., Ltd.
4.750%, due 12/15/21 (b) | | | 1,000,000 | | | | 1,037,990 | |
Royal Caribbean Cruises, Ltd.
7.250%, due 3/15/18 | | | 600,000 | | | | 620,400 | |
| | | | | | | | |
| | | | | | | 1,658,390 | |
| | | | | | | | |
Lodging 1.1% | |
Boyd Gaming Corp.
6.375%, due 4/1/26 | | | 1,000 | | | | 1,081 | |
Marriott International, Inc.
6.750%, due 5/15/18 | | | 185,000 | | | | 192,798 | |
7.150%, due 12/1/19 | | | 1,334,000 | | | | 1,491,945 | |
MGM Resorts International
6.000%, due 3/15/23 (c) | | | 2,300,000 | | | | 2,535,750 | |
8.625%, due 2/1/19 | | | 475,000 | | | | 522,500 | |
Wyndham Worldwide Corp.
4.150%, due 4/1/24 | | | 3,080,000 | | | | 3,163,582 | |
Wynn Las Vegas LLC / Wynn Las Vegas Capital Corp. | | | | | | | | |
4.250%, due 5/30/23 | | | 1,150,000 | | | | 1,158,625 | |
| | | | | | |
The notes to the financial statements are an integral part of,
and should be read in conjunction with, the financial statements. | | | | | 15 | |
Portfolio of Investments June 30, 2017 (Unaudited) (continued)
| | | | | | | | |
| | | Principal
Amount | | | Value | |
| Corporate Bonds (continued) | |
Lodging (continued) | | | | | | | | |
Wynn Las Vegas LLC / Wynn Las Vegas Capital Corp. (continued) | | | | | | | | |
5.500%, due 3/1/25 | | $ | 2,790,000 | | | $ | 2,934,731 | |
| | | | | | | | |
| | | | | | | 12,001,012 | |
| | | | | | | | |
Machinery—Diversified 0.4% | |
CNH Industrial Capital LLC
4.875%, due 4/1/21 (c) | | | 4,355,000 | | | | 4,627,188 | |
| | | | | | | | |
|
Media 2.5% | |
Altice Luxembourg S.A.
7.750%, due 5/15/22 (b) | | | 4,400,000 | | | | 4,669,500 | |
Charter Communications Operating LLC / Charter Communications Operating Capital
4.464%, due 7/23/22 | | | 2,770,000 | | | | 2,951,341 | |
Clear Channel Worldwide Holdings, Inc.
Series B
6.500%, due 11/15/22 | | | 1,385,000 | | | | 1,423,364 | |
Comcast Corp.
3.400%, due 7/15/46 | | | 2,050,000 | | | | 1,866,732 | |
DISH DBS Corp.
4.250%, due 4/1/18 (c) | | | 2,500,000 | | | | 2,532,050 | |
Sky PLC
3.750%, due 9/16/24 (b) | | | 3,060,000 | | | | 3,143,204 | |
Time Warner Entertainment Co., L.P.
8.375%, due 3/15/23 | | | 740,000 | | | | 931,115 | |
UPCB Finance IV, Ltd.
5.375%, due 1/15/25 (b) | | | 5,335,000 | | | | 5,581,744 | |
Virgin Media Secured Finance PLC
5.500%, due 1/15/25 (b) | | | 2,985,000 | | | | 3,104,400 | |
Walt Disney Co.
0.875%, due 7/12/19 | | | 980,000 | | | | 965,436 | |
| | | | | | | | |
| | | | 27,168,886 | |
| | | | | | | | |
Mining 0.4% | |
Aleris International, Inc.
7.875%, due 11/1/20 | | | 752,000 | | | | 708,760 | |
FMG Resources (August 2006) Pty, Ltd.
9.750%, due 3/1/22 (b) | | | 3,405,000 | | | | 3,877,444 | |
| | | | | | | | |
| | | | 4,586,204 | |
| | | | | | | | |
Miscellaneous—Manufacturing 1.1% | |
Amsted Industries, Inc. (b) | |
5.000%, due 3/15/22 | | | 1,860,000 | | | | 1,920,450 | |
5.375%, due 9/15/24 | | | 2,100,000 | | | | 2,173,500 | |
Bombardier, Inc.
6.000%, due 10/15/22 (b) | | | 945,000 | | | | 945,000 | |
Siemens Financieringsmaatschappij N.V. (b) | |
2.150%, due 5/27/20 | | | 1,480,000 | | | | 1,487,641 | |
2.700%, due 3/16/22 | | | 2,485,000 | | | | 2,517,308 | |
| | | | | | | | |
| | | Principal
Amount | | | Value | |
Miscellaneous—Manufacturing (continued) | |
Textron Financial Corp.
2.917%, due 2/15/67 (a)(b) | | $ | 3,720,000 | | | $ | 3,208,500 | |
| | | | | | | | |
| | | | 12,252,399 | |
| | | | | | | | |
Oil & Gas 1.9% | |
Anadarko Petroleum Corp.
(TBD), due 10/10/36 | | | 6,555,000 | | | | 2,702,528 | |
Chevron Corp.
1.686%, due 2/28/19 | | | 2,330,000 | | | | 2,331,629 | |
CITGO Petroleum Corp.
6.250%, due 8/15/22 (b) | | | 1,750,000 | | | | 1,776,250 | |
Murphy Oil USA, Inc.
6.000%, due 8/15/23 | | | 4,348,000 | | | | 4,587,140 | |
¨Petrobras Global Finance B.V.
7.375%, due 1/17/27 | | | 7,330,000 | | | | 7,755,140 | |
Tesoro Corp.
5.125%, due 12/15/26 (b) | | | 1,600,000 | | | | 1,741,152 | |
| | | | | | | | |
| | | | 20,893,839 | |
| | | | | | | | |
Packaging & Containers 0.9% | |
Ball Corp.
5.000%, due 3/15/22 | | | 4,240,000 | | | | 4,526,200 | |
Crown Americas LLC / Crown Americas Capital Corp. IV
4.500%, due 1/15/23 | | | 1,500,000 | | | | 1,571,250 | |
Sealed Air Corp. (b) | |
4.875%, due 12/1/22 | | | 1,875,000 | | | | 1,996,875 | |
5.500%, due 9/15/25 | | | 1,260,000 | | | | 1,376,550 | |
WestRock MWV LLC
7.375%, due 9/1/19 | | | 900,000 | | | | 995,584 | |
| | | | | | | | |
| | | | 10,466,459 | |
| | | | | | | | |
Pharmaceuticals 1.7% | |
Allergan Funding SCS
3.450%, due 3/15/22 | | | 4,165,000 | | | | 4,293,353 | |
Eli Lilly & Co.
2.350%, due 5/15/22 | | | 1,700,000 | | | | 1,704,624 | |
Johnson & Johnson
2.250%, due 3/3/22 | | | 4,100,000 | | | | 4,121,787 | |
Novartis Capital Corp.
1.800%, due 2/14/20 | | | 2,850,000 | | | | 2,851,998 | |
Pfizer, Inc.
1.200%, due 6/1/18 | | | 5,650,000 | | | | 5,639,435 | |
| | | | | | | | |
| | | | 18,611,197 | |
| | | | | | | | |
Pipelines 1.2% | |
Hiland Partners, L.P. / Hiland Partners Finance Corp.
5.500%, due 5/15/22 (b) | | | 3,430,000 | | | | 3,582,501 | |
MPLX, L.P.
4.125%, due 3/1/27 | | | 1,780,000 | | | | 1,786,061 | |
Spectra Energy Partners, L.P. | |
3.375%, due 10/15/26 | | | 2,100,000 | | | | 2,052,676 | |
4.750%, due 3/15/24 | | | 818,000 | | | | 878,903 | |
| | | | |
| 16 | | MainStay VP Unconstrained Bond Portfolio | | The notes to the financial statements are an integral part of,
and should be read in conjunction with, the financial statements. |
| | | | | | | | |
| | | Principal
Amount | | | Value | |
| Corporate Bonds (continued) | |
Pipelines (continued) | | | | | | | | |
Targa Resources Partners, L.P. / Targa Resources Partners Finance Corp. | | | | | | | | |
4.125%, due 11/15/19 | | $ | 750,000 | | | $ | 758,438 | |
5.250%, due 5/1/23 | | | 950,000 | | | | 973,750 | |
Tesoro Logistics, L.P. / Tesoro Logistics Finance Corp.
5.875%, due 10/1/20 | | | 3,249,000 | | | | 3,318,041 | |
| | | | | | | | |
| | | | 13,350,370 | |
| | | | | | | | |
Private Equity 0.2% | |
Icahn Enterprises, L.P. / Icahn Enterprises Finance Corp.
6.000%, due 8/1/20 | | | 1,945,000 | | | | 2,002,134 | |
| | | | | | | | |
|
Real Estate Investment Trusts 1.5% | |
Crown Castle International Corp.
3.400%, due 2/15/21 | | | 4,290,000 | | | | 4,405,178 | |
Equinix, Inc. | |
5.750%, due 1/1/25 | | | 2,000,000 | | | | 2,152,500 | |
5.875%, due 1/15/26 | | | 2,275,000 | | | | 2,480,455 | |
ESH Hospitality, Inc.
5.250%, due 5/1/25 (b) | | | 5,145,000 | | | | 5,331,506 | |
Host Hotels & Resorts, L.P.
3.750%, due 10/15/23 | | | 329,000 | | | | 335,477 | |
Iron Mountain, Inc. | |
5.750%, due 8/15/24 | | | 1,635,000 | | | | 1,667,700 | |
6.000%, due 10/1/20 (b) | | | 267,000 | | | | 276,345 | |
6.000%, due 8/15/23 | | | 340,000 | | | | 361,250 | |
| | | | | | | | |
| | | | 17,010,411 | |
| | | | | | | | |
Regional (State & Province) 0.7% | |
Japan Finance Organization for Municipalities
Series Reg S
1.375%, due 2/5/18 | | | 7,730,000 | | | | 7,705,457 | |
| | | | | | | | |
|
Retail 2.0% | |
AutoNation, Inc.
6.750%, due 4/15/18 | | | 830,000 | | | | 861,203 | |
AutoZone, Inc.
3.750%, due 6/1/27 | | | 2,735,000 | | | | 2,735,768 | |
Darden Restaurants, Inc.
3.850%, due 5/1/27 | | | 2,025,000 | | | | 2,057,483 | |
Dollar General Corp.
3.250%, due 4/15/23 | | | 4,115,000 | | | | 4,191,309 | |
O’Reilly Automotive, Inc.
3.550%, due 3/15/26 | | | 3,000,000 | | | | 3,020,571 | |
QVC, Inc.
4.850%, due 4/1/24 | | | 2,300,000 | | | | 2,350,439 | |
Starbucks Corp.
2.450%, due 6/15/26 | | | 2,950,000 | | | | 2,845,151 | |
| | | | | | | | |
| | | Principal
Amount | | | Value | |
Retail (continued) | | | | | | | | |
Suburban Propane Partners, L.P. / Suburban Energy Finance Corp. | | | | | | | | |
5.500%, due 6/1/24 (c) | | $ | 4,515,000 | | | $ | 4,492,425 | |
5.750%, due 3/1/25 | | | 105,000 | | | | 103,950 | |
| | | | | | | | |
| | | | 22,658,299 | |
| | | | | | | | |
Semiconductors 1.1% | |
NXP B.V. / NXP Funding LLC (b) | |
4.625%, due 6/15/22 | | | 1,755,000 | | | | 1,886,625 | |
4.625%, due 6/1/23 | | | 1,065,000 | | | | 1,148,869 | |
Qorvo, Inc. | |
6.750%, due 12/1/23 | | | 2,500,000 | | | | 2,743,750 | |
7.000%, due 12/1/25 | | | 1,700,000 | | | | 1,929,500 | |
Sensata Technologies B.V.
5.000%, due 10/1/25 (b) | | | 3,890,000 | | | | 4,068,162 | |
| | | | | | | | |
| | | | 11,776,906 | |
| | | | | | | | |
Software 1.9% | |
First Data Corp.
7.000%, due 12/1/23 (b) | | | 1,714,000 | | | | 1,829,695 | |
¨Microsoft Corp. | |
1.100%, due 8/8/19 | | | 4,635,000 | | | | 4,580,066 | |
1.850%, due 2/6/20 | | | 4,520,000 | | | | 4,531,521 | |
MSCI, Inc.
5.750%, due 8/15/25 (b) | | | 4,005,000 | | | | 4,337,896 | |
Oracle Corp. | |
2.650%, due 7/15/26 | | | 1,920,000 | | | | 1,842,365 | |
4.300%, due 7/8/34 | | | 935,000 | | | | 1,014,485 | |
PTC, Inc.
6.000%, due 5/15/24 | | | 2,569,000 | | | | 2,780,943 | |
| | | | | | | | |
| | | | 20,916,971 | |
| | | | | | | | |
Telecommunications 3.4% | |
AT&T, Inc.
3.200%, due 3/1/22 | | | 4,275,000 | | | | 4,327,155 | |
CommScope Technologies LLC
5.000%, due 3/15/27 (b) | | | 1,600,000 | | | | 1,596,000 | |
CommScope, Inc.
5.000%, due 6/15/21 | | | 1,563,000 | | | | 1,598,168 | |
Crown Castle Towers LLC
6.113%, due 1/15/40 (b) | | | 2,200,000 | | | | 2,365,203 | |
Hughes Satellite Systems Corp. | |
5.250%, due 8/1/26 | | | 540,000 | | | | 564,300 | |
6.500%, due 6/15/19 | | | 900,000 | | | | 972,000 | |
Rogers Communications, Inc.
3.625%, due 12/15/25 | | | 4,995,000 | | | | 5,112,812 | |
Sprint Capital Corp. | |
6.900%, due 5/1/19 | | | 1,978,000 | | | | 2,111,416 | |
8.750%, due 3/15/32 | | | 1,830,000 | | | | 2,305,800 | |
Sprint Spectrum Co. LLC / Sprint Spectrum Co. II LLC / Sprint Spectrum Co. III LLC
3.360%, due 3/20/23 (b) | | | 2,265,000 | | | | 2,284,819 | |
| | | | | | |
The notes to the financial statements are an integral part of,
and should be read in conjunction with, the financial statements. | | | | | 17 | |
Portfolio of Investments June 30, 2017 (Unaudited) (continued)
| | | | | | | | |
| | | Principal
Amount | | | Value | |
| Corporate Bonds (continued) | |
Telecommunications (continued) | | | | | | | | |
T-Mobile USA, Inc. | |
6.000%, due 3/1/23 | | $ | 1,200,000 | | | $ | 1,270,116 | |
6.125%, due 1/15/22 | | | 3,050,000 | | | | 3,205,361 | |
6.500%, due 1/15/26 | | | 1,235,000 | | | | 1,363,131 | |
Telecom Italia Capital S.A.
7.721%, due 6/4/38 | | | 305,000 | | | | 369,050 | |
Telefonica Emisiones SAU | |
4.570%, due 4/27/23 | | | 1,781,000 | | | | 1,938,827 | |
5.462%, due 2/16/21 | | | 279,000 | | | | 306,880 | |
Verizon Communications, Inc. | |
3.000%, due 11/1/21 | | | 2,635,000 | | | | 2,669,895 | |
5.150%, due 9/15/23 | | | 1,722,000 | | | | 1,912,775 | |
ViaSat, Inc.
6.875%, due 6/15/20 | | | 1,255,000 | | | | 1,279,698 | |
| | | | | | | | |
| | | | 37,553,406 | |
| | | | | | | | |
Textiles 0.4% | |
Cintas Corp. No 2
2.900%, due 4/1/22 | | | 3,805,000 | | | | 3,864,476 | |
| | | | | | | | |
|
Trucking & Leasing 0.4% | |
Aviation Capital Group Corp.
2.875%, due 1/20/22 | | | 4,900,000 | | | | 4,882,683 | |
| | | | | | | | |
Total Corporate Bonds
(Cost $824,352,267) | | | | | | | 841,006,196 | |
| | | | | | | | |
|
| Foreign Bonds 0.1% | |
Barclays Bank PLC
Series Reg S
10.000%, due 5/21/21 | | GBP | 401,000 | | | | 669,354 | |
| | | | | | | | |
Total Foreign Bond
(Cost $660,585) | | | | | | | 669,354 | |
| | | | | | | | |
|
| Loan Assignments 17.1% (e) | |
Advertising 1.1% | | | | | | | | |
Allied Universal Holdco LLC
2015 Term Loan
5.050%, due 7/28/22 | | $ | 3,085,938 | | | | 3,089,795 | |
Outfront Media Capital LLC
2017 Term Loan B
3.460%, due 3/18/24 | | | 5,362,500 | | | | 5,379,258 | |
USAGM HoldCo LLC
2015 2nd Lien Term Loan
9.670%, due 7/28/23 | | | 3,125,000 | | | | 3,164,062 | |
| | | | | | | | |
| | | | | | | 11,633,115 | |
| | | | | | | | |
Auto Manufacturers 0.3% | |
Navistar International Corp.
2017 Term Loan B
5.090%, due 8/7/20 | | | 2,955,000 | | | | 2,983,318 | |
| | | | | | | | |
| | | | | | | | |
| | | Principal
Amount | | | Value | |
Auto Parts & Equipment 0.2% | |
TI Group Automotive Systems LLC
2015 USD Term Loan
3.980%, due 6/30/22 | | $ | 2,677,313 | | | $ | 2,675,639 | |
| | | | | | | | |
|
Building Materials 1.0% | |
Builders FirstSource, Inc.
2017 Term Loan B
4.300%, due 2/29/24 | | | 1,989,950 | | | | 1,985,805 | |
Forterra Finance LLC
2017 Term Loan B
4.230%, due 10/25/23 | | | 4,937,688 | | | | 4,651,301 | |
Quikrete Holdings, Inc.
2016 1st Lien Term Loan
3.980%, due 11/15/23 | | | 4,900,375 | | | | 4,888,805 | |
| | | | | | | | |
| | | | | | | 11,525,911 | |
| | | | | | | | |
Chemicals 0.4% | |
Axalta Coating Systems U.S. Holdings, Inc.
USD Term Loan
3.300%, due 6/1/24 | | | 4,476,289 | | | | 4,488,039 | |
| | | | | | | | |
|
Commercial Services 1.6% | |
Electro Rent Corp.
1st Lien Term Loan
6.230%, due 1/19/24 | | | 2,388,000 | | | | 2,403,921 | |
Global Payments, Inc.
2017 1st Lien Term Loan
3.230%, due 4/22/23 | | | 1,875,300 | | | | 1,880,658 | |
KAR Auction Services, Inc.
Term Loan B4
3.560%, due 3/11/21 | | | 1,601,337 | | | | 1,609,343 | |
Neff Rental LLC
2nd Lien Term Loan
7.660%, due 6/9/21 | | | 3,388,246 | | | | 3,385,424 | |
ServiceMaster Co.
2016 Term Loan B
3.730%, due 11/8/23 | | | 4,412,825 | | | | 4,433,049 | |
U.S. Security Associates Holdings, Inc.
2016 Term Loan
6.300%, due 7/14/23 | | | 3,970,000 | | | | 3,984,887 | |
| | | | | | | | |
| | | | | | | 17,697,282 | |
| | | | | | | | |
Computers 0.3% | |
Tempo Acquisition LLC
Term Loan
4.060%, due 5/1/24 | | | 3,170,000 | | | | 3,175,284 | |
| | | | | | | | |
|
Entertainment 0.3% | |
Regal Cinemas Corp.
Reprice Term Loan
3.230%, due 4/1/22 | | | 3,511,200 | | | | 3,516,116 | |
| | | | | | | | |
| | | | |
| 18 | | MainStay VP Unconstrained Bond Portfolio | | The notes to the financial statements are an integral part of,
and should be read in conjunction with, the financial statements. |
| | | | | | | | |
| | | Principal
Amount | | | Value | |
| Loan Assignments (continued) | |
Environmental Controls 0.4% | |
GFL Environmental, Inc.
USD Term Loan B
4.050%, due 9/29/23 | | $ | 3,970,000 | | | $ | 3,974,963 | |
| | | | | | | | |
|
Food 0.3% | |
Post Holdings, Inc.
2017 Series A Incremental Term Loan
3.470%, due 5/24/24 | | | 2,650,000 | | | | 2,652,069 | |
| | | | | | | | |
|
Food—Wholesale 1.2% | |
Nature’s Bounty Co.
2017 USD Term Loan B
4.800%, due 5/5/23 | | | 3,980,000 | | | | 3,981,990 | |
Pinnacle Foods Finance LLC
2017 Term Loan B
3.080%, due 2/2/24 | | | 4,019,800 | | | | 4,030,075 | |
U.S. Foods, Inc.
2016 Term Loan B
3.980%, due 6/27/23 | | | 5,222,250 | | | | 5,240,700 | |
| | | | | | | | |
| | | | | | | 13,252,765 | |
| | | | | | | | |
Gaming 0.1% | |
Mohegan Tribal Gaming Authority
2016 Term Loan B
5.230%, due 10/13/23 | | | 995,000 | | | | 1,002,761 | |
| | | | | | | | |
|
Hand & Machine Tools 0.3% | |
Milacron LLC
Amended Term Loan B
4.230%, due 9/28/23 | | | 3,557,125 | | | | 3,561,571 | |
| | | | | | | | |
|
Health Care—Products 0.4% | |
Ortho-Clinical Diagnostics, Inc.
Term Loan B
5.050%, due 6/30/21 | | | 4,127,350 | | | | 4,103,015 | |
| | | | | | | | |
|
Health Care—Services 2.0% | |
MPH Acquisition Holdings LLC
2016 Term Loan B
4.300%, due 6/7/23 | | | 4,182,421 | | | | 4,177,193 | |
BWAY Holding Co.
2017 Term Loan B
4.330%, due 4/3/24 | | | 3,290,000 | | | | 3,285,298 | |
ExamWorks Group, Inc.
2017 Term Loan
4.480%, due 7/27/23 | | | 4,590,370 | | | | 4,613,322 | |
INC Research LLC
2017 Term Loan B
TBD, due 6/27/24 | | | 5,130,000 | | | | 5,138,552 | |
| | | | | | | | |
| | | Principal
Amount | | | Value | |
inVentiv Health, Inc.
2016 Term Loan B
4.950%, due 11/9/23 | | $ | 4,925,250 | | | $ | 4,937,563 | |
| | | | | | | | |
| | | | | | | 22,151,928 | |
| | | | | | | | |
|
Household Products & Wares 0.6% | |
KIK Custom Products, Inc.
2015 Term Loan B
5.790%, due 8/26/22 | | | 2,439,301 | | | | 2,449,668 | |
Prestige Brands, Inc.
Term Loan B4
3.980%, due 1/26/24 | | | 4,102,142 | | | | 4,116,791 | |
| | | | | | | | |
| | | | | | | 6,566,459 | |
| | | | | | | | |
Internet 0.2% | |
Match Group, Inc.
Term Loan B1
4.370%, due 11/16/22 | | | 1,859,375 | | | | 1,864,023 | |
| | | | | | | | |
|
Iron & Steel 0.4% | |
Signode Industrial Group U.S., Inc.
USD Term Loan B
4.010%, due 5/4/21 | | | 4,231,209 | | | | 4,220,631 | |
| | | | | | | | |
|
Lodging 0.6% | |
Boyd Gaming Corp.
Term Loan B3
3.690%, due 9/15/23 | | | 516,644 | | | | 517,105 | |
Hilton Worldwide Finance LLC
Term Loan B2
3.220%, due 10/25/23 | | | 5,407,176 | | | | 5,421,446 | |
MGM Growth Prop. Operating Partnership, L.P.
2016 Term Loan B
3.480%, due 4/25/23 | | | 987,500 | | | | 988,241 | |
| | | | | | | | |
| | | | | | | 6,926,792 | |
| | | | | | | | |
Machinery—Diversified 0.4% | |
Husky Injection Molding Systems, Ltd.
1st Lien Term Loan
4.480%, due 6/30/21 | | | 4,059,127 | | | | 4,077,393 | |
| | | | | | | | |
|
Media 0.8% | |
Charter Communications Operating LLC
Repriced Term Loan F
3.230%, due 1/3/21 | | | 1,932,103 | | | | 1,936,665 | |
Nielsen Finance LLC
USD Term Loan B4
3.100%, due 10/4/23 | | | 3,000,000 | | | | 3,000,342 | |
Virgin Media Bristol LLC
USD Term Loan I
3.910%, due 1/31/25 | | | 4,100,000 | | | | 4,100,000 | |
| | | | | | | | |
| | | | | | | 9,037,007 | |
| | | | | | | | |
| | | | | | |
The notes to the financial statements are an integral part of,
and should be read in conjunction with, the financial statements. | | | | | 19 | |
Portfolio of Investments June 30, 2017 (Unaudited) (continued)
| | | | | | | | |
| | | Principal
Amount | | | Value | |
| Loan Assignments (continued) | |
Miscellaneous—Manufacturing 0.1% | |
Gates Global LLC
2017 USD Term Loan B
4.550%, due 4/1/24 | | $ | 1,354,165 | | | $ | 1,354,729 | |
| | | | | | | | |
|
Packaging 0.3% | |
Klockner-Pentaplast of America, Inc.
USD 2017 Term Loan B2
TBD, due 6/13/24 | | | 3,150,000 | | | | 3,122,438 | |
| | | | | | | | |
|
Packaging & Containers 0.5% | |
Berry Plastics Group, Inc.
Term Loan K
3.370%, due 2/8/20 | | | 3,770,000 | | | | 3,767,644 | |
Reynolds Group Holdings, Inc.
USD 2017 Term Loan
4.230%, due 2/5/23 | | | 1,910,587 | | | | 1,913,989 | |
| | | | | | | | |
| | | | | | | 5,681,633 | |
| | | | | | | | |
Real Estate 0.4% | |
Realogy Corp.
2017 Term Loan B
3.480%, due 7/20/22 | | | 4,032,101 | | | | 4,051,254 | |
| | | | | | | | |
|
Retail 0.2% | |
Pilot Travel Centers LLC
2017 Term Loan B
3.230%, due 5/25/23 | | | 2,686,500 | | | | 2,699,933 | |
| | | | | | | | |
|
Software 0.2% | |
First Data Corp.
2017 Term Loan
3.720%, due 4/26/24 | | | 2,509,253 | | | | 2,507,685 | |
| | | | | | | | |
|
Support Services 0.7% | |
Advanced Disposal Services, Inc.
Term Loan B3
3.940%, due 11/10/23 | | | 3,913,333 | | | | 3,930,802 | |
Change Healthcare Holdings, Inc.
2017 Term Loan B
3.980%, due 3/1/24 | | | 4,044,862 | | | | 4,044,232 | |
| | | | | | | | |
| | | | | | | 7,975,034 | |
| | | | | | | | |
Tech Hardware & Equipment 0.4% | |
Dell, Inc.
2017 Term Loan B
3.730%, due 9/7/23 | | | 4,488,750 | | | | 4,503,980 | |
| | | | | | | | |
|
Telecommunications 1.2% | |
Level 3 Financing, Inc.
2017 Term Loan B
3.470%, due 2/22/24 | | | 5,875,000 | | | | 5,886,016 | |
| | | | | | | | |
| | | Principal
Amount | | | Value | |
Telecommunications (continued) | |
SBA Senior Finance II LLC
Term Loan B1
3.480%, due 3/24/21 | | $ | 4,310,367 | | | $ | 4,317,910 | |
Sprint Communications, Inc.
1st Lien Term Loan B
3.750%, due 2/2/24 | | | 3,591,000 | | | | 3,589,075 | |
| | | | | | | | |
| | | | | | | 13,793,001 | |
| | | | | | | | |
Transportation 0.2% | |
XPO Logistics, Inc.
2017 Term Loan B
3.410%, due 11/1/21 | | | 2,477,254 | | | | 2,481,589 | |
| | | | | | | | |
Total Loan Assignments
(Cost $188,785,164) | | | | | | | 189,257,357 | |
| | | | | | | | |
|
| Mortgage-Backed Securities 0.0%‡ | |
Commercial Mortgage Loans
(Collateralized Mortgage Obligations) 0.0%‡ | |
Banc of America Commercial Mortgage Trust
Series 2005-J, Class 1A1
3.287%, due 11/25/35 (f) | | | 27,002 | | | | 24,408 | |
Wells Fargo Mortgage Backed Securities Trust
Series 2006-AR10, Class 5A2
3.324%, due 7/25/36 (f) | | | 23,082 | | | | 23,103 | |
| | | | | | | | |
| | | | | | | 47,511 | |
| | | | | | | | |
Total Mortgage-Backed Securities
(Cost $42,243) | | | | | | | 47,511 | |
| | | | | | | | |
|
| U.S. Government & Federal Agencies 0.2% | |
United States Treasury Bonds
3.000%, due 2/15/47 | | | 2,695,000 | | | | 2,780,060 | |
| | | | | | | | |
Total U.S. Government & Federal Agencies
(Cost $2,831,146) | | | | | | | 2,780,060 | |
| | | | | | | | |
| | |
| | | | | | | | |
| | |
| | | Shares | | | | |
| Convertible Preferred Stocks 0.1% | |
Banks 0.1% | | | | | | | | |
Bank of America Corp.
Series L
7.250% | | | 400 | | | | 504,796 | |
Wells Fargo & Co.
Series L
7.500% | | | 400 | | | | 524,444 | |
| | | | | | | | |
| | | | | | | 1,029,240 | |
| | | | | | | | |
Total Convertible Preferred Stocks
(Cost $828,353) | | | | | | | 1,029,240 | |
| | | | | | | | |
| | | | |
| 20 | | MainStay VP Unconstrained Bond Portfolio | | The notes to the financial statements are an integral part of,
and should be read in conjunction with, the financial statements. |
| | | | | | | | |
| | | Principal
Amount | | | Value | |
| Short-Term Investment 6.7% | |
Repurchase Agreement 6.7% | | | | | | | | |
Fixed Income Clearing Corp.
0.12%, dated 6/30/17
due 7/3/17
Proceeds at Maturity $74,781,767 (Collateralized by a United States Treasury Note with a rate of 1.125% and a maturity date of 9/30/21, with a Principal Amount of $78,095,000 and a Market Value of $76,281,946) | | $ | 74,781,019 | | | $ | 74,781,019 | |
| | | | | | | | |
Total Short-Term Investment
(Cost $74,781,019) | | | | | | | 74,781,019 | |
| | | | | | | | |
Total Investments, Before Investments Sold Short
(Cost $1,095,059,151) (g) | | | 100.3 | % | | | 1,113,105,335 | |
| | | | | | | | |
|
| Investments Sold Short (0.6%) | |
Long-Term Bonds Sold Short (0.6%) | | | | | |
Oil & Gas (0.6%) | |
Noble Energy, Inc.
4.150%, due 12/15/21 | | | (1,000,000 | ) | | | (1,053,685 | ) |
3.900%, due 11/15/24 | | | (5,655,000 | ) | | | (5,810,874 | ) |
| | | | | | | | |
Total Investments Sold Short
(Cost $5,976,651) | | | | | | | (6,864,559 | ) |
| | | | | | | | |
Total Investments, Net of Investments Sold Short
(Cost $1,089,082,499) (g) | | | 99.7 | | | | 1,106,240,776 | |
Other Assets, Less Liabilities | | | 0.3 | | | | 2,843,152 | |
Net Assets | | | 100.0 | % | | $ | 1,109,083,928 | |
| ‡ | Less than one-tenth of a percent. |
| (a) | Floating rate—Rate shown was the rate in effect as of June 30, 2017. |
| (b) | May be sold to institutional investors only under Rule 144A or securities offered pursuant to Section 4(a)(2) of the Securities Act of 1933, as amended. |
| (c) | Security, or a portion thereof, was maintained in a segregated account at the Fund’s custodian as collateral for swap contracts. (See Note 2(K)) |
| (d) | Step coupon—Rate shown was the rate in effect as of June 30, 2017. |
| (e) | Floating Rate Loan—generally pays interest at rates which are periodically re-determined at a margin above the London InterBank Offered Rate or other short-term rates. The rate shown was the weighted average interest rate of all contracts within the floating rate loan facility as of June 30, 2017. |
| (f) | Collateral strip rate—A bond whose interest was based on the weighted net interest rate of the collateral. The coupon rate adjusts periodically based on a predetermined schedule. Rate shown was the rate in effect as of June 30, 2017. |
| (g) | As of June 30, 2017, cost was $1,095,355,823 for federal income tax purposes and net unrealized appreciation was as follows: |
| | | | |
Gross unrealized appreciation | | $ | 22,454,132 | |
Gross unrealized depreciation | | | (4,704,620 | ) |
| | | | |
Net unrealized appreciation | | $ | 17,749,512 | |
| | | | |
As of June 30, 2017, the Portfolio held the following foreign currency forward contracts:
| | | | | | | | | | | | | | | | | | | | | | | | | | |
Foreign Currency Buy Contracts | | Expiration
Date | | | Counterparty | | Contract
Amount
Purchased | | | Contract
Amount
Sold | | | Unrealized
Appreciation
(Depreciation) | |
Pound Sterling vs. U.S. Dollar | | | 8/1/17 | | | JPMorgan Chase Bank N.A. | | | GBP | | | | 67,000 | | | $ | 85,820 | | | | | | | $ | 1,519 | |
| | | | | | | |
| | | | | | | | | | | | | | | | | | | | | | | | | | |
Foreign Currency Sales Contracts | | | | | | | Contract
Amount
Sold | | | Contract
Amount
Purchased | | | | |
Euro vs. U.S. Dollar | | | 8/1/17 | | | JPMorgan Chase Bank N.A. | | | EUR | | | | 1,033,000 | | | $ | 1,110,031 | | | | | | | $ | (71,442 | ) |
Pound Sterling vs. U.S. Dollar | | | 8/1/17 | | | JPMorgan Chase Bank N.A. | | | GBP | | | | 589,000 | | | | 754,597 | | | | | | | | (13,202 | ) |
Net unrealized appreciation (depreciation) on foreign currency forward contracts | | | | | | | | | | | | | | | $ | (83,125 | ) |
| | | | | | |
The notes to the financial statements are an integral part of,
and should be read in conjunction with, the financial statements. | | | | | 21 | |
Portfolio of Investments June 30, 2017 (Unaudited) (continued)
As of June 30, 2017, the Portfolio held the following futures contracts1:
| | | | | | | | | | | | | | | | |
Type | | Number of
Contracts
Long (Short) | | | Expiration
Date | | | Notional
Amount | | | Unrealized
Appreciation
(Depreciation)2 | |
2-Year United States Treasury Note | | | (2,729 | ) | | | September 2017 | | | $ | (589,762,487 | ) | | $ | 752,112 | |
| 5-Year United States Treasury Note | | | 363 | | | | September 2017 | | | | 42,774,445 | | | | (99,255 | ) |
| 10-Year United States Treasury Note | | | (294 | ) | | | September 2017 | | | | (36,906,188 | ) | | | 91,211 | |
| Euro Bund | | | (151 | ) | | | September 2017 | | | | (27,916,845 | ) | | | 405,052 | |
| United States Treasury Long Bond | | | (246 | ) | | | September 2017 | | | | (37,807,125 | ) | | | (261,944 | ) |
| | | | | | | | | | | | | | | | |
| | | | | | | | | | $ | (649,618,200 | ) | | $ | 887,176 | |
| | | | | | | | | | | | | | | | |
| 1. | As of June 30, 2017, cash in the amount of $2,660,915 was on deposit with a broker for futures transactions. |
| 2. | Represents the difference between the value of the contracts at the time they were opened and the value as of June 30, 2017. |
As of June 30, 2017, the Portfolio held the following centrally cleared interest rate swap agreements1:
| | | | | | | | | | | | | | | | | | | | | | | | | | | | |
Notional
Amount | | | Currency | | | Expiration
Date | | | Payments
made by Portfolio | | Payments
Received by Portfolio | | Upfront
Premiums
Received/
(Paid) | | | Value | | | Unrealized
Appreciation/
(Depreciation) | |
| | | $ | 50,000,000 | | | | USD | | | | 10/8/2017 | | | Fixed 0.73% | | 3-Month USD-LIBOR | | $ | — | | | $ | 80,920 | | | $ | 80,920 | |
| | | $ | 50,000,000 | | | | USD | | | | 10/16/2017 | | | Fixed 0.70% | | 3-Month USD-LIBOR | | | — | | | | 89,788 | | | | 89,788 | |
| | | $ | 80,000,000 | | | | USD | | | | 2/16/2018 | | | Fixed 0.67% | | 3-Month USD-LIBOR | | | (3,162 | ) | | | 347,217 | | | | 344,055 | |
| | | $ | 385,000,000 | | | | USD | | | | 3/30/2018 | | | Fixed 0.96% | | 3-Month USD-LIBOR | | | (11,568 | ) | | | 1,249,856 | | | | 1,238,288 | |
| | | $ | 550,000,000 | | | | USD | | | | 4/8/2018 | | | Fixed 0.85% | | 3-Month USD-LIBOR | | | (13,447 | ) | | | 2,342,989 | | | | 2,329,542 | |
| | | $ | 115,000,000 | | | | USD | | | | 7/22/2018 | | | Fixed 0.94% | | 3-Month USD-LIBOR | | | (4,388 | ) | | | 621,015 | | | | 616,627 | |
| | | | | | | | | | | | | | | | | | | $ | (32,565 | ) | | $ | 4,731,785 | | | $ | 4,699,220 | |
The following abbreviations are used in the preceding pages:
EUR—Euro
GBP—British Pound Sterling
| 1. | As of June 30, 2017, cash in the amount of $1,083,596 was on deposit with a broker for centrally cleared swap agreements. |
| | | | |
| 22 | | MainStay VP Unconstrained Bond Portfolio | | The notes to the financial statements are an integral part of,
and should be read in conjunction with, the financial statements. |
The following is a summary of the fair valuations according to the inputs used as of June 30, 2017, for valuing the Portfolio’s assets and liabilities.
Asset Valuation Inputs
| | | | | | | | | | | | | | | | |
Description | | Quoted
Prices in
Active
Markets for
Identical
Assets (Level 1) | | | Significant
Other
Observable
Inputs (Level 2) | | | Significant
Unobservable
Inputs (Level 3) | | | Total | |
| Investments in Securities (a) | | | | | | | | | | | | | | | | |
| Long-Term Bonds | | | | | | | | | | | | | | | | |
Asset-Backed Securities | | $ | — | | | $ | 750,956 | | | $ | — | | | $ | 750,956 | |
Convertible Bonds | | | — | | | | 2,783,642 | | | | — | | | | 2,783,642 | |
Corporate Bonds | | | — | | | | 841,006,196 | | | | — | | | | 841,006,196 | |
Foreign Bonds | | | — | | | | 669,354 | | | | — | | | | 669,354 | |
Loan Assignments (b) | | | — | | | | 176,488,694 | | | | 12,768,663 | | | | 189,257,357 | |
Mortgage-Backed Securities | | | — | | | | 47,511 | | | | — | | | | 47,511 | |
U.S. Government & Federal Agencies | | | — | | | | 2,780,060 | | | | — | | | | 2,780,060 | |
| | | | | | | | | | | | | | | | |
| Total Long-Term Bonds | | | — | | | | 1,024,526,413 | | | | 12,768,663 | | | | 1,037,295,076 | |
| | | | | | | | | | | | | | | | |
| Convertible Preferred Stocks | | | 1,029,240 | | | | — | | | | — | | | | 1,029,240 | |
| Short-Term Investment | | | | | | | | | | | | | | | | |
Repurchase Agreement | | | — | | | | 74,781,019 | | | | — | | | | 74,781,019 | |
| | | | | | | | | | | | | | | | |
| Total Investments in Securities | | | 1,029,240 | | | | 1,099,307,432 | | | | 12,768,663 | | | | 1,113,105,335 | |
| | | | | | | | | | | | | | | | |
| Other Financial Instruments | | | | | | | | | | | | | | | | |
Foreign Currency Forward Contract (c) | | | — | | | | 1,519 | | | | — | | | | 1,519 | |
Futures Contracts (c) | | | 1,248,375 | | | | — | | | | — | | | | 1,248,375 | |
Interest Rate Swap Contracts (c) | | | — | | | | 4,699,220 | | | | — | | | | 4,699,220 | |
| | | | | | | | | | | | | | | | |
| Total Other Financial Instruments | | | 1,248,375 | | | | 4,700,739 | | | | — | | | | 5,949,114 | |
| | | | | | | | | | | | | | | | |
| Total Investments in Securities and Other Financial Instruments | | $ | 2,277,615 | | | $ | 1,104,008,171 | | | $ | 12,768,663 | | | $ | 1,119,054,449 | |
| | | | | | | | | | | | | | | | |
Liability Valuation Inputs
| | | | | | | | | | | | | | | | |
Description | | Quoted
Prices in
Active
Markets for
Identical
Assets (Level 1) | | | Significant
Other
Observable
Inputs (Level 2) | | | Significant
Unobservable
Inputs (Level 3) | | | Total | |
| Long-Term Bonds Sold Short | | | | | | | | | | | | | | | | |
Corporate Bonds Sold Short | | $ | — | | | $ | (6,864,559 | ) | | $ | — | | | $ | (6,864,559 | ) |
| | | | | | | | | | | | | | | | |
| Total Long-Term Bonds Sold Short | | | — | | | | (6,864,559 | ) | | | — | | | | (6,864,559 | ) |
| | | | | | | | | | | | | | | | |
| Other Financial Instruments | | | | | | | | | | | | | | | | |
Foreign Currency Forward Contracts (c) | | | — | | | | (84,644 | ) | | | — | | | | (84,644 | ) |
Futures Contracts (c) | | | (361,199 | ) | | | — | | | | — | | | | (361,199 | ) |
| | | | | | | | | | | | | | | | |
| Total Other Financial Instruments | | | (361,199 | ) | | | (84,644 | ) | | | — | | | | (445,843 | ) |
| | | | | | | | | | | | | | | | |
| Total Investments in Securities Sold Short and Other Financial Instruments | | $ | (361,199 | ) | | $ | (6,949,203 | ) | | $ | — | | | $ | (7,310,402 | ) |
| | | | | | | | | | | | | | | | |
| (a) | For a complete listing of investments and their industries, see the Portfolio of Investments. |
| (b) | The Level 3 securities valued at $3,561,571, $1,864,023, $4,220,631 and $3,122,438 are held in Hand & Machine Tools, Internet, Iron & Steel and Packaging, respectively, within the Loan Assignments section of the Portfolio of Investments. |
| (c) | The value listed for these securities reflects unrealized appreciation (depreciation) as shown on the Portfolio of Investments. |
| | | | | | |
The notes to the financial statements are an integral part of,
and should be read in conjunction with, the financial statements. | | | | | 23 | |
Portfolio of Investments June 30, 2017 (Unaudited) (continued)
The Portfolio recognizes transfers between the levels as of the beginning of the period.
As of June 30, 2017, securities with a market value of $6,359,499 transferred from Level 2 to Level 3. The transfer occurred as a result of utilizing
significant unobservable inputs. As of December 31, 2016, the fair value obtained for these securities, as determined based on information provided by an independent pricing source, utilized significant observable inputs. (See Note 2)
As of June 30, 2017, securities with a market value of $9,005,668 transferred from Level 3 to Level 2. The transfer occurred as a result of utilizing
significant observable inputs. As of December 31, 2016, the fair value obtained for these securities, as determined based on information provided by an independent pricing source, utilized significant unobservable inputs. (See Note 2)
The following is a reconciliation of investments in which significant unobservable inputs (Level 3) were used in determining value:
| | | | | | | | | | | | | | | | | | | | | | | | | | | | | | | | | | | | | | | | |
Investments in Securities | | Balance as of
December 31,
2016 | | | Accrued
Discounts
(Premiums) | | | Realized
Gain
(Loss) | | | Change in
Unrealized
Appreciation
(Depreciation) | | | Purchases | | | Sales | | | Transfers
into
Level 3 | | | Transfers
out of
Level 3 | | | Balance
as of
June 30,
2017 | | | Change in
Unrealized
Appreciation
(Depreciation)
from
Investments
Still Held at
June 30,
2017 (a) | |
| Long-Term Bonds | | | | | | | | | | | | | | | | | | | | | | | | | | | | | | | | | | | | | | | | |
Loan Assignments | | | | | | | | | | | | | | | | | | | | | | | | | | | | | | | | | | | | | | | | |
Advertising | | $ | 6,281,094 | | | $ | — | | | $ | — | | | $ | — | | | $ | — | | | $ | — | | | $ | — | | | $ | (6,281,094 | ) | | $ | — | | | $ | — | |
Auto Parts & Equipment | | | 2,724,574 | | | | — | | | | — | | | | — | | | | — | | | | — | | | | — | | | | (2,724,574 | ) | | | (0 | ) | | | — | |
Commercial Services | | | — | | | | — | | | | — | | | | — | | | | — | | | | — | | | | — | | | | — | | | | — | | | | — | |
Containers, Packaging & Glass | | | — | | | | — | | | | — | | | | 3,938 | | | | 3,118,500 | | | | — | | | | — | | | | — | | | | 3,122,438 | | | | 3,938 | |
Hand & Machine Tools | | | 2,000,630 | | | | 637 | | | | 65 | | | | (2,658 | ) | | | 3,561,594 | | | | (1,998,697 | ) | | | — | | | | — | | | | 3,561,571 | | | | (2,658 | ) |
Internet | | | — | | | | 1,983 | | | | — | | | | (7,793 | ) | | | — | | | | — | | | | 1,869,834 | | | | — | | | | 1,864,023 | | | | (7,793 | ) |
Iron & Steel | | | — | | | | 877 | | | | 589 | | | | (26,030 | ) | | | | | | | (244,470 | ) | | | 4,489,665 | | | | — | | | | 4,220,631 | | | | (26,030 | ) |
Real Estate | | | 4,118,214 | | | | (88 | ) | | | (15,959 | ) | | | (57,782 | ) | | | — | | | | (4,044,386 | ) | | | — | | | | — | | | | 0 | | | | (57,782 | ) |
| | | | | | | | | | | | | | | | | | | | | | | | | | | | | | | | | | | | | | | | |
| Total | | $ | 15,124,512 | | | $ | 3,409 | | | $ | (15,305 | ) | | $ | (90,325 | ) | | $ | 6,680,094 | | | $ | (6,287,552 | ) | | $ | 6,359,499 | | | $ | (9,005,668 | ) | | $ | 12,768,663 | | | $ | (90,325 | ) |
| | | | | | | | | | | | | | | | | | | | | | | | | | | | | | | | | | | | | | | | |
| (a) | Included in “Net change in unrealized appreciation (depreciation) on investments” in the Statement of Operations. |
| | | | |
| 24 | | MainStay VP Unconstrained Bond Portfolio | | The notes to the financial statements are an integral part of,
and should be read in conjunction with, the financial statements. |
Statement of Assets and Liabilities as of June 30, 2017 (Unaudited)
| | | | |
| Assets | |
Investment in securities, at value (identified cost $1,095,059,151) | | $ | 1,113,105,335 | |
Cash collateral on deposit at broker | | | 3,744,511 | |
Cash denominated in foreign currencies (identified cost $15,783) | | | 16,804 | |
Receivables: | | | | |
Dividends and interest | | | 8,933,003 | |
Investment securities sold | | | 1,278,464 | |
Fund shares sold | | | 1,066,903 | |
Variation margin on futures contracts | | | 923,992 | |
Variation margin on centrally cleared swap contracts | | | 59,150 | |
Other assets | | | 5,776 | |
Unrealized appreciation on foreign currency forward contracts | | | 1,519 | |
| | | | |
Total assets | | | 1,129,135,457 | |
| | | | |
| |
| Liabilities | | | | |
Investments sold short (proceeds $5,976,651) | | | 6,864,559 | |
Due to custodian | | | 288 | |
Payables: | | | | |
Investment securities purchased | | | 11,822,362 | |
Manager (See Note 3) | | | 514,258 | |
Fund shares redeemed | | | 337,858 | |
NYLIFE Distributors (See Note 3) | | | 200,160 | |
Shareholder communication | | | 83,762 | |
Broker fees and charges on short sales | | | 41,091 | |
Interest on investments sold short | | | 30,025 | |
Professional fees | | | 29,063 | |
Custodian | | | 26,884 | |
Trustees | | | 1,765 | |
Accrued expenses | | | 14,810 | |
Unrealized depreciation on foreign currency forward contracts | | | 84,644 | |
| | | | |
Total liabilities | | | 20,051,529 | |
| | | | |
Net assets | | $ | 1,109,083,928 | |
| | | | |
| |
| Composition of Net Assets | | | | |
Shares of beneficial interest outstanding (par value of $.001 per share) unlimited number of shares authorized | | $ | 110,909 | |
Additional paid-in capital | | | 1,124,411,882 | |
| | | | |
| | | 1,124,522,791 | |
Undistributed net investment income | | | 2,646,787 | |
Accumulated net realized gain (loss) on investments, investments sold short, futures transactions, swap transactions and foreign currency transactions | | | (40,756,798 | ) |
Net unrealized appreciation (depreciation) on investments, swap contracts and futures contracts | | | 23,632,580 | |
Net unrealized appreciation (depreciation) on investments sold short | | | (887,908 | ) |
Net unrealized appreciation (depreciation) on translation of other assets and liabilities in foreign currencies and foreign currency forward contracts | | | (73,524 | ) |
| | | | |
Net assets | | $ | 1,109,083,928 | |
| | | | |
| | | | |
Initial Class | | | | |
Net assets applicable to outstanding shares | | $ | 127,312,649 | |
| | | | |
Shares of beneficial interest outstanding | | | 12,698,549 | |
| | | | |
Net asset value per share outstanding | | $ | 10.03 | |
| | | | |
Service Class | | | | |
Net assets applicable to outstanding shares | | $ | 981,771,279 | |
| | | | |
Shares of beneficial interest outstanding | | | 98,210,910 | |
| | | | |
Net asset value per share outstanding | | $ | 10.00 | |
| | | | |
| | | | | | |
The notes to the financial statements are an integral part of,
and should be read in conjunction with, the financial statements. | | | | | 25 | |
Statement of Operations for the six months ended June 30, 2017 (Unaudited)
| | | | |
| Investment Income (Loss) | |
Income | | | | |
Interest | | $ | 19,135,677 | |
Dividends | | | 29,500 | |
| | | | |
Total income | | | 19,165,177 | |
| | | | |
Expenses | | | | |
Manager (See Note 3) | | | 2,992,970 | |
Distribution/Service—Service Class (See Note 3) | | | 1,155,921 | |
Interest on investments sold short | | | 178,378 | |
Broker fees and charges on short sales | | | 116,825 | |
Shareholder communication | | | 81,268 | |
Professional fees | | | 51,221 | |
Interest expense | | | 22,307 | |
Trustees | | | 12,748 | |
Custodian | | | 11,015 | |
Miscellaneous | | | 20,064 | |
| | | | |
Total expenses | | | 4,642,717 | |
| | | | |
Net investment income (loss) | | | 14,522,460 | |
| | | | |
|
| Realized and Unrealized Gain (Loss) on Investments, Futures Contracts, Swap Contracts and Foreign Currency Transactions | |
Net realized gain (loss) on: | | | | |
Investment transactions | | | 2,599,430 | |
Futures transactions | | | (2,252,582 | ) |
Swap transactions | | | 1,216,807 | |
Foreign currency transactions | | | 63,134 | |
| | | | |
Net realized gain (loss) on investments, futures transactions, swap transactions and foreign currency transactions | | | 1,626,789 | |
| | | | |
Net change in unrealized appreciation (depreciation) on: | | | | |
Investments | | | 13,862,027 | |
Investments sold short | | | (78,421 | ) |
Futures contracts | | | 231,045 | |
Swap contracts | | | (994,921 | ) |
Translation of other assets and liabilities in foreign currencies and foreign currency forward contracts | | | (207,246 | ) |
| | | | |
Net change in unrealized appreciation (depreciation) on investments, investments sold short, futures contracts, swap contracts and foreign currency transactions | | | 12,812,484 | |
| | | | |
Net realized and unrealized gain (loss) on investments, investments sold short, futures transactions, swap transactions and foreign currency transactions | | | 14,439,273 | |
| | | | |
Net increase (decrease) in net assets resulting from operations | | $ | 28,961,733 | |
| | | | |
| | | | |
| 26 | | MainStay VP Unconstrained Bond Portfolio | | The notes to the financial statements are an integral part of,
and should be read in conjunction with, the financial statements. |
Statement of Changes in Net Assets
for the six months ended June 30, 2017 (Unaudited) and the year ended December 31, 2016
| | | | | | | | |
| | | 2017 | | | 2016 | |
| Increase (Decrease) in Net Assets | |
Operations: | | | | | | | | |
Net investment income (loss) | | $ | 14,522,460 | | | $ | 33,147,353 | |
Net realized gain (loss) on investments, investments sold short, futures transactions, swap transactions and foreign currency transactions | | | 1,626,789 | | | | (25,243,047 | ) |
Net change in unrealized appreciation (depreciation) on investments, investments sold short, futures contracts, swap contracts and foreign currency transactions | | | 12,812,484 | | | | 56,197,287 | |
| | | | |
Net increase (decrease) in net assets resulting from operations | | | 28,961,733 | | | | 64,101,593 | |
| | | | |
Dividends to shareholders: | | | | | | | | |
From net investment income: | | | | | | | | |
Initial Class | | | (1,954,605 | ) | | | (4,264,730 | ) |
Service Class | | | (13,774,266 | ) | | | (27,133,079 | ) |
| | | | |
Total dividends to shareholders | | | (15,728,871 | ) | | | (31,397,809 | ) |
| | | | |
Capital share transactions: | | | | | | | | |
Net proceeds from sale of shares | | | 116,629,815 | | | | 204,058,463 | |
Net asset value of shares issued to shareholders in reinvestment of dividends | | | 15,728,871 | | | | 31,397,809 | |
Cost of shares redeemed | | | (42,020,926 | ) | | | (140,275,677 | ) |
| | | | |
Increase (decrease) in net assets derived from capital share transactions | | | 90,337,760 | | | | 95,180,595 | |
| | | | |
Net increase (decrease) in net assets | | | 103,570,622 | | | | 127,884,379 | |
| | |
| Net Assets | | | | | | | | |
Beginning of period | | | 1,005,513,306 | | | | 877,628,927 | |
| | | | |
End of period | | $ | 1,109,083,928 | | | $ | 1,005,513,306 | |
| | | | |
Undistributed net investment income at end of period | | $ | 2,646,787 | | | $ | 3,853,198 | |
| | | | |
| | | | | | |
The notes to the financial statements are an integral part of,
and should be read in conjunction with, the financial statements. | | | | | 27 | |
Financial Highlights selected per share data and ratios
| | | | | | | | | | | | | | | | | | | | | | | | | | | | |
| | | Six months
ended
June 30, | | | | | | Year ended December 31, | |
| Initial Class | | 2017* | | | | | | 2016 | | | 2015 | | | 2014 | | | 2013 | | | 2012 | |
Net asset value at beginning of period | | $ | 9.90 | | | | | | | $ | 9.54 | | | $ | 10.12 | | | $ | 10.32 | | | $ | 10.32 | | | $ | 9.60 | |
| | | | | | | | | | | | | | | | | | | | | | | | | | | | |
Net investment income (loss) (a) | | | 0.15 | | | | | | | | 0.37 | | | | 0.40 | | | | 0.45 | | | | 0.49 | | | | 0.54 | |
Net realized and unrealized gain (loss) on investments | | | 0.14 | | | | | | | | 0.33 | | | | (0.66 | ) | | | (0.28 | ) | | | (0.04 | ) | | | 0.81 | |
Net realized and unrealized gain (loss) on foreign currency transactions | | | (0.00 | )‡ | | | | | | | 0.01 | | | | 0.02 | | | | 0.03 | | | | (0.02 | ) | | | (0.01 | ) |
| | | | | | | | | | | | | | | | | | | | | | | | | | | | |
Total from investment operations | | | 0.29 | | | | | | | | 0.71 | | | | (0.24 | ) | | | 0.20 | | | | 0.43 | | | | 1.34 | |
| | | | | | | | | | | | | | | | | | | | | | | | | | | | |
| Less dividends and distributions: | | | | | | | | | | | | | | | | | | | | | | | | | | | | |
From net investment income | | | (0.16 | ) | | | | | | | (0.35 | ) | | | (0.34 | ) | | | (0.40 | ) | | | (0.43 | ) | | | (0.53 | ) |
From net realized gain on investments | | | — | | | | | | | | — | | | | — | | | | — | | | | (0.00 | )‡ | | | (0.09 | ) |
| | | | | | | | | | | | | | | | | | | | | | | | | | | | |
Total dividends and distributions | | | (0.16 | ) | | | | | | | (0.35 | ) | | | (0.34 | ) | | | (0.40 | ) | | | (0.43 | ) | | | (0.62 | ) |
| | | | | | | | | | | | | | | | | | | | | | | | | | | | |
Net asset value at end of period | | $ | 10.03 | | | | | | | $ | 9.90 | | | $ | 9.54 | | | $ | 10.12 | | | $ | 10.32 | | | $ | 10.32 | |
| | | | | | | | | | | | | | | | | | | | | | | | | | | | |
Total investment return (b) | | | 2.90 | % | | | | | | | 7.50 | % | | | (2.42 | %) | | | 1.92 | % | | | 4.17 | % | | | 13.88 | % |
| Ratios (to average net assets)/Supplemental Data: | | | | | | | | | | | | | | | | | | | | | | | | | | | | |
Net investment income (loss) | | | 2.99 | %†† | | | | | | | 3.80 | % | | | 4.01 | % | | | 4.31 | % | | | 4.69 | % | | | 5.30 | % |
Net expenses (excluding short sales expenses | | | 0.61 | %†† | | | | | | | 0.62 | % | | | 0.62 | % | | | 0.64 | % | | | 0.65 | % | | | 0.65 | % |
Expenses (including short sales expenses) | | | 0.67 | %†† | | | | | | | 0.72 | % | | | 0.65 | % | | | 0.64 | % | | | 0.65 | % | | | 0.65 | % |
Short sale expenses | | | 0.06 | %†† | | | | | | | 0.10 | % | | | 0.03 | % | | | — | | | | — | | | | 0.00 | %(c) |
Portfolio turnover rate | | | 20 | % | | | | | | | 34 | % | | | 26 | % | | | 18 | % | | | 23 | % | | | 39 | % |
Net assets at end of period (in 000’s) | | $ | 127,313 | | | | | | | $ | 122,586 | | | $ | 129,311 | | | $ | 166,855 | | | $ | 105,972 | | | $ | 133,840 | |
| ‡ | Less than one cent per share. |
| (a) | Per share data based on average shares outstanding during the period. |
| (b) | Total return does not reflect any deduction of sales charges, mortality and expense charges, contract charges or administrative charges. For periods of less than one year, total return is not annualized. |
| (c) | Less than one-hundredth of a percent. |
| | | | | | | | | | | | | | | | | | | | | | | | | | | | |
| | | Six months
ended
June 30, | | | | | | Year ended December 31, | |
| Service Class | | 2017* | | | | | | 2016 | | | 2015 | | | 2014 | | | 2013 | | | 2012 | |
Net asset value at beginning of period | | $ | 9.87 | | | | | | | $ | 9.51 | | | $ | 10.09 | | | $ | 10.29 | | | $ | 10.30 | | | $ | 9.60 | |
| | | | | | | | | | | | | | | | | | | | | | | | | | | | |
Net investment income (loss) (a) | | | 0.14 | | | | | | | | 0.34 | | | | 0.38 | | | | 0.42 | | | | 0.47 | | | | 0.52 | |
Net realized and unrealized gain (loss) on investments | | | 0.13 | | | | | | | | 0.33 | | | | (0.66 | ) | | | (0.28 | ) | | | (0.04 | ) | | | 0.79 | |
Net realized and unrealized gain (loss) on foreign currency transactions | | | (0.00 | )‡ | | | | | | | 0.01 | | | | 0.02 | | | | 0.03 | | | | (0.03 | ) | | | (0.01 | ) |
| | | | | | | | | | | | | | | | | | | | | | | | | | | | |
Total from investment operations | | | 0.27 | | | | | | | | 0.68 | | | | (0.26 | ) | | | 0.17 | | | | 0.40 | | | | 1.30 | |
| | | | | | | | | | | | | | | | | | | | | | | | | | | | |
| Less dividends and distributions: | | | | | | | | | | | | | | | | | | | | | | | | | | | | |
From net investment income | | | (0.14 | ) | | | | | | | (0.32 | ) | | | (0.32 | ) | | | (0.37 | ) | | | (0.41 | ) | | | (0.51 | ) |
From net realized gain on investments | | | — | | | | | | | | — | | | | — | | | | — | | | | (0.00 | )‡ | | | (0.09 | ) |
| | | | | | | | | | | | | | | | | | | | | | | | | | | | |
Total dividends and distributions | | | (0.14 | ) | | | | | | | (0.32 | ) | | | (0.32 | ) | | | (0.37 | ) | | | (0.41 | ) | | | (0.60 | ) |
| | | | | | | | | | | | | | | | | | | | | | | | | | | | |
Net asset value at end of period | | $ | 10.00 | | | | | | | $ | 9.87 | | | $ | 9.51 | | | $ | 10.09 | | | $ | 10.29 | | | $ | 10.30 | |
| | | | | | | | | | | | | | | | | | | | | | | | | | | | |
Total investment return (b) | | | 2.77 | % | | | | | | | 7.23 | % | | | (2.66 | %) | | | 1.67 | % | | | 3.91 | % | | | 13.58 | % |
| Ratios (to average net assets)/Supplemental Data: | | | | | | | | | | | | | | | | | | | | | | | | | | | | |
Net investment income (loss) | | | 2.74 | %†† | | | | | | | 3.54 | % | | | 3.77 | % | | | 4.06 | % | | | 4.47 | % | | | 5.03 | % |
Net expenses (excluding short sales expenses) | | | 0.86 | %†† | | | | | | | 0.87 | % | | | 0.87 | % | | | 0.89 | % | | | 0.90 | % | | | 0.90 | % |
Expenses (including short sales expenses) | | | 0.92 | %†† | | | | | | | 0.97 | % | | | 0.90 | % | | | 0.89 | % | | | 0.90 | % | | | 0.90 | % |
Short sale expenses | | | 0.06 | %†† | | | | | | | 0.10 | % | | | 0.03 | % | | | — | | | | — | | | | 0.00 | %(c) |
Portfolio turnover rate | | | 20 | % | | | | | | | 34 | % | | | 26 | % | | | 18 | % | | | 23 | % | | | 39 | % |
Net assets at end of period (in 000’s) | | $ | 981,771 | | | | | | | $ | 882,928 | | | $ | 748,317 | | | $ | 571,281 | | | $ | 298,891 | | | $ | 148,966 | |
| ‡ | Less than one cent per share. |
| (a) | Per share data based on average shares outstanding during the period. |
| (b) | Total return does not reflect any deduction of sales charges, mortality and expense charges, contract charges or administrative charges. For periods of less than one year, total return is not annualized. |
| (c) | Less than one-hundredth of a percent. |
| | | | |
| 28 | | MainStay VP Unconstrained Bond Portfolio | | The notes to the financial statements are an integral part of,
and should be read in conjunction with, the financial statements. |
Notes to Financial Statements (Unaudited)
Note 1–Organization and Business
MainStay VP Funds Trust (the “Fund”) was organized as a Delaware statutory trust on February 1, 2011. The Fund is registered under the Investment Company Act of 1940, as amended (the “1940 Act”), as an open-end management investment company. The Fund is comprised of thirty-two separate series (collectively referred to as the “Portfolios”). These financial statements and notes relate to the MainStay VP Unconstrained Bond Portfolio (the “Portfolio”), a “diversified” portfolio, as that term is defined in the 1940 Act, as interpreted or modified by regulatory authorities having jurisdiction, from time to time.
Shares of the Portfolio are currently offered to certain separate accounts to fund variable annuity policies and variable universal life insurance policies issued by New York Life Insurance and Annuity Corporation (“NYLIAC”), a wholly-owned subsidiary of New York Life Insurance Company (“New York Life”). NYLIAC allocates shares of the Portfolios to, among others, NYLIAC Variable Annuity Separate Accounts-I, II, III and IV, VUL Separate Account-I and CSVUL Separate Account-I (collectively, the “Separate Accounts”). Shares of the Portfolio are also offered to the MainStay VP Conservative Allocation Portfolio, MainStay VP Moderate Allocation Portfolio, MainStay VP Moderate Growth Allocation Portfolio and MainStay VP Growth Allocation Portfolio, which operate as “funds-of-funds.”
The Portfolio currently offers two classes of shares. Initial Class and Service Class shares commenced operations on April 29, 2011. Shares of the Portfolio are offered and are redeemed at a price equal to their respective net asset value (“NAV”) per share. No sales or redemption charge is applicable to the purchase or redemption of the Portfolio’s shares. Under the terms of the Fund’s multiple class plan adopted pursuant to Rule 18f-3 under the 1940 Act, the classes differ in that, among other things, Service Class shares of the Portfolio pay a combined distribution and service fee of 0.25% of average daily net assets attributable to Service Class shares of the Portfolio to the Distributor (as defined in Note 3 (B)) pursuant to a plan adopted in accordance with Rule 12b-1 under the 1940 Act. Contract owners of variable annuity contracts purchased after June 2, 2003, are permitted to invest only in the Service Class shares.
The Portfolio’s investment objective is to seek total return by investing primarily in domestic and foreign debt securities.
Note 2–Significant Accounting Policies
The Portfolio is an investment company and accordingly follows the investment company accounting and reporting guidance of the Financial Accounting Standards Board (“FASB”) Accounting Standard Codification Topic 946 Financial Services—Investment Companies. The Portfolio prepares its financial statements in accordance with generally accepted accounting principles (“GAAP”) in the United States of America and follows the significant accounting policies described below.
(A) Securities Valuation. Investments are usually valued as of the close of regular trading on the New York Stock Exchange (the “Exchange”) (usually 4:00 p.m. Eastern time) on each day the Portfolio is open for business (“valuation date”).
The Board of Trustees (the “Board”) of the Fund adopted procedures establishing methodologies for the valuation of the Portfolio’s securities
and other assets and delegated the responsibility for valuation determinations under those procedures to the Valuation Committee of the Fund (the “Valuation Committee”). The Board authorized the Valuation Committee to appoint a Valuation Sub-Committee (the “Sub-Committee”) to deal in the first instance with establishing the prices of securities for which market quotations are not readily available or the prices of which are not otherwise readily determinable under these procedures. The Sub-Committee meets (in person, via electronic mail or via teleconference) on an as-needed basis. Subsequently, the Valuation Committee meets to ensure that actions taken by the Sub-Committee were appropriate. The procedures recognize that, subject to the oversight of the Board and unless otherwise noted, the responsibility for the day-to-day valuation of portfolio assets (including fair value measurements for the Portfolio’s assets and liabilities) rests with New York Life Investment Management LLC (“New York Life Investments” or the “Manager”), aided to whatever extent necessary by the Subadvisor (as defined in Note 3(A)) to the Portfolio.
To assess the appropriateness of security valuations, the Manager, the Subadvisor or the Portfolio’s third party service provider, who is subject to oversight by the Manager, regularly compares prior day prices, prices on comparable securities and the sale prices to the prior and current day prices and challenges prices with changes exceeding certain tolerance levels with third party pricing services or broker sources. For those securities valued through either a standardized fair valuation methodology or a fair valuation measurement, the Sub-Committee deals in the first instance with such valuation and the Valuation Committee reviews and affirms, if appropriate, the reasonableness of the valuation based on such methodologies and measurements on a regular basis after considering all relevant information that is reasonably available. Any action taken by the Sub-Committee with respect to the valuation of a portfolio security or other asset is submitted by the Valuation Committee to the Board for its review and ratification, if appropriate, at its next regularly scheduled meeting.
“Fair value” is defined as the price the Portfolio would reasonably expect to receive upon selling an asset or liability in an orderly transaction to an independent buyer in the principal or most advantageous market for the asset or liability. Fair value measurements are determined within a framework that establishes a three-tier hierarchy which maximizes the use of observable market data and minimizes the use of unobservable inputs to establish a classification of fair value measurements for disclosure purposes. “Inputs” refer broadly to the assumptions that market participants would use in pricing the asset or liability, including assumptions about risk, such as the risk inherent in a particular valuation technique used to measure fair value using a pricing model and/or the risk inherent in the inputs for the valuation technique. Inputs may be observable or unobservable. Observable inputs reflect the assumptions market participants would use in pricing the asset or liability based on market data obtained from sources independent of the Portfolio. Unobservable inputs reflect the Portfolio’s own assumptions about the assumptions market participants would use in pricing the asset or liability based on the information available. The inputs or methodology used for valuing assets or liabilities may not be an indication of the risks associated with investing in those assets or liabilities. The three-tier hierarchy of inputs is summarized below.
| • | | Level 1—quoted prices in active markets for an identical asset or liability |
Notes to Financial Statements (Unaudited) (continued)
| • | | Level 2—other significant observable inputs (including quoted prices for a similar asset or liability in active markets, interest rates and yield curves, prepayment speeds, credit risk, etc.) |
| • | | Level 3—significant unobservable inputs (including the Portfolio’s own assumptions about the assumptions that market participants would use in measuring fair value of an asset or liability) |
The level of an asset or liability within the fair value hierarchy is based on the lowest level of an input, both individually and in the aggregate, that is significant to the fair value measurement. As of June 30, 2017, the aggregate value by input level of the Portfolio’s assets and liabilities is included at the end of the Portfolio’s Portfolio of Investments.
The Portfolio may use third party vendor evaluations, whose prices may be derived from one or more of the following standard inputs, among others:
| | |
• Benchmark yields | | • Reported trades |
• Broker/dealer quotes | | • Issuer spreads |
• Two-sided markets | | • Benchmark securities |
• Bids/offers | | • Reference data (corporate actions or material event notices) |
• Industry and economic events | | • Comparable bonds |
• Equity and credit default swap curves | | • Monthly payment information |
An asset or liability for which market values cannot be measured using the methodologies described above is valued by methods deemed reasonable in good faith by the Valuation Committee, following the procedures established by the Board, to represent fair value. Under these procedures, the Portfolio generally uses a market-based approach which may use related or comparable assets or liabilities, recent transactions, market multiples, book values, and other relevant information. The Portfolio may also use an income-based valuation approach in which the anticipated future cash flows of the asset or liability are discounted to calculate fair value. Discounts may also be applied due to the nature and/or duration of any restrictions on the disposition of the asset or liability. Fair value represents a good faith approximation of the value of a security. Fair value determinations involve the consideration of a number of subjective factors, an analysis of applicable facts and circumstances and the exercise of judgment. As a result, it is possible that the fair value for a security determined in good faith in accordance with the Portfolio’s valuation procedures may differ from valuations for the same security determined by other funds using their own valuation procedures. Although the Portfolio’s valuation procedures are designed to value a security at the price the Portfolio may reasonably expect to receive upon the security’s sale in an orderly transaction, there can be no assurance that any fair value determination thereunder would, in fact, approximate the amount that the Portfolio would actually realize upon the sale of the security or the price at which the security would trade if a reliable market price were readily available. During the six-month period ended June 30, 2017, there were no material changes to the fair value methodologies.
Securities which may be valued in this manner include, but are not limited to: (i) a security for which trading has been halted or suspended; (ii) a debt security that has recently gone into default and for which there is not a current market quotation; (iii) a security of an issuer that has entered into a restructuring; (iv) a security that has been de-listed
from a national exchange; (v) a security for which the market price is not readily available from a third party pricing source or, if so provided, does not, in the opinion of the Manager or Subadvisor, reflect the security’s market value; (vi) a security subject to trading collars for which no or limited trading takes place; and (vii) a security whose principal market has been temporarily closed at a time when, under normal conditions, it would be open. Securities for which market quotations or observable inputs are not readily available are generally categorized as Level 3 in the hierarchy. As of June 30, 2017, securities that were fair valued in such a manner are shown in the Portfolio of Investments.
Certain securities held by the Portfolio may principally trade in foreign markets. Events may occur between the time the foreign markets close and the time at which the Portfolio’s NAVs are calculated. These events may include, but are not limited to, situations relating to a single issuer in a market sector, significant fluctuations in U.S. or foreign markets, natural disasters, armed conflicts, governmental actions or other developments not tied directly to the securities markets. Should the Manager or Subadvisor conclude that such events may have affected the accuracy of the last price of such securities reported on the local foreign market, the Sub-Committee may, pursuant to procedures adopted by the Board, adjust the value of the local price to reflect the estimated impact on the price of such securities as a result of such events. In this instance, securities are generally categorized as Level 3 in the hierarchy. Additionally, certain foreign equity securities are also fair valued whenever the movement of a particular index exceeds certain thresholds. In such cases, the securities are fair valued by applying factors provided by a third party vendor in accordance with valuation procedures adopted by the Board and are generally categorized as Level 2 in the hierarchy.
Equity securities, rights and warrants are valued at the last quoted sales prices as of the close of regular trading on the relevant exchange on each valuation date. Securities that are not traded on the valuation date are valued at the mean of the last quoted bid and ask prices. Prices are normally taken from the principal market in which each security trades. Futures contracts are valued at the last posted settlement price on the market where such futures are primarily traded. These securities are generally categorized as Level 1 in the hierarchy.
Debt securities (other than convertible and municipal bonds) are valued at the evaluated bid prices (evaluated mean prices in the case of convertible and municipal bonds) supplied by a pricing agent or brokers selected by the Manager, in consultation with the Subadvisor. Those values reflect broker/dealer supplied prices and electronic data processing techniques, if the evaluated bid or mean prices are deemed by the Manager, in consultation with the Subadvisor, to be representative of market values at the regular close of trading of the Exchange on each valuation date. Debt securities purchased on a delayed delivery basis are marked to market daily until settlement at the forward settlement date. Debt securities, including corporate bonds, U.S. government & federal agency bonds, municipal bonds, foreign bonds, convertible bonds, asset-backed securities and mortgage-backed securities are generally categorized as Level 2 in the hierarchy.
Loan assignments, participations and commitments are valued at the average of bid quotations obtained from the engaged independent pricing service and are generally categorized as Level 2 in the hierarchy. Certain loan assignments, participations and commitments may be
| | |
| 30 | | MainStay VP Unconstrained Bond Portfolio |
valued by utilizing significant unobservable inputs obtained from the pricing service and are generally categorized as Level 3 in the hierarchy. As of June 30, 2017, the Portfolio held loan assignments categorized as Level 3 securities with a value of $12,768,663 that were valued by utilizing significant unobservable inputs.
Foreign currency forward contracts are valued at their fair market values measured on the basis of the mean between the last current bid and ask prices based on dealer or exchange quotations and are generally categorized as Level 2 in the hierarchy.
Swaps are marked to market daily based upon quotations from pricing agents, brokers, or market makers. These securities are generally categorized as Level 2 in the hierarchy.
Temporary cash investments acquired in excess of 60 days to maturity at the time of purchase are valued using the latest bid prices or using valuations based on a matrix system (which considers such factors as security prices, yields, maturities, and ratings), both as furnished by independent pricing services. Other temporary cash investments which mature in 60 days or less at the time of purchase (“Short-Term Investments”) are valued using the amortized cost method of valuation, unless the use of such method would be inappropriate. The amortized cost method involves valuing a security at its cost on the date of purchase and thereafter assuming a constant amortization to maturity of the difference between such cost and the value on maturity date. Amortized cost approximates the current fair value of a security. Securities valued using the amortized cost method are not valued using quoted prices in an active market and are generally categorized as Level 2 in the hierarchy.
The information above is not intended to reflect an exhaustive list of the methodologies that may be used to value portfolio investments. The valuation procedures permit the use of a variety of valuation methodologies in connection with valuing portfolio investments. The methodology used for a specific type of investment may vary based on the market data available or other considerations. The methodologies summarized above may not represent the specific means by which portfolio investments are valued on any particular business day.
(B) Income Taxes. The Portfolio’s policy is to comply with the requirements of the Internal Revenue Code of 1986, as amended (the “Internal Revenue Code”), applicable to regulated investment companies and to distribute all of its taxable income to the shareholders of the Portfolio within the allowable time limits. Therefore, no federal, state and local income tax provisions are required.
Management evaluates the Portfolio’s tax positions to determine if the tax positions taken meet the minimum recognition threshold in connection with accounting for uncertainties in income tax positions taken or expected to be taken for the purposes of measuring and recognizing tax liabilities in the financial statements. Recognition of tax benefits of an uncertain tax position is permitted only to the extent the position is “more likely than not” to be sustained assuming examination by taxing authorities. Management has analyzed the Portfolio’s tax positions taken on federal, state and local income tax returns for all open tax years (for up to three tax years), and has concluded that no provisions for federal, state and local income tax are required in the Portfolio’s financial statements. The Portfolio’s federal, state and local income and federal
excise tax returns for tax years for which the applicable statutes of limitations have not expired are subject to examination by the Internal Revenue Service and state and local departments of revenue.
(C) Foreign Taxes. The Portfolio may be subject to foreign taxes on income and other transaction-based taxes imposed by certain countries in which it invests. A portion of the taxes on gains on investments or currency purchases/repatriation may be reclaimable. The Portfolio will accrue such taxes and reclaims as applicable, based upon its current interpretation of tax rules and regulations that exist in the markets in which it invests.
The Portfolio may be subject to taxation on realized capital gains, repatriation proceeds and other transaction-based taxes imposed by certain countries in which it invests. The Portfolio will accrue such taxes as applicable based upon its current interpretation of tax rules and regulations that exist in the market in which it invests. Capital gains taxes relating to positions still held are reflected as a liability on the Statement of Assets and Liabilities, as well as an adjustment to the Portfolio’s net unrealized appreciation (depreciation). Taxes related to capital gains realized, if any, are reflected as part of net realized gain (loss) in the Statement of Operations. Changes in tax liabilities related to capital gains taxes on unrealized investment gains, if any, are reflected as part of the change in net unrealized appreciation (depreciation) on investments in the Statement of Operations. Transaction-based charges are generally assessed as a percentage of the transaction amount.
(D) Dividends and Distributions to Shareholders. Dividends and distributions are recorded on the ex-dividend date. The Portfolio intends to declare and pay dividends from net investment income, if any, at least quarterly and distributions from net realized capital and currency gains, if any, at least annually. All dividends and distributions are reinvested in the same class of shares of the Portfolio, at NAV. Dividends and distributions to shareholders are determined in accordance with federal income tax regulations and may differ from GAAP.
(E) Security Transactions and Investment Income. The Portfolio records security transactions on the trade date. Realized gains and losses on security transactions are determined using the identified cost method. Dividend income is recognized on the ex-dividend date, net of any foreign tax withheld at the source, and interest income is accrued as earned using the effective interest rate method and includes any realized gains and losses from repayments of principal on mortgage-backed securities. Discounts and premiums on securities purchased, other than Short-Term Investments, for the Portfolio are accreted and amortized, respectively, on the effective interest rate method over the life of the respective securities. Discounts and premiums on Short-Term Investments are accreted and amortized, respectively, on the straight-line method. The straight-line method approximates the effective interest method for Short-Term Investments. Income from payment-in-kind securities is accreted daily based on the effective interest method.
Investment income and realized and unrealized gains and losses on investments of the Portfolio are allocated pro rata to the separate classes of shares based upon their relative net assets on the date the income is earned or realized and unrealized gains and losses are incurred.
Notes to Financial Statements (Unaudited) (continued)
The Portfolio may place a debt security on non-accrual status and reduce related interest income by ceasing current accruals and writing off all or a portion of any interest receivables when the collection of all or a portion of such interest has become doubtful. A debt security is removed from non-accrual status when the issuer resumes interest payments or when collectability of interest is reasonably assured.
(F) Expenses. Expenses of the Fund are allocated to the individual Portfolios in proportion to the net assets of the respective Portfolios when the expenses are incurred, except where direct allocations of expenses can be made. Expenses (other than fees incurred under the distribution and service plans, further discussed in Note 3(B), which are charged directly to the Service Class shares) are allocated to separate classes of shares pro rata based upon their relative net assets on the date the expenses are incurred. The expenses borne by the Portfolio, including those of related parties to the Portfolio, are shown in the Statement of Operations.
(G) Use of Estimates. In preparing financial statements in conformity with GAAP, management makes estimates and assumptions that affect the reported amounts and disclosures in the financial statements. Actual results could differ from those estimates.
(H) Repurchase Agreements. The Portfolio may enter into repurchase agreements (i.e., buy a security from another party with the agreement that it be sold back in the future) to earn income. The Portfolio may enter into repurchase agreements only with counterparties, usually financial institutions, that are deemed by the Manager or Subadvisor to be creditworthy, pursuant to guidelines established by the Board. During the term of any repurchase agreement, the Manager or Subadvisor will continue to monitor the creditworthiness of the counterparty. Under the 1940 Act, repurchase agreements are considered to be collateralized loans by the Portfolio to the counterparty secured by the securities transferred to the Portfolio.
Repurchase agreements are subject to counterparty risk, meaning the Portfolio could lose money by the counterparty’s failure to perform under the terms of the agreement. The Portfolio mitigates this risk by ensuring the repurchase agreement is collateralized by cash, U.S. government securities, fixed income securities and/or other securities. The collateral is held by the Portfolio’s custodian and valued daily on a mark to market basis to determine if the value, including accrued interest, exceeds the repurchase price. In the event of the counterparty’s default on the obligation to repurchase, the Portfolio has the right to liquidate the collateral and apply the proceeds in satisfaction of the obligation. Under certain circumstances, such as in the event of default or bankruptcy by the counterparty, realization and/or retention of the collateral may be limited or subject to delay, to legal proceedings and possible realized loss to the Portfolio.
(I) Loan Assignments, Participations and Commitments. The Portfolio’s principal investments may include loan assignments and participations (“loans”). Commitments are agreements to make money available to a borrower in a specified amount, at a specified rate and within a specified time. The Fund records an investment when the borrower withdraws money on a commitment or when a funded loan is purchased (trade date) and records interest as earned. These loans pay interest at rates that are periodically reset by reference to a base lending rate plus a spread. These base lending rates are generally the prime rate offered by a designated U.S. bank or the London InterBank Offered Rate.
The loans in which the Portfolio may invest are generally readily marketable, but may be subject to some restrictions on resale. For example, the Portfolio may be contractually obligated to receive approval from the agent bank and/or borrower prior to the sale of these investments. If the Portfolio purchases an assignment from a lender, the Portfolio will generally have direct contractual rights against the borrower in favor of the lender. If the Portfolio purchases a participation interest either from a lender or a participant, the Portfolio typically will have established a direct contractual relationship with the seller of the participation interest, but not with the borrower. Consequently, the Portfolio is subject to the credit risk of the lender or participant who sold the participation interest to the Portfolio, in addition to the usual credit risk of the borrower. In the event that the borrower, selling participant or intermediate participants become insolvent or enters into bankruptcy, the Portfolio may incur certain costs and delays in realizing payment, or may suffer a loss of principal and/or interest.
Unfunded commitments represent the remaining obligation of the Portfolio to the borrower. At any point in time, up to the maturity date of the issue, the borrower may demand the unfunded portion. Unfunded amounts, if any, are marked to market and any unrealized gains or losses are recorded in the Statement of Assets and Liabilities. As of June 30, 2017, the Portfolio did not hold any unfunded commitments.
(J) Futures Contracts. A futures contract is an agreement to purchase or sell a specified quantity of an underlying instrument at a specified future date and price, or to make or receive a cash payment based on the value of a financial instrument (e.g., foreign currency, interest rate, security, or securities index). The Portfolio is subject to risks such as market price risk and/or interest rate risk in the normal course of investing in these transactions. Upon entering into a futures contract, the Portfolio is required to pledge to the broker or futures commission merchant an amount of cash and/or U.S. Government securities equal to a certain percentage of the collateral amount, known as the “initial margin.” During the period the futures contract is open, changes in the value of the contract are recognized as unrealized appreciation or depreciation by marking to market such contract on a daily basis to reflect the market value of the contract at the end of each day’s trading. The Portfolio agrees to receive from or pay to the broker or futures commission merchant an amount of cash equal to the daily fluctuation in the value of the contract. Such receipts or payments are known as “variation margin.” When the futures contract is closed, the Portfolio records a realized gain or loss equal to the difference between the proceeds from (or cost of) the closing transaction and the Portfolio’s basis in the contract.
The use of futures contracts involves, to varying degrees, elements of market risk in excess of the amount recognized in the Statement of Assets and Liabilities. The contract or notional amounts and variation margin reflect the extent of the Portfolio’s involvement in open futures positions. There are several risks associated with the use of futures contracts as hedging techniques. There can be no assurance that a liquid market will exist at the time when the Portfolio seeks to close out a futures contract. If no liquid market exists, the Portfolio would remain obligated to meet margin requirements until the position is closed. Futures may involve a small initial investment relative to the risk assumed, which could result in losses greater than if they had not been used. Futures may be more volatile than direct investments in the
| | |
| 32 | | MainStay VP Unconstrained Bond Portfolio |
instrument underlying the futures, and may not correlate to the underlying instrument, causing a given hedge not to achieve its objectives. The Portfolio’s activities in futures contracts have minimal counterparty risk as they are conducted through regulated exchanges that guarantee the futures against default by the counterparty. In the event of a bankruptcy or insolvency of a futures commission merchant that holds margin on behalf of the Portfolio, the Portfolio may not be entitled to the return of the entire margin owed to the Portfolio, potentially resulting in a loss. The Portfolio’s investment in futures contracts and other derivatives may increase the volatility of the Portfolio’s NAV and may result in a loss to the Portfolio. As of June 30, 2017, all open futures contracts are shown in the Portfolio of Investments.
(K) Swap Contracts. The Portfolio may enter into credit default, interest rate, equity, index and currency exchange rate contracts (“swaps”). In a typical swap transaction, two parties agree to exchange the future returns (or differentials in rates of future returns) earned or realized at periodic intervals on a particular investment or instrument based on a notional principal amount. Generally, the Portfolio will enter into a swap on a net basis, which means that the two payment streams under the swap are netted, with the Portfolio receiving or paying (as the case may be) only the net amount of the two payment streams. Therefore, the Portfolio’s current obligation under a swap generally will be equal to the net amount to be paid or received under the swap, based on the relative value of notional positions attributable to each counterparty to the swap. The payments may be adjusted for transaction costs, interest payments, the amount of interest paid on the investment or instrument or other factors. Collateral, in the form of cash or securities, may be required to be held in segregated accounts with the custodian bank or broker in accordance with the terms of the swap. Swap agreements are privately negotiated in the over the counter market (“OTC swaps”) and may be executed in a multilateral or other trade facilities platform, such as a registered commodities exchange (“centrally cleared swaps”).
Certain standardized swaps, including certain credit default and interest rate swaps, are subject to mandatory clearing and exchange-trading, and more types of standardized swaps are expected to be subject to mandatory clearing and exchange-trading in the future. The counterparty risk for exchange-traded and cleared derivatives is expected to be generally lower than for uncleared derivatives, but cleared contracts are not risk-free. In a cleared derivative transaction, the Portfolio typically enters into the transaction with a financial institution counterparty, and performance of the transaction is effectively guaranteed by a central clearinghouse, thereby reducing or eliminating the Portfolio’s exposure to the credit risk of its original counterparty. The Portfolio will be required to post specified levels of margin with the clearinghouse or at the instruction of the clearinghouse; the margin required by a clearinghouse may be greater than the margin the Portfolio would be required to post in an uncleared transaction. As of June 30, 2017, all swap positions outstanding are shown in the Portfolio of Investments.
Swaps are marked to market daily based upon quotations from pricing agents, brokers, or market makers and the change in value, if any, is recorded as unrealized appreciation or depreciation. Any payments made or received upon entering into a swap would be amortized or accreted over the life of the swap and recorded as a realized gain or loss. Early termination of a swap is recorded as a realized gain or loss.
Daily changes in valuation of centrally cleared swaps, if any, are recorded as a receivable or payable for the change in value as appropriate (“variation margin”) on the Statement of Assets and Liabilities.
The Portfolio bears the risk of loss of the amount expected to be received under a swap in the event of the default or bankruptcy of the swap counterparty. The Portfolio may be able to eliminate its exposure under a swap either by assignment or other disposition, or by entering into an offsetting swap with the same party or a similar creditworthy party. Swaps are not actively traded on financial markets. Entering into swaps involves elements of credit, market, and documentation risk in excess of the amounts recognized on the Statement of Assets and Liabilities. Such risks involve the possibilities that there will be no liquid market for these swaps, that the counterparty to the swaps may default on its obligation to perform or disagree as to the meaning of the contractual terms in the swaps and that there may be unfavorable changes in interest rates, the price of the index or the security underlying these transactions.
Interest Rate Swaps: An interest rate swap is an agreement between two parties where one stream of future interest payments is exchanged for another based on a specified principal amount. Interest rate swaps often exchange a fixed payment for a floating payment that is linked to an interest rate (most often the London InterBank Offer Rate). The Portfolio will typically use interest rate swaps to limit, or manage, its exposure to fluctuations in interest rates, or to obtain a marginally lower interest rate than it would have been able to get without the swap.
Credit Default Swaps: The Portfolio may enter into credit default swaps to simulate long and short bond positions or to take an active long or short position with respect to the likelihood of a default or credit event by the issuer of the underlying reference obligation. The types of reference obligations underlying the swaps that may be entered into by the Portfolio include debt obligations of a single issuer of corporate or sovereign debt, a basket of obligations of different issuers or a credit index. A credit index is an equally-weighted credit default swap index that is designed to track a representative segment of the credit default swap market (e.g., investment grade, high volatility, below investment grade or emerging markets) and provides an investor with exposure to specific “baskets” of issuers of certain debt instruments. Index credit default swaps have standardized terms including a fixed spread and standard maturity dates. The composition of the obligations within a particular index changes periodically. Credit default swaps involve one party, the protection buyer, making a stream of payments to another party, the protection seller, in exchange for the right to receive a contingent payment if there is a credit event related to the underlying reference obligation. In the event that the reference obligation matures prior to the termination date of the contract, a similar security will be substituted for the duration of the contract term. Credit events are defined under individual swap agreements and generally include bankruptcy, failure to pay, restructuring, repudiation/moratorium, obligation acceleration and obligation default. Selling protection effectively adds leverage to a portfolio up to the notional amount of the swap agreement. Potential liabilities under these contracts may be reduced by: the auction rates of the underlying reference obligations; upfront payments received at the inception of a swap; and net amounts received from credit default swaps purchased with the identical reference obligation.
Notes to Financial Statements (Unaudited) (continued)
(L) Foreign Currency Forward Contracts. The Portfolio may enter into foreign currency forward contracts, which are agreements to buy or sell foreign currencies on a specified future date at a specified rate. The Portfolio is subject to foreign currency exchange rate risk in the normal course of investing in these transactions. During the period the forward contract is open, changes in the value of the contract are recognized as unrealized appreciation or depreciation by marking to market such contract on a daily basis to reflect the market value of the contract at the end of each day’s trading. Cash movement occurs on settlement date. When the forward contract is closed, the Portfolio records a realized gain or loss equal to the difference between the proceeds from (or cost of) the closing transaction and the Portfolio’s basis in the contract. The Portfolio may purchase and sell foreign currency forward contracts for purposes of seeking to enhance portfolio returns and manage portfolio risk more efficiently. Foreign currency forward contracts may also be used to gain exposure to a particular currency or to hedge against the risk of loss due to changing currency exchange rates. Foreign currency forward contracts to purchase or sell a foreign currency may also be used in anticipation of future purchases or sales of securities denominated in foreign currency, even if the specific investments have not yet been selected.
The use of foreign currency forward contracts involves, to varying degrees, elements of risk in excess of the amount recognized in the Statement of Assets and Liabilities, including counterparty risk, market risk, and illiquidity risk. Counterparty risk is heightened for these instruments because foreign currency forward contracts are not exchange-traded and therefore no clearinghouse or exchange stands ready to meet the obligations under such contracts. Thus, the Portfolio faces the risk that its counterparties under such contracts may not perform their obligations. Market risk is the risk that the value of a foreign currency forward contract will depreciate due to unfavorable changes in exchange rates. Illiquidity risk arises because the secondary market for foreign currency forward contracts may have less liquidity relative to markets for other securities and financial instruments. Risks also arise from the possible movements in the foreign exchange rates underlying these instruments. While the Portfolio may enter into forward contracts to reduce currency exchange risks, changes in currency exchange rates may result in poorer overall performance for the Portfolio than if it had not engaged in such transactions. Exchange rate movements can be large, depending on the currency, and can last for extended periods of time, affecting the value of the Portfolio’s assets. Moreover, there may be an imperfect correlation between the Portfolio’s holdings of securities denominated in a particular currency and forward contracts entered into by the Portfolio. Such imperfect correlation may prevent the Portfolio from achieving the intended hedge or expose the Portfolio to the risk of currency exchange loss. The unrealized appreciation (depreciation) on forward contracts also reflects the Portfolio’s exposure at the valuation date to credit loss in the event of a counterparty’s failure to perform its obligations.
(M) Foreign Currency Transactions. The Portfolio’s books and records are maintained in U.S. dollars. Prices of securities denominated in foreign currency amounts are translated into U.S. dollars at the mean between the buying and selling rates last quoted by any major U.S. bank at the following dates:
| (i) | market value of investment securities, other assets and liabilities— at the valuation date; and |
| (ii) | purchases and sales of investment securities, income and expenses—at the date of such transactions. |
The assets and liabilities that are denominated in foreign currency amounts are presented at the exchange rates and market values at the close of the period. The realized and unrealized changes in net assets arising from fluctuations in exchange rates and market prices of securities are not separately presented.
Net realized gain (loss) on foreign currency transactions represents net gains and losses on foreign currency forward contracts, net currency gains or losses realized as a result of differences between the amounts of securities sale proceeds or purchase cost, dividends, interest and withholding taxes as recorded on the Portfolio’s books, and the U.S. dollar equivalent amount actually received or paid. Net currency gains or losses from valuing such foreign currency denominated assets and liabilities, other than investments at valuation date exchange rates, are reflected in unrealized foreign exchange gains or losses.
(N) Rights and Warrants. Rights are certificates that permit the holder to purchase a certain number of shares, or a fractional share, of a new stock from the issuer at a specific price. Warrants are instruments that entitle the holder to buy an equity security at a specific price for a specific period of time. These investments can provide a greater potential for profit or loss than an equivalent investment in the underlying security. Prices of these investments do not necessarily move in tandem with the prices of the underlying securities.
There is risk involved in the purchase of rights and warrants in that these investments are speculative investments. The Portfolio could also lose the entire value of its investment in warrants if such warrants are not exercised by the date of its expiration. The Portfolio is exposed to risk until the sale or exercise of each right or warrant is completed.
As of June 30, 2017, the Portfolio did not hold any rights or warrants.
(O) Securities Sold Short. The Portfolio may engage in sales of securities it does not own (“short sales”) as part of its investment strategies. When the Portfolio enters into a short sale, it must segregate or maintain with a broker the cash proceeds from the security sold short or other securities as collateral for its obligation to deliver the security upon conclusion of the sale. During the period a short position is open, depending on the nature and type of security, a short position is reflected as a liability and is marked to market in accordance with the valuation methodologies previously detailed (See Note 2(B)). Liabilities for securities sold short are closed out by purchasing the applicable securities for delivery to the counterparty broker. A gain, limited to the price at which the Portfolio sold the security short, or a loss, unlimited as to dollar amount, will be recognized upon termination of a short sale if the market price on the date the short position is closed out is less or greater, respectively, than the proceeds originally received. Any such gain or loss may be offset, completely or in part, by the change in the value of the hedged investments. Interest on short positions held is accrued daily, while dividends declared on short positions existing on the record date are recorded on the ex-dividend date as a dividend expense in the Statement of Operations. Broker fees and other expenses related to securities sold short are disclosed in the Statement of Operations. Short sales involve risk of loss in excess of the related amounts reflected in the Statement of Assets and Liabilities.
| | |
| 34 | | MainStay VP Unconstrained Bond Portfolio |
(P) Securities Lending. In order to realize additional income, the Portfolio may engage in securities lending, subject to the limitations set forth in the 1940 Act and relevant guidance by the staff of the Securities and Exchange Commission (“SEC”). In the event the Portfolio does engage in securities lending, the Portfolio will lend through its custodian, State Street Bank and Trust Company (“State Street”). State Street will manage the Portfolio’s collateral in accordance with the lending agreement between the Portfolio and State Street, and indemnify the Portfolio against counterparty risk. The loans will be collateralized by U.S. Treasury securities at least equal at all times to the market value of the securities loaned. The Portfolio may bear the risk of delay in recovery of, or loss of rights in, the securities loaned should the borrower of the securities experience financial difficulty. The Portfolio may also record a realized gain or loss on securities deemed sold due to a borrower’s inability to return securities on loan. The Portfolio bears the risk of any loss on investment of the collateral. The Portfolio will receive compensation for lending its securities in the form of fees or it will retain a portion of interest on the investment of any cash received as collateral. The Portfolio will also continue to receive interest and dividends on the securities loaned and any gain or loss in the market price of the securities loaned that may occur during the term of the loan will be for the account of the Portfolio. During the six-month period ended June 30, 2017, the Portfolio did not have any portfolio securities on loan.
(Q) Securities Risk. The Portfolio’s principal investments may include high-yield debt securities (commonly referred to as “junk bonds”), which are considered speculative because they present a greater risk of loss, including default, than higher rated debt securities. These securities pay investors a premium—a higher interest rate or yield than investment grade debt securities—because of the increased risk of loss. These securities can also be subject to greater price volatility. In times of unusual or adverse market, economic or political conditions, these securities may experience higher than normal default rates.
The Portfolio may invest in loans which are usually rated below investment grade and are generally considered speculative because they present a greater risk of loss, including default, than higher rated debt securities. These investments pay investors a higher interest rate than investment grade debt securities because of the increased risk of loss. Although certain loans are collateralized, there is no guarantee that the value of the collateral will be sufficient to repay the loan. In a recession or serious credit event, the value of these investments could decline significantly. As a result of these and other events, the Portfolio’s NAV could go down and you could lose money. In addition, floating rate loans generally are subject to extended settlement periods that may be longer than seven days. As a result, the Portfolio may be adversely affected by selling other investments at an unfavorable time and/or under unfavorable conditions or engaging in borrowing transactions, such as borrowing against its credit facility, to raise cash to meet redemption obligations or pursue other investment opportunities. In certain circumstances, floating rate loans may not be deemed to be securities. As a result, the Portfolio may not have the protection of the anti-fraud provisions of the federal securities laws. In such cases, the Portfolio generally must rely on the contractual provisions in the loan agreement and common-law fraud protections under applicable state law.
The Portfolio may invest in foreign securities, which carry certain risks that are in addition to the usual risks inherent in domestic instruments. These risks include those resulting from currency fluctuations, future adverse political or economic developments and possible imposition of currency exchange blockages or other foreign governmental laws or restrictions. These risks are likely to be greater in emerging markets than in developed markets. The ability of issuers of debt securities held by the Portfolio to meet their obligations may be affected by economic or political developments in a specific country, industry or region.
(R) Counterparty Credit Risk. In order to better define its contractual rights and to secure rights that will help the Portfolio mitigate its counterparty risk, the Portfolio may enter into an International Swaps and Derivatives Association, Inc. Master Agreement (“ISDA Master Agreement”) or similar agreement with its counterparties. An ISDA Master Agreement is a bilateral agreement between the Portfolio and a counterparty that governs certain OTC derivatives and typically contains collateral posting terms and netting provisions. Under an ISDA Master Agreement, the Portfolio may, under certain circumstances, offset with the counterparty certain derivative financial instruments’ payables and/or receivables with collateral held and/or posted and create one single net payment. The provisions of the ISDA Master Agreement typically permit a single net payment in the event of default including the bankruptcy or insolvency of the counterparty. Bankruptcy or insolvency laws of a particular jurisdiction may restrict or prohibit the right of offset in bankruptcy, insolvency or other events. In addition, certain ISDA Master Agreements may contain provisions for early termination of OTC derivative transactions in the event the net assets of the Portfolio decline
below specific levels or if the Portfolio fails to meet the terms of its ISDA Master Agreements. The result would cause the Portfolio to accelerate payment of any net liability owed to the counterparty.
For financial reporting purposes, the Portfolio does not offset derivative assets and derivative liabilities that are subject to netting arrangements, if any, in the Statement of Assets and Liabilities.
(S) Indemnifications. Under the Fund’s organizational documents, its officers and trustees are indemnified against certain liabilities that may arise out of performance of their duties to the Fund. Additionally, in the normal course of business, the Portfolio enters into contracts with third-party service providers that contain a variety of representations and warranties and which may provide general indemnifications. The Portfolio’s maximum exposure under these arrangements is unknown, as this would involve future claims that may be made against the Portfolio that have not yet occurred. Based on experience, management is of the view that the risk of loss in connection with these potential indemnification obligations is remote. However, there can be no assurance that material liabilities related to such obligations will not arise in the future, which could adversely impact the Portfolio.
(T) Quantitative Disclosure of Derivative Holdings. The following tables show additional disclosures related to the Portfolio’s derivative and hedging activities, including how such activities are accounted for and their effect on the Portfolio’s financial positions, performance and cash flows. The Portfolio entered into futures contracts to help manage the duration and yield curve positioning of the portfolio
while minimizing the exposure to wider bid/ask spreads in traditional bonds. The Portfolio entered into interest rate and credit default swap contracts in order to obtain a desired return at a lower cost to the
Notes to Financial Statements (Unaudited) (continued)
Portfolio, rather than directly investing in an instrument yielding that desired return or to hedge against credit and interest rate risk. The Portfolio also entered into foreign currency forward contracts to gain
exposure to a particular currency or to hedge against the risk of loss due to changing currency exchange rates. These derivatives are not accounted for as hedging instruments.
Fair value of derivative instruments as of June 30, 2017:
Asset Derivatives
| | | | | | | | | | | | | | |
| | | Statement of
Assets and Liabilities | | Foreign
Exchange
Contracts
Risk | | | Interest
Rate
Contracts
Risk | | | Total | |
Futures Contracts | | Net Assets—Net unrealized appreciation (depreciation) on investments, swap contracts and futures contracts (a) | | $ | — | | | $ | 1,248,375 | | | $ | 1,248,375 | |
Forward Contracts | | Unrealized appreciation on foreign currency forward contracts | | | 1,519 | | | | — | | | | 1,519 | |
Centrally Cleared Swap Contracts | | Net Assets—Net unrealized appreciation (depreciation) on investments, swap contracts and futures contracts (b) | | | — | | | | 4,699,220 | | | | 4,699,220 | |
| | | | | | | | | | | | | | |
Total Fair Value | | | | $ | 1,519 | | | $ | 5,947,595 | | | $ | 5,949,114 | |
| | | | | | | | | | | | | | |
Liability Derivatives
| | | | | | | | | | | | | | |
| | | Statement of Assets and Liabilities | | Foreign
Exchange
Contracts
Risk | | | Interest
Rate
Contracts
Risk | | | Total | |
Futures Contracts | | Net Assets—Net unrealized appreciation (depreciation) on investments, swap contracts and futures contracts (a) | | $ | — | | | $ | (361,199 | ) | | $ | (361,199 | ) |
Forward Contracts | | Unrealized depreciation on foreign currency forward contracts | | | (84,644 | ) | | | — | | | | (84,644 | ) |
| | | | | | | | | | | | | | |
Total Fair Value | | | | $ | (84,644 | ) | | $ | (361,199 | ) | | $ | (445,843 | ) |
| | | | | | | | | | | | | | |
| (a) | Includes cumulative appreciation (depreciation) of futures contracts as reported in the Portfolio of Investments. Only current day’s variation margin is reported within the Statement of Assets and Liabilities. |
| (b) | Includes cumulative appreciation (depreciation) of centrally cleared swap agreements as reported in the Portfolio of Investments. Only the current day’s variation margin is reported within the Statement of Assets and Liabilities. |
The effect of derivative instruments on the Statement of Operations for the period ended June 30, 2017:
Realized Gain (Loss)
| | | | | | | | | | | | | | |
| | | Statement of Operations Location | | Foreign
Exchange
Contracts
Risk | | | Interest
Rate
Contracts
Risk | | | Total | |
Forward Contracts | | Net realized gain (loss) on foreign currency transactions | | $ | 41,836 | | | $ | — | | | $ | 41,836 | |
Futures Contracts | | Net realized gain (loss) on futures transactions | | | — | | | | (2,252,582 | ) | | | (2,252,582 | ) |
Swap Contracts | | Net realized gain (loss) on swap transactions | | | — | | | | 1,216,807 | | | | 1,216,807 | |
| | | | | | | | | | | | | | |
Total Realized Gain (Loss) | | | | $ | 41,836 | | | $ | (1,035,775 | ) | | $ | (993,939 | ) |
| | | | | | | | | | | | | | |
| | |
| 36 | | MainStay VP Unconstrained Bond Portfolio |
Change in Unrealized Appreciation (Depreciation)
| | | | | | | | | | | | | | |
| | | Statement of Operations Location | | Foreign
Exchange
Contracts
Risk | | | Interest
Rate
Contracts
Risk | | | Total | |
Forward Contracts | | Net change in unrealized appreciation (depreciation) on translation of other assets and liabilities in foreign currencies and foreign currency forward contracts | | $ | (214,666 | ) | | $ | — | | | $ | (214,666 | ) |
Futures Contracts | | Net change in unrealized appreciation (depreciation) on futures contracts | | | — | | | | 231,045 | | | | 231,045 | |
Swap Contracts | | Net change in unrealized appreciation (depreciation) on swap contracts | | | — | | | | (994,921 | ) | | | (994,921 | ) |
| | | | | | | | | | | | | | |
Total Change in Unrealized Appreciation (Depreciation) | | | | $ | (214,666 | ) | | $ | (763,876 | ) | | $ | (978,542 | ) |
| | | | | | | | | | | | | | |
Average Notional Amount
| | | | | | | | | | | | |
| | | Foreign
Exchange
Contracts
Risk | | | Interest Rate Contracts Risk | | | Total | |
Forward Contracts Long (a) | | $ | 4,755,943 | | | $ | — | | | $ | 4,755,943 | |
Forward Contracts Short | | $ | (8,421,499 | ) | | $ | — | | | $ | (8,421,499 | ) |
Futures Contracts Long | | $ | — | | | $ | 42,825,020 | | | $ | 42,825,020 | |
Futures Contracts Short | | $ | — | | | $ | (563,467,359 | ) | | $ | (563,467,359 | ) |
Swap Contracts Long | | $ | — | | | $ | 1,230,000,000 | | | $ | 1,230,000,000 | |
| | | | | | | | | | | | |
| (a) | Positions were open five months during the reporting period. |
Note 3–Fees and Related Party Transactions
(A) Manager and Subadvisor. New York Life Investments, a registered investment adviser and an indirect, wholly-owned subsidiary of New York Life, serves as the Portfolio’s Manager pursuant to an Amended and Restated Management Agreement (“Management Agreement”). The Manager provides offices, conducts clerical, recordkeeping and bookkeeping services, and keeps most of the financial and accounting records required to be maintained by the Portfolio. Except for the portion of salaries and expenses that are the responsibility of the Portfolio, the Manager pays the salaries and expenses of all personnel affiliated with the Portfolio and the operational expenses of the Portfolio. The Portfolio reimburses New York Life Investments in an amount equal to a portion of the compensation of the Chief Compliance Officer attributable to the Portfolio. MacKay Shields LLC (“MacKay Shields” or “Subadvisor”), a registered investment adviser and an indirect, wholly-owned subsidiary of New York Life serves as a Subadvisor and is responsible for the day-to-day portfolio management of the Portfolio. New York Life Investments pays for the services of the Subadvisor.
The Fund, on behalf of the Portfolio, pays New York Life Investments in its capacity as the Portfolio’s investment manager and administrator, pursuant to the Management Agreement, a monthly fee for the services performed and facilities furnished at an annual rate of the Portfolio’s average daily net assets as follows: 0.60% up to $500 million; 0.55% from $500 million to $1 billion; 0.50% from $1 billion to $5 billion; and 0.475% in excess of $5 billion. During the six-month period ended June 30, 2017, the effective management fee rate was 0.57%.
During the six-month period ended June 30, 2017, New York Life Investments earned fees from the Portfolio in the amount of $2,992,970.
State Street provides sub-administration and sub-accounting services to the Portfolio pursuant to an agreement with New York Life Investments. These services include calculating the daily NAVs of the Portfolio, maintaining the general ledger and sub-ledger accounts for the calculation of the Portfolio’s NAVs, and assisting New York Life Investments in conducting various aspects of the Portfolio’s administrative operations. For providing these services to the Portfolio, State Street is compensated by New York Life Investments.
(B) Distribution and Service Fees. The Fund, on behalf of the Portfolio, has entered into a distribution agreement with NYLIFE Distributors LLC (the “Distributor”), an indirect, wholly-owned subsidiary of New York Life. The Portfolio has adopted a distribution plan (the “Plan”) in accordance with the provisions of Rule 12b-1 under the 1940 Act. Under the Plan, the Distributor has agreed to provide, through its affiliates or independent third parties, various distribution-related, shareholder and administrative support services to the Service Class shareholders. For its services, the Distributor is entitled to a combined distribution and service fee accrued daily and paid monthly at an annual rate of 0.25% of the average daily net assets attributable to the Service Class shares of the Portfolio.
Notes to Financial Statements (Unaudited) (continued)
Note 4–Federal Income Tax
During the year ended December 31, 2016, the tax character of distributions paid as reflected in the Statements of Changes in Net Assets was as follows:
| | | | |
| 2016 | |
Tax-Based Distributions from Ordinary Income | | Tax-Based
Distributions
from Long-Term
Gains | |
| $31,397,809 | | $ | — | |
Note 5–Custodian
State Street is the custodian of cash and securities held by the Portfolio. Custodial fees are charged to the Portfolio based on the Portfolio’s net assets and/or the market value of securities held by the Portfolio and the number of certain transactions incurred by the Portfolio.
Note 6–Line of Credit
The Portfolio and certain other funds managed by New York Life Investments, maintain a line of credit with a syndicate of banks in order to secure a source of funds for temporary purposes to meet unanticipated or excessive redemption requests.
Effective August 1, 2017, under the credit agreement (the “Credit Agreement”), the aggregate commitment amount is $600,000,000 with an additional uncommitted amount of $100,000,000. The commitment fee is an annual rate of 0.15% of the average commitment amount payable quarterly, regardless of usage, to State Street, who serves as the agent to the syndicate. The commitment fee is allocated among the Portfolio and certain other funds managed by New York Life Investments based upon their respective net assets and other factors. Interest on any revolving credit loan is charged based upon the Federal Funds Advances Rate or the one month LIBOR, whichever is higher. The Credit Agreement expires on July 31, 2018, although the Portfolio, certain other funds managed by New York Life Investments and the syndicate of banks may renew the Credit Agreement for an additional year on the same or different terms. Prior to August 1, 2017, the aggregate commitment amount was $600,000,000 with an additional uncommitted amount of $100,000,000, and the commitment fee, under a credit agreement for which Bank of New York Mellon served as agent, was at an annual rate of 0.15% of the average commitment amount. During the six-month period ended June 30, 2017, there were no borrowings made or outstanding with respect to the Portfolio under the credit agreement for which Bank of New York Mellon served as agent.
Note 7–Interfund Lending Program
Pursuant to an exemptive order issued by the SEC, the Portfolio, along with certain other funds managed by New York Life Investments, may participate in an interfund lending program. The interfund lending program provides an alternative credit facility that permits the Portfolio and certain other funds managed by New York Life Investments to lend or borrow money for temporary purposes directly to or from one another subject to the conditions of the exemptive order. During the six-month period ended June 30, 2017, there were no interfund loans made or outstanding with respect to the Portfolio.
Note 8–Purchases and Sales of Securities (in 000’s)
During the six-month period ended June 30, 2017, purchases and sales of securities, other than short-term securities, were $271,241 and $190,863, respectively.
Note 9–Capital Share Transactions
Transactions in capital shares for the six-month period ended June 30, 2017, and the year ended December 31, 2016, were as follows:
| | | | | | | | |
Initial Class | | Shares | | | Amount | |
Six-month period ended June 30, 2017: | | | | | | | | |
Shares sold | | | 354,538 | | | $ | 3,555,660 | |
Shares issued to shareholders in reinvestment of dividends and distributions | | | 195,689 | | | | 1,954,605 | |
Shares redeemed | | | (238,021 | ) | | | (2,386,510 | ) |
| | | | | | | | |
Net increase (decrease) | | | 312,206 | | | $ | 3,123,755 | |
| | | | | | | | |
Year ended December 31, 2016: | | | | | | | | |
Shares sold | | | 1,009,337 | | | $ | 9,859,278 | |
Shares issued to shareholders in reinvestment of dividends and distributions | | | 436,717 | | | | 4,264,730 | |
Shares redeemed | | | (2,616,294 | ) | | | (24,952,427 | ) |
| | | | | | | | |
Net increase (decrease) | | | (1,170,240 | ) | | $ | (10,828,419 | ) |
| | | | | | | | |
| | |
| | | | | | | | |
Service Class | | Shares | | | Amount | |
Six-month period ended June 30, 2017: | | | | | | | | |
Shares sold | | | 11,335,300 | | | $ | 113,074,155 | |
Shares issued to shareholders in reinvestment of dividends and distributions | | | 1,382,972 | | | | 13,774,266 | |
Shares redeemed | | | (3,973,911 | ) | | | (39,634,416 | ) |
| | | | | | | | |
Net increase (decrease) | | | 8,744,361 | | | $ | 87,214,005 | |
| | | | | | | | |
Year ended December 31, 2016: | | | | | | | | |
Shares sold | | | 19,911,739 | | | $ | 194,199,185 | |
Shares issued to shareholders in reinvestment of dividends and distributions | | | 2,785,008 | | | | 27,133,079 | |
Shares redeemed | | | (11,892,741 | ) | | | (115,323,250 | ) |
| | | | | | | | |
Net increase (decrease) | | | 10,804,006 | | | $ | 106,009,014 | |
| | | | | | | | |
Note 10–Recent Accounting Pronouncement
In October 2016, the SEC adopted new rules and amended existing rules (together, “final rules”) intended to modernize the reporting and disclosure of information by registered investment companies. In part, the final rules amend Regulation S-X and require standardized, enhanced disclosure about derivatives in investment company financial statements, as well as other amendments. The compliance date for the amendments to Regulation S-X is August 1, 2017 and applies to shareholder reports for funds with fiscal periods ending after August 1, 2017. Management is currently evaluating the impact that the adoption of the amendments to Regulation S-X will have on the Portfolio’s financial statements and related disclosures.
| | |
| 38 | | MainStay VP Unconstrained Bond Portfolio |
Note 11–Subsequent Events
In connection with the preparation of the financial statements of the Portfolio as of and for the six-month period ended June 30, 2017, events and transactions subsequent to June 30, 2017, through the date the financial statements were issued have been evaluated by the Portfolio’s management for possible adjustment and/or disclosure. No subsequent events requiring financial statement adjustment or disclosure have been identified.
Proxy Voting Policies and Procedures and Proxy Voting Record
A description of the policies and procedures that New York Life Investments uses to vote proxies related to the Portfolio’s securities is available without charge, upon request, (i) by calling 800-598-2019 or (ii) by visiting the SEC’s website at www.sec.gov.
The Portfolio is required to file with the SEC its proxy voting record for the 12-month period ending June 30 on Form N-PX. The Portfolio’s most recent Form N-PX or proxy voting record is available free of charge upon request (i) by calling 800-598-2019 or; (ii) by visiting the SEC’s website at www.sec.gov.
Shareholder Reports and Quarterly Portfolio Disclosure
The Portfolio is required to file its complete schedule of portfolio holdings with the SEC for its first and third fiscal quarters on Form N-Q. The Portfolio’s Form N-Q is available without charge on the SEC’s website at www.sec.gov or by calling MainStay Investments at 800-598-2019. You also can obtain and review copies of Form N-Q by visiting the SEC’s Public Reference Room in Washington, DC (information on the operation of the Public Reference Room may be obtained by calling 1-800-SEC-0330).
| | |
| 40 | | MainStay VP Unconstrained Bond Portfolio |
This page intentionally left blank
This page intentionally left blank
MainStay VP Portfolios
MainStay VP offers a wide range of Portfolios. The full array of MainStay VP offerings is listed here, with information about the manager, subadvisors, legal counsel, and independent registered public accounting firm.
Equity Portfolios
MainStay VP Common Stock Portfolio
MainStay VP Cornerstone Growth Portfolio
MainStay VP Eagle Small Cap Growth Portfolio
MainStay VP Emerging Markets Equity Portfolio
MainStay VP Epoch U.S. Equity Yield Portfolio
MainStay VP Epoch U.S. Small Cap Portfolio
MainStay VP International Equity Portfolio
MainStay VP Large Cap Growth Portfolio
MainStay VP MFS® Utilities Portfolio
MainStay VP Mid Cap Core Portfolio
MainStay VP S&P 500 Index Portfolio
MainStay VP Small Cap Core Portfolio
MainStay VP T. Rowe Price Equity Income Portfolio
MainStay VP VanEck Global Hard Assets Portfolio
Mixed Asset Portfolios
MainStay VP Balanced Portfolio
MainStay VP Convertible Portfolio
MainStay VP Cushing Renaissance Advantage Portfolio
MainStay VP Income Builder Portfolio
MainStay VP Janus Henderson Balanced Portfolio
Income Portfolios
MainStay VP Bond Portfolio
MainStay VP Floating Rate Portfolio
MainStay VP Government Portfolio
MainStay VP High Yield Corporate Bond Portfolio
MainStay VP Indexed Bond Portfolio
MainStay VP PIMCO Real Return Portfolio
MainStay VP Unconstrained Bond Portfolio
Money Market
MainStay VP U.S. Government Money Market Portfolio
Alternative
MainStay VP Absolute Return Multi-Strategy Portfolio
Asset Allocation Portfolios
MainStay VP Conservative Allocation Portfolio
MainStay VP Growth Allocation Portfolio
MainStay VP Moderate Allocation Portfolio
MainStay VP Moderate Growth Allocation Portfolio
Manager
New York Life Investment Management LLC
New York, New York
Subadvisors
Candriam Belgium*
Brussels, Belgium
Candriam France S.A.S.*
Paris, France
Cornerstone Capital Management Holdings LLC*
New York, New York
Cushing Asset Management, LP
Dallas, Texas
Eagle Asset Management, Inc.
St Petersburg, Florida
Epoch Investment Partners, Inc.
New York, New York
Janus Capital Management LLC
Denver, Colorado
MacKay Shields LLC*
New York, New York
Massachusetts Financial Services Company
Boston, Massachusetts
NYL Investors LLC*
New York, New York
Pacific Investment Management Company LLC
Newport Beach, California
T. Rowe Price Associates, Inc.
Baltimore, Maryland
Van Eck Associates Corporation
New York, New York
Winslow Capital Management, LLC
Minneapolis, Minnesota
Distributor
NYLIFE Distributors LLC*
Jersey City, New Jersey
Custodian
State Street Bank and Trust Company
Boston, Massachusetts
Independent Registered Public Accounting Firm
PricewaterhouseCoopers LLP
New York, New York
Legal Counsel
Dechert LLP
Washington, District of Columbia
Some Portfolios may not be available in all products.
* An affiliate of New York Life Investment Management LLC
Not part of the Semiannual Report
2017 Semiannual Report
This report is for the general information of New York Life Variable Annuities and NYLIAC Variable Universal Life Insurance Products policyowners. It must be preceded or accompanied by the appropriate product(s) and funds prospectuses if it is given to anyone who is not an owner of a New York Life variable annuity policy or a NYLIAC Variable Universal Life Insurance Product. This report does not offer for sale or solicit orders to purchase securities.
The performance data quoted in this report represents past performance. Past performance is no guarantee of future results. Due to market volatility and other factors, current performance may be lower or higher than the figures shown. The most recent month-end performance summary for your variable annuity or variable life policy is available by calling 800-598-2019 and is updated periodically on www.newyorklife.com.
The New York Life Variable Annuities and NYLIAC Variable Universal Life Insurance Products are issued by New York Life Insurance and Annuity Corporation (a Delaware Corporation) and distributed by NYLIFE Distributors LLC (Member FINRA/SIPC).
New York Life Insurance Company
New York Life Insurance and Annuity Corporation (NYLIAC) (A Delaware Corporation)
51 Madison Avenue, Room 551
New York, NY 10010
www.newyorklife.com
Printed on recycled paper
mainstayinvestments.com
NYLIFE Distributors LLC, 30 Hudson Street, Jersey City, NJ 07302
New York Life Investment Management LLC is the investment manager to the MainStay VP Funds Trust
©2017 by NYLIFE Distributors LLC. All rights reserved.
You may obtain copies of the Prospectus and the Statement of Additional Information free of charge, upon request, by calling toll-free 800-598-2019 or writing to New York Life Insurance and Annuity Corporation, 51 Madison Avenue, New York, NY 10010.
| | | | |
| Not FDIC Insured | | No Bank Guarantee | | May Lose Value |
| | | | |
1743294 | | | | MSVPUB10-08/17 (NYLIAC) NI532 |
MainStay VP Emerging Markets Equity Portfolio
Message from the President and Semiannual Report
Unaudited | June 30, 2017

Sign up for electronic delivery of your shareholder reports. For full details on electronic delivery, including who can participate and what you
can receive via eDelivery, please log on to www.newyorklife.com/vsc

This page intentionally left blank
Message from the President
The six months ended June 30, 2017, brought positive results to many stock and bond investors. The year began with many investors hoping that Republican control of the White House, the Senate and the House of Representatives could bring an end to political gridlock; and while debate has continued on a number of issues, the U.S. stock market climbed relatively steadily throughout the first half of 2017.
According to FTSE-Russell U.S. market data, stocks at all capitalization levels tended to record positive total returns during the reporting period, with large-cap stocks generally outperforming stocks of smaller-capitalization companies. Growth stocks outpaced value stocks at every capitalization level by substantial margins—from more than six percentage points for micro-caps and mid-caps to more than 10 percentage points for the largest 200 U.S. companies by market capitalization.
Most sectors of the stock market advanced during the reporting period, with energy and telecommunication services being notable exceptions. Energy stocks declined as oil prices fell despite moves by the Organization of Petroleum Exporting Countries (OPEC) intended to limit oil production by its members. Telecommunication services stocks tended to decline as competition increased and rising interest rates made dividend payouts less appealing.
In March and June of 2017, the Federal Reserve announced successive increases in the target range for the federal funds rate, ultimately bringing the federal funds target range to 1.00% to 1.25%. While short-term U.S. Treasury yields rose in response, yields for U.S. Treasury securities with maturities of five years or longer declined. As the difference between short- and long-term yields narrowed, the advantages of higher-yielding long-term bonds became increasingly apparent.
Virtually all taxable and tax-exempt bond sectors provided positive total returns during the reporting period. Mortgage-backed
securities, though providing positive total returns, faced headwinds when the Federal Reserve announced plans to begin normalizing its balance sheet by reducing reinvestment of principal payments on mortgage-backed securities.
International stock and bond markets were also strong during the reporting period. International stocks provided double-digit total returns that were surpassed by emerging-market stocks as a whole. Global investment-grade bonds provided single-digit returns; and emerging-market debt was somewhat stronger.
Even during periods of favorable market performance and generally positive returns, MainStay believes that it is important to carefully monitor your investments. Your risk tolerance may
change over time, leading you to reevaluate which MainStay VP Portfolios are most appropriate for your long-term goals. Your goals themselves may also change, leading you to pursue investments with more or less risk. The portfolio managers of MainStay VP Portfolios seek to provide results consistent with the investment objectives of their respective Portfolios, to give you a wide range of choices suitable to various investment needs.
The report that follows provides more detailed information about the specific markets, securities and investment decisions that influenced your MainStay VP Portfolio during the six months ended June 30, 2017. We invite you to review the report carefully as part of your ongoing investment evaluation and review.
Sincerely,

Stephen P. Fisher
President
The opinions expressed are as of the date of the accompanying report and are subject to change. Past performance is no guarantee of future results. There is no guarantee that any forecasts made will come to pass. This material does not constitute investment advice and is not intended as an endorsement of any specific investment.
Not all MainStay VP Portfolios and/or share classes are available under all policies.
Not part of the Semiannual Report
Table of Contents
Investors should refer to the Portfolio’s Summary Prospectus and/or Prospectus and consider the Portfolio’s investment objectives, strategies, risks, charges and expenses carefully before investing. The Summary Prospectus and/or Prospectus contain this and other information about the Portfolio. You may obtain copies of the Portfolio’s Summary Prospectus and/or the Prospectus and the Statement of Additional Information free of charge, upon request, by calling toll-free 800-598-2019, by writing to New York Life Insurance and Annuity Corporation, 51 Madison Avenue, Room 251, New York, New York 10010 or by sending an email to MainStayShareholdersServices@nylim.com. These documents are also available at mainstayinvestments.com/vpdocuments. Please read the Summary Prospectus and/or Prospectus carefully before investing. MainStay VP Funds Trust portfolios are separate account options which are purchased through a variable insurance or variable annuity contract.
Investment and Performance Comparison (Unaudited)
Performance data quoted represents past performance. Past performance is no guarantee of future results. Because of market volatility and other factors, current performance may be lower or higher than the figures shown. Investment return and principal value will fluctuate, and as a result, when shares are redeemed, they may be worth more or less than their original cost. The performance table and graph do not reflect any deduction of sales charges, mortality and expense charges, contract charges or administrative charges. Please refer to the Performance Summary appropriate for your policy. For performance information current to the most recent month-end, please call 800-598-2019 or visit www.newyorklife.com.
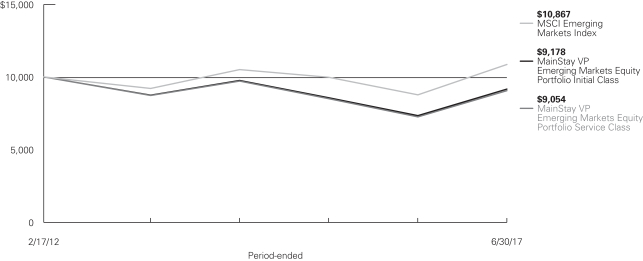
Average Annual Total Returns for the Period Ended June 30, 2017
| | | | | | | | | | | | | | | | | | |
| Class | | Inception Date | | Six Months | | One Year | | Five Years | | | Ten Years or Since Inception | | | Gross
Expense
Ratio1 | |
| Initial Class Shares | | 2/17/2012 | | 22.40% | | 24.97% | | | 0.81 | % | | | –1.58 | % | | | 1.36 | % |
| Service Class Shares | | 2/17/2012 | | 22.25 | | 24.65 | | | 0.55 | | | | –1.83 | | | | 1.61 | |
| | | | | | | | | | | | | | | | |
| Benchmark Performance | | Six
Months | | | One
Year | | | Five
Years | | | Ten Years or Since Inception | |
MSCI Emerging Markets Index2 | | | 18.43 | % | | | 23.75 | % | | | 3.96 | % | | | 1.56 | % |
Average Lipper Variable Products Emerging Markets Portfolio3 | | | 19.36 | | | | 22.90 | | | | 4.23 | | | | 2.04 | |
| 1. | The gross expense ratios presented reflect the Portfolio’s “Total Annual Portfolio Operating Expenses” from the most recent Prospectus and may differ from other expense ratios disclosed in this report. |
| 2. | The MSCI Emerging Markets Index is the Portfolio’s primary broad-based securities market index for comparison purposes. The MSCI Emerging Markets Index is a free float-adjusted market-capitalization index that is designed to measure equity market performance in the global emerging markets. Results assume reinvestment of all dividends and capital gains. An investment cannot be made directly in an index. |
| 3. | The Average Lipper Variable Products Emerging Markets Portfolio is representative of portfolios that, by portfolio practice, seek long-term capital appreciation by investing primarily in emerging market equity securities, where “emerging market” is defined by a country���s GNP per-capita or other economic measures. This benchmark is a product of Lipper Inc. Lipper Inc. is an independent monitor of fund performance. Results are based on average total returns of similar portfolios with all dividend and capital gain distributions reinvested. |
Cost in Dollars of a $1,000 Investment in MainStay VP Emerging Markets Equity Portfolio (Unaudited)
The example below is intended to describe the fees and expenses borne by shareholders during the six-month period from January 1, 2017 to June 30, 2017, and the impact of those costs on your investment.
Example
As a shareholder of the Portfolio, you incur two types of costs: (1) transaction costs, including exchange fees and sales charges (loads) on purchases (as applicable), and (2) ongoing costs, including management fees, distribution and/or service (12b-1) fees, and other Portfolio expenses (as applicable). This example is intended to help you understand your ongoing costs (in dollars) of investing in the Portfolio and to compare these costs with the ongoing costs of investing in other mutual funds. The example is based on an investment of $1,000 made at the beginning of the six-month period and held for the entire period from January 1, 2017 to June 30, 2017. Shares are only sold in connection with variable life and annuity contracts and the example does not reflect any contract level or transactional fees or expenses. If these costs had been included, your costs would have been higher.
This example illustrates your Portfolio’s ongoing costs in two ways:
Actual Expenses
The second and third data columns in the table below provide information about actual account values and actual expenses. You may use the information in these columns, together with the amount you invested, to estimate the expenses that you paid during the six months ended June 30, 2017. Simply divide your account value by $1,000 (for
example, an $8,600 account value divided by $1,000 = 8.6), then multiply the result by the number under the heading entitled “Expenses Paid During Period” to estimate the expenses you paid on your account during this period.
Hypothetical Example for Comparison Purposes
The fourth and fifth data columns in the table below provide information about hypothetical account values and hypothetical expenses based on the Portfolio’s actual expense ratio and an assumed rate of return of 5% per year before expenses, which is not the Portfolio’s actual return. The hypothetical account values and expenses may not be used to estimate the actual ending account balances or expenses you paid for the six-month period shown. You may use this information to compare the ongoing costs of investing in the Portfolio with the ongoing costs of investing in other mutual funds. To do so, compare this 5% hypothetical example with the 5% hypothetical examples that appear in the shareholder reports of the other mutual funds.
Please note that the expenses shown in the table are meant to highlight your ongoing costs only and do not reflect any transactional costs, such as exchange fees or sales charges (loads). Therefore, the fourth and fifth data columns of the table are useful in comparing ongoing costs only and will not help you determine the relative total costs of owning different funds. In addition, if these transactional costs were included, your costs would have been higher.
| | | | | | | | | | | | | | | | | | | | | | |
| | | | | | | | | | | | | | | | | | | |
| Share Class | | Beginning
Account
Value
1/1/17 | | | Ending Account
Value (Based
on Actual
Returns and
Expenses)
6/30/17 | | | Expenses
Paid
During
Period1 | | | Ending Account
Value (Based
on Hypothetical
5% Annualized
Return and
Actual Expenses)
6/30/17 | | | Expenses
Paid
During
Period1 | | Net Expense
Ratio
During
Period2 |
| | | | | | |
| Initial Class Shares | | $ | 1,000.00 | | | $ | 1,224.00 | | | $ | 7.11 | | | $ | 1,018.40 | | | $6.46 | | 1.29% |
| | | | | | |
| Service Class Shares | | $ | 1,000.00 | | | $ | 1,222.50 | | | $ | 8.49 | | | $ | 1,017.20 | | | $7.70 | | 1.54% |
| 1. | Expenses are equal to the Portfolio’s annualized expense ratio of each class multiplied by the average account value over the period, divided by 365 and multiplied by 181 (to reflect the six-month period). The table above represents the actual expenses incurred during the six-month period. |
| 2. | Expenses are equal to the Portfolio’s annualized expense ratio to reflect the six-month period. |
| | |
| 6 | | MainStay VP Emerging Markets Equity Portfolio |
Country Composition as of June 30, 2017 (Unaudited)
| | | | |
| China | | | 30.3 | % |
| Republic of Korea | | | 18.4 | |
| Taiwan | | | 10.7 | |
| India | | | 8.0 | |
| Brazil | | | 7.5 | |
| South Africa | | | 4.9 | |
| Mexico | | | 2.9 | |
| United States | | | 2.9 | |
| Indonesia | | | 2.1 | |
| Malaysia | | | 2.1 | |
| Russia | | | 1.8 | |
| Thailand | | | 1.5 | |
| Poland | | | 1.2 | |
| Turkey | | | 1.2 | |
| | | | |
| Hong Kong | | | 1.1 | % |
| Argentina | | | 0.6 | |
| Hungary | | | 0.6 | |
| Philippines | | | 0.6 | |
| United Arab Emirates | | | 0.6 | |
| Greece | | | 0.3 | |
| Chile | | | 0.1 | |
| Singapore | | | 0.1 | |
| Ukraine | | | 0.1 | |
| Colombia | | | 0.0 | ‡ |
| Egypt | | | 0.0 | ‡ |
| Other Assets, Less Liabilities | | | 0.4 | |
| | | | |
| | | 100.0 | % |
| | | | |
See Portfolio of Investments beginning on page 11 for specific holdings within these categories.
| ‡ | Less than one-tenth of a percent. |
Top Ten Holdings as of June 30, 2017 (excluding short-term investment) (Unaudited)
| 1. | Samsung Electronics Co., Ltd. |
| 3. | Taiwan Semiconductor Manufacturing Co., Ltd. |
| 4. | Alibaba Group Holding, Ltd., Sponsored ADR |
| 6. | China Construction Bank Corp. |
| 7. | Ping An Insurance Group Co. of China, Ltd. |
| 9. | Itau Unibanco Holding S.A. |
| 10. | Geely Automobile Holdings, Ltd. |
Portfolio Management Discussion and Analysis (Unaudited)
Answers to the questions reflect the views of portfolio managers Jeremy Roethel,1 CFA, and Andrew Ver Planck, CFA, of Cornerstone Capital Management Holdings LLC (“Cornerstone Holdings”), a Subadvisor of the Portfolio, and Jan Boudewijns, Philip Screve and Mohamed Lamine Saidi of Candriam Belgium (“Candriam”), a Subadvisor of the Portfolio.
How did MainStay VP Emerging Markets Equity Portfolio perform relative to its benchmark and peers for the six months ended June 30, 2017?
For the six months ended June 30, 2017, MainStay VP Emerging Markets Equity Portfolio returned 22.40% for Initial Class shares and 22.25% for Service Class shares. Over the same period, both share classes outperformed the 18.43% return of the MSCI Emerging Markets Index,2 which is the Portfolio’s benchmark, and the 19.36% return of the Average Lipper3 Variable Products Emerging Markets Portfolio.
What factors affected the Portfolio’s relative performance during the reporting period?
Candriam
The supportive environment worldwide for new-economy stocks—especially in Internet, technology and e-commerce—helped the portion of the Portfolio subadvised by Candriam outperform the MSCI Emerging Markets Index during the reporting period. U.S. sanctions prohibiting investment in a number of Russian stocks included in the benchmark had a favorable impact, as most of these companies performed poorly during the reporting period.
Factors that affected relative performance in this portion of the Portfolio related to our investment process. This process focuses on bottom-up selection of reasonably priced quality companies delivering strong and sustainable profitability in an environment of scarce global economic growth, and the process results in a structural tilt toward quality and growth stocks. Growth stocks, especially in a number of rapidly developing new-economy industries, substantially outperformed value stocks over the reporting period, and helped relative performance.
The relative outperformance of the Candriam portion of the Portfolio developed gradually over the first half of 2017. For the six months ended June 30, 2017, emerging markets consistently outperformed developed markets, the longest such run since 2008, as emerging markets showed limited sensitivity to geopolitical and macro risk.
Weaker commodity prices drove a rotation out of energy and materials stocks amid fading reflation hopes. This pushed investors even more in the direction of new-economy stocks that showed strong profitability trends. During the reporting period, our portion of the Portfolio reduced exposure to commodity-related stocks and increased exposure to new-economy stocks. Even so, we sought to maintain a balanced mix of stocks in our portion of the Portfolio.
Cornerstone Holdings
The portion of the Portfolio subadvised by Cornerstone Holdings outperformed the MSCI Emerging Markets Index primarily because of stock selection. Allocation effects—being overweight or underweight relative to the benchmark as a result of Cornerstone Holdings’ bottom-up stock-selection process—detracted modestly from relative performance across sectors but contributed positively across regions.
Which sectors were the strongest positive contributors to the Portfolio’s relative performance, and which sectors were particularly weak?
Candriam
In the portion of the Portfolio subadvised by Candriam, information technology made the strongest positive sector contribution to performance relative to the MSCI Emerging Markets Index. (Contributions take weightings and total returns into account.) The materials and health care sectors also provided strong positive contributions to relative performance in this portion of the Portfolio. Stock selection, positive total returns and overweight positions in all of these sectors added to the relative performance of this portion of the Portfolio.
In the Candriam portion of the Portfolio, consumer staples, real estate and telecommunication services made the weakest sector contributions relative to the MSCI Emerging Markets Index. The consumer staples sector provided a negative total return during the reporting period, while the real estate and telecommunication services sectors both provided positive total returns.
Cornerstone Holdings
In the portion of the Portfolio subadvised by Cornerstone Holdings, the strongest positive sector contributions to performance relative to the MSCI Emerging Markets Index came from information technology, consumer discretionary and financials. In each case, stock selection was the main driver of relative performance.
The weakest sector contribution to relative performance in the Cornerstone Holdings portion of the Portfolio came from real estate, primarily driven by an underweight position in this outperforming sector.
| 1. | Effective June 30, 2017, Jeremy Roethel no longer serves as a portfolio manager of the Portfolio. |
| 2. | See footnote on page 5 for more information on the MSCI Emerging Markets Index. |
| 3. | See footnote on page 5 for more information on Lipper Inc. |
| | |
| 8 | | MainStay VP Emerging Markets Equity Portfolio |
During the reporting period, which individual stocks made the strongest positive contributions to the Portfolio’s absolute performance and which stocks detracted the most?
Candriam
The strongest contributions to absolute performance in the Candriam portion of the Portfolio came from a number of leading emerging-markets information technology companies. Among these were Chinese provider of Internet, mobile and telecommunication services Tencent Holdings; Korean electrical equipment company Samsung Electronics; and Chinese e-commerce company Alibaba.
Tencent Holdings, China’s largest online user platform, performed strongly on solid top-line growth and better profitability from mobile online games, payment systems and performance ads. Shares of Samsung Electronics advanced because the company had relatively low multiples and rerated on the back of high dividend payouts and a share buyback. The company also benefited from its market-dominant position and new technology-driven market-share gains in semiconductors, memory and displays. Positions in Tencent Holdings and Samsung Electronics were capped because of risk concentration limits, but remained the largest holdings in the Candriam portion of the Portfolio. Shares in Alibaba rose as the e-commerce giant reaped the benefits of China’s consumption boom and the company’s data-driven personalization and marketing strategy. The Candriam portion of the Portfolio added to its position.
In the Candriam portion of the Portfolio, China-based oil and gas company Petrochina, Brazil-based oil and gas company Petrobras, and Tatarstan-based (Russian) oil producer Tatneft were among the weakest contributors to absolute performance. Each of these companies provided negative total returns as oil prices fell on concerns about oversupply from high U.S. rig counts and the inability of production cuts by the Organization of Petroleum Exporting Countries (OPEC) to lift prices. Petrochina and Petrobras are government-controlled entities.
Petrochina faced depressed share-price performance in the first half of 2017, largely because of lower earnings in 2016 and sensitivity to oil prices. The Candriam portion of the Portfolio maintained the position as a core oil and gas holding trading at what we viewed to be attractive exploration and production reserve valuations because the company could benefit from accelerating natural gas and state-owned enterprise reforms. Petrobras also suffered, not only from lower oil prices but also from rising country (Brazil) and foreign-exchange (debt reduction) risks. The Candriam portion of the Portfolio reduced its exposure to Petrobras but remained invested because at Candriam, we believed in the company’s long-term growth story. Tatneft suffered less than Petrobras, as the stock found support
from an increase in its dividend payout. The company continued to grow in upstream operations and to improve its product slate. The Candriam portion of the Portfolio added to its position in the stock.
Cornerstone Holdings
During the reporting period, the strongest contributor to absolute performance in the Cornerstone Holdings portion of the Portfolio was a long position in Chinese e-commerce company Alibaba, which continued to benefit from strong revenue growth and user engagement. A long position in consumer electronics and technology company Samsung rose on optimism surrounding the company’s semiconductor business and smart phone handset sales. A long position in Chinese Internet company Tencent Holdings also contributed positively to absolute performance in the Cornerstone Holdings portion of the Portfolio. The company reported strong earnings on the continued growth of mobile games; and online advertising revenue also contributed to the stock’s strong absolute performance.
The weakest contributor to absolute performance in the portion of the Portfolio subadvised by Cornerstone Holdings was a short position in TPK Holding, a Taiwan-based maker of touch screens. The company’s stock rallied on growing product demand, which helped drive strong earnings growth despite margins that have run below expectations. The Cornerstone Holdings portion of the Portfolio also held a short position in Brazil-based railway and port operator Rumo. The stock was also a significant drag on absolute performance because the stock performed well, driven by improvements in operating efficiencies that translated directly into better-than-expected earnings growth. In the Cornerstone Holdings portion of the Portfolio, a long position in vertically integrated Russian energy company Gazprom slumped in concert with falling crude oil prices during the reporting period.
Did the Portfolio make any significant purchases or sales during the reporting period?
Candriam
The Candriam portion of the Portfolio made significant purchases in state-owned insurance company China Life Insurance, Chinese automaker Geely Automobile and Chinese e-commerce leader Alibaba. China Life Insurance was added to the Candriam portion of the Portfolio on the back of the company’s continued agency expansion, productivity improvement and, in our view, a relatively conservative investment policy. Geely Automobile entered the Portfolio on improving sales and brand equity with the launch of higher-quality cars utilizing Volvo technology. These cars drove the company’s stock price higher. The position in Alibaba in the Candriam portion of the Portfolio was substantially increased as the company continued to reap the
benefits of China’s consumption boom and the company’s data-driven personalization and marketing strategies.
Significant sales in the Candriam portion of the Portfolio included Chinese solar glass manufacturer Xinyi Solar, Chinese sofa manufacturer and retailer Man Wah and Russian government-controlled diamond miner Alrosa. The position in Xinyi Solar was sold off as the market grew increasingly concerned that new manufacturing capacity coming on-stream could result in solar glass oversupply and suppress profit margins. Man Wah was divested from the Candriam portion of the Portfolio on growing concerns about lower U.S. sales, slow market growth and declining market share. The Candriam portion of the Portfolio sold shares of Alrosa because of our concerns about growing diamond supplies, sluggish retail demand and uncertainty about the company’s plans to start its own diamond cutting business.
Cornerstone Holdings
The Cornerstone Holdings portion of the Portfolio established new and overweight positions relative to the MSCI Emerging Markets Index in retail chain Wal-Mart de Mexico and steel maker POSCO. Cornerstone Holdings’ investment process viewed both companies favorably because of reasonable valuations and attractive earnings trends.
The Cornerstone Holdings portion of the Portfolio exited its positions in oil exploration & production company CNOOC and auto parts maker Hyundai Mobis. Cornerstone Holdings’ investment process viewed both companies as unattractive because their deteriorating earnings and price trends did not support then-current valuations.
How did the Portfolio’s sector weightings change during the reporting period?
Candriam
During the reporting period, the Candriam portion of the Portfolio substantially increased its weighing in the information
technology sector and increased its weightings to a lesser degree in the consumer discretionary and telecommunication services sectors. Over the same period, Candriam’s portion of the Portfolio substantially decreased its weighting in the materials sector and decreased its weightings to a lesser degree in the consumer staples and energy sectors.
Cornerstone Holdings
During the reporting period, the Cornerstone Holdings portion of the Portfolio modestly increased its weightings relative to the MSCI Emerging Markets Index in the materials and information technology sectors. Over the same period, the Cornerstone Holdings portion of the Portfolio modestly reduced its weightings relative to the Index in energy and industrials.
How was the Portfolio positioned at the end of the reporting period?
Candriam
As of June 30, 2017, the most substantially overweight sectors relative to the MSCI Emerging Markets Index in the portion of the Portfolio subadvised by Candriam were information technology, health care and materials. As of the same date, the most substantially underweight sectors in the Candriam portion of the Portfolio were financials, consumer staples and telecommunications services.
Cornerstone Holdings
As of June 30, 2017, the portion of the Portfolio subadvised by Cornerstone Holdings held modestly overweight positions relative to the MSCI Emerging Markets Index in the information technology and financials sectors. As of the same date, the Cornerstone Holdings portion of the Portfolio held modestly underweight positions relative to the Index in consumer discretionary and consumer staples.
The opinions expressed are those of the portfolio managers as of the date of this report and are subject to change. There is no guarantee that any forecasts made will come to pass. This material does not constitute investment advice and is not intended as an endorsement of any specific investment.
Not all MainStay VP Portfolios and/or share classes are available under all policies.
| | |
| 10 | | MainStay VP Emerging Markets Equity Portfolio |
Portfolio of Investments June 30, 2017 (Unaudited)
| | | | | | | | |
| | |
| | | Shares | | | Value | |
| | | | | | | | |
| Common Stocks 90.9%† | | | | | | | | |
Argentina 0.6% | | | | | | | | |
Grupo Financiero Galicia S.A., ADR (Banks) | | | 40,000 | | | $ | 1,705,600 | |
Pampa Energia S.A., Sponsored ADR (Electric Utilities) (a) | | | 32,000 | | | | 1,883,200 | |
| | | | | | | | |
| | | | | | | 3,588,800 | |
| | | | | | | | |
Brazil 3.6% | | | | | | | | |
Banco Bradesco S.A. (Banks) | | | 47,700 | | | | 397,392 | |
Banco do Brasil S.A. (Banks) | | | 258,800 | | | | 2,093,586 | |
Banco Santander Brasil S.A. (Banks) | | | 133,000 | | | | 1,003,652 | |
Cia de Saneamento Basico do Estado de Sao Paulo (Water Utilities) | | | 273,100 | | | | 2,609,903 | |
EcoRodovias Infraestrutura e Logistica S.A. (Transportation Infrastructure) | | | 750,000 | | | | 2,343,113 | |
Equatorial Energia S.A. (Electric Utilities) | | | 80,000 | | | | 1,308,340 | |
JBS S.A. (Food Products) | | | 39,800 | | | | 78,449 | |
Kroton Educacional S.A. (Diversified Consumer Services) | | | 390,000 | | | | 1,750,521 | |
Lojas Renner S.A. (Multiline Retail) | | | 240,000 | | | | 1,983,519 | |
M Dias Branco S.A. (Food Products) | | | 4,800 | | | | 71,430 | |
Magazine Luiza S.A. (Multiline Retail) | | | 11,300 | | | | 873,193 | |
Petroleo Brasileiro S.A. (Oil, Gas & Consumable Fuels) (a) | | | 17,500 | | | | 69,727 | |
QGEP Participacoes S.A. (Oil, Gas & Consumable Fuels) | | | 53,900 | | | | 97,618 | |
Qualicorp S.A. (Health Care
Providers & Services) | | | 138,100 | | | | 1,196,375 | |
Rumo S.A. (Road & Rail) (a) | | | 600,000 | | | | 1,566,603 | |
Smiles S.A. (Media) | | | 31,800 | | | | 579,578 | |
TIM Participacoes S.A. (Wireless Telecommunication Services) | | | 500,000 | | | | 1,477,557 | |
Vale S.A. (Metals & Mining) | | | 89,600 | | | | 784,328 | |
Wiz Solucoes e Corretagem de Seguros
S.A. (Insurance) | | | 41,700 | | | | 231,604 | |
| | | | | | | | |
| | | | | | | 20,516,488 | |
| | | | | | | | |
Chile 0.1% | | | | | | | | |
Enel Americas S.A. (Electric Utilities) | | | 1,724,590 | | | | 327,317 | |
| | | | | | | | |
| | |
China 30.3% | | | | | | | | |
AAC Technologies Holdings, Inc. (Electronic Equipment, Instruments & Components) | | | 150,000 | | | | 1,875,132 | |
Agricultural Bank of China, Ltd. Class H (Banks) | | | 5,083,000 | | | | 2,402,355 | |
¨Alibaba Group Holding, Ltd., Sponsored ADR (Internet Software & Services) (a) | | | 144,900 | | | | 20,416,410 | |
Anhui Conch Cement Co., Ltd. Class H (Construction Materials) | | | 1,172,500 | | | | 4,077,308 | |
Autohome, Inc., ADR (Internet Software & Services) (a) | | | 47,000 | | | | 2,131,920 | |
| | | | | | | | |
| | |
| | | Shares | | | Value | |
| | | | | | | | |
China (continued) | | | | | | | | |
Baidu, Inc., Sponsored ADR (Internet Software & Services) (a) | | | 6,800 | | | $ | 1,216,248 | |
Bank of China, Ltd. Class H (Banks) | | | 1,950,000 | | | | 956,586 | |
Beijing Enterprises Water Group, Ltd. (Water Utilities) (a) | | | 3,100,000 | | | | 2,406,163 | |
Brilliance China Automotive Holdings, Ltd. (Automobiles) | | | 1,740,000 | | | | 3,169,127 | |
BYD Electronic International Co., Ltd. (Communications Equipment) | | | 134,000 | | | | 265,685 | |
China Agri-Industries Holdings, Ltd. (Food Products) | | | 474,000 | | | | 196,704 | |
China Communications Construction Co., Ltd. Class H (Construction & Engineering) | | | 1,530,000 | | | | 1,971,425 | |
China Communications Services Corp., Ltd. Class H (Diversified Telecommunication Services) | | | 2,110,000 | | | | 1,216,146 | |
¨China Construction Bank Corp. Class H (Banks) | | | 12,685,100 | | | | 9,829,695 | |
China Everbright Greentech, Ltd. (Independent Power & Renewable Electricity Producers) (a)(c) | | | 17,901 | | | | 12,129 | |
China Everbright International, Ltd. (Commercial Services & Supplies) | | | 1,700,000 | | | | 2,120,795 | |
China Huarong Asset Management Co., Ltd. Class H (Capital Markets) (c) | | | 860,000 | | | | 334,860 | |
China Life Insurance Co., Ltd. Class H (Insurance) | | | 1,320,000 | | | | 4,032,302 | |
China Lumena New Materials Corp. (Chemicals) (a)(b)(d) | | | 260,000 | | | | 0 | |
China Merchants Bank Co., Ltd. Class H (Banks) | | | 1,400,000 | | | | 4,222,890 | |
China Mobile, Ltd. (Wireless Telecommunication Services) | | | 505,000 | | | | 5,358,888 | |
China National Building Material Co., Ltd. Class H (Construction Materials) | | | 2,928,000 | | | | 1,740,123 | |
China Petroleum & Chemical Corp. Class H (Oil, Gas & Consumable Fuels) | | | 7,038,000 | | | | 5,489,810 | |
China Railway Construction Corp., Ltd. Class H (Construction & Engineering) | | | 1,744,000 | | | | 2,273,972 | |
China Shenhua Energy Co., Ltd. Class H (Oil, Gas & Consumable Fuels) | | | 838,500 | | | | 1,866,567 | |
China State Construction International Holdings, Ltd. (Construction & Engineering) | | | 1,500,000 | | | | 2,566,779 | |
China Telecom Corp., Ltd. Class H (Diversified Telecommunication Services) | | | 2,616,000 | | | | 1,243,090 | |
China Vanke Co., Ltd. Class H (Real Estate Management & Development) | | | 215,100 | | | | 608,868 | |
China Yongda Automobiles Services Holdings, Ltd. (Specialty Retail) | | | 13,000 | | | | 13,204 | |
| † | Percentages indicated are based on Portfolio net assets. |
| ¨ | | Among the Portfolio’s 10 largest holdings, as of June 30, 2017, excluding short-term investment. May be subject to change daily. |
| | | | | | |
The notes to the financial statements are an integral part of,
and should be read in conjunction with, the financial statements. | | | | | 11 | |
Portfolio of Investments June 30, 2017 (Unaudited) (continued)
| | | | | | | | |
| | |
| | | Shares | | | Value | |
| | | | | | | | |
| Common Stocks (continued) | |
China (continued) | | | | | | | | |
CSPC Pharmaceutical Group, Ltd. (Pharmaceuticals) | | | 1,600,000 | | | $ | 2,336,230 | |
Dongfeng Motor Group Co., Ltd. Class H (Automobiles) | | | 1,106,000 | | | | 1,307,518 | |
ENN Energy Holdings, Ltd. (Gas Utilities) | | | 264,000 | | | | 1,592,633 | |
Fuyao Glass Industry Group Co., Ltd. Class H (Auto Components) (c) | | | 500,000 | | | | 1,914,838 | |
¨Geely Automobile Holdings, Ltd. (Automobiles) | | | 2,840,000 | | | | 6,125,636 | |
Guangzhou Automobile Group Co., Ltd. Class H (Automobiles) | | | 900,000 | | | | 1,579,261 | |
Haitian International Holdings, Ltd. (Machinery) | | | 168,000 | | | | 471,242 | |
Hisense Kelon Electrical Holdings Co., Ltd. Class H (Household Durables) | | | 476,000 | | | | 810,866 | |
Huaneng Renewables Corp., Ltd. Class H (Independent Power & Renewable Electricity Producers) | | | 6,500,000 | | | | 2,006,417 | |
Industrial & Commercial Bank of China, Ltd. Class H (Banks) | | | 6,002,000 | | | | 4,051,328 | |
Jiangxi Copper Co., Ltd. Class H (Metals & Mining) | | | 331,000 | | | | 543,509 | |
Kingsoft Corp., Ltd. (Software) | | | 750,000 | | | | 1,954,864 | |
MMG, Ltd. (Metals & Mining) (a) | | | 6,000,000 | | | | 2,213,271 | |
Momo, Inc., Sponsored ADR (Internet Software & Services) (a) | | | 59,200 | | | | 2,188,032 | |
NetEase, Inc., ADR (Internet Software & Services) | | | 8,400 | | | | 2,525,292 | |
PetroChina Co., Ltd. Class H (Oil, Gas & Consumable Fuels) | | | 4,400,000 | | | | 2,693,837 | |
¨Ping An Insurance Group Co. of China, Ltd. Class H (Insurance) | | | 1,202,500 | | | | 7,924,306 | |
Shanghai Fosun Pharmaceutical Group Co., Ltd. Class H (Pharmaceuticals) | | | 520,000 | | | | 2,014,742 | |
Shanghai Industrial Holdings, Ltd. (Industrial Conglomerates) | | | 345,000 | | | | 1,020,756 | |
Sihuan Pharmaceutical Holdings Group, Ltd. (Pharmaceuticals) | | | 3,321,000 | | | | 1,390,937 | |
Silergy Corp. (Semiconductors & Semiconductor Equipment) | | | 100,000 | | | | 1,926,364 | |
Sinotruk Hong Kong, Ltd. (Machinery) | | | 670,500 | | | | 486,937 | |
Sunny Optical Technology Group Co., Ltd. (Electronic Equipment, Instruments & Components) | | | 260,000 | | | | 2,331,107 | |
TAL Education Group, ADR (Diversified Consumer Services) | | | 17,000 | | | | 2,079,270 | |
¨Tencent Holdings, Ltd. (Internet Software & Services) | | | 718,100 | | | | 25,679,770 | |
Weibo Corp., Sponsored ADR (Internet Software & Services) (a) | | | 37,500 | | | | 2,492,625 | |
Weichai Power Co., Ltd. Class H (Machinery) | | | 1,589,000 | | | | 1,392,101 | |
| | | | | | | | |
| | |
| | | Shares | | | Value | |
| | | | | | | | |
China (continued) | | | | | | | | |
Weiqiao Textile Co., Ltd. Class H (Textiles, Apparel & Luxury Goods) (a)(b)(d) | | | 205,000 | | | $ | 146,776 | |
Xingda International Holdings, Ltd. (Auto Components) | | | 346,000 | | | | 140,041 | |
Yanzhou Coal Mining Co., Ltd. Class H (Oil, Gas & Consumable Fuels) | | | 1,504,000 | | | | 1,348,456 | |
YY, Inc., ADR (Internet Software & Services) (a) | | | 30,200 | | | | 1,752,506 | |
Zhejiang Expressway Co., Ltd. Class H (Transportation Infrastructure) | | | 210,000 | | | | 274,353 | |
Zhongsheng Group Holdings, Ltd. (Specialty Retail) | | | 352,000 | | | | 656,440 | |
ZTE Corp. Class H (Communications Equipment) (a) | | | 850,000 | | | | 2,029,344 | |
| | | | | | | | |
| | | | | | | 173,416,786 | |
| | | | | | | | |
Colombia 0.0%‡ | | | | | | | | |
Ecopetrol S.A. (Oil, Gas & Consumable Fuels) | | | 276,391 | | | | 125,159 | |
| | | | | | | | |
| | |
Egypt 0.0%‡ | | | | | | | | |
Telecom Egypt Co. (Diversified Telecommunication Services) | | | 431,179 | | | | 246,048 | |
| | | | | | | | |
| | |
Greece 0.3% | | | | | | | | |
FF Group (Specialty Retail) (a) | | | 13,545 | | | | 331,067 | |
Motor Oil Hellas Corinth Refineries S.A. (Oil, Gas & Consumable Fuels) | | | 10,684 | | | | 232,706 | |
Mytilineos Holdings S.A. (Industrial Conglomerates) (a) | | | 53,127 | | | | 501,208 | |
OPAP S.A. (Hotels, Restaurants & Leisure) | | | 42,030 | | | | 475,245 | |
| | | | | | | | |
| | | | | | | 1,540,226 | |
| | | | | | | | |
Hong Kong 1.1% | | | | | | | | |
China Metal Recycling Holdings, Ltd. (Metals & Mining) (a)(b)(d) | | | 75,000 | | | | 0 | |
Haier Electronics Group Co., Ltd. (Household Durables) (a) | | | 900,000 | | | | 2,340,073 | |
Nine Dragons Paper Holdings, Ltd. (Paper & Forest Products) | | | 1,417,000 | | | | 1,887,530 | |
Shimao Property Holdings, Ltd. (Real Estate Management & Development) | | | 900,000 | | | | 1,540,067 | |
Sun Art Retail Group, Ltd. (Food & Staples Retailing) | | | 82,500 | | | | 65,726 | |
Texhong Textile Group, Ltd. (Textiles, Apparel & Luxury Goods) | | | 306,000 | | | | 381,351 | |
| | | | | | | | |
| | | | | | | 6,214,747 | |
| | | | | | | | |
Hungary 0.6% | | | | | | | | |
MOL Hungarian Oil & Gas PLC (Oil, Gas & Consumable Fuels) | | | 15,788 | | | | 1,239,226 | |
OTP Bank PLC (Banks) | | | 24,102 | | | | 806,635 | |
Richter Gedeon Nyrt (Pharmaceuticals) | | | 47,348 | | | | 1,237,406 | |
| | | | | | | | |
| | | | | | | 3,283,267 | |
| | | | | | | | |
| | | | |
| 12 | | MainStay VP Emerging Markets Equity Portfolio | | The notes to the financial statements are an integral part of,
and should be read in conjunction with, the financial statements. |
| | | | | | | | |
| | |
| | | Shares | | | Value | |
| | | | | | | | |
| Common Stocks (continued) | |
India 8.0% | | | | | | | | |
Adani Enterprises, Ltd. (Trading
Companies & Distributors) (a) | | | 311,596 | | | $ | 639,221 | |
Adani Ports & Special Economic Zone, Ltd. (Transportation Infrastructure) (a) | | | 520,000 | | | | 2,935,571 | |
Bajaj Finance, Ltd. (Consumer Finance) | | | 24,000 | | | | 510,001 | |
Balrampur Chini Mills, Ltd. (Food Products) | | | 366,958 | | | | 858,956 | |
Bharat Petroleum Corp., Ltd. (Oil, Gas & Consumable Fuels) | | | 210,000 | | | | 2,073,115 | |
Chennai Petroleum Corp., Ltd. (Oil, Gas & Consumable Fuels) | | | 78,680 | | | | 430,907 | |
Dewan Housing Finance Corp., Ltd. (Thrifts & Mortgage Finance) | | | 116,641 | | | | 787,682 | |
Eicher Motors, Ltd. (Machinery) (a) | | | 3,700 | | | | 1,546,115 | |
Gail India, Ltd. (Gas Utilities) | | | 44,312 | | | | 248,168 | |
Godrej Consumer Products, Ltd. (Personal Products) (a)(d) | | | 14,000 | | | | 210,073 | |
Godrej Consumer Products, Ltd. (Personal Products) | | | 20,000 | | | | 300,104 | |
HCL Technologies, Ltd. (IT Services) | | | 17,355 | | | | 228,599 | |
Hindustan Petroleum Corp., Ltd. (Oil, Gas & Consumable Fuels) | | | 221,579 | | | | 1,746,922 | |
Housing Development Finance Corp., Ltd. (Thrifts & Mortgage Finance) | | | 23,860 | | | | 595,010 | |
Indiabulls Housing Finance, Ltd. (Thrifts & Mortgage Finance) | | | 166,797 | | | | 2,792,745 | |
Indian Bank (Banks) | | | 178,041 | | | | 778,133 | |
Indian Oil Corp., Ltd. (Oil, Gas &
Consumable Fuels) | | | 185,950 | | | | 1,104,552 | |
ITC, Ltd. (Tobacco) | | | 75,156 | | | | 375,562 | |
Jammu & Kashmir Bank, Ltd. (Banks) | | | 44,113 | | | | 58,010 | |
Jubilant Life Sciences, Ltd. (Pharmaceuticals) | | | 4,430 | | | | 46,879 | |
Karnataka Bank, Ltd. (Banks) | | | 196,904 | | | | 495,173 | |
KEC International, Ltd. (Construction & Engineering) (a) | | | 48,867 | | | | 194,674 | |
Mahindra & Mahindra, Ltd. (Automobiles) | | | 20,000 | | | | 419,261 | |
Mangalore Refinery & Petrochemicals, Ltd. (Oil, Gas & Consumable Fuels) (a) | | | 345,095 | | | | 633,197 | |
Maruti Suzuki India, Ltd. (Automobiles) | | | 4,319 | | | | 481,179 | |
Motherson Sumi Systems, Ltd.
(Auto Components) (a) | | | 350,000 | | | | 2,501,644 | |
National Aluminium Co., Ltd. (Metals & Mining) | | | 444,431 | | | | 444,517 | |
NTPC, Ltd. (Independent Power & Renewable Electricity Producers) | | | 13,167 | | | | 32,399 | |
Oil & Natural Gas Corp., Ltd. (Oil, Gas & Consumable Fuels) | | | 1,119,534 | | | | 2,724,466 | |
Petronet LNG, Ltd. (Oil, Gas & Consumable Fuels) | | | 390,000 | | | | 2,593,866 | |
Power Finance Corp., Ltd. (Diversified Financial Services) | | | 875,077 | | | | 1,668,586 | |
| | | | | | | | |
| | |
| | | Shares | | | Value | |
| | | | | | | | |
India (continued) | | | | | | | | |
Power Grid Corp. of India, Ltd.
(Electric Utilities) | | | 730,000 | | | $ | 2,376,206 | |
Reliance Capital, Ltd. (Diversified
Financial Services) | | | 28,269 | | | | 281,542 | |
Reliance Industries, Ltd. (Oil, Gas & Consumable Fuels) (a) | | | 36,242 | | | | 775,443 | |
Rural Electrification Corp., Ltd. (Diversified Financial Services) | | | 650,289 | | | | 1,730,415 | |
Shree Cement, Ltd. (Construction Materials) | | | 7,400 | | | | 1,946,239 | |
Tata Motors, Ltd. Class A (Automobiles) | | | 140,082 | | | | 572,139 | |
Union Bank of India (Banks) (a) | | | 354,434 | | | | 808,803 | |
Vardhman Textiles, Ltd. (Textiles, Apparel & Luxury Goods) (a) | | | 3,603 | | | | 63,546 | |
Vedanta, Ltd. (Metals & Mining) | | | 997,810 | | | | 3,839,185 | |
Yes Bank, Ltd. (Banks) | | | 130,000 | | | | 2,948,242 | |
| | | | | | | | |
| | | | | | | 45,797,047 | |
| | | | | | | | |
Indonesia 2.1% | | | | | | | | |
PT Adaro Energy Tbk (Oil, Gas & Consumable Fuels) | | | 1,957,500 | | | | 232,065 | |
PT Bank Negara Indonesia Persero Tbk (Banks) | | | 1,661,700 | | | | 822,902 | |
PT Bank Rakyat Indonesia Persero Tbk (Banks) | | | 3,200,000 | | | | 3,661,602 | |
PT Indo Tambangraya Megah Tbk (Oil, Gas & Consumable Fuels) | | | 595,000 | | | | 772,350 | |
PT Indofood Sukses Makmur Tbk (Food Products) | | | 1,251,700 | | | | 807,700 | |
PT Telekomunikasi Indonesia Persero Tbk (Diversified Telecommunication Services) | | | 6,363,200 | | | | 2,158,069 | |
PT United Tractors Tbk (Oil, Gas & Consumable Fuels) | | | 1,685,500 | | | | 3,471,542 | |
| | | | | | | | |
| | | | | | | 11,926,230 | |
| | | | | | | | |
Malaysia 2.1% | | | | | | | | |
AirAsia BHD (Airlines) | | | 2,328,500 | | | | 1,762,926 | |
CIMB Group Holdings BHD (Banks) | | | 2,699,300 | | | | 4,137,629 | |
Genting BHD (Hotels, Restaurants & Leisure) | | | 135,500 | | | | 297,032 | |
Hartalega Holdings BHD (Health Care Equipment & Supplies) | | | 400,000 | | | | 687,687 | |
Kuala Lumpur Kepong BHD (Food Products) | | | 191,400 | | | | 1,109,346 | |
Malayan Banking BHD (Banks) | | | 644,000 | | | | 1,444,730 | |
My EG Services BHD (IT Services) | | | 4,750,000 | | | | 2,423,328 | |
| | | | | | | | |
| | | | | | | 11,862,678 | |
| | | | | | | | |
Mexico 2.9% | | | | | | | | |
America Movil S.A.B. de C.V. Series L (Wireless Telecommunication Services) | | | 1,995,600 | | | | 1,600,988 | |
Arca Continental S.A.B. de C.V. (Beverages) | | | 137,400 | | | | 1,033,637 | |
Cemex S.A.B. de C.V. (Construction Materials) (a) | | | 2,800,000 | | | | 2,635,113 | |
Coca-Cola FEMSA S.A.B. de C.V. Series L (Beverages) | | | 77,000 | | | | 652,954 | |
| | | | | | |
The notes to the financial statements are an integral part of,
and should be read in conjunction with, the financial statements. | | | | | 13 | |
Portfolio of Investments June 30, 2017 (Unaudited) (continued)
| | | | | | | | |
| | |
| | | Shares | | | Value | |
| | | | | | | | |
| Common Stocks (continued) | |
Mexico (continued) | | | | | | | | |
Fibra Uno Administracion S.A. de C.V. (Equity Real Estate Investment Trusts (REITs)) | | | 117,500 | | | $ | 222,327 | |
Fomento Economico Mexicano S.A.B.
de C.V. (Beverages) | | | 143,300 | | | | 1,411,227 | |
Gruma S.A.B. de C.V. Class B (Food Products) | | | 110,000 | | | | 1,435,129 | |
Grupo Financiero Banorte S.A.B. de C.V. Class O (Banks) | | | 268,000 | | | | 1,700,404 | |
Grupo Mexico S.A.B. de C.V. Series B (Metals & Mining) | | | 450,000 | | | | 1,264,302 | |
OHL Mexico S.A.B. de C.V. (Transportation Infrastructure) | | | 1,051,475 | | | | 1,516,778 | |
Qualitas Controladora S.A.B. de C.V. (Insurance) | | | 24,100 | | | | 40,169 | |
Unifin Financiera SAPI de C.V. SOFOM ENR (Consumer Finance) | | | 450,000 | | | | 1,235,788 | |
Wal-Mart de Mexico S.A.B. de C.V. (Food & Staples Retailing) | | | 888,300 | | | | 2,059,627 | |
| | | | | | | | |
| | | | | | | 16,808,443 | |
| | | | | | | | |
Philippines 0.6% | | | | | | | | |
Ayala Land, Inc. (Real Estate
Management & Development) | | | 2,500,000 | | | | 1,969,382 | |
International Container Terminal Services, Inc. (Transportation Infrastructure) | | | 720,000 | | | | 1,395,482 | |
SM Prime Holdings, Inc. (Real Estate Management & Development) | | | 309,400 | | | | 202,342 | |
| | | | | | | | |
| | | | | | | 3,567,206 | |
| | | | | | | | |
Poland 1.2% | | | | | | | | |
Enea S.A. (Electric Utilities) (a) | | | 86,170 | | | | 310,669 | |
Polskie Gornictwo Naftowe i Gazownictwo S.A. (Oil, Gas & Consumable Fuels) | | | 779,432 | | | | 1,329,324 | |
Powszechny Zaklad Ubezpieczen
S.A. (Insurance) | | | 386,088 | | | | 4,645,788 | |
Synthos S.A. (Chemicals) | | | 218,202 | | | | 285,585 | |
Tauron Polska Energia S.A. (Electric Utilities) (a) | | | 552,010 | | | | 533,293 | |
| | | | | | | | |
| | | | | | | 7,104,659 | |
| | | | | | | | |
Republic of Korea 16.5% | | | | | | | | |
BGF retail Co., Ltd. (Food & Staples Retailing) | | | 19,000 | | | | 1,677,228 | |
DGB Financial Group, Inc. (Banks) | | | 111,287 | | | | 1,147,740 | |
Dongwon Industries Co., Ltd. (Food Products) | | | 244 | | | | 68,883 | |
E-MART, Inc. (Food & Staples Retailing) | | | 6,347 | | | | 1,300,853 | |
Hana Financial Group, Inc. (Banks) | | | 21,718 | | | | 858,925 | |
Hansol Chemical Co., Ltd. (Chemicals) | | | 12,500 | | | | 775,685 | |
Hanwha Chemical Corp. (Chemicals) | | | 69,998 | | | | 1,847,607 | |
Hanwha Corp. (Industrial Conglomerates) | | | 16,290 | | | | 674,864 | |
Hyundai Engineering & Construction Co., Ltd. (Construction & Engineering) | | | 46,000 | | | | 1,851,418 | |
Hyundai Heavy Industries Co., Ltd. (Machinery) (a) | | | 1,737 | | | | 267,955 | |
| | | | | | | | |
| | |
| | | Shares | | | Value | |
| | | | | | | | |
Republic of Korea (continued) | | | | | | | | |
Hyundai Marine & Fire Insurance Co., Ltd. (Insurance) | | | 50,500 | | | $ | 1,736,813 | |
Hyundai Motor Co. (Automobiles) | | | 17,596 | | | | 2,452,967 | |
Hyundai Robotics Co., Ltd. (Semiconductors & Semiconductor Equipment) (a) | | | 6,200 | | | | 2,094,393 | |
Industrial Bank of Korea (Banks) | | | 139,458 | | | | 1,736,902 | |
KB Financial Group, Inc. (Banks) | | | 110,208 | | | | 5,557,839 | |
Koh Young Technology, Inc. (Semiconductors & Semiconductor Equipment) | | | 30,000 | | | | 1,573,220 | |
Korea Zinc Co., Ltd. (Metals & Mining) | | | 4,700 | | | | 1,873,181 | |
LG Display Co., Ltd. (Electronic Equipment, Instruments & Components) | | | 56,172 | | | | 1,821,423 | |
LG Electronics, Inc. (Household Durables) | | | 28,577 | | | | 2,003,125 | |
LG Innotek Co., Ltd. (Electronic Equipment, Instruments & Components) | | | 17,500 | | | | 2,523,708 | |
LG Uplus Corp. (Diversified Telecommunication Services) | | | 220,095 | | | | 3,000,902 | |
Lotte Chemical Corp. (Chemicals) | | | 4,022 | | | | 1,209,254 | |
Mirae Asset Daewoo Co., Ltd. (Capital Markets) | | | 320,000 | | | | 3,090,504 | |
Modetour Network, Inc. (Hotels, Restaurants & Leisure) | | | 49,295 | | | | 1,363,621 | |
NAVER Corp. (Internet Software & Services) | | | 3,100 | | | | 2,270,507 | |
NCSoft Corp. (Software) | | | 8,000 | | | | 2,653,498 | |
Osstem Implant Co., Ltd. (Health Care Equipment & Supplies) (a) | | | 28,000 | | | | 1,282,349 | |
POSCO (Metals & Mining) | | | 14,406 | | | | 3,613,619 | |
Samsung Biologics Co., Ltd. (Life Sciences Tools & Services) (a) | | | 9,500 | | | | 2,424,507 | |
¨Samsung Electronics Co., Ltd. (Technology Hardware, Storage & Peripherals) | | | 12,336 | | | | 25,628,346 | |
Samsung SDI Co., Ltd. (Electronic Equipment, Instruments & Components) | | | 6,000 | | | | 899,358 | |
Shinhan Financial Group Co., Ltd. (Banks) | | | 44,445 | | | | 1,915,080 | |
¨SK Hynix, Inc. (Semiconductors & Semiconductor Equipment) | | | 134,494 | | | | 7,922,821 | |
SK Innovation Co., Ltd. (Oil, Gas & Consumable Fuels) | | | 2,558 | | | | 354,362 | |
SK Materials Co., Ltd. (Chemicals) | | | 6,000 | | | | 1,038,325 | |
SK Telecom Co., Ltd. (Wireless Telecommunication Services) | | | 7,981 | | | | 1,855,479 | |
SL Corp. (Auto Components) | | | 5,348 | | | | 100,963 | |
| | | | | | | | |
| | | | | | | 94,468,224 | |
| | | | | | | | |
Russia 1.8% | | | | | | | | |
Gazprom PJSC, Sponsored ADR (Oil, Gas & Consumable Fuels) | | | 225,000 | | | | 890,550 | |
Tatneft PJSC (Oil, Gas & Consumable Fuels) (a) | | | 400,000 | | | | 2,540,059 | |
United Co. Rusal PLC (Metals & Mining) | | | 4,200,000 | | | | 2,054,961 | |
| | | | |
| 14 | | MainStay VP Emerging Markets Equity Portfolio | | The notes to the financial statements are an integral part of,
and should be read in conjunction with, the financial statements. |
| | | | | | | | |
| | |
| | | Shares | | | Value | |
| | | | | | | | |
| Common Stocks (continued) | |
Russia (continued) | | | | | | | | |
X5 Retail Group N.V., GDR (Food & Staples Retailing) (a) | | | 36,000 | | | $ | 1,247,400 | |
Yandex N.V. Class A (Internet Software & Services) (a) | | | 135,000 | | | | 3,542,400 | |
| | | | | | | | |
| | | | | | | 10,275,370 | |
| | | | | | | | |
Singapore 0.1% | | | | | | | | |
IGG, Inc. (Software) | | | 516,000 | | | | 797,054 | |
| | | | | | | | |
| | |
South Africa 4.9% | | | | | | | | |
AngloGold Ashanti, Ltd. (Metals & Mining) | | | 80,000 | | | | 782,725 | |
Assore, Ltd. (Metals & Mining) | | | 4,237 | | | | 63,109 | |
Barclays Africa Group, Ltd. (Banks) | | | 189,529 | | | | 2,082,537 | |
Bid Corp., Ltd. (Food & Staples Retailing) | | | 19,801 | | | | 452,884 | |
Capitec Bank Holdings, Ltd. (Banks) | | | 44,000 | | | | 2,791,515 | |
Exxaro Resources, Ltd. (Oil, Gas & Consumable Fuels) | | | 261,609 | | | | 1,859,709 | |
FirstRand, Ltd. (Diversified Financial Services) | | | 818,494 | | | | 2,949,894 | |
Growthpoint Properties, Ltd. (Equity Real Estate Investment Trusts (REITs)) | | | 351,071 | | | | 656,925 | |
Liberty Holdings, Ltd. (Insurance) | | | 120,796 | | | | 1,038,758 | |
Murray & Roberts Holdings, Ltd. (Construction & Engineering) | | | 12,575 | | | | 12,563 | |
¨Naspers, Ltd. Class N (Media) | | | 57,829 | | | | 11,249,746 | |
Nedbank Group, Ltd. (Banks) | | | 73,893 | | | | 1,179,294 | |
Standard Bank Group, Ltd. (Banks) | | | 230,070 | | | | 2,533,100 | |
Sun International, Ltd. (Hotels,
Restaurants & Leisure) | | | 13,608 | | | | 57,397 | |
Telkom S.A. SOC, Ltd. (Diversified Telecommunication Services) | | | 32,577 | | | | 153,267 | |
Tsogo Sun Holdings, Ltd. (Hotels, Restaurants & Leisure) | | | 213,093 | | | | 365,023 | |
| | | | | | | | |
| | | | | | | 28,228,446 | |
| | | | | | | | |
Taiwan 10.7% | | | | | | | | |
Advantech Co., Ltd. (Technology Hardware, Storage & Peripherals) | | | 54,998 | | | | 389,614 | |
ASPEED Technology, Inc. (Semiconductors & Semiconductor Equipment) | | �� | 95,000 | | | | 2,111,111 | |
AU Optronics Corp. (Electronic Equipment, Instruments & Components) | | | 4,375,000 | | | | 1,999,096 | |
Cathay Financial Holding Co., Ltd. (Insurance) | | | 370,000 | | | | 609,369 | |
Charoen Pokphand Enterprise (Food Products) | | | 33,000 | | | | 80,927 | |
Chicony Power Technology Co., Ltd. (Electrical Equipment) | | | 144,000 | | | | 299,172 | |
China General Plastics Corp. (Chemicals) | | | 151,000 | | | | 139,980 | |
China Life Insurance Co., Ltd. (Insurance) | | | 1,100,000 | | | | 1,095,661 | |
Coretronic Corp. (Electronic Equipment, Instruments & Components) | | | 236,000 | | | | 322,735 | |
CTBC Financial Holding Co., Ltd. (Banks) | | | 2,763,000 | | | | 1,812,027 | |
| | | | | | | | |
| | |
| | | Shares | | | Value | |
| | | | | | | | |
Taiwan (continued) | | | | | | | | |
E Ink Holdings, Inc. (Electronic Equipment, Instruments & Components) | | | 889,000 | | | $ | 827,045 | |
E.Sun Financial Holding Co., Ltd. (Banks) | | | 3,595,576 | | | | 2,210,298 | |
Ennoconn Corp. (Technology Hardware, Storage & Peripherals) | | | 125,000 | | | | 1,584,073 | |
Formosa Chemicals & Fibre Corp. (Chemicals) | | | 412,000 | | | | 1,293,425 | |
Formosa Plastics Corp. (Chemicals) | | | 84,000 | | | | 255,976 | |
Formosa Taffeta Co., Ltd. (Textiles, Apparel & Luxury Goods) | | | 165,000 | | | | 165,705 | |
Fubon Financial Holding Co., Ltd. (Diversified Financial Services) (a) | | | 586,462 | | | | 934,059 | |
General Interface Solution Holding, Ltd. (Electronic Equipment, Instruments & Components) | | | 108,000 | | | | 798,817 | |
Globalwafers Co., Ltd. (Semiconductors & Semiconductor Equipment) | | | 232,000 | | | | 1,620,644 | |
Grand Pacific Petrochemical Corp. (Chemicals) | | | 339,000 | | | | 236,252 | |
Grape King Bio, Ltd. (Personal Products) | | | 50,000 | | | | 332,840 | |
Hon Hai Precision Industry Co., Ltd. (Electronic Equipment, Instruments & Components) | | | 1,343,115 | | | | 5,165,827 | |
Innolux Corp. (Electronic Equipment, Instruments & Components) | | | 3,694,000 | | | | 1,930,789 | |
ITEQ Corp. (Electronic Equipment, Instruments & Components) | | | 133,000 | | | | 193,248 | |
Largan Precision Co., Ltd. (Electronic Equipment, Instruments & Components) | | | 14,000 | | | | 2,232,084 | |
Lien Hwa Industrial Corp. (Food Products) | | | 420,000 | | | | 389,349 | |
Long Chen Paper Co., Ltd. (Paper & Forest Products) | | | 581,000 | | | | 651,285 | |
Mercuries & Associates, Ltd. (Insurance) | | | 34,000 | | | | 24,645 | |
Nanya Technology Corp. (Semiconductors & Semiconductor Equipment) | | | 984,000 | | | | 1,772,623 | |
Pou Chen Corp. (Textiles, Apparel & Luxury Goods) | | | 936,000 | | | | 1,295,385 | |
Powertech Technology, Inc. (Semiconductors & Semiconductor Equipment) (a) | | | 461,000 | | | | 1,423,008 | |
Rechi Precision Co., Ltd. (Machinery) | | | 480,000 | | | | 546,746 | |
Syncmold Enterprise Corp. (Machinery) | | | 52,000 | | | | 120,855 | |
¨Taiwan Semiconductor Manufacturing Co., Ltd. (Semiconductors & Semiconductor Equipment) | | | 3,226,000 | | | | 22,111,144 | |
Taiwan Styrene Monomer Corp. (Chemicals) | | | 370,000 | | | | 261,506 | |
Tripod Technology Corp. (Electronic Equipment, Instruments & Components) | | | 50,000 | | | | 159,270 | |
TYC Brother Industrial Co., Ltd. (Auto Components) | | | 99,000 | | | | 104,793 | |
Walsin Lihwa Corp. (Electrical Equipment) | | | 1,731,000 | | | | 762,505 | |
Winbond Electronics Corp. (Semiconductors & Semiconductor Equipment) | | | 1,391,000 | | | | 834,509 | |
| | | | | | |
The notes to the financial statements are an integral part of,
and should be read in conjunction with, the financial statements. | | | | | 15 | |
Portfolio of Investments June 30, 2017 (Unaudited) (continued)
| | | | | | | | |
| | |
| | | Shares | | | Value | |
| | | | | | | | |
| Common Stocks (continued) | |
Taiwan (continued) | | | | | | | | |
Wistron Corp. (Technology Hardware, Storage & Peripherals) | | | 100,088 | | | $ | 101,832 | |
Yageo Corp. (Electronic Equipment, Instruments & Components) | | | 176,000 | | �� | | 613,281 | |
Yuanta Financial Holding Co., Ltd. (Capital Markets) | | | 3,729,000 | | | | 1,642,623 | |
| | | | | | | | |
| | | | | | | 61,456,133 | |
| | | | | | | | |
Thailand 1.5% | | | | | | | | |
Charoen Pokphand Foods PCL, NVDR (Food Products) | | | 1,332,800 | | | | 973,019 | |
CP ALL PCL, NVDR (Food & Staples Retailing) | | | 1,320,000 | | | | 2,438,328 | |
Electricity Generating PCL, NVDR (Independent Power & Renewable Electricity Producers) | | | 33,900 | | | | 213,559 | |
Kiatnakin Bank PCL, NVDR (Banks) | | | 312,500 | | | | 657,749 | |
Krung Thai Bank PCL, NVDR (Banks) | | | 1,204,700 | | | | 666,716 | |
PTT Global Chemical PCL, NVDR (Chemicals) | | | 234,800 | | | | 473,471 | |
Srisawad Power 1979 PCL, NVDR (Consumer Finance) | | | 1,600,260 | | | | 2,367,179 | |
Thai Oil PCL, NVDR (Oil, Gas & Consumable Fuels) | | | 333,600 | | | | 775,814 | |
| | | | | | | | |
| | | | | | | 8,565,835 | |
| | | | | | | | |
Turkey 1.2% | | | | | | | | |
Eregli Demir ve Celik Fabrikalari TAS (Metals & Mining) | | | 71,132 | | | | 142,529 | |
KOC Holding AS (Industrial Conglomerates) | | | 490,000 | | | | 2,253,322 | |
TAV Havalimanlari Holding A.S. (Transportation Infrastructure) | | | 108,337 | | | | 581,028 | |
Tekfen Holding A.S. (Construction & Engineering) | | | 163,701 | | | | 405,711 | |
Turk Hava Yollari AO (Airlines) (a) | | | 600,000 | | | | 1,372,764 | |
Turkiye Halk Bankasi A.S. (Banks) | | | 176,458 | | | | 659,501 | |
Turkiye Is Bankasi Class C (Banks) | | | 341,030 | | | | 722,100 | |
Turkiye Vakiflar Bankasi TAO Class D (Banks) | | | 341,546 | | | | 628,061 | |
| | | | | | | | |
| | | | | | | 6,765,016 | |
| | | | | | | | |
Ukraine 0.1% | | | | | | | | |
Kernel Holding S.A. (Food Products) | | | 33,714 | | | | 590,005 | |
| | | | | | | | |
| | |
United Arab Emirates 0.6% | | | | | | | | |
NMC Health PLC (Health Care Providers & Services) | | | 112,000 | | | | 3,188,814 | |
| | | | | | | | |
Total Common Stocks
(Cost $451,649,208) | | | | | | | 520,659,998 | |
| | | | | | | | |
| | | | | | | | |
| | |
| | | Shares | | | Value | |
| | | | | | | | |
| Exchange-Traded Funds 2.2% (e) | | | | | |
United States 2.2% | | | | | | | | |
iShares MSCI Emerging Markets ETF | | | 88,884 | | | $ | 3,678,909 | |
iShares MSCI Russia Capped ETF | | | 140,000 | | | | 4,032,000 | |
VanEck Vectors Russia ETF | | | 248,500 | | | | 4,763,745 | |
| | | | | | | | |
| | | | | | | 12,474,654 | |
| | | | | | | | |
Total Exchange-Traded Funds
(Cost $13,311,980) | | | | | | | 12,474,654 | |
| | | | | | | | |
| |
| Preferred Stocks 5.8% | | | | | |
Brazil 3.9% | | | | | | | | |
Banco ABC Brasil S.A.
6.560% (Banks) | | | 42,900 | | | | 217,420 | |
Banco Bradesco S.A.
4.180% (Banks) | | | 178,990 | | | | 1,520,894 | |
Banco do Estado do Rio Grande do Sul S.A.
4.660% Class B (Banks) | | | 226,800 | | | | 899,560 | |
Braskem S.A.
3.580% Class A (Chemicals) | | | 175,000 | | | | 1,806,574 | |
Centrais Eletricas Brasileiras S.A.
3.580% Class B (Electric Utilities) | | | 11,700 | | | | 57,954 | |
Cia de Saneamento do Parana
6.090% (Water Utilities) | | | 113,900 | | | | 374,750 | |
Cia Energetica de Minas Gerais
6.150% (Electric Utilities) | | | 385,900 | | | | 941,191 | |
Cia Paranaense de Energia
7.390% Class B (Electric Utilities) | | | 187,200 | | | | 1,386,102 | |
¨Itau Unibanco Holding S.A.
4.760% (Banks) | | | 665,930 | | | | 7,387,161 | |
Petroleo Brasileiro S.A.
0.00% (Oil, Gas & Consumable Fuels) (a) | | | 732,300 | | | | 2,734,327 | |
Suzano Papel e Celulose S.A.
2.640% Class A (Paper & Forest Products) | | | 81,400 | | | | 350,377 | |
Vale S.A.
3.820% (Metals & Mining) | | | 573,500 | | | | 4,658,422 | |
| | | | | | | | |
| | | | | | | 22,334,732 | |
| | | | | | | | |
Republic of Korea 1.9% | | | | | | | | |
Hyundai Motor Co.
3.740% (Automobiles) | | | 18,438 | | | | 1,877,400 | |
Hyundai Motor Co.
3.890% (Automobiles) | | | 17,039 | | | | 1,682,827 | |
LG Chem, Ltd.
2.480% (Chemicals) | | | 17,702 | | | | 3,125,293 | |
Samsung Electronics Co., Ltd.
1.440% (Technology Hardware,
Storage & Peripherals) | | | 2,615 | | | | 4,255,675 | |
| | | | | | | | |
| | | | | | | 10,941,195 | |
| | | | | | | | |
Total Preferred Stocks
(Cost $30,672,762) | | | | | | | 33,275,927 | |
| | | | | | | | |
| | | | |
| 16 | | MainStay VP Emerging Markets Equity Portfolio | | The notes to the financial statements are an integral part of,
and should be read in conjunction with, the financial statements. |
| | | | | | | | |
| | | Principal
Amount | | | Value | |
| Short-Term Investment 0.7% | | | | | | | | |
Repurchase Agreement 0.7% | | | | | | | | |
Fixed Income Clearing Corp.
0.12%, dated 6/30/17
due 7/3/17
Proceeds at Maturity $3,885,245 (Collateralized by a United States Treasury Note with a rate of 2.00% and a maturity date of 8/31/21, with a Principal Amount of $3,900,000 and a Market Value of $3,965,348) | | $ | 3,885,206 | | | $ | 3,885,206 | |
| | | | | | | | |
Total Short-Term Investment
(Cost $3,885,206) | | | | | | | 3,885,206 | |
| | | | | | | | |
Total Investments
(Cost $499,519,156) (f) | | | 99.6 | % | | | 570,295,785 | |
Other Assets, Less Liabilities | | | 0.4 | | | | 2,238,772 | |
Net Assets | | | 100.0 | % | | $ | 572,534,557 | |
| ‡ | Less than one-tenth of a percent. |
| (a) | Non-income producing security. |
| (b) | Illiquid security—As of June 30, 2017, the total market value of these securities deemed illiquid under procedures approved by the Board of Trustees was $146,776, which represented 0.0% of the Portfolio’s net assets. |
| (c) | May be sold to institutional investors only under Rule 144A or securities offered pursuant to Section 4(a)(2) of the Securities Act of 1933, as amended. |
| (d) | Fair valued security—Represents fair value as measured in good faith under procedures approved by the Board of Trustees. As of June 30, 2017, the total market value of these securities was $356,849, which represented 0.1% of the Portfolio’s net assets. |
| (e) | Exchange-Traded Fund—An investment vehicle that represents a basket of securities that is traded on an exchange. |
| (f) | As of June 30, 2017, cost was $503,692,080 for federal income tax purposes and net unrealized appreciation was as follows: |
| | | | |
Gross unrealized appreciation | | $ | 79,885,124 | |
Gross unrealized depreciation | | | (13,281,419 | ) |
| | | | |
Net unrealized appreciation | | $ | 66,603,705 | |
| | | | |
The following abbreviations are used in the preceding pages:
ADR—American Depositary Receipt
ETF—Exchange-Traded Fund
NVDR—Non-Voting Depositary Receipt
The table below sets forth the diversification of MainStay VP Emerging Markets Equity Portfolio investments by industry.
Industry Diversification
| | | | | | | | |
| | | Value | | | Percent † | |
Airlines | | $ | 3,135,690 | | | | 0.6 | % |
Auto Components | | | 4,762,279 | | | | 0.8 | |
Automobiles | | | 19,667,315 | | | | 3.4 | |
Banks | | | 81,509,766 | | | | 14.2 | |
Beverages | | | 3,097,818 | | | | 0.5 | |
Capital Markets | | | 21,427,847 | | | | 3.7 | |
Chemicals | | | 12,748,933 | | | | 2.2 | |
Commercial Services & Supplies | | | 2,120,795 | | | | 0.4 | |
Communications Equipment | | | 2,295,029 | | | | 0.4 | |
Construction & Engineering | | | 9,276,542 | | | | 1.6 | |
Construction Materials | | | 10,398,783 | | | | 1.8 | |
Consumer Finance | | | 4,112,968 | | | | 0.7 | |
Diversified Consumer Services | | | 3,829,791 | | | | 0.7 | |
Diversified Financial Services | | | 7,564,496 | | | | 1.3 | |
Diversified Telecommunication Services | | | 8,017,522 | | | | 1.4 | |
Electric Utilities | | | 9,124,272 | | | | 1.6 | |
Electrical Equipment | | | 1,061,677 | | | | 0.2 | |
Electronic Equipment, Instruments & Components | | | 23,692,920 | | | | 4.1 | |
Equity Real Estate Investment Trusts (REITs) | | | 879,252 | | | | 0.2 | |
Food & Staples Retailing | | | 9,242,046 | | | | 1.6 | |
Food Products | | | 6,659,897 | | | | 1.2 | |
Gas Utilities | | | 1,840,801 | | | | 0.3 | |
Health Care Equipment & Supplies | | | 1,970,036 | | | | 0.3 | |
Health Care Providers & Services | | | 4,385,189 | | | | 0.8 | |
Hotels, Restaurants & Leisure | | | 2,558,318 | | | | 0.5 | |
Household Durables | | | 5,154,064 | | | | 0.9 | |
Independent Power & Renewable Electricity Producers | | | 2,264,504 | | | | 0.4 | |
Industrial Conglomerates | | | 4,450,150 | | | | 0.8 | |
Insurance | | | 21,379,415 | | | | 3.7 | |
Internet Software & Services | | | 64,215,710 | | | | 11.2 | |
IT Services | | | 2,651,927 | | | | 0.5 | |
Life Sciences Tools & Services | | | 2,424,507 | | | | 0.4 | |
Machinery | | | 4,831,951 | | | | 0.8 | |
Media | | | 11,829,324 | | | | 2.1 | |
Metals & Mining | | | 22,277,658 | | | | 3.9 | |
Multiline Retail | | | 2,856,712 | | | | 0.5 | |
Oil, Gas & Consumable Fuels | | | 40,205,676 | | | | 7.0 | |
Paper & Forest Products | | | 2,889,192 | | | | 0.5 | |
Personal Products | | | 843,017 | | | | 0.2 | |
Pharmaceuticals | | | 7,026,194 | | | | 1.2 | |
Real Estate Management & Development | | | 4,320,659 | | | | 0.8 | |
Road & Rail | | | 1,566,603 | | | | 0.3 | |
Semiconductors & Semiconductor Equipment | | | 43,389,837 | | | | 7.6 | |
Software | | | 5,405,416 | | | | 0.9 | |
Specialty Retail | | | 1,000,711 | | | | 0.2 | |
Technology Hardware, Storage & Peripherals | | | 31,959,540 | | | | 5.6 | |
Textiles, Apparel & Luxury Goods | | | 2,052,763 | | | | 0.4 | |
Thrifts & Mortgage Finance | | | 4,175,437 | | | | 0.7 | |
Tobacco | | | 375,562 | | | | 0.1 | |
Trading Companies & Distributors | | | 639,221 | | | | 0.1 | |
Transportation Infrastructure | | | 9,046,325 | | | | 1.6 | |
Water Utilities | | | 5,390,816 | | | | 0.9 | |
Wireless Telecommunication Services | | | 10,292,912 | | | | 1.8 | |
| | | | | | | | |
| | | 570,295,785 | | | | 99.6 | |
Other Assets, Less Liabilities | | | 2,238,772 | | | | 0.4 | |
| | | | | | | | |
Net Assets | | $ | 572,534,557 | | | | 100.0 | % |
| | | | | | | | |
| † | Percentages indicated are based on Portfolio net assets. |
| | | | | | |
The notes to the financial statements are an integral part of,
and should be read in conjunction with, the financial statements. | | | | | 17 | |
Portfolio of Investments June 30, 2017 (Unaudited) (continued)
The following is a summary of the fair valuations according to the inputs used as of June 30, 2017, for valuing the Portfolio’s assets.
Asset Valuation Inputs
| | | | | | | | | | | | | | | | |
Description | | Quoted
Prices in
Active
Markets for
Identical
Assets
(Level 1) | | | Significant
Other
Observable
Inputs (Level 2) | | | Significant
Unobservable
Inputs (Level 3) | | | Total | |
| Investments in Securities (a) | | | | | | | | | | | | | | | | |
| Common Stocks (b) | | $ | 520,303,149 | | | $ | 356,849 | | | $ | 0 | | | $ | 520,659,998 | |
| Exchange-Traded Funds | | | 12,474,654 | | | | — | | | | — | | | | 12,474,654 | |
| Preferred Stocks | | | 33,275,927 | | | | — | | | | — | | | | 33,275,927 | |
| Short-Term Investment | | | | | | | | | | | | | | | | |
Repurchase Agreement | | | — | | | | 3,885,206 | | | | — | | | | 3,885,206 | |
| | | | | | | | | | | | | | | | |
| Total Investments in Securities | | $ | 566,053,730 | | | $ | 4,242,055 | | | $ | 0 | | | $ | 570,295,785 | |
| | | | | | | | | | | | | | | | |
| (a) | For a complete listing of investments and their industries, see the Portfolio of Investments. |
| (b) | The Level 3 securities valued at $0 and $0 are held in China and Hong Kong, respectively, within the Common Stocks section of the Portfolio of Investments. |
The Portfolio recognizes transfers between the levels as of the beginning of the period.
As of June 30, 2017, certain foreign equity securities with a market value of $261,772,530 were transferred from Level 2 to Level 1 as the prices of these securities were based on observable quoted prices in active markets.
The following is a reconciliation of investments in which significant unobservable inputs (Level 3) were used in determining value:
| | | | | | | | | | | | | | | | | | | | | | | | | | | | | | | | | | | | | | | | |
Investments in
Securities | | Balance as of
December 31,
2016 | | | Accrued
Discounts
(Premiums) | | | Realized
Gain
(Loss) | | | Change in
Unrealized
Appreciation
(Depreciation) | | | Purchases | | | Sales | | | Transfers
in to
Level 3 | | | Transfers
out of
Level 3 | | | Balance
as of
June 30,
2017 | | | Change in
Unrealized
Appreciation
(Depreciation)
from
Investments
Still Held at
June 30,
2017 (a) | |
| Common Stocks | | | | | | | | | | | | | | | | | | | | | | | | | | | | | | | | | | | | | | | | |
China | | $ | 121,197 | | | $ | — | | | $ | 75,634 | | | $ | 107,189 | | | $ | — | | | $ | (304,020 | ) | | $ | — | | | $ | — | | | $ | 0 | | | $ | 107,189 | |
Hong Kong | | | 0 | | | | — | | | | — | | | | — | | | | — | | | | — | | | | — | | | | — | | | | 0 | | | | — | |
South Africa | | | 22 | | | | — | | | | — | | | | 75,062 | | | | — | | | | (75,084 | ) | | | — | | | | — | | | | — | | | | 75,062 | |
| | | | | | | | | | | | | | | | | | | | | | | | | | | | | | | | | | | | | | | | |
| Total | | $ | 121,219 | | | $ | — | | | $ | 75,634 | | | $ | 182,251 | | | $ | — | | | $ | (379,104 | ) | | $ | — | | | $ | — | | | $ | 0 | | | $ | 182,251 | |
| | | | | | | | | | | | | | | | | | | | | | | | | | | | | | | | | | | | | | | | |
| (a) | Included in “Net change in unrealized appreciation (depreciation) on investments” in the Statement of Operations. |
| | | | |
| 18 | | MainStay VP Emerging Markets Equity Portfolio | | The notes to the financial statements are an integral part of,
and should be read in conjunction with, the financial statements. |
Statement of Assets and Liabilities as of June 30, 2017 (Unaudited)
| | | | |
| Assets | |
Investment in securities, at value
(identified cost $499,519,156) | | $ | 570,295,785 | |
Cash denominated in foreign currencies
(identified cost $1,881,980) | | | 1,885,160 | |
Cash | | | 462,457 | |
Due from custodian | | | 610,638 | |
Receivables: | |
Investment securities sold | | | 3,091,782 | |
Dividends and interest | | | 2,260,247 | |
Fund shares sold | | | 122,159 | |
Other assets | | | 2,679 | |
| | | | |
Total assets | | | 578,730,907 | |
| | | | |
| |
| Liabilities | | | | |
Payables: | |
Investment securities purchased | | | 4,663,760 | |
Foreign capital gains tax (See Note 2(C)) | | | 683,558 | |
Manager (See Note 3) | | | 473,166 | |
Fund shares redeemed | | | 259,037 | |
NYLIFE Distributors (See Note 3) | | | 38,935 | |
Professional fees | | | 34,516 | |
Shareholder communication | | | 21,080 | |
Custodian | | | 12,531 | |
Trustees | | | 751 | |
Accrued expenses | | | 9,016 | |
| | | | |
Total liabilities | | | 6,196,350 | |
| | | | |
Net assets | | $ | 572,534,557 | |
| | | | |
| |
| Composition of Net Assets | | | | |
Shares of beneficial interest outstanding (par value of
$.001 per share) unlimited number of shares authorized | | $ | 64,825 | |
Additional paid-in capital | | | 602,864,185 | |
| | | | |
| | | 602,929,010 | |
Undistributed net investment income | | | 5,705,632 | |
Accumulated net realized gain (loss) on investments, investments sold short, futures transactions, swap transactions and foreign currency transactions (a) | | | (106,070,312 | ) |
Net unrealized appreciation (depreciation) on investments and futures contracts (b) | | | 69,982,799 | |
Net unrealized appreciation (depreciation) on translation of other assets and liabilities in foreign currencies | | | (12,572 | ) |
| | | | |
Net assets | | $ | 572,534,557 | |
| | | | |
| | | | |
Initial Class | | | | |
Net assets applicable to outstanding shares | | $ | 382,607,208 | |
| | | | |
Shares of beneficial interest outstanding | | | 43,282,415 | |
| | | | |
Net asset value per share outstanding | | $ | 8.84 | |
| | | | |
Service Class | | | | |
Net assets applicable to outstanding shares | | $ | 189,927,349 | |
| | | | |
Shares of beneficial interest outstanding | | | 21,543,029 | |
| | | | |
Net asset value per share outstanding | | $ | 8.82 | |
| | | | |
| (a) | Realized gain (loss) on security transactions recorded net of foreign capital gains tax. |
| (b) | Unrealized appreciation (depreciation) on investments recorded net of foreign capital gains tax in the amount of $(793,830). |
| | | | | | |
The notes to the financial statements are an integral part of,
and should be read in conjunction with, the financial statements. | | | | | 19 | |
Statement of Operations for the six months ended June 30, 2017 (Unaudited)
| | | | |
| Investment Income (Loss) | |
Income | | | | |
Dividends (a) | | $ | 6,834,795 | |
Interest | | | 1,987 | |
| | | | |
Total income | | | 6,836,782 | |
| | | | |
Expenses | | | | |
Manager (See Note 3) | | | 2,610,323 | |
Custodian | | | 373,979 | |
Distribution/Service—Service Class (See Note 3) | | | 222,101 | |
Professional fees | | | 70,734 | |
Shareholder communication | | | 41,436 | |
Trustees | | | 5,462 | |
Broker fees and charges on short sales | | | 2,273 | |
Miscellaneous | | | 18,414 | |
| | | | |
Total expenses | | | 3,344,722 | |
| | | | |
Net investment income (loss) | | | 3,492,060 | |
| | | | |
|
| Realized and Unrealized Gain (Loss) on Investments, Futures Contracts, Swap Contracts and Foreign Currency Transactions | |
Net realized gain (loss) on: | |
Investment transactions (b) | | | 37,747,341 | |
Investments sold short | | | 12,198 | |
Futures transactions | | | 488,315 | |
Swap transactions | | | 1,893,466 | |
Foreign currency transactions | | | (226,049 | ) |
| | | | |
Net realized gain (loss) on investments, investments sold short, futures transactions, swap transactions and foreign currency transactions | | | 39,915,271 | |
| | | | |
Net change in unrealized appreciation (depreciation) on: | | | | |
Investments (c) | | | 55,098,953 | |
Swap contracts | | | (3,619,529 | ) |
Translation of other assets and liabilities in
foreign currencies | | | (10,317 | ) |
| | | | |
Net change in unrealized appreciation (depreciation) on investments, futures contracts, swap contracts and foreign currency transactions | | | 51,469,107 | |
| | | | |
Net realized and unrealized gain (loss) on investments, investments sold short, futures transactions, swap transactions and foreign currency transactions | | | 91,384,378 | |
| | | | |
Net increase (decrease) in net assets resulting from operations | | $ | 94,876,438 | |
| | | | |
| (a) | Dividends recorded net of foreign withholding taxes in the amount of $882,865. |
| (b) | Realized gain (loss) on security transactions recorded net of foreign capital gains tax in the amount of $375,109. |
| (c) | Net change in unrealized appreciation (depreciation) on investments recorded net of foreign capital gains tax in the amount of $(421,941). |
| | | | |
| 20 | | MainStay VP Emerging Markets Equity Portfolio | | The notes to the financial statements are an integral part of,
and should be read in conjunction with, the financial statements. |
Statements of Changes in Net Assets
for the six months ended June 30, 2017 (Unaudited) and the year ended December 31, 2016
| | | | | | | | |
| | | 2017 | | | 2016 | |
| Increase (Decrease) in Net Assets | |
Operations: | | | | | | | | |
Net investment income (loss) | | $ | 3,492,060 | | | $ | 3,233,480 | |
Net realized gain (loss) on investments, investments sold short, futures transactions, swap transactions and foreign currency transactions | | | 39,915,271 | | | | (29,230,911 | ) |
Net change in unrealized appreciation (depreciation) on investments, investments sold short, futures contracts, swap contracts and foreign currency transactions | | | 51,469,107 | | | | 50,466,104 | |
| | | | |
Net increase (decrease) in net assets resulting from operations | | | 94,876,438 | | | | 24,468,673 | |
| | | | |
Dividends to shareholders: | | | | | | | | |
From net investment income: | | | | | | | | |
Initial Class | | | — | | | | (1,097,408 | ) |
Service Class | | | — | | | | (248,796 | ) |
| | | | |
Total dividends to shareholders | | | — | | | | (1,346,204 | ) |
| | | | |
Capital share transactions: | | | | | | | | |
Net proceeds from sale of shares | | | 98,389,316 | | | | 77,449,786 | |
Net asset value of shares issued to shareholders in reinvestment of dividends | | | — | | | | 1,346,204 | |
Cost of shares redeemed | | | (34,101,304 | ) | | | (56,570,031 | ) |
| | | | |
Increase (decrease) in net assets derived from capital share transactions | | | 64,288,012 | | | | 22,225,959 | |
| | | | |
Net increase (decrease) in net assets | | | 159,164,450 | | | | 45,348,428 | |
| | |
| Net Assets | | | | | | | | |
| |
Beginning of period | | | 413,370,107 | | | | 368,021,679 | |
| | | | |
End of period | | $ | 572,534,557 | | | $ | 413,370,107 | |
| | | | |
Undistributed net investment income at end of period | | $ | 5,705,632 | | | $ | 2,213,572 | |
| | | | |
| | | | | | |
The notes to the financial statements are an integral part of,
and should be read in conjunction with, the financial statements. | | | | | 21 | |
Financial Highlights selected per share data and ratios
| | | | | | | | | | | | | | | | | | | | | | | | |
| | | Six months
ended
June 30, | | | Year ended December 31, | | | February 17,
2012**
through
December 31, | |
| Initial Class | | 2017* | | | 2016 | | | 2015 | | | 2014 | | | 2013 | | | 2012 | |
Net asset value at beginning of period | | $ | 7.22 | | | $ | 6.83 | | | $ | 8.27 | | | $ | 9.50 | | | $ | 10.12 | | | $ | 10.00 | |
| | | | | | | | | | | | | | | | | | | | | | | | |
Net investment income (loss) (a) | | | 0.06 | | | | 0.06 | | | | 0.06 | | | | 0.14 | (b) | | | 0.11 | | | | 0.09 | |
Net realized and unrealized gain (loss) on investments | | | 1.56 | | | | 0.37 | | | | (1.38 | ) | | | (1.26 | ) | | | (0.66 | ) | | | 0.04 | |
Net realized and unrealized gain (loss) on foreign
currency transactions | | | (0.00 | )‡ | | | (0.01 | ) | | | (0.02 | ) | | | (0.01 | ) | | | (0.00 | )‡ | | | (0.01 | ) |
| | | | | | | | | | | | | | | | | | | | | | | | |
Total from investment operations | | | 1.62 | | | | 0.42 | | | | (1.34 | ) | | | (1.13 | ) | | | (0.55 | ) | | | 0.12 | |
| | | | | | | | | | | | | | | | | | | | | | | | |
| Less dividends and distributions: | | | | | | | | | | | | | | | | | | | | | | | | |
From net investment income | | | — | | | | (0.03 | ) | | | (0.10 | ) | | | (0.10 | ) | | | (0.07 | ) | | | — | |
| | | | | | | | | | | | | | | | | | | | | | | | |
Net asset value at end of period | | $ | 8.84 | | | $ | 7.22 | | | $ | 6.83 | | | $ | 8.27 | | | $ | 9.50 | | | $ | 10.12 | |
| | | | | | | | | | | | | | | | | | | | | | | | |
Total investment return (c) | | | 22.44 | %(d) | | | 6.23 | % | | | (16.20 | %) | | | (11.97 | %) | | | (5.43 | %) | | | 1.20 | %(d) |
| Ratios (to average net assets)/Supplemental Data: | | | | | | | | | | | | | | | | | | | | | | | | |
Net investment income (loss) | | | 1.57 | %†† | | | 0.91 | %(e) | | | 0.77 | % | | | 1.52 | % (b) | | | 1.17 | % | | | 1.15 | %†† |
Net expenses (excluding short sale expenses) | | | 1.29 | %†† | | | 1.29 | %(f) | | | 1.40 | % | | | 1.37 | % | | | 1.34 | % | | | 1.40 | %†† |
Expenses (including short sales expenses) | | | 1.29 | %†† | | | 1.29 | % | | | 1.40 | % | | | 1.37 | % | | | 1.34 | % | | | 1.40 | %†† |
Short sale expenses | | | 0.00 | %††(g) | | | 0.00 | %(g) | | | 0.00 | % (g) | | | — | | | | — | | | | — | |
Portfolio turnover rate | | | 88 | % | | | 123 | % | | | 207 | % | | | 65 | % | | | 68 | % | | | 81 | % |
Net assets at end of period (in 000’s) | | $ | 382,607 | | | $ | 257,593 | | | $ | 204,138 | | | $ | 165,049 | | | $ | 132,661 | | | $ | 190,688 | |
| ‡ | Less than one cent per share. |
| (a) | Per share data based on average shares outstanding during the period. |
| (b) | Included in net investment income per share and the ratio of net investment income to average net assets are $0.03 per share and 0.32%, respectively, resulting from a special one-time dividend from BR Properties S.A. that paid 5.50 Brazilian Real per share. |
| (c) | Total return does not reflect any deduction of sales charges, mortality and expense charges, contract charges or administrative charges. For periods of less than one year, total return is not annualized. |
| (d) | Total investment return may reflect adjustments to conform to generally accepted accounting principles. |
| (e) | Without the custody fee reimbursement, net investment income (loss) would have been 0.83%. |
| (f) | Without the custody fee reimbursement, net expenses would have been 1.37%. |
| | | | |
| 22 | | MainStay VP Emerging Markets Equity Portfolio | | The notes to the financial statements are an integral part of,
and should be read in conjunction with, the financial statements. |
Financial Highlights selected per share data and ratios
| | | | | | | | | | | | | | | | | | | | | | | | |
| | | Six months
ended
June 30, | | | Year ended December 31, | | | February 17,
2012**
through
December 31, | |
| Service Class | | 2017* | | | 2016 | | | 2015 | | | 2014 | | | 2013 | | | 2012 | |
Net asset value at beginning of period | | $ | 7.21 | | | $ | 6.82 | | | $ | 8.25 | | | $ | 9.47 | | | $ | 10.10 | | | $ | 10.00 | |
| | | | | | | | | | | | | | | | | | | | | | | | |
Net investment income (loss) (a) | | | 0.05 | | | | 0.05 | | | | 0.04 | | | | 0.12 | (b) | | | 0.08 | | | | 0.08 | |
Net realized and unrealized gain (loss) on investments | | | 1.56 | | | | 0.36 | | | | (1.37 | ) | | | (1.25 | ) | | | (0.66 | ) | | | 0.04 | |
Net realized and unrealized gain (loss) on foreign currency transactions | | | (0.00 | )‡ | | | (0.01 | ) | | | (0.02 | ) | | | (0.01 | ) | | | (0.00 | )‡ | | | (0.02 | ) |
| | | | | | | | | | | | | | | | | | | | | | | | |
Total from investment operations | | | 1.61 | | | | 0.40 | | | | (1.35 | ) | | | (1.14 | ) | | | (0.58 | ) | | | 0.10 | |
| | | | | | | | | | | | | | | | | | | | | | | | |
| Less dividends and distributions: | | | | | | | | | | | | | | | | | | | | | | | | |
From net investment income | | | — | | | | (0.01 | ) | | | (0.08 | ) | | | (0.08 | ) | | | (0.05 | ) | | | — | |
| | | | | | | | | | | | | | | | | | | | | | | | |
Net asset value at end of period | | $ | 8.82 | | | $ | 7.21 | | | $ | 6.82 | | | $ | 8.25 | | | $ | 9.47 | | | $ | 10.10 | |
| | | | | | | | | | | | | | | | | | | | | | | | |
Total investment return (c) | | | 22.33 | %(d) | | | 5.96 | % | | | (16.42 | %) | | | (12.19 | %) | | | (5.67 | %) | | | 1.00 | %(d) |
| Ratios (to average net assets)/Supplemental Data: | | | | | | | | | | | | | | | | | | | | | | | | |
Net investment income (loss) | | | 1.23 | %†† | | | 0.69 | %(e) | | | 0.52 | % | | | 1.29 | % (b) | | | 0.86 | % | | | 0.96 | %†† |
Net expenses (excluding short sales expenses) | | | 1.54 | %†† | | | 1.55 | %(f) | | | 1.65 | % | | | 1.62 | % | | | 1.59 | % | | | 1.65 | %†† |
Expenses (including short sales expenses) | | | 1.54 | %†† | | | 1.55 | % | | | 1.65 | % | | | 1.62 | % | | | 1.59 | % | | | 1.65 | %†† |
Short sale expenses | | | 0.00 | %††(g) | | | 0.00 | %(g) | | | 0.00 | % (g) | | | — | | | | — | | | | — | |
Portfolio turnover rate | | | 88 | % | | | 123 | % | | | 207 | % | | | 65 | % | | | 68 | % | | | 81 | % |
Net assets at end of period (in 000’s) | | $ | 189,927 | | | $ | 155,777 | | | $ | 163,884 | | | $ | 205,319 | | | $ | 230,943 | | | $ | 255,631 | |
| ‡ | Less than one cent per share. |
| (a) | Per share data based on average shares outstanding during the period. |
| (b) | Included in net investment income per share and the ratio of net investment income to average net assets are $0.03 per share and 0.32%, respectively, resulting from a special one-time dividend from BR Properties S.A. that paid 5.50 Brazilian Real per share. |
| (c) | Total return does not reflect any deduction of sales charges, mortality and expense charges, contract charges or administrative charges. For periods of less than one year, total return is not annualized. |
| (d) | Total investment return may reflect adjustments to conform to generally accepted accounting principles. |
| (e) | Without the custody fee reimbursement, net investment income (loss) would have been 0.62%. |
| (f) | Without the custody fee reimbursement, net expenses would have been 1.62%. |
| | | | | | |
The notes to the financial statements are an integral part of,
and should be read in conjunction with, the financial statements. | | | | | 23 | |
Notes to Financial Statements (Unaudited)
Note 1–Organization and Business
MainStay VP Funds Trust (the “Fund”) was organized as a Delaware statutory trust on February 1, 2011. The Fund is registered under the Investment Company Act of 1940, as amended (the “1940 Act”), as an open-end management investment company. The Fund is comprised of thirty-two separate series (collectively referred to as the “Portfolios”). These financial statements and notes relate to the MainStay VP Emerging Markets Equity Portfolio (the “Portfolio”), a “diversified” portfolio, as that term is defined in the 1940 Act, as interpreted or modified by regulatory authorities having jurisdiction, from time to time.
Shares of the Portfolio are currently offered to certain separate accounts to fund variable annuity policies and variable universal life insurance policies issued by New York Life Insurance and Annuity Corporation (“NYLIAC”), a wholly-owned subsidiary of New York Life Insurance Company (“New York Life”). NYLIAC allocates shares of the Portfolios to, among others, NYLIAC Variable Annuity Separate Accounts-I, II, III and IV, VUL Separate Account-I and CSVUL Separate Account-I (collectively, the “Separate Accounts”). Shares of the Portfolio are also offered to the MainStay VP Conservative Allocation Portfolio, MainStay VP Moderate Allocation Portfolio, MainStay VP Moderate Growth Allocation Portfolio and MainStay VP Growth Allocation Portfolio, which operate as “funds-of-funds.”
The Portfolio currently offers two classes of shares. Initial Class and Service Class shares commenced operations on February 17, 2012. Shares of the Portfolio are sold and are redeemed at a price equal to their respective net asset value (“NAV”) per share. No sales or redemption charge is applicable to the purchase or redemption of the Portfolio’s shares. Under the terms of the Fund’s multiple class plan adopted pursuant to Rule 18f-3 under the 1940 Act, the classes differ in that, among other things, Service Class shares of the Portfolio pay a combined distribution and service fee of 0.25% of average daily net assets attributable to Service Class shares of the Portfolio to the Distributor (as defined in Note 3(B)) pursuant to a plan adopted in accordance with Rule 12b-1 under the 1940 Act. Contract owners of variable annuity contracts purchased after June 2, 2003, are permitted to invest only in the Service Class shares.
The Portfolio’s investment objective is to seek long-term capital appreciation.
Note 2–Significant Accounting Policies
The Portfolio is an investment company and accordingly follows the investment company accounting and reporting guidance of the Financial Accounting Standards Board (“FASB”) Accounting Standard Codification Topic 946 Financial Services—Investment Companies. The Portfolio prepares its financial statements in accordance with generally accepted accounting principles (“GAAP”) in the United States of America and follows the significant accounting policies described below.
(A) Securities Valuation. Investments are usually valued as of the close of regular trading on the New York Stock Exchange (the “Exchange”) (usually 4:00 p.m. Eastern time) on each day the Portfolio is open for business (“valuation date”).
The Board of Trustees (the “Board”) of the Fund adopted procedures establishing methodologies for the valuation of the Portfolio’s securities and other assets and delegated the responsibility for valuation
determinations under those procedures to the Valuation Committee of the Fund (the “Valuation Committee”). The Board authorized the Valuation Committee to appoint a Valuation Sub-Committee (the “Sub-Committee”) to deal in the first instance with establishing the prices of securities for which market quotations are not readily available or the prices of which are not otherwise readily determinable under these procedures. The Sub-Committee meets (in person, via electronic mail or via teleconference) on an as-needed basis. Subsequently, the Valuation Committee meets to ensure that actions taken by the Sub-Committee were appropriate. The procedures recognize that, subject to the oversight of the Board and unless otherwise noted, the responsibility for the day-to-day valuation of portfolio assets (including fair value measurements for the Portfolio’s assets and liabilities) rests with New York Life Investment Management LLC (“New York Life Investments” or the “Manager”), aided to whatever extent necessary by the Subadvisors (as defined in Note 3(A)) to the Portfolio.
To assess the appropriateness of security valuations, the Manager, the Subadvisors or the Portfolio’s third party service provider, who is subject to oversight by the Manager, regularly compares prior day prices, prices on comparable securities and the sale prices to the prior and current day prices and challenges prices with changes exceeding certain tolerance levels with third party pricing services or broker sources. For those securities valued through either a standardized fair valuation methodology or a fair valuation measurement, the Sub-Committee deals in the first instance with such valuation and the Valuation Committee reviews and affirms, if appropriate, the reasonableness of the valuation based on such methodologies and measurements on a regular basis after considering all relevant information that is reasonably available. Any action taken by the Sub-Committee with respect to the valuation of a portfolio security or other asset is submitted by the Valuation Committee to the Board for its review and ratification, if appropriate, at its next regularly scheduled meeting.
“Fair value” is defined as the price the Portfolio would reasonably expect to receive upon selling an asset or liability in an orderly transaction to an independent buyer in the principal or most advantageous market for the asset or liability. Fair value measurements are determined within a framework that establishes a three-tier hierarchy which maximizes the use of observable market data and minimizes the use of unobservable inputs to establish a classification of fair value measurements for disclosure purposes. “Inputs” refer broadly to the assumptions that market participants would use in pricing the asset or liability, including assumptions about risk, such as the risk inherent in a particular valuation technique used to measure fair value using a pricing model and/or the risk inherent in the inputs for the valuation technique. Inputs may be observable or unobservable. Observable inputs reflect the assumptions market participants would use in pricing the asset or liability based on market data obtained from sources independent of the Portfolio. Unobservable inputs reflect the Portfolio’s own assumptions about the assumptions market participants would use in pricing the asset or liability based on the information available. The inputs or methodology used for valuing assets or liabilities may not be an indication of the risks associated with investing in those assets or liabilities. The three-tier hierarchy of inputs is summarized below.
| • | | Level 1—quoted prices in active markets for an identical asset or liability |
| | |
| 24 | | MainStay VP Emerging Markets Equity Portfolio |
| • | | Level 2—other significant observable inputs (including quoted prices for a similar asset or liability in active markets, interest rates and yield curves, prepayment speeds, credit risk, etc.) |
| • | | Level 3—significant unobservable inputs (including the Portfolio’s own assumptions about the assumptions that market participants would use in measuring fair value of an asset or liability) |
The level of an asset or liability within the fair value hierarchy is based on the lowest level of an input, both individually and in the aggregate, that is significant to the fair value measurement. As of June 30, 2017, the aggregate value by input level of the Portfolio’s assets and liabilities is included at the end of the Portfolio’s Portfolio of Investments.
The Portfolio may use third party vendor evaluations, whose prices may be derived from one or more of the following standard inputs, among others:
| | |
• Broker/dealer quotes | | • Benchmark securities |
• Two-sided markets | | • Reference data (corporate actions or material event notices) |
• Bids/offers | | • Monthly payment information |
• Industry and economic events | | • Reported trades |
An asset or liability for which market values cannot be measured using the methodologies described above is valued by methods deemed reasonable in good faith by the Valuation Committee, following the procedures established by the Board, to represent fair value. Under these procedures, the Portfolio generally uses a market-based approach which may use related or comparable assets or liabilities, recent transactions, market multiples, book values, and other relevant information. The Portfolio may also use an income-based valuation approach in which the anticipated future cash flows of the asset or liability are discounted to calculate fair value. Discounts may also be applied due to the nature and/or duration of any restrictions on the disposition of the asset or liability. Fair value represents a good faith approximation of the value of a security. Fair value determinations involve the consideration of a number of subjective factors, an analysis of applicable facts and circumstances and the exercise of judgment. As a result, it is possible that the fair value for a security determined in good faith in accordance with the Portfolio’s valuation procedures may differ from valuations for the same security determined by other funds using their own valuation procedures. Although the Portfolio’s valuation procedures are designed to value a security at the price the Portfolio may reasonably expect to receive upon the security’s sale in an orderly transaction, there can be no assurance that any fair value determination thereunder would, in fact, approximate the amount that the Portfolio would actually realize upon the sale of the security or the price at which the security would trade if a reliable market price were readily available. During the six-month period ended June 30, 2017, there were no material changes to the fair value methodologies.
Securities which may be valued in this manner include, but are not limited to: (i) a security for which trading has been halted or suspended; (ii) a debt security that has recently gone into default and for which there is not a current market quotation; (iii) a security of an issuer that has entered into a restructuring; (iv) a security that has been de-listed from a national exchange; (v) a security for which the market price is not readily available from a third party pricing source or, if so provided, does
not, in the opinion of the Manager or Subadvisors, reflect the security’s market value; (vi) a security subject to trading collars for which no or limited trading takes place; and (vii) a security whose principal market has been temporarily closed at a time when, under normal conditions, it would be open. Securities for which market quotations or observable inputs are not readily available are generally categorized as Level 3 in the hierarchy. As of June 30, 2017, securities that were fair valued in such a manner are shown in the Portfolio of Investments.
Certain securities held by the Portfolio may principally trade in foreign markets. Events may occur between the time the foreign markets close and the time at which the Portfolio’s NAVs are calculated. These events may include, but are not limited to, situations relating to a single issuer in a market sector, significant fluctuations in U.S. or foreign markets, natural disasters, armed conflicts, governmental actions or other developments not tied directly to the securities markets. Should the Manager or Subadvisors conclude that such events may have affected the accuracy of the last price of such securities reported on the local foreign market, the Sub-Committee may, pursuant to procedures adopted by the Board, adjust the value of the local price to reflect the estimated impact on the price of such securities as a result of such events. In this instance, securities are generally categorized as Level 3 in the hierarchy. Additionally, certain foreign equity securities are also fair valued whenever the movement of a particular index exceeds certain thresholds. In such cases, the securities are fair valued by applying factors provided by a third party vendor in accordance with valuation procedures adopted by the Board and are generally categorized as Level 2 in the hierarchy. As of June 30, 2017, securities that were fair valued in such a manner are shown in the Portfolio of Investments.
Equity securities and shares of Exchange-Traded Funds (“ETFs”) are valued at the last quoted sales prices as of the close of regular trading on the relevant exchange on each valuation date. Securities that are not traded on the valuation date are valued at the mean of the last quoted bid and ask prices. Prices are normally taken from the principal market in which each security trades. These securities are generally categorized as Level 1 in the hierarchy.
Total return swap contracts, which are arrangements to exchange a market-linked return for a periodic payment, are based on a notional principal amount. To the extent that the total return of the security, index or other financial measure underlying the transaction exceeds or falls short of the offsetting interest rate obligation, the Portfolio will receive a payment from or make a payment to the counterparty. Total return swap contracts are marked to market daily based upon quotations from market makers and these securities are generally categorized as Level 2 in the hierarchy.
Temporary cash investments acquired in excess of 60 days to maturity at the time of purchase are valued using the latest bid prices or using valuations based on a matrix system (which considers such factors as security prices, yields, maturities, and ratings), both as furnished by independent pricing services. Other temporary cash investments which mature in 60 days or less at the time of purchase (“Short-Term Investments”) are valued using the amortized cost method of valuation, unless the use of such method would be inappropriate. The amortized cost method involves valuing a security at its cost on the date of purchase and thereafter assuming a constant amortization to maturity of the difference between such cost and the value on maturity date. Amor-
Notes to Financial Statements (Unaudited) (continued)
tized cost approximates the current fair value of a security. Securities valued using the amortized cost method are not valued using quoted prices in an active market and are generally categorized as Level 2 in the hierarchy.
The information above is not intended to reflect an exhaustive list of the methodologies that may be used to value portfolio investments. The valuation procedures permit the use of a variety of valuation methodologies in connection with valuing portfolio investments. The methodology used for a specific type of investment may vary based on the market data available or other considerations. The methodologies summarized above may not represent the specific means by which portfolio investments are valued on any particular business day.
A Portfolio security or other asset may be determined to be illiquid under procedures approved by the Board. Illiquidity of a security might prevent the sale of such security at a time when the Manager or Subadvisors might wish to sell, and these securities could have the effect of decreasing the overall level of the Portfolio’s liquidity. Further, the lack of an established secondary market may make it more difficult to value illiquid securities, requiring the Portfolio to rely on judgments that may be somewhat subjective in measuring value, which could vary materially from the amount that the Portfolio could realize upon disposition. Difficulty in selling illiquid securities may result in a loss or may be costly to the Portfolio. Under the supervision of the Board, the Manager or Subadvisors determine the liquidity of the Portfolio’s investments; in doing so, the Manager or Subadvisors may consider various factors, including (i) the frequency of trades and quotations, (ii) the number of dealers and prospective purchasers, (iii) dealer undertakings to make a market, and (iv) the nature of the security and the market in which it trades (e.g., the time needed to dispose of the security, the method of soliciting offers and the mechanics of transfer). Illiquid securities are often valued in accordance with methods deemed by the Board in good faith to be reasonable and appropriate to accurately reflect their fair value. The liquidity of the Portfolio’s investments, as shown in the Portfolio of Investments, was determined as of June 30, 2017 and can change at any time in response to, among other relevant factors, market conditions or events or developments with respect to an individual issuer or instrument. As of June 30, 2017, securities deemed to be illiquid under procedures approved by the Board are shown in the Portfolio of Investments.
(B) Income Taxes. The Portfolio’s policy is to comply with the requirements of the Internal Revenue Code of 1986, as amended (the “Internal Revenue Code”), applicable to regulated investment companies and to distribute all of its taxable income to the shareholders of the Portfolio within the allowable time limits. Therefore, no federal, state and local income tax provisions are required.
Management evaluates the Portfolio’s tax positions to determine if the tax positions taken meet the minimum recognition threshold in connection with accounting for uncertainties in income tax positions taken or expected to be taken for the purposes of measuring and recognizing tax liabilities in the financial statements. Recognition of tax benefits of an uncertain tax position is permitted only to the extent the position is “more likely than not” to be sustained assuming examination by taxing authorities. Management has analyzed the Portfolio’s tax positions taken on federal, state and local income tax returns for all open tax years (for up to three tax years), and has concluded that no provisions for federal,
state and local income tax are required in the Portfolio’s financial statements. The Portfolio’s federal, state and local income and federal excise tax returns for tax years for which the applicable statutes of limitations have not expired are subject to examination by the Internal Revenue Service and state and local departments of revenue. The Portfolio’s federal, state and local income and federal excise tax returns for tax years for which the applicable statutes of limitations have not expired are subject to examination by the Internal Revenue Service and local departments of revenue.
(C) Foreign Taxes. The Portfolio may be subject to foreign taxes on income and other transaction-based taxes imposed by certain countries in which it invests. A portion of the taxes on gains on investments or currency purchases/repatriation may be reclaimable. The Portfolio will accrue such taxes and reclaims as applicable, based upon its current interpretation of tax rules and regulations that exist in the markets in which it invests.
The Portfolio may be subject to taxation on realized capital gains, repatriation proceeds and other transaction-based taxes imposed by certain countries in which it invests. The Portfolio will accrue such taxes as applicable based upon its current interpretation of tax rules and regulations that exist in the market in which it invests. Capital gains taxes relating to positions still held are reflected as a liability on the Statement of Assets and Liabilities, as well as an adjustment to the Portfolio’s net unrealized appreciation (depreciation). Taxes related to capital gains realized during the six-month period ended June 30, 2017, if any, are reflected as part of net realized gain (loss) in the Statement of Operations. Changes in tax liabilities related to capital gains taxes on unrealized investment gains, if any, are reflected as part of the change in net unrealized appreciation (depreciation) on investments in the Statement of Operations. Transaction-based charges are generally assessed as a percentage of the transaction amount.
(D) Dividends and Distributions to Shareholders. Dividends and distributions are recorded on the ex-dividend date. The Portfolio intends to declare and pay dividends from net investment income and distributions from net realized capital and currency gains, if any, at least annually. Unless the shareholder elects otherwise, all dividends and distributions are reinvested in the same class of shares of the Portfolio, at NAV. Dividends and distributions to shareholders are determined in accordance with federal income tax regulations and may differ from GAAP.
(E) Security Transactions and Investment Income. The Portfolio records security transactions on the trade date. Realized gains and losses on security transactions are determined using the identified cost method. Dividend income is recognized on the ex-dividend date; net of any foreign tax withheld at the source, and interest income is accrued as earned using the effective interest rate method. Discounts and premiums on Short-Term Investments are accreted and amortized, respectively, on the straight-line method. The straight-line method approximates the effective interest method for Short-Term Investments.
Investment income and realized and unrealized gains and losses on investments of the Portfolio are allocated pro rata to the separate classes of shares based upon their relative net assets on the date the income is earned or realized and unrealized gains and losses are incurred.
| | |
| 26 | | MainStay VP Emerging Markets Equity Portfolio |
(F) Expenses. Expenses of the Fund are allocated to the individual Portfolios in proportion to the net assets of the respective Portfolios when the expenses are incurred, except where direct allocations of expenses can be made. Expenses (other than fees incurred under the distribution and service plans, further discussed in Note 3(B), which are charged directly to the Service Class shares) are allocated to separate classes of shares pro rata based upon their relative net assets on the date the expenses are incurred. The expenses borne by the Portfolio, including those of related parties to the Portfolio, are shown in the Statement of Operations. Additionally, the Portfolio may invest in shares of ETFs or mutual funds, which are subject to management fees and other fees that may increase their costs versus the costs of owning the underlying securities directly. These indirect expenses of ETFs or mutual funds are not included in the amounts shown as expenses on the Portfolio’s Statement of Operations or in the expense ratios included in the financial highlights.
(G) Use of Estimates. In preparing financial statements in conformity with GAAP, management makes estimates and assumptions that affect the reported amounts and disclosures in the financial statements. Actual results could differ from those estimates.
(H) Repurchase Agreements. The Portfolio may enter into repurchase agreements (i.e., buy a security from another party with the agreement that it be sold back in the future) to earn income. The Portfolio may enter into repurchase agreements only with counterparties, usually financial institutions that are deemed by the Manager or Subadvisors to be creditworthy, pursuant to guidelines established by the Board. During the term of any repurchase agreement, the Manager or Subadvisors will continue to monitor the creditworthiness of the counterparty. Under the 1940 Act, repurchase agreements are considered to be collateralized loans by the Portfolio to the counterparty secured by the securities transferred to the Portfolio.
Repurchase agreements are subject to counterparty risk, meaning the Portfolio could lose money by the counterparty’s failure to perform under the terms of the agreement. The Portfolio mitigates this risk by ensuring the repurchase agreement is collateralized by cash, U.S. government securities, fixed income securities and/or other securities. The collateral is held by the Portfolio’s custodian and valued daily on a mark to market basis to determine if the value, including accrued interest, exceeds the repurchase price. In the event of the counterparty’s default on the obligation to repurchase, the Portfolio has the right to liquidate the collateral and apply the proceeds in satisfaction of the obligation. Under certain circumstances, such as in the event of default or bankruptcy by the counterparty, realization and/or retention of the collateral may be limited or subject to delay, to legal proceedings and possible realized loss to the Portfolio.
(I) Futures Contracts. A futures contract is an agreement to purchase or sell a specified quantity of an underlying instrument at a specified future date and price, or to make or receive a cash payment based on the value of a financial instrument (e.g., foreign currency, interest rate, security, or securities index). The Portfolio is subject to risks such as market price risk and/or interest rate risk in the normal course of investing in these transactions. Upon entering into a futures contract, the Portfolio is required to pledge to the broker or futures commission merchant an amount of cash and/or U.S. Government securities equal to a certain percentage of the collateral amount, known as the “initial
margin.” During the period the futures contract is open, changes in the value of the contract are recognized as unrealized appreciation or depreciation by marking to market such contract on a daily basis to reflect the market value of the contract at the end of each day’s trading. The Portfolio agrees to receive from or pay to the broker or futures commission merchant an amount of cash equal to the daily fluctuation in the value of the contract. Such receipts or payments are known as “variation margin.” When the futures contract is closed, the Portfolio records a realized gain or loss equal to the difference between the proceeds from (or cost of) the closing transaction and the Portfolio’s basis in the contract.
The use of futures contracts involves, to varying degrees, elements of market risk in excess of the amount recognized in the Statement of Assets and Liabilities. The contract or notional amounts and variation margin reflect the extent of the Portfolio’s involvement in open futures positions. There are several risks associated with the use of futures contracts as hedging techniques. There can be no assurance that a liquid market will exist at the time when the Portfolio seeks to close out a futures contract. If no liquid market exists, the Portfolio would remain obligated to meet margin requirements until the position is closed. Futures may involve a small initial investment relative to the risk assumed, which could result in losses greater than if they had not been used. Futures may be more volatile than direct investments in the instrument underlying the futures, and may not correlate to the underlying instrument, causing a given hedge not to achieve its objectives. The Portfolio’s activities in futures contracts have minimal counterparty risk as they are conducted through regulated exchanges that guarantee the futures against default by the counterparty. In the event of a bankruptcy or insolvency of a futures commission merchant that holds margin on behalf of the Portfolio, the Portfolio may not be entitled to the return of the entire margin owed to the Portfolio, potentially resulting in a loss. The Portfolio’s investment in futures contracts and other derivatives may increase the volatility of the Portfolio’s NAV and may result in a loss to the Portfolio. As of June 30, 2017, the Portfolio did not have any open futures contracts.
(J) Equity Swaps (Total Return Swaps). Total return swap contracts are agreements between counterparties to exchange cash flow, one based on a market-linked return of an individual asset or group of assets (such as an index), and the other on a fixed or floating rate. As a total return swap, an equity swap may be structured in different ways. For example, when the Portfolio enters into a “long” equity swap, the counterparty may agree to pay the Portfolio the amount, if any, by which the notional amount of the equity swap would have increased in value had it been invested in a particular referenced security or securities, plus the dividends that would have been received on those securities. In return, the Portfolio will generally agree to pay the counterparty interest on the notional amount of the equity swap plus the amount, if any, by which that notional amount would have decreased in value had it been invested in such referenced security or securities, plus, in certain instances, commissions or trading spreads on the notional amounts. Therefore, the Portfolio’s return on the equity swap generally should equal the gain or loss on the notional amount, plus dividends on the referenced security or securities less the interest paid by the Portfolio on the notional amount. Alternatively, when the Portfolio enters into a “short” equity swap, the counterparty will generally agree to pay the Portfolio the amount, if any, by which the notional
Notes to Financial Statements (Unaudited) (continued)
amount of the equity swap would have decreased in value had the Portfolio sold a particular referenced security or securities short, less the dividend expense that the Portfolio would have incurred on the referenced security or securities, as adjusted for interest payments or other economic factors. In this situation, the Portfolio will generally be obligated to pay the amount, if any, by which the notional amount of the swap would have increased in value had it been invested directly in the referenced security or securities.
Equity swaps generally do not involve the delivery of securities or other referenced assets. Accordingly, the risk of loss with respect to equity swaps is normally limited to the net amount of payments that the Portfolio is contractually obligated to make. If the other party to an equity swap defaults, the Portfolio’s risk of loss consists of the net amount of payments that the Portfolio is contractually entitled to receive, if any. The Portfolio will segregate cash or liquid assets, enter into offsetting transactions or use other measures permitted by applicable law to “cover” the Portfolio’s current obligations. The Portfolio and New York Life Investments, however, believe these transactions do not constitute senior securities under the 1940 Act and, accordingly, will not treat them as being subject to the Portfolio’s borrowing restrictions.
Equity swaps are derivatives and their value can be very volatile. The Portfolio may engage in total return swaps to gain exposure to emerging markets securities, along with offsetting long total return swap positions to maintain appropriate currency balances and risk exposures across all swap positions. To the extent that the Manager, or Subadvisors does not accurately analyze and predict future market trends, the values or assets or economic factors, the Portfolio may suffer a loss, which may be substantial.
(K) Securities Sold Short. The Portfolio may engage in sales of securities it does not own (“short sales”) as part of its investment strategies. When the Portfolio enters into a short sale, it must segregate or maintain with a broker the cash proceeds from the security sold short or other securities as collateral for its obligation to deliver the security upon conclusion of the sale. During the period a short position is open, depending on the nature and type of security, a short position is reflected as a liability and is marked to market in accordance with the valuation methodologies previously detailed (See Note 2(B)). Liabilities for securities sold short are closed out by purchasing the applicable securities for delivery to the counterparty broker. A gain, limited to the price at which the Portfolio sold the security short, or a loss, unlimited as to dollar amount, will be recognized upon termination of a short sale if the market price on the date the short position is closed out is less or greater, respectively, than the proceeds originally received. Any such gain or loss may be offset, completely or in part, by the change in the value of the hedged investments.
(L) Foreign Currency Transactions. The Portfolio’s books and records are maintained in U.S. dollars. Prices of securities denominated in foreign currency amounts are translated into U.S. dollars at the mean between the buying and selling rates last quoted by any major U.S. bank at the following dates:
| (i) | market value of investment securities, other assets and liabilities—at the valuation date; and |
| (ii) | purchases and sales of investment securities, income and expenses—at the date of such transactions. |
The assets and liabilities that are denominated in foreign currency amounts are presented at the exchange rates and market values at the close of the period. The realized and unrealized changes in net assets arising from fluctuations in exchange rates and market prices of securities are not separately presented.
Net realized gain (loss) on foreign currency transactions represents net gains and losses on foreign currency forward contracts, net currency gains or losses realized as a result of differences between the amounts of securities sale proceeds or purchase cost, dividends, interest and withholding taxes as recorded on the Portfolio’s books, and the U.S. dollar equivalent amount actually received or paid. Net currency gains or losses from valuing such foreign currency denominated assets and liabilities, other than investments at valuation date exchange rates, are reflected in unrealized foreign exchange gains or losses.
(M) Rights and Warrants. Rights are certificates that permit the holder to purchase a certain number of shares, or a fractional share, of a new stock from the issuer at a specific price. Warrants are instruments that entitle the holder to buy an equity security at a specific price for a specific period of time. These investments can provide a greater potential for profit or loss than an equivalent investment in the underlying security. Prices of these investments do not necessarily move in tandem with the prices of the underlying securities.
There is risk involved in the purchase of rights and warrants in that these investments are speculative investments. The Portfolio could also lose the entire value of its investment in warrants if such warrants are not exercised by the date of its expiration. The Portfolio is exposed to risk until the sale or exercise of each right or warrant is completed. As of June 30, 2017, the Fund did not hold any rights or warrants.
(N) Securities Lending. In order to realize additional income, the Portfolio may engage in securities lending, subject to the limitations set forth in the 1940 Act and relevant guidance by the staff of the Securities and Exchange Commission (“SEC”). In the event the Portfolio does engage in securities lending, the Portfolio will lend through its custodian, State Street Bank and Trust Company (“State Street”). State Street will manage the Portfolio’s collateral in accordance with the lending agreement between the Portfolio and State Street, and indemnify the Portfolio against counterparty risk. The loans will be collateralized by U.S. Treasury securities at least equal at all times to the market value of the securities loaned. The Portfolio may bear the risk of delay in recovery of, or loss of rights in, the securities loaned should the borrower of the securities experience financial difficulty. The Portfolio may also record a realized gain or loss on securities deemed sold due to a borrower’s inability to return securities on loan. The Portfolio bears the risk of any loss on investment of the collateral. The Portfolio will receive compensation for lending its securities in the form of fees or it will retain a portion of interest on the investment of any cash received as collateral. The Portfolio will also continue to receive interest and dividends on the securities loaned and any gain or loss in the market price of the securities loaned that may occur during the term of the loan will be for the account of the Portfolio. During the six-month period ended June 30, 2017, the Portfolio did not have any portfolio securities on loan.
(O) Foreign Securities Risk. The Portfolio may invest in foreign securities, which carry certain risks that are in addition to the usual risks
| | |
| 28 | | MainStay VP Emerging Markets Equity Portfolio |
inherent in domestic securities. These risks include those resulting from currency fluctuations, future adverse political or economic developments and possible imposition of currency exchange blockages or other foreign governmental laws or restrictions. These risks are likely to be greater in emerging markets than in developed markets. The ability of issuers of securities held by the Portfolio to meet their obligations may be affected by economic or political developments in a specific country, industry or region.
For example, the Portfolio’s portfolio has significant investments in the Asia-Pacific region. The development and stability of the Asia-Pacific region can be adversely affected by, among other regional and global developments, trade barriers, exchange controls and other measures imposed or negotiated by the countries with which they trade. Some Asia-Pacific countries can be characterized as emerging markets or newly industrialized and may experience more volatile economic cycles and less liquid markets than developed countries.
(P) Counterparty Credit Risk. In order to better define its contractual rights and to secure rights that will help a Portfolio mitigate its counterparty risk, the Portfolio may enter into an International Swaps and Derivatives Association, Inc. Master Agreement (“ISDA Master Agreement”) or similar agreement with its counterparties. An ISDA Master Agreement is a bilateral agreement between the Portfolio and a counterparty that governs certain OTC derivatives and typically contains collateral posting terms and netting provisions. Under an ISDA Master Agreement, the Portfolio may, under certain circumstances, offset with the counterparty certain derivative financial instruments’ payables and/or receivables with collateral held and/or posted and create one single net payment. The provisions of the ISDA Master Agreement typically permit a single net payment in the event of default including the bankruptcy or insolvency of the counterparty. Bankruptcy or insolvency laws of a particular jurisdiction may restrict or prohibit the right of offset in bankruptcy, insolvency or other events. In addition, certain ISDA Master Agreements may contain provisions for early termination of OTC derivative transactions in the event the net assets of the Portfolio decline below specific levels or if the Portfolio fails to meet the terms of its ISDA Master Agreements. The result would cause the Portfolio to accelerate payment of any net liability owed to the counterparty.
For financial reporting purposes, the Portfolios do not offset derivative assets and derivative liabilities that are subject to netting arrangements, if any, in the Statement of Assets and Liabilities.
(Q) Indemnifications. Under the Fund’s organizational documents, its officers and trustees are indemnified against certain liabilities that may arise out of performance of their duties to the Fund. Additionally, in the normal course of business, each Portfolio enters into contracts with third-party service providers that contain a variety of representations and warranties and which may provide general indemnifications. The Portfolio’s maximum exposure under these arrangements is unknown, as this would involve future claims that may be made against the Portfolio that have not yet occurred. Based on experience, management is of the view that the risk of loss in connection with these potential indemnification obligations is remote. However, there can be no assurance that material liabilities related to such obligations will not arise in the future, which could adversely impact the Portfolio.
(R) Quantitative Disclosure of Derivative Holdings. The following tables show additional disclosures related to the Portfolio’s derivative and hedging activities, including how such activities are accounted for and their effect on the Portfolio’s financial positions, performance and cash flows. The Portfolio entered into total return swap contracts to gain exposure to emerging market securities, along with offsetting long total return swap positions to maintain appropriate currency balances and risk exposures across all swap positions. These derivatives are not accounted for as hedging instruments.
Fair value of derivative instruments as of June 30, 2017:
Realized Gain (Loss)
| | | | | | | | | | |
| | | Statement of
Operations
Location | | Equity
Contracts
Risk | | | Total | |
Futures Contracts | | Net realized gain (loss) on futures transactions | | $ | 488,315 | | | $ | 488,315 | |
Total Return Equity Swap Contracts | | Net realized gain (loss) on swap transactions | | | 1,893,466 | | | | 1,893,466 | |
| | | | | | |
Total Realized Gain (Loss) | | | | $ | 2,381,781 | | | $ | 2,381,781 | |
| | | | | | |
Change in Unrealized Appreciation (Depreciation)
| | | | | | | | | | |
| | | Statement of
Operations
Location | | Equity
Contracts
Risk | | | Total | |
Total Return Equity Swap Contracts | | Net change in unrealized appreciation (depreciation) on swap contracts | | $ | (3,619,529 | ) | | $ | (3,619,529 | ) |
| | | | | | |
Total Change in Unrealized Appreciation (Depreciation) | | | | $ | (3,619,529 | ) | | $ | (3,619,529 | ) |
| | | | | | |
Average Notional Amount
| | | | | | | | |
| | | Equity
Contracts
Risk | | | Total | |
Futures Contracts Long (a) | | $ | 5,286,630 | | | $ | 5,286,630 | |
| Futures Contracts Short (b) | | $ | (3,965,010 | ) | | $ | (3,965,010 | ) |
| Swap Contracts Long (c) | | $ | 58,763,078 | | | $ | 58,763,078 | |
| Swap Contracts Short (c) | | $ | (57,326,953 | ) | | $ | (57,326,953 | ) |
| | | | | | | | |
| (a) | Positions were open two months during the reporting period. |
| (b) | Positions were open one month during the reporting period. |
| (c) | Positions were open three months during the reporting period. |
Note 3–Fees and Related Party Transactions
(A) Manager and Subadvisors. New York Life Investments, a registered investment adviser and an indirect, wholly-owned subsidiary of New York Life, serves as the Portfolio’s Manager pursuant to an Amended and Restated Management Agreement (“Management Agreement”). The Manager provides offices, conducts clerical,
Notes to Financial Statements (Unaudited) (continued)
recordkeeping and bookkeeping services, and keeps most of the financial and accounting records required to be maintained by the Portfolio. Except for the portion of salaries and expenses that are the responsibility of the Portfolio, the Manager pays the salaries and expenses of all personnel affiliated with the Portfolio and certain operational expenses of the Portfolio. The Portfolio reimburses New York Life Investments in an amount equal to a portion of the compensation of the Chief Compliance Officer attributable to the Portfolio. Pursuant to the terms of a Subadvisory Agreement with New York Life Investments, Cornerstone Capital Management Holdings LLC (“Cornerstone Holdings” or “Subadvisor”), a registered investment adviser and an indirect, wholly-owned subsidiary of New York Life, serves as a Subadvisor to the Portfolio. Candriam Belgium (“Candriam Belgium” or “Subadvisor,” and, together with Cornerstone Holdings, the “Subadvisors”), a registered investment adviser and a direct, wholly-owned subsidiary of New York Life, serves as a Subadvisor to the Portfolio. New York Life Investments pays for the services of the Subadvisors.
The Fund, on behalf of the Portfolio, pays New York Life Investments in its capacity as the Portfolio’s investment manager and administrator, pursuant to the Management Agreement, a monthly fee for services performed and facilities furnished at an annual rate of the Portfolio’s average daily net assets. Effective May 1, 2017, the Fund, on behalf of the Portfolio, pays New York Life Investments at the rate of 1.05% on assets up to $1 billion and 1.025% on assets over $1 billion. Prior to May 1, 2017, the Fund, on behalf of the Portfolio, paid New York Life Investments at the rate of 1.10% up to $1 billion; and 1.09% in excess of $1 billion. During the six-month period ended June 30, 2017, the effective management fee rate was 1.08%.
During the six-month period ended June 30, 2017, New York Life Investments earned fees from the Portfolio in the amount of $2,610,323.
State Street provides sub-administration and sub-accounting services to the Portfolio pursuant to an agreement with New York Life Investments. These services include calculating the daily NAVs of the Portfolio, maintaining the general ledger and sub-ledger accounts for the calculation of the Portfolio’s NAVs, and assisting New York Life Investments in conducting various aspects of the Portfolio’s administrative operations. For providing these services to the Portfolio, State Street is compensated by New York Life Investments.
(B) Distribution and Service Fees. The Fund, on behalf of the Portfolio, has entered into a distribution agreement with NYLIFE Distributors LLC (the “Distributor”), an indirect, wholly-owned subsidiary of New York Life. The Portfolio has adopted a distribution plan (the “Plan”) in accordance with the provisions of Rule 12b-1 under the 1940 Act. Under the Plan, the Distributor has agreed to provide, through its affiliates or independent third parties, various distribution-related, shareholder and administrative support services to the Service Class shareholders. For its services, the Distributor is entitled to a combined distribution and service fee accrued daily and paid monthly at an annual rate of 0.25% of the average daily net assets attributable to the Service Class shares of the Portfolio.
Note 4–Federal Income Tax
During the year ended December 31, 2016, the tax character of distributions paid as reflected in the Statement of Changes in Net Assets was as follows:
| | |
| 2016 |
Tax-Based
Distributions
from Ordinary
Income | | Tax-Based
Distributions
from Long-Term
Gains |
| $1,346,204 | | $— |
Note 5–Custodian
State Street is the custodian of cash and securities held by the Portfolio. Custodial fees are charged to the Portfolio based on the Portfolio’s net assets and/or the market value of securities held by the Portfolio and the number of certain transactions incurred by the Portfolio.
Note 6–Line of Credit
The Portfolio and certain other funds managed by New York Life Investments, maintain a line of credit with a syndicate of banks in order to secure a source of funds for temporary purposes to meet unanticipated or excessive redemption requests.
Effective August 1, 2017, under the credit agreement (the “Credit Agreement”), the aggregate commitment amount is $600,000,000 with an additional uncommitted amount of $100,000,000. The commitment fee is an annual rate of 0.15% of the average commitment amount payable quarterly, regardless of usage, to State Street, who serves as the agent to the syndicate. The commitment fee is allocated among the Portfolio and certain other funds managed by New York Life Investments based upon their respective net assets and other factors. Interest on any revolving credit loan is charged based upon the Federal Funds Advances Rate or the one month LIBOR, whichever is higher. The Credit Agreement expires on July 31, 2018, although the Portfolio, certain other funds managed by New York Life Investments and the syndicate of banks may renew the Credit Agreement for an additional year on the same or different terms. Prior to August 1, 2017, the aggregate commitment amount was $600,000,000 with an additional uncommitted amount of $100,000,000, and the commitment fee, under a credit agreement for which Bank of New York Mellon served as agent, was at an annual rate of 0.15% of the average commitment amount. During the six-month period ended June 30, 2017, there were no borrowings made or outstanding with respect to the Portfolio under the credit agreement for which Bank of New York Mellon served as agent.
Note 7–Interfund Lending Program
Pursuant to an exemptive order issued by the SEC, the Portfolio, along with certain other funds managed by New York Life Investments, may participate in an interfund lending program. The interfund lending program provides an alternative credit facility that permits the Portfolio and certain other funds managed by New York Life Investments to lend or borrow money for temporary purposes directly to or from one another subject to the conditions of the exemptive order. During the six-month period ended June 30, 2017, there were no interfund loans made or outstanding with respect to the Portfolio.
| | |
| 30 | | MainStay VP Emerging Markets Equity Portfolio |
Note 8–Purchases and Sales of Securities (in 000’s)
During the six-month period ended June 30, 2017, purchases and sales of securities, other than short-term securities, were $486,661 and $419,992, respectively.
Note 9–Capital Share Transactions
Transactions in capital shares for the six-month period ended June 30, 2017, and the year ended December 31, 2016, were as follows:
| | | | | | | | |
Initial Class | | Shares | | | Amount | |
Six-month period ended June 30, 2017: | | | | | | | | |
Shares sold | | | 9,398,901 | | | $ | 79,875,533 | |
Shares redeemed | | | (1,786,093 | ) | | | (14,835,037 | ) |
| | | | |
Net increase (decrease) | | | 7,612,808 | | | $ | 65,040,496 | |
| | | | |
Year ended December 31, 2016: | | | | | | | | |
Shares sold | | | 9,083,670 | | | $ | 64,487,491 | |
Shares issued to shareholders in reinvestment of dividends and distributions | | | 139,940 | | | | 1,097,408 | |
Shares redeemed | | | (3,455,425 | ) | | | (25,436,461 | ) |
| | | | |
Net increase (decrease) | | | 5,768,185 | | | $ | 40,148,438 | |
| | | | |
| | |
| | | | | | | | |
Service Class | | Shares | | | Amount | |
Six-month period ended June 30, 2017: | | | | | | | | |
Shares sold | | | 2,260,451 | | | $ | 18,513,783 | |
Shares redeemed | | | (2,319,226 | ) | | | (19,266,267 | ) |
| | | | |
Net increase (decrease) | | | (58,775 | ) | | $ | (752,484 | ) |
| | | | |
Year ended December 31, 2016: | | | | | | | | |
Shares sold | | | 1,847,412 | | | $ | 12,962,295 | |
Shares issued to shareholders in reinvestment of dividends and distributions | | | 31,753 | | | | 248,796 | |
Shares redeemed | | | (4,323,334 | ) | | | (31,133,570 | ) |
| | | | |
Net increase (decrease) | | | (2,444,169 | ) | | $ | (17,922,479 | ) |
| | | | |
Note 10–Recent Accounting Pronouncement
In October 2016, the SEC adopted new rules and amended existing rules (together, “final rules”) intended to modernize the reporting and disclosure of information by registered investment companies. In part, the final rules amend Regulation S-X and require standardized, enhanced disclosure about derivatives in investment company financial statements, as well as other amendments. The compliance date for the amendments to Regulation S-X is August 1, 2017 and applies to shareholder reports for funds with fiscal periods ending after August 1, 2017. Management is currently evaluating the impact that the adoption of the amendments to Regulation S-X will have on the Portfolio’s financial statements and related disclosures.
Note 11–Subsequent Events
In connection with the preparation of the financial statements of the Portfolio as of and for the six-month period ended June 30, 2017, events and transactions subsequent to June 30, 2017, through the date the financial statements were issued have been evaluated by the Portfolio’s management for possible adjustment and/or disclosure. No subsequent events requiring financial statement adjustment or disclosure have been identified.
Proxy Voting Policies and Procedures and Proxy Voting Record
A description of the policies and procedures that New York Life Investments uses to vote proxies related to the Portfolio’s securities is available without charge, upon request, (i) by calling 800-598-2019 or (ii) by visiting the SEC’s website at www.sec.gov.
The Portfolio is required to file with the SEC its proxy voting record for the 12-month period ending June 30 on Form N-PX. The Portfolio’s most recent Form N-PX or proxy voting record is available free of charge upon request (i) by calling 800-598-2019 or; (ii) by visiting the SEC’s website at www.sec.gov.
Shareholder Reports and Quarterly Portfolio Disclosure
The Portfolio is required to file its complete schedule of portfolio holdings with the SEC for its first and third fiscal quarters on Form N-Q. The Portfolio’s Form N-Q is available without charge on the SEC’s website at www.sec.gov or by calling MainStay Investments at 800-598-2019. You also can obtain and review copies of Form N-Q by visiting the SEC’s Public Reference Room in Washington, DC (information on the operation of the Public Reference Room may be obtained by calling 1-800-SEC-0330).
| | |
| 32 | | MainStay VP Emerging Markets Equity Portfolio |
This page intentionally left blank
This page intentionally left blank
MainStay VP Portfolios
MainStay VP offers a wide range of Portfolios. The full array of MainStay VP offerings is listed here, with information about the manager, subadvisors, legal counsel, and independent registered public accounting firm.
Equity Portfolios
MainStay VP Common Stock Portfolio
MainStay VP Cornerstone Growth Portfolio
MainStay VP Eagle Small Cap Growth Portfolio
MainStay VP Emerging Markets Equity Portfolio
MainStay VP Epoch U.S. Equity Yield Portfolio
MainStay VP Epoch U.S. Small Cap Portfolio
MainStay VP International Equity Portfolio
MainStay VP Large Cap Growth Portfolio
MainStay VP MFS® Utilities Portfolio
MainStay VP Mid Cap Core Portfolio
MainStay VP S&P 500 Index Portfolio
MainStay VP Small Cap Core Portfolio
MainStay VP T. Rowe Price Equity Income Portfolio
MainStay VP VanEck Global Hard Assets Portfolio
Mixed Asset Portfolios
MainStay VP Balanced Portfolio
MainStay VP Convertible Portfolio
MainStay VP Cushing Renaissance Advantage Portfolio
MainStay VP Income Builder Portfolio
MainStay VP Janus Henderson Balanced Portfolio
Income Portfolios
MainStay VP Bond Portfolio
MainStay VP Floating Rate Portfolio
MainStay VP Government Portfolio
MainStay VP High Yield Corporate Bond Portfolio
MainStay VP Indexed Bond Portfolio
MainStay VP PIMCO Real Return Portfolio
MainStay VP Unconstrained Bond Portfolio
Money Market
MainStay VP U.S. Government Money Market Portfolio
Alternative
MainStay VP Absolute Return Multi-Strategy Portfolio
Asset Allocation Portfolios
MainStay VP Conservative Allocation Portfolio
MainStay VP Growth Allocation Portfolio
MainStay VP Moderate Allocation Portfolio
MainStay VP Moderate Growth Allocation Portfolio
Manager
New York Life Investment Management LLC
New York, New York
Subadvisors
Candriam Belgium*
Brussels, Belgium
Candriam France S.A.S.*
Paris, France
Cornerstone Capital Management Holdings LLC*
New York, New York
Cushing Asset Management, LP
Dallas, Texas
Eagle Asset Management, Inc.
St Petersburg, Florida
Epoch Investment Partners, Inc.
New York, New York
Janus Capital Management LLC
Denver, Colorado
MacKay Shields LLC*
New York, New York
Massachusetts Financial Services Company
Boston, Massachusetts
NYL Investors LLC*
New York, New York
Pacific Investment Management Company LLC
Newport Beach, California
T. Rowe Price Associates, Inc.
Baltimore, Maryland
Van Eck Associates Corporation
New York, New York
Winslow Capital Management, LLC
Minneapolis, Minnesota
Distributor
NYLIFE Distributors LLC*
Jersey City, New Jersey
Custodian
State Street Bank and Trust Company
Boston, Massachusetts
Independent Registered Public Accounting Firm
PricewaterhouseCoopers LLP
New York, New York
Legal Counsel
Dechert LLP
Washington, District of Columbia
Some Portfolios may not be available in all products.
* An affiliate of New York Life Investment Management LLC
Not part of the Semiannual Report
2017 Semiannual Report
This report is for the general information of New York Life Variable Annuities and NYLIAC Variable Universal Life Insurance Products policyowners. It must be preceded or accompanied by the appropriate product(s) and funds prospectuses if it is given to anyone who is not an owner of a New York Life variable annuity policy or a NYLIAC Variable Universal Life Insurance Product. This report does not offer for sale or solicit orders to purchase securities.
The performance data quoted in this report represents past performance. Past performance is no guarantee of future results. Due to market volatility and other factors, current performance may be lower or higher than the figures shown. The most recent month-end performance summary for your variable annuity or variable life policy is available by calling 800-598-2019 and is updated periodically on www.newyorklife.com.
The New York Life Variable Annuities and NYLIAC Variable Universal Life Insurance Products are issued by New York Life Insurance and Annuity Corporation (a Delaware Corporation) and distributed by NYLIFE Distributors LLC (Member FINRA/SIPC).
New York Life Insurance Company
New York Life Insurance and Annuity Corporation (NYLIAC) (A Delaware Corporation)
51 Madison Avenue, Room 551
New York, NY 10010
www.newyorklife.com
Printed on recycled paper
mainstayinvestments.com
NYLIFE Distributors LLC, 30 Hudson Street, Jersey City, NJ 07302
New York Life Investment Management LLC is the investment manager to the MainStay VP Funds Trust
©2017 by NYLIFE Distributors LLC. All rights reserved.
You may obtain copies of the Prospectus and the Statement of Additional Information free of charge, upon request, by calling toll-free 800-598-2019 or writing to New York Life Insurance and Annuity Corporation, 51 Madison Avenue, New York, NY 10010.
| | | | |
| Not FDIC Insured | | No Bank Guarantee | | May Lose Value |
| | | | |
| 1744155 | | | | MSVPEME10-08/17 (NYLIAC) NI516 |
MainStay VP Eagle Small Cap Growth Portfolio
Message from the President and Semiannual Report
Unaudited | June 30, 2017

Sign up for electronic delivery of your shareholder reports. For full details on electronic delivery, including who can participate and what you
can receive via eDelivery, please log on to www.newyorklife.com/vsc

This page intentionally left blank
Message from the President
The six months ended June 30, 2017, brought positive results to many stock and bond investors. The year began with many investors hoping that Republican control of the White House, the Senate and the House of Representatives could bring an end to political gridlock; and while debate has continued on a number of issues, the U.S. stock market climbed relatively steadily throughout the first half of 2017.
According to FTSE-Russell U.S. market data, stocks at all capitalization levels tended to record positive total returns during the reporting period, with large-cap stocks generally outperforming stocks of smaller-capitalization companies. Growth stocks outpaced value stocks at every capitalization level by substantial margins—from more than six percentage points for micro-caps and mid-caps to more than 10 percentage points for the largest 200 U.S. companies by market capitalization.
Most sectors of the stock market advanced during the reporting period, with energy and telecommunication services being notable exceptions. Energy stocks declined as oil prices fell despite moves by the Organization of Petroleum Exporting Countries (OPEC) intended to limit oil production by its members. Telecommunication services stocks tended to decline as competition increased and rising interest rates made dividend payouts less appealing.
In March and June of 2017, the Federal Reserve announced successive increases in the target range for the federal funds rate, ultimately bringing the federal funds target range to 1.00% to 1.25%. While short-term U.S. Treasury yields rose in response, yields for U.S. Treasury securities with maturities of five years or longer declined. As the difference between short- and long-term yields narrowed, the advantages of higher-yielding long-term bonds became increasingly apparent.
Virtually all taxable and tax-exempt bond sectors provided positive total returns during the reporting period. Mortgage-backed
securities, though providing positive total returns, faced headwinds when the Federal Reserve announced plans to begin normalizing its balance sheet by reducing reinvestment of principal payments on mortgage-backed securities.
International stock and bond markets were also strong during the reporting period. International stocks provided double-digit total returns that were surpassed by emerging-market stocks as a whole. Global investment-grade bonds provided single-digit returns; and emerging-market debt was somewhat stronger.
Even during periods of favorable market performance and generally positive returns, MainStay believes that it is important to carefully monitor your investments. Your risk tolerance may
change over time, leading you to reevaluate which MainStay VP Portfolios are most appropriate for your long-term goals. Your goals themselves may also change, leading you to pursue investments with more or less risk. The portfolio managers of MainStay VP Portfolios seek to provide results consistent with the investment objectives of their respective Portfolios, to give you a wide range of choices suitable to various investment needs.
The report that follows provides more detailed information about the specific markets, securities and investment decisions that influenced your MainStay VP Portfolio during the six months ended June 30, 2017. We invite you to review the report carefully as part of your ongoing investment evaluation and review.
Sincerely,

Stephen P. Fisher
President
The opinions expressed are as of the date of the accompanying report and are subject to change. Past performance is no guarantee of future results. There is no guarantee that any forecasts made will come to pass. This material does not constitute investment advice and is not intended as an endorsement of any specific investment.
Not all MainStay VP Portfolios and/or share classes are available under all policies.
Not part of the Semiannual Report
Table of Contents
Investors should refer to the Portfolio’s Summary Prospectus and/or Prospectus and consider the Portfolio’s investment objectives, strategies, risks, charges and expenses carefully before investing. The Summary Prospectus and/or Prospectus contain this and other information about the Portfolio. You may obtain copies of the Portfolio’s Summary Prospectus and/or the Prospectus and the Statement of Additional Information free of charge, upon request, by calling toll-free 800-598-2019, by writing to New York Life Insurance and Annuity Corporation, 51 Madison Avenue, Room 251, New York, New York 10010 or by sending an email to MainStayShareholdersServices@nylim.com. These documents are also available at mainstayinvestments.com/vpdocuments. Please read the Summary Prospectus and/or Prospectus carefully before investing. MainStay VP Funds Trust portfolios are separate account options which are purchased through a variable insurance or variable annuity contract.
Investment and Performance Comparison1 (Unaudited)
Performance data quoted represents past performance. Past performance is no guarantee of future results. Because of market volatility and other factors, current performance may be lower or higher than the figures shown. Investment return and principal value will fluctuate, and as a result, when shares are redeemed, they may be worth more or less than their original cost. The performance table and graph do not reflect any deduction of sales charges, mortality and expense charges, contract charges or administrative charges. Please refer to the Performance Summary appropriate for your policy. For performance information current to the most recent month-end, please call 800-598-2019 or visit www.newyorklife.com.
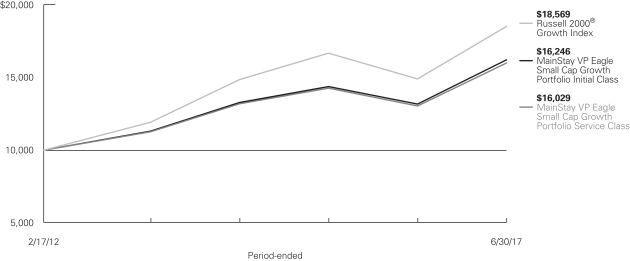
Average Annual Total Returns for the Period Ended June 30, 2017
| | | | | | | | | | | | | | | | | | | | | | | | |
| Class | | Inception Date | | | Six Months | | | One Year | | | Five Years | | | Ten Years
or Since
Inception | | | Gross Expense Ratio2 | |
| Initial Class Shares | | | 2/17/2012 | | | | 11.11 | % | | | 23.05 | % | | | 12.02 | % | | | 9.46 | % | | | 0.86 | % |
| Service Class Shares | | | 2/17/2012 | | | | 10.97 | | | | 22.74 | | | | 11.74 | | | | 9.18 | | | | 1.11 | |
| | | | | | | | | | | | | | | | |
| Benchmark Performance | | Six
Months | | | One
Year | | | Five
Years | | | Ten Years
or Since
Inception | |
Russell 2000® Growth Index3 | | | 9.97 | % | | | 24.40 | % | | | 13.98 | % | | | 12.22 | % |
Average Lipper Variable Products Small-Cap Growth Portfolio4 | | | 11.62 | | | | 23.60 | | | | 13.12 | | | | 11.63 | |
| 1. | Performance figures reflect certain fee waivers and/or expense limitations, without which total returns may have been different. For information on current fee waivers and/or expense limitations (if any), please refer to the Notes to Financial Statements. |
| 2. | The gross expense ratios presented reflect the Portfolio’s “Total Annual Portfolio Operating Expenses” from the most recent Prospectus and may differ from other expense ratios disclosed in this report. |
| 3. | The Russell 2000® Growth Index is the Portfolio’s primary broad-based securities market index for comparison purposes. The Russell 2000® Growth Index measures the performance of the small-cap growth segment of the U.S. equity universe. It includes those Russell 2000® Index companies with higher price-to-book ratios and higher forecasted growth values. Results |
| | assume reinvestment of all dividends and capital gains. An investment cannot be made directly in an index. |
| 4. | The Average Lipper Variable Products Small-Cap Growth Portfolio is representative of portfolios that, by portfolio practice, invest at least 75% of their equity assets in companies with market capitalizations (on a three-year weighted basis) below Lipper’s U.S. Diversified Equity small-cap ceiling. Small-cap growth portfolios typically have above-average characteristics compared to the S&P Small Cap 600® Index. This benchmark is a product of Lipper Inc. Lipper Inc. is an independent monitor of fund performance. Results are based on average total returns of similar portfolios with all dividend and capital gain distributions reinvested. |
Cost in Dollars of a $1,000 Investment in MainStay VP Eagle Small Cap Growth Portfolio (Unaudited)
The example below is intended to describe the fees and expenses borne by shareholders during the six-month period from January 1, 2017 to June 30, 2017, and the impact of those costs on your investment.
Example
As a shareholder of the Portfolio, you incur two types of costs: (1) transaction costs, including exchange fees and sales charges (loads) on purchases (as applicable), and (2) ongoing costs, including management fees, distribution and/or service (12b-1) fees, and other Portfolio expenses (as applicable). This example is intended to help you understand your ongoing costs (in dollars) of investing in the Portfolio and to compare these costs with the ongoing costs of investing in other mutual funds. The example is based on an investment of $1,000 made at the beginning of the six-month period and held for the entire period from January 1, 2017 to June 30, 2017. Shares are only sold in connection with variable life and annuity contracts and the example does not reflect any contract level or transactional fees or expenses. If these costs had been included, your costs would have been higher.
This example illustrates your Portfolio’s ongoing costs in two ways:
Actual Expenses
The second and third data columns in the table below provide information about actual account values and actual expenses. You may use the information in these columns, together with the amount you invested, to estimate the expenses that you paid during the six months ended June 30, 2017. Simply divide your account value by $1,000 (for
example, an $8,600 account value divided by $1,000 = 8.6), then multiply the result by the number under the heading entitled “Expenses Paid During Period” to estimate the expenses you paid on your account during this period.
Hypothetical Example for Comparison Purposes
The fourth and fifth data columns in the table below provide information about hypothetical account values and hypothetical expenses based on the Portfolio’s actual expense ratio and an assumed rate of return of 5% per year before expenses, which is not the Portfolio’s actual return. The hypothetical account values and expenses may not be used to estimate the actual ending account balances or expenses you paid for the six-month period shown. You may use this information to compare the ongoing costs of investing in the Portfolio with the ongoing costs of investing in other mutual funds. To do so, compare this 5% hypothetical example with the 5% hypothetical examples that appear in the shareholder reports of the other mutual funds.
Please note that the expenses shown in the table are meant to highlight your ongoing costs only and do not reflect any transactional costs, such as exchange fees or sales charges (loads). Therefore, the fourth and fifth data columns of the table are useful in comparing ongoing costs only and will not help you determine the relative total costs of owning different funds. In addition, if these transactional costs were included, your costs would have been higher.
| | | | | | | | | | | | | | | | | | | | | | | | |
| | | | | | | | | | | | | | | | | | | |
| Share Class | | Beginning
Account
Value
1/1/17 | | | Ending Account
Value (Based
on Actual
Returns and
Expenses)
6/30/17 | | | Expenses
Paid
During
Period1 | | | Ending Account
Value (Based
on Hypothetical
5% Annualized
Return and
Actual Expenses)
6/30/17 | | | Expenses
Paid
During
Period1 | | | Net Expense
Ratio
During
Period2 | |
| | | | | | |
| Initial Class Shares | | $ | 1,000.00 | | | $ | 1,111.10 | | | $ | 4.45 | | | $ | 1,020.60 | | | $ | 4.26 | | | | 0.85 | % |
| | | | | | |
| Service Class Shares | | $ | 1,000.00 | | | $ | 1,109.70 | | | $ | 5.75 | | | $ | 1,019.30 | | | $ | 5.51 | | | | 1.10 | % |
| 1. | Expenses are equal to the Portfolio’s annualized expense ratio of each class multiplied by the average account value over the period, divided by 365 and multiplied by 181 (to reflect the six-month period). The table above represents the actual expenses incurred during the six-month period. |
| 2. | Expenses are equal to the Portfolio’s annualized expense ratio to reflect the six-month period. |
| | |
| 6 | | MainStay VP Eagle Small Cap Growth Portfolio |
Industry Composition as of June 30, 2017 (Unaudited)
| | | | |
| Software | | | 10.3 | % |
| Biotechnology | | | 9.9 | |
| Electronic Equipment, Instruments & Components | | | 6.8 | |
| Health Care Equipment & Supplies | | | 5.0 | |
| Chemicals | | | 4.4 | |
| Internet Software & Services | | | 4.4 | |
| Banks | | | 3.7 | |
| Machinery | | | 3.7 | |
| Semiconductors & Semiconductor Equipment | | | 3.6 | |
| Building Products | | | 3.3 | |
| Hotels, Restaurants & Leisure | | | 3.1 | |
| Specialty Retail | | | 3.0 | |
| Health Care Technology | | | 2.9 | |
| Commercial Services & Supplies | | | 2.8 | |
| Household Durables | | | 2.5 | |
| Pharmaceuticals | | | 2.4 | |
| Health Care Providers & Services | | | 2.3 | |
| Construction Materials | | | 2.1 | |
| Equity Real Estate Investment Trusts (REITs) | | | 2.0 | |
| Internet & Direct Marketing Retail | | | 1.8 | |
| Insurance | | | 1.6 | |
| | | | |
| Airlines | | | 1.4 | % |
| Capital Markets | | | 1.4 | |
| Aerospace & Defense | | | 1.2 | |
| Distributors | | | 1.2 | |
| IT Services | | | 1.2 | |
| Oil, Gas & Consumable Fuels | | | 1.2 | |
| Life Sciences Tools & Services | | | 1.1 | |
| Road & Rail | | | 1.1 | |
| Auto Components | | | 1.0 | |
| Food Products | | | 1.0 | |
| Multiline Retail | | | 1.0 | |
| Food & Staples Retailing | | | 0.9 | |
| Professional Services | | | 0.8 | |
| Air Freight & Logistics | | | 0.7 | |
| Diversified Consumer Services | | | 0.7 | |
| Electrical Equipment | | | 0.7 | |
| Communications Equipment | | | 0.6 | |
| Textiles, Apparel & Luxury Goods | | | 0.6 | |
| Short-Term Investment | | | 1.0 | |
| Other Assets, Less Liabilities | | | –0.4 | |
| | | | |
| | | 100.0 | % |
| | | | |
See Portfolio of Investments beginning on page 10 for specific holdings within these categories.
Top Ten Holdings or Issuers as of June 30, 2017 (excluding short-term investment) (Unaudited)
| 3. | Universal Electronics, Inc. |
| 4. | Waste Connections, Inc. |
| 5. | Summit Materials, Inc. Class A |
| 6. | Synovus Financial Corp. |
| 7. | John Bean Technologies Corp. |
Portfolio Management Discussion and Analysis (Unaudited)
Answers to the questions reflect the views of portfolio managers Bert L. Boksen, CFA, and Eric Mintz, CFA, of Eagle Asset Management, Inc. (“Eagle”), the Portfolio’s Subadvisor.
How did MainStay VP Eagle Small Cap Growth Portfolio perform relative to its primary benchmark and peers during the six months ended June 30, 2017?
For the six months ended June 30, 2017, MainStay VP Eagle Small Cap Growth Portfolio returned 11.11% for Initial Class shares and 10.97% for Service Class shares. Over the same period, both share classes outperformed the 9.97% return of the Russell 2000® Growth Index,1 which is the Portfolio’s broad-based securities-market index. Both share classes underperformed the 11.62% return of the Average Lipper2 Variable Products Small-Cap Growth Portfolio for the six months ended June 30, 2017.
What factors affected the Portfolio’s relative performance during the reporting period?
The Portfolio’s relative performance was helped by positions in the information technology sector, including select holdings in the electronic equipment, instruments & components industry and the software industry. Solid performance in the industrials sector and, to a lesser extent, in the materials sector also helped the Portfolio’s performance relative to the Russell 2000® Growth Index. The Portfolio’s holdings in the health care sector detracted from relative performance. Despite strong double-digit total returns in the biotechnology industry, the Portfolio held a slightly underweight position in the industry, which led the Portfolio to underperform the even stronger results of biotechnology stocks in the Russell 2000® Index. The financials sector also detracted from relative performance during the reporting period.
Which sectors were the strongest positive contributors to the Portfolio’s relative performance, and which sectors were particularly weak?
The information technology sector provided strong absolute performance and strong returns relative to the Russell 2000® Growth Index. The industrials sector was also a solid positive contributor to the Portfolio’s relative performance, with the Portfolio’s positions in the commercial services & supplies industry driving positive results. (Contributions take weightings and total returns into account.) The Portfolio’s materials holdings also performed well on a relative basis, with holdings in the construction materials industry providing strong performance.
During the reporting period, the Portfolio’s health care sector holdings were the greatest detractors from performance relative to the Russell 2000® Growth Index. Portfolio holdings in the biotechnology industry, despite double-digit absolute performance, could not keep up with biotechnology stocks in the Russell 2000® Growth Index and thus weakened relative performance. Soft results in the Portfolio’s financials sector
holdings also detracted from relative performance during the reporting period.
During the reporting period, which individual stocks made the strongest positive contributions to the Portfolio’s absolute performance and which stocks detracted the most?
Electronic equipment company Coherent was a strong contributor to the Portfolio’s absolute performance. The company makes laser-based equipment used in such applications as smartphone and tablet displays. The company continued to benefit from strong orders for its product used in the fabrication of organic light-emitting diode (OLED) displays. OLED displays, in turn, have increasingly been used in next-generation smartphones. The potential for alternative applications of Coherent’s equipment (e.g., in tablets, autos and televisions) may offer the company additional upside over the longer term. Exact Sciences designs and develops molecular diagnostic tests used in cancer screening and was also a strong performer for the Portfolio during the reporting period. Shares rose as the company announced that it had finalized a reimbursement coverage contract with insurance payer UnitedHealthcare for its Cologuard examination product. IPG Photonics, which makes lasers used in research markets such as communications and medical applications, was also a strong contributor to the Portfolio’s absolute performance. The company has benefited from the solid competitive positioning of its high-power lasers as well as from cost advantages generated through efficient vertical integration.
Shares of footwear, apparel and accessories retailer Genesco—a long-term holding in the Portfolio—faced ongoing pressure in a difficult environment as Amazon.com continued to reshape the landscape for retailers. Genesco reduced its earnings guidance, largely reflecting weak traffic trends at shopping malls. The company continued to drive improved results in its e-commerce channel, which we believe may help offset some of the headwinds affecting the company’s traditional brick-and-mortar channel. RSP Permian is an energy exploration-and-production (E&P) operator in the Permian Basin of West Texas. Consistent with the crude oil–driven sell-off in the broader energy sector, the company’s shares declined. Investors focused on a recovery in North American drilling activity, but production cuts by the Organization of the Petroleum Exporting Countries (OPEC) have been slow to reduce elevated inventory levels. We believed that RSP Permian remained well-positioned to benefit from strong economics derived from its acreage portfolio. Alder Pharmaceuticals primarily develops drugs for the treatment of migraines and rheumatoid arthritis. Despite reporting positive Phase III clinical trial data for its migraine therapy, the company’s shares
| 1. | See footnote on page 5 for more information on the Russell 2000® Growth Index. |
| 2. | See footnote on page 5 for more information on Lipper Inc. |
| | |
| 8 | | MainStay VP Eagle Small Cap Growth Portfolio |
fell when the results were not as compelling as investors had hoped. Although the news was disappointing in the near term, we remain cautiously optimistic given the efficacy of the treatment, particularly in the severely underserved migraine-patient market.
Were there other stocks that were particularly noteworthy during the reporting period?
Other notable contributors to the Portfolio’s performance included aesthetics product companies ZELTIQ Aesthetics and Cynosure as well as pharmaceutical development and manufacturing services provider Patheon. Acquisitions at sizable premiums were announced for each of these companies during the reporting period.
Did the Portfolio make any significant purchases or sales during the reporting period?
The Portfolio purchased a new position in Teladoc, an industry-leading telemedicine provider. We believe that Teladoc’s services may be widely adopted among plan providers because they add value and are convenient and cost effective.
The Portfolio also purchased a new position in Pegasystems, a provider of platform-based business process management, client-relationship management and case-management software. The company’s versatile product offerings are viewed as some of the best in the industry by its customers as well as research and advisory companies. This perceived value has translated into solid contract wins that we believe may continue in the future.
The Portfolio sold its position in Vitamin Shoppe, which is a specialty retailer of vitamins, nutritional supplements, and health and beauty aids. Evolving competitive pressures have plagued the company in recent periods, as expanding product offerings from conventional retailers and online vendors have continued to encroach on Vitamin Shoppe’s market share.
The Portfolio also sold its position in Gigamon, which designs and develops products and services to help provide customers with visibility and control of network traffic. Shares had dipped earlier in the reporting period when the company prereleased lower-than-anticipated quarterly results, attributing the miss to delays in deal closings. Although initially we were cautiously optimistic that the delays were temporary, we ultimately
concluded that it would be prudent to close the position in the absence of near-term catalysts to reaccelerate the stock.
How did the Portfolio’s sector weightings change during the reporting period?
Generally speaking, changes in sector weights tend to be a gradual process, primarily resulting from appreciation or depreciation of existing sector holdings. During the reporting period, we saw the Portfolio’s relative weighting in the health care sector shift from a modestly underweight position to one that was only slightly underweight. This change resulted primarily from the success of some of the Portfolio’s health care positions during the reporting period. As the stocks appreciated, the degree to which the Portfolio was underweight relative to health care stocks in the Russell 2000® Growth Index was reduced. We also saw notable appreciation of some of the Portfolio’s materials sector positions, which moved the Portfolio’s materials weighting from effectively in-line with the Russell 2000® Growth Index to modestly overweight.
During the reporting period, we saw the Portfolio’s relative weighting in the industrials sector shift from an in-line posture to a modestly underweight position relative to the Russell 2000® Growth Index, primarily because of the annual restructuring of the Russell indices. (The process increased the weighting of the industrials sector in the Russell 2000® Growth Index.) As some of the Portfolio’s strong-performing stocks in the information technology sector gave back some ground toward the end of the reporting period, the Portfolio’s overweight position relative to the Russell 2000® Growth Index in information technology decreased but remained modestly overweight.
How was the Portfolio positioned at the end of the reporting period?
As of June 30, 2017, the Portfolio held overweight positions relative to the Russell 2000® Growth Index in information technology and materials and, to a lesser extent, in the financials and consumer discretionary sectors. As of the same date, the Portfolio held a modestly underweight position relative to the Index in the industrials sector, primarily as a result of the Russell 2000® Growth Index reconstitution. Since Russell reconstitutes its indices every June, it is not unusual to see some dispersion in sector weights at the end of the semiannual reporting period.
The opinions expressed are those of the portfolio managers as of the date of this report and are subject to change. There is no guarantee that any forecasts made will come to pass. This material does not constitute investment advice and is not intended as an endorsement of any specific investment.
Not all MainStay VP Portfolios and/or share classes are available under all policies.
Portfolio of Investments June 30, 2017 (Unaudited)
| | | | | | | | |
| | |
| | | Shares | | | Value | |
| Common Stocks 99.4%† | |
Aerospace & Defense 1.2% | | | | | | | | |
Hexcel Corp. | | | 83,418 | | | $ | 4,403,636 | |
| | | | | | | | |
| | |
Air Freight & Logistics 0.7% | | | | | | | | |
Echo Global Logistics, Inc. (a) | | | 129,919 | | | | 2,585,388 | |
| | | | | | | | |
| | |
Airlines 1.4% | | | | | | | | |
¨JetBlue Airways Corp. (a) | | | 224,824 | | | | 5,132,732 | |
| | | | | | | | |
| | |
Auto Components 1.0% | | | | | | | | |
Visteon Corp. (a) | | | 36,804 | | | | 3,756,216 | |
| | | | | | | | |
| | |
Banks 3.7% | | | | | | | | |
Bank of The Ozarks, Inc. | | | 78,764 | | | | 3,691,669 | |
¨Synovus Financial Corp. | | | 133,030 | | | | 5,885,247 | |
UMB Financial Corp. | | | 58,396 | | | | 4,371,524 | |
| | | | | | | | |
| | | | | | | 13,948,440 | |
| | | | | | | | |
Biotechnology 9.9% | | | | | | | | |
Acceleron Pharma, Inc. (a) | | | 73,062 | | | | 2,220,354 | |
Aimmune Therapeutics, Inc. (a) | | | 123,941 | | | | 2,548,227 | |
Akebia Therapeutics, Inc. (a) | | | 169,769 | | | | 2,439,581 | |
Alder Biopharmaceuticals, Inc. (a) | | | 96,822 | | | | 1,108,612 | |
Atara Biotherapeutics, Inc. (a) | | | 98,625 | | | | 1,380,750 | |
Biohaven Pharmaceutical Holding Co., Ltd. (a) | | | 108,918 | | | | 2,722,950 | |
Clovis Oncology, Inc. (a) | | | 32,998 | | | | 3,089,603 | |
Edge Therapeutics, Inc. (a) | | | 229,555 | | | | 2,355,234 | |
Exact Sciences Corp. (a) | | | 100,946 | | | | 3,570,460 | |
Genomic Health, Inc. (a) | | | 60,433 | | | | 1,967,094 | |
Lexicon Pharmaceuticals, Inc. (a) | | | 134,572 | | | | 2,213,709 | |
Ligand Pharmaceuticals, Inc. (a) | | | 17,255 | | | | 2,094,757 | |
Progenics Pharmaceuticals, Inc. (a) | | | 282,609 | | | | 1,918,915 | |
Sage Therapeutics, Inc. (a) | | | 33,410 | | | | 2,660,773 | |
Sarepta Therapeutics, Inc. (a) | | | 43,758 | | | | 1,475,082 | |
TESARO, Inc. (a) | | | 14,698 | | | | 2,055,662 | |
Ultragenyx Pharmaceutical, Inc. (a) | | | 23,940 | | | | 1,486,913 | |
| | | | | | | | |
| | | | | | | 37,308,676 | |
| | | | | | | | |
Building Products 3.3% | | | | | | | | |
Builders FirstSource, Inc. (a) | | | 275,395 | | | | 4,219,051 | |
Masonite International Corp. (a) | | | 64,801 | | | | 4,892,476 | |
Trex Co., Inc. (a) | | | 49,300 | | | | 3,335,638 | |
| | | | | | | | |
| | | | | | | 12,447,165 | |
| | | | | | | | |
Capital Markets 1.4% | | | | | | | | |
¨Stifel Financial Corp. (a) | | | 111,654 | | | | 5,133,851 | |
| | | | | | | | |
| | |
Chemicals 4.4% | | | | | | | | |
¨Quaker Chemical Corp. | | | 94,452 | | | | 13,717,264 | |
| | | | | | | | |
| | |
| | | Shares | | | Value | |
Chemicals (continued) | | | | | | | | |
Sensient Technologies Corp. | | | 36,118 | | | $ | 2,908,582 | |
| | | | | | | | |
| | | | | | | 16,625,846 | |
| | | | | | | | |
Commercial Services & Supplies 2.8% | | | | | | | | |
Ritchie Brothers Auctioneers, Inc. | | | 78,413 | | | | 2,253,589 | |
¨Waste Connections, Inc. | | | 127,438 | | | | 8,209,556 | |
| | | | | | | | |
| | | | | | | 10,463,145 | |
| | | | | | | | |
Communications Equipment 0.6% | | | | | | | | |
Infinera Corp. (a) | | | 212,677 | | | | 2,269,264 | |
| | | | | | | | |
| | |
Construction Materials 2.1% | | | | | | | | |
¨Summit Materials, Inc., Class A (a) | | | 270,945 | | | | 7,822,182 | |
| | | | | | | | |
| | |
Distributors 1.2% | | | | | | | | |
Pool Corp. | | | 37,107 | | | | 4,362,670 | |
| | | | | | | | |
| | |
Diversified Consumer Services 0.7% | | | | | | | | |
Bright Horizons Family Solutions, Inc. (a) | | | 34,665 | | | | 2,676,485 | |
| | | | | | | | |
| | |
Electrical Equipment 0.7% | | | | | | | | |
Thermon Group Holdings, Inc. (a) | | | 134,814 | | | | 2,584,384 | |
| | | | | | | | |
|
Electronic Equipment, Instruments & Components 6.8% | |
Cognex Corp. | | | 45,191 | | | | 3,836,716 | |
¨Coherent, Inc. (a) | | | 52,259 | | | | 11,757,752 | |
IPG Photonics Corp. (a) | | | 31,393 | | | | 4,555,124 | |
Littelfuse, Inc. | | | 13,766 | | | | 2,271,390 | |
Orbotech, Ltd. (a) | | | 100,272 | | | | 3,270,873 | |
| | | | | | | | |
| | | | | | | 25,691,855 | |
| | | | | | | | |
Equity Real Estate Investment Trusts (REITs) 2.0% | |
CubeSmart | | | 39,026 | | | | 938,185 | |
GEO Group, Inc. | | | 89,674 | | | | 2,651,660 | |
Physicians Realty Trust | | | 44,982 | | | | 905,938 | |
Seritage Growth Properties Class A | | | 74,736 | | | | 3,135,175 | |
| | | | | | | | |
| | | | | | | 7,630,958 | |
| | | | | | | | |
Food & Staples Retailing 0.9% | | | | | | | | |
Casey’s General Stores, Inc. | | | 31,198 | | | | 3,341,618 | |
| | | | | | | | |
| | |
Food Products 1.0% | | | | | | | | |
Snyder’s-Lance, Inc. | | | 111,563 | | | | 3,862,311 | |
| | | | | | | | |
|
Health Care Equipment & Supplies 5.0% | |
Integra LifeSciences Holdings Corp. (a) | | | 83,254 | | | | 4,538,176 | |
¨NuVasive, Inc. (a) | | | 66,586 | | �� | | 5,121,795 | |
NxStage Medical, Inc. (a) | | | 135,001 | | | | 3,384,475 | |
Penumbra, Inc. (a) | | | 23,680 | | | | 2,077,920 | |
| † | Percentages indicated are based on Portfolio net assets. |
| ¨ | | Among the Portfolio’s 10 largest holdings, as of June 30, 2017, excluding short-term investment. May be subject to change daily. |
| | | | |
| 10 | | MainStay VP Eagle Small Cap Growth Portfolio | | The notes to the financial statements are an integral part of,
and should be read in conjunction with, the financial statements. |
| | | | | | | | |
| | |
| | | Shares | | | Value | |
| Common Stocks (continued) | | | | | | | | |
Health Care Equipment & Supplies (continued) | |
West Pharmaceutical Services, Inc. | | | 39,176 | | | $ | 3,702,915 | |
| | | | | | | | |
| | | | | | | 18,825,281 | |
| | | | | | | | |
Health Care Providers & Services 2.3% | | | | | | | | |
HealthSouth Corp. | | | 59,639 | | | | 2,886,528 | |
Teladoc, Inc. (a) | | | 98,646 | | | | 3,423,016 | |
Tivity Health, Inc. (a) | | | 57,786 | | | | 2,302,772 | |
| | | | | | | | |
| | | | | | | 8,612,316 | |
| | | | | | | | |
Health Care Technology 2.9% | | | | | | | | |
Cotiviti Holdings, Inc. (a) | | | 103,338 | | | | 3,837,973 | |
Evolent Health, Inc. Class A (a) | | | 73,744 | | | | 1,869,410 | |
HMS Holdings Corp. (a) | | | 166,793 | | | | 3,085,671 | |
Omnicell, Inc. (a) | | | 51,230 | | | | 2,208,013 | |
| | | | | | | | |
| | | | | | | 11,001,067 | |
| | | | | | | | |
Hotels, Restaurants & Leisure 3.1% | |
Chuy’s Holdings, Inc. (a) | | | 62,110 | | | | 1,453,374 | |
Dave & Buster’s Entertainment, Inc. (a) | | | 34,302 | | | | 2,281,426 | |
Penn National Gaming, Inc. (a) | | | 180,683 | | | | 3,866,616 | |
Planet Fitness, Inc. Class A | | | 180,427 | | | | 4,211,166 | |
| | | | | | | | |
| | | | | | | 11,812,582 | |
| | | | | | | | |
Household Durables 2.5% | | | | | | | | |
¨Universal Electronics, Inc. (a) | | | 141,549 | | | | 9,462,551 | |
| | | | | | | | |
| | |
Insurance 1.6% | | | | | | | | |
Enstar Group, Ltd. (a) | | | 18,394 | | | | 3,653,968 | |
ProAssurance Corp. | | | 37,527 | | | | 2,281,642 | |
| | | | | | | | |
| | | | | | | 5,935,610 | |
| | | | | | | | |
Internet & Direct Marketing Retail 1.8% | |
HSN, Inc. | | | 77,828 | | | | 2,482,713 | |
Nutrisystem, Inc. | | | 79,130 | | | | 4,118,717 | |
| | | | | | | | |
| | | | | | | 6,601,430 | |
| | | | | | | | |
Internet Software & Services 4.4% | |
comScore, Inc. (a) | | | 131,607 | | | | 3,454,684 | |
Cornerstone OnDemand, Inc. (a) | | | 114,771 | | | | 4,103,063 | |
LogMeIn, Inc. | | | 36,282 | | | | 3,791,469 | |
MuleSoft, Inc. Class A (a) | | | 75,000 | | | | 1,870,500 | |
WebMD Health Corp. (a) | | | 56,197 | | | | 3,295,954 | |
| | | | | | | | |
| | | | | | | 16,515,670 | |
| | | | | | | | |
IT Services 1.2% | | | | | | | | |
Blackhawk Network Holdings, Inc. (a) | | | 67,545 | | | | 2,944,962 | |
Everi Holdings, Inc. (a) | | | 206,913 | | | | 1,506,327 | |
| | | | | | | | |
| | | | | | | 4,451,289 | |
| | | | | | | | |
Life Sciences Tools & Services 1.1% | |
PRA Health Sciences, Inc. (a) | | | 57,367 | | | | 4,303,099 | |
| | | | | | | | |
| | |
Machinery 3.7% | | | | | | | | |
Chart Industries, Inc. (a) | | | 59,032 | | | | 2,050,181 | |
¨John Bean Technologies Corp. | | | 56,582 | | | | 5,545,036 | |
| | | | | | | | |
| | |
| | | Shares | | | Value | |
Machinery (continued) | | | | | | | | |
WABCO Holdings, Inc. (a) | | | 27,684 | | | $ | 3,529,987 | |
Woodward, Inc. | | | 40,064 | | | | 2,707,525 | |
| | | | | | | | |
| | | | | | | 13,832,729 | |
| | | | | | | | |
Multiline Retail 1.0% | | | | | | | | |
Ollie’s Bargain Outlet Holdings, Inc. (a) | | | 89,593 | | | | 3,816,662 | |
| | | | | | | | |
|
Oil, Gas & Consumable Fuels 1.2% | |
RSP Permian, Inc. (a) | | | 134,514 | | | | 4,340,767 | |
| | | | | | | | |
| | |
Pharmaceuticals 2.4% | | | | | | | | |
Aclaris Therapeutics, Inc. (a) | | | 73,492 | | | | 1,993,103 | |
Dermira, Inc. (a) | | | 63,747 | | | | 1,857,588 | |
Medicines Co. (a) | | | 43,321 | | | | 1,646,631 | |
Prestige Brands Holdings, Inc. (a) | | | 67,627 | | | | 3,571,382 | |
| | | | | | | | |
| | | | | | | 9,068,704 | |
| | | | | | | | |
Professional Services 0.8% | | | | | | | | |
WageWorks, Inc. (a) | | | 44,841 | | | | 3,013,315 | |
| | | | | | | | |
| | |
Road & Rail 1.1% | | | | | | | | |
Landstar System, Inc. | | | 47,133 | | | | 4,034,585 | |
| | | | | | | | |
|
Semiconductors & Semiconductor Equipment 3.6% | |
Ambarella, Inc. (a) | | | 61,201 | | | | 2,971,309 | |
MACOM Technology Solutions Holdings, Inc. (a) | | | 37,248 | | | | 2,077,321 | |
MKS Instruments, Inc. | | | 41,558 | | | | 2,796,853 | |
Nanometrics, Inc. (a) | | | 78,522 | | | | 1,985,821 | |
Veeco Instruments, Inc. (a) | | | 129,902 | | | | 3,617,771 | |
| | | | | | | | |
| | | | | | | 13,449,075 | |
| | | | | | | | |
Software 10.3% | | | | | | | | |
Appian Corp. (a) | | | 150,000 | | | | 2,722,500 | |
Ellie Mae, Inc. (a) | | | 20,914 | | | | 2,298,658 | |
Guidewire Software, Inc. (a) | | | 73,597 | | | | 5,056,850 | |
Imperva, Inc. (a) | | | 69,468 | | | | 3,324,044 | |
Paylocity Holding Corp. (a) | | | 56,181 | | | | 2,538,257 | |
Pegasystems, Inc. | | | 78,196 | | | | 4,562,737 | |
PTC, Inc. (a) | | | 76,014 | | | | 4,189,892 | |
RealPage, Inc. (a) | | | 120,515 | | | | 4,332,514 | |
Tableau Software, Inc. Class A (a) | | | 45,141 | | | | 2,765,789 | |
Take-Two Interactive Software, Inc. (a) | | | 47,005 | | | | 3,449,227 | |
Ultimate Software Group, Inc. (a) | | | 17,109 | | | | 3,593,916 | |
| | | | | | | | |
| | | | | | | 38,834,384 | |
| | | | | | | | |
Specialty Retail 3.0% | | | | | | | | |
Burlington Stores, Inc. (a) | | | 33,883 | | | | 3,116,897 | |
Camping World Holdings, Inc. Class A | | | 73,755 | | | | 2,275,342 | |
Genesco, Inc. (a) | | | 63,105 | | | | 2,139,260 | |
MarineMax, Inc. (a) | | | 198,017 | | | | 3,871,232 | |
| | | | | | | | |
| | | | | | | 11,402,731 | |
| | | | | | | | |
| | | | | | |
The notes to the financial statements are an integral part of,
and should be read in conjunction with, the financial statements. | | | | | 11 | |
Portfolio of Investments June 30, 2017 (Unaudited) (continued)
| | | | | | | | |
| | |
| | | Shares | | | Value | |
| Common Stocks (continued) | |
Textiles, Apparel & Luxury Goods 0.6% | |
Steven Madden, Ltd. (a) | | | 56,728 | | | $ | 2,266,284 | |
| | | | | | | | |
Total Common Stocks
(Cost $298,175,777) | | | | | | | 373,626,953 | |
| | | | | | | | |
| | |
| | | | | | | | |
| | | Principal
Amount | | | | |
| Short-Term Investment 1.0% | |
Repurchase Agreement 1.0% | | | | | | | | |
Fixed Income Clearing Corp.
0.12%, dated 6/30/17
due 7/3/17
Proceeds at Maturity $3,847,361 (Collateralized by a United States Treasury Note with a rate of 2.125% and a maturity date of 9/30/21, with a Principal Amount of $3,850,000 and a Market Value of $3,927,705) | | $ | 3,847,323 | | | | 3,847,323 | |
| | | | | | | | |
Total Short-Term Investment
(Cost $3,847,323) | | | | | | | 3,847,323 | |
| | | | | | | | |
Total Investments
(Cost $302,023,100) (b) | | | 100.4 | % | | | 377,474,276 | |
Other Assets, Less Liabilities | | | (0.4 | ) | | | (1,688,914 | ) |
Net Assets | | | 100.0 | % | | $ | 375,785,362 | |
| (a) | Non-income producing security. |
| (b) | As of June 30, 2017, cost was $302,850,633 for federal income tax purposes and net unrealized appreciation was as follows: |
| | | | |
Gross unrealized appreciation | | $ | 92,024,222 | |
Gross unrealized depreciation | | | (17,400,579 | ) |
| | | | |
Net unrealized appreciation | | $ | 74,623,643 | |
| | | | |
The following is a summary of the fair valuations according to the inputs used as of June 30, 2017, for valuing the Portfolio’s assets.
Asset Valuation Inputs
| | | | | | | | | | | | | | | | |
Description | | Quoted
Prices in
Active
Markets for
Identical
Assets
(Level 1) | | | Significant
Other
Observable
Inputs (Level 2) | | | Significant
Unobservable
Inputs (Level 3) | | | Total | |
| Investments in Securities (a) | | | | | | | | | | | | | | | | |
Common Stocks | | $ | 373,626,953 | | | $ | — | | | $ | — | | | $ | 373,626,953 | |
Short-Term Investment | | | | | | | | | | | | | | | | |
Repurchase Agreement | | | — | | | | 3,847,323 | | | | — | | | | 3,847,323 | |
| | | | | | | | | | | | | | | | |
| Total Investments in Securities | | $ | 373,626,953 | | | $ | 3,847,323 | | | $ | — | | | $ | 377,474,276 | |
| | | | | | | | | | | | | | | | |
| (a) | For a complete listing of investments and their industries, see the Portfolio of Investments. |
The Portfolio recognizes transfers between the levels as of the beginning of the period.
For the period ended June 30, 2017, the Portfolio did not have any transfers among levels. (See Note 2)
As of June 30, 2017, the Portfolio did not hold any investments with significant unobservable inputs (Level 3). (See Note 2)
| | | | |
| 12 | | MainStay VP Eagle Small Cap Growth Portfolio | | The notes to the financial statements are an integral part of,
and should be read in conjunction with, the financial statements. |
Statement of Assets and Liabilities as of June 30, 2017 (Unaudited)
| | | | |
| Assets | |
Investment in securities, at value
(identified cost $302,023,100) | | $ | 377,474,276 | |
Receivables: | |
Dividends and interest | | | 100,795 | |
Fund shares sold | | | 79,943 | |
Other assets | | | 2,016 | |
| | | | |
Total assets | | | 377,657,030 | |
| | | | |
|
| Liabilities | |
Payables: | |
Investment securities purchased | | | 1,395,618 | |
Manager (See Note 3) | | | 252,059 | |
Fund shares redeemed | | | 144,989 | |
Shareholder communication | | | 28,269 | |
Professional fees | | | 24,192 | |
NYLIFE Distributors (See Note 3) | | | 16,432 | |
Custodian | | | 5,754 | |
Trustees | | | 633 | |
Accrued expenses | | | 3,722 | |
| | | | |
Total liabilities | | | 1,871,668 | |
| | | | |
Net assets | | $ | 375,785,362 | |
| | | | |
|
| Net Assets Consist of | |
Shares of beneficial interest outstanding (par value of $.001 per share) unlimited number of shares authorized | | $ | 28,196 | |
Additional paid-in capital | | | 269,938,073 | |
| | | | |
| | | 269,966,269 | |
Net investment loss | | | (1,160,392 | ) |
Accumulated net realized gain (loss) on investments | | | 31,528,309 | |
Net unrealized appreciation (depreciation) on investments | | | 75,451,176 | |
| | | | |
Net assets | | $ | 375,785,362 | |
| | | | |
| | | | |
Initial Class | |
Net assets applicable to outstanding shares | | $ | 295,865,131 | |
| | | | |
Shares of beneficial interest outstanding | | | 22,131,260 | |
| | | | |
Net asset value per share outstanding | | $ | 13.37 | |
| | | | |
Service Class | |
Net assets applicable to outstanding shares | | $ | 79,920,231 | |
| | | | |
Shares of beneficial interest outstanding | | | 6,064,377 | |
| | | | |
Net asset value per share outstanding | | $ | 13.18 | |
| | | | |
| | | | | | |
The notes to the financial statements are an integral part of,
and should be read in conjunction with, the financial statements. | | | | | 13 | |
Statement of Operations for the six months ended June 30, 2017 (Unaudited)
| | | | |
| Investment Income (Loss) | |
Income | |
Dividends | | $ | 473,044 | |
Interest | | | 855 | |
| | | | |
Total income | | | 473,899 | |
| | | | |
Expenses | |
Manager (See Note 3) | | | 1,477,907 | |
Distribution/Service—Service Class (See Note 3) | | | 93,492 | |
Professional fees | | | 31,817 | |
Shareholder communication | | | 29,316 | |
Trustees | | | 4,539 | |
Custodian | | | 3,455 | |
Miscellaneous | | | 8,730 | |
| | | | |
Total expenses | | | 1,649,256 | |
| | | | |
Net investment income (loss) | | | (1,175,357 | ) |
| | | | |
|
| Realized and Unrealized Gain (Loss) on Investments | |
Net realized gain (loss) on investments | | | 14,120,844 | |
Net change in unrealized appreciation (depreciation) on investments | | | 25,412,394 | |
| | | | |
Net realized and unrealized gain (loss) on investments | | | 39,533,238 | |
| | | | |
Net increase (decrease) in net assets resulting from operations | | $ | 38,357,881 | |
| | | | |
| | | | |
| 14 | | MainStay VP Eagle Small Cap Growth Portfolio | | The notes to the financial statements are an integral part of,
and should be read in conjunction with, the financial statements. |
Statements of Changes in Net Assets
for the six months ended June 30, 2017 (Unaudited) and the year ended December 31, 2016
| | | | | | | | |
| | | 2017 | | | 2016 | |
| Increase (Decrease) in Net Assets | |
Operations: | |
Net investment income (loss) | | $ | (1,175,357 | ) | | $ | (1,633,575 | ) |
Net realized gain (loss) on investments | | | 14,120,844 | | | | 18,288,067 | |
Net change in unrealized appreciation (depreciation) on investments | | | 25,412,394 | | | | 15,415,605 | |
| | | | |
Net increase (decrease) in net assets resulting from operations | | | 38,357,881 | | | | 32,070,097 | |
| | | | |
Distributions to shareholders: | |
From net realized gain on investments: | |
Initial Class | | | — | | | | (14,860,374 | ) |
Service Class | | | — | | | | (3,493,789 | ) |
| | | | |
Total distributions to shareholders | | | — | | | | (18,354,163 | ) |
| | | | |
Capital share transactions: | |
Net proceeds from sale of shares | | | 14,081,256 | | | | 31,463,470 | |
Net asset value of shares issued to shareholders in reinvestment of distributions | | | — | | | | 18,354,163 | |
Cost of shares redeemed | | | (29,162,759 | ) | | | (101,739,186 | ) |
| | | | |
Increase (decrease) in net assets derived from capital share transactions | | | (15,081,503 | ) | | | (51,921,553 | ) |
| | | | |
Net increase (decrease) in net assets | | | 23,276,378 | | | | (38,205,619 | ) |
|
| Net Assets | |
Beginning of period | | | 352,508,984 | | | | 390,714,603 | |
| | | | |
End of period | | $ | 375,785,362 | | | $ | 352,508,984 | |
| | | | |
Net investment Income (loss) at end of period | | $ | (1,160,392 | ) | | $ | 14,965 | |
| | | | |
| | | | | | |
The notes to the financial statements are an integral part of,
and should be read in conjunction with, the financial statements. | | | | | 15 | |
Financial Highlights selected per share data and ratios
| | | | | | | | | | | | | | | | | | | | | | | | | | | | |
| | | Six months
ended
June 30, | | | | | | Year ended December 31, | | | February 17,
2012**
through
December 31, | |
| Initial Class | | 2017* | | | | | | 2016 | | | 2015 | | | 2014 | | | 2013 | | | 2012 | |
Net asset value at beginning of period | | $ | 12.03 | | | | | | | $ | 11.53 | | | $ | 13.33 | | | $ | 13.07 | | | $ | 9.99 | | | $ | 10.00 | |
| | | | | | | | | | | | | | | | | | | | | | | | | | | | |
Net investment income (loss) | | | (0.04 | )(a) | | | | | | | (0.05 | )(a) | | | (0.07 | )(a) | | | (0.04 | )(a) | | | (0.03 | ) | | | 0.02 | |
Net realized and unrealized gain (loss) on investments | | | 1.38 | | | | | | | | 1.19 | | | | (0.09 | ) | | | 0.36 | | | | 3.12 | | | | (0.03 | ) |
| | | | | | | | | | | | | | | | | | | | | | | | | | | | |
Total from investment operations | | | 1.34 | | | | | | | | 1.14 | | | | (0.16 | ) | | | 0.32 | | | | 3.09 | | | | (0.01 | ) |
| | | | | | | | | | | | | | | | | | | | | | | | | | | | |
| Less dividends and distributions: | | | | | | | | | | | | | | | | | | | | | | | | | | | | |
From net investment income | | | — | | | | | | | | — | | | | — | | | | — | | | | (0.01 | ) | | | — | |
From net realized gain on investments | | | — | | | | | | | | (0.64 | ) | | | (1.64 | ) | | | (0.06 | ) | | | — | | | | — | |
| | | | | | | | | | | | | | | | | | | | | | | | | | | | |
Total dividends and distributions | | | — | | | | | | | | (0.64 | ) | | | (1.64 | ) | | | (0.06 | ) | | | (0.01 | ) | | | — | |
| | | | | | | | | | | | | | | | | | | | | | | | | | | | |
Net asset value at end of period | | $ | 13.37 | | | | | | | $ | 12.03 | | | $ | 11.53 | | | $ | 13.33 | | | $ | 13.07 | | | $ | 9.99 | |
| | | | | | | | | | | | | | | | | | | | | | | | | | | | |
Total investment return (b) | | | 11.14 | % (c) | | | | | | | 10.01 | % | | | (0.91 | %) | | | 2.52 | % | | | 30.89 | % | | | (0.10 | %) |
| Ratios (to average net assets)/Supplemental Data: | | | | | | | | | | | | | | | | | | | | | | | | | | | | |
Net investment income (loss) | | | (0.59 | %)†† | | | | | | | (0.41 | %) | | | (0.53 | %) | | | (0.30 | %) | | | (0.27 | %) | | | 0.22 | % †† |
Net expenses | | | 0.85 | % †† | | | | | | | 0.86 | % | | | 0.85 | % | | | 0.85 | % | | | 0.85 | % | | | 0.86 | % †† |
Portfolio turnover rate | | | 20 | % | | | | | | | 36 | % | | | 50 | % | | | 51 | % | | | 41 | % | | | 78 | % |
Net assets at end of period (in 000’s) | | $ | 295,865 | | | | | | | $ | 282,378 | | | $ | 319,580 | | | $ | 343,965 | | | $ | 430,114 | | | $ | 272,908 | |
| (a) | Per share data based on average shares outstanding during the period. |
| (b) | Total return does not reflect any deduction of sales charges, mortality and expense charges, contract charges or administrative charges. For periods of less than one year, total return is not annualized. |
| (c) | Total investment return may reflect adjustments to conform to generally accepted accounting principles. |
| | | | | | | | | | | | | | | | | | | | | | | | | | | | |
| | | Six months
ended
June 30, | | | | | | Year ended December 31, | | | February 17,
2012**
through
December 31, | |
| Service Class | | 2017* | | | | | | 2016 | | | 2015 | | | 2014 | | | 2013 | | | 2012 | |
Net asset value at beginning of period | | $ | 11.88 | | | | | | | $ | 11.42 | | | $ | 13.25 | | | $ | 13.02 | | | $ | 9.97 | | | $ | 10.00 | |
| | | | | | | | | | | | | | | | | | | | | | | | | | | | |
Net investment income (loss) | | | (0.05 | )(a) | | | | | | | (0.07 | )(a) | | | (0.10 | )(a) | | | (0.07 | )(a) | | | (0.06 | ) | | | (0.01 | ) |
Net realized and unrealized gain (loss) on investments | | | 1.35 | | | | | | | | 1.17 | | | | (0.09 | ) | | | 0.36 | | | | 3.11 | | | | (0.02 | ) |
| | | | | | | | | | | | | | | | | | | | | | | | | | | | |
Total from investment operations | | | 1.30 | | | | | | | | 1.10 | | | | (0.19 | ) | | | 0.29 | | | | 3.05 | | | | (0.03 | ) |
| | | | | | | | | | | | | | | | | | | | | | | | | | | | |
| Less dividends and distributions: | | | | | | | | | | | | | | | | | | | | | | | | | | | | |
From net realized gain on investments | | | — | | | | | | | | (0.64 | ) | | | (1.64 | ) | | | (0.06 | ) | | | — | | | | — | |
| | | | | | | | | | | | | | | | | | | | | | | | | | | | |
Net asset value at end of period | | $ | 13.18 | | | | | | | $ | 11.88 | | | $ | 11.42 | | | $ | 13.25 | | | $ | 13.02 | | | $ | 9.97 | |
| | | | | | | | | | | | | | | | | | | | | | | | | | | | |
Total investment return (b) | | | 10.94 | % (c) | | | | | | | 9.73 | % | | | (1.16 | %) | | | 2.27 | % | | | 30.56 | % | | | (0.30 | %) |
| Ratios (to average net assets)/Supplemental Data: | | | | | | | | | | | | | | | | | | | | | | | | | | | | |
Net investment income (loss) | | | (0.85 | %)†† | | | | | | | (0.66 | %) | | | (0.79 | %) | | | (0.55 | %) | | | (0.51 | %) | | | (0.09 | %)†† |
Net expenses | | | 1.10 | % †† | | | | | | | 1.11 | % | | | 1.10 | % | | | 1.10 | % | | | 1.10 | % | | | 1.11 | % †† |
Portfolio turnover rate | | | 20 | % | | | | | | | 36 | % | | | 50 | % | | | 51 | % | | | 41 | % | | | 78 | % |
Net assets at end of period (in 000’s) | | $ | 79,920 | | | | | | | $ | 70,131 | | | $ | 71,135 | | | $ | 61,536 | | | $ | 58,716 | | | $ | 45,318 | |
| (a) | Per share data based on average shares outstanding during the period. |
| (b) | Total return does not reflect any deduction of sales charges, mortality and expense charges, contract charges or administrative charges. For periods of less than one year, total return is not annualized. |
| (c) | Total investment return may reflect adjustments to conform to generally accepted accounting principles. |
| | | | |
| 16 | | MainStay VP Eagle Small Cap Growth Portfolio | | The notes to the financial statements are an integral part of,
and should be read in conjunction with, the financial statements. |
Notes to Financial Statements (Unaudited)
Note 1–Organization and Business
MainStay VP Funds Trust (the “Fund”) was organized as a Delaware statutory trust on February 1, 2011. The Fund is registered under the Investment Company Act of 1940, as amended (the “1940 Act”), as an open-end management investment company. The Fund is comprised of thirty-two separate series (collectively referred to as the “Portfolios”). These financial statements and notes relate to the MainStay VP Eagle Small Cap Growth Portfolio (the “Portfolio”), a “diversified” portfolio, as that term is defined in the 1940 Act, as interpreted or modified by regulatory authorities having jurisdiction, from time to time.
Shares of the Portfolio are currently offered to certain separate accounts to fund variable annuity policies and variable universal life insurance policies issued by New York Life Insurance and Annuity Corporation (“NYLIAC”), a wholly-owned subsidiary of New York Life Insurance Company (“New York Life”). NYLIAC allocates shares of the Portfolios to, among others, NYLIAC Variable Annuity Separate Accounts-I, II, III and IV, VUL Separate Account-I and CSVUL Separate Account-I (collectively, the “Separate Accounts”). Shares of the Portfolio are also offered to the MainStay VP Conservative Allocation Portfolio, MainStay VP Moderate Allocation Portfolio, MainStay VP Moderate Growth Allocation Portfolio and MainStay VP Growth Allocation Portfolio, which operate as “funds-of-funds.”
The Portfolio currently offers two classes of shares. Initial Class and Service Class shares commenced operations on February 17, 2012. Shares of the Portfolio are sold and are redeemed at a price equal to their respective net asset value (“NAVs”) per share. No sales or redemption charge is applicable to the purchase or redemption of the Portfolio’s shares. Under the terms of the Fund’s multiple class plan, adopted pursuant to Rule 18f-3 under the 1940 Act, the classes differ in that, among other things. Service Class shares of the Portfolio pay a combined distribution and service fee of 0.25% of average daily net assets attributable to Service Class shares of the Portfolio to the Distributor (as defined in Note 3(B)) pursuant to a plan adopted in accordance with Rule 12b-1 under the 1940 Act. below) of their shares. Contract owners of variable annuity contracts purchased after June 2, 2003, are permitted to invest only in the Service Class shares.
The Portfolio’s investment objective is to seek long-term capital appreciation.
Note 2–Significant Accounting Policies
The Portfolio is an investment company and accordingly follows the investment company accounting and reporting guidance of the Financial Accounting Standards Board (“FASB”) Accounting Standard Codification Topic 946 Financial Services — Investment Companies. The Portfolio prepares its financial statements in accordance with generally accepted accounting principles (“GAAP”) in the United States of America and follows the significant accounting policies described below.
(A) Securities Valuation. Investments are usually valued as of the close of regular trading on the New York Stock Exchange (the “Exchange”) (usually 4:00 p.m. Eastern time) on each day the Portfolio is open for business (“valuation date”).
The Board of Trustees (the “Board”) of the Fund adopted procedures establishing methodologies for the valuation of the Portfolio’s securities and other assets and delegated the responsibility for valuation
determinations under those procedures to the Valuation Committee of the Fund (the “Valuation Committee”). The Board authorized the Valuation Committee to appoint a Valuation Sub-Committee (the “Sub-Committee”) to deal in the first instance with establishing the prices of securities for which market quotations are not readily available or the prices of which are not otherwise readily determinable under these procedures. The Sub-Committee meets (in person, via electronic mail or via teleconference) on an as-needed basis. Subsequently, the Valuation Committee meets to ensure that actions taken by the Sub-Committee were appropriate. The procedures recognize that, subject to the oversight of the Board and unless otherwise noted, the responsibility for the day-to-day valuation of portfolio assets (including fair value measurements for the Portfolio’s assets and liabilities) rests with New York Life Investment Management LLC (“New York Life Investments” or the “Manager”), aided to whatever extent necessary by the Subadvisor (as defined in Note 3(A)) to the Portfolio.
To assess the appropriateness of security valuations, the Manager, the Subadvisor or the Portfolio’s third party service provider, who is subject to oversight by the Manager, regularly compares prior day prices, prices on comparable securities and the sale prices to the prior and current day prices and challenges prices with changes exceeding certain tolerance levels with third party pricing services or broker sources. For those securities valued through either a standardized fair valuation methodology or a fair valuation measurement, the Sub-Committee deals in the first instance with such valuation and the Valuation Committee reviews and affirms, if appropriate, the reasonableness of the valuation based on such methodologies and measurements on a regular basis after considering all relevant information that is reasonably available. Any action taken by the Sub-Committee with respect to the valuation of a portfolio security or other asset is submitted by the Valuation Committee to the Board for its review and ratification, if appropriate, at its next regularly scheduled meeting.
“Fair value” is defined as the price the Portfolio would reasonably expect to receive upon selling an asset or liability in an orderly transaction to an independent buyer in the principal or most advantageous market for the asset or liability. Fair value measurements are determined within a framework that establishes a three-tier hierarchy which maximizes the use of observable market data and minimizes the use of unobservable inputs to establish a classification of fair value measurements for disclosure purposes. “Inputs” refer broadly to the assumptions that market participants would use in pricing the asset or liability, including assumptions about risk, such as the risk inherent in a particular valuation technique used to measure fair value using a pricing model and/or the risk inherent in the inputs for the valuation technique. Inputs may be observable or unobservable. Observable inputs reflect the assumptions market participants would use in pricing the asset or liability based on market data obtained from sources independent of the Portfolio. Unobservable inputs reflect the Portfolio’s own assumptions about the assumptions market participants would use in pricing the asset or liability based on the information available. The inputs or methodology used for valuing assets or liabilities may not be an indication of the risks associated with investing in those assets or liabilities. The three-tier hierarchy of inputs is summarized below.
| • | | Level 1—quoted prices in active markets for an identical asset or liability |
Notes to Financial Statements (Unaudited) (continued)
| • | | Level 2—other significant observable inputs (including quoted prices for a similar asset or liability in active markets, interest rates and yield curves, prepayment speeds, credit risk, etc.) |
| • | | Level 3—significant unobservable inputs (including the Portfolio’s own assumptions about the assumptions that market participants would use in measuring fair value of an asset or liability) |
The level of an asset or liability within the fair value hierarchy is based on the lowest level of an input, both individually and in the aggregate, that is significant to the fair value measurement. As of June 30, 2017, the aggregate value by input level of the Portfolio’s assets and liabilities is included at the end of the Portfolio’s Portfolio of Investments.
The Portfolio may use third party vendor evaluations, whose prices may be derived from one or more of the following standard inputs, among others:
| | |
• Broker/dealer quotes | | • Benchmark securities |
• Two-sided markets | | • Reference data (corporate actions or material event notices) |
• Bids/offers | | • Monthly payment information |
• Industry and economic events | | • Reported trades |
An asset or liability for which market values cannot be measured using the methodologies described above is valued by methods deemed reasonable in good faith by the Valuation Committee, following the procedures established by the Board, to represent fair value. Under these procedures, the Portfolio generally uses a market-based approach which may use related or comparable assets or liabilities, recent transactions, market multiples, book values, and other relevant information. The Portfolio may also use an income-based valuation approach in which the anticipated future cash flows of the asset or liability are discounted to calculate fair value. Discounts may also be applied due to the nature and/or duration of any restrictions on the disposition of the asset or liability. Fair value represents a good faith approximation of the value of a security. Fair value determinations involve the consideration of a number of subjective factors, an analysis of applicable facts and circumstances and the exercise of judgment. As a result, it is possible that the fair value for a security determined in good faith in accordance with the Portfolio’s valuation procedures may differ from valuations for the same security determined by other funds using their own valuation procedures. Although the Portfolio’s valuation procedures are designed to value a security at the price the Portfolio may reasonably expect to receive upon the security’s sale in an orderly transaction, there can be no assurance that any fair value determination thereunder would, in fact, approximate the amount that the Portfolio would actually realize upon the sale of the security or the price at which the security would trade if a reliable market price were readily available. During the six-month period ended June 30, 2017, there were no material changes to the fair value methodologies.
Securities which may be valued in this manner include, but are not limited to: (i) a security for which trading has been halted or suspended; (ii) a debt security that has recently gone into default and for which there is not a current market quotation; (iii) a security of an issuer that has entered into a restructuring; (iv) a security that has been de-listed from a national exchange; (v) a security for which the market price is not readily available from a third party pricing source or, if so provided, does
not, in the opinion of the Manager or Subadvisor reflect the security’s market value; (vi) a security subject to trading collars for which no or limited trading takes place; and (vii) a security whose principal market has been temporarily closed at a time when, under normal conditions, it would be open. Securities for which market quotations or observable inputs are not readily available are generally categorized as Level 3 in the hierarchy. As of June 30, 2017, there were no securities held by the Portfolio that were fiar valued in such a manner.
Equity securities are valued at the last quoted sales prices as of the close of regular trading on the relevant exchange on each valuation date. Securities that are not traded on the valuation date are valued at the mean of the last quoted bid and ask prices. Prices are normally taken from the principal market in which each security trades. These securities are generally categorized as Level 1 in the hierarchy.
Temporary cash investments acquired in excess of 60 days to maturity at the time of purchase are valued using the latest bid prices or using valuations based on a matrix system (which considers such factors as security prices, yields, maturities, and ratings), both as furnished by independent pricing services. Other temporary cash investments which mature in 60 days or less at the time of purchase (“Short-Term Investments”) are valued using the amortized cost method of valuation, unless the use of such method would be inappropriate. The amortized cost method involves valuing a security at its cost on the date of purchase and thereafter assuming a constant amortization to maturity of the difference between such cost and the value on maturity date. Amortized cost approximates the current fair value of a security. Securities valued using the amortized cost method are not valued using quoted prices in an active market and are generally categorized as Level 2 in the hierarchy.
The information above is not intended to reflect an exhaustive list of the methodologies that may be used to value portfolio investments. The valuation procedures permit the use of a variety of valuation methodologies in connection with valuing portfolio investments. The methodology used for a specific type of investment may vary based on the market data available or other considerations. The methodologies summarized above may not represent the specific means by which portfolio investments are valued on any particular business day.
A Portfolio security or other asset may be determined to be illiquid under procedures approved by the Board. Illiquidity of a security might prevent the sale of such security at a time when the Manager or Subadvisor might wish to sell, and these securities could have the effect of decreasing the overall level of the Portfolio’s liquidity. Further, the lack of an established secondary market may make it more difficult to value illiquid securities, requiring the Portfolio to rely on judgments that may be somewhat subjective in measuring value, which could vary materially from the amount that the Portfolio could realize upon disposition. Difficulty in selling illiquid securities may result in a loss or may be costly to the Portfolio. Under the supervision of the Board, the Manager or Subadvisor determines the liquidity of the Portfolio’s investments; in doing so, the Manager or Subadvisor may consider various factors, including (i) the frequency of trades and quotations, (ii) the number of dealers and prospective purchasers, (iii) dealer undertakings to make a market, and (iv) the nature of the security and the market in which it trades (e.g., the time needed to dispose of the security, the method of soliciting offers and the mechanics of transfer). Illiquid securities are
| | |
| 18 | | MainStay VP Eagle Small Cap Growth Portfolio |
often valued in accordance with methods deemed by the Board in good faith to be reasonable and appropriate to accurately reflect their fair value. The liquidity of the Portfolio’s investments, as shown in the Portfolio of Investments, was determined as of June 30, 2017 and can change at any time in response to, among other relevant factors, market conditions or events or developments with respect to an individual issuer or instrument.
(B) Income Taxes. The Portfolio’s policy is to comply with the requirements of the Internal Revenue Code of 1986, as amended (the “Internal Revenue Code”), applicable to regulated investment companies and to distribute all of its taxable income to the shareholders of the Portfolio within the allowable time limits. Therefore, no federal, state and local income tax provisions are required.
Management evaluates the Portfolio’s tax positions to determine if the tax positions taken meet the minimum recognition threshold in connection with accounting for uncertainties in income tax positions taken or expected to be taken for the purposes of measuring and recognizing tax liabilities in the financial statements. Recognition of tax benefits of an uncertain tax position is permitted only to the extent the position is “more likely than not” to be sustained assuming examination by taxing authorities. Management has analyzed the Portfolio’s tax positions taken on federal, state and local income tax returns for all open tax years (for up to three tax years), and has concluded that no provisions for federal, state and local income tax are required in the Portfolio’s financial statements. The Portfolio’s federal, state and local income and federal excise tax returns for tax years for which the applicable statutes of limitations have not expired are subject to examination by the Internal Revenue Service and state and local departments of revenue.
(C) Dividends and Distributions to Shareholders. Dividends and distributions are recorded on the ex-dividend date. The Portfolio intends to declare and pay dividends from net investment income and distributions from net realized capital and currency gains, if any, at least annually. Unless the shareholder elects otherwise, all dividends and distributions are reinvested in the same class of shares of the Portfolio, at NAV. Dividends and distributions to shareholders are determined in accordance with federal income tax regulations and may differ from GAAP.
(D) Security Transactions and Investment Income. The Portfolio records security transactions on the trade date. Realized gains and losses on security transactions are determined using the identified cost method. Dividend income is recognized on the ex-dividend date; net of any foreign tax withheld at the source, and interest income is accrued as earned using the effective interest rate method. Discounts and premiums on Short-Term Investments are accreted and amortized, respectively, on the straight-line method. The straight-line method approximates the effective interest method for Short-Term Investments.
Investment income and realized and unrealized gains and losses on investments of the Portfolio are allocated pro rata to the separate classes of shares based upon their relative net assets on the date the income is earned or realized and unrealized gains and losses are incurred.
(E) Expenses. Expenses of the Fund are allocated to the individual Portfolios in proportion to the net assets of the respective Portfolios when the expenses are incurred, except where direct allocations of
expenses can be made. Expenses (other than fees incurred under the distribution and service plans, further discussed in Note 3(B), which are charged directly to the Service Class shares) are allocated to separate classes of shares pro rata based upon their relative net assets on the date the expenses are incurred. The expenses borne by the Portfolio, including those incurred with related parties to the Portfolio, are shown in the Statement of Operations.
(F) Use of Estimates. In preparing financial statements in conformity with GAAP, management makes estimates and assumptions that affect the reported amounts and disclosures in the financial statements. Actual results could differ from those estimates.
(G) Repurchase Agreements. The Portfolio may enter into repurchase agreements (i.e., buy a security from another party with the agreement that it be sold back in the future) to earn income. The Portfolio may enter into repurchase agreements only with counterparties, usually financial institutions, that are deemed by the Manager or Subadvisor to be creditworthy, pursuant to guidelines established by the Board. During the term of any repurchase agreement, the Manager or Subadvisor will continue to monitor the creditworthiness of the counterparty. Under the 1940 Act, repurchase agreements are considered to be collateralized loans by the Portfolio to the counterparty secured by the securities transferred to the Portfolio.
Repurchase agreements are subject to counterparty risk, meaning the Portfolio could lose money by the counterparty’s failure to perform under the terms of the agreement. The Portfolio mitigates this risk by ensuring the repurchase agreement is collateralized by cash, U.S. government securities, fixed income securities and/or other securities. The collateral is held by the Portfolio’s custodian valued daily on a mark to market basis to determine if the value, including accrued interest, exceeds the repurchase price. In the event of the counterparty’s default on the obligation to repurchase, the Portfolio has the right to liquidate the collateral and apply the proceeds in satisfaction of the obligation. Under certain circumstances, such as in the event of default or bankruptcy by the counterparty, realization and/or retention of the collateral may be limited or subject to delay, to legal proceedings and possible realized loss to the Portfolio.
(H) Securities Lending. In order to realize additional income, the Portfolio may engage in securities lending, subject to the limitations set forth in the 1940 Act and relevant guidance by the staff of the Securities and Exchange Commission (“SEC”). In the event the Portfolio does engage in securities lending, the Portfolio will lend through its custodian, State Street Bank and Trust Company (“State Street”). State Street will manage the Portfolio’s collateral in accordance with the lending agreement between the Portfolio and State Street, and indemnify the Portfolio against counterparty risk. The loans will be collateralized by U.S. Treasury securities at least equal at all times to the market value of the securities loaned. The Portfolio may bear the risk of delay in recovery of, or loss of rights in, the securities loaned should the borrower of the securities experience financial difficulty. The Portfolio may also record a realized gain or loss on securities deemed sold due to a borrower’s inability to return securities on loan. The Portfolio bears the risk of any loss on investment of the collateral. The Portfolio will receive compensation for lending its securities in the form of fees or it will retain a portion of interest on the investment of any cash received as collateral. The Portfolio will also continue to receive interest and divi-
Notes to Financial Statements (Unaudited) (continued)
dends on the securities loaned and any gain or loss in the market price of the securities loaned that may occur during the term of the loan will be for the account of the Portfolio. During the six-month period ended June 30, 2017, the Portfolio did not have any portfolio securities on loan.
(I) Indemnifications. Under the Fund’s organizational documents, its officers and trustees are indemnified against certain liabilities that may arise out of performance of their duties to the Fund. Additionally, in the normal course of business, the Portfolio enters into contracts with third-party service providers that contain a variety of representations and warranties and which may provide general indemnifications. The Portfolio’s maximum exposure under these arrangements is unknown, as this would involve future claims that may be made against the Portfolio that have not yet occurred. Based on experience, management is of the view that the risk of loss in connection with these potential indemnification obligations is remote. However, there can be no assurance that material liabilities related to such obligations will not arise in the future, which could adversely impact the Portfolio.
Note 3–Fees and Related Party Transactions
(A) Manager and Subadvisor. New York Life Investments, a registered investment adviser and an indirect, wholly-owned subsidiary of New York Life, serves as the Portfolio’s Manager pursuant to an Amended and Restated Management Agreement (“Management Agreement”). The Manager provides offices, conducts clerical, recordkeeping and bookkeeping services, and keeps most of the financial and accounting records required to be maintained by the Portfolio. Except for the portion of salaries and expenses that are the responsibility of the Portfolio, the Manager pays the salaries and expenses of all personnel affiliated with the Portfolio and the operational expenses of the Portfolio. The Portfolio reimburses New York Life Investments in an amount equal to a portion of the compensation of the Chief Compliance Officer attributable to the Portfolio. Pursuant to the terms of a Subadvisory Agreement with New York Life Investments, Eagle Asset Management, Inc. (“Eagle”), a registered investment adviser, serves as Subadvisor to the Portfolio. New York Life Investments pays for the services of the Subadvisor.
The Fund, on behalf of the Portfolio, pays New York Life Investments in its capacity as the Portfolio’s investment manager and administrator, pursuant to the Management Agreement, a monthly fee for the services performed and the facilities furnished at an annual percentage of the average daily net assets of 0.81%. New York Life Investments has contractually agreed to waive a portion of its management fee so that the management fee does not exceed 0.785% on assets in excess of $1 billion. This agreement expires on May 1, 2018 and may only be amended or terminated prior to that date by action of the Board. During the six-month period ended June 30, 2017, the effective management fee rate was 0.81%.
During the six-month period ended June 30, 2017, New York Life Investments earned fees from the Portfolio in the amount of $1,477,907.
State Street provides sub-administration and sub-accounting services to the Portfolio pursuant to an agreement with New York Life Investments. These services include calculating the daily NAVs of the Portfolio,
maintaining the general ledger and sub-ledger accounts for the calculation of the Portfolio’s NAVs, and assisting New York Life Investments in conducting various aspects of the Portfolio’s administrative operations. For providing these services to the Portfolio, State Street is compensated by New York Life Investments.
(B) Distribution and Service Fees. The Fund, on behalf of the Portfolio, has entered into a distribution agreement with NYLIFE Distributors LLC (the “Distributor”), an indirect, wholly-owned subsidiary of New York Life. The Portfolio has adopted a distribution plan (the “Plan”) in accordance with the provisions of Rule 12b-1 under the 1940 Act. Under the Plan, the Distributor has agreed to provide, through its affiliates or independent third parties, various distribution-related, shareholder and administrative support services to the Service Class shareholders. For its services, the Distributor is entitled to a combined distribution and service fee accrued daily and paid monthly at an annual rate of 0.25% of the average daily net assets attributable to the Service Class shares of the Portfolio.
Note 4–Federal Income Tax
During the year ended December 31, 2016, the tax character of distributions paid as reflected in the Statements of Changes in Net Assets was as follows:
| | |
| 2016 |
Tax-Based
Distributions
from Ordinary
Income | | Tax-Based
Distributions
from Long-Term
Gains |
| $— | | $18,354,163 |
Note 5–Custodian
State Street is the custodian of cash and securities held by the Portfolio. Custodial fees are charged to the Portfolio based on the Portfolio’s net assets and/or the market value of securities held by the Portfolio and the number of certain transactions incurred by the Portfolio.
Note 6–Line of Credit
The Portfolio and certain other funds managed by New York Life Investments, maintain a line of credit with a syndicate of banks in order to secure a source of funds for temporary purposes to meet unanticipated or excessive redemption requests.
Effective August 1, 2017, under the credit agreement (the “Credit Agreement”), the aggregate commitment amount is $600,000,000 with an additional uncommitted amount of $100,000,000. The commitment fee is an annual rate of 0.15% of the average commitment amount payable quarterly, regardless of usage, to State Street, who serves as the agent to the syndicate. The commitment fee is allocated among the Portfolio and certain other funds managed by New York Life Investments based upon their respective net assets and other factors. Interest on any revolving credit loan is charged based upon the Federal Funds Rate or the one month LIBOR, whichever is higher. The Credit Agreement expires on July 31, 2018, although the Portfolio, certain other funds managed by New York Life Investments and the syndicate of banks may renew the Credit Agreement for an additional year on the same or
| | |
| 20 | | MainStay VP Eagle Small Cap Growth Portfolio |
different terms. Prior to August 1, 2017, the aggregate commitment amount was $600,000,000 with an additional uncommitted amount of $100,000,000, and the commitment fee, under a credit agreement for which Bank of New York Mellon served as agent, was at an annual rate of 0.15% of the average commitment amount. During the six-month period ended June 30, 2017, there were no borrowings made or outstanding with respect to the Portfolio under the credit agreement for which Bank of New York Mellon served as agent.
Note 7–Interfund Lending Program
Pursuant to an exemptive order issued by the SEC, the Portfolio, along with certain other funds managed by New York Life Investments, may participate in an interfund lending program. The interfund lending program provides an alternative credit facility that permits the Portfolio and certain other funds managed by New York Life Investments to lend or borrow money for temporary purposes directly to or from one another, subject to the conditions of the exemptive order. During the six-month period ended June 30, 2017, there were no interfund loans made or outstanding with respect to the Portfolio.
Note 8–Purchases and Sales of Securities (in 000’s)
During the six-month period ended June 30, 2017, purchases and sales of securities, other than short-term securities, were $73,232 and $88,797, respectively.
Note 9–Capital Share Transactions
Transactions in capital shares for the six-month period ended June 30, 2017, and the year ended December 31, 2016, were as follows:
| | | | | | | | |
Initial Class | | Shares | | | Amount | |
Six-month period ended June 30, 2017: | | | | | | | | |
Shares sold | | | 283,082 | | | $ | 3,647,583 | |
Shares redeemed | | | (1,621,016 | ) | | | (20,810,292 | ) |
| | | | |
Net increase (decrease) | | | (1,337,934 | ) | | $ | (17,162,709 | ) |
| | | | |
Year ended December 31, 2016: | | | | | | | | |
Shares sold | | | 1,760,298 | | | $ | 19,300,751 | |
Shares issued to shareholders in reinvestment of dividends and distributions | | | 1,271,981 | | | | 14,860,374 | |
Shares redeemed | | | (7,275,998 | ) | | | (82,510,002 | ) |
| | | | |
Net increase (decrease) | | | (4,243,719 | ) | | $ | (48,348,877 | ) |
| | | | |
| | | | | | | | |
Service Class | | Shares | | | Amount | |
Six-month period ended June 30, 2017: | | | | | | | | |
Shares sold | | | 821,434 | | | $ | 10,433,673 | |
Shares redeemed | | | (662,573 | ) | | | (8,352,467 | ) |
| | | | |
Net increase (decrease) | | | 158,861 | | | $ | 2,081,206 | |
| | | | |
Year ended December 31, 2016: | | | | | | | | |
Shares sold | | | 1,069,875 | | | $ | 12,162,719 | |
Shares issued to shareholders in reinvestment of dividends and distributions | | | 302,811 | | | | 3,493,789 | |
Shares redeemed | | | (1,697,325 | ) | | | (19,229,184 | ) |
| | | | |
Net increase (decrease) | | | (324,639 | ) | | $ | 3,572,676 | |
| | | | |
Note 10–Recent Accounting Pronouncement
In October 2016, the SEC adopted new rules and amended existing rules (together, “final rules”) intended to modernize the reporting and disclosure of information by registered investment companies. In part, the final rules amend Regulation S-X and require standardized, enhanced disclosure about derivatives in investment company financial statements, as well as other amendments. The compliance date for the amendments to Regulation S-X is August 1, 2017 and applies to shareholder reports for funds with fiscal periods ending after August 1, 2017. Management is currently evaluating the impact that the adoption of the amendments to Regulation S-X will have on the Portfolio’s financial statements and related disclosures.
Note 11–Subsequent Events
In connection with the preparation of the financial statements of the Portfolio as of and for the six-month period ended June 30, 2017, events and transactions subsequent to June 30, 2017, through the date the financial statements were issued have been evaluated by the Portfolio’s management for possible adjustment and/or disclosure. No subsequent events requiring financial statement adjustment or disclosure have been identified.
Proxy Voting Policies and Procedures and Proxy Voting Record
A description of the policies and procedures that New York Life Investments uses to vote proxies related to the Portfolio’s securities is available without charge, upon request, (i) by calling 800-598-2019 or (ii) by visiting the SEC’s website at www.sec.gov.
The Portfolio is required to file with the SEC its proxy voting record for the 12-month period ending June 30 on Form N-PX. The Portfolio’s most recent Form N-PX or proxy voting record is available free of charge upon request (i) by calling 800-598-2019 or; (ii) by visiting the SEC’s website at www.sec.gov.
Shareholder Reports and Quarterly Portfolio Disclosure
The Portfolio is required to file its complete schedule of portfolio holdings with the SEC for its first and third fiscal quarters on Form N-Q. The Portfolio’s Form N-Q is available without charge on the SEC’s website at www.sec.gov or by calling MainStay Investments at 800-598-2019. You also can obtain and review copies of Form N-Q by visiting the SEC’s Public Reference Room in Washington, DC (information on the operation of the Public Reference Room may be obtained by calling 1-800-SEC-0330).
| | |
| 22 | | MainStay VP Eagle Small Cap Growth Portfolio |
MainStay VP Portfolios
MainStay VP offers a wide range of Portfolios. The full array of MainStay VP offerings is listed here, with information about the manager, subadvisors, legal counsel, and independent registered public accounting firm.
Equity Portfolios
MainStay VP Common Stock Portfolio
MainStay VP Cornerstone Growth Portfolio
MainStay VP Eagle Small Cap Growth Portfolio
MainStay VP Emerging Markets Equity Portfolio
MainStay VP Epoch U.S. Equity Yield Portfolio
MainStay VP Epoch U.S. Small Cap Portfolio
MainStay VP International Equity Portfolio
MainStay VP Large Cap Growth Portfolio
MainStay VP MFS® Utilities Portfolio
MainStay VP Mid Cap Core Portfolio
MainStay VP S&P 500 Index Portfolio
MainStay VP Small Cap Core Portfolio
MainStay VP T. Rowe Price Equity Income Portfolio
MainStay VP VanEck Global Hard Assets Portfolio
Mixed Asset Portfolios
MainStay VP Balanced Portfolio
MainStay VP Convertible Portfolio
MainStay VP Cushing Renaissance Advantage Portfolio
MainStay VP Income Builder Portfolio
MainStay VP Janus Henderson Balanced Portfolio
Income Portfolios
MainStay VP Bond Portfolio
MainStay VP Floating Rate Portfolio
MainStay VP Government Portfolio
MainStay VP High Yield Corporate Bond Portfolio
MainStay VP Indexed Bond Portfolio
MainStay VP PIMCO Real Return Portfolio
MainStay VP Unconstrained Bond Portfolio
Money Market
MainStay VP U.S. Government Money Market Portfolio
Alternative
MainStay VP Absolute Return Multi-Strategy Portfolio
Asset Allocation Portfolios
MainStay VP Conservative Allocation Portfolio
MainStay VP Growth Allocation Portfolio
MainStay VP Moderate Allocation Portfolio
MainStay VP Moderate Growth Allocation Portfolio
Manager
New York Life Investment Management LLC
New York, New York
Subadvisors
Candriam Belgium*
Brussels, Belgium
Candriam France S.A.S.*
Paris, France
Cornerstone Capital Management Holdings LLC*
New York, New York
Cushing Asset Management, LP
Dallas, Texas
Eagle Asset Management, Inc.
St Petersburg, Florida
Epoch Investment Partners, Inc.
New York, New York
Janus Capital Management LLC
Denver, Colorado
MacKay Shields LLC*
New York, New York
Massachusetts Financial Services Company
Boston, Massachusetts
NYL Investors LLC*
New York, New York
Pacific Investment Management Company LLC
Newport Beach, California
T. Rowe Price Associates, Inc.
Baltimore, Maryland
Van Eck Associates Corporation
New York, New York
Winslow Capital Management, LLC
Minneapolis, Minnesota
Distributor
NYLIFE Distributors LLC*
Jersey City, New Jersey
Custodian
State Street Bank and Trust Company
Boston, Massachusetts
Independent Registered Public Accounting Firm
PricewaterhouseCoopers LLP
New York, New York
Legal Counsel
Dechert LLP
Washington, District of Columbia
Some Portfolios may not be available in all products.
* An affiliate of New York Life Investment Management LLC
Not part of the Semiannual Report
2017 Semiannual Report
This report is for the general information of New York Life Variable Annuities and NYLIAC Variable Universal Life Insurance Products policyowners. It must be preceded or accompanied by the appropriate product(s) and funds prospectuses if it is given to anyone who is not an owner of a New York Life variable annuity policy or a NYLIAC Variable Universal Life Insurance Product. This report does not offer for sale or solicit orders to purchase securities.
The performance data quoted in this report represents past performance. Past performance is no guarantee of future results. Due to market volatility and other factors, current performance may be lower or higher than the figures shown. The most recent month-end performance summary for your variable annuity or variable life policy is available by calling 800-598-2019 and is updated periodically on www.newyorklife.com.
The New York Life Variable Annuities and NYLIAC Variable Universal Life Insurance Products are issued by New York Life Insurance and Annuity Corporation (a Delaware Corporation) and distributed by NYLIFE Distributors LLC (Member FINRA/SIPC).
New York Life Insurance Company
New York Life Insurance and Annuity Corporation (NYLIAC) (A Delaware Corporation)
51 Madison Avenue, Room 551
New York, NY 10010
www.newyorklife.com
Printed on recycled paper
mainstayinvestments.com
NYLIFE Distributors LLC, 30 Hudson Street, Jersey City, NJ 07302
New York Life Investment Management LLC is the investment manager to the MainStay VP Funds Trust
©2017 by NYLIFE Distributors LLC. All rights reserved.
You may obtain copies of the Prospectus and the Statement of Additional Information free of charge, upon request, by calling toll-free 800-598-2019 or writing to New York Life Insurance and Annuity Corporation, 51 Madison Avenue, New York, NY 10010.
| | | | |
| Not FDIC Insured | | No Bank Guarantee | | May Lose Value |
| | | | |
| 1743130 | | | | MSVPESCG10-08/17 (NYLIAC) NI515 |
MainStay VP VanEck Global Hard
Assets Portfolio
Message from the President and Semiannual Report
Unaudited | June 30, 2017

Sign up for electronic delivery of your shareholder reports. For full details on electronic delivery, including who can participate and what you
can receive via eDelivery, please log on to www.newyorklife.com/vsc

This page intentionally left blank
Message from the President
The six months ended June 30, 2017, brought positive results to many stock and bond investors. The year began with many investors hoping that Republican control of the White House, the Senate and the House of Representatives could bring an end to political gridlock; and while debate has continued on a number of issues, the U.S. stock market climbed relatively steadily throughout the first half of 2017.
According to FTSE-Russell U.S. market data, stocks at all capitalization levels tended to record positive total returns during the reporting period, with large-cap stocks generally outperforming stocks of smaller-capitalization companies. Growth stocks outpaced value stocks at every capitalization level by substantial margins—from more than six percentage points for micro-caps and mid-caps to more than 10 percentage points for the largest 200 U.S. companies by market capitalization.
Most sectors of the stock market advanced during the reporting period, with energy and telecommunication services being notable exceptions. Energy stocks declined as oil prices fell despite moves by the Organization of Petroleum Exporting Countries (OPEC) intended to limit oil production by its members. Telecommunication services stocks tended to decline as competition increased and rising interest rates made dividend payouts less appealing.
In March and June of 2017, the Federal Reserve announced successive increases in the target range for the federal funds rate, ultimately bringing the federal funds target range to 1.00% to 1.25%. While short-term U.S. Treasury yields rose in response, yields for U.S. Treasury securities with maturities of five years or longer declined. As the difference between short- and long-term yields narrowed, the advantages of higher-yielding long-term bonds became increasingly apparent.
Virtually all taxable and tax-exempt bond sectors provided positive total returns during the reporting period. Mortgage-backed
securities, though providing positive total returns, faced headwinds when the Federal Reserve announced plans to begin normalizing its balance sheet by reducing reinvestment of principal payments on mortgage-backed securities.
International stock and bond markets were also strong during the reporting period. International stocks provided double-digit total returns that were surpassed by emerging-market stocks as a whole. Global investment-grade bonds provided single-digit returns; and emerging-market debt was somewhat stronger.
Even during periods of favorable market performance and generally positive returns, MainStay believes that it is important to carefully monitor your investments. Your risk tolerance may
change over time, leading you to reevaluate which MainStay VP Portfolios are most appropriate for your long-term goals. Your goals themselves may also change, leading you to pursue investments with more or less risk. The portfolio managers of MainStay VP Portfolios seek to provide results consistent with the investment objectives of their respective Portfolios, to give you a wide range of choices suitable to various investment needs.
The report that follows provides more detailed information about the specific markets, securities and investment decisions that influenced your MainStay VP Portfolio during the six months ended June 30, 2017. We invite you to review the report carefully as part of your ongoing investment evaluation and review.
Sincerely,

Stephen P. Fisher
President
The opinions expressed are as of the date of the accompanying report and are subject to change. Past performance is no guarantee of future results. There is no guarantee that any forecasts made will come to pass. This material does not constitute investment advice and is not intended as an endorsement of any specific investment.
Not all MainStay VP Portfolios and/or share classes are available under all policies.
Not part of the Semiannual Report
Table of Contents
Investors should refer to the Portfolio’s Summary Prospectus and/or Prospectus and consider the Portfolio’s investment objectives, strategies, risks, charges and expenses carefully before investing. The Summary Prospectus and/or Prospectus contain this and other information about the Portfolio. You may obtain copies of the Portfolio’s Summary Prospectus and/or the Prospectus and the Statement of Additional Information free of charge, upon request, by calling toll-free 800-598-2019, by writing to New York Life Insurance and Annuity Corporation, 51 Madison Avenue, Room 251, New York, New York 10010 or by sending an email to MainStayShareholdersServices@nylim.com. These documents are also available at mainstayinvestments.com/vpdocuments. Please read the Summary Prospectus and/or Prospectus carefully before investing. MainStay VP Funds Trust portfolios are separate account options which are purchased through a variable insurance or variable annuity contract.
Investment and Performance Comparison (Unaudited)
Performance data quoted represents past performance. Past performance is no guarantee of future results. Because of market volatility and other factors, current performance may be lower or higher than the figures shown. Investment return and principal value will fluctuate, and as a result, when shares are redeemed, they may be worth more or less than their original cost. The performance table and graph do not reflect any deduction of sales charges, mortality and expense charges, contract charges or administrative charges. Please refer to the Performance Summary appropriate for your policy. For performance information current to the most recent month-end, please call 800-598-2019 or visit www.newyorklife.com.
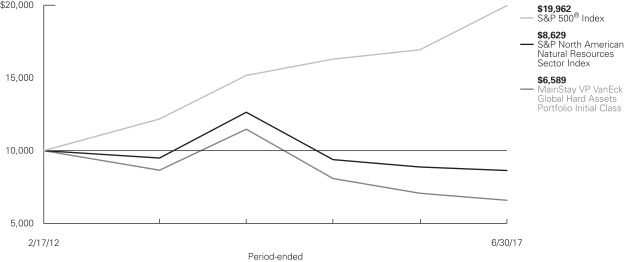
Average Annual Total Returns for the Period Ended June 30, 2017
| | | | | | | | | | | | | | | | | | |
| Class | | Inception Date | | Six Months | | One Year | | Five Years | | | Ten Years
or Since
Inception | | | Gross
Expense
Ratio1 | |
| Initial Class Shares | | 2/17/2012 | | –16.18% | | –6.56% | | | –4.13 | % | | | –7.47 | % | | | 0.94 | % |
| | | | | | | | | | | | | | | | |
| Benchmark Performance | | Six
Months | | | One
Year | | | Five
Years | | | Ten Years
or Since
Inception | |
S&P North American Natural Resources Sector Index2 | | | –11.04 | % | | | –2.62 | % | | | 0.13 | % | | | –2.71 | % |
S&P 500® Index3 | | | 9.34 | | | | 17.90 | | | | 14.63 | | | | 13.75 | |
Average Lipper Variable Products Natural Resources Portfolio4 | | | –10.11 | | | | –2.01 | | | | –1.47 | | | | –4.39 | |
| 1. | The gross expense ratios presented reflect the Portfolio’s “Total Annual Portfolio Operating Expenses” from the most recent Prospectus and may differ from other expense ratios disclosed in this report. |
| 2. | The S&P North American Natural Resources Sector Index is the Portfolio’s primary broad-based securities market index for comparison purposes. The S&P North American Natural Resources Sector Index represents U.S. traded securities that are classified under the GICS® energy and materials sector excluding the chemicals industry and steel sub-industry. The natural resource sector includes mining, energy, paper and forest products, and plantation-owning companies. Results assume reinvestment of all dividends and capital gains. An investment cannot be made directly in an index. |
| 3. | The S&P 500® Index is the Portfolio’s secondary benchmark. “S&P 500®” is a trademark of The McGraw-Hill Companies, Inc. The S&P 500® Index is widely regarded as the standard index for measuring large-cap U.S. stock market performance. Results assume reinvestment of all dividends and capital gains. An investment cannot be made directly in an index. |
| 4. | The Average Lipper Variable Products Natural Resources Portfolio is representative of portfolios that, by portfolio practice, invest primarily in the equity securities of domestic companies engaged in the exploration, development, production, or distribution of natural resources. This benchmark is a product of Lipper Inc. Lipper Inc. is an independent monitor of fund performance. Results are based on average total returns of similar portfolios with all dividend and capital gain distributions reinvested. |
Cost in Dollars of a $1,000 Investment in MainStay VP VanEck Global Hard Assets Portfolio (Unaudited)
The example below is intended to describe the fees and expenses borne by shareholders during the six-month period from January 1, 2017 to June 30, 2017, and the impact of those costs on your investment.
Example
As a shareholder of the Portfolio, you incur two types of costs: (1) transaction costs, including exchange fees and sales charges (loads) on purchases (as applicable), and (2) ongoing costs, including management fees, distribution and/or service (12b-1) fees, and other Portfolio expenses (as applicable). This example is intended to help you understand your ongoing costs (in dollars) of investing in the Portfolio and to compare these costs with the ongoing costs of investing in other mutual funds. The example is based on an investment of $1,000 made at the beginning of the six-month period and held for the entire period from January 1, 2017 to June 30, 2017. Shares are only sold in connection with variable life and annuity contracts and the example does not reflect any contract level or transactional fees or expenses. If these costs had been included, your costs would have been higher.
This example illustrates your Portfolio’s ongoing costs in two ways:
Actual Expenses
The second and third data columns in the table below provide information about actual account values and actual expenses. You may use the information in these columns, together with the amount you invested, to estimate the expenses that you paid during the six months
ended June 30, 2017. Simply divide your account value by $1,000 (for example, an $8,600 account value divided by $1,000 = 8.6), then multiply the result by the number under the heading entitled “Expenses Paid During Period” to estimate the expenses you paid on your account during this period.
Hypothetical Example for Comparison Purposes
The fourth and fifth data columns in the table below provide information about hypothetical account values and hypothetical expenses based on the Portfolio’s actual expense ratio and an assumed rate of return of 5% per year before expenses, which is not the Portfolio’s actual return. The hypothetical account values and expenses may not be used to estimate the actual ending account balances or expenses you paid for the six-month period shown. You may use this information to compare the ongoing costs of investing in the Portfolio with the ongoing costs of investing in other mutual funds. To do so, compare this 5% hypothetical example with the 5% hypothetical examples that appear in the shareholder reports of the other mutual funds.
Please note that the expenses shown in the table are meant to highlight your ongoing costs only and do not reflect any transactional costs, such as exchange fees or sales charges (loads). Therefore, the fourth and fifth data columns of the table are useful in comparing ongoing costs only and will not help you determine the relative total costs of owning different funds. In addition, if these transactional costs were included, your costs would have been higher.
| | | | | | | | | | | | | | | | | | | | | | | | |
| | | | | | | | | | | | | | | | | | | |
| Share Class | | Beginning
Account
Value
1/1/17 | | | Ending Account
Value (Based
on Actual
Returns and
Expenses)
6/30/17 | | | Expenses
Paid
During
Period1 | | | Ending Account
Value (Based on Hypothetical 5% Annualized
Return and
Actual Expenses)
6/30/17 | | | Expenses
Paid
During
Period1 | | | Net Expense
Ratio
During
Period2 | |
| | | | | | |
| Initial Class Shares | | $ | 1,000.00 | | | $ | 838.20 | | | $ | 4.28 | | | $ | 1,020.10 | | | $ | 4.71 | | | | 0.94 | % |
| 1. | Expenses are equal to the Portfolio’s annualized expense ratio multiplied by the average account value over the period, divided by 365 and multiplied by 181 (to reflect the six-month period). The table above represents the actual expenses incurred during the six-month period. |
| 2. | Expenses are equal to the Portfolio’s annualized expense ratio to reflect the six-month period. |
| | |
| 6 | | MainStay VP VanEck Global Hard Assets Portfolio |
Country Composition as of June 30, 2017 (Unaudited)
| | | | |
| United States | | | 69.7 | % |
| Canada | | | 17.2 | |
| Switzerland | | | 7.5 | |
| United Kingdom | | | 1.6 | |
| France | | | 1.2 | |
| Luxembourg | | | 1.1 | |
| Bermuda | | | 0.8 | |
| South Africa | | | 0.8 | |
| Other Assets, Less Liabilities | | | 0.1 | |
| | | | |
| | | 100.0 | % |
| | | | |
Portfolio Composition as of June 30, 2017 (Unaudited)
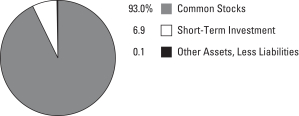
See Portfolio of Investments beginning on page 9 for specific holdings within these categories.
Top Ten Holdings as of June 30, 2017 (excluding short-term investment) (Unaudited)
| 4. | Pioneer Natural Resources Co. |
| 6. | Diamondback Energy, Inc. |
| 7. | Patterson-UTI Energy, Inc. |
| 8. | Teck Resources, Ltd. Class B |
| 9. | First Quantum Minerals, Ltd. |
| 10. | Agnico Eagle Mines, Ltd. |
Portfolio Management Discussion and Analysis (Unaudited)
Answers to the questions reflect the views of portfolio managers Charles T. Cameron and Shawn Reynolds of VanEck Associates Corporation (“VanEck”), the Portfolio’s Subadvisor.
How did MainStay VP VanEck Global Hard Assets Portfolio perform relative to its benchmarks and peers during the six months ended June 30, 2017?
For the six months ended June 30, 2017, MainStay VP VanEck Global Hard Assets Portfolio returned –16.18% for Initial Class shares. Over the same period, the Portfolio underperformed the –11.04% return of the S&P North American Natural Resources Sector Index,1 which is the Portfolio’s primary benchmark; the 9.34% return of the S&P 500® Index,1 which is a secondary benchmark of the Portfolio; and the –10.11% return of the Average Lipper2 Variable Products Natural Resources Portfolio.
What factors affected the Portfolio’s relative performance during the reporting period?
Among the key contributors to the Portfolio’s underperformance relative to the S&P North American Natural Resources Sector Index were overweight positions and underperformance in the oil & gas exploration & production, oil & gas drilling, and copper subindustries. (Contributions take weightings and total returns into account.)
Which subindustries were the strongest positive contributors to the Portfolio’s relative performance, and which subindustries were particularly weak?
During the reporting period, the subindustries that made the strongest positive contributions to the Portfolio’s performance relative to the S&P North American Natural Resources Sector Index were integrated oil & gas, forest products, and oil & gas storage & transportation. Although the Portfolio had no exposure to the integrated oil & gas subindustry during the reporting period, this positioning helped relative performance because the subindustry underperformed the Index.
The subindustries that made the weakest contributions to the Portfolio’s performance relative to the S&P North American Natural Resources Sector Index were oil & gas exploration & production, oil & gas drilling, and copper.
During the reporting period, which individual stocks made the strongest positive contributions to the Portfolio’s absolute performance and which stocks detracted the most?
The Portfolio’s three strongest-contributing individual positions were forest products company Louisiana-Pacific, diversified metals & mining company Glencore, and gold mining company Kinross Gold. Louisiana-Pacific benefited from strong prices for oriented strand board (OSB). Glencore benefited from commodity price support, good earnings, and continued and
expanded strategic structural optimization. Kinross Gold benefited from its continued focus on cost reduction and from operational performance that met expectations.
The Portfolio’s weakest contributing companies were oil & gas drilling company Nabors and two oil & gas exploration & production companies, PDC Energy and Cimarex Energy. Each of these companies suffered from the decline in crude oil prices.
Did the Portfolio make any significant purchases or sales during the reporting period?
During the reporting period, the Portfolio established significant new positions in oil & gas equipment & services companies ProPetro Holding and Forum Energy Technologies and in gold mining company IAMGOLD.
The Portfolio’s largest sales during the reporting period included exiting entire positions in oil & gas exploration & production companies Hess and SM Energy and reducing the Portfolio’s position in oil & gas equipment & services company Halliburton.
How did the Portfolio’s subindustry weightings change during the reporting period?
On both an absolute and relative basis, the Portfolio sizably decreased its weighting in the oil & gas exploration & production subindustry. The Portfolio also reduced its weighting in the oil & gas drilling subindustry on both an absolute and a relative basis.
On both an absolute and a relative basis, the Portfolio increased its weightings in the gold and diversified metals & mining subindustries.
How was the Portfolio positioned at the end of the reporting period?
As of June 30, 2017, the Portfolio had no allocation to the integrated oil & gas subindustry, making that subindustry a substantially underweight position relative to the S&P North American Natural Resources Sector Index. As of the same date, the Portfolio’s next most substantially underweight position was in the oil & gas storage & transportation subindustry. The Portfolio also had an underweight position in the oil & gas refining & marketing subindustry.
As of June 30, 2017, the Portfolio’s most substantially overweight positions relative to the S&P North American Natural Resources Sector Index were in the diversified metals & mining, gold, and oil & gas drilling subindustries.
| 1. | See footnote on page 5 for more information on this index. |
| 2. | See footnote on page 5 for more information on Lipper Inc. |
The opinions expressed are those of the portfolio managers as of the date of this report and are subject to change. There is no guarantee that any forecasts made will come to pass. This material does not constitute investment advice and is not intended as an endorsement of any specific investment.
Not all MainStay VP Portfolios and/or share classes are available under all policies.
| | |
| 8 | | MainStay VP VanEck Global Hard Assets Portfolio |
Portfolio of Investments June 30, 2017 (Unaudited)
| | | | | | | | |
| | |
Shares | | | Value | |
| Common Stocks 93.0%† | | | | | | | | |
Bermuda 0.8% | | | | | | | | |
Golar LNG, Ltd. (Oil, Gas & Consumable Fuels) | | | 125,800 | | | $ | 2,799,050 | |
| | | | | | | | |
| | |
Canada 17.2% | | | | | | | | |
¨Agnico Eagle Mines, Ltd. (Metals & Mining) | | | 253,793 | | | | 11,450,328 | |
Agrium, Inc. (Chemicals) | | | 100,500 | | | | 9,094,245 | |
Barrick Gold Corp. (Metals & Mining) | | | 268,000 | | | | 4,263,880 | |
¨First Quantum Minerals, Ltd. (Metals & Mining) | | | 1,426,500 | | | | 12,067,169 | |
Goldcorp, Inc. (Metals & Mining) | | | 167,800 | | | | 2,166,298 | |
IAMGOLD Corp. (Metals & Mining) (a) | | | 474,800 | | | | 2,449,968 | |
Kinross Gold Corp. (Metals & Mining) (a) | | | 1,008,300 | | | | 4,103,781 | |
New Gold, Inc. (Metals & Mining) (a) | | | 590,500 | | | | 1,877,790 | |
¨Teck Resources, Ltd. Class B (Metals & Mining) | | | 697,400 | | | | 12,085,942 | |
| | | | | | | | |
| | | | | | | 59,559,401 | |
| | | | | | | | |
France 1.2% | | | | | | | | |
Vallourec S.A. (Energy Equipment & Services) (a) | | | 672,500 | | | | 4,085,501 | |
| | | | | | | | |
| | |
Luxembourg 1.1% | | | | | | | | |
Tenaris S.A., ADR (Energy Equipment & Services) | | | 125,900 | | | | 3,920,526 | |
| | | | | | | | |
| | |
South Africa 0.8% | | | | | | | | |
Petra Diamonds, Ltd. (Metals & Mining) (a) | | | 1,957,300 | | | | 2,783,819 | |
| | | | | | | | |
| | |
Switzerland 7.5% | | | | | | | | |
¨Glencore PLC (Metals & Mining) (a) | | | 5,303,430 | | | | 19,838,198 | |
Weatherford International PLC (Energy Equipment & Services) (a) | | | 1,552,000 | | | | 6,006,240 | |
| | | | | | | | |
| | | | | | | 25,844,438 | |
| | | | | | | | |
| | |
United Kingdom 1.6% | | | | | | | | |
Randgold Resources, Ltd., ADR (Metals & Mining) | | | 61,800 | | | | 5,466,828 | |
| | | | | | | | |
| | |
United States 62.8% | | | | | | | | |
Callon Petroleum Co. (Oil, Gas & Consumable Fuels) (a) | | | 276,700 | | | | 2,935,787 | |
CF Industries Holdings, Inc. (Chemicals) | | | 257,700 | | | | 7,205,292 | |
Cimarex Energy Co. (Oil, Gas & Consumable Fuels) | | | 106,900 | | | | 10,049,669 | |
¨Concho Resources, Inc. (Oil, Gas & Consumable Fuels) (a) | | | 106,900 | | | | 12,991,557 | |
| | | | | | | | |
| | |
Shares | | | Value | |
United States (continued) | | | | | | | | |
CONSOL Energy, Inc. (Oil, Gas & Consumable Fuels) (a) | | | 496,300 | | | $ | 7,414,722 | |
¨Diamondback Energy, Inc. (Oil, Gas & Consumable Fuels) (a) | | | 144,500 | | | | 12,833,045 | |
¨EOG Resources, Inc. (Oil, Gas & Consumable Fuels) | | | 144,500 | | | | 13,080,140 | |
Forum Energy Technologies, Inc. (Energy Equipment & Services) (a) | | | 100,100 | | | | 1,561,560 | |
Freeport-McMoRan, Inc. (Metals & Mining) (a) | | | 345,500 | | | | 4,149,455 | |
Green Plains, Inc. (Oil, Gas & Consumable Fuels) | | | 182,000 | | | | 3,740,100 | |
Halliburton Co. (Energy Equipment & Services) | | | 232,000 | | | | 9,908,720 | |
Hannon Armstrong Sustainable Infrastructure Capital, Inc. (Equity Real Estate Investment Trusts (REITs)) | | | 50,300 | | | | 1,150,361 | |
Laredo Petroleum, Inc. (Oil, Gas & Consumable Fuels) (a) | | | 322,400 | | | | 3,391,648 | |
Louisiana-Pacific Corp. (Paper & Forest Products) (a) | | | 327,000 | | | | 7,883,970 | |
Nabors Industries, Ltd. (Energy Equipment & Services) | | | 1,086,900 | | | | 8,847,366 | |
Newfield Exploration Co. (Oil, Gas & Consumable Fuels) (a) | | | 314,300 | | | | 8,944,978 | |
Newmont Mining Corp. (Metals & Mining) | | | 339,700 | | | | 11,002,883 | |
¨Parsley Energy, Inc., Class A (Oil, Gas & Consumable Fuels) (a) | | | 502,700 | | | | 13,949,925 | |
¨Patterson-UTI Energy, Inc. (Energy Equipment & Services) | | | 609,600 | | | | 12,307,824 | |
PDC Energy, Inc. (Oil, Gas & Consumable Fuels) (a) | | | 169,800 | | | | 7,320,078 | |
¨Pioneer Natural Resources Co. (Oil, Gas & Consumable Fuels) | | | 81,500 | | | | 13,005,770 | |
ProPetro Holding Corp. (Energy Equipment & Services) (a) | | | 288,900 | | | | 4,033,044 | |
RSP Permian, Inc. (Oil, Gas & Consumable Fuels) (a) | | | 137,100 | | | | 4,424,217 | |
Schlumberger, Ltd. (Energy Equipment & Services) | | | 151,700 | | | | 9,987,928 | |
Scorpio Tankers, Inc. (Oil, Gas & Consumable Fuels) | | | 652,400 | | | | 2,590,028 | |
Steel Dynamics, Inc. (Metals & Mining) | | | 232,300 | | | | 8,318,663 | |
Sunrun, Inc. (Electrical Equipment) (a) | | | 238,700 | | | | 1,699,544 | |
Superior Energy Services, Inc. (Energy Equipment & Services) (a) | | | 465,100 | | | | 4,850,993 | |
Tyson Foods, Inc., Class A (Food Products) | | | 56,600 | | | | 3,544,858 | |
Union Pacific Corp. (Road & Rail) | | | 43,100 | | | | 4,694,021 | |
| | | | | | | | |
| | | | | | | 217,818,146 | |
| | | | | | | | |
Total Common Stocks
(Cost $352,782,795) | | | | | | | 322,277,709 | |
| | | | | | | | |
| † | Percentages indicated are based on Portfolio net assets. |
| ¨ | Among the Portfolio’s 10 largest holdings, as of June 30, 2017, excluding short-term investment. May be subject to change daily. |
| | | | | | |
The notes to the financial statements are an integral part of,
and should be read in conjunction with, the financial statements. | | | | | 9 | |
Portfolio of Investments June 30, 2017 (Unaudited) (continued)
| | | | | | | | |
| | | Principal
Amount | | | Value | |
| Short-Term Investment 6.9% | | | | | | | | |
Repurchase Agreement 6.9% | | | | | | | | |
United States 6.9% | | | | | | | | |
Fixed Income Clearing Corp.
0.12%, dated 6/30/17
due 7/3/17
Proceeds at Maturity $23,920,067 (Collateralized by a United States Treasury Note with a rate of 2.125% and a maturity date of 9/30/21, with a Principal Amount of $23,920,000 and a Market Value of $24,402,777) | | $ | 23,919,828 | | | $ | 23,919,828 | |
| | | | | | | | |
Total Short-Term Investment
(Cost $23,919,828) | | | | | | | 23,919,828 | |
| | | | | | | | |
Total Investments
(Cost $376,702,623) (b) | | | 99.9 | % | | | 346,197,537 | |
Other Assets, Less Liabilities | | | 0.1 | | | | 473,404 | |
Net Assets | | | 100.0 | % | | $ | 346,670,941 | |
| (a) | Non-income producing security. |
| (b) | As of June 30, 2017, cost was $385,252,724 for federal income tax purposes and net unrealized depreciation was as follows: |
| | | | |
Gross unrealized appreciation | | $ | 35,318,972 | |
Gross unrealized depreciation | | | (74,374,159 | ) |
| | | | |
Net unrealized depreciation | | $ | (39,055,187 | ) |
| | | | |
The following abbreviation is used in the preceding pages:
ADR—American Depositary Receipt
The following is a summary of the fair valuations according to the inputs used as of June 30, 2017, for valuing the Portfolio’s assets.
Asset Valuation Inputs
| | | | | | | | | | | | | | | | |
Description | | Quoted
Prices in
Active
Markets for
Identical
Assets (Level 1) | | | Significant
Other
Observable
Inputs (Level 2) | | | Significant
Unobservable
Inputs (Level 3) | | | Total | |
| Investments in Securities (a) | | | | | | | | | | | | | | | | |
| Common Stocks | | $ | 322,277,709 | | | $ | — | | | $ | — | | | $ | 322,277,709 | |
| Short-Term Investment | | | | | | | | | | | | | | | | |
Repurchase Agreement | | | — | | | | 23,919,828 | | | | — | | | | 23,919,828 | |
| | | | | | | | | | | | | | | | |
| Total Investments in Securities | | $ | 322,277,709 | | | $ | 23,919,828 | | | $ | — | | | $ | 346,197,537 | |
| | | | | | | | | | | | | | | | |
| (a) | For a complete listing of investments and their industries, see the Portfolio of Investments. |
The Portfolio recognizes transfers between the levels as of the beginning of the period.
As of June 30, 2017, certain foreign equity securities with a market value of $25,144,278 were transferred from Level 2 to Level 1 as the prices of these securities were based on observable quoted prices in active markets. ( See Note 2)
As of June 30, 2017, the Portfolio did not hold any investments with significant unobservable inputs (Level 3). (See Note 2)
| | | | |
| 10 | | MainStay VP VanEck Global Hard Assets Portfolio | | The notes to the financial statements are an integral part of,
and should be read in conjunction with, the financial statements. |
The table below sets forth the diversification of MainStay VP VanEck Global Hard Assets Portfolio investments by industry.
Industry Diversification
| | | | | | | | |
| | | Value | | | Percent † | |
Capital Markets | | $ | 23,919,828 | | | | 6.9 | % |
Chemicals | | | 16,299,537 | | | | 4.7 | |
Electrical Equipment | | | 1,699,544 | | | | 0.5 | |
Energy Equipment & Services | | | 65,509,702 | | | | 18.9 | |
Equity Real Estate Investment Trusts (REITs) | | | 1,150,361 | | | | 0.3 | |
Food Products | | | 3,544,858 | | | | 1.0 | |
Metals & Mining | | | 102,025,002 | | | | 29.4 | |
Oil, Gas & Consumable Fuels | | | 119,470,714 | | | | 34.5 | |
Paper & Forest Products | | | 7,883,970 | | | | 2.3 | |
Road & Rail | | | 4,694,021 | | | | 1.4 | |
| | | | | | | | |
| | | 346,197,537 | | | | 99.9 | |
Other Assets, Less Liabilities | | | 473,404 | | | | 0.1 | |
| | | | | | | | |
Net Assets | | $ | 346,670,941 | | | | 100.0 | % |
| | | | | | | | |
| † | Percentages indicated are based on Portfolio net assets. |
| | | | | | |
The notes to the financial statements are an integral part of,
and should be read in conjunction with, the financial statements. | | | | | 11 | |
Statement of Assets and Liabilities as of June 30, 2017 (Unaudited)
| | | | |
| Assets | |
Investment in securities, at value
(identified cost $376,702,623) | | $ | 346,197,537 | |
Cash | | | 42,756 | |
Receivables: | | | | |
Investment securities sold | | | 684,163 | |
Dividends and interest | | | 267,237 | |
Fund shares sold | | | 87,287 | |
Other assets | | | 2,428 | |
| | | | |
Total assets | | | 347,281,408 | |
| | | | |
|
| Liabilities | |
Payables: | | | | |
Fund shares redeemed | | | 286,706 | |
Manager (See Note 3) | | | 255,432 | |
Professional fees | | | 29,536 | |
Shareholder communication | | | 28,689 | |
Custodian | | | 4,086 | |
Trustees | | | 783 | |
Accrued expenses | | | 5,235 | |
| | | | |
Total liabilities | | | 610,467 | |
| | | | |
Net assets | | $ | 346,670,941 | |
| | | | |
|
| Composition of Net Assets | |
Shares of beneficial interest outstanding (par value of $.001 per share) unlimited number of shares authorized | | $ | 53,941 | |
Additional paid-in capital | | | 551,117,738 | |
| | | | |
| | | 551,171,679 | |
Net investment loss | | | (233,645 | ) |
Accumulated net realized gain (loss) on investments and foreign currency transactions | | | (173,762,007 | ) |
Net unrealized appreciation (depreciation) on investments | | | (30,505,086 | ) |
| | | | |
Net assets | | $ | 346,670,941 | |
| | | | |
| | | | |
Initial Class | |
Net assets applicable to outstanding shares | | $ | 346,670,941 | |
| | | | |
Shares of beneficial interest outstanding | | | 53,941,486 | |
| | | | |
Net asset value per share outstanding | | $ | 6.43 | |
| | | | |
| | | | |
| 12 | | MainStay VP VanEck Global Hard Assets Portfolio | | The notes to the financial statements are an integral part of,
and should be read in conjunction with, the financial statements. |
Statement of Operations for the six months ended June 30, 2017 (Unaudited)
| | | | |
| Investment Income (Loss) | |
Income | | | | |
Dividends (a) | | $ | 1,608,509 | |
Interest | | | 3,879 | |
| | | | |
Total income | | | 1,612,388 | |
| | | | |
Expenses | |
Manager (See Note 3) | | | 1,772,720 | |
Shareholder communication | | | 37,308 | |
Professional fees | | | 34,334 | |
Trustees | | | 5,436 | |
Custodian | | | 4,980 | |
Miscellaneous | | | 10,205 | |
| | | | |
Total expenses | | | 1,864,983 | |
| | | | |
Net investment income (loss) | | | (252,595 | ) |
| | | | |
|
| Realized and Unrealized Gain (Loss) on Investments and Foreign Currency Transactions | |
Net realized gain (loss) on: | |
Investment transactions | | | (11,872,786 | ) |
Foreign currency transactions | | | (2,769 | ) |
| | | | |
Net realized gain (loss) on investments and foreign currency transactions | | | (11,875,555 | ) |
| | | | |
Net change in unrealized appreciation (depreciation) on: | |
Investments | | | (55,075,464 | ) |
Translation of other assets and liabilities in foreign currencies | | | 87 | |
| | | | |
Net change in unrealized appreciation (depreciation) on investments and foreign currency transactions | | | (55,075,377 | ) |
| | | | |
Net realized and unrealized gain (loss) on investments and foreign currency transactions | | | (66,950,932 | ) |
| | | | |
Net increase (decrease) in net assets resulting from operations | | $ | (67,203,527 | ) |
| | | | |
| (a) | Dividends recorded net of foreign withholding taxes in the amount of $46,607. |
| | | | | | |
The notes to the financial statements are an integral part of,
and should be read in conjunction with, the financial statements. | | | | | 13 | |
Statements of Changes in Net Assets
for the six months ended June 30, 2017 (Unaudited) and the year ended December 31, 2016
| | | | | | | | |
| | | 2017 | | | 2016 | |
| Increase (Decrease) in Net Assets | |
Operations: | | | | | | | | |
Net investment income (loss) | | $ | (252,595 | ) | | $ | (471,888 | ) |
Net realized gain (loss) on investments and foreign currency transactions | | | (11,875,555 | ) | | | (52,089,740 | ) |
Net change in unrealized appreciation (depreciation) on investments and foreign currency transactions | | | (55,075,377 | ) | | | 196,405,570 | |
| | | | |
Net increase (decrease) in net assets resulting from operations | | | (67,203,527 | ) | | | 143,843,942 | |
| | | | |
Dividends to shareholders: | | | | | | | | |
From net investment income: | | | | | | | | |
Initial Class | | | — | | | | (2,505,721 | ) |
| | | | |
Capital share transactions: | | | | | | | | |
Net proceeds from sale of shares | | | 26,124,181 | | | | 61,767,884 | |
Net asset value of shares issued to shareholders in reinvestment of dividends | | | — | | | | 2,505,721 | |
Cost of shares redeemed | | | (45,141,001 | ) | | | (105,543,449 | ) |
Increase (decrease) in net assets derived from capital share transactions | | | (19,016,820 | ) | | | (41,269,844 | ) |
| | | | |
Net increase (decrease) in net assets | | | (86,220,347 | ) | | | 100,068,377 | |
|
| Net Assets | |
| |
Beginning of period | | | 432,891,288 | | | | 332,822,911 | |
| | | | |
End of period | | $ | 346,670,941 | | | $ | 432,891,288 | |
| | | | |
(Net investment loss) undistributed net Investment Income at end of period | | $ | (233,645 | ) | | $ | 18,950 | |
| | | | |
| | | | |
| 14 | | MainStay VP VanEck Global Hard Assets Portfolio | | The notes to the financial statements are an integral part of,
and should be read in conjunction with, the financial statements. |
Financial Highlights selected per share data and ratios
| | | | | | | | | | | | | | | | | | | | | | | | |
| | | Six months
ended June 30, | | | Year ended December 31, | | | February 17,
2012**
through December 31, | |
| Initial Class | | 2017* | | | 2016 | | | 2015 | | | 2014 | | | 2013 | | | 2012 | |
Net asset value at beginning of period | | $ | 7.67 | | | $ | 5.38 | | | $ | 8.06 | | | $ | 9.97 | | | $ | 9.08 | | | $ | 10.00 | |
| | | | | | | | | | | | | | | | | | | | | | | | |
Net investment income (loss) | | | (0.00 | )‡ | | | (0.01 | ) | | | 0.04 | | | | 0.04 | | | | 0.05 | | | | 0.08 | |
Net realized and unrealized gain (loss) on investments | | | (1.24 | ) | | | 2.34 | | | | (2.69 | ) | | | (1.91 | ) | | | 0.95 | | | | (1.00 | ) |
Net realized and unrealized gain (loss) on foreign currency transactions | | | (0.00 | )‡ | | | (0.00 | )‡ | | | 0.00 | ‡ | | | (0.00 | )‡ | | | (0.00 | )‡ | | | (0.00 | )‡ |
| | | | | | | | | | | | | | | | | | | | | | | | |
Total from investment operations | | | (1.24 | ) | | | 2.33 | | | | (2.65 | ) | | | (1.87 | ) | | | 1.00 | | | | (0.92 | ) |
| | | | | | | | | | | | | | | | | | | | | | | | |
| Less dividends: | | | | | | | | | | | | | | | | | | | | | | | | |
From net investment income | | | — | | | | (0.04 | ) | | | (0.03 | ) | | | (0.04 | ) | | | (0.11 | ) | | | — | |
| | | | | | | | | | | | | | | | | | | | | | | | |
Net asset value at end of period | | $ | 6.43 | | | $ | 7.67 | | | $ | 5.38 | | | $ | 8.06 | | | $ | 9.97 | | | $ | 9.08 | |
| | | | | | | | | | | | | | | | | | | | | | | | |
Total investment return (a) | | | (16.17 | %)(b) | | | 43.33 | % | | | (32.96 | %) | | | (18.81 | %) | | | 10.96 | % | | | (9.20 | %)(b) |
| Ratios (to average net assets)/Supplemental Data: | | | | | | | | | | | | | | | | | | | | | | | | |
Net investment income (loss) | | | (0.13 | %)†† | | | (0.12 | %)(c) | | | 0.57 | % | | | 0.38 | % | | | 0.46 | % | | | 0.98 | % †† |
Net expenses | | | 0.94 | % †† | | | 0.93 | % (d) | | | 0.93 | % | | | 0.93 | % | | | 0.93 | % | | | 0.94 | % †† |
Portfolio turnover rate | | | 7 | % | | | 40 | % | | | 21 | % | | | 33 | % | | | 31 | % | | | 24 | % |
Net assets at end of period (in 000’s) | | $ | 346,671 | | | $ | 432,891 | | | $ | 332,823 | | | $ | 466,515 | | | $ | 591,890 | | | $ | 608,978 | |
| ‡ | Less than one cent per share. |
| (a) | Total return does not reflect any deduction of sales charges, mortality and expense charges, contract charges or administrative charges. For periods of less than one year, total return is not annualized. |
| (b) | Total investment return may reflect adjustments to conform to generally accepted accounting principles. |
| (c) | Without the custody fee reimbursement, net investment income (loss) would have been (0.13)%. |
| (d) | Without the custody fee reimbursement, net expenses would have been 0.94%. |
| | | | | | |
The notes to the financial statements are an integral part of,
and should be read in conjunction with, the financial statements. | | | | | 15 | |
Notes to Financial Statements (Unaudited)
Note 1–Organization and Business
MainStay VP Funds Trust (the “Fund”) was organized as a Delaware statutory trust on February 1, 2011. The Fund is registered under the Investment Company Act of 1940, as amended (the “1940 Act”), as an open-end management investment company. The Fund is comprised of thirty-two separate series (collectively referred to as the “Portfolios”). These financial statements and notes relate to the MainStay VP VanEck Global Hard Assets Portfolio (the “Portfolio”), a “non diversified” portfolio, as that term is defined in the 1940 Act, as interpreted or modified by regulatory authorities having jurisdiction, from time to time. Since the Portfolio has historically operated as a “diversified” portfolio, it will not operate as “non diversified” without first obtaining shareholder approval.
Shares of the Portfolio are currently offered to certain separate accounts to fund variable annuity policies and variable universal life insurance policies issued by New York Life Insurance and Annuity Corporation (“NYLIAC”), a wholly-owned subsidiary of New York Life Insurance Company (“New York Life”). NYLIAC allocates shares of the Portfolios to, among others, NYLIAC Variable Annuity Separate Accounts-I, II, III and IV, VUL Separate Account-I and CSVUL Separate Account-I (collectively, the “Separate Accounts”). Shares of the Portfolio are also offered to the MainStay VP Conservative Allocation Portfolio, MainStay VP Moderate Allocation Portfolio, MainStay VP Moderate Growth Allocation Portfolio and MainStay VP Growth Allocation Portfolio, which operate as “funds-of-funds.”
The Portfolio currently offers one class of shares. Initial Class shares commenced operations on February 17, 2012. Shares of the Portfolio are sold and are redeemed at a price equal to their net asset value (“NAV”) per share. No sales or redemption charge is applicable to the purchase or redemption of the Portfolio’s shares.
The Portfolio’s investment objective is to seek long-term capital appreciation by investing primarily in hard asset securities. Income is a secondary consideration.
Note 2–Significant Accounting Policies
The Portfolio is an investment company and accordingly follows the investment company accounting and reporting guidance of the Financial Accounting Standards Board (“FASB”) Accounting Standard Codification Topic 946 Financial Services—Investment Companies. The Portfolio prepares its financial statements in accordance with generally accepted accounting principles (“GAAP”) in the United States of America and follows the significant accounting policies described below.
(A) Securities Valuation. Investments are usually valued as of the close of regular trading on the New York Stock Exchange (the “Exchange”) (usually 4:00 p.m. Eastern time) on each day the Portfolio is open for business (“valuation date”).
The Board of Trustees (the “Board”) of the Fund adopted procedures establishing methodologies for the valuation of the Portfolio’s securities and other assets and delegated the responsibility for valuation determinations under those procedures to the Valuation Committee of the Fund (the “Valuation Committee”). The Board authorized the Valuation Committee to appoint a Valuation Sub-Committee (the “Sub-Committee”) to deal in the first instance with establishing the
prices of securities for which market quotations are not readily available or the prices of which are not otherwise readily determinable under these procedures. The Sub-Committee meets (in person, via electronic mail or via teleconference) on an as-needed basis. Subsequently, the Valuation Committee meets to ensure that actions taken by the Sub-Committee were appropriate. The procedures recognize that, subject to the oversight of the Board and unless otherwise noted, the responsibility for the day-to-day valuation of portfolio assets (including fair value measurements for the Portfolio’s assets and liabilities) rests with New York Life Investment Management LLC (“New York Life Investments” or the “Manager”), aided to whatever extent necessary by the Subadvisor (as defined in Note 3(A)) to the Portfolio.
To assess the appropriateness of security valuations, the Manager, the Subadvisor or the Portfolio’s third party service provider, who is subject to oversight by the Manager, regularly compares prior day prices, prices on comparable securities and the sale prices to the prior and current day prices and challenges prices with changes exceeding certain tolerance levels with third party pricing services or broker sources. For those securities valued through either a standardized fair valuation methodology or a fair valuation measurement, the Sub-Committee deals in the first instance with such valuation and the Valuation Committee reviews and affirms, if appropriate, the reasonableness of the valuation based on such methodologies and measurements on a regular basis after considering all relevant information that is reasonably available. Any action taken by the Sub-Committee with respect to the valuation of a portfolio security or other asset is submitted by the Valuation Committee to the Board for its review and ratification, if appropriate, at its next regularly scheduled meeting.
“Fair value” is defined as the price the Portfolio would reasonably expect to receive upon selling an asset or liability in an orderly transaction to an independent buyer in the principal or most advantageous market for the asset or liability. Fair value measurements are determined within a framework that establishes a three-tier hierarchy which maximizes the use of observable market data and minimizes the use of unobservable inputs to establish a classification of fair value measurements for disclosure purposes. “Inputs” refer broadly to the assumptions that market participants would use in pricing the asset or liability, including assumptions about risk, such as the risk inherent in a particular valuation technique used to measure fair value using a pricing model and/or the risk inherent in the inputs for the valuation technique. Inputs may be observable or unobservable. Observable inputs reflect the assumptions market participants would use in pricing the asset or liability based on market data obtained from sources independent of the Portfolio. Unobservable inputs reflect the Portfolio’s own assumptions about the assumptions market participants would use in pricing the asset or liability based on the information available. The inputs or methodology used for valuing assets or liabilities may not be an indication of the risks associated with investing in those assets or liabilities. The three-tier hierarchy of inputs is summarized below.
| • | | Level 1—quoted prices in active markets for an identical asset or liability |
| • | | Level 2—other significant observable inputs (including quoted prices for a similar asset or liability in active markets, interest rates and yield curves, prepayment speeds, credit risk, etc.) |
| | |
| 16 | | MainStay VP VanEck Global Hard Assets Portfolio |
| • | | Level 3—significant unobservable inputs (including the Portfolio’s own assumptions about the assumptions that market participants would use in measuring fair value of an asset or liability) |
The level of an asset or liability within the fair value hierarchy is based on the lowest level of an input, both individually and in the aggregate, that is significant to the fair value measurement. As of June 30, 2017, the aggregate value by input level of the Portfolio’s assets and liabilities is included at the end of the Portfolio’s Portfolio of Investments.
The Portfolio may use third party vendor evaluations, whose prices may be derived from one or more of the following standard inputs, among others:
| | |
• Broker/dealer quotes | | • Benchmark securities |
• Two-sided markets | | • Reference data (corporate actions or material event notices) |
• Bids/offers | | • Monthly payment information |
• Industry and economic events | | • Reported trades |
An asset or liability for which market values cannot be measured using the methodologies described above is valued by methods deemed reasonable in good faith by the Valuation Committee, following the procedures established by the Board, to represent fair value. Under these procedures, the Portfolio generally uses a market-based approach which may use related or comparable assets or liabilities, recent transactions, market multiples, book values, and other relevant information. The Portfolio may also use an income-based valuation approach in which the anticipated future cash flows of the asset or liability are discounted to calculate fair value. Discounts may also be applied due to the nature and/or duration of any restrictions on the disposition of the asset or liability. Fair value represents a good faith approximation of the value of a security. Fair value determinations involve the consideration of a number of subjective factors, an analysis of applicable facts and circumstances and the exercise of judgment. As a result, it is possible that the fair value for a security determined in good faith in accordance with the Portfolio’s valuation procedures may differ from valuations for the same security determined by other funds using their own valuation procedures. Although the Portfolio’s valuation procedures are designed to value a security at the price the Portfolio may reasonably expect to receive upon the security’s sale in an orderly transaction, there can be no assurance that any fair value determination thereunder would, in fact, approximate the amount that the Portfolio would actually realize upon the sale of the security or the price at which the security would trade if a reliable market price were readily available. During the six-month period ended June 30, 2017, there were no material changes to the fair value methodologies.
Securities which may be valued in this manner include, but are not limited to: (i) a security for which trading has been halted or suspended; (ii) a debt security that has recently gone into default and for which there is not a current market quotation; (iii) a security of an issuer that has entered into a restructuring; (iv) a security that has been de-listed from a national exchange; (v) a security for which the market price is not readily available from a third party pricing source or, if so provided, does not, in the opinion of the Manager or Subadvisor reflect the security’s market value; (vi) a security subject to trading collars for which no or limited trading takes place; and (vii) a security whose principal market has been temporarily closed at a time when, under normal conditions, it
would be open. Securities for which market quotations or observable inputs are not readily available are generally categorized as Level 3 in the hierarchy. As of June 30, 2017, there were no securities held by the Portfolio that were fair valued in such a manner.
Certain securities held by the Portfolio may principally trade in foreign markets. Events may occur between the time the foreign markets close and the time at which the Portfolio’s NAVs are calculated. These events may include, but are not limited to, situations relating to a single issuer in a market sector, significant fluctuations in U.S. or foreign markets, natural disasters, armed conflicts, governmental actions or other developments not tied directly to the securities markets. Should the Manager or Subadvisor conclude that such events may have affected the accuracy of the last price of such securities reported on the local foreign market, the Sub-Committee may, pursuant to procedures adopted by the Board, adjust the value of the local price to reflect the estimated impact on the price of such securities as a result of such events. In this instance, securities are generally categorized as Level 3 in the hierarchy. Additionally, certain foreign equity securities are also fair valued whenever the movement of a particular index exceeds certain thresholds. In such cases, the securities are fair valued by applying factors provided by a third party vendor in accordance with valuation procedures adopted by the Board and are generally categorized as Level 2 in the hierarchy. As of June 30, 2017, no foreign equity securities held by the Portfolio were valued in such a manner.
Equity securities are valued at the last quoted sales prices as of the close of regular trading on the relevant exchange on each valuation date. Securities that are not traded on the valuation date are valued at the mean of the last quoted bid and ask prices. Prices are normally taken from the principal market in which each security trades. These securities are generally categorized as Level 1 in the hierarchy.
Temporary cash investments acquired in excess of 60 days to maturity at the time of purchase are valued using the latest bid prices or using valuations based on a matrix system (which considers such factors as security prices, yields, maturities, and ratings), both as furnished by independent pricing services. Other temporary cash investments which mature in 60 days or less at the time of purchase (“Short-Term Investments”) are valued using the amortized cost method of valuation, unless the use of such method would be inappropriate. The amortized cost method involves valuing a security at its cost on the date of purchase and thereafter assuming a constant amortization to maturity of the difference between such cost and the value on maturity date. Amortized cost approximates the current fair value of a security. Securities valued using the amortized cost method are not valued using quoted prices in an active market and are generally categorized as Level 2 in the hierarchy.
The information above is not intended to reflect an exhaustive list of the methodologies that may be used to value portfolio investments. The valuation procedures permit the use of a variety of valuation methodologies in connection with valuing portfolio investments. The methodology used for a specific type of investment may vary based on the market data available or other considerations. The methodologies summarized above may not represent the specific means by which portfolio investments are valued on any particular business day.
A portfolio security or other asset may be determined to be illiquid under procedures approved by the Board. Illiquidity of a security might prevent
Notes to Financial Statements (Unaudited) (continued)
the sale of such security at a time when the Manager or Subadvisor might wish to sell, and these securities could have the effect of decreasing the overall level of the Portfolio’s liquidity. Further, the lack of an established secondary market may make it more difficult to value illiquid securities, requiring the Portfolio to rely on judgments that may be somewhat subjective in measuring value, which could vary materially from the amount that the Portfolio could realize upon disposition. Difficulty in selling illiquid securities may result in a loss or may be costly to the Portfolio. Under the supervision of the Board, the Manager or Subadvisor determines the liquidity of the Portfolio’s investments; in doing so, the Manager or Subadvisor may consider various factors, including (i) the frequency of trades and quotations, (ii) the number of dealers and prospective purchasers, (iii) dealer undertakings to make a market, and (iv) the nature of the security and the market in which it trades (e.g., the time needed to dispose of the security, the method of soliciting offers and the mechanics of transfer). Illiquid securities are often valued in accordance with methods deemed by the Board in good faith to be reasonable and appropriate to accurately reflect their fair value. The liquidity of the Portfolio’s investments, as shown in the Portfolio of Investments and was determined as of June 30, 2017 and can change at any time in response to, among other relevant factors, market conditions or events or developments with respect to an individual issuer or instrument. As of June 30, 2017, the Portfolio did not hold any securities deemed to be illiquid under procedures approved by the Board.
(B) Income Taxes. The Portfolio’s policy is to comply with the requirements of the Internal Revenue Code of 1986, as amended (the “Internal Revenue Code”), applicable to regulated investment companies and to distribute all of its taxable income to the shareholders of the Portfolio within the allowable time limits. Therefore, no federal, state and local income tax provisions are required.
Management evaluates the Portfolio’s tax positions to determine if the tax positions taken meet the minimum recognition threshold in connection with accounting for uncertainties in income tax positions taken or expected to be taken for the purposes of measuring and recognizing tax liabilities in the financial statements. Recognition of tax benefits of an uncertain tax position is permitted only to the extent the position is “more likely than not” to be sustained assuming examination by taxing authorities. Management has analyzed the Portfolio’s tax positions taken on federal, state and local income tax returns for all open tax years (for up to three tax years), and has concluded that no provisions for federal, state and local income tax are required in the Portfolio’s financial statements. The Portfolio’s federal, state and local income and federal excise tax returns for tax years for which the applicable statutes of limitations have not expired are subject to examination by the Internal Revenue Service and state and local departments of revenue.
(C) Foreign Taxes. The Portfolio may be subject to foreign taxes on income and other transaction-based taxes imposed by certain countries in which it invests. A portion of the taxes on gains on investments or currency purchases/repatriation may be reclaimable. The Portfolio will accrue such taxes and reclaims as applicable, based upon its current interpretation of tax rules and regulations that exist in the markets in which it invests.
The Portfolio may be subject to taxation on realized capital gains, repatriation proceeds and other transaction-based taxes imposed by certain
countries in which it invests. The Portfolio will accrue such taxes as applicable based upon its current interpretation of tax rules and regulations that exist in the market in which it invests. Capital gains taxes relating to positions still held are reflected as a liability on the Statement of Assets and Liabilities, as well as an adjustment to the Portfolio’s net unrealized appreciation (depreciation). Taxes related to capital gains realized, if any, are reflected as part of net realized gain (loss) in the Statement of Operations. Changes in tax liabilities related to capital gains taxes on unrealized investment gains, if any, are reflected as part of the change in net unrealized appreciation (depreciation) on investments in the Statement of Operations. Transaction-based charges are generally assessed as a percentage of the transaction amount.
(D) Dividends and Distributions to Shareholders. Dividends and distributions are recorded on the ex-dividend date. The Portfolio intends to declare and pay dividends from net investment income and distributions from net realized capital and currency gains, if any, at least annually. Unless the shareholder elects otherwise, all dividends and distributions are reinvested in the same class of shares of the Portfolio, at NAV. Dividends and distributions to shareholders are determined in accordance with federal income tax regulations and may differ from GAAP.
(E) Security Transactions and Investment Income. The Portfolio records security transactions on the trade date. Realized gains and losses on security transactions are determined using the identified cost method. Dividend income is recognized on the ex-dividend date; net of any foreign tax withheld at the source, and interest income is accrued as earned using the effective interest rate method. Discounts and premiums on Short-Term Investments are accreted and amortized, respectively, on the straight-line method. The straight-line method approximates the effective interest method for Short-Term Investments.
(F) Expenses. Expenses of the Fund are allocated to the individual Portfolios in proportion to the net assets of the respective Portfolios when the expenses are incurred, except where direct allocations of expenses can be made. The expenses borne by the Portfolio, including those of related parties to the Portfolio, are shown in the Statement of Operations.
(G) Use of Estimates. In preparing financial statements in conformity with GAAP, management makes estimates and assumptions that affect the reported amounts and disclosures in the financial statements. Actual results could differ from those estimates.
(H) Repurchase Agreements. The Portfolio may enter into repurchase agreements (i.e., buy a security from another party with the agreement that it be sold back in the future) to earn income. The Portfolio may enter into repurchase agreements only with counterparties, usually financial institutions, that are deemed by the Manager or Subadvisor to be creditworthy, pursuant to guidelines established by the Board. During the term of any repurchase agreement, the Manager or Subadvisor will continue to monitor the creditworthiness of the counterparty. Under the 1940 Act, repurchase agreements are considered to be collateralized loans by the Portfolio to the counterparty secured by the securities transferred to the Portfolio.
Repurchase agreements are subject to counterparty risk, meaning the Portfolio could lose money by the counterparty’s failure to perform under the terms of the agreement. The Portfolio mitigates this risk by
| | |
| 18 | | MainStay VP VanEck Global Hard Assets Portfolio |
ensuring the repurchase agreement is collateralized by cash, U.S. government securities, fixed income securities and/or other securities. The collateral is held by the Portfolio’s custodian valued daily on a mark to market basis to determine if the value, including accrued interest, exceeds the repurchase price. In the event of the counterparty’s default on the obligation to repurchase, the Portfolio has the right to liquidate the collateral and apply the proceeds in satisfaction of the obligation. Under certain circumstances, such as in the event of default or bankruptcy by the counterparty, realization and/or retention of the collateral may be limited or subject to delay, to legal proceedings and possible realized loss to the Portfolio.
(I) Foreign Currency Transactions. The Portfolio’s books and records are maintained in U.S. dollars. Prices of securities denominated in foreign currency amounts are translated into U.S. dollars at the mean between the buying and selling rates last quoted by any major U.S. bank at the following dates:
| (i) | market value of investment securities, other assets and liabilities—at the valuation date; and |
| (ii) | purchases and sales of investment securities, income and expenses—at the date of such transactions. |
The assets and liabilities that are denominated in foreign currency amounts are presented at the exchange rates and market values at the close of the period. The realized and unrealized changes in net assets arising from fluctuations in exchange rates and market prices of securities are not separately presented.
Net realized gain (loss) on foreign currency transactions represents net gains and losses on foreign currency forward contracts, net currency gains or losses realized as a result of differences between the amounts of securities sale proceeds or purchase cost, dividends, interest and withholding taxes as recorded on the Portfolio’s books, and the U.S. dollar equivalent amount actually received or paid. Net currency gains or losses from valuing such foreign currency denominated assets and liabilities, other than investments at valuation date exchange rates, are reflected in unrealized foreign exchange gains or losses.
(J) Securities Lending. In order to realize additional income, the Portfolio may engage in securities lending, subject to the limitations set forth in the 1940 Act and relevant guidance by the staff of the Securities and Exchange Commission (“SEC”). In the event the Portfolio does engage in securities lending, the Portfolio will lend through its custodian, State Street Bank and Trust Company (“State Street”). State Street will manage the Portfolio’s collateral in accordance with the lending agreement between the Portfolio and State Street, and indemnify the Portfolio against counterparty risk. The loans will be collateralized by U.S. Treasury securities at least equal at all times to the market value of the securities loaned. The Portfolio may bear the risk of delay in recovery of, or loss of rights in, the securities loaned should the borrower of the securities experience financial difficulty. The Portfolio may also record a realized gain or loss on securities deemed sold due to a borrower’s inability to return securities on loan. The Portfolio bears the risk of any loss on investment of the collateral. The Portfolio will receive compensation for lending its securities in the form of fees or it will retain a portion of interest on the investment of any cash received as collateral. The Portfolio will also continue to receive interest and dividends on the securities loaned and any gain or loss in the market price of the securities
loaned that may occur during the term of the loan will be for the account of the Portfolio. During the six-month period ended June 30, 2017, the Portfolio did not have any portfolio securities on loan.
(K) Foreign Securities Risk. The Portfolio may invest in foreign securities, which carry certain risks that are in addition to the usual risks inherent in domestic instruments. These risks include those resulting from currency fluctuations, future adverse political or economic developments and possible imposition of currency exchange blockages or other foreign governmental laws or restrictions. These risks are likely to be greater in emerging markets than in developed markets. The ability of issuers of securities held by the Portfolio to meet their obligations may be affected, among other things, by economic or political developments in a specific country, industry or region.
(L) Indemnifications. Under the Fund’s organizational documents, its officers and trustees are indemnified against certain liabilities that may arise out of performance of their duties to the Fund. Additionally, in the normal course of business, the Portfolio enters into contracts with third-party service providers that contain a variety of representations and warranties and which may provide general indemnifications. The Portfolio’s maximum exposure under these arrangements is unknown, as this would involve future claims that may be made against the Portfolios that have not yet occurred. Based on experience, management is of the view that the risk of loss in connection with these potential indemnification obligations is remote. However, there can be no assurance that material liabilities related to such obligations will not arise in the future, which could adversely impact the Portfolio.
Note 3–Fees and Related Party Transactions
(A) Manager and Subadvisor. New York Life Investments, a registered investment adviser and an indirect, wholly-owned subsidiary of New York Life, serves as the Portfolio’s Manager, pursuant to an Amended and Restated Management Agreement (“Management Agreement”). The Manager provides offices, conducts clerical, recordkeeping and bookkeeping services, and keeps most of the financial and accounting records required to be maintained by the Portfolio. Except for the portion of salaries and expenses that are the responsibility of the Portfolio, the Manager pays the salaries and expenses of all personnel affiliated with the Portfolio and certain operational expenses of the Portfolio. The Portfolio reimburses New York Life Investments in an amount equal to a portion of the compensation of the Chief Compliance Officer attributable to the Portfolio. VanEck Associates Corporation (“VanEck” or “Subadvisor”), a registered investment adviser, serves as Subadvisor to the Portfolio and is responsible for the day-to-day portfolio management of the Portfolio. Pursuant to the terms of a Subadvisory Agreement (“Subadvisory Agreement”) between New York Life Investments and VanEck, New York Life Investments pays for the services of the Subadvisor.
The Fund, on behalf of the Portfolio, pays New York Life Investments in its capacity as the Portfolio’s investment manager and administrator, pursuant to the Management Agreement, a monthly fee for services performed and facilities furnished at an annual rate of the Portfolio’s average daily net assets as follows: 0.89% up to $1 billion; and 0.88% in excess of $1 billion. During the six-month period ended June 30, 2017, the effective management fee rate was 0.89%.
Notes to Financial Statements (Unaudited) (continued)
During the six-month period ended June 30, 2017, New York Life Investments earned fees from the Portfolio in the amount of $1,772,720.
State Street provides sub-administration and sub-accounting services to the Portfolio pursuant to an agreement with New York Life Investments. These services include calculating the daily NAVs of the Portfolio, maintaining the general ledger and sub-ledger accounts for the calculation of the Portfolio’s NAVs, and assisting New York Life Investments in conducting various aspects of the Portfolio’s administrative operations. For providing these services to the Portfolio, State Street is compensated by New York Life Investments.
Note 4–Federal Income Tax
During the year ended December 31, 2016, the tax character of distributions paid as reflected in the Statements of Changes in Net Assets was as follows:
| | |
| 2016 |
Tax-Based
Distributions
from Ordinary
Income | | Tax-Based
Distributions
from Long-Term
Gains |
| $2,505,721 | | $— |
Note 5–Custodian
State Street is the custodian of cash and securities held by the Portfolio. Custodial fees are charged to the Portfolio based on the Portfolio’s net assets and/or the market value of securities held by the Portfolio and the number of certain transactions incurred by the Portfolio.
Note 6–Line of Credit
The Portfolio and certain other funds managed by New York Life Investments, maintain a line of credit with a syndicate of banks in order to secure a source of funds for temporary purposes to meet unanticipated or excessive redemption requests.
Effective August 1, 2017, under the credit agreement (the “Credit Agreement”), the aggregate commitment amount is $600,000,000 with an additional uncommitted amount of $100,000,000. The commitment fee is an annual rate of 0.15% of the average commitment amount payable quarterly, regardless of usage, to State Street, who serves as the agent to the syndicate. The commitment fee is allocated among the Portfolio and certain other funds managed by New York Life Investments based upon their respective net assets and other factors. Interest on any revolving credit loan is charged based upon the Federal Funds Advances Rate or the one month LIBOR, whichever is higher. The Credit Agreement expires on July 31, 2018, although the Portfolio, certain other funds managed by New York Life Investments and the syndicate of banks may renew the Credit Agreement for an additional year on the same or different terms. Prior to August 1, 2017, the aggregate commitment amount was $600,000,000 with an additional uncommitted amount of $100,000,000, and the commitment fee, under a credit agreement for which Bank of New York Mellon served as agent, was at an annual rate of 0.15% of the average commitment amount. During the six-month period ended June 30, 2017, there were no borrowings made or outstanding with respect to the Portfolio under the credit agreement for which Bank of New York Mellon served as agent.
Note 7–Interfund Lending Program
Pursuant to an exemptive order issued by the SEC, the Portfolio, along with certain other funds managed by New York Life Investments, may participate in an interfund lending program. The interfund lending program provides an alternative credit facility that permits the Portfolio and certain other funds managed by New York Life Investments to lend or borrow money for temporary purposes directly to or from one another, subject to the conditions of the exemptive order. During the six-month period ended June 30, 2017, there were no interfund loans made or outstanding with respect to the Portfolio.
Note 8–Purchases and Sales of Securities (in 000’s)
During the six-month period ended June 30, 2017, purchases and sales of securities, other than short-term securities, were $25,609 and $57,574, respectively.
Note 9–Capital Share Transactions
Transactions in capital shares for the six-month period ended June 30, 2017, and the year ended December 31, 2016, were as follows:
| | | | | | | | |
Initial Class | | Shares | | | Amount | |
Six-month period ended June 30, 2017: | | | | | | | | |
Shares sold | | | 3,653,411 | | | $ | 26,124,181 | |
Shares redeemed | | | (6,169,781 | ) | | | (45,141,001 | ) |
| | | | |
Net increase (decrease) | | | (2,516,370 | ) | | $ | (19,016,820 | ) |
| | | | |
Year ended December 31, 2016: | | | | | | | | |
Shares sold | | | 10,064,583 | | | $ | 61,767,884 | |
Shares issued to shareholders in reinvestment of dividends and distributions | | | 341,318 | | | | 2,505,721 | |
Shares redeemed | | | (15,788,390 | ) | | | (105,543,449 | ) |
| | | | |
Net increase (decrease) | | | (5,382,489 | ) | | $ | (41,269,844 | ) |
| | | | |
Note 10–Recent Accounting Pronouncement
In October 2016, the SEC adopted new rules and amended existing rules (together, “final rules”) intended to modernize the reporting and disclosure of information by registered investment companies. In part, the final rules amend Regulation S-X and require standardized, enhanced disclosure about derivatives in investment company financial statements, as well as other amendments. The compliance date for the amendments to Regulation S-X is August 1, 2017 and applies to shareholder reports for funds with fiscal periods ending after August 1, 2017. Management is currently evaluating the impact that the adoption of the amendments to Regulation S-X will have on the Portfolio’s financial statements and related disclosures.
Note 11–Subsequent Events
In connection with the preparation of the financial statements of the Portfolio as of and for the six-month period ended June 30, 2017, events and transactions subsequent to June 30, 2017, through the date the financial statements were issued have been evaluated by the Portfolio’s management for possible adjustment and/or disclosure. No subsequent events requiring financial statement adjustment or disclosure have been identified.
| | |
| 20 | | MainStay VP VanEck Global Hard Assets Portfolio |
Proxy Voting Policies and Procedures and Proxy Voting Record
A description of the policies and procedures that New York Life Investments uses to vote proxies related to the Portfolio’s securities is available without charge, upon request, (i) by calling 800-598-2019 or (ii) by visiting the SEC’s website at www.sec.gov.
The Portfolio is required to file with the SEC its proxy voting record for the 12-month period ending June 30 on Form N-PX. The Portfolio’s most recent Form N-PX or proxy voting record is available free of charge upon request (i) by calling 800-598-2019 or; (ii) by visiting the SEC’s website at www.sec.gov.
Shareholder Reports and Quarterly Portfolio Disclosure
The Portfolio is required to file its complete schedule of portfolio holdings with the SEC for its first and third fiscal quarters on Form N-Q. The Portfolio’s Form N-Q is available without charge on the SEC’s website at www.sec.gov or by calling MainStay Investments at 800-598-2019. You also can obtain and review copies of Form N-Q by visiting the SEC’s Public Reference Room in Washington, DC (information on the operation of the Public Reference Room may be obtained by calling 1-800-SEC-0330).
This page intentionally left blank
MainStay VP Portfolios
MainStay VP offers a wide range of Portfolios. The full array of MainStay VP offerings is listed here, with information about the manager, subadvisors, legal counsel, and independent registered public accounting firm.
Equity Portfolios
MainStay VP Common Stock Portfolio
MainStay VP Cornerstone Growth Portfolio
MainStay VP Eagle Small Cap Growth Portfolio
MainStay VP Emerging Markets Equity Portfolio
MainStay VP Epoch U.S. Equity Yield Portfolio
MainStay VP Epoch U.S. Small Cap Portfolio
MainStay VP International Equity Portfolio
MainStay VP Large Cap Growth Portfolio
MainStay VP MFS® Utilities Portfolio
MainStay VP Mid Cap Core Portfolio
MainStay VP S&P 500 Index Portfolio
MainStay VP Small Cap Core Portfolio
MainStay VP T. Rowe Price Equity Income Portfolio
MainStay VP VanEck Global Hard Assets Portfolio
Mixed Asset Portfolios
MainStay VP Balanced Portfolio
MainStay VP Convertible Portfolio
MainStay VP Cushing Renaissance Advantage Portfolio
MainStay VP Income Builder Portfolio
MainStay VP Janus Henderson Balanced Portfolio
Income Portfolios
MainStay VP Bond Portfolio
MainStay VP Floating Rate Portfolio
MainStay VP Government Portfolio
MainStay VP High Yield Corporate Bond Portfolio
MainStay VP Indexed Bond Portfolio
MainStay VP PIMCO Real Return Portfolio
MainStay VP Unconstrained Bond Portfolio
Money Market
MainStay VP U.S. Government Money Market Portfolio
Alternative
MainStay VP Absolute Return Multi-Strategy Portfolio
Asset Allocation Portfolios
MainStay VP Conservative Allocation Portfolio
MainStay VP Growth Allocation Portfolio
MainStay VP Moderate Allocation Portfolio
MainStay VP Moderate Growth Allocation Portfolio
Manager
New York Life Investment Management LLC
New York, New York
Subadvisors
Candriam Belgium*
Brussels, Belgium
Candriam France S.A.S.*
Paris, France
Cornerstone Capital Management Holdings LLC*
New York, New York
Cushing Asset Management, LP
Dallas, Texas
Eagle Asset Management, Inc.
St Petersburg, Florida
Epoch Investment Partners, Inc.
New York, New York
Janus Capital Management LLC
Denver, Colorado
MacKay Shields LLC*
New York, New York
Massachusetts Financial Services Company
Boston, Massachusetts
NYL Investors LLC*
New York, New York
Pacific Investment Management Company LLC
Newport Beach, California
T. Rowe Price Associates, Inc.
Baltimore, Maryland
Van Eck Associates Corporation
New York, New York
Winslow Capital Management, LLC
Minneapolis, Minnesota
Distributor
NYLIFE Distributors LLC*
Jersey City, New Jersey
Custodian
State Street Bank and Trust Company
Boston, Massachusetts
Independent Registered Public Accounting Firm
PricewaterhouseCoopers LLP
New York, New York
Legal Counsel
Dechert LLP
Washington, District of Columbia
Some Portfolios may not be available in all products.
* An affiliate of New York Life Investment Management LLC
Not part of the Semiannual Report
2017 Semiannual Report
This report is for the general information of New York Life Variable Annuities and NYLIAC Variable Universal Life Insurance Products policyowners. It must be preceded or accompanied by the appropriate product(s) and funds prospectuses if it is given to anyone who is not an owner of a New York Life variable annuity policy or a NYLIAC Variable Universal Life Insurance Product. This report does not offer for sale or solicit orders to purchase securities.
The performance data quoted in this report represents past performance. Past performance is no guarantee of future results. Due to market volatility and other factors, current performance may be lower or higher than the figures shown. The most recent month-end performance summary for your variable annuity or variable life policy is available by calling 800-598-2019 and is updated periodically on www.newyorklife.com.
The New York Life Variable Annuities and NYLIAC Variable Universal Life Insurance Products are issued by New York Life Insurance and Annuity Corporation (a Delaware Corporation) and distributed by NYLIFE Distributors LLC (Member FINRA/SIPC).
New York Life Insurance Company
New York Life Insurance and Annuity Corporation (NYLIAC) (A Delaware Corporation)
51 Madison Avenue, Room 551
New York, NY 10010
www.newyorklife.com
Printed on recycled paper
mainstayinvestments.com
NYLIFE Distributors LLC, 30 Hudson Street, Jersey City, NJ 07302
New York Life Investment Management LLC is the investment manager to the MainStay VP Funds Trust
©2017 by NYLIFE Distributors LLC. All rights reserved.
You may obtain copies of the Prospectus and the Statement of Additional Information free of charge, upon request, by calling toll-free 800-598-2019 or writing to New York Life Insurance and Annuity Corporation, 51 Madison Avenue, New York, NY 10010.
| | | | |
| Not FDIC Insured | | No Bank Guarantee | | May Lose Value |
| | | | |
1743160 | | | | MSVPVEG10-08/17 (NYLIAC) NI533 |
MainStay VP Janus Henderson Balanced Portfolio
(Formerly known as MainStay VP Janus Balanced Portfolio)
Message from the President and Semiannual Report
Unaudited | June 30, 2017

Sign up for electronic delivery of your shareholder reports. For full details on electronic delivery, including who can participate and what you
can receive via eDelivery, please log on to www.newyorklife.com/vsc

This page intentionally left blank
Message from the President
The six months ended June 30, 2017, brought positive results to many stock and bond investors. The year began with many investors hoping that Republican control of the White House, the Senate and the House of Representatives could bring an end to political gridlock; and while debate has continued on a number of issues, the U.S. stock market climbed relatively steadily throughout the first half of 2017.
According to FTSE-Russell U.S. market data, stocks at all capitalization levels tended to record positive total returns during the reporting period, with large-cap stocks generally outperforming stocks of smaller-capitalization companies. Growth stocks outpaced value stocks at every capitalization level by substantial margins—from more than six percentage points for micro-caps and mid-caps to more than 10 percentage points for the largest 200 U.S. companies by market capitalization.
Most sectors of the stock market advanced during the reporting period, with energy and telecommunication services being notable exceptions. Energy stocks declined as oil prices fell despite moves by the Organization of Petroleum Exporting Countries (OPEC) intended to limit oil production by its members. Telecommunication services stocks tended to decline as competition increased and rising interest rates made dividend payouts less appealing.
In March and June of 2017, the Federal Reserve announced successive increases in the target range for the federal funds rate, ultimately bringing the federal funds target range to 1.00% to 1.25%. While short-term U.S. Treasury yields rose in response, yields for U.S. Treasury securities with maturities of five years or longer declined. As the difference between short- and long-term yields narrowed, the advantages of higher-yielding long-term bonds became increasingly apparent.
Virtually all taxable and tax-exempt bond sectors provided positive total returns during the reporting period. Mortgage-backed
securities, though providing positive total returns, faced headwinds when the Federal Reserve announced plans to begin normalizing its balance sheet by reducing reinvestment of principal payments on mortgage-backed securities.
International stock and bond markets were also strong during the reporting period. International stocks provided double-digit total returns that were surpassed by emerging-market stocks as a whole. Global investment-grade bonds provided single-digit returns; and emerging-market debt was somewhat stronger.
Even during periods of favorable market performance and generally positive returns, MainStay believes that it is important to carefully monitor your investments. Your risk tolerance may
change over time, leading you to reevaluate which MainStay VP Portfolios are most appropriate for your long-term goals. Your goals themselves may also change, leading you to pursue investments with more or less risk. The portfolio managers of MainStay VP Portfolios seek to provide results consistent with the investment objectives of their respective Portfolios, to give you a wide range of choices suitable to various investment needs.
The report that follows provides more detailed information about the specific markets, securities and investment decisions that influenced your MainStay VP Portfolio during the six months ended June 30, 2017. We invite you to review the report carefully as part of your ongoing investment evaluation and review.
Sincerely,

Stephen P. Fisher
President
The opinions expressed are as of the date of the accompanying report and are subject to change. Past performance is no guarantee of future results. There is no guarantee that any forecasts made will come to pass. This material does not constitute investment advice and is not intended as an endorsement of any specific investment.
Not all MainStay VP Portfolios and/or share classes are available under all policies.
Not part of the Semiannual Report
Table of Contents
Investors should refer to the Portfolio’s Summary Prospectus and/or Prospectus and consider the Portfolio’s investment objectives, strategies, risks, charges and expenses carefully before investing. The Summary Prospectus and/or Prospectus contain this and other information about the Portfolio. You may obtain copies of the Portfolio’s Summary Prospectus and/or the Prospectus and the Statement of Additional Information free of charge, upon request, by calling toll-free 800-598-2019, by writing to New York Life Insurance and Annuity Corporation, 51 Madison Avenue, Room 251, New York, New York 10010 or by sending an email to MainStayShareholdersServices@nylim.com. These documents are also available at mainstayinvestments.com/vpdocuments. Please read the Summary Prospectus and/or Prospectus carefully before investing. MainStay VP Funds Trust portfolios are separate account options which are purchased through a variable insurance contract.
Investment and Performance Comparison1 (Unaudited)
Performance data quoted represents past performance. Past performance is no guarantee of future results. Because of market volatility and other factors. current performance may be lower or higher than the figures shown. Investment return and principal value will fluctuate, and as a result, when shares are redeemed, they may be worth more or less than their original cost. The performance table and graph do not reflect any deduction of sales charges, mortality and expense charges, contract charges or administrative charges. Please refer to the Performance Summary appropriate for your policy. For performance information current to the most recent month-end, please call 800-598-2019 or visit www.newyorklife.com.
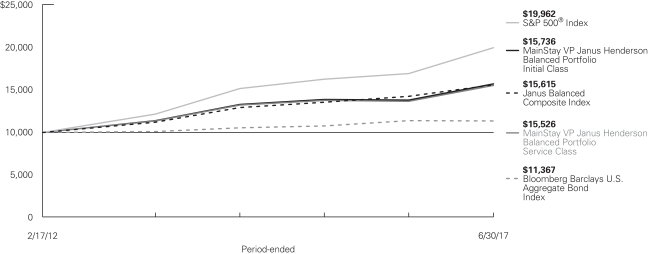
Average Annual Total Returns for the Period Ended June 30, 2017
| | | | | | | | | | | | | | | | | | | | | | |
| Class | | Inception Date | | Six Months | | | One Year | | | Five Years | | | Ten Years
or Since
Inception | | | Gross
Expense
Ratio2 | |
| Initial Class Shares | | 2/17/2012 | | | 8.33 | % | | | 13.84 | % | | | 9.65 | % | | | 8.81 | % | | | 0.59 | % |
| Service Class Shares | | 2/17/2012 | | | 8.20 | | | | 13.55 | | | | 9.38 | | | | 8.54 | | | | 0.84 | |
| | | | | | | | | | | | | | | | |
| Benchmark Performance | | Six
Months | | | One
Year | | | Five
Years | | | Ten Years
or Since
Inception | |
S&P 500® Index3 | | | 9.34 | % | | | 17.90 | % | | | 14.63 | % | | | 13.75 | % |
Bloomberg Barclays U.S. Aggregate Bond Index4 | | | 2.27 | | | | –0.31 | | | | 2.21 | | | | 2.42 | |
Janus Balanced Composite Index5 | | | 6.12 | | | | 9.41 | | | | 9.01 | | | | 8.65 | |
Average Lipper Variable Products Mixed-Asset Target Allocation Moderate Portfolio6 | | | 6.59 | | | | 9.96 | | | | 7.50 | | | | 7.15 | |
| 1. | Performance figures reflect certain fee waivers and/or expense limitations, without which total returns may have been different. For information on current fee waivers and/or expense limitations (if any), please refer to the Notes to Financial Statements. |
| 2. | The gross expense ratios presented reflect the Portfolio’s “Total Annual Portfolio Operating Expenses” from the most recent Prospectus and may differ from other expense ratios disclosed in this report. |
| 3. | The S&P 500® Index is the Portfolio’s primary broad-based securities market index for comparison purposes. “S&P 500®” Index is a trademark of The McGraw-Hill Companies, Inc. The S&P 500® Index is widely regarded as the standard index for measuring large-cap U.S. stock market performance. Results assume reinvestment of all dividends and capital gains. An investment cannot be made directly in an index. |
| 4. | The Portfolio has selected the Bloomberg Barclays U.S. Aggregate Bond Index as a secondary benchmark. The Bloomberg Barclays U.S. Aggregate Bond Index is a broad-based benchmark that measures performance of the investment-grade, U.S. dollar-denominated, fixed-rate taxable bond market, including Treasurys, government-related and corporate securities, mortgage- |
| | backed securities (agency fixed-rate and hybrid adjustable-rate mortgage pass-throughs), asset-backed securities and commercial mortgage-backed securities. Results assume reinvestment of all dividends and capital gains. An investment cannot be made directly in an index. |
| 5. | The Portfolio has selected the Janus Balanced Composite Index as an additional benchmark. The Janus Balanced Composite Index consists of the S&P 500® Index (55% weighted) and the Bloomberg Barclays U.S. Aggregate Bond Index (45% weighted). Results assume reinvestment of all dividends and capital gains. An investment cannot be made directly in an index. |
| 6. | The Average Lipper Variable Products Mixed-Asset Target Allocation Moderate Portfolio is representative of portfolios that, by portfolio practice, maintain a mix of between 40%-60% equity securities, with the remainder invested in bonds, cash, and cash equivalents. This benchmark is a product of Lipper Inc. Lipper Inc. is an independent monitor of fund performance. Results are based on average total returns of similar portfolios with all dividend and capital gain distributions reinvested. |
Cost in Dollars of a $1,000 Investment in MainStay VP Janus Henderson Balanced Portfolio (Unaudited)
The example below is intended to describe the fees and expenses borne by shareholders during the six-month period from January 1, 2017 to June 30, 2017, and the impact of those costs on your investment.
Example
As a shareholder of the Portfolio, you incur two types of costs: (1) transaction costs, including exchange fees and sales charges (loads) on purchases (as applicable), and (2) ongoing costs, including management fees, distribution and/or service (12b-1) fees, and other Portfolio expenses (as applicable). This example is intended to help you understand your ongoing costs (in dollars) of investing in the Portfolio and to compare these costs with the ongoing costs of investing in other mutual funds. The example is based on an investment of $1,000 made at the beginning of the six-month period and held for the entire period from January 1, 2017 to June 30, 2017. Shares are only sold in connection with variable life and annuity contracts and the example does not reflect any contract level or transactional fees or expenses. If these costs had been included, your costs would have been higher.
This example illustrates your Portfolio’s ongoing costs in two ways:
Actual Expenses
The second and third data columns in the table below provide information about actual account values and actual expenses. You may use the information in these columns, together with the amount you invested, to estimate the expenses that you paid during the six months ended June 30, 2017. Simply divide your account value by $1,000
(for example, an $8,600 account value divided by $1,000 = 8.6), then multiply the result by the number under the heading entitled “Expenses Paid During Period” to estimate the expenses you paid on your account during this period.
Hypothetical Example for Comparison Purposes
The fourth and fifth data columns in the table below provide information about hypothetical account values and hypothetical expenses based on the Portfolio’s actual expense ratio and an assumed rate of return of 5% per year before expenses, which is not the Portfolio’s actual return. The hypothetical account values and expenses may not be used to estimate the actual ending account balances or expenses you paid for the six-month period shown. You may use this information to compare the ongoing costs of investing in the Portfolio with the ongoing costs of investing in other mutual funds. To do so, compare this 5% hypothetical example with the 5% hypothetical examples that appear in the shareholder reports of the other mutual funds.
Please note that the expenses shown in the table are meant to highlight your ongoing costs only and do not reflect any transactional costs, such as exchange fees or sales charges (loads). Therefore, the fourth and fifth data columns of the table are useful in comparing ongoing costs only and will not help you determine the relative total costs of owning different funds. In addition, if these transactional costs were included, your costs would have been higher.
| | | | | | | | | | | | | | | | | | | | | | | | |
| | | | | | | | | | | | | | | | | | | |
| Share Class | | Beginning Account Value 1/1/17 | | | Ending Account Value (Based on Actual Returns and Expenses) 6/30/17 | | | Expenses Paid During Period1 | | | Ending Account Value (Based on Hypothetical 5% Annualized Return and Actual Expenses) 6/30/17 | | | Expenses Paid During Period1 | | | Net Expense Ratio During Period2 | |
| | | | | | |
| Initial Class Shares | | $ | 1,000.00 | | | $ | 1,083.30 | | | $ | 3.00 | | | $ | 1,021.90 | | | $ | 2.91 | | | | 0.58 | % |
| | | | | | |
| Service Class Shares | | $ | 1,000.00 | | | $ | 1,082.00 | | | $ | 4.28 | | | $ | 1,020.70 | | | $ | 4.16 | | | | 0.83 | % |
| 1. | Expenses are equal to the Portfolio’s annualized expense ratio of each class multiplied by the average account value over the period, divided by 365 and multiplied by 181 (to reflect the six-month period). The table above represents the actual expenses incurred during the six-month period. |
| 2. | Expenses are equal to the Portfolio’s annualized expense ratio to reflect the six-month period. |
| | |
| 6 | | MainStay VP Janus Henderson Balanced Portfolio |
Portfolio Composition as of June 30, 2017 (Unaudited)
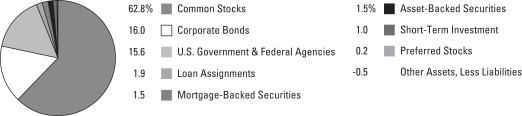
See Portfolio of Investments beginning on page 13 for specific holdings within these categories.
Top Ten Holdings or Issuers Held as of June 30, 2017 (excluding short-term investment) (Unaudited)
| 1. | Federal National Mortgage Association (Mortgage Pass-Through Securities), 3.50%–7.00%, due 4/1/34–5/1/56 |
| 2. | United States Treasury Notes, 1.25%–2.375%, due 5/31/19–5/15/27 |
| 5. | Mastercard, Inc. Class A |
| 8. | United States Treasury Bonds, 2.25%–3.00%, due 8/15/46–2/15/47 |
Portfolio Management Discussion and Analysis (Unaudited)
Answers to the questions reflect the views of portfolio managers Jeremiah Buckley, CFA, E. Marc Pinto, CFA, Mayur Saigal and Darrell Watters of Janus Capital Management LLC (“Janus Capital”), the Portfolio’s Subadvisor.
How did MainStay VP Janus Henderson Balanced Portfolio perform relative to its benchmarks and peers for the six months ended June 30, 2017?
For the six months ended June 30, 2017, MainStay VP Janus Henderson Balanced Portfolio returned 8.33% for Initial Class shares and 8.20% for Service Class shares. Over the same period, both share classes underperformed the 9.34% return of the S&P 500® Index,1 which is the Portfolio’s primary benchmark, and outperformed the 2.27% return of the Bloomberg Barclays U.S. Aggregate Bond Index,1 which is a secondary benchmark of the Portfolio. For the six months ended June 30, 2017, both share classes outperformed the 6.12% return of the Janus Balanced Composite Index,1 which is an additional benchmark of the Portfolio, and the 6.59% return of the Average Lipper2 Variable Products Mixed-Asset Target Allocation Moderate Portfolio.
Were there any changes to the Portfolio during the reporting period?
Effective on or about June 5, 2017, the name of the Portfolio changed from MainStay VP Janus Balanced Portfolio to MainStay VP Janus Henderson Balanced Portfolio in connection with a change in the control of the Subadvisor’s parent company. For more information on this change, see the Supplement dated June 2, 2017, and the Information Statement dated June 5, 2017.
What factors affected the Portfolio’s relative performance during the reporting period?
The Portfolio’s underperformance relative to the S&P 500® Index during the reporting period was largely the result of the Portfolio’s composition as compared to the Index. The Portfolio’s primary benchmark consists entirely of large-cap U.S. stocks, while the Portfolio may invest in domestic and foreign debt and equity securities. During the reporting period, investment-grade fixed-income securities in the aggregate tended to underperform large-cap U.S. stocks by a substantial margin. During the reporting period, however, the Portfolio outperformed the Janus Balanced Composite Index, which better reflects the composition of the Portfolio.
The equity portion of the Portfolio outperformed its benchmark, the S&P 500® Index. At the sector level, stock selection in industrials drove outperformance relative to the Index in the equity portion of the Portfolio. Security selection in the consumer discretionary sector also helped relative performance
in the equity portion of the Portfolio. The equity portion of the Portfolio had a significantly underweight position relative to the Index in the poor-performing energy sector, which also proved beneficial. While the equity portion of the Portfolio has cautiously added energy holdings, we remained wary of the sector’s ability to secure dividend payouts, and we remained comfortable with an underweight equity position in the sector. Incremental returns on capital are too low, in our view, and we believe that many energy companies still need to improve their balance sheets. The equity portion of the Portfolio had a zero weighting in the telecommunication services sector, which has been negatively affected by increased price competition. This positioning further aided the relative performance of the equity portion of the Portfolio because the telecommunication services sector detracted from the returns of the Index during the reporting period. Stock selection in the financials, consumer staples and materials sectors detracted from relative performance in the equity portion of the Portfolio.
During the reporting period, the fixed-income portion of the Portfolio outperformed its benchmark, the Bloomberg Barclays U.S. Aggregate Bond Index. The outperformance was largely driven by the Portfolio’s positioning in U.S. Treasury securities, primarily because of yield-curve3 positioning. An overweight allocation relative to the Index in the long bond proved beneficial as the yield curve flattened. In the fixed-income portion of the Portfolio, positioning in corporate credit also contributed positively to relative performance. (Contributions take weightings and total returns into account.) An overweight allocation to investment-grade credit benefited results in the fixed-income portion of the Portfolio as spreads tightened, and our security selection was particularly strong. Our emphasis on owning fixed-income securities in the lowest tier of investment-grade ratings also aided the relative performance of the fixed-income portion of the Portfolio, as these “riskier” assets performed well during the reporting period. For similar reasons, an out-of-index allocation to high-yield bonds contributed positively to performance in the fixed-income portion of the Portfolio. Our continued focus on securities that provided greater spread carry4 than the Bloomberg Barclays U.S. Aggregate Bond Index further supported results.
| 1. | See footnote on page 5 for more information on this index. |
| 2. | See footnote on page 5 for more information on Lipper Inc. |
| 3. | The yield curve is a line that plots the yields of various securities of similar quality—typically U.S. Treasury issues—across a range of maturities. The U.S. Treasury yield curve serves as a benchmark for other debt and is used in economic forecasting. |
| 4. | The terms “spread” and “yield spread” may refer to the difference in yield between a security or type of security and comparable U.S. Treasury issues. The terms may also refer to the difference in yield between two specific securities or types of securities at a given time. Carry is a measure of excess income generated by the Portfolio’s holdings. |
| | |
| 8 | | MainStay VP Janus Henderson Balanced Portfolio |
Which sectors were the strongest contributors to the relative performance of the equity portion of the Portfolio, and which sectors were particularly weak?
Favorable stock selection made industrials the strongest-contributing sector relative to the S&P 500® Index in the equity portion of the Portfolio. The energy sector was the second-strongest-contributing sector relative to the Index, primarily because the equity portion of the Portfolio held an underweight position in the poor-performing sector. Even so, the energy sector generated negative total returns in the equity portion of the Portfolio. Strong stock selection in the consumer discretionary sector made it the next-strongest-contributing equity sector relative to the S&P 500® Index.
In the equity portion of the Portfolio, financials was the weakest-contributing sector relative to the S&P 500® Index, followed by consumer staples and materials. In each case, the weakness was due to stock selection.
During the reporting period, which individual stocks made the strongest positive contributions to the absolute performance of the equity portion of the Portfolio and which individual stocks detracted the most?
During the reporting period, aerospace & defense company Boeing was the strongest positive contributor to absolute performance in the equity portion of the Portfolio. Global air traffic has continued to grow, which has resulted in more wear and tear on jets and faster replacement of planes. These factors provided a favorable backdrop for the company’s commercial airline business. In addition, the debut of Boeing’s 737 MAX narrow-body aircraft was well received by investors. The defense sector, which accounts for roughly 30% to 40% of Boeing’s business, also boosted the stock during the reporting period. We liked Boeing’s ability to generate free cash flow, which management often returns to shareholders. We also appreciated the company’s recent dividend increase.
CSX Corp., a leading railroad company in North America, was the second-strongest positive contributor to absolute performance in the equity portion of the Portfolio. Positive sentiment surrounded the railroad company’s improving operational efficiency, and the company’s newly appointed CEO was well received by many investors. Overall rail volume remained generally positive, and we believed that industry fundamentals could provide a favorable backdrop for revenues. As CSX focused on improving its customer service and reliability, we also believed that the company could convince more shippers to use railway services rather than trucking services.
Software company Adobe Systems was also a positive contributor to absolute performance in the equity portion of the Portfolio. Our investment thesis was validated as the company’s shift from a licensed-software model to a recurring revenue, subscription-based model continued to accelerate, providing
greater predictability of earnings and cash flow. Additionally, Omniture, the company’s online marketing tool, had better-than-expected growth during the reporting period.
Private-label credit card issuer Synchrony Financial was the weakest contributor to absolute performance in the equity portion of the Portfolio. The stock declined amid general weakness in retail during the reporting period and heightened loss provisions. Given Synchrony’s strong recent growth, increased loss provisions were widely expected; but the reported increase exceeded expectations and hurt credibility among investors. We trimmed the Portfolio’s position in the stock during the reporting period, but we continued to believe that the company provided a valuable service to retailers. We also appreciated the meaningful return on equity to investors.
National grocery-store chain Kroger was another weak contributor that generated a negative return for the equity portion of the Portfolio. To offset competitive threats and new entrants in certain markets, Kroger had aggressively lowered prices. This change, combined with a larger-than-expected LIFO charge as food prices began to rise during the reporting period, ultimately lowered the company’s earnings guidance. Late in the reporting period, Amazon.com’s announced acquisition of Whole Foods hurt stock prices for other supermarkets across the board. We believed that the capital investments Kroger is making in new and existing stores, as well as in its supply chain, could eventually lead to higher free cash flow per share. We are, however, concerned about the increased competition from a number of players and are closely monitoring the stock.
Toy manufacturer Mattel was also a weak contributor that generated a negative return for the equity portion of the Portfolio. Early in the year, the toy company named former Google executive Margaret Georgiadis as the new CEO. The stock suffered from a series of decisions made by new management, including reducing the dividend, increasing investment in technology and lowering revenue guidance for 2017. While these decisions hurt the stock price in the short term, we believed that management was taking the right steps to improve the business over the long term. We also liked Mattel’s brand lineup, which we believe leaves the company well- positioned in a healthy industry.
Did the equity portion of the Portfolio make any significant purchases or sales during the reporting period?
The equity portion of the Portfolio purchased a position in Lam Research Corporation, a designer, manufacturer and servicer of semiconductor processing equipment. The company has benefited from the widespread adoption of computing devices as everyday objects. We believed that the market for semiconductors could remain strong and that the equipment supplied by the company could remain in high demand.
The equity portion of the Portfolio also purchased a position in insurance company Progressive, which has been able to provide better rates than competing insurers, primarily because competitors have recently incurred higher loss rates that are passed along to consumers. Progressive has also successfully bundled their flagship automotive insurance policies with other insurance services, such as home and marine. We believed that their bundling strategy could add to profits over time.
The equity portion of the Portfolio sold discount-store operator Dollar Tree. While our price target was met following the company’s acquisition of Family Dollar, our primary reason for closing the position was to reduce exposure to general merchandise retailers in the equity portion of the Portfolio. We remained concerned with the general deterioration of the U.S. retail sector. We were also concerned with the Trump administration’s proposed border adjustment tax that could negatively affect retailers, particularly the lower-cost goods that Dollar Tree sells.
The equity portion of the Portfolio sold media and entertainment company Time Warner, as our investment thesis was disrupted after AT&T announced plans to acquire the company. The deal has been in review by the Department of Justice, and the Portfolio exited the position after achieving considerable price appreciation on news of the acquisition.
How did sector weightings change in the equity portion of the Portfolio during the reporting period?
During the reporting period, the equity portion of the Portfolio decreased its exposure to the financials and consumer discretionary sectors. Over the same period, the equity portion of the Portfolio increased its exposure to information technology and energy.
How was the equity portion of the Portfolio positioned at the end of the reporting period?
As of June 30, 2017, the equity portion of the Portfolio held overweight positions relative to the S&P 500® Index in the consumer discretionary and industrials sectors. As of the same date, the equity portion of the Portfolio held an underweight position in energy and had no exposure to utilities or telecommunication services.
What was the duration5 strategy of the fixed-income portion of the Portfolio during the reporting period?
The fixed-income portion of the Portfolio added duration during the reporting period, but we maintained a cautious stance on interest rates. The duration of corporate credit was shorter than that of the Bloomberg Barclays U.S. Aggregate Bond Index; however, the fixed-income portion of the Portfolio held an
overweight allocation to corporate credit, which led to a higher duration contribution. U.S. Treasury duration in the fixed-income portion of the Portfolio was also longer than that of the Index. The duration contribution from U.S. Treasury securities, however, was underweight in relation to the benchmark because the fixed-income portion of the Portfolio held an underweight allocation to the asset class. As of June 30, 2017, the duration of the fixed-income portion of the Portfolio was 5.97 years, or 101% of the duration of the Index.
Overall, yield-curve positioning had a negative impact on the performance of the fixed-income portion of the Portfolio relative to the Bloomberg Barclays U.S. Aggregate Bond Index. Our focus on shorter- and intermediate-dated corporate credit and our bank loan exposure weighed on results. Many longer-dated benchmark constituents—which benefited as long-term rates declined—outperformed the shorter-dated holdings in the fixed-income portion of the Portfolio. In the fixed-income portion of the Portfolio, yield-curve positioning in U.S. Treasury securities partially offset these losses. An overweight allocation to longer-term bonds proved beneficial as the yield curve flattened during the reporting period.
What specific factors, risks or market forces prompted significant decisions for the fixed-income portion of the Portfolio during the reporting period?
While we added duration to the fixed-income portion of the Portfolio during the reporting period, exposure to U.S. Treasury securities remained relatively low, in the context of the Portfolio’s historical range. We believed that the pace of inflation would slow, which led us to close a position in Treasury Inflation-Protected Securities (TIPS) early in the reporting period. As the reporting period progressed, we grew increasingly mindful of the potential for an economic slowdown. We believed that the Federal Reserve’s eagerness to see interest rates rise above historical lows presented an opportunity for policy error—particularly amid flagging inflation data and uninspiring growth. In our view, the lack of inflation was concerning, and the odds of the reflation trade returning were greatly reduced. The U.S. rate market had begun to price in a slower-growth outlook, which would be less of a tailwind for risk markets. Even so, investors continued to express interest in equities and corporate credit. We found this disconnect concerning, along with the general complacency prevalent across markets, because any shift in sentiment would likely come with increased volatility.
At the same time, we were wary of how far the credit cycle had advanced and how far spreads had tightened. We continued to seek opportunities in corporate credit; however, we reduced the Portfolio’s exposure to sectors that we believed were exhibiting poor fundamentals, particularly those that we felt would be likely
| 5. | Duration is a measure of the price sensitivity of a fixed-income investment to changes in interest rates. Duration is expressed as a number of years and is considered a more accurate sensitivity gauge than average maturity. |
| | |
| 10 | | MainStay VP Janus Henderson Balanced Portfolio |
to engage in mergers and acquisitions. We increased the Portfolio’s emphasis on non-cyclical companies that we believed had the ability to generate sustainable free cash flow even in an economic downturn. The fixed-income portion of the Portfolio also added to its positions in certain higher-rated investment-grade issuers during the reporting period. Specifically within the financials sector, we rotated out of subordinated debt and into the senior portion of the capital structure. As the premium for owning subordinated debt within financials diminished, we continued to believe that many of the best risk-adjusted opportunities resided higher in the capital structure. We also trimmed some of the Portfolio’s bank hybrid and preferred holdings on realized valuation.
During the reporting period, which market segments made the strongest positive contributions to the relative performance of the fixed-income portion of the Portfolio and which market segments were particularly weak?
The fixed-income portion of the Portfolio outperformed its benchmark, the Bloomberg Barclays U.S. Aggregate Bond Index. Outperformance was largely driven by the Portfolio’s positioning in U.S. Treasury securities, mainly because of yield-curve positioning. An overweight allocation relative to the Index in longer-term bonds proved beneficial as the yield curve flattened. Positioning in corporate credit also contributed positively to the relative performance of the fixed-income portion of the Portfolio. A relative overweight allocation to investment-grade credit benefited performance as spreads tightened, and our security selection was particularly strong. The fixed-income portion of the Portfolio emphasized owning securities in the lowest tier of investment-grade ratings, which also aided relative performance, as “riskier” investment-grade assets performed well during the reporting period. For similar reasons, an out-of-index allocation to high-yield bonds contributed positively to the relative performance of the fixed-income portion of the Portfolio. With long-term rates rallying, however, limited exposure to long-duration corporate bonds partially offset these gains. A continued focus on securities that provide greater spread carry than the Portfolio’s fixed-income benchmark further supported results.
Despite generating positive returns, an out-of-index position in bank loans (an asset class with no rate duration) detracted from the relative performance of the fixed-income portion of the Portfolio. Many benchmark constituents, which benefited from price appreciation as long-term rates declined, performed better. Government-related debt, which includes government agency debt as well as debt issued by state-owned entities, also detracted. This was due to a significantly underweight allocation to the asset class in the fixed-income portion of the Portfolio. The fixed-income portion of the Portfolio did not own securities of certain Mexico-domiciled issuers that performed well during the reporting period and that were a part of the Index.
On a credit sector basis, strong relative contributors to the performance of the fixed-income portion of the Portfolio included banking and brokerage, asset managers and exchanges. Financials generally benefited from the prospect of a more relaxed regulatory environment under the Trump administration and from rising interest rates, which help pad net interest income. The fixed-income portion of the Portfolio held overweight positions relative to the Index in both sectors, which proved beneficial. Within banking, security selection further aided the relative outperformance of the fixed-income portion of the Portfolio, largely because of preferred exposure and bank hybrids, which tend to behave much like high-yield corporate credit.
In the fixed-income portion of the Portfolio, security selection also helped in brokerage, asset managers and exchanges. Two financial related issuers, Neuberger Berman and Raymond James Financial, were among the top individual corporate credit contributors on a relative basis. Neuberger Berman benefited from solid first quarter earnings results and increased liquidity after the company issued a bond in the first quarter. Although we continued to like the company’s conservative management team and its commitment to reducing leverage, our target valuation was realized and we trimmed the Portfolio’s position. Regarding Raymond James, we liked the stability of the company’s business model and appreciated the management team’s conservative approach to balance sheet management. Standard & Poor’s upgraded the company’s credit rating during the reporting period, and the company is under review for an upgrade at Moody’s.
Relative sector detractors included electric utilities and media entertainment. Both sectors modestly detracted from the performance of the fixed-income portion of the Portfolio, largely because of the Portfolio’s yield-curve positioning. Although no single issuer detracted materially from relative performance, shorter-dated exposure in these sectors meant that the fixed-income portion of the Portfolio was unable to benefit from declining long-term rates.
Did the fixed-income portion of the Portfolio make any significant purchases or sales during the reporting period?
The fixed-income portion of the Portfolio purchased a position in multinational consumer goods company and producer of health, hygiene and home products Reckitt Benckiser. The company recently acquired infant formula manufacturer Mead Johnson Nutrition. We liked the company’s consumer product–oriented business line and that the acquisition was already complete. The fixed-income portion of the Portfolio participated in a new issue to refinance the bridge funding incurred in the acquisition.
The fixed-income portion of the Portfolio used a new issue of paint and coating supplier Sherwin-Williams to establish a
position in the company. While proceeds of the issue are slated to be used to finance the acquisition of Valspar, we appreciated management’s intent to aggressively pay down debt once the acquisition is complete.
In the fixed-income portion of the Portfolio, we closed the Portfolio’s position in food and beverage conglomerate Kraft Heinz. The sale reflected our concern over the lack of growth in large-brand, center-aisle food and beverage products. In our opinion, the sector’s fundamentals were generally unattractive, and we were concerned with the potential for increased merger and acquisition activity.
The fixed-income portion of the Portfolio closed its position in pharmaceutical company AbbVie as we sought to reallocate to stronger opportunities elsewhere in the pharmaceutical space. The sale reflected our concern over patent infringement disputes on the company’s popular rheumatoid arthritis drug Humira. AbbVie relies on the drug for nearly 70% of its earnings.
During the reporting period, how did industry weightings change in the fixed-income portion of the Portfolio?
At the credit industry level, the fixed-income portion of the Portfolio increased its allocation to health care and metals & mining during the reporting period. Over the same period, the fixed-income portion of the Portfolio decreased its exposure to
brokerage, asset managers, exchanges and independent energy.
How was the fixed-income portion of the Portfolio positioned at the end of the reporting period?
As of June 30, 2017, the fixed-income portion of the Portfolio held underweight positions relative to the Bloomberg Barclays U.S. Aggregate Bond Index in U.S. Treasurys and U.S. mortgage-backed securities. As of the same date, the fixed-income portion of the Portfolio had zero exposure to the government-related market segment. As of June 30, 2017, the fixed-income portion of the Portfolio held overweight positions relative to the Index in corporate credit and asset-backed securities. As of the same date, the fixed-income portion of the Portfolio maintained out-of-index positions in bank loans and high-yield bonds. At period-end, the fixed-income portion of the Portfolio also held out-of-index allocations in preferred securities (including bank hybrids) and cash.
On a credit industry basis, the fixed-income portion of the Portfolio held overweight positions relative to the Bloomberg Barclays U.S. Aggregate Bond Index in technology; health care; and brokerage, asset managers and exchanges as of June 30, 2017. As of the same date, the fixed-income portion of the Portfolio held underweight positions relative to the Index in integrated energy, pharmaceuticals and insurance companies.
The opinions expressed are those of the portfolio managers as of the date of this report and are subject to change. There is no guarantee that any forecasts made will come to pass. This material does not constitute investment advice and is not intended as an endorsement of any specific investment.
Not all MainStay VP Portfolios and/or share classes are available under all policies.
| | |
| 12 | | MainStay VP Janus Henderson Balanced Portfolio |
Portfolio of Investments June 30, 2017 (Unaudited)
| | | | | | | | |
| | | Principal
Amount | | | Value | |
Long-Term Bonds 36.5%† Asset-Backed Securities 1.5% | | | | | | | | |
Automobile ABS 0.3% | |
AmeriCredit Automobile Receivables Trust | | | | | | | | |
Series 2015-2, Class D
3.00%, due 6/8/21 | | $ | 467,000 | | | $ | 471,531 | |
Series 2016-1, Class D
3.59%, due 2/8/22 | | | 657,000 | | | | 670,888 | |
Series 2016-2, Class D
3.65%, due 5/9/22 | | | 445,000 | | | | 454,520 | |
OSCAR US Funding Trust V (a) | | | | | | | | |
Series 2016-2A, Class A3
2.73%, due 12/15/20 | | | 220,000 | | | | 220,154 | |
Series 2016-2A, Class A4
2.99%, due 12/15/23 | | | 190,000 | | | | 189,280 | |
Santander Drive Auto Receivables Trust | | | | | | | | |
Series 2015-1, Class D
3.24%, due 4/15/21 | | | 507,000 | | | | 513,989 | |
Series 2015-4, Class D
3.53%, due 8/16/21 | | | 815,000 | | | | 831,234 | |
| | | | | | | | |
| | | | | | | 3,351,596 | |
| | | | | | | | |
Other ABS 1.2% | | | | | | | | |
American Tower Trust I
Series-13, Class 1A
1.551%, due 3/15/43 (a) | | | 1,031,000 | | | | 1,028,902 | |
Applebee’s Funding LLC / IHOP Funding LLC
Series 2014-1, Class A2
4.277%, due 9/5/44 (a) | | | 3,092,000 | | | | 3,043,622 | |
CKE Restaurant Holdings, Inc.
Series 2013-1A, Class A2
4.474%, due 3/20/43 (a) | | | 1,440,961 | | | | 1,438,131 | |
Coinstar Funding LLC
Series 2017-1A, Class A2
5.216%, due 4/25/47 (a) | | | 844,000 | | | | 857,560 | |
Domino’s Pizza Master Issuer LLC (a) | | | | | | | | |
Series 2017-1A, Class A2II
3.082%, due 7/25/47 | | | 170,000 | | | | 169,176 | |
Series 2015-1A, Class A2I
3.484%, due 10/25/45 | | | 1,212,650 | | | | 1,224,692 | |
Series 2017-1A, Class A23
4.118%, due 7/25/47 | | | 859,000 | | | | 858,463 | |
Series 2012-1A, Class A2
5.216%, due 1/25/42 | | | 468,129 | | | | 468,354 | |
Jimmy Johns Funding LLC
Series 2017-1A, Class A2II
4.846%, due 7/30/47 (a) | | | 644,000 | | | | 644,000 | |
| | | | | | | | |
| | | Principal
Amount | | | Value | |
Other ABS (continued) | | | | | | | | |
Taco Bell Funding LLC
Series 2016-1A, Class A2I
3.832%, due 5/25/46 (a) | | $ | 867,445 | | | $ | 886,798 | |
Wendy’s Funding LLC
Series 2015-1A, Class A2I
3.371%, due 6/15/45 (a) | | | 1,454,100 | | | | 1,466,576 | |
| | | | | | | | |
| | | | | | | 12,086,274 | |
| | | | | | | | |
Total Asset-Backed Securities
(Cost $15,443,687) | | | | | | | 15,437,870 | |
| | | | | | | | |
| | |
| Corporate Bonds 16.0% | | | | | | | | |
Aerospace & Defense 0.1% | | | | | | | | |
Arconic, Inc.
5.125%, due 10/1/24 | | | 71,000 | | | | 73,662 | |
Rockwell Collins, Inc.
3.20%, due 3/15/24 | | | 429,000 | | | | 434,857 | |
3.50%, due 3/15/27 | | | 732,000 | | | | 742,275 | |
| | | | | | | | |
| | | | | | | 1,250,794 | |
| | | | | | | | |
Auto Manufacturers 0.4% | |
Ford Motor Co.
4.346%, due 12/8/26 | | | 965,000 | | | | 993,410 | |
General Motors Co.
4.875%, due 10/2/23 | | | 689,000 | | | | 738,383 | |
General Motors Financial Co., Inc.
3.95%, due 4/13/24 | | | 1,963,000 | | | | 1,990,879 | |
| | | | | | | | |
| | | | | | | 3,722,672 | |
| | | | | | | | |
Auto Parts & Equipment 0.0%‡ | |
ZF North America Capital, Inc.
4.50%, due 4/29/22 (a) | | | 190,000 | | | | 199,500 | |
| | | | | | | | |
|
Banks 2.4% | |
Bank of America Corp.
2.503%, due 10/21/22 | | | 2,001,000 | | | | 1,975,421 | |
4.183%, due 11/25/27 | | | 953,000 | | | | 969,282 | |
4.244%, due 4/24/38 (b) | | | 1,472,000 | | | | 1,530,664 | |
Citigroup, Inc. (b)
2.632%, due 9/1/23 | | | 968,000 | | | | 985,976 | |
3.887%, due 1/10/28 | | | 1,823,000 | | | | 1,852,649 | |
Citizens Bank N.A.
2.65%, due 5/26/22 | | | 397,000 | | | | 395,932 | |
Citizens Financial Group, Inc.
3.75%, due 7/1/24 | | | 278,000 | | | | 276,557 | |
4.30%, due 12/3/25 | | | 992,000 | | | | 1,034,264 | |
4.35%, due 8/1/25 | | | 190,000 | | | | 197,107 | |
| † | Percentages indicated are based on Portfolio net assets. |
| ¨ | | Among the Portfolio’s 10 largest holdings or issuers held, as of June 30, 2017, excluding short-term investment. May be subject to change daily. |
| | | | | | |
The notes to the financial statements are an integral part of,
and should be read in conjunction with, the financial statements. | | | | | 13 | |
Portfolio of Investments June 30, 2017 (Unaudited) (continued)
| | | | | | | | |
| | | Principal
Amount | | | Value | |
| Corporate Bonds (continued) | |
Banks (continued) | |
First Republic Bank
4.625%, due 2/13/47 | | $ | 394,000 | | | $ | 404,729 | |
Goldman Sachs Capital I
6.345%, due 2/15/34 | | | 1,547,000 | | | | 1,899,968 | |
Goldman Sachs Group, Inc.
3.00%, due 4/26/22 | | | 1,249,000 | | | | 1,258,596 | |
3.691%, due 6/5/28 (b) | | | 1,081,000 | | | | 1,085,292 | |
3.75%, due 2/25/26 | | | 929,000 | | | | 945,956 | |
JPMorgan Chase & Co.
2.295%, due 8/15/21 | | | 1,270,000 | | | | 1,262,611 | |
3.375%, due 5/1/23 | | | 1,319,000 | | | | 1,338,467 | |
3.782%, due 2/1/28 (b) | | | 1,463,000 | | | | 1,496,089 | |
3.875%, due 9/10/24 | | | 304,000 | | | | 313,650 | |
Morgan Stanley
2.625%, due 11/17/21 | | | 881,000 | | | | 879,701 | |
3.95%, due 4/23/27 | | | 681,000 | | | | 687,141 | |
Santander UK PLC
5.00%, due 11/7/23 (a) | | | 1,286,000 | | | | 1,378,615 | |
SVB Financial Group
5.375%, due 9/15/20 | | | 906,000 | | | | 986,053 | |
U.S. Bancorp
2.375%, due 7/22/26 | | | 1,072,000 | | | | 1,010,281 | |
UBS A.G.
Series Reg S
4.75%, due 5/22/23 (b) | | | 400,000 | | | | 407,887 | |
Wells Fargo & Co.
3.00%, due 4/22/26 | | | 305,000 | | | | 297,880 | |
5.875%, due 6/15/25 (b) | | | 620,000 | | | | 683,221 | |
| | | | | | | | |
| | | | | | | 25,553,989 | |
| | | | | | | | |
Beverages 0.7% | | | | | | | | |
Anheuser-Busch InBev Finance, Inc.
2.65%, due 2/1/21 | | | 236,000 | | | | 239,164 | |
3.30%, due 2/1/23 | | | 1,343,000 | | | | 1,382,929 | |
3.65%, due 2/1/26 | | | 2,050,000 | | | | 2,112,054 | |
Constellation Brands, Inc.
3.70%, due 12/6/26 | | | 712,000 | | | | 724,617 | |
4.25%, due 5/1/23 | | | 914,000 | | | | 973,040 | |
4.75%, due 12/1/25 | | | 100,000 | | | | 109,534 | |
Molson Coors Brewing Co.
3.00%, due 7/15/26 | | | 1,205,000 | | | | 1,159,023 | |
4.20%, due 7/15/46 | | | 284,000 | | | | 280,074 | |
| | | | | | | | |
| | | | | | | 6,980,435 | |
| | | | | | | | |
Building Materials 0.3% | | | | | | | | |
Eagle Materials, Inc.
4.50%, due 8/1/26 | | | 74,000 | | | | 75,665 | |
Martin Marietta Materials, Inc.
4.25%, due 7/2/24 | | | 467,000 | | | | 490,089 | |
| | | | | | | | |
| | | Principal
Amount | | | Value | |
Building Materials (continued) | | | | | | | | |
Masco Corp.
3.50%, due 4/1/21 | | $ | 435,000 | | | $ | 446,732 | |
4.375%, due 4/1/26 | | | 79,000 | | | | 84,269 | |
Owens Corning
3.40%, due 8/15/26 | | | 211,000 | | | | 207,857 | |
4.20%, due 12/1/24 | | | 450,000 | | | | 471,188 | |
Vulcan Materials Co.
4.50%, due 4/1/25 | | | 866,000 | | | | 924,795 | |
7.00%, due 6/15/18 | | | 410,000 | | | | 429,311 | |
7.50%, due 6/15/21 | | | 300,000 | | | | 354,050 | |
| | | | | | | | |
| | | | | | | 3,483,956 | |
| | | | | | | | |
Chemicals 0.2% | | | | | | | | |
CF Industries, Inc.
4.50%, due 12/1/26 (a) | | | 1,045,000 | | | | 1,074,422 | |
6.875%, due 5/1/18 | | | 118,000 | | | | 122,573 | |
Sherwin-Williams Co.
2.75%, due 6/1/22 | | | 287,000 | | | | 286,829 | |
3.125%, due 6/1/24 | | | 184,000 | | | | 184,932 | |
3.45%, due 6/1/27 | | | 518,000 | | | | 521,421 | |
4.50%, due 6/1/47 | | | 242,000 | | | | 253,574 | |
| | | | | | | | |
| | | | | | | 2,443,751 | |
| | | | | | | | |
Commercial Services 0.7% | | | | | | | | |
IHS Markit, Ltd. (a)
4.75%, due 2/15/25 | | | 384,000 | | | | 412,320 | |
5.00%, due 11/1/22 | | | 111,000 | | | | 119,810 | |
Total System Services, Inc.
3.80%, due 4/1/21 | | | 462,000 | | | | 481,113 | |
4.80%, due 4/1/26 | | | 1,288,000 | | | | 1,402,046 | |
UBM PLC
5.75%, due 11/3/20 (a) | | | 1,016,000 | | | | 1,069,570 | |
Verisk Analytics, Inc.
4.125%, due 9/12/22 | | | 557,000 | | | | 586,983 | |
4.875%, due 1/15/19 | | | 605,000 | | | | 629,985 | |
5.50%, due 6/15/45 | | | 621,000 | | | | 689,930 | |
5.80%, due 5/1/21 | | | 1,609,000 | | | | 1,788,976 | |
| | | | | | | | |
| | | | | | | 7,180,733 | |
| | | | | | | | |
Computers 0.1% | | | | | | | | |
Seagate HDD Cayman
4.75%, due 1/1/25 | | | 1,152,000 | | | | 1,160,891 | |
4.875%, due 6/1/27 | | | 120,000 | | | | 119,839 | |
5.75%, due 12/1/34 | | | 252,000 | | | | 252,102 | |
| | | | | | | | |
| | | | | | | 1,532,832 | |
| | | | | | | | |
Diversified Financial Services 1.3% | | | | | | | | |
Ally Financial, Inc.
8.00%, due 12/31/18 | | | 263,000 | | | | 283,711 | |
CBOE Holdings, Inc.
3.65%, due 1/12/27 | | | 725,000 | | | | 731,238 | |
| | | | |
| 14 | | MainStay VP Janus Henderson Balanced Portfolio | | The notes to the financial statements are an integral part of,
and should be read in conjunction with, the financial statements. |
| | | | | | | | |
| | | Principal
Amount | | | Value | |
| Corporate Bonds (continued) | |
Diversified Financial Services (continued) | | | | | |
Charles Schwab Corp.
3.00%, due 3/10/25 | | $ | 571,000 | | | $ | 571,054 | |
4.625%, due 3/1/22 (b) | | | 152,000 | | | | 155,230 | |
7.00%, due 2/1/22 (b) | | | 792,000 | | | | 912,780 | |
Discover Financial Services
3.75%, due 3/4/25 | | | 668,000 | | | | 660,031 | |
3.95%, due 11/6/24 | | | 777,000 | | | | 789,033 | |
E*TRADE Financial Corp.
4.625%, due 9/15/23 | | | 1,246,000 | | | | 1,295,840 | |
5.375%, due 11/15/22 | | | 983,000 | | | | 1,033,333 | |
5.875%, due 12/29/49 (b) | | | 153,000 | | | | 162,180 | |
Lazard Group LLC
4.25%, due 11/14/20 | | | 948,000 | | | | 1,000,151 | |
LeasePlan Corp. N.V.
2.50%, due 5/16/18 (a) | | | 1,785,000 | | | | 1,789,762 | |
Raymond James Financial, Inc.
3.625%, due 9/15/26 | | | 311,000 | | | | 311,283 | |
4.95%, due 7/15/46 | | | 921,000 | | | | 999,483 | |
5.625%, due 4/1/24 | | | 809,000 | | | | 920,539 | |
Scottrade Financial Services, Inc.
6.125%, due 7/11/21 (a) | | | 299,000 | | | | 339,532 | |
Synchrony Financial
3.00%, due 8/15/19 | | | 481,000 | | | | 487,781 | |
4.50%, due 7/23/25 | | | 796,000 | | | | 818,567 | |
TD Ameritrade Holding Corp.
2.95%, due 4/1/22 | | | 446,000 | | | | 456,390 | |
3.625%, due 4/1/25 | | | 500,000 | | | | 517,366 | |
| | | | | | | | |
| | | | | | | 14,235,284 | |
| | | | | | | | |
Electric 0.5% | |
Dominion Energy, Inc.
2.00%, due 8/15/21 | | | 107,000 | | | | 104,944 | |
2.85%, due 8/15/26 | | | 148,000 | | | | 141,078 | |
Duke Energy Corp.
1.80%, due 9/1/21 | | | 288,000 | | | | 281,139 | |
2.65%, due 9/1/26 | | | 450,000 | | | | 427,380 | |
PPL Capital Funding, Inc.
3.10%, due 5/15/26 | | | 1,087,000 | | | | 1,063,834 | |
PPL WEM, Ltd. / Western Power Distribution, Ltd.
5.375%, due 5/1/21 (a) | | | 796,000 | | | | 858,933 | |
Southern Co.
2.35%, due 7/1/21 | | | 1,143,000 | | | | 1,134,672 | |
2.95%, due 7/1/23 | | | 610,000 | | | | 606,090 | |
3.25%, due 7/1/26 | | | 1,144,000 | | | | 1,119,131 | |
| | | | | | | | |
| | | | | | | 5,737,201 | |
| | | | | | | | |
Electronics 0.2% | | | | | | | | |
Trimble, Inc
4.75%, due 12/1/24 | | | 1,821,000 | | | | 1,944,488 | |
| | | | | | | | |
| | | | | | | | |
| | | Principal
Amount | | | Value | |
Food 0.4% | | | | | | | | |
Danone S.A. (a)
2.077%, due 11/2/21 | | $ | 957,000 | | | $ | 944,115 | |
2.589%, due 11/2/23 | | | 580,000 | | | | 565,893 | |
Sysco Corp.
2.50%, due 7/15/21 | | | 190,000 | | | | 190,518 | |
3.25%, due 7/15/27 | | | 373,000 | | | | 367,254 | |
3.30%, due 7/15/26 | | | 476,000 | | | | 472,222 | |
WM Wrigley Jr Co. (a)
2.40%, due 10/21/18 | | | 1,411,000 | | | | 1,420,524 | |
3.375%, due 10/21/20 | | | 218,000 | | | | 225,025 | |
| | | | | | | | |
| | | | | | | 4,185,551 | |
| | | | | | | | |
Forest Products & Paper 0.2% | | | | | | | | |
Georgia-Pacific LLC (a)
3.163%, due 11/15/21 | | | 1,461,000 | | | | 1,491,987 | |
3.60%, due 3/1/25 | | | 741,000 | | | | 763,332 | |
| | | | | | | | |
| | | | | | | 2,255,319 | |
| | | | | | | | |
Health Care—Products 0.4% | |
Abbott Laboratories
3.75%, due 11/30/26 | | | 242,000 | | | | 247,036 | |
3.875%, due 9/15/25 | | | 149,000 | | | | 153,251 | |
Becton Dickinson & Co.
2.894%, due 6/6/22 | | | 507,000 | | | | 508,585 | |
3.363%, due 6/6/24 | | | 1,128,000 | | | | 1,130,578 | |
3.70%, due 6/6/27 | | | 800,000 | | | | 802,529 | |
4.669%, due 6/6/47 | | | 264,000 | | | | 274,448 | |
Life Technologies Corp.
6.00%, due 3/1/20 | | | 584,000 | | | | 636,470 | |
| | | | | | | | |
| | | | | | | 3,752,897 | |
| | | | | | | | |
Health Care—Services 0.6% | | | | | | | | |
Aetna, Inc.
2.80%, due 6/15/23 | | | 384,000 | | | | 383,334 | |
Centene Corp.
4.75%, due 5/15/22 | | | 59,000 | | | | 61,581 | |
4.75%, due 1/15/25 | | | 170,000 | | | | 174,675 | |
6.125%, due 2/15/24 | | | 141,000 | | | | 152,446 | |
Cigna Corp.
3.25%, due 4/15/25 | | | 1,956,000 | | | | 1,963,627 | |
HCA, Inc.
3.75%, due 3/15/19 | | | 460,000 | | | | 469,200 | |
5.00%, due 3/15/24 | | | 306,000 | | | | 323,978 | |
5.375%, due 2/1/25 | | | 268,000 | | | | 282,686 | |
5.875%, due 5/1/23 | | | 244,000 | | | | 265,655 | |
5.875%, due 2/15/26 | | | 545,000 | | | | 588,600 | |
Tenet Healthcare Corp.
4.625%, due 7/15/24 (a) | | | 289,000 | | | | 289,361 | |
THC Escrow Corp. III
4.625%, due 7/15/24 (a) | | | 363,000 | | | | 363,980 | |
Universal Health Services, Inc.
4.75%, due 8/1/22 (a) | | | 652,000 | | | | 674,005 | |
| | | | | | |
The notes to the financial statements are an integral part of,
and should be read in conjunction with, the financial statements. | | | | | 15 | |
Portfolio of Investments June 30, 2017 (Unaudited) (continued)
| | | | | | | | |
| | | Principal
Amount | | | Value | |
| Corporate Bonds (continued) | |
Health Care—Services (continued) | | | | | | | | |
WellCare Health Plans, Inc.
5.25%, due 4/1/25 | | $ | 648,000 | | | $ | 678,780 | |
| | | | | | | | |
| | | | | | | 6,671,908 | |
| | | | | | | | |
Home Builders 0.2% | |
D.R. Horton, Inc.
3.75%, due 3/1/19 | | | 633,000 | | | | 647,545 | |
MDC Holdings, Inc.
5.50%, due 1/15/24 | | | 708,000 | | | | 748,710 | |
Toll Brothers Finance Corp.
4.00%, due 12/31/18 | | | 301,000 | | | | 308,525 | |
4.375%, due 4/15/23 | | | 166,000 | | | | 171,727 | |
5.875%, due 2/15/22 | | | 252,000 | | | | 279,090 | |
| | | | | | | | |
| | | | | | | 2,155,597 | |
| | | | | | | | |
Housewares 0.2% | |
Newell Brands, Inc.
3.15%, due 4/1/21 | | | 248,000 | | | | 253,762 | |
3.85%, due 4/1/23 | | | 236,000 | | | | 247,786 | |
4.20%, due 4/1/26 | | | 1,390,000 | | | | 1,475,884 | |
| | | | | | | | |
| | | | | | | 1,977,432 | |
| | | | | | | | |
Insurance 0.0%‡ | | | | | | | | |
Berkshire Hathaway, Inc.
3.125%, due 3/15/26 | | | 142,000 | | | | 143,598 | |
| | | | | | | | |
|
Investment Management/Advisory Services 0.1% | |
Neuberger Berman Group LLC / Neuberger Berman Finance Corp.
4.875%, due 4/15/45 (a) | | | 858,000 | | | | 832,814 | |
| | | | | | | | |
|
Iron & Steel 0.1% | |
Reliance Steel & Aluminum Co.
4.50%, due 4/15/23 | | | 758,000 | | | | 800,690 | |
Steel Dynamics, Inc.
5.00%, due 12/15/26 | | | 90,000 | | | | 92,362 | |
| | | | | | | | |
| | | | | | | 893,052 | |
| | | | | | | | |
Lodging 0.0%‡ | | | | | | | | |
Wynn Las Vegas LLC / Wynn Las Vegas Capital Corp.
5.25%, due 5/15/27 (a) | | | 384,000 | | | | 393,360 | |
| | | | | | | | |
| | |
Machinery—Diversified 0.0%‡ | | | | | | | | |
CNH Industrial Capital LLC
3.625%, due 4/15/18 | | | 486,000 | | | | 490,277 | |
| | | | | | | | |
| | |
Media 0.5% | | | | | | | | |
CCO Holdings LLC / CCO Holdings Capital Corp.
5.125%, due 5/1/27 (a) | | | 1,715,000 | | | | 1,753,587 | |
| | | | | | | | |
| | | Principal
Amount | | | Value | |
Media (continued) | | | | | | | | |
Charter Communications Operating LLC / Charter Communications Operating Capital
4.908%, due 7/23/25 | | $ | 1,127,000 | | | $ | 1,217,519 | |
Comcast Corp.
2.35%, due 1/15/27 | | | 589,000 | | | | 552,823 | |
3.30%, due 2/1/27 | | | 433,000 | | | | 438,320 | |
3.40%, due 7/15/46 | | | 106,000 | | | | 96,524 | |
Cox Communications, Inc.
3.35%, due 9/15/26 (a) | | | 946,000 | | | | 928,921 | |
NBCUniversal Media LLC
4.45%, due 1/15/43 | | | 193,000 | | | | 204,901 | |
Time Warner, Inc.
3.60%, due 7/15/25 | | | 642,000 | | | | 640,541 | |
| | | | | | | | |
| | | | | | | 5,833,136 | |
| | | | | | | | |
Mining 0.3% | | | | | | | | |
Anglo American Capital PLC (a)
3.75%, due 4/10/22 | | | 200,000 | | | | 201,000 | |
4.75%, due 4/10/27 | | | 965,000 | | | | 991,344 | |
FMG Resources (August 2006) Pty, Ltd. (a)
4.75%, due 5/15/22 | | | 566,000 | | | | 568,123 | |
5.125%, due 5/15/24 | | | 188,000 | | | | 188,000 | |
Freeport-McMoRan, Inc.
3.10%, due 3/15/20 | | | 280,000 | | | | 274,050 | |
Teck Resources, Ltd.
8.50%, due 6/1/24 (a) | | | 687,000 | | | | 793,485 | |
| | | | | | | | |
| | | | | | | 3,016,002 | |
| | | | | | | | |
Miscellaneous—Manufacturing 0.1% | | | | | | | | |
General Electric Co.
5.00%, due 1/21/21 (b) | | | 898,000 | | | | 953,137 | |
| | | | | | | | |
| | |
Oil & Gas 0.4% | | | | | | | | |
Antero Resources Corp.
5.375%, due 11/1/21 | | | 971,000 | | | | 980,710 | |
Canadian Natural Resources, Ltd.
2.95%, due 1/15/23 | | | 340,000 | | | | 337,291 | |
5.90%, due 2/1/18 | | | 321,000 | | | | 328,375 | |
Cenovus Energy, Inc.
5.70%, due 10/15/19 | | | 19,000 | | | | 20,052 | |
ConocoPhillips Co.
4.95%, due 3/15/26 | | | 728,000 | | | | 810,787 | |
Diamond Offshore Drilling, Inc.
5.875%, due 5/1/19 | | | 145,000 | | | | 148,988 | |
Helmerich & Payne International Drilling Co.
4.65%, due 3/15/25 | | | 727,000 | | | | 762,359 | |
Motiva Enterprises LLC
5.75%, due 1/15/20 (a) | | | 688,000 | | | | 736,291 | |
| | | | |
| 16 | | MainStay VP Janus Henderson Balanced Portfolio | | The notes to the financial statements are an integral part of,
and should be read in conjunction with, the financial statements. |
| | | | | | | | |
| | | Principal
Amount | | | Value | |
| Corporate Bonds (continued) | |
Oil & Gas (continued) | | | | | | | | |
SM Energy Co.
6.50%, due 1/1/23 | | $ | 56,000 | | | $ | 53,340 | |
| | | | | | | | |
| | | | | | | 4,178,193 | |
| | | | | | | | |
Oil & Gas Services 0.1% | | | | | | | | |
Oceaneering International, Inc.
4.65%, due 11/15/24 | | | 945,000 | | | | 931,959 | |
| | | | | | | | |
| | |
Packaging & Containers 0.1% | | | | | | | | |
Ardagh Packaging Finance PLC / Ardagh Holdings USA, Inc.
4.25%, due 9/15/22 (a) | | | 200,000 | | | | 205,300 | |
Ball Corp.
4.375%, due 12/15/20 | | | 449,000 | | | | 471,450 | |
| | | | | | | | |
| | | | | | | 676,750 | |
| | | | | | | | |
Pharmaceuticals 0.9% | |
Actavis Funding SCS
3.00%, due 3/12/20 | | | 1,192,000 | | | | 1,217,293 | |
Cardinal Health, Inc.
2.616%, due 6/15/22 | | | 517,000 | | | | 517,478 | |
3.41%, due 6/15/27 | | | 665,000 | | | | 666,535 | |
3.079%, due 6/15/24 | | | 335,000 | | | | 335,808 | |
Express Scripts Holding Co.
3.40%, due 3/1/27 | | | 420,000 | | | | 405,353 | |
3.50%, due 6/15/24 | | | 367,000 | | | | 370,205 | |
4.50%, due 2/25/26 | | | 651,000 | | | | 689,935 | |
Reckitt Benckiser Treasury Services PLC (a)(c)
2.375%, due 6/24/22 | | | 643,000 | | | | 638,801 | |
2.75%, due 6/26/24 | | | 610,000 | | | | 604,824 | |
3.00%, due 6/26/27 | | | 953,000 | | | | 940,397 | |
Shire Acquisitions Investments Ireland DAC
2.40%, due 9/23/21 | | | 573,000 | | | | 566,318 | |
2.875%, due 9/23/23 | | | 762,000 | | | | 755,274 | |
3.20%, due 9/23/26 | | | 762,000 | | | | 745,125 | |
Teva Pharmaceutical Finance Netherlands III B.V.
3.15%, due 10/1/26 | | | 1,055,000 | | | | 1,001,910 | |
| | | | | | | | |
| | | | | | | 9,455,256 | |
| | | | | | | | |
Pipelines 1.0% | |
Columbia Pipeline Group, Inc.
4.50%, due 6/1/25 | | | 380,000 | | | | 404,505 | |
Enbridge Energy Partners, L.P.
5.875%, due 10/15/25 | | | 492,000 | | | | 561,263 | |
Energy Transfer Equity, L.P.
5.50%, due 6/1/27 | | | 906,000 | | | | 937,710 | |
5.875%, due 1/15/24 | | | 506,000 | | | | 536,360 | |
Energy Transfer Partners, L.P.
4.15%, due 10/1/20 | | | 435,000 | | | | 451,794 | |
4.75%, due 1/15/26 | | | 194,000 | | | | 201,822 | |
| | | | | | | | |
| | | Principal
Amount | | | Value | |
Pipelines (continued) | |
Kinder Morgan Energy Partners, L.P.
3.95%, due 9/1/22 | | $ | 420,000 | | | $ | 433,941 | |
5.00%, due 10/1/21 | | | 426,000 | | | | 457,529 | |
Kinder Morgan, Inc.
6.50%, due 9/15/20 | | | 55,000 | | | | 61,082 | |
Nustar Logistics, L.P.
5.625%, due 4/28/27 | | | 608,000 | | | | 638,400 | |
Phillips 66 Partners, L.P.
3.605%, due 2/15/25 | | | 473,000 | | | | 468,391 | |
Regency Energy Partners, L.P. / Regency Energy Finance Corp.
5.875%, due 3/1/22 | | | 550,000 | | | | 605,871 | |
Sabine Pass Liquefaction LLC
5.00%, due 3/15/27 | | | 867,000 | | | | 922,897 | |
TC Pipelines, L.P.
3.90%, due 5/25/27 | | | 704,000 | | | | 702,455 | |
Tesoro Logistics L.P. / Tesoro Logistics Finance Corp.
5.25%, due 1/15/25 | | | 256,000 | | | | 268,800 | |
Western Gas Partners, L.P.
5.375%, due 6/1/21 | | | 1,117,000 | | | | 1,199,133 | |
Williams Cos., Inc.
3.70%, due 1/15/23 | | | 263,000 | | | | 259,055 | |
Williams Partners, L.P.
3.75%, due 6/15/27 | | | 1,185,000 | | | | 1,172,941 | |
Williams Partners, L.P. / ACMP Finance Corp.
4.875%, due 5/15/23 | | | 755,000 | | | | 783,403 | |
4.875%, due 3/15/24 | | | 67,000 | | | | 70,211 | |
| | | | | | | | |
| | | | | | | 11,137,563 | |
| | | | | | | | |
Private Equity 0.0%‡ | |
Carlyle Holdings Finance LLC
3.875%, due 2/1/23 (a) | | | 392,000 | | | | 402,529 | |
| | | | | | | | |
|
Real Estate 0.3% | |
Jones Lang LaSalle, Inc.
4.40%, due 11/15/22 | | | 951,000 | | | | 1,001,375 | |
Kennedy-Wilson, Inc.
5.875%, due 4/1/24 | | | 1,442,000 | | | | 1,487,063 | |
Post Apartment Homes, L.P.
4.75%, due 10/15/17 | | | 653,000 | | | | 653,578 | |
| | | | | | | | |
| | | | | | | 3,142,016 | |
| | | | | | | | |
Real Estate Investment Trusts 0.9% | |
Alexandria Real Estate Equities, Inc.
2.75%, due 1/15/20 | | | 735,000 | | | | 740,046 | |
4.50%, due 7/30/29 | | | 677,000 | | | | 717,625 | |
4.60%, due 4/1/22 | | | 1,246,000 | | | | 1,331,502 | |
American Tower Corp.
3.30%, due 2/15/21 | | | 828,000 | | | | 849,631 | |
3.375%, due 10/15/26 | | | 1,024,000 | | | | 1,001,872 | |
| | | | | | |
The notes to the financial statements are an integral part of,
and should be read in conjunction with, the financial statements. | | | | | 17 | |
Portfolio of Investments June 30, 2017 (Unaudited) (continued)
| | | | | | | | |
| | | Principal
Amount | | | Value | |
| Corporate Bonds (continued) | |
Real Estate Investment Trusts (continued) | |
American Tower Corp. (continued) | | | | | | | | |
3.45%, due 9/15/21 | | $ | 76,000 | | | $ | 78,374 | |
3.50%, due 1/31/23 | | | 133,000 | | | | 136,403 | |
4.40%, due 2/15/26 | | | 450,000 | | | | 471,649 | |
Crown Castle International Corp.
5.25%, due 1/15/23 | | | 595,000 | | | | 660,949 | |
MGM Growth Properties Operating Partnership, L.P. / MGP Finance Co-Issuer, Inc.
5.625%, due 5/1/24 | | | 425,000 | | | | 463,250 | |
Senior Housing Properties Trust
6.75%, due 4/15/20 | | | 301,000 | | | | 326,419 | |
6.75%, due 12/15/21 | | | 331,000 | | | | 369,176 | |
SL Green Realty Corp.
5.00%, due 8/15/18 | | | 693,000 | | | | 711,252 | |
7.75%, due 3/15/20 | | | 1,335,000 | | | | 1,494,773 | |
| | | | | | | | |
| | | | | | | 9,352,921 | |
| | | | | | | | |
Retail 0.5% | |
1011778 B.C. ULC / New Red Finance, Inc. (a)
4.25%, due 5/15/24 | | | 941,000 | | | | 935,062 | |
4.625%, due 1/15/22 | | | 934,000 | | | | 957,350 | |
Coach, Inc.
3.00%, due 7/15/22 | | | 330,000 | | | | 325,369 | |
4.125%, due 7/15/27 | | | 330,000 | | | | 326,408 | |
CVS Health Corp.
2.80%, due 7/20/20 | | | 1,377,000 | | | | 1,401,921 | |
4.75%, due 12/1/22 | | | 363,000 | | | | 397,882 | |
5.00%, due 12/1/24 | | | 515,000 | | | | 570,464 | |
Walgreens Boots Alliance, Inc.
3.45%, due 6/1/26 | | | 597,000 | | | | 595,738 | |
4.65%, due 6/1/46 | | | 102,000 | | | | 106,762 | |
| | | | | | | | |
| | | | | | | 5,616,956 | |
| | | | | | | | |
Semiconductors 0.7% | |
Broadcom Corp. / Broadcom Cayman Finance, Ltd. (a)
3.625%, due 1/15/24 | | | 663,000 | | | | 678,248 | |
3.875%, due 1/15/27 | | | 1,703,000 | | | | 1,748,811 | |
NXP B.V. / NXP Funding LLC (a)
3.875%, due 9/1/22 | | | 938,000 | | | | 976,692 | |
4.125%, due 6/15/20 | | | 281,000 | | | | 295,140 | |
4.625%, due 6/1/23 | | | 621,000 | | | | 669,904 | |
TSMC Global, Ltd.
1.625%, due 4/3/18 (a) | | | 2,579,000 | | | | 2,573,797 | |
| | | | | | | | |
| | | | | | | 6,942,592 | |
| | | | | | | | |
Software 0.4% | |
Cadence Design Systems, Inc.
4.375%, due 10/15/24 | | | 1,686,000 | | | | 1,751,297 | |
Fidelity National Information Services, Inc.
3.00%, due 8/15/26 | | | 742,000 | | | | 718,490 | |
| | | | | | | | |
| | | Principal
Amount | | | Value | |
Software (continued) | | | | | | | | |
Fidelity National Information Services, Inc. (continued) | | | | | | | | |
3.625%, due 10/15/20 | | $ | 425,000 | | | $ | 445,206 | |
4.50%, due 10/15/22 | | | 549,000 | | | | 596,529 | |
First Data Corp.
7.00%, due 12/1/23 (a) | | | 781,000 | | | | 833,718 | |
| | | | | | | | |
| | | | | | | 4,345,240 | |
| | | | | | | | |
Telecommunications 0.4% | |
AT&T, Inc.
3.40%, due 5/15/25 | | | 149,000 | | | | 146,480 | |
4.25%, due 3/1/27 | | | 706,000 | | | | 729,971 | |
5.25%, due 3/1/37 | | | 962,000 | | | | 1,024,893 | |
Verizon Communications, Inc.
2.625%, due 8/15/26 | | | 1,733,000 | | | | 1,594,006 | |
2.946%, due 3/15/22 (a) | | | 297,000 | | | | 299,064 | |
4.125%, due 8/15/46 | | | 377,000 | | | | 335,529 | |
| | | | | | | | |
| | | | | | | 4,129,943 | |
| | | | | | | | |
Textiles 0.0%‡ | |
Cintas Corp. No. 2
4.30%, due 6/1/21 | | | 426,000 | | | | 453,927 | |
| | | | | | | | |
|
Transportation 0.0%‡ | |
FedEx Corp.
3.90%, due 2/1/35 | | | 89,000 | | | | 88,340 | |
4.40%, due 1/15/47 | | | 39,000 | | | | 40,113 | |
| | | | | | | | |
| | | | | | | 128,453 | |
| | | | | | | | |
Trucking & Leasing 0.3% | |
Park Aerospace Holdings, Ltd. (a)
5.25%, due 8/15/22 | | | 315,000 | | | | 329,276 | |
5.50%, due 2/15/24 | | | 803,000 | | | | 838,733 | |
Penske Truck Leasing Co., L.P. / PTL Finance Corp. (a)
2.50%, due 6/15/19 | | | 648,000 | | | | 651,296 | |
3.375%, due 3/15/18 | | | 942,000 | | | | 952,973 | |
| | | | | | | | |
| | | | | | | 2,772,278 | |
| | | | | | | | |
Total Corporate Bonds
(Cost $168,202,409) | | | | | | | 171,486,291 | |
| | | | | | | | |
|
| Loan Assignments 1.9% (d) | |
Aerospace & Defense 0.1% | |
Avolon TLB Borrower 1 S.A.R.L.
Term Loan B2
3.962%, due 3/20/22 | | | 589,000 | | | | 593,617 | |
| | | | | | | | |
| | |
Broadcasting & Entertainment 0.1% | | | | | | | | |
Quintiles IMS, Inc.
2017 Term Loan B
3.232%, due 3/7/24 | | | 681,306 | | | | 685,422 | |
| | | | | | | | |
| | | | |
| 18 | | MainStay VP Janus Henderson Balanced Portfolio | | The notes to the financial statements are an integral part of,
and should be read in conjunction with, the financial statements. |
| | | | | | | | |
| | | Principal
Amount | | | Value | |
| Loan Assignments (continued) | |
Chemicals 0.2% | | | | | | | | |
Axalta Coating Systems U.S. Holdings, Inc.
Term Loan
3.30%, due 6/1/24 | | $ | 2,012,000 | | | $ | 2,017,282 | |
| | | | | | | | |
| |
Communications Equipment 0.2% | | | | | |
CommScope, Inc.
Term Loan B5
3.296%, due 12/29/22 | | | 1,244,081 | | | | 1,245,117 | |
Zayo Group LLC | | | | | | | | |
2017 Term Loan B1
3.216%, due 1/19/21 | | | 79,800 | | | | 79,825 | |
2017 Term Loan B2
3.716%, due 1/19/24 | | | 732,122 | | | | 733,494 | |
| | | | | | | | |
| | | | | | | 2,058,436 | |
| | | | | | | | |
Containers, Packaging & Glass 0.1% | | | | | | | | |
Reynolds Group Holdings, Inc.
2017 Term Loan
4.226%, due 2/5/23 | | | 1,457,581 | | | | 1,460,177 | |
| | | | | | | | |
| | |
Food Services 0.1% | | | | | | | | |
Aramark Services, Inc.
2017 Term Loan B
3.226%, due 3/28/24 | | | 1,028,423 | | | | 1,033,565 | |
Post Holdings, Inc.
2017 Series A Incremental Term Loan
3.47%, due 5/24/24 | | | 228,000 | | | | 228,178 | |
| | | | | | | | |
| | | | | | | 1,261,743 | |
| | | | | | | | |
Health Care—Services 0.1% | | | | | | | | |
HCA, Inc.
Term Loan B8
3.476%, due 2/15/24 | | | 1,182,067 | | | | 1,186,922 | |
| | | | | | | | |
| | |
Lodging 0.2% | | | | | | | | |
Hilton Worldwide Finance LLC
Term Loan B2
3.216%, due 10/25/23 | | | 2,268,645 | | | | 2,274,632 | |
| | | | | | | | |
| | |
Media 0.3% | | | | | | | | |
Charter Communications Operating LLC
Repriced Term Loan F
3.23%, due 1/3/21 | | | 901,265 | | | | 903,393 | |
Mission Broadcasting, Inc.
2016 Term Loan B2
4.246%, due 1/17/24 | | | 87,443 | | | | 87,580 | |
Nexstar Broadcasting, Inc.
2017 Term Loan B
4.238%, due 1/17/24 | | | 887,238 | | | | 888,625 | |
| | | | | | | | |
| | | Principal
Amount | | | Value | |
Media (continued) | | | | | | | | |
Nielsen Finance LLC
Term Loan B4
3.096%, due 10/4/23 | | $ | 989,753 | | | $ | 989,866 | |
| | | | | | | | |
| | | | | | | 2,869,464 | |
| | | | | | | | |
Retail 0.3% | | | | | | | | |
Landry’s, Inc.
2016 Term Loan B
3.913%, due 10/4/23 | | | 1,036,422 | | | | 1,031,888 | |
Yum! Brands, Inc.
1st Lien Term Loan B
3.209%, due 6/16/23 | | | 2,157,167 | | | | 2,164,357 | |
| | | | | | | | |
| | | | | | | 3,196,245 | |
| | | | | | | | |
Telecommunications 0.2% | | | | | | | | |
Level 3 Financing, Inc.
2017 Term Loan B
3.466%, due 2/22/24 | | | 2,757,000 | | | | 2,762,169 | |
| | | | | | | | |
Total Loan Assignments
(Cost $20,360,651) | | | | | | | 20,366,109 | |
| | | | | | | | |
|
| Mortgage-Backed Securities 1.5% | |
Agency Collateral (Collateralized Mortgage Obligation) 0.1% | |
FREMF Mortgage Trust 0.1% | | | | | | | | |
Series 2010-KSCT, Class B
2.00%, due 1/25/20 (a)(c) | | | 980,823 | | | | 917,696 | |
| | | | | | | | |
|
Commercial Mortgage Loans
(Collateralized Mortgage Obligations) 1.0% | |
Banc of America Commercial Mortgage Trust | | | | | | | | |
Series 2007-3, Class AJ
5.676%, due 6/10/49 (e) | | | 197,506 | | | | 198,515 | |
Bank of America Merrill Lynch Large Loan, Inc. (a)(b) | | | | | | | | |
Series 2014-FL1, Class D
5.159%, due 12/15/31 | | | 100,000 | | | | 97,499 | |
Series 2014-FL1, Class E
6.659%, due 12/15/31 | | | 310,216 | | | | 294,667 | |
Commercial Mortgage Trust | | | | | | | | |
Series 2007-GG11, Class AM
5.867%, due 12/10/49 (e) | | | 1,007,557 | | | | 1,010,269 | |
Cosmopolitan Hotel Trust (a)(b) | | | | | | | | |
Series 2016-CSMO, Class B
3.259%, due 11/15/33 | | | 208,000 | | | | 209,563 | |
Series 2016-CSMO, Class D
4.659%, due 11/15/33 | | | 272,000 | | | | 275,390 | |
Series 2016-CSMO, Class E
5.809%, due 11/15/33 | | | 401,000 | | | | 407,400 | |
GS Mortgage Securities Trust (a) | | | | | | | | |
Series 2013-NYC5, Class E
3.771%, due 1/10/30 (e) | | | 383,000 | | | | 385,815 | |
| | | | | | |
The notes to the financial statements are an integral part of,
and should be read in conjunction with, the financial statements. | | | | | 19 | |
Portfolio of Investments June 30, 2017 (Unaudited) (continued)
| | | | | | | | |
| | | Principal
Amount | | | Value | |
| Mortgage-Backed Securities (continued) | |
Commercial Mortgage Loans
(Collateralized Mortgage Obligations) (continued) | |
Series 2014-GSFL, Class E
7.109%, due 7/15/31 (b) | | $ | 370,000 | | | $ | 370,203 | |
GSCCRE Commercial Mortgage Trust | | | | | | | | |
Series 2015-HULA, Class E
5.527%, due 8/15/32 (a)(b) | | | 606,000 | | | | 609,024 | |
JP Morgan Chase Commercial Mortgage Securities Trust (a) | | | | | | | | |
Series 2016-WIKI, Class C
3.554%, due 10/5/31 | | | 131,000 | | | | 133,773 | |
Series 2015-UES, Class E
3.621%, due 9/5/32 (b) | | | 425,000 | | | | 422,173 | |
Series 2015-SGP, Class B
3.909%, due 7/15/36 (b) | | | 181,000 | | | | 182,128 | |
Series 2016-WIKI, Class D
4.009%, due 10/5/31 (e) | | | 200,000 | | | | 203,330 | |
Series 2015-SGP, Class D
5.659%, due 7/15/36 (b) | | | 648,000 | | | | 654,463 | |
Series 2010-C2, Class E
5.724%, due 11/15/43 (e) | | | 299,000 | | | | 306,265 | |
LB-UBS Commercial Mortgage Trust | | | | | | | | |
Series 2008-C1, Class AM
6.296%, due 4/15/41 (e) | | | 443,000 | | | | 439,038 | |
Series 2006-C1, Class AJ
5.276%, due 2/15/41 (b) | | | 122,328 | | | | 122,380 | |
Series 2007-C7, Class AJ
6.50%, due 9/15/45 (e) | | | 357,692 | | | | 361,862 | |
Palisades Center Trust | | | | | | | | |
Series 2016-PLSD, Class D
4.737%, due 4/13/33 (a) | | | 156,000 | | | | 157,245 | |
Starwood Retail Property Trust (a)(b) | | | | | | | | |
Series 2014-STAR, Class D
4.377%, due 11/15/27 | | | 882,000 | | | | 848,918 | |
Series 2014-STAR, Class E
5.277%, due 11/15/27 | | | 526,000 | | | | 502,734 | |
Wachovia Bank Commercial Mortgage Trust | | | | | | | | |
Series 2007-C30, Class AJ
5.413%, due 12/15/43 (b) | | | 375,999 | | | | 380,812 | |
Series 2007-C31, Class AJ
5.66%, due 4/15/47 (e) | | | 975,274 | | | | 995,872 | |
Series 2007-C33, Class AJ
6.174%, due 2/15/51 (e) | | | 403,670 | | | | 410,873 | |
Series 2007-C34, Class AJ
6.271%, due 5/15/46 (e) | | | 275,680 | | | | 275,877 | |
Wells Fargo Commercial Mortgage Trust (a)(b) | | | | | | | | |
Series 2014-TISH, Class WTS1
3.409%, due 2/15/27 | | | 364,000 | | | | 373,334 | |
| | | | | | | | |
| | | Principal
Amount | | | Value | |
Commercial Mortgage Loans
(Collateralized Mortgage Obligations) (continued) | |
Series 2014-TISH, Class SCH1
3.909%, due 1/15/27 | | $ | 283,000 | | | $ | 279,021 | |
Series 2014-TISH, Class WTS2
4.409%, due 2/15/27 | | | 136,000 | | | | 138,528 | |
| | | | | | | | |
| | | | | | | 11,046,971 | |
| | | | | | | | |
Whole Loan (Collateralized Mortgage Obligations) 0.4% | |
Federal Home Loan Mortgage Corporation Structured Agency Credit Risk Debt Notes (b) | | | | | | | | |
Series 2014-DN2, Class M3
4.816%, due 4/25/24 | | | 587,000 | | | | 652,433 | |
Series 2014-DN1, Class M3
5.716%, due 2/25/24 | | | 1,285,000 | | | | 1,500,372 | |
Federal National Mortgage Association | | | | | | | | |
Series 2014-C04, Class 1M2
6.116%, due 11/25/24 (b) | | | 1,856,051 | | | | 2,121,100 | |
| | | | | | | | |
| | | | | | | 4,273,905 | |
| | | | | | | | |
Total Mortgage-Backed Securities
(Cost $16,338,589) | | | | | | | 16,238,572 | |
| | | | | | | | |
|
| U.S. Government & Federal Agencies 15.6% | |
Federal Home Loan Mortgage Corporation
(Mortgage Pass-Through Securities) 1.3% | |
3.50%, due 7/1/29 | | | 437,908 | | | | 456,972 | |
3.50%, due 2/1/44 | | | 583,042 | | | | 601,080 | |
3.50%, due 7/1/46 | | | 1,464,482 | | | | 1,516,367 | |
4.00%, due 8/1/44 | | | 168,466 | | | | 179,664 | |
4.50%, due 5/1/44 | | | 1,275,523 | | | | 1,381,848 | |
4.50%, due 9/1/44 | | | 1,554,221 | | | | 1,702,350 | |
4.50%, due 6/1/45 | | | 724,236 | | | | 793,379 | |
4.50%, due 2/1/46 | | | 1,234,618 | | | | 1,351,104 | |
4.50%, due 6/1/46 | | | 1,105,572 | | | | 1,195,705 | |
5.00%, due 3/1/42 | | | 394,127 | | | | 436,136 | |
5.00%, due 7/1/44 | | | 1,532,748 | | | | 1,690,078 | |
5.50%, due 10/1/36 | | | 212,782 | | | | 239,298 | |
5.50%, due 8/1/41 | | | 546,911 | | | | 617,428 | |
6.00%, due 4/1/40 | | | 1,102,793 | | | | 1,276,456 | |
8.00%, due 4/1/32 | | | 101,549 | | | | 124,454 | |
| | | | | | | | |
| | | | | | | 13,562,319 | |
| | | | | | | | |
¨Federal National Mortgage Association
(Mortgage Pass-Through Securities) 5.6% | |
3.50%, due 2/1/43 | | | 1,869,115 | | | | 1,929,260 | |
3.50%, due 1/1/44 | | | 2,181,046 | | | | 2,262,474 | |
3.50%, due 4/1/44 | | | 772,830 | | | | 799,109 | |
3.50%, due 2/1/45 | | | 1,571,575 | | | | 1,622,262 | |
3.50%, due 12/1/45 | | | 399,581 | | | | 413,136 | |
3.50%, due 1/1/46 | | | 2,004,642 | | | | 2,072,964 | |
3.50%, due 7/1/46 | | | 1,470,359 | | | | 1,518,779 | |
| | | | |
| 20 | | MainStay VP Janus Henderson Balanced Portfolio | | The notes to the financial statements are an integral part of,
and should be read in conjunction with, the financial statements. |
| | | | | | | | |
| | | Principal
Amount | | | Value | |
| U.S. Government & Federal Agencies (continued) | |
¨Federal National Mortgage Association
(Mortgage Pass-Through Securities) (continued) | |
3.50%, due 8/1/46 | | $ | 2,886,435 | | | $ | 2,972,266 | |
3.50%, due 6/1/47 | | | 49,192 | | | | 50,761 | |
3.50%, due 5/1/56 | | | 1,722,611 | | | | 1,771,216 | |
4.00%, due 4/1/34 | | | 359,257 | | | | 381,206 | |
4.00%, due 6/1/42 | | | 714,427 | | | | 757,591 | |
4.00%, due 8/1/42 | | | 301,590 | | | | 319,707 | |
4.00%, due 9/1/42 | | | 373,111 | | | | 395,496 | |
4.00%, due 11/1/42 | | | 478,417 | | | | 507,023 | |
4.00%, due 8/1/43 | | | 1,234,302 | | | | 1,308,742 | |
4.00%, due 9/1/43 | | | 305,771 | | | | 324,264 | |
4.00%, due 2/1/44 | | | 824,237 | | | | 874,014 | |
4.00%, due 6/1/44 | | | 1,074,435 | | | | 1,139,153 | |
4.00%, due 7/1/44 | | | 1,934,769 | | | | 2,066,199 | |
4.00%, due 8/1/44 | | | 1,705,300 | | | | 1,821,244 | |
4.00%, due 5/1/45 | | | 396,969 | | | | 424,064 | |
4.00%, due 10/1/45 | | | 1,315,338 | | | | 1,397,115 | |
4.00%, due 12/1/45 | | | 553,604 | | | | 591,332 | |
4.00%, due 1/1/46 | | | 259,137 | | | | 276,102 | |
4.00%, due 4/1/46 | | | 710,682 | | | | 756,863 | |
4.00%, due 5/1/46 | | | 834,100 | | | | 888,756 | |
4.00%, due 6/1/46 | | | 284,694 | | | | 303,349 | |
4.00%, due 8/1/46 | | | 184,669 | | | | 196,148 | |
4.00%, due 10/1/46 | | | 482,941 | | | | 512,634 | |
4.00%, due 11/1/46 | | | 267,082 | | | | 285,238 | |
4.00%, due 1/1/47 | | | 307,785 | | | | 329,456 | |
4.00%, due 2/1/47 | | | 683,685 | | | | 729,126 | |
4.00%, due 3/1/47 | | | 144,551 | | | | 153,555 | |
4.00%, due 4/1/47 | | | 682,648 | | | | 727,137 | |
4.00%, due 5/1/47 | | | 253,901 | | | | 269,706 | |
4.00%, due 6/1/47 | | | 869,008 | | | | 923,029 | |
4.50%, due 11/1/42 | | | 186,345 | | | | 202,304 | |
4.50%, due 3/1/43 | | | 473,732 | | | | 516,497 | |
4.50%, due 8/1/44 | | | 1,050,651 | | | | 1,151,716 | |
4.50%, due 10/1/44 | | | 1,721,662 | | | | 1,885,477 | |
4.50%, due 3/1/45 | | | 902,993 | | | | 987,164 | |
4.50%, due 5/1/45 | | | 447,682 | | | | 490,624 | |
4.50%, due 6/1/45 | | | 412,620 | | | | 449,583 | |
4.50%, due 10/1/45 | | | 926,575 | | | | 1,011,091 | |
4.50%, due 2/1/46 | | | 1,719,209 | | | | 1,882,917 | |
4.50%, due 4/1/46 | | | 664,008 | | | | 731,006 | |
4.50%, due 7/1/46 | | | 2,742,686 | | | | 2,997,193 | |
4.50%, due 9/1/46 | | | 253,915 | | | | 278,370 | |
4.50%, due 11/1/46 | | | 835,055 | | | | 911,501 | |
4.50%, due 12/1/46 | | | 447,616 | | | | 483,861 | |
4.50%, due 2/1/47 | | | 758,630 | | | | 822,657 | |
4.50%, due 4/1/47 | | | 1,728,676 | | | | 1,890,855 | |
4.50%, due 5/1/47 | | | 754,975 | | | | 822,132 | |
4.50%, due 6/1/47 | | | 110,223 | | | | 119,325 | |
5.00%, due 5/1/41 | | | 534,392 | | | | 584,671 | |
| | | | | | | | |
| | | Principal
Amount | | | Value | |
¨Federal National Mortgage Association
(Mortgage Pass-Through Securities) (continued) | |
5.00%, due 7/1/44 | | $ | 727,493 | | | $ | 812,814 | |
5.50%, due 12/1/39 | | | 395,558 | | | | 440,681 | |
5.50%, due 3/1/40 | | | 395,656 | | | | 446,832 | |
5.50%, due 4/1/40 | | | 940,833 | | | | 1,045,784 | |
5.50%, due 2/1/41 | | | 218,873 | | | | 247,187 | |
5.50%, due 5/1/41 | | | 310,189 | | | | 345,314 | |
5.50%, due 6/1/41 | | | 405,591 | | | | 456,525 | |
5.50%, due 12/1/41 | | | 425,578 | | | | 474,795 | |
5.50%, due 2/1/42 | | | 1,642,828 | | | | 1,827,888 | |
6.00%, due 10/1/35 | | | 328,189 | | | | 374,138 | |
6.00%, due 12/1/35 | | | 337,873 | | | | 385,876 | |
6.00%, due 2/1/37 | | | 65,520 | | | | 75,777 | |
6.00%, due 9/1/37 | | | 143,746 | | | | 150,900 | |
6.00%, due 10/1/38 | | | 245,572 | | | | 279,136 | |
7.00%, due 2/1/39 | | | 96,205 | | | | 111,629 | |
| | | | | | | | |
| | | | | | | 59,764,696 | |
| | | | | | | | |
Government National Mortgage Association
(Mortgage Pass-Through Securities) 1.4% | |
3.50%, due 5/20/42 | | | 263,309 | | | | 274,252 | |
4.00%, due 1/15/45 | | | 1,566,739 | | | | 1,660,014 | |
4.00%, due 10/20/45 | | | 694,373 | | | | 741,772 | |
4.00%, due 7/15/46 | | | 1,083,909 | | | | 1,158,693 | |
4.50%, due 5/15/41 | | | 534,958 | | | | 599,923 | |
4.50%, due 7/15/41 | | | 107,526 | | | | 118,268 | |
4.50%, due 8/15/41 | | | 1,009,556 | | | | 1,108,212 | |
4.50%, due 10/20/41 | | | 621,323 | | | | 661,393 | |
4.50%, due 5/15/44 | | | 346,130 | | | | 379,557 | |
4.50%, due 8/15/46 | | | 1,594,315 | | | | 1,747,741 | |
4.90%, due 10/15/34 | | | 531,634 | | | | 603,876 | |
5.00%, due 10/15/39 | | | 196,019 | | | | 216,355 | |
5.00%, due 11/15/39 | | | 304,563 | | | | 333,995 | |
5.00%, due 1/15/40 | | | 104,277 | | | | 114,110 | |
5.00%, due 5/15/40 | | | 167,810 | | | | 186,147 | |
5.00%, due 7/15/40 | | | 473,369 | | | | 519,315 | |
5.00%, due 2/15/41 | | | 344,385 | | | | 378,730 | |
5.00%, due 5/15/41 | | | 123,992 | | | | 137,636 | |
5.00%, due 9/15/41 | | | 96,773 | | | | 107,944 | |
5.00%, due 6/15/44 | | | 653,532 | | | | 727,840 | |
5.00%, due 7/15/44 | | | 198,516 | | | | 220,685 | |
5.00%, due 12/20/44 | | | 290,672 | | | | 326,053 | |
5.10%, due 1/15/32 | | | 493,626 | | | | 561,829 | |
5.50%, due 9/15/35 | | | 55,497 | | | | 63,771 | |
5.50%, due 8/15/39 | | | 1,301,741 | | | | 1,507,209 | |
5.50%, due 10/15/39 | | | 383,779 | | | | 438,943 | |
5.50%, due 1/20/42 | | | 203,541 | | | | 223,122 | |
6.00%, due 11/20/42 | | | 71,053 | | | | 80,966 | |
7.50%, due 8/15/33 | | | 338,208 | | | | 395,048 | |
| | | | | | | | |
| | | | | | | 15,593,399 | |
| | | | | | | | |
| | | | | | |
The notes to the financial statements are an integral part of,
and should be read in conjunction with, the financial statements. | | | | | 21 | |
Portfolio of Investments June 30, 2017 (Unaudited) (continued)
| | | | | | | | |
| | | Principal
Amount | | | Value | |
| U.S. Government & Federal Agencies (continued) | |
¨United States Treasury Bonds 2.2% | | | | | | | | |
2.25%, due 8/15/46 | | $ | 9,789,000 | | | $ | 8,618,147 | |
2.875%, due 11/15/46 | | | 11,789,000 | | | | 11,853,934 | |
3.00%, due 2/15/47 | | | 3,329,000 | | | | 3,434,070 | |
| | | | | | | | |
| | | | | | | 23,906,151 | |
| | | | | | | | |
¨United States Treasury Notes 5.1% | | | | | | | | |
1.25%, due 5/31/19 | | | 4,198,000 | | | | 4,187,832 | |
1.25%, due 6/30/19 | | | 2,827,000 | | | | 2,819,271 | |
1.50%, due 5/15/20 | | | 251,000 | | | | 250,716 | |
1.50%, due 6/15/20 | | | 290,000 | | | | 289,592 | |
1.625%, due 2/15/26 | | | 1,143,000 | | | | 1,086,297 | |
1.75%, due 5/31/22 | | | 12,720,000 | | | | 12,645,473 | |
2.00%, due 5/31/24 | | | 5,369,000 | | | | 5,325,796 | |
2.00%, due 11/15/26 | | | 8,546,000 | | | | 8,333,017 | |
2.25%, due 11/15/25 | | | 1,382,000 | | | | 1,382,323 | |
2.25%, due 2/15/27 | | | 12,931,000 | | | | 12,870,897 | |
2.375%, due 5/15/27 | | | 4,960,000 | | | | 4,991,387 | |
| | | | | | | | |
| | | | | | | 54,182,601 | |
| | | | | | | | |
Total U.S. Government & Federal Agencies
(Cost $167,067,008) | | | | | | | 167,009,166 | |
| | | | | | | | |
Total Long-Term Bonds
(Cost $387,412,344) | | | | | | | 390,538,008 | |
| | | | | | | | |
| | |
| | | | | | | | |
| | |
| | | Shares | | | | |
| Common Stocks 62.8% | | | | | | | | |
Aerospace & Defense 5.3% | | | | | | | | |
¨Boeing Co. | | | 168,569 | | | | 33,334,520 | |
General Dynamics Corp. | | | 53,247 | | | | 10,548,231 | |
Northrop Grumman Corp. | | | 47,898 | | | | 12,295,895 | |
| | | | | | | | |
| | | | | | | 56,178,646 | |
| | | | | | | | |
Agriculture 2.5% | | | | | | | | |
¨Altria Group, Inc. | | | 356,457 | | | | 26,545,353 | |
| | | | | | | | |
| | |
Apparel 1.7% | | | | | | | | |
NIKE, Inc., Class B | | | 309,481 | | | | 18,259,379 | |
| | | | | | | | |
| | |
Auto Manufacturers 1.1% | | | | | | | | |
General Motors Co. | | | 337,040 | | | | 11,772,807 | |
| | | | | | | | |
| | |
Banks 1.8% | | | | | | | | |
Morgan Stanley | | | 23,734 | | | | 1,057,587 | |
U.S. Bancorp | | | 342,377 | | | | 17,776,214 | |
| | | | | | | | |
| | | | | | | 18,833,801 | |
| | | | | | | | |
Biotechnology 1.9% | | | | | | | | |
¨Amgen, Inc. | | | 115,829 | | | | 19,949,229 | |
| | | | | | | | |
| | | | | | | | |
| | |
| | | Shares | | | Value | |
Building Materials 0.3% | | | | | | | | |
Vulcan Materials Co. | | | 26,119 | | | $ | 3,308,755 | |
| | | | | | | | |
| | |
Chemicals 1.5% | | | | | | | | |
LyondellBasell Industries N.V., Class A | | | 193,918 | | | | 16,364,740 | |
| | | | | | | | |
| | |
Commercial Services 0.5% | | | | | | | | |
Automatic Data Processing, Inc. | | | 56,771 | | | | 5,816,757 | |
| | | | | | | | |
| | |
Computers 2.6% | | | | | | | | |
Accenture PLC Class A | | | 74,718 | | | | 9,241,122 | |
Apple, Inc. | | | 129,087 | | | | 18,591,110 | |
| | | | | | | | |
| | | | | | | 27,832,232 | |
| | | | | | | | |
Cosmetics & Personal Care 0.6% | | | | | | | | |
Estee Lauder Cos., Inc., Class A | | | 63,961 | | | | 6,138,977 | |
| | | | | | | | |
| | |
Diversified Financial Services 6.7% | | | | | | | | |
¨CME Group, Inc. | | | 163,130 | | | | 20,430,401 | |
¨Mastercard, Inc. Class A | | | 244,240 | | | | 29,662,948 | |
Synchrony Financial | | | 339,432 | | | | 10,121,862 | |
TD Ameritrade Holding Corp. | | | 256,124 | | | | 11,010,771 | |
| | | | | | | | |
| | | | | | | 71,225,982 | |
| | | | | | | | |
Electronics 1.7% | | | | | | | | |
Honeywell International, Inc. | | | 140,457 | | | | 18,721,514 | |
| | | | | | | | |
| | |
Entertainment 0.7% | | | | | | | | |
Madison Square Garden Co. Class A (f) | | | 14,777 | | | | 2,909,591 | |
Six Flags Entertainment Corp. | | | 73,404 | | | | 4,375,613 | |
| | | | | | | | |
| | | | | | | 7,285,204 | |
| | | | | | | | |
Food 1.9% | | | | | | | | |
Hershey Co. | | | 70,641 | | | | 7,584,724 | |
Kroger Co. | | | 252,300 | | | | 5,883,636 | |
Sysco Corp. | | | 141,010 | | | | 7,097,033 | |
| | | | | | | | |
| | | | | | | 20,565,393 | |
| | | | | | | | |
Health Care—Products 1.6% | | | | | | | | |
Abbott Laboratories | | | 29,243 | | | | 1,421,502 | |
Medtronic PLC | | | 180,161 | | | | 15,989,289 | |
| | | | | | | | |
| | | | | | | 17,410,791 | |
| | | | | | | | |
Health Care—Services 1.0% | | | | | | | | |
Aetna, Inc. | | | 69,083 | | | | 10,488,872 | |
| | | | | | | | |
| | |
Household Products & Wares 0.8% | | | | | | | | |
Kimberly-Clark Corp. | | | 64,510 | | | | 8,328,886 | |
| | | | | | | | |
| | |
Insurance 0.2% | | | | | | | | |
Progressive Corp. | | | 49,769 | | | | 2,194,315 | |
| | | | | | | | |
| | | | |
| 22 | | MainStay VP Janus Henderson Balanced Portfolio | | The notes to the financial statements are an integral part of,
and should be read in conjunction with, the financial statements. |
| | | | | | | | |
| | |
| | | Shares | | | Value | |
| Common Stocks (continued) | | | | | | | | |
Internet 4.0% | | | | | | | | |
¨Alphabet, Inc. Class C (f) | | | 26,722 | | | $ | 24,283,083 | |
Priceline Group, Inc. (f) | | | 9,776 | | | | 18,286,204 | |
| | | | | | | | |
| | | | | | | 42,569,287 | |
| | | | | | | | |
Leisure Time 0.4% | | | | | | | | |
Norwegian Cruise Line Holdings, Ltd. (f) | | | 84,017 | | | | 4,561,283 | |
| | | | | | | | |
| | |
Media 1.7% | | | | | | | | |
Comcast Corp., Class A | | | 471,224 | | | | 18,340,038 | |
| | | | | | | | |
| | |
Oil & Gas 1.0% | | | | | | | | |
Suncor Energy, Inc. | | | 358,125 | | | | 10,460,329 | |
| | | | | | | | |
| | |
Pharmaceuticals 3.4% | | | | | | | | |
AbbVie, Inc. | | | 104,491 | | | | 7,576,642 | |
Allergan PLC | | | 59,431 | | | | 14,447,082 | |
Bristol-Myers Squibb Co. | | | 191,891 | | | | 10,692,166 | |
Eli Lilly & Co. | | | 40,142 | | | | 3,303,687 | |
| | | | | | | | |
| | | | | | | 36,019,577 | |
| | | | | | | | |
Private Equity 0.7% | | | | | | | | |
Blackstone Group L.P. | | | 226,375 | | | | 7,549,606 | |
| | | | | | | | |
| | |
Real Estate 0.8% | | | | | | | | |
CBRE Group, Inc., Class A (f) | | | 232,620 | | | | 8,467,368 | |
| | | | | | | | |
| | |
Real Estate Investment Trusts 2.0% | | | | | | | | |
Colony NorthStar, Inc. Class A | | | 406,678 | | | | 5,730,093 | |
Colony Starwood Homes | | | 87,359 | | | | 2,997,287 | |
Crown Castle International Corp. | | | 51,440 | | | | 5,153,259 | |
MGM Growth Properties LLC Class A | | | 120,944 | | | | 3,530,356 | |
Outfront Media, Inc. | | | 164,866 | | | | 3,811,702 | |
| | | | | | | | |
| | | | | | | 21,222,697 | |
| | | | | | | | |
Retail 4.4% | | | | | | | | |
Costco Wholesale Corp. | | | 104,417 | | | | 16,699,411 | |
Home Depot, Inc. | | | 101,578 | | | | 15,582,065 | |
McDonald’s Corp. | | | 39,748 | | | | 6,087,803 | |
Starbucks Corp. | | | 157,499 | | | | 9,183,767 | |
| | | | | | | | |
| | | | | | | 47,553,046 | |
| | | | | | | | |
Semiconductors 1.7% | | | | | | | | |
Intel Corp. | | | 334,238 | | | | 11,277,190 | |
Lam Research Corp. | | | 47,838 | | | | 6,765,728 | |
| | | | | | | | |
| | | | | | | 18,042,918 | |
| | | | | | | | |
Software 5.1% | | | | | | | | |
Adobe Systems, Inc. (f) | | | 137,098 | | | | 19,391,141 | |
¨Microsoft Corp. | | | 510,186 | | | | 35,167,121 | |
| | | | | | | | |
| | | | | | | 54,558,262 | |
| | | | | | | | |
| | | | | | | | |
| | |
| | | Shares | | | Value | |
Toys, Games & Hobbies 1.0% | | | | | | | | |
Hasbro, Inc. | | | 61,223 | | | $ | 6,826,977 | |
Mattel, Inc. | | | 187,194 | | | | 4,030,287 | |
| | | | | | | | |
| | | | | | | 10,857,264 | |
| | | | | | | | |
Transportation 2.2% | | | | | | | | |
CSX Corp. | | | 294,881 | | | | 16,088,707 | |
United Parcel Service, Inc. Class B | | | 65,483 | | | | 7,241,765 | |
| | | | | | | | |
| | | | | | | 23,330,472 | |
| | | | | | | | |
Total Common Stocks
(Cost $535,880,555) | | | | | | | 670,753,780 | |
| | | | | | | | |
|
| Preferred Stocks 0.2% | |
Banks 0.1% | | | | | | | | |
Citigroup Capital XIII
7.542% (b) | | | 5,656 | | | | 146,943 | |
Morgan Stanley
6.875% (b) | | | 8,022 | | | | 234,965 | |
| | | | | | | | |
| | | | | | | 381,908 | |
| | | | | | | | |
Diversified Financial Services 0.1% | | | | | | | | |
Discover Financial Services
6.50% | | | 46,958 | | | | 1,210,577 | |
| | | | | | | | |
| |
Miscellaneous—Manufacturing 0.0%‡ | | | | | |
General Electric Co.
4.70% | | | 3,757 | | | | 95,841 | |
| | | | | | | | |
Total Preferred Stocks
(Cost $1,619,117) | | | | | | | 1,688,326 | |
| | | | | | | | |
| | |
| | | | | | | | |
| | | Principal Amount | | | | |
| Short-Term Investment 1.0% | |
Repurchase Agreement 1.0% | | | | | | | | |
Fixed Income Clearing Corp.
0.12%, dated 6/30/17
due 7/3/17
Proceeds at Maturity $10,823,142 (Collateralized by a United States Treasury Note with a rate of 2.125% and a maturity date of 9/30/21, with a Principal Amount of $10,825,000 and a Market Value of $11,043.481) | | $ | 10,823,034 | | | | 10,823,034 | |
| | | | | | | | |
Total Short-Term Investment
(Cost $10,823,034) | | | | | | | 10,823,034 | |
| | | | | | | | |
Total Investments
(Cost $935,735,050) (g) | | | 100.5 | % | | | 1,073,803,148 | |
Other Assets, Less Liabilities | | | (0.5 | ) | | | (4,838,069 | ) |
Net Assets | | | 100.0 | % | | $ | 1,068,965,079 | |
| ‡ | Less than one-tenth of a percent. |
| | | | | | |
The notes to the financial statements are an integral part of,
and should be read in conjunction with, the financial statements. | | | | | 23 | |
Portfolio of Investments June 30, 2017 (Unaudited) (continued)
| (a) | May be sold to institutional investors only under Rule 144A or securities offered pursuant to Section 4(a)(2) of the Securities Act of 1933, as amended. |
| (b) | Floating rate—Rate shown was the rate in effect as of June 30, 2017. |
| (c) | Illiquid security—As of June 30, 2017, the total market value of these securities deemed illiquid under procedures approved by the Board of Trustees was $3,101,718, which represented 0.3% of the Portfolio’s net assets. |
| (d) | Floating Rate Loan—generally pays interest at rates which are periodically re-determined at a margin above the London InterBank Offered Rate or other short-term rates. The rate shown was the weighted average interest rate of all contracts within the floating rate loan facility as of June 30, 2017. |
| (e) | Collateral strip rate—A bond whose interest was based on the weighted net interest rate of the collateral. The coupon rate adjusts periodically based on a predetermined schedule. Rate shown was the rate in effect as of June 30, 2017. |
| (f) | Non-income producing security. |
| (g) | As of June 30, 2017, cost was $939,456,067 for federal income tax purposes and net unrealized appreciation was as follows: |
| | | | |
Gross unrealized appreciation | | $ | 148,370,500 | |
Gross unrealized depreciation | | | (14,023,419 | ) |
| | | | |
Net unrealized appreciation | | $ | 134,347,081 | |
| | | | |
The following is a summary of the fair valuations according to the inputs used as of June 30, 2017, for valuing the Portfolio’s assets.
Asset Valuation Inputs
| | | | | | | | | | | | | | | | |
Description | | Quoted
Prices in
Active
Markets for
Identical
Assets (Level 1) | | | Significant
Other
Observable
Inputs (Level 2) | | | Significant
Unobservable
Inputs (Level 3) | | | Total | |
| Investments in Securities (a) | | | | | | | | | |
| Long-Term Bonds | | | | | | | | | |
Asset-Backed Securities | | $ | — | | | $ | 15,437,870 | | | $ | — | | | $ | 15,437,870 | |
Corporate Bonds | | | — | | | | 171,486,291 | | | | — | | | | 171,486,291 | |
Loan Assignments | | | — | | | | 20,366,109 | | | | — | | | | 20,366,109 | |
Mortgage-Backed Securities | | | — | | | | 16,238,572 | | | | — | | | | 16,238,572 | |
U.S. Government & Federal Agencies | | | — | | | | 167,009,166 | | | | — | | | | 167,009,166 | |
| | | | | | | | | | | | | | | | |
| Total Long-Term Bonds | | | — | | | | 390,538,008 | | | | — | | | | 390,538,008 | |
| | | | | | | | | | | | | | | | |
| Common Stocks | | | 670,753,780 | | | | — | | | | — | | | | 670,753,780 | |
| Preferred Stocks | | | 1,688,326 | | | | — | | | | — | | | | 1,688,326 | |
| Short-Term Investment | | | | | | | | | |
Repurchase Agreement | | | — | | | | 10,823,034 | | | | — | | | | 10,823,034 | |
| | | | | | | | | | | | | | | | |
| Total Investments in Securities | | $ | 672,442,106 | | | $ | 401,361,042 | | | $ | — | | | $ | 1,073,803,148 | |
| | | | | | | | | | | | | | | | |
| (a) | For a complete listing of investments and their industries, see the Portfolio of Investments. |
The Portfolio recognizes transfers between the levels as of the beginning of the period.
For the period ended June 30, 2017, the Portfolio did not have any transfers among levels. (See Note 2)
As of June 30, 2017, the Portfolio did not hold any investments with significant unobservable inputs (Level 3). (See Note 2)
| | | | |
| 24 | | MainStay VP Janus Henderson Balanced Portfolio | | The notes to the financial statements are an integral part of,
and should be read in conjunction with, the financial statements. |
Statement of Assets and Liabilities as of June 30, 2017 (Unaudited)
| | | | |
| Assets | |
Investment in securities, at value
(identified cost $935,735,050) | | $ | 1,073,803,148 | |
Due from custodian | | | 3,300,387 | |
Receivables: | |
Investment securities sold | | | 3,341,484 | |
Dividends and interest | | | 3,238,281 | |
Fund shares sold | | | 562,159 | |
Other assets | | | 5,862 | |
| | | | |
Total assets | | | 1,084,251,321 | |
| | | | |
|
| Liabilities | |
Payables: | |
Investment securities purchased | | | 14,195,775 | |
Manager (See Note 3) | | | 483,136 | |
Fund shares redeemed | | | 304,553 | |
NYLIFE Distributors (See Note 3) | | | 136,401 | |
Shareholder communication | | | 88,835 | |
Professional fees | | | 38,593 | |
Custodian | | | 29,654 | |
Trustees | | | 1,808 | |
Accrued expenses | | | 7,487 | |
| | | | |
Total liabilities | | | 15,286,242 | |
| | | | |
Net assets | | $ | 1,068,965,079 | |
| | | | |
|
| Composition of Net Assets | |
Shares of beneficial interest outstanding (par value of $.001 per share) unlimited number of shares authorized | | $ | 83,750 | |
Additional paid-in capital | | | 835,081,674 | |
| | | | |
| | | 835,165,424 | |
Undistributed net investment income | | | 28,174,248 | |
Accumulated net realized gain (loss) on investments and foreign currency transactions | | | 67,557,309 | |
Net unrealized appreciation (depreciation) on investments | | | 138,068,098 | |
| | | | |
Net assets | | $ | 1,068,965,079 | |
| | | | |
| | | | |
Initial Class | |
Net assets applicable to outstanding shares | | $ | 404,923,267 | |
| | | | |
Shares of beneficial interest outstanding | | | 31,611,659 | |
| | | | |
Net asset value per share outstanding | | $ | 12.81 | |
| | | | |
Service Class | |
Net assets applicable to outstanding shares | | $ | 664,041,812 | |
| | | | |
Shares of beneficial interest outstanding | | | 52,137,877 | |
| | | | |
Net asset value per share outstanding | | $ | 12.74 | |
| | | | |
| | | | | | |
The notes to the financial statements are an integral part of,
and should be read in conjunction with, the financial statements. | | | | | 25 | |
Statement of Operations for the six months ended June 30, 2017 (Unaudited)
| | | | |
| Investment Income (Loss) | |
Income | |
Dividends | | $ | 8,172,797 | |
Interest | | | 6,052,808 | |
| | | | |
Total income | | | 14,225,605 | |
| | | | |
Expenses | |
Manager (See Note 3) | | | 2,871,193 | |
Distribution/Service—Service Class (See Note 3) | | | 800,109 | |
Shareholder communication | | | 81,418 | |
Professional fees | | | 56,955 | |
Custodian | | | 13,224 | |
Trustees | | | 13,019 | |
Miscellaneous | | | 21,177 | |
| | | | |
Total expenses before waiver/reimbursement | | | 3,857,095 | |
Expense waiver/reimbursement from Manager (See Note 3) | | | (6,536 | ) |
| | | | |
Net expenses | | | 3,850,559 | |
| | | | |
Net investment income (loss) | | | 10,375,046 | |
| | | | |
|
| Realized and Unrealized Gain (Loss) on Investments and Foreign Currency Transactions | |
Net realized gain (loss) on: | | | | |
Investment transactions | | | 24,660,551 | |
Foreign currency transactions | | | (1,238 | ) |
| | | | |
Net realized gain (loss) on investments and foreign currency transactions | | | 24,659,313 | |
| | | | |
Net change in unrealized appreciation (depreciation) on investments | | | 47,915,547 | |
| | | | |
Net realized and unrealized gain (loss) on investments and foreign currency transactions | | | 72,574,860 | |
| | | | |
Net increase (decrease) in net assets resulting from operations | | $ | 82,949,906 | |
| | | | |
| | | | |
| 26 | | MainStay VP Janus Henderson Balanced Portfolio | | The notes to the financial statements are an integral part of,
and should be read in conjunction with, the financial statements. |
Statements of Changes in Net Assets
for the six months ended June 30, 2017 (Unaudited) and the year ended December 31, 2016
| | | | | | | | |
| | | 2017 | | | 2016 | |
| Increase (Decrease) in Net Assets | |
Operations: | | | | | | | | |
Net investment income (loss) | | $ | 10,375,046 | | | $ | 17,411,006 | |
Net realized gain (loss) on investments and foreign currency transactions | | | 24,659,313 | | | | 45,585,056 | |
Net change in unrealized appreciation (depreciation) on investments and foreign currency transactions | | | 47,915,547 | | | | (17,501,558 | ) |
| | | | |
Net increase (decrease) in net assets resulting from operations | | | 82,949,906 | | | | 45,494,504 | |
| | | | |
Dividends and distributions to shareholders: | | | | | | | | |
From net investment income: | | | | | | | | |
Initial Class | | | — | | | | (7,623,180 | ) |
Service Class | | | — | | | | (10,269,274 | ) |
| | | | |
| | | — | | | | (17,892,454 | ) |
| | | | |
From net realized gain on investments: | | | | | | | | |
Initial Class | | | — | | | | (19,433,692 | ) |
Service Class | | | — | | | | (29,876,227 | ) |
| | | | |
| | | — | | | | (49,309,919 | ) |
| | | | |
Total dividends and distributions to shareholders | | | — | | | | (67,202,373 | ) |
| | | | |
Capital share transactions: | | | | | | | | |
Net proceeds from sale of shares | | | 45,926,735 | | | | 92,050,256 | |
Net asset value of shares issued to shareholders in reinvestment of dividends and distributions | | | — | | | | 67,202,373 | |
Cost of shares redeemed | | | (80,979,379 | ) | | | (137,783,018 | ) |
| | | | |
Increase (decrease) in net assets derived from capital share transactions | | | (35,052,644 | ) | | | 21,469,611 | |
| | | | |
Net increase (decrease) in net assets | | | 47,897,262 | | | | (238,258 | ) |
|
| Net Assets | |
Beginning of period | | | 1,021,067,817 | | | | 1,021,306,075 | |
| | | | |
End of period | | $ | 1,068,965,079 | | | $ | 1,021,067,817 | |
| | | | |
Undistributed net investment income at end of period | | $ | 28,174,248 | | | $ | 17,799,202 | |
| | | | |
| | | | | | |
The notes to the financial statements are an integral part of,
and should be read in conjunction with, the financial statements. | | | | | 27 | |
Financial Highlights selected per share data and ratios
| | | | | | | | | | | | | | | | | | | | | | | | |
| | | Six months
ended
June 30, | | | Year ended December 31, | | | February 17,
2012**
through
December 31, | |
| Initial Class | | 2017* | | | 2016 | | | 2015 | | | 2014 | | | 2013 | | | 2012 | |
Net asset value at beginning of period | | $ | 11.82 | | | $ | 12.11 | | | $ | 13.13 | | | $ | 12.47 | | | $ | 10.55 | | | $ | 10.00 | |
| | | | | | | | | | | | | | | | | | | | | | | | |
Net investment income (loss) (a) | | | 0.13 | | | | 0.22 | | | | 0.24 | | | | 0.24 | | | | 0.20 | | | | 0.18 | |
Net realized and unrealized gain (loss) on investments | | | 0.86 | | | | 0.32 | | | | (0.17 | ) | | | 0.84 | | | | 1.91 | | | | 0.37 | |
Net realized and unrealized gain (loss) on foreign currency transactions | | | (0.00 | )‡ | | | 0.00 | ‡ | | | (0.00 | )‡ | | | (0.00 | )‡ | | | (0.00 | )‡ | | | (0.00 | )‡ |
| | | | | | | | | | | | | | | | | | | | | | | | |
Total from investment operations | | | 0.99 | | | | 0.54 | | | | 0.07 | | | | 1.08 | | | | 2.11 | | | | 0.55 | |
| | | | | | | | | | | | | | | | | | | | | | | | |
| Less dividends and distributions: | | | | | | | | | | | | | | | | | | | | | | | | |
From net investment income | | | — | | | | (0.23 | ) | | | (0.25 | ) | | | (0.19 | ) | | | (0.17 | ) | | | — | |
From net realized gain on investments | | | — | | | | (0.60 | ) | | | (0.84 | ) | | | (0.23 | ) | | | (0.02 | ) | | | — | |
| | | | | | | | | | | | | | | | | | | | | | | | |
Total dividends and distributions | | | — | | | | (0.83 | ) | | | (1.09 | ) | | | (0.42 | ) | | | (0.19 | ) | | | — | |
| | | | | | | | | | | | | | | | | | | | | | | | |
Net asset value at end of period | | $ | 12.81 | | | $ | 11.82 | | | $ | 12.11 | | | $ | 13.13 | | | $ | 12.47 | | | $ | 10.55 | |
| | | | | | | | | | | | | | | | | | | | | | | | |
Total investment return (b) | | | 8.38 | %(c) | | | 4.70 | % | | | 0.70 | % | | | 8.68 | % | | | 20.15 | % | | | 5.50 | %(c) |
| Ratios (to average net assets)/Supplemental Data: | | | | | | | | | | | | | | | | | | | | | | | | |
Net investment income (loss) | | | 2.14 | %†† | | | 1.87 | % | | | 1.84 | % | | | 1.85 | % | | | 1.77 | % | | | 2.01 | %†† |
Net expenses | | | 0.59 | %†† | | | 0.59 | % | | | 0.58 | % | | | 0.58 | % | | | 0.58 | % | | | 0.58 | %†† |
Expenses (before waiver/reimbursement) | | | 0.59 | %†† | | | 0.59 | % | | | 0.58 | % | | | 0.59 | % | | | 0.59 | % | | | 0.59 | %†† |
Portfolio turnover rate | | | 31 | % | | | 74 | % | | | 76 | % | | | 86 | % | | | 74 | % | | | 63 | % |
Net assets at end of period (in 000’s) | | $ | 404,923 | | | $ | 401,219 | | | $ | 429,680 | | | $ | 478,480 | | | $ | 493,872 | | | $ | 461,363 | |
| ‡ | Less than one cent per share. |
| (a) | Per share data based on average shares outstanding during the period. |
| (b) | Total return does not reflect any deduction of sales charges, mortality and expense charges, contract charges or administrative charges. For periods of less than one year, total return is not annualized. |
| (c) | Total investment return may reflect adjustments to conform to generally accepted accounting principles. |
| | | | |
| 28 | | MainStay VP Janus Henderson Balanced Portfolio | | The notes to the financial statements are an integral part of,
and should be read in conjunction with, the financial statements. |
Financial Highlights selected per share data and ratios
| | | | | | | | | | | | | | | | | | | | | | | | |
| | | Six months
ended
June 30, | | | Year ended December 31, | | | February 17,
2012**
through
December 31, | |
| Service Class | | 2017* | | | 2016 | | | 2015 | | | 2014 | | | 2013 | | | 2012 | |
Net asset value at beginning of period | | $ | 11.77 | | | $ | 12.06 | | | $ | 13.08 | | | $ | 12.44 | | | $ | 10.53 | | | $ | 10.00 | |
| | | | | | | | | | | | | | | | | | | | | | | | |
Net investment income (loss) (a) | | | 0.12 | | | | 0.19 | | | | 0.21 | | | | 0.21 | | | | 0.18 | | | | 0.16 | |
Net realized and unrealized gain (loss) on investments | | | 0.85 | | | | 0.32 | | | | (0.17 | ) | | | 0.82 | | | | 1.90 | | | | 0.37 | |
Net realized and unrealized gain (loss) on foreign currency transactions | | | (0.00 | )‡ | | | 0.00 | ‡ | | | (0.00 | )‡ | | | (0.00 | )‡ | | | (0.00 | )‡ | | | (0.00 | )‡ |
| | | | | | | | | | | | | | | | | | | | | | | | |
Total from investment operations | | | 0.97 | | | | 0.51 | | | | 0.04 | | | | 1.03 | | | | 2.08 | | | | 0.53 | |
| Less dividends and distributions: | | | | | | | | | | | | | | | | | | | | | | | | |
From net investment income | | | — | | | | (0.20 | ) | | | (0.22 | ) | | | (0.16 | ) | | | (0.15 | ) | | | — | |
From net realized gain on investments | | | — | | | | (0.60 | ) | | | (0.84 | ) | | | (0.23 | ) | | | (0.02 | ) | | | — | |
| | | | | | | | | | | | | | | | | | | | | | | | |
Total dividends and distributions | | | — | | | | (0.80 | ) | | | (1.06 | ) | | | (0.39 | ) | | | (0.17 | ) | | | — | |
| | | | | | | | | | | | | | | | | | | | | | | | |
Net asset value at end of period | | $ | 12.74 | | | $ | 11.77 | | | $ | 12.06 | | | $ | 13.08 | | | $ | 12.44 | | | $ | 10.53 | |
| | | | | | | | | | | | | | | | | | | | | | | | |
Total investment return (b) | | | 8.24 | %(c) | | | 4.44 | % | | | 0.45 | % | | | 8.41 | % | | | 19.86 | % | | | 5.30 | %(c) |
| Ratios (to average net assets)/Supplemental Data: | | | | | | | | | | | | | | | | | | | | | | | | |
Net investment income (loss) | | | 1.89 | %†† | | | 1.62 | % | | | 1.60 | % | | | 1.61 | % | | | 1.52 | % | | | 1.77 | %†† |
Net expenses | | | 0.84 | %†† | | | 0.84 | % | | | 0.83 | % | | | 0.83 | % | | | 0.83 | % | | | 0.83 | %†† |
Expenses (before waiver/reimbursement) | | | 0.84 | %†† | | | 0.84 | % | | | 0.83 | % | | | 0.84 | % | | | 0.84 | % | | | 0.84 | %†† |
Portfolio turnover rate | | | 31 | % | | | 74 | % | | | 76 | % | | | 86 | % | | | 74 | % | | | 63 | % |
Net assets at end of period (in 000’s) | | $ | 664,042 | | | $ | 619,849 | | | $ | 591,626 | | | $ | 568,868 | | | $ | 512,495 | | | $ | 378,717 | |
| ‡ | Less than one cent per share. |
| (a) | Per share data based on average shares outstanding during the period. |
| (b) | Total return does not reflect any deduction of sales charges, mortality and expense charges, contract charges or administrative charges. For periods of less than one year, total return is not annualized. |
| (c) | Total investment return may reflect adjustments to conform to generally accepted accounting principles. |
| | | | | | |
The notes to the financial statements are an integral part of,
and should be read in conjunction with, the financial statements. | | | | | 29 | |
Notes to Financial Statements (Unaudited)
Note 1–Organization and Business
MainStay VP Funds Trust (the “Fund”) was organized as a Delaware statutory trust on February 1, 2011. The Fund is registered under the Investment Company (as amended (the “1940 Act”), as an open-end management investment company. The Fund is comprised of thirty-two separate series (collectively referred to as the “Portfolios”). These financial statements and notes relate to the MainStay VP Janus Henderson Balanced Portfolio (formerly known as MainStay VP Janus Balanced Portfolio) (the “Portfolio”), a “diversified” portfolio, as that term is defined in the 1940 Act, as interpreted or modified by regulatory authorities having jurisdiction, from time to time.
Shares of the Portfolio are currently offered to certain separate accounts to fund variable annuity policies and variable universal life insurance policies issued by New York Life Insurance and Annuity Corporation (“NYLIAC”), a wholly-owned subsidiary of New York Life Insurance Company (“New York Life”). NYLIAC allocates shares of the Portfolios to, among others, NYLIAC Variable Annuity Separate Accounts-I, II, III and IV, VUL Separate Account-I and CSVUL Separate Account-I (collectively, the “Separate Accounts”). Shares of the Portfolio are also offered to the MainStay VP Conservative Allocation Portfolio, MainStay VP Moderate Allocation Portfolio, MainStay VP Moderate Growth Allocation Portfolio and MainStay VP Growth Allocation Portfolio, which operate as “funds-of-funds.”
The Portfolio currently offers two classes of shares. Initial Class and Service Class shares commenced operations on February 17, 2012. Shares of the Portfolio are sold and are redeemed at a price equal to their respective net asset value (“NAV”) per share. No sales or redemption charge is applicable to the purchase or redemption of the Portfolio’s shares. Under the terms of the Fund’s multiple class plan adopted pursuant to Rule 18f-3 under the 1940 Act, the classes differ in that, among other things, Service Class shares of the Portfolio pay a combined distribution and service fee of 0.25% of average daily net assets to the Distributor (as defined in Note 3(B)) pursuant to a plan adopted in accordance with Rule 12b-1 under the 1940 Act. Contract owners of variable annuity contracts purchased after June 2, 2003, are permitted to invest only in the Service Class shares.
The Portfolio’s investment objective is to seek long-term capital growth, consistent with preservation of capital and balanced current income.
Note 2–Significant Accounting Policies
The Portfolio is an investment company and accordingly follows the investment company accounting and reporting guidance of the Financial Accounting Standards Board (“FASB”) Accounting Standard Codification Topic 946 Financial Services—Investment Companies. The Portfolio prepares its financial statements in accordance with generally accepted accounting principles (“GAAP”) in the United States of America and follows the significant accounting policies described below.
(A) Securities Valuation. Investments are usually valued as of the close of regular trading on the New York Stock Exchange (the “Exchange”) (usually 4:00 p.m. Eastern time) on each day the Portfolio is open for business (“valuation date”).
The Board of Trustees (the “Board”) of the Fund adopted procedures establishing methodologies for the valuation of the Portfolio’s securities
and other assets and delegated the responsibility for valuation determinations under those procedures to the Valuation Committee of the Fund (the “Valuation Committee”). The Board authorized the Valuation Committee to appoint a Valuation Sub-Committee (the “Sub-Committee”) to deal in the first instance with establishing the prices of securities for which market quotations are not readily available or the prices of which are not otherwise readily determinable under these procedures. The Sub-Committee meets (in person, via electronic mail or via teleconference) on an as-needed basis. Subsequently, the Valuation Committee meets to ensure that actions taken by the Sub-Committee were appropriate. The procedures recognize that, subject to the oversight of the Board and unless otherwise noted, the responsibility for the day-to-day valuation of portfolio assets (including fair value measurements for the Portfolio’s assets and liabilities) rests with New York Life Investment Management LLC (“New York Life Investments” or the “Manager”), aided to whatever extent necessary by the Subadvisor (as defined in Note 3(A)) to the Portfolio.
To assess the appropriateness of security valuations, the Manager, the Subadvisor or the Portfolio’s third party service provider, who is subject to oversight by the Manager, regularly compares prior day prices, prices on comparable securities and the sale prices to the prior and current day prices and challenges prices with changes exceeding certain tolerance levels with third party pricing services or broker sources. For those securities valued through either a standardized fair valuation methodology or a fair valuation measurement, the Sub-Committee deals in the first instance with such valuation and the Valuation Committee reviews and affirms, if appropriate, the reasonableness of the valuation based on such methodologies and measurements on a regular basis after considering all relevant information that is reasonably available. Any action taken by the Sub-Committee with respect to the valuation of a portfolio security or other asset is submitted by the Valuation Committee to the Board for its review and ratification, if appropriate, at its next regularly scheduled meeting.
“Fair value” is defined as the price the Portfolio would reasonably expect to receive upon selling an asset or liability in an orderly transaction to an independent buyer in the principal or most advantageous market for the asset or liability. Fair value measurements are determined within a framework that establishes a three-tier hierarchy which maximizes the use of observable market data and minimizes the use of unobservable inputs to establish a classification of fair value measurements for disclosure purposes. “Inputs” refer broadly to the assumptions that market participants would use in pricing the asset or liability, including assumptions about risk, such as the risk inherent in a particular valuation technique used to measure fair value using a pricing model and/or the risk inherent in the inputs for the valuation technique. Inputs may be observable or unobservable. Observable inputs reflect the assumptions market participants would use in pricing the asset or liability based on market data obtained from sources independent of the Portfolio. Unobservable inputs reflect the Portfolio’s own assumptions about the assumptions market participants would use in pricing the asset or liability based on the information available. The inputs or methodology used for valuing assets or liabilities may not be an indication of the risks associated with investing in those assets or liabilities. The three-tier hierarchy of inputs is summarized below.
| • | | Level 1—quoted prices in active markets for an identical asset or liability |
| | |
| 30 | | MainStay VP Janus Henderson Balanced Portfolio |
| • | | Level 2—other significant observable inputs (including quoted prices for a similar asset or liability in active markets, interest rates and yield curves, prepayment speeds, credit risk, etc.) |
| • | | Level 3—significant unobservable inputs (including the Portfolio’s own assumptions about the assumptions that market participants would use in measuring fair value of an asset or liability) |
The level of an asset or liability within the fair value hierarchy is based on the lowest level of an input, both individually and in the aggregate, that is significant to the fair value measurement. As of June 30, 2017, the aggregate value by input level of the Portfolio’s assets and liabilities is included at the end of the Portfolio’s Portfolio of Investments.
The Portfolio may use third party vendor evaluations, whose prices may be derived from one or more of the following standard inputs, among others:
| | |
• Benchmark yields | | • Reported trades |
• Broker/dealer quotes | | • Issuer spreads |
• Two-sided markets | | • Benchmark securities |
• Bids/offers | | • Reference data (corporate actions or material event notices) |
• Industry and economic events | | • Comparable bonds |
• Monthly payment information | | |
An asset or liability for which market values cannot be measured using the methodologies described above is valued by methods deemed reasonable in good faith by the Valuation Committee, following the procedures established by the Board, to represent fair value. Under these procedures, the Portfolio generally uses a market-based approach which may use related or comparable assets or liabilities, recent transactions, market multiples, book values, and other relevant information. The Portfolio may also use an income-based valuation approach in which the anticipated future cash flows of the asset or liability are discounted to calculate fair value. Discounts may also be applied due to the nature and/or duration of any restrictions on the disposition of the asset or liability. Fair value represents a good faith approximation of the value of a security. Fair value determinations involve the consideration of a number of subjective factors, an analysis of applicable facts and circumstances and the exercise of judgment. As a result, it is possible that the fair value for a security determined in good faith in accordance with the Portfolio’s valuation procedures may differ from valuations for the same security determined by other funds using their own valuation procedures. Although the Portfolio’s valuation procedures are designed to value a security at the price the Portfolio may reasonably expect to receive upon the security’s sale in an orderly transaction, there can be no assurance that any fair value determination thereunder would, in fact, approximate the amount that the Portfolio would actually realize upon the sale of the security or the price at which the security would trade if a reliable market price were readily available. During the six-month period ended June 30, 2017, there were no material changes to the fair value methodologies.
Securities which may be valued in this manner include, but are not limited to: (i) a security for which trading has been halted or suspended; (ii) a debt security that has recently gone into default and for which there is not a current market quotation; (iii) a security of an issuer that has entered into a restructuring; (iv) a security that has been de-listed
from a national exchange; (v) a security for which the market price is not readily available from a third party pricing source or, if so provided, does not, in the opinion of the Manager or Subadvisor reflect the security’s market value; (vi) a security subject to trading collars for which no or limited trading takes place; and (vii) a security whose principal market has been temporarily closed at a time when, under normal conditions, it would be open. Securities for which market quotations or observable inputs are not readily available are generally categorized as Level 3 in the hierarchy. As of June 30, 2017, there were no securities held by the Portfolio that were fair valued in such a manner.
Equity securities are valued at the last quoted sales prices as of the close of regular trading on the relevant exchange on each valuation date. Securities that are not traded on the valuation date are valued at the mean of the last quoted bid and ask prices. Prices are normally taken from the principal market in which each security trades. These securities are generally categorized as Level 1 in the hierarchy.
Debt securities (other than convertible and municipal bonds) are valued at the evaluated bid prices (evaluated mean prices in the case of convertible and municipal bonds) supplied by a pricing agent or brokers selected by the Manager, in consultation with the Subadvisor. Those values reflect broker/dealer supplied prices and electronic data processing techniques, if the evaluated bid or mean prices are deemed by the Manager, in consultation with the Subadvisor, to be representative of market values at the regular close of trading of the Exchange on each valuation date. Debt securities purchased on a delayed delivery basis are marked to market daily until settlement at the forward settlement date. Debt securities, including corporate bonds, U.S. government & federal agency bonds, municipal bonds, foreign bonds, convertible bonds, asset-backed securities and mortgage-backed securities are generally categorized as Level 2 in the hierarchy.
Loan assignments, participations and commitments are valued at the average of bid quotations obtained from the engaged independent pricing service and are generally categorized as Level 2 in the hierarchy. Certain loan assignments, participations and commitments may be valued by utilizing significant unobservable inputs obtained from the pricing service and are generally categorized as Level 3 in the hierarchy.
Temporary cash investments acquired in excess of 60 days to maturity at the time of purchase are valued using the latest bid prices or using valuations based on a matrix system (which considers such factors as security prices, yields, maturities, and ratings), both as furnished by independent pricing services. Other temporary cash investments which mature in 60 days or less at the time of purchase (“Short-Term Investments”) are valued using the amortized cost method of valuation, unless the use of such method would be inappropriate. The amortized cost method involves valuing a security at its cost on the date of purchase and thereafter assuming a constant amortization to maturity of the difference between such cost and the value on maturity date. Amortized cost approximates the current fair value of a security. Securities valued using the amortized cost method are not valued using quoted prices in an active market and are generally categorized as Level 2 in the hierarchy.
The information above is not intended to reflect an exhaustive list of the methodologies that may be used to value portfolio investments. The valuation procedures permit the use of a variety of valuation
Notes to Financial Statements (Unaudited) (continued)
methodologies in connection with valuing portfolio investments. The methodology used for a specific type of investment may vary based on the market data available or other considerations. The methodologies summarized above may not represent the specific means by which portfolio investments are valued on any particular business day.
A portfolio security or other asset may be determined to be illiquid under procedures approved by the Board. Illiquidity of a security might prevent the sale of such security at a time when the Manager or Subadvisor might wish to sell, and these securities could have the effect of decreasing the overall level of the Portfolio’s liquidity. Further, the lack of an established secondary market may make it more difficult to value illiquid securities, requiring the Portfolio to rely on judgments that may be somewhat subjective in measuring value, which could vary materially from the amount that the Portfolio could realize upon disposition. Difficulty in selling illiquid securities may result in a loss or may be costly to the Portfolio. Under the supervision of the Board, the Manager or Subadvisor determines the liquidity of the Portfolio’s investments; in doing so, the Manager or Subadvisor may consider various factors, including (i) the frequency of trades and quotations, (ii) the number of dealers and prospective purchasers, (iii) dealer undertakings to make a market, and (iv) the nature of the security and the market in which it trades (e.g., the time needed to dispose of the security, the method of soliciting offers and the mechanics of transfer). Illiquid securities are often valued in accordance with methods deemed by the Board in good faith to be reasonable and appropriate to accurately reflect their fair value. The liquidity of the Portfolio’s investments, as shown in the Portfolio of Investments and was determined as of June 30, 2017 and can change at any time in response to, among other relevant factors, market conditions or events or developments with respect to an individual issuer or instrument. As of June 30, 2017, securities deemed to be illiquid under procedures approved by the Board are shown in the Portfolio of Investments.
(B) Income Taxes. The Portfolio’s policy is to comply with the requirements of the Internal Revenue Code of 1986, as amended (the “Internal Revenue Code”), applicable to regulated investment companies and to distribute all of its taxable income to the shareholders of the Portfolio within the allowable time limits. Therefore, no federal, state and local income tax provisions are required.
Management evaluates the Portfolio’s tax positions to determine if the tax positions taken meet the minimum recognition threshold in connection with accounting for uncertainties in income tax positions taken or expected to be taken for the purposes of measuring and recognizing tax liabilities in the financial statements. Recognition of tax benefits of an uncertain tax position is permitted only to the extent the position is “more likely than not” to be sustained assuming examination by taxing authorities. Management has analyzed the Portfolio’s tax positions taken on federal, state and local income tax returns for all open tax years (for up to three tax years), and has concluded that no provisions for federal, state and local income tax are required in the Portfolio’s financial statements. The Portfolio’s federal, state and local income and federal excise tax returns for tax years for which the applicable statutes of limitations have not expired are subject to examination by the Internal Revenue Service and state and local departments of revenue.
(C) Dividends and Distributions to Shareholders. Dividends and distributions are recorded on the ex-dividend date. The Portfolio
intends to declare and pay dividends from net investment income and distributions from net realized capital and currency gains, if any, at least annually. Unless the shareholder elects otherwise, all dividends and distributions are reinvested in the same class of shares of the Portfolio, at NAV. Dividends and distributions to shareholders are determined in accordance with federal income tax regulations and may differ from GAAP.
(D) Security Transactions and Investment Income. The Portfolio records security transactions on the trade date. Realized gains and losses on security transactions are determined using the identified cost method. Dividend income is recognized on the ex-dividend date, net of any foreign tax withheld at the source, and interest income is accrued as earned using the effective interest rate method and includes any realized gains and losses from repayments of principal on mortgage-backed securities. Discounts and premiums on securities purchased, other than Short-Term Investments, for the Portfolio are accreted and amortized, respectively, on the effective interest rate method over the life of the respective securities. Discounts and premiums on Short-Term Investments are accreted and amortized, respectively, on the straight-line method. The straight-line method approximates the effective interest method for Short-Term Investments.
Investment income and realized and unrealized gains and losses on investments of the Portfolio are allocated pro rata to the separate classes of shares based upon their relative net assets on the date the income is earned or realized and unrealized gains and losses are incurred.
The Portfolio may place a debt security on non-accrual status and reduce related interest income by ceasing current accruals and writing off all or a portion of any interest receivables when the collection of all or a portion of such interest has become doubtful. A debt security is removed from non-accrual status when the issuer resumes interest payments or when collectability of interest is reasonably assured.
(E) Expenses. Expenses of the Fund are allocated to the individual Portfolios in proportion to the net assets of the respective Portfolios when the expenses are incurred, except where direct allocations of expenses can be made. Expenses (other than fees incurred under the distribution and service plans, further discussed in Note 3(B), which are charged directly to the Service Class shares) are allocated to separate classes of shares pro rata based upon their relative net assets on the date the expenses are incurred. The expenses borne by the Portfolio, including those of related parties to the Portfolio, are shown in the Statement of Operations.
(F) Use of Estimates. In preparing financial statements in conformity with GAAP, management makes estimates and assumptions that affect the reported amounts and disclosures in the financial statements. Actual results could differ from those estimates.
(G) Repurchase Agreements. The Portfolio may enter into repurchase agreements (i.e., buy a security from another party with the agreement that it be sold back in the future) to earn income. The Portfolio may enter into repurchase agreements only with counterparties, usually financial institutions, that are deemed by the Manager or Subadvisor to be creditworthy, pursuant to guidelines established by the Board. During the term of any repurchase agreement, the Manager or Subadvisor will continue to monitor the creditworthiness of the
| | |
| 32 | | MainStay VP Janus Henderson Balanced Portfolio |
counterparty. Under the 1940 Act, repurchase agreements are considered to be collateralized loans by the Portfolio to the counterparty secured by the securities transferred to the Portfolio.
Repurchase agreements are subject to counterparty risk, meaning the Portfolio could lose money by the counterparty’s failure to perform under the terms of the agreement. The Portfolio mitigates this risk by ensuring the repurchase agreement is collateralized by cash, U.S. government securities, fixed income securities and/or other securities. The collateral is held by the Portfolio’s custodian valued daily on a mark to market basis to determine if the value, including accrued interest, exceeds the repurchase price. In the event of the counterparty’s default on the obligation to repurchase, the Portfolio has the right to liquidate the collateral and apply the proceeds in satisfaction of the obligation. Under certain circumstances, such as in the event of default or bankruptcy by the counterparty, realization and/or retention of the collateral may be limited or subject to delay, to legal proceedings and possible realized loss to the Portfolio.
(H) Loan Assignments, Participations and Commitments. The Portfolio may invest in loan assignments and participations (“loans”). Commitments are agreements to make money available to a borrower in a specified amount, at a specified rate and within a specified time. The Portfolio records an investment when the borrower withdraws money on a commitment or when a funded loan is purchased (trade date) and records interest as earned. These loans pay interest at rates that are periodically reset by reference to a base lending rate plus a spread. These base lending rates are generally the prime rate offered by a designated U.S. bank or the London InterBank Offered Rate.
The loans in which the Portfolio may invest are generally readily marketable, but may be subject to some restrictions on resale. For example, the Portfolio may be contractually obligated to receive approval from the agent bank and/or borrower prior to the sale of these investments. If the Portfolio purchases an assignment from a lender, the Portfolio will generally have direct contractual rights against the borrower in favor of the lender. If the Portfolio purchases a participation interest either from a lender or a participant, the Portfolio typically will have established a direct contractual relationship with the seller of the participation interest, but not with the borrower. Consequently, the Portfolio is subject to the credit risk of the lender or participant who sold the participation interest to the Portfolio, in addition to the usual credit risk of the borrower. In the event that the borrower, selling participant or intermediate participants become insolvent or enters into bankruptcy, the Portfolio may incur certain costs and delays in realizing payment, or may suffer a loss of principal and/or interest.
Unfunded commitments represent the remaining obligation of the Portfolio to the borrower. At any point in time, up to the maturity date of the issue, the borrower may demand the unfunded portion. Unfunded amounts, if any, are marked to market and any unrealized gains or losses are recorded in the Statement of Assets and Liabilities. As of June 30, 2017, the Portfolio did not hold any unfunded commitments.
(I) Treasury Inflation-Protected Securities. The Portfolio invests in Treasury Inflation-Protected Securities (“TIPS”) which are specially structured bonds in which the principal amount is adjusted to keep pace with inflation. The inflation (deflation) adjustment is applied to
the principal of each bond on a monthly basis and is accounted for as interest income on the Statements of Operations. TIPS are subject to interest rate risk.
(J) Securities Lending. In order to realize additional income, the Portfolio may engage in securities lending, subject to the limitations set forth in the 1940 Act and relevant guidance by the staff of the Securities and Exchange Commission (“SEC”). In the event the Portfolio does engage in securities lending, the Portfolio will lend through its custodian, State Street Bank and Trust Company (“State Street”). State Street will manage the Portfolio’s collateral in accordance with the lending agreement between the Portfolio and State Street, and indemnify the Portfolio against counterparty risk. The loans will be collateralized by U.S. Treasury securities at least equal at all times to the market value of the securities loaned. The Portfolio may bear the risk of delay in recovery of, or loss of rights in, the securities loaned should the borrower of the securities experience financial difficulty. The Portfolio may also record a realized gain or loss on securities deemed sold due to a borrower’s inability to return securities on loan. The Portfolio bears the risk of any loss on investment of the collateral. The Portfolio will receive compensation for lending its securities in the form of fees or it will retain a portion of interest on the investment of any cash received as collateral. The Portfolio will also continue to receive interest and dividends on the securities loaned and any gain or loss in the market price of the securities loaned that may occur during the term of the loan will be for the account of the Portfolio. During the six-month period ended June 30, 2017, the Portfolio did not have any portfolio securities on loan.
(K) Securities Risk. The Portfolio may invest in high-yield debt securities (sometimes called “junk bonds”), which are generally considered speculative because they present a greater risk of loss, including default, than higher rated debt securities. These securities pay investors a premium—a higher interest rate or yield than investment grade debt securities—because of the increased risk of loss. These securities can also be subject to greater price volatility. In times of unusual or adverse market, economic or political conditions, these securities may experience higher than normal default rates.
The Portfolio may invest in foreign securities, which carry certain risks that are in addition to the usual risks inherent in domestic instruments. These risks include those resulting from currency fluctuations, future adverse political or economic developments and possible imposition of currency exchange blockages or other foreign governmental laws or restrictions. These risks are likely to be greater in emerging markets than in developed markets. The ability of issuers of debt securities held by the Portfolio to meet their obligations may be affected, among other things, by economic or political developments in a specific country, industry or region.
The Portfolio may invest in loans which are usually rated below investment grade and are generally considered speculative because they present a greater risk of loss, including default, than higher rated debt securities. These investments pay investors a higher interest rate than investment grade debt securities because of the increased risk of loss. Although certain loans are collateralized, there is no guarantee that the value of the collateral will be sufficient to repay the loan. In a recession or serious credit event, the value of these investments could decline significantly. As a result, the Portfolio’s NAVs could go down and you could lose money.
Notes to Financial Statements (Unaudited) (continued)
In addition, loans generally are subject to extended settlement periods that may be longer than seven days. As a result, the Portfolio may be adversely affected by selling other investments at an unfavorable time and/or under unfavorable conditions or engaging in borrowing transactions, such as borrowing against its credit facility, to raise cash to meet redemption obligations or pursue other investment opportunities.
(L) Indemnifications. Under the Fund’s organizational documents, its officers and trustees are indemnified against certain liabilities that may arise out of performance of their duties to the Fund. Additionally, in the normal course of business, the Portfolio enters into contracts with third-party service providers that contain a variety of representations and warranties and which may provide general indemnifications. The Portfolio’s maximum exposure under these arrangements is unknown, as this would involve future claims that may be made against the Portfolio that have not yet occurred. Based on experience, management is of the view that the risk of loss in connection with these potential indemnification obligations is remote. However, there can be no assurance that material liabilities related to such obligations will not arise in the future, which could adversely impact the Portfolio.
Note 3–Fees and Related Party Transactions
(A) Manager and Subadvisor. New York Life Investments, a registered investment adviser and an indirect, wholly-owned subsidiary of New York Life, serves as the Portfolio’s Manager pursuant to an Amended and Restated Management Agreement (“Management Agreement”). The Manager provides offices, conducts clerical, recordkeeping and bookkeeping services, and keeps most of the financial and accounting records required to be maintained by the Portfolio. Except for the portion of salaries and expenses that are the responsibility of the Portfolio, the Manager pays the salaries and expenses of all personnel affiliated with the Portfolio and certain operational expenses of the Portfolio. The Portfolio reimburses New York Life Investments in an amount equal to a portion of the compensation of the Chief Compliance Officer attributable to the Portfolio. Janus Capital Management LLC (“Janus”), a registered investment adviser and wholly owned subsidiary of Janus Henderson Group PLC, doing business as Janus Henderson Investors, (“Janus” or “Subadvisor”), serves as Subadvisor to the Portfolio and is responsible for the day-to-day portfolio management of the Portfolio. Pursuant to the terms of a Subadvisory Agreement (“Subadvisory Agreement”) between New York Life Investments and Janus, New York Life Investments pays for the services of the Subadvisor.
The Fund, on behalf of the Portfolio, pays New York Life Investments in its capacity as the Portfolio’s investment manager and administrator, pursuant to the Management Agreement, a monthly fee for the services performed and the facilities furnished at an annual percentage of the average daily net assets of 0.55%. New York Life Investments has contractually agreed to waive a portion of its management fee so that the management fee does not exceed 0.525% on assets in excess of $1 billion. This agreement will remain in effect until May 1, 2018, and shall renew automatically for one-year terms unless New York Life Investments provides written notice of termination prior to the start of the next term or upon approval of the Board. During the six-month period ended June 30, 2017, the effective management fee rate was 0.55%.
During the six-month period ended June 30, 2017, New York Life Investments earned fees from the Portfolio in the amount of $2,871,193 and waived fees/reimbursed expenses in the amount of $6,536.
State Street provides sub-administration and sub-accounting services to the Portfolio pursuant to an agreement with New York Life Investments. These services include calculating the daily NAVs of the Portfolio, maintaining the general ledger and sub-ledger accounts for the calculation of the Portfolio’s NAVs, and assisting New York Life Investments in conducting various aspects of the Portfolio’s administrative operations. For providing these services to the Portfolio, State Street is compensated by New York Life Investments.
(B) Distribution, Service and Shareholder Service Fees. The Fund, on behalf of the Portfolio, has entered into a distribution agreement with NYLIFE Distributors LLC (the “Distributor”), an indirect, wholly-owned subsidiary of New York Life. The Portfolio has adopted a distribution plan (the “Plan”) in accordance with the provisions of Rule 12b-1 under the 1940 Act. Under the Plan, the Distributor has agreed to provide, through its affiliates or independent third parties, various distribution-related, shareholder and administrative support services to the Service Class shareholders. For its services, the Distributor is entitled to a combined distribution and service fee accrued daily and paid monthly at an annual rate of 0.25% of the average daily net assets attributable to the Service Class shares of the Portfolio.
Note 4–Federal Income Tax
During the year ended December 31, 2016, the tax character of distributions paid as reflected in the Statement of Changes in Net Assets was as follows:
| | |
| 2016 |
Tax-Based
Distributions
from Ordinary
Income | | Tax-Based
Distributions
from Long-Term
Gains |
| $17,892,454 | | $49,309,919 |
Note 5–Custodian
State Street is the custodian of cash and securities held by the Portfolio. Custodial fees are charged to the Portfolio based on the Portfolio’s net assets and/or the market value of securities held by the Portfolio and the number of certain transactions incurred by the Portfolio.
Note 6–Line of Credit
The Portfolio and certain other funds managed by New York Life Investments, maintain a line of credit with a syndicate of banks in order to secure a source of funds for temporary purposes to meet unanticipated or excessive redemption requests.
Effective August 1, 2017, under the credit agreement (the “Credit Agreement”), the aggregate commitment amount is $600,000,000 with an additional uncommitted amount of $100,000,000. The commitment fee is an annual rate of 0.15% of the average commitment amount payable quarterly, regardless of usage, to State Street, who serves as the agent to the syndicate. The commitment fee is allocated among the Portfolio and certain other funds managed by New York Life Investments
| | |
| 34 | | MainStay VP Janus Henderson Balanced Portfolio |
based upon their respective net assets and other factors. Interest on any revolving credit loan is charged based upon the Federal Funds Rate or the one month LIBOR, whichever is higher. The Credit Agreement expires on July 31, 2018, although the Portfolio, certain other funds managed by New York Life Investments and the syndicate of banks may renew the Credit Agreement for an additional year on the same or different terms. Prior to August 1, 2017, the aggregate commitment amount was $600,000,000 with an additional uncommitted amount of $100,000,000, and the commitment fee, under a credit agreement for which Bank of New York Mellon served as agent, was at an annual rate of 0.15% of the average commitment amount. During the six-month period ended June 30, 2017, there were no borrowings made or outstanding with respect to the Portfolio under the credit agreement for which Bank of New York Mellon served as agent.
Note 7–Interfund Lending Program
Pursuant to an exemptive order issued by the SEC, the Portfolio, along with certain other funds managed by New York Life Investments, may participate in an interfund lending program. The interfund lending program provides an alternative credit facility that permits the Portfolio and certain other funds managed by New York Life Investments to lend or borrow money for temporary purposes directly to or from one another, subject to the conditions of the exemptive order. During the six-month period ended June 30, 2017, there were no interfund loans made or outstanding with respect to the Portfolio.
Note 8–Purchases and Sales of Securities (in 000’s)
During the six-month period ended June 30, 2017, purchases and sales of U.S. government securities were $173,166 and $126,411, respectively. Purchases and sales of securities, other than U.S. government securities and short-term securities, were $168,706 and $197,017, respectively.
Note 9–Capital Share Transactions
Transactions in capital shares for the six-month period ended June 30, 2017, and the year ended December 31, 2016, were as follows:
| | | | | | | | |
Initial Class | | Shares | | | Amount | |
Six-month period ended June 30, 2017: | | | | | | | | |
Shares sold | | | 310,163 | | | $ | 3,862,216 | |
Shares redeemed | | | (2,631,232 | ) | | | (32,708,620 | ) |
| | | | |
Net increase (decrease) | | | (2,321,069 | ) | | $ | (28,846,404 | ) |
| | | | |
Year ended December 31, 2016: | | | | | | | | |
Shares sold | | | 806,070 | | | $ | 9,618,754 | |
Shares issued to shareholders in reinvestment of dividends and distributions | | | 2,354,942 | | | | 27,056,872 | |
Shares redeemed | | | (4,714,821 | ) | | | (56,140,523 | ) |
| | | | |
Net increase (decrease) | | | (1,553,809 | ) | | $ | (19,464,897 | ) |
| | | | |
| | |
| | | | | | | | |
| | | | | | | | |
Service Class | | Shares | | | Amount | |
Six-month period ended June 30, 2017: | | | | | | | | |
Shares sold | | | 3,388,494 | | | $ | 42,064,519 | |
Shares redeemed | | | (3,909,214 | ) | | | (48,270,759 | ) |
| | | | |
Net increase (decrease) | | | (520,720 | ) | | $ | (6,206,240 | ) |
| | | | |
Year ended December 31, 2016: | | | | | | | | |
Shares sold | | | 6,981,875 | | | $ | 82,431,502 | |
Shares issued to shareholders in reinvestment of dividends and distributions | | | 3,507,761 | | | | 40,145,501 | |
Shares redeemed | | | (6,892,031 | ) | | | (81,642,495 | ) |
| | | | |
Net increase (decrease) | | | 3,597,605 | | | $ | 40,934,508 | |
| | | | |
Note 10–Recent Accounting Pronouncement
In October 2016, the SEC adopted new rules and amended existing rules (together, “final rules”) intended to modernize the reporting and disclosure of information by registered investment companies. In part, the final rules amend Regulation S-X and require standardized, enhanced disclosure about derivatives in investment company financial statements, as well as other amendments. The compliance date for the amendments to Regulation S-X is August 1, 2017 and applies to shareholder reports for funds with fiscal periods ending after August 1, 2017. Management is currently evaluating the impact that the adoption of the amendments to Regulation S-X will have on the Portfolio’s financial statements and related disclosures.
Note 11–Subsequent Events
In connection with the preparation of the financial statements of the Portfolio as of and for the six-month period ended June 30, 2017, events and transactions subsequent to June 30, 2017, through the date the financial statements were issued have been evaluated by the Portfolio’s management for possible adjustment and/or disclosure. No subsequent events requiring financial statement adjustment or disclosure have been identified.
Board Consideration and Approval of Subadvisory Agreement (Unaudited)
Section 15(c) of the Investment Company Act of 1940, as amended (the “1940 Act”), requires that each mutual fund’s board of trustees, including a majority of the independent trustees, review and approve the fund’s investment advisory agreements. At its March 21, 2017 meeting, the Board of Trustees of the MainStay Group of Funds (“Board”) unanimously approved the continued retention of Janus Capital Management, LLC (“Janus”) as Subadviser to the MainStay VP Janus Henderson Balanced Portfolio (formerly MainStay Janus Balanced Portfolio) (“Portfolio”), pursuant to the terms of the Subadvisory Agreement between New York Life Investment Management LLC (“New York Life Investments”) and Janus with respect to the Portfolio.
The previous subadvisory agreement between New York Life Investments and Janus with respect to the Portfolio automatically terminated, as required by the 1940 Act, as a result of the merger of the ultimate parent of Janus and Henderson Group plc, which was deemed to constitute a change of control of Janus. Under the terms of an exemptive order issued by the Securities and Exchange Commission, New York Life Investments, on behalf of the Portfolio and subject to the approval of the Board, is permitted to retain, and materially amend subadvisory agreements with, unaffiliated and certain affiliated subadvisors without shareholder approval. This authority is subject to certain conditions.
In reaching its decision to approve the continued retention of Janus and the Subadvisory Agreement, the Board considered information furnished by New York Life Investments and Janus specifically in connection with the Board’s consideration of the Subadvisory Agreement, as well as other relevant information furnished to it by New York Life Investments and Janus throughout the year. The Board requested and received responses from Janus to a comprehensive list of questions encompassing a variety of topics prepared on behalf of the Board by independent legal counsel to the Board. In addition, the Board considered its historical experience with Janus and knowledge of Janus’s capabilities and resources, including in connection with its prior contract review process and approval of the previous subadvisory agreement between New York Life Investments and Janus, on behalf of the Portfolio (the “Prior Contract Review Process”). In addition, the Board considered representations from New York Life Investments and Janus that the change of control of Janus is not expected to have a material impact on the nature and quality of services provided by Janus, and that Janus Henderson Investors, now the ultimate parent company of Janus, had agreed to pay all of the Portfolio’s expenses incurred as a result of the change of control of Janus.
In determining to approve the continued retention of Janus and the Subadvisory Agreement, the Trustees comprehensively reviewed and evaluated all of the information and factors they believed to be relevant and appropriate in light of legal advice furnished to them by independent legal counsel and through the exercise of their own business judgment. The broad factors considered by the Board are described in greater detail below and included, among other factors: (i) the nature, extent and quality of the services to be provided to the Portfolio by Janus; (ii) the investment performance of the Portfolio and Janus’s investment performance track record; (iii) the costs of the services to be provided and the profits to be realized by Janus and its affiliates from its relationship with the Portfolio; (iv) the extent to which economies of scale may be realized if the Portfolio grows, and the extent to which economies of scale may benefit the Portfolio’s
shareholders; and (v) the reasonableness of the Portfolio’s subadvisory fees and overall total ordinary operating expenses, particularly as compared to any similar funds and accounts managed by New York Life Investments and Janus.
Although individual Trustees may have weighed certain factors or information differently, the Board’s decision to approve the continued retention of Janus and the Subadvisory Agreement was based on a comprehensive consideration of the information provided to the Board throughout the year and during the Prior Contract Review Process, as well as information provided to the Board specifically in connection with its review of the Subadvisory Agreement. The Board’s conclusion with respect to the Subadvisory Agreement may have been based, in part, on the Board’s knowledge of Janus resulting from, among other things, the Board’s consideration of the MainStay Group of Funds’ subadvisory agreements in prior years, particularly the Subadvisory Agreement with respect to the Portfolio. The Board also considered that shareholders of the Portfolio approved the ability of New York Life Investments to act as a “manager of managers,” which allows the Board and New York Life Investments to retain unaffiliated and certain affiliated subadvisers for the Portfolio without the approval of Portfolio shareholders. A more detailed discussion of the factors that figured prominently in the Board’s decision to approve the continued retention of Janus and the Subadvisory Agreement is summarized in more detail below.
Nature, Extent and Quality of Services to Be Provided by Janus
In considering the approval of the continued retention of Janus and the Subadvisory Agreement, the Board examined the nature, extent and quality of the services that Janus historically had provided to the Portfolio. Based on information provided to the Board in connection with the Prior Contract Review Process, the Board acknowledged Janus’s historical service to the Portfolio and took note of the experience of Janus’s portfolio managers, the number of accounts managed by the portfolio managers and Janus’s method for compensating portfolio managers. The Board considered Janus’s continued willingness to invest in personnel and other resources designed to benefit the Portfolio. The Board also considered the experience of senior management and administrative personnel of Janus, and Janus’s overall legal and compliance environment. Based on these considerations, the Board concluded, within the context of its overall determinations regarding the Subadvisory Agreement, that the Portfolio likely would continue to benefit from the nature, extent and quality of these services as a result of Janus’s experience, personnel, operations and resources.
Investment Performance
In evaluating the Portfolio’s investment performance, the Board considered the Portfolio’s historical investment performance results, as presented to the Board in connection with the Prior Contract Review Process, in light of the Portfolio’s investment objective, strategies and risks, as disclosed in the Portfolio’s prospectus. The Board particularly considered detailed investment reports on the Portfolio’s performance provided to the Board throughout the year. The Board also considered information provided to the Board showing the investment performance of the Portfolio as compared to peer funds. In addition, the Board considered the strength of Janus’s resources (including research
| | |
| 36 | | MainStay VP Janus Henderson Balanced Portfolio |
capabilities). Based on these considerations, the Board concluded, within the context of its overall determinations regarding the Subadvisory Agreement, that the continued retention of Janus as Subadviser to the Portfolio is likely to benefit the Portfolio’s long-term investment performance.
Costs of the Services to be Provided, and Profits to be Realized, by Janus
Because Janus’s subadvisory fees are negotiated at arm’s-length by New York Life Investments and are paid by New York Life Investments, not the Portfolio, the Board primarily considered the profits realized by New York Life Investments and its affiliates with respect to the Portfolio. In evaluating any costs and profits of Janus from its relationship with the Portfolio in connection with the Prior Contract Review Process, the Board considered, among other factors, Janus’s investments in personnel, systems, equipment and other resources necessary to manage the Portfolio, and that New York Life Investments is responsible for paying the subadvisory fees for the Portfolio. The Board acknowledged that Janus must be in a position to pay and retain experienced professional personnel to provide services to the Portfolio, and that Janus’s ability to maintain a strong financial position is important in order for Janus to continue to provide high-quality services to the Portfolio and its shareholders.
In considering costs and profitability, the Board also considered certain fall-out benefits that may be realized by Janus from its relationship with the Portfolio. The Board recognized, for example, the benefits to Janus from legally permitted “soft-dollar” arrangements by which brokers may provide research and other services to Janus in exchange for commissions paid by the Portfolio with respect to trades in the Portfolio’s securities.
After evaluating the information presented to the Board, the Board concluded, within the context of its overall determinations regarding the Subadvisory Agreement, that any profits realized by Janus from its relationship with the Portfolio supported the Board’s decision to approve the Subadvisory Agreement. The Board also concluded that any profits realized by Janus from its relationship with the Portfolio are the result of arm’s-length negotiations between New York Life Investments and Janus, and are based on subadvisory fees paid to Janus by New York Life Investments, not the Portfolio.
Extent to Which Economies of Scale May Be Realized if the Portfolio Grows
The Board also considered whether the Portfolio’s expense structure permitted economies of scale to be shared with the Portfolio’s shareholders, taking into account information provided to the Board in connection with the Prior Contract Review Process. Based on this information, the Board concluded, within the context of its overall determinations regarding the Subadvisory Agreement, that the Portfolio’s expense structure appropriately reflects economies of scale for the benefit of Portfolio investors. The Board noted, however, that it would continue to evaluate the reasonableness of the Portfolio’s expense structure if the Portfolio continues to grow over time.
Reasonableness of Subadvisory Fees and Total Annual Operating Expenses
The Board evaluated the reasonableness of the fees to be paid under the Subadvisory Agreement, and the Portfolio’s expected total ordinary operating expenses, taking into account information provided to the Board in connection with the Prior Contract Review Process. The Board considered that the fees to be paid to Janus under the Subadvisory Agreement are paid by New York Life Investments, not the Portfolio, and will result in no increase in the Portfolio’s expenses.
After considering all of the factors outlined above, the Board concluded, within the context of the Board’s overall conclusions regarding the Subadvisory Agreement, that the Portfolio’s subadvisory fees and total ordinary operating expenses were within a range that is competitive. Additionally, the Board determined that, within the context of the Board’s overall conclusions regarding the Subadvisory Agreement, the factors outlined above support a conclusion that these fees and expenses are reasonable.
Conclusion
On the basis of the information and factors summarized above and the evaluation thereof, the Board, as a whole, including the Independent Trustees who are not parties to the Subadvisory Agreement or “interested persons” of any such party voting separately, unanimously voted to approve the Subadvisory Agreement.
Proxy Voting Policies and Procedures and Proxy Voting Record
A description of the policies and procedures that New York Life Investments uses to vote proxies related to the Portfolio’s securities is available without charge, upon request, (i) by calling 800-598-2019 or (ii) by visiting the SEC’s website at www.sec.gov.
The Portfolio is required to file with the SEC its proxy voting record for the 12-month period ending June 30 on Form N-PX. The Portfolio’s most recent Form N-PX or proxy voting record is available free of charge upon request (i) by calling 800-598-2019 or; (ii) by visiting the SEC’s website at www.sec.gov.
Shareholder Reports and Quarterly Portfolio Disclosure
The Portfolio is required to file its complete schedule of portfolio holdings with the SEC for its first and third fiscal quarters on Form N-Q. The Portfolio’s Form N-Q is available without charge on the SEC’s website at www.sec.gov or by calling MainStay Investments at 800-598-2019. You also can obtain and review copies of Form N-Q by visiting the SEC’s Public Reference Room in Washington, DC (information on the operation of the Public Reference Room may be obtained by calling 1-800-SEC-0330).
| | |
| 38 | | MainStay VP Janus Henderson Balanced Portfolio |
MainStay VP Portfolios
MainStay VP offers a wide range of Portfolios. The full array of MainStay VP offerings is listed here, with information about the manager, subadvisors, legal counsel, and independent registered public accounting firm.
Equity Portfolios
MainStay VP Common Stock Portfolio
MainStay VP Cornerstone Growth Portfolio
MainStay VP Eagle Small Cap Growth Portfolio
MainStay VP Emerging Markets Equity Portfolio
MainStay VP Epoch U.S. Equity Yield Portfolio
MainStay VP Epoch U.S. Small Cap Portfolio
MainStay VP International Equity Portfolio
MainStay VP Large Cap Growth Portfolio
MainStay VP MFS® Utilities Portfolio
MainStay VP Mid Cap Core Portfolio
MainStay VP S&P 500 Index Portfolio
MainStay VP Small Cap Core Portfolio
MainStay VP T. Rowe Price Equity Income Portfolio
MainStay VP VanEck Global Hard Assets Portfolio
Mixed Asset Portfolios
MainStay VP Balanced Portfolio
MainStay VP Convertible Portfolio
MainStay VP Cushing Renaissance Advantage Portfolio
MainStay VP Income Builder Portfolio
MainStay VP Janus Henderson Balanced Portfolio
Income Portfolios
MainStay VP Bond Portfolio
MainStay VP Floating Rate Portfolio
MainStay VP Government Portfolio
MainStay VP High Yield Corporate Bond Portfolio
MainStay VP Indexed Bond Portfolio
MainStay VP PIMCO Real Return Portfolio
MainStay VP Unconstrained Bond Portfolio
Money Market
MainStay VP U.S. Government Money Market Portfolio
Alternative
MainStay VP Absolute Return Multi-Strategy Portfolio
Asset Allocation Portfolios
MainStay VP Conservative Allocation Portfolio
MainStay VP Growth Allocation Portfolio
MainStay VP Moderate Allocation Portfolio
MainStay VP Moderate Growth Allocation Portfolio
Manager
New York Life Investment Management LLC
New York, New York
Subadvisors
Candriam Belgium*
Brussels, Belgium
Candriam France S.A.S.*
Paris, France
Cornerstone Capital Management Holdings LLC*
New York, New York
Cushing Asset Management, LP
Dallas, Texas
Eagle Asset Management, Inc.
St Petersburg, Florida
Epoch Investment Partners, Inc.
New York, New York
Janus Capital Management LLC
Denver, Colorado
MacKay Shields LLC*
New York, New York
Massachusetts Financial Services Company
Boston, Massachusetts
NYL Investors LLC*
New York, New York
Pacific Investment Management Company LLC
Newport Beach, California
T. Rowe Price Associates, Inc.
Baltimore, Maryland
Van Eck Associates Corporation
New York, New York
Winslow Capital Management, LLC
Minneapolis, Minnesota
Distributor
NYLIFE Distributors LLC*
Jersey City, New Jersey
Custodian
State Street Bank and Trust Company
Boston, Massachusetts
Independent Registered Public Accounting Firm
PricewaterhouseCoopers LLP
New York, New York
Legal Counsel
Dechert LLP
Washington, District of Columbia
Some Portfolios may not be available in all products.
* An affiliate of New York Life Investment Management LLC
Not part of the Semiannual Report
2017 Semiannual Report
This report is for the general information of New York Life Variable Annuities and NYLIAC Variable Universal Life Insurance Products policyowners. It must be preceded or accompanied by the appropriate product(s) and funds prospectuses if it is given to anyone who is not an owner of a New York Life variable annuity policy or a NYLIAC Variable Universal Life Insurance Product. This report does not offer for sale or solicit orders to purchase securities.
The performance data quoted in this report represents past performance. Past performance is no guarantee of future results. Due to market volatility and other factors, current performance may be lower or higher than the figures shown. The most recent month-end performance summary for your variable annuity or variable life policy is available by calling 800-598-2019 and is updated periodically on www.newyorklife.com.
The New York Life Variable Annuities and NYLIAC Variable Universal Life Insurance Products are issued by New York Life Insurance and Annuity Corporation (a Delaware Corporation) and distributed by NYLIFE Distributors LLC (Member FINRA/SIPC).
New York Life Insurance Company
New York Life Insurance and Annuity Corporation (NYLIAC) (A Delaware Corporation)
51 Madison Avenue, Room 551
New York, NY 10010
www.newyorklife.com
Printed on recycled paper
mainstayinvestments.com
NYLIFE Distributors LLC, 30 Hudson Street, Jersey City, NJ 07302
New York Life Investment Management LLC is the investment manager to the MainStay VP Funds Trust
©2017 by NYLIFE Distributors LLC. All rights reserved.
You may obtain copies of the Prospectus and the Statement of Additional Information free of charge, upon request, by calling toll-free 800-598-2019 or writing to New York Life Insurance and Annuity Corporation, 51 Madison Avenue, New York, NY 10010.
| | | | |
| Not FDIC Insured | | No Bank Guarantee | | May Lose Value |
| | | | |
| 1743291 | | | | MSVPJB10-08/17 (NYLIAC) NI524 |
MainStay VP MFS® Utilities Portfolio
Message from the President and Semiannual Report
Unaudited | June 30, 2017

Sign up for electronic delivery of your shareholder reports. For full details on electronic delivery, including who can participate and what you
can receive via eDelivery, please log on to www.newyorklife.com/vsc

This page intentionally left blank
Message from the President
The six months ended June 30, 2017, brought positive results to many stock and bond investors. The year began with many investors hoping that Republican control of the White House, the Senate and the House of Representatives could bring an end to political gridlock; and while debate has continued on a number of issues, the U.S. stock market climbed relatively steadily throughout the first half of 2017.
According to FTSE-Russell U.S. market data, stocks at all capitalization levels tended to record positive total returns during the reporting period, with large-cap stocks generally outperforming stocks of smaller-capitalization companies. Growth stocks outpaced value stocks at every capitalization level by substantial margins—from more than six percentage points for micro-caps and mid-caps to more than 10 percentage points for the largest 200 U.S. companies by market capitalization.
Most sectors of the stock market advanced during the reporting period, with energy and telecommunication services being notable exceptions. Energy stocks declined as oil prices fell despite moves by the Organization of Petroleum Exporting Countries (OPEC) intended to limit oil production by its members. Telecommunication services stocks tended to decline as competition increased and rising interest rates made dividend payouts less appealing.
In March and June of 2017, the Federal Reserve announced successive increases in the target range for the federal funds rate, ultimately bringing the federal funds target range to 1.00% to 1.25%. While short-term U.S. Treasury yields rose in response, yields for U.S. Treasury securities with maturities of five years or longer declined. As the difference between short- and long-term yields narrowed, the advantages of higher-yielding long-term bonds became increasingly apparent.
Virtually all taxable and tax-exempt bond sectors provided positive total returns during the reporting period. Mortgage-backed
securities, though providing positive total returns, faced headwinds when the Federal Reserve announced plans to begin normalizing its balance sheet by reducing reinvestment of principal payments on mortgage-backed securities.
International stock and bond markets were also strong during the reporting period. International stocks provided double-digit total returns that were surpassed by emerging-market stocks as a whole. Global investment-grade bonds provided single-digit returns; and emerging-market debt was somewhat stronger.
Even during periods of favorable market performance and generally positive returns, MainStay believes that it is important to carefully monitor your investments. Your risk tolerance may
change over time, leading you to reevaluate which MainStay VP Portfolios are most appropriate for your long-term goals. Your goals themselves may also change, leading you to pursue investments with more or less risk. The portfolio managers of MainStay VP Portfolios seek to provide results consistent with the investment objectives of their respective Portfolios, to give you a wide range of choices suitable to various investment needs.
The report that follows provides more detailed information about the specific markets, securities and investment decisions that influenced your MainStay VP Portfolio during the six months ended June 30, 2017. We invite you to review the report carefully as part of your ongoing investment evaluation and review.
Sincerely,

Stephen P. Fisher
President
The opinions expressed are as of the date of the accompanying report and are subject to change. Past performance is no guarantee of future results. There is no guarantee that any forecasts made will come to pass. This material does not constitute investment advice and is not intended as an endorsement of any specific investment.
Not all MainStay VP Portfolios and/or share classes are available under all policies.
Not part of the Semiannual Report
Table of Contents
Investors should refer to the Portfolio’s Summary Prospectus and/or Prospectus and consider the Portfolio’s investment objectives, strategies, risks, charges and expenses carefully before investing. The Summary Prospectus and/or Prospectus contain this and other information about the Portfolio. You may obtain copies of the Portfolio’s Summary Prospectus and/or the Prospectus and the Statement of Additional Information free of charge, upon request, by calling toll-free 800-598-2019, by writing to New York Life Insurance and Annuity Corporation, 51 Madison Avenue, Room 251, New York, New York 10010 or by sending an email to MainStayShareholdersServices@nylim.com. These documents are also available at mainstayinvestments.com/vpdocuments. Please read the Summary Prospectus and/or Prospectus carefully before investing. MainStay VP Funds Trust portfolios are separate account options which are purchased through a variable insurance or variable annuity contract.
Investment and Performance Comparison (Unaudited)
Performance data quoted represents past performance. Past performance is no guarantee of future results. Because of market volatility and other factors, current performance may be lower or higher than the figures shown. Investment return and principal value will fluctuate, and as a result, when shares are redeemed, they may be worth more or less than their original cost. The performance table and graph do not reflect any deduction of sales charges, mortality and expense charges, contract charges or administrative charges. Please refer to the Performance Summary appropriate for your policy. For performance information current to the most recent month-end, please call 800-598-2019 or visit www.newyorklife.com.
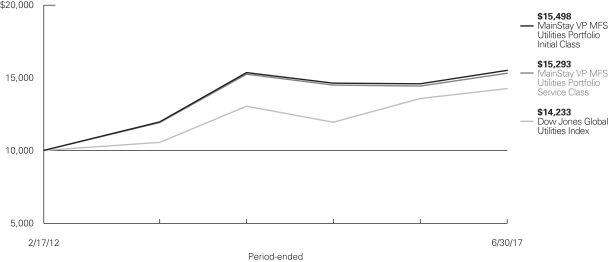
Average Annual Total Returns for the Period Ended June 30, 2017
| | | | | | | | | | | | | | | | | | | | | | | | |
| Class | | Inception
Date | | | Six Months | | | One Year | | | Five Years | | | Ten Years
or Since
Inception | | | Gross
Expense
Ratio1 | |
| Initial Class Shares | | | 2/17/2012 | | | | 9.94 | % | | | 6.32 | % | | | 9.00 | % | | | 8.50 | % | | | 0.77 | % |
| Service Class Shares | | | 2/17/2012 | | | | 9.82 | | | | 6.07 | | | | 8.73 | | | | 8.23 | | | | 1.02 | |
| | | | | | | | | | | | | | | | |
| Benchmark Performance | | Six
Months | | | One
Year | | | Five
Years | | | Ten Years
or Since
Inception | |
Dow Jones Global Utilities Index2 | | | 11.12 | % | | | 5.07 | % | | | 7.39 | % | | | 6.80 | % |
Average Lipper Variable Products Utility Portfolio3 | | | 10.20 | | | | 4.68 | | | | 9.00 | | | | 8.99 | |
| 1. | The gross expense ratios presented reflect the Portfolio’s “Total Annual Portfolio Operating Expenses” from the most recent Prospectus and may differ from other expense ratios disclosed in this report. |
| 2. | The Dow Jones Global Utilities Index is the Portfolio’s primary broad-based securities market index for comparison purposes. The Dow Jones Global Utilities Index is a free-float market-capitalization-weighted index that measures the performance of utility companies in developed and emerging markets. Results assume reinvestment of all dividends and capital gains. An investment cannot be made directly in an index. |
| 3. | The Average Lipper Variable Products Utility Portfolio is representative of portfolios that invest primarily in the equity securities of domestic and foreign companies providing utilities. This benchmark is a product of Lipper Inc. Lipper Inc. is an independent monitor of fund performance. Results are based on average total returns of similar portfolios with all dividend and capital gain distributions reinvested. |
Cost in Dollars of a $1,000 Investment in MainStay VP MFS® Utilities Portfolio (Unaudited)
The example below is intended to describe the fees and expenses borne by shareholders during the six-month period from January 1, 2017 to June 30, 2017, and the impact of those costs on your investment.
Example
As a shareholder of the Portfolio, you incur two types of costs: (1) transaction costs, including exchange fees and sales charges (loads) on purchases (as applicable), and (2) ongoing costs, including management fees, distribution and/or service (12b-1) fees, and other Portfolio expenses (as applicable). This example is intended to help you understand your ongoing costs (in dollars) of investing in the Portfolio and to compare these costs with the ongoing costs of investing in other mutual funds. The example is based on an investment of $1,000 made at the beginning of the six-month period and held for the entire period from January 1, 2017 to June 30, 2017. Shares are only sold in connection with variable life and annuity contracts and the example does not reflect any contract level or transactional fees or expenses. If these costs had been included, your costs would have been higher.
This example illustrates your Portfolio’s ongoing costs in two ways:
Actual Expenses
The second and third data columns in the table below provide information about actual account values and actual expenses. You may use the information in these columns, together with the amount you invested, to estimate the expenses that you paid during the six months
ended June 30, 2017. Simply divide your account value by $1,000
(for example, an $8,600 account value divided by $1,000 = 8.6), then multiply the result by the number under the heading entitled “Expenses Paid During Period” to estimate the expenses you paid on your account during this period.
Hypothetical Example for Comparison Purposes
The fourth and fifth data columns in the table below provide information about hypothetical account values and hypothetical expenses based on the Portfolio’s actual expense ratio and an assumed rate of return of 5% per year before expenses, which is not the Portfolio’s actual return. The hypothetical account values and expenses may not be used to estimate the actual ending account balances or expenses you paid for the six-month period shown. You may use this information to compare the ongoing costs of investing in the Portfolio with the ongoing costs of investing in other mutual funds. To do so, compare this 5% hypothetical example with the 5% hypothetical examples that appear in the shareholder reports of the other mutual funds.
Please note that the expenses shown in the table are meant to highlight your ongoing costs only and do not reflect any transactional costs, such as exchange fees or sales charges (loads). Therefore, the fourth and fifth data columns of the table are useful in comparing ongoing costs only and will not help you determine the relative total costs of owning different funds. In addition, if these transactional costs were included, your costs would have been higher.
| | | | | | | | | | | | | | | | | | | | | | |
| | | | | | | | | | | | | | | | | | |
| Share Class | | Beginning
Account
Value
1/1/17 | | | Ending Account
Value (Based
on Actual
Returns and
Expenses)
6/30/17 | | | Expenses
Paid
During
Period1 | | | Ending Account
Value (Based
on Hypothetical
5% Annualized
Return and
Actual Expenses)
6/30/17 | | | Expenses
Paid
During
Period1 | | | Net Expense
Ratio
During
Period2 |
| | | | | | |
| Initial Class Shares | | $ | 1,000.00 | | | $ | 1,099.40 | | | $ | 4.01 | | | $ | 1,021.00 | | | $ | 3.86 | | | 0.77% |
| | | | | | |
| Service Class Shares | | $ | 1,000.00 | | | $ | 1,098.20 | | | $ | 5.31 | | | $ | 1,019.70 | | | $ | 5.11 | | | 1.02% |
| 1. | Expenses are equal to the Portfolio’s annualized expense ratio of each class multiplied by the average account value over the period, divided by 365 and multiplied by 181 (to reflect the six-month period). The table above represents the actual expenses incurred during the six-month period. |
| 2. | Expenses are equal to the Portfolio’s annualized expense ratio to reflect the six-month period. |
| | |
| 6 | | MainStay VP MFS® Utilities Portfolio |
Country Composition as of June 30, 2017 (Unaudited)
| | | | |
| United States | | | 68.1 | % |
| Spain | | | 6.4 | |
| Canada | | | 3.6 | |
| Italy | | | 3.2 | |
| Sweden | | | 2.5 | |
| Portugal | | | 2.1 | |
| United Kingdom | | | 2.1 | |
| Brazil | | | 1.6 | |
| France | | | 1.6 | |
| China | | | 1.4 | |
| Germany | | | 1.1 | |
| Netherlands | | | 1.1 | |
| Greece | | | 0.8 | |
| | | | |
| Denmark | | | 0.7 | % |
| Japan | | | 0.7 | |
| Russia | | | 0.7 | |
| Thailand | | | 0.7 | |
| Indonesia | | | 0.5 | |
| Mexico | | | 0.5 | |
| Israel | | | 0.4 | |
| India | | | 0.2 | |
| New Zealand | | | 0.2 | |
| Luxembourg | | | 0.1 | |
| Other Assets, Less Liabilities | | | (0.3 | ) |
| | | | |
| | | 100.0 | % |
| | | | |
Portfolio Composition as of June 30, 2017 (Unaudited)
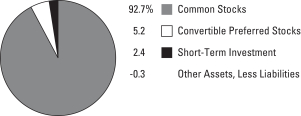
See Portfolio of Investments beginning on page 10 for specific holdings within these categories.
Top Ten Holdings as of June 30, 2017 (excluding short-term investment) (Unaudited)
| 10. | American Electric Power Co., Inc. |
Portfolio Management Discussion and Analysis (Unaudited)
Answers to the questions reflect the views of portfolio managers Maura A. Shaughnessy, CFA, and Claud P. Davis, CFA, CPA, of Massachusetts Financial Services Company (“MFS”), the Portfolio’s Subadvisor.
How did MainStay VP MFS® Utilities Portfolio perform relative to its benchmark and peers during the six months ended June 30, 2017?
For the six months ended June 30, 2017, MainStay VP MFS® Utilities Portfolio returned 9.94% for Initial Class shares and 9.82% for Service Class shares. Over the same period, both share classes underperformed the 11.12% return of the Dow Jones Global Utilities Index,1 which is the Portfolio’s benchmark, and the 10.20% return of the Average Lipper2 Variable Products Utility Portfolio.
What factors affected the Portfolio’s relative performance during the reporting period?
In general, having less foreign exposure than the benchmark and more exposure outside of traditional utilities (electric power) hurt the Portfolio’s performance relative to the Dow Jones Global Utilities Index. These negatives were partially offset by stock selection and weightings in select industries.
During the reporting period, how was the Portfolio’s performance materially affected by investments in derivatives?
The Portfolio’s hedging strategy, which uses foreign currency forward contracts, detracted from relative performance during the reporting period.
Which industries were the strongest positive contributors to the Portfolio’s relative performance, and which industries were particularly weak?
During the reporting period, the weakest contributors to the Portfolio’s performance relative to the Dow Jones Global Utilities Index included an overweight position and stock selection in natural gas pipeline and stock selection in energy—independent. (Contributions take weightings and total returns into account.) These positions provided negative total returns. The Portfolio’s small cash position also detracted from relative performance. The strongest positive contributors to the Portfolio’s relative performance during the reporting period included stock selection in electric power, an overweight position in wireless communications and an overweight position in cable TV.
During the reporting period, which individual stocks made the strongest positive contributions to the Portfolio’s absolute performance and which stocks detracted the most?
The stocks that made the strongest positive contributions to the Portfolio’s absolute performance included Swedish tele-
communication services company Com Hem, Portuguese renewable energy company EDP Renovaveis and U.S. power generation company NRG Corp. The price of Com Hem shares rose after a private equity firm took a stake in the company and management reported solid results during the second quarter of 2017. EDP Renovaveis recovered in 2017, as the Trump administration’s position on renewable energy reduced pressure on the company. NRG’s stock rose as the company continued to improve its business position by reducing leverage and addressing capital allocation.
The stocks that made the weakest contributions to the Portfolio’s absolute performance included U.S. oil & gas pipeline operator Energy Transfer Partners, telecommunication services company Frontier Communications and oil transportation and storage company Plains GP Holdings. Energy Transfer Partners and Plains GP Holdings were hurt by falling oil and natural gas prices. Frontier Communications suffered from continuing subscriber losses and from announced plans to cut its dividend by more than 60%.
Did the Portfolio make any significant purchases or sales during the reporting period?
During the reporting period, U.S. regulated utility Duke Energy was added to the Portfolio. At the time, Duke Energy was trading a little below its historical average, and the company’s earnings had become more resilient as Duke Energy moved to a mostly regulated business. The Portfolio also added cable company Altice USA by participating in its initial public offering. We believed that Altice USA was attractive because the company had been cutting costs to drive margins higher. The company has also typically generated substantial cash flow, which could be used for mergers and acquisitions or for capital return. The Portfolio continued to trim its position in cable company Charter Communications, as the stock had done very well and the company’s valuation had, in our view, become less attractive. The Portfolio trimmed its position in U.S. integrated utility Dominion Energy in favor of other companies in the electric power industry.
How did the Portfolio’s sector weightings change during the reporting period?
During the reporting period, the Portfolio slightly increased its exposure to the wireless communications, water utilities and telephone services industries. Over the same period, the Portfolio slightly decreased its exposure to the cable TV, natural gas distribution and natural gas pipeline industries.
| 1. | See footnote on page 5 for more information on the Dow Jones Global Utilities Index. |
| 2. | See footnote on page 5 for more information on Lipper Inc. |
| | |
| 8 | | MainStay VP MFS® Utilities Portfolio |
How was the Portfolio positioned at the end of the reporting period?
As of June 30, 2017, the Portfolio maintained a moderately significant overweight position relative to the Dow Jones Global Utilities Index in natural gas pipeline and somewhat overweight positions in telephone services and wireless communications. As of the same date, the Portfolio remained substantially underweight relative to the Index in electric power and somewhat underweight in the natural gas distribution industry.
The opinions expressed are those of the portfolio managers as of the date of this report and are subject to change. There is no guarantee that any forecasts made will come to pass. This material does not constitute investment advice and is not intended as an endorsement of any specific investment.
Not all MainStay VP Portfolios and/or share classes are available under all policies.
Portfolio of Investments June 30, 2017 (Unaudited)
| | | | | | | | |
| | | Shares | | | Value | |
| Common Stocks 92.7%† | |
Commercial Services & Supplies 0.5% | |
Covanta Holding Corp. | | | 504,280 | | | $ | 6,656,496 | |
| | | | | | | | |
|
Diversified Telecommunication Services 8.3% | |
Bezeq The Israeli Telecommunication Corp., Ltd. (Israel) | | | 3,410,013 | | | | 5,664,863 | |
BT Group PLC (United Kingdom) | | | 1,033,392 | | | | 3,967,161 | |
Cellnex Telecom S.A. (Spain) (a) | | | 637,986 | | | | 13,159,879 | |
¨Com Hem Holding AB (Sweden) | | | 2,330,826 | | | | 32,369,894 | |
Hellenic Telecommunications Organization S.A. (Greece) (b) | | | 829,080 | | | | 9,980,679 | |
Koninklijke KPN N.V. (Netherlands) | | | 4,343,144 | | | | 13,894,418 | |
Orange S.A. (France) | | | 678,751 | | | | 10,768,017 | |
SBA Communications Corp. (New Zealand) (b) | | | 24,307 | | | | 3,279,014 | |
TDC A/S (Denmark) | | | 1,588,292 | | | | 9,236,483 | |
Telefonica Brasil S.A., ADR (Brazil) | | | 181,386 | | | | 2,446,897 | |
Telesites S.A.B. de C.V. (Mexico) (b) | | | 2,153,100 | | | | 1,582,608 | |
Verizon Communications, Inc. | | | 73,911 | | | | 3,300,865 | |
| | | | | | | | |
| | | | 109,650,778 | |
| | | | | | | | |
Electric Utilities 32.5% | |
Alupar Investimento S.A. (Brazil) | | | 276,400 | | | | 1,509,275 | |
¨American Electric Power Co., Inc. | | | 452,538 | | | | 31,437,815 | |
Avangrid, Inc. | | | 266,676 | | | | 11,773,745 | |
Duke Energy Corp. | | | 264,331 | | | | 22,095,428 | |
Edison International | | | 201,580 | | | | 15,761,540 | |
EDP—Energias de Portugal S.A. (Portugal) | | | 5,518,347 | | | | 18,044,854 | |
Emera, Inc. (Canada) | | | 179,299 | | | | 6,665,642 | |
¨Enel S.p.A. (Italy) | | | 7,759,366 | | | | 41,599,905 | |
¨Exelon Corp. | | | 2,373,816 | | | | 85,623,543 | |
Great Plains Energy, Inc. | | | 255,607 | | | | 7,484,173 | |
Iberdrola S.A. (Spain) | | | 2,521,019 | | | | 19,962,749 | |
¨NextEra Energy, Inc. | | | 403,722 | | | | 56,573,564 | |
¨PG&E Corp. | | | 567,101 | | | | 37,638,493 | |
¨PPL Corp. | | | 1,343,190 | | | | 51,927,726 | |
SSE PLC (United Kingdom) | | | 882,046 | | | | 16,692,362 | |
Transmissora Alianca de Energia Eletrica S.A. (Brazil) | | | 377,727 | | | | 2,512,935 | |
| | | | | | | | |
| | | | 427,303,749 | |
| | | | | | | | |
Equity Real Estate Investment Trusts (REITs) 2.2% | |
¨American Tower Corp. | | | 219,361 | | | | 29,025,848 | |
| | | | | | | | |
|
Gas Utilities 1.3% | |
China Resources Gas Group, Ltd. (China) | | | 3,652,000 | | | | 12,465,760 | |
Infraestructura Energetica Nova S.A.B. de C.V. (Mexico) | | | 874,444 | | | | 4,660,650 | |
| | | | | | | | |
| | | | 17,126,410 | |
| | | | | | | | |
| | | | | | | | |
| | | Shares | | | Value | |
Independent Power & Renewable Electricity Producers 14.0% | |
AES Corp. | | | 1,729,437 | | | $ | 19,214,045 | |
Calpine Corp. (b) | | | 2,131,740 | | | | 28,842,442 | |
China Longyuan Power Group Corp., Ltd. (China), Class H | | | 10,059,000 | | | | 7,318,026 | |
Dynegy, Inc. (b) | | | 1,423,133 | | | | 11,769,310 | |
¨EDP Renovaveis S.A. (Spain) | | | 6,440,572 | | | | 51,220,504 | |
Engie Brasil Energia S.A. (Brazil) | | | 538,000 | | | | 5,508,455 | |
NextEra Energy Partners, L.P. | | | 455,776 | | | | 16,859,154 | |
NRG Energy, Inc. | | | 1,307,620 | | | | 22,517,217 | |
NRG Yield, Inc. | | | | | | | | |
Class A | | | 535,489 | | | | 9,135,442 | |
Class C | | | 500,545 | | | | 8,809,592 | |
NTPC, Ltd. (India) | | | 1,001,335 | | | | 2,463,931 | |
| | | | | | | | |
| | | | | | | 183,658,118 | |
| | | | | | | | |
Media 4.7% | | | | | | | | |
Altice U.S.A., Inc. Class A (b) | | | 331,936 | | | | 10,721,533 | |
Charter Communications, Inc. Class A (b) | | | 48,548 | | | | 16,353,394 | |
Comcast Corp. Class A | | | 638,362 | | | | 24,845,049 | |
NOS SGPS S.A. (Portugal) | | | 1,517,886 | | | | 9,212,632 | |
| | | | | | | | |
| | | | | | | 61,132,608 | |
| | | | | | | | |
Multi-Utilities 8.1% | | | | | | | | |
Ameren Corp. | | | 204,915 | | | | 11,202,703 | |
DTE Energy Co. | | | 103,505 | | | | 10,949,794 | |
Innogy S.E. (Germany) (a) | | | 182,340 | | | | 7,177,666 | |
Public Service Enterprise Group, Inc. | | | 286,459 | | | | 12,320,602 | |
RWE A.G. (Germany) (b) | | | 331,308 | | | | 6,601,246 | |
¨Sempra Energy | | | 424,135 | | | | 47,821,221 | |
Suez (France) | | | 580,599 | | | | 10,752,668 | |
| | | | | | | | |
| | | | | | | 106,825,900 | |
| | | | | | | | |
Oil, Gas & Consumable Fuels 17.2% | |
Cheniere Energy, Inc. (b) | | | 292,696 | | | | 14,257,222 | |
Enable Midstream Partners, L.P. | | | 227,146 | | | | 3,620,707 | |
Enbridge, Inc. (Canada) | | | 587,794 | | | | 23,415,668 | |
Energy Transfer Partners, L.P. | | | 1,392,993 | | | | 28,403,127 | |
Enterprise Products Partners, L.P. | | | 1,115,051 | | | | 30,195,581 | |
EQT Corp. | | | 25,849 | | | | 1,514,493 | |
EQT GP Holdings, L.P. | | | 161,980 | | | | 4,883,697 | |
EQT Midstream Partners, L.P. | | | 240,600 | | | | 17,955,978 | |
Kinder Morgan, Inc. | | | 413,550 | | | | 7,923,618 | |
Plains All American Pipeline, L.P. | | | 126,816 | | | | 3,331,456 | |
Plains GP Holdings, L.P. Class A (b) | | | 441,840 | | | | 11,558,534 | |
SemGroup Corp. Class A | | | 158,714 | | | | 4,285,278 | |
Shell Midstream Partners, L.P. | | | 218,827 | | | | 6,630,458 | |
Tallgrass Energy GP, L.P. | | | 295,416 | | | | 7,512,429 | |
Targa Resources Corp. | | | 212,301 | | | | 9,596,005 | |
TransCanada Corp. (Canada) | | | 365,194 | | | | 17,409,233 | |
Western Gas Equity Partners, L.P. | | | 203,752 | | | | 8,765,411 | |
| † | Percentages indicated are based on Portfolio net assets. |
| ¨ | | Among the Portfolio’s 10 largest holdings, as of June 30, 2017, excluding short-term investment. May be subject to change daily |
| | | | |
| 10 | | MainStay VP MFS® Utilities Portfolio | | The notes to the financial statements are an integral part of,
and should be read in conjunction with, the financial statements. |
| | | | | | | | |
| | | Shares | | | Value | |
| Common Stocks (continued) | |
Oil, Gas & Consumable Fuels (continued) | |
Williams Cos., Inc. | | | 428,834 | | | $ | 12,985,094 | |
Williams Partners, L.P. | | | 283,777 | | | | 11,382,296 | |
| | | | | | | | |
| | | | | | | 225,626,285 | |
| | | | | | | | |
Water Utilities 0.7% | | | | | | | | |
Cia de Saneamento Basico do Estado de Sao Paulo (Brazil) | | | 897,800 | | | | 8,579,899 | |
| | | | | | | | |
|
Wireless Telecommunication Services 3.2% | |
Advanced Info Service PCL (Thailand) | | | 1,614,300 | | | | 8,435,038 | |
KDDI Corp. (Japan) | | | 360,100 | | | | 9,524,761 | |
Millicom International Cellular S.A. (Luxembourg) | | | 11,939 | | | | 705,170 | |
Mobile TeleSystems PJSC, Sponsored ADR (Russia) | | | 1,114,471 | | | | 9,339,267 | |
PT XL Axiata Tbk (Indonesia) (b) | | | 26,187,400 | | | | 6,700,359 | |
Vodafone Group PLC (United Kingdom) | | | 2,490,329 | | | | 7,062,783 | |
| | | | | | | | |
| | | | | | | 41,767,378 | |
| | | | | | | | |
Total Common Stocks
(Cost $1,136,739,508) | | | | | | | 1,217,353,469 | |
| | | | | | | | |
|
| Convertible Preferred Stocks 5.2% | |
Diversified Telecommunication Services 0.3% | |
Frontier Communications Corp.
11.125% | | | 133,379 | | | | 3,926,678 | |
| | | | | | | | |
| | |
Electric Utilities 2.1% | | | | | | | | |
Great Plains Energy, Inc.
7.00% | | | 122,248 | | | | 6,484,034 | |
¨Nextera Energy, Inc. | | | | | | | | |
6.123% | | | 263,256 | | | | 14,218,457 | |
6.371% | | | 106,095 | | | | 6,804,933 | |
| | | | | | | | |
| | | | | | | 27,507,424 | |
| | | | | | | | |
Equity Real Estate Investment Trusts (REITs) 0.6% | |
¨American Tower Corp.
5.50% | | | 64,915 | | | | 7,869,645 | |
| | | | | | | | |
|
Independent Power & Renewable Electricity Producers 0.7% | |
Dynegy, Inc. | | | | | | | | |
5.375% | | | 173,984 | | | | 5,058,585 | |
7.00% | | | 56,168 | | | | 3,419,508 | |
| | | | | | | | |
| | | | | | | 8,478,093 | |
| | | | | | | | |
Multi-Utilities 0.8% | | | | | | | | |
Dominion Energy, Inc.
6.75% | | | 209,412 | | | | 10,537,612 | |
| | | | | | | | |
| | |
Oil, Gas & Consumable Fuels 0.7% | | | | | | | | |
Anadarko Petroleum Corp.
7.50% | | | 237,262 | | | | 9,748,858 | |
| | | | | | | | |
Total Convertible Preferred Stocks
(Cost $83,169,626) | | | | | | | 68,068,310 | |
| | | | | | | | |
| | | | | | | | |
| | | Principal
Amount | | | Value | |
| Short-Term Investment 2.4% | |
U.S. Government & Federal Agencies 2.4% | |
Federal Home Loan Bank Discount Notes
0.659%, due 7/3/17 (c) | | $ | 31,532,000 | | | $ | 31,530,861 | |
| | | | | | | | |
Total Short-Term Investment
(Cost $31,530,861) | | | | | | | 31,530,861 | |
| | | | | | | | |
Total Investments
(Cost $1,251,439,995) (d) | | | 100.3 | % | | | 1,316,952,640 | |
Other Assets, Less Liabilities | | | (0.3 | ) | | | (4,202,367 | ) |
Net Assets | | | 100.0 | % | | $ | 1,312,750,273 | |
| (a) | May be sold to institutional investors only under Rule 144A or securities offered pursuant to Section 4(a)(2) of the Securities Act of 1933, as amended. |
| (b) | Non-income producing security. |
| (c) | Interest rate shown represents yield to maturity. |
| (d) | As of June 30, 2017, cost was $1,263,735,076 for federal income tax purposes and net unrealized appreciation was as follows: |
| | | | |
Gross unrealized appreciation | | $ | 159,060,861 | |
Gross unrealized depreciation | | | (105,843,297 | ) |
| | | | |
Net unrealized appreciation | | $ | 53,217,564 | |
| | | | |
| | | | | | |
The notes to the financial statements are an integral part of,
and should be read in conjunction with, the financial statements. | | | | | 11 | |
Portfolio of Investments June 30, 2017 (Unaudited) (continued)
As of June 30, 2017, the Portfolio held the following foreign currency forward contracts:
| | | | | | | | | | | | | | | | | | | | | | | | | | | | | | |
Foreign Currency Buy Contracts | | Expiration
Date | | | Counterparty | | Contract
Amount
Purchased | | | Contract
Amount
Sold | | | Unrealized
Appreciation
(Depreciation) | |
Canadian Dollar vs. U.S. Dollar | | | 8/10/17 | | | Goldman Sachs & Co. | | | CAD | | | | 357,903 | | | | | | | $ | 270,774 | | | | | | | $ | 5,394 | |
Canadian Dollar vs. U.S. Dollar | | | 8/10/17 | | | Deutsche Bank AG | | | | | | | 281,422 | | | | | | | | 212,339 | | | | | | | | 4,813 | |
Canadian Dollar vs. U.S. Dollar | | | 8/10/17 | | | JPMorgan Chase Bank N.A. | | | | | | | 123,731 | | | | | | | | 95,004 | | | | | | | | 471 | |
Canadian Dollar vs. U.S. Dollar | | | 8/10/17 | | | Morgan Stanley & Co. | | | | | | | 867,449 | | | | | | | | 657,839 | | | | | | | | 11,507 | |
Canadian Dollar vs. U.S. Dollar | | | 8/10/17 | | | Barclays Bank PLC | | | | | | | 367,144 | | | | | | | | 277,365 | | | | | | | | 5,933 | |
Euro vs. U.S. Dollar | | | 8/10/17 | | | JPMorgan Chase Bank N.A. | | | EUR | | | | 433,324 | | | | | | | | 484,549 | | | | | | | | 11,284 | |
Euro vs. U.S. Dollar | | | 8/10/17 | | | BNP Paribas S.A. | | | | | | | 817,908 | | | | | | | | 918,353 | | | | | | | | 17,544 | |
Euro vs. U.S. Dollar | | | 8/10/17 | | | Morgan Stanley & Co. | | | | | | | 916,588 | | | | | | | | 1,034,085 | | | | | | | | 14,726 | |
Euro vs. U.S. Dollar | | | 8/10/17 | | | Deutsche Bank AG | | | | | | | 253,827 | | | | | | | | 284,901 | | | | | | | | 5,542 | |
Euro vs. U.S. Dollar | | | 7/19/17 | | | Morgan Stanley & Co. | | | | | | | 656,000 | | | | | | | | 732,929 | | | | | | | | 16,858 | |
Pound Sterling vs. U.S. Dollar | | | 8/10/17 | | | BNP Paribas S.A. | | | GBP | | | | 549,965 | | | | | | | | 716,178 | | | | | | | | 933 | |
| | | | | | | | |
| | | | | | | | | | | | | | | | | | | | | | | | | | | | | | |
Foreign Currency Sales Contracts | | | | | | | Contract
Amount
Sold | | | | | | Contract
Amount
Purchased | | | | | | | |
Canadian Dollar vs. U.S. Dollar | | | 8/10/17 | | | BNP Paribas S.A. | | | CAD | | | | 108,827 | | | | | | | | 81,748 | | | | | | | | (2,226 | ) |
Canadian Dollar vs. U.S. Dollar | | | 8/10/17 | | | Goldman Sachs & Co. | | | | | | | 2,056,264 | | | | | | | | 1,528,730 | | | | | | | | (57,938 | ) |
Canadian Dollar vs. U.S. Dollar | | | 8/10/17 | | | Merrill Lynch International Bank | | | | | | | 37,387,094 | | | | | | | | 27,767,574 | | | | | | | | (1,081,304 | ) |
Canadian Dollar vs. U.S. Dollar | | | 8/10/17 | | | Deutsche Bank AG | | | | | | | 580,867 | | | | | | | | 439,376 | | | | | | | | (8,836 | ) |
Canadian Dollar vs. U.S. Dollar | | | 8/10/17 | | | JPMorgan Chase Bank N.A. | | | | | | | 1,407,176 | | | | | | | | 1,054,737 | | | | | | | | (31,077 | ) |
Euro vs. U.S. Dollar | | | 8/10/17 | | | Deutsche Bank AG | | | EUR | | | | 2,946,000 | | | | | | | | 3,308,950 | | | | | | | | (62,029 | ) |
Euro vs. U.S. Dollar | | | 8/10/17 | | | Citibank N.A. | | | | | | | 777,979 | | | | | | | | 879,398 | | | | | | | | (10,809 | ) |
Euro vs. U.S. Dollar | | | 8/10/17 | | | HSBC Bank USA | | | | | | | 3,834,026 | | | | | | | | 4,335,325 | | | | | | | | (51,784 | ) |
Euro vs. U.S. Dollar | | | 8/10/17 | | | Morgan Stanley & Co. | | | | | | | 7,006,240 | | | | | | | | 7,923,357 | | | | | | | | (93,578 | ) |
Euro vs. U.S. Dollar | | | 8/10/17 | | | JPMorgan Chase Bank N.A. | | | | | | | 95,413,271 | | | | | | | | 107,869,856 | | | | | | | | (1,307,383 | ) |
Euro vs. U.S. Dollar | | | 8/10/17 | | | BNP Paribas S.A. | | | | | | | 4,853,116 | | | | | | | | 5,483,938 | | | | | | | | (69,271 | ) |
Euro vs. U.S. Dollar | | | 7/19/17 | | | BNP Paribas S.A. | | | | | | | 1,806,000 | | | | | | | | 1,988,929 | | | | | | | | (75,272 | ) |
Euro vs. U.S. Dollar | | | 7/19/17 | | | Barclays Bank PLC | | | | | | | 2,216,000 | | | | | | | | 2,440,940 | | | | | | | | (91,879 | ) |
Pound Sterling vs. U.S. Dollar | | | 8/10/17 | | | Merrill Lynch International Bank | | | GBP | | | | 14,809,874 | | | | | | | | 19,119,918 | | | | | | | | (190,992 | ) |
Net unrealized appreciation (depreciation) on foreign currency forward contracts | | | | | | | $ | (3,039,373 | ) |
The following abbreviations are used in the preceding pages:
ADR—American Depositary Receipt
CAD—Canadian Dollar
EUR—Euro
GBP—British Pound Sterling
| | | | |
| 12 | | MainStay VP MFS® Utilities Portfolio | | The notes to the financial statements are an integral part of,
and should be read in conjunction with, the financial statements. |
The following is a summary of the fair valuations according to the inputs used as of June 30, 2017, for valuing the Portfolio’s assets and liabilities.
Asset Valuation Inputs
| | | | | | | | | | | | | | | | | | | | |
Description | | Quoted
Prices in
Active
Markets for
Identical
Assets (Level 1) | | | Significant
Other
Observable
Inputs (Level 2) | | | Significant
Unobservable
Inputs (Level 3) | | | Total | | | | |
| Investments in Securities (a) | | | | | | | | | | | | | | | | | | | | |
| Common Stocks | | $ | 1,217,353,469 | | | $ | — | | | $ | — | | | $ | 1,217,353,469 | | | | | |
| Convertible Preferred Stocks | | | 68,068,310 | | | | — | | | | — | | | | 68,068,310 | | | | | |
| Short-Term Investment | | | | | | | | | | | | | | | | | | | | |
U.S. Government & Federal Agencies | | | — | | | | 31,530,861 | | | | — | | | | 31,530,861 | | | | | |
| | | | | | | | | | | | | | | | | | | | |
| Total Investments in Securities | | | 1,285,421,779 | | | | 31,530,861 | | | | — | | | | 1,316,952,640 | | | | | |
| | | | | | | | | | | | | | | | | | | | |
| Other Financial Instruments | | | | | | | | | | | | | | | | | | | | |
Foreign Currency Forward Contracts (b) | | | — | | | | 95,005 | | | | — | | | | 95,005 | | | | | |
| | | | | | | | | | | | | | | | | | | | |
| Total Investments in Securities and Other Financial Instruments | | $ | 1,285,421,779 | | | $ | 31,625,866 | | | $ | — | | | $ | 1,317,047,645 | | | | | |
| | | | | | | | | | | | | | | | | | | | |
Liability Valuation Inputs
| | | | | | | | | | | | | | | | | | | | |
Description | | Quoted
Prices in
Active
Markets for
Identical
Assets (Level 1) | | | Significant
Other
Observable
Inputs (Level 2) | | | Significant
Unobservable
Inputs (Level 3) | | | Total | | | | |
| Other Financial Instruments | | | | | | | | | | | | | | | | | | | | |
Foreign Currency Forward Contracts (b) | | $ | — | | | $ | (3,134,378 | ) | | $ | — | | | $ | (3,134,378 | ) | | | | |
| | | | | | | | | | | | | | | | | | | | |
| (a) | For a complete listing of investments and their industries, see the Portfolio of Investments. |
| (b) | The value listed for these securities reflects unrealized appreciation (depreciation) as shown on the Portfolio of Investments. |
The Portfolio recognizes transfers between the levels as of the beginning of the period.
As of June 30, 2017, certain foreign equity securities with a market value of $281,790,107 were transferred from Level 2 to Level 1 as the prices of these securities were based on observable quoted prices in active markets. ( See Note 2)
As of June 30, 2017, the Portfolio did not hold any investments with significant unobservable inputs (Level 3). (See Note 2)
| | | | | | |
The notes to the financial statements are an integral part of,
and should be read in conjunction with, the financial statements. | | | | | 13 | |
Statement of Assets and Liabilities as of June 30, 2017 (Unaudited)
| | | | |
| Assets | |
Investment in securities, at value
(identified cost $1,251,439,995) | | $ | 1,316,952,640 | |
Cash denominated in foreign currencies
(identified cost $97,343) | | | 97,582 | |
Cash | | | 844 | |
Due from custodian | | | 293,459 | |
Receivables: | | | | |
Investment securities sold | | | 4,500,056 | |
Dividends and interest | | | 2,995,350 | |
Fund shares sold | | | 562,161 | |
Other assets | | | 7,148 | |
Unrealized appreciation on foreign currency forward contracts | | | 95,005 | |
| | | | |
Total assets | | | 1,325,504,245 | |
| | | | |
| |
| Liabilities | | | | |
Payables: | | | | |
Investment securities purchased | | | 7,849,026 | |
Manager (See Note 3) | | | 788,300 | |
Fund shares redeemed | | | 389,259 | |
NYLIFE Distributors (See Note 3) | | | 255,558 | |
Foreign capital gains tax (See Note 2(C)) | | | 141,361 | |
Shareholder communication | | | 114,372 | |
Professional fees | | | 28,333 | |
Custodian | | | 24,120 | |
Trustees | | | 2,146 | |
Accrued expenses | | | 27,119 | |
Unrealized depreciation on foreign currency forward contracts | | | 3,134,378 | |
| | | | |
Total liabilities | | | 12,753,972 | |
| | | | |
Net assets | | $ | 1,312,750,273 | |
| | | | |
| |
| Composition of Net Assets | | | | |
Shares of beneficial interest outstanding (par value of $.001 per share) unlimited number of shares authorized | | $ | 112,551 | |
Additional paid-in capital | | | 1,211,845,411 | |
| | | | |
| | | 1,211,957,962 | |
Undistributed net investment income | | | 44,301,211 | |
Accumulated net realized gain (loss) on investments and foreign currency transactions | | | (5,823,642 | ) |
Net unrealized appreciation (depreciation) on investments (a) | | | 65,371,284 | |
Net unrealized appreciation (depreciation) on translation of other assets and liabilities in foreign currencies and foreign currency forward contracts | | | (3,056,542 | ) |
| | | | |
Net assets | | $ | 1,312,750,273 | |
| | | | |
| | | | |
Initial Class | | | | |
Net assets applicable to outstanding shares | | $ | 82,909,935 | |
| | | | |
Shares of beneficial interest outstanding | | | 7,071,681 | |
| | | | |
Net asset value per share outstanding | | $ | 11.72 | |
| | | | |
Service Class | | | | |
Net assets applicable to outstanding shares | | $ | 1,229,840,338 | |
| | | | |
Shares of beneficial interest outstanding | | | 105,478,830 | |
| | | | |
Net asset value per share outstanding | | $ | 11.66 | |
| | | | |
| (a) | Unrealized appreciation (depreciation) on investments recorded net of foreign capital gains tax in the amount of $141,361. |
| | | | |
| 14 | | MainStay VP MFS® Utilities Portfolio | | The notes to the financial statements are an integral part of,
and should be read in conjunction with, the financial statements. |
Statement of Operations for the six months ended June 30, 2017 (Unaudited)
| | | | |
| Investment Income (Loss) | |
Income | | | | |
Dividends (a) | | $ | 23,857,628 | |
Interest | | | 165,955 | |
| | | | |
Total income | | | 24,023,583 | |
| | | | |
Expenses | | | | |
Manager (See Note 3) | | | 4,644,838 | |
Distribution/Service—Service Class (See Note 3) | | | 1,506,103 | |
Shareholder communication | | | 97,192 | |
Custodian | | | 76,558 | |
Professional fees | | | 54,896 | |
Trustees | | | 15,661 | |
Miscellaneous | | | 34,365 | |
| | | | |
Total expenses | | | 6,429,613 | |
| | | | |
Net investment income (loss) | | | 17,593,970 | |
| | | | |
|
| Realized and Unrealized Gain (Loss) on Investments and Foreign Currency Transactions | |
Net realized gain (loss) on: | | | | |
Investment transactions | | | 5,092,079 | |
Foreign currency transactions | | | (4,901,624 | ) |
| | | | |
Net realized gain (loss) on investments and foreign currency transactions | | | 190,455 | |
| | | | |
Net change in unrealized appreciation (depreciation) on: | | | | |
Investments (b) | | | 108,676,447 | |
Translation of other assets and liabilities in foreign currencies and foreign currency forward contracts | | | (6,106,151 | ) |
| | | | |
Net change in unrealized appreciation (depreciation) on investments and foreign currency transactions | | | 102,570,296 | |
| | | | |
Net realized and unrealized gain (loss) on investments and foreign currency transactions | | | 102,760,751 | |
| | | | |
Net increase (decrease) in net assets resulting from operations | | $ | 120,354,721 | |
| | | | |
| (a) | Dividends recorded net of foreign withholding taxes in the amount of $988,319. |
| (b) | Unrealized appreciation (depreciation) on investments recorded net of foreign capital gains tax in the amount of $141,361. |
| | | | | | |
The notes to the financial statements are an integral part of,
and should be read in conjunction with, the financial statements. | | | | | 15 | |
Statements of Changes in Net Assets
for the six months ended June 30, 2017 (Unaudited) and the year ended December 31, 2016
| | | | | | | | |
| | | 2017 | | | 2016 | |
| Increase (Decrease) in Net Assets | |
Operations: | | | | | | | | |
Net investment income (loss) | | $ | 17,593,970 | | | $ | 19,046,795 | |
Net realized gain (loss) on investments and foreign currency transactions | | | 190,455 | | | | 5,657,038 | |
Net change in unrealized appreciation (depreciation) on investments and foreign currency transactions | | | 102,570,296 | | | | 103,748,606 | |
| | | | |
Net increase (decrease) in net assets resulting from operations | | | 120,354,721 | | | | 128,452,439 | |
| | | | |
Dividends and distributions to shareholders: | | | | | | | | |
From net investment income: | | | | | | | | |
Initial Class | | | — | | | | (2,368,667 | ) |
Service Class | | | — | | | | (32,605,544 | ) |
| | | | |
| | | — | | | | (34,974,211 | ) |
| | | | |
From net realized gain on investments: | | | | | | | | |
Initial Class | | | — | | | | (2,076,830 | ) |
Service Class | | | — | | | | (31,448,343 | ) |
| | | | |
| | | — | | | | (33,525,173 | ) |
| | | | |
Total dividends and distributions to shareholders | | | — | | | | (68,499,384 | ) |
| | | | |
Capital share transactions: | | | | | | | | |
Net proceeds from sale of shares | | | 52,074,229 | | | | 98,803,750 | |
Net asset value of shares issued to shareholders in reinvestment of dividends and distributions | | | — | | | | 68,499,384 | |
Cost of shares redeemed | | | (95,847,760 | ) | | | (192,707,850 | ) |
| | | | |
Increase (decrease) in net assets derived from capital share transactions | | | (43,773,531 | ) | | | (25,404,716 | ) |
| | | | |
Net increase (decrease) in net assets | | | 76,581,190 | | | | 34,548,339 | |
|
| Net Assets | |
Beginning of period | | | 1,236,169,083 | | | | 1,201,620,744 | |
| | | | |
End of period | | $ | 1,312,750,273 | | | $ | 1,236,169,083 | |
| | | | |
Undistributed net investment income at end of period | | $ | 44,301,211 | | | $ | 26,707,241 | |
| | | | |
| | | | |
| 16 | | MainStay VP MFS® Utilities Portfolio | | The notes to the financial statements are an integral part of,
and should be read in conjunction with, the financial statements. |
Financial Highlights selected per share data and ratios
| | | | | | | | | | | | | | | | | | | | | | | | | | | | |
| | | Six months
ended June 30, | | | | | | Year ended December 31, | | | February 17,
2012**
through December 31, | |
| Initial Class | | 2017* | | | | | | 2016 | | | 2015 | | | 2014 | | | 2013 | | | 2012 | |
Net asset value at beginning of period | | $ | 10.66 | | | | | | | $ | 10.15 | | | $ | 13.42 | | | $ | 12.65 | | | $ | 10.89 | | | $ | 10.00 | |
| | | | | | | | | | | | | | | | | | | | | | | | | | | | |
Net investment income (loss) (a) | | | 0.17 | | | | | | | | 0.19 | | | | 0.28 | | | | 0.38 | | | | 0.37 | | | | 0.33 | |
Net realized and unrealized gain (loss) on investments | | | 0.99 | | | | | | | | 0.88 | | | | (2.25 | ) | | | 1.05 | | | | 1.88 | | | | 0.56 | |
Net realized and unrealized gain (loss) on foreign currency transactions | | | (0.10 | ) | | | | | | | 0.08 | | | | 0.13 | | | | 0.16 | | | | (0.05 | ) | | | (0.00 | )‡ |
| | | | | | | | | | | | | | | | | | | | | | | | | | | | |
Total from investment operations | | | 1.06 | | | | | | | | 1.15 | | | | (1.84 | ) | | | 1.59 | | | | 2.20 | | | | 0.89 | |
| | | | | | | | | | | | | | | | | | | | | | | | | | | | |
| Less dividends and distributions: | | | | | | | | | | | | | | | | | | | | | | | | | | | | |
From net investment income | | | — | | | | | | | | (0.34 | ) | | | (0.51 | ) | | | (0.24 | ) | | | (0.28 | ) | | | — | |
From net realized gain on investments | | | — | | | | | | | | (0.30 | ) | | | (0.92 | ) | | | (0.58 | ) | | | (0.16 | ) | | | — | |
| | | | | | | | | | | | | | | | | | | | | | | | | | | | |
Total dividends and distributions | | | — | | | | | | | | (0.64 | ) | | | (1.43 | ) | | | (0.82 | ) | | | (0.44 | ) | | | — | |
| | | | | | | | | | | | | | | | | | | | | | | | | | | | |
Net asset value at end of period | | $ | 11.72 | | | | | | | $ | 10.66 | | | $ | 10.15 | | | $ | 13.42 | | | $ | 12.65 | | | $ | 10.89 | |
| | | | | | | | | | | | | | | | | | | | | | | | | | | | |
Total investment return (b) | | | 9.94 | % | | | | | | | 11.43 | % | | | (14.35 | %) | | | 12.68 | % | | | 20.33 | % | | | 8.90 | %(c) |
| Ratios (to average net assets)/Supplemental Data: | | | | | | | | | | | | | | | | | | | | | | | | | | | | |
Net investment income (loss) | | | 2.97 | %†† | | | | | | | 1.76 | %(d) | | | 2.23 | % | | | 2.81 | % | | | 3.03 | % | | | 3.66 | %†† |
Net expenses | | | 0.77 | %†† | | | | | | | 0.75 | %(e) | | | 0.77 | % | | | 0.78 | %(f) | | | 0.79 | % | | | 0.80 | %†† |
Portfolio turnover rate | | | 15 | % | | | | | | | 35 | % | | | 43 | % | | | 47 | % | | | 45 | % | | | 43 | % |
Net assets at end of period (in 000’s) | | $ | 82,910 | | | | | | | $ | 75,772 | | | $ | 70,368 | | | $ | 82,495 | | | $ | 70,290 | | | $ | 56,565 | |
| ‡ | Less than one cent per share. |
| (a) | Per share data based on average shares outstanding during the period. |
| (b) | Total return does not reflect any deduction of sales charges, mortality and expense charges, contract charges or administrative charges. For periods of less than one year, total return is not annualized. |
| (c) | Total investment return may reflect adjustments to conform to generally accepted accounting principles. |
| (d) | Without the custody fee reimbursement, net investment income (loss) would have been 1.74%. |
| (e) | Without the custody fee reimbursement, net expenses would have been 0.77%. |
| (f) | Expense waiver/reimbursement less than 0.01%. |
| | | | | | |
The notes to the financial statements are an integral part of,
and should be read in conjunction with, the financial statements. | | | | | 17 | |
Financial Highlights selected per share data and ratios
| | | | | | | | | | | | | | | | | | | | | | | | | | | | |
| | | Six months
ended
June 30, | | | | | | Year ended December 31, | | | February 17,
2012**
through
December 31, | |
| Service Class | | 2017* | | | | | | 2016 | | | 2015 | | | 2014 | | | 2013 | | | 2012 | |
Net asset value at beginning of period | | $ | 10.62 | | | | | | | $ | 10.10 | | | $ | 13.36 | | | $ | 12.61 | | | $ | 10.87 | | | $ | 10.00 | |
| | | | | | | | | | | | | | | | | | | | | | | | | | | | |
Net investment income (loss) (a) | | | 0.15 | | | | | | | | 0.16 | | | | 0.25 | | | | 0.35 | | | | 0.34 | | | | 0.30 | |
Net realized and unrealized gain (loss) on investments | | | 0.99 | | | | | | | | 0.89 | | | | (2.24 | ) | | | 1.04 | | | | 1.87 | | | | 0.57 | |
Net realized and unrealized gain (loss) on foreign currency transactions | | | (0.10 | ) | | | | | | | 0.08 | | | | 0.13 | | | | 0.16 | | | | (0.05 | ) | | | (0.00 | )‡ |
| | | | | | | | | | | | | | | | | | | | | | | | | | | | |
Total from investment operations | | | 1.04 | | | | | | | | 1.13 | | | | (1.86 | ) | | | 1.55 | | | | 2.16 | | | | 0.87 | |
| | | | | | | | | | | | | | | | | | | | | | | | | | | | |
| Less dividends and distributions: | | | | | | | | | | | | | | | | | | | | | | | | | | | | |
From net investment income | | | — | | | | | | | | (0.31 | ) | | | (0.48 | ) | | | (0.22 | ) | | | (0.26 | ) | | | — | |
From net realized gain on investments | | | — | | | | | | | | (0.30 | ) | | | (0.92 | ) | | | (0.58 | ) | | | (0.16 | ) | | | — | |
| | | | | | | | | | | | | | | | | | | | | | | | | | | | |
Total dividends and distributions | | | — | | | | | | | | (0.61 | ) | | | (1.40 | ) | | | (0.80 | ) | | | (0.42 | ) | | | — | |
| | | | | | | | | | | | | | | | | | | | | | | | | | | | |
Net asset value at end of period | | $ | 11.66 | | | | | | | $ | 10.62 | | | $ | 10.10 | | | $ | 13.36 | | | $ | 12.61 | | | $ | 10.87 | |
| | | | | | | | | | | | | | | | | | | | | | | | | | | | |
Total investment return (b) | | | 9.79 | %(c) | | | | | | | 11.15 | % | | | (14.57 | %) | | | 12.40 | % | | | 20.03 | % | | | 8.70 | %(c) |
| Ratios (to average net assets)/Supplemental Data: | | | | | | | | | | | | | | | | | | | | | | | | | | | | |
Net investment income (loss) | | | 2.72 | %†† | | | | | | | 1.52 | %(d) | | | 1.98 | % | | | 2.53 | % | | | 2.78 | % | | | 3.26 | %†† |
Net expenses | | | 1.02 | %†† | | | | | | | 1.00 | %(e) | | | 1.02 | % | | | 1.03 | %(f) | | | 1.04 | % | | | 1.05 | %†† |
Portfolio turnover rate | | | 15 | % | | | | | | | 35 | % | | | 43 | % | | | 47 | % | | | 45 | % | | | 43 | % |
Net assets at end of period (in 000’s) | | $ | 1,229,840 | | | | | | | $ | 1,160,397 | | | $ | 1,131,252 | | | $ | 1,357,229 | | | $ | 1,095,097 | | | $ | 793,902 | |
| ‡ | Less than one cent per share. |
| (a) | Per share data based on average shares outstanding during the period. |
| (b) | Total return does not reflect any deduction of sales charges, mortality and expense charges, contract charges or administrative charges. For periods of less than one year, total return is not annualized. |
| (c) | Total investment return may reflect adjustments to conform to generally accepted accounting principles. |
| (d) | Without the custody fee reimbursement, net investment income (loss) would have been 1.50%. |
| (e) | Without the custody fee reimbursement, net expenses would have been 1.02%. |
| (f) | Expense waiver/reimbursement less than 0.01%. |
| | | | |
| 18 | | MainStay VP MFS® Utilities Portfolio | | The notes to the financial statements are an integral part of,
and should be read in conjunction with, the financial statements. |
Notes to Financial Statements (Unaudited)
Note 1–Organization and Business
MainStay VP Funds Trust (the “Fund”) was organized as a Delaware statutory trust on February 1, 2011. The Fund is registered under the Investment Company Act of 1940, as amended (the “1940 Act”), as an open-end management investment company. The Fund is comprised of thirty-two separate series (collectively referred to as the “Portfolios”). These financial statements and notes relate to the MainStay VP MFS® Utilities Portfolio (the “Portfolio”), a “diversified” portfolio, as that term is defined in the 1940 Act, as interpreted or modified by regulatory authorities having jurisdiction, from time to time.
Shares of the Portfolio are currently offered certain separate accounts to fund variable annuity policies and variable universal life insurance policies issued by New York Life Insurance and Annuity Corporation (“NYLIAC”), a wholly-owned subsidiary of New York Life Insurance Company (“New York Life”). NYLIAC allocates shares of the Portfolios to, among others, NYLIAC Variable Annuity Separate Accounts-I, II, III and IV, VUL Separate Account-I and CSVUL Separate Account-I (collectively, the “Separate Accounts”). Shares of the Portfolio are also offered to the MainStay VP Conservative Allocation Portfolio, MainStay VP Moderate Allocation Portfolio, MainStay VP Moderate Growth Allocation Portfolio and MainStay VP Growth Allocation Portfolio, which operate as “funds-of-funds.”
The Portfolio currently offers two classes of shares. Initial Class and Service Class shares commenced operations on February 17, 2012. Shares of the Portfolio are sold and are redeemed at a price equal to their respective net asset value (“NAV”) per share. No sales or redemption charge is applicable to the purchase or redemption of the Portfolio’s shares. Under the terms of the Fund’s multiple class plan adopted pursuant to Rule 18f-3 under the 1940 Act, the classes differ in that, among other things, Service Class shares of the Portfolio pay a combined distribution and service fee of 0.25% of average daily net assets attributable to Service Class shares of the Portfolio to the Distributor (as defined in Note 3(B)) pursuant to a plan adopted in accordance with Rule 12b-1 under the 1940 Act. Contract owners of variable annuity contracts purchased after June 2, 2003, are permitted to invest only in the Service Class shares.
The Portfolio’s investment objective is to seek total return.
Note 2–Significant Accounting Policies
The Portfolio is an investment company and accordingly follows the investment company accounting and reporting guidance of the Financial Accounting Standards Board (“FASB”) Accounting Standard Codification Topic 946 Financial Services—Investment Companies. The Portfolio prepares its financial statements in accordance with generally accepted accounting principles (“GAAP”) in the United States of America and follows the significant accounting policies described below.
(A) Securities Valuation. Investments are usually valued as of the close of regular trading on the New York Stock Exchange (the “Exchange”) (usually 4:00 p.m. Eastern time) on each day the Portfolio is open for business (“valuation date”).
The Board of Trustees (the “Board”) of the Fund adopted procedures establishing methodologies for the valuation of the Portfolio’s securities and other assets and delegated the responsibility for valuation determinations under those procedures to the Valuation Committee of the Fund
(the “Valuation Committee”). The Board authorized the Valuation Committee to appoint a Valuation Sub-Committee (the “Sub-Committee”) to deal in the first instance with establishing the prices of securities for which market quotations are not readily available or the prices of which are not otherwise readily determinable under these procedures. The Sub-Committee meets (in person, via electronic mail or via teleconference) on an as-needed basis. Subsequently, the Valuation Committee meets to ensure that actions taken by the Sub-Committee were appropriate. The procedures recognize that, subject to the oversight of the Board and unless otherwise noted, the responsibility for the day-to-day valuation of portfolio assets (including fair value measurements for the Portfolio’s assets and liabilities) rests with New York Life Investment Management LLC (“New York Life Investments” or the “Manager”), aided to whatever extent necessary by the Subadvisor (as defined in Note 3(A)) to the Portfolio.
To assess the appropriateness of security valuations, the Manager, the Subadvisor or the Portfolio’s third party service provider, who is subject to oversight by the Manager, regularly compares prior day prices, prices on comparable securities and the sale prices to the prior and current day prices and challenges prices with changes exceeding certain tolerance levels with third party pricing services or broker sources. For those securities valued through either a standardized fair valuation methodology or a fair valuation measurement, the Sub-Committee deals in the first instance with such valuation and the Valuation Committee reviews and affirms, if appropriate, the reasonableness of the valuation based on such methodologies and measurements on a regular basis after considering all relevant information that is reasonably available. Any action taken by the Sub-Committee with respect to the valuation of a portfolio security or other asset is submitted by the Valuation Committee to the Board for its review and ratification, if appropriate, at its next regularly scheduled meeting.
“Fair value” is defined as the price the Portfolio would reasonably expect to receive upon selling an asset or liability in an orderly transaction to an independent buyer in the principal or most advantageous market for the asset or liability. Fair value measurements are determined within a framework that establishes a three-tier hierarchy which maximizes the use of observable market data and minimizes the use of unobservable inputs to establish a classification of fair value measurements for disclosure purposes. “Inputs” refer broadly to the assumptions that market participants would use in pricing the asset or liability, including assumptions about risk, such as the risk inherent in a particular valuation technique used to measure fair value using a pricing model and/or the risk inherent in the inputs for the valuation technique. Inputs may be observable or unobservable. Observable inputs reflect the assumptions market participants would use in pricing the asset or liability based on market data obtained from sources independent of the Portfolio. Unobservable inputs reflect the Portfolio’s own assumptions about the assumptions market participants would use in pricing the asset or liability based on the information available. The inputs or methodology used for valuing assets or liabilities may not be an indication of the risks associated with investing in those assets or liabilities. The three-tier hierarchy of inputs is summarized below.
| • | | Level 1—quoted prices in active markets for an identical asset or liability |
Notes to Financial Statements (Unaudited) (continued)
| • | | Level 2—other significant observable inputs (including quoted prices for a similar asset or liability in active markets, interest rates and yield curves, prepayment speeds, credit risk, etc.) |
| • | | Level 3—significant unobservable inputs (including the Portfolio’s own assumptions about the assumptions that market participants would use in measuring fair value of an asset or liability) |
The level of an asset or liability within the fair value hierarchy is based on the lowest level of an input, both individually and in the aggregate, that is significant to the fair value measurement. As of June 30, 2017, the aggregate value by input level of the Portfolio’s assets and liabilities is included at the end of the Portfolio’s Portfolio of Investments.
The Portfolio may use third party vendor evaluations, whose prices may be derived from one or more of the following standard inputs, among others:
| | |
• Benchmark yields | | • Reported trades |
• Broker/dealer quotes | | • Issuer spreads |
• Two-sided markets | | • Benchmark securities |
• Bids / offers | | • Reference data (corporate actions or material event notices) |
• Industry and economic events | | • Monthly payment information |
An asset or liability for which market values cannot be measured using the methodologies described above is valued by methods deemed reasonable in good faith by the Valuation Committee, following the procedures established by the Board, to represent fair value. Under these procedures, the Portfolio generally uses a market-based approach which may use related or comparable assets or liabilities, recent transactions, market multiples, book values, and other relevant information. The Portfolio may also use an income-based valuation approach in which the anticipated future cash flows of the asset or liability are discounted to calculate fair value. Discounts may also be applied due to the nature and/or duration of any restrictions on the disposition of the asset or liability. Fair value represents a good faith approximation of the value of a security. Fair value determinations involve the consideration of a number of subjective factors, an analysis of applicable facts and circumstances and the exercise of judgment. As a result, it is possible that the fair value for a security determined in good faith in accordance with the Portfolio’s valuation procedures may differ from valuations for the same security determined by other funds using their own valuation procedures. Although the Portfolio’s valuation procedures are designed to value a security at the price the Portfolio may reasonably expect to receive upon the security’s sale in an orderly transaction, there can be no assurance that any fair value determination thereunder would, in fact, approximate the amount that the Portfolio would actually realize upon the sale of the security or the price at which the security would trade if a reliable market price were readily available. During the six-month period ended June 30, 2017, there were no material changes to the fair value methodologies.
Securities which may be valued in this manner include, but are not limited to: (i) a security for which trading has been halted or suspended; (ii) a debt security that has recently gone into default and for which there is not a current market quotation; (iii) a security of an issuer that has entered into a restructuring; (iv) a security that has been de-listed from a national exchange; (v) a security for which the market price is not
readily available from a third party pricing source or, if so provided, does not, in the opinion of the Manager or Subadvisor, reflect the security’s market value; (vi) a security subject to trading collars for which no or limited trading takes place; and (vii) a security whose principal market has been temporarily closed at a time when, under normal conditions, it would be open. Securities for which market quotations or observable inputs are not readily available are generally categorized as Level 3 in the hierarchy. As of June 30, 2017, there were no securities held by the Portfolio that were fair valued in such a manner.
Certain securities held by the Portfolio may principally trade in foreign markets. Events may occur between the time the foreign markets close and the time at which the Portfolios’ NAVs are calculated. These events may include, but are not limited to, situations relating to a single issuer in a market sector, significant fluctuations in U.S. or foreign markets, natural disasters, armed conflicts, governmental actions or other developments not tied directly to the securities markets. Should the Manager or Subadvisor(s) conclude that such events may have affected the accuracy of the last price of such securities reported on the local foreign market, the Sub-Committee may, pursuant to procedures adopted by the Board, adjust the value of the local price to reflect the estimated impact on the price of such securities as a result of such events. In this instance, securities are generally categorized as Level 3 in the hierarchy. Additionally, certain foreign equity securities are also fair valued whenever the movement of a particular index exceeds certain thresholds. In such cases, the securities are fair valued by applying factors provided by a third party vendor in accordance with valuation procedures adopted by the Board and are generally categorized as Level 2 in the hierarchy. As of June 30, 2017, no foreign equity securities held by the Portfolio were valued in such a manner.
Temporary cash investments acquired in excess of 60 days to maturity at the time of purchase are valued using the latest bid prices or using valuations based on a matrix system (which considers such factors as security prices, yields, maturities, and ratings), both as furnished by independent pricing services. Other temporary cash investments which mature in 60 days or less at the time of purchase (“Short-Term Investments”) are valued using the amortized cost method of valuation, unless the use of such method would be inappropriate. The amortized cost method involves valuing a security at its cost on the date of purchase and thereafter assuming a constant amortization to maturity of the difference between such cost and the value on maturity date. Amortized cost approximates the current fair value of a security. Securities valued using the amortized cost method are not valued using quoted prices in an active market and are generally categorized as Level 2 in the hierarchy.
The information above is not intended to reflect an exhaustive list of the methodologies that may be used to value portfolio investments. The valuation procedures permit the use of a variety of valuation methodologies in connection with valuing portfolio investments. The methodology used for a specific type of investment may vary based on the market data available or other considerations. The methodologies summarized above may not represent the specific means by which portfolio investments are valued on any particular business day.
A portfolio security or other asset may be determined to be illiquid under procedures approved by the Board. Illiquidity of a security might prevent the sale of such security at a time when the Manager or Subadvisor
| | |
| 20 | | MainStay VP MFS® Utilities Portfolio |
might wish to sell, and these securities could have the effect of decreasing the overall level of the Portfolio’s liquidity. Further, the lack of an established secondary market may make it more difficult to value illiquid securities, requiring the Portfolio to rely on judgments that may be somewhat subjective in measuring value, which could vary materially from the amount that the Portfolio could realize upon disposition. Difficulty in selling illiquid securities may result in a loss or may be costly to the Portfolio. Under the supervision of the Board, the Manager or Subadvisor determines the liquidity of the Portfolio’s investments; in doing so, the Manager or Subadvisor may consider various factors, including (i) the frequency of trades and quotations, (ii) the number of dealers and prospective purchasers, (iii) dealer undertakings to make a market, and (iv) the nature of the security and the market in which it trades (e.g., the time needed to dispose of the security, the method of soliciting offers and the mechanics of transfer). Illiquid securities are often valued in accordance with methods deemed by the Board in good faith to be reasonable and appropriate to accurately reflect their fair value. The liquidity of the Portfolio’s investments, as shown in the Portfolio of Investments and was determined as of June 30, 2017 and can change at any time in response to, among other relevant factors, market conditions or events or developments with respect to an individual issuer or instrument. As of June 30, 2017, the Portfolio did not hold any securities deemed to be illiquid under procedures approved by the Board.
(B) Income Taxes. The Portfolio is treated as a separate entity for federal income tax purposes. The Portfolio’s policy is to comply with the requirements of the Internal Revenue Code of 1986, as amended (the “Internal Revenue Code”), applicable to regulated investment companies and to distribute all of its taxable income to the shareholders of the Portfolio within the allowable time limits. Therefore, no federal, state and local income tax provisions are required.
Management evaluates the Portfolio’s tax positions to determine if the tax positions taken meet the minimum recognition threshold in connection with accounting for uncertainties in income tax positions taken or expected to be taken for the purposes of measuring and recognizing tax liabilities in the financial statements. Recognition of tax benefits of an uncertain tax position is permitted only to the extent the position is “more likely than not” to be sustained assuming examination by taxing authorities. Management has analyzed the Portfolio’s tax positions taken on federal, state and local income tax returns for all open tax years (for up to three tax years), and has concluded that no provisions for federal, state and local income tax are required in the Portfolio’s financial statements. The Portfolio’s federal, state and local income and federal excise tax returns for tax years for which the applicable statutes of limitations have not expired are subject to examination by the Internal Revenue Service and state and local departments of revenue.
(C) Foreign Taxes. The Portfolio may be subject to foreign taxes on income and other transaction-based taxes imposed by certain countries in which it invests. A portion of the taxes on gains on investments or currency purchases/repatriation may be reclaimable. The Portfolio will accrue such taxes and reclaims as applicable, based upon its current interpretation of tax rules and regulations that exist in the markets in which it invests.
The Portfolio may be subject to taxation on realized capital gains, repatriation proceeds and other transaction-based taxes imposed by certain
countries in which it invests. The Portfolio will accrue such taxes as applicable based upon its current interpretation of tax rules and regulations that exist in the market in which it invests. Capital gains taxes relating to positions still held are reflected as a liability on the Statement of Assets and Liabilities, as well as an adjustment to the Portfolio’s net unrealized appreciation (depreciation). Taxes related to capital gains realized, if any, are reflected as part of net realized gain (loss) in the Statement of Operations. Changes in tax liabilities related to capital gains taxes on unrealized investment gains, if any, are reflected as part of the change in net unrealized appreciation (depreciation) on investments in the Statement of Operations. Transaction-based charges are generally assessed as a percentage of the transaction amount.
(D) Dividends and Distributions to Shareholders. Dividends and distributions are recorded on the ex-dividend date. The Portfolio intends to declare and pay dividends from net investment income and distributions from net realized capital and currency gains, if any, at least annually. Unless the shareholder elects otherwise, all dividends and distributions are reinvested in the same class of shares of the Portfolio, at NAV. Dividends and distributions to shareholders are determined in accordance with federal income tax regulations and may differ from GAAP.
(E) Security Transactions and Investment Income. The Portfolio records security transactions on the trade date. Realized gains and losses on security transactions are determined using the identified cost method. Dividend income is recognized on the ex-dividend date; net of any foreign tax withheld at the source, and interest income is accrued as earned using the effective interest rate method. Discounts and premiums on Short-Term Investments are accreted and amortized, respectively, on the straight-line method. The straight-line method approximates the effective interest method for Short-Term Investments.
Investment income and realized and unrealized gains and losses on investments of the Portfolio are allocated pro rata to the separate classes of shares based upon their relative net assets on the date the income is earned or realized and unrealized gains and losses are incurred.
The Portfolio may place a debt security on non-accrual status and reduce related interest income by ceasing current accruals and writing off all or a portion of any interest receivables when the collection of all or a portion of such interest has become doubtful. A debt security is removed from non-accrual status when the issuer resumes interest payments or when collectability of interest is reasonably assured.
(F) Expenses. Expenses of the Fund are allocated to the individual Portfolios in proportion to the net assets of the respective Portfolios when the expenses are incurred, except where direct allocations of expenses can be made. Expenses (other than fees incurred under the distribution and service plans, further discussed in Note 3(B), which are charged directly to the Service Class shares) are allocated to separate classes of shares pro rata based upon their relative net assets on the date the expenses are incurred. The expenses borne by the Portfolio, including those with related parties to the Portfolio, are shown in the Statement of Operations.
(G) Use of Estimates. In preparing financial statements in conformity with GAAP, management makes estimates and assumptions that affect the reported amounts and disclosures in the financial statements. Actual results could differ from those estimates.
Notes to Financial Statements (Unaudited) (continued)
(H) Repurchase Agreements. The Portfolio may enter into repurchase agreements (i.e., buy a security from another party with the agreement that it be sold back in the future) to earn income. The Portfolio may enter into repurchase agreements only with counterparties, usually financial institutions, that are deemed by the Manager or Subadvisor to be creditworthy, pursuant to guidelines established by the Board. During the term of any repurchase agreement, the Manager or Subadvisor will continue to monitor the creditworthiness of the counterparty. Under the 1940 Act, repurchase agreements are considered to be collateralized loans by the Portfolio to the counterparty secured by the securities transferred to the Portfolio.
Repurchase agreements are subject to counterparty risk, meaning the Portfolio could lose money by the counterparty’s failure to perform under the terms of the agreement. The Portfolio mitigates this risk by ensuring the repurchase agreement is collateralized by cash, U.S. government securities, fixed income securities and/or other securities. The collateral is held by the Portfolio’s custodian valued daily on a mark to market basis to determine if the value, including accrued interest, exceeds the repurchase price. In the event of the counterparty’s default on the obligation to repurchase, the Portfolio has the right to liquidate the collateral and apply the proceeds in satisfaction of the obligation. Under certain circumstances, such as in the event of default or bankruptcy by the counterparty, realization and/or retention of the collateral may be limited or subject to delay, to legal proceedings and possible realized loss to the Portfolio.
(I) Foreign Currency Forward Contracts. The Portfolio may enter into foreign currency forward contracts, which are agreements to buy or sell foreign currencies on a specified future date at a specified rate. The Portfolio is subject to foreign currency exchange rate risk in the normal course of investing in these transactions. During the period the forward contract is open, changes in the value of the contract are recognized as unrealized appreciation or depreciation by marking to market such contract on a daily basis to reflect the market value of the contract at the end of each day’s trading. Cash movement occurs on settlement date. When the forward contract is closed, the Portfolio records a realized gain or loss equal to the difference between the proceeds from (or cost of) the closing transaction and the Portfolio’s basis in the contract. The Portfolio may purchase and sell foreign currency forward contracts for purposes of seeking to enhance portfolio returns and manage portfolio risk more efficiently. Foreign currency forward contracts may also be used to gain exposure to a particular currency or to hedge against the risk of loss due to changing currency exchange rates. Foreign currency forward contracts to purchase or sell a foreign currency may also be used in anticipation of future purchases or sales of securities denominated in foreign currency, even if the specific investments have not yet been selected.
The use of foreign currency forward contracts involves, to varying degrees, elements of risk in excess of the amount recognized in the Statement of Assets and Liabilities, including counterparty risk, market risk, and illiquidity risk. Counterparty risk is heightened for these instruments because foreign currency forward contracts are not exchange-traded and therefore no clearinghouse or exchange stands ready to meet the obligations under such contracts. Thus, the Portfolio faces the risk that its counterparties under such contracts may not perform their obligations. Market risk is the risk that the value of a foreign currency forward contract will depreciate due to unfavorable
changes in exchange rates. Illiquidity risk arises because the secondary market for foreign currency forward contracts may have less liquidity relative to markets for other securities and financial instruments. Risks also arise from the possible movements in the foreign exchange rates underlying these instruments. While the Portfolio may enter into forward contracts to reduce currency exchange risks, changes in currency exchange rates may result in poorer overall performance for the Portfolio than if it had not engaged in such transactions. Exchange rate movements can be large, depending on the currency, and can last for extended periods of time, affecting the value of the Portfolio’s assets. Moreover, there may be an imperfect correlation between the Portfolio’s holdings of securities denominated in a particular currency and forward contracts entered into by the Portfolio. Such imperfect correlation may prevent the Portfolio from achieving the intended hedge or expose the Portfolio to the risk of currency exchange loss. The unrealized appreciation (depreciation) on forward contracts also reflects the Portfolio’s exposure at the valuation date to credit loss in the event of a counterparty’s failure to perform its obligations.
(J) Foreign Currency Transactions. The Portfolios’ books and records are maintained in U.S. dollars. Prices of securities denominated in foreign currency amounts are translated into U.S. dollars at the mean between the buying and selling rates last quoted by any major U.S. bank at the following dates:
| (i) | market value of investment securities, other assets and liabilities—at the valuation date; and |
| (ii) | purchases and sales of investment securities, income and expenses—at the date of such transactions. |
The assets and liabilities that are denominated in foreign currency amounts are presented at the exchange rates and market values at the close of the period. The realized and unrealized changes in net assets arising from fluctuations in exchange rates and market prices of securities are not separately presented.
Net realized gain (loss) on foreign currency transactions represents net gains and losses on foreign currency forward contracts, net currency gains or losses realized as a result of differences between the amounts of securities sale proceeds or purchase cost, dividends, interest and withholding taxes as recorded on the Portfolio’s books, and the U.S. dollar equivalent amount actually received or paid. Net currency gains or losses from valuing such foreign currency denominated assets and liabilities, other than investments at valuation date exchange rates, are reflected in unrealized foreign exchange gains or losses.
(K) Securities Lending. In order to realize additional income, the Portfolio may engage in securities lending, subject to the limitations set forth in the 1940 Act and relevant guidance by the staff of the Securities and Exchange Commission (“SEC”). In the event the Portfolio does engage in securities lending, the Portfolio will lend through its custodian, State Street Bank and Trust Company (“State Street”). State Street will manage the Portfolio’s collateral in accordance with the lending agreement between the Portfolio and State Street, and indemnify the Portfolio against counterparty risk. The loans will be collateralized by U.S. Treasury securities at least equal at all times to the market value of the securities loaned. The Portfolio may bear the risk of delay in recovery of, or loss of rights in, the securities loaned should the borrower of the securities experience financial difficulty. The Portfolio may also record a realized
| | |
| 22 | | MainStay VP MFS® Utilities Portfolio |
gain or loss on securities deemed sold due to a borrower’s inability to return securities on loan. The Portfolio bears the risk of any loss on investment of the collateral. The Portfolio will receive compensation for lending its securities in the form of fees or it will retain a portion of interest on the investment of any cash received as collateral. The Portfolio will also continue to receive interest and dividends on the securities loaned and any gain or loss in the market price of the securities loaned that may occur during the term of the loan will be for the account of the Portfolio. During the six-month period ended June 30, 2017, the Portfolio did not have any portfolio securities on loan.
(L) Foreign Securities Risk. The Portfolio may invest in foreign securities, which carry certain risks that are in addition to the usual risks inherent in domestic instruments. These risks include those resulting from currency fluctuations, future adverse political or economic developments and possible imposition of currency exchange blockages or other foreign governmental laws or restrictions. These risks are likely to be greater in emerging markets than in developed markets. The ability of issuers of securities held by the Portfolio to meet their obligations may be affected, among other things, by economic or political developments in a specific country, industry or region.
(M) Indemnifications. Under the Fund’s organizational documents, its officers and trustees are indemnified against certain liabilities that may arise out of performance of their duties to the Fund. Additionally, in the normal course of business, the Portfolio enters into contracts with third-party service providers that contain a variety of representations and warranties and which may provide general indemnifications. The Portfolio’s maximum exposure under these arrangements is unknown, as this would involve future claims that may be made against the Portfolio that have not yet occurred. Based on experience, management is of the view that the risk of loss in connection with these potential indemnification obligations is remote. However, there can be no assurance that material liabilities related to such obligations will not arise in the future, which could adversely impact the Portfolio.
(N) Quantitative Disclosure of Derivative Holdings. The following tables show additional disclosures related to the Portfolio’s derivative and hedging activities, including how such activities are accounted for and their effect on the Portfolio’s financial positions, performance and cash flows. The Portfolio entered into foreign currency forward contracts in order to provide an efficient means of maintaining liquidity while remaining fully invested in the market.
Fair value of derivative instruments as of June 30, 2017:
Asset Derivatives
| | | | | | | | | | |
| | | Statement of
Assets and Liabilities
Location | | Foreign
Exchange
Contracts
Risk | | | Total | |
Forward Contracts | | Unrealized appreciation on foreign currency forward contracts | | $ | 95,005 | | | $ | 95,005 | |
| | | | | | | | | | |
Total Fair Value | | | | $ | 95,005 | | | $ | 95,005 | |
| | | | | | | | | | |
Liability Derivatives
| | | | | | | | | | |
| | | Statement of
Assets and Liabilities
Location | | Foreign
Exchange
Contracts
Risk | | | Total | |
Forward Contracts | | Unrealized depreciation on foreign currency forward contracts | | $ | (3,134,378 | ) | | $ | (3,134,378 | ) |
| | | | | | | | | | |
Total Fair Value | | | | $ | (3,134,378 | ) | | $ | (3,134,378 | ) |
| | | | | | | | | | |
The effect of derivative instruments on the Statement of Operations for the period ended June 30, 2017:
Realized Gain (Loss)
| | | | | | | | | | |
| | | Statement of
Operations
Location | | Foreign
Exchange
Contracts
Risk | | | Total | |
Forward Contracts | | Net realized gain (loss) on foreign currency transactions | | $ | (2,517 | ) | | $ | (2,517 | ) |
| | | | | | | | | | |
Total Realized Gain (Loss) | | | | $ | (2,517 | ) | | $ | (2,517 | ) |
| | | | | | | | | | |
Change in Unrealized Appreciation (Depreciation)
| | | | | | | | | | |
| | | Statement of
Operations Location | | Foreign
Exchange
Contracts
Risk | | | Total | |
Forward Contracts | | Net change in unrealized appreciation (depreciation) on translation of other assets and liabilities in foreign currencies and foreign currency forward contracts | | $ | (6,158,872 | ) | | $ | (6,158,872 | ) |
| | | | | | | | | | |
Total Change in Unrealized Appreciation (Depreciation) | | | | $ | (6,158,872 | ) | | $ | (6,158,872 | ) |
| | | | | | | | | | |
Average Notional Amount
| | | | | | | | | | |
| | | | | Foreign
Exchange
Contracts
Risk | | | Total | |
Forward Contracts Long | | | | $ | 5,863,129 | | | $ | 5,863,129 | |
Forward Contracts Short | | | | $ | (168,730,767 | ) | | $ | (168,730,767 | ) |
| | | | | | | | | | |
Note 3–Fees and Related Party Transactions
(A) Manager and Subadvisor. New York Life Investments, a registered investment adviser and an indirect, wholly-owned subsidiary of New York Life, serves as the Portfolio’s Manager pursuant to an Amended and Restated Management Agreement (“Management Agreement”). The Manager provides offices, conducts clerical,
Notes to Financial Statements (Unaudited) (continued)
recordkeeping and bookkeeping services, and keeps most of the financial and accounting records required to be maintained by the Portfolio. Except for the portion of salaries and expenses that are the responsibility of the Portfolio, the Manager pays the salaries and expenses of all personnel affiliated with the Portfolio and certain operational expenses of the Portfolio. The Portfolio reimburses New York Life Investments in an amount equal to a portion of the compensation of the Chief Compliance Officer attributable to the Portfolio. Massachusetts Financial Services Company (“MFS®” or “Subadvisor”), a registered investment adviser and an indirect majority-owned subsidiary of Sun Life Financial, Inc. (a diversified financial services company), serves as Subadvisor to the Portfolio and is responsible for the day-to-day portfolio management of the Portfolio. Pursuant to the terms of a Subadvisory Agreement (“Subadvisory Agreement”) between New York Life Investments and MFS®, New York Life Investments pays for the services of the Subadvisor.
The Fund, on behalf of the Portfolio, pays New York Life Investments in its capacity as the Portfolio’s investment manager and administrator, pursuant to the Management Agreement, a monthly fee for services performed and facilities furnished at an annual rate of the Portfolio’s average daily net assets as follows: 0.73% up to $1 billion; and 0.70% in excess of $1 billion. During the six-month period ended June 30, 2017, the effective management fee rate was 0.72%.
During the six-month period ended June 30, 2017, New York Life Investments earned fees from the Portfolio in the amount of $4,644,838.
State Street provides sub-administration and sub-accounting services to the Portfolio pursuant to an agreement with New York Life Investments. These services include calculating the daily NAVs of the Portfolio, maintaining the general ledger and sub-ledger accounts for the calculation of the Portfolio’s NAVs, and assisting New York Life Investments in conducting various aspects of the Portfolio’s administrative operations. For providing these services to the Portfolio, State Street is compensated by New York Life Investments.
(B) Distribution and Service Fees. The Fund, on behalf of the Portfolio, has entered into a distribution agreement with NYLIFE Distributors LLC (the “Distributor”), an indirect, wholly-owned subsidiary of New York Life. The Portfolio has adopted a distribution plan (the “Plan”) in accordance with the provisions of Rule 12b-1 under the 1940 Act. Under the Plan, the Distributor has agreed to provide, through its affiliates or independent third parties, various distribution-related, shareholder and administrative support services to the Service Class shareholders. For its services, the Distributor is entitled to a combined distribution and service fee accrued daily and paid monthly at an annual rate of 0.25% of the average daily net assets attributable to the Service Class shares of the Portfolio.
Note 4–Federal Income Tax
During the year ended December 31, 2016, the tax character of distributions paid as reflected in the Statement of Changes in Net Assets was as follows:
Note 5–Custodian
State Street is the custodian of cash and securities held by the Portfolio. Custodial fees are charged to the Portfolio based on the Portfolio’s net
assets and/or the market value of securities held by the Portfolio and the number of certain transactions incurred by the Portfolio.
Note 6–Line of Credit
The Portfolio and certain other funds managed by New York Life Investments, maintain a line of credit with a syndicate of banks in order to secure a source of funds for temporary purposes to meet unanticipated or excessive redemption requests.
Effective August 1, 2017, under the credit agreement (the “Credit Agreement”), the aggregate commitment amount is $600,000,000 with an additional uncommitted amount of $100,000,000. The commitment fee is an annual rate of 0.15% of the average commitment amount payable quarterly, regardless of usage, to State Street, who serves as the agent to the syndicate. The commitment fee is allocated among the Portfolio and certain other funds managed by New York Life Investments based upon their respective net assets and other factors. Interest on any revolving credit loan is charged based upon the Federal Funds Rate or the one month LIBOR, whichever is higher. The Credit Agreement expires on July 31, 2018, although the Portfolio, certain other funds managed by New York Life Investments and the syndicate of banks may renew the Credit Agreement for an additional year on the same or different terms. Prior to August 1, 2017, the aggregate commitment amount was $600,000,000 with an additional uncommitted amount of $100,000,000, and the commitment fee, under a credit agreement for which Bank of New York Mellon served as agent, was at an annual rate of 0.15% of the average commitment amount. During the six-month period ended June 30, 2017, there were no borrowings made or outstanding with respect to the Portfolio under the credit agreement for which Bank of New York Mellon served as agent.
Note 7–Interfund Lending Program
Pursuant to an exemptive order issued by the SEC, the Portfolio, along with certain other funds managed by New York Life Investments, may participate in an interfund lending program. The interfund lending program provides an alternative credit facility that permits the Portfolio and certain other funds managed by New York Life Investments to lend or borrow money for temporary purposes directly to or from one another, subject to the conditions of the exemptive order. During the six-month period ended June 30, 2017, there were no interfund loans made or outstanding with respect to the Portfolio.
Note 8–Purchases and Sales of Securities (in 000’s)
During the six-month period ended June 30, 2017, purchases and sales of securities, other than short-term securities, were $188,970 and $188,075, respectively.
The Portfolio may purchase securities from or sell securities to other portfolios managed by the respective Subadvisor. These interportfolio transactions are primarily used for cash management purposes and are made pursuant to Rule 17a-7 of the 1940 Act. The Rule 17a-7 transactions during the six-month period ended June 30, 2017, were as follows:
| | | | |
Purchases (000’s) | | Sales (000’s) | | Realized Gain / (Loss) (000’s) |
| $350 | | $1,139 | | $364 |
| | |
| 24 | | MainStay VP MFS® Utilities Portfolio |
Note 9–Capital Share Transactions
Transactions in capital shares for the six-month period ended June 30, 2017, and the year ended December 31, 2016, were as follows:
| | | | | | | | |
Initial Class | | Shares | | | Amount | |
Six-month period ended June 30, 2017: | | | | | | | | |
Shares sold | | | 190,424 | | | $ | 2,156,588 | |
Shares redeemed | | | (223,952 | ) | | | (2,535,547 | ) |
| | | | | | | | |
Net increase (decrease) | | | (33,528 | ) | | $ | (378,959 | ) |
| | | | | | | | |
Year ended December 31, 2016: | | | | | | | | |
Shares sold | | | 598,407 | | | $ | 6,617,153 | |
Shares issued to shareholders in reinvestment of dividends and distributions | | | 417,760 | | | | 4,445,497 | |
Shares redeemed | | | (846,498 | ) | | | (9,055,805 | ) |
| | | | | | | | |
Net increase (decrease) | | | 169,669 | | | $ | 2,006,845 | |
| | | | | | | | |
|
| |
Service Class | | Shares | | | Amount | |
Six-month period ended June 30, 2017: | | | | | | | | |
Shares sold | | | 4,423,575 | | | $ | 49,917,641 | |
Shares redeemed | | | (8,237,061 | ) | | | (93,312,213 | ) |
| | | | | | | | |
Net increase (decrease) | | | (3,813,486 | ) | | $ | (43,394,572 | ) |
| | | | | | | | |
Year ended December 31, 2016: | | | | | | | | |
Shares sold | | | 8,505,136 | | | $ | 92,186,597 | |
Shares issued to shareholders in reinvestment of dividends and distributions | | | 6,042,447 | | | | 64,053,887 | |
Shares redeemed | | | (17,249,967 | ) | | | (183,652,045 | ) |
| | | | | | | | |
Net increase (decrease) | | | (2,702,384 | ) | | $ | (27,411,561 | ) |
| | | | | | | | |
Note 10–Recent Accounting Pronouncement
In October 2016, the SEC adopted new rules and amended existing rules (together, “final rules”) intended to modernize the reporting and disclosure of information by registered investment companies. In part, the final rules amend Regulation S-X and require standardized, enhanced disclosure about derivatives in investment company financial statements, as well as other amendments. The compliance date for the amendments to Regulation S-X is August 1, 2017 and applies to shareholder reports for funds with fiscal periods ending after August 1, 2017. Management is currently evaluating the impact that the adoption of the amendments to Regulation S-X will have on the Portfolio’s financial statements and related disclosures.
Note 11–Subsequent Events
In connection with the preparation of the financial statements of the Portfolios as of and for the six-month period ended June 30, 2017, events and transactions subsequent to June 30, 2017, through the date the financial statements were issued have been evaluated by the Portfolios’ management for possible adjustment and/or disclosure. No subsequent events requiring financial statement adjustment or disclosure have been identified.
Proxy Voting Policies and Procedures and Proxy Voting Record
A description of the policies and procedures that New York Life Investments uses to vote proxies related to the Portfolio’s securities is available without charge, upon request, (i) by calling 800-598-2019 or (ii) by visiting the SEC’s website at www.sec.gov.
The Portfolio is required to file with the SEC its proxy voting record for the 12-month period ending June 30 on Form N-PX. The Portfolio’s most recent Form N-PX or proxy voting record is available free of charge upon request (i) by calling 800-598-2019 or; (ii) by visiting the SEC’s website at www.sec.gov.
Shareholder Reports and Quarterly Portfolio Disclosure
The Portfolio is required to file its complete schedule of portfolio holdings with the SEC for its first and third fiscal quarters on Form N-Q. The Portfolio’s Form N-Q is available without charge on the SEC’s website at www.sec.gov or by calling MainStay Investments at 800-598-2019. You also can obtain and review copies of Form N-Q by visiting the SEC’s Public Reference Room in Washington, DC (information on the operation of the Public Reference Room may be obtained by calling 1-800-SEC-0330).
| | |
| 26 | | MainStay VP MFS® Utilities Portfolio |
MainStay VP Portfolios
MainStay VP offers a wide range of Portfolios. The full array of MainStay VP offerings is listed here, with information about the manager, subadvisors, legal counsel, and independent registered public accounting firm.
Equity Portfolios
MainStay VP Common Stock Portfolio
MainStay VP Cornerstone Growth Portfolio
MainStay VP Eagle Small Cap Growth Portfolio
MainStay VP Emerging Markets Equity Portfolio
MainStay VP Epoch U.S. Equity Yield Portfolio
MainStay VP Epoch U.S. Small Cap Portfolio
MainStay VP International Equity Portfolio
MainStay VP Large Cap Growth Portfolio
MainStay VP MFS® Utilities Portfolio
MainStay VP Mid Cap Core Portfolio
MainStay VP S&P 500 Index Portfolio
MainStay VP Small Cap Core Portfolio
MainStay VP T. Rowe Price Equity Income Portfolio
MainStay VP VanEck Global Hard Assets Portfolio
Mixed Asset Portfolios
MainStay VP Balanced Portfolio
MainStay VP Convertible Portfolio
MainStay VP Cushing Renaissance Advantage Portfolio
MainStay VP Income Builder Portfolio
MainStay VP Janus Henderson Balanced Portfolio
Income Portfolios
MainStay VP Bond Portfolio
MainStay VP Floating Rate Portfolio
MainStay VP Government Portfolio
MainStay VP High Yield Corporate Bond Portfolio
MainStay VP Indexed Bond Portfolio
MainStay VP PIMCO Real Return Portfolio
MainStay VP Unconstrained Bond Portfolio
Money Market
MainStay VP U.S. Government Money Market Portfolio
Alternative
MainStay VP Absolute Return Multi-Strategy Portfolio
Asset Allocation Portfolios
MainStay VP Conservative Allocation Portfolio
MainStay VP Growth Allocation Portfolio
MainStay VP Moderate Allocation Portfolio
MainStay VP Moderate Growth Allocation Portfolio
Manager
New York Life Investment Management LLC
New York, New York
Subadvisors
Candriam Belgium*
Brussels, Belgium
Candriam France S.A.S.*
Paris, France
Cornerstone Capital Management Holdings LLC*
New York, New York
Cushing Asset Management, LP
Dallas, Texas
Eagle Asset Management, Inc.
St Petersburg, Florida
Epoch Investment Partners, Inc.
New York, New York
Janus Capital Management LLC
Denver, Colorado
MacKay Shields LLC*
New York, New York
Massachusetts Financial Services Company
Boston, Massachusetts
NYL Investors LLC*
New York, New York
Pacific Investment Management Company LLC
Newport Beach, California
T. Rowe Price Associates, Inc.
Baltimore, Maryland
Van Eck Associates Corporation
New York, New York
Winslow Capital Management, LLC
Minneapolis, Minnesota
Distributor
NYLIFE Distributors LLC*
Jersey City, New Jersey
Custodian
State Street Bank and Trust Company
Boston, Massachusetts
Independent Registered Public Accounting Firm
PricewaterhouseCoopers LLP
New York, New York
Legal Counsel
Dechert LLP
Washington, District of Columbia
Some Portfolios may not be available in all products.
* An affiliate of New York Life Investment Management LLC
Not part of the Semiannual Report
2017 Semiannual Report
This report is for the general information of New York Life Variable Annuities and NYLIAC Variable Universal Life Insurance Products policyowners. It must be preceded or accompanied by the appropriate product(s) and funds prospectuses if it is given to anyone who is not an owner of a New York Life variable annuity policy or a NYLIAC Variable Universal Life Insurance Product. This report does not offer for sale or solicit orders to purchase securities.
The performance data quoted in this report represents past performance. Past performance is no guarantee of future results. Due to market volatility and other factors, current performance may be lower or higher than the figures shown. The most recent month-end performance summary for your variable annuity or variable life policy is available by calling 800-598-2019 and is updated periodically on www.newyorklife.com.
The New York Life Variable Annuities and NYLIAC Variable Universal Life Insurance Products are issued by New York Life Insurance and Annuity Corporation (a Delaware Corporation) and distributed by NYLIFE Distributors LLC (Member FINRA/SIPC).
New York Life Insurance Company
New York Life Insurance and Annuity Corporation (NYLIAC) (A Delaware Corporation)
51 Madison Avenue, Room 551
New York, NY 10010
www.newyorklife.com
Printed on recycled paper
mainstayinvestments.com
NYLIFE Distributors LLC, 30 Hudson Street, Jersey City, NJ 07302
New York Life Investment Management LLC is the investment manager to the MainStay VP Funds Trust
©2017 by NYLIFE Distributors LLC. All rights reserved.
You may obtain copies of the Prospectus and the Statement of Additional Information free of charge, upon request, by calling toll-free 800-598-2019 or writing to New York Life Insurance and Annuity Corporation, 51 Madison Avenue, New York, NY 10010.
| | | | |
| Not FDIC Insured | | No Bank Guarantee | | May Lose Value |
| | | | |
1743148 | | | | MSVPMFS10-08/17 (NYLIAC) NI526 |
MainStay VP T. Rowe Price Equity Income Portfolio
Message from the President and Semiannual Report
Unaudited | June 30, 2017

Sign up for electronic delivery of your shareholder reports. For full details on electronic delivery, including who can participate and what you
can receive via eDelivery, please log on to www.newyorklife.com/vsc

This page intentionally left blank
Message from the President
The six months ended June 30, 2017, brought positive results to many stock and bond investors. The year began with many investors hoping that Republican control of the White House, the Senate and the House of Representatives could bring an end to political gridlock; and while debate has continued on a number of issues, the U.S. stock market climbed relatively steadily throughout the first half of 2017.
According to FTSE-Russell U.S. market data, stocks at all capitalization levels tended to record positive total returns during the reporting period, with large-cap stocks generally outperforming stocks of smaller-capitalization companies. Growth stocks outpaced value stocks at every capitalization level by substantial margins—from more than six percentage points for micro-caps and mid-caps to more than 10 percentage points for the largest 200 U.S. companies by market capitalization.
Most sectors of the stock market advanced during the reporting period, with energy and telecommunication services being notable exceptions. Energy stocks declined as oil prices fell despite moves by the Organization of Petroleum Exporting Countries (OPEC) intended to limit oil production by its members. Telecommunication services stocks tended to decline as competition increased and rising interest rates made dividend payouts less appealing.
In March and June of 2017, the Federal Reserve announced successive increases in the target range for the federal funds rate, ultimately bringing the federal funds target range to 1.00% to 1.25%. While short-term U.S. Treasury yields rose in response, yields for U.S. Treasury securities with maturities of five years or longer declined. As the difference between short- and long-term yields narrowed, the advantages of higher-yielding long-term bonds became increasingly apparent.
Virtually all taxable and tax-exempt bond sectors provided positive total returns during the reporting period. Mortgage-backed
securities, though providing positive total returns, faced headwinds when the Federal Reserve announced plans to begin normalizing its balance sheet by reducing reinvestment of principal payments on mortgage-backed securities.
International stock and bond markets were also strong during the reporting period. International stocks provided double-digit total returns that were surpassed by emerging-market stocks as a whole. Global investment-grade bonds provided single-digit returns; and emerging-market debt was somewhat stronger.
Even during periods of favorable market performance and generally positive returns, MainStay believes that it is important to carefully monitor your investments. Your risk tolerance may
change over time, leading you to reevaluate which MainStay VP Portfolios are most appropriate for your long-term goals. Your goals themselves may also change, leading you to pursue investments with more or less risk. The portfolio managers of MainStay VP Portfolios seek to provide results consistent with the investment objectives of their respective Portfolios, to give you a wide range of choices suitable to various investment needs.
The report that follows provides more detailed information about the specific markets, securities and investment decisions that influenced your MainStay VP Portfolio during the six months ended June 30, 2017. We invite you to review the report carefully as part of your ongoing investment evaluation and review.
Sincerely,

Stephen P. Fisher
President
The opinions expressed are as of the date of the accompanying report and are subject to change. Past performance is no guarantee of future results. There is no guarantee that any forecasts made will come to pass. This material does not constitute investment advice and is not intended as an endorsement of any specific investment.
Not all MainStay VP Portfolios and/or share classes are available under all policies.
Not part of the Semiannual Report
Table of Contents
Investors should refer to the Portfolio’s Summary Prospectus and/or Prospectus and consider the Portfolio’s investment objectives, strategies, risks, charges and expenses carefully before investing. The Summary Prospectus and/or Prospectus contain this and other information about the Portfolio. You may obtain copies of the Portfolio’s Summary Prospectus and/or the Prospectus and the Statement of Additional Information free of charge, upon request, by calling toll-free 800-598-2019, by writing to New York Life Insurance and Annuity Corporation, 51 Madison Avenue, Room 251, New York, New York 10010 or by sending an email to MainStayShareholdersServices@nylim.com. These documents are also available at mainstayinvestments.com/vpdocuments. Please read the Summary Prospectus and/or Prospectus carefully before investing. MainStay VP Funds Trust portfolios are separate account options which are purchased through a variable insurance or variable annuity contract.
Investment and Performance Comparison1 (Unaudited)
Performance data quoted represents past performance. Past performance is no guarantee of future results. Because of market volatility and other factors, current performance may be lower or higher than the figures shown. Investment return and principal value will fluctuate, and as a result, when shares are redeemed, they may be worth more or less than their original cost. The performance table and graph do not reflect any deduction of sales charges, mortality and expense charges, contract charges or administrative charges. Please refer to the Performance Summary appropriate for your policy. For performance information current to the most recent month-end, please call 800-598-2019 or visit www.newyorklife.com.
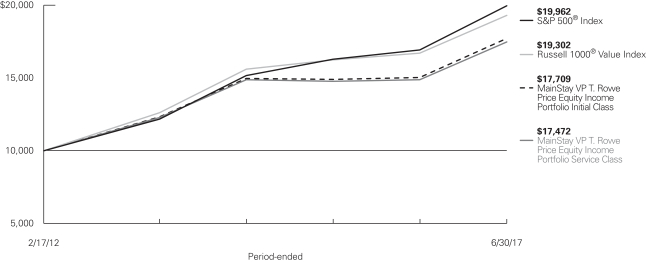
Average Annual Total Returns for the Period Ended June 30, 2017
| | | | | | | | | | | | | | | | | | | | | | |
| Class | | Inception
Date | | Six Months | | | One Year | | | Five Years | | | Ten Years
or Since
Inception | | | Gross
Expense
Ratio2 | |
| Initial Class Shares | | 2/17/2012 | | | 5.52 | % | | | 17.80 | % | | | 12.22 | % | | | 11.23 | % | | | 0.78 | % |
| Service Class Shares | | 2/17/2012 | | | 5.39 | | | | 17.51 | | | | 11.94 | | | | 10.95 | | | | 1.03 | |
| | | | | | | | | | | | | | | | |
| Benchmark Performance | | Six
Months | | | One
Year | | | Five
Years | | | Ten Years
or Since
Inception | |
Russell 1000® Value Index3 | | | 4.66 | % | | | 15.53 | % | | | 13.94 | % | | | 13.04 | % |
S&P 500® Index4 | | | 9.34 | | | | 17.90 | | | | 14.63 | | | | 13.75 | |
Average Lipper Variable Products Equity Income Portfolio5 | | | 5.91 | | | | 14.84 | | | | 12.21 | | | | 11.48 | |
| 1. | Performance figures reflect certain fee waivers and/or expense limitations, without which total returns may have been different. For information on current fee waivers and/or expense limitations (if any), please refer to the Notes to Financial Statements. |
| 2. | The gross expense ratios presented reflect the Portfolio’s “Total Annual Portfolio Operating Expenses” from the most recent Prospectus and may differ from other expense ratios disclosed in this report. |
| 3. | The Russell 1000® Value Index is the Portfolio’s primary broad-based securities market index for comparison purposes. The Russell 1000® Value Index measures the performance of the large-cap value segment of the U.S. equity universe. It includes those Russell 1000® Index companies with lower price-to-book ratios and lower expected growth values. Results assume reinvestment of all dividends and capital gains. An investment cannot be made directly in an index. |
| 4. | The S&P 500® Index is the Portfolio’s secondary benchmark. “S&P 500®” is a trademark of the McGraw-Hill Companies, Inc. The S&P 500® Index is widely regarded as the standard index for measuring large-cap U.S. stock market performance. Results assume reinvestment of all dividends and capital gains. An investment cannot be made directly in an index. |
| 5. | The Average Lipper Variable Products Equity Income Portfolio is representative of portfolios that, by portfolio practice, seek relatively high current income and growth of income through investing 65% or more of their portfolio in equities. This benchmark is a product of Lipper Inc. Lipper Inc. is an independent monitor of fund performance. Results are based on average total returns of similar portfolios with all dividend and capital gain distributions reinvested. |
Cost in Dollars of a $1,000 Investment in MainStay VP T. Rowe Price Equity Income Portfolio (Unaudited)
The example below is intended to describe the fees and expenses borne by shareholders during the six-month period from January 1, 2017 to June 30, 2017, and the impact of those costs on your investment.
Example
As a shareholder of the Portfolio, you incur two types of costs: (1) transaction costs, including exchange fees and sales charges (loads) on purchases (as applicable), and (2) ongoing costs, including management fees, distribution and/or service (12b-1) fees, and other Portfolio expenses (as applicable). This example is intended to help you understand your ongoing costs (in dollars) of investing in the Portfolio and to compare these costs with the ongoing costs of investing in other mutual funds. The example is based on an investment of $1,000 made at the beginning of the six-month period and held for the entire period from January 1, 2017 to June 30, 2017. Shares are only sold in connection with variable life and annuity contracts and the example does not reflect any contract level or transactional fees or expenses. If these costs had been included, your costs would have been higher.
This example illustrates your Portfolio’s ongoing costs in two ways:
Actual Expenses
The second and third data columns in the table below provide information about actual account values and actual expenses. You may use the information in these columns, together with the amount you invested, to estimate the expenses that you paid during the six months ended June 30, 2017. Simply divide your account value by $1,000
(for example, an $8,600 account value divided by $1,000 = 8.6), then multiply the result by the number under the heading entitled “Expenses Paid During Period” to estimate the expenses you paid on your account during this period.
Hypothetical Example for Comparison Purposes
The fourth and fifth data columns in the table below provide information about hypothetical account values and hypothetical expenses based on the Portfolio’s actual expense ratio and an assumed rate of return of 5% per year before expenses, which is not the Portfolio’s actual return. The hypothetical account values and expenses may not be used to estimate the actual ending account balances or expenses you paid for the six-month period shown. You may use this information to compare the ongoing costs of investing in the Portfolio with the ongoing costs of investing in other mutual funds. To do so, compare this 5% hypothetical example with the 5% hypothetical examples that appear in the shareholder reports of the other mutual funds.
Please note that the expenses shown in the table are meant to highlight your ongoing costs only and do not reflect any transactional costs, such as exchange fees or sales charges (loads). Therefore, the fourth and fifth data columns of the table are useful in comparing ongoing costs only and will not help you determine the relative total costs of owning different funds. In addition, if these transactional costs were included, your costs would have been higher.
| | | | | | | | | | | | | | | | | | | | | | |
| | | | | | | | | | | | | | | | | | |
| Share Class | | Beginning
Account
Value
1/1/17 | | | Ending Account
Value (Based
on Actual
Returns and
Expenses)
6/30/17 | | | Expenses
Paid
During
Period1 | | | Ending Account
Value (Based
on Hypothetical
5% Annualized
Return and
Actual Expenses)
6/30/17 | | | Expenses
Paid
During
Period1 | | | Net Expense
Ratio
During
Period2 |
| | | | | | |
| Initial Class Shares | | $ | 1,000.00 | | | $ | 1,055.20 | | | $ | 3.92 | | | $ | 1,021.00 | | | $ | 3.86 | | | 0.77% |
| | | | | | |
| Service Class Shares | | $ | 1,000.00 | | | $ | 1,053.90 | | | $ | 5.19 | | | $ | 1,019.70 | | | $ | 5.11 | | | 1.02% |
| 1. | Expenses are equal to the Portfolio’s annualized expense ratio of each class multiplied by the average account value over the period, divided by 365 and multiplied by 181 (to reflect the six-month period). The table above represents the actual expenses incurred during the six-month period. |
| 2. | Expenses are equal to the Portfolio’s annualized expense ratio to reflect the six-month period. |
| | |
| 6 | | MainStay VP T. Rowe Price Equity Income Portfolio |
Industry Composition as of June 30, 2017 (Unaudited)
| | | | |
| Banks | | | 12.1 | % |
| Oil, Gas & Consumable Fuels | | | 9.5 | |
| Capital Markets | | | 6.9 | |
| Insurance | | | 6.0 | |
| Pharmaceuticals | | | 6.0 | |
| Electric Utilities | | | 5.4 | |
| Media | | | 4.0 | |
| Semiconductors & Semiconductor Equipment | | | 3.4 | |
| Machinery | | | 2.7 | |
| Chemicals | | | 2.6 | |
| Communications Equipment | | | 2.6 | |
| Diversified Telecommunication Services | | | 2.6 | |
| Health Care Equipment & Supplies | | | 2.6 | |
| Food Products | | | 2.5 | |
| Software | | | 2.2 | |
| Equity Real Estate Investment Trusts (REITs) | | | 2.1 | |
| Aerospace & Defense | | | 2.0 | |
| Beverages | | | 1.7 | |
| Building Products | | | 1.7 | |
| Health Care Providers & Services | | | 1.7 | |
| Hotels, Restaurants & Leisure | | | 1.5 | |
| Industrial Conglomerates | | | 1.3 | |
| Technology Hardware, Storage & Peripherals | | | 1.2 | |
| | | | |
| Air Freight & Logistics | | | 1.1 | % |
| Multi-Utilities | | | 1.1 | |
| Biotechnology | | | 1.0 | |
| Containers & Packaging | | | 1.0 | |
| Multiline Retail | | | 1.0 | |
| Electrical Equipment | | | 0.9 | |
| Food & Staples Retailing | | | 0.9 | |
| Construction Materials | | | 0.8 | |
| Airlines | | | 0.7 | |
| Tobacco | | | 0.7 | |
| Auto Components | | | 0.6 | |
| Consumer Finance | | | 0.6 | |
| Leisure Products | | | 0.6 | |
| Metals & Mining | | | 0.6 | |
| Personal Products | | | 0.5 | |
| Automobiles | | | 0.4 | |
| Electronic Equipment, Instruments & Components | | | 0.4 | |
| Independent Power & Renewable Electricity Producers | | | 0.3 | |
| Wireless Telecommunication Services | | | 0.3 | |
| Short-Term Investment | | | 2.1 | |
| Other Assets, Less Liabilities | | | 0.1 | |
| | | | |
| | | 100.0 | % |
| | | | |
See Portfolio of Investments beginning on page 11 for specific holdings within these categories.
Top Ten Holdings as of June 30, 2017 (excluding short-term investment) (Unaudited)
| 8. | Verizon Communications, Inc. |
Portfolio Management Discussion and Analysis (Unaudited)
Answers to the questions reflect the views of portfolio manager John D. Linehan, CFA, of T. Rowe Price Associates, Inc. (“T. Rowe”), the Portfolio’s Subadvisor.
How did MainStay VP T. Rowe Price Equity Income Portfolio perform relative to its benchmark and peers during the six months ended June 30, 2017?
For the six months ended June 30, 2017, MainStay VP T. Rowe Price Equity Income Portfolio returned 5.52% for Initial Class shares and 5.39% for Service Class shares. Over the same period, both share classes outperformed the 4.66% return of the Russell 1000® Value Index,1 which is the Portfolio’s primary benchmark, but underperformed the 9.34% return of the S&P 500® Index,1 which is the Portfolio’s secondary benchmark. Both share classes underperformed the 5.91% return of the Average Lipper2 Variable Products Equity Income Portfolio for the six months ended June 30, 2017.
What factors affected the Portfolio’s relative performance during the reporting period?
The Portfolio’s stock selection and sector weightings contributed to the Portfolio’s outperformance relative to the Russell 1000® Value Index during the reporting period.
Which sectors were the strongest positive contributors to the Portfolio’s relative performance, and which sectors were particularly weak?
Even though the energy sector provided negative absolute returns in the Portfolio and in the Russell 1000® Value Index, the sector was the most substantial positive contributor to the Portfolio’s relative performance. (Contributions take weightings and total returns into account.) This was because the Portfolio held an underweight position in energy stocks relative to the Index and because of favorable stock selection. The financials and industrials sectors also helped the Portfolio’s relative performance because of stock selection.
The consumer staples sector was the most substantial detractor from the Portfolio’s relative performance because of stock selection and an underweight position relative to the Russell 1000® Value Index. The consumer discretionary and health care sectors both detracted from the Portfolio’s relative performance because of stock selection.
During the reporting period, which individual stocks made the strongest positive contributions to the Portfolio’s absolute performance and which stocks detracted the most?
At the beginning of the reporting period, shares of aerospace & defense company Boeing were already benefiting from strong sales, margins and free cash flows, as well as positive management commentary. In the second quarter of 2017, the company’s shares continued to rise after the company reported continued strength in demand for its commercial aircraft,
including a $5.8 billion deal with China Aircraft Leasing. We liked Boeing for its robust free cash flow generation, shareholder-friendly capital allocation policies and competitive position in a duopoly market that is expected to see steady airline passenger growth.
Health care providers & services company Anthem was another strong contributor to the Portfolio’s absolute performance. Anthem benefited from better-than-expected operating revenue, supported by increases in premiums and membership, as well as by strong underlying fundamentals in the managed care space. Anthem, however, also faced uncertainty related to efforts by Congress to repeal and replace the Affordable Care Act; and during the reporting period, a U.S. appeals court ruled against the company’s proposed merger with Cigna. In light of this uncertainty and the stock’s strong performance, we trimmed the Portfolio’s position.
Shares of capital markets company State Street moved higher after the company reported strong expense management. The stock also rose after the U.S. Treasury Department released its proposed regulatory changes, which could result in fewer regulations going forward. We continued to like State Street because of management’s focus on controlling costs. We believed that the company could also see earnings improve if short-term interest rates continued to rise.
Media company Twenty-First Century Fox detracted from the Portfolio’s absolute performance. Along with other media companies, the company suffered from concerns that advertising revenue was softening and that consumers’ preference for streaming services over traditional cable subscriptions was accelerating. Despite these concerns, we continued to like the company for its high-quality “must see” content, including sports and news programming.
Shares of diversified telecommunication services company Verizon Communications fell after the company missed analysts’ earnings expectations. The miss came amid heightened competition among wireless operators. Despite these headwinds, however, we believed that the company was well managed and could benefit from a recurring revenue business, low churn and predictable free cash flow. In our opinion, the company offers an attractive dividend yield and could benefit from tax reform.
Industrial conglomerate General Electric also detracted from the Portfolio’s absolute performance. A leader in many industrial businesses, the company has valuable assets in its diversified segments and has largely divested its financial services portfolio to increase its focus on the company’s core industrial segments. General Electric, however, has an upcoming management transition and faces questions about its growth potential
| 1. | See footnote on page 5 for more information on this index. |
| 2. | See footnote on page 5 for more information on Lipper Inc. |
| | |
| 8 | | MainStay VP T. Rowe Price Equity Income Portfolio |
and its pension shortfalls. We sold a portion of the Portfolio’s shares to pursue what we viewed to be more attractive investment opportunities in industrials and other sectors.
Did the Portfolio make any significant purchases or sales during the reporting period?
The Portfolio initiated a position in Tyson Foods during the reporting period. We liked the company’s focus on increasing its higher-margin prepared food business, which we believe may offer improved product diversity and could lead to stronger, less-volatile earnings over the long term. The Portfolio increased its position in regional bank U.S. Bancorp, which has a strong expense discipline and a superior business mix. This mix includes payments businesses as well as traditional lending products. We increased the position because we believed that the bank was well-positioned to benefit from rising interest rates, favorable policy and regulatory changes, and earnings stability in the financials sector. Although Wells Fargo traded higher following the U.S. presidential election and into 2017, the Portfolio bought shares of the bank because we believed that it would continue to feature attractive long-term fundamentals and growth prospects. Wells Fargo has taken steps to address concerns raised in 2016 about sales tactics and accusations that employees created fraudulent accounts for retail customers.
American Express performed well since late 2016 because of broader sector-friendly developments and strong quarterly results. Unfortunately, the company is facing longer-term competitive headwinds as credit card issuers offer increasingly generous rewards and charge lower fees. In this environment, the company has increased its marketing and promotional spending. While American Express features a strong brand and superior customer service, we believed that earnings growth could be challenged as the company navigates competitive obstacles. We took advantage of recent stock price appreciation to sell shares.
Shares of banking company Bank of America continued to advance in early 2017, driven by expectations for a friendlier regulatory environment, corporate tax reform and higher profits from bank lending as interest rates rose. Bank of America is among the U.S. market-share leaders in deposits, mortgages, credit and debit cards, and capital markets; and management has made notable progress in navigating a number of headwinds. Nevertheless, we reduced the Portfolio’s position in the company following the postelection surge.
Union Pacific is the largest freight railroad operator in the United States. The company’s shares had advanced since early 2016 as commodity prices rallied and the U.S. presidential election spurred expectations for economic growth. Following
the recent share price appreciation, we no longer found the risk/reward profile as attractive, and we eliminated the Portfolio’s position in the stock.
How did the Portfolio’s sector weightings change during the reporting period?
At the beginning of the reporting period, the Portfolio’s most substantially overweight positions relative to the Russell 1000® Value Index were in consumer discretionary and industrials. At the end of the reporting period, industrials and materials were the most substantially overweight positions. The Portfolio’s most substantial increases in relative sector weightings during the reporting period were in financials and energy.
The most substantially underweight positions relative to the Russell 1000® Value Index at the beginning of the reporting period were real estate and consumer staples. At the end of the reporting period, real estate, consumer staples and health care were the Portfolio’s most substantially underweight positions. During the reporting period, the Portfolio’s most substantial decreases in relative sector weightings occurred in consumer discretionary and health care.
Changes in the Portfolio’s relative sector weightings did not result entirely from investment decisions within the Portfolio. A portion of these changes relative to the Russell 1000® Value Index reflected the reconstitution of the Russell 1000® Value Index in late June. As part of the reconstitution, the health care and consumer discretionary sectors saw the largest weighting increases within the Index, while the financials, industrials and information technology sectors saw notable declines in Index weightings.
How was the Portfolio positioned at the end of the reporting period?
The Portfolio uses a diversified, bottom-up investment strategy with a long-term focus that has historically resulted in lower Portfolio turnover relative to peers. Changes to our sector positioning primarily result from our stock-selection process. As of June 30, 2017, the Portfolio was overweight relative to the Russell 1000® Value Index in industrials, materials and consumer discretionary. We like several names in the industrials sector, where we typically invest in companies that reach many different end markets and have solid business models and/or an ability to generate strong cash flows. Within the materials sector, the Portfolio’s largest exposures at the end of the reporting period were in the chemicals and containers & packaging industries. While these cyclical industries have faced challenges resulting from large swings in raw materials costs and from economic weakness, we believed that some companies appeared to be well-positioned should the economy improve.
The consumer discretionary sector comprises a diverse group of industries, including retailers, media companies, diversified consumer services and auto manufacturers. It continued to be a significant weighting in the Portfolio primarily because of the Portfolio’s exposure to the media industry, where the Portfolio holds companies that produce or distribute “must-see” content and typically generate strong cash flows, much of which are returned to shareholders through dividends and buybacks.
As of June 30, 2017, the Portfolio was most substantially underweight relative to its benchmark in real estate, consumer staples and health care. The vast majority of the real estate sector consists of real estate investment trusts (REITs), which own and frequently operate many different types of income-producing real estate properties. While REITs generally offer attractive dividend yields, we believed that valuations appeared
elevated and that further interest-rate hikes could continue to drive investors out of the sector. In consumer staples, we typically focus our efforts on companies with strong brands that in our view are trading at attractive valuations relative to their history. We also like the stable earnings and dividend yields that consumer staples stocks tend to provide. We have a diversified view of the health care sector, considering the myriad challenges and opportunities facing health care companies. In recent periods, valuations have fallen because of political scrutiny regarding drug pricing, uncertainty about potential health care reform, merger and acquisition approval developments, and drug trial results that have affected health care companies in different ways. Within the sector, the Portfolio’s primary exposure at the end of the reporting period was to the pharmaceuticals industry, where most of the sector’s above-average dividend-paying companies are located.
The opinions expressed are those of the portfolio manager as of the date of this report and are subject to change. There is no guarantee that any forecasts made will come to pass. This material does not constitute investment advice and is not intended as an endorsement of any specific investment.
Not all MainStay VP Portfolios and/or share classes are available under all policies.
| | |
| 10 | | MainStay VP T. Rowe Price Equity Income Portfolio |
Portfolio of Investments June 30, 2017 (Unaudited)
| | | | | | | | |
| | | Principal
Amount | | | Value | |
| Corporate Bonds 0.2%† | |
Technology Hardware, Storage & Peripherals 0.2% | |
Western Digital Corp.
10.50%, due 4/1/24 | | $ | 1,186,000 | | | $ | 1,399,101 | |
| | | | | | | | |
Total Corporate Bond
(Cost $1,180,708) | | | | | | | 1,399,101 | |
| | | | | | | | |
| | |
| | | | | | | | |
| | |
| | | Shares | | | | |
| Common Stocks 95.8% | |
Aerospace & Defense 2.0% | | | | | | | | |
¨Boeing Co. | | | 78,800 | | | | 15,582,700 | |
United Technologies Corp. | | | 8,600 | | | | 1,050,146 | |
| | | | | | | | |
| | | | | | | 16,632,846 | |
| | | | | | | | |
Air Freight & Logistics 1.1% | | | | | | | | |
United Parcel Service, Inc. Class B | | | 82,200 | | | | 9,090,498 | |
| | | | | | | | |
| | |
Airlines 0.7% | | | | | | | | |
Delta Air Lines, Inc. | | | 39,300 | | | | 2,111,982 | |
Southwest Airlines Co. | | | 56,600 | | | | 3,517,124 | |
| | | | | | | | |
| | | | | | | 5,629,106 | |
| | | | | | | | |
Auto Components 0.6% | | | | | | | | |
Adient PLC | | | 74,900 | | | | 4,896,962 | |
| | | | | | | | |
| | |
Automobiles 0.4% | | | | | | | | |
Ford Motor Co. | | | 265,700 | | | | 2,973,183 | |
| | | | | | | | |
| | |
Banks 12.1% | | | | | | | | |
Bank of America Corp. | | | 101,700 | | | | 2,467,242 | |
Citigroup, Inc. | | | 184,700 | | | | 12,352,736 | |
Fifth Third Bancorp | | | 366,900 | | | | 9,524,724 | |
¨JPMorgan Chase & Co. | | | 319,800 | | | | 29,229,720 | |
KeyCorp | | | 328,500 | | | | 6,156,090 | |
PNC Financial Services Group, Inc. | | | 61,600 | | | | 7,691,992 | |
Royal Bank of Scotland Group PLC (a) | | | 577,012 | | | | 1,857,780 | |
U.S. Bancorp | | | 200,200 | | | | 10,394,384 | |
¨Wells Fargo & Co. | | | 346,400 | | | | 19,194,024 | |
| | | | | | | | |
| | | | | | | 98,868,692 | |
| | | | | | | | |
Beverages 1.7% | | | | | | | | |
Diageo PLC | | | 141,829 | | | | 4,190,490 | |
PepsiCo., Inc. | | | 82,600 | | | | 9,539,474 | |
| | | | | | | | |
| | | | | | | 13,729,964 | |
| | | | | | | | |
Biotechnology 1.0% | | | | | | | | |
Gilead Sciences, Inc. | | | 119,000 | | | | 8,422,820 | |
| | | | | | | | |
| | | | | | | | |
| | |
| | | Shares | | | Value | |
Building Products 1.7% | | | | | | | | |
Johnson Controls International PLC | | | 312,704 | | | $ | 13,558,845 | |
| | | | | | | | |
| | |
Capital Markets 6.9% | | | | | | | | |
Ameriprise Financial, Inc. | | | 79,900 | | | | 10,170,471 | |
Bank of New York Mellon Corp. | | | 141,200 | | | | 7,204,024 | |
¨Morgan Stanley | | | 380,200 | | | | 16,941,712 | |
Northern Trust Corp. | | | 79,500 | | | | 7,728,195 | |
¨State Street Corp. | | | 155,700 | | | | 13,970,961 | |
| | | | | | | | |
| | | | | | | 56,015,363 | |
| | | | | | | | |
Chemicals 2.6% | | | | | | | | |
Akzo Nobel N.V. | | | 10,756 | | | | 934,763 | |
CF Industries Holdings, Inc. | | | 225,800 | | | | 6,313,368 | |
E.I. du Pont de Nemours & Co. | | | 171,000 | | | | 13,801,410 | |
| | | | | | | | |
| | | | | | | 21,049,541 | |
| | | | | | | | |
Communications Equipment 2.6% | | | | | | | | |
Cisco Systems, Inc. | | | 316,900 | | | | 9,918,970 | |
Harris Corp. | | | 106,289 | | | | 11,594,004 | |
| | | | | | | | |
| | | | | | | 21,512,974 | |
| | | | | | | | |
Construction Materials 0.8% | | | | | | | | |
Vulcan Materials Co. | | | 49,600 | | | | 6,283,328 | |
| | | | | | | | |
| | |
Consumer Finance 0.6% | | | | | | | | |
American Express Co. | | | 58,900 | | | | 4,961,736 | |
| | | | | | | | |
| | |
Containers & Packaging 1.0% | | | | | | | | |
International Paper Co. | | | 145,800 | | | | 8,253,738 | |
| | | | | | | | |
|
Diversified Telecommunication Services 2.6% | |
CenturyLink, Inc. | | | 144,200 | | | | 3,443,496 | |
Telefonica S.A. | | | 266,945 | | | | 2,755,606 | |
¨Verizon Communications, Inc. | | | 330,775 | | | | 14,772,412 | |
| | | | | | | | |
| | | | | | | 20,971,514 | |
| | | | | | | | |
Electric Utilities 4.4% | | | | | | | | |
Edison International | | | 98,400 | | | | 7,693,896 | |
Exelon Corp. | | | 166,100 | | | | 5,991,227 | |
PG&E Corp. | | | 159,300 | | | | 10,572,741 | |
Southern Co. | | | 145,620 | | | | 6,972,286 | |
Xcel Energy, Inc. | | | 93,500 | | | | 4,289,780 | |
| | | | | | | | |
| | | | | | | 35,519,930 | |
| | | | | | | | |
Electrical Equipment 0.9% | | | | | | | | |
Emerson Electric Co. | | | 130,200 | | | | 7,762,524 | |
| | | | | | | | |
|
Electronic Equipment, Instruments & Components 0.4% | |
TE Connectivity, Ltd. | | | 38,200 | | | | 3,005,576 | |
| | | | | | | | |
| † | Percentages indicated are based on Fund net assets. |
| ¨ | | Among the Portfolio’s 10 largest holdings, as of June 30, 2017, excluding short-term investment. May be subject to change daily. |
| | | | | | |
The notes to the financial statements are an integral part of,
and should be read in conjunction with, the financial statements. | | | | | 11 | |
Portfolio of Investments June 30, 2017 (Unaudited) (continued)
| | | | | | | | |
| | |
| | | Shares | | | Value | |
| Common Stocks (continued) | |
Equity Real Estate Investment Trusts (REITs) 2.1% | |
Equity Residential | | | 77,700 | | | $ | 5,114,991 | |
Rayonier, Inc. | | | 222,329 | | | | 6,396,405 | |
Weyerhaeuser Co. | | | 168,400 | | | | 5,641,400 | |
| | | | | | | | |
| | | | | | | 17,152,796 | |
| | | | | | | | |
Food & Staples Retailing 0.9% | | | | | | | | |
Wal-Mart Stores, Inc. | | | 102,700 | | | | 7,772,336 | |
| | | | | | | | |
| | |
Food Products 2.5% | | | | | | | | |
Archer-Daniels-Midland Co. | | | 198,200 | | | | 8,201,516 | |
Kellogg Co. | | | 49,900 | | | | 3,466,054 | |
Tyson Foods, Inc. Class A | | | 134,700 | | | | 8,436,261 | |
| | | | | | | | |
| | | | | | | 20,103,831 | |
| | | | | | | | |
Health Care Equipment & Supplies 1.9% | |
Becton Dickinson & Co. | | | 33,900 | | | | 6,614,229 | |
Medtronic PLC | | | 97,300 | | | | 8,635,375 | |
| | | | | | | | |
| | | | | | | 15,249,604 | |
| | | | | | | | |
Health Care Providers & Services 1.7% | |
Anthem, Inc. | | | 73,108 | | | | 13,753,808 | |
| | | | | | | | |
|
Hotels, Restaurants & Leisure 1.5% | |
Carnival Corp. | | | 57,200 | | | | 3,750,604 | |
Las Vegas Sands Corp. | | | 135,578 | | | | 8,662,078 | |
| | | | | | | | |
| | | | | | | 12,412,682 | |
| | | | | | | | |
Independent Power & Renewable Electricity Producers 0.3% | |
AES Corp. | | | 187,000 | | | | 2,077,570 | |
| | | | | | | | |
| | |
Industrial Conglomerates 1.3% | | | | | | | | |
General Electric Co. | | | 379,600 | | | | 10,252,996 | |
| | | | | | | | |
| | |
Insurance 6.0% | | | | | | | | |
American International Group, Inc. | | | 84,500 | | | | 5,282,940 | |
Chubb, Ltd. | | | 27,858 | | | | 4,049,996 | |
Loews Corp. | | | 261,400 | | | | 12,236,134 | |
Marsh & McLennan Cos., Inc. | | | 88,700 | | | | 6,915,052 | |
MetLife, Inc. | | | 237,900 | | | | 13,070,226 | |
Willis Towers Watson PLC | | | 31,743 | | | | 4,617,337 | |
XL Group, Ltd. | | | 65,600 | | | | 2,873,280 | |
| | | | | | | | |
| | | | | | | 49,044,965 | |
| | | | | | | | |
Leisure Products 0.6% | | | | | | | | |
Mattel, Inc. | | | 236,600 | | | | 5,093,998 | |
| | | | | | | | |
| | |
Machinery 2.7% | | | | | | | | |
Cummins, Inc. | | | 18,000 | | | | 2,919,960 | |
Flowserve Corp. | | | 83,705 | | | | 3,886,423 | |
Illinois Tool Works, Inc. | | | 68,900 | | | | 9,869,925 | |
Pentair PLC | | | 79,800 | | | | 5,309,892 | |
| | | | | | | | |
| | | | | | | 21,986,200 | |
| | | | | | | | |
| | | | | | | | |
| | |
| | | Shares | | | Value | |
Media 4.0% | | | | | | | | |
Comcast Corp. Class A | | | 269,600 | | | $ | 10,492,832 | |
News Corp. Class A | | | 486,500 | | | | 6,665,050 | |
Time Warner, Inc. | | | 9,400 | | | | 943,854 | |
Twenty-First Century Fox, Inc. Class B | | | 416,900 | | | | 11,619,003 | |
Walt Disney Co. | | | 29,100 | | | | 3,091,875 | |
| | | | | | | | |
| | | | | | | 32,812,614 | |
| | | | | | | | |
Metals & Mining 0.6% | | | | | | | | |
Nucor Corp. | | | 81,000 | | | | 4,687,470 | |
| | | | | | | | |
| | |
Multi-Utilities 1.0% | | | | | | | | |
NiSource, Inc. | | | 328,500 | | | | 8,330,760 | |
| | | | | | | | |
| | |
Multiline Retail 1.0% | | | | | | | | |
Kohl’s Corp. | | | 130,300 | | | | 5,038,701 | |
Macy’s, Inc. | | | 120,000 | | | | 2,788,800 | |
| | | | | | | | |
| | | | | | | 7,827,501 | |
| | | | | | | | |
Oil, Gas & Consumable Fuels 9.5% | | | | | | | | |
Apache Corp. | | | 134,360 | | | | 6,439,875 | |
Canadian Natural Resources, Ltd. | | | 110,800 | | | | 3,195,472 | |
Chevron Corp. | | | 79,300 | | | | 8,273,369 | |
EQT Corp. | | | 27,370 | | | | 1,603,608 | |
¨Exxon Mobil Corp. | | | 245,100 | | | | 19,786,923 | |
Hess Corp. | | | 151,800 | | | | 6,659,466 | |
Occidental Petroleum Corp. | | | 161,100 | | | | 9,645,057 | |
Royal Dutch Shell PLC Class A, Sponsored ADR | | | 111,500 | | | | 5,930,685 | |
¨Total S.A. | | | 294,704 | | | | 14,569,561 | |
Transcanada Corp. | | | 24,300 | | | | 1,158,381 | |
| | | | | | | | |
| | | | | | | 77,262,397 | |
| | | | | | | | |
Personal Products 0.5% | | | | | | | | |
Avon Products, Inc. (a) | | | 129,500 | | | | 492,100 | |
Coty, Inc. Class A | | | 203,093 | | | | 3,810,025 | |
| | | | | | | | |
| | | | | | | 4,302,125 | |
| | | | | | | | |
Pharmaceuticals 6.0% | | | | | | | | |
Bristol-Myers Squibb Co. | | | 133,100 | | | | 7,416,332 | |
GlaxoSmithKline PLC | | | 209,942 | | | | 4,472,093 | |
¨Johnson & Johnson | | | 126,200 | | | | 16,694,998 | |
Merck & Co., Inc. | | | 121,700 | | | | 7,799,753 | |
Pfizer, Inc. | | | 369,900 | | | | 12,424,941 | |
| | | | | | | | |
| | | | | | | 48,808,117 | |
| | | | | | | | |
Semiconductors & Semiconductor Equipment 3.4% | |
Analog Devices, Inc. | | | 30,700 | | | | 2,388,460 | |
Applied Materials, Inc. | | | 208,400 | | | | 8,609,004 | |
QUALCOMM, Inc. | | | 220,800 | | | | 12,192,576 | |
Texas Instruments, Inc. | | | 60,700 | | | | 4,669,651 | |
| | | | | | | | |
| | | | | | | 27,859,691 | |
| | | | | | | | |
Software 2.2% | | | | | | | | |
CA, Inc. | | | 41,900 | | | | 1,444,293 | |
¨Microsoft Corp. | | | 237,000 | | | | 16,336,410 | |
| | | | | | | | |
| | | | | | | 17,780,703 | |
| | | | | | | | |
| | | | |
| 12 | | MainStay VP T. Rowe Price Equity Income Portfolio | | The notes to the financial statements are an integral part of,
and should be read in conjunction with, the financial statements. |
| | | | | | | | |
| | |
| | | Shares | | | Value | |
| Common Stocks (continued) | |
Technology Hardware, Storage & Peripherals 1.0% | |
Apple, Inc. | | | 24,000 | | | $ | 3,456,480 | |
Western Digital Corp. | | | 52,700 | | | | 4,669,220 | |
| | | | | | | | |
| | | | | | | 8,125,700 | |
| | | | | | | | |
Tobacco 0.7% | | | | | | | | |
Philip Morris International, Inc. | | | 48,500 | | | | 5,696,325 | |
| | | | | | | | |
|
Wireless Telecommunication Services 0.3% | |
Vodafone Group PLC | | | 841,401 | | | | 2,386,284 | |
| | | | | | | | |
Total Common Stocks
(Cost $652,725,684) | | | | | | | 779,919,613 | |
| | | | | | | | |
|
| Convertible Preferred Stocks 1.8% | |
Electric Utilities 1.0% | | | | | | | | |
Great Plains Energy, Inc.
7.00% | | | 45,287 | | | | 2,402,022 | |
Nextera Energy, Inc.
6.123% | | | 105,786 | | | | 5,713,502 | |
| | | | | | | | |
| | | | | | | 8,115,524 | |
| | | | | | | | |
Health Care Equipment & Supplies 0.7% | | | | | | | | |
Becton Dickinson & Co.
Series A
6.125% | | | 102,349 | | | | 5,606,678 | |
| | | | | | | | |
| | |
Multi-Utilities 0.1% | | | | | | | | |
DTE Energy Co.
6.50% | | | 23,834 | | | | 1,307,295 | |
| | | | | | | | |
Total Convertible Preferred Stocks
(Cost $13,754,462) | | | | | | | 15,029,497 | |
| | | | | | | | |
| | | | | | | | |
| | | Principal
Amount | | | Value | |
| Short-Term Investment 2.1% | |
Repurchase Agreement 2.1% | | | | | | | | |
Fixed Income Clearing Corp.
0.12%, dated 6/30/17
due 7/3/17
Proceeds at Maturity $17,455,515 (Collateralized by a United States Treasury Note with a rate of 1.125% and a maturity date of 9/30/21, with a Principal Amount of $18,230,000 and a Market Value of $17,806,772) | | $ | 17,455,340 | | | $ | 17,455,340 | |
| | | | | | | | |
Total Short-Term Investment
(Cost $17,455,340) | | | | | | | 17,455,340 | |
| | | | | | | | |
Total Investments
(Cost $685,116,194) (b) | | | 99.9 | % | | | 813,803,551 | |
Other Assets, Less Liabilities | | | 0.1 | | | | 727,438 | |
Net Assets | | | 100.0 | % | | $ | 814,530,989 | |
| (a) | Non-income producing security. |
| (b) | As of June 30, 2017, cost was $686,567,382 for federal income tax purposes and net unrealized appreciation was as follows: |
| | | | |
Gross unrealized appreciation | | $ | 153,776,598 | |
Gross unrealized depreciation | | | (26,540,429 | ) |
| | | | |
Net unrealized appreciation | | $ | 127,236,169 | |
| | | | |
The following abbreviation is used in the preceding pages:
ADR—American Depositary Receipt
The following is a summary of the fair valuations according to the inputs used as of June 30, 2017, for valuing the Portfolio’s assets.
Asset Valuation Inputs
| | | | | | | | | | | | | | | | | | | | |
Description | | Quoted
Prices in
Active
Markets for
Identical
Assets (Level 1) | | | Significant
Other
Observable
Inputs (Level 2) | | | Significant
Unobservable
Inputs (Level 3) | | | Total | | | | |
| Investments in Securities (a) | | | | | | | | | | | | | | | | | | | | |
| Corporate Bond | | $ | — | | | $ | 1,399,101 | | | $ | — | | | $ | 1,399,101 | | | | | |
| Common Stocks | | | 779,919,613 | | | | — | | | | — | | | | 779,919,613 | | | | | |
| Convertible Preferred Stocks | | | 15,029,497 | | | | — | | | | — | | | | 15,029,497 | | | | | |
| Short-Term Investment | | | | | | | | | | | | | | | | | | | | |
Repurchase Agreement | | | — | | | | 17,455,340 | | | | — | | | | 17,455,340 | | | | | |
| | | | | | | | | | | | | | | | | | | | |
| Total Investments in Securities | | $ | 794,949,110 | | | $ | 18,854,441 | | | $ | — | | | $ | 813,803,551 | | | | | |
| | | | | | | | | | | | | | | | | | | | |
| (a) | For a complete listing of investments and their industries, see the Portfolio of Investments. |
The Portfolio recognizes transfers between the levels as of the beginning of the period.
As of June 30, 2017, certain foreign equity securities with a market value of $30,206,253 were transferred from Level 2 to Level 1 as the prices of these securities were based on observable quoted prices in active markets. (see Note 2)
As of June 30, 2017, the Portfolio did not hold any investments with significant unobservable inputs (Level 3). (See Note 2)
| | | | | | |
The notes to the financial statements are an integral part of,
and should be read in conjunction with, the financial statements. | | | | | 13 | |
Statement of Assets and Liabilities as of June 30, 2017 (Unaudited)
| | | | |
| Assets | |
Investment in securities, at value
(identified cost $685,116,194) | | $ | 813,803,551 | |
Cash denominated in foreign currencies
(identified cost $221,596) | | | 226,779 | |
Receivables: | |
Dividends and interest | | | 1,290,387 | |
Investment securities sold | | | 1,014,000 | |
Fund shares sold | | | 44,048 | |
Other assets | | | 4,542 | |
| | | | |
Total assets | | | 816,383,307 | |
| | | | |
| |
| Liabilities | | | | |
Payables: | |
Investment securities purchased | | | 896,754 | |
Manager (See Note 3) | | | 497,730 | |
Fund shares redeemed | | | 267,683 | |
Shareholder communication | | | 77,825 | |
NYLIFE Distributors (See Note 3) | | | 67,794 | |
Professional fees | | | 24,302 | |
Custodian | | | 11,140 | |
Trustees | | | 1,379 | |
Accrued expenses | | | 7,711 | |
| | | | |
Total liabilities | | | 1,852,318 | |
| | | | |
Net assets | | $ | 814,530,989 | |
| | | | |
| |
| Composition of Net Assets | | | | |
Shares of beneficial interest outstanding (par value of $.001 per share) unlimited number of shares authorized | | $ | 59,542 | |
Additional paid-in capital | | | 601,940,950 | |
| | | | |
| | | 602,000,492 | |
Undistributed net investment income | | | 23,789,960 | |
Accumulated net realized gain (loss) on investments and foreign currency transactions | | | 60,045,273 | |
Net unrealized appreciation (depreciation) on investments | | | 128,687,357 | |
Net unrealized appreciation (depreciation) on translation of other assets and liabilities in foreign currencies | | | 7,907 | |
| | | | |
Net assets | | $ | 814,530,989 | |
| | | | |
| | | | |
Initial Class | | | | |
Net assets applicable to outstanding shares | | $ | 484,197,147 | |
| | | | |
Shares of beneficial interest outstanding | | | 35,326,364 | |
| | | | |
Net asset value per share outstanding | | $ | 13.71 | |
| | | | |
Service Class | |
Net assets applicable to outstanding shares | | $ | 330,333,842 | |
| | | | |
Shares of beneficial interest outstanding | | | 24,215,346 | |
| | | | |
Net asset value per share outstanding | | $ | 13.64 | |
| | | | |
| | | | |
| 14 | | MainStay VP T. Rowe Price Equity Income Portfolio | | The notes to the financial statements are an integral part of,
and should be read in conjunction with, the financial statements. |
Statement of Operations for the six months ended June 30, 2017 (Unaudited)
| | | | |
| Investment Income (Loss) | |
Income | | | | |
Dividends (a) | | $ | 10,430,977 | |
Interest | | | 68,543 | |
| | | | |
Total income | | | 10,499,520 | |
| | | | |
Expenses | |
Manager (See Note 3) | | | 2,962,998 | |
Distribution/Service—Service Class (See Note 3) | | | 402,577 | |
Shareholder communication | | | 58,750 | |
Professional fees | | | 41,172 | |
Trustees | | | 9,973 | |
Custodian | | | 8,700 | |
Miscellaneous | | | 17,305 | |
| | | | |
Total expenses | | | 3,501,475 | |
| | | | |
Net investment income (loss) | | | 6,998,045 | |
| | | | |
|
| Realized and Unrealized Gain (Loss) on Investments and Foreign Currency Transactions | |
Net realized gain (loss) on: | | | | |
Investment transactions | | | 24,692,455 | |
Foreign currency transactions | | | 7,584 | |
| | | | |
Net realized gain (loss) on investments and foreign currency transactions | | | 24,700,039 | |
| | | | |
Net change in unrealized appreciation (depreciation) on: | |
Investments | | | 11,299,118 | |
Translation of other assets and liabilities in foreign currencies | | | 7,488 | |
| | | | |
Net change in unrealized appreciation (depreciation) on investments and foreign currency transactions | | | 11,306,606 | |
| | | | |
Net realized and unrealized gain (loss) on investments and foreign currency transactions | | | 36,006,645 | |
| | | | |
Net increase (decrease) in net assets resulting from operations | | $ | 43,004,690 | |
| | | | |
| (a) | Dividends recorded net of foreign withholding taxes in the amount of $124,243. |
| | | | | | |
The notes to the financial statements are an integral part of,
and should be read in conjunction with, the financial statements. | | | | | 15 | |
Statements of Changes in Net Assets
for the six months ended June 30, 2017 (Unaudited) and the year ended December 31, 2016
| | | | | | | | |
| | | 2017 | | | 2016 | |
| Increase (Decrease) in Net Assets | |
Operations: | | | | | | | | |
Net investment income (loss) | | $ | 6,998,045 | | | $ | 15,853,298 | |
Net realized gain (loss) on investments and foreign currency transactions | | | 24,700,039 | | | | 36,727,621 | |
Net change in unrealized appreciation (depreciation) on investments and foreign currency transactions | | | 11,306,606 | | | | 78,755,371 | |
| | | | |
Net increase (decrease) in net assets resulting from operations | | | 43,004,690 | | | | 131,336,290 | |
| | | | |
Dividends and distributions to shareholders: | | | | | | | | |
From net investment income: | | | | | | | | |
Initial Class | | | — | | | | (9,268,385 | ) |
Service Class | | | — | | | | (4,972,626 | ) |
| | | | |
| | | — | | | | (14,241,011 | ) |
| | | | |
From net realized gain on investments: | | | | | | | | |
Initial Class | | | — | | | | (32,756,863 | ) |
Service Class | | | — | | | | (20,271,168 | ) |
| | | | |
| | | — | | | | (53,028,031 | ) |
| | | | |
Total dividends and distributions to shareholders | | | — | | | | (67,269,042 | ) |
| | | | |
Capital share transactions: | | | | | | | | |
Net proceeds from sale of shares | | | 38,341,461 | | | | 54,414,434 | |
Net asset value of shares issued to shareholders in reinvestment of dividends and distributions | | | — | | | | 67,269,042 | |
Cost of shares redeemed | | | (56,999,025 | ) | | | (150,724,784 | ) |
| | | | |
Increase (decrease) in net assets derived from capital share transactions | | | (18,657,564 | ) | | | (29,041,308 | ) |
| | | | |
Net increase (decrease) in net assets | | | 24,347,126 | | | | 35,025,940 | |
|
| Net Assets | |
Beginning of period | | | 790,183,863 | | | | 755,157,923 | |
| | | | |
End of period | | $ | 814,530,989 | | | $ | 790,183,863 | |
| | | | |
Undistributed net investment income at end of period | | $ | 23,789,960 | | | $ | 16,791,915 | |
| | | | |
| | | | |
| 16 | | MainStay VP T. Rowe Price Equity Income Portfolio | | The notes to the financial statements are an integral part of,
and should be read in conjunction with, the financial statements. |
Financial Highlights selected per share data and ratios
| | | | | | | | | | | | | | | | | | | | | | | | | | | | |
| | | Six months
ended
June 30, | | | | | | Year ended December 31, | | | February 17,
2012**
through
December 31, | |
| Initial Class | | 2017* | | | | | | 2016 | | | 2015 | | | 2014 | | | 2013 | | | 2012 | |
Net asset value at beginning of period | | $ | 12.99 | | | | | | | $ | 11.97 | | | $ | 13.90 | | | $ | 13.77 | | | $ | 10.79 | | | $ | 10.00 | |
| | | | | | | | | | | | | | | | | | | | | | | | | | | | |
Net investment income (loss) (a) | | | 0.12 | | | | | | | | 0.27 | | | | 0.25 | | | | 0.26 | | | | 0.21 | | | | 0.19 | |
Net realized and unrealized gain (loss) on investments | | | 0.60 | | | | | | | | 1.90 | | | | (1.21 | ) | | | 0.78 | | | | 3.03 | | | | 0.60 | |
Net realized and unrealized gain (loss) on foreign currency transactions | | | 0.00 | ‡ | | | | | | | (0.00 | )‡ | | | (0.00 | )‡ | | | (0.00 | )‡ | | | — | | | | — | |
| | | | | | | | | | | | | | | | | | | | | | | | | | | | |
Total from investment operations | | | 0.72 | | | | | | | | 2.17 | | | | (0.96 | ) | | | 1.04 | | | | 3.24 | | | | 0.79 | |
| | | | | | | | | | | | | | | | | | | | | | | | | | | | |
| Less dividends and distributions: | | | | | | | | | | | | | | | | | | | | | | | | | | | | |
From net investment income | | | — | | | | | | | | (0.25 | ) | | | (0.24 | ) | | | (0.21 | ) | | | (0.16 | ) | | | — | |
From net realized gain on investments | | | — | | | | | | | | (0.90 | ) | | | (0.73 | ) | | | (0.70 | ) | | | (0.10 | ) | | | — | |
| | | | | | | | | | | | | | | | | | | | | | | | | | | | |
Total dividends and distributions | | | — | | | | | | | | (1.15 | ) | | | (0.97 | ) | | | (0.91 | ) | | | (0.26 | ) | | | — | |
| | | | | | | | | | | | | | | | | | | | | | | | | | | | |
Net asset value at end of period | | $ | 13.71 | | | | | | | $ | 12.99 | | | $ | 11.97 | | | $ | 13.90 | | | $ | 13.77 | | | $ | 10.79 | |
| | | | | | | | | | | | | | | | | | | | | | | | | | | | |
Total investment return (b) | | | 5.54 | %(c) | | | | | | | 18.82 | % | | | (6.78 | %) | | | 7.74 | % | | | 30.36 | % | | | 7.90 | %(c) |
| Ratios (to average net assets)/Supplemental Data: | | | | | | | | | | | | | | | | | | | | | | | | | | | | |
Net investment income (loss) | | | 1.85 | %†† | | | | | | | 2.18 | % | | | 1.90 | % | | | 1.89 | % | | | 1.72 | % | | | 2.15 | %†† |
Net expenses | | | 0.77 | %†† | | | | | | | 0.78 | % | | | 0.77 | % | | | 0.78 | % | | | 0.78 | % | | | 0.79 | %†† |
Expenses (before waiver/reimbursement) | | | 0.78 | %†† | | | | | | | 0.78 | % | | | 0.77 | % | | | 0.79 | % | | | 0.83 | % | | | 0.84 | %†† |
Portfolio turnover rate | | | 12 | % | | | | | | | 23 | % | | | 42 | % | | | 18 | % | | | 20 | % | | | 15 | % |
Net assets at end of period (in 000’s) | | $ | 484,197 | | | | | | | $ | 472,125 | | | $ | 473,818 | | | $ | 534,825 | | | $ | 448,471 | | | $ | 374,322 | |
| ‡ | Less than one cent per share. |
| (a) | Per share data based on average shares outstanding during the period. |
| (b) | Total return does not reflect any deduction of sales charges, mortality and expense charges, contract charges or administrative charges. For periods of less than one year, total return is not annualized. |
| (c) | Total investment return may reflect adjustments to conform to generally accepted accounting principles. |
| | | | | | |
The notes to the financial statements are an integral part of,
and should be read in conjunction with, the financial statements. | | | | | 17 | |
Financial Highlights selected per share data and ratios
| | | | | | | | | | | | | | | | | | | | | | | | | | | | |
| | | Six months
ended
June 30, | | | | | | Year ended December 31, | | | February 17,
2012**
through
December 31, | |
| Service Class | | 2017* | | | | | | 2016 | | | 2015 | | | 2014 | | | 2013 | | | 2012 | |
Net asset value at beginning of period | | $ | 12.94 | | | | | | | $ | 11.93 | | | $ | 13.85 | | | $ | 13.73 | | | $ | 10.76 | | | $ | 10.00 | |
| | | | | | | | | | | | | | | | | | | | | | | | | | | | |
Net investment income (loss) (a) | | | 0.11 | | | | | | | | 0.24 | | | | 0.22 | | | | 0.23 | | | | 0.18 | | | | 0.17 | |
Net realized and unrealized gain (loss) on investments | | | 0.59 | | | | | | | | 1.89 | | | | (1.21 | ) | | | 0.77 | | | | 3.03 | | | | 0.59 | |
Net realized and unrealized gain (loss) on foreign currency transactions | | | 0.00 | ‡ | | | | | | | (0.00 | )‡ | | | (0.00 | )‡ | | | (0.00 | )‡ | | | — | | | | — | |
| | | | | | | | | | | | | | | | | | | | | | | | | | | | |
Total from investment operations | | | 0.70 | | | | | | | | 2.13 | | | | (0.99 | ) | | | 1.00 | | | | 3.21 | | | | 0.76 | |
| | | | | | | | | | | | | | | | | | | | | | | | | | | | |
| Less dividends and distributions: | | | | | | | | | | | | | | | | | | | | | | | | | | | | |
From net investment income | | | — | | | | | | | | (0.22 | ) | | | (0.20 | ) | | | (0.18 | ) | | | (0.14 | ) | | | — | |
From net realized gain on investments | | | — | | | | | | | | (0.90 | ) | | | (0.73 | ) | | | (0.70 | ) | | | (0.10 | ) | | | — | |
| | | | | | | | | | | | | | | | | | | | | | | | | | | | |
Total dividends and distributions | | | — | | | | | | | | (1.12 | ) | | | (0.93 | ) | | | (0.88 | ) | | | (0.24 | ) | | | — | |
| | | | | | | | | | | | | | | | | | | | | | | | | | | | |
Net asset value at end of period | | $ | 13.64 | | | | | | | $ | 12.94 | | | $ | 11.93 | | | $ | 13.85 | | | $ | 13.73 | | | $ | 10.76 | |
| | | | | | | | | | | | | | | | | | | | | | | | | | | | |
Total investment return (b) | | | 5.41 | %(c) | | | | | | | 18.53 | % | | | (7.01 | %) | | | 7.47 | % | | | 30.04 | % | | | 7.60 | %(c) |
| Ratios (to average net assets)/Supplemental Data: | | | | | | | | | | | | | | | | | | | | | | | | | | | | |
Net investment income (loss) | | | 1.60 | %†† | | | | | | | 1.93 | % | | | 1.64 | % | | | 1.64 | % | | | 1.47 | % | | | 1.85 | %†† |
Net expenses | | | 1.02 | %†† | | | | | | | 1.03 | % | | | 1.02 | % | | | 1.03 | % | | | 1.03 | % | | | 1.04 | %†† |
Expenses (before waiver/reimbursement) | | | 1.03 | %†† | | | | | | | 1.03 | % | | | 1.02 | % | | | 1.04 | % | | | 1.08 | % | | | 1.09 | %†† |
Portfolio turnover rate | | | 12 | % | | | | | | | 23 | % | | | 42 | % | | | 18 | % | | | 20 | % | | | 15 | % |
Net assets at end of period (in 000’s) | | $ | 330,334 | | | | | | | $ | 318,059 | | | $ | 281,340 | | | $ | 323,002 | | | $ | 313,698 | | | $ | 242,081 | |
| ‡ | Less than one cent per share. |
| (a) | Per share data based on average shares outstanding during the period. |
| (b) | Total return does not reflect any deduction of sales charges, mortality and expense charges, contract charges or administrative charges. For periods of less than one year, total return is not annualized. |
| (c) | Total investment return may reflect adjustments to conform to generally accepted accounting principles. |
| | | | |
| 18 | | MainStay VP T. Rowe Price Equity Income Portfolio | | The notes to the financial statements are an integral part of,
and should be read in conjunction with, the financial statements. |
Notes to Financial Statements (Unaudited)
Note 1–Organization and Business
MainStay VP Funds Trust (the “Fund”) was organized as a Delaware statutory trust on February 1, 2011. The Fund is registered under the Investment Company Act of 1940, as amended (the “1940 Act”), as an open-end management investment company. The Fund is comprised of thirty-two separate series (collectively referred to as the “Portfolios”). These financial statements and notes relate to the MainStay VP T. Rowe Price Equity Income Portfolio (the “Portfolio”), a “diversified” portfolio, as that term is defined in the 1940 Act, as interpreted or modified by regulatory authorities having jurisdiction, from time to time.
Shares of the Portfolio are currently offered to certain separate accounts to fund variable annuity policies and variable universal life insurance policies issued by New York Life Insurance and Annuity Corporation (“NYLIAC”), a wholly-owned subsidiary of New York Life Insurance Company (“New York Life”). NYLIAC allocates shares of the Portfolios to, among others, NYLIAC Variable Annuity Separate Accounts-I, II, III and IV, VUL Separate Account-I and CSVUL Separate Account-I (collectively, the “Separate Accounts”). Shares of the Portfolio are also offered to the MainStay VP Conservative Allocation Portfolio, MainStay VP Moderate Allocation Portfolio, MainStay VP Moderate Growth Allocation Portfolio and MainStay VP Growth Allocation Portfolio, which operate as “funds-of-funds.”
The Portfolio currently offers two classes of shares. Initial Class and Service Class shares commenced operations on February 17, 2012. Shares of the Portfolio are sold and are redeemed at a price equal to their respective net asset value (“NAV”) per share. No sales or redemption charge is applicable to the purchase or redemption of the Portfolio’s shares. Under the terms of the Fund’s multiple class plan adopted pursuant to Rule 18f-3 under the 1940 Act, the classes differ in that, among other things, Service Class shares of the Portfolio pay a combined distribution and service fee of 0.25% of average daily net assets to the Distributor (as defined in Note 3(B)), pursuant to a plan adopted in accordance with Rule 12b-1 under the 1940 Act. Contract owners of variable annuity contracts purchased after June 2, 2003, are permitted to invest only in the Service Class shares.
The Portfolio’s investment objective is to seek a high level of dividend income and long-term capital growth primarily through investments in stocks.
Note 2–Significant Accounting Policies
The Portfolio is an investment company and accordingly follows the investment company accounting and reporting guidance of the Financial Accounting Standards Board (“FASB”) Accounting Standard Codification Topic 946 Financial Services—Investment Companies. The Portfolio prepares its financial statements in accordance with generally accepted accounting principles (“GAAP”) in the United States of America and follows the significant accounting policies described below.
(A) Securities Valuation. Investments are usually valued as of the close of regular trading on the New York Stock Exchange (the “Exchange”) (usually 4:00 p.m. Eastern time) on each day the Portfolio is open for business (“valuation date”).
The Board of Trustees (the “Board”) of the Fund adopted procedures establishing methodologies for the valuation of the Portfolio’s securities and other assets and delegated the responsibility for valuation determi-
nations under those procedures to the Valuation Committee of the Fund (the “Valuation Committee”). The Board authorized the Valuation Committee to appoint a Valuation Sub-Committee (the “Sub-Committee”) to deal in the first instance with establishing the prices of securities for which market quotations are not readily available or the prices of which are not otherwise readily determinable under these procedures. The Sub-Committee meets (in person, via electronic mail or via teleconference) on an as-needed basis. Subsequently, the Valuation Committee meets to ensure that actions taken by the Sub-Committee were appropriate. The procedures recognize that, subject to the oversight of the Board and unless otherwise noted, the responsibility for the day-to-day valuation of portfolio assets (including fair value measurements for the Portfolio’s assets and liabilities) rests with New York Life Investment Management LLC (“New York Life Investments” or the “Manager”), aided to whatever extent necessary by the Subadvisor (as defined in Note 3(A)) to the Portfolio.
To assess the appropriateness of security valuations, the Manager, the Subadvisor or the Portfolio’s third party service provider, who is subject to oversight by the Manager, regularly compares prior day prices, prices on comparable securities and the sale prices to the prior and current day prices and challenges prices with changes exceeding certain tolerance levels with third party pricing services or broker sources. For those securities valued through either a standardized fair valuation methodology or a fair valuation measurement, the Sub-Committee deals in the first instance with such valuation and the Valuation Committee reviews and affirms, if appropriate, the reasonableness of the valuation based on such methodologies and measurements on a regular basis after considering all relevant information that is reasonably available. Any action taken by the Sub-Committee with respect to the valuation of a portfolio security or other asset is submitted by the Valuation Committee to the Board for its review and ratification, if appropriate, at its next regularly scheduled meeting.
“Fair value” is defined as the price the Portfolio would reasonably expect to receive upon selling an asset or liability in an orderly transaction to an independent buyer in the principal or most advantageous market for the asset or liability. Fair value measurements are determined within a framework that establishes a three-tier hierarchy which maximizes the use of observable market data and minimizes the use of unobservable inputs to establish a classification of fair value measurements for disclosure purposes. “Inputs” refer broadly to the assumptions that market participants would use in pricing the asset or liability, including assumptions about risk, such as the risk inherent in a particular valuation technique used to measure fair value using a pricing model and/or the risk inherent in the inputs for the valuation technique. Inputs may be observable or unobservable. Observable inputs reflect the assumptions market participants would use in pricing the asset or liability based on market data obtained from sources independent of the Portfolio. Unobservable inputs reflect the Portfolio’s own assumptions about the assumptions market participants would use in pricing the asset or liability based on the information available. The inputs or methodology used for valuing assets or liabilities may not be an indication of the risks associated with investing in those assets or liabilities. The three-tier hierarchy of inputs is summarized below.
| • | | Level 1—quoted prices in active markets for an identical asset or liability |
Notes to Financial Statements (Unaudited) (continued)
| • | | Level 2—other significant observable inputs (including quoted prices for a similar asset or liability in active markets, interest rates and yield curves, prepayment speeds, credit risk, etc.) |
| • | | Level 3—significant unobservable inputs (including the Portfolio’s own assumptions about the assumptions that market participants would use in measuring fair value of an asset or liability) |
The level of an asset or liability within the fair value hierarchy is based on the lowest level of an input, both individually and in the aggregate, that is significant to the fair value measurement. As of June 30, 2017, the aggregate value by input level of the Portfolio’s assets and liabilities is included at the end of the Portfolio’s Portfolio of Investments.
The Portfolio may use third party vendor evaluations, whose prices may be derived from one or more of the following standard inputs, among others:
| | |
• Comparable bonds | | • Benchmark yields |
• Reported trades | | • Broker/dealer quotes |
• Two-sided markets | | • Benchmark securities |
• Bids / offers | | • Reference data (corporate actions or material event notices) |
• Industry and economic events | | • Monthly payment information |
An asset or liability for which market values cannot be measured using the methodologies described above is valued by methods deemed reasonable in good faith by the Valuation Committee, following the procedures established by the Board, to represent fair value. Under these procedures, the Portfolio generally uses a market-based approach which may use related or comparable assets or liabilities, recent transactions, market multiples, book values, and other relevant information. The Portfolio may also use an income-based valuation approach in which the anticipated future cash flows of the asset or liability are discounted to calculate fair value. Discounts may also be applied due to the nature and/or duration of any restrictions on the disposition of the asset or liability. Fair value represents a good faith approximation of the value of a security. Fair value determinations involve the consideration of a number of subjective factors, an analysis of applicable facts and circumstances and the exercise of judgment. As a result, it is possible that the fair value for a security determined in good faith in accordance with the Portfolio’s valuation procedures may differ from valuations for the same security determined by other funds using their own valuation procedures. Although the Portfolio’s valuation procedures are designed to value a security at the price the Portfolio may reasonably expect to receive upon the security’s sale in an orderly transaction, there can be no assurance that any fair value determination thereunder would, in fact, approximate the amount that the Portfolio would actually realize upon the sale of the security or the price at which the security would trade if a reliable market price were readily available. During the six-month period ended June 30, 2017, there were no material changes to the fair value methodologies.
Securities which may be valued in this manner include, but are not limited to: (i) a security for which trading has been halted or suspended; (ii) a debt security that has recently gone into default and for which there is not a current market quotation; (iii) a security of an issuer that has entered into a restructuring; (iv) a security that has been de-listed from a national exchange; (v) a security for which the market price is not
readily available from a third party pricing source or, if so provided, does not, in the opinion of the Manager or Subadvisor, reflect the security’s market value; (vi) a security subject to trading collars for which no or limited trading takes place; and (vii) a security whose principal market has been temporarily closed at a time when, under normal conditions, it would be open. Securities for which market quotations or observable inputs are not readily available are generally categorized as Level 3 in the hierarchy. As of June 30, 2017, there were no securities held by the Portfolio that were fair valued in such a manner.
Equity securities, rights and shares of Exchange-Traded Funds (“ETFs”) are valued at the last quoted sales prices as of the close of regular trading on the relevant exchange on each valuation date. Securities that are not traded on the valuation date are valued at the mean of the last quoted bid and ask prices. Prices are normally taken from the principal market in which each security trades. These securities are generally categorized as Level 1 in the hierarchy.
Debt securities (other than convertible and municipal bonds) are valued at the evaluated bid prices (evaluated mean prices in the case of convertible and municipal bonds) supplied by a pricing agent or brokers selected by the Manager, in consultation with the Subadvisor. Those values reflect broker/dealer supplied prices and electronic data processing techniques, if the evaluated bid or mean prices are deemed by the Manager, in consultation with the Subadvisor, to be representative of market values at the regular close of trading of the Exchange on each valuation date. Debt securities purchased on a delayed delivery basis are marked to market daily until settlement at the forward settlement date. Debt securities, including corporate bonds, U.S. government & federal agency bonds, municipal bonds, foreign bonds, convertible bonds, asset-backed securities and mortgage-backed securities are generally categorized as Level 2 in the hierarchy.
Temporary cash investments acquired in excess of 60 days to maturity at the time of purchase are valued using the latest bid prices or using valuations based on a matrix system (which considers such factors as security prices, yields, maturities, and ratings), both as furnished by independent pricing services. Other temporary cash investments which mature in 60 days or less at the time of purchase (“Short-Term Investments”) are valued using the amortized cost method of valuation, unless the use of such method would be inappropriate. The amortized cost method involves valuing a security at its cost on the date of purchase and thereafter assuming a constant amortization to maturity of the difference between such cost and the value on maturity date. Amortized cost approximates the current fair value of a security. Securities valued using the amortized cost method are not valued using quoted prices in an active market and are generally categorized as Level 2 in the hierarchy.
The information above is not intended to reflect an exhaustive list of the methodologies that may be used to value portfolio investments. The valuation procedures permit the use of a variety of valuation methodologies in connection with valuing portfolio investments. The methodology used for a specific type of investment may vary based on the market data available or other considerations. The methodologies summarized above may not represent the specific means by which portfolio investments are valued on any particular business day.
| | |
| 20 | | MainStay VP T. Rowe Price Equity Income Portfolio |
(B) Income Taxes. The Portfolio’s policy is to comply with the requirements of the Internal Revenue Code of 1986, as amended (the “Internal Revenue Code”), applicable to regulated investment companies and to distribute all of its taxable income to the shareholders of the Portfolio within the allowable time limits. Therefore, no federal, state and local income tax provisions are required.
Management evaluates the Portfolio’s tax positions to determine if the tax positions taken meet the minimum recognition threshold in connection with accounting for uncertainties in income tax positions taken or expected to be taken for the purposes of measuring and recognizing tax liabilities in the financial statements. Recognition of tax benefits of an uncertain tax position is permitted only to the extent the position is “more likely than not” to be sustained assuming examination by taxing authorities. Management has analyzed the Portfolio’s tax positions taken on federal, state and local income tax returns for all open tax years (for up to three tax years), and has concluded that no provisions for federal, state and local income tax are required in the Portfolio’s financial statements. The Portfolio’s federal, state and local income and federal excise tax returns for tax years for which the applicable statutes of limitations have not expired are subject to examination by the Internal Revenue Service and state and local departments of revenue.
(C) Foreign Taxes. The Portfolio may be subject to foreign taxes on income and other transaction-based taxes imposed by certain countries in which it invests. A portion of the taxes on gains on investments or currency purchases/repatriation may be reclaimable. The Portfolio will accrue such taxes and reclaims as applicable, based upon its current interpretation of tax rules and regulations that exist in the markets in which it invests.
The Portfolio may be subject to taxation on realized capital gains, repatriation proceeds and other transaction-based taxes imposed by certain countries in which it invests. The Portfolio will accrue such taxes as applicable based upon its current interpretation of tax rules and regulations that exist in the market in which it invests. Capital gains taxes relating to positions still held are reflected as a liability on the Statement of Assets and Liabilities, as well as an adjustment to the Portfolio’s net unrealized appreciation (depreciation). Taxes related to capital gains realized, if any, are reflected as part of net realized gain (loss) in the Statement of Operations. Changes in tax liabilities related to capital gains taxes on unrealized investment gains, if any, are reflected as part of the change in net unrealized appreciation (depreciation) on investments in the Statement of Operations. Transaction-based charges are generally assessed as a percentage of the transaction amount.
(D) Dividends and Distributions to Shareholders. Dividends and distributions are recorded on the ex-dividend date. The Portfolio intends to declare and pay dividends from net investment income and distributions from net realized capital and currency gains, if any, at least annually. All dividends and distributions are reinvested in the same class of shares of the Portfolio, at NAV. Dividends and distributions to shareholders are determined in accordance with federal income tax regulations and may differ from GAAP.
(E) Security Transactions and Investment Income. The Portfolio records security transactions on the trade date. Realized gains and losses on security transactions are determined using the identified cost method. Dividend income is recognized on the ex-dividend date;
net of any foreign tax withheld at the source, and interest income is accrued as earned using the effective interest rate method and includes any realized gains and losses from repayment of principal on mortgage-backed securities. Discounts and premiums on Short-Term Investments are accreted and amortized, respectively, on the straight-line method. The straight-line method approximates the effective interest method for Short-Term Investments.
Investment income and realized and unrealized gains and losses on investments of the Portfolio are allocated pro rata to the separate classes of shares based upon their relative net assets on the date the income is earned or realized and unrealized gains and losses are incurred.
(F) Expenses. Expenses of the Fund are allocated to the individual Portfolios in proportion to the net assets of the respective Portfolios when the expenses are incurred, except where direct allocations of expenses can be made. Expenses (other than fees incurred under the distribution and service plans, further discussed in Note 3(B), which are charged directly to the Service Class shares) are allocated to separate classes of shares pro rata based upon their relative net assets on the date the expenses are incurred. The expenses borne by the Portfolio, including those of related parties to the Portfolio, are shown in the Statement of Operations.
(G) Use of Estimates. In preparing financial statements in conformity with GAAP, management makes estimates and assumptions that affect the reported amounts and disclosures in the financial statements. Actual results could differ from those estimates.
(H) Repurchase Agreements. The Portfolio may enter into repurchase agreements (i.e., buy a security from another party with the agreement that it be sold back in the future) to earn income. The Portfolio may enter into repurchase agreements only with counterparties, usually financial institutions, that are deemed by the Manager or Subadvisor to be creditworthy, pursuant to guidelines established by the Board. During the term of any repurchase agreement, the Manager or Subadvisor will continue to monitor the creditworthiness of the counterparty. Under the 1940 Act, repurchase agreements are considered to be collateralized loans by the Portfolio to the counterparty secured by the securities transferred to the Portfolio.
Repurchase agreements are subject to counterparty risk, meaning the Portfolio could lose money by the counterparty’s failure to perform under the terms of the agreement. The Portfolio mitigates this risk by ensuring the repurchase agreement is collateralized by cash, U.S. government securities, fixed income securities and/or other securities. The collateral is held by the Portfolio’s custodian and valued daily on a mark to market basis to determine if the value, including accrued interest, exceeds the repurchase price. In the event of the counterparty’s default on the obligation to repurchase, the Portfolio has the right to liquidate the collateral and apply the proceeds in satisfaction of the obligation. Under certain circumstances, such as in the event of default or bankruptcy by the counterparty, realization and/or retention of the collateral may be limited or subject to delay, to legal proceedings and possible realized loss to the Portfolio.
(I) Foreign Currency Transactions. The Portfolio’s books and records are maintained in U.S. dollars. Prices of securities denominated in foreign currency amounts are translated into U.S. dollars at the mean
Notes to Financial Statements (Unaudited) (continued)
between the buying and selling rates last quoted by any major U.S. bank at the following dates:
| (i) | market value of investment securities, other assets and liabilities— at the valuation date; and |
| (ii) | purchases and sales of investment securities, income and expenses—at the date of such transactions. |
The assets and liabilities that are denominated in foreign currency amounts are presented at the exchange rates and market values at the close of the period. The realized and unrealized changes in net assets arising from fluctuations in exchange rates and market prices of securities are not separately presented.
Net realized gain (loss) on foreign currency transactions represents net gains and losses on foreign currency forward contracts, net currency gains or losses realized as a result of differences between the amounts of securities sale proceeds or purchase cost, dividends, interest and withholding taxes as recorded on the Portfolio’s books, and the U.S. dollar equivalent amount actually received or paid. Net currency gains or losses from valuing such foreign currency denominated assets and liabilities, other than investments at valuation date exchange rates, are reflected in unrealized foreign exchange gains or losses.
(J) Securities Lending. In order to realize additional income, the Portfolio may engage in securities lending, subject to the limitations set forth in the 1940 Act and relevant guidance by the staff of the Securities and Exchange Commission (“SEC”). In the event the Portfolio does engage in securities lending, the Portfolio will lend through its custodian, State Street Bank and Trust Company (“State Street”). State Street will manage the Portfolio’s collateral in accordance with the lending agreement between the Portfolio and State Street, and indemnify the Portfolio against counterparty risk. The loans will be collateralized by U.S. Treasury securities at least equal at all times to the market value of the securities loaned. The Portfolio may bear the risk of delay in recovery of, or loss of rights in, the securities loaned should the borrower of the securities experience financial difficulty. The Portfolio may also record a realized gain or loss on securities deemed sold due to a borrower’s inability to return securities on loan. The Portfolio bears the risk of any loss on investment of the collateral. The Portfolio will receive compensation for lending its securities in the form of fees or it will retain a portion of interest on the investment of any cash received as collateral. The Portfolio will also continue to receive interest and dividends on the securities loaned and any gain or loss in the market price of the securities loaned that may occur during the term of the loan will be for the account of the Portfolio. During the six-month period ended June 30, 2017, the Portfolio did not have any portfolio securities on loan.
(K) Foreign Securities Risk. The Portfolio invests in foreign securities, which carry certain risks that are in addition to the usual risks inherent in domestic securities. These risks include those resulting from currency fluctuations, future adverse political or economic developments and possible imposition of currency exchange blockages or other foreign governmental laws or restrictions. These risks are likely to be greater in emerging markets than in developed markets. The ability of issuers of securities held by the Portfolio to meet their obligations may be affected by economic and political developments in a specific country, industry or region.
(L) Indemnifications. Under the Fund’s organizational documents, its officers and trustees are indemnified against certain liabilities that may arise out of performance of their duties to the Fund. Additionally, in the normal course of business, the Portfolio enters into contracts with third-party service providers that contain a variety of representations and warranties and which may provide general indemnifications. The Portfolio’s maximum exposure under these arrangements is unknown, as this would involve future claims that may be made against the Portfolio that have not yet occurred. Based on experience, management is of the view that the risk of loss in connection with these potential indemnification obligations is remote. However, there can be no assurance that material liabilities related to such obligations will not arise in the future, which could adversely impact the Portfolio.
Note 3–Fees and Related Party Transactions
(A) Manager and Subadvisor. New York Life Investments, a registered investment adviser and an indirect, wholly-owned subsidiary of New York Life, serves as the Portfolio’s Manager, pursuant to an Amended and Restated Management Agreement (“Management Agreement”). The Manager provides offices, conducts clerical, recordkeeping and bookkeeping services, and keeps most of the financial and accounting records required to be maintained by the Portfolio. Except for the portion of salaries and expenses that are the responsibility of the Portfolio, the Manager pays the salaries and expenses of all personnel affiliated with the Portfolio and certain operational expenses of the Portfolio. The Portfolio reimburses New York Life Investments in an amount equal to a portion of the compensation of the Chief Compliance Officer attributable to the Portfolio. Pursuant to the terms of a Subadvisory Agreement with New York Life Investments, T. Rowe Price Associates, Inc. (“T. Rowe Price”), a registered investment adviser, serves as Subadvisor to the Portfolio. New York Life Investments pays for the services of the Subadvisor.
The Fund, on behalf of the Portfolio, pays New York Life Investments in its capacity as the Portfolio’s investment manager and administrator, pursuant to the Management Agreement, a monthly fee for services performed and facilities furnished at an annual percentage of the Portfolio’s average daily net assets as follows: 0.75% up to $500 million; and 0.725% on assets in excess of $500 million. New York Life Investments has contractually agreed to waive fees and/or reimburse expenses so that total annual operating expenses (excludes taxes, interest, litigation, extraordinary expenses, brokerage and other transaction expenses relating to the purchase and sale of portfolio investments, and acquired (underlying) portfolio/fund fees and expenses) do not exceed 0.85% for Initial Class shares and 1.10% for Service Class shares. This agreement expires on May 1, 2018 and may only be amended or terminated prior to that date by action of the Board. During the six-month period ended June 30, 2017, the effective management fee rate was 0.74%.
During the six-month period ended June 30, 2017, New York Life Investments earned fees from the Portfolio in the amount of $2,962,998.
State Street provides sub-administration and sub-accounting services to the Portfolio pursuant to an agreement with New York Life Investments. These services include calculating the daily NAVs of the Portfolio, maintaining the general ledger and sub-ledger accounts for the calculation of the Portfolio’s NAVs, and assisting New York Life Investments in conducting various aspects of the Portfolio’s administrative
| | |
| 22 | | MainStay VP T. Rowe Price Equity Income Portfolio |
operations. For providing these services to the Portfolio, State Street is compensated by New York Life Investments.
(B) Distribution and Service Fees. The Fund, on behalf of the Portfolio, has entered into a distribution agreement with NYLIFE Distributors LLC (the “Distributor”), an indirect, wholly-owned subsidiary of New York Life. The Portfolio has adopted a distribution plan (the “Plan”) in accordance with the provisions of Rule 12b-1 under the 1940 Act. Under the Plan, the Distributor has agreed to provide, through its affiliates or independent third parties, various distribution-related, shareholder and administrative support services to the Service Class shareholders. For its services, the Distributor is entitled to a combined distribution and service fee accrued daily and paid monthly at an annual rate of 0.25% of the average daily net assets attributable to the Service Class shares of the Portfolio.
Note 4–Federal Income Tax
During the year ended December 31, 2016, the tax character of distributions paid as reflected in the Statement of Changes in Net Assets was as follows:
| | |
| 2016 |
Tax-Based
Distributions
from Ordinary
Income | | Tax-Based
Distributions
from Long-Term
Gains |
| $14,241,011 | | $53,028,031 |
Note 5–Custodian
State Street is the custodian of cash and securities held by the Portfolio. Custodial fees are charged to the Portfolio based on the Portfolio’s net assets and/or the market value of securities held by the Portfolio and the number of certain transactions incurred by the Portfolio.
Note 6–Line of Credit
The Portfolio and certain other funds managed by New York Life Investments, maintain a line of credit with a syndicate of banks in order to secure a source of funds for temporary purposes to meet unanticipated or excessive redemption requests.
Effective August 1, 2017, under the credit agreement (the “Credit Agreement”), the aggregate commitment amount is $600,000,000 with an additional uncommitted amount of $100,000,000. The commitment fee is an annual rate of 0.15% of the average commitment amount payable quarterly, regardless of usage, to State Street, who serves as the agent to the syndicate. The commitment fee is allocated among the Portfolio and certain other funds managed by New York Life Investments based upon their respective net assets and other factors. Interest on any revolving credit loan is charged based upon the Federal Funds Rate or the one month LIBOR, whichever is higher. The Credit Agreement expires on July 31, 2018, although the Portfolio, certain other funds managed by New York Life Investments and the syndicate of banks may renew the Credit Agreement for an additional year on the same or different terms. Prior to August 1, 2017, the aggregate commitment amount was $600,000,000 with an additional uncommitted amount of $100,000,000, and the commitment fee, under a credit agreement for
which Bank of New York Mellon served as agent, was at an annual rate of 0.15% of the average commitment amount. During the six-month period ended June 30, 2017, there were no borrowings made or outstanding with respect to the Portfolio under the credit agreement for which Bank of New York served as agent.
Note 7–Interfund Lending Program
Pursuant to an exemptive order issued by the SEC, the Portfolio, along with certain other funds managed by New York Life Investments, may participate in an interfund lending program. The interfund lending program provides an alternative credit facility that permits the Portfolio and certain other funds managed by New York Life Investments to lend or borrow money for temporary purposes directly to or from one another, subject to the conditions of the exemptive order. During the six-month period ended June 30, 2017, there were no interfund loans made or outstanding with respect to the Portfolio.
Note 8–Purchases and Sales of Securities (in 000’s)
During the six-month period ended June 30, 2017, purchases and sales of securities, other than short-term securities, were $90,969 and $102,794, respectively.
The Portfolio may purchase securities from or sell to other portfolios managed by its Subadvisor. These interportfolio transactions are primarily used for cash management purposes and are made pursuant to Rule 17a-7 of the 1940 Act. The Rule 17a-7 transactions during the six-month period ended June 30, 2016, were as follows:
| | | | |
Purchases
(000’s) | | Sales
(000’s) | | Realized
Gain/(Loss)
(000’s) |
| $0 | | $69 | | $8 |
Note 9–Capital Share Transactions
| | | | | | | | |
Initial Class | | Shares | | | Amount | |
Six-month period ended June 30, 2017: | | | | | | | | |
Shares sold | | | 844,088 | | | $ | 11,247,880 | |
Shares redeemed | | | (1,864,653 | ) | | | (25,152,576 | ) |
| | | | |
Net increase (decrease) | | | (1,020,565 | ) | | $ | (13,904,696 | ) |
| | | | |
Year ended December 31, 2016: | | | | | | | | |
Shares sold | | | 1,755,449 | | | $ | 20,931,750 | |
Shares issued to shareholders in reinvestment of dividends
and distributions | | | 3,472,224 | | | | 42,025,248 | |
Shares redeemed | | | (8,455,638 | ) | | | (104,115,752 | ) |
| | | | |
Net increase (decrease) | | | (3,227,965 | ) | | $ | (41,158,754 | ) |
| | | | |
Notes to Financial Statements (Unaudited) (continued)
| | | | | | | | |
Service Class | | Shares | | | Amount | |
Six-month period ended June 30, 2017: | | | | | | | | |
Shares sold | | | 2,037,069 | | | $ | 27,093,581 | |
Shares redeemed | | | (2,393,698 | ) | | | (31,846,449 | ) |
| | | | |
Net increase (decrease) | | | (356,629 | ) | | $ | (4,752,868 | ) |
| | | | |
Year ended December 31, 2016: | | | | | | | | |
Shares sold | | | 2,677,875 | | | $ | 33,482,684 | |
Shares issued to shareholders in reinvestment of dividends
and distributions | | | 2,091,800 | | | | 25,243,794 | |
Shares redeemed | | | (3,774,017 | ) | | | (46,609,032 | ) |
| | | | |
Net increase (decrease) | | | 995,658 | | | $ | 12,117,446 | |
| | | | |
Note 10–Recent Accounting Pronouncement
In October 2016, the SEC adopted new rules and amended existing rules (together, “final rules”) intended to modernize the reporting and disclosure of information by registered investment companies. In part, the final rules amend Regulation S-X and require standardized,
enhanced disclosure about derivatives in investment company financial statements, as well as other amendments. The compliance date for the amendments to Regulation S-X is August 1, 2017 and applies to shareholder reports for funds with fiscal periods ending after August 1, 2017. Management is currently evaluating the impact that the adoption of the amendments to Regulation S-X will have on the Portfolio’s financial statements and related disclosures.
Note 11–Subsequent Events
In connection with the preparation of the financial statements of the Portfolio as of and for the period ended June 30, 2017, events and transactions subsequent to June 30, 2017, through the date the financial statements were issued have been evaluated by the Portfolio’s management for possible adjustment and/or disclosure. No subsequent events requiring financial statement adjustment or disclosure have been identified.
| | |
| 24 | | MainStay VP T. Rowe Price Equity Income Portfolio |
Proxy Voting Policies and Procedures and Proxy Voting Record
A description of the policies and procedures that New York Life Investments uses to vote proxies related to the Portfolio’s securities is available without charge, upon request, (i) by calling 800-598-2019 or (ii) by visiting the SEC’s website at www.sec.gov.
The Portfolio is required to file with the SEC its proxy voting record for the 12-month period ending June 30 on Form N-PX. The Portfolio’s most recent Form N-PX or proxy voting record is available free of charge upon request (i) by calling 800-598-2019 or; (ii) by visiting the SEC’s website at www.sec.gov.
Shareholder Reports and Quarterly Portfolio Disclosure
The Portfolio is required to file its complete schedule of portfolio holdings with the SEC for its first and third fiscal quarters on Form N-Q. The Portfolio’s Form N-Q is available without charge on the SEC’s website at www.sec.gov or by calling MainStay Investments at 800-598-2019. You also can obtain and review copies of Form N-Q by visiting the SEC’s Public Reference Room in Washington, DC (information on the operation of the Public Reference Room may be obtained by calling 1-800-SEC-0330).
This page intentionally left blank
MainStay VP Portfolios
MainStay VP offers a wide range of Portfolios. The full array of MainStay VP offerings is listed here, with information about the manager, subadvisors, legal counsel, and independent registered public accounting firm.
Equity Portfolios
MainStay VP Common Stock Portfolio
MainStay VP Cornerstone Growth Portfolio
MainStay VP Eagle Small Cap Growth Portfolio
MainStay VP Emerging Markets Equity Portfolio
MainStay VP Epoch U.S. Equity Yield Portfolio
MainStay VP Epoch U.S. Small Cap Portfolio
MainStay VP International Equity Portfolio
MainStay VP Large Cap Growth Portfolio
MainStay VP MFS® Utilities Portfolio
MainStay VP Mid Cap Core Portfolio
MainStay VP S&P 500 Index Portfolio
MainStay VP Small Cap Core Portfolio
MainStay VP T. Rowe Price Equity Income Portfolio
MainStay VP VanEck Global Hard Assets Portfolio
Mixed Asset Portfolios
MainStay VP Balanced Portfolio
MainStay VP Convertible Portfolio
MainStay VP Cushing Renaissance Advantage Portfolio
MainStay VP Income Builder Portfolio
MainStay VP Janus Henderson Balanced Portfolio
Income Portfolios
MainStay VP Bond Portfolio
MainStay VP Floating Rate Portfolio
MainStay VP Government Portfolio
MainStay VP High Yield Corporate Bond Portfolio
MainStay VP Indexed Bond Portfolio
MainStay VP PIMCO Real Return Portfolio
MainStay VP Unconstrained Bond Portfolio
Money Market
MainStay VP U.S. Government Money Market Portfolio
Alternative
MainStay VP Absolute Return Multi-Strategy Portfolio
Asset Allocation Portfolios
MainStay VP Conservative Allocation Portfolio
MainStay VP Growth Allocation Portfolio
MainStay VP Moderate Allocation Portfolio
MainStay VP Moderate Growth Allocation Portfolio
Manager
New York Life Investment Management LLC
New York, New York
Subadvisors
Candriam Belgium*
Brussels, Belgium
Candriam France S.A.S.*
Paris, France
Cornerstone Capital Management Holdings LLC*
New York, New York
Cushing Asset Management, LP
Dallas, Texas
Eagle Asset Management, Inc.
St Petersburg, Florida
Epoch Investment Partners, Inc.
New York, New York
Janus Capital Management LLC
Denver, Colorado
MacKay Shields LLC*
New York, New York
Massachusetts Financial Services Company
Boston, Massachusetts
NYL Investors LLC*
New York, New York
Pacific Investment Management Company LLC
Newport Beach, California
T. Rowe Price Associates, Inc.
Baltimore, Maryland
Van Eck Associates Corporation
New York, New York
Winslow Capital Management, LLC
Minneapolis, Minnesota
Distributor
NYLIFE Distributors LLC*
Jersey City, New Jersey
Custodian
State Street Bank and Trust Company
Boston, Massachusetts
Independent Registered Public Accounting Firm
PricewaterhouseCoopers LLP
New York, New York
Legal Counsel
Dechert LLP
Washington, District of Columbia
Some Portfolios may not be available in all products.
* An affiliate of New York Life Investment Management LLC
Not part of the Semiannual Report
2017 Semiannual Report
This report is for the general information of New York Life Variable Annuities and NYLIAC Variable Universal Life Insurance Products policyowners. It must be preceded or accompanied by the appropriate product(s) and funds prospectuses if it is given to anyone who is not an owner of a New York Life variable annuity policy or a NYLIAC Variable Universal Life Insurance Product. This report does not offer for sale or solicit orders to purchase securities.
The performance data quoted in this report represents past performance. Past performance is no guarantee of future results. Due to market volatility and other factors, current performance may be lower or higher than the figures shown. The most recent month-end performance summary for your variable annuity or variable life policy is available by calling 800-598-2019 and is updated periodically on www.newyorklife.com.
The New York Life Variable Annuities and NYLIAC Variable Universal Life Insurance Products are issued by New York Life Insurance and Annuity Corporation (a Delaware Corporation) and distributed by NYLIFE Distributors LLC (Member FINRA/SIPC).
New York Life Insurance Company
New York Life Insurance and Annuity Corporation (NYLIAC) (A Delaware Corporation)
51 Madison Avenue, Room 551
New York, NY 10010
www.newyorklife.com
Printed on recycled paper
mainstayinvestments.com
NYLIFE Distributors LLC, 30 Hudson Street, Jersey City, NJ 07302
New York Life Investment Management LLC is the investment manager to the MainStay VP Funds Trust
©2017 by NYLIFE Distributors LLC. All rights reserved.
You may obtain copies of the Prospectus and the Statement of Additional Information free of charge, upon request, by calling toll-free 800-598-2019 or writing to New York Life Insurance and Annuity Corporation, 51 Madison Avenue, New York, NY 10010.
| | | | |
| Not FDIC Insured | | No Bank Guarantee | | May Lose Value |
| | | | |
1743153 | | | | MSVPTRPE10-08/17 (NYLIAC) NI531 |
MainStay VP PIMCO Real Return Portfolio
Message from the President and Semiannual Report
Unaudited | June 30, 2017

Sign up for electronic delivery of your shareholder reports. For full details on electronic delivery, including who can participate and what you
can receive via eDelivery, please log on to www.newyorklife.com/vsc

This page intentionally left blank
Message from the President
The six months ended June 30, 2017, brought positive results to many stock and bond investors. The year began with many investors hoping that Republican control of the White House, the Senate and the House of Representatives could bring an end to political gridlock; and while debate has continued on a number of issues, the U.S. stock market climbed relatively steadily throughout the first half of 2017.
According to FTSE-Russell U.S. market data, stocks at all capitalization levels tended to record positive total returns during the reporting period, with large-cap stocks generally outperforming stocks of smaller-capitalization companies. Growth stocks outpaced value stocks at every capitalization level by substantial margins—from more than six percentage points for micro-caps and mid-caps to more than 10 percentage points for the largest 200 U.S. companies by market capitalization.
Most sectors of the stock market advanced during the reporting period, with energy and telecommunication services being notable exceptions. Energy stocks declined as oil prices fell despite moves by the Organization of Petroleum Exporting Countries (OPEC) intended to limit oil production by its members. Telecommunication services stocks tended to decline as competition increased and rising interest rates made dividend payouts less appealing.
In March and June of 2017, the Federal Reserve announced successive increases in the target range for the federal funds rate, ultimately bringing the federal funds target range to 1.00% to 1.25%. While short-term U.S. Treasury yields rose in response, yields for U.S. Treasury securities with maturities of five years or longer declined. As the difference between short- and long-term yields narrowed, the advantages of higher-yielding long-term bonds became increasingly apparent.
Virtually all taxable and tax-exempt bond sectors provided positive total returns during the reporting period. Mortgage-backed
securities, though providing positive total returns, faced headwinds when the Federal Reserve announced plans to begin normalizing its balance sheet by reducing reinvestment of principal payments on mortgage-backed securities.
International stock and bond markets were also strong during the reporting period. International stocks provided double-digit total returns that were surpassed by emerging-market stocks as a whole. Global investment-grade bonds provided single-digit returns; and emerging-market debt was somewhat stronger.
Even during periods of favorable market performance and generally positive returns, MainStay believes that it is important to carefully monitor your investments. Your risk tolerance may
change over time, leading you to reevaluate which MainStay VP Portfolios are most appropriate for your long-term goals. Your goals themselves may also change, leading you to pursue investments with more or less risk. The portfolio managers of MainStay VP Portfolios seek to provide results consistent with the investment objectives of their respective Portfolios, to give you a wide range of choices suitable to various investment needs.
The report that follows provides more detailed information about the specific markets, securities and investment decisions that influenced your MainStay VP Portfolio during the six months ended June 30, 2017. We invite you to review the report carefully as part of your ongoing investment evaluation and review.
Sincerely,

Stephen P. Fisher
President
The opinions expressed are as of the date of the accompanying report and are subject to change. Past performance is no guarantee of future results. There is no guarantee that any forecasts made will come to pass. This material does not constitute investment advice and is not intended as an endorsement of any specific investment.
Not all MainStay VP Portfolios and/or share classes are available under all policies.
Not part of the Semiannual Report
Table of Contents
Investors should refer to the Portfolio’s Summary Prospectus and/or Prospectus and consider the Portfolio’s investment objectives, strategies, risks, charges and expenses carefully before investing. The Summary Prospectus and/or Prospectus contain this and other information about the Portfolio. You may obtain copies of the Portfolio’s Summary Prospectus and/or the Prospectus and the Statement of Additional Information free of charge, upon request, by calling toll-free 800-598-2019, by writing to New York Life Insurance and Annuity Corporation, 51 Madison Avenue, Room 251, New York, New York 10010 or by sending an email to MainStayShareholdersServices@nylim.com. These documents are also available at mainstayinvestments.com/vpdocuments. Please read the Summary Prospectus and/or Prospectus carefully before investing. MainStay VP Funds Trust portfolios are separate account options which are purchased through a variable insurance or variable annuity contract.
Investment and Performance Comparison1 (Unaudited)
Performance data quoted represents past performance. Past performance is no guarantee of future results. Because of market volatility and other factors, current performance may be lower or higher than the figures shown. Investment return and principal value will fluctuate, and as a result, when shares are redeemed, they may be worth more or less than their original cost. The performance table and graph do not reflect any deduction of sales charges, mortality and expense charges, contract charges or administrative charges. Please refer to the Performance Summary appropriate for your policy. For performance information current to the most recent month-end, please call 800-598-2019 or visit www.newyorklife.com.
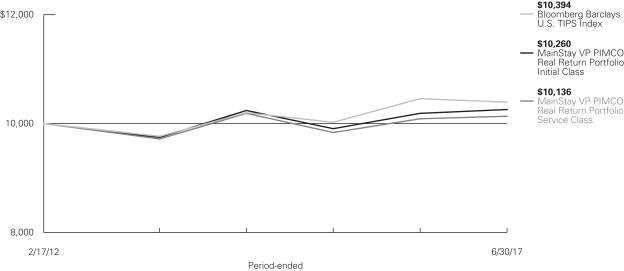
Average Annual Total Returns for the Period Ended June 30, 2017
| | | | | | | | | | | | | | |
| Class | | Inception
Date | | Six Months | | One Year | | Five Years | | Ten Years
or Since
Inception | | Gross
Expense
Ratio2 | |
| Initial Class Shares | | 2/17/2012 | | 1.27% | | 0.72% | | –0.06% | | 0.48% | | | 0.92 | % |
| Service Class Shares | | 2/17/2012 | | 1.15 | | 0.47 | | –0.29 | | 0.25 | | | 1.17 | |
| | | | | | | | | | | | | | | | |
| Benchmark Performance | | Six
Months | | | One
Year | | | Five
Years | | | Ten Years
or Since
Inception | |
Bloomberg Barclays U.S. TIPS Index3 | | | 0.85 | % | | | –0.63 | % | | | 0.27 | % | | | 0.72 | % |
Average Lipper Variable Products Inflation-Protected Bond Portfolio4 | | | 1.01 | | | | 0.32 | | | | 0.16 | | | | 0.54 | |
| 1. | Performance figures reflect certain fee waivers and/or expense limitations, without which total returns may have been different. For information on current fee waivers and/or expense limitations (if any), please refer to the Notes to Financial Statements. |
| 2. | The gross expense ratios presented reflect the Portfolio’s “Total Annual Portfolio Operating Expenses” from the most recent Prospectus and may differ from other expense ratios disclosed in this report. |
| 3. | The Bloomberg Barclays U.S. TIPS Index is the Portfolio’s primary broad-based securities market index for comparison purposes. The Bloomberg Barclays U.S. TIPS Index includes all publicly issued U.S. Treasury Inflation-Protected Securities (“TIPS”) that have at least one year remaining to |
| | maturity and are rated investment grade. Results assume reinvestment of all dividends and capital gains. An investment cannot be made directly in an index. |
| 4. | The Average Lipper Variable Products Inflation-Protected Bond Portfolio is representative of portfolios that invest primarily in inflation-indexed fixed income securities. Inflation-linked bonds are fixed income securities structured to provide protection against inflation. The benchmark is a product of Lipper Inc. Lipper Inc. is an independent monitor of fund performance. Results are based on average total returns of similar portfolios with all dividend and capital gain distributions reinvested. |
Cost in Dollars of a $1,000 Investment in MainStay VP PIMCO Real Return Portfolio (Unaudited)
The example below is intended to describe the fees and expenses borne by shareholders during the six-month period from January 1, 2017 to June 30, 2017, and the impact of those costs on your investment.
Example
As a shareholder of the Portfolio, you incur two types of costs: (1) transaction costs, including exchange fees and sales charges (loads) on purchases (as applicable), and (2) ongoing costs, including management fees, distribution and/or service (12b-1) fees, and other Portfolio expenses (as applicable). This example is intended to help you understand your ongoing costs (in dollars) of investing in the Portfolio and to compare these costs with the ongoing costs of investing in other mutual funds. The example is based on an investment of $1,000 made at the beginning of the six-month period and held for the entire period from January 1, 2017 to June 30, 2017. Shares are only sold in connection with variable life and annuity contracts and the example does not reflect any contract level or transactional fees or expenses. If these costs had been included, your costs would have been higher.
This example illustrates your Portfolio’s ongoing costs in two ways:
Actual Expenses
The second and third data columns in the table below provide information about actual account values and actual expenses. You may use the information in these columns, together with the amount you invested, to estimate the expenses that you paid during the six months ended June 30, 2017. Simply divide your account value by $1,000
(for example, an $8,600 account value divided by $1,000 = 8.6), then multiply the result by the number under the heading entitled “Expenses Paid During Period” to estimate the expenses you paid on your account during this period.
Hypothetical Example for Comparison Purposes
The fourth and fifth data columns in the table below provide information about hypothetical account values and hypothetical expenses based on the Portfolio’s actual expense ratio and an assumed rate of return of 5% per year before expenses, which is not the Portfolio’s actual return. The hypothetical account values and expenses may not be used to estimate the actual ending account balances or expenses you paid for the six-month period shown. You may use this information to compare the ongoing costs of investing in the Portfolio with the ongoing costs of investing in other mutual funds. To do so, compare this 5% hypothetical example with the 5% hypothetical examples that appear in the shareholder reports of the other mutual funds.
Please note that the expenses shown in the table are meant to highlight your ongoing costs only and do not reflect any transactional costs, such as exchange fees or sales charges (loads). Therefore, the fourth and fifth data columns of the table are useful in comparing ongoing costs only and will not help you determine the relative total costs of owning different funds. In addition, if these transactional costs were included, your costs would have been higher.
| | | | | | | | | | | | | | | | | | | | | | | | |
| | | | | | | | | | | | | | | | | | | |
| Share Class | | Beginning Account Value 1/1/17 | | | Ending Account Value (Based on Actual Returns and Expenses) 6/30/17 | | | Expenses Paid During Period1 | | | Ending Account Value (Based on Hypothetical 5% Annualized Return and Actual Expenses) 6/30/17 | | | Expenses Paid During Period1 | | | Net Expense Ratio During Period2 | |
| | | | | | |
| Initial Class Shares | | $ | 1,000.00 | | | $ | 1,000.00 | | | $ | 4.66 | | | $ | 1,020.10 | | | $ | 4.71 | | | | 0.94 | % |
| | | | | | |
| Service Class Shares | | $ | 1,000.00 | | | $ | 1,000.00 | | | $ | 5.90 | | | $ | 1,018.90 | | | $ | 5.96 | | | | 1.19 | % |
| 1. | Expenses are equal to the Portfolio’s annualized expense ratio of each class multiplied by the average account value over the period, divided by 365 and multiplied by 181 (to reflect the six-month period). The table above represents the actual expenses incurred during the six-month period. |
| 2. | Expenses are equal to the Portfolio’s annualized expense ratio to reflect the six-month period. |
| | |
| 6 | | MainStay VP PIMCO Real Return Portfolio |
Portfolio Composition as of June 30, 2017 (Unaudited)
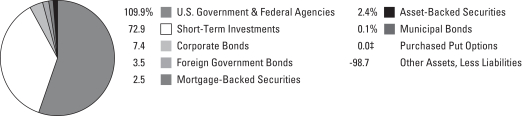
See Portfolio of Investments beginning on page 10 for specific holdings within these categories.
| ‡ | Less than one-tenth of a percent. |
Top Ten Holdings or Issuers Held as of June 30, 2017 (excluding short-term investments) (Unaudited)
| 1. | United States Treasury Inflation—Indexed Notes, 0.125%–1.875%, due 1/15/18–1/15/27 |
| 2. | United States Treasury Inflation—Indexed Bonds, 0.375%–3.625%, due 7/15/18–2/15/47 |
| 3. | United States Treasury Notes, 1.875%–2.750%, due 2/28/22–11/15/26 |
| 4. | United States Treasury Bonds, 3.000%, due 2/15/47–5/15/47 |
| 5. | Ally Financial, Inc., 3.600%, due 5/21/18 |
| 6. | Nykredit Realkredit A/S, 1.000%–2.500%, due 7/1/17–10/1/47 |
| 7. | Paragon Mortgages No.13 PLC, 0.576%, due 1/15/39 |
| 8. | CIFC Funding, Ltd., 2.569%, due 12/5/24 |
| 9. | New Zealand Government Bond, 2.000%–3.000%, due 9/20/25–9/20/35 |
| 10. | Japanese Government CPI Linked Bond, 0.100%, due 3/10/24–3/10/27 |
Portfolio Management Discussion and Analysis (Unaudited)
Answers to the questions reflect the views of portfolio managers Mihir Worah and Jeremie Banet of Pacific Investment Management Company LLC (“PIMCO”), the Portfolio’s Subadvisor.
How did MainStay VP PIMCO Real Return Portfolio perform relative to its benchmark and peers during the six months ended June 30, 2017?
For the six months ended June 30, 2017, MainStay VP PIMCO Real Return Portfolio returned 1.27% for Initial Class shares and 1.15% for Service Class shares. Over the same period, both share classes outperformed the 0.85% return of the Bloomberg Barclays U.S. TIPS Index,1 which is the Portfolio’s benchmark, and the 1.01% return of the Average Lipper2 Variable Products Inflation-Protected Bond Portfolio.
Were there any changes to the Portfolio during the reporting period?
Effective May 1, 2017, the “Principal Investment Strategies” section of the Portfolio’s Summary Prospectus and Prospectus was modified to allow the Portfolio to invest in mortgage-backed securities rated below B.3
What factors affected the Portfolio’s relative performance during the reporting period?
Positive contributors to the Portfolio’s performance relative to the Bloomberg Barclays U.S. TIPS Index included (1) being short U.K. nominal duration4 as U.K. interest rates rose, reversing the year’s earlier downward trend; (2) duration and yield curve5 positioning in the United States, as an overweight to intermediate maturities on the yield curve benefited from a decline in mid- to long-term rates; (3) being short U.K. inflation expectations as expectations trended lower despite recent strength in the consumer price index (CPI); and (4) spread sector6 exposure, particularly positions in investment-grade and high-yield financials, residential mortgage-backed securities and dollar-denominated emerging-market sovereign debt. (Contributions take weightings and total returns into account.)
One strategy that detracted from relative performance during the reporting period was being long the Brazilian real as the currency depreciated amid heightened political concerns.
During the reporting period, how was the Portfolio’s performance materially affected by investments in derivatives?
The use of short (pay-fixed) interest-rate swaps on the U.K. nominal curve and short inflation swaps on the U.K. real yield curve added to performance as nominal gilts (a U.K. government obligation) modestly rose and mid- to long-term breakeven inflation expectations fell. On the other hand, the use of short futures and pay-fixed interest-rate swaps along the U.S. nominal yield curve detracted from performance amid a rally in long-end U.S. Treasury securities. Receive-fixed interest-rate swaps on intermediate-term Mexican nominal rates added to performance amid a rally in the belly of the yield curve. Finally, currency exposure, through the use of currency forwards, detracted from performance overall.
What was the Portfolio’s duration strategy during the reporting period?
The Portfolio remained slightly underweight overall duration relative to the Bloomberg Barclays U.S. TIPS Index for the majority of the reporting period, with a duration concentration at the belly of the yield curve. The Portfolio, however, maintained an overweight to real duration in the United States. In addition, the Portfolio’s overall duration was brought in-line with the benchmark toward the end of the reporting period. As of June 30, 2017, the Portfolio’s duration was approximately even with the benchmark’s duration at 7.82 years.
What specific factors, risks or market forces prompted significant decisions for the Portfolio during the reporting period?
PIMCO takes a long-term approach to investing, with the goal of consistently providing added value in portfolios over time. Because we believed that many asset classes were fairly valued, we remained tactical and sought to capitalize on perceived market dislocations as they arose. Within interest rates, total duration in the Portfolio remained range-bound throughout the reporting period, consistent with relatively muted moves in
| 1. | See footnote on page 5 for more information on the Bloomberg Barclays U.S. TIPS Index. |
| 2. | See footnote on page 5 for more information on Lipper Inc. |
| 3. | An obligation rated ‘B’ by Standard & Poor’s (“S&P”) is deemed by S&P to be more vulnerable to nonpayment than obligations rated ‘BB’, but in the opinion of S&P, the obligor currently has the capacity to meet its financial commitment on the obligation. It is the opinion of S&P that adverse business, financial, or economic conditions will likely impair the obligor’s capacity or willingness to meet its financial commitment on the obligation. When applied to Portfolio holdings, ratings are based solely on the creditworthiness of the bonds in the portfolio and are not meant to represent the security or safety of the Portfolio. |
| 4. | Duration is a measure of the price sensitivity of a fixed-income investment to changes in interest rates. Duration is expressed as a number of years and is considered a more accurate sensitivity gauge than average maturity. |
| 5. | The yield curve is a line that plots the yields of various securities of similar quality—typically U.S. Treasury issues—across a range of maturities. The U.S. Treasury yield curve serves as a benchmark for other debt and is used in economic forecasting. |
| 6. | The terms “spread” and “yield spread” may refer to the difference in yield between a security or type of security and comparable U.S. Treasury issues. The terms may also refer to the difference in yield between two specific securities or types of securities at a given time. The term “spread sectors” refers to asset classes or market sectors that typically trade at a spread to comparable U.S. Treasury securities. |
| | |
| 8 | | MainStay VP PIMCO Real Return Portfolio |
interest rates. The Portfolio, however, maintained an overweight to real duration, specifically in the United States, where positions were increased in the intermediate portion of the real yield curve given the attractive steepness of the curve and strong core inflation dynamics. Inflation expectations in the U.S. remain well below levels that we feel are justified given strong core inflation dynamics. The Portfolio remained tactical in currencies, reducing shorts to the Chinese yuan renminbi (CNY) and the euro (EUR) while maintaining long positions in select emerging-market currencies that offered attractive potential for generating income.
During the reporting period, which market segments were the strongest positive contributors to the Portfolio’s performance and which market segments were particularly weak?
Duration strategies and yield-curve positioning in the United States, with a focus in the belly of the yield curve, contributed strongly as mid- to long-term rates declined. In addition, out-of-benchmark exposures to spread sectors such as investment-grade and high-yield financials, residential mortgage-backed securities and external emerging-market debt also contributed positively as spreads generally tightened. Currency strategies,
on the other hand, moderately detracted during the reporting period.
Did the Portfolio make any significant purchases or sales during the reporting period?
During the reporting period the Portfolio increased overall duration, bringing it into line with the duration of the benchmark at the end of the reporting period. The Portfolio also increased exposure to U.S. TIPS and breakeven inflation. Although the Portfolio reduced some credit and spread exposure, the Portfolio maintained exposure to credit, mortgages and emerging markets.
How was the Portfolio positioned at the end of the reporting period?
As of June 30, 2017, the Portfolio was overweight relative to the Bloomberg Barclays U.S. TIPS Index in U.S. TIPS, while it maintained a defensive posture toward nominal yields. As of the same date, the Portfolio maintained out-of-index exposure to mortgage-backed securities, corporate securities, bonds of non-U.S. developed nations and dollar denominated emerging-market securities.
The opinions expressed are those of the portfolio managers as of the date of this report and are subject to change. There is no guarantee that any forecasts made will come to pass. This material does not constitute investment advice and is not intended as an endorsement of any specific investment.
Not all MainStay VP Portfolios and/or share classes are available under all policies.
Portfolio of Investments June 30, 2017 (Unaudited)
| | | | | | | | |
| | | Principal
Amount | | | Value | |
Long-Term Bonds 125.8%† Asset-Backed Securities 2.4% | |
Other ABS 2.4% | | | | | | | | |
Bayview Opportunity Master Fund IVB Trust
Series 2016-RN4, Class A1
3.475%, due 10/28/31 (a)(b) | | $ | 176,446 | | | $ | 177,610 | |
¨CIFC Funding, Ltd.
Series 2012-2A, Class A1R
2.569%, due 12/5/24 (a)(c) | | | 2,733,624 | | | | 2,738,765 | |
Fortress Credit Investments IV, Ltd.
Series 2015-4A, Class A 2.408%, due 7/17/23 (a)(c) | | | 329,265 | | | | 329,267 | |
Highlander Euro CDO III B.V.
Series 2007-3A, Class A 0.069%, due 5/1/23 (a)(c) | | EUR | 415,875 | | | | 474,884 | |
Malin CLO B.V.
Series 2007-1A, Class A1
0.00%, due 5/7/23 (a)(c) | | | 156,754 | | | | 178,964 | |
Navient Student Loan Trust
Series 2016-7A, Class A 2.366%, due 3/25/66 (a)(c) | | $ | 560,586 | | | | 566,527 | |
OneMain Financial Issuance Trust
Series 2014-2A, Class A 2.470%, due 9/18/24 (a) | | | 424,896 | | | | 425,449 | |
SLM Student Loan Trust (c)
Series 2004-2, Class A5
0.00%, due 1/25/24 | | EUR | 402,829 | | | | 457,949 | |
Series 2003-5, Class A5, Series Reg S 0.00%, due 6/17/24 | | | 101,794 | | | | 115,596 | |
Symphony CLO VIII , Ltd.
Series 2012-8A, Class AR 2.256%, due 1/9/23 (a)(c) | | $ | 619,028 | | | | 619,245 | |
US Residential Opportunity Fund II Trust
Series 2016-3II, Class A 3.598%, due 10/27/36 (a)(b) | | | 251,887 | | | | 252,982 | |
Vericrest Opportunity Loan Trust (a)(b) Series 2017-NPL2, Class A1
3.500%, due 3/25/47 | | | 93,594 | | | | 93,748 | |
Series 2015-NPL8, Class A1
3.500%, due 6/26/45 | | | 1,085,182 | | | | 1,087,842 | |
Series 2014-NP11, Class A1
3.875%, due 4/25/55 | | | 70,250 | | | | 70,281 | |
Series 2015-NP14, Class A1 4.375%, due 11/27/45 | | | 227,408 | | | | 228,229 | |
| | | | | | | | |
| | | | | | | 7,817,338 | |
| | | | | | | | |
Total Asset-Backed Securities
(Cost $7,730,514) | | | | | | | 7,817,338 | |
| | | | | | | | |
| | | | | | | | |
| | | Principal
Amount | | | Value | |
| Corporate Bonds 7.4% | | | | | | | | |
Banks 3.2% | | | | | | | | |
Credit Suisse Group Funding Guernsey, Ltd.
3.800%, due 9/15/22 | | $ | 300,000 | | | $ | 311,694 | |
Deutsche Bank A.G.
4.250%, due 10/14/21 | | | 1,400,000 | | | | 1,468,156 | |
Goldman Sachs Group, Inc.
2.446%, due 9/15/20 (c) | | | 1,300,000 | | | | 1,322,325 | |
ING Bank N.V.
2.625%, due 12/5/22 (a) | | | 400,000 | | | | 403,364 | |
Intesa Sanpaolo S.p.A.
6.500%, due 2/24/21 (a) | | | 400,000 | | | | 448,147 | |
¨Nykredit Realkredit A/S | | | | | | | | |
1.000%, due 7/1/17 | | DKK | 9,600,000 | | | | 1,473,159 | |
2.000%, due 7/1/17 | | | 6,900,000 | | | | 1,059,696 | |
2.000%, due 10/1/17 | | | 3,600,000 | | | | 556,039 | |
Series Reg S
2.500%, due 10/1/47 | | | 2,430,677 | | | | 378,676 | |
Realkredit Danmark A/S | | | | | | | | |
1.000%, due 4/1/18 | | | 500,000 | | | | 77,588 | |
2.500%, due 10/1/47 | | | 1,794,683 | | | | 279,732 | |
Royal Bank of Scotland PLC
6.934%, due 4/9/18 | | EUR | 400,000 | | | | 479,994 | |
Santander Holdings Usa, Inc.
2.642%, due 11/24/17 (c) | | $ | 100,000 | | | | 100,399 | |
Toronto-Dominion Bank
2.250%, due 3/15/21 (a) | | | 600,000 | | | | 599,326 | |
UBS A.G. (a)(c) | | | | | | | | |
1.539%, due 12/7/18 (d) | | | 800,000 | | | | 800,256 | |
1.799%, due 6/8/20 | | | 800,000 | | | | 801,096 | |
| | | | | | | | |
| | | | | | | 10,559,647 | |
| | | | | | | | |
Diversified Financial Services 2.0% | | | | | | | | |
AerCap Ireland Capital DAC / AerCap Global Aviation Trust
4.625%, due 10/30/20 | | | 100,000 | | | | 106,277 | |
¨Ally Financial, Inc.
3.600%, due 5/21/18 | | | 3,900,000 | | | | 3,943,875 | |
Bear Stearns Cos. LLC
7.250%, due 2/1/18 | | | 700,000 | | | | 721,956 | |
BRFkredit A/S | | | | | | | | |
2.000%, due 10/1/17 | | DKK | 1,600,000 | | | | 247,129 | |
2.500%, due 10/1/47 | | | 285,792 | | | | 44,524 | |
4.000%, due 1/1/18 | | | 900,000 | | | | 141,270 | |
International Lease Finance Corp. 6.250%, due 5/15/19 | | $ | 100,000 | | | | 107,258 | |
Navient Corp.
5.500%, due 1/15/19 | | | 300,000 | | | | 312,375 | |
| † | Percentages indicated are based on Portfolio net assets. |
| ¨ | | Among the Portfolio’s 10 largest issuers held, as of June 30, 2017, excluding short-term investments. May be subject to change daily. |
| | | | |
| 10 | | MainStay VP PIMCO Real Return Portfolio | | The notes to the financial statements are an integral part of,
and should be read in conjunction with, the financial statements. |
| | | | | | | | |
| | | Principal
Amount | | | Value | |
| Corporate Bonds (continued) | |
Diversified Financial Services (continued) | |
Nordea Kredit Realkreditaktieselskab | | | | | | | | |
1.000%, due 10/1/17 | | DKK | 1,200,000 | | | $ | 184,895 | |
2.000%, due 10/1/17 | | | 2,600,000 | | | | 401,584 | |
2.500%, due 10/1/47 | | | 469,910 | | | | 73,244 | |
Synchrony Financial
2.580%, due 11/9/17 (c) | | $ | 100,000 | | | | 100,317 | |
| | | | | | | | |
| | | | | | | 6,384,704 | |
| | | | | | | | |
Home Builders 0.3% | | | | | | | | |
D.R. Horton, Inc.
4.000%, due 2/15/20 | | | 900,000 | | | | 934,602 | |
| | | | | | | | |
| | |
Machinery—Diversified 0.3% | | | | | | | | |
John Deere Capital Corp.
1.577%, due 6/22/20 (c) | | | 1,100,000 | | | | 1,101,342 | |
| | | | | | | | |
| | |
Oil & Gas 0.4% | | | | | | | | |
BG Energy Capital PLC
Series Reg S
6.500%, due 11/30/72 (c) | | GBP | 200,000 | | | | 266,102 | |
Petrobras Global Finance B.V. | | | | | | | | |
6.125%, due 1/17/22 | | $ | 600,000 | | | | 618,900 | |
6.625%, due 1/16/34 | | GBP | 100,000 | | | | 126,467 | |
8.375%, due 5/23/21 | | $ | 100,000 | | | | 111,938 | |
| | | | | | | | |
| | | | | | | 1,123,407 | |
| | | | | | | | |
Pipelines 0.6% | | | | | | | | |
Enbridge, Inc.
1.946%, due 6/15/20 (c) | | | 1,000,000 | | | | 999,427 | |
Spectra Energy Partners, L.P.
1.920%, due 6/5/20 (c) | | | 900,000 | | | | 903,505 | |
| | | | | | | | |
| | | | | | | 1,902,932 | |
| | | | | | | | |
Real Estate Investment Trusts 0.2% | | | | | | | | |
Unibail-Rodamco SE
Series Reg S
1.928%, due 4/16/19 (c) | | | 700,000 | | | | 697,143 | |
| | | | | | | | |
| | |
Telecommunications 0.4% | | | | | | | | |
AT&T, Inc.
2.023%, due 7/15/21 (c) | | | 1,000,000 | | | | 1,010,357 | |
Telefonica Emisiones SAU
6.221%, due 7/3/17 | | | 400,000 | | | | 400,000 | |
| | | | | | | | |
| | | | | | | 1,410,357 | |
| | | | | | | | |
Total Corporate Bonds
(Cost $23,859,280) | | | | | | | 24,114,134 | |
| | | | | | | | |
| | | | | | | | |
| | | Principal
Amount | | | Value | |
| Foreign Government Bonds 3.5% | |
Argentina 0.3% | | | | | | | | |
Argentine Republic Government International Bond
6.875%, due 1/26/27 | | $ | 900,000 | | | $ | 932,400 | |
| | | | | | | | |
| | |
Canada 0.3% | | | | | | | | |
Canadian Government Real Return Bond
4.250%, due 12/1/26 | | CAD | 890,742 | | | | 935,107 | |
| | | | | | | | |
| | |
Japan 0.8% | | | | | | | | |
¨Japanese Government CPI Linked Bond | | | | | | | | |
0.100%, due 3/10/27 | | JPY | 230,460,000 | | | | 2,147,955 | |
0.100%, due 3/10/24 | | | 41,040,000 | | | | 378,126 | |
| | | | | | | | |
| | | | | | | 2,526,081 | |
| | | | | | | | |
Mexico 0.5% | | | | | | | | |
Mexican Bonos de Proteccion al Ahorro
6.570%, due 1/4/18 (c)(d) | | MXN | 32,600,000 | | | | 1,855,188 | |
| | | | | | | | |
| | |
New Zealand 0.8% | | | | | | | | |
¨New Zealand Government Bond | | | | | | | | |
Series Reg S
2.000%, due 9/20/25 | | NZD | 1,900,000 | | | | 1,483,586 | |
Series Reg S
2.500%, due 9/20/35 | | | 800,000 | | | | 631,920 | |
Series Reg S
3.000%, due 9/20/30 | | | 500,000 | | | | 427,831 | |
| | | | | | | | |
| | | | | | | 2,543,337 | |
| | | | | | | | |
Spain 0.2% | | | | | | | | |
Autonomous Community of Catalonia
4.950%, due 2/11/20 | | EUR | 500,000 | | | | 609,909 | |
| | | | | | | | |
| | |
United Kingdom 0.6% | | | | | | | | |
United Kingdom Gilt Inflation Linked | | | | | | | | |
Series Reg S 0.125%, due 3/22/46 | | GBP | 633,910 | | | | 1,309,174 | |
Series Reg S 0.125%, due 11/22/65 | | | 287,767 | | | | 827,548 | |
| | | | | | | | |
| | | | | | | 2,136,722 | |
| | | | | | | | |
Total Foreign Government Bonds
(Cost $12,350,566) | | | | | | | 11,538,744 | |
| | | | | | | | |
|
| Mortgage-Backed Securities 2.5% | |
Agency Collateral (Collateralized Mortgage Obligation) 0.2% | |
Federal Home Loan Mortgage Corporation Strips
Series 278, Class F1
1.609%, due 9/15/42 (c) | | $ | 851,888 | | | | 853,804 | |
| | | | | | | | |
| | | | | | |
The notes to the financial statements are an integral part of,
and should be read in conjunction with, the financial statements. | | | | | 11 | |
Portfolio of Investments June 30, 2017 (Unaudited) (continued)
| | | | | | | | |
| | | Principal
Amount | | | Value | |
| Mortgage-Backed Securities (continued) | |
Commercial Mortgage Loans (Collateralized Mortgage Obligations) 0.1% | |
Morgan Stanley Capital I Trust
Series 2007-IQ16, Class A4
5.809%, due 12/12/49 | | $ | 268,396 | | | $ | 269,177 | |
| | | | | | | | |
|
Whole Loan (Collateralized Mortgage Obligations) 2.2% | |
BCAP LLC Trust
Series 2011-RR5, Class 5A1
5.250%, due 8/26/37 (a) | | | 2,213,710 | | | | 2,274,142 | |
Eurosail-UK PLC (c) | | | | | | | | |
Series 2007-3X, Class A3A, Reg S
1.240%, due 6/13/45 | | GBP | 280,280 | | | | 352,403 | |
Series 2007-3A, Class A3C
1.240%, due 6/13/45 (a) | | | 74,732 | | | | 93,962 | |
Series 2007-3X, Class A3C, Reg S
1.240%, due 6/13/45 | | | 74,732 | | | | 93,962 | |
Marche Mutui Srl (c) | | | | | | | | |
Series 4, Class A, Reg S
0.108%, due 2/25/55 | | EUR | 3,327 | | | | 3,800 | |
Series 6, Class A1, Reg S
1.921%, due 1/27/64 | | | 55,558 | | | | 63,681 | |
¨Paragon Mortgages No.13 PLC
Series 13X, Class A1, Reg S
0.576%, due 1/15/39 (c) | | GBP | 2,398,270 | | | | 2,987,789 | |
Trinity Square PLC
Series 2015-1, Class A
1.486%, due 7/15/51 (a)(c) | | | 953,698 | | | | 1,255,921 | |
| | | | | | | | |
| | | | | | | 7,125,660 | |
| | | | | | | | |
Total Mortgage-Backed Securities
(Cost $8,585,532) | | | | | | | 8,248,641 | |
| | | | | | | | |
| | |
| Municipal Bonds 0.1% | | | | | | | | |
Texas 0.1% | | | | | | | | |
South Carolina Student Loan Corp. Series A-3
1.342%, due 12/1/23 (c) | | $ | 250,046 | | | | 250,066 | |
| | | | | | | | |
Total Municipal Bonds
(Cost $249,787) | | | | | | | 250,066 | |
| | | | | | | | |
|
| U.S. Government & Federal Agencies 109.9% | |
Federal National Mortgage Association
(Mortgage Pass-Through Securities) 0.6% (c)(e) | |
1.932%, due 6/1/43 | | | 472,746 | | | | 479,966 | |
2.982%, due 11/1/34 | | | 645,335 | | | | 683,107 | |
4.299%, due 12/1/36 | | | 631,447 | | | | 668,851 | |
| | | | | | | | |
| | | | | | | 1,831,924 | |
| | | | | | | | |
Government National Mortgage Association
(Mortgage Pass-Through Securities) 0.1% | |
Series 2017-H10, Class FB
2.550%, due 4/20/67 (c) | | | 400,116 | | | | 413,146 | |
| | | | | | | | |
| | | | | | | | |
| | | Principal
Amount | | | Value | |
¨United States Treasury Bonds 1.2% | |
3.000%, due 2/15/47 | | $ | 1,840,000 | | | $ | 1,898,074 | |
3.000%, due 5/15/47 | | | 2,110,000 | | | | 2,177,586 | |
| | | | | | | | |
| | | | | | | 4,075,660 | |
| | | | | | | | |
¨United States Treasury Notes 5.0% | |
1.875%, due 2/28/22 | | | 7,700,000 | | | | 7,709,325 | |
2.000%, due 2/15/25 | | | 3,880,000 | | | | 3,826,801 | |
2.000%, due 11/15/26 | | | 200,000 | | | | 195,015 | |
2.750%, due 2/15/24 | | | 4,300,000 | | | | 4,474,017 | |
| | | | | | | | |
| | | | | | | 16,205,158 | |
| | | | | | | | |
¨United States Treasury Inflation—Indexed Bond 38.4% (e) | |
0.375%, due 7/15/25 | | | 7,062,487 | | | | 7,009,426 | |
0.625%, due 2/15/43 | | | 1,850,403 | | | | 1,702,193 | |
0.750%, due 2/15/42 | | | 3,062,202 | | | | 2,913,492 | |
0.750%, due 2/15/45 | | | 2,803,410 | | | | 2,629,097 | |
0.875%, due 2/15/47 (f) | | | 3,504,530 | | | | 3,400,926 | |
1.000%, due 2/15/46 | | | 4,818,926 | | | | 4,814,604 | |
1.375%, due 7/15/18 (f) | | | 340,149 | | | | 345,535 | |
1.375%, due 2/15/44 | | | 14,970,514 | | | | 16,284,731 | |
1.750%, due 1/15/28 | | | 14,098,326 | | | | 15,714,178 | |
2.000%, due 1/15/26 | | | 8,142,727 | | | | 9,124,813 | |
2.125%, due 2/15/40 | | | 2,907,210 | | | | 3,615,708 | |
2.125%, due 2/15/41 | | | 1,574,237 | | | | 1,966,814 | |
2.375%, due 1/15/25 | | | 26,367,029 | | | | 30,038,163 | |
2.375%, due 1/15/27 (f) | | | 945,680 | | | | 1,097,902 | |
2.500%, due 1/15/29 | | | 15,902,464 | | | | 19,119,230 | |
3.625%, due 4/15/28 | | | 4,172,237 | | | | 5,450,389 | |
| | | | | | | | |
| | | | | | | 125,227,201 | |
| | | | | | | | |
¨United States Treasury Inflation—Indexed Notes 64.6% (e) | |
0.125%, due 4/15/18 | | | 3,322,267 | | | | 3,310,197 | |
0.125%, due 4/15/19 | | | 6,563,301 | | | | 6,566,267 | |
0.125%, due 4/15/20 | | | 25,244,598 | | | | 25,283,450 | |
0.125%, due 4/15/21 | | | 24,320,647 | | | | 24,283,607 | |
0.125%, due 1/15/22 | | | 2,668,242 | | | | 2,664,251 | |
0.125%, due 4/15/22 (f) | | | 3,920,904 | | | | 3,902,193 | |
0.125%, due 7/15/22 | | | 23,256,243 | | | | 23,226,568 | |
0.125%, due 1/15/23 | | | 28,292,655 | | | | 28,033,975 | |
0.125%, due 7/15/24 | | | 16,736,688 | | | | 16,439,896 | |
0.125%, due 7/15/26 (f) | | | 2,580,651 | | | | 2,489,210 | |
0.250%, due 1/15/25 | | | 8,278,886 | | | | 8,131,853 | |
0.375%, due 7/15/23 | | | 18,842,278 | | | | 18,963,623 | |
0.375%, due 1/15/27 | | | 2,631,642 | | | | 2,584,638 | |
0.625%, due 1/15/24 | | | 12,249,600 | | | | 12,424,096 | |
0.625%, due 1/15/26 | | | 16,313,296 | | | | 16,416,493 | |
1.375%, due 1/15/20 | | | 4,522,640 | | | | 4,687,418 | |
1.625%, due 1/15/18 (f) | | | 350,124 | | | | 351,701 | |
1.875%, due 7/15/19 | | | 10,305,900 | | | | 10,741,386 | |
| | | | | | | | |
| | | | | | | 210,500,822 | |
| | | | | | | | |
Total U.S. Government & Federal Agencies
(Cost $365,439,378) | | | | 358,253,911 | |
| | | | | | | | |
Total Long-Term Bonds (Cost $418,215,057) | | | | | | | 410,222,834 | |
| | | | | | | | |
| | | | |
| 12 | | MainStay VP PIMCO Real Return Portfolio | | The notes to the financial statements are an integral part of,
and should be read in conjunction with, the financial statements. |
| | | | | | | | |
| | | Principal
Amount | | | Value | |
| Purchased Put Options 0.0%‡ | |
IMM Euro Future
Strike Price $98.25
Expires 3/19/18 | | $ | 425,000 | | | $ | 13,813 | |
| | | | | | | | |
Total Purchased Put Options
(Cost $16,796) | | | | | | | 13,813 | |
| | | | | | | | |
|
| Short-Term Investments 72.9% | |
Foreign Government Bonds 8.2% | |
Argentina Treasury Bills | | | | | | | | |
(zero coupon), due 7/14/17 | | | 100,000 | | | | 99,944 | |
(zero coupon), due 9/15/17 | | | 300,000 | | | | 298,236 | |
(zero coupon), due 9/29/17 | | | 100,000 | | | | 99,271 | |
(zero coupon), due 10/13/17 | | | 300,000 | | | | 297,594 | |
(zero coupon), due 11/24/17 | | | 100,000 | | | | 98,863 | |
(zero coupon), due 12/15/17 | | | 200,000 | | | | 197,362 | |
Brazil Letras do Tesouro Nacional | | | | | | | | |
(zero coupon), due 10/1/17 | | BRL | 36,600,000 | | | | 10,794,652 | |
(zero coupon), due 1/1/18 | | | 14,100,000 | | | | 4,078,185 | |
(zero coupon), due 7/1/18 | | | 3,000,000 | | | | 833,017 | |
Japan Treasury Discount Bills | | | | | | | | |
(zero coupon), due 7/10/17 | | JPY | 260,000,000 | | | | 2,311,662 | |
(zero coupon), due 8/7/17 | | | 860,000,000 | | | | 7,646,732 | |
| | | | | | | | |
Total Foreign Government Bonds
(Cost $27,232,223) | | | | | | | 26,755,518 | |
| | | | | | | | |
|
Repurchase Agreements 60.4% | |
BNP Paribas Securities Corp.
1.25%, dated 6/30/17
due 7/6/17
Proceeds at Maturity $55,011,458 (Collateralized by a United States Treasury Inflation Protected Note with a rate of 0.125% and a maturity date of 415/18, with a Principal Amount of $56,317,528 and a Market Value of $56,132,018) | | | 55,000,000 | | | | 55,000,000 | |
Credit Agricole Corp.
1.38%, dated 6/30/17
due 7/3/17
Proceeds at Maturity $40,904,704 (Collateralized by a United States Treasury Note with a rate of 1.375% and a maturity date of 1/31/20, with a Principal Amount of $41,559,000 and a Market Value of $41,450,240) | | | 40,900,000 | | | | 40,900,000 | |
| | | | | | | | |
| | | Principal
Amount | | | Value | |
Repurchase Agreements (continued) | |
RBC Capital Markets LLC
1.40%, dated 6/30/17
due 7/3/17
Proceeds at Maturity $10,201,190 (Collateralized by United States Treasury securities with rates between 1.375% and 1.75% and maturity dates between 5/31/20 and 12/31/20, with a Principal Amount of $10,414,000 and a Market Value of $10,399,759) | | $ | 10,200,000 | | | $ | 10,200,000 | |
Societe Generale S.A.
1.08%, dated 6/30/17
due 7/5/17
Proceeds at Maturity $50,007,500 (Collateralized by a United States Treasury Inflation Protected Note with a rate of 0.125% and a maturity date of 7/15/22, with a Principal Amount of $50,942,282 and a Market Value of $50,904,483) | | | 50,000,000 | | | | 50,000,000 | |
Standard Chartered Bank
1.39%, dated 6/30/17
due 7/3/17
Proceeds at Maturity $40,904,738 (Collateralized by United States Treasury Notes with rates between 1.75% and 2.00% and maturity dates between 6/30/22 and 5/31/24, with a Principal Amount of $41,894,600 and a Market Value of $41,593,236) | | | 40,900,000 | | | | 40,900,000 | |
| | | | | | | | |
Total Repurchase Agreements
(Cost $197,000,000) | | | | | | | 197,000,000 | |
| | | | | | | | |
| | |
Short Term Instruments 3.9% | | | | | | | | |
Barclays Bank PLC
1.710%, due 3/16/18 | | | 900,000 | | | | 899,820 | |
1.949%, due 11/6/17 | | | 1,200,000 | | | | 1,202,700 | |
Credit Suisse
2.028%, due 9/12/17 | | | 2,300,000 | | | | 2,303,680 | |
Mitsubishi UFJ Trust & Banking Corp.
1.987%, due 9/19/17 | | | 700,000 | | | | 701,036 | |
Natixis
1.979%, due 9/25/17 | | | 2,300,000 | | | | 2,303,473 | |
Norinchukin Bank
1.871%, due 10/12/17 | | | 2,500,000 | | | | 2,505,000 | |
Sumitomo Mitsui Banking Corp.
1.946%, due 9/15/17 | | | 700,000 | | | | 700,945 | |
Sumitomo Mitsui Trust Bank, Ltd.
1.860%, due 10/6/17 | | | 700,000 | | | | 701,246 | |
1.997%, due 9/18/17 | | | 1,500,000 | | | | 1,502,250 | |
| | | | | | | | |
Total Short Term Instruments
(Cost $12,800,000) | | | | | | | 12,820,150 | |
| | | | | | | | |
| | | | | | |
The notes to the financial statements are an integral part of,
and should be read in conjunction with, the financial statements. | | | | | 13 | |
Portfolio of Investments June 30, 2017 (Unaudited) (continued)
| | | | | | | | |
| | | Principal
Amount | | | Value | |
| Short-Term Investments (continued) | |
U.S. Government & Federal Agencies 0.4% | |
United States Treasury Bills (g)
0.899-0.976%, due 8/31/17 | | $ | 1,221,000 | | | $ | 1,219,209 | |
| | | | | | | | |
Total U.S. Government & Federal Agencies
(Cost $1,219,169) | | | | | | | 1,219,209 | |
| | | | | | | | |
Total Short-Term Investments
(Cost $238,251,392) | | | | | | | 237,794,877 | |
| | | | | | | | |
Total Investments
(Cost $656,483,245) | | | 198.0 | % | | | 648,031,524 | |
Other Assets, Less Liabilities | | | (98.7 | ) | | | (321,968,110 | ) |
Net Assets | | | 100.0 | % | | $ | 326,063,414 | |
| ‡ | Less than one-tenth of a percent. |
| (a) | May be sold to institutional investors only under Rule 144A or securities offered pursuant to Section 4(a)(2) of the Securities Act of 1933, as amended. |
| (b) | Step coupon—Rate shown was the rate in effect as of June 30, 2017. |
| (c) | Floating rate—Rate shown was the rate in effect as of June 30, 2017. |
| (d) | Illiquid security—As of June 30, 2017, the total market value of these securities deemed illiquid under procedures approved by the Board of Trustees was $2,655,444, which represented 0.8% of the Portfolio’s net assets. |
| (e) | Delayed delivery security. |
| (f) | Security, or a portion thereof, was maintained in a segregated account at the Portfolio’s custodian as collateral for swap contracts (See Note 2(L)). |
| (g) | Interest rate shown represents yield to maturity. |
| (h) | As of June 30, 2017, cost was $656,762,994 for federal income tax purposes and net unrealized depreciation was as follows: |
| | | | |
Gross unrealized appreciation | | $ | 1,931,728 | |
Gross unrealized depreciation | | | (10,663,198 | ) |
| | | | |
Net unrealized depreciation | | $ | (8,731,470 | ) |
| | | | |
As of June 30, 2017, the Portfolio held the following foreign currency forward contracts:
| | | | | | | | | | | | | | | | | | | | | | | | | | | | | | |
Foreign Currency Buy Contracts | | Expiration
Date | | | Counterparty | | Contract Amount Purchased | | | Contract Amount Sold | | | Unrealized Appreciation (Depreciation) | |
Argentine Peso vs. U.S. Dollar | | | 9/15/17 | | | JPMorgan Chase Bank N.A. | | | ARS | | | | 7,773,600 | | | | | | | $ | 465,764 | | | | | | | $ | (15,260 | ) |
Brazilian Real vs. U.S. Dollar | | | 7/5/17 | | | Bank of America N.A. | | | BRL | | | | 5,042,657 | | | | | | | | 1,530,838 | | | | | | | | (8,710 | ) |
Brazilian Real vs. U.S. Dollar | | | 7/5/17 | | | Credit Suisse International | | | | | | | 2,470,644 | | | | | | | | 746,824 | | | | | | | | (1,060 | ) |
Brazilian Real vs. U.S. Dollar | | | 8/2/17 | | | Bank of America N.A. | | | | | | | 2,572,013 | | | | | | | | 764,843 | | | | | | | | 6,964 | |
Canadian Dollar vs. U.S. Dollar | | | 7/5/17 | | | JPMorgan Chase Bank N.A. | | | CAD | | | | 1,232,000 | | | | | | | | 939,884 | | | | | | | | 10,147 | |
Danish Krone vs. U.S. Dollar | | | 7/3/17 | | | Bank of America N.A. | | | DKK | | | | 5,673,700 | | | | | | | | 858,176 | | | | | | | | 13,314 | |
Euro vs. U.S. Dollar | | | 7/5/17 | | | Bank of America N.A. | | | EUR | | | | 2,730,000 | | | | | | | | 3,075,206 | | | | | | | | 42,863 | |
Euro vs. U.S. Dollar | | | 7/5/17 | | | Credit Suisse International | | | | | | | 2,133,000 | | | | | | | | 2,417,756 | | | | | | | | 18,450 | |
Indian Rupee vs. U.S. Dollar | | | 7/20/17 | | | Credit Suisse International | | | INR | | | | 52,465,290 | | | | | | | | 798,680 | | | | | | | | 11,434 | |
Indian Rupee vs. U.S. Dollar | | | 12/4/17 | | | Credit Suisse International | | | | | | | 52,465,290 | | | | | | | | 800,386 | | | | | | | | (4,200 | ) |
Pound Sterling vs. U.S. Dollar | | | 7/5/17 | | | Credit Suisse International | | | GBP | | | | 801,000 | | | | | | | | 1,024,194 | | | | | | | | 19,068 | |
Pound Sterling vs. U.S. Dollar | | | 7/5/17 | | | JPMorgan Chase Bank N.A. | | | | | | | 534,000 | | | | | | | | 691,949 | | | | | | | | 3,559 | |
Russian Ruble vs. U.S. Dollar | | | 9/21/17 | | | JPMorgan Chase Bank N.A. | | | RUB | | | | 47,802,570 | | | | | | | | 823,792 | | | | | | | | (26,296 | ) |
| | | | | | | | |
| | | | | | | | | | | | | | | | | | | | | | | | | | | | | | |
Foreign Currency Sales Contracts | | | | | | | Contract Amount Sold | | | Contract Amount Purchased | | | | |
Australian Dollar vs. U.S. Dollar | | | 7/5/17 | | | JPMorgan Chase Bank N.A. | | | AUD | | | | 1,942,000 | | | | | | | | 1,436,762 | | | | | | | | (55,859 | ) |
Brazilian Real vs. U.S. Dollar | | | 7/5/17 | | | Bank of America N.A. | | | BRL | | | | 5,042,657 | | | | | | | | 1,516,197 | | | | | | | | (5,930 | ) |
Brazilian Real vs. U.S. Dollar | | | 7/5/17 | | | Credit Suisse International | | | | | | | 2,470,644 | | | | | | | | 748,000 | | | | | | | | 2,235 | |
Brazilian Real vs. U.S. Dollar | | | 10/3/17 | | | JPMorgan Chase Bank N.A. | | | | | | | 36,600,000 | | | | | | | | 10,852,289 | | | | | | | | 1,168 | |
Brazilian Real vs. U.S. Dollar | | | 1/3/18 | | | JPMorgan Chase Bank N.A. | | | | | | | 14,100,000 | | | | | | | | 3,836,640 | | | | | | | | (283,832 | ) |
Brazilian Real vs. U.S. Dollar | | | 7/3/18 | | | Bank of America N.A. | | | | | | | 2,300,000 | | | | | | | | 678,266 | | | | | | | | 25,173 | |
Brazilian Real vs. U.S. Dollar | | | 7/3/18 | | | JPMorgan Chase Bank N.A. | | | | | | | 700,000 | | | | | | | | 206,058 | | | | | | | | 7,292 | |
Canadian Dollar vs. U.S. Dollar | | | 7/5/17 | | | JPMorgan Chase Bank N.A. | | | CAD | | | | 1,232,000 | | | | | | | | 914,007 | | | | | | | | (36,024 | ) |
| | | | |
| 14 | | MainStay VP PIMCO Real Return Portfolio | | The notes to the financial statements are an integral part of,
and should be read in conjunction with, the financial statements. |
| | | | | | | | | | | | | | | | | | | | | | | | | | | | | | |
Foreign Currency Sales Contracts | | | | | | | Contract Amount Sold | | | Contract Amount Purchased | | | Unrealized Appreciation (Depreciation) | |
Canadian Dollar vs. U.S. Dollar | | | 8/2/17 | | | JPMorgan Chase Bank N.A. | | | CAD | | | | 1,232,000 | | | | | | | $ | 940,375 | | | | | | | $ | (10,144 | ) |
Danish Krone vs. U.S. Dollar | | | 7/3/17 | | | Bank of America N.A. | | | DKK | | | | 5,704,832 | | | | | | | | 836,424 | | | | | | | | (39,847 | ) |
Danish Krone vs. U.S. Dollar | | | 7/3/17 | | | JPMorgan Chase Bank N.A. | | | | | | | 16,734,000 | | | | | | | | 2,550,741 | | | | | | | | (19,627 | ) |
Danish Krone vs. U.S. Dollar | | | 10/2/17 | | | Bank of America N.A. | | | | | | | 4,737,700 | | | | | | | | 720,716 | | | | | | | | (10,643 | ) |
Danish Krone vs. U.S. Dollar | | | 10/2/17 | | | JPMorgan Chase Bank N.A. | | | | | | | 7,969,000 | | | | | | | | 1,221,493 | | | | | | | | (8,682 | ) |
Danish Krone vs. U.S. Dollar | | | 10/3/17 | | | JPMorgan Chase Bank N.A. | | | | | | | 1,843,000 | | | | | | | | 280,387 | | | | | | | | (4,134 | ) |
Danish Krone vs. U.S. Dollar | | | 1/2/18 | | | Bank of America N.A. | | | | | | | 936,000 | | | | | | | | 142,632 | | | | | | | | (2,638 | ) |
Danish Krone vs. U.S. Dollar | | | 4/3/18 | | | Bank of America N.A. | | | | | | | 505,000 | | | | | | | | 77,440 | | | | | | | | (1,370 | ) |
Euro vs. U.S. Dollar | | | 7/5/17 | | | Bank of America N.A. | | | EUR | | | | 4,863,000 | | | | | | | | 5,466,012 | | | | | | | | (88,262 | ) |
Euro vs. U.S. Dollar | | | 8/2/17 | | | Credit Suisse International | | | | | | | 2,133,000 | | | | | | | | 2,421,328 | | | | | | | | (18,369 | ) |
Indian Rupee vs. U.S. Dollar | | | 7/20/17 | | | Credit Suisse International | | | INR | | | | 52,465,290 | | | | | | | | 812,030 | | | | | | | | 1,917 | |
Japanese Yen vs. U.S. Dollar | | | 7/5/17 | | | Credit Suisse International | | | JPY | | | | 286,200,000 | | | | | | | | 2,579,659 | | | | | | | | 35,093 | |
Japanese Yen vs. U.S. Dollar | | | 7/10/17 | | | Bank of America N.A. | | | | | | | 260,000,000 | | | | | | | | 2,362,127 | | | | | | | | 50,001 | |
Japanese Yen vs. U.S. Dollar | | | 8/7/17 | | | Bank of America N.A. | | | | | | | 860,000,000 | | | | | | | | 7,730,824 | | | | | | | | 74,139 | |
Mexican Peso vs. U.S. Dollar | | | 8/8/17 | | | Bank of America N.A. | | | MXN | | | | 18,257,219 | | | | | | | | 943,465 | | | | | | | | (57,101 | ) |
Mexican Peso vs. U.S. Dollar | | | 8/8/17 | | | Credit Suisse International | | | | | | | 15,919,000 | | | | | | | | 860,878 | | | | | | | | (11,544 | ) |
New Zealand Dollar vs. U.S. Dollar | | | 7/5/17 | | | JPMorgan Chase Bank N.A. | | | NZD | | | | 3,498,000 | | | | | | | | 2,472,505 | | | | | | | | (90,829 | ) |
Pound Sterling vs. U.S. Dollar | | | 7/5/17 | | | JPMorgan Chase Bank N.A. | | | GBP | | | | 7,516,000 | | | | | | | | 9,661,179 | | | | | | | | (128,032 | ) |
Russian Ruble vs. U.S. Dollar | | | 10/20/17 | | | Credit Suisse International | | | RUB | | | | 47,544,000 | | | | | | | | 814,668 | | | | | | | | 25,770 | |
Yuan Renminbi vs. U.S. Dollar | | | 7/5/17 | | | Credit Suisse International | | | CNH | | | | 162,000 | | | | | | | | 23,460 | | | | | | | | (433 | ) |
Net unrealized appreciation (depreciation) on foreign currency forward contracts | | | | | | | $ | (580,239 | ) |
As of June 30, 2017, the Portfolio held the following futures contracts1:
| | | | | | | | | | | | | | | | |
Type | | Number of
Contracts
Long
(Short) | | | Expiration
Date | | | Notional
Amount | | | Unrealized
Appreciation
(Depreciation)2 | |
5-Year United States Treasury Note | | | (67 | ) | | | September 2017 | | | $ | (7,895,007 | ) | | $ | 15,946 | |
| 10-Year Japan Government Bond | | | (3 | ) | | | September 2017 | | | | (4,003,823 | ) | | | 13,327 | |
| 10-Year United States Treasury Note | | | (38 | ) | | | September 2017 | | | | (4,770,188 | ) | | | 19,745 | |
| Euro BOBL | | | (6 | ) | | | September 2017 | | | | (902,527 | ) | | | 9,931 | |
| Euro-OAT | | | (1 | ) | | | September 2017 | | | | (169,586 | ) | | | 993 | |
| United States Treasury Long Bond | | | (56 | ) | | | September 2017 | | | | (8,606,500 | ) | | | (93,263 | ) |
| United States Treasury Ultra Bond | | | 28 | | | | September 2017 | | | | 4,644,500 | | | | 63,399 | |
| | | | | | | | | | | | | | | | |
| | | | | | | | | | $ | (21,703,131 | ) | | $ | 30,078 | |
| | | | | | | | | | | | | | | | |
| 1. | As of June 30, 2017, cash in the amount of $559,000 was on deposit with a broker for futures transactions. |
| 2. | Represents the difference between the value of the contracts at the time they were opened and the value as of June 30, 2017. |
Written Inflation-Capped Options
| | | | | | | | | | | | | | | | | | | | | | | | | | |
Description | | Counterparty | | | Initial
Index | | | Floating Rate | | Expiration
Date | | | Notional
Amount | | | Premium Paid
(Received) | | | Market
Value | |
Floor-OTC USA Non-Revised Consumer Price Index-Urban (CPI-U), American Style-Put | | | JPMorgan Chase Bank N.A. | | | | 238.643 | | | Maximum of [0, Final Index/Initial Index] | | | 10/2/2020 | | | $ | (1,900,000 | ) | | $ | (35,068 | ) | | $ | (10,558 | ) |
Cap-OTC USA Non-Revised Consumer Price Index-Urban (CPI-U), American Style-Call | | | JPMorgan Chase Bank N.A. | | | | 234.781 | | | Maximum of [0, Final Index/Initial Index –(1 + 4.000%)10] | | | 5/16/2024 | | | | (300,000 | ) | | | (2,085 | ) | | | (105 | ) |
| | | | | | | | | | | | | | | | | | | | | $ | (37,153 | ) | | $ | (10,663 | ) |
| | | | | | |
The notes to the financial statements are an integral part of,
and should be read in conjunction with, the financial statements. | | | | | 15 | |
Portfolio of Investments June 30, 2017 (Unaudited) (continued)
Written Options on Futures Contracts
| | | | | | | | | | | | | | | | | | | | | | | | |
Description | | Counterparty | | | Strike
Price | | | Expiration
Date | | | Notional
Amount | | | Premium Paid
(Received) | | | Market
Value | |
Call-10-Year United States Treasury Note | | | Morgan Stanley & Co., LLC | | | $ | 127.50 | | | | 7/21/2017 | | | $ | (54,000 | ) | | $ | (11,761 | ) | | $ | (2,531 | ) |
Put-10-Year United States Treasury Note | | | Morgan Stanley & Co., LLC | | | | 126.00 | | | | 7/21/2017 | | | | (54,000 | ) | | | (12,528 | ) | | | (41,344 | ) |
Call-10-Year United States Treasury Note | | | Morgan Stanley & Co., LLC | | | | 127.50 | | | | 8/25/2017 | | | | (28,000 | ) | | | (14,404 | ) | | | (5,688 | ) |
Put-10-Year United States Treasury Note | | | Morgan Stanley & Co., LLC | | | | 124.50 | | | | 8/25/2017 | | | | (28,000 | ) | | | (12,217 | ) | | | (12,687 | ) |
Call-IMM Euro Future | | | Morgan Stanley & Co., LLC | | | | 98.75 | | | | 3/19/2018 | | | | (425,000 | ) | | | (19,373 | ) | | | (6,375 | ) |
| | | | | | | | | | | | | | | | | | | $ | (70,283 | ) | | $ | (68,625 | ) |
Swap Contracts
As of June 30, 2017, the Portfolio held the following OTC inflation swap agreements1:
| | | | | | | | | | | | | | | | | | | | | | | | | | | | | | |
Notional Amount | | | Currency | | | Expiration
Date | | | Counterparty | | Payments
made by
Portfolio | | Payments
Received by
Portfolio | | Upfront
Premiums
Received/
(Paid) | | | Value | | | Unrealized
Appreciation/
(Depreciation) | |
USD | | | 8,000,000 | | | | USD | | | | 11/16/2017 | | | Credit Suisse International | | Fixed 2.320% | | 12-Month USD-CPI | | $ | — | | | $ | (447,906 | ) | | $ | (447,906 | ) |
| | | | | | | | | | | | | | | | | | | | | $ | — | | | $ | (447,906 | ) | | $ | (447,906 | ) |
As of June 30, 2017, the Portfolio held the following centrally cleared inflation swap agreements1:
| | | | | | | | | | | | | | | | | | | | | | | | | | | | |
Notional
Amount | | | Currency | | | Expiration
Date | | | Payments made by Portfolio | | Payments Received by Portfolio | | Upfront
Premiums
Received/
(Paid) | | | Value | | | Unrealized
Appreciation/
(Depreciation) | |
USD | | | 2,800,000 | | | | USD | | | | 4/27/2018 | | | Fixed 1.710% | | 12-Month USD-CPI | | $ | — | | | $ | (11,240 | ) | | $ | (11,240 | ) |
EUR | | | 200,000 | | | | EUR | | | | 9/15/2018 | | | Fixed 0.630% | | 12-Month USD-CPI | | | 361 | | | | 997 | | | | 1,358 | |
| | | | 600,000 | | | | | | | | 11/15/2018 | | | Fixed 0.890% | | 12-Month EUR-CPI | | | (708 | ) | | | 4,541 | | | | 3,833 | |
USD | | | 2,800,000 | | | | USD | | | | 4/27/2019 | | | 12-Month USD-CPI | | Fixed 1.940% | | | — | | | | 18,846 | | | | 18,846 | |
| | | | 800,000 | | | | | | | | 6/15/2019 | | | Fixed 1.790% | | 12-Month USD-CPI | | | — | | | | (9 | ) | | | (9 | ) |
| | | | 1,300,000 | | | | | | | | 11/23/2020 | | | Fixed 2.030% | | 12-Month USD-CPI | | | — | | | | (6,996 | ) | | | (6,996 | ) |
| | | | 1,300,000 | | | | | | | | 11/25/2020 | | | Fixed 2.020% | | 12-Month USD-CPI | | | — | | | | (6,802 | ) | | | (6,802 | ) |
EUR | | | 2,300,000 | | | | EUR | | | | 12/15/2026 | | | 12-Month EUR-CPI | | Fixed 1.390% | | | 3,757 | | | | 4,960 | | | | 8,717 | |
| | | | 800,000 | | | | | | | | 6/15/2027 | | | Fixed 1.360% | | 12-Month EUR-CPI | | | — | | | | 8,688 | | | | 8,688 | |
| | | | 800,000 | | | | | | | | 6/15/2027 | | | 12-Month EUR-CPI | | Fixed 1.440% | | | — | | | | (1,211 | ) | | | (1,211 | ) |
GBP | | | 4,300,000 | | | | GBP | | | | 6/15/2030 | | | UK RPI | | Fixed 3.400% | | | (4,803 | ) | | | 73,408 | | | | 68,605 | |
| | | | 2,100,000 | | | | | | | | 4/15/2031 | | | UK RPI | | Fixed 3.140% | | | 204,986 | | | | (171,032 | ) | | | 33,954 | |
| | | | 2,840,000 | | | | | | | | 10/15/2031 | | | UK RPI | | Fixed 3.530% | | | 18,042 | | | | 28,366 | | | | 46,408 | |
| | | | 560,000 | | | | | | | | 10/15/2046 | | | Fixed 3.590% | | UK RPI | | | 44,339 | | | | (41,213 | ) | | | 3,126 | |
| | | | | $ | 265,974 | | | $ | (98,697 | ) | | $ | 167,277 | |
As of June 30, 2017, the Portfolio held the following OTC credit default swap contracts:
| | | | | | | | | | | | | | | | | | | | | | | | | | | | | | | | |
Reference Entity | | Counterparty | | | Termination
Date | | | Buy/Sell
Protection2 | | | Notional
Amount
(000)3 | | | (Pay)/
Receive
Fixed
Rate4 | | | Upfront
Premiums
Received/
(Paid) | | | Value | | | Unrealized
Appreciation/
(Depreciation)5 | |
Federative Republic of Brazil | | | Credit Suisse International | | | | 6/20/2021 | | | | Sell | | | | 1,700 | | | | 1.000 | % | | $ | 97,316 | | | $ | (55,961 | ) | | $ | 41,355 | |
United Mexican States | | | Credit Suisse International | | | | 6/20/2021 | | | | Sell | | | | 2,700 | | | | 1.000 | % | | | 56,728 | | | | 17,630 | | | | 74,358 | |
Federative Republic of Brazil | | | Bank of America, NA | | | | 6/20/2022 | | | | Sell | | | | 300 | | | | 1.000 | % | | | 18,919 | | | | (18,754 | ) | | | 165 | |
| | | | | | | | | | | | | | | | | | | | | | | $ | 172,963 | | | $ | (57,085 | ) | | $ | 115,878 | |
| | | | |
| 16 | | MainStay VP PIMCO Real Return Portfolio | | The notes to the financial statements are an integral part of,
and should be read in conjunction with, the financial statements. |
As of June 30, 2017, the Portfolio held the following centrally cleared credit default swap contracts1:
| | | | | | | | | | | | | | | | | | | | | | | | | | | | |
Reference Entity | | Termination
Date | | | Buy/Sell
Protection2 | | | Notional
Amount
(000)3 | | | (Pay)/
Receive
Fixed
Rate4 | | | Upfront
Premiums
Received/
(Paid) | | | Value | | | Unrealized
Appreciation/
(Depreciation)5 | |
CDX North American High Yield Series 28, 5 Year Index | | | 6/20/2022 | | | | Sell | | | | 2,730 | | | | 5.000% | | | $ | 185,866 | | | $ | (187,953 | ) | | $ | (2,087 | ) |
| | | | | | | | | | | | | | | | | | | $ | 185,866 | | | $ | (187,953 | ) | | $ | (2,087 | ) |
As of June 30, 2017, the Portfolio held the following centrally cleared interest rate swap agreements1:
| | | | | | | | | | | | | | | | | | | | | | | | | | | | |
Notional
Amount | | | Currency | | | Expiration
Date | | | Payments made by Portfolio | | Payments Received by Portfolio | | Upfront
Premiums
Received/
(Paid) | | | Value | | | Unrealized
Appreciation/
(Depreciation) | |
USD | | | 2,500,000 | | | | USD | | | | 6/15/2018 | | | 3-Month USD-LIBOR | | Fixed 1.250% | | $ | 560 | | | $ | (4,281 | ) | | $ | (3,721 | ) |
| | | | 16,200,000 | | | | | | | | 6/21/2019 | | | Fixed 1.250% | | 3-Month USD-LIBOR | | | (95,386 | ) | | | 111,264 | | | | 15,878 | |
MXN | | | 18,400,000 | | | | MXN | | | | 7/7/2021 | | | MXN TIIE | | Fixed 5.610% | | | 43,644 | | | | (40,272 | ) | | | 3,372 | |
| | | | 7,200,000 | | | | | | | | 11/10/2021 | | | MXN TIIE | | Fixed 7.030% | | | 575 | | | | 4,696 | | | | 5,271 | |
| | | | 2,200,000 | | | | | | | | 11/17/2021 | | | MXN TIIE | | Fixed 7.390% | | | — | | | | 3,119 | | | | 3,119 | |
USD | | | 7,700,000 | | | | USD | | | | 12/16/2022 | | | 3-Month USD-LIBOR | | Fixed 2.250% | | | (16,266 | ) | | | 105,921 | | | | 89,655 | |
| | | | 900,000 | | | | | | | | 12/19/2023 | | | 3-Month USD-LIBOR | | Fixed 2.500% | | | 6,380 | | | | 11,147 | | | | 17,527 | |
MXN | | | 14,900,000 | | | | MXN | | | | 6/5/2024 | | | MXN TIIE | | Fixed 7.200% | | | (157 | ) | | | 12,585 | | | | 12,428 | |
USD | | | 6,200,000 | | | | USD | | | | 7/27/2026 | | | Fixed 2.000% | | 3-Month USD-LIBOR | | | (177,034 | ) | | | 151,952 | | | | (25,082 | ) |
MXN | | | 13,900,000 | | | | MXN | | | | 11/4/2026 | | | MXN TIIE | | Fixed 7.380% | | | — | | | | 15,512 | | | | 15,512 | |
| | | | 6,700,000 | | | | | | | | 12/17/2026 | | | MXN TIIE | | Fixed 8.040% | | | 1,661 | | | | 24,771 | | | | 26,432 | |
USD | | | 4,650,000 | | | | USD | | | | 12/21/2026 | | | Fixed 1.750% | | 3-Month USD-LIBOR | | | 111,224 | | | | 199,945 | | | | 311,169 | |
MXN | | | 3,400,000 | | | | MXN | | | | 2/25/2027 | | | MXN TIIE | | Fixed 7.730% | | | (4,970 | ) | | | 8,446 | | | | 3,476 | |
GBP | | | 4,200,000 | | | | GBP | | | | 9/20/2027 | | | Fixed 1.500% | | 6-Month GBP-LIBOR | | | 61,959 | | | | (60,012 | ) | | | 1,947 | |
| | | | 690,000 | | | | | | | | 3/18/2045 | | | Fixed 2.000% | | 6-Month GBP-LIBOR | | | 106,772 | | | | (78,530 | ) | | | 28,242 | |
JPY | | | 6,100,000 | | | | JPY | | | | 12/21/2045 | | | Fixed 1.500% | | 6-Month GBP-LIBOR | | | 9,103 | | | | (10,075 | ) | | | (972 | ) |
USD | | | 3,300,000 | | | | USD | | | | 6/15/2046 | | | Fixed 2.500% | | 3-Month USD-LIBOR | | | 200,235 | | | | 46,521 | | | | 246,756 | |
| | | | 4,600,000 | | | | | | | | 12/21/2046 | | | Fixed 2.250% | | 3-Month USD-LIBOR | | | 362,906 | | | | 283,284 | | | | 646,190 | |
GBP | | | 600,000 | | | | GBP | | | | 3/15/2047 | | | Fixed 1.500% | | 6-Month GBP-LIBOR | | | (8,522 | ) | | | 21,696 | | | | 13,174 | |
| | | | 1,750,000 | | | | | | | | 3/21/2048 | | | Fixed 1.750% | | 6-Month GBP-LIBOR | | | 92,317 | | | | (60,836 | ) | | | 31,481 | |
| | | | 300,000 | | | | | | | | 3/21/2048 | | | Fixed 1.750% | | 6-Month GBP-LIBOR | | | 25,364 | | | | (10,429 | ) | | | 14,935 | |
USD | | | 200,000 | | | | USD | | | | 12/19/2048 | | | Fixed 2.750% | | 3-Month USD-LIBOR | | | (4,389 | ) | | | (6,289 | ) | | | (10,678 | ) |
| | | | $715,976 | | | $ | 730,135 | | | $ | 1,446,111 | |
| 1. | As of June 30, 2017, cash in the amount of $618,000 was on deposit with a broker for centrally cleared swap agreements. |
| 2. | Buy-Portfolio pays premium and buys credit protection. If a credit event occurs, as defined under the terms of that particular swap agreement, the Portfolio will either (i) receive from the seller of protection an amount equal to the notional amount of the swap and deliver the referenced obligation or underlying securities comprising the referenced index or (ii) receive a net settlement amount in the form of cash or securities equal to the notional amount of the swap less the recovery value of the referenced obligation or underlying securities comprising the referenced index. |
| | Sell-Portfolio receives premium and sells credit protection. If a credit event occurs, as defined under the terms of that particular swap agreement, the Portfolio will either (i) pay to the buyer of protection an amount equal to the notional amount of the swap and take delivery of the referenced obligation or underlying securities comprising the referenced index or (ii) pay a net settlement amount in the form of cash or securities equal to the notional amount of the swap less the recovery value of the referenced obligation or underlying securities comprising the referenced index. |
| 3. | The maximum potential amount the Portfolio could be required to pay as a seller of credit protection or receive as a buyer of credit protection if a credit event occurs as defined under the terms of that particular swap contract. |
| 4. | The annual fixed rate represents the interest received by the Portfolio (as a seller of protection) or paid by the Portfolio (as a buyer of protection) annually on the notional amount of the credit default swap contract. |
| 5. | Represents the difference between the value of the credit default swap contracts at the time they were opened and the value at June 30, 2017. |
| | | | | | |
The notes to the financial statements are an integral part of,
and should be read in conjunction with, the financial statements. | | | | | 17 | |
Portfolio of Investments June 30, 2017 (Unaudited) (continued)
The following abbreviations are used in the preceding pages:
AUD—Australian Dollar
ARS—Argentine Peso
BRL—Brazilian Real
CAD—Canadian Dollar
CNH—Chinese Yuan Renminbi Offshore
DKK—Danish Krone
EUR—Euro
GBP—British Pound Sterling
INR—Indian Rupee
JPY—Japanese Yen
MXN—Mexican Peso
NZD—New Zealand Dollar
RUB—New Russian Ruble
USD—United States Dollar
The following is a summary of the fair valuations according to the inputs used as of June 30, 2017, for valuing the Portfolio’s assets and liabilities.
Asset Valuation Inputs
| | | | | | | | | | | | | | | | |
Description | | Quoted
Prices in
Active
Markets for
Identical
Assets (Level 1) | | | Significant
Other
Observable
Inputs (Level 2) | | | Significant
Unobservable
Inputs (Level 3) | | | Total | |
| Investments in Securities (a) | | | | | | | | | | | | |
| Long-Term Bonds | | | | | | | | | | | | |
Asset-Backed Securities | | $ | — | | | $ | 7,817,338 | | | $ | — | | | $ | 7,817,338 | |
Corporate Bonds | | | — | | | | 24,114,134 | | | | — | | | | 24,114,134 | |
Foreign Government Bonds | | | — | | | | 11,538,744 | | | | — | | | | 11,538,744 | |
Mortgage-Backed Securities | | | — | | | | 8,248,641 | | | | — | | | | 8,248,641 | |
Municipal Bonds | | | — | | | | 250,066 | | | | — | | | | 250,066 | |
U.S. Government & Federal Agencies | | | — | | | | 358,253,911 | | | | — | | | | 358,253,911 | |
| | | | | | | | | | | | | | | | |
| Total Long-Term Bonds | | | — | | | | 410,222,834 | | | | — | | | | 410,222,834 | |
| | | | | | | | | | | | | | | | |
| Purchased Put Options | | | 13,813 | | | | — | | | | — | | | | 13,813 | |
| Short-Term Investments | | | | | | | | | | | | |
Foreign Government Bonds | | | — | | | | 26,755,518 | | | | — | | | | 26,755,518 | |
Repurchase Agreement | | | — | | | | 197,000,000 | | | | — | | | | 197,000,000 | |
Short Term Instruments | | | — | | | | 12,820,150 | | | | — | | | | 12,820,150 | |
U.S. Government & Federal Agencies | | | — | | | | 1,219,209 | | | | — | | | | 1,219,209 | |
| | | | | | | | | | | | | | | | |
| Total Short-Term Investments | | | — | | | | 237,794,877 | | | | — | | | | 237,794,877 | |
| | | | | | | | | | | | | | | | |
| Total Investments in Securities | | | 13,813 | | | | 648,017,711 | | | | — | | | | 648,031,524 | |
| | | | | | | | | | | | | | | | |
| Other Financial Instruments | | | | | | | | | | | | |
Foreign Currency Forward Contracts (b) | | | — | | | | 348,587 | | | | — | | | | 348,587 | |
Futures Contracts (b) | | | 123,341 | | | | — | | | | — | | | | 123,341 | |
Inflation Swap Contracts (b) | | | — | | | | 193,535 | | | | — | | | | 193,535 | |
Credit Default Swap Contracts (b) | | | — | | | | 115,878 | | | | — | | | | 115,878 | |
Interest Rate Swap Contracts (b) | | | — | | | | 1,486,564 | | | | — | | | | 1,486,564 | |
| | | | | | | | | | | | | | | | |
| Total Other Financial Instruments | | | 123,341 | | | | 2,144,564 | | | | — | | | | 2,267,905 | |
| | | | | | | | | | | | | | | | |
| Total Investments in Securities and Other Financial Instruments | | $ | 137,154 | | | $ | 650,162,275 | | | $ | — | | | $ | 650,299,429 | |
| | | | | | | | | | | | | | | | |
| | | | |
| 18 | | MainStay VP PIMCO Real Return Portfolio | | The notes to the financial statements are an integral part of,
and should be read in conjunction with, the financial statements. |
Liability Valuation Inputs
| | | | | | | | | | | | | | | | |
Description | | Quoted
Prices in
Active
Markets for
Identical
Assets (Level 1) | | | Significant
Other
Observable
Inputs (Level 2) | | | Significant
Unobservable
Inputs (Level 3) | | | Total | |
| Other Financial Instruments | | | | | | | | | | | | | | | | |
Foreign Currency Forward Contracts (b) | | $ | — | | | $ | (928,826 | ) | | $ | — | | | $ | (928,826 | ) |
Futures Contracts (b) | | | (93,263 | ) | | | — | | | | — | | | | (93,263 | ) |
Written Options | | | (68,625 | ) | | | (10,663 | ) | | | — | | | | (79,288 | ) |
Inflation Swap Contracts (b) | | | — | | | | (474,164 | ) | | | — | | | | (474,164 | ) |
Credit Default Swap Contracts (b) | | | — | | | | (2,087 | ) | | | — | | | | (2,087 | ) |
Interest Rate Swap Contracts (b) | | | — | | | | (40,453 | ) | | | — | | | | (40,453 | ) |
| | | | | | | | | | | | | | | | |
| Total Other Financial Instruments | | $ | (161,888 | ) | | $ | (1,456,193 | ) | | $ | — | | | $ | (1,618,081 | ) |
| | | | | | | | | | | | | | | | |
| (a) | For a complete listing of investments and their industries, see the Portfolio of Investments. |
| (b) | The value listed for these securities reflects unrealized appreciation (depreciation) as shown on the Portfolio of Investments. |
The Portfolio recognizes transfers between the levels as of the beginning of the period.
For the period ended June 30, 2017, the Portfolio did not have any transfers among levels. (See Note 2)
As of June 30, 2017, the Portfolio did not hold any investments with significant unobservable inputs (Level 3). (See Note 2)
| | | | | | |
The notes to the financial statements are an integral part of,
and should be read in conjunction with, the financial statements. | | | | | 19 | |
Statement of Assets and Liabilities as of June 30, 2017 (Unaudited)
| | | | |
| Assets | |
Investment in securities, at value
(identified cost $459,483,245) | | $ | 451,031,524 | |
Repurchase agreement, at value
(identified cost $197,000,000) | | | 197,000,000 | |
Cash collateral on deposit at broker | | | 2,172,000 | |
Cash denominated in foreign currencies
(identified cost $1,115,046) | | | 1,015,215 | |
Cash | | | 806,293 | |
Receivables: | | | | |
Investment securities sold | | | 3,635,535 | |
Interest | | | 1,792,141 | |
Fund shares sold | | | 139,071 | |
Variation margin on derivative instruments | | | 95,492 | |
Variation margin on centrally cleared swap contracts | | | 247,002 | |
Unrealized appreciation on OTC swap contracts | | | 115,878 | |
Other assets | | | 1,822 | |
Unrealized appreciation on foreign currency forward contracts | | | 348,587 | |
| | | | |
Total assets | | | 658,400,560 | |
| | | | |
| |
| Liabilities | | | | |
Written options, at value (premiums received $107,436) | | | 79,288 | |
Payables: | | | | |
Sale buyback transaction | | | 221,472,683 | |
Investment securities purchased | | | 108,902,133 | |
Premiums received for OTC swap contracts | | | 172,963 | |
Manager (See Note 3) | | | 134,946 | |
Fund shares redeemed | | | 70,537 | |
NYLIFE Distributors (See Note 3) | | | 59,010 | |
Professional fees | | | 40,964 | |
Custodian | | | 14,216 | |
Shareholder communication | | | 9,740 | |
Trustees | | | 559 | |
Accrued expenses | | | 3,375 | |
Unrealized depreciation on OTC swap contracts | | | 447,906 | |
Unrealized depreciation on foreign currency forward contracts | | | 928,826 | |
| | | | |
Total liabilities | | | 332,337,146 | |
| | | | |
Net assets | | $ | 326,063,414 | |
| | | | |
| | | | |
| Composition of Net Assets | | | | |
Shares of beneficial interest outstanding (par value of $.001 per share) unlimited number of shares authorized | | $ | 38,428 | |
Additional paid-in capital | | | 395,839,310 | |
| | | | |
| | | 395,877,738 | |
Undistributed net investment income | | | 9,308,974 | |
Accumulated net realized gain (loss) on investments, investments sold short, futures transactions, written options, swap transactions and foreign currency transactions | | | (71,470,958 | ) |
Net unrealized appreciation (depreciation) on investments, swap contracts, futures contracts and written options | | | (7,114,222 | ) |
Net unrealized appreciation (depreciation) on translation of other assets and liabilities in foreign currencies and foreign currency forward contracts | | | (538,118 | ) |
| | | | |
Net assets | | $ | 326,063,414 | |
| | | | |
Initial Class | | | | |
Net assets applicable to outstanding shares | | $ | 41,010,563 | |
| | | | |
Shares of beneficial interest outstanding | | | 4,821,700 | |
| | | | |
Net asset value per share outstanding | | $ | 8.51 | |
| | | | |
Service Class | | | | |
Net assets applicable to outstanding shares | | $ | 285,052,851 | |
| | | | |
Shares of beneficial interest outstanding | | | 33,605,870 | |
| | | | |
Net asset value per share outstanding | | $ | 8.48 | |
| | | | |
| | | | |
| 20 | | MainStay VP PIMCO Real Return Portfolio | | The notes to the financial statements are an integral part of,
and should be read in conjunction with, the financial statements. |
Statement of Operations for the six months ended June 30, 2017 (Unaudited)
| | | | |
| Investment Income (Loss) | |
Income | |
Interest | | $ | 6,785,287 | |
| | | | |
Expenses | | | | |
Manager (See Note 3) | | | 804,638 | |
Interest expense | | | 551,607 | |
Distribution/Service—Service Class (See Note 3) | | | 354,125 | |
Custodian | | | 56,951 | |
Professional fees | | | 47,971 | |
Shareholder communication | | | 31,918 | |
Trustees | | | 4,013 | |
Miscellaneous | | | 7,646 | |
| | | | |
Total expenses | | | 1,858,869 | |
| | | | |
Net investment income (loss) | | | 4,926,418 | |
| | | | |
|
| Realized and Unrealized Gain (Loss) on Investments, Futures Contracts, Swap Contracts, Written Options and Foreign Currency Transactions | |
Net realized gain (loss) on: | | | | |
Investment transactions | | | (2,169,241 | ) |
Investments sold short | | | (12,148 | ) |
Futures transactions | | | (349,679 | ) |
Written option transactions | | | 266,717 | |
Swap transactions | | | 96,797 | |
Foreign currency transactions | | | (638,592 | ) |
| | | | |
Net realized gain (loss) on investments, investments sold short, futures transactions, swap transactions, written option transactions and foreign currency transactions | | | (2,806,146 | ) |
| | | | |
Net change in unrealized appreciation (depreciation) on: | | | | |
Investments | | | 2,684,862 | |
Investments sold short | | | 47,471 | |
Futures contracts | | | 74,596 | |
Swap contracts | | | 376,941 | |
Written option contracts | | | 1,631 | |
Translation of other assets and liabilities in foreign currencies and foreign currency forward contracts | | | (1,712,507 | ) |
| | | | |
Net change in unrealized appreciation (depreciation) on investments, investments sold short, futures contracts, swap contracts, written options and foreign currency transactions | | | 1,472,994 | |
| | | | |
Net realized and unrealized gain (loss) on investments, investments sold short, futures transactions, written options, swap transactions and foreign currency transactions | | | (1,333,152 | ) |
| | | | |
Net increase (decrease) in net assets resulting from operations | | $ | 3,593,266 | |
| | | | |
| | | | | | |
The notes to the financial statements are an integral part of,
and should be read in conjunction with, the financial statements. | | | | | 21 | |
Statements of Changes in Net Assets
for the six months ended June 30, 2017 (Unaudited) and the year ended December 31, 2016
| | | | | | | | |
| | | 2017 | | | 2016 | |
| Increase (Decrease) in Net Assets | |
Operations: | | | | | | | | |
Net investment income (loss) | | $ | 4,926,418 | | | $ | 6,791,183 | |
Net realized gain (loss) on investments, investments sold short, futures transactions, written option transactions, swap transactions and foreign currency transactions | | | (2,806,146 | ) | | | (12,997,564 | ) |
Net change in unrealized appreciation (depreciation) on investments, investments sold short, futures contracts, written options, swap contracts and foreign currency transactions | | | 1,472,994 | | | | 21,386,501 | |
| | | | |
Net increase (decrease) in net assets resulting from operations | | | 3,593,266 | | | | 15,180,120 | |
| | | | |
Dividends to shareholders: | | | | | | | | |
From net investment income: | | | | | | | | |
Initial Class | | | — | | | | (602,515 | ) |
Service Class | | | — | | | | (3,989,745 | ) |
| | | | |
Total dividends to shareholders | | | — | | | | (4,592,260 | ) |
| | | | |
Capital share transactions: | | | | | | | | |
Net proceeds from sale of shares | | | 24,685,563 | | | | 38,669,160 | |
Net asset value of shares issued to shareholders in reinvestment of dividends | | | — | | | | 4,592,260 | |
Cost of shares redeemed | | | (20,281,206 | ) | | | (87,850,451 | ) |
| | | | |
Increase (decrease) in net assets derived from capital share transactions | | | 4,404,357 | | | | (44,589,031 | ) |
| | | | |
Net increase (decrease) in net assets | | | 7,997,623 | | | | (34,001,171 | ) |
|
| Net Assets | |
Beginning of period | | | 318,065,791 | | | | 352,066,962 | |
| | | | |
End of period | | $ | 326,063,414 | | | $ | 318,065,791 | |
| | | | |
Undistributed net investment income at end of period | | $ | 9,308,974 | | | $ | 4,382,556 | |
| | | | |
| | | | |
| 22 | | MainStay VP PIMCO Real Return Portfolio | | The notes to the financial statements are an integral part of,
and should be read in conjunction with, the financial statements. |
Statement of Cash Flows
for the six months ended June 30, 2017 (Unaudited)
| | | | |
| Cash flows used in operating activities: | |
Net increase in net assets resulting from operations | | $ | 3,593,266 | |
Adjustments to reconcile net increase in net assets resulting from operations to net cash used in operating activities: | | | | |
Long term investments purchased | | | (253,547,499 | ) |
Long term investments sold | | | 254,730,002 | |
Purchases to cover securities sold short | | | (4,064,365 | ) |
Purchase of short term investments, net | | | (89,245,960 | ) |
Amortization (accretion) of discount and premium and inflation adjustments, net | | | (4,409,746 | ) |
Decrease in investment securities sold receivable | | | 35,759,979 | |
Increase in interest receivable | | | (282,543 | ) |
Decrease in deposit at brokers | | | 177,000 | |
Increase in other assets | | | (1,820 | ) |
Decrease in unrealized appreciation on forward foreign currency contracts | | | 2,940,415 | |
Increase in premiums from written options | | | 61,455 | |
Decrease in investment securities purchased payable | | | (41,274,576 | ) |
Decrease in interest payable for securities sold short | | | (30,257 | ) |
Decrease in due to broker | | | (830,000 | ) |
Decrease in professional fees payable | | | (19,897 | ) |
Decrease in custodian payable | | | (6,798 | ) |
Decrease in shareholder communication payable | | | (9,484 | ) |
Increase in due to manager | | | 1,117 | |
Decrease in due to NYLIFE Distributors | | | (325 | ) |
Increase in due to Trustees | | | 99 | |
Increase in unrealized appreciation on OTC swap contracts | | | (94,342 | ) |
Increase in unrealized depreciation on OTC swap contracts | | | 19,320 | |
Decrease in premiums received for open OTC swap contracts | | | (1,853 | ) |
Decrease in unrealized depreciation on forward foreign currency contracts | | | (1,171,394 | ) |
Decrease in variation margin on derivative instruments | | | (345,914 | ) |
Increase in accrued expenses and other liabilities | | | 2,925 | |
Net change in unrealized (appreciation) depreciation on investments | | | (2,684,862 | ) |
Net realized loss from investments | | | 2,169,241 | |
Net change in unrealized (appreciation) on securities sold short | | | (47,471 | ) |
Net realized loss from securities sold short | | | 12,148 | |
Net change in unrealized depreciation on written options | | | (1,631 | ) |
| | | | |
Net cash used in operating activities* | | | (98,603,770 | ) |
| | | | |
| |
| Cash flows used in financing activities: | | | | |
Proceeds from shares sold | | | 24,622,254 | |
Payment on shares redeemed | | | (20,313,498 | ) |
Due to custodian | | | (16 | ) |
Proceeds from reverse repurchase agreements | | | (119,792,963 | ) |
Payments on reverse repurchase agreements | | | 60,292,113 | |
Proceeds from sale-buyback transactions | | | 4,133,243,207 | |
Payments on sale-buyback transactions | | | (3,977,906,691 | ) |
| | | | |
Net cash used in financing activities | | | 100,144,406 | |
| | | | |
Net increase in cash: | | | 1,540,636 | |
| | | | |
Cash and Foreign Currency at beginning of period | | | 280,872 | |
| | | | |
Cash and Foreign Currency at end of period | | $ | 1,821,508 | |
| | | | |
| * | Included in operating expenses is cash of $581,864 paid for interest on borrowings. |
| | | | | | |
The notes to the financial statements are an integral part of,
and should be read in conjunction with, the financial statements. | | | | | 23 | |
Financial Highlights selected per share data and ratios
| | | | | | | | | | | | | | | | | | | | | | | | | | | | |
| | | Six months
ended
June 30, | | | | | | Year ended December 31, | | | February 17,
2012** through
December 31, | |
| Initial Class | | 2017* | | | | | | 2016 | | | 2015 | | | 2014 | | | 2013 | | | 2012 | |
Net asset value at beginning of period | | $ | 8.40 | | | | | | | $ | 8.11 | | | $ | 8.71 | | | $ | 9.44 | | | $ | 10.59 | | | $ | 10.00 | |
| | | | | | | | | | | | | | | | | | | | | | | | | | | | |
Net investment income (loss) (a) | | | 0.14 | | | | | | | | 0.17 | | | | 0.11 | | | | 0.26 | | | | 0.09 | | | | 0.14 | |
Net realized and unrealized gain (loss) on investments | | | 0.02 | | | | | | | | 0.21 | | | | (0.51 | ) | | | (0.18 | ) | | | (1.05 | ) | | | 0.47 | |
Net realized and unrealized gain (loss) on foreign currency transactions | | | (0.05 | ) | | | | | | | 0.05 | | | | 0.19 | | | | 0.18 | | | | (0.01 | ) | | | (0.02 | ) |
| | | | | | | | | | | | | | | | | | | | | | | | | | | | |
Total from investment operations | | | 0.11 | | | | | | | | 0.43 | | | | (0.21 | ) | | | 0.26 | | | | (0.97 | ) | | | 0.59 | |
| | | | | | | | | | | | | | | | | | | | | | | | | | | | |
| Less dividends and distributions: | | | | | | | | | | | | | | | | | | | | | | | | | | | | |
From net investment income | | | — | | | | | | | | (0.14 | ) | | | (0.39 | ) | | | (0.09 | ) | | | (0.12 | ) | | | — | |
From net realized gain on investments | | | — | | | | | | | | — | | | | — | | | | (0.90 | ) | | | (0.06 | ) | | | — | |
| | | | | | | | | | | | | | | | | | | | | | | | | | | | |
Total dividends and distributions | | | — | | | | | | | | (0.14 | ) | | | (0.39 | ) | | | (0.99 | ) | | | (0.18 | ) | | | — | |
| | | | | | | | | | | | | | | | | | | | | | | | | | | | |
Net asset value at end of period | | $ | 8.51 | | | | | | | $ | 8.40 | | | $ | 8.11 | | | $ | 8.71 | | | $ | 9.44 | | | $ | 10.59 | |
| | | | | | | | | | | | | | | | | | | | | | | | | | | | |
Total investment return (b) | | | 1.31 | %(c) | | | | | | | 5.28 | % | | | (2.51 | %) | | | 2.50 | % | | | (9.08 | %) | | | 5.90 | %(c) |
| Ratios (to average net assets)/Supplemental Data: | | | | | | | | | | | | | | | | | | | | | | | | | | | | |
Net investment income (loss) | | | 3.31 | %†† | | | | | | | 2.06 | %(d) | | | 1.26 | % | | | 2.74 | % | | | 0.88 | % | | | 1.51 | %†† |
Net expenses (f) | | | 0.94 | %†† | | | | | | | 0.90 | %(e) | | | 0.72 | % | | | 0.64 | % | | | 0.61 | % | | | 0.62 | %†† |
Portfolio turnover rate (g) | | | 86 | % | | | | | | | 143 | % | | | 84 | % | | | 85 | % | | | 88 | % | | | 44 | % |
Net assets at end of period (in 000’s) | | $ | 41,011 | | | | | | | $ | 36,060 | | | $ | 68,794 | | | $ | 9,479 | | | $ | 9,678 | | | $ | 12,642 | |
| (a) | Per share data based on average shares outstanding during the period. |
| (b) | Total return does not reflect any deduction of sales charges, mortality and expense charges, contract charges or administrative charges. For periods of less than one year, total return is not annualized. |
| (c) | Total investment return may reflect adjustments to conform to generally accepted accounting principles. |
| (d) | Without the custody fee reimbursement, net investment income (loss) would have been 2.04%. |
| (e) | Without the custody fee reimbursement, net expenses would have been 0.92%. |
| (f) | Includes interest expenses of 0.34%, 0.32%, 0.15%, 0.08%, 0.07% and 0.05% incurred as a result of entering into reverse repurchase agreements and dollar roll transactions for the six months ended June 30, 2017, the years ended December 31, 2016, 2015, 2014, 2013 and the period ended December 31, 2012, respectively. |
| (g) | The portfolio turnover rates not including dollar rolls were 67% for the six months ended June 30, 2017, 91%, 59%, 49%, and 88% for the years ended December 31, 2016, 2015, 2014, 2013 and 43% for the period ended December 31, 2012. |
| | | | |
| 24 | | MainStay VP PIMCO Real Return Portfolio | | The notes to the financial statements are an integral part of,
and should be read in conjunction with, the financial statements. |
Financial Highlights selected per share data and ratios
| | | | | | | | | | | | | | | | | | | | | | | | | | | | |
| | | Six months
ended
June 30, | | | | | | Year ended December 31, | | | February 17,
2012 **
through
December 31, | |
| Service Class | | 2017* | | | | | | 2016 | | | 2015 | | | 2014 | | | 2013 | | | 2012 | |
Net asset value at beginning of period | | $ | 8.39 | | | | | | | $ | 8.10 | | | $ | 8.70 | | | $ | 9.42 | | | $ | 10.58 | | | $ | 10.00 | |
| | | | | | | | | | | | | | | | | | | | | | | | | | | | |
Net investment income (loss) (a) | | | 0.13 | | | | | | | | 0.18 | | | | 0.05 | | | | 0.24 | | | | 0.07 | | | | 0.12 | |
Net realized and unrealized gain (loss) on investments | | | 0.03 | | | | | | | | 0.19 | | | | (0.46 | ) | | | (0.18 | ) | | | (1.05 | ) | | | 0.48 | |
Net realized and unrealized gain (loss) on foreign currency transactions | | | (0.07 | ) | | | | | | | 0.04 | | | | 0.17 | | | | 0.18 | | | | (0.01 | ) | | | (0.02 | ) |
| | | | | | | | | | | | | | | | | | | | | | | | | | | | |
Total from investment operations | | | 0.09 | | | | | | | | 0.41 | | | | (0.24 | ) | | | 0.24 | | | | (0.99 | ) | | | 0.58 | |
| | | | | | | | | | | | | | | | | | | | | | | | | | | | |
| Less dividends and distributions: | | | | | | | | | | | | | | | | | | | | | | | | | | | | |
From net investment income | | | — | | | | | | | | (0.12 | ) | | | (0.36 | ) | | | (0.06 | ) | | | (0.11 | ) | | | — | |
From net realized gain on investments | | | — | | | | | | | | — | | | | — | | | | (0.90 | ) | | | (0.06 | ) | | | — | |
| | | | | | | | | | | | | | | | | | | | | | | | | | | | |
Total dividends and distributions | | | — | | | | | | | | (0.12 | ) | | | (0.36 | ) | | | (0.96 | ) | | | (0.17 | ) | | | — | |
| | | | | | | | | | | | | | | | | | | | | | | | | | | | |
Net asset value at end of period | | $ | 8.48 | | | | | | | $ | 8.39 | | | $ | 8.10 | | | $ | 8.70 | | | $ | 9.42 | | | $ | 10.58 | |
| | | | | | | | | | | | | | | | | | | | | | | | | | | | |
Total investment return (b) | | | 1.07 | %(c) | | | | | | | 5.03 | % | | | (2.76 | %) | | | 2.26 | % | | | (9.26 | %) | | | 5.80 | %(c) |
| Ratios (to average net assets)/Supplemental Data: | | | | | | | | | | | | | | | | | | | | | | | | | | | | |
Net investment income (loss) | | | 3.03 | %†† | | | | | | | 2.16 | %(d) | | | 0.56 | % | | | 2.52 | % | | | 0.67 | % | | | 1.32 | %†† |
Net expenses (f) | | | 1.19 | %†† | | | | | | | 1.16 | %(e) | | | 0.97 | % | | | 0.87 | % | | | 0.82 | % | | | 0.81 | %†† |
Portfolio turnover rate (g) | | | 86 | % | | | | | | | 143 | % | | | 84 | % | | | 85 | % | | | 88 | % | | | 44 | % |
Net assets at end of period (in 000’s) | | $ | 285,053 | | | | | | | $ | 282,006 | | | $ | 283,273 | | | $ | 331,595 | | | $ | 356,681 | | | $ | 475,807 | |
| (a) | Per share data based on average shares outstanding during the period. |
| (b) | Total return does not reflect any deduction of sales charges, mortality and expense charges, contract charges or administrative charges. For periods of less than one year, total return is not annualized. |
| (c) | Total investment return may reflect adjustments to conform to generally accepted accounting principles. |
| (d) | Without the custody fee reimbursement, net investment income (loss) would have been 2.14%. |
| (e) | Without the custody fee reimbursement, net expenses would have been 1.17%. |
| (f) | Includes interest expenses of 0.34%, 0.32%, 0.15%, 0.08%, 0.07% and 0.05% incurred as a result of entering into reverse repurchase agreements and dollar roll transactions for the six months ended June 30, 2017, the years ended December 31, 2016, 2015, 2014, 2013 and the period ended December 31, 2012, respectively. |
| (g) | The portfolio turnover rates not including dollar rolls were 67% for the six months ended June 30, 2017, 91%, 59%, 49%, and 88% for the years ended December 31, 2016, 2015, 2014, 2013 and 43% for the period ended December 31, 2012. |
| | | | | | |
The notes to the financial statements are an integral part of,
and should be read in conjunction with, the financial statements. | | | | | 25 | |
Notes to Financial Statements (Unaudited)
Note 1–Organization and Business
MainStay VP Funds Trust (the “Fund”) was organized as a Delaware statutory trust on February 1, 2011. The Fund is registered under the Investment Company Act of 1940, as amended (the “1940 Act”), as an open-end management investment company. The Fund is comprised of thirty-two separate series (collectively referred to as the “Portfolios”). These financial statements and notes relate to the MainStay VP PIMCO Real Return Portfolio (the “Portfolio”), a “diversified” portfolio, as that term is defined in the 1940 Act, as interpreted or modified by regulatory authorities having jurisdiction, from time to time.
Shares of the Portfolio are currently offered to certain separate accounts to fund variable annuity policies and variable universal life insurance policies issued by New York Life Insurance and Annuity Corporation (“NYLIAC”), a wholly-owned subsidiary of New York Life Insurance Company (“New York Life”). NYLIAC allocates shares of the Portfolios to, among others, NYLIAC Variable Annuity Separate Accounts-I, II, III and IV, VUL Separate Account-I and CSVUL Separate Account-I (collectively, the “Separate Accounts”). Shares of the Portfolio are also offered to the MainStay VP Conservative Allocation Portfolio, MainStay VP Moderate Allocation Portfolio, MainStay VP Moderate Growth Allocation Portfolio and MainStay VP Growth Allocation Portfolio, which operate as “funds-of-funds.”
The Portfolio currently offers two classes of shares. Initial Class and Service Class shares commenced operations on February 17, 2012. Shares of the Portfolio are sold and are redeemed at a price equal to their respective net asset value (“NAV”) per share. No sales or redemption charge is applicable to the purchase or redemption of the Portfolio’s shares. Under the terms of the Fund’s multiple class plan adopted pursuant to Rule 18f-3 under the 1940 Act, the classes differ in that, among other things, Service Class shares of the Portfolio pay a combined distribution and service fee of 0.25% of average daily net assets attributable to Service Class shares of the Portfolio to the Distributor (as defined in Note 3(B)) pursuant to a plan adopted in accordance with Rule 12b-1 under the 1940 Act. Contract owners of variable annuity contracts purchased after June 2, 2003, are permitted to invest only in the Service Class shares.
The Portfolio’s investment objective is to seek maximum real return, consistent with preservation of real capital and prudent investment management.
Note 2–Significant Accounting Policies
The Portfolio is an investment company and accordingly follows the investment company accounting and reporting guidance of the Financial Accounting Standards Board (“FASB”) Accounting Standard Codification Topic 946 Financial Services—Investment Companies. The Portfolio prepares its financial statements in accordance with generally accepted accounting principles (“GAAP”) in the United States of America and follows the significant accounting policies described below.
(A) Securities Valuation. Investments are usually valued as of the close of regular trading on the New York Stock Exchange (the “Exchange”) (usually 4:00 p.m. Eastern time) on each day the Portfolio is open for business (“valuation date”).
The Board of Trustees (the “Board”) of the Fund adopted procedures establishing methodologies for the valuation of the Portfolio’s securities and other assets and delegated the responsibility for valuation
determinations under those procedures to the Valuation Committee of the Fund (the “Valuation Committee”). The Board authorized the Valuation Committee to appoint a Valuation Sub-Committee (the “Sub-Committee”) to deal in the first instance with establishing the prices of securities for which market quotations are not readily available or the prices of which are not otherwise readily determinable under these procedures. The Sub-Committee meets (in person, via electronic mail or via teleconference) on an as-needed basis. Subsequently, the Valuation Committee meets to ensure that actions taken by the Sub-Committee were appropriate. The procedures recognize that, subject to the oversight of the Board and unless otherwise noted, the responsibility for the day-to-day valuation of portfolio assets (including fair value measurements for the Portfolio’s assets and liabilities) rests with New York Life Investment Management LLC (“New York Life Investments” or the “Manager”), aided to whatever extent necessary by the Subadvisor (as defined in Note 3(A)) to the Portfolio.
To assess the appropriateness of security valuations, the Manager, the Subadvisor or the Portfolio’s third party service provider, who is subject to oversight by the Manager, regularly compares prior day prices, prices on comparable securities and the sale prices to the prior and current day prices and challenges prices with changes exceeding certain tolerance levels with third party pricing services or broker sources. For those securities valued through either a standardized fair valuation methodology or a fair valuation measurement, the Sub-Committee deals in the first instance with such valuation and the Valuation Committee reviews and affirms, if appropriate, the reasonableness of the valuation based on such methodologies and measurements on a regular basis after considering all relevant information that is reasonably available. Any action taken by the Sub-Committee with respect to the valuation of a portfolio security or other asset is submitted by the Valuation Committee to the Board for its review and ratification, if appropriate, at its next regularly scheduled meeting.
“Fair value” is defined as the price the Portfolio would reasonably expect to receive upon selling an asset or liability in an orderly transaction to an independent buyer in the principal or most advantageous market for the asset or liability. Fair value measurements are determined within a framework that establishes a three-tier hierarchy which maximizes the use of observable market data and minimizes the use of unobservable inputs to establish a classification of fair value measurements for disclosure purposes. “Inputs” refer broadly to the assumptions that market participants would use in pricing the asset or liability, including assumptions about risk, such as the risk inherent in a particular valuation technique used to measure fair value using a pricing model and/or the risk inherent in the inputs for the valuation technique. Inputs may be observable or unobservable. Observable inputs reflect the assumptions market participants would use in pricing the asset or liability based on market data obtained from sources independent of the Portfolio. Unobservable inputs reflect the Portfolio’s own assumptions about the assumptions market participants would use in pricing the asset or liability based on the information available. The inputs or methodology used for valuing assets or liabilities may not be an indication of the risks associated with investing in those assets or liabilities. The three-tier hierarchy of inputs is summarized below.
| • | | Level 1—quoted prices in active markets for an identical asset or liability |
| | |
| 26 | | MainStay VP PIMCO Real Return Portfolio |
| • | | Level 2—other significant observable inputs (including quoted prices for a similar asset or liability in active markets, interest rates and yield curves, prepayment speeds, credit risk, etc.) |
| • | | Level 3—significant unobservable inputs (including the Portfolio’s own assumptions about the assumptions that market participants would use in measuring fair value of an asset or liability) |
The level of an asset or liability within the fair value hierarchy is based on the lowest level of an input, both individually and in the aggregate, that is significant to the fair value measurement. As of June 30, 2017, the aggregate value by input level of the Portfolio’s assets and liabilities is included at the end of the Portfolio’s Portfolio of Investments.
The Portfolio may use third party vendor evaluations, whose prices may be derived from one or more of the following standard inputs, among others:
| | |
• Benchmark yields | | • Reported trades |
• Broker/dealer quotes | | • Issuer spreads |
• Two-sided markets | | • Benchmark securities |
• Bids/offers | | • Reference data (corporate actions or material event notices) |
• Industry and economic events | | • Comparable bonds |
• Monthly payment information | | |
An asset or liability for which market values cannot be measured using the methodologies described above is valued by methods deemed reasonable in good faith by the Valuation Committee, following the procedures established by the Board, to represent fair value. Under these procedures, the Portfolio generally uses a market-based approach which may use related or comparable assets or liabilities, recent transactions, market multiples, book values, and other relevant information. The Portfolio may also use an income-based valuation approach in which the anticipated future cash flows of the asset or liability are discounted to calculate fair value. Discounts may also be applied due to the nature and/or duration of any restrictions on the disposition of the asset or liability. Fair value represents a good faith approximation of the value of a security. Fair value determinations involve the consideration of a number of subjective factors, an analysis of applicable facts and circumstances and the exercise of judgment. As a result, it is possible that the fair value for a security determined in good faith in accordance with the Portfolio’s valuation procedures may differ from valuations for the same security determined by other funds using their own valuation procedures. Although the Portfolio’s valuation procedures are designed to value a security at the price the Portfolio may reasonably expect to receive upon the security’s sale in an orderly transaction, there can be no assurance that any fair value determination thereunder would, in fact, approximate the amount that the Portfolio would actually realize upon the sale of the security or the price at which the security would trade if a reliable market price were readily available. During the six-month period ended June 30, 2017, there were no material changes to the fair value methodologies.
Securities which may be valued in this manner include, but are not limited to: (i) a security for which trading has been halted or suspended; (ii) a debt security that has recently gone into default and for which there is not a current market quotation; (iii) a security of an issuer that has entered into a restructuring; (iv) a security that has been de-listed
from a national exchange; (v) a security for which the market price is not readily available from a third party pricing source or, if so provided, does not, in the opinion of the Manager or Subadvisor, reflect the security’s market value; (vi) a security subject to trading collars for which no or limited trading takes place; and (vii) a security whose principal market has been temporarily closed at a time when, under normal conditions, it would be open. Securities for which market quotations or observable inputs are not readily available are generally categorized as Level 3 in the hierarchy. As of June 30, 2017, there were no securities held by the Portfolio that were fair valued in such a manner.
Certain securities held by the Portfolio may principally trade in foreign markets. Events may occur between the time the foreign markets close and the time at which the Portfolio’s NAVs are calculated. These events may include, but are not limited to, situations relating to a single issuer in a market sector, significant fluctuations in U.S. or foreign markets, natural disasters, armed conflicts, governmental actions or other developments not tied directly to the securities markets. Should the Manager or Subadvisor conclude that such events may have affected the accuracy of the last price of such securities reported on the local foreign market, the Sub-Committee may, pursuant to procedures adopted by the Board, adjust the value of the local price to reflect the estimated impact on the price of such securities as a result of such events. In this instance, securities are generally categorized as Level 3 in the hierarchy. Additionally, certain foreign equity securities are also fair valued whenever the movement of a particular index exceeds certain thresholds. In such cases, the securities are fair valued by applying factors provided by a third party vendor in accordance with valuation procedures adopted by the Board and are generally categorized as Level 2 in the hierarchy. As of June 30, 2017, no foreign equity securities were held by the Portfolio.
Equity securities are valued at the last quoted sales prices as of the close of regular trading on the relevant exchange on each valuation date. Securities that are not traded on the valuation date are valued at the mean of the last quoted bid and ask prices. Prices are normally taken from the principal market in which each security trades. Futures contracts are valued at the last posted settlement price on the market where such futures are primarily traded. These securities are generally categorized as Level 1 in the hierarchy.
Options contracts are valued at the last posted settlement price on the market where such options are primarily traded.
Debt securities are valued at the evaluated bid prices (evaluated mean prices in the case of convertible and municipal bonds) supplied by a pricing agent or brokers selected by the Manager, in consultation with the Subadvisor. Those values reflect broker/dealer supplied prices and electronic data processing techniques, if the evaluated bid or mean prices are deemed by the Manager, in consultation with the Subadvisor, to be representative of market values at the regular close of trading of the Exchange on each valuation date. Debt securities purchased on a delayed delivery basis are marked to market daily until settlement at the forward settlement date. Debt securities, including corporate bonds, U.S. government & federal agency bonds, municipal bonds, foreign bonds, convertible bonds, asset-backed securities and mortgage-backed securities are generally categorized as Level 2 in the hierarchy.
Foreign currency forward contracts are valued at their fair market values measured on the basis of the mean between the last current bid and
Notes to Financial Statements (Unaudited) (continued)
ask prices based on dealer or exchange quotations and are generally categorized as Level 2 in the hierarchy.
Swaps are marked to market daily based upon quotations from pricing agents, brokers, or market makers. These securities are generally categorized as Level 2 in the hierarchy.
Temporary cash investments acquired in excess of 60 days to maturity at the time of purchase are valued using the latest bid prices or using valuations based on a matrix system (which considers such factors as security prices, yields, maturities, and ratings), both as furnished by independent pricing services. Other temporary cash investments which mature in 60 days or less at the time of purchase (“Short-Term Investments”) are valued using the amortized cost method of valuation, unless the use of such method would be inappropriate. The amortized cost method involves valuing a security at its cost on the date of purchase and thereafter assuming a constant amortization to maturity of the difference between such cost and the value on maturity date. Amortized cost approximates the current fair value of a security. Securities valued using the amortized cost method are not valued using quoted prices in an active market and are generally categorized as Level 2 in the hierarchy.
The information above is not intended to reflect an exhaustive list of the methodologies that may be used to value portfolio investments. The valuation procedures permit the use of a variety of valuation methodologies in connection with valuing portfolio investments. The methodology used for a specific type of investment may vary based on the market data available or other considerations. The methodologies summarized above may not represent the specific means by which portfolio investments are valued on any particular business day.
A portfolio security or other asset may be determined to be illiquid under procedures approved by the Board. Illiquidity of a security might prevent the sale of such security at a time when the Manager or Subadvisor might wish to sell, and these securities could have the effect of decreasing the overall level of the Portfolio’s liquidity. Further, the lack of an established secondary market may make it more difficult to value illiquid securities, requiring the Portfolio to rely on judgments that may be somewhat subjective in measuring value, which could vary materially from the amount that the Portfolio could realize upon disposition. Difficulty in selling illiquid securities may result in a loss or may be costly to the Portfolio. Under the supervision of the Board, the Manager or Subadvisor determines the liquidity of the Portfolio’s investments; in doing so, the Manager or Subadvisor may consider various factors, including (i) the frequency of trades and quotations, (ii) the number of dealers and prospective purchasers, (iii) dealer undertakings to make a market, and (iv) the nature of the security and the market in which it trades (e.g., the time needed to dispose of the security, the method of soliciting offers and the mechanics of transfer). Illiquid securities are often valued in accordance with methods deemed by the Board in good faith to be reasonable and appropriate to accurately reflect their fair value. The liquidity of the Portfolio’s investments, as shown in the Portfolio of Investments and was determined as of June 30, 2017 and can change at any time in response to, among other relevant factors, market conditions or events or developments with respect to an individual issuer or instrument. As of June 30, 2017, securities deemed to be illiquid under procedures approved by the Board are shown in the Portfolio of Investments.
(B) Income Taxes. The Portfolio’s policy is to comply with the requirements of the Internal Revenue Code of 1986, as amended (the “Internal Revenue Code”), applicable to regulated investment companies and to distribute all of its taxable income to the shareholders of the Portfolio within the allowable time limits. Therefore, no federal, state and local income tax provisions are required.
Management evaluates the Portfolio’s tax positions to determine if the tax positions taken meet the minimum recognition threshold in connection with accounting for uncertainties in income tax positions taken or expected to be taken for the purposes of measuring and recognizing tax liabilities in the financial statements. Recognition of tax benefits of an uncertain tax position is permitted only to the extent the position is “more likely than not” to be sustained assuming examination by taxing authorities. Management has analyzed the Portfolio’s tax positions taken on federal, state and local income tax returns for all open tax years (for up to three tax years), and has concluded that no provisions for federal, state and local income tax are required in the Portfolio’s financial statements. The Portfolio’s federal, state and local income and federal excise tax returns for tax years for which the applicable statutes of limitations have not expired are subject to examination by the Internal Revenue Service and state and local departments of revenue.
(C) Foreign Taxes. The Portfolio may be subject to foreign taxes on income and other transaction-based taxes imposed by certain countries in which it invests. A portion of the taxes on gains on investments or currency purchases/repatriation may be reclaimable. The Portfolio will accrue such taxes and reclaims as applicable, based upon its current interpretation of tax rules and regulations that exist in the markets in which it invests.
The Portfolio may be subject to taxation on realized capital gains, repatriation proceeds and other transaction-based taxes imposed by certain countries in which it invests. The Portfolio will accrue such taxes as applicable based upon its current interpretation of tax rules and regulations that exist in the market in which it invests. Capital gains taxes relating to positions still held are reflected as a liability on the Statement of Assets and Liabilities, as well as an adjustment to the Portfolio’s net unrealized appreciation (depreciation). Taxes related to capital gains realized, if any, are reflected as part of net realized gain (loss) in the Statement of Operations. Changes in tax liabilities related to capital gains taxes on unrealized investment gains, if any, are reflected as part of the change in net unrealized appreciation (depreciation) on investments in the Statement of Operations. Transaction-based charges are generally assessed as a percentage of the transaction amount.
(D) Dividends and Distributions to Shareholders. Dividends and distributions are recorded on the ex-dividend date. The Portfolios intend to declare and pay dividends from net investment income and distributions from net realized capital and currency gains, if any, at least annually. All dividends and distributions are reinvested in the same class of shares of the respective Portfolio, at NAV. Dividends and distributions to shareholders are determined in accordance with federal income tax regulations and may differ from GAAP.
(E) Security Transactions and Investment Income. The Portfolio records security transactions on the trade date. Realized gains and losses on security transactions are determined using the identified cost method. Dividend income is recognized on the ex-dividend date,
| | |
| 28 | | MainStay VP PIMCO Real Return Portfolio |
net of any foreign tax withheld at the source, and interest income is accrued as earned using the effective interest rate method and includes any realized gains and losses from repayments of principal on mortgage-backed securities. Discounts and premiums on securities purchased, other than Short-Term Investments, for the Portfolio are accreted and amortized, respectively, on the effective interest rate method over the life of the respective securities. Discounts and premiums on Short-Term Investments are accreted and amortized, respectively, on the straight-line method. The straight-line method approximates the effective interest method for Short-Term Investments.
Investment income and realized and unrealized gains and losses on investments of the Portfolio are allocated pro rata to the separate classes of shares based upon their relative net assets on the date the income is earned or realized and unrealized gains and losses are incurred.
The Portfolio may place a debt security on non-accrual status and reduce related interest income by ceasing current accruals and writing off all or a portion of any interest receivables when the collection of all or a portion of such interest has become doubtful. A debt security is removed from non-accrual status when the issuer resumes interest payments or when collectability of interest is reasonably assured.
(F) Expenses. Expenses of the Fund are allocated to the individual Portfolios in proportion to the net assets of the respective Portfolios when the expenses are incurred, except where direct allocations of expenses can be made. Expenses (other than fees incurred under the distribution and service plans, further discussed in Note 3(B), which are charged directly to the Service Class shares) are allocated to separate classes of shares pro rata based upon their relative net assets on the date the expenses are incurred. The expenses borne by the Portfolio, including those of related parties to the Portfolio, are shown in the Statement of Operations.
(G) Use of Estimates. In preparing financial statements in conformity with GAAP, management makes estimates and assumptions that affect the reported amounts and disclosures in the financial statements. Actual results could differ from those estimates.
(H) Repurchase Agreements. The Portfolio may enter into repurchase agreements (i.e., buy a security from another party with the agreement that it be sold back in the future) to earn income. The Portfolio may enter into repurchase agreements only with counterparties, usually financial institutions that are deemed by the Manager or Subadvisor to be creditworthy, pursuant to guidelines established by the Board. During the term of any repurchase agreement, the Manager or Subadvisor will continue to monitor the creditworthiness of the counterparty. Under the 1940 Act, repurchase agreements are considered to be collateralized loans by the Portfolio to the counterparty secured by the securities transferred to the Portfolio.
Repurchase agreements are subject to counterparty risk, meaning the Portfolio could lose money by the counterparty’s failure to perform under the terms of the agreement. The Portfolio mitigates this risk by ensuring the repurchase agreement is collateralized by cash, U.S. government securities, fixed income securities and/or other securities. The collateral is held by the Portfolio’s custodian valued daily on a mark to market basis to determine if the value, including accrued interest, exceeds the repurchase price. In the event of the counterparty’s default
on the obligation to repurchase, the Portfolio has the right to liquidate the collateral and apply the proceeds in satisfaction of the obligation. Under certain circumstances, such as in the event of default or bankruptcy by the counterparty, realization and/or retention of the collateral may be limited or subject to delay, to legal proceedings and possible realized loss to the Portfolio.
(I) Futures Contracts. A futures contract is an agreement to purchase or sell a specified quantity of an underlying instrument at a specified future date and price, or to make or receive a cash payment based on the value of a financial instrument (e.g., foreign currency, interest rate, security, or securities index). The Portfolio is subject to risks such as market price risk and/or interest rate risk in the normal course of investing in these transactions. Upon entering into a futures contract, the Portfolio is required to pledge to the broker or futures commission merchant an amount of cash and/or U.S. Government securities equal to a certain percentage of the collateral amount, known as the “initial margin.” During the period the futures contract is open, changes in the value of the contract are recognized as unrealized appreciation or depreciation by marking to market such contract on a daily basis to reflect the market value of the contract at the end of each day’s trading. The Portfolio agrees to receive from or pay to the broker or futures commission merchant an amount of cash equal to the daily fluctuation in the value of the contract. Such receipts or payments are known as “variation margin.” When the futures contract is closed, the Portfolio records a realized gain or loss equal to the difference between the proceeds from (or cost of) the closing transaction and the Portfolio’s basis in the contract.
The use of futures contracts involves, to varying degrees, elements of market risk in excess of the amount recognized in the Statement of Assets and Liabilities. The contract or notional amounts and variation margin reflect the extent of the Portfolio’s involvement in open futures positions. There are several risks associated with the use of futures contracts as hedging techniques. There can be no assurance that a liquid market will exist at the time when the Portfolio seeks to close out a futures contract. If no liquid market exists, the Portfolio would remain obligated to meet margin requirements until the position is closed. Futures may involve a small initial investment relative to the risk assumed, which could result in losses greater than if they had not been used. Futures may be more volatile than direct investments in the instrument underlying the futures, and may not correlate to the underlying instrument, causing a given hedge not to achieve its objectives. The Portfolio’s activities in futures contracts have minimal counterparty risk as they are conducted through regulated exchanges that guarantee the futures against default by the counterparty. In the event of a bankruptcy or insolvency of a futures commission merchant that holds margin on behalf of the Portfolio, the Portfolio may not be entitled to the return of the entire margin owed to the Portfolio, potentially resulting in a loss. The Portfolio’s investment in futures contracts and other derivatives may increase the volatility of the Portfolio’s NAV and may result in a loss to the Portfolio. As of June 30, 2017, all open futures contracts are shown in the Portfolio of Investments.
(J) Foreign Currency Forward Contracts. The Portfolio may enter into foreign currency forward contracts, which are agreements to buy or sell foreign currencies on a specified future date at a specified rate. The Portfolio is subject to foreign currency exchange rate risk in
Notes to Financial Statements (Unaudited) (continued)
the normal course of investing in these transactions. During the period the forward contract is open, changes in the value of the contract are recognized as unrealized appreciation or depreciation by marking to market such contract on a daily basis to reflect the market value of the contract at the end of each day’s trading. Cash movement occurs on settlement date. When the forward contract is closed, the Portfolio records a realized gain or loss equal to the difference between the proceeds from (or cost of) the closing transaction and the Portfolio’s basis in the contract. The Portfolio may purchase and sell foreign currency forward contracts for purposes of seeking to enhance portfolio returns and manage portfolio risk more efficiently. Foreign currency forward contracts may also be used to gain exposure to a particular currency or to hedge against the risk of loss due to changing currency exchange rates. Foreign currency forward contracts to purchase or sell a foreign currency may also be used in anticipation of future purchases or sales of securities denominated in foreign currency, even if the specific investments have not yet been selected.
The use of foreign currency forward contracts involves, to varying degrees, elements of risk in excess of the amount recognized in the Statement of Assets and Liabilities, including counterparty risk, market risk, and illiquidity risk. Counterparty risk is heightened for these instruments because foreign currency forward contracts are not exchange-traded and therefore no clearinghouse or exchange stands ready to meet the obligations under such contracts. Thus, the Portfolio faces the risk that its counterparties under such contracts may not perform their obligations. Market risk is the risk that the value of a foreign currency forward contract will depreciate due to unfavorable changes in exchange rates. Illiquidity risk arises because the secondary market for foreign currency forward contracts may have less liquidity relative to markets for other securities and financial instruments. Risks also arise from the possible movements in the foreign exchange rates underlying these instruments. While the Portfolio may enter into forward contracts to reduce currency exchange risks, changes in currency exchange rates may result in poorer overall performance for the Portfolio than if it had not engaged in such transactions. Exchange rate movements can be large, depending on the currency, and can last for extended periods of time, affecting the value of the Portfolio’s assets. Moreover, there may be an imperfect correlation between the Portfolio’s holdings of securities denominated in a particular currency and forward contracts entered into by the Portfolio. Such imperfect correlation may prevent the Portfolio from achieving the intended hedge or expose the Portfolio to the risk of currency exchange loss. The unrealized appreciation (depreciation) on forward contracts also reflects the Portfolio’s exposure at the valuation date to credit loss in the event of a counterparty’s failure to perform its obligations.
(K) Foreign Currency Transactions. The Portfolio’s books and records are maintained in U.S. dollars. Prices of securities denominated in foreign currency amounts are translated into U.S. dollars at the mean between the buying and selling rates last quoted by any major U.S. bank at the following dates:
| (i) | market value of investment securities, other assets and liabilities—at the valuation date; and |
| (ii) | purchases and sales of investment securities, income and expenses—at the date of such transactions. |
The assets and liabilities that are denominated in foreign currency amounts are presented at the exchange rates and market values at the close of the period. The realized and unrealized changes in net assets arising from fluctuations in exchange rates and market prices of securities are not separately presented.
Net realized gain (loss) on foreign currency transactions represents net gains and losses on foreign currency forward contracts, net currency gains or losses realized as a result of differences between the amounts of securities sale proceeds or purchase cost, dividends, interest and withholding taxes as recorded on the Portfolio’s books, and the U.S. dollar equivalent amount actually received or paid. Net currency gains or losses from valuing such foreign currency denominated assets and liabilities, other than investments at valuation date exchange rates, are reflected in unrealized foreign exchange gains or losses.
(L) Swap Contracts. The Portfolio may enter into credit default, interest rate, equity, index and currency exchange rate contracts (“swaps”). In a typical swap transaction, two parties agree to exchange the future returns (or differentials in rates of future returns) earned or realized at periodic intervals on a particular investment or instrument based on a notional principal amount. Generally, the Portfolio will enter into a swap on a net basis, which means that the two payment streams under the swap are netted, with the Portfolio receiving or paying (as the case may be) only the net amount of the two payment streams. Therefore, the Portfolio’s current obligation under a swap generally will be equal to the net amount to be paid or received under the swap, based on the relative value of notional positions attributable to each counterparty to the swap. The payments may be adjusted for transaction costs, interest payments, the amount of interest paid on the investment or instrument or other factors. Collateral, in the form of cash or securities, may be required to be held in segregated accounts with the custodian bank or broker in accordance with the terms of the swap. Swap agreements are privately negotiated in the over the counter market (“OTC swaps”) and may be executed in a multilateral or other trade facilities platform, such as a registered commodities exchange (“centrally cleared swaps”).
Certain standardized swaps, including certain credit default and interest rate swaps, are subject to mandatory clearing and exchange-trading, and more types of standardized swaps are expected to be subject to mandatory clearing and exchange-trading in the future. The counterparty risk for exchange-traded and cleared derivatives is expected to be generally lower than for uncleared derivatives, but cleared contracts are not risk-free. In a cleared derivative transaction, the Portfolio typically enters into the transaction with a financial institution counterparty, and performance of the transaction is effectively guaranteed by a central clearinghouse, thereby reducing or eliminating the Portfolio’s exposure to the credit risk of its original counterparty. The Portfolio will be required to post specified levels of margin with the clearinghouse or at the instruction of the clearinghouse; the margin required by a clearinghouse may be greater than the margin the Portfolio would be required to post in an uncleared transaction. As of June 30, 2017, all swap positions outstanding are shown in the Portfolio of Investments.
Swaps are marked to market daily based upon quotations from pricing agents, brokers, or market makers and the change in value, if any, is recorded as unrealized appreciation or depreciation. Any payments made or received upon entering into a swap would be amortized or
| | |
| 30 | | MainStay VP PIMCO Real Return Portfolio |
accreted over the life of the swap and recorded as a realized gain or loss. Early termination of a swap is recorded as a realized gain or loss. Daily changes in valuation of centrally cleared swaps, if any, are recorded as a receivable or payable for the change in value as appropriate (“variation margin”) on the Statement of Assets and Liabilities.
The Portfolio bears the risk of loss of the amount expected to be received under a swap in the event of the default or bankruptcy of the swap counterparty. The Portfolio may be able to eliminate its exposure under a swap either by assignment or other disposition, or by entering into an offsetting swap with the same party or a similar creditworthy party. Swaps are not actively traded on financial markets. Entering into swaps involves elements of credit, market, and documentation risk in excess of the amounts recognized on the Statement of Assets and Liabilities. Such risks involve the possibilities that there will be no liquid market for these swaps, that the counterparty to the swaps may default on its obligation to perform or disagree as to the meaning of the contractual terms in the swaps and that there may be unfavorable changes in interest rates, the price of the index or the security underlying these transactions.
Interest Rate Swaps: An interest rate swap is an agreement between two parties where one stream of future interest payments is exchanged for another based on a specified principal amount. Interest rate swaps often exchange a fixed payment for a floating payment that is linked to an interest rate (most often the London InterBank Offer Rate). The Portfolio will typically use interest rate swaps to limit, or manage, its exposure to fluctuations in interest rates, or to obtain a marginally lower interest rate than it would have been able to get without the swap.
Credit Default Swaps: The Portfolio may enter into credit default swaps to simulate long and short bond positions or to take an active long or short position with respect to the likelihood of a default or credit event by the issuer of the underlying reference obligation. The types of reference obligations underlying the swaps that may be entered into by the Portfolio include debt obligations of a single issuer of corporate or sovereign debt, a basket of obligations of different issuers or a credit index. A credit index is an equally-weighted credit default swap index that is designed to track a representative segment of the credit default swap market (e.g., investment grade, high volatility, below investment grade or emerging markets) and provides an investor with exposure to specific “baskets” of issuers of certain debt instruments. Index credit default swaps have standardized terms including a fixed spread and standard maturity dates. The composition of the obligations within a particular index changes periodically. Credit default swaps involve one party, the protection buyer, making a stream of payments to another party, the protection seller, in exchange for the right to receive a contingent payment if there is a credit event related to the underlying reference obligation. In the event that the reference obligation matures prior to the termination date of the contract, a similar security will be substituted for the duration of the contract term. Credit events are defined under individual swap agreements and generally include bankruptcy, failure to pay, restructuring, repudiation/moratorium, obligation acceleration and obligation default. Selling protection effectively adds leverage to a portfolio up to the notional amount of the swap agreement. Potential liabilities under these contracts may be reduced by: the auction rates of the underlying reference obligations; upfront payments
received at the inception of a swap; and net amounts received from credit default swaps purchased with the identical reference obligation.
(M) Options Contracts. The Portfolio may write call and put options on securities and financial derivative instruments it owns or in which it may invest. Writing put options tends to increase the Portfolio’s exposure to the underlying instrument. Writing call options tends to decrease the Portfolio’s exposure to the underlying instrument. When the Portfolio writes a call or put, an amount equal to the premium received is recorded as a liability and subsequently marked to market to reflect the current value of the option written. These liabilities are reflected as written options outstanding on the Statement of Assets and Liabilities. Premiums received from writing options which expire are treated as realized gains. Premiums received from writing options which are exercised or closed are added to the proceeds or offset against amounts paid on the underlying futures, swaps, security or currency transaction to determine the realized gain or loss. Certain options may be written with premiums to be determined on a future date. The Portfolio, as a writer of an option, has no control over whether the underlying instrument may be sold (call) or purchased (put) and as a result bears the market risk of an unfavorable change in the price of the instrument underlying the written option. There is the risk the Portfolio may not be able to enter into a closing transaction because of an illiquid market. Writing call options involves risk of loss in excess of the related amounts reflected in the Statement of Assets and Liabilities.
The Portfolio may also purchase put and call options. Purchasing call options tends to increase the Portfolio’s exposure to the underlying instrument. Alternatively, purchasing put options tends to decrease the Portfolio’s exposure to the underlying instrument. The Portfolio pays a premium which is included on the Portfolio’s Statement of Assets and Liabilities as an investment and subsequently marked to market to reflect the current value of the option. Premiums paid for purchasing options which expire are treated as realized losses. Certain options may be purchased with premiums to be determined on a future date. The premiums for these options are based upon implied volatility parameters at specified terms. The risk associated with purchasing put and call options is limited to the premium paid. Premiums paid for purchasing options which are exercised or closed are added to the amounts paid or offset against the proceeds on the underlying investment transaction to determine the realized gain or loss when the underlying transaction is sold.
The Portfolio may purchase or write foreign currency options. Purchasing a foreign currency option gives the Portfolio the right, but not the obligation, to buy or sell a specified amount of the currency at a specified rate of exchange that may be exercised on or before the option’s expiration date. Writing a foreign currency option obligates the Portfolio to buy or sell a specified amount of foreign currency at a specified rate of exchange, and such option may be exercised on or before the option’s expiration date in exchange for an option premium. These options may be used as a short or long hedge against possible variations in foreign exchange rates or to gain exposure to foreign currencies. The risks associated with writing a foreign currency put option include the risk that the Portfolio may incur a loss if the value of the referenced foreign currency decreases and the option is exercised. The risks associated with writing a foreign currency call option include the risk that if the value of the referenced foreign currency increases, and if
Notes to Financial Statements (Unaudited) (continued)
the option is exercised, the Portfolio must either acquire the referenced foreign currency at the then higher price for delivery or, if the Portfolio already owns the referenced foreign currency, forego the opportunity for profit with respect to such foreign currency.
The Portfolio may purchase or write inflation-capped options to enhance returns or for hedging opportunities. An inflation-capped option pays out if inflation exceeds a certain level over a specified period of time. The purpose of purchasing inflation-capped options is to protect the Portfolio from inflation erosion above a certain rate on a given notional exposure. When the Portfolio writes an inflation-capped option, an amount equal to the premium received is recorded as a liability and subsequently marked to market to reflect the current value of the option written.
During the year ended June 30, 2017, the Portfolio had the following transactions in written Inflation-Capped Options, Foreign Currency Options and Options on Futures Contracts:
| | | | | | | | |
| | | Notional
Amount | | | Premium | |
Options outstanding at December 31, 2016 | | $ | 13,841,000 | | | $ | 45,981 | |
Options written | | | 4,857,500 | | | | 345,808 | |
Options bought back | | | (13,407,000 | ) | | | (136,951 | ) |
Options exercised | | | (157,000 | ) | | | (95,867 | ) |
Options expired | | | (2,345,500 | ) | | | (51,535 | ) |
Options outstanding at June 30, 2017 | | $ | 2,789,000 | | | $ | 107,436 | |
(N) Loan Assignments, Participations and Commitments. The Portfolio may invest in loan assignments and participations (“loans”). Commitments are agreements to make money available to a borrower in a specified amount, at a specified rate and within a specified time. The Portfolio records an investment when the borrower withdraws money on a commitment or when a funded loan is purchased (trade date) and records interest as earned. These loans pay interest at rates that are periodically reset by reference to a base lending rate plus a spread. These base lending rates are generally the prime rate offered by a designated U.S. bank or the London InterBank Offered Rate.
The loans in which the Portfolio may invest are generally readily marketable, but may be subject to some restrictions on resale. For example, the Portfolio may be contractually obligated to receive approval from the agent bank and/or borrower prior to the sale of these investments. If the Portfolio purchases an assignment from a lender, the Portfolio will generally have direct contractual rights against the borrower in favor of the lender. If the Portfolio purchases a participation interest either from a lender or a participant, the Portfolio typically will have established a direct contractual relationship with the seller of the participation interest, but not with the borrower. Consequently, the Portfolio is subject to the credit risk of the lender or participant who sold the participation interest to the Portfolio, in addition to the usual credit risk of the borrower. In the event that the borrower, selling participant or intermediate participants become insolvent or enters into bankruptcy, the Portfolio may incur certain costs and delays in realizing payment, or may suffer a loss of principal and/or interest.
Unfunded commitments represent the remaining obligation of the Portfolio to the borrower. At any point in time, up to the maturity date of the issue, the borrower may demand the unfunded portion. Unfunded
amounts, if any, are marked to market and any unrealized gains or losses are recorded in the Statement of Assets and Liabilities. As of June 30, 2017, the Portfolio did not hold any unfunded commitments.
(O) Dollar Rolls. The Portfolio may enter into dollar roll transactions in which it sells mortgage-backed securities (“MBS”) from its portfolio to a counterparty from whom the Portfolio simultaneously agrees to buy a similar security on a delayed delivery basis. The Portfolio generally transfers MBS where the MBS are “to be announced,” therefore, the Portfolio accounts for these transactions as purchases and sales.
When accounted for as purchase and sales, the securities sold in connection with the dollar rolls are removed from a portfolio and a realized gain or loss is recognized. The securities the Portfolio has agreed to acquire are included at market value in the Portfolio of Investments and liabilities for such purchase commitments are included as payables for investments purchased. During the roll period, the Portfolio foregoes principal and interest paid on the securities. The Portfolio is compensated by the difference between the current sales price and the forward price for the future as well as by the earnings on the cash proceeds of the initial sale. Dollar rolls may be renewed without physical delivery of the securities subject to the contract. The Portfolio maintains liquid assets from its portfolio having a value not less than the repurchase price, including accrued interest. Dollar roll transactions involve certain risks, including the risk that the securities returned to the Portfolio at the end of the roll period, while substantially similar, could be inferior to what was initially sold to the counterparty.
The Portfolio accounts for a dollar roll transaction as a purchase and sale whereby the difference in the sales price and purchase price of the security sold is recorded as a realized gain (loss).
(P) Reverse Repurchase Agreements. The Portfolio may enter into reverse repurchase agreements with banks or broker/dealers, which involve the sale of a security by a Portfolio and its agreement to repurchase the instrument at a specified time and price. Under a reverse repurchase agreement, the Portfolio continues to receive any principal and interest payments on the underlying security during the term of the agreement. These agreements involve the sale of debt securities, or obligations, held by a Portfolio, with an agreement to repurchase the obligations at an agreed upon price, date and interest payment. The proceeds will be used to purchase other debt securities either maturing, or under an agreement to resell, at a date simultaneous with or prior to the expiration of the reverse repurchase agreement. Reverse repurchase agreements will be utilized, when permitted by law, only when the interest income to be earned from the investment of the proceeds from the transaction is greater than the interest expense of the reverse repurchase transaction.
The Portfolio will limit its investments in reverse repurchase agreements and other borrowing to no more than 33 1/3%, or as otherwise limited herein, of its total assets. While a reverse repurchase agreement is outstanding, the Portfolios will maintain liquid assets in an amount at least equal in value to the Portfolio’s commitments to cover their obligations under the agreement. The use of reverse repurchase agreements by the Portfolio creates leverage that increases the Portfolio’s investment risk. If the income and gains on securities purchased with the proceeds of reverse repurchase agreements exceed the cost of the agreements, the Portfolio’s earnings or NAV will increase faster than
| | |
| 32 | | MainStay VP PIMCO Real Return Portfolio |
otherwise would be the case; conversely, if the income and gains fail to exceed the costs, earnings or NAV would decline faster than otherwise would be the case. If the buyer of the obligation subject to the reverse repurchase agreement becomes bankrupt, realization upon the underlying securities may be delayed and there is a risk of loss due to any decline in their value. During the six-month period ended June 30, 2017, the Portfolio’s average amount of borrowing was $111,777,491 at a weighted average interest rate of 0.88%.
(Q) Sale-Buybacks. The Portfolio may enter into financing transactions referred to as ‘sale-buybacks’. A sale-buyback transaction consists of a sale of a security by the Portfolio to a financial institution, the counterparty, with a simultaneous agreement to repurchase the same or substantially the same security at an agreed-upon price and date. The Portfolio is not entitled to receive principal and interest payments, if any, made on the security sold to the counterparty during the term of the agreement. The agreed-upon proceeds for securities to be repurchased by the Portfolio are reflected as a liability on the Statement of Assets and Liabilities. The Portfolio will recognize net income represented by the price differential between the price received for the transferred security and the agreed-upon repurchase price. This is commonly referred to as the “price drop”. A price drop consists of (i) the foregone interest and inflationary income adjustments, if any, the Portfolio would have otherwise received had the security not been sold and (ii) the negotiated financing terms between the Portfolio and counterparty. Foregone interest and inflationary income adjustments, if any, are recorded as components of interest income on the Statement of Operations. Interest payments based upon negotiated financing terms made by the Portfolio to counterparties are recorded as a component of interest expense on the Statement of Operations. In periods of increased demand for the security, the Portfolio may receive a fee for use of the security by the counterparty, which may result in interest income to the Portfolio. The Portfolio will segregate cash or liquidity assets, enter into off-setting transactions or use other measures permitted by applicable laws to “cover” the Portfolio’s current obligations.
(R) Securities Sold Short. The Portfolio may engage in sales of securities it does not own (“short sales”) as part of its investment strategies. When the Portfolio enters into a short sale, it must segregate or maintain with a broker the cash proceeds from the security sold short or other securities as collateral for its obligation to deliver the security upon conclusion of the sale. During the period a short position is open, depending on the nature and type of security, a short position is reflected as a liability and is marked to market in accordance with the valuation methodologies previously detailed (See Note 2(B)). Liabilities for securities sold short are closed out by purchasing the applicable securities for delivery to the counterparty broker. A gain, limited to the price at which the Portfolio sold the security short, or a loss, unlimited as to dollar amount, will be recognized upon termination of a short sale if the market price on the date the short position is closed out is less or greater, respectively, than the proceeds originally received. Any such gain or loss may be offset, completely or in part, by the change in the value of the hedged investments. Interest on short positions held is accrued daily, while dividends declared on short positions existing on the record date are recorded on the ex-dividend date as a dividend expense in the Statement of Operations. Broker fees and other expenses related to securities sold short are disclosed in the Statement
of Operations. Short sales involve risk of loss in excess of the related amounts reflected in the Statement of Assets and Liabilities.
(S) Delayed Delivery Transactions. The Portfolio may purchase or sell securities on a delayed delivery basis. These transactions involve a commitment by the Portfolio to purchase or sell securities for a predetermined price or yield, with payment and delivery taking place beyond the customary settlement period. When delayed delivery purchases are outstanding, the Portfolio will designate liquid assets in an amount sufficient to meet the purchase price. When purchasing a security on a delayed delivery basis, the Portfolio assumes the rights and risks of ownership of the security, including the risk of price and yield fluctuations, and takes such fluctuations into account when determining its NAV. The Portfolio may dispose of or renegotiate a delayed delivery transaction after it is entered into, and may sell delayed delivery securities before they are delivered, which may result in a realized gain or loss. When the Portfolio has sold a security it owns on a delayed delivery basis, the Portfolio does not participate in future gains and losses with respect to the security.
(T) Treasury Inflation-Protected Securities. The Portfolio invests in Treasury Inflation-Protected Securities (“TIPS”) which are specially structured bonds in which the principal amount is adjusted to keep pace with inflation. The inflation (deflation) adjustment is applied to the principal of each bond on a monthly basis and is accounted for as interest income on the Statements of Operations. TIPS are subject to interest rate risk.
(U) Securities Lending. In order to realize additional income, the Portfolio may engage in securities lending, subject to the limitations set forth in the 1940 Act and relevant guidance by the staff of the Securities and Exchange Commission (“SEC”). In the event the Portfolio does engage in securities lending, the Portfolio will lend through its custodian, State Street Bank and Trust Company (“State Street”). State Street will manage the Portfolio’s collateral in accordance with the lending agreement between the Portfolio and State Street, and indemnify the Portfolio against counterparty risk. The loans will be collateralized by U.S. Treasury securities at least equal at all times to the market value of the securities loaned. The Portfolio may bear the risk of delay in recovery of, or loss of rights in, the securities loaned should the borrower of the securities experience financial difficulty. The Portfolio may also record a realized gain or loss on securities deemed sold due to a borrower’s inability to return securities on loan. The Portfolio bears the risk of any loss on investment of the collateral. The Portfolio will receive compensation for lending its securities in the form of fees or it will retain a portion of interest on the investment of any cash received as collateral. The Portfolio will also continue to receive interest and dividends on the securities loaned and any gain or loss in the market price of the securities loaned that may occur during the term of the loan will be for the account of the Portfolio. During the six-month period ended June 30, 2017, the Portfolio did not have any portfolio securities on loan.
(V) Securities Risk. The Portfolio may invest in foreign securities, which carry certain risks that are in addition to the usual risks inherent in domestic securities. These risks include those resulting from currency fluctuations, future adverse political or economic developments and possible imposition of currency exchange blockages or other foreign governmental laws or restrictions. These risks are likely to be greater in
Notes to Financial Statements (Unaudited) (continued)
emerging markets than in developed markets. The ability of issuers of debt held by the Portfolio to meet their obligations may be affected, among other things, by economic or political developments in a specific country, industry or region.
The ability of issuers of debt securities held by the Portfolio to meet their obligations may be affected by economic or political developments in a specific country, industry or region. Investments in the Portfolio are not guaranteed, even though some of the Portfolio’s underlying investments are guaranteed by the U.S. government or its agencies or instrumentalities. The principal risk of mortgage-related and asset-backed securities is that the underlying debt may be prepaid ahead of schedule, if interest rates fall, thereby reducing the value of the fund’s investment. If interest rates rise, less of the debt may be prepaid and the fund may lose money. Funds that invest in bonds are subject to interest-rate risk and can lose principal value when interest rates rise.
Bonds are also subject to credit risk, in which the bond issuer may fail to pay interest and principal in a timely manner.
In order to better define its contractual rights and to secure rights that will help the Portfolio mitigate its counterparty risk, the Portfolio may enter into an International Swaps and Derivatives Association, Inc. Master Agreement (“ISDA Master Agreement”) or similar agreement with its counterparties. An ISDA Master Agreement is a bilateral agreement between the Portfolio and a counterparty that governs certain OTC derivatives and typically contains collateral posting terms and netting provisions. Under an ISDA Master Agreement, the Portfolio may, under certain circumstances, offset with the counterparty certain derivative financial instruments’ payables and/or receivables with collateral held and/or posted and create one single net payment. The provisions of the ISDA Master Agreement typically permit a single net payment in the event of default including the bankruptcy or insolvency of the counterparty. Bankruptcy or insolvency laws of a particular jurisdiction may
restrict or prohibit the right of offset in bankruptcy, insolvency or other events. In addition, certain ISDA Master Agreements may contain provisions for early termination of OTC derivative transactions in the event the net assets of the Portfolio declines below specific levels or if the Portfolio fails to meet the terms of its ISDA Master Agreements. The result would cause the Portfolio to accelerate payment of any net liability owed to the counterparty.
For financial reporting purposes, the Portfolio does not offset derivative assets and derivative liabilities that are subject to netting arrangements, if any, in the Statements of Assets and Liabilities.
(W) Indemnifications. Under the Fund’s organizational documents, its officers and trustees are indemnified against certain liabilities that may arise out of performance of their duties to the Fund. Additionally, in the normal course of business, the Portfolio enters into contracts with third-party service providers that contain a variety of representations and warranties and which may provide general indemnifications. The Portfolio’s maximum exposure under these arrangements is unknown, as this would involve future claims that may be made against the Portfolio that have not yet occurred. Based on experience, management is of the view that the risk of loss in connection with these potential indemnification obligations is remote. However, there can be no assurance that material liabilities related to such obligations will not arise in the future, which could adversely impact the Portfolio.
(X) Quantitative Disclosure of Derivative Holdings. The following tables show additional disclosures related to the Portfolio’s derivative and hedging activities, including how such activities are accounted for and their effect on the Portfolio’s financial positions, performance and cash flows. The Portfolio entered into futures contracts in order to provide an efficient means of maintaining liquidity while remaining fully invested in the market. These derivatives are not accounted for as hedging instruments.
Fair value of derivative instruments as of June 30, 2017:
Asset Derivatives
| | | | | | | | | | | | | | | | | | |
| | | Statement of
Assets and Liabilities Location | | Foreign
Exchange
Contracts
Risk | | | Credit
Contracts
Risk | | | Interest
Rate
Contracts
Risk | | | Total | |
Purchased Options | | Investments in securities, at value | | $ | 13,813 | | | $ | — | | | $ | — | | | $ | 13,813 | |
Futures Contracts | | Net Assets—Net unrealized appreciation on investments and futures contracts (a) | | | — | | | | — | | | | 123,341 | | | | 123,341 | |
OTC Swap Contracts | | Unrealized appreciation on OTC swap contracts | | | — | | | | 115,878 | | | | — | | | | 115,878 | |
Centrally Cleared Swap Contracts | | Net Assets—Net unrealized appreciation on investments and swap contracts (b) | | | — | | | | — | | | | 1,680,099 | | | | 1,680,099 | |
Forward Contracts | | Unrealized appreciation on foreign currency forward contracts | | | 348,587 | | | | — | | | | — | | | | 348,587 | |
| | | | | | | | | | | | | | | | | | |
Total Fair Value | | | | $ | 362,400 | | | $ | 115,878 | | | $ | 1,803,440 | | | $ | 2,281,718 | |
| | | | | | | | | | | | | | | | | | |
| | |
| 34 | | MainStay VP PIMCO Real Return Portfolio |
Liability Derivatives
| | | | | | | | | | | | | | | | | | |
| | | Statement of Assets and Liabilities Location | | Foreign
Exchange
Contracts
Risk | | | Credit
Contracts
Risk | | | Interest
Rate
Contracts
Risk | | | Total | |
Written Options | | Investments in written options, at value | | $ | (6,375 | ) | | $ | — | | | $ | (72,913 | ) | | $ | (79,288 | ) |
Futures Contracts | | Net Assets—Net unrealized appreciation on investments and futures contracts (a) | | | — | | | | — | | | | (93,263 | ) | | | (93,263 | ) |
OTC Swap Contracts | | Unrealized depreciation on OTC swap contracts | | | — | | | | — | | | | (447,906 | ) | | | (447,906 | ) |
Centrally Cleared Swap Contracts | | Net Assets—Net unrealized depreciation on investments and swap contracts (b) | | | — | | | | (2,087 | ) | | | (66,711 | ) | | | (68,798 | ) |
Forward Contracts | | Unrealized depreciation on foreign currency forward contracts | | | (928,826 | ) | | | — | | | | — | | | | (928,826 | ) |
| | | | | | | | | | | | | | | | | | |
Total Fair Value | | | | $ | (935,201 | ) | | $ | (2,087 | ) | | $ | (680,793 | ) | | $ | (1,618,081 | ) |
| | | | | | | | | | | | | | | | | | |
| (a) | Includes cumulative appreciation (depreciation) of futures contracts as reported in the Portfolio of Investments. Only the current day’s variation margin is reported within the Statement of Assets and Liabilities. |
| (b) | Includes cumulative appreciation (depreciation) of centrally cleared swap agreements as reported in the Portfolio of Investments. Only the current day’s variation margin is reported within the Statement of Assets and Liabilities. |
The effect of derivative instruments on the Statement of Operations for the period ended June 30, 2017:
Realized Gain (Loss)
| | | | | | | | | | | | | | | | | | |
| | | Statement of Operations Location | | Foreign
Exchange
Contracts
Risk | | | Credit
Contracts
Risk | | | Interest
Rate
Contracts
Risk | | | Total | |
Purchased Options | | Net realized gain (loss) on investment transactions | | $ | (32,475 | ) | | $ | — | | | $ | — | | | $ | (32,475 | ) |
Written Options | | Net realized gain (loss) on written option transactions | | | 21,877 | | | | — | | | | 244,840 | | | | 266,717 | |
Futures Contracts | | Net realized gain (loss) on futures transactions | | | — | | | | — | | | | (349,679 | ) | | | (349,679 | ) |
Swap Contracts | | Net realized gain (loss) on swap transactions | | | — | | | | 19,745 | | | | 77,052 | | | | 96,797 | |
Forward Contracts | | Net realized gain (loss) on foreign currency transactions | | | 40,054 | | | | — | | | | — | | | | 40,054 | |
| | | | | | | | | | | | | | | | | | |
Total Realized Gain (Loss) | | | | $ | 29,456 | | | $ | 19,745 | | | $ | (27,787 | ) | | $ | 21,414 | |
| | | | | | | | | | | | | | | | | | |
Change in Unrealized Appreciation (Depreciation)
| | | | | | | | | | | | | | | | | | |
| | | Statement of Operations Location | | Foreign
Exchange
Contracts
Risk | | | Credit
Contracts
Risk | | | Interest
Rate
Contracts
Risk | | | Total | |
Purchased Options | | Net change in unrealized appreciation (depreciation) on investments | | $ | 2,800 | | | $ | — | | | $ | — | | | $ | 2,800 | |
Written Options | | Net change in unrealized appreciation (depreciation) on written options | | | 12,998 | | | | — | | | | (11,367 | ) | | | 1,631 | |
Futures Contracts | | Net change in unrealized appreciation (depreciation) on futures contracts | | | — | | | | — | | | | 74,596 | | | | 74,596 | |
Swap Contracts | | Net change in unrealized appreciation (depreciation) on swap contracts | | | — | | | | 92,255 | | | | 284,686 | | | | 376,941 | |
Forward Contracts | | Net change in unrealized appreciation (depreciation) on translation of other assets and liabilities in foreign currencies and foreign currency forward contracts | | | (1,769,021 | ) | | | — | | | | — | | | | (1,769,021 | ) |
| | | | | | | | | | | | | | | | | | |
Total Change in Unrealized Appreciation (Depreciation) | | | | $ | (1,753,223 | ) | | $ | 92,255 | | | $ | 347,915 | | | $ | (1,313,053 | ) |
| | | | | | | | | | | | | | | | | | |
Notes to Financial Statements (Unaudited) (continued)
Average Notional Amount
| | | | | | | | | | | | | | | | |
| | | Foreign
Exchange
Contracts Risk | | | Credit
Contracts
Risk | | | Interest
Rate
Contracts
Risk | | | Total | |
Purchased Options | | $ | — | | | $ | — | | | $ | 1,260,000 | | | $ | 1,260,000 | |
Written Options | | | (1,114,250 | ) | | | — | | | | — | | | | (1,114,250 | ) |
Written Inflation—Capped Options | | | — | | | | — | | | | (2,476,500 | ) | | | (2,476,500 | ) |
Futures Contracts Long | | | — | | | | — | | | | 7,692,082 | | | | 7,692,082 | |
Futures Contracts Short | | | — | | | | — | | | | (41,578,761 | ) | | | (41,578,761 | ) |
Swap Contracts Long | | | — | | | | 5,793,121 | | | | 77,853,967 | | | | 83,647,088 | |
Swap Contracts Short | | | — | | | | (6,070,000 | ) | | | — | | | | (6,070,000 | ) |
Forward Contracts Long | | | 21,397,177 | | | | — | | | | — | | | | 21,397,177 | |
Forward Contracts Short | | $ | (76,931,320 | ) | | $ | — | | | $ | — | | | $ | (76,931,320 | ) |
| | | | |
Note 3–Fees and Related Party Transactions
(A) Manager and Subadvisor. New York Life Investments, a registered investment adviser and an indirect, wholly-owned subsidiary of New York Life, serves as the Portfolio’s Manager pursuant to an Amended and Restated Management Agreement (“Management Agreement”). The Manager provides offices, conducts clerical, recordkeeping and bookkeeping services, and keeps most of the financial and accounting records required to be maintained by the Portfolio. Except for the portion of salaries and expenses that are the responsibility of the Portfolio, the Manager pays the salaries and expenses of all personnel affiliated with the Portfolio and certain operational expenses of the Portfolio. The Portfolio reimburses New York Life Investments in an amount equal to a portion of the compensation of the Chief Compliance Officer attributable to the Portfolio. Pursuant to the terms of a Subadvisory Agreement with New York Life Investments, Pacific Investment Management Company LLC (“PIMCO”), a registered investment adviser, serves as Subadvisor to the Portfolio. New York Life Investments pays for the services of the Subadvisor.
The Fund, on behalf of the Portfolio, pays New York Life Investments in its capacity as the Portfolio’s investment manager and administrator, pursuant to the Management Agreement, a monthly fee for the services performed and the facilities furnished at an annual percentage of the average daily net assets of 0.50%. During the six-month period ended June 30, 2017, the effective management fee rate was 0.50%.
During the six-month period ended June 30, 2017, New York Life Investments earned fees from the Portfolio in the amount of $804,638.
State Street provides sub-administration and sub-accounting services to the Portfolio pursuant to an agreement with New York Life Investments. These services include calculating the daily NAVs of the Portfolio, maintaining the general ledger and sub-ledger accounts for the calculation of the Portfolio’s NAVs, and assisting New York Life Investments in conducting various aspects of the Portfolio’s administrative operations. For providing these services to the Portfolio, State Street is compensated by New York Life Investments.
(B) Distribution and Service Fees. The Fund, on behalf of the Portfolio, has entered into a distribution agreement with NYLIFE Distributors LLC (the “Distributor”), an indirect, wholly-owned subsidiary of New York Life. The Portfolio has adopted a distribution plan (the “Plan”) in accordance with the provisions of Rule 12b-1 under the 1940 Act. Under the Plan, the Distributor has agreed to provide, through its
affiliates or independent third parties, various distribution-related, shareholder and administrative support services to the Service Class shareholders. For its services, the Distributor is entitled to a combined distribution and service fee accrued daily and paid monthly at an annual rate of 0.25% of the average daily net assets attributable to the Service Class shares of the Portfolio.
Note 4–Federal Income Tax
During the year ended December 31, 2016, the tax character of distributions paid as reflected in the Statement of Changes in Net Assets was as follows:
| | | | |
| 2016 | |
Tax-Based
Distributions
from Ordinary
Income | | Tax-Based
Distributions
from Long-Term
Gains | |
| $4,592,260 | | $ | — | |
Note 5–Custodian
State Street is the custodian of cash and securities held by the Portfolio. Custodial fees are charged to the Portfolio based on the Portfolio’s net assets and/or the market value of securities held by the Portfolio and the number of certain transactions incurred by the Portfolio.
Note 6–Line of Credit
The Portfolio and certain other funds managed by New York Life Investments, maintain a line of credit with a syndicate of banks in order to secure a source of funds for temporary purposes to meet unanticipated or excessive redemption requests.
Effective August 1, 2017, under the credit agreement (the “Credit Agreement”), the aggregate commitment amount is $600,000,000 with an additional uncommitted amount of $100,000,000. The commitment fee is an annual rate of 0.15% of the average commitment amount payable quarterly, regardless of usage, to State Street, who serves as the agent to the syndicate. The commitment fee is allocated among the Portfolio and certain other funds managed by New York Life Investments based upon their respective net assets and other factors. Interest on any revolving credit loan is charged based upon the Federal Funds Rate or the one month LIBOR, whichever is higher. The Credit Agreement
| | |
| 36 | | MainStay VP PIMCO Real Return Portfolio |
expires on July 31, 2018, although the Portfolio, certain other funds managed by New York Life Investments and the syndicate of banks may renew the Credit Agreement for an additional year on the same or different terms. Prior to August 1, 2017, the aggregate commitment amount was $600,000,000 with an additional uncommitted amount of $100,000,000, and the commitment fee, under a credit agreement for which Bank of New York Mellon served as agent, was at an annual rate of 0.15% of the average commitment amount. During the six-month period ended June 30, 2017, there were no borrowings made or outstanding with respect to the Portfolio under the credit agreement for which Bank of New York Mellon served as agent.
Note 7–Interfund Lending Program
Pursuant to an exemptive order issued by the SEC, the Portfolio, along with certain other funds managed by New York Life Investments, may participate in an interfund lending program. The interfund lending program provides an alternative credit facility that permits the Portfolio and certain other funds managed by New York Life Investments to lend or borrow money for temporary purposes directly to or from one another subject to the conditions of the exemptive order. During the six-month period ended June 30, 2017, there were no interfund loans made or outstanding with respect to the Portfolio.
Note 8–Purchases and Sales of Securities (in 000’s)
During the six-month period ended June 30, 2017, purchases and sales of U.S. government securities were $233,245 and $210,745, respectively. Purchases and sales of securities, other than U.S. government securities and short-term securities, were $20,302 and $43,985, respectively.
The Portfolio may purchase securities from or sell to other portfolios managed by the respective Subadvisor. These interportfolio transactions are primarily used for cash management purposes and are made pursuant to Rule 17a-7 of the 1940 Act. The Rule 17a-7 transactions during the six months ended June 30, 2017, were as follows:
| | | | | | | | |
Purchases (000’s) | | Sales (000’s) | | | Realized
Gain/(Loss) (000’s) | |
| $1,834 | | $ | 108 | | | $ | 2 | |
Note 9–Capital Share Transactions
Transactions in capital shares for the six-month period ended June 30, 2017, and the year ended December 31, 2016, were as follows:
| | | | | | | | |
Initial Class | | Shares | | | Amount | |
Six-month period ended June 30, 2017: | | | | | | | | |
Shares sold | | | 624,964 | | | $ | 5,308,033 | |
Shares redeemed | | | (95,276 | ) | | | (811,539 | ) |
| | | | | | | | |
Net increase (decrease) | | | 529,688 | | | $ | 4,496,494 | |
| | | | | | | | |
Year ended December 31, 2016: | | | | | | | | |
Shares sold | | | 1,421,724 | | | $ | 12,250,897 | |
Shares issued to shareholders in reinvestment of dividends and distributions | | | 70,661 | | | | 602,515 | |
Shares redeemed | | | (5,678,537 | ) | | | (46,409,208 | ) |
| | | | | | | | |
Net increase (decrease) | | | (4,186,152 | ) | | $ | (33,555,796 | ) |
| | | | | | | | |
| | |
| | | | | | | | |
| | | | | | | | |
Service Class | | Shares | | | Amount | |
Six-month period ended June 30, 2017: | | | | | | | | |
Shares sold | | | 2,283,097 | | | $ | 19,377,530 | |
Shares redeemed | | | (2,293,301 | ) | | | (19,469,667 | ) |
| | | | | | | | |
Net increase (decrease) | | | (10,204 | ) | | $ | (92,137 | ) |
| | | | | | | | |
Year ended December 31, 2016: | | | | | | | | |
Shares sold | | | 3,123,241 | | | $ | 26,418,263 | |
Shares issued to shareholders in reinvestment of dividends and distributions | | | 468,328 | | | | 3,989,745 | |
Shares redeemed | | | (4,948,145 | ) | | | (41,441,243 | ) |
| | | | | | | | |
Net increase (decrease) | | | (1,356,576 | ) | | $ | (11,033,235 | ) |
| | | | | | | | |
Note 10–Recent Accounting Pronouncement
In October 2016, the SEC adopted new rules and amended existing rules (together, “final rules”) intended to modernize the reporting and disclosure of information by registered investment companies. In part, the final rules amend Regulation S-X and require standardized, enhanced disclosure about derivatives in investment company financial statements, as well as other amendments. The compliance date for the amendments to Regulation S-X is August 1, 2017 and applies to shareholder reports for funds with fiscal periods ending after August 1, 2017. Management is currently evaluating the impact that the adoption of the amendments to Regulation S-X will have on the Portfolio’s financial statements and related disclosures.
In November 2016, the FASB issued the Accounting Standards Update “Restricted Cash” which will require entities to include the total of cash, cash equivalents, restricted cash, and restricted cash equivalents in the beginning and ending cash balances in the Statement of Cash Flows. The guidance will be applied retrospectively and is effective for fiscal years beginning after December 15, 2017, and interim periods within those years. Management is currently evaluating the impact, if any, of this guidance on the Portfolio’s presentation in the Statement of Cash Flows.
Note 11–Subsequent Events
In connection with the preparation of the financial statements of the Portfolio as of and for the six-month period ended June 30, 2017, events and transactions subsequent to June 30, 2017, through the date the financial statements were issued have been evaluated by the Portfolio’s management for possible adjustment and/or disclosure. No subsequent events requiring financial statement adjustment or disclosure have been identified.
Proxy Voting Policies and Procedures and Proxy Voting Record
A description of the policies and procedures that New York Life Investments uses to vote proxies related to the Portfolio’s securities is available without charge, upon request, (i) by calling 800-598-2019 or (ii) by visiting the SEC’s website at www.sec.gov.
The Portfolio is required to file with the SEC its proxy voting record for the 12-month period ending June 30 on Form N-PX. The Portfolio’s most recent Form N-PX or proxy voting record is available free of charge upon request (i) by calling 800-598-2019 or; (ii) by visiting the SEC’s website at www.sec.gov.
Shareholder Reports and Quarterly Portfolio Disclosure
The Portfolio is required to file its complete schedule of portfolio holdings with the SEC for its first and third fiscal quarters on Form N-Q. The Portfolio’s Form N-Q is available without charge on the SEC’s website at www.sec.gov or by calling MainStay Investments at 800-598-2019. You also can obtain and review copies of Form N-Q by visiting the SEC’s Public Reference Room in Washington, DC (information on the operation of the Public Reference Room may be obtained by calling 1-800-SEC-0330).
| | |
| 38 | | MainStay VP PIMCO Real Return Portfolio |
MainStay VP Portfolios
MainStay VP offers a wide range of Portfolios. The full array of MainStay VP offerings is listed here, with information about the manager, subadvisors, legal counsel, and independent registered public accounting firm.
Equity Portfolios
MainStay VP Common Stock Portfolio
MainStay VP Cornerstone Growth Portfolio
MainStay VP Eagle Small Cap Growth Portfolio
MainStay VP Emerging Markets Equity Portfolio
MainStay VP Epoch U.S. Equity Yield Portfolio
MainStay VP Epoch U.S. Small Cap Portfolio
MainStay VP International Equity Portfolio
MainStay VP Large Cap Growth Portfolio
MainStay VP MFS® Utilities Portfolio
MainStay VP Mid Cap Core Portfolio
MainStay VP S&P 500 Index Portfolio
MainStay VP Small Cap Core Portfolio
MainStay VP T. Rowe Price Equity Income Portfolio
MainStay VP VanEck Global Hard Assets Portfolio
Mixed Asset Portfolios
MainStay VP Balanced Portfolio
MainStay VP Convertible Portfolio
MainStay VP Cushing Renaissance Advantage Portfolio
MainStay VP Income Builder Portfolio
MainStay VP Janus Henderson Balanced Portfolio
Income Portfolios
MainStay VP Bond Portfolio
MainStay VP Floating Rate Portfolio
MainStay VP Government Portfolio
MainStay VP High Yield Corporate Bond Portfolio
MainStay VP Indexed Bond Portfolio
MainStay VP PIMCO Real Return Portfolio
MainStay VP Unconstrained Bond Portfolio
Money Market
MainStay VP U.S. Government Money Market Portfolio
Alternative
MainStay VP Absolute Return Multi-Strategy Portfolio
Asset Allocation Portfolios
MainStay VP Conservative Allocation Portfolio
MainStay VP Growth Allocation Portfolio
MainStay VP Moderate Allocation Portfolio
MainStay VP Moderate Growth Allocation Portfolio
Manager
New York Life Investment Management LLC
New York, New York
Subadvisors
Candriam Belgium*
Brussels, Belgium
Candriam France S.A.S.*
Paris, France
Cornerstone Capital Management Holdings LLC*
New York, New York
Cushing Asset Management, LP
Dallas, Texas
Eagle Asset Management, Inc.
St Petersburg, Florida
Epoch Investment Partners, Inc.
New York, New York
Janus Capital Management LLC
Denver, Colorado
MacKay Shields LLC*
New York, New York
Massachusetts Financial Services Company
Boston, Massachusetts
NYL Investors LLC*
New York, New York
Pacific Investment Management Company LLC
Newport Beach, California
T. Rowe Price Associates, Inc.
Baltimore, Maryland
Van Eck Associates Corporation
New York, New York
Winslow Capital Management, LLC
Minneapolis, Minnesota
Distributor
NYLIFE Distributors LLC*
Jersey City, New Jersey
Custodian
State Street Bank and Trust Company
Boston, Massachusetts
Independent Registered Public Accounting Firm
PricewaterhouseCoopers LLP
New York, New York
Legal Counsel
Dechert LLP
Washington, District of Columbia
Some Portfolios may not be available in all products.
* An affiliate of New York Life Investment Management LLC
Not part of the Semiannual Report
2017 Semiannual Report
This report is for the general information of New York Life Variable Annuities and NYLIAC Variable Universal Life Insurance Products policyowners. It must be preceded or accompanied by the appropriate product(s) and funds prospectuses if it is given to anyone who is not an owner of a New York Life variable annuity policy or a NYLIAC Variable Universal Life Insurance Product. This report does not offer for sale or solicit orders to purchase securities.
The performance data quoted in this report represents past performance. Past performance is no guarantee of future results. Due to market volatility and other factors, current performance may be lower or higher than the figures shown. The most recent month-end performance summary for your variable annuity or variable life policy is available by calling 800-598-2019 and is updated periodically on www.newyorklife.com.
The New York Life Variable Annuities and NYLIAC Variable Universal Life Insurance Products are issued by New York Life Insurance and Annuity Corporation (a Delaware Corporation) and distributed by NYLIFE Distributors LLC (Member FINRA/SIPC).
New York Life Insurance Company
New York Life Insurance and Annuity Corporation (NYLIAC) (A Delaware Corporation)
51 Madison Avenue, Room 551
New York, NY 10010
www.newyorklife.com
Printed on recycled paper
mainstayinvestments.com
NYLIFE Distributors LLC, 30 Hudson Street, Jersey City, NJ 07302
New York Life Investment Management LLC is the investment manager to the MainStay VP Funds Trust
©2017 by NYLIFE Distributors LLC. All rights reserved.
You may obtain copies of the Prospectus and the Statement of Additional Information free of charge, upon request, by calling toll-free 800-598-2019 or writing to New York Life Insurance and Annuity Corporation, 51 Madison Avenue, New York, NY 10010.
| | | | |
| Not FDIC Insured | | No Bank Guarantee | | May Lose Value |
| | | | |
1743293 | | | | MSVPPRR10-08/17 (NYLIAC) NI528 |
MainStay VP Absolute Return Multi-Strategy Portfolio
Message from the President and Semiannual Report
Unaudited | June 30, 2017

Sign up for electronic delivery of your shareholder reports. For full details on electronic delivery, including who can participate and what you
can receive via eDelivery, please log on to www.newyorklife.com/vsc

This page intentionally left blank
Message from the President
The six months ended June 30, 2017, brought positive results to many stock and bond investors. The year began with many investors hoping that Republican control of the White House, the Senate and the House of Representatives could bring an end to political gridlock; and while debate has continued on a number of issues, the U.S. stock market climbed relatively steadily throughout the first half of 2017.
According to FTSE-Russell U.S. market data, stocks at all capitalization levels tended to record positive total returns during the reporting period, with large-cap stocks generally outperforming stocks of smaller-capitalization companies. Growth stocks outpaced value stocks at every capitalization level by substantial margins—from more than six percentage points for micro-caps and mid-caps to more than 10 percentage points for the largest 200 U.S. companies by market capitalization.
Most sectors of the stock market advanced during the reporting period, with energy and telecommunication services being notable exceptions. Energy stocks declined as oil prices fell despite moves by the Organization of Petroleum Exporting Countries (OPEC) intended to limit oil production by its members. Telecommunication services stocks tended to decline as competition increased and rising interest rates made dividend payouts less appealing.
In March and June of 2017, the Federal Reserve announced successive increases in the target range for the federal funds rate, ultimately bringing the federal funds target range to 1.00% to 1.25%. While short-term U.S. Treasury yields rose in response, yields for U.S. Treasury securities with maturities of five years or longer declined. As the difference between short- and long-term yields narrowed, the advantages of higher-yielding long-term bonds became increasingly apparent.
Virtually all taxable and tax-exempt bond sectors provided positive total returns during the reporting period. Mortgage-backed
securities, though providing positive total returns, faced headwinds when the Federal Reserve announced plans to begin normalizing its balance sheet by reducing reinvestment of principal payments on mortgage-backed securities.
International stock and bond markets were also strong during the reporting period. International stocks provided double-digit total returns that were surpassed by emerging-market stocks as a whole. Global investment-grade bonds provided single-digit returns; and emerging-market debt was somewhat stronger.
Even during periods of favorable market performance and generally positive returns, MainStay believes that it is important to carefully monitor your investments. Your risk tolerance may
change over time, leading you to reevaluate which MainStay VP Portfolios are most appropriate for your long-term goals. Your goals themselves may also change, leading you to pursue investments with more or less risk. The portfolio managers of MainStay VP Portfolios seek to provide results consistent with the investment objectives of their respective Portfolios, to give you a wide range of choices suitable to various investment needs.
The report that follows provides more detailed information about the specific markets, securities and investment decisions that influenced your MainStay VP Portfolio during the six months ended June 30, 2017. We invite you to review the report carefully as part of your ongoing investment evaluation and review.
Sincerely,

Stephen P. Fisher
President
The opinions expressed are as of the date of the accompanying report and are subject to change. Past performance is no guarantee of future results. There is no guarantee that any forecasts made will come to pass. This material does not constitute investment advice and is not intended as an endorsement of any specific investment.
Not all MainStay VP Portfolios and/or share classes are available under all policies.
Not part of the Semiannual Report
Table of Contents
Investors should refer to the Portfolio’s Summary Prospectus and/or Prospectus and consider the Portfolio’s investment objectives, strategies, risks, charges and expenses carefully before investing. The Summary Prospectus and/or Prospectus contain this and other information about the Portfolio. You may obtain copies of the Portfolio’s Summary Prospectus and/or the Prospectus and the Statement of Additional Information free of charge, upon request, by calling toll-free 800-598-2019, by writing to New York Life Insurance and Annuity Corporation, 51 Madison Avenue, Room 251, New York, New York 10010 or by sending an email to MainStayShareholdersServices@nylim.com. These documents are also available at mainstayinvestments.com/vpdocuments. Please read the Summary Prospectus and/or Prospectus carefully before investing. MainStay VP Funds Trust portfolios are separate account options which are purchased through a variable insurance or variable annuity contract.
Investment and Performance Comparison1 (Unaudited)
Performance data quoted represents past performance. Past performance is no guarantee of future results. Because of market volatility and other factors, current performance may be lower or higher than the figures shown. Investment return and principal value will fluctuate, and as a result, when shares are redeemed, they may be worth more or less than their original cost. The performance table and graph do not reflect any deduction of sales charges, mortality and expense charges, contract charges or administrative charges. Please refer to the Performance Summary appropriate for your policy. For performance information current to the most recent month-end, please call 800-598-2019 or visit www.newyorklife.com.
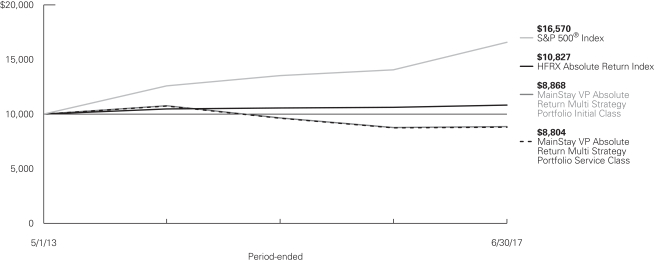
Average Annual Total Returns for the Period Ended June 30, 2017
| | | | | | | | | | | | | | | | | | | | |
| Class | | Inception
Date | | | Six Months | | | One Year | | | Five Years
or Since
Inception2 | | | Gross
Expense
Ratio3 | |
| Initial Class Shares | | | 5/1/2013 | | | | –1.92 | % | | | 1.17 | % | | | –2.84 | % | | | 2.48 | % |
Service Class Shares | | | 5/1/2013 | | | | –2.05 | | | | 0.89 | | | | –3.01 | | | | 2.66 | |
| | | | | | | | | | | | |
| Benchmark Performance | | Six
Months | | | One
Year | | | Five Years
or Since
Inception | |
HFRX Absolute Return Index4 | | | 1.38 | % | | | 1.93 | % | | | 1.93 | % |
S&P 500® Index5 | | | 9.34 | | | | 17.90 | | | | 12.89 | |
Average Lipper Variable Products Alternative Other Portfolio6 | | | 4.45 | | | | 7.61 | | | | 3.21 | |
| 1. | Performance figures reflect certain fee waivers and/or expense limitations, without which total returns may have been different. For information on current fee waivers and/or expense limitations (if any), please refer to the Notes to Consolidated Financial Statements. |
| 2. | The Portfolio commenced operations on May 1, 2013. Effective January 15, 2016, the Portfolio replaced its subadvisor. Effective January 19, 2016, the Portfolio revised its principal investment strategies. The performance shown above reflects the Portfolio’s prior subadvisor and principal investment strategies. Past performance may have been different if the new subadvisors or revised principal investment strategies had been in place during the period. |
| 3. | The gross expense ratios presented reflect the Portfolio’s “Total Annual Portfolio Operating Expenses” from the most recent Prospectus and may differ from other expense ratios disclosed in this report. |
| 4. | The HFRX Absolute Return Index is the Portfolio’s primary broad-based securities market index for comparison purposes. The HFRX Absolute Return Index is designed to be representative of the overall composition of the hedge fund universe. It is comprised of eligible hedge fund strategies, including but not limited to convertible arbitrage, distressed securities, |
| | equity hedge, equity market neutral, event driven, macro, merger arbitrage, and relative value arbitrage. Results assume reinvestment of all dividends and capital gains. An investment cannot be made directly in an index. |
| 5. | The S&P 500® Index is the Portfolio’s secondary benchmark index for comparison purposes. “S&P 500®” is a trademark of The McGraw-Hill Companies Inc. The S&P 500® Index is widely regarded as the standard index for measuring large-cap U.S. stock market performance. Results assume reinvestment of all dividends and capital gains. An investment cannot be made directly in an index. |
| 6. | The Average Lipper Variable Products Alternative Other Portfolio is representative of portfolios that, by prospectus language, seek total returns through the use of alternative investment strategies. These strategies include but are not limited to equity market neutral, long/short equity, global macro, event driven, credit focus or through the use of several different hedge-like strategies. This benchmark is a product of Lipper Inc. Lipper Inc. is an independent monitor of fund performance. Results are based on average total returns of similar portfolios with all dividend and capital gain distributions reinvested. |
Cost in Dollars of a $1,000 Investment in MainStay VP Absolute Return Multi-Strategy Portfolio (Unaudited)
The example below is intended to describe the fees and expenses borne by shareholders during the six-month period from January 1, 2017 to June 30, 2017, and the impact of those costs on your investment.
Example
As a shareholder of the Portfolio, you incur two types of costs: (1) transaction costs, including exchange fees and sales charges (loads) on purchases (as applicable), and (2) ongoing costs, including management fees, distribution and/or service (12b-1) fees, and other Portfolio expenses (as applicable). This example is intended to help you understand your ongoing costs (in dollars) of investing in the Portfolio and to compare these costs with the ongoing costs of investing in other mutual funds. The example is based on an investment of $1,000 made at the beginning of the six-month period and held for the entire period from January 1, 2017 to June 30, 2017. Shares are only sold in connection with variable life and annuity contracts and the example does not reflect any contract level or transactional fees or expenses. If these costs had been included, your costs would have been higher.
This example illustrates your Portfolio’s ongoing costs in two ways:
Actual Expenses
The second and third data columns in the table below provide information about actual account values and actual expenses. You may use the information in these columns, together with the amount you invested, to estimate the expenses that you paid during the six months ended June 30, 2017. Simply divide your account value by $1,000
(for example, an $8,600 account value divided by $1,000 = 8.6), then multiply the result by the number under the heading entitled “Expenses Paid During Period” to estimate the expenses you paid on your account during this period.
Hypothetical Example for Comparison Purposes
The fourth and fifth data columns in the table below provide information about hypothetical account values and hypothetical expenses based on the Portfolio’s actual expense ratio and an assumed rate of return of 5% per year before expenses, which is not the Portfolio’s actual return. The hypothetical account values and expenses may not be used to estimate the actual ending account balances or expenses you paid for the six-month period shown. You may use this information to compare the ongoing costs of investing in the Portfolio with the ongoing costs of investing in other mutual funds. To do so, compare this 5% hypothetical example with the 5% hypothetical examples that appear in the shareholder reports of the other mutual funds.
Please note that the expenses shown in the table are meant to highlight your ongoing costs only and do not reflect any transactional costs, such as exchange fees or sales charges (loads). Therefore, the fourth and fifth data columns of the table are useful in comparing ongoing costs only and will not help you determine the relative total costs of owning different funds. In addition, if these transactional costs were included, your costs would have been higher.
| | | | | | | | | | | | | | | | | | | | | | | | |
| | | | | | | | | | | | | | | | | | | |
| Share Class | | Beginning Account Value 1/1/17 | | | Ending Account Value (Based on Actual Returns and Expenses) 6/30/17 | | | Expenses Paid During
Period1 | | | Ending Account Value (Based
on Hypothetical
5% Annualized
Return and
Actual Expenses)
6/30/17 | | | Expenses Paid During
Period1 | | | Net Expense Ratio During Period2 | |
| | | | | | |
| Initial Class Shares | | $ | 1,000.00 | | | $ | 980.80 | | | $ | 12.18 | | | $ | 1,012.50 | | | $ | 12.37 | | | | 2.48 | % |
| | | | | | |
| Service Class Shares | | $ | 1,000.00 | | | $ | 979.50 | | | $ | 13.40 | | | $ | 1,011.30 | | | $ | 13.61 | | | | 2.73 | % |
| 1. | Expenses are equal to the Portfolio’s annualized expense ratio of each class multiplied by the average account value over the period, divided by 365 and multiplied by 181 (to reflect the six-month period). The table above represents the actual expenses incurred during the six-month period. |
| 2. | Expenses are equal to the Portfolio’s annualized expense ratio to reflect the six-month period. |
| | |
| 6 | | MainStay VP Absolute Return Multi-Strategy Portfolio |
The Portfolio pursues its investment objective by allocating its assets among multiple non-traditional or “alternative” investment strategies managed by New York Life Investment Management LLC, the Manager, and different Subadvisors. The Manager is responsible for selecting and overseeing each Subadvisor and for determining the amount of Portfolio assets allocated to each investment strategy and Subadvisor. The Manager, along with each of the Subadvisors, provides day-to-day portfolio management for a portion of the Portfolio’s assets by
employing a variety of non-traditional investment strategies. The Portfolio employs an absolute return strategy, which seeks to provide returns that have a low correlation to traditional equity and fixed-income indices, lower volatility than traditional equity indices, and similar volatility to traditional investment grade fixed-income indices through investing in a number of non-traditional investment strategies. The Portfolio’s absolute return investment approach seeks to provide positive returns over a complete market cycle.
Strategy Allocation as of June 30, 20171 (Unaudited)

| 1 | Percentages based on total net assets. |
Equity Market Neutral: This strategy seeks to profit by detecting and exploiting perceived pricing inefficiencies in individual equity securities and neutralizing exposure to market risk by maintaining approximately equal value exposure in long and short positions. The strategy will identify investment opportunities based on a model that reflects the input of relevant factors, including relative value, market sentiment, and the Subadvisor’s forecasts as to anticipated market volatility. The strategy may engage in short sales in order to generate returns that are independent of the direction of the market.
Risk Arbitrage: This strategy implements event-driven arbitrage strategies on securities of companies that experience certain “special situations,” which are corporate events that are likely to create discontinuity in the price of a given security. The Portfolio’s risk arbitrage strategy consists primarily of an announced merger arbitrage strategy. An announced merger arbitrage strategy buys or sells the securities of companies involved in a merger based on the Subadvisor’s anticipation of the merger’s outcome. The strategy may also invest in securities of companies based on other event-driven strategies, such as holding discount arbitrage, share class arbitrage, spin-offs, asset sales, initial public offerings, minority buyouts, auctions or rights issues. Share class arbitrage involves capitalizing on perceived pricing inefficiencies of a particular share class in a multiple share class issuer. Discount arbitrage is when a discount option is purchased while an opposite transaction is taken in the underlying security.
Managed Futures: This strategy primarily takes long and short positions in futures contracts (directly or through derivatives, including total return swaps) across asset classes globally. The strategy seeks to exploit market trends and generate absolute returns utilizing a quantitative and systematic investment approach, which consists of analyzing financial markets through statistical models. These quantitative models produce buy or sell signals looking to benefit from the upward and downward movements of the asset classes covered based on market trends and patterns and contrarian views (i.e., instruments and strategies that may be out of favor in the broader market). The managed
futures strategy will be implemented through (i) investment in derivative instruments, including swap agreements, exchange-traded futures and option and forward contracts, to gain exposure to a wide variety of global markets for currencies, interest rates, stock market indices, energy resources, metals and agricultural products and to hedge price risk, (ii) investment in swap agreements that reflect the return of securities, derivatives and commodity interests selected by the Subadvisor, or (iii) investment in some combination of (i) and (ii). This strategy will involve the use of one or more wholly-owned subsidiaries formed under the laws of the Cayman Islands (each, a “Cayman Subsidiary”).
Master Limited Partnerships (“MLPs”): This strategy seeks to deliver both high current income and total return by investing in a portfolio of domestic and foreign publicly traded partnerships and/or other issuers engaged in the transportation, storage, processing, refining, marketing, exploration, production or mining of crude oil, natural gas, natural gas liquids, minerals or other natural resources. The Subadvisor implements this strategy by identifying companies it believes will benefit from increased crude oil, natural gas or natural gas liquids production resulting in greater energy infrastructure needs. The Portfolio will invest no more than 25% of its total assets in securities of MLPs that are qualified publicly traded partnerships (“QPTPs”), which are treated as partnerships for U.S. federal income tax purposes.
Credit Long/Short or Non-Traditional Fixed-Income: This strategy seeks to exploit opportunities in the global fixed-income markets based on top-down and bottom-up analysis. The strategy may invest in various credit strategies that involve being long and short different financial instruments, and the credit instruments involved will range from high grade to high yield (known as “junk bonds”) and distressed debt. The strategy may also invest in credit derivatives, including credit default swaps, options and indices. The Subadvisors responsible for this strategy dynamically allocate capital to the sectors and securities that they believe offer the best balance of risk and return, unrestricted by benchmark constraints.
Global Macro: This strategy seeks to obtain exposure to a broad spectrum of investments and countries or regions, based on discrete strategies that employ a variety of techniques, both discretionary and systematic analysis, combinations of top down and bottom up theses, and quantitative and fundamental approaches, designed to effectively identify and assess factors that affect businesses and economies broadly (e.g., monetary and fiscal policy, regulatory changes, demographics) and their impact on securities markets. The strategy may also employ arbitrage techniques and seek long and short exposure (directly or through derivatives, including total return swaps) across diversified asset classes globally. The strategy may be exposed significantly to interest rate and foreign currency futures. In addition, the strategy may involve the use of one or more Cayman Subsidiaries to obtain certain commodities market exposure.
Tactical Allocation: This strategy, which is managed by the Manager, may invest in a range of asset classes, including equity securities, fixed-income instruments, futures, options, currency forward contracts and swaps (including total return swaps) and affiliated and unaffiliated open-end funds, closed-end funds and exchange-traded funds, to manage or gain access to certain market exposures, including
exposure to asset classes or strategies in which the Portfolio is not otherwise invested, to exploit perceived structural inefficiencies in the markets or to manage cash flows. Additionally, positions may be pursued on a long or short basis either to take advantage of perceived investment opportunities or to counter exposure from other strategies in the Portfolio.
Other Strategies: The Manager may modify the strategies summarized above and allocate the Portfolio’s assets among or to other strategies developed or implemented to further optimize risk reward expectations based on, among other factors, changing market conditions. In addition to the instruments described above, such other strategies may include taking long and/or short positions in a wide range of instruments, including, but not limited to, commodities and real estate investment trusts (“REITs”). Such investments may be made without restriction as to issuer capitalization, country (including emerging markets), currency, maturity or credit rating and within the context of a range of investment programs or strategies, including, but not limited to, carry strategies, relative value strategies, and various forms arbitrage.
| | |
| 8 | | MainStay VP Absolute Return Multi-Strategy Portfolio |
Manager’s Allocation as of June 30, 20171 (Unaudited)
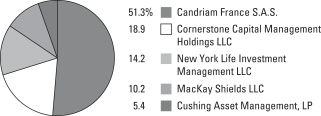
1 Percentages based on total net assets.
Top Ten Holdings or Issuers Held as of June 30, 2017 (excluding short-term investments) (Unaudited)
| 1. | B.C. ULC / New Red Finance, Inc., 4.25%–4.625%, due 1/15/22–5/15/24 |
| 2. | MoneyGram International, Inc. |
| 3. | Synlab Bondco PLC, 6.25%, due 7/1/22 |
| 4. | Cemex Finance LLC, 9.375%, due 10/12/22 |
| 6. | Energy Transfer Partners, L.P. |
| 7. | Ball Corp., 4.375%, due 12/15/23 |
| 9. | Energy Transfer Equity, L.P. |
Top Five Short Positions as of June 30, 2017
| 1. | United States Oil Fund, L.P. |
| 3. | Liberty Broadband Corp. |
Portfolio Management Discussion and Analysis (Unaudited)
Answers to the questions reflect the views of Jae S. Yoon, CFA, Jonathan Swaney, Poul Kristensen, CFA, and Amit Soni, CFA, of New York Life Investments,1 the Portfolio’s manager.
How did MainStay VP Absolute Return Multi-Strategy Portfolio perform relative to its primary benchmark and peers for the six months ended June 30, 2017?
For the six months ended June 30, 2017, MainStay VP Absolute Return Multi-Strategy Portfolio returned –1.92% for Initial Class shares and –2.05% for Service Class shares. Over the same period, both share classes underperformed the 1.38% return of the HFRX Absolute Return Index,2 which is the Portfolio’s broad-based securities-market index, and the 9.34% return of the S&P 500® Index, which is a secondary benchmark of the Portfolio. For the six months ended June 30, 2017, both share classes underperformed the 4.45% return of the Average Lipper3 Variable Products Alternative Other Portfolio.
Were there any changes to the Portfolio during the reporting period?
Judd B. Cryer no longer serves as a portfolio manager of the Portfolio. Jerry V. Swank, Libby F. Toudouze and John Musgrave continue to manage the Master Limited Partnerships (“MLPs”) strategy of the Portfolio for Cushing Asset Management, LP, a subadvisor to the Portfolio. For more information on this change, please see the prospectus supplement dated February 28, 2017.
What factors affected the Portfolio’s performance relative to its primary benchmark during the reporting period?
The primary positive contributors were the credit opportunities and global alpha strategies. The managed futures and equity market neutral strategies were the greatest detractors from the Portfolio’s performance. Poor performance from the managed futures strategy can be attributed to strong trend reversals in commodities and bond yields.
During the reporting period, how did the Portfolio’s performance correlate with traditional equity and fixed-income indices?
The Portfolio maintained low correlation to traditional equity indices and a modest inverse correlation to traditional investment-grade fixed-income indices during the reporting period. The Portfolio’s correlation to the S&P 500® Index was 18%. The Portfolio’s correlation to the Bloomberg Barclays U.S. Aggregate Bond Index4 was –31%.
During the reporting period, how did the Portfolio’s volatility compare to that of traditional investment-grade fixed-income indices?
Volatility reflects sharp up or down movements in the price of securities, commodities or markets over relatively short periods. During the reporting period, the Portfolio’s volatility was closer to that of traditional investment-grade and high-yield fixed-income indices than it was to traditional equity indices. The volatility of the Portfolio during the reporting period was 2.7%. This compared to 3.2% for the Bloomberg Barclays U.S. Aggregate Bond Index, 2.3% for the BofA Merrill Lynch U.S. High Yield Master II Index5 and 6.9% for the S&P 500® Index.
During the reporting period, how did the Portfolio use derivatives and how was the Portfolio’s performance materially affected by investments in derivatives?
Derivatives are used by the Portfolio for a variety of purposes, including alpha6 generation, hedging and/or operational efficiency. We believe that measuring the impact of derivatives on performance as positive or negative does not properly reflect the utility of derivatives to the Portfolio because of the functions they perform within the Portfolio. For example, a hedge performing as expected might have a negative contribution to return even as it serves its intended function to reduce a risk of an exposure. That said, the contribution from derivatives on the Portfolio’s performance was negative during the reporting period.
How did you allocate the Portfolio’s assets among each of the strategies during the reporting period and why?
The Portfolio’s allocations are based on the estimated optimal risk-return distribution of assets taking into account both the risk and return expectations. See the chart on page 7 for strategy allocations as of June 30, 2017. (It is generally not possible to increase return without taking additional risk, and the Portfolio generally cannot reduce risk without also reducing return.) These estimates of risk and return are long term in nature; and as a result, allocations tend to be quite stable over time. The Portfolio’s allocation to an individual strategy may change if there is a statistically significant change in the risk-return characteristics of a strategy, if the outlook of a strategy improves substantially or if an attractive new strategy becomes
| 1. | “New York Life Investments” is a service mark used by New York Life Investment Management Holdings LLC and its subsidiary New York Life Investment Management LLC. |
| 2. | See footnote on page 5 for more information on this index. |
| 3. | See footnote on page 5 for more information on Lipper Inc. |
| 4. | The Bloomberg Barclays U.S. Aggregate Bond Index is a broad-based benchmark that measures the investment grade, U.S. dollar denominated, fixed-rate taxable bond market, including Treasurys, government-related and corporate securities (agency fixed-rate and hybrid adjustable-rate mortgage pass-throughs), asset-backed securities and commercial mortgage-backed securities. Results assume reinvestment of all dividends and capital gains. An investment cannot be made directly in an index. |
| 5. | The BofA Merrill Lynch U.S. High Yield Master II Index monitors the performance of below-investment-grade U.S. dollar denominated corporate bonds publicly issued in the U.S. domestic market. An investment cannot be made directly in an index. |
| 6. | Alpha measures the relationship between a mutual fund’s return and its beta over a three-year period. Often, alpha is viewed as the excess return (positive or negative) or the value added by the portfolio manager. Beta is a measure of volatility in relation to the market as a whole. A beta higher than 1 indicates that a security or portfolio will tend to exhibit higher volatility than the market. A beta lower than 1 indicates that a security or portfolio will tend to exhibit lower volatility than the market. |
| | |
| 10 | | MainStay VP Absolute Return Multi-Strategy Portfolio |
available for investment that we believe would likely further support the Portfolio’s investment goal.
How did the tactical allocation among the strategies affect the Portfolio’s performance during the reporting period?
During the first half of 2017, the Portfolio’s tactical allocations were limited to the MLP Alpha7 strategy and were based on our outlook for the sector and its relationship to movements in the crude oil market. In April, we increased the Portfolio’s allocation to the hedged MLP strategy and then decreased the allocation in May. This trade contributed positively to the Portfolio’s performance.
During the reporting period, how did each strategy either contribute to or detract from the Portfolio’s absolute performance?
During the reporting period, the Portfolio saw its greatest positive contributions from global alpha (+1.02%), credit oppor-
tunities8 (+0.48%) and risk arbitrage (+0.23%). Other positive contributors included MLP alpha (+0.22%) and flexible bond (+0.20%). Over the same period, the strategies that made negative contributions to the Portfolio’s performance were managed futures (–2.24%), global market neutral (–0.98%) and tactical/completion (–0.13%).
How did the Portfolio’s strategy weightings change during the reporting period?
There were two strategic changes during the reporting period. First, there was a merger of the global opportunities and the global alpha strategies, resulting in the global alpha strategy absorbing the allocation of the global opportunities strategy. Second, we reduced the allocation to the risk arbitrage strategy owing to an expectation of a low return environment for this source of absolute return. Tactical changes, discussed above, were limited to increasing—and later decreasing—the Portfolio’s allocation to the hedged MLP strategy.
| 7. | The Master Limited Partnerships and other energy companies portion of the Portfolio consists of two underlying strategies: The midstream MLP strategy and the upstream MLP strategy. |
| 8. | The credit long/short or non-traditional fixed-income portion of the Portfolio consists of two underlying strategies: the flexible bond strategy and the credit opportunities strategy. |
The opinions expressed are those of the portfolio managers as of the date of this report and are subject to change. There is no guarantee that any forecasts made will come to pass. This material does not constitute investment advice and is not intended as an endorsement of any specific investment.
Not all MainStay VP Portfolios and/or share classes are available under all policies.
Consolidated Portfolio of Investments June 30, 2017 (Unaudited)
| | | | | | | | |
| | | Principal
Amount | | | Value | |
Long-Term Bonds 15.0%† Corporate Bonds 10.6% | |
Apparel 0.1% | |
Hanesbrands Finance Luxembourg SCA
Series Reg S
3.500%, due 6/15/24 | | EUR | 420,000 | | | $ | 502,489 | |
| | | | | | | | |
| | |
Auto Manufacturers 0.2% | | | | | | | | |
Volkswagen International Finance N.V.
Series Reg S
3.875%, due 12/31/99 (a) | | | 800,000 | | | | 906,867 | |
| | | | | | | | |
| | |
Auto Parts & Equipment 0.7% | | | | | | | | |
Adient Global Holdings, Ltd.
Series Reg S
3.500%, due 8/15/24 | | | 700,000 | | | | 810,818 | |
Federal-Mogul Holdings LLC
Series Reg S
4.875%, due 4/15/22 | | | 300,000 | | | | 342,919 | |
IHO Verwaltungs GmbH (b) | | | | | | | | |
Series Reg S
3.250%, due 9/15/23 (4.00% PIK) | | | 400,000 | | | | 468,281 | |
Series Reg S
3.750%, due 9/15/26 (4.50% PIK) | | | 650,000 | | | | 773,949 | |
Lear Corp.
4.750%, due 1/15/23 | | $ | 805,000 | | | | 832,885 | |
ZF North America Capital, Inc.
4.500%, due 4/29/22 (c) | | | 750,000 | | | | 787,500 | |
| | | | | | | | |
| | | | | | | 4,016,352 | |
| | | | | | | | |
Banks 0.4% | |
Bank of America Corp. | | | | | | | | |
4.200%, due 8/26/24 | | | 295,000 | | | | 306,241 | |
5.625%, due 7/1/20 | | | 275,000 | | | | 301,154 | |
Citigroup, Inc.
4.600%, due 3/9/26 | | | 250,000 | | | | 262,335 | |
Goldman Sachs Group, Inc. | | | | | | | | |
5.375%, due 3/15/20 | | | 255,000 | | | | 275,283 | |
6.750%, due 10/1/37 | | | 260,000 | | | | 337,491 | |
Morgan Stanley | | | | | | | | |
5.000%, due 11/24/25 | | | 285,000 | | | | 309,926 | |
5.500%, due 1/26/20 | | | 250,000 | | | | 269,671 | |
| | | | | | | | |
| | | | | | | 2,062,101 | |
| | | | | | | | |
Building Materials 0.5% | |
¨Cemex Finance LLC
Series Reg S
9.375%, due 10/12/22 | | | 1,950,000 | | | | 2,071,875 | |
| | | | | | | | |
| | | Principal
Amount | | | Value | |
Building Materials (continued) | |
Cemex SAB de CV | | | | | | | | |
Series Reg S
4.375%, due 3/5/23 | | EUR | 400,000 | | | $ | 482,718 | |
Series Reg S
7.750%, due 4/16/26 | | $ | 200,000 | | | | 228,750 | |
| | | | | | | | |
| | | | | | | 2,783,343 | |
| | | | | | | | |
Chemicals 0.2% | |
Axalta Coating Systems LLC
Series Reg S
4.250%, due 8/15/24 | | EUR | 350,000 | | | | 426,018 | |
NOVA Chemicals Corp. (c) | | | | | | | | |
4.875%, due 6/1/24 | | $ | 463,000 | | | | 461,264 | |
5.250%, due 6/1/27 | | | 378,000 | | | | 376,110 | |
Syngenta Finance N.V.
Series Reg S
1.250%, due 9/10/27 | | EUR | 100,000 | | | | 103,042 | |
| | | | | | | | |
| | | | | | | 1,366,434 | |
| | | | | | | | |
Commercial Services 0.3% | |
La Financiere Atalian SAS
Series Reg S
4.000%, due 5/15/24 | | | 950,000 | | | | 1,123,018 | |
Nassa Topco A/S
Series Reg S
2.875%, due 4/6/24 | | | 300,000 | | | | 351,211 | |
Nielsen Co. Luxembourg S.A.R.L.
5.500%, due 10/1/21 (c) | | $ | 400,000 | | | | 414,000 | |
| | | | | | | | |
| | | | | | | 1,888,229 | |
| | | | | | | | |
Distribution & Wholesale 0.3% | |
Rexel S.A. | | | | | | | | |
Series Reg S
2.625%, due 6/15/24 | | EUR | 100,000 | | | | 115,500 | |
Series Reg S
3.250%, due 6/15/22 | | | 240,000 | | | | 284,053 | |
VWR Funding, Inc.
Series Reg S
4.625%, due 4/15/22 | | | 1,221,000 | | | | 1,447,034 | |
| | | | | | | | |
| | | | | | | 1,846,587 | |
| | | | | | | | |
Electric 0.6% | |
EDP—Energias de Portugal S.A.
Series Reg S
5.375%, due 9/16/75 (a) | | | 200,000 | | | | 250,877 | |
EDP Finance B.V.
Series Reg S
6.000%, due 2/2/18 | | $ | 800,000 | | | | 817,731 | |
Enel S.p.A.
8.750%, due 9/24/73 (a)(c) | | | 400,000 | | | | 476,000 | |
| † | Percentages indicated are based on Portfolio net assets. |
| ¨ | | Among the Portfolio’s 10 largest holdings or issuers held, as of June 30, 2017, excluding short-term investments. May be subject to change daily. |
| ∎ | | Among the Portfolio’s 5 largest short positions as of June 30, 2017. May be subject to change daily. |
| | | | |
| 12 | | MainStay VP Absolute Return Multi-Strategy Portfolio | | The notes to the financial statements are an integral part of,
and should be read in conjunction with, the financial statements. |
| | | | | | | | |
| | | Principal
Amount | | | Value | |
| Corporate Bonds (continued) | |
Electric (continued) | |
Gas Natural Fenosa Finance B.V.
Series Reg S
4.125%, due 11/29/49 (a) | | EUR | 1,400,000 | | | $ | 1,724,574 | |
Tennet Holding B.V.
Series Reg S
2.995%, due 12/31/99 (a) | | | 100,000 | | | | 117,070 | |
| | | | | | | | |
| | | | | | | 3,386,252 | |
| | | | | | | | |
Electrical Components & Equipment 0.0%‡ | |
Senvion Holding GmbH
Series Reg S
3.875%, due 10/25/22 | | | 190,000 | | | | 220,806 | |
| | | | | | | | |
| | |
Engineering & Construction 0.2% | | | | | | | | |
SPIE S.A.
Series Reg S
3.125%, due 3/22/24 | | | 900,000 | | | | 1,070,450 | |
| | | | | | | | |
| | |
Food 0.4% | | | | | | | | |
Albertsons Cos. LLC / Safeway, Inc. / New Albertson’s, Inc. / Albertson’s LLC
5.750%, due 3/15/25 (c) | | $ | 140,000 | | | | 130,200 | |
Barry Callebaut Services N.V.
5.500%, due 6/15/23 (c) | | | 200,000 | | | | 216,380 | |
Casino Guichard Perrachon S.A.
Series Reg S
1.865%, due 6/13/22 | | EUR | 500,000 | | | | 576,808 | |
Kraft Heinz Foods Co.
2.800%, due 7/2/20 | | $ | 300,000 | | | | 304,487 | |
Nomad Foods Bondco PLC
Series Reg S
3.250%, due 5/15/24 | | EUR | 600,000 | | | | 697,078 | |
Tyson Foods, Inc.
3.950%, due 8/15/24 | | $ | 490,000 | | | | 512,745 | |
| | | | | | | | |
| | | | | | | 2,437,698 | |
| | | | | | | | |
Food Services 0.1% | | | | | | | | |
Aramark Services, Inc.
5.125%, due 1/15/24 | | | 600,000 | | | | 630,750 | |
| | | | | | | | |
| | |
Forest Products & Paper 0.2% | | | | | | | | |
Smurfit Kappa Acquisitions Unlimited Co. | | | | | | | | |
Series Reg S
2.375%, due 2/1/24 | | EUR | 560,000 | | | | 654,507 | |
Series Reg S
2.750%, due 2/1/25 | | | 200,000 | | | | 235,625 | |
| | | | | | | | |
| | | | | | | 890,132 | |
| | | | | | | | |
| | | | | | | | |
| | | Principal
Amount | | | Value | |
Health Care—Products 0.3% | | | | | | | | |
Boston Scientific Corp.
2.850%, due 5/15/20 | | $ | 480,000 | | | $ | 486,657 | |
Hologic, Inc.
5.250%, due 7/15/22 (c) | | | 1,060,000 | | | | 1,113,000 | |
| | | | | | | | |
| | | | | | | 1,599,657 | |
| | | | | | | | |
Health Care—Services 0.5% | | | | | | | | |
DaVita, Inc. | | | | | | | | |
5.000%, due 5/1/25 | | | 450,000 | | | | 451,125 | |
5.750%, due 8/15/22 | | | 690,000 | | | | 708,975 | |
Fresenius Medical Care U.S. Finance II, Inc.
4.750%, due 10/15/24 (c) | | | 420,000 | | | | 441,000 | |
HCA, Inc.
5.875%, due 3/15/22 | | | 625,000 | | | | 692,969 | |
Laboratory Corporation of America Holdings
2.625%, due 2/1/20 | | | 480,000 | | | | 483,953 | |
| | | | | | | | |
| | | | | | | 2,778,022 | |
| | | | | | | | |
Home Builders 0.0%‡ | | | | | | | | |
TRI Pointe Group, Inc. / TRI Pointe Homes, Inc.
5.875%, due 6/15/24 | | | 250,000 | | | | 263,750 | |
| | | | | | | | |
| | |
Household Products & Wares 0.3% | | | | | | | | |
Spectrum Brands, Inc. | | | | | | | | |
Series Reg S
4.000%, due 10/1/26 | | EUR | 1,000,000 | | | | 1,186,420 | |
6.625%, due 11/15/22 | | $ | 276,000 | | | | 289,110 | |
| | | | | | | | |
| | | | | | | 1,475,530 | |
| | | | | | | | |
Internet 0.2% | | | | | | | | |
Netflix, Inc.
Series Reg S
3.625%, due 5/15/27 | | EUR | 900,000 | | | | 1,044,638 | |
VeriSign, Inc.
4.750%, due 7/15/27 (c) | | $ | 215,000 | | | | 217,419 | |
| | | | | | | | |
| | | | | | | 1,262,057 | |
| | | | | | | | |
Lodging 0.2% | | | | | | | | |
Hilton Domestic Operating Co., Inc.
4.250%, due 9/1/24 (c) | | | 425,000 | | | | 430,844 | |
NH Hotel Group S.A.
Series Reg S
3.750%, due 10/1/23 | | EUR | 350,000 | | | | 421,566 | |
| | | | | | | | |
| | | | | | | 852,410 | |
| | | | | | | | |
Media 1.4% | | | | | | | | |
Altice Luxembourg S.A. | | | | | | | | |
Series Reg S
7.250%, due 5/15/22 | | | 450,000 | | | | 545,062 | |
7.750%, due 5/15/22 (c) | | $ | 1,100,000 | | | | 1,167,375 | |
| | | | | | |
The notes to the financial statements are an integral part of,
and should be read in conjunction with, the financial statements. | | | | | 13 | |
Consolidated Portfolio of Investments June 30, 2017 (Unaudited) (continued)
| | | | | | | | |
| | | Principal
Amount | | | Value | |
| Corporate Bonds (continued) | |
Media (continued) | | | | | | | | |
CCO Holdings LLC / CCO Holdings Capital Corp. (c) | | | | | | | | |
5.875%, due 4/1/24 | | $ | 200,000 | | | $ | 213,500 | |
5.875%, due 5/1/27 | | | 525,000 | | | | 561,094 | |
CSC Holdings LLC
10.875%, due 10/15/25 (c) | | | 850,000 | | | | 1,023,188 | |
SFR Group S.A.
6.000%, due 5/15/22 (c) | | | 800,000 | | | | 837,000 | |
Sirius XM Radio, Inc. (c) | | | | | | | | |
3.875%, due 8/1/22 | | | 253,000 | | | | 254,978 | |
5.000%, due 8/1/27 | | | 220,000 | | | | 221,650 | |
5.750%, due 8/1/21 | | | 900,000 | | | | 929,250 | |
6.000%, due 7/15/24 | | | 200,000 | | | | 212,500 | |
Unitymedia Hessen GmbH & Co. KG / Unitymedia NRW GmbH
5.500%, due 1/15/23 (c) | | | 180,000 | | | | 186,750 | |
Virgin Media Secured Finance PLC
5.500%, due 1/15/25 (c) | | | 850,000 | | | | 884,000 | |
Ziggo Secured Finance B.V.
Series Reg S
4.250%, due 1/15/27 | | EUR | 900,000 | | | | 1,087,821 | |
| | | | | | | | |
| | | | | | | 8,124,168 | |
| | | | | | | | |
Metal Fabricate & Hardware 0.1% | | | | | | | | |
Vallourec S.A.
Series Reg S
2.250%, due 9/30/24 | | | 400,000 | | | | 363,156 | |
| | | | | | | | |
| | |
Miscellaneous—Manufacturing 0.1% | | | | | | | | |
Colfax Corp.
Series Reg S
3.250%, due 5/15/25 | | | 500,000 | | | | 582,496 | |
| | | | | | | | |
| | |
Oil & Gas 0.2% | | | | | | | | |
Concho Resources, Inc. | | | | | | | | |
5.500%, due 10/1/22 | | $ | 240,000 | | | | 246,300 | |
5.500%, due 4/1/23 | | | 325,000 | | | | 333,937 | |
Continental Resources, Inc.
5.000%, due 9/15/22 | | | 175,000 | | | | 171,719 | |
Petrobras Global Finance B.V.
7.375%, due 1/17/27 | | | 265,000 | | | | 280,370 | |
| | | | | | | | |
| | | | | | | 1,032,326 | |
| | | | | | | | |
Packaging & Containers 0.7% | | | | | | | | |
Ardagh Packaging Finance PLC / Ardagh Holdings USA, Inc.
Series Reg S
6.750%, due 5/15/24 | | EUR | 900,000 | | | | 1,147,432 | |
¨Ball Corp.
4.375%, due 12/15/23 | | | 1,500,000 | | | | 1,938,085 | |
| | | | | | | | |
| | | Principal
Amount | | | Value | |
Packaging & Containers (continued) | | | | | | | | |
Sealed Air Corp.
4.875%, due 12/1/22 (c) | | $ | 1,000,000 | | | $ | 1,065,000 | |
| | | | | | | | |
| | | | | | | 4,150,517 | |
| | | | | | | | |
Pharmaceuticals 0.2% | | | | | | | | |
Grifols S.A.
Series Reg S
3.200%, due 5/1/25 | | EUR | 900,000 | | | | 1,029,771 | |
| | | | | | | | |
| | |
Pipelines 0.2% | | | | | | | | |
Cheniere Corpus Christi Holdings LLC | | | | | | | | |
5.125%, due 6/30/27 (c) | | $ | 300,000 | | | | 307,500 | |
7.000%, due 6/30/24 | | | 600,000 | | | | 667,500 | |
| | | | | | | | |
| | | | | | | 975,000 | |
| | | | | | | | |
Private Equity 0.0%‡ | | | | | | | | |
Icahn Enterprises, L.P. / Icahn Enterprises Finance Corp.
5.875%, due 2/1/22 | | | 240,000 | | | | 245,700 | |
| | | | | | | | |
| | |
Real Estate Investment Trusts 0.1% | | | | | | | | |
Equinix, Inc. | | | | | | | | |
5.375%, due 1/1/22 | | | 300,000 | | | | 316,500 | |
5.375%, due 4/1/23 | | | 500,000 | | | | 519,375 | |
| | | | | | | | |
| | | | | | | 835,875 | |
| | | | | | | | |
Retail 1.1% | | | | | | | | |
¨B.C. ULC / New Red Finance, Inc. (c) | | | | | | | | |
4.250%, due 5/15/24 | | | 465,000 | | | | 462,066 | |
4.625%, due 1/15/22 | | | 2,000,000 | | | | 2,050,000 | |
AutoNation, Inc.
3.350%, due 1/15/21 | | | 400,000 | | | | 407,243 | |
Dollar Tree, Inc.
5.750%, due 3/1/23 | | | 1,600,000 | | | | 1,688,480 | |
KFC Holding Co. / Pizza Hut Holdings LLC / Taco Bell of America LLC (c) | | | | | | | | |
4.750%, due 6/1/27 | | | 170,000 | | | | 173,612 | |
5.000%, due 6/1/24 | | | 750,000 | | | | 781,875 | |
5.250%, due 6/1/26 | | | 280,000 | | | | 294,700 | |
Mobilux Finance S.A.S.
Series Reg S
5.500%, due 11/15/24 | | EUR | 420,000 | | | | 506,972 | |
| | | | | | | | |
| | | | | | | 6,364,948 | |
| | | | | | | | |
Software 0.2% | | | | | | | | |
Quintiles IMS, Inc.
Series Reg S
3.250%, due 3/15/25 | | | 800,000 | | | | 928,690 | |
| | | | | | | | |
| | |
Telecommunications 0.6% | | | | | | | | |
Nokia OYJ | | | | | | | | |
Series Reg S
2.000%, due 3/15/24 | | | 760,000 | | | | 882,940 | |
| | | | |
| 14 | | MainStay VP Absolute Return Multi-Strategy Portfolio | | The notes to the financial statements are an integral part of,
and should be read in conjunction with, the financial statements. |
| | | | | | | | |
| | | Principal
Amount | | | Value | |
| Corporate Bonds (continued) | |
Telecommunications (continued) | | | | | | | | |
Nokia OYJ (continued) | | | | | | | | |
3.375%, due 6/12/22 | | $ | 410,000 | | | $ | 413,116 | |
4.375%, due 6/12/27 | | | 348,000 | | | | 354,309 | |
Sprint Communications, Inc.
9.000%, due 11/15/18 (c) | | | 278,000 | | | | 301,716 | |
T-Mobile USA, Inc. | | | | | | | | |
6.375%, due 3/1/25 | | | 235,000 | | | | 254,094 | |
6.836%, due 4/28/23 | | | 200,000 | | | | 213,500 | |
Telecom Italia Capital S.A.
6.999%, due 6/4/18 | | | 200,000 | | | | 208,750 | |
Telefonica Europe B.V.
Series Reg S
3.750%, due 12/29/49 (a) | | EUR | 600,000 | | | | 714,415 | |
Telia Co. AB
Series Reg S
3.000%, due 4/4/78 (a) | | | 300,000 | | | | 352,505 | |
| | | | | | | | |
| | | | | | | 3,695,345 | |
| | | | | | | | |
Total Corporate Bonds
(Cost $58,555,607) | | | | | | | 60,567,908 | |
| | | | | | | | |
| |
| Foreign Bonds 4.4% | | | | | |
Belgium 0.1% | | | | | | | | |
Ontex Group N.V.
Series Reg S
4.750%, due 11/15/21 | | | 530,000 | | | | 626,768 | |
| | | | | | | | |
| | |
France 1.2% | | | | | | | | |
Accor S.A.
Series Reg S
4.125%, due 6/30/49 (a) | | | 800,000 | | | | 964,246 | |
Crown European Holdings S.A.
Series Reg S
3.375%, due 5/15/25 | | | 650,000 | | | | 769,532 | |
HomeVi S.A.S.
Series Reg S
6.875%, due 8/15/21 | | | 780,000 | | | | 925,086 | |
PSA Tresorerie GIE
6.000%, due 9/19/33 | | | 330,000 | | | | 473,021 | |
Rexel S.A.
Series Reg S
3.500%, due 6/15/23 | | | 950,000 | | | | 1,133,869 | |
Solvay Finance S.A.
Series Reg S
5.869%, due 12/29/49 (a) | | | 1,050,000 | | | | 1,400,133 | |
TOTAL S.A.
Series Reg S
3.875%, due 12/29/49 (a) | | | 100,000 | | | | 123,117 | |
| | | | | | | | |
| | | Principal
Amount | | | Value | |
France (continued) | | | | | | | | |
Veolia Environnement S.A.
Series Reg S
4.850%, due 1/29/49 (a) | | GBP | 600,000 | | | $ | 799,053 | |
| | | | | | | | |
| | | | | | | 6,588,057 | |
| | | | | | | | |
Germany 0.9% | | | | | | | | |
Kirk Beauty One GmbH
Series Reg S
8.750%, due 7/15/23 | | EUR | 450,000 | | | | 560,410 | |
Techem Energy Metering Service GmbH & Co. KG
Series Reg S
7.875%, due 10/1/20 | | | 1,350,000 | | | | 1,599,492 | |
Trionista Holdco GmbH
Series Reg S
5.000%, due 4/30/20 | | | 400,000 | | | | 463,170 | |
Trionista TopCo GmbH
Series Reg S
6.875%, due 4/30/21 | | | 1,000,000 | | | | 1,186,008 | |
Unitymedia Hessen GmbH & Co. KG / Unitymedia NRW GmbH | | | | | | | | |
Series Reg S
5.125%, due 1/21/23 | | | 257,337 | | | | 307,120 | |
Series Reg S
5.500%, due 9/15/22 | | | 688,500 | | | | 815,340 | |
| | | | | | | | |
| | | | | | | 4,931,540 | |
| | | | | | | | |
Ireland 0.1% | | | | | | | | |
Ardagh Packaging Finance PLC / Ardagh Holdings USA, Inc. | | | | | | | | |
Series Reg S
4.125%, due 5/15/23 | | | 110,000 | | | | 133,073 | |
Series Reg S
4.250%, due 1/15/22 | | | 192,857 | | | | 225,250 | |
| | | | | | | | |
| | | | | | | 358,323 | |
| | | | | | | | |
Italy 0.2% | | | | | | | | |
Enel S.p.A.
Series Reg S
7.750%, due 9/10/75 (a) | | GBP | 650,000 | | | | 960,882 | |
LKQ Italia Bondco S.p.A.
Series Reg S
3.875%, due 4/1/24 | | EUR | 200,000 | | | | 246,819 | |
| | | | | | | | |
| | | | | | | 1,207,701 | |
| | | | | | | | |
Luxembourg 0.3% | | | | | | | | |
Dufry Finance SCA
Series Reg S
4.500%, due 8/1/23 | | | 1,350,000 | | | | 1,644,053 | |
Gestamp Funding Luxembourg S.A.
Series Reg S
3.500%, due 5/15/23 | | | 300,000 | | | | 357,201 | |
| | | | | | | | |
| | | | | | | 2,001,254 | |
| | | | | | | | |
| | | | | | |
The notes to the financial statements are an integral part of,
and should be read in conjunction with, the financial statements. | | | | | 15 | |
Consolidated Portfolio of Investments June 30, 2017 (Unaudited) (continued)
| | | | | | | | |
| | | Principal
Amount | | | Value | |
| Foreign Bonds (continued) | |
Netherlands 0.8% | | | | | | | | |
InterXion Holding N.V.
Series Reg S
6.000%, due 7/15/20 | | EUR | 900,000 | | | $ | 1,061,486 | |
Telefonica Europe B.V.
Series Reg S
5.000%, due 3/31/49 (a) | | | 600,000 | | | | 742,065 | |
Vonovia Finance B.V.
Series Reg S
4.625%, due 4/8/74 (a) | | | 1,400,000 | | | | 1,692,104 | |
Ziggo Bond Co B.V.
Series Reg S
7.125%, due 5/15/24 | | | 965,000 | | | | 1,235,698 | |
| | | | | | | | |
| | | | | | | 4,731,353 | |
| | | | | | | | |
Spain 0.1% | | | | | | | | |
Cellnex Telecom S.A.
Series Reg S
2.375%, due 1/16/24 | | | 600,000 | | | | 701,570 | |
| | | | | | | | |
| | |
Sweden 0.1% | | | | | | | | |
Verisure Holding AB
Series Reg S
6.000%, due 11/1/22 | | | 405,000 | | | | 502,759 | |
| | | | | | | | |
| | |
United Kingdom 0.6% | | | | | | | | |
Alliance Automotive Finance PLC
Series Reg S
6.250%, due 12/1/21 | | | 700,000 | | | | 837,225 | |
¨Synlab Bondco PLC
Series Reg S
6.250%, due 7/1/22 | | | 1,700,000 | | | | 2,101,647 | |
Worldpay Finance PLC
Series Reg S
3.750%, due 11/15/22 | | | 600,000 | | | | 744,211 | |
| | | | | | | | |
| | | | | | | 3,683,083 | |
| | | | | | | | |
Total Foreign Bonds
(Cost $23,835,090) | | | | | | | 25,332,408 | |
| | | | | | | | |
Total Long-Term Bonds
(Cost $82,390,697) | | | | | | | 85,900,316 | |
| | | | | | | | |
| | |
| | | | | | | | |
| | |
| | | Shares | | | | |
| Common Stocks 28.0% | | | | | | | | |
Advertising 0.0% ‡ | | | | | | | | |
IPSOS (d) | | | 293 | | | | 10,993 | |
| | | | | | | | |
| | | | | | | | |
| | |
Shares | | | Value | |
Aerospace & Defense 0.2% | | | | | | | | |
Leonardo S.p.A. (d) | | | 19,035 | | | $ | 316,329 | |
Spirit AeroSystems Holdings, Inc.
Class A (d) | | | 12,000 | | | | 695,280 | |
| | | | | | | | |
| | | | | | | 1,011,609 | |
| | | | | | | | |
Agriculture 0.2% | | | | | | | | |
Bunge, Ltd. (d) | | | 8,100 | | | | 604,260 | |
Universal Corp. (d) | | | 8,300 | | | | 537,010 | |
| | | | | | | | |
| | | | | | | 1,141,270 | |
| | | | | | | | |
Airlines 0.3% | | | | | | | | |
Air France-KLM (d)(e) | | | 48,631 | | | | 693,465 | |
Air New Zealand, Ltd. | | | 72,460 | | | | 173,102 | |
Deutsche Lufthansa A.G., Registered (d) | | | 33,964 | | | | 772,930 | |
| | | | | | | | |
| | | | | | | 1,639,497 | |
| | | | | | | | |
Apparel 0.2% | | | | | | | | |
Christian Dior S.E. | | | 3,480 | | | | 995,061 | |
Crocs, Inc. (d)(e) | | | 14,000 | | | | 107,940 | |
| | | | | | | | |
| | | | | | | 1,103,001 | |
| | | | | | | | |
Auto Manufacturers 0.3% | | | | | | | | |
Fiat Chrysler Automobiles N.V. (d)(e) | | | 59,939 | | | | 631,880 | |
Peugeot S.A. (d) | | | 31,534 | | | | 629,029 | |
Wabash National Corp. (d) | | | 27,200 | | | | 597,856 | |
| | | | | | | | |
| | | | | | | 1,858,765 | |
| | | | | | | | |
Auto Parts & Equipment 0.3% | | | | | | | | |
Haldex AB (e) | | | 123,864 | | | | 1,558,463 | |
| | | | | | | | |
|
Banks 1.3% | |
Aldermore Group PLC (e) | | | 179,040 | | | | 506,723 | |
Banca Generali S.p.A. | | | 18,841 | | | | 560,791 | |
Bendigo & Adelaide Bank, Ltd. | | | 61,086 | | | | 520,214 | |
BGEO Group PLC (d) | | | 9,709 | | | | 441,833 | |
BNP Paribas S.A. (d) | | | 4,831 | | | | 347,948 | |
Customers Bancorp, Inc. (d)(e) | | | 19,400 | | | | 548,632 | |
Deutsche Pfandbriefbank A.G. (c)(d) | | | 43,671 | | | | 538,442 | |
First BanCorp (d)(e) | | | 105,900 | | | | 613,161 | |
Franklin Financial Network, Inc. (d)(e) | | | 10,800 | | | | 445,500 | |
Investec PLC (d) | | | 75,015 | | | | 560,328 | |
Mediobanca S.p.A. (d) | | | 40,546 | | | | 400,115 | |
OFG Bancorp (d) | | | 38,400 | | | | 384,000 | |
OneSavings Bank PLC | | | 109,149 | | | | 533,104 | |
Raiffeisen Bank International A.G. (d)(e) | | | 25,046 | | | | 632,199 | |
Virgin Money Holdings UK PLC | | | 44,099 | | | | 153,356 | |
| | | | | | | | |
| | | | | | | 7,186,346 | |
| | | | | | | | |
Beverages 0.1% | | | | | | | | |
Coca-Cola Bottling Co. Consolidated (d) | | | 2,400 | | | | 549,288 | |
| | | | | | | | |
|
Biotechnology 0.0%‡ | |
CSL, Ltd. | | | 661 | | | | 70,125 | |
Probi AB | | | 848 | | | | 58,381 | |
| | | | | | | | |
| | | | | | | 128,506 | |
| | | | | | | | |
| | | | |
| 16 | | MainStay VP Absolute Return Multi-Strategy Portfolio | | The notes to the financial statements are an integral part of,
and should be read in conjunction with, the financial statements. |
| | | | | | | | |
| | |
Shares | | | Value | |
| Common Stocks (continued) | |
Building Materials 0.3% | | | | | | | | |
Buzzi Unicem S.p.A. | | | 28,986 | | | $ | 412,505 | |
Cementir Holding S.p.A. | | | 9,259 | | | | 55,203 | |
CSR, Ltd. | | | 174,527 | | | | 567,418 | |
Ibstock PLC (c) | | | 6,951 | | | | 22,235 | |
Inwido AB | | | 28,549 | | | | 401,564 | |
Polypipe Group PLC | | | 42,687 | | | | 212,550 | |
| | | | | | | | |
| | | | | | | 1,671,475 | |
| | | | | | | | |
Chemicals 0.9% | | | | | | | | |
Chemours Co. (d) | | | 13,800 | | | | 523,296 | |
Covestro A.G. (c)(d) | | | 8,757 | | | | 632,214 | |
Huntsman Corp. (d) | | | 27,000 | | | | 697,680 | |
Incitec Pivot, Ltd. | | | 45,858 | | | | 120,190 | |
Lenzing A.G. (d) | | | 2,268 | | | | 406,433 | |
Monsanto Co. | | | 13,732 | | | | 1,625,320 | |
Mosaic Co. (d) | | | 28,300 | | | | 646,089 | |
Rayonier Advanced Materials, Inc. (d) | | | 31,100 | | | | 488,892 | |
| | | | | | | | |
| | | | | | | 5,140,114 | |
| | | | | | | | |
Commercial Services 1.3% | | | | | | | | |
ASTM S.p.A. | | | 8,281 | | | | 143,102 | |
Avis Budget Group, Inc. (d)(e) | | | 22,000 | | | | 599,940 | |
Barrett Business Services, Inc. (d) | | | 4,000 | | | | 229,160 | |
Brink’s Co. (d) | | | 8,900 | | | | 596,300 | |
CoreLogic, Inc. (d)(e) | | | 200 | | | | 8,676 | |
Cross Country Healthcare, Inc. (d)(e) | | | 9,800 | | | | 126,518 | |
Euronet Worldwide, Inc. (d)(e) | | | 7,600 | | | | 664,012 | |
Herc Holdings, Inc. (d)(e) | | | 14,100 | | | | 554,412 | |
INC Research Holdings, Inc. Class A (d)(e) | | | 9,600 | | | | 561,600 | |
K12, Inc. (d)(e) | | | 29,100 | | | | 521,472 | |
LSC Communications, Inc. (d) | | | 7,800 | | | | 166,920 | |
¨MoneyGram International, Inc. (d)(e) | | | 132,554 | | | | 2,286,556 | |
Quad/Graphics, Inc. (d) | | | 6,000 | | | | 137,520 | |
R.R. Donnelley & Sons Co. (d) | | | 50,300 | | | | 630,762 | |
TrueBlue, Inc. (d)(e) | | | 6,400 | | | | 169,600 | |
| | | | | | | | |
| | | | | | | 7,396,550 | |
| | | | | | | | |
Computers 0.5% | | | | | | | | |
Carbonite, Inc. (d)(e) | | | 15,800 | | | | 344,440 | |
Computershare, Ltd. | | | 59,726 | | | | 649,102 | |
CSRA, Inc. (d) | | | 21,800 | | | | 692,150 | |
NCR Corp. (d)(e) | | | 6,200 | | | | 253,208 | |
Western Digital Corp. (d) | | | 7,400 | | | | 655,640 | |
| | | | | | | | |
| | | | | | | 2,594,540 | |
| | | | | | | | |
Cosmetics & Personal Care 0.1% | | | | | | | | |
Avon Products, Inc. (e) | | | 159,200 | | | | 604,960 | |
| | | | | | | | |
|
Distribution & Wholesale 0.2% | |
D’ieteren S.A. | | | 6,291 | | | | 294,021 | |
Entertainment One, Ltd. | | | 89,600 | | | | 257,206 | |
| | | | | | | | |
| | |
Shares | | | Value | |
Distribution & Wholesale (continued) | | | | | | | | |
Essendant, Inc. (d) | | | 15,700 | | | $ | 232,831 | |
Veritiv Corp. (d)(e) | | | 5,000 | | | | 225,000 | |
| | | | | | | | |
| | | | | | | 1,009,058 | |
| | | | | | | | |
Diversified Financial Services 0.5% | | | | | | | | |
Banca IFIS S.p.A. | | | 604 | | | | 24,538 | |
Deutsche Boerse A.G. | | | 3,986 | | | | 420,752 | |
Enova International, Inc. (d)(e) | | | 41,100 | | | | 610,335 | |
Genworth Mortgage Insurance Australia, Ltd. | | | 241,653 | | | | 544,202 | |
INTL. FCStone, Inc. (d)(e) | | | 14,800 | | | | 558,848 | |
LPL Financial Holdings, Inc. (d) | | | 16,800 | | | | 713,328 | |
OM Asset Management PLC (d) | | | 15,900 | | | | 236,274 | |
| | | | | | | | |
| | | | | | | 3,108,277 | |
| | | | | | | | |
Electrical Components & Equipment 0.2% | |
General Cable Corp. (d) | | | 32,700 | | | | 534,645 | |
Leoni A.G. (d) | | | 9,582 | | | | 493,304 | |
| | | | | | | | |
| | | | | | | 1,027,949 | |
| | | | | | | | |
Electronics 0.4% | |
El.En. S.p.A. | | | 9,853 | | | | 313,300 | |
Electrocomponents PLC (d) | | | 24,489 | | | | 184,038 | |
Jabil, Inc. (d) | | | 21,700 | | | | 633,423 | |
TTM Technologies, Inc. (d)(e) | | | 33,800 | | | | 586,768 | |
Venture Corp., Ltd. | | | 60,400 | | | | 528,651 | |
| | | | | | | | |
| | | | | | | 2,246,180 | |
| | | | | | | | |
Energy—Alternate Sources 0.2% | |
Green Plains, Inc. (d) | | | 11,400 | | | | 234,270 | |
Renewable Energy Group, Inc. (d)(e) | | | 11,500 | | | | 148,925 | |
Vestas Wind Systems A/S (d) | | | 7,342 | | | | 677,773 | |
| | | | | | | | |
| | | | | | | 1,060,968 | |
| | | | | | | | |
Engineering & Construction 0.3% | |
Astaldi S.p.A. | | | 87,428 | | | | 544,214 | |
Bouygues S.A. | | | 21,357 | | | | 900,586 | |
Carillion PLC | | | 1,672 | | | | 4,068 | |
Monadelphous Group, Ltd. | | | 40,160 | | | | 431,829 | |
| | | | | | | | |
| | | | | | | 1,880,697 | |
| | | | | | | | |
Entertainment 0.3% | |
Genting Singapore PLC | | | 787,800 | | | | 620,856 | |
International Game Technology PLC (d) | | | 32,600 | | | | 596,580 | |
William Hill PLC | | | 85,296 | | | | 282,400 | |
| | | | | | | | |
| | | | | | | 1,499,836 | |
| | | | | | | | |
Environmental Controls 0.0%‡ | |
Derichebourg S.A. | | | 10,542 | | | | 89,100 | |
| | | | | | | | |
| | |
Food 0.5% | | | | | | | | |
Austevoll Seafood ASA | | | 47,627 | | | | 405,033 | |
Casino Guichard Perrachon S.A. | | | 6,734 | | | | 398,867 | |
Flowers Foods, Inc. (d) | | | 33,900 | | | | 586,809 | |
Norway Royal Salmon ASA | | | 1,248 | | | | 19,059 | |
| | | | | | |
The notes to the financial statements are an integral part of,
and should be read in conjunction with, the financial statements. | | | | | 17 | |
Consolidated Portfolio of Investments June 30, 2017 (Unaudited) (continued)
| | | | | | | | |
| | |
Shares | | | Value | |
| Common Stocks (continued) | |
Food (continued) | |
Salmar ASA (d) | | | 71 | | | $ | 1,761 | |
Tyson Foods, Inc. Class A (d) | | | 11,400 | | | | 713,982 | |
Whole Foods Market, Inc. | | | 11,480 | | | | 483,423 | |
| | | | | | | | |
| | | | | | | 2,608,934 | |
| | | | | | | | |
Forest Products & Paper 0.2% | | | | | | | | |
Ence Energia y Celulosa S.A. | | | 84,560 | | | | 346,723 | |
UPM-Kymmene OYJ (d) | | | 24,053 | | | | 685,704 | |
| | | | | | | | |
| | | | | | | 1,032,427 | |
| | | | | | | | |
Gas 0.2% | | | | | | | | |
Western Gas Equity Partners, L.P. | | | 27,800 | | | | 1,195,956 | |
| | | | | | | | |
| | |
Health Care—Products 0.5% | | | | | | | | |
Alere, Inc. (d)(e) | | | 13,500 | | | | 677,565 | |
AngioDynamics, Inc. (d)(e) | | | 24,300 | | | | 393,903 | |
Bruker Corp. (d) | | | 26,000 | | | | 749,840 | |
Integer Holdings Corp. (d)(e) | | | 13,600 | | | | 588,200 | |
Intersect ENT, Inc. (d)(e) | | | 14,500 | | | | 405,275 | |
LeMaitre Vascular, Inc. (d) | | | 5,000 | | | | 156,100 | |
VWR Corp. (d)(e) | | | 2,900 | | | | 95,729 | |
| | | | | | | | |
| | | | | | | 3,066,612 | |
| | | | | | | | |
Health Care—Services 0.5% | |
Centene Corp. (d)(e) | | | 8,800 | | | | 702,944 | |
LHC Group, Inc. (d)(e) | | | 5,400 | | | | 366,606 | |
Molina Healthcare, Inc. (d)(e) | | | 8,300 | | | | 574,194 | |
Providence Service Corp. (d)(e) | | | 6,700 | | | | 339,087 | |
WellCare Health Plans, Inc. (d)(e) | | | 3,800 | | | | 682,328 | |
| | | | | | | | |
| | | | | | | 2,665,159 | |
| | | | | | | | |
Holding Companies—Diversified 0.1% | |
CIR-Compagnie Industriali Riunite S.p.A. | | | 25,227 | | | | 35,440 | |
Seven Group Holdings, Ltd. | | | 64,531 | | | | 542,608 | |
| | | | | | | | |
| | | | | | | 578,048 | |
| | | | | | | | |
Home Builders 0.6% | |
Barratt Developments PLC (d) | | | 84,110 | | | | 617,309 | |
Beazer Homes USA, Inc. (d)(e) | | | 44,700 | | | | 613,284 | |
Crest Nicholson Holdings PLC (d) | | | 2,965 | | | | 20,216 | |
Persimmon PLC (d) | | | 20,812 | | | | 607,730 | |
Redrow PLC (d) | | | 33,170 | | | | 236,316 | |
Taylor Morrison Home Corp. Class A (d)(e) | | | 33,000 | | | | 792,330 | |
Thor Industries, Inc. (d) | | | 7,200 | | | | 752,544 | |
| | | | | | | | |
| | | | | | | 3,639,729 | |
| | | | | | | | |
Home Furnishing 0.0%‡ | |
Hooker Furniture Corp. (d) | | | 1,800 | | | | 74,070 | |
| | | | | | | | |
| | |
Household Products & Wares 0.2% | | | | | | | | |
Central Garden & Pet Co. Class A (d)(e) | | | 6,300 | | | | 189,126 | |
Henkel A.G. & Co. KGaA | | | 6,763 | | | | 818,010 | |
| | | | | | | | |
| | | | | | | 1,007,136 | |
| | | | | | | | |
| | | | | | | | |
| | |
Shares | | | Value | |
Insurance 0.3% | |
Aegon N.V. (d) | | | 130,164 | | | $ | 664,689 | |
NN Group N.V. (d) | | | 18,797 | | | | 668,115 | |
Societa Cattolica di Assicurazioni SCRL | | | 61,897 | | | | 481,437 | |
| | | | | | | | |
| | | | | | | 1,814,241 | |
| | | | | | | | |
Internet 0.6% | | | | | | | | |
1-800-Flowers.com, Inc. Class A (d)(e) | | | 2,500 | | | | 24,375 | |
Atea ASA (e) | | | 7,821 | | | | 104,920 | |
Bankrate, Inc. (d)(e) | | | 39,700 | | | | 510,145 | |
Blucora, Inc. (d)(e) | | | 26,600 | | | | 563,920 | |
Endurance International Group Holdings, Inc. (d)(e) | | | 27,800 | | | | 232,130 | |
FTD Cos., Inc. (d)(e) | | | 5,400 | | | | 108,000 | |
GoDaddy, Inc. Class A (d)(e) | | | 1,800 | | | | 76,356 | |
Groupon, Inc. (e) | | | 218,100 | | | | 837,504 | |
Overstock.com, Inc. (d)(e) | | | 12,500 | | | | 203,750 | |
Yelp, Inc. (d)(e) | | | 23,400 | | | | 702,468 | |
| | | | | | | | |
| | | | | | | 3,363,568 | |
| | | | | | | | |
Investment Companies 0.3% | | | | | | | | |
Asian Pay Television Trust | | | 165,400 | | | | 68,479 | |
EXOR N.V. | | | 26,142 | | | | 1,414,974 | |
John Laing Group PLC (c) | | | 2,803 | | | | 11,062 | |
| | | | | | | | |
| | | | | | | 1,494,515 | |
| | | | | | | | |
Iron & Steel 0.4% | | | | | | | | |
Ferrexpo PLC | | | 249,580 | | | | 674,186 | |
Fortescue Metals Group, Ltd. | | | 185,054 | | | | 742,453 | |
Outokumpu OYJ (d) | | | 61,561 | | | | 491,480 | |
United States Steel Corp. (d) | | | 20,800 | | | | 460,512 | |
| | | | | | | | |
| | | | | | | 2,368,631 | |
| | | | | | | | |
Leisure Time 0.3% | | | | | | | | |
Intrawest Resorts Holdings, Inc. (d)(e) | | | 12,200 | | | | 289,628 | |
Norwegian Cruise Line Holdings, Ltd. (d)(e) | | | 13,200 | | | | 716,628 | |
Royal Caribbean Cruises, Ltd. (d) | | | 5,900 | | | | 644,457 | |
TUI A.G. (d) | | | 2,278 | | | | 33,201 | |
| | | | | | | | |
| | | | | | | 1,683,914 | |
| | | | | | | | |
Lodging 0.2% | | | | | | | | |
Caesars Entertainment Corp. (d)(e) | | | 49,700 | | | | 596,400 | |
Scandic Hotels Group AB (c) | | | 37,579 | | | | 488,433 | |
| | | | | | | | |
| | | | | | | 1,084,833 | |
| | | | | | | | |
Machinery—Construction & Mining 0.1% | | | | | | | | |
Danieli & C Officine Meccaniche S.p.A. | | | 14,493 | | | | 259,554 | |
Oshkosh Corp. (d) | | | 500 | | | | 34,440 | |
Terex Corp. (d) | | | 10,400 | | | | 390,000 | |
| | | | | | | | |
| | | | | | | 683,994 | |
| | | | | | | | |
Machinery—Diversified 0.4% | | | | | | | | |
Bobst Group S.A., Registered | | | 5,481 | | | | 527,580 | |
DXP Enterprises, Inc. (d)(e) | | | 15,000 | | | | 517,500 | |
Ichor Holdings, Ltd. (d)(e) | | | 20,100 | | | | 405,216 | |
Pfeiffer Vacuum Technology A.G. | | | 5,743 | | | | 840,583 | |
| | | | | | | | |
| | | | | | | 2,290,879 | |
| | | | | | | | |
| | | | |
| 18 | | MainStay VP Absolute Return Multi-Strategy Portfolio | | The notes to the financial statements are an integral part of,
and should be read in conjunction with, the financial statements. |
| | | | | | | | |
| | |
Shares | | | Value | |
| Common Stocks (continued) | |
Media 0.1% | | | | | | | | |
Nine Entertainment Co. Holdings, Ltd. | | | 57,322 | | | $ | 60,799 | |
Sanoma OYJ | | | 2,464 | | | | 23,021 | |
tronc, Inc. (d)(e) | | | 27,600 | | | | 355,764 | |
| | | | | | | | |
| | | | | | | 439,584 | |
| | | | | | | | |
Metal Fabricate & Hardware 0.2% | | | | | | | | |
Global Brass & Copper Holdings, Inc. (d) | | | 17,900 | | | | 546,845 | |
Sims Metal Management, Ltd. | | | 55,175 | | | | 643,746 | |
| | | | | | | | |
| | | | | | | 1,190,591 | |
| | | | | | | | |
Mining 0.9% | | | | | | | | |
Acacia Mining PLC | | | 39,871 | | | | 154,699 | |
BHP Billiton PLC (d) | | | 13,713 | | | | 210,039 | |
Dominion Diamond Corp. | | | 104,400 | | | | 1,311,264 | |
Mineral Resources, Ltd. | | | 57,692 | | | | 481,112 | |
Newmont Mining Corp. (d) | | | 7,000 | | | | 226,730 | |
Norsk Hydro ASA | | | 91,215 | | | | 505,636 | |
Regis Resources, Ltd. | | | 173,370 | | | | 503,693 | |
Rio Tinto PLC (d) | | | 16,296 | | | | 688,105 | |
Rio Tinto, Ltd. | | | 13,989 | | | | 680,276 | |
South32, Ltd. | | | 38,473 | | | | 79,249 | |
St. Barbara, Ltd. (e) | | | 178,957 | | | | 400,260 | |
| | | | | | | | |
| | | | | | | 5,241,063 | |
| | | | | | | | |
Miscellaneous—Manufacturing 0.2% | | | | | | | | |
AGFA-Gevaert N.V. (e) | | | 61,776 | | | | 300,575 | |
Fenner PLC | | | 110,476 | | | | 411,883 | |
Trinity Industries, Inc. (d) | | | 8,800 | | | | 246,664 | |
Vesuvius PLC (d) | | | 52,604 | | | | 363,467 | |
| | | | | | | | |
| | | | | | | 1,322,589 | |
| | | | | | | | |
Office & Business Equipment 0.2% | | | | | | | | |
Neopost S.A. (d) | | | 12,541 | | | | 582,258 | |
Pitney Bowes, Inc. (d) | | | 43,600 | | | | 658,360 | |
| | | | | | | | |
| | | | | | | 1,240,618 | |
| | | | | | | | |
Oil & Gas 1.0% | | | | | | | | |
Alon USA Energy, Inc. (d) | | | 23,400 | | | | 311,688 | |
Antero Midstream Partners, L.P. (d) | | | 25,500 | | | | 846,090 | |
Beach Energy, Ltd. | | | 645,045 | | | | 285,074 | |
CVR Energy, Inc. (d) | | | 15,500 | | | | 337,280 | |
Delek U.S. Holdings, Inc. (d) | | | 12,600 | | | | 333,144 | |
EnQuest PLC (e) | | | 625,933 | | | | 258,841 | |
Ensco PLC Class A (d) | | | 55,400 | | | | 285,864 | |
EQT GP Holdings, L.P. (d) | | | 36,100 | | | | 1,088,415 | |
HollyFrontier Corp. (d) | | | 1,300 | | | | 35,711 | |
QEP Resources, Inc. (d)(e) | | | 33,600 | | | | 339,360 | |
Rowan Cos. PLC Class A (d)(e) | | | 14,400 | | | | 147,456 | |
Saras S.p.A. | | | 124,269 | | | | 289,261 | |
Southwestern Energy Co. (d)(e) | | | 43,700 | | | | 265,696 | |
Transocean, Ltd. (d)(e) | | | 37,600 | | | | 309,448 | |
Whiting Petroleum Corp. (d)(e) | | | 35,600 | | | | 196,156 | |
| | | | | | | | |
| | |
Shares | | | Value | |
Oil & Gas (continued) | | | | | | | | |
Woodside Petroleum, Ltd. | | | 14,518 | | | $ | 333,306 | |
| | | | | | | | |
| | | | | | | 5,662,790 | |
| | | | | | | | |
Oil & Gas Services 1.4% | | | | | | | | |
¨Baker Hughes, Inc. (d) | | | 36,810 | | | | 2,006,513 | |
Exterran Corp. (d)(e) | | | 19,600 | | | | 523,320 | |
Halliburton Co. | | | 23,110 | | | | 987,028 | |
Maire Tecnimont S.p.A. | | | 133,460 | | | | 620,091 | |
McDermott International, Inc. (d)(e) | | | 83,900 | | | | 601,563 | |
Oceaneering International, Inc. (d) | | | 26,400 | | | | 602,976 | |
Petrofac, Ltd. (d) | | | 56,759 | | | | 326,752 | |
Rice Midstream Partners, L.P. | | | 56,400 | | | | 1,124,616 | |
Subsea 7 S.A. (d) | | | 37,318 | | | | 501,969 | |
TechnipFMC PLC (e) | | | 36,133 | | | | 979,939 | |
| | | | | | | | |
| | | | | | | 8,274,767 | |
| | | | | | | | |
Pharmaceuticals 1.7% | | | | | | | | |
Akorn, Inc. (e) | | | 18,942 | | | | 635,315 | |
Amphastar Pharmaceuticals, Inc. (d)(e) | | | 32,100 | | | | 573,306 | |
AstraZeneca PLC, Sponsored ADR | | | 11,800 | | | | 402,262 | |
Catalent, Inc. (d)(e) | | | 15,400 | | | | 540,540 | |
Depomed, Inc. (d)(e) | | | 34,600 | | | | 371,604 | |
Diplomat Pharmacy, Inc. (d)(e) | | | 31,700 | | | | 469,160 | |
Endo International PLC (d)(e) | | | 62,000 | | | | 692,540 | |
Heska Corp. (d)(e) | | | 5,400 | | | | 551,178 | |
Horizon Pharma PLC (d)(e) | | | 115,672 | | | | 1,373,027 | |
Impax Laboratories, Inc. (d)(e) | | | 17,200 | | | | 276,920 | |
Mylan N.V. (e) | | | 13,717 | | | | 532,494 | |
Patheon N.V. (e) | | | 11,560 | | | | 403,213 | |
Phibro Animal Health Corp. Class A (d) | | | 15,600 | | | | 577,980 | |
Sanofi (d) | | | 4,541 | | | | 434,421 | |
SciClone Pharmaceuticals, Inc. (d)(e) | | | 32,500 | | | | 357,500 | |
Shire PLC ADR | | | 1,892 | | | | 312,691 | |
Sigma Healthcare, Ltd. | | | 142,298 | | | | 97,886 | |
Sucampo Pharmaceuticals, Inc. Class A (d)(e) | | | 54,200 | | | | 569,100 | |
Supernus Pharmaceuticals, Inc. (d)(e) | | | 11,100 | | | | 478,410 | |
TESARO, Inc. (e) | | | 2,170 | | | | 303,496 | |
| | | | | | | | |
| | | | | | | 9,953,043 | |
| | | | | | | | |
Pipelines 4.4% | | | | | | | | |
Antero Midstream GP, L.P. (e) | | | 46,700 | | | | 1,026,466 | |
Cheniere Energy, Inc. (d)(e) | | | 25,500 | | | | 1,242,105 | |
Dominion Energy Midstream Partners, L.P. (d) | | | 32,800 | | | | 946,280 | |
¨Energy Transfer Equity, L.P. (d) | | | 104,300 | | | | 1,873,228 | |
¨Energy Transfer Partners, L.P. | | | 97,100 | | | | 1,979,869 | |
EnLink Midstream LLC (d) | | | 48,500 | | | | 853,600 | |
Enterprise Products Partners, L.P. (d) | | | 57,300 | | | | 1,551,684 | |
Genesis Energy, L.P. (d) | | | 22,300 | | | | 707,579 | |
Kinder Morgan, Inc. | | | 61,000 | | | | 1,168,760 | |
Magellan Midstream Partners, L.P. (d) | | | 10,900 | | | | 776,843 | |
¨MPLX, L.P. (d) | | | 52,700 | | | | 1,760,180 | |
ONEOK, Inc. | | | 15,900 | | | | 829,344 | |
| | | | | | |
The notes to the financial statements are an integral part of,
and should be read in conjunction with, the financial statements. | | | | | 19 | |
Consolidated Portfolio of Investments June 30, 2017 (Unaudited) (continued)
| | | | | | | | |
| | |
Shares | | | Value | |
| Common Stocks (continued) | |
Pipelines (continued) | | | | | | | | |
Phillips 66 Partners, L.P. (d) | | | 26,500 | | | $ | 1,309,630 | |
Plains GP Holdings, L.P. Class A (e) | | | 24,001 | | | | 627,866 | |
SemGroup Corp. Class A | | | 22,650 | | | | 611,550 | |
Shell Midstream Partners, L.P. (d) | | | 44,900 | | | | 1,360,470 | |
Targa Resources Corp. (d) | | | 36,800 | | | | 1,663,360 | |
Tesoro Logistics, L.P. (d) | | | 24,800 | | | | 1,281,912 | |
Valero Energy Partners, L.P. (d) | | | 29,300 | | | | 1,337,252 | |
¨Williams Cos., Inc. | | | 61,900 | | | | 1,874,332 | |
Williams Partners, L.P. | | | 16,200 | | | | 649,782 | |
| | | | | | | | |
| | | | | | | 25,432,092 | |
| | | | | | | | |
Retail 2.0% | | | | | | | | |
Ascena Retail Group, Inc. (e) | | | 75,000 | | | | 161,250 | |
Best Buy Co., Inc. (d) | | | 11,000 | | | | 630,630 | |
Big Lots, Inc. (d) | | | 7,800 | | | | 376,740 | |
Brinker International, Inc. (d) | | | 1,800 | | | | 68,580 | |
Cewe Stiftung & Co KGaA | | | 2,545 | | | | 214,607 | |
Debenhams PLC | | | 595,747 | | | | 335,590 | |
Dick’s Sporting Goods, Inc. (d) | | | 600 | | | | 23,898 | |
EI Group PLC (e) | | | 194,507 | | | | 325,536 | |
GameStop Corp. Class A (d) | | | 29,600 | | | | 639,656 | |
Gap, Inc. (d) | | | 19,300 | | | | 424,407 | |
HSN, Inc. (d) | | | 5,400 | | | | 172,260 | |
Kate Spade & Co. (d)(e) | | | 35,300 | | | | 652,697 | |
Liberty Interactive Corp. QVC Group Class A (d)(e) | | | 27,800 | | | | 682,212 | |
Matas A/S | | | 15,888 | | | | 251,364 | |
Nu Skin Enterprises, Inc. Class A (d) | | | 11,800 | | | | 741,512 | |
Office Depot, Inc. (d) | | | 234,660 | | | | 1,323,482 | |
Panera Bread Co. Class A (e) | | | 2,720 | | | | 855,821 | |
Pier 1 Imports, Inc. | | | 107,800 | | | | 559,482 | |
Rallye S.A. | | | 4,692 | | | | 96,622 | |
Regis Corp. (d)(e) | | | 44,200 | | | | 453,934 | |
Ruby Tuesday, Inc. (e) | | | 3,600 | | | | 7,236 | |
Rush Enterprises, Inc. Class A (d)(e) | | | 15,000 | | | | 557,700 | |
Staples, Inc. (d) | | | 128,600 | | | | 1,295,002 | |
Urban Outfitters, Inc. (d)(e) | | | 25,100 | | | | 465,354 | |
| | | | | | | | |
| | | | | | | 11,315,572 | |
| | | | | | | | |
Semiconductors 0.5% | | | | | | | | |
Alpha & Omega Semiconductor, Ltd. (d)(e) | | | 6,300 | | | | 105,021 | |
BE Semiconductor Industries N.V. (d) | | | 10,741 | | | | 573,521 | |
NXP Semiconductors N.V. (e) | | | 4,020 | | | | 439,989 | |
Siltronic A.G. (d)(e) | | | 6,366 | | | | 539,285 | |
SOITEC (d)(e) | | | 9,178 | | | | 559,878 | |
STMicroelectronics N.V. (d) | | | 43,169 | | | | 619,770 | |
| | | | | | | | |
| | | | | | | 2,837,464 | |
| | | | | | | | |
Shipbuilding 0.1% | | | | | | | | |
Yangzijiang Shipbuilding Holdings, Ltd. | | | 717,600 | | | | 620,261 | |
| | | | | | | | |
| | | | | | | | |
| | |
Shares | | | Value | |
Software 0.5% | |
Akamai Technologies, Inc. (d)(e) | | | 14,000 | | | $ | 697,340 | |
Allscripts Healthcare Solutions, Inc. (d)(e) | | | 56,800 | | | | 724,768 | |
Donnelley Financial Solutions, Inc. (d)(e) | | | 10,100 | | | | 231,896 | |
Nuance Communications, Inc. (d)(e) | | | 35,600 | | | | 619,796 | |
Quality Systems, Inc. (d)(e) | | | 35,600 | | | | 612,676 | |
Synchronoss Technologies, Inc. (d)(e) | | | 9,700 | | | | 159,565 | |
| | | | | | | | |
| | | | | | | 3,046,041 | |
| | | | | | | | |
Telecommunications 0.9% | | | | | | | | |
ARRIS International PLC (d)(e) | | | 13,200 | | | | 369,864 | |
EchoStar Corp. Class A (d)(e) | | | 4,000 | | | | 242,800 | |
Eutelsat Communications S.A. (d) | | | 25,522 | | | | 651,793 | |
General Communication, Inc. Class A (d)(e) | | | 600 | | | | 21,984 | |
Koninklijke KPN N.V. (Netherlands) | | | 67,200 | | | | 214,983 | |
Lumos Networks Corp. (d)(e) | | | 25,900 | | | | 462,833 | |
Straight Path Communications, Inc. Class B (e) | | | 6,480 | | | | 1,164,132 | |
T-Mobile U.S., Inc. (e) | | | 9,329 | | | | 565,524 | |
TDC A/S (Denmark) | | | 94,077 | | | | 547,091 | |
Telecom Italia S.p.A. | | | 833,008 | | | | 613,666 | |
United States Cellular Corp. (d)(e) | | | 600 | | | | 22,992 | |
| | | | | | | | |
| | | | | | | 4,877,662 | |
| | | | | | | | |
Transportation 0.3% | | | | | | | | |
Ansaldo STS S.p.A. (e) | | | 26,225 | | | | 334,274 | |
BW LPG, Ltd. (c) | | | 31,279 | | | | 108,650 | |
BW Offshore, Ltd. (e) | | | 4,605 | | | | 11,583 | |
Golden Ocean Group, Ltd. (d)(e) | | | 53,428 | | | | 354,853 | |
International Seaways, Inc. (d)(e) | | | 12,300 | | | | 266,541 | |
Nobina AB (c) | | | 1,050 | | | | 5,696 | |
Ryder System, Inc. (d) | | | 9,800 | | | | 705,404 | |
| | | | | | | | |
| | | | | | | 1,787,001 | |
| | | | | | | | |
Trucking & Leasing 0.1% | | | | | | | | |
Greenbrier Cos., Inc. (d) | | | 12,400 | | | | 573,500 | |
| | | | | | | | |
Total Common Stocks
(Cost $152,861,664) | | | | | | | 159,984,726 | |
| | | | | | | | |
|
| Preferred Stocks 0.1% | |
Auto Components 0.1% | | | | | | | | |
Schaeffler A.G. (d)
3.970% | | | 11,800 | | | | 169,006 | |
| | | | | | | | |
|
Health Care Equipment & Supplies 0.0%‡ | |
Draegerwerk A.G. & Co. KGaA (d)
0.200% | | | 1,568 | | | | 164,959 | |
| | | | | | | | |
Total Preferred Stocks
(Cost $370,886) | | | | | | | 333,965 | |
| | | | | | | | |
| | | | |
| 20 | | MainStay VP Absolute Return Multi-Strategy Portfolio | | The notes to the financial statements are an integral part of,
and should be read in conjunction with, the financial statements. |
| | | | | | | | |
| | |
Shares | | | Value | |
| Unaffiliated Investment Companies 0.3% | |
Internet Software & Services 0.3% | | | | | | | | |
Altaba, Inc. (e) | | | 28,223 | | | $ | 1,537,589 | |
| | | | | | | | |
Total Unaffiliated Investment Companies
(Cost $1,091,226) | | | | | | | 1,537,589 | |
| | | | | | | | |
| | |
| | | | | | | | |
| | | Principal
Amount | | | | |
| Purchased Put Options 0.0%‡ | |
Euro BOBL
Strike Price $131.50
Expires 8/25/17 | | $ | 65 | | | | 31,181 | |
| | | | | | | | |
Total Purchased Put Options
(Cost $22,391) | | | | | | | 31,181 | |
| | | | | | | | |
|
| Short-Term Investments 66.0% | |
Repurchase Agreements 39.6% | |
Fixed Income Clearing Corp.
0.12%, dated 6/30/17
due 7/3/17
Proceeds at Maturity $219,562,958 (Collateralized by United States Treasury securities with rates between 1.125% and 2.00% and a maturity date of 8/31/21, with a Principal Amount of $228,585,000 and a Market Value of $223,967,343) | | | 219,560,762 | | | | 219,560,762 | |
State Street Bank and Trust Co.
0.05%, dated 6/30/17
due 7/3/17
Proceeds at Maturity $7,136,981 (Collateralized by United States Treasury securities with rates between 1.625% and 2.00% and maturity dates between 12/31/19 and 8/31/21, with a Principal Amount of $7,175,000 and a Market Value of $7,287,908) (g) | | | 7,136,951 | | | | 7,136,951 | |
| | | | | | | | |
Total Repurchase Agreements
(Cost $226,697,713) | | | | | | | 226,697,713 | |
| | | | | | | | |
| | |
U.S. Governments 26.4% | | | | | | | | |
United States Treasury Bills (g)(h) | |
0.803%, due 7/20/17 (i) | | | 25,900,000 | | | | 25,889,201 | |
0.880%, due 8/24/17 | | | 36,100,000 | | | | 36,052,131 | |
0.920%, due 9/14/17 | | | 9,880,400 | | | | 9,861,420 | |
0.950%, due 9/21/17 (i) | | | 49,363,000 | | | | 49,256,309 | |
| | | | | | | | |
| | | Principal
Amount | | | Value | |
U.S. Governments (continued) | | | | | | | | |
United States Treasury Bills (continued) | |
1.110%, due 1/4/18 | | $ | 30,200,000 | | | $ | 30,027,649 | |
| | | | | | | | |
Total U.S. Governments
(Cost $151,142,832) | | | | | | | 151,086,710 | |
| | | | | | | | |
Total Short-Term Investments
(Cost $377,840,545) | | | | | | | 377,784,423 | |
| | | | | | | | |
Total Investments, Before Investments Sold Short
(Cost $614,577,409) (f) | | | 109.4 | % | | | 625,572,200 | |
| | | | | | | | |
| | |
| | | | | | | | |
| | |
| | | Shares | | | | |
Investments Sold Short (21.7%) Common Stocks Sold Short (18.5%) | |
Advertising (0.1%) | | | | | | | | |
JCDecaux S.A. | | | (8,384 | ) | | | (275,016 | ) |
| | | | | | | | |
| | |
Aerospace & Defense (0.5%) | | | | | | | | |
Aerovironment, Inc. (e) | | | (2,000 | ) | | | (76,400 | ) |
Cobham PLC | | | (376,243 | ) | | | (635,089 | ) |
Rolls-Royce Holdings PLC (e) | | | (59,303 | ) | | | (688,201 | ) |
Rolls-Royce Holdings PLC preferred shares (e)(j) | | | (4,016,115 | ) | | | (5,231 | ) |
TransDigm Group, Inc. | | | (2,400 | ) | | | (645,288 | ) |
Zodiac Aerospace | | | (26,410 | ) | | | (716,399 | ) |
| | | | | | | | |
| | | | | | | (2,766,608 | ) |
| | | | | | | | |
Agriculture (0.0%)‡ | | | | | | | | |
Andersons, Inc. | | | (2,800 | ) | | | (95,620 | ) |
Australian Agricultural Co., Ltd. (e) | | | (23,232 | ) | | | (33,123 | ) |
| | | | | | | | |
| | | | | | | (128,743 | ) |
| | | | | | | | |
Airlines (0.1%) | | | | | | | | |
Norwegian Air Shuttle ASA (e) | | | (20,553 | ) | | | (598,711 | ) |
| | | | | | | | |
| | |
Apparel (0.2%) | | | | | | | | |
Geox S.p.A. | | | (75,311 | ) | | | (248,243 | ) |
∎ Under Armour, Inc. | | | | | | | | |
Class A (e) | | | (5,000 | ) | | | (108,800 | ) |
Class C (e) | | | (36,600 | ) | | | (737,856 | ) |
| | | | | | | | |
| | | | | | | (1,094,899 | ) |
| | | | | | | | |
Auto Parts & Equipment (0.1%) | | | | | | | | |
Bertrandt A.G. | | | (1,079 | ) | | | (108,154 | ) |
Motorcar Parts of America, Inc. (e) | | | (18,800 | ) | | | (530,912 | ) |
| | | | | | | | |
| | | | | | | (639,066 | ) |
| | | | | | | | |
Banks (0.8%) | | | | | | | | |
Access National Corp. | | | (12,800 | ) | | | (339,456 | ) |
Banca Monte dei Paschi di Siena S.p.A. (e)(j)(k) | | | (11,083 | ) | | | (190,889 | ) |
Banco BPM S.p.A. (e) | | | (117,276 | ) | | | (392,464 | ) |
Banco Comercial Portugues S.A. Class R (e) | | | (105,730 | ) | | | (28,463 | ) |
BOK Financial Corp. | | | (1,700 | ) | | | (143,021 | ) |
Credito Valtellinese S.p.A. (e) | | | (145,530 | ) | | | (619,325 | ) |
EFG International A.G. (e) | | | (44,112 | ) | | | (285,677 | ) |
| | | | | | |
The notes to the financial statements are an integral part of,
and should be read in conjunction with, the financial statements. | | | | | 21 | |
Consolidated Portfolio of Investments June 30, 2017 (Unaudited) (continued)
| | | | | | | | |
| | |
Shares | | | Value | |
| Common Stocks Sold Short (continued) | |
Banks (continued) | | | | | | | | |
HSBC Holdings PLC | | | (49,118 | ) | | $ | (455,301 | ) |
Live Oak Bancshares, Inc. | | | (19,900 | ) | | | (481,580 | ) |
Metro Bank PLC (e) | | | (8,078 | ) | | | (377,500 | ) |
Pacific Continental Corp. | | | (12,300 | ) | | | (314,265 | ) |
Republic First Bancorp, Inc. (e) | | | (42,800 | ) | | | (395,900 | ) |
UniCredit S.p.A. (e) | | | (38,376 | ) | | | (716,639 | ) |
| | | | | | | | |
| | | | | | | (4,740,480 | ) |
| | | | | | | | |
Beverages (0.0%)‡ | | | | | | | | |
Marie Brizard Wine & Spirits S.A. (e) | | | (10,082 | ) | | | (180,673 | ) |
| | | | | | | | |
| | |
Biotechnology (0.6%) | | | | | | | | |
Ablynx N.V. (e) | | | (17,559 | ) | | | (226,421 | ) |
Cellectis S.A. (e) | | | (7,975 | ) | | | (206,037 | ) |
Evolva Holding S.A. (e) | | | (49,999 | ) | | | (21,900 | ) |
Genfit (e) | | | (7,367 | ) | | | (251,669 | ) |
Genmab A/S (e) | | | (697 | ) | | | (148,707 | ) |
Illumina, Inc. (e) | | | (3,600 | ) | | | (624,672 | ) |
Innate Pharma S.A. (e) | | | (17,687 | ) | | | (220,799 | ) |
Omeros Corp. (e) | | | (36,000 | ) | | | (716,580 | ) |
Paratek Pharmaceuticals, Inc. (e) | | | (27,200 | ) | | | (655,520 | ) |
Pharma Mar S.A. (e) | | | (60,433 | ) | | | (271,608 | ) |
Theravance Biopharma, Inc. (e) | | | (8,000 | ) | | | (318,720 | ) |
| | | | | | | | |
| | | | | | | (3,662,633 | ) |
| | | | | | | | |
Building Materials (0.1%) | | | | | | | | |
James Hardie Industries PLC | | | (38,620 | ) | | | (608,508 | ) |
| | | | | | | | |
| | |
Chemicals (0.3%) | | | | | | | | |
Essentra PLC | | | (75,161 | ) | | | (552,608 | ) |
SGL Carbon S.E. (e) | | | (52,589 | ) | | | (653,202 | ) |
Symrise A.G. | | | (9,143 | ) | | | (647,655 | ) |
| | | | | | | | |
| | | | | | | (1,853,465 | ) |
| | | | | | | | |
Commercial Services (0.9%) | | | | | | | | |
Advisory Board Co. (e) | | | (10,900 | ) | | | (561,350 | ) |
Berendsen PLC | | | (14,404 | ) | | | (230,754 | ) |
Brambles, Ltd. | | | (86,583 | ) | | | (647,509 | ) |
Brunel International N.V. | | | (4,484 | ) | | | (62,737 | ) |
Caverion Corp. (e) | | | (17,546 | ) | | | (140,482 | ) |
CBIZ, Inc. (e) | | | (2,600 | ) | | | (39,000 | ) |
HealthEquity, Inc. (e) | | | (11,900 | ) | | | (592,977 | ) |
Macquarie Infrastructure Corp. | | | (8,300 | ) | | | (650,720 | ) |
MarketAxess Holdings, Inc. | | | (3,500 | ) | | | (703,850 | ) |
Spotless Group Holdings, Ltd. | | | (36,990 | ) | | | (32,695 | ) |
Textainer Group Holdings, Ltd. (e) | | | (49,600 | ) | | | (719,200 | ) |
WEX, Inc. (e) | | | (6,400 | ) | | | (667,328 | ) |
| | | | | | | | |
| | | | | | | (5,048,602 | ) |
| | | | | | | | |
Computers (0.3%) | | | | | | | | |
Arcam AB (e) | | | (357 | ) | | | (14,217 | ) |
NEXTDC, Ltd. (e) | | | (164,920 | ) | | | (571,676 | ) |
Nutanix, Inc. Class A (e) | | | (34,700 | ) | | | (699,205 | ) |
| | | | | | | | |
| | |
Shares | | | Value | |
Computers (continued) | | | | | | | | |
Serco Group PLC (e) | | | (104,569 | ) | | $ | (156,489 | ) |
Syntel, Inc. | | | (2,700 | ) | | | (45,792 | ) |
Tobii AB (e) | | | (82,087 | ) | | | (382,924 | ) |
| | | | | | | | |
| | | | | | | (1,870,303 | ) |
| | | | | | | | |
Cosmetics & Personal Care (0.2%) | | | | | | | | |
Coty, Inc. Class A | | | (34,200 | ) | | | (641,592 | ) |
e.l.f. Beauty, Inc. (e) | | | (22,100 | ) | | | (601,341 | ) |
| | | | | | | | |
| | | | | | | (1,242,933 | ) |
| | | | | | | | |
Country Funds—Closed-end (0.0%)‡ | | | | | | | | |
Flow Traders (c) | | | (4,453 | ) | | | (122,827 | ) |
| | | | | | | | |
| | |
Distribution & Wholesale (0.0%)‡ | | | | | | | | |
Fastenal Co. | | | (4,500 | ) | | | (195,885 | ) |
| | | | | | | | |
| | |
Diversified Financial Services (0.6%) | | | | | | | | |
Credit Acceptance Corp. (e) | | | (3,000 | ) | | | (771,420 | ) |
GRENKE A.G. | | | (1,381 | ) | | | (306,787 | ) |
Hypoport A.G. (e) | | | (2,224 | ) | | | (288,306 | ) |
Navient Corp. | | | (45,100 | ) | | | (750,915 | ) |
On Deck Capital, Inc. (e) | | | (22,200 | ) | | | (103,452 | ) |
PHH Corp. (e) | | | (6,500 | ) | | | (89,505 | ) |
Provident Financial PLC | | | (16,289 | ) | | | (516,176 | ) |
Tamburi Investment Partners S.p.A. | | | (32,113 | ) | | | (183,939 | ) |
VZ Holding A.G. | | | (11 | ) | | | (3,530 | ) |
WisdomTree Investments, Inc. | | | (57,600 | ) | | | (585,792 | ) |
| | | | | | | | |
| | | | | | | (3,599,822 | ) |
| | | | | | | | |
Electric (0.1%) | | | | | | | | |
E.ON S.E. | | | (75,276 | ) | | | (709,134 | ) |
| | | | | | | | |
|
Electrical Components & Equipment (0.1%) | |
SMA Solar Technology A.G. | | | (20,417 | ) | | | (613,297 | ) |
Vossloh A.G. (e) | | | (46 | ) | | | (2,957 | ) |
| | | | | | | | |
| | | | | | | (616,254 | ) |
| | | | | | | | |
Electronics (0.2%) | | | | | | | | |
Fingerprint Cards AB Class B (e) | | | (2,334 | ) | | | (8,525 | ) |
Garmin, Ltd. | | | (8,800 | ) | | | (449,064 | ) |
GoPro, Inc. Class A (e) | | | (64,400 | ) | | | (523,572 | ) |
| | | | | | | | |
| | | | | | | (981,161 | ) |
| | | | | | | | |
Energy—Alternate Sources (0.3%) | | | | | | | | |
Capital Stage A.G. | | | (9,706 | ) | | | (68,621 | ) |
Nordex S.E. (e) | | | (38,677 | ) | | | (475,101 | ) |
Plug Power, Inc. (e) | | | (292,500 | ) | | | (596,700 | ) |
Sunrun, Inc. (e) | | | (113,000 | ) | | | (804,560 | ) |
| | | | | | | | |
| | | | | | | (1,944,982 | ) |
| | | | | | | | |
Engineering & Construction (0.2%) | | | | | | | | |
KBR, Inc. | | | (47,700 | ) | | | (725,994 | ) |
Obrascon Huarte Lain S.A. | | | (2,637 | ) | | | (9,454 | ) |
| | | | |
| 22 | | MainStay VP Absolute Return Multi-Strategy Portfolio | | The notes to the financial statements are an integral part of,
and should be read in conjunction with, the financial statements. |
| | | | | | | | |
| | |
Shares | | | Value | |
| Common Stocks Sold Short (continued) | |
Engineering & Construction (continued) | |
SATS, Ltd. | | | (119,300 | ) | | $ | (442,799 | ) |
Sydney Airport | | | (16,868 | ) | | | (91,920 | ) |
| | | | | | | | |
| | | | | | | (1,270,167 | ) |
| | | | | | | | |
Entertainment (0.2%) | | | | | | | | |
Caesars Acquisition Co. Class A (e) | | | (30,900 | ) | | | (588,645 | ) |
Codere S.A. (e) | | | (641,966 | ) | | | (322,617 | ) |
IMAX Corp. (e) | | | (800 | ) | | | (17,600 | ) |
Juventus Football Club S.p.A (e) | | | (607,681 | ) | | | (365,771 | ) |
| | | | | | | | |
| | | | | | | (1,294,633 | ) |
| | | | | | | | |
Environmental Controls (0.1%) | | | | | | | | |
Energy Recovery, Inc. (e) | | | (66,200 | ) | | | (548,798 | ) |
| | | | | | | | |
| | |
Food (0.6%) | | | | | | | | |
Amplify Snack Brands, Inc. (e) | | | (59,900 | ) | | | (577,436 | ) |
Cal-Maine Foods, Inc. (e) | | | (14,700 | ) | | | (582,120 | ) |
Chocoladefabriken Lindt & Sprungli A.G. | | | (36 | ) | | | (208,739 | ) |
Chocoladefabriken Lindt & Sprungli A.G., Registered | | | (9 | ) | | | (627,438 | ) |
Chr. Hansen Holding A/S | | | (9,948 | ) | | | (723,522 | ) |
Dairy Crest Group PLC | | | (19,772 | ) | | | (154,255 | ) |
Ocado Group PLC (e) | | | (60,911 | ) | | | (229,591 | ) |
Wessanen | | | (2,686 | ) | | | (45,526 | ) |
| | | | | | | | |
| | | | | | | (3,148,627 | ) |
| | | | | | | | |
Hand & Machine Tools (0.0%)‡ | | | | | | | | |
KUKA A.G. | | | (7 | ) | | | (855 | ) |
Meyer Burger Technology A.G. (e) | | | (157,110 | ) | | | (196,613 | ) |
| | | | | | | | |
| | | | | | | (197,468 | ) |
| | | | | | | | |
Health Care—Products (0.6%) | | | | | | | | |
ABIOMED, Inc. (e) | | | (4,800 | ) | | | (687,840 | ) |
Accelerate Diagnostics, Inc. (e) | | | (19,100 | ) | | | (522,385 | ) |
Cerus Corp. (e) | | | (127,900 | ) | | | (321,029 | ) |
Nanosonics, Ltd. (e) | | | (140,314 | ) | | | (273,927 | ) |
Novan, Inc. (e) | | | (4,400 | ) | | | (17,732 | ) |
Novocure, Ltd. (e) | | | (40,006 | ) | | | (692,104 | ) |
Patterson Cos., Inc. | | | (14,700 | ) | | | (690,165 | ) |
RaySearch Laboratories AB (e) | | | (2,261 | ) | | | (63,203 | ) |
Rockwell Medical, Inc. (e) | | | (28,300 | ) | | | (224,419 | ) |
| | | | | | | | |
| | | | | | | (3,492,804 | ) |
| | | | | | | | |
Health Care—Services (0.6%) | | | | | | | | |
Acadia Healthcare Co., Inc. (e) | | | (15,700 | ) | | | (775,266 | ) |
Brookdale Senior Living, Inc. (e) | | | (29,800 | ) | | | (438,358 | ) |
Capital Senior Living Corp. (e) | | | (200 | ) | | | (3,042 | ) |
Envision Healthcare Corp. (e) | | | (12,000 | ) | | | (752,040 | ) |
Healthscope, Ltd. | | | (41,927 | ) | | | (71,218 | ) |
Mediclinic International PLC | | | (35,593 | ) | | | (343,745 | ) |
MEDNAX, Inc. (e) | | | (3,300 | ) | | | (199,221 | ) |
Teladoc, Inc. (e) | | | (17,800 | ) | | | (617,660 | ) |
| | | | | | | | |
| | | | | | | (3,200,550 | ) |
| | | | | | | | |
| | | | | | | | |
| | |
Shares | | | Value | |
Home Builders (0.1%) | | | | | | | | |
LGI Homes, Inc. (e) | | | (16,800 | ) | | $ | (675,024 | ) |
| | | | | | | | |
| | |
Household Products & Wares (0.1%) | | | | | | | | |
Societe BIC S.A. | | | (3,838 | ) | | | (455,453 | ) |
| | | | | | | | |
| | |
Insurance (0.3%) | | | | | | | | |
Ambac Financial Group, Inc. (e) | | | (33,000 | ) | | | (572,550 | ) |
Citizens, Inc. (e) | | | (17,100 | ) | | | (126,198 | ) |
MBIA, Inc. (e) | | | (69,500 | ) | | | (655,385 | ) |
Trupanion, Inc. (e) | | | (22,700 | ) | | | (508,026 | ) |
| | | | | | | | |
| | | | | | | (1,862,159 | ) |
| | | | | | | | |
Internet (0.6%) | | | | | | | | |
FireEye, Inc. (e) | | | (43,400 | ) | | | (660,114 | ) |
Liberty Expedia Holdings, Inc. Class A (e) | | | (1,100 | ) | | | (59,422 | ) |
Liberty Ventures Series A (e) | | | (12,800 | ) | | | (669,312 | ) |
Pandora Media, Inc. (e) | | | (74,000 | ) | | | (660,080 | ) |
Yoox Net-A-Porter Group S.p.A. (e) | | | (19,747 | ) | | | (546,259 | ) |
Zillow Group, Inc. Class C (e) | | | (15,300 | ) | | | (749,853 | ) |
zooplus A.G. (e) | | | (912 | ) | | | (181,245 | ) |
| | | | | | | | |
| | | | | | | (3,526,285 | ) |
| | | | | | | | |
Investment Companies (0.1%) | | | | | | | | |
Leonteq A.G. (e) | | | (8,878 | ) | | | (493,016 | ) |
| | | | | | | | |
| | |
Iron & Steel (0.1%) | | | | | | | | |
Allegheny Technologies, Inc. | | | (35,200 | ) | | | (598,752 | ) |
| | | | | | | | |
| | |
Leisure Time (0.0%)‡ | | | | | | | | |
Ardent Leisure Group | | | (41,144 | ) | | | (59,452 | ) |
| | | | | | | | |
| | |
Lodging (0.1%) | | | | | | | | |
Accor S.A. | | | (14,973 | ) | | | (701,927 | ) |
Choice Hotels International, Inc. | | | (1,500 | ) | | | (96,375 | ) |
| | | | | | | | |
| | | | | | | (798,302 | ) |
| | | | | | | | |
Machinery—Diversified (0.3%) | | | | | | | | |
Cognex Corp. | | | (7,100 | ) | | | (602,790 | ) |
Wabted Corp. | | | (8,000 | ) | | | (732,000 | ) |
Welbilt, Inc. (e) | | | (25,400 | ) | | | (478,790 | ) |
| | | | | | | | |
| | | | | | | (1,813,580 | ) |
| | | | | | | | |
Media (0.5%) | | | | | | | | |
Global Eagle Entertainment, Inc. (e) | | | (5,400 | ) | | | (19,224 | ) |
HT&E, Ltd. | | | (89,713 | ) | | | (182,037 | ) |
∎ Liberty Broadband Corp. | | | | | | | | |
Class A (e) | | | (7,800 | | | | (669,162 | ) |
Class C (e) | | | (2,500 | ) | | | (216,875 | ) |
Liberty Media Corp-Liberty Formula One Class C (e) | | | (5,400 | ) | | | (197,748 | ) |
Promotora de Informaciones S.A. Class A (e) | | | (10,986 | ) | | | (29,474 | ) |
| | | | | | |
The notes to the financial statements are an integral part of,
and should be read in conjunction with, the financial statements. | | | | | 23 | |
Consolidated Portfolio of Investments June 30, 2017 (Unaudited) (continued)
| | | | | | | | |
| | |
Shares | | | Value | |
| Common Stocks Sold Short (continued) | |
Media (continued) | | | | | | | | |
∎ Schibsted ASA | | | | | | | | |
Class A | | | (26,696 | ) | | $ | (644,637 | ) |
Class B | | | (10,656 | ) | | | (235,488 | ) |
SFR Group S.A. (e) | | | (9,649 | ) | | | (326,761 | ) |
| | | | | | | | |
| | | | | | | (2,521,406 | ) |
| | | | | | | | |
Metal Fabricate & Hardware (0.1%) | | | | | | | | |
Valmont Industries, Inc. | | | (3,100 | ) | | | (463,760 | ) |
| | | | | | | | |
| | |
Mining (1.2%) | | | | | | | | |
Fairmount Santrol Holdings, Inc. (e) | | | (114,400 | ) | | | (446,160 | ) |
Ferroglobe Representation & Warranty Insurance Trust (e)(j)(k) | | | (13,500 | ) | | | (0 | ) |
Fresnillo PLC | | | (24,053 | ) | | | (465,532 | ) |
Galaxy Resources, Ltd. (e) | | | (173,491 | ) | | | (220,686 | ) |
Independence Group NL | | | (202,853 | ) | | | (491,125 | ) |
Newcrest Mining, Ltd. | | | (20,925 | ) | | | (324,232 | ) |
Nyrstar N.V. (e) | | | (107,221 | ) | | | (654,194 | ) |
Orocobre, Ltd. (e) | | | (200,968 | ) | | | (535,990 | ) |
Randgold Resources, Ltd. | | | (6,979 | ) | | | (618,561 | ) |
Royal Gold, Inc. | | | (8,100 | ) | | | (633,177 | ) |
Saracen Mineral Holdings, Ltd. (e) | | | (206,495 | ) | | | (185,693 | ) |
Sirius Minerals PLC (e) | | | (1,356,188 | ) | | | (535,916 | ) |
Syrah Resources, Ltd. (e) | | | (264,716 | ) | | | (563,586 | ) |
U.S. Silica Holdings, Inc. | | | (14,300 | ) | | | (507,507 | ) |
Western Areas, Ltd. (e) | | | (330,895 | ) | | | (536,628 | ) |
| | | | | | | | |
| | | | | | | (6,718,987 | ) |
| | | | | | | | |
Miscellaneous—Manufacturing (0.1%) | |
Axon Enterprise, Inc. (e) | | | (11,400 | ) | | | (286,596 | ) |
| | | | | | | | |
| | |
Office & Business Equipment (0.1%) | | | | | | | | |
SLM Solutions Group A.G. (e) | | | (10,275 | ) | | | (451,820 | ) |
| | | | | | | | |
| | |
Oil & Gas (0.6%) | | | | | | | | |
Cabot Oil & Gas Corp. | | | (13,600 | ) | | | (341,088 | ) |
California Resources Corp. (e) | | | (10,200 | ) | | | (87,210 | ) |
Chesapeake Energy Corp. (e) | | | (37,800 | ) | | | (187,866 | ) |
Continental Resources, Inc. (e) | | | (9,400 | ) | | | (303,902 | ) |
Diamondback Energy, Inc. (e) | | | (3,700 | ) | | | (328,597 | ) |
EP Energy Corp. Class A (e) | | | (82,000 | ) | | | (300,120 | ) |
Helmerich & Payne, Inc. | | | (5,300 | ) | | | (288,002 | ) |
Liquefied Natural Gas, Ltd. (e) | | | (1,241 | ) | | | (529 | ) |
Lundin Petroleum AB (e) | | | (17,299 | ) | | | (332,851 | ) |
Pantheon Resources PLC (e) | | | (26,280 | ) | | | (17,457 | ) |
Par Pacific Holdings, Inc. (e) | | | (2,800 | ) | | | (50,512 | ) |
Parsley Energy, Inc. Class A (e) | | | (11,900 | ) | | | (330,225 | ) |
Rice Energy, Inc. (e) | | | (10,400 | ) | | | (276,952 | ) |
Ring Energy, Inc. (e) | | | (25,200 | ) | | | (327,600 | ) |
Sound Energy PLC (e) | | | (323,291 | ) | | | (324,224 | ) |
| | | | | | | | |
| | | | | | | (3,497,135 | ) |
| | | | | | | | |
| | | | | | | | |
| | |
Shares | | | Value | |
Oil & Gas Services (0.8%) | | | | | | | | |
Aker Solutions ASA (e) | | | (85,078 | ) | | $ | (384,284 | ) |
Flotek Industries, Inc. (e) | | | (54,900 | ) | | | (490,806 | ) |
Forum Energy Technologies, Inc. (e) | | | (33,300 | ) | | | (519,480 | ) |
Keane Group, Inc. (d)(e) | | | (35,300 | ) | | | (564,800 | ) |
Mammoth Energy Services, Inc. (e) | | | (8,400 | ) | | | (156,240 | ) |
Petroleum Geo-Services ASA (e) | | | (129,134 | ) | | | (224,278 | ) |
RPC, Inc. | | | (32,600 | ) | | | (658,846 | ) |
Saipem S.p.A. (e) | | | (152,544 | ) | | | (563,454 | ) |
Schoeller-Bleckmann Oilfield Equipment A.G. (e) | | | (5,374 | ) | | | (351,702 | ) |
Weatherford International PLC (e) | | | (136,200 | ) | | | (527,094 | ) |
| | | | | | | | |
| | | | | | | (4,440,984 | ) |
| | | | | | | | |
Pharmaceuticals (1.3%) | | | | | | | | |
AB Science S.A. (e) | | | (11,939 | ) | | | (144,543 | ) |
Aclaris Therapeutics, Inc. (e) | | | (22,000 | ) | | | (596,640 | ) |
Aerie Pharmaceuticals, Inc. (e) | | | (9,900 | ) | | | (520,245 | ) |
ALK-Abello A/S | | | (1,628 | ) | | | (242,937 | ) |
Blackmores, Ltd. | | | (7,133 | ) | | | (525,435 | ) |
DexCom, Inc. (e) | | | (7,500 | ) | | | (548,625 | ) |
Hikma Pharmaceuticals PLC | | | (6,870 | ) | | | (131,533 | ) |
Intra-Cellular Therapies, Inc. (e) | | | (42,400 | ) | | | (526,608 | ) |
Premier, Inc. Class A (e) | | | (18,900 | ) | | | (680,400 | ) |
Reata Pharmaceuticals, Inc. (e) | | | (2,200 | ) | | | (69,608 | ) |
Revance Therapeutics, Inc. (e) | | | (24,500 | ) | | | (646,800 | ) |
Santhera Pharmaceuticals Holding A.G., Registered (e) | | | (2,166 | ) | | | (150,439 | ) |
Sirtex Medical, Ltd. | | | (28,579 | ) | | | (356,945 | ) |
TherapeuticsMD, Inc. (e) | | | (131,400 | ) | | | (692,478 | ) |
VCA, Inc. (e) | | | (7,100 | ) | | | (655,401 | ) |
Vectura Group PLC (e) | | | (5,228 | ) | | | (7,619 | ) |
Vifor Pharma A.G. | | | (5,621 | ) | | | (619,605 | ) |
Zealand Pharma A/S (e) | | | (3,024 | ) | | | (60,616 | ) |
| | | | | | | | |
| | | | | | | (7,176,477 | ) |
| | | | | | | | |
Pipelines (0.1%) | | | | | | | | |
Cheniere Energy, Inc. (e) | | | (6,700 | ) | | | (326,357 | ) |
| | | | | | | | |
| | |
Private Equity (0.1%) | | | | | | | | |
AURELIUS Equity Opportunities S.E. & Co. KGaA | | | (9,592 | ) | | | (515,292 | ) |
| | | | | | | | |
| | |
Real Estate (0.1%) | | | | | | | | |
REA Group, Ltd. | | | (13,921 | ) | | | (710,459 | ) |
| | | | | | | | |
| | |
Retail (1.9%) | | | | | | | | |
AO World PLC (e) | | | (44,574 | ) | | | (67,489 | ) |
At Home Group, Inc. (e) | | | (21,400 | ) | | | (498,406 | ) |
CarMax, Inc. (e) | | | (10,400 | ) | | | (655,824 | ) |
Domino’s Pizza Enterprises, Ltd. | | | (18,082 | ) | | | (723,799 | ) |
Duluth Holdings, Inc. Class B (e) | | | (27,900 | ) | | | (508,059 | ) |
| | | | |
| 24 | | MainStay VP Absolute Return Multi-Strategy Portfolio | | The notes to the financial statements are an integral part of,
and should be read in conjunction with, the financial statements. |
| | | | | | | | |
| | |
Shares | | | Value | |
| Common Stocks Sold Short (continued) | |
Retail (continued) | | | | | | | | |
Five Below, Inc. (e) | | | (10,900 | ) | | $ | (538,133 | ) |
Fred’s, Inc. Class A | | | (36,200 | ) | | | (334,126 | ) |
Freshpet, Inc. (e) | | | (7,800 | ) | | | (129,480 | ) |
GNC Holdings, Inc. Class A | | | (42,900 | ) | | | (361,647 | ) |
J.C. Penney Co., Inc. (e) | | | (138,400 | ) | | | (643,560 | ) |
Lululemon Athletica, Inc. (e) | | | (13,500 | ) | | | (805,545 | ) |
Lumber Liquidators Holdings, Inc. (e) | | | (18,800 | ) | | | (471,128 | ) |
Luxottica Group S.p.A | | | (10,873 | ) | | | (629,002 | ) |
Majestic Wine PLC | | | (1,736 | ) | | | (7,235 | ) |
Party City Holdco, Inc. (e) | | | (32,800 | ) | | | (513,320 | ) |
RH (e) | | | (9,600 | ) | | | (619,392 | ) |
Salvatore Ferragamo S.p.A. | | | (19,636 | ) | | | (523,676 | ) |
Sears Holdings Corp. (e) | | | (36,000 | ) | | | (318,960 | ) |
Shake Shack, Inc. Class A (e) | | | (10,700 | ) | | | (373,216 | ) |
Sports Direct International PLC (e) | | | (139,580 | ) | | | (529,390 | ) |
Tile Shop Holdings, Inc. | | | (21,300 | ) | | | (439,845 | ) |
Wingstop, Inc. | | | (18,700 | ) | | | (577,830 | ) |
Zalando SE (c)(e) | | | (14,250 | ) | | | (651,188 | ) |
| | | | | | | | |
| | | | | | | (10,920,250 | ) |
| | | | | | | | |
Semiconductors (0.1%) | | | | | | | | |
IPG Photonics Corp. (e) | | | (4,700 | ) | | | (681,970 | ) |
Nanoco Group PLC (e) | | | (79,957 | ) | | | (45,561 | ) |
| | | | | | | | |
| | | | | | | (727,531 | ) |
| | | | | | | | |
Software (0.9%) | | | | | | | | |
Aconex, Ltd. (e) | | | (170,194 | ) | | | (487,925 | ) |
Actua Corp. (e) | | | (13,300 | ) | | | (186,865 | ) |
Atlassian Corp. PLC Class A (e) | | | (6,700 | ) | | | (235,706 | ) |
Black Knight Financial Services, Inc. Class A (e) | | | (8,400 | ) | | | (343,980 | ) |
CommerceHub, Inc. Series C (e) | | | (18,600 | ) | | | (324,384 | ) |
Guidewire Software, Inc. (e) | | | (9,800 | ) | | | (673,358 | ) |
Hortonworks, Inc. (e) | | | (19,400 | ) | | | (249,872 | ) |
NantHealth, Inc. (e) | | | (2,500 | ) | | | (10,575 | ) |
Opera Software ASA | | | (40,125 | ) | | | (157,160 | ) |
pdvWireless, Inc. (e) | | | (4,400 | ) | | | (102,520 | ) |
Starbreeze AB (e) | | | (106,473 | ) | | | (187,045 | ) |
Twilio, Inc. Class A (e) | | | (26,900 | ) | | | (783,059 | ) |
Veeva Systems, Inc. Class A (e) | | | (10,400 | ) | | | (637,624 | ) |
Workday, Inc. Class A (e) | | | (6,600 | ) | | | (640,200 | ) |
| | | | | | | | |
| | | | | | | (5,020,273 | ) |
| | | | | | | | |
Telecommunications (0.7%) | | | | | | | | |
Acacia Communications, Inc. (e) | | | (11,500 | ) | | | (476,905 | ) |
Arista Networks, Inc. (e) | | | (4,500 | ) | | | (674,055 | ) |
Frontier Communications Corp. | | | (80,900 | ) | | | (93,844 | ) |
Inmarsat PLC | | | (63,763 | ) | | | (639,055 | ) |
Quantenna Communications, Inc. (e) | | | (11,100 | ) | | | (210,900 | ) |
Shenandoah Telecommunications Co. | | | (8,400 | ) | | | (257,880 | ) |
TPG Telecom, Ltd. | | | (156,378 | ) | | | (685,095 | ) |
| | | | | | | | |
| | |
Shares | | | Value | |
Telecommunications (continued) | | | | | | | | |
Vocus Group, Ltd. | | | (276,877 | ) | | $ | (717,162 | ) |
| | | | | | | | |
| | | | | | | (3,754,896 | ) |
| | | | | | | | |
Transportation (0.4%) | | | | | | | | |
Golar LNG, Ltd. | | | (12,000 | ) | | | (267,000 | ) |
Groupe Eurotunnel S.E., Registered | | | (58,530 | ) | | | (624,245 | ) |
Nordic American Tankers, Ltd. | | | (52,600 | ) | | | (333,484 | ) |
Scorpio Bulkers, Inc. (e) | | | (94,500 | ) | | | (670,950 | ) |
Singapore Post, Ltd. | | | (363,700 | ) | | | (351,350 | ) |
| | | | | | | | |
| | | | | | | (2,247,029 | ) |
| | | | | | | | |
Total Common Stocks Sold Short
(Cost $100,220,819) | | | | | | | (106,095,027 | ) |
| | | | | | | | |
|
| Exchange-Traded Funds Sold Short (3.2%) (l) | |
∎ SPDR S&P 500 ETF Trust | | | (11,700 | ) | | | (2,829,060 | ) |
∎ United States Oil Fund, L.P. (e) | | | (1,618,000 | ) | | | (15,371,000 | ) |
| | | | | | | | |
Total Exchange-Traded Funds Sold Short
(Cost $19,553,689) | | | | | | | (18,200,060 | ) |
| | | | | | | | |
Total Investments Sold Short
(Proceeds $119,774,508) (m) | | | (21.7 | )% | | | (124,295,087 | ) |
| | | | | | | | |
Total Investments, Net of Investments Sold Short
(Cost $494,802,901) | | | 87.7 | | | | 501,277,113 | |
Other Assets, Less Liabilities | | | 12.3 | | | | 70,533,141 | |
Net Assets | | | 100.0 | % | | $ | 571,810,254 | |
| ‡ | Less than one-tenth of a percent. |
| (a) | Floating rate—Rate shown was the rate in effect as of June 30, 2017. |
| (b) | PIK (“Payment-in-Kind”)—issuer may pay interest or dividends with additional securities and/or in cash. |
| (c) | May be sold to institutional investors only under Rule 144A or securities offered pursuant to Section 4(a)(2) of the Securities Act of 1933, as amended. |
| (d) | Security, or a portion thereof, was maintained in a segregated account at the Portfolio’s custodian as collateral for securities Sold Short (See Note 2(O)). |
| (e) | Non-income producing security. |
| (f) | As of June 30, 2017, cost was $613,677,029 for federal income tax purposes and net unrealized appreciation was as follows: |
| | | | |
Gross unrealized appreciation | | $ | 17,071,134 | |
Gross unrealized depreciation | | | (5,175,963 | ) |
| | | | |
Net unrealized appreciation | | $ | 11,895,171 | |
| | | | |
| (g) | Security, or a portion thereof, was held in the MainStay VP Multi-Strategy Cayman Fund Ltd., which is a wholly-owned subsidiary of the MainStay VP Absolute Return Multi-Strategy Portfolio. |
| (h) | Interest rate shown represents yield to maturity. |
| | | | | | |
The notes to the financial statements are an integral part of,
and should be read in conjunction with, the financial statements. | | | | | 25 | |
Consolidated Portfolio of Investments June 30, 2017 (Unaudited) (continued)
| (i) | Security, or a portion thereof, was maintained in a segregated account at the Portfolio’s custodian as collateral for swap contracts. (See Note 2(L)) |
| (j) | Fair valued security—Represents fair value as measured in good faith under procedures approved by the Board of Trustees. As of June 30, 2017, the total market value of fair valued securities was $(196,120), which represented less than one-tenth of a percent of the Portfolio’s net assets. |
| (k) | Illiquid security—As of June 30, 2017, the total market value of these securities deemed illiquid under procedures approved by the Board of |
| | Trustees was $(190,889), which represented less than one-tenth of a percent of the Portfolio’s net assets. |
| (l) | Exchange-Traded Fund—An investment vehicle that represents a basket of securities that is traded on an exchange. |
| (m) | As of June 30, 2017, cash in the amount of $69,147,223 was on deposit with brokers for short sale transactions. |
As of June 30, 2017, the Portfolio held the following foreign currency forward contracts:
| | | | | | | | | | | | | | | | | | | | | | |
Foreign Currency Sales Contracts | | Expiration
Date | | | Counterparty | | Contract
Amount
Sold | | | Contract
Amount
Purchased | | | Unrealized
Appreciation
(Depreciation) | |
Danish Krone vs. U.S. Dollar | | | 9/21/17 | | | UBS AG | | | DKK | | | | 3,600,000 | | | $ | 549,156 | | | $ | (6,217 | ) |
Euro vs. U.S. Dollar | | | 9/21/17 | | | Societe Generale | | | EUR | | | | 8,100,000 | | | | 9,186,978 | | | | (102,206 | ) |
Euro vs. U.S. Dollar | | | 7/27/17 | | | Societe Generale | | | | | | | 42,942,343 | | | | 48,084,032 | | | | (1,017,793 | ) |
Pound Sterling vs. U.S. Dollar | | | 7/27/17 | | | Societe Generale | | | GBP | | | | 1,400,000 | | | | 1,783,744 | | | | (40,962 | ) |
Swedish Krona vs. U.S. Dollar | | | 9/21/17 | | | Societe Generale | | | SEK | | | | 14,400,000 | | | | 1,676,989 | | | | (39,796 | ) |
Net unrealized appreciation (depreciation) on foreign currency forward contracts | | | $ | (1,206,974 | ) |
As of June 30, 2017, the Portfolio held the following futures contracts1:
| | | | | | | | | | | | | | | | |
Type | | Number of
Contracts
(Short) | | | Expiration
Date | | | Notional
Amount | | | Unrealized
Appreciation
(Depreciation)2 | |
| Euro Bund | | | (8 | ) | | | September 2017 | | | $ | (1,479,038 | ) | | $ | 21,460 | |
| | | | | | | | | | | | |
| 1. | As of June 30, 2017, cash in the amount of $56,486 was on deposit with a broker for futures transactions. |
| 2. | Represents the difference between the value of the contracts at the time they were opened and the value as of June 30, 2017. |
As of June 30, 2017, the Portfolio held the following centrally cleared interest rate swap agreements1:
| | | | | | | | | | | | | | | | | | | | | | | | | | |
Notional
Amount | | | Currency | | | Termination
Date | | | Payments made by Portfolio | | Payments Received by Portfolio | | Upfront
Premiums
Received/
(Paid) | | | Value | | | Unrealized
Appreciation/
(Depreciation)5 | |
| | $15,700,000 | | | | USD | | | | 1/22/2018 | | | Fixed 0.870% | | 3-Month USD-LIBOR | | $ | — | | | $ | 42,634 | | | $ | 42,634 | |
| | 17,460,000 | | | | USD | | | | 2/25/2018 | | | Fixed 0.800% | | 3-Month USD-LIBOR | | | — | | | | 64,730 | | | | 64,730 | |
| | 3,090,000 | | | | USD | | | | 2/25/2026 | | | 3-Month USD-LIBOR | | Fixed 1.605% | | | — | | | | (147,941 | ) | | | (147,941 | ) |
| | 4,090,000 | | | | USD | | | | 1/22/2026 | | | 3-Month USD-LIBOR | | Fixed 1.836% | | | — | | | | (117,494 | ) | | | (117,494 | ) |
| | | | | | | | | | | | | | | | | $ | — | | | $ | (158,071 | ) | | $ | (158,071 | ) |
The following abbreviation are used in the preceding pages:
ADR—American Depositary Receipt
CHF—Swiss Franc
DKK—Danish Krone
ETF—Exchange-Traded Fund
EUR—Euro
GBP—British Pound Sterling
LIBOR—London Interbank Offered Rate
NOK—Norwegian Krone
SEK—Swedish Krona
SPDR—Standard & Poor’s Depositary Receipt
USD—United States Dollar
| | | | |
| 26 | | MainStay VP Absolute Return Multi-Strategy Portfolio | | The notes to the financial statements are an integral part of,
and should be read in conjunction with, the financial statements. |
As of June 30, 2017, the Portfolio held the following centrally cleared credit default swap contracts1:
| | | | | | | | | | | | | | | | | | | | | | | | | | | | |
Reference Entity | | Termination
Date | | | Buy/Sell
Protection2 | | | Notional
Amount
(000)3 | | | (Pay)/ Receive
Fixed
Rate4 | | | Upfront
Premiums
Received/
(Paid) | | | Value | | | Unrealized
Appreciation/
(Depreciation)5 | |
Markit CDX North American Investment Grade Series 27 | | | 12/20/2021 | | | | Sell | | | $ | 19,965 | | | | 1.00 | % | | $ | 249,495 | | | $ | 409,285 | | | $ | 159,790 | |
Markit CDX North American High Yield Series 27 | | | 12/20/2021 | | | | Sell | | | | 32,012 | | | | 5.00 | % | | | 1,841,008 | | | | 2,397,434 | | | | 556,426 | |
iTraxx Europe Crossover Series 27 | | | 6/20/2022 | | | | Buy | | | | EUR 9,700 | | | | (5.00 | )% | | | (930,595 | ) | | | (1,272,091 | ) | | | (341,496 | ) |
iTraxx Europe Senior Financials Series 27 | | | 6/20/2022 | | | | Buy | | | | 3,200 | | | | (1.00 | )% | | | (10,708 | ) | | | (84,915 | ) | | | (74,207 | ) |
| | | | | | | | | | | | | | | | | | | $ | 1,149,200 | | | $ | 1,449,713 | | | $ | 300,513 | |
As of June 30, 2017, the Portfolio held the following OTC credit default swap contracts1:
| | | | | | | | | | | | | | | | | | | | | | | | | | | | | | | | |
Reference Entity | | Counterparty | | | Termination
Date | | | Buy/Sell
Protection2 | | | Notional
Amount
(000)3 | | | (Pay)/ Receive
Fixed
Rate4 | | | Upfront
Premiums
Received/
(Paid) | | | Value | | | Unrealized
Appreciation/
(Depreciation)5 | |
ArcelorMittal
6.125%, 6/01/18 | | | Societe Generale S.A. | | | | 6/20/2022 | | | | Sell | | | | EUR 200 | | | | 5.00 | % | | $ | 26,744 | | | $ | 29,384 | | | $ | 2,983 | |
ArcelorMittal
6.125%, 6/01/18 | | | JP Morgan Chase Bank NA | | | | 6/20/2022 | | | | Sell | | | | 200 | | | | 5.00 | % | | | 22,968 | | | | 29,384 | | | | 6,759 | |
Bayer A.G.
5.625%, 5/23/18 | | | Societe Generale S.A. | | | | 6/20/2021 | | | | Buy | | | | 600 | | | | (1.00 | )% | | | (12,408 | ) | | | (20,584 | ) | | | (8,382 | ) |
Bayer A.G.
5.625%, 5/23/18 | | | Societe Generale S.A. | | | | 12/20/2021 | | | | Buy | | | | 400 | | | | (1.00 | )% | | | (8,066 | ) | | | (14,456 | ) | | | (6,527 | ) |
Casino Guichard Perrachon
4.407%, 8/06/19 | | | BNP Paribas S.A. | | | | 6/20/2022 | | | | Sell | | | | 200 | | | | 1.00 | % | | | (8,377 | ) | | | (6,488 | ) | | | 1,957 | |
Electricite de France S.A.
5.625%, 2/21/33 | | | BNP Paribas S.A. | | | | 6/20/2022 | | | | Buy | | | | 550 | | | | (1.00 | )% | | | (571 | ) | | | (14,462 | ) | | | (14,080 | ) |
Electricite de France S.A. 5.625%, 2/21/33 | | | Societe Generale S.A. | | | | 6/20/2022 | | | | Buy | | | | 800 | | | | (1.00 | )% | | | (9,357 | ) | | | (21,036 | ) | | | (11,954 | ) |
Marks & Spencer PLC
6.125%, 12/02/19 | | | BNP Paribas S.A. | | | | 12/20/2021 | | | | Buy | | | | 400 | | | | (1.00 | )% | | | 9,676 | | | | 4,653 | | | | (5,160 | ) |
Orange S.A.
5.625%, 5/22/18 | | | BNP Paribas S.A. | | | | 6/20/2021 | | | | Buy | | | | 1,200 | | | | (1.00 | )% | | | (16,163 | ) | | | (34,375 | ) | | | (18,624 | ) |
Next PLC
5.375%, 10/26/21 | | | Societe Generale S.A. | | | | 12/20/2021 | | | | Buy | | | | 400 | | | | (1.00 | )% | | | 2,985 | | | | 5,235 | | | | 2,113 | |
Repsol International Fiance 4.875%, 2/19/19 | | | Societe Generale S.A. | | | | 6/20/2022 | | | | Buy | | | | 200 | | | | (1.00 | )% | | | (1,414 | ) | | | (1,004 | ) | | | 341 | |
Tesco PLC
6.000%, 12/14/29 | | | JP Morgan Chase Bank NA | | | | 6/20/2024 | | | | Sell | | | | 400 | | | | 1.00 | % | | | (27,724 | ) | | | (29,462 | ) | | | 1,598 | |
Total Capital S.A.
4.875%, 1/28/19 | | | BNP Paribas S.A. | | | | 6/20/2021 | | | | Buy | | | | 500 | | | | (1.00 | )% | | | (5,861 | ) | | | (16,107 | ) | | | (10,417 | ) |
Total Capital S.A.
4.875%, 1/28/19 | | | Societe Generale S.A. | | | | 6/20/2021 | | | | Buy | | | | 500 | | | | (1.00 | )% | | | (9,967 | ) | | | (16,107 | ) | | | (6,312 | ) |
| | | | | | | | | | | | | | | | | | | | | | | $ | (37,535 | ) | | $ | (105,425 | ) | | $ | (68,901 | ) |
| 1. | As of June 30, 2017, cash in the amount of $2,341,093 was on deposit with a broker for centrally cleared swap agreements. |
| 2. | Buy—Portfolio pays premium and buys credit protection. If a credit event occurs, as defined under the terms of that particular swap agreement, the Portfolio will either (i) receive from the seller of protection an amount equal to the notional amount of the swap and deliver the referenced obligation or underlying securities comprising the referenced index or (ii) receive a net settlement amount in the form of cash or securities equal to the notional amount of the swap less the recovery value of the referenced obligation or underlying securities comprising the referenced index. |
| | | | | | |
The notes to the financial statements are an integral part of,
and should be read in conjunction with, the financial statements. | | | | | 27 | |
Consolidated Portfolio of Investments June 30, 2017 (Unaudited) (continued)
| | Sell—Portfolio receives premium and sells credit protection. If a credit event occurs, as defined under the terms of that particular swap agreement, the Portfolio will either (i) pay to the buyer of protection an amount equal to the notional amount of the swap and take delivery of the referenced obligation or underlying securities comprising the referenced index or (ii) pay a net settlement amount in the form of cash or securities equal to the notional amount of the swap less the recovery value of the referenced obligation or underlying securities comprising the referenced index. |
| 3. | The maximum potential amount the Portfolio could be required to pay as a seller of credit protection or receive as a buyer of credit protection if a credit event occurs as defined under the terms of that particular swap contract. |
| 4. | The annual fixed rate represents the interest received by the Portfolio (as a seller of protection) or paid by the Portfolio (as a buyer of protection) annually on the notional amount of the credit default swap contract. |
| 5. | Represents the difference between the value of the credit default swap contracts at the time they were opened and the value at June 30, 2017. |
Total Return Swap Contracts
Open OTC total return equity swap contracts as of June 30, 2017 were as follows1:
| | | | | | | | | | | | | | | | |
Swap Counterparty | | Reference Obligation | | Rate(s) (Paid)/Received by the Portfolio | | Termination
Date(s) | | | Notional
Amount
Long/
(Short)
(000)* | | | Unrealized
Appreciation | |
UBS AG | | Buzzi Unicem SpA | | Euro OverNight Index Average minus 0.45% | | | 6/25/2018 | | | $ | (402 | ) | | $ | 29,418 | |
Citibank N.A. | | Consumer Staples Select Sector SPDR Fund | | 1 Month LIBOR BBA minus 0.35% | | | 7/28/2017 | | | | (461 | ) | | | 17,667 | |
Citibank N.A. | | CNH Industrial NV | | 1 Month LIBOR BBA minus 0.40% | | | 7/3/2017 | | | | (103 | ) | | | 909 | |
UBS AG | | Danieli & C Officine Meccaniche SpA | | Euro OverNight Index Average minus 0.45% | | | 6/25/2018 | | | | (218 | ) | | | 13,056 | |
Morgan Stanley Capital Services LLC | | Depomed Inc | | US Federal Funds Rate plus 0.45% | | | 2/21/2018 | | | | 307 | | | | 2,110 | |
Citibank N.A. | | Fiat Chrysler Automobiles NV | | 1 Month LIBOR BBA minus 0.40% | | | 7/3/2017 | | | | (120 | ) | | | 8,146 | |
Morgan Stanley Capital Services LLC | | Groupe Fnac SA | | Euro OverNight Index Average plus 0.55% | | | 4/3/2018 | | | | 574 | | | | 72,894 | |
Morgan Stanley Capital Services LLC | | Havas SA | | Euro OverNight Index Average plus 0.55% | | | 3/1/2025 | | | | 810 | | | | 14,087 | |
Citibank N.A. | | Henkel AG & Co KGaA | | 1 Month LIBOR BBA minus 0.40% | | | 7/3/2017 | | | | (726 | ) | | | 31,239 | |
UBS AG | | Lagardere SCA | | Euro OverNight Index Average minus 0.45% | | | 6/25/2018 | | | | (262 | ) | | | 6,723 | |
UBS AG | | London Stock Exchange Group PLC | | 1 Month LIBOR BBA plus 0.40% | | | 6/25/2018 | | | | 367 | | | | 28,207 | |
UBS AG | | Orange SA | | Euro OverNight Index Average minus 0.45% | | | 6/25/2018 | | | | (424 | ) | | | 50,977 | |
Citibank N.A. | | Swatch Group AG/The | | 1 Month LIBOR BBA minus 1.82% | | | 7/3/2017 | | | | (442 | ) | | | 27,392 | |
UBS AG | | Telecom Italia SpA/Milano | | Euro OverNight Index Average minus 0.45% | | | 6/25/2018 | | | | (68 | ) | | | 2,405 | |
Morgan Stanley Capital Services LLC | | VCA Inc | | US Federal Funds Rate plus 0.45% | | | 3/1/2025 | | | | 1,273 | | | | 40 | |
UBS AG | | Vinci SA | | 1 Month LIBOR BBA minus 0.45% | | | 6/25/2018 | | | | (257 | ) | | | 10,638 | |
| | | | | | | | | | | $ | (152 | ) | | $ | 315,908 | |
| | | | | | | | | | | | | | | | |
| | | | | | | | | | | | | Unrealized
Depreciation | |
Citibank N.A. | | Alibaba Group Holding Ltd | | 1 Month LIBOR BBA plus 0.35% | | | 7/28/2017 | | | $ | (667 | ) | | $ | (90,742 | ) |
Morgan Stanley Capital Services LLC | | AMC Entertainment Holdings Inc | | US Federal Funds Rate plus 0.45% | | | 2/21/2018 | | | | 85 | | | | (2,606 | ) |
Morgan Stanley Capital Services LLC | | Brocade Communications System Inc | | US Federal Funds Rate plus 0.45% | | | 3/1/2025 | | | | 1,621 | | | | (10,479 | ) |
Morgan Stanley Capital Services LLC | | Cairo Communication SpA | | Euro OverNight Index Average plus 0.55% | | | 4/3/2018 | | | | 875 | | | | (90,051 | ) |
UBS AG | | Entertainment One Ltd | | 1 Month LIBOR BBA plus 0.40% | | | 6/25/2018 | | | | 493 | | | | (46,386 | ) |
UBS AG | | Gamesa Corp Tecnologica SA | | 1 Month LIBOR BBA plus 0.40% | | | 6/3/2019 | | | | 630 | | | | (48,667 | ) |
Morgan Stanley Capital Services LLC | | GFK SE | | Euro OverNight Index Average plus 0.55% | | | 4/3/2018 | | | | 415 | | | | (4,785 | ) |
| | | | |
| 28 | | MainStay VP Absolute Return Multi-Strategy Portfolio | | The notes to the financial statements are an integral part of,
and should be read in conjunction with, the financial statements. |
| | | | | | | | | | | | | | | | |
Swap Counterparty | | Reference Obligation | | Rate(s) (Paid)/Received by the Portfolio | | Termination
Date(s) | | | Notional
Amount
Long/
(Short)
(000)* | | | Unrealized
Depreciation | |
Morgan Stanley Capital Services LLC | | Haldex AB | | 1 Month Stockholm Interbank Offered Rate plus 0.45% | | | 9/18/2018 | | | $ | 2,294 | | | $ | (25,476 | ) |
Morgan Stanley Capital Services LLC | | J Sainsbury PLC | | Sterling OverNight Index Average plus 0.55% | | | 2/22/2018 | | | | 503 | | | | (64,834 | ) |
UBS AG | | Marriott International Inc/MD | | 1 Month LIBOR BBA plus 0.35% | | | 6/25/2018 | | | | 1,653 | | | | (128,538 | ) |
Morgan Stanley Capital Services LLC | | Shire PLC | | Sterling OverNight Index Average plus 0.55% | | | 2/22/2018 | | | | 339 | | | | (25,047 | ) |
Citibank N.A. | | Swatch Group AG/The | | 1 Month LIBOR BBA plus 0.55% | | | 7/3/2017 | | | | 443 | | | | (23,230 | ) |
UBS AG | | Telecom Italia SpA/Milano | | 1 Month LIBOR BBA plus 0.40% | | | 6/25/2018 | | | | 89 | | | | (5,634 | ) |
Morgan Stanley Capital Services LLC | | Twitter Inc | | US Federal Funds Rate plus 0.45% | | | 2/21/2018 | | | | 167 | | | | (6,070 | ) |
Morgan Stanley Capital Services LLC | | Ubisoft Entertainment SA | | Euro OverNight Index Average plus 0.55% | | | 4/3/2018 | | | | 898 | | | | (16,790 | ) |
| | | | | | | | | | | $ | 9,838 | | | $ | (589,335 | ) |
Open OTC total return basket swap contracts as of June 30, 2017 were as follows1:
| | | | | | | | | | | | | | | | |
Swap Counterparty | | Reference Obligation | | Rate (Paid)/Received
by the Portfolio | | Termination
Date | | | Notional
Amount
(000)* | | | Unrealized
Appreciation/
(Depreciation) | |
Credit Suisse | | Credit Suisse Backwardation Long/Short Excess Return Index ** | | 0.60% | | | 5/31/2017 | | | $ | 14,603 | | | $ | (7,506 | ) |
Credit Suisse | | Credit Suisse Custom 24A Excess Return Index ** | | 1.50% | | | 5/31/2017 | | | | 20,103 | | | | (25,583 | ) |
Credit Suisse | | Credit Suisse Custom 88 Enhanced Excess Return Index ** | | 0.60% | | | 5/31/2017 | | | | 17,034 | | | | (8,661 | ) |
JPMorgan Chase Bank | | JPMorgan JMAB125E Index | | 0.00% | | | 10/31/2017 | | | | 11,756 | | | | — | |
Bank of America Merrill Lynch | | BofA ML Mean Reversion EUR Index Total Return Index | | 1.00% | | | 5/31/2018 | | | | 18,945 | | | | 14,639 | |
Bank of America Merrill Lynch | | BofA ML Commodity Excess Return Index | | 1.00% | | | 5/31/2018 | | | | 19,735 | | | | 377,033 | |
Bank of America Merrill Lynch | | BofA ML Commodity Excess Return Index | | 0.20% | | | 5/31/2018 | | | | 14,050 | | | | 8,494 | |
Bank of America Merrill Lynch | | BofA ML Commodity Excess Return Index | | 0.00% | | | 5/31/2018 | | | | 7,183 | | | | (12,131 | ) |
Bank of America Merrill Lynch | | BofA ML Commodity Excess Return Index | | 0.00% | | | 5/31/2018 | | | | 7,158 | | | | (6,755 | ) |
Societe Generale | | SGI BOSS 1% Index | | 0.60% | | | 6/5/2017 | | | | 19,527 | | | | (17,346 | ) |
Societe Generale | | SGI Smart Market Neutral Commodity 2 Index ** | | 0.60% | | | 6/5/2017 | | | | 17,295 | | | | (9,181 | ) |
Societe Generale | | SGI US Gravity Index | | 0.60% | | | 6/5/2017 | | | | 4,583 | | | | (2,387 | ) |
Societe Generale | | SGI NYLIM Custom US Sector Reversal Index | | 0.60% | | | 6/5/2017 | | | | 21,403 | | | | 10,837 | |
| | | | | | | | | | | $ | 193,375 | | | $ | 321,453 | |
| | | | | | |
The notes to the financial statements are an integral part of,
and should be read in conjunction with, the financial statements. | | | | | 29 | |
Consolidated Portfolio of Investments June 30, 2017 (Unaudited) (continued)
Open OTC Candriam proprietary total return swap contracts as of June 30, 2017 were as follows1:
| | | | | | | | |
Swap Counterparty | | Reference Obligation | | Description | | Unrealized
Appreciation/
(Depreciation) | |
| Societe Generale Newedge UK Limited | | Candriam IG Diversified Futures Index ** | | Total return swap with Societe Generale Newedge UK Limited (“SG Newedge UK”). The swap provides exposure to the total returns of the Candriam Alternative Return Systemat program, calculated on a daily basis with a reference to a managed account owned by SG Newedge UK, a company formed under the laws of England. (Notional Amount $88,626,149)*** | | $ | (598,036 | ) |
| Societe Generale Newedge UK Limited | | Candriam Global Alpha Index | | Total return swap with SG Newedge UK. The swap provides exposure to the returns of the exchange-traded derivatives and OTC foreign exchange forwards for the Candriam Global Alpha strategy, calculated on a daily basis with a reference to a managed account owned by SG Newedge UK, a company formed under the laws of England. (Notional Amount $87,650,127)**** | | | (383,724 | ) |
| | | | | | | $ | (981,760 | ) |
The summaries below provide a breakdown of the derivative contracts comprising the index components of the above Candriam proprietary total return swaps as of June 30, 2017:
Candriam IG Diversified Futures Index
| | | | |
Category | | % Breakdown | |
Financials | | | 82.18 | % |
Financial Commodity Future | | | 66.35 | |
Physical Commodity Future | | | 41.60 | |
Foreign Currency | | | (10.83 | ) |
Physical Index Future | | | (37.46 | ) |
Currency Future | | | (41.84 | ) |
Total | | | 100.00 | % |
| | | | | | | | |
Description | | Sector | | Notional
Amount
(000)* | | Unrealized
Appreciation
(Depreciation) | |
3-Month Euribor Dec19 | | Financials | | (762,295) | | $ | (2,988 | ) |
90Day Euro Future Dec19 | | Financial Commodity Future | | (166,430) | | | 75,901 | |
90Day Sterling Future Dec19 | | Financial Commodity Future | | (135,072) | | | (807 | ) |
AUD/USD Currency Future Sep17 | | Currency Future | | 16,594 | | | (49,323 | ) |
Australian Dollar | | Foreign Currency | | (12) | | | 23 | |
BP Currency Future Sep17 | | Currency Future | | (13,147) | | | 49,315 | |
Brent Crude Future Sep17 | | Physical Commodity Future | | (5,862) | | | (87,168 | ) |
British Pound Sterling | | Foreign Currency | | (934) | | | 6,216 | |
CAC40 10 Euro Future Jul17 | | Physical Index Future | | 944 | | | 11,074 | |
Canadian Currency Future Sep17 | | Currency Future | | 1,232 | | | (2,857 | ) |
CBOE VIX Future Jul17 | | Physical Index Future | | (666) | | | (10,756 | ) |
Copper Future Sep17 | | Physical Commodity Future | | 12,724 | | | (69,041 | ) |
Corn Future Dec17 | | Physical Commodity Future | | (349,344) | | | (51,497 | ) |
Cotton No.2 Future Dec17 | | Physical Commodity Future | | (12,613) | | | 173,053 | |
DAX Index Future Sep17 | | Physical Index Future | | 354 | | | 3,566 | |
DJIA MINI e-CBOT Sep17 | | Physical Index Future | | 514,464 | | | 26,496 | |
Euro | | Foreign Currency | | 250 | | | (1,187 | ) |
Euro FX Currency Future Sep17 | | Currency Future | | 16,675 | | | (77,762 | ) |
| | | | |
| 30 | | MainStay VP Absolute Return Multi-Strategy Portfolio | | The notes to the financial statements are an integral part of,
and should be read in conjunction with, the financial statements. |
| | | | | | | | |
Description | | Sector | | Notional
Amount
(000)* | | Unrealized
Appreciation
(Depreciation) | |
Euro Stoxx 50 Sep17 | | Physical Index Future | | 11,197 | | $ | 134,593 | |
EURO/JPY Future Sep17 | | Currency Future | | 353,621 | | | 39,327 | |
Euro-BTP Future Sep17 | | Financial Commodity future | | (3,074) | | | (2,455 | ) |
Euro-Bund Future Sep17 | | Financial Commodity future | | (11,021) | | | 11,943 | |
Euro-OAT Future Sep17 | | Financial Commodity future | | (11,287) | | | 13,267 | |
FTSE 100 Index Future Sep17 | | Physical Index Future | | 17,131 | | | 135,922 | |
Gasoline RBOB Future Aug17 | | Physical Commodity Future | | (1,547) | | | (17,265 | ) |
Gold 100 OZ Future Aug17 | | Physical Commodity Future | | (21,458) | | | 330,033 | |
Hang Seng Index Future Jul17 | | Physical Index Future | | 575,362 | | | 17,831 | |
Hong Kong Dollar | | Foreign Currency | | 5,155 | | | (288 | ) |
Japanese Yen | | Foreign Currency | | (6) | | | — | |
Japanese Yen Currency Future Sep17 | | Currency Future | | (7,961) | | | 47,489 | |
JPN 10 Year Bond(OSE) Sep17 | | Financial Commodity future | | (127,058) | | | (35,535 | ) |
Korea 3 Year Bond Future Sep17 | | Financial Commodity future | | (77,758) | | | 11,568 | |
Live Cattle Future Aug17 | | Physical Commodity Future | | 5,880 | | | (22,681 | ) |
LME PRI ALUM Future Sep17 | | Physical Commodity Future | | 22,687 | | | 69,299 | |
LME Zinc Future Sep17 | | Physical Commodity Future | | 8,778 | | | 124,303 | |
Mexican Peso Future Sep17 | | Currency Future | | 374 | | | (14,003 | ) |
NASDAQ 100 E-MINI Sep17 | | Physical Index Future | | 5,589 | | | (51,547 | ) |
Natural Gas Future Aug17 | | Physical Commodity Future | | (10,151) | | | 234,569 | |
New Zealand Dollar Future Sep17 | | Currency Future | | 19,678 | | | (56,986 | ) |
Nikkei 225 (SGX) Sep17 | | Physical Index Future | | (769,124) | | | (18,838 | ) |
Russell 2000 Mini Sep17 | | Physical Index Future | | 1,282 | | | 7,525 | |
S&P500 EMINI Future Sep17 | | Physical Index Future | | (18,188) | | | (24,962 | ) |
SA RAND Currency (CME) Sep17 | | Currency Future | | 1,067 | | | (72,552 | ) |
Silver Future Sep17 | | Physical Commodity Future | | (79) | | | 212,806 | |
South Korean Won | | Foreign Currency | | 96,036 | | | (157 | ) |
Soybean Future Nov17 | | Physical Commodity Future | | (1,000,365) | | | (215,281 | ) |
SPI 200 Future Sep17 | | Physical Index Future | | 2,051 | | | (4,090 | ) |
Sugar #11 (WORLD) Oct17 | | Physical Commodity Future | | (7,936) | | | (50,905 | ) |
Topix Index Future Sep17 | | Physical Index Future | | 7,124 | | | 17,508 | |
U.S. 10 Year Note (CBT)Sep17 | | Financial Commodity future | | (25,397) | | | 69,520 | |
U.S. 5 Year Note (CBT) Sep17 | | Financial Commodity future | | (58,566) | | | 94,749 | |
U.S. Long Bond (CBT) Sep17 | | Financial Commodity future | | 153 | | | (507 | ) |
Wheat Future (CBT) Sep17 | | Physical Commodity Future | | 982,350 | | | 416,682 | |
WTI Crude Future Aug17 | | Physical Commodity Future | | (9,037) | | | (160,536 | ) |
| | | | | | | 1,232,604 | |
| | | | | | | | |
Net Cash and Other Receivables/Payables | | | | | | | (1,830,640 | ) |
| | | | | | | | |
Swaps, at Value | | | | | | $ | (598,036 | ) |
| | | | | | | | |
| | | | | | |
The notes to the financial statements are an integral part of,
and should be read in conjunction with, the financial statements. | | | | | 31 | |
Consolidated Portfolio of Investments June 30, 2017 (Unaudited) (continued)
Candriam Global Alpha Index
| | | | |
Category | | % Breakdown | |
Foreign Currency | | | 99.99 | % |
Currency Future | | | 0.01 | |
Index Option | | | 0.00 | † |
Physical Index Future | | | 0.00 | † |
Physical Index Option | | | 0.00 | † |
Financial Commodity Option | | | 0.00 | † |
Equity Index | | | 0.00 | † |
Currency Option | | | 0.00 | † |
Financial Commodity Future | | | 0.00 | † |
Total | | | 100.00 | % |
| | | | | | | | |
Description | | Sector | | Notional
Amount
(000)* | | Unrealized
Appreciation
(Depreciation) | |
£ Future Option Jul17P 128 | | Currency Option | | (1) | | $ | (106 | ) |
£ Future Option Sep17C 130 | | Currency Option | | 332 | | | (55,532 | ) |
£ Future Option Sep17C 133 | | Currency Option | | (165) | | | 39,199 | |
£ Future Option Sep17P 126.5 | | Currency Option | | (40) | | | (4,355 | ) |
90Day Euro Future Sep18 | | Financial Commodity Future | | 105,368 | | | (38,927 | ) |
90Day Euro Future Sep19 | | Financial Commodity Future | | (105,084) | | | 43,252 | |
AUD/USD Currency Future Sep17 | | Currency Future | | 3,212 | | | (9,485 | ) |
AUD/USD Euro 2PM O Sep17C 75.5 | | Currency Option | | (426) | | | 41,941 | |
AUD/USD Euro 2PM O Sep17C 76 | | Currency Option | | 255 | | | (27,875 | ) |
AUD/USD Euro 2PM O Sep17C 78 | | Currency Option | | (124) | | | 21,696 | |
AUD/USD Euro 2PM O Sep17P 74 | | Currency Option | | (30) | | | (3,129 | ) |
Australian 10 Year Bond Future Sep17 | | Financial Commodity Future | | 13,127 | | | (15,640 | ) |
Australian Dollar | | Foreign Currency | | 853 | | | (1,584 | ) |
British Pound Sterling | | Foreign Currency | | 607 | | | (4,013 | ) |
Canadian Currency 2PM OP Aug17C 76 | | Currency Option | | 430 | | | (41,425 | ) |
Canadian Currency 2PM OP Aug17C 78 | | Currency Option | | (106) | | | 20,648 | |
Canadian Currency 2PM OP Jul17C 77 | | Currency Option | | (202) | | | 86,979 | |
Canadian Currency 2PM OP Jul17P 76.5 | | Currency Option | | (11) | | | (1,613 | ) |
Canadian Currency 2PM OP Sep17P 74 | | Currency Option | | (2) | | | (290 | ) |
EUR/JPY Future Sep17 | | Currency Future | | 62,487 | | | 6,860 | |
Eurex Euro Stoxx 50 Weekly Option | | Index Option | | 91 | | | 37,853 | |
Eurex Euro Stoxx 50 Weekly Option | | Index Option | | (37) | | | (17,319 | ) |
Eurib 2yr MidCv O Dec17C 100 | | Financial Commodity Option | | (52) | | | 2,320 | |
Eurib 2yr MidCv O Dec17P 100 | | Financial Commodity Option | | 258 | | | (2,723 | ) |
Eurib 2yr MidCv O Dec17P 99.88 | | Financial Commodity Option | | (170) | | | 252 | |
Euro | | Foreign Currency | | (1,405) | | | 6,631 | |
Euro Currency 2PM OP Aug17C 1.14 | | Currency Option | | (48) | | | 16,514 | |
Euro Currency 2PM OP Aug17C 1.15 | | Currency Option | | (28) | | | 12,139 | |
Euro Currency 2PM OP Dec17C 1.18 | | Currency Option | | 329 | | | (80,989 | ) |
Euro Currency 2PM OP Dec17C 1.2 | | Currency Option | | (163) | | | 47,476 | |
Euro Currency 2PM OP Dec17P 1.11 | | Currency Option | | (111) | | | (11,534 | ) |
| | | | |
| 32 | | MainStay VP Absolute Return Multi-Strategy Portfolio | | The notes to the financial statements are an integral part of,
and should be read in conjunction with, the financial statements. |
| | | | | | | | |
Description | | Sector | | Notional
Amount
(000)* | | Unrealized
Appreciation
(Depreciation) | |
Euro Currency 2PM OP Jul17C 1.14 | | Currency Option | | (41) | | $ | 36,850 | |
Euro Currency 2PM OP Sep17C 1.15 | | Currency Option | | (47) | | | 14,306 | |
Euro FX Currency Future Sep17 | | Currency Future | | (6,128) | | | 28,396 | |
Euro Stoxx 50 Price EUR | | Index Option | | 13 | | | 3,118 | |
Euro Stoxx 50 Price EUR | | Index Option | | 14 | | | 3,075 | |
Euro Stoxx 50 Price EUR | | Index Option | | (2) | | | (46 | ) |
Euro Stoxx 50 Price EUR | | Index Option | | (5) | | | (1,023 | ) |
Euro Stoxx 50 Price EUR | | Index Option | | — | | | (54 | ) |
Euro Stoxx 50 Price EUR | | Index Option | | (2) | | | (853 | ) |
Euro Stoxx 50 Price EUR | | Index Option | | (6) | | | (783 | ) |
Euro Stoxx 50 Sep17 | | Physical Index Future | | (6,370) | | | (76,064 | ) |
Euro Stoxx Bank Sep17 | | Physical Index Future | | 1,638 | | | 41,193 | |
Euro-Bobl Future Sep17 | | Financial Commodity Future | | (33,824) | | | (2,778 | ) |
Euro-Bobl Option Aug17P 131.75 | | Financial Commodity Option | | (39) | | | 3,082 | |
Euro-Bobl Option Aug17P 132 | | Financial Commodity Option | | (112) | | | 6,301 | |
Euro-Bobl Option Aug17P 132.25 | | Financial Commodity Option | | 155 | | | (5,408 | ) |
Euro-Bobl Option Sep17C 131.75 | | Financial Commodity Option | | (199) | | | 6,969 | |
Euro-Bobl Option Sep17C 132.5 | | Financial Commodity Option | | (39) | | | 3,859 | |
Euro-Bobl Option Sep17C 132.75 | | Financial Commodity Option | | (26) | | | 2,664 | |
Euro-Bobl Option Sep17C 133 | | Financial Commodity Option | | (16) | | | 2,852 | |
Euro-Bobl Option Sep17P 131.25 | | Financial Commodity Option | | (85) | | | 6,727 | |
Euro-Bobl Option Sep17P 132 | | Financial Commodity Option | | (303) | | | 10,620 | |
Euro-Bobl Option Sep17P 132.5 | | Financial Commodity Option | | 457 | | | (12,938 | ) |
Euro-Bund Option Aug17C 165 | | Financial Commodity Option | | (9) | | | 1,450 | |
Euro-Bund Option Sep17P 159 | | Financial Commodity Option | | (96) | | | 18 | |
Euro-Bund Option Sep17P 160 | | Financial Commodity Option | | (144) | | | (1,696 | ) |
Euro-Bund Option Sep17P 162 | | Financial Commodity Option | | (14) | | | (285 | ) |
Euro-Bund Option Sep17P 163 | | Financial Commodity Option | | 450 | | | 11,548 | |
FTSE 100 Index | | Index Option | | (8,487) | | | (10,562 | ) |
FTSE 100 Index | | Index Option | | (23,931) | | | 76,642 | |
FTSE MIB Index Jul17 | | Equity Index | | (134) | | | (56,185 | ) |
FTSE MIB Index Jul17 | | Equity Index | | (60) | | | 91,675 | |
FTSE MIB Index Jul17 | | Equity Index | | 134 | | | (166,762 | ) |
FTSE/MIB Index Future Sep17 | | Physical Index Future | | 7,623 | | | 137,002 | |
Hong Kong Dollar | | Foreign Currency | | (1,332) | | | 74 | |
IBEX MINI Index Future Jul17 | | Physical Index Future | | (4,350) | | | (56,902 | ) |
IMM Euro Future Option Dec17P 98.38 | | Financial Commodity Option | | (21) | | | (2,092 | ) |
IMM Euro Future Option Dec17P 98.5 | | Financial Commodity Option | | 70 | | | 8,368 | |
Japanese Yen | | Foreign Currency | | 24,066 | | | (1,491 | ) |
Japanese Yen 2PM OP Aug17P 88 | | Currency Option | | (36) | | | (10,405 | ) |
Japanese Yen 2PM OP Jul17C 92 | | Currency Option | | — | | | 106 | |
Japanese Yen 2PM OP Sep17C 92 | | Currency Option | | (51) | | | 14,195 | |
Japanese Yen 2PM OP Sep17P 87 | | Currency Option | | (170) | | | (42,949 | ) |
Japanese Yen 2PM OP Sep17P 88.5 | | Currency Option | | (85) | | | (17,099 | ) |
| | | | | | |
The notes to the financial statements are an integral part of,
and should be read in conjunction with, the financial statements. | | | | | 33 | |
Consolidated Portfolio of Investments June 30, 2017 (Unaudited) (continued)
| | | | | | | | |
Description | | Sector | | Notional
Amount
(000)* | | Unrealized
Appreciation
(Depreciation) | |
Japanese Yen 2PM OP Sep17P 89.5 | | Currency Option | | 506 | | $ | 85,898 | |
KRW-EUR X-RATE | | Foreign Currency | | (1,182,833,758) | | | 2,901 | |
Long GILT Future Sep17 | | Financial Commodity Future | | (3,409) | | | 3,085 | |
Mexican Peso Future Sep17 | | Currency Future | | 423 | | | (15,728 | ) |
NASDAQ 100 E-MINI Sep17 | | Physical Index Future | | (4,807) | | | 44,046 | |
NASDAQ 100 E-MINI Sep17P 5500 | | Physical Index Option | | (58) | | | (8,469 | ) |
New Zealand Dollar Future Sep17 | | Currency Future | | (3,280) | | | 9,437 | |
Norwegian Krone | | Foreign Currency | | 112 | | | (24 | ) |
Norwegian Krone Sep17 | | Currency Future | | 502,320 | | | (9,485 | ) |
OMX Stockholm 30 Index | | Index Option | | 30 | | | 154 | |
OMX Stockholm 30 Index | | Index Option | | (9) | | | (180 | ) |
Russell 2000 Index/Old | | Index Option | | (120) | | | (11,718 | ) |
Russell 2000 Index/Old | | Index Option | | (28) | | | 17,964 | |
Russell 2000 Index/Old | | Index Option | | 106 | | | (49,376 | ) |
Russian Ruble Future Sep17 | | Currency Future | | (667,748) | | | 37,334 | |
S&P500 EMINI OPTN Dec17P 2050 | | Physical Index Option | | (29) | | | 1,157 | |
S&P500 EMINI OPTN Dec17P 2240 | | Physical Index Option | | 68 | | | (1,571 | ) |
S&P500 EMINI OPTN Sep17C 2430 | | Physical Index Option | | (423) | | | (16,244 | ) |
S&P500 EMINI OPTN Sep17C 2450 | | Physical Index Option | | (151) | | | (7,481 | ) |
SA RAND Currency (CME) Sep17 | | Currency Future | | (444) | | | 29,994 | |
Singapore Dollar | | Foreign Currency | | 9 | | | (22 | ) |
South Korean Won | | Foreign Currency | | 1,632,598 | | | (2,659 | ) |
Stoxx 600 Auto Sep17 | | Physical Index Future | | 4,316 | | | 66,940 | |
Stoxx 600 BAS Sep17 | | Physical Index Future | | 2,426 | | | 64,933 | |
Stoxx 600 Health Sep17 | | Physical Index Future | | 1,866 | | | 8,071 | |
Stoxx 600 RETL Sep17 | | Physical Index Future | | 5,154 | | | 20,208 | |
Stoxx 600 Tech Sep17 | | Physical Index Future | | (1,997) | | | (4,682 | ) |
Stoxx 600 TLCM Sep17 | | Physical Index Future | | 1,417 | | | 9,393 | |
Stoxx Europe 600 Basic Resource | | Index Option | | (46) | | | 61,397 | |
Stoxx Europe 600 Oil & Gas Pri | | Index Option | | 193 | | | 77,990 | |
Stoxx Europe 600 Oil & Gas Pri | | Index Option | | (42) | | | (14,575 | ) |
Stoxx Europe 600 Oil & Gas Pri | | Index Option | | (2) | | | (232 | ) |
Stoxx Europe 600 Oil & Gas Pri | | Index Option | | (422) | | | 68,435 | |
Stoxx Europe 600 Utilities Pri | | Index Option | | 46 | | | 9,211 | |
Stoxx Europe 600 Utilities Pri | | Index Option | | (4) | | | (30 | ) |
Stoxx Europe 600 Utilities Pri | | Index Option | | (36) | | | 14,448 | |
Swedish Krona | | Foreign Currency | | (602) | | | 456 | |
Swiss Franc | | Foreign Currency | | (289) | | | 1,196 | |
TRY/USD Future Sep17 | | Currency Future | | 9,357 | | | (78,155 | ) |
Turkish Lira | | Foreign Currency | | 28 | | | (72 | ) |
U.S. 10 Year Future Option Sep17C 126.5 | | Financial Commodity Option | | (138) | | | 46,982 | |
U.S. 10 Year Future Option Sep17C 127 | | Financial Commodity Option | | (9) | | | 3,251 | |
U.S. 10 Year Note (CBT)Sep17 | | Financial Commodity Future | | 77,943 | | | (211,986 | ) |
U.S. 5 Year Future Option Sep17C118.25 | | Financial Commodity Option | | (9) | | | 2,981 | |
| | | | |
| 34 | | MainStay VP Absolute Return Multi-Strategy Portfolio | | The notes to the financial statements are an integral part of,
and should be read in conjunction with, the financial statements. |
| | | | | | | | |
Description | | Sector | | Notional
Amount
(000)* | | Unrealized
Appreciation
(Depreciation) | |
U.S. 5 Year Future Option Sep17P 117.5 | | Financial Commodity Option | | (125) | | $ | (20,586 | ) |
U.S. 5 Year Note (CBT) Sep17 | | Financial Commodity Future | | (34,928) | | | 56,144 | |
Yen Denom Nikkei Sep17 | | Physical Index Future | | (9,056) | | | (28,899 | ) |
| | | | | | | 373,768 | |
| | | | | | | | |
Net Cash and Other Receivables/Payables | | | | | | | (757,492 | ) |
| | | | | | | | |
Swaps, at Value | | | | | | $ | (383,724 | ) |
| | | | | | | | |
| 1. | As of June 30, 2017, cash in the amount of $2,027,623 was on deposit with brokers for total return equity swap contracts. |
| * | Notional amounts reflected as a positive value indicate a long position held by the Portfolio or Index and a negative value indicates a short position. |
| ** | The total return swap is held in the MainStay VP Multi-Strategy Cayman Fund Ltd., which is a wholly-owned subsidiary of the MainStay VP Absolute Return Multi-Strategy Portfolio. |
| *** | The investment portfolio of the managed account is comprised at any given time of trading positions selected by Candriam France S.A.S. that include exchange traded futures in relation to any commodity, currency, interest rate, bond or equity index traded on certain exchanges. Under the terms of the swap, the advisor has the ability to periodically adjust the notional level of the swap. The swap was effective on June 24, 2015 and has an open ended term unless terminated by one of the parties. In addition, the terms of the swap provide for a payment to the SG Newedge UK based upon 0.4% per annum accrued on the full notional level of the swap, plus a floating rate (based on LIBOR and Fed Funds) accrued on 15% of the notional of the swap. |
| **** | The investment portfolio of the managed account is comprised at any given time of trading positions selected by Candriam France S.A.S. that include exchange traded derivatives and over the counter derivatives. Under the terms of the swap, the advisor has the ability to periodically adjust the notional level of the swap. The swap was effective on February 26, 2016 and has an open ended term unless terminated by one of the parties. In addition, the terms of the swap provide for a payment to the SG Newedge UK based upon 0.4% per annum accrued on the full notional level of the swap, plus a floating rate (based on LIBOR and Fed Funds) accrued on 15% of the notional of the swap. |
| † | Amount represents less than 0.01%. |
The following is a summary of the fair valuations according to the inputs used as of June 30, 2017, for valuing the Portfolio’s assets and liabilities.
Asset Valuation Inputs
| | | | | | | | | | | | | | | | |
Description | | Quoted
Prices in
Active
Markets for
Identical
Assets (Level 1) | | | Significant
Other
Observable
Inputs (Level 2) | | | Significant
Unobservable
Inputs (Level 3) | | | Total | |
| Investments in Securities (a) | | | | | | | | | | | | | | | | |
| Long-Term Bonds | | | | | | | | | | | | | | | | |
Corporate Bonds | | $ | — | | | $ | 60,567,908 | | | $ | — | | | $ | 60,567,908 | |
Foreign Bonds | | | — | | | | 25,332,408 | | | | — | | | | 25,332,408 | |
| | | | | | | | | | | | | | | | |
| Total Long-Term Bonds | | | — | | | | 85,900,316 | | | | — | | | | 85,900,316 | |
| | | | | | | | | | | | | | | | |
| Common Stocks | | | 159,984,726 | | | | — | | | | — | | | | 159,984,726 | |
| Preferred Stocks | | | 333,965 | | | | — | | | | — | | | | 333,965 | |
| Unaffiliated Investment Companies | | | 1,537,589 | | | | — | | | | — | | | | 1,537,589 | |
| Purchased Put Options | | | 31,181 | | | | — | | | | — | | | | 31,181 | |
| Short-Term Investments | | | | | | | | | | | | | | | | |
Repurchase Agreements | | | — | | | | 226,697,713 | | | | — | | | | 226,697,713 | |
U.S. Governments | | | — | | | | 151,086,710 | | | | — | | | | 151,086,710 | |
| | | | | | | | | | | | | | | | |
| Total Short-Term Investments | | | — | | | | 377,784,423 | | | | — | | | | 377,784,423 | |
| | | | | | | | | | | | | | | | |
| Total Investments in Securities | | | 161,887,461 | | | | 463,684,739 | | | | — | | | | 625,572,200 | |
| | | | | | | | | | | | | | | | |
| Other Financial Instruments | | | | | | | | | | | | | | | | |
Credit Default Swap Contracts (b) | | | — | | | | 730,370 | | | | — | | | | 730,370 | |
Futures Contracts (b) | | | 21,460 | | | | — | | | | — | | | | 21,460 | |
Interest Rate Swap Contracts (b) | | | — | | | | 107,364 | | | | — | | | | 107,364 | |
Total Return Basket Swap Contracts (b) | | | — | | | | 411,002 | | | | — | | | | 411,002 | |
Total Return Equity Swap Contracts (b) | | | — | | | | 315,908 | | | | — | | | | 315,908 | |
| | | | | | | | | | | | | | | | |
| Total Other Financial Instruments | | | 21,460 | | | | 1,564,644 | | | | — | | | | 1,586,104 | |
| | | | | | | | | | | | | | | | |
| Total Investments in Securities and Other Financial Instruments | | $ | 161,908,921 | | | $ | 465,249,383 | | | $ | — | | | $ | 627,158,304 | |
| | | | | | | | | | | | | | | | |
| | | | | | |
The notes to the financial statements are an integral part of,
and should be read in conjunction with, the financial statements. | | | | | 35 | |
Consolidated Portfolio of Investments June 30, 2017 (Unaudited) (continued)
Liability Valuation Inputs
| | | | | | | | | | | | | | | | |
Description | | Quoted
Prices in
Active
Markets for
Identical
Assets (Level 1) | | | Significant
Other
Observable
Inputs (Level 2) | | | Significant
Unobservable
Inputs (Level 3) | | | Total | |
| Common Stocks Sold Short (c) | | $ | (105,898,907 | ) | | $ | (196,120 | ) | | $ | — | | | $ | (106,095,027 | ) |
| Exchange Traded Funds Sold Short | | | (18,200,060 | ) | | | — | | | | — | | | | (18,200,060 | ) |
| Other Financial Instruments | | | | | | | | | | | | | | | | |
Candriam Proprietary Total Return Swap Contracts (b) | | | — | | | | (981,760 | ) | | | — | | | | (981,760 | ) |
Credit Default Swap Contracts (b) | | | — | | | | (498,758 | ) | | | — | | | | (498,758 | ) |
Foreign Currency Forward Contracts (b) | | | — | | | | (1,206,974 | ) | | | — | | | | (1,206,974 | ) |
Interest Rate Swap Contracts (b) | | | — | | | | (265,435 | ) | | | — | | | | (265,435 | ) |
Total Return Basket Swap Contracts (b) | | | — | | | | (89,550 | ) | | | — | | | | (89,550 | ) |
Total Return Equity Swap Contracts (b) | | | — | | | | (589,335 | ) | | | — | | | | (589,335 | ) |
| | | | | | | | | | | | | | | | |
| Total Other Financial Instruments | | | — | | | | (3,631,812 | ) | | | — | | | | (3,631,812 | ) |
| | | | | | | | | | | | | | | | |
| Total Investments in Securities Sold Short and Other Financial Instruments | | $ | (124,098,967 | ) | | $ | (3,827,932 | ) | | $ | — | | | $ | (127,926,899 | ) |
| | | | | | | | | | | | | | | | |
| (a) | For a complete listing of investments and their industries, see the Consolidated Portfolio of Investments. |
| (b) | The value listed for these securities reflects unrealized appreciation (depreciation) as shown on the Consolidated Portfolio of Investments. |
| (c) | The Level 2 securities at $(5,231), $(190,889), and $(0) are held in Aerospace and Defense, Banks, and Mining, respectively, within the Common Stocks Sold Short section of the Consolidated Portfolio of Investments. |
The Portfolio recognizes transfers between the levels as of the beginning of the period.
As of June 30, 2017, certain foreign equity securities with a market value of $10,224,327 were transferred from Level 2 to Level 1 as the prices of these securities were based on observable quoted prices in active markets. (See Note 2)
As of June 30, 2017, the Portfolio did not hold any investments with significant unobservable inputs (Level 3). (See Note 2)
The following is a reconciliation of investments in which significant unobservable inputs (Level 3) were used in determining value:
| | | | | | | | | | | | | | | | | | | | | | | | | | | | | | | | | | | | | | | | |
Investments in
Securities | | Balance
as of
December 31,
2016 | | | Accrued
Discounts
(Premiums) | | | Realized
Gain
(Loss) | | | Change in
Unrealized
Appreciation
(Depreciation) | | | Purchases | | | Sales | | | Transfers
in to
Level 3 | | | Transfers
out of
Level 3 | | | Balance
as of
June 30,
2017 | | | Change in
Unrealized
Appreciation
(Depreciation)
from
Investments
Still Held at
June 30,
2017 (a) | |
| Common Stocks Sold Short | | | | | | | | | | | | | | | | | | | | | | | | | | | | | | | | | | | | | | | | |
Mining | | $ | (0 | )* | | $ | — | | | $ | — | | | $ | — | | | $ | — | | | $ | — | | | $ | — | | | $ | (0 | )* | | $ | — | | | $ | — | |
| Rights Sold Short | | | | | | | | | | | | | | | | | | | | | | | | | | | | | | | | | | | | | | | | |
Banks | | | (4 | ) | | | — | | | | — | | | | (4 | ) | | | — | | | | — | | | | — | | | | — | | | | — | | | | — | |
Energy Equipment & Services | | | (9,698 | ) | | | — | | | | — | | | | (9,698 | ) | | | — | | | | — | | | | — | | | | — | | | | — | | | | — | |
| | | | | | | | | | | | | | | | | | | | | | | | | | | | | | | | | | | | | | | | |
| Total | | $ | (9,702 | ) | | $ | — | | | $ | — | | | $ | (9,702 | ) | | $ | — | | | $ | — | | | $ | — | | | $ | (0 | )* | | $ | — | | | $ | — | |
| | | | | | | | | | | | | | | | | | | | | | | | | | | | | | | | | | | | | | | | |
| (a) | Included in “Net change in unrealized appreciation (depreciation) on investments sold short” in the Consolidated Statement of Operations. |
| | | | |
| 36 | | MainStay VP Absolute Return Multi-Strategy Portfolio | | The notes to the financial statements are an integral part of,
and should be read in conjunction with, the financial statements. |
Consolidated Statement of Assets and Liabilities as of June 30, 2017 (Unaudited)
| | | | |
| Assets | |
Investment in securities before investments sold short, at value (identified cost $387,879,696) | | $ | 398,874,487 | |
Repurchase agreement, at value (identified cost $226,697,713) | | | 226,697,713 | |
Cash collateral on deposit at broker | | | 73,572,425 | |
Cash denominated in foreign currencies
(identified cost $1,931,633) | | | 1,969,909 | |
Receivables: | | | | |
Dividends and interest | | | 1,411,215 | |
Investment securities sold | | | 843,563 | |
Variation margin on futures contracts | | | 725,561 | |
Fund shares sold | | | 430,384 | |
Variation margin on centrally cleared swap contracts | | | 190,117 | |
Premiums paid for OTC swap contracts | | | 62,373 | |
Unrealized appreciation on OTC swap contracts | | | 741,064 | |
Other assets | | | 3,256 | |
| | | | |
Total assets | | | 705,522,067 | |
| | | | |
| |
| Liabilities | | | | |
Investments sold short (proceeds $119,774,508) | | | 124,295,087 | |
Due to custodian | | | 700,649 | |
Payables: | | | | |
Investment securities purchased | | | 3,869,223 | |
Manager (See Note 3) | | | 596,430 | |
Broker fees and charges on short sales | | | 354,363 | |
Fund shares redeemed | | | 213,522 | |
Custodian | | | 178,274 | |
Premiums received for OTC swap contracts | | | 99,908 | |
NYLIFE Distributors (See Note 3) | | | 79,916 | |
Professional fees | | | 73,568 | |
Dividends on investments sold short | | | 40,061 | |
Shareholder communication | | | 14,656 | |
Trustees | | | 1,007 | |
Transfer agent (See Note 3) | | | 813 | |
Accrued expenses | | | 243,636 | |
Interest expense and fees payable | | | 26 | |
Unrealized depreciation on OTC swap contracts | | | 1,743,700 | |
Unrealized depreciation on foreign currency forward contracts | | | 1,206,974 | |
| | | | |
Total liabilities | | | 133,711,813 | |
| | | | |
Net assets | | $ | 571,810,254 | |
| | | | |
| | | | |
| Composition of Net Assets | | | | |
Shares of beneficial interest outstanding (par value of $.001 per share) unlimited number of shares authorized | | $ | 64,817 | |
Additional paid-in capital | | | 640,029,659 | |
| | | | |
| | | 640,094,476 | |
Undistributed net investment income | | | 1,127,622 | |
Accumulated net realized gain (loss) on investments, investments sold short, futures transactions, written options, swap transactions and foreign currency transactions | | | (73,894,530 | ) |
Net unrealized appreciation (depreciation) on investments, swap contracts and futures contracts | | | 10,156,057 | |
Net unrealized appreciation (depreciation) on investments sold short | | | (4,520,579 | ) |
Net unrealized appreciation (depreciation) on translation of other assets and liabilities in foreign currencies and foreign currency forward contracts | | | (1,152,792 | ) |
| | | | |
Net assets | | $ | 571,810,254 | |
| | | | |
Initial Class | | | | |
Net assets applicable to outstanding shares | | $ | 180,942,178 | |
| | | | |
Shares of beneficial interest outstanding | | | 20,409,445 | |
| | | | |
Net asset value per share outstanding | | $ | 8.87 | |
| | | | |
Service Class | | | | |
Net assets applicable to outstanding shares | | $ | 390,868,076 | |
| | | | |
Shares of beneficial interest outstanding | | | 44,407,971 | |
| | | | |
Net asset value per share outstanding | | $ | 8.80 | |
| | | | |
| | | | | | |
The notes to the financial statements are an integral part of,
and should be read in conjunction with, the financial statements. | | | | | 37 | |
Consolidated Statement of Operations for the six months ended June 30, 2017 (Unaudited)
| | | | |
| Investment Income (Loss) | |
Income | | | | |
Interest | | $ | 2,829,343 | |
Dividends (a) | | | 2,090,867 | |
| | | | |
Total income | | | 4,920,210 | |
| | | | |
Expenses | | | | |
Manager (See Note 3) | | | 4,000,967 | |
Broker fees and charges on short sales | | | 2,372,491 | |
Dividends and interest on investments sold short | | | 636,409 | |
Distribution/Service—Service Class (See Note 3) | | | 468,054 | |
Custodian | | | 317,463 | |
Professional fees | | | 100,889 | |
Shareholder communication | | | 56,754 | |
Interest expense | | | 11,198 | |
Trustees | | | 7,098 | |
Transfer agent (See Note 3) | | | 2,480 | |
Miscellaneous | | | 16,911 | |
| | | | |
Total expenses before waiver/reimbursement | | | 7,990,714 | |
Expense waiver/reimbursement from Manager (See Note 3) | | | (428,283 | ) |
| | | | |
Net expenses | | | 7,562,431 | |
| | | | |
Net investment income (loss) | | | (2,642,221 | ) |
| | | | |
|
| Realized and Unrealized Gain (Loss) on Investments, Futures Contracts, Swap Contracts, Written Options and Foreign Currency Transactions | |
Net realized gain (loss) on: | | | | |
Investment transactions | | | 5,060,941 | |
Investments sold short | | | (39,848 | ) |
Futures transactions | | | (145,255 | ) |
Written option transactions | | | 127,028 | |
Swap transactions | | | (7,459,243 | ) |
Foreign currency transactions | | | (2,788,372 | ) |
| | | | |
Net realized gain (loss) on investments, investments sold short, futures transactions, swap transactions, written option transactions and foreign currency transactions | | | (5,244,749 | ) |
| | | | |
Net change in unrealized appreciation (depreciation) on: | | | | |
Investments | | | (319,211 | ) |
Investments sold short | | | (1,819,382 | ) |
Futures contracts | | | 251,834 | |
Swap contracts | | | (379,299 | ) |
Translation of other assets and liabilities in foreign currencies and foreign currency forward contracts | | | (1,355,018 | ) |
| | | | |
Net change in unrealized appreciation (depreciation) on investments, investments sold short, futures contracts, swap contracts and foreign currency transactions | | | (3,621,076 | ) |
| | | | |
Net realized and unrealized gain (loss) on investments, investments sold short, futures transactions, written options, swap transactions and foreign currency transactions | | | (8,865,825 | ) |
| | | | |
Net increase (decrease) in net assets resulting from operations | | $ | (11,508,046 | ) |
| | | | |
| (a) | Dividends recorded net of foreign withholding taxes in the amount of $101,901 |
| | | | |
| 38 | | MainStay VP Absolute Return Multi-Strategy Portfolio | | The notes to the financial statements are an integral part of,
and should be read in conjunction with, the financial statements. |
Consolidated Statement of Changes in Net Assets
for the six months ended June 30, 2017 (Unaudited) and the year ended December 31, 2016
| | | | | | | | |
| | | 2017 | | | 2016 | |
| Increase (Decrease) in Net Assets | |
Operations: | | | | | | | | |
Net investment income (loss) | | $ | (2,642,221 | ) | | $ | (6,277,823 | ) |
Net realized gain (loss) on investments, investments sold short, futures transactions, written option transactions, swap transactions and foreign currency transactions | | | (5,244,749 | ) | | | 21,454,701 | |
Net change in unrealized appreciation (depreciation) on investments, investments sold short, futures contracts, swap contracts and foreign currency transactions | | | (3,621,076 | ) | | | (9,814,921 | ) |
| | | | |
Net increase (decrease) in net assets resulting from operations | | | (11,508,046 | ) | | | 5,361,957 | |
| | | | |
Capital share transactions: | | | | | | | | |
Net proceeds from sale of shares | | | 52,261,475 | | | | 276,773,421 | |
Cost of shares redeemed | | | (36,665,580 | ) | | | (47,839,006 | ) |
| | | | |
Increase (decrease) in net assets derived from capital share transactions | | | 15,595,895 | | | | 228,934,415 | |
| | | | |
Net increase (decrease) in net assets | | | 4,087,849 | | | | 234,296,372 | |
|
| Net Assets | |
Beginning of period | | | 567,722,405 | | | | 333,426,033 | |
| | | | |
End of period | | $ | 571,810,254 | | | $ | 567,722,405 | |
| | | | |
Net investment income (loss) | | $ | 1,127,622 | | | $ | 3,769,843 | |
| | | | |
| | | | | | |
The notes to the financial statements are an integral part of,
and should be read in conjunction with, the financial statements. | | | | | 39 | |
Consolidated Financial Highlights selected per share data and ratios
| | | | | | | | | | | | | | | | | | | | |
| | | Six months
ended June 30, | | | Year ended December 31, . | | | May 1,
2013 **
through December 31, | |
| Initial Class | | 2017* | | | 2016 | | | 2015 | | | 2014 | | | 2013 | |
Net asset value at beginning of period | | $ | 9.04 | | | $ | 9.03 | | | $ | 9.82 | | | $ | 11.15 | | | $ | 10.00 | |
| | | | | | | | | | | | | | | | | | | | |
Net investment income (loss) (a) | | | (0.03 | ) | | | (0.10 | ) | | | (0.06 | ) | | | (0.08 | ) | | | (0.10 | ) |
Net realized and unrealized gain (loss) on investments | | | (0.07 | ) | | | 0.03 | | | | (0.72 | ) | | | (1.25 | ) | | | 1.25 | |
Net realized and unrealized gain (loss) on foreign currency transactions | | | (0.07 | ) | | | 0.08 | | | | (0.01 | ) | | | (0.00 | )‡ | | | — | |
| | | | | | | | | | | | | | | | | | | | |
Total from investment operations | | | (0.17 | ) | | | 0.01 | | | | (0.79 | ) | | | (1.33 | ) | | | 1.15 | |
| | | | | | | | | | | | | | | | | | | | |
Net asset value at end of period | | $ | 8.87 | | | $ | 9.04 | | | $ | 9.03 | | | $ | 9.82 | | | $ | 11.15 | |
| | | | | | | | | | | | | | | | | | | | |
Total investment return (b) | | | (1.88 | %)(c) | | | 0.11 | % (c) | | | (8.04 | %) | | | (11.93 | %) | | | 11.50 | % (c) |
| Ratios (to average net assets)/Supplemental Data: (d) | | | | | | | | | | | | | | | | | | | | |
Net investment income (loss) | | | (0.76 | %)†† | | | (1.11 | %) | | | (0.59 | %) | | | (0.78 | %) | | | (1.35 | %)†† |
Net expenses | | | 1.44 | % †† | | | 1.46 | % | | | 1.47 | % | | | 1.46 | % | | | 1.54 | % †† |
Expenses (including short sales expenses, before waiver/reimbursement) | | | 2.63 | % †† | | | 2.63 | % | | | 2.00 | % | | | 2.21 | % | | | 2.64 | % †† |
Short sale expenses | | | 1.04 | % †† | | | 0.95 | % | | | 0.53 | % | | | 0.75 | % | | | 1.10 | % †† |
Portfolio turnover rate | | | 84 | % | | | 267 | % | | | 115 | % | | | 113 | % | | | 18 | % |
Net assets at end of period (in 000’s) | | $ | 180,942 | | | $ | 201,252 | | | $ | 3,051 | | | $ | 100,126 | | | $ | 88,557 | |
| ‡ | Less than one cent per share. |
| (a) | Per share data based on average shares outstanding during the period. |
| (b) | Total return does not reflect any deduction of sales charges, mortality and expense charges, contract charges or administrative charges. For periods of less than one year, total return is not annualized. |
| (c) | Total investment return may reflect adjustments to conform to generally accepted accounting principles. |
| (d) | In addition to the fees and expenses which the Portfolio bears directly, the Portfolio indirectly bears a pro-rata share of the fees and expenses of the Exchange-Traded Funds in which it invests. Such indirect expenses are not included in the above expense ratios. |
| | | | | | | | | | | | | | | | | | | | |
| | | Six months
ended June 30, | | | Year ended December 31, . | | | May 1,
2013 **
through December 31, | |
| Service Class | | 2017* | | | 2016 | | | 2015 | | | 2014 | | | 2013 | |
Net asset value at beginning of period | | $ | 8.99 | | | $ | 9.00 | | | $ | 9.79 | | | $ | 11.14 | | | $ | 10.00 | |
| | | | | | | | | | | | | | | | | | | | |
Net investment income (loss) (a) | | | (0.04 | ) | | | (0.12 | ) | | | (0.11 | ) | | | (0.11 | ) | | | (0.11 | ) |
Net realized and unrealized gain (loss) on investments | | | (0.08 | ) | | | 0.03 | | | | (0.67 | ) | | | (1.24 | ) | | | 1.25 | |
Net realized and unrealized gain (loss) on foreign currency transactions | | | (0.07 | ) | | | 0.08 | | | | (0.01 | ) | | | (0.00 | )‡ | | | — | |
| | | | | | | | | | | | | | | | | | | | |
Total from investment operations | | | (0.19 | ) | | | (0.01 | ) | | | (0.79 | ) | | | (1.35 | ) | | | 1.14 | |
| | | | | | | | | | | | | | | | | | | | |
Net asset value at end of period | | $ | 8.80 | | | $ | 8.99 | | | $ | 9.00 | | | $ | 9.79 | | | $ | 11.14 | |
| | | | | | | | | | | | | | | | | | | | |
Total investment return (b)(c) | | | (2.11 | %) | | | (0.11 | %) | | | (8.07 | %) | | | (12.12 | %) | | | 11.40 | % |
| Ratios (to average net assets)/Supplemental Data: (d) | | | | | | | | | | | | | | | | | | | | |
Net investment income (loss) | | | (1.02 | %)†† | | | (1.36 | %) | | | (1.15 | %) | | | (1.04 | %) | | | (1.55 | %)†† |
Net expenses (excluding short sales expenses) | | | 1.68 | % †† | | | 1.71 | % | | | 1.72 | % | | | 1.71 | % | | | 1.79 | % †† |
Expenses (including short sales expenses, before waiver/reimbursement) | | | 2.88 | % †† | | | 2.80 | % | | | 2.51 | % | | | 2.48 | % | | | 2.79 | % †† |
Short sale expenses | | | 1.05 | % †† | | | 0.90 | % | | | 0.79 | % | | | 0.77 | % | | | 1.00 | % †† |
Portfolio turnover rate | | | 84 | % | | | 267 | % | | | 115 | % | | | 113 | % | | | 18 | % |
Net assets at end of period (in 000’s) | | $ | 390,868 | | | $ | 366,470 | | | $ | 330,375 | | | $ | 344,385 | | | $ | 253,022 | |
| ‡ | Less than one cent per share. |
| (a) | Per share data based on average shares outstanding during the period. |
| (b) | Total return does not reflect any deduction of sales charges, mortality and expense charges, contract charges or administrative charges. For periods of less than one year, total return is not annualized. |
| (c) | Total investment return may reflect adjustments to conform to generally accepted accounting principles. |
| (d) | In addition to the fees and expenses which the Portfolio bears directly, the Portfolio indirectly bears a pro-rata share of the fees and expenses of the Exchange-Traded Funds in which it invests. Such indirect expenses are not included in the above expense ratios. |
| | | | |
| 40 | | MainStay VP Absolute Return Multi-Strategy Portfolio | | The notes to the financial statements are an integral part of,
and should be read in conjunction with, the financial statements. |
Notes to Consolidated Financial Statements (Unaudited)
Note 1–Organization and Business
MainStay VP Funds Trust (the “Fund”) was organized as a Delaware statutory trust on February 1, 2011. The Fund is registered under the Investment Company Act of 1940, as amended (the “1940 Act”), as an open-end management investment company. The Fund is comprised of thirty-two separate series (collectively referred to as the “Portfolios”). These consolidated financial statements and notes to consolidated financial statements relate to the MainStay VP Absolute Return Multi-Strategy Portfolio (the “Portfolio”), a “diversified” portfolio, as that term is defined in the 1940 Act, as interpreted or modified by regulatory authorities having jurisdiction, from time to time.
Shares of the Portfolio are currently offered to certain separate accounts to fund variable annuity policies and variable universal life insurance policies issued by New York Life Insurance and Annuity Corporation (“NYLIAC”), a wholly-owned subsidiary of New York Life Insurance Company (“New York Life”). NYLIAC allocates shares of the Portfolios to, among others, NYLIAC Variable Annuity Separate Accounts-I, II, III and IV, VUL Separate Account-I and CSVUL Separate Account-I (collectively, the “Separate Accounts”). Shares of the Portfolio are also sold to the MainStay VP Conservative Allocation Portfolio, MainStay VP Moderate Allocation Portfolio, MainStay VP Moderate Growth Allocation Portfolio and MainStay VP Growth Allocation Portfolio, which operate as “funds-of-funds.”
The Portfolio currently offers two classes of shares. Initial Class and Service Class shares commenced operations on May 1, 2013. Shares of the Portfolio are sold and are redeemed at a price equal to their respective net asset value (“NAV”) per share. No sales or redemption charge is applicable to the purchase or redemption of the Portfolio’s shares. Under the terms of the Fund’s multiple class plan adopted pursuant to Rule 18f-3 under the 1940 Act, the classes differ in that, among other things, Service Class shares of the Portfolio pay a combined distribution and service fee of 0.25% of average daily net assets attributable to Service Class shares of the Portfolio to the Distributor (as defined in Note 3(B)) pursuant to a plan adopted in accordance with Rule 12b-1 under the 1940 Act. Contract owners of variable annuity contracts purchased after June 2, 2003, are permitted to invest only in the Service Class shares.
The Portfolio’s investment objective is to seek long-term growth of capital.
Note 2–Significant Accounting Policies
The Portfolio is an investment company and accordingly follows the investment company accounting and reporting guidance of the Financial Accounting Standards Board (“FASB”) Accounting Standard Codification Topic 946 Financial Services—Investment Companies. The Portfolio prepares its consolidated financial statements in accordance with generally accepted accounting principles (“GAAP”) in the United States of America and follows the significant accounting policies described below.
(A) Securities Valuation. Investments are usually valued as of the close of regular trading on the New York Stock Exchange (the “Exchange”) (usually 4:00 p.m. Eastern time) on each day the Portfolio is open for business (“valuation date”).
The Board of Trustees (the “Board”) of the Fund adopted procedures establishing methodologies for the valuation of the Portfolio’s securities
and other assets and delegated the responsibility for valuation determinations under those procedures to the Valuation Committee of the Fund (the “Valuation Committee”). The Board authorized the Valuation Committee to appoint a Valuation Sub-Committee (the “Sub-Committee”) to deal in the first instance with establishing the prices of securities for which market quotations are not readily available or the prices of which are not otherwise readily determinable under these procedures. The Sub-Committee meets (in person, via electronic mail or via teleconference) on an as-needed basis. Subsequently, the Valuation Committee meets to ensure that actions taken by the Sub-Committee were appropriate. The procedures recognize that, subject to the oversight of the Board and unless otherwise noted, the responsibility for the day-to-day valuation of portfolio assets (including fair value measurements for the Portfolio’s assets and liabilities) rests with New York Life Investment Management LLC (“New York Life Investments” or the “Manager”), aided to whatever extent necessary by the Subadvisors (as defined in Note 3(A)) to the Portfolio.
To assess the appropriateness of security valuations, the Manager, the Subadvisors or the Portfolio’s third party service provider, who is subject to oversight by the Manager, regularly compares prior day prices, prices on comparable securities and the sale prices to the prior and current day prices and challenges prices with changes exceeding certain tolerance levels with third party pricing services or broker sources. For those securities valued through either a standardized fair valuation methodology or a fair valuation measurement, the Sub-Committee deals in the first instance with such valuation and the Valuation Committee reviews and affirms, if appropriate, the reasonableness of the valuation based on such methodologies and measurements on a regular basis after considering all relevant information that is reasonably available. Any action taken by the Sub-Committee with respect to the valuation of a portfolio security or other asset is submitted by the Valuation Committee to the Board for its review and ratification, if appropriate, at its next regularly scheduled meeting.
“Fair value” is defined as the price the Portfolio would reasonably expect to receive upon selling an asset or liability in an orderly transaction to an independent buyer in the principal or most advantageous market for the asset or liability. Fair value measurements are determined within a framework that establishes a three-tier hierarchy which maximizes the use of observable market data and minimizes the use of unobservable inputs to establish a classification of fair value measurements for disclosure purposes. “Inputs” refer broadly to the assumptions that market participants would use in pricing the asset or liability, including assumptions about risk, such as the risk inherent in a particular valuation technique used to measure fair value using a pricing model and/or the risk inherent in the inputs for the valuation technique. Inputs may be observable or unobservable. Observable inputs reflect the assumptions market participants would use in pricing the asset or liability based on market data obtained from sources independent of the Portfolio. Unobservable inputs reflect the Portfolio’s own assumptions about the assumptions market participants would use in pricing the asset or liability based on the information available. The inputs or methodology used for valuing assets or liabilities may not be an indication of the risks associated with investing in those assets or liabilities. The three-tier hierarchy of inputs is summarized below.
| • | | Level 1—quoted prices in active markets for an identical asset or liability |
Notes to Consolidated Financial Statements (Unaudited) (continued)
| • | | Level 2—other significant observable inputs (including quoted prices for a similar asset or liability in active markets, interest rates and yield curves, prepayment speeds, credit risk, etc.) |
| • | | Level 3—significant unobservable inputs (including the Portfolio’s own assumptions about the assumptions that market participants would use in measuring fair value of an asset or liability) |
The level of an asset or liability within the fair value hierarchy is based on the lowest level of an input, both individually and in the aggregate, that is significant to the fair value measurement. As of June 30, 2017, the aggregate value by input level of the Portfolio’s assets and liabilities is included at the end of the Portfolio’s Consolidated Portfolio of Investments.
The Portfolio may use third party vendor evaluations, whose prices may be derived from one or more of the following standard inputs, among others:
| | |
• Benchmark yields | | • Reported trades |
• Broker/dealer quotes | | • Issuer spreads |
• Two-sided markets | | • Benchmark securities |
• Bids/offers | | • Reference data (corporate actions or material event notices) |
• Industry and economic events | | • Comparable bonds |
• Monthly payment information | | |
An asset or liability for which market values cannot be measured using the methodologies described above is valued by methods deemed reasonable in good faith by the Valuation Committee, following the procedures established by the Board, to represent fair value. Under these procedures, the Portfolio generally uses a market-based approach which may use related or comparable assets or liabilities, recent transactions, market multiples, book values, and other relevant information. The Portfolio may also use an income-based valuation approach in which the anticipated future cash flows of the asset or liability are discounted to calculate fair value. Discounts may also be applied due to the nature and/or duration of any restrictions on the disposition of the asset or liability. Fair value represents a good faith approximation of the value of a security. Fair value determinations involve the consideration of a number of subjective factors, an analysis of applicable facts and circumstances and the exercise of judgment. As a result, it is possible that the fair value for a security determined in good faith in accordance with the Portfolio’s valuation procedures may differ from valuations for the same security determined by other funds using their own valuation procedures. Although the Portfolio’s valuation procedures are designed to value a security at the price the Portfolio may reasonably expect to receive upon the security’s sale in an orderly transaction, there can be no assurance that any fair value determination thereunder would, in fact, approximate the amount that the Portfolio would actually realize upon the sale of the security or the price at which the security would trade if a reliable market price were readily available. During the six-month period ended June 30, 2017, there were no material changes to the fair value methodologies.
Securities which may be valued in this manner include, but are not limited to: (i) a security for which trading has been halted or suspended; (ii) a debt security that has recently gone into default and for which there is not a current market quotation; (iii) a security of an issuer that
has entered into a restructuring; (iv) a security that has been de-listed from a national exchange; (v) a security for which the market price is not readily available from a third party pricing source or, if so provided, does not, in the opinion of the Manager or Subadvisors, reflect the security’s market value; (vi) a security subject to trading collars for which no or limited trading takes place; and (vii) a security whose principal market has been temporarily closed at a time when, under normal conditions, it would be open. Securities for which market quotations or observable inputs are not readily available are generally categorized as Level 3 in the hierarchy. As of June 30, 2017, securities that were fair valued in such a manner are shown in the Portfolio of Investments.
Certain securities held by the Portfolio may principally trade in foreign markets. Events may occur between the time the foreign markets close and the time at which the Portfolio’s NAVs are calculated. These events may include, but are not limited to, situations relating to a single issuer in a market sector, significant fluctuations in U.S. or foreign markets, natural disasters, armed conflicts, governmental actions or other developments not tied directly to the securities markets. Should the Manager or Subadvisors conclude that such events may have affected the accuracy of the last price of such securities reported on the local foreign market, the Sub-Committee may, pursuant to procedures adopted by the Board, adjust the value of the local price to reflect the estimated impact on the price of such securities as a result of such events. In this instance, securities are generally categorized as Level 3 in the hierarchy. Additionally, certain foreign equity securities are also fair valued whenever the movement of a particular index exceeds certain thresholds. In such cases, the securities are fair valued by applying factors provided by a third party vendor in accordance with valuation procedures adopted by the Board and are generally categorized as Level 2 in the hierarchy. As of June 30, 2017, securities that were fair valued in such a manner are shown in the Consolidated Portfolio of Investments.
Equity securities and shares of Exchange-Traded Funds (“ETFs”) are valued at the last quoted sales prices as of the close of regular trading on the relevant exchange on each valuation date. Securities that are not traded on the valuation date are valued at the mean of the last quoted bid and ask prices. Prices are normally taken from the principal market in which each security trades. Futures contracts are valued at the last posted settlement price on the market where such futures are primarily traded. Options contracts are valued at the last posted settlement price on the market where such options are primarily traded. These securities are generally categorized as Level 1 in the hierarchy.
Debt securities (other than convertible and municipal bonds) are valued at the evaluated bid prices (evaluated mean prices in the case of convertible and municipal bonds) supplied by a pricing agent or brokers selected by the Manager, in consultation with the Subadvisors. Those values reflect broker/dealer supplied prices and electronic data processing techniques, if the evaluated bid or mean prices are deemed by the Manager, in consultation with the Subadvisors, to be representative of market values at the regular close of trading of the Exchange on each valuation date. Debt securities purchased on a delayed delivery basis are marked to market daily until settlement at the forward settlement date. Debt securities, including corporate bonds, U.S. government & federal agency bonds, municipal bonds, foreign bonds, convertible bonds, asset-backed securities and mortgage-backed securities are generally categorized as Level 2 in the hierarchy.
| | |
| 42 | | MainStay VP Absolute Return Multi-Strategy Portfolio |
Foreign currency forward contracts are valued at their fair market values measured on the basis of the mean between the last current bid and ask prices based on dealer or exchange quotations and are generally categorized as Level 2 in the hierarchy.
Swaps are marked to market daily based upon quotations from pricing agents, brokers, or market makers. These securities are generally categorized as Level 2 in the hierarchy.
Total return swap contracts, which are arrangements to exchange a market-linked return for a periodic payment, are based on a notional principal amount. To the extent that the total return of the security, index or other financial measure underlying the transaction exceeds or falls short of the offsetting interest rate obligation, the Portfolio will receive a payment from or make a payment to the counterparty. Total return swap contracts are marked to market daily based upon quotations from market makers and these securities are generally categorized as Level 2 in the hierarchy.
Temporary cash investments acquired in excess of 60 days to maturity at the time of purchase are valued using the latest bid prices or using valuations based on a matrix system (which considers such factors as security prices, yields, maturities, and ratings), both as furnished by independent pricing services. Other temporary cash investments which mature in 60 days or less at the time of purchase (“Short-Term Investments”) are valued using the amortized cost method of valuation, unless the use of such method would be inappropriate. The amortized cost method involves valuing a security at its cost on the date of purchase and thereafter assuming a constant amortization to maturity of the difference between such cost and the value on maturity date. Amortized cost approximates the current fair value of a security. Securities valued using the amortized cost method are not valued using quoted prices in an active market and are generally categorized as Level 2 in the hierarchy.
The information above is not intended to reflect an exhaustive list of the methodologies that may be used to value portfolio investments. The valuation procedures permit the use of a variety of valuation methodologies in connection with valuing portfolio investments. The methodology used for a specific type of investment may vary based on the market data available or other considerations. The methodologies summarized above may not represent the specific means by which portfolio investments are valued on any particular business day.
A Portfolio security or other asset may be determined to be illiquid under procedures approved by the Board. Illiquidity of a security might prevent the sale of such security at a time when the Manager or Subadvisors might wish to sell, and these securities could have the effect of decreasing the overall level of the Portfolio’s liquidity. Further, the lack of an established secondary market may make it more difficult to value illiquid securities, requiring the Portfolio to rely on judgments that may be somewhat subjective in measuring value, which could vary materially from the amount that the Portfolio could realize upon disposition. Difficulty in selling illiquid securities may result in a loss or may be costly to the Portfolio. Under the supervision of the Board, the Manager or Subadvisors determine the liquidity of the Portfolio’s investments; in doing so, the Manager or Subadvisors may consider various factors, including (i) the frequency of trades and quotations, (ii) the number of dealers and prospective purchasers, (iii) dealer undertakings to make a
market, and (iv) the nature of the security and the market in which it trades (e.g., the time needed to dispose of the security, the method of soliciting offers and the mechanics of transfer). Illiquid securities are often valued in accordance with methods deemed by the Board in good faith to be reasonable and appropriate to accurately reflect their fair value. The liquidity of the Portfolio’s investments, as shown in the Consolidated Portfolio of Investments, was determined as of June 30, 2017 and can change at any time in response to, among other relevant factors, market conditions or events or developments with respect to an individual issuer or instrument. As of June 30, 2017, securities deemed to be illiquid under procedures approved by the Board are shown in the Consolidated Portfolio of Investments.
(B) Income Taxes. The Portfolio’s policy is to comply with the requirements of the Internal Revenue Code of 1986, as amended (the “Internal Revenue Code”), applicable to regulated investment companies and to distribute all of its taxable income to the shareholders of the Portfolio within the allowable time limits. Therefore, no federal, state and local income tax provisions are required.
Management evaluates the Portfolio’s tax positions to determine if the tax positions taken meet the minimum recognition threshold in connection with accounting for uncertainties in income tax positions taken or expected to be taken for the purposes of measuring and recognizing tax liabilities in the consolidated financial statements. Recognition of tax benefits of an uncertain tax position is permitted only to the extent the position is “more likely than not” to be sustained assuming examination by taxing authorities. Management has analyzed the Portfolio’s tax positions taken on federal, state and local income tax returns for all open tax years (for up to three tax years), and has concluded that no provisions for federal, state and local income tax are required in the Portfolio’s consolidated financial statements. The Portfolio’s federal, state and local income and federal excise tax returns for tax years for which the applicable statutes of limitations have not expired are subject to examination by the Internal Revenue Service and state and local departments of revenue.
For U.S. tax purposes, the Cayman Subsidiary (defined in Note 2(U)) is treated as a controlled foreign corporation (“CFC”) of the Portfolio under the Internal Revenue Code. As a U.S. shareholder of a CFC, the Portfolio is required to include its share of the Cayman Subsidiary’s earnings in its taxable income. Any net loss or deficit in earnings generated by the Cayman Subsidiary cannot be deducted by the Portfolio in the period incurred, nor can such loss or deficit in earnings be carried forward to offset the Portfolio’s taxable income and the Cayman Subsidiary’s earnings in future periods. As a Cayman Islands exempted limited company, the Cayman Subsidiary has received an undertaking from the Government of the Cayman Islands exempting it from all local income, profits and capital gains taxes. No such taxes are levied in the Cayman Islands at this time.
With respect to Portfolio investments in the Cayman Subsidiary, the Internal Revenue Service (“IRS”) has issued private letter rulings to regulated investment companies (but not the Portfolio) in which the IRS specifically concluded that income and gains earned by a regulated investment company from its investment in a wholly-owned foreign subsidiary that invests in commodity-linked instruments are qualifying gross income of a regulated investment company for purposes of compliance with Subchapter M of the Internal Revenue Code. However, the
Notes to Consolidated Financial Statements (Unaudited) (continued)
Portfolio is not able to rely on private letter rulings issued to other taxpayers. Additionally, the IRS has suspended the issuance of such private letter rulings, pending review of its position on this matter. The IRS also recently issued proposed regulations that, if finalized, would generally treat the Fund’s income inclusion with respect to the Cayman Subsidiary as qualifying income only if there is a distribution out of the earnings and profits of the Cayman Subsidiary that is attributable to such income inclusion. The proposed regulations, if adopted, would apply to taxable years beginning on or after 90 days after the regulations are published as final.
In connection with investments in the Cayman Subsidiary, the Portfolio has obtained an opinion of counsel that gross income derived by the Portfolio from its investment in the Cayman Subsidiary should constitute qualifying gross income of a regulated investment company under Subchapter M of the Internal Revenue Code. However, no assurances can be provided that the IRS would not be able to successfully assert that the gross income derived by the Portfolio from its investment in the Cayman Subsidiary was not qualifying gross income of a regulated investment company under Subchapter M of the Internal Revenue Code, in which case the Portfolio could fail to qualify as a regulated investment company under Subchapter M of the Internal Revenue Code if less than 90% of its gross income was not derived from such qualifying gross income. If the Portfolio failed to qualify as a regulated investment company, it would be subject to federal and state income tax on all of its taxable income at regular corporate tax rates. This would significantly adversely affect the returns to, and could cause substantial losses for, Portfolio shareholders.
(C) Foreign Taxes. The Portfolio may be subject to foreign taxes on income and other transaction-based taxes imposed by certain countries in which it invests. A portion of the taxes on gains on investments or currency purchases/repatriation may be reclaimable. The Portfolio will accrue such taxes and reclaims as applicable, based upon its current interpretation of tax rules and regulations that exist in the markets in which it invests.
The Portfolio may be subject to taxation on realized capital gains, repatriation proceeds and other transaction-based taxes imposed by certain countries in which it invests. The Portfolio will accrue such taxes as applicable based upon its current interpretation of tax rules and regulations that exist in the market in which it invests. Capital gains taxes relating to positions still held are reflected as a liability on the Consolidated Statement of Assets and Liabilities, as well as an adjustment to the Portfolio’s net unrealized appreciation (depreciation). Taxes related to capital gains realized, if any, are reflected as part of net realized gain (loss) in the Consolidated Statement of Operations. Changes in tax liabilities related to capital gains taxes on unrealized investment gains if any, are reflected as part of the change in net unrealized appreciation (depreciation) on investments in the Consolidated Statement of Operations. Transaction-based charges are generally assessed as a percentage of the transaction amount.
(D) Dividends and Distributions to Shareholders. Dividends and distributions are recorded on the ex-dividend date. The Portfolio intends to declare and pay dividends from net investment income and distributions from net realized capital and currency gains, if any, at least annually. Unless the shareholder elects otherwise, all dividends and distributions are reinvested in the same class of shares of the Portfolio,
at NAV. Dividends and distributions to shareholders are determined in accordance with federal income tax regulations and may differ from GAAP.
(E) Security Transactions and Investment Income. The Portfolio records security transactions on the trade date. Realized gains and losses on security transactions are determined using the identified cost method. Dividend income is recognized on the ex-dividend date; net of any foreign tax withheld at the source, and interest income is accrued as earned using the effective interest rate method. Discounts and premiums on securities purchased, other than Short-Term Investments, for the Portfolio are accreted and amortized, respectively, on the effective interest rate method over the life of the respective securities. Discounts and premiums on Short-Term Investments are accreted and amortized, respectively, on the straight-line method. The straight-line method approximates the effective interest method for Short-Term Investments. Income from payment-in-kind securities is recorded daily based on the effective interest method of accrual.
The Portfolio may invest in master limited partnerships (“MLPs”). To comply with Subchapter M of the Internal Revenue Code, the Portfolio may invest no more than 25% of its total assets in MLPs. Distributions on a MLP are generally recorded based on the characterization reported on the Portfolio’s Form 1065, Schedule K-1, received from the MLP. The Portfolio records its pro rata share of the income and deductions, and capital gains and losses allocated from each MLP on its Consolidated Statement of Operations, as well as adjusts the cost basis of each MLP accordingly, as reported on the Portfolio’s Consolidated Portfolio of Investments.
Distributions received from investments in energy related U.S. royalty trusts and Canadian royalty trusts and exploration and production companies (collectively, “Energy Trusts”) and MLPs generally are comprised of ordinary income, capital gains and return of capital from the Energy Trusts or MLPs. The Portfolio records its investment income on the ex-date of the distributions. For purposes of the consolidated financial statements, the Portfolio uses return of capital and income estimates to allocate the dividend income received. Such estimates are based on historical information available from each Energy Trust, MLP and other industry sources. These estimates may subsequently be revised based on information received from Energy Trusts or MLPs after their tax reporting periods are concluded, as the actual character of these distributions is not known until after the fiscal year end.
The Portfolio estimates the allocation of investment income and return of capital associated with distributions received from MLPs and records this information on the Consolidated Statement of Operations.
Investment income and realized and unrealized gains and losses on investments of the Portfolio are allocated pro rata to the separate classes of shares based upon their relative net assets on the date the income is earned or realized and unrealized gains and losses are incurred.
The Portfolio may place a debt security on non-accrual status and reduce related interest income by ceasing current accruals and writing off all or a portion of any interest receivables when the collection of all or a portion of such interest has become doubtful. A debt security is removed from non-accrual status when the issuer resumes interest payments or when collectability of interest is reasonably assured.
| | |
| 44 | | MainStay VP Absolute Return Multi-Strategy Portfolio |
(F) Expenses. Expenses of the Fund are allocated to the individual Portfolios in proportion to the net assets of the respective Portfolios when the expenses are incurred, except where direct allocations of expenses can be made. Expenses (other than fees incurred under the distribution and service plans, further discussed in Note 3(B), which are charged directly to the Service Class shares) are allocated to separate classes of shares pro rata based upon their relative net assets on the date the expenses are incurred. The expenses borne by the Portfolio, including those of related parties to the Portfolio, are shown in the Consolidated Statement of Operations. Additionally, the Portfolio may invest in shares of ETFs or mutual funds, which are subject to management fees and other fees that may increase their costs versus the costs of owning the underlying securities directly. These indirect expenses of ETFs or mutual funds are not included in the amounts shown as expenses on the Portfolio’s Consolidated Statement of Operations or in the expense ratios included in the Consolidated Financial Highlights.
(G) Use of Estimates. In preparing the consolidated financial statements in conformity with GAAP, management makes estimates and assumptions that affect the reported amounts and disclosures in the consolidated financial statements. Actual results could differ from those estimates.
(H) Repurchase Agreements. The Portfolio may enter into repurchase agreements (i.e., buy a security from another party with the agreement that it be sold back in the future) to earn income. The Portfolio may enter into repurchase agreements only with counterparties, usually financial institutions that are deemed by the Manager or Subadvisors to be creditworthy, pursuant to guidelines established by the Board. During the term of any repurchase agreement, the Manager or Subadvisors will continue to monitor the creditworthiness of the counterparty. Under the 1940 Act, repurchase agreements are considered to be collateralized loans by the Portfolio to the counterparty secured by the securities transferred to the Portfolio.
Repurchase agreements are subject to counterparty risk, meaning the Portfolio could lose money by the counterparty’s failure to perform under the terms of the agreement. The Portfolio mitigates this risk by ensuring the repurchase agreement is collateralized by cash, U.S. government securities, fixed income securities and/or other securities. The collateral is held by the Portfolio’s custodian valued daily on a mark to market basis to determine if the value, including accrued interest, exceeds the repurchase price. In the event of the counterparty’s default on the obligation to repurchase, the Portfolio has the right to liquidate the collateral and apply the proceeds in satisfaction of the obligation. Under certain circumstances, such as in the event of default or bankruptcy by the counterparty, realization and/or retention of the collateral may be limited or subject to delay, to legal proceedings and possible realized loss to the Portfolio.
(I) Futures Contracts. A futures contract is an agreement to purchase or sell a specified quantity of an underlying instrument at a specified future date and price, or to make or receive a cash payment based on the value of a financial instrument (e.g., foreign currency, interest rate, security, or securities index). The Portfolio is subject to risks such as market price risk and/or interest rate risk in the normal course of investing in these transactions. Upon entering into a futures contract, the Portfolio is required to pledge to the broker or futures commission merchant an amount of cash and/or U.S. Government securities equal to
a certain percentage of the collateral amount, known as the “initial margin.” During the period the futures contract is open, changes in the value of the contract are recognized as unrealized appreciation or depreciation by marking to market such contract on a daily basis to reflect the market value of the contract at the end of each day’s trading. The Portfolio agrees to receive from or pay to the broker or futures commission merchant an amount of cash equal to the daily fluctuation in the value of the contract. Such receipts or payments are known as “variation margin.” When the futures contract is closed, the Portfolio records a realized gain or loss equal to the difference between the proceeds from (or cost of) the closing transaction and the Portfolio’s basis in the contract.
The use of futures contracts involves, to varying degrees, elements of market risk in excess of the amount recognized in the Consolidated Statement of Assets and Liabilities. The contract or notional amounts and variation margin reflect the extent of the Portfolio’s involvement in open futures positions. There are several risks associated with the use of futures contracts as hedging techniques. There can be no assurance that a liquid market will exist at the time when the Portfolio seeks to close out a futures contract. If no liquid market exists, the Portfolio would remain obligated to meet margin requirements until the position is closed. Futures may involve a small initial investment relative to the risk assumed, which could result in losses greater than if they had not been used. Futures may be more volatile than direct investments in the instrument underlying the futures, and may not correlate to the underlying instrument, causing a given hedge not to achieve its objectives. The Portfolio’s activities in futures contracts have minimal counterparty risk as they are conducted through regulated exchanges that guarantee the futures against default by the counterparty. In the event of a bankruptcy or insolvency of a futures commission merchant that holds margin on behalf of the Portfolio, the Portfolio may not be entitled to the return of the entire margin owed to the Portfolio, potentially resulting in a loss. The Portfolio’s investment in futures contracts and other derivatives may increase the volatility of the Portfolio’s NAV and may result in a loss to the Portfolio. As of June 30, 2017, all open futures contracts are shown in the Consolidated Portfolio of Investments.
(J) Foreign Currency Forward Contracts. The Portfolio may enter into foreign currency forward contracts, which are agreements to buy or sell foreign currencies on a specified future date at a specified rate. The Portfolio is subject to foreign currency exchange rate risk in the normal course of investing in these transactions. During the period the forward contract is open, changes in the value of the contract are recognized as unrealized appreciation or depreciation by marking to market such contract on a daily basis to reflect the market value of the contract at the end of each day’s trading. Cash movement occurs on settlement date. When the forward contract is closed, the Portfolio records a realized gain or loss equal to the difference between the proceeds from (or cost of) the closing transaction and the Portfolio’s basis in the contract. The Portfolio may purchase and sell foreign currency forward contracts for purposes of seeking to enhance portfolio returns and manage portfolio risk more efficiently. Foreign currency forward contracts may also be used to gain exposure to a particular currency or to hedge against the risk of loss due to changing currency exchange rates. Foreign currency forward contracts to purchase or sell a foreign currency may also be used in anticipation of future purchases
Notes to Consolidated Financial Statements (Unaudited) (continued)
or sales of securities denominated in foreign currency, even if the specific investments have not yet been selected.
The use of foreign currency forward contracts involves, to varying degrees, elements of risk in excess of the amount recognized in the Consolidated Statement of Assets and Liabilities, including counterparty risk, market risk, and illiquidity risk. Counterparty risk is heightened for these instruments because foreign currency forward contracts are not exchange-traded and therefore no clearinghouse or exchange stands ready to meet the obligations under such contracts. Thus, the Portfolio faces the risk that its counterparties under such contracts may not perform their obligations. Market risk is the risk that the value of a foreign currency forward contract will depreciate due to unfavorable changes in exchange rates. Illiquidity risk arises because the secondary market for foreign currency forward contracts may have less liquidity relative to markets for other securities and financial instruments. Risks also arise from the possible movements in the foreign exchange rates underlying these instruments. While the Portfolio may enter into forward contracts to reduce currency exchange risks, changes in currency exchange rates may result in poorer overall performance for the Portfolio than if it had not engaged in such transactions. Exchange rate movements can be large, depending on the currency, and can last for extended periods of time, affecting the value of the Portfolio’s assets. Moreover, there may be an imperfect correlation between the Portfolio’s holdings of securities denominated in a particular currency and forward contracts entered into by the Portfolio. Such imperfect correlation may prevent the Portfolio from achieving the intended hedge or expose the Portfolio to the risk of currency exchange loss. The unrealized appreciation (depreciation) on forward contracts also reflects the Portfolio’s exposure at the valuation date to credit loss in the event of a counterparty’s failure to perform its obligations.
(K) Foreign Currency Transactions. The Portfolio’s books and records are maintained in U.S. dollars. Prices of securities denominated in foreign currency amounts are translated into U.S. dollars at the mean between the buying and selling rates last quoted by any major U.S. bank at the following dates:
| (i) | market value of investment securities, other assets and liabilities—at the valuation date; and |
| (ii) | purchases and sales of investment securities, income and expenses—at the date of such transactions. |
The assets and liabilities that are denominated in foreign currency amounts are presented at the exchange rates and market values at the close of the period. The realized and unrealized changes in net assets arising from fluctuations in exchange rates and market prices of securities are not separately presented.
Net realized gain (loss) on foreign currency transactions represents net gains and losses on foreign currency forward contracts, net currency gains or losses realized as a result of differences between the amounts of securities sale proceeds or purchase cost, dividends, interest and withholding taxes as recorded on the Portfolio’s books, and the U.S. dollar equivalent amount actually received or paid. Net currency gains or losses from valuing such foreign currency denominated assets and liabilities, other than investments at valuation date exchange rates, are reflected in unrealized foreign exchange gains or losses.
(L) Swap Contracts. The Portfolio may enter into credit default, interest rate, equity, index and currency exchange rate contracts (“swaps”). In a typical swap transaction, two parties agree to exchange the future returns (or differentials in rates of future returns) earned or realized at periodic intervals on a particular investment or instrument based on a notional principal amount. Generally, the Portfolio will enter into a swap on a net basis, which means that the two payment streams under the swap are netted, with the Portfolio receiving or paying (as the case may be) only the net amount of the two payment streams. Therefore, the Portfolio’s current obligation under a swap generally will be equal to the net amount to be paid or received under the swap, based on the relative value of notional positions attributable to each counterparty to the swap. The payments may be adjusted for transaction costs, interest payments, the amount of interest paid on the investment or instrument or other factors. Collateral, in the form of cash or securities, may be required to be held in segregated accounts with the custodian bank or broker in accordance with the terms of the swap. Swap agreements are privately negotiated in the over the counter market (“OTC swaps”) and may be executed in a multilateral or other trade facilities platform, such as a registered commodities exchange (“centrally cleared swaps”).
Certain standardized swaps, including certain credit default and interest rate swaps, are subject to mandatory clearing, and more types of standardized swaps are expected to be subject to mandatory clearing in the future. The counterparty risk for cleared derivatives is expected to be generally lower than for uncleared derivatives, but cleared contracts are not risk-free. In a cleared derivative transaction, the Portfolio typically enters into the transaction with a financial institution counterparty, and performance of the transaction is effectively guaranteed by a central clearinghouse, thereby reducing or eliminating the Portfolio’s exposure to the credit risk of its original counterparty. The Portfolio will be required to post specified levels of margin with the clearinghouse or at the instruction of the clearinghouse; the margin required by a clearinghouse may be greater than the margin the Portfolio would be required to post in an uncleared transaction. As of June 30, 2017, all swap positions outstanding are shown in the Consolidated Portfolio of Investments.
Swaps are marked to market daily based upon quotations from pricing agents, brokers, or market makers and the change in value, if any, is recorded as unrealized appreciation or depreciation. Any payments made or received upon entering into a swap would be amortized or accreted over the life of the swap and recorded as a realized gain or loss. Early termination of a swap is recorded as a realized gain or loss. Daily changes in valuation of centrally cleared swaps, if any, are recorded as a receivable or payable for the change in value as appropriate (“variation margin”) on the Consolidated Statement of Assets and Liabilities.
The Portfolio bears the risk of loss of the amount expected to be received under a swap in the event of the default or bankruptcy of the swap counterparty. The Portfolio may be able to eliminate its exposure under a swap either by assignment or other disposition, or by entering into an offsetting swap with the same party or a similar creditworthy party. Swaps are not actively traded on financial markets. Entering into swaps involves elements of credit, market, and documentation risk in excess of the amounts recognized on the Consolidated Statement of
| | |
| 46 | | MainStay VP Absolute Return Multi-Strategy Portfolio |
Assets and Liabilities. Such risks involve the possibilities that there will be no liquid market for these swaps, that the counterparty to the swaps may default on its obligation to perform or disagree as to the meaning of the contractual terms in the swaps and that there may be unfavorable changes in interest rates, the price of the index or the security underlying these transactions.
Interest Rate Swaps: An interest rate swap is an agreement between two parties where one stream of future interest payments is exchanged for another based on a specified principal amount. Interest rate swaps often exchange a fixed payment for a floating payment that is linked to an interest rate (most often LIBOR). The Portfolio will typically use interest rate swaps to limit, or manage, its exposure to fluctuations in interest rates, or to obtain a marginally lower interest rate than it would have been able to get without the swap.
Credit Default Swaps: The Portfolio may enter into credit default swaps to simulate long and short bond positions or to take an active long or short position with respect to the likelihood of a default or credit event by the issuer of the underlying reference obligation. The types of reference obligations underlying the swaps that may be entered into by the Portfolio include debt obligations of a single issuer of corporate or sovereign debt, a basket of obligations of different issuers or a credit index. A credit index is an equally-weighted credit default swap index that is designed to track a representative segment of the credit default swap market (e.g., investment grade, high volatility, below investment grade or emerging markets) and provides an investor with exposure to specific “baskets” of issuers of certain debt instruments. Index credit default swaps have standardized terms including a fixed spread and standard maturity dates. The composition of the obligations within a particular index changes periodically. Credit default swaps involve one party, the protection buyer, making a stream of payments to another party, the protection seller, in exchange for the right to receive a contingent payment if there is a credit event related to the underlying reference obligation. In the event that the reference obligation matures prior to the termination date of the contract, a similar security will be substituted for the duration of the contract term. Credit events are defined under individual swap agreements and generally include bankruptcy, failure to pay, restructuring, repudiation/moratorium, obligation acceleration and obligation default. Selling protection effectively adds leverage to a portfolio up to the notional amount of the swap agreement. Potential liabilities under these contracts may be reduced by: the auction rates of the underlying reference obligations; upfront payments received at the inception of a swap; and net amounts received from credit default swaps purchased with the identical reference obligation.
Equity Swaps (Total Return Swaps): Total return swap contracts are agreements between counterparties to exchange cash flow, one based on a market-linked return of an individual asset or group of assets (such as an index), and the other on a fixed or floating rate. As a total return swap, an equity swap may be structured in different ways. For example, when the Portfolio enters into a “long” equity swap, the counterparty may agree to pay the Portfolio the amount, if any, by which the notional amount of the equity swap would have increased in value had it been invested in a particular referenced security or securities, plus the dividends that would have been received on those securities. In return, the Portfolio will generally agree to pay the counterparty interest on the notional amount of the equity swap plus the amount, if any, by which
that notional amount would have decreased in value had it been invested in such referenced security or securities, plus, in certain instances, commissions or trading spreads on the notional amounts. Therefore, the Portfolio’s return on the equity swap generally should equal the gain or loss on the notional amount, plus dividends on the referenced security or securities less the interest paid by the Portfolio on the notional amount. Alternatively, when the Portfolio enters into a “short” equity swap, the counterparty will generally agree to pay the Portfolio the amount, if any, by which the notional amount of the equity swap would have decreased in value had the Portfolio sold a particular referenced security or securities short, less the dividend expense that the Portfolio would have incurred on the referenced security or securities, as adjusted for interest payments or other economic factors. In this situation, the Portfolio will generally be obligated to pay the amount, if any, by which the notional amount of the swap would have increased in value had it been invested directly in the referenced security or securities.
Equity swaps generally do not involve the delivery of securities or other referenced assets. Accordingly, the risk of loss with respect to equity swaps is normally limited to the net amount of payments that the Portfolio is contractually obligated to make. If the other party to an equity swap defaults, the Portfolio’s risk of loss consists of the net amount of payments that the Portfolio is contractually entitled to receive, if any. The Portfolio will segregate cash or liquid assets, enter into offsetting transactions or use other measures permitted by applicable law to “cover” the Portfolio’s current obligations. The Portfolio and New York Life Investments, however, believe these transactions do not constitute senior securities under the 1940 Act and, accordingly, will not treat them as being subject to the Portfolio’s borrowing restrictions.
Equity swaps are derivatives and their value can be very volatile. The Portfolio may engage in total return swaps to gain exposure to emerging markets securities, along with offsetting long total return swap positions to maintain appropriate currency balances and risk exposures across all swap positions. To the extent that the Manager, or Subadvisors do not accurately analyze and predict future market trends, the values or assets or economic factors, the Portfolio may suffer a loss, which may be substantial.
(M) Rights and Warrants. Rights are certificates that permit the holder to purchase a certain number of shares, or a fractional share, of a new stock from the issuer at a specific price. Warrants are instruments that entitle the holder to buy an equity security at a specific price for a specific period of time. These investments can provide a greater potential for profit or loss than an equivalent investment in the underlying security. Prices of these investments do not necessarily move in tandem with the prices of the underlying securities.
There is risk involved in the purchase of rights and warrants in that these investments are speculative investments. The Portfolio could also lose the entire value of its investment in warrants if such warrants are not exercised by the date of its expiration. The Portfolio is exposed to risk until the sale or exercise of each right or warrant is completed. As of June 30, 2017, the Portfolio did not hold any warrants.
(N) Options Contracts. The Portfolio may write call and put options on securities and financial derivative instruments it owns or in which it may invest. Writing put options tends to increase the Portfolio’s
Notes to Consolidated Financial Statements (Unaudited) (continued)
exposure to the underlying instrument. Writing call options tends to decrease the Portfolio’s exposure to the underlying instrument. When the Portfolio writes a call or put, an amount equal to the premium received is recorded as a liability and subsequently marked to market to reflect the current value of the option written. These liabilities are reflected as written options outstanding on the Consolidated Statement of Assets and Liabilities. Premiums received from writing options which expire are treated as realized gains. Premiums received from writing options which are exercised or closed are added to the proceeds or offset against amounts paid on the underlying futures, swaps, security or currency transaction to determine the realized gain or loss. Certain options may be written with premiums to be determined on a future date. The Portfolio, as a writer of an option, has no control over whether the underlying instrument may be sold (call) or purchased (put) and as a result bears the market risk of an unfavorable change in the price of the instrument underlying the written option. There is the risk the Portfolio may not be able to enter into a closing transaction because of an illiquid market. Writing call options involves risk of loss in excess of the related amounts reflected in the Consolidated Statement of Assets and Liabilities.
The Portfolio may also purchase put and call options. Purchasing call options tends to increase the Portfolio’s exposure to the underlying instrument. Alternatively, purchasing put options tends to decrease the Portfolio’s exposure to the underlying instrument. The Portfolio pays a premium which is included on the Portfolio’s Statement of Assets and Liabilities as an investment and subsequently marked to market to reflect the current value of the option. Premiums paid for purchasing options which expire are treated as realized losses. Certain options may be purchased with premiums to be determined on a future date. The premiums for these options are based upon implied volatility parameters at specified terms. The risk associated with purchasing put and call options is limited to the premium paid. Premiums paid for purchasing options which are exercised or closed are added to the amounts paid or offset against the proceeds on the underlying investment transaction to determine the realized gain or loss when the underlying transaction is sold.
The Portfolio may purchase or write foreign currency options. Purchasing a foreign currency option gives the Portfolio the right, but not the obligation, to buy or sell a specified amount of the currency at a specified rate of exchange that may be exercised on or before the option’s expiration date. Writing a foreign currency option obligates the Portfolio to buy or sell a specified amount of foreign currency at a specified rate of exchange, and such option may be exercised on or before the option’s expiration date in exchange for an option premium. These options may be used as a short or long hedge against possible variations in foreign exchange rates or to gain exposure to foreign currencies. The risks associated with writing a foreign currency put option include the risk that the Portfolio may incur a loss if the value of the referenced foreign currency decreases and the option is exercised. The risks associated with writing a foreign currency call option include the risk that if the value of the referenced foreign currency increases, and if the option is exercised, the Portfolio must either acquire the referenced foreign currency at the then higher price for delivery or, if the Portfolio already owns the referenced foreign currency, forego the opportunity for profit with respect to such foreign currency.
During the six-month period ended June 30, 2017, the Portfolio had the following transactions in written Inflation-Capped Options, Foreign Currency Options and Options on Futures Contracts:
| | | | | | | | |
| | | Notional
Amount | | | Premium | |
Options outstanding at December 31, 2016 | | | — | | | $ | — | |
Options written | | | 29,880,000 | | | | 158,301 | |
Options closed | | | (29,880,000 | ) | | | (158,301 | ) |
Options outstanding at June 30, 2017 | | | — | | | $ | — | |
(O) Securities Sold Short. The Portfolio may engage in sales of securities it does not own (“short sales”) as part of its investment strategies. When the Portfolio enters into a short sale, it must segregate or maintain with a broker the cash proceeds from the security sold short or other securities as collateral for its obligation to deliver the security upon conclusion of the sale. During the period a short position is open, depending on the nature and type of security, a short position is reflected as a liability and is marked to market in accordance with the valuation methodologies previously detailed (See Note 2(A)). Liabilities for securities sold short are closed out by purchasing the applicable securities for delivery to the counterparty broker. A gain, limited to the price at which the Portfolio sold the security short, or a loss, unlimited as to dollar amount, will be recognized upon termination of a short sale if the market price on the date the short position is closed out is less or greater, respectively, than the proceeds originally received. Any such gain or loss may be offset, completely or in part, by the change in the value of the hedged investments. Interest on short positions held is accrued daily, while dividends declared on short positions existing on the record date are recorded on the ex-dividend date as a dividend expense in the Consolidated Statement of Operations. Broker fees and other expenses related to securities sold short are disclosed in the Consolidated Statement of Operations. Short sales involve risk of loss in excess of the related amounts reflected in the Consolidated Statement of Assets and Liabilities.
(P) Securities Lending. In order to realize additional income, the Portfolio may engage in securities lending, subject to the limitations set forth in the 1940 Act and relevant guidance by the staff of the Securities and Exchange Commission (“SEC”). In the event the Portfolio does engage in securities lending, the Portfolio will lend through its custodian, State Street Bank and Trust Company (“State Street”). State Street will manage the Portfolio’s collateral in accordance with the lending agreement between the Portfolio and State Street, and indemnify the Portfolio against counterparty risk. The loans will be collateralized by U.S. Treasury securities at least equal at all times to the market value of the securities loaned. The Portfolio may bear the risk of delay in recovery of, or loss of rights in, the securities loaned should the borrower of the securities experience financial difficulty. The Portfolio may also record a realized gain or loss on securities deemed sold due to a borrower’s inability to return securities on loan. The Portfolio bears the risk of any loss on investment of the collateral. The Portfolio will receive compensation for lending its securities in the form of fees or it will retain a portion of interest on the investment of any cash received as collateral. The Portfolio will also continue to receive interest and dividends on the securities loaned and any gain or loss in the market price of the securities loaned that may occur during the term of the loan will
| | |
| 48 | | MainStay VP Absolute Return Multi-Strategy Portfolio |
be for the account of the Portfolio.During the six-month period ended June 30, 2017, the Portfolio did not have any portfolio securities on loan.
(Q) High-Yield Securities, Energy Company, and Foreign Securities Risk. The Portfolio may invest in high-yield debt securities (commonly referred to as ‘‘junk bonds’’), which are considered speculative because they present a greater risk of loss, including default, than higher quality debt securities. These securities pay investors a premium—a higher interest rate or yield than investment grade debt securities—because of the increased risk of loss. These securities can also be subject to greater price volatility. In times of unusual or adverse market, economic or political conditions, these securities may experience higher than normal default rates. In times of unusual or adverse market, economic or political conditions, these securities may experience higher than normal default rates.
The Portfolio may invest up to 25% of its total assets in securities of domestic and foreign publicly traded partnerships and/or other issuers (including U.S. and Canadian royalty trusts and Canadian energy companies) engaged in the transportation, storage, processing, refining, marketing, exploration, production or mining of crude oil, natural gas, minerals or other natural resources (“Energy Companies”). The Portfolio may be particularly vulnerable to adverse events affecting Energy Companies as a result of its focus in Energy Companies.
The Portfolio may invest as limited partners in the equity securities of MLPs. As limited partners of MLPs, holders of MLP equity securities are subject to certain risks inherent in the structure of MLPs, including (i) tax risks, (ii) the limited ability to elect or remove management or the general partner or managing member, (iii) limited voting rights, except with respect to extraordinary transactions, and (iv) conflicts of interest between the general partner or managing member and its affiliates, on the one hand, and the limited partners or members, on the other hand, including those arising from incentive distribution payments or corporate opportunities.
The Portfolio may invest in foreign securities, which carry certain risks that are in addition to the usual risks inherent in domestic securities. These risks include those resulting from currency fluctuations, future adverse political or economic developments and possible imposition of currency exchange blockages or other foreign governmental laws or restrictions. These risks are likely to be greater in emerging markets than in developed markets. The ability of issuers of debt held by the Portfolio to meet their obligations may be affected, among other things, by economic or political developments in a specific country, industry or region.
The Portfolio may enter into investment transactions which may represent off-balance sheet risk. Off-balance sheet risk exists when the maximum potential loss on a particular investment is greater than the value of such investment, as reflected in the Consolidated Statement of Assets and Liabilities. Off-balance sheet risk generally arises from the use of derivative financial instruments or short sales.
(R) Counterparty Credit Risk. In order to better define its contractual rights and to secure rights that will help the Portfolio mitigate its counterparty risk, the Portfolio may enter into an International Swaps and Derivatives Association, Inc. Master Agreement (“ISDA Master Agreement”) or similar agreement with its counterparties. An ISDA
Master Agreement is a bilateral agreement between the Portfolio and a counterparty that governs certain OTC derivatives and typically contains collateral posting terms and netting provisions. Under an ISDA Master Agreement, the Portfolio may, under certain circumstances, offset with the counterparty certain derivative financial instruments’ payables and/or receivables with collateral held and/or posted and create one single net payment. The provisions of the ISDA Master Agreement typically permit a single net payment in the event of default including the bankruptcy or insolvency of the counterparty. Bankruptcy or insolvency laws of a particular jurisdiction may restrict or prohibit the right of offset in bankruptcy, insolvency or other events. In addition, certain ISDA Master Agreements may contain provisions for early termination of OTC derivative transactions in the event the net assets of the Portfolio decline below specific levels or if the Portfolio fails to meet the terms of its ISDA Master Agreements. The result would cause the Portfolio to accelerate payment of any net liability owed to the counterparty.
For financial reporting purposes, the Portfolio does not offset derivative assets and derivative liabilities that are subject to netting arrangements, if any, in the Consolidated Statement of Assets and Liabilities.
(S) Indemnifications. Under the Fund’s organizational documents, its officers and trustees are indemnified against certain liabilities that may arise out of performance of their duties to the Fund. Additionally, in the normal course of business, the Portfolio enters into contracts with third-party service providers that contain a variety of representations and warranties and which may provide general indemnifications. The Portfolio’s maximum exposure under these arrangements is unknown, as this would involve future claims that may be made against the Portfolio that have not yet occurred. Based on experience, management is of the view that the risk of loss in connection with these potential indemnification obligations is remote. However, there can be no assurance that material liabilities related to such obligations will not arise in the future, which could adversely impact the Portfolio.
(T) Quantitative Disclosure of Derivative Holdings. The following tables show additional disclosures related to the Portfolio’s derivative and hedging activities, including how such activities are accounted for and their effect on the Portfolio’s financial positions, performance and cash flows. The Portfolio entered into futures contracts in order to provide an efficient means of maintaining liquidity while remaining fully invested in the market. These derivatives are not accounted for as hedging instruments. The Portfolio utilizes a range of derivative instruments for a variety of different purposes. Total return swaps (“TRS”) are one form of derivative that is used. In some cases, TRS contracts are entered into so as to affect long and short exposure to individual securities or indices within a particular strategy. In other cases, TRS are used to gain exposure to the strategy itself, which may also use derivatives. For example, a TRS contract is used to generate the return available from a customized index comprised of a diversified basket of exchange-traded futures. Other examples of derivative positions into which the Portfolio has entered include interest rate swaps, credit default swaps and option contracts. These instruments are frequently used to obtain a desired return at a lower cost to the Portfolio than is available when investing directly in the underlying instrument or to hedge against credit and interest rate risks. The Portfolio has also entered into foreign currency forward contracts to gain exposure to a particular currency or to hedge against the risk of loss due to changing currency exchange rates.
Notes to Consolidated Financial Statements (Unaudited) (continued)
Fair value of derivative instruments as of June 30, 2017:
Asset Derivatives
| | | | | | | | | | | | | | | | | | | | | | |
| | | Consolidated
Statement of
Assets and Liabilities
Location | | Foreign
Exchange
Contracts
Risk | | | Equity
Contracts
Risk | | | Credit
Contracts
Risk | | | Interest
Rate
Contracts
Risk | | | Total | |
Purchased Options | | Investments in securities, at value | | $ | — | | | $ | — | | | $ | — | | | $ | 31,181 | | | $ | 31,181 | |
Futures Contracts | | Net Assets-Net unrealized appreciation on investments and futures contracts (a) | | | — | | | | — | | | | — | | | | 21,460 | | | | 21,460 | |
OTC Swap Contracts | | Unrealized appreciation on OTC swap contracts | | | — | | | | 726,910 | | | | 14,154 | | | | — | | | | 741,064 | |
Centrally Cleared Swap Contracts | | Net Assets-Net unrealized appreciation on investments and swap contracts (b) | | | — | | | | — | | | | 716,216 | | | | 107,364 | | | | 823,580 | |
| | | | | | | | | | | | | | | | | | | | | | |
Total Fair Value | | | | $ | — | | | $ | 726,910 | | | $ | 730,370 | | | $ | 160,005 | | | $ | 1,617,285 | |
| | | | | | | | | | | | | | | | | | | | | | |
Liability Derivatives
| | | | | | | | | | | | | | | | | | | | | | |
| | | Consolidated
Statement of
Assets and Liabilities
Location | | Foreign
Exchange
Contracts
Risk | | | Equity
Contracts
Risk | | | Credit
Contracts
Risk | | | Interest
Rate
Contracts
Risk | | | Total | |
OTC Swap Contracts | | Unrealized depreciation on OTC swap contracts | | $ | — | | | $ | (1,660,645 | ) | | $ | (83,055 | ) | | $ | — | | | $ | (1,743,700 | ) |
Centrally Cleared Swap Contracts | | Net Assets-Net unrealized depreciation on investments and swap contracts (b) | | | — | | | | — | | | | (415,703 | ) | | | (265,435 | ) | | | (681,138 | ) |
Forward Contracts | | Unrealized depreciation on foreign currency forward contracts | | | (1,206,974 | ) | | | — | | | | — | | | | — | | | | (1,206,974 | ) |
| | | | | | | | | | | | | | | | | | | | | | |
Total Fair Value | | | | $ | (1,206,974 | ) | | $ | (1,660,645 | ) | | $ | (498,758 | ) | | $ | (265,435 | ) | | $ | (3,631,812 | ) |
| | | | | | | | | | | | | | | | | | | | | | |
| (a) | Includes cumulative appreciation (depreciation) of futures contracts as reported in the Portfolio of Investments. Only current day’s variation margin is reported within the Statement of Assets and Liabilities. |
| (b) | Includes cumulative appreciation (depreciation) of centrally cleared swap agreements as reported in the Portfolio of Investments. Only the current day’s variation margin is reported within the Statement of Assets and Liabilities. |
The effect of derivative instruments on the Consolidated Statement of Operations for the period ended June 30, 2017:
Realized Gain (Loss)
| | | | | | | | | | | | | | | | | | | | | | |
| | | Consolidated
Statement of
Operations
Location | | Foreign
Exchange
Contracts
Risk | | | Equity
Contracts
Risk | | | Credit
Contracts
Risk | | | Interest
Rate
Contracts
Risk | | | Total | |
Purchased Options | | Net realized gain (loss) on investment transactions | | $ | — | | | $ | — | | | $ | — | | | $ | (163,353 | ) | | $ | (163,353 | ) |
Written Options | | Net realized gain (loss) on written option transactions | | | — | | | | — | | | | — | | | | 127,028 | | | | 127,028 | |
Futures Contracts | | Net realized gain (loss) on futures transactions | | | — | | | | 79 | | | | — | | | | (145,334 | ) | | | (145,255 | ) |
Swap Contracts | | Net realized gain (loss) on swap transactions | | | — | | | | (6,869,721 | ) | | | 143,824 | | | | (733,346 | ) | | | (7,459,243 | ) |
Forward Contracts | | Net realized gain (loss) on foreign currency transactions | | | (80,197 | ) | | | — | | | | — | | | | — | | | | (80,197 | ) |
| | | | | | | | | | | | | | | | | | | | | | |
Total Realized Gain (Loss) | | | | $ | (80,197 | ) | | $ | (6,869,642 | ) | | $ | 143,824 | | | $ | (915,005 | ) | | $ | (7,721,020 | ) |
| | | | | | | | | | | | | | | | | | | | | | |
| | |
| 50 | | MainStay VP Absolute Return Multi-Strategy Portfolio |
Change in Unrealized Appreciation (Depreciation)
| | | | | | | | | | | | | | | | | | | | | | |
| | | Consolidated
Statement of
Operations
Location | | Foreign
Exchange
Contracts
Risk | | | Equity
Contracts
Risk | | | Credit
Contracts
Risk | | | Interest
Rate
Contracts
Risk | | | Total | |
Purchased Options | | Net change in unrealized appreciation (depreciation) on investments | | $ | — | | | $ | — | | | $ | — | | | $ | 37,746 | | | $ | 37,746 | |
Futures Contracts | | Net change in unrealized appreciation (depreciation) on futures contracts | | | — | | | | — | | | | — | | | | 251,834 | | | | 251,834 | |
Swap Contracts | | Net change in unrealized appreciation (depreciation) on swap contracts | | | — | | | | (279,686 | ) | | | (237,057 | ) | | | 137,444 | | | | (379,299 | ) |
Forward Contracts | | Net change in unrealized appreciation (depreciation) on translation of other assets and liabilities in foreign currencies and foreign currency forward contracts | | | (1,454,932 | ) | | | — | | | | — | | | | — | | | | (1,454,932 | ) |
| | | | | | | | | | | | | | | | | | | | | | |
Total Change in Unrealized Appreciation (Depreciation) | | $ | (1,454,932 | ) | | $ | (279,686 | ) | | $ | (237,057 | ) | | $ | 427,024 | | | $ | (1,544,651 | ) |
| | | | | | | | | | | | | | | | | | | | | | |
Average Notional Amount
| | | | | | | | | | | | | | | | | | | | |
| | | Foreign
Exchange
Contracts
Risk | | | Equity
Contracts
Risk | | | Credit
Contracts
Risk | | | Interest
Rate
Contracts
Risk | | | Total | |
Purchased Options (a) | | $ | — | | | $ | — | | | $ | — | | | $ | 12,532,000 | | | $ | 12,532,000 | |
Written Options | | $ | — | | | $ | — | | | $ | — | | | $ | (8,400,000 | ) | | $ | (8,400,000 | ) |
Written Swaptions (b) | | $ | — | | | $ | — | | | $ | — | | | $ | (3,000,000 | ) | | $ | (3,000,000 | ) |
Futures Contracts Short | | $ | — | | | $ | — | | | $ | — | | | $ | (8,664,733 | ) | | $ | (8,664,733 | ) |
Swap Contracts Long | | $ | — | | | $ | 357,753,617 | | | $ | 143,041,421 | | | $ | 41,827,500 | | | $ | 542,622,538 | |
Swap Contracts Short | | $ | — | | | $ | (4,103,144 | ) | | $ | — | | | $ | — | | | $ | (4,103,144 | ) |
Forward Contracts Long (a) | | $ | 2,260,319 | | | $ | — | | | $ | — | | | $ | — | | | $ | 2,260,319 | |
Forward Contracts Short | | $ | (81,966,132 | ) | | $ | — | | | $ | — | | | $ | — | | | $ | (81,966,132 | ) |
| | | | | | | | | | | | |
| (a) | Positions were open five months during the reporting period. |
| (b) | Positions were open two months during the reporting period. |
(U) Basis for Consolidation for the Wholly-Owned Subsidiary. MainStay VP Multi-Strategy Cayman Fund Ltd. (the “Cayman Subsidiary”) is organized as an exempted limited company under the laws of the Cayman Islands, and is a wholly-owned and controlled subsidiary of the Portfolio. The Portfolio and the Cayman Subsidiary are both advised by the Manager, and are subject to the same investment restrictions and guidelines as well as follow the same compliance policies and procedures. The Cayman Subsidiary serves as an investment vehicle for the Portfolio to enable the Portfolio to gain exposure to the commodities markets, primarily through investing up to 25% in the aggregate of the Portfolio’s assets in the equity securities of the Cayman Subsidiary. In pursuing its investment objective, the Cayman Subsidiary is expected to invest, directly or indirectly through the use of derivatives (including total return swaps), in securities, commodities, commodity related instruments and other investments. Except where the context otherwise requires, the term “Portfolio” refers to the Portfolio together with the Cayman Subsidiary. As of June 30, 2017, net assets of the Cayman Subsidiary were $63,947,155 representing 11.2% of the Portfolio’s consolidated net assets.
Although the Cayman Subsidiary is otherwise subject to the same fundamental, non-fundamental and certain other investment restrictions
as the Portfolio, the investment programs of the Portfolio and the Cayman Subsidiary are not necessarily identical. The Portfolio currently conducts its commodity investment activities only through the Cayman Subsidiary, but retains the ability to invest in additional Cayman Islands subsidiary entities in the future. The Portfolio is currently the sole shareholder of the Cayman Subsidiary, and it is expected that the Portfolio will remain the sole shareholder and will continue to control the Cayman Subsidiary. As a wholly-owned subsidiary of the Portfolio, all assets, liabilities, income and expenses of the Cayman Subsidiary are consolidated in the financial statements and financial highlights of the Portfolio, and all significant intercompany balances, revenues and expenses have been eliminated in consolidation.
(V) Commodity Futures Trading Commission Regulation. The Portfolio and the Cayman Subsidiary operate subject to Commodity Futures Trading Commission (“CFTC”) regulation and the Manager and Candriam France S.A.S. (“Candriam France” or “Subadvisor”) are registered with the CFTC as a commodity pool operator (“CPO”) and Commodity Trading Advisor (“CTA”), respectively, and each a member of the National Futures Association. The Manager and Candriam France act as CPO and CTA, respectively, to the Portfolio and the Cayman Subsidiary. Accordingly, the Portfolio and the Manager will
Notes to Consolidated Financial Statements (Unaudited) (continued)
comply with certain CFTC rules regarding the disclosure, reporting and recordkeeping requirements that apply with respect to the Portfolio as a result of the Manager’s registration as a CPO. Generally, these rules allow for substituted compliance with CFTC disclosure and shareholder reporting requirements, based on the Portfolio’s compliance with comparable SEC requirements. This means that for most of the CFTC’s disclosure and shareholder reporting applicable to the Manager as the Portfolio’s CPO, the Manager’s compliance with SEC disclosure and shareholder reporting will generally be deemed to fulfill the Manager’s CFTC compliance obligations so long as the Portfolio operates in compliance with the conditions of CFTC Regulation 4.12.
Candriam France operates the Cayman Subsidiary in accordance with an operational exemption from certain CFTC disclosure, reporting and recordkeeping provisions.
As a result of CFTC regulation with respect to the Portfolio and the Cayman Subsidiary, the Portfolio and the Cayman Subsidiary may incur additional compliance and other expenses. The CFTC has neither reviewed nor approved the Portfolio, the Cayman Subsidiary, their investment strategies, or the Portfolio’s Prospectus or Statement of Additional Information.
Note 3–Fees and Related Party Transactions
(A) Manager and Subadvisors. New York Life Investments, a registered investment adviser and an indirect, wholly-owned subsidiary of New York Life Insurance Company (“New York Life”), serves as the Portfolio’s Manager, pursuant to an Amended and Restated Management Agreement (“Management Agreement”). The Manager provides offices, conducts clerical, recordkeeping and bookkeeping services, and keeps most of the financial and accounting records required to be maintained by the Portfolio. Except for the portion of salaries and expenses that are the responsibility of the Portfolio, the Manager pays the salaries and expenses of all personnel affiliated with the Portfolio and certain operational expenses of the Portfolio. The Portfolio reimburses New York Life Investments in an amount equal to a portion of the compensation of the Chief Compliance Officer attributable to the Portfolio. Candriam France, a registered investment adviser serves as a Subadvisor, pursuant to the terms of a Subadvisory Agreement (“Subadvisory Agreement”) between New York Life Investments and Candriam France and, is responsible for the day-to-day portfolio management of a portion of the Portfolio and the Cayman Subsidiary. Cornerstone Capital Management Holdings LLC (“Cornerstone Holdings” or “Subadvisor”), a registered investment adviser and an indirect, wholly-owned subsidiary of New York Life, serves as a Subadvisor, pursuant to the terms of an amended and restated Subadvisory Agreement between New York Life Investments and Cornerstone Holdings and is responsible for the day-to-day portfolio management of a portion of the Portfolio. Cushing® Asset Management, LP (“Cushing” or “Subadvisor”), a registered investment adviser, serves as a Subadvisor, pursuant to the terms of a Subadvisory Agreement between New York Life Investments and Cushing and, is responsible for the day-to-day portfolio management of a portion of the Portfolio. MacKay Shields LLC (‘‘MacKay Shields’’ or “Subadvisor,” and together with Candriam France, Cornerstone Holdings and Cushing, the “Subadvisors”), a registered investment adviser and an indirect, wholly-owned subsidiary of New York Life, serves as a Subadvisor, pursuant to the terms of a
Subadvisory Agreement between New York Life Investments and MacKay Shields and, is responsible for the day-to-day portfolio management of a portion of the Portfolio. New York Life Investments pays for the services of the Subadvisors.
The Cayman Subsidiary has entered into a separate advisory agreement with New York Life Investments for the management of the Cayman Subsidiary’s portfolio pursuant to which the Cayman Subsidiary is obligated to pay New York Life Investments a management fee at the same rate that the Portfolio pays New York Life Investments for services provided to the Portfolio. New York Life Investments is contractually obligated to waive the management fee it receives from the Portfolio in an amount equal to the management fee paid to New York Life Investments by the Cayman Subsidiary. This waiver arrangement may not be terminated by New York Life Investments as long as its advisory agreement with the Cayman Subsidiary is in place.
The Fund, on behalf of the Portfolio, pays New York Life Investments in its capacity as the Portfolio’s investment manager and administrator, pursuant to the Management Agreement, a monthly fee for the services performed and the facilities furnished at an annual rate of the Portfolio’s average daily net assets as follows: 1.25%.
New York Life Investments has contractually agreed to waive fees and/or reimburse expenses so that the total annual operating expenses (excluding taxes, interest, litigation, extraordinary expenses, brokerage and other transaction expenses relating to the purchase or sale of portfolio investments, short sale expense, and acquired (underlying) fund fees and expenses) do not exceed 1.46% and 1.71% for the Initial Class shares and Service Class shares, respectively. This agreement expires on May 1, 2018 and may only be amended or terminated prior to that date by action of the Board.
During the six-month period ended June 30, 2017, New York Life Investments earned fees from the Portfolio in the amount of $4,000,967 and waived its fees and/or reimbursed expenses in the amount of $428,283.
State Street provides sub-administration and sub-accounting services to the Portfolio pursuant to an agreement with New York Life Investments. These services include calculating the daily NAVs of the Portfolio, maintaining the general ledger and sub-ledger accounts for the calculation of the Portfolio’s NAVs, and assisting New York Life Investments in conducting various aspects of the Portfolio’s administrative operations. For providing these services to the Portfolio, State Street is compensated by New York Life Investments.
(B) Distribution and Service Fees. The Fund, on behalf of the Portfolio, has entered into a distribution agreement with NYLIFE Distributors LLC (the “Distributor”), an indirect, wholly-owned subsidiary of New York Life. The Portfolio has adopted a distribution plan (the “Plan”) in accordance with the provisions of Rule 12b-1 under the 1940 Act. Under the Plan, the Distributor has agreed to provide, through its affiliates or independent third parties, various distribution-related, shareholder and administrative support services to the Service Class shareholders. For its services, the Distributor is entitled to a combined distribution and service fee accrued daily and paid monthly at an annual rate of 0.25% of the average daily net assets attributable to the Service Class shares of the Portfolio.
| | |
| 52 | | MainStay VP Absolute Return Multi-Strategy Portfolio |
Note 4–Custodian
State Street is the custodian of cash and securities held by the Portfolio. Custodial fees are charged to the Portfolio based on the Portfolio’s net assets and/or the market value of securities held by the Portfolio and the number of certain transactions incurred by the Portfolio.
Note 5–Line of Credit
The Portfolio and certain other funds managed by New York Life Investments, maintain a line of credit with a syndicate of banks in order to secure a source of funds for temporary purposes to meet unanticipated or excessive redemption requests.
Effective August 1, 2017, under the credit agreement (the “Credit Agreement”), the aggregate commitment amount is $600,000,000 with an additional uncommitted amount of $100,000,000. The commitment fee is an annual rate of 0.15% of the average commitment amount payable quarterly, regardless of usage, to State Street, who serves as the agent to the syndicate. The commitment fee is allocated among the Portfolio and certain other funds managed by New York Life Investments based upon their respective net assets and other factors. Interest on any revolving credit loan is charged based upon the Federal Funds Rate or the one month LIBOR, whichever is higher. The Credit Agreement expires on July 31, 2018, although the Portfolio, certain other funds managed by New York Life Investments and the syndicate of banks may renew the Credit Agreement for an additional year on the same or different terms. Prior to August 1, 2017, the aggregate commitment amount was $600,000,000 with an additional uncommitted amount of $100,000,000, and the commitment fee, under a credit agreement for which Bank of New York Mellon served as agent, was at an annual rate of 0.15% of the average commitment amount. During the six-month period ended June 30, 2017, there were no borrowings made or outstanding with respect to the Portfolio under the credit agreement for which Bank of New York Mellon served as agent.
Note 6–Interfund Lending Program
Pursuant to an exemptive order issued by the SEC, the Portfolio, along with certain other funds managed by New York Life Investments, may participate in an interfund lending program. The interfund lending program provides an alternative credit facility that permits the Portfolio and certain other funds managed by New York Life Investments to lend or borrow money for temporary purposes directly to or from one another subject to the conditions of the exemptive order. During the six-month period ended June 30, 2017, there were no interfund loans made or outstanding with respect to the Portfolio.
Note 7–Purchases and Sales of Securities (in 000’s)
During the six-month period ended June 30, 2017, purchases and sales of U.S. government securities were $0 and $10,542, respectively. Purchases and sales of securities, other than U.S. government securities and short-term securities, were $226,017 and $237,141, respectively.
Note 8–Capital Share Transactions
Transactions in capital shares for the six-month period ended June 30, 2017, and the year ended December 31, 2016, were as follows:
| | | | | | | | |
Initial Class | | Shares | | | Amount | |
Six-month period ended June 30, 2017: | | | | | | | | |
Shares sold | | | 278,228 | | | $ | 2,412,726 | |
Shares redeemed | | | (2,129,114 | ) | | | (18,986,482 | ) |
| | | | |
Net increase (decrease) | | | (1,850,886 | ) | | $ | (16,573,756 | ) |
| | | | |
Year ended December 31, 2016: | | | | | | | | |
Shares sold | | | 22,463,715 | | | $ | 198,067,021 | |
Shares redeemed | | | (541,322 | ) | | | (4,829,306 | ) |
| | | | |
Net increase (decrease) | | | 21,922,393 | | | $ | 193,237,715 | |
| | | | |
|
| |
Service Class | | Shares | | | Amount | |
Six-month period ended June 30, 2017: | | | | | | | | |
Shares sold | | | 5,612,783 | | | $ | 49,848,749 | |
Shares redeemed | | | (1,981,009 | ) | | | (17,679,098 | ) |
| | | | |
Net increase (decrease) | | | 3,631,774 | | | $ | 32,169,651 | |
| | | | |
Year ended December 31, 2016: | | | | | | | | |
Shares sold | | | 8,975,441 | | | $ | 78,706,400 | |
Shares redeemed | | | (4,895,026 | ) | | | (43,009,700 | ) |
| | | | |
Net increase (decrease) | | | 4,080,415 | | | $ | 35,696,700 | |
| | | | |
Note 9–Recent Accounting Pronouncement
In October 2016, the SEC adopted new rules and amended existing rules (together, “final rules”) intended to modernize the reporting and disclosure of information by registered investment companies. In part, the final rules amend Regulation S-X and require standardized, enhanced disclosure about derivatives in investment company financial statements, as well as other amendments. The compliance date for the amendments to Regulation S-X is August 1, 2017 and applies to shareholder reports for funds with fiscal periods ending after August 1, 2017. Management is currently evaluating the impact that the adoption of the amendments to Regulation S-X will have on the Portfolio’s consolidated financial statements and related disclosures.
Note 10–Subsequent Events
In connection with the preparation of the consolidated financial statements of the Portfolio as of and for the six-month period ended June 30, 2017, events and transactions subsequent to June 30, 2017, through the date the consolidated financial statements were issued have been evaluated by the Portfolio’s management for possible adjustment and/or disclosure. No subsequent events requiring financial statement adjustment or disclosure have been identified.
Proxy Voting Policies and Procedures and Proxy Voting Record
A description of the policies and procedures that New York Life Investments uses to vote proxies related to the Portfolio’s securities is available without charge, upon request, (i) by calling 800-598-2019 or (ii) by visiting the SEC’s website at www.sec.gov.
The Portfolio is required to file with the SEC its proxy voting record for the 12-month period ending June 30 on Form N-PX. The Portfolio’s most recent Form N-PX or proxy voting record is available free of charge upon request (i) by calling 800-598-2019 or; (ii) by visiting the SEC’s website at www.sec.gov.
Shareholder Reports and Quarterly Portfolio Disclosure
The Portfolio is required to file its complete schedule of portfolio holdings with the SEC for its first and third fiscal quarters on Form N-Q. The Portfolio’s Form N-Q is available without charge on the SEC’s website at www.sec.gov or by calling MainStay Investments at 800-598-2019. You also can obtain and review copies of Form N-Q by visiting the SEC’s Public Reference Room in Washington, DC (information on the operation of the Public Reference Room may be obtained by calling 1-800-SEC-0330).
| | |
| 54 | | MainStay VP Absolute Return Multi-Strategy Portfolio |
MainStay VP Portfolios
MainStay VP offers a wide range of Portfolios. The full array of MainStay VP offerings is listed here, with information about the manager, subadvisors, legal counsel, and independent registered public accounting firm.
Equity Portfolios
MainStay VP Common Stock Portfolio
MainStay VP Cornerstone Growth Portfolio
MainStay VP Eagle Small Cap Growth Portfolio
MainStay VP Emerging Markets Equity Portfolio
MainStay VP Epoch U.S. Equity Yield Portfolio
MainStay VP Epoch U.S. Small Cap Portfolio
MainStay VP International Equity Portfolio
MainStay VP Large Cap Growth Portfolio
MainStay VP MFS® Utilities Portfolio
MainStay VP Mid Cap Core Portfolio
MainStay VP S&P 500 Index Portfolio
MainStay VP Small Cap Core Portfolio
MainStay VP T. Rowe Price Equity Income Portfolio
MainStay VP VanEck Global Hard Assets Portfolio
Mixed Asset Portfolios
MainStay VP Balanced Portfolio
MainStay VP Convertible Portfolio
MainStay VP Cushing Renaissance Advantage Portfolio
MainStay VP Income Builder Portfolio
MainStay VP Janus Henderson Balanced Portfolio
Income Portfolios
MainStay VP Bond Portfolio
MainStay VP Floating Rate Portfolio
MainStay VP Government Portfolio
MainStay VP High Yield Corporate Bond Portfolio
MainStay VP Indexed Bond Portfolio
MainStay VP PIMCO Real Return Portfolio
MainStay VP Unconstrained Bond Portfolio
Money Market
MainStay VP U.S. Government Money Market Portfolio
Alternative
MainStay VP Absolute Return Multi-Strategy Portfolio
Asset Allocation Portfolios
MainStay VP Conservative Allocation Portfolio
MainStay VP Growth Allocation Portfolio
MainStay VP Moderate Allocation Portfolio
MainStay VP Moderate Growth Allocation Portfolio
Manager
New York Life Investment Management LLC
New York, New York
Subadvisors
Candriam Belgium*
Brussels, Belgium
Candriam France S.A.S.*
Paris, France
Cornerstone Capital Management Holdings LLC*
New York, New York
Cushing Asset Management, LP
Dallas, Texas
Eagle Asset Management, Inc.
St Petersburg, Florida
Epoch Investment Partners, Inc.
New York, New York
Janus Capital Management LLC
Denver, Colorado
MacKay Shields LLC*
New York, New York
Massachusetts Financial Services Company
Boston, Massachusetts
NYL Investors LLC*
New York, New York
Pacific Investment Management Company LLC
Newport Beach, California
T. Rowe Price Associates, Inc.
Baltimore, Maryland
Van Eck Associates Corporation
New York, New York
Winslow Capital Management, LLC
Minneapolis, Minnesota
Distributor
NYLIFE Distributors LLC*
Jersey City, New Jersey
Custodian
State Street Bank and Trust Company
Boston, Massachusetts
Independent Registered Public Accounting Firm
PricewaterhouseCoopers LLP
New York, New York
Legal Counsel
Dechert LLP
Washington, District of Columbia
Some Portfolios may not be available in all products.
* An affiliate of New York Life Investment Management LLC
Not part of the Semiannual Report
2017 Semiannual Report
This report is for the general information of New York Life Variable Annuities and NYLIAC Variable Universal Life Insurance Products policyowners. It must be preceded or accompanied by the appropriate product(s) and funds prospectuses if it is given to anyone who is not an owner of a New York Life variable annuity policy or a NYLIAC Variable Universal Life Insurance Product. This report does not offer for sale or solicit orders to purchase securities.
The performance data quoted in this report represents past performance. Past performance is no guarantee of future results. Due to market volatility and other factors, current performance may be lower or higher than the figures shown. The most recent month-end performance summary for your variable annuity or variable life policy is available by calling 800-598-2019 and is updated periodically on www.newyorklife.com.
The New York Life Variable Annuities and NYLIAC Variable Universal Life Insurance Products are issued by New York Life Insurance and Annuity Corporation (a Delaware Corporation) and distributed by NYLIFE Distributors LLC (Member FINRA/SIPC).
New York Life Insurance Company
New York Life Insurance and Annuity Corporation (NYLIAC) (A Delaware Corporation)
51 Madison Avenue, Room 551
New York, NY 10010
www.newyorklife.com
Printed on recycled paper
mainstayinvestments.com
NYLIFE Distributors LLC, 30 Hudson Street, Jersey City, NJ 07302
New York Life Investment Management LLC is the investment manager to the MainStay VP Funds Trust
©2017 by NYLIFE Distributors LLC. All rights reserved.
You may obtain copies of the Prospectus and the Statement of Additional Information free of charge, upon request, by calling toll-free 800-598-2019 or writing to New York Life Insurance and Annuity Corporation, 51 Madison Avenue, New York, NY 10010.
| | | | |
| Not FDIC Insured | | No Bank Guarantee | | May Lose Value |
| | | | |
| 1743162 | | | | MSVPARM10-08/17 (NYLIAC) NI506 |
MainStay VP Cushing® Renaissance Advantage Portfolio
Message from the President and Semiannual Report
Unaudited | June 30, 2017

Sign up for electronic delivery of your shareholder reports. For full details on electronic delivery, including who can participate and what you
can receive via eDelivery, please log on to www.newyorklife.com/vsc

This page intentionally left blank
Message from the President
The six months ended June 30, 2017, brought positive results to many stock and bond investors. The year began with many investors hoping that Republican control of the White House, the Senate and the House of Representatives could bring an end to political gridlock; and while debate has continued on a number of issues, the U.S. stock market climbed relatively steadily throughout the first half of 2017.
According to FTSE-Russell U.S. market data, stocks at all capitalization levels tended to record positive total returns during the reporting period, with large-cap stocks generally outperforming stocks of smaller-capitalization companies. Growth stocks outpaced value stocks at every capitalization level by substantial margins—from more than six percentage points for micro-caps and mid-caps to more than 10 percentage points for the largest 200 U.S. companies by market capitalization.
Most sectors of the stock market advanced during the reporting period, with energy and telecommunication services being notable exceptions. Energy stocks declined as oil prices fell despite moves by the Organization of Petroleum Exporting Countries (OPEC) intended to limit oil production by its members. Telecommunication services stocks tended to decline as competition increased and rising interest rates made dividend payouts less appealing.
In March and June of 2017, the Federal Reserve announced successive increases in the target range for the federal funds rate, ultimately bringing the federal funds target range to 1.00% to 1.25%. While short-term U.S. Treasury yields rose in response, yields for U.S. Treasury securities with maturities of five years or longer declined. As the difference between short- and long-term yields narrowed, the advantages of higher-yielding long-term bonds became increasingly apparent.
Virtually all taxable and tax-exempt bond sectors provided positive total returns during the reporting period. Mortgage-backed
securities, though providing positive total returns, faced headwinds when the Federal Reserve announced plans to begin normalizing its balance sheet by reducing reinvestment of principal payments on mortgage-backed securities.
International stock and bond markets were also strong during the reporting period. International stocks provided double-digit total returns that were surpassed by emerging-market stocks as a whole. Global investment-grade bonds provided single-digit returns; and emerging-market debt was somewhat stronger.
Even during periods of favorable market performance and generally positive returns, MainStay believes that it is important to carefully monitor your investments. Your risk tolerance may
change over time, leading you to reevaluate which MainStay VP Portfolios are most appropriate for your long-term goals. Your goals themselves may also change, leading you to pursue investments with more or less risk. The portfolio managers of MainStay VP Portfolios seek to provide results consistent with the investment objectives of their respective Portfolios, to give you a wide range of choices suitable to various investment needs.
The report that follows provides more detailed information about the specific markets, securities and investment decisions that influenced your MainStay VP Portfolio during the six months ended June 30, 2017. We invite you to review the report carefully as part of your ongoing investment evaluation and review.
Sincerely,

Stephen P. Fisher
President
The opinions expressed are as of the date of the accompanying report and are subject to change. Past performance is no guarantee of future results. There is no guarantee that any forecasts made will come to pass. This material does not constitute investment advice and is not intended as an endorsement of any specific investment.
Not all MainStay VP Portfolios and/or share classes are available under all policies.
Not part of the Semiannual Report
Table of Contents
Investors should refer to the Portfolio’s Summary Prospectus and/or Prospectus and consider the Portfolio’s investment objectives, strategies, risks, charges and expenses carefully before investing. The Summary Prospectus and/or Prospectus contain this and other information about the Portfolio. You may obtain copies of the Portfolio’s Summary Prospectus and/or the Prospectus and the Statement of Additional Information free of charge, upon request, by calling toll-free 800-598-2019, by writing to New York Life Insurance and Annuity Corporation, 51 Madison Avenue, Room 251, New York, New York 10010 or by sending an email to MainStayShareholdersServices@nylim.com. These documents are also available at mainstayinvestments.com/vpdocuments. Please read the Summary Prospectus and/or Prospectus carefully before investing. MainStay VP Funds Trust portfolios are separate account options which are purchased through a variable insurance or variable annuity contract.
Investment and Performance Comparison (Unaudited)
Performance data quoted represents past performance. Past performance is no guarantee of future results. Because of market volatility and other factors, current performance may be lower or higher than the figures shown. Investment return and principal value will fluctuate, and as a result, when shares are redeemed, they may be worth more or less than their original cost. The performance table and graph do not reflect any deduction of sales charges, mortality and expense charges, contract charges or administrative charges. Please refer to the Performance Summary appropriate for your policy. For performance information current to the most recent month-end, please call 800-598-2019 or visit www.newyorklife.com.
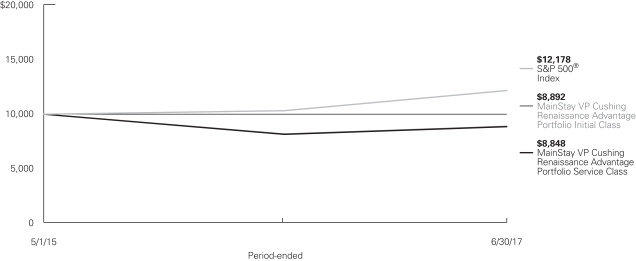
Average Annual Total Returns for the Period Ended June 30, 2017
| | | | | | | | | | | | | | | | | | |
| Class | | Inception Date | | Six Months | | | One Year | | | Five Years or Since Inception | | | Gross
Expense
Ratio1 | |
| Initial Class Shares | | 5/1/2015 | | | –9.64 | % | | | 8.76 | % | | | –5.27 | % | | | 1.38 | % |
| Service Class Shares | | 5/1/2015 | | | –9.75 | | | | 8.49 | | | | –5.49 | | | | 1.63 | |
| | | | | | | | | | | | |
| Benchmark Performance | | Six Months | | | One
Year | | | Five Years or Since Inception | |
S&P 500® Index2 | | | 9.34 | % | | | 17.90 | % | | | 9.52 | % |
Average Lipper Variable Products Alternative Other Portfolio3 | | | 4.45 | | | | 7.61 | | | | 2.32 | |
| 1. | The gross expense ratios presented reflect the Portfolio’s “Total Annual Portfolio Operating Expenses” from the most recent Prospectus and may differ from other expense ratios disclosed in this report. |
| 2. | The S&P 500® Index is the Portfolio’s primary broad-based securities market index for comparison purposes. “S&P 500®” is a trademark of The McGraw-Hill Companies, Inc. The S&P 500® Index is widely regarded as the standard index for measuring large-cap U.S. stock market performance. Results assume reinvestment of all dividends and capital gains. An investment cannot be made directly in an index. |
| 3. | The Average Lipper Variable Products Alternative Other Portfolio is representative of portfolios that, by prospectus language, seek total returns through the use of alternative investment strategies. These strategies include but are not limited to equity market neutral, long/short equity, global macro, event driven, credit focus or through the use of several different hedge-like strategies. This benchmark is a product of Lipper Inc. Lipper Inc. is an independent monitor of fund performance. Results are based on average total returns of similar portfolios with all dividend and capital gain distributions reinvested. |
Cost in Dollars of a $1,000 Investment in MainStay VP Cushing Renaissance Advantage Portfolio (Unaudited)
The example below is intended to describe the fees and expenses borne by shareholders during the six-month period from January 1, 2017 to June 30, 2017, and the impact of those costs on your investment.
Example
As a shareholder of the Portfolio, you incur two types of costs: (1) transaction costs, including exchange fees and sales charges (loads) on purchases (as applicable), and (2) ongoing costs, including management fees, distribution and/or service (12b-1) fees, and other Portfolio expenses (as applicable). This example is intended to help you understand your ongoing costs (in dollars) of investing in the Portfolio and to compare these costs with the ongoing costs of investing in other mutual funds. The example is based on an investment of $1,000 made at the beginning of the six-month period and held for the entire period from January 1, 2017 to June 30, 2017. Shares are only sold in connection with variable life and annuity contracts and the example does not reflect any contract level or transactional fees or expenses. If these costs had been included, your costs would have been higher.
This example illustrates your Portfolio’s ongoing costs in two ways:
Actual Expenses
The second and third data columns in the table below provide information about actual account values and actual expenses. You may use the information in these columns, together with the amount you invested, to estimate the expenses that you paid during the six months ended June 30, 2017. Simply divide your account value by $1,000
(for example, an $8,600 account value divided by $1,000 = 8.6), then multiply the result by the number under the heading entitled “Expenses Paid During Period” to estimate the expenses you paid on your account during this period.
Hypothetical Example for Comparison Purposes
The fourth and fifth data columns in the table below provide information about hypothetical account values and hypothetical expenses based on the Portfolio’s actual expense ratio and an assumed rate of return of 5% per year before expenses, which is not the Portfolio’s actual return. The hypothetical account values and expenses may not be used to estimate the actual ending account balances or expenses you paid for the six-month period shown. You may use this information to compare the ongoing costs of investing in the Portfolio with the ongoing costs of investing in other mutual funds. To do so, compare this 5% hypothetical example with the 5% hypothetical examples that appear in the shareholder reports of the other mutual funds.
Please note that the expenses shown in the table are meant to highlight your ongoing costs only and do not reflect any transactional costs, such as exchange fees or sales charges (loads). Therefore, the fourth and fifth data columns of the table are useful in comparing ongoing costs only and will not help you determine the relative total costs of owning different funds. In addition, if these transactional costs were included, your costs would have been higher.
| | | | | | | | | | | | | | | | | | | | | | |
| | | | | | | | | | | | | | | | | | |
| Share Class | | Beginning
Account
Value
1/1/17 | | | Ending Account
Value (Based
on Actual
Returns and
Expenses)
6/30/17 | | | Expenses
Paid
During
Period1 | | | Ending Account
Value (Based
on Hypothetical
5% Annualized
Return and
Actual Expenses)
6/30/17 | | | Expenses
Paid
During
Period1 | | | Net Expense
Ratio
During
Period2 |
| | | | | | |
| Initial Class Shares | | $ | 1,000.00 | | | $ | 903.60 | | | $ | 6.18 | | | $ | 1,018.30 | | | $ | 6.56 | | | 1.31% |
| | | | | | |
| Service Class Shares | | $ | 1,000.00 | | | $ | 902.50 | | | $ | 7.36 | | | $ | 1,017.10 | | | $ | 7.80 | | | 1.56% |
| 1. | Expenses are equal to the Portfolio’s annualized expense ratio of each class multiplied by the average account value over the period, divided by 365 and multiplied by 181 (to reflect the six-month period). The table above represents the actual expenses incurred during the six-month period. |
| 2. | Expenses are equal to the Portfolio’s annualized expense ratio to reflect the six-month period. |
| | |
| 6 | | MainStay VP Cushing Renaissance Advantage Portfolio |
Industry Composition as of June 30, 2017 (Unaudited)
| | | | |
| Oil, Gas & Consumable Fuels | | | 49.9 | % |
| Energy Equipment & Services | | | 10.7 | |
| Road & Rail | | | 10.1 | |
| Construction & Engineering | | | 9.2 | |
| Trading Companies & Distributors | | | 7.1 | |
| Machinery | | | 4.7 | |
| Air Freight & Logistics | | | 2.8 | |
| | | | |
| Metals & Mining | | | 2.0 | % |
| Electrical Equipment | | | 1.3 | |
| Chemicals | | | 0.9 | |
| Short-Term Investment | | | 1.1 | |
| Other Assets, Less Liabilities | | | 0.2 | |
| | | | |
| | | 100.0 | % |
| | | | |
See Portfolio of Investments beginning on page 10 for specific holdings within these categories.
Top Ten Holdings as of June 30, 2017 (excluding short-term investment) (Unaudited)
| 5. | Jacobs Engineering Group, Inc. |
| 6. | Marathon Petroleum Corp. |
| 8. | Energy Transfer Partners, L.P. |
Portfolio Management Discussion and Analysis (Unaudited)
Answers to the questions reflect the views of portfolio managers Jerry V. Swank, Matthew A. Lemme, CFA, and Saket Kumar of Cushing® Asset Management, LP, the Portfolio’s Subadvisor.
How did MainStay VP Cushing Renaissance Advantage Portfolio perform relative to its primary benchmark and peers for the six months ended June 30, 2017?
For the six months ended June 30, 2017, MainStay VP Cushing Renaissance Advantage Portfolio returned –9.64% for Initial Class shares and –9.75% for Service Class shares. Over the same period, both share classes underperformed the 9.34% return of the S&P 500® Index,1 which is the Portfolio’s primary benchmark, and the 4.45% return of the Average Lipper2 Variable Products Alternative Other Portfolio.
What factors affected the Portfolio’s performance relative to the S&P 500® Index during the reporting period?
The Portfolio’s performance lagged that of the S&P 500® Index primarily because the Portfolio’s investment program focuses on companies in the energy, industrial and manufacturing sectors. The S&P 500® Index, on the other hand, tracks the performance of stocks in a wide variety of sectors. For example, during the reporting period, the energy sector of the S&P 500® Index returned –12.61%, as compared to the 9.34% return of the Index as a whole.
Which subsectors were the strongest contributors to the Portfolio’s performance and which subsectors were particularly weak?
The subsectors that made the most substantial contributions the Portfolio’s performance were transportation, chemicals, and engineering & construction. (Contributions take weightings and total returns into account.) The most substantial detractors were subsectors with greater exposure to commodities: oil services, exploration & production, and midstream energy.
During the reporting period, which individual holdings made the strongest contributions to the Portfolio’s absolute performance and which holdings detracted the most?
The Portfolio’s best-performing stock during the reporting period was railroad company CSX, which had strong performance because many investors had a favorable view of the company’s new CEO and his plans to improve profitability. Transportation and supply chain provider XPO Logistics provided strong performance because of improved less-than-truckload hauling fundamentals, contract wins and enthusiasm for the company’s e-commerce platform. Liquefied natural gas (LNG) shipping company GasLog Partners, L.P., rallied during the reporting period because of a stronger-than-seasonal increase in LNG demand.
The most substantial detractors from the Portfolio’s absolute performance were oilfield services companies Fairmount Santrol Holdings, Weatherford PLC and U.S. Silica Holdings. These companies underperformed because of declining prices for energy commodities and negative investor sentiment toward energy companies. Sand producers Fairmount Santrol Holdings and U.S. Silica Holdings also underperformed, as lower-cost competitors increased production.
Did the Portfolio make any significant purchases or sales during the reporting period?
The Portfolio’s largest individual purchase during the reporting period was an increase in the Portfolio’s existing position in railroad company CSX to take advantage of a sell-off in shares, despite improving volumes and other positive indicators in relation to the company’s competitors. Another large purchase was a new position in natural gas gatherers & processors company Targa Resources. We made the purchase because we believed that the company would likely benefit from increased U.S. energy commodity production.
The Portfolio’s most substantial sales during the reporting period included closing Portfolio positions in frac sand mining companies U.S. Silica Holdings and Fairmount Santrol Holdings. The positions were eliminated because of concerns about increased competition from new mines in Texas.
How did the Portfolio’s subsector weightings change during the reporting period?
The Portfolio’s most substantial subsector weighting increase during the reporting period was in engineering & construction, through the addition of new positions in multinational engineering company AECOM, construction company Granite Construction, and engineering & construction services provider for energy infrastructure businesses Quanta Services. We believed that each of these positions might benefit from increased infrastructure and power spending. The Portfolio also added to its weighting in industrials as we sought to take advantage of these anticipated spending increases.
The Portfolio’s most substantial decreases in subsector weightings during the reporting period were in chemicals and materials, reflecting strong performance driven by the decrease in energy commodity prices.
How was the Portfolio positioned at the end of the reporting period?
As of June 30, 2017, the majority of the Portfolio was positioned to benefit from increasing U.S. production volumes
| 1. | See footnote on page 5 for more information on the S&P 500® Index. |
| 2. | See footnote on page 5 for more information on Lipper Inc. |
| | |
| 8 | | MainStay VP Cushing Renaissance Advantage Portfolio |
without exposure to underlying energy commodity prices. A portion of the Portfolio continued to have direct commodity exposure, but the level of exposure was lower than it had been at the beginning of the reporting period.
The opinions expressed are those of the portfolio managers as of the date of this report and are subject to change. There is no guarantee that any forecasts made will come to pass. This material does not constitute investment advice and is not intended as an endorsement of any specific investment.
Not all MainStay VP Portfolios and/or share classes are available under all policies.
Portfolio of Investments June 30, 2017 (Unaudited)
| | | | | | | | |
| | |
| | | Shares | | | Value | |
| | | | | | | | |
| Common Stocks 86.4%† | |
Air Freight & Logistics 2.8% | |
¨XPO Logistics, Inc. (a) | | | 71,628 | | | $ | 4,629,318 | |
| | | | | | | | |
| | |
Chemicals 0.9% | | | | | | | | |
Westlake Chemical Corp. | | | 23,807 | | | | 1,576,262 | |
| | | | | | | | |
| | |
Construction & Engineering 9.2% | | | | | | | | |
AECOM (a) | | | 102,308 | | | | 3,307,618 | |
Granite Construction, Inc. | | | 70,250 | | | | 3,388,860 | |
¨Jacobs Engineering Group, Inc. | | | 108,975 | | | | 5,927,150 | |
Quanta Services, Inc. (a) | | | 84,485 | | | | 2,781,246 | |
| | | | | | | | |
| | | | | | | 15,404,874 | |
| | | | | | | | |
Electrical Equipment 1.3% | | | | | | | | |
Eaton Corp. PLC | | | 28,634 | | | | 2,228,584 | |
| | | | | | | | |
| | |
Energy Equipment & Services 9.4% | | | | | | | | |
C&J Energy Services, Inc. (a) | | | 105,721 | | | | 3,623,059 | |
Halliburton Co. | | | 85,356 | | | | 3,645,555 | |
Independence Contract Drilling, Inc. (a) | | | 37,470 | | | | 145,758 | |
Keane Group, Inc. (a) | | | 139,769 | | | | 2,236,304 | |
NCS Multistage Holdings, Inc. (a) | | | 27,134 | | | | 683,234 | |
ProPetro Holding Corp. (a) | | | 134,759 | | | | 1,881,236 | |
Select Energy Services, Inc. Class A (a) | | | 192,506 | | | | 2,338,948 | |
U.S. Silica Holdings, Inc. | | | 231 | | | | 8,198 | |
Weatherford International PLC (a) | | | 322,315 | | | | 1,247,359 | |
| | | | | | | | |
| | | | | | | 15,809,651 | |
| | | | | | | | |
Machinery 4.7% | | | | | | | | |
¨Dover Corp. | | | 76,232 | | | | 6,115,331 | |
Flowserve Corp. | | | 35,975 | | | | 1,670,319 | |
| | | | | | | | |
| | | | | | | 7,785,650 | |
| | | | | | | | |
Metals & Mining 2.0% | | | | | | | | |
AK Steel Holding Corp. (a) | | | 323,264 | | | | 2,123,844 | |
United States Steel Corp. | | | 55,885 | | | | 1,237,294 | |
| | | | | | | | |
| | | | | | | 3,361,138 | |
| | | | | | | | |
Oil, Gas & Consumable Fuels 38.9% | | | | | | | | |
Anadarko Petroleum Corp. | | | 35,985 | | | | 1,631,560 | |
Callon Petroleum Co. (a) | | | 296,482 | | | | 3,145,674 | |
Centennial Resource Development, Inc. Class A (a) | | | 240,001 | | | | 3,796,816 | |
¨Cheniere Energy, Inc. (a) | | | 131,177 | | | | 6,389,632 | |
Cimarex Energy Co. | | | 18,126 | | | | 1,704,025 | |
Concho Resources, Inc. (a) | | | 19,503 | | | | 2,370,200 | |
Devon Energy Corp. | | | 75,973 | | | | 2,428,857 | |
Diamondback Energy, Inc. (a) | | | 27,848 | | | | 2,473,181 | |
Energen Corp. (a) | | | 50,892 | | | | 2,512,538 | |
Extraction Oil & Gas, Inc. (a) | | | 126,263 | | | | 1,698,237 | |
| | | | | | | | |
| | |
| | | Shares | | | Value | |
| | | | | | | | |
Oil, Gas & Consumable Fuels (continued) | | | | | | | | |
GasLog, Ltd. | | | 141,029 | | | $ | 2,150,692 | |
¨Golar LNG, Ltd. | | | 243,617 | | | | 5,420,478 | |
¨Marathon Petroleum Corp. | | | 112,416 | | | | 5,882,729 | |
Newfield Exploration Co. (a) | | | 114,357 | | | | 3,254,600 | |
Parsley Energy, Inc. Class A (a) | | | 128,489 | | | | 3,565,570 | |
Phillips 66 | | | 10,911 | | | | 902,231 | |
Pioneer Natural Resources Co. | | | 27,166 | | | | 4,335,150 | |
RSP Permian, Inc. (a) | | | 139,511 | | | | 4,502,020 | |
SemGroup Corp. Class A | | | 63,351 | | | | 1,710,477 | |
¨Targa Resources Corp. | | | 116,919 | | | | 5,284,739 | |
| | | | | | | | |
| | | | | | | 65,159,406 | |
| | | | | | | | |
Road & Rail 10.1% | |
Covenant Transportation Group, Inc. Class A (a) | | | 193,132 | | | | 3,385,604 | |
¨CSX Corp. | | | 137,495 | | | | 7,501,727 | |
Genesee & Wyoming, Inc. Class A (a) | | | 27,498 | | | | 1,880,588 | |
Swift Transportation Co. (a) | | | 155,198 | | | | 4,112,747 | |
| | | | | | | | |
| | | | | | | 16,880,666 | |
| | | | | | | | |
Trading Companies & Distributors 7.1% | |
MRC Global, Inc. (a) | | | 243,621 | | | | 4,024,619 | |
¨United Rentals, Inc. (a) | | | 55,196 | | | | 6,221,141 | |
Univar, Inc. (a) | | | 57,199 | | | | 1,670,211 | |
| | | | | | | | |
| | | | | | | 11,915,971 | |
| | | | | | | | |
Total Common Stocks
(Cost $150,898,481) | | | | | | | 144,751,520 | |
| | | | | | | | |
|
| MLPs and Related Companies 12.3% | |
Energy Equipment & Services 1.3% | | | | | | | | |
Hi-Crush Partners, L.P. (a) | | | 208,378 | | | | 2,260,901 | |
| | | | | | | | |
| | |
Oil, Gas & Consumable Fuels 11.0% | | | | | | | | |
American Midstream Partners, L.P. | | | 127,775 | | | | 1,641,909 | |
Energy Transfer Equity, L.P. | | | 144,139 | | | | 2,588,737 | |
¨Energy Transfer Partners, L.P. | | | 265,221 | | | | 5,407,856 | |
GasLog Partners, L.P. | | | 149,631 | | | | 3,389,142 | |
MPLX, L.P. | | | 50,876 | | | | 1,699,258 | |
NGL Energy Partners, L.P. | | | 263,668 | | | | 3,691,352 | |
| | | | | | | | |
| | | | | | | 18,418,254 | |
| | | | | | | | |
Total MLPs and Related Companies
(Cost $24,421,545) | | | | | | | 20,679,155 | |
| | | | | | | | |
| † | Percentages indicated are based on Fund net assets. |
| ¨ | | Among the Portfolio’s 10 largest holdings, as of June 30, 2017, excluding short-term investment. May be subject to change daily. |
| | | | |
| 10 | | MainStay VP Cushing Renaissance Advantage Portfolio | | The notes to the financial statements are an integral part of,
and should be read in conjunction with, the financial statements. |
| | | | | | | | |
| | | Principal
Amount | | | Value | |
| | | | | | | | |
| Short-Term Investment 1.1% | |
Repurchase Agreement 1.1% | | | | | | | | |
Fixed Income Clearing Corp.
0.12%, dated 6/30/17
due 7/3/17
Proceeds at Maturity $1,841,234 (Collateralized by a United States Treasury Note with a rate of 1.125% and a maturity date of 8/31/21, with a Principal Amount of $1,920,000 and a Market Value of $1,879,071) | | $ | 1,841,216 | | | $ | 1,841,216 | |
| | | | | | | | |
Total Short-Term Investment
(Cost $1,841,216) | | | | | | | 1,841,216 | |
| | | | | | | | |
Total Investments
(Cost $177,161,242) (b) | | | 99.8 | % | | | 167,271,891 | |
Other Assets, Less Liabilities | | | 0.2 | | | | 357,296 | |
Net Assets | | | 100.0 | % | | $ | 167,629,187 | |
| (a) | Non-income producing security. |
| (b) | As of June 30, 2017, cost was $178,575,819 for federal income tax purposes and net unrealized depreciation was as follows: |
| | | | |
Gross unrealized appreciation | | $ | 6,123,634 | |
Gross unrealized depreciation | | | (17,427,562 | ) |
| | | | |
Net unrealized depreciation | | $ | (11,303,928 | ) |
| | | | |
The following is a summary of the fair valuations according to the inputs used as of June 30, 2017, for valuing the Portfolio’s assets.
Asset Valuation Inputs
| | | | | | | | | | | | | | | | |
Description | | Quoted
Prices in
Active
Markets for
Identical
Assets
(Level 1) | | | Significant
Other
Observable
Inputs
(Level 2) | | | Significant
Unobservable
Inputs
(Level 3) | | | Total | |
| Investments in Securities (a) | | | | | | | | | | | | | | | | |
| Common Stocks | | $ | 144,751,520 | | | $ | — | | | $ | — | | | $ | 144,751,520 | |
| MLPs and Related Companies | | | 20,679,155 | | | | — | | | | — | | | | 20,679,155 | |
| Short-Term Investment | | | | | | | | | | | | | | | | |
Repurchase Agreement | | | — | | | | 1,841,216 | | | | — | | | | 1,841,216 | |
| | | | | | | | | | | | | | | | |
| Total Investments in Securities | | $ | 165,430,675 | | | $ | 1,841,216 | | | $ | — | | | $ | 167,271,891 | |
| | | | | | | | | | | | | | | | |
| (a) | For a complete listing of investments and their industries, see the Portfolio of Investments. |
The Portfolio recognizes transfers between the levels as of the beginning of the period.
For the period ended June 30, 2017, the Portfolio did not have any transfers among levels. (See Note 2)
As of June 30, 2017, the Portfolio did not hold any investments with significant unobservable inputs (Level 3). (See Note 2)
| | | | | | |
The notes to the financial statements are an integral part of,
and should be read in conjunction with, the financial statements. | | | | | 11 | |
Statement of Assets and Liabilities as of June 30, 2017 (Unaudited)
| | | | |
| Assets | |
Investment in securities, at value
(identified cost $177,161,242) | | $ | 167,271,891 | |
Receivables: | | | | |
Investment securities sold | | | 4,036,978 | |
Fund shares sold | | | 56,545 | |
Dividends and interest | | | 25,870 | |
Other assets | | | 628 | |
| | | | |
Total assets | | | 171,391,912 | |
| | | | |
| |
| Liabilities | | | | |
Payables: | | | | |
Investment securities purchased | | | 3,549,372 | |
Manager (See Note 3) | | | 171,334 | |
Professional fees | | | 23,839 | |
NYLIFE Distributors (See Note 3) | | | 6,076 | |
Shareholder communication | | | 5,540 | |
Custodian | | | 3,744 | |
Fund shares redeemed | | | 289 | |
Trustees | | | 160 | |
Accrued expenses | | | 2,371 | |
| | | | |
Total liabilities | | | 3,762,725 | |
| | | | |
Net assets | | $ | 167,629,187 | |
| | | | |
| |
| Net Assets Consist of | | | | |
Shares of beneficial interest outstanding (par value of $.001 per share) unlimited number of shares authorized | | $ | 19,040 | |
Additional paid-in capital | | | 198,566,649 | |
| | | | |
| | | 198,585,689 | |
Undistributed net investment income | | | 426,598 | |
Accumulated net realized gain (loss) on investments and foreign currency transactions | | | (21,493,749 | ) |
Net unrealized appreciation (depreciation) on investments | | | (9,889,351 | ) |
| | | | |
Net assets | | $ | 167,629,187 | |
| | | | |
| | | | |
Initial Class | | | | |
Net assets applicable to outstanding shares | | $ | 138,241,372 | |
| | | | |
Shares of beneficial interest outstanding | | | 15,692,140 | |
| | | | |
Net asset value per share outstanding | | $ | 8.81 | |
| | | | |
Service Class | | | | |
Net assets applicable to outstanding shares | | $ | 29,387,815 | |
| | | | |
Shares of beneficial interest outstanding | | | 3,347,985 | |
| | | | |
Net asset value per share outstanding | | $ | 8.78 | |
| | | | |
| | | | |
| 12 | | MainStay VP Cushing Renaissance Advantage Portfolio | | The notes to the financial statements are an integral part of,
and should be read in conjunction with, the financial statements. |
Statement of Operations for the six months ended June 30, 2017 (Unaudited)
| | | | |
| Investment Income (Loss) | |
Income | | | | |
Dividends | | $ | 1,481,245 | |
Interest | | | 3,453 | |
| | | | |
Total income | | | 1,484,698 | |
| | | | |
Expenses | | | | |
Manager (See Note 3) | | | 972,932 | |
Distribution/Service—Service Class (See Note 3) | | | 38,518 | |
Professional fees | | | 27,685 | |
Shareholder communication | | | 10,219 | |
Custodian | | | 2,770 | |
Trustees | | | 1,419 | |
Miscellaneous | | | 4,557 | |
| | | | |
Total expenses | | | 1,058,100 | |
| | | | |
Net investment income (loss) | | | 426,598 | |
| | | | |
|
| Realized and Unrealized Gain (Loss) on Investments and Foreign Currency Transactions | |
Net realized gain (loss) on: | | | | |
Investment transactions | | | (4,680,900 | ) |
Foreign currency transactions | | | 56 | |
| | | | |
Net realized gain (loss) on investments and foreign currency transactions | | | (4,680,844 | ) |
| | | | |
Net change in unrealized appreciation (depreciation) on: | | | | |
Investments | | | (15,117,534 | ) |
Translation of other assets and liabilities in foreign currencies | | | (17 | ) |
| | | | |
Net change in unrealized appreciation (depreciation) on investments and foreign currency transactions | | | (15,117,551 | ) |
| | | | |
Net realized and unrealized gain (loss) on investments and foreign currency transactions | | | (19,798,395 | ) |
| | | | |
Net increase (decrease) in net assets resulting from operations | | $ | (19,371,797 | ) |
| | | | |
| | | | | | |
The notes to the financial statements are an integral part of,
and should be read in conjunction with, the financial statements. | | | | | 13 | |
Statements of Changes in Net Assets
for the six months ended June 30, 2017 (Unaudited) and the year ended December 31, 2016
| | | | | | | | |
| | | 2017 | | | 2016 | |
| Increase (Decrease) in Net Assets | |
Operations: | | | | | | | | |
Net investment income (loss) | | $ | 426,598 | | | $ | (22,947 | ) |
Net realized gain (loss) on investments and foreign currency transactions | | | (4,680,844 | ) | | | 2,890,268 | |
Net change in unrealized appreciation (depreciation) on investments and foreign currency transactions | | | (15,117,551 | ) | | | 14,651,214 | |
| | | | |
Net increase (decrease) in net assets resulting from operations | | | (19,371,797 | ) | | | 17,518,535 | |
| | | | |
Dividends to shareholders: | | | | | | | | |
From net investment income: | | | | | | | | |
Initial Class | | | — | | | | (120,480 | ) |
Service Class | | | — | | | | (35,763 | ) |
| | | | |
Total dividends to shareholders | | | — | | | | (156,243 | ) |
| | | | |
Capital share transactions: | | | | | | | | |
Net proceeds from sale of shares | | | 117,320,718 | | | | 64,571,295 | |
Net asset value of shares issued to shareholders in reinvestment of dividends | | | — | | | | 156,243 | |
Cost of shares redeemed | | | (28,069,157 | ) | | | (48,631,038 | ) |
| | | | |
Increase (decrease) in net assets derived from capital share transactions | | | 89,251,561 | | | | 16,096,500 | |
| | | | |
Net increase (decrease) in net assets | | | 69,879,764 | | | | 33,458,792 | |
|
| Net Assets | |
Beginning of Period | | | 97,749,423 | | | | 64,290,631 | |
| | | | |
End of Period | | $ | 167,629,187 | | | $ | 97,749,423 | |
| | | | |
Undistributed net investment income at end of period | | $ | 426,598 | | | $ | — | |
| | | | |
| | | | |
| 14 | | MainStay VP Cushing Renaissance Advantage Portfolio | | The notes to the financial statements are an integral part of,
and should be read in conjunction with, the financial statements. |
Financial Highlights selected per share data and ratios
| | | | | | | | | | | | |
| Initial Class | | Six months
ended
June 30,
2017* | | | Year ended
December 31,
2016 | | | May 1, 2015**
through
December 31,
2015 | |
Net asset value at beginning of period | | $ | 9.75 | | | $ | 7.59 | | | $ | 10.00 | |
| | | | | | | | | | | | |
Net investment income (loss) (a) | | | 0.03 | | | | 0.00 | ‡ | | | 0.04 | |
Net realized and unrealized gain (loss) on investments | | | (0.97 | ) | | | 2.18 | | | | (2.40 | ) |
Net realized and unrealized gain (loss) on foreign currency transactions | | | — | ‡ | | | 0.00 | ‡ | | | (0.00 | )‡ |
| | | | | | | | | | | | |
Total from investment operations | | | (0.94 | ) | | | 2.18 | | | | (2.36 | ) |
| | | | | | | | | | | | |
| Less dividends and distributions: | | | | | | | | | | | | |
From net investment income | | | — | | | | (0.02 | ) | | | (0.05 | ) |
| | | | | | | | | | | | |
Net asset value at end of period | | $ | 8.81 | | | $ | 9.75 | | | $ | 7.59 | |
| | | | | | | | | | | | |
Total investment return (b) | | | (9.64 | %) | | | 28.77 | % | | | (23.58 | %) |
| Ratios (to average net assets)/Supplemental Data: | | | | | | | | | | | | |
Net investment income (loss) | | | 0.60 | % †† | | | 0.06 | % | | | 0.60 | % †† |
Net expenses | | | 1.31 | % †† | | | 1.38 | % | | | 1.35 | % †† |
Portfolio turnover rate | | | 59 | % | | | 356 | % | | | 122 | % (c) |
Net assets at end of period (in 000’s) | | $ | 138,241 | | | $ | 71,036 | | | $ | 58,364 | |
| ‡ | Less than one cent per share. |
| (a) | Per share data based on average shares outstanding during the period. |
| (b) | Total return does not reflect any deduction of sales charges, mortality and expense charges, contract charges or administrative charges. For periods of less than one year, total return is not annualized. |
| (c) | Portfolio turnover rate is not annualized. |
| | | | | | | | | | | | |
| Service Class | | Six months
ended
June 30,
2017* | | | Year ended
December 31,
2016 | | | May 1, 2015**
through
December 31,
2015 | |
Net asset value at beginning of period | | $ | 9.73 | | | $ | 7.59 | | | $ | 10.00 | |
| | | | | | | | | | | | |
Net investment income (loss) (a) | | | 0.02 | | | | (0.02 | ) | | | 0.02 | |
Net realized and unrealized gain (loss) on investments | | | (0.97 | ) | | | 2.18 | | | | (2.39 | ) |
Net realized and unrealized gain (loss) on foreign currency transactions | | | — | ‡ | | | 0.00 | ‡ | | | (0.00 | )‡ |
| | | | | | | | | | | | |
Total from investment operations | | | (0.95 | ) | | | 2.16 | | | | (2.37 | ) |
| | | | | | | | | | | | |
| Less dividends and distributions: | | | | | | | | | | | | |
From net investment income | | | — | | | | (0.02 | ) | | | (0.04 | ) |
| | | | | | | | | | | | |
Net asset value at end of period | | $ | 8.78 | | | $ | 9.73 | | | $ | 7.59 | |
| | | | | | | | | | | | |
Total investment return (b) | | | (9.76 | %)(c) | | | 28.48 | % | | | (23.70 | %) |
| Ratios (to average net assets)/Supplemental Data: | | | | | | | | | | | | |
Net investment income (loss) | | | 0.35 | % †† | | | (0.37 | %) | | | 0.37 | % †† |
Net expenses | | | 1.56 | % †† | | | 1.64 | % | | | 1.60 | % †† |
Portfolio turnover rate | | | 59 | % | | | 356 | % | | | 122 | % (d) |
Net assets at end of period (in 000’s) | | $ | 29,388 | | | $ | 26,714 | | | $ | 5,927 | |
| ‡ | Less than one cent per share. |
| (a) | Per share data based on average shares outstanding during the period. |
| (b) | Total return does not reflect any deduction of sales charges, mortality and expense charges, contract charges or administrative charges. For periods of less than one year, total return is not annualized. |
| (c) | Total investment return may reflect adjustments to conform to generally accepted accounting principles. |
| (d) | Portfolio turnover rate is not annualized. |
| | | | | | |
The notes to the financial statements are an integral part of,
and should be read in conjunction with, the financial statements. | | | | | 15 | |
Notes to Financial Statements (Unaudited)
Note 1–Organization and Business
MainStay VP Funds Trust (the “Fund”) was organized as a Delaware statutory trust on February 1, 2011. The Fund is registered under the Investment Company Act of 1940, as amended (the “1940 Act”), as an open-end management investment company. The Fund is comprised of thirty-one separate series (collectively referred to as the “Portfolios”). These financial statements and notes relate to the MainStay VP Cushing Renaissance Advantage Portfolio (the “Portfolio”), a “non diversified” portfolio, as that term is defined in the 1940 Act, as interpreted or modified by regulatory authorities having jurisdiction, from time to time.
Shares of the Portfolio are currently offered to certain separate accounts to fund variable annuity policies and variable universal life insurance policies issued by New York Life Insurance and Annuity Corporation (“NYLIAC”), a wholly-owned subsidiary of New York Life Insurance Company (“New York Life”). NYLIAC allocates shares of the Portfolios to, among others, NYLIAC Variable Annuity Separate Accounts-I, II, III and IV, VUL Separate Account-I and CSVUL Separate Account-I (collectively, the “Separate Accounts”). The Separate Accounts are used to fund flexible premium deferred variable annuity contracts and variable life insurance policies. Shares of the Portfolio are also offered to the MainStay VP Conservative Allocation Portfolio, MainStay VP Moderate Allocation Portfolio, MainStay VP Moderate Growth Allocation Portfolio and MainStay VP Growth Allocation Portfolio, which operate as “funds-of-funds.”
The Portfolio currently offers two classes of shares. Initial class and Service Class shares commenced operations on May 1, 2015. Shares of the Portfolio are sold and are redeemed at a price equal to their respective net asset value (“NAVs”) per share. No sales or redemption charge is applicable to the purchase or redemption of the Portfolio’s shares. Under the terms of the Fund’s multiple class plan, adopted pursuant to Rule 18f-3 under the 1940 Act, the classes differ in that, among other things Service Class shares pay a combined distribution and service fee of 0.25% of average daily net assets attributable to Service Class shares of the Portfolio to the Distributor (as defined in Note 3 (B)) pursuant to a plan adopted in accordance with Rule 12b-1 under the 1940 Act. Contract owners of variable annuity contracts purchased after June 2, 2003, are permitted to invest only in the Service Class shares.
The Portfolio’s investment objective is to seek total return.
Note 2–Significant Accounting Policies
The Portfolio is an investment company and accordingly follows the investment company accounting and reporting guidance of the Financial Accounting Standards Board (“FASB”) Accounting Standard Codification Topic 946 Financial Services—Investment Companies. The Portfolio prepares its financial statements in accordance with generally accepted accounting principles (“GAAP”) in the United States of America and follows the significant accounting policies described below.
(A) Securities Valuation. Investments are usually valued as of the close of regular trading on the New York Stock Exchange (the “Exchange”) (usually 4:00 p.m. Eastern time) on each day the Portfolio is open for business (“valuation date”).
The Board of Trustees (the “Board”) of the Fund adopted procedures establishing methodologies for the valuation of the Portfolio’s securities
and other assets and delegated the responsibility for valuation determinations under those procedures to the Valuation Committee of the Fund (the “Valuation Committee”). The Board authorized the Valuation Committee to appoint a Valuation Sub-Committee (the “Sub-Committee”) to deal in the first instance with establishing the prices of securities for which market quotations are not readily available or the prices of which are not otherwise readily determinable under these procedures. The Sub-Committee meets (in person, via electronic mail or via teleconference) on an as-needed basis. Subsequently, the Valuation Committee meets to ensure that actions taken by the Sub-Committee were appropriate. The procedures recognize that, subject to the oversight of the Board and unless otherwise noted, the responsibility for the day-to-day valuation of portfolio assets (including fair value measurements for the Portfolio’s assets and liabilities) rests with New York Life Investment Management LLC (“New York Life Investments” or the “Manager”), aided to whatever extent necessary by the Subadvisor (as defined in Note 3(A)) to the Portfolio.
To assess the appropriateness of security valuations, the Manager, the Subadvisor or the Portfolio’s third party service provider, who is subject to oversight by the Manager, regularly compares prior day prices, prices on comparable securities and the sale prices to the prior and current day prices and challenges prices with changes exceeding certain tolerance levels with third party pricing services or broker sources. For those securities valued through either a standardized fair valuation methodology or a fair valuation measurement, the Sub-Committee deals in the first instance with such valuation and the Valuation Committee reviews and affirms, if appropriate, the reasonableness of the valuation based on such methodologies and measurements on a regular basis after considering all relevant information that is reasonably available. Any action taken by the Sub-Committee with respect to the valuation of a portfolio security or other asset is submitted by the Valuation Committee to the Board for its review and ratification, if appropriate, at its next regularly scheduled meeting.
“Fair value” is defined as the price the Portfolio would reasonably expect to receive upon selling an asset or liability in an orderly transaction to an independent buyer in the principal or most advantageous market for the asset or liability. Fair value measurements are determined within a framework that establishes a three-tier hierarchy which maximizes the use of observable market data and minimizes the use of unobservable inputs to establish a classification of fair value measurements for disclosure purposes. “Inputs” refer broadly to the assumptions that market participants would use in pricing the asset or liability, including assumptions about risk, such as the risk inherent in a particular valuation technique used to measure fair value using a pricing model and/or the risk inherent in the inputs for the valuation technique. Inputs may be observable or unobservable. Observable inputs reflect the assumptions market participants would use in pricing the asset or liability based on market data obtained from sources independent of the Portfolio. Unobservable inputs reflect the Portfolio’s own assumptions about the assumptions market participants would use in pricing the asset or liability based on the information available. The inputs or methodology used for valuing assets or liabilities may not be an indication of the risks associated with investing in those assets or liabilities. The three-tier hierarchy of inputs is summarized below.
| • | | Level 1—quoted prices in active markets for an identical asset or liability |
| | |
| 16 | | MainStay VP Cushing Renaissance Advantage Portfolio |
| • | | Level 2—other significant observable inputs (including quoted prices for a similar asset or liability in active markets, interest rates and yield curves, prepayment speeds, credit risk, etc.) |
| • | | Level 3—significant unobservable inputs (including the Portfolio’s own assumptions about the assumptions that market participants would use in measuring fair value of an asset or liability) |
The level of an asset or liability within the fair value hierarchy is based on the lowest level of an input, both individually and in the aggregate, that is significant to the fair value measurement. As of June 30, 2017, the aggregate value by input level of the Portfolio’s assets and liabilities is included at the end of the Portfolio’s Portfolio of Investments.
The Portfolio may use third party vendor evaluations, whose prices may be derived from one or more of the following standard inputs, among others:
| | |
• Broker/dealer quotes | | • Benchmark securities |
• Two-sided markets | | • Reference data (corporate actions or material event notices) |
• Bids/offers | | • Monthly payment information |
• Industry and economic events | | • Reported trades |
An asset or liability for which market values cannot be measured using the methodologies described above is valued by methods deemed reasonable in good faith by the Valuation Committee, following the procedures established by the Board, to represent fair value. Under these procedures, the Portfolio generally uses a market-based approach which may use related or comparable assets or liabilities, recent transactions, market multiples, book values, and other relevant information. The Portfolio may also use an income-based valuation approach in which the anticipated future cash flows of the asset or liability are discounted to calculate fair value. Discounts may also be applied due to the nature and/or duration of any restrictions on the disposition of the asset or liability. Fair value represents a good faith approximation of the value of a security. Fair value determinations involve the consideration of a number of subjective factors, an analysis of applicable facts and circumstances and the exercise of judgment. As a result, it is possible that the fair value for a security determined in good faith in accordance with the Portfolio’s valuation procedures may differ from valuations for the same security determined by other funds using their own valuation procedures. Although the Portfolio’s valuation procedures are designed to value a security at the price the Portfolio may reasonably expect to receive upon the security’s sale in an orderly transaction, there can be no assurance that any fair value determination thereunder would, in fact, approximate the amount that the Portfolio would actually realize upon the sale of the security or the price at which the security would trade if a reliable market price were readily available. During the six-month period ended June 30, 2017, there were no material changes to the fair value methodologies.
Securities which may be valued in this manner include, but are not limited to: (i) a security for which trading has been halted or suspended; (ii) a debt security that has recently gone into default and for which there is not a current market quotation; (iii) a security of an issuer that has entered into a restructuring; (iv) a security that has been de-listed from a national exchange; (v) a security for which the market price is not readily available from a third party pricing source or, if so provided, does
not, in the opinion of the Manager or Subadvisor, reflect the security’s market value; (vi) a security subject to trading collars for which no or limited trading takes place; and (vii) a security whose principal market has been temporarily closed at a time when, under normal conditions, it would be open. Securities for which market quotations or observable inputs are not readily available are generally categorized as Level 3 in the hierarchy. As of June 30, 2017, there were no securities held by the Portfolio that were fiar valued in such a manner.
Certain securities held by the Portfolio may principally trade in foreign markets. Events may occur between the time the foreign markets close and the time at which the Portfolio’s NAVs are calculated. These events may include, but are not limited to, situations relating to a single issuer in a market sector, significant fluctuations in U.S. or foreign markets, natural disasters, armed conflicts, governmental actions or other developments not tied directly to the securities markets. Should the Manager or Subadvisor conclude that such events may have affected the accuracy of the last price of such securities reported on the local foreign market, the Sub-Committee may, pursuant to procedures adopted by the Board, adjust the value of the local price to reflect the estimated impact on the price of such securities as a result of such events. In this instance, securities are generally categorized as Level 3 in the hierarchy. Additionally, certain foreign equity securities are also fair valued whenever the movement of a particular index exceeds certain thresholds. In such cases, the securities are fair valued by applying factors provided by a third party vendor in accordance with valuation procedures adopted by the Board and are generally categorized as Level 2 in the hierarchy. As of June 30, 2017, there were no securities held by the Portfolio that were fair valued in such a manner.
Equity securities are valued at the last quoted sales prices as of the close of regular trading on the relevant exchange on each valuation date. Securities that are not traded on the valuation date are valued at the mean of the last quoted bid and ask prices. Prices are normally taken from the principal market in which each security trades. These securities are generally categorized as Level 1 in the hierarchy.
Temporary cash investments acquired in excess of 60 days to maturity at the time of purchase are valued using the latest bid prices or using valuations based on a matrix system (which considers such factors as security prices, yields, maturities, and ratings), both as furnished by independent pricing services. Other temporary cash investments which mature in 60 days or less at the time of purchase (“Short-Term Investments”) are valued using the amortized cost method of valuation, unless the use of such method would be inappropriate. The amortized cost method involves valuing a security at its cost on the date of purchase and thereafter assuming a constant amortization to maturity of the difference between such cost and the value on maturity date. Amortized cost approximates the current fair value of a security. Securities valued using the amortized cost method are not valued using quoted prices in an active market and are generally categorized as Level 2 in the hierarchy.
The information above is not intended to reflect an exhaustive list of the methodologies that may be used to value portfolio investments. The valuation procedures permit the use of a variety of valuation methodologies in connection with valuing portfolio investments. The methodology used for a specific type of investment may vary based on the market data available or other considerations. The methodologies
Notes to Financial Statements (Unaudited) (continued)
summarized above may not represent the specific means by which portfolio investments are valued on any particular business day.
(B) Income Taxes. The Portfolio’s policy is to comply with the requirements of the Internal Revenue Code of 1986, as amended (the “Internal Revenue Code”), applicable to regulated investment companies and to distribute all of its taxable income to the shareholders of the Portfolio within the allowable time limits. Therefore, no federal, state and local income tax provisions are required.
Management evaluates the Portfolio’s tax positions to determine if the tax positions taken meet the minimum recognition threshold in connection with accounting for uncertainties in income tax positions taken or expected to be taken for the purposes of measuring and recognizing tax liabilities in the financial statements. Recognition of tax benefits of an uncertain tax position is permitted only to the extent the position is “more likely than not” to be sustained assuming examination by taxing authorities. Management has analyzed the Portfolio’s tax positions taken on federal, state and local income tax returns for all open tax years (for up to three tax years), and has concluded that no provisions for federal, state and local income tax are required in the Portfolio’s financial statements. The Portfolio’s federal, state and local income and federal excise tax returns for tax years for which the applicable statutes of limitations have not expired are subject to examination by the Internal Revenue Service and state and local departments of revenue.
(C) Foreign Taxes. The Portfolio may be subject to foreign taxes on income and other transaction-based taxes imposed by certain countries in which it invests. A portion of the taxes on gains on investments or currency purchases/repatriation may be reclaimable. The Portfolio will accrue such taxes and reclaims as applicable, based upon its current interpretation of tax rules and regulations that exist in the markets in which it invests.
The Portfolio may be subject to taxation on realized capital gains, repatriation proceeds and other transaction-based taxes imposed by certain countries in which it invests. The Portfolio will accrue such taxes as applicable based upon its current interpretation of tax rules and regulations that exist in the market in which it invests. Capital gains taxes relating to positions still held are reflected as a liability on the Statement of Assets and Liabilities, as well as an adjustment to the Portfolio’s net unrealized appreciation (depreciation). Taxes related to capital gains realized, if any, are reflected as part of net realized gain (loss) in the Statement of Operations. Changes in tax liabilities related to capital gains taxes on unrealized investment gains, if any, are reflected as part of the change in net unrealized appreciation (depreciation) on investments in the Statement of Operations. Transaction-based charges are generally assessed as a percentage of the transaction amount.
(D) Dividends and Distributions to Shareholders. Dividends and distributions are recorded on the ex-dividend date. The Portfolio intends to declare and pay dividends from net investment income and distributions from net realized capital and currency gains, if any, at least annually. Unless the shareholder elects otherwise, all dividends and distributions are reinvested in the same class of shares of the Portfolio, at NAV. Dividends and distributions to shareholders are determined in accordance with federal income tax regulations and may differ from GAAP.
(E) Security Transactions and Investment Income. The Portfolio records security transactions on the trade date. Realized gains and losses on security transactions are determined using the identified cost method. Dividend income is recognized on the ex-dividend date; net of any foreign tax withheld at the source, and interest income is accrued as earned using the effective interest rate method. Discounts and premiums on Short-Term Investments are accreted and amortized, respectively, on the straight-line method. The straight-line method approximates the effective interest method for Short-Term Investments. Income from payment-in-kind securities is accreted daily based on the effective interest method.
The Portfolio may invest no more than 25% of its total assets in certain master limited partnerships (“MLPs”) on an annual basis. Distributions on a MLP are generally recorded based on the characterization reported on the Portfolio’s Form 1065, Schedule K-1, received from the MLP. The Portfolio records its pro rata share of the income and deductions, and capital gains and losses allocated from each MLP on the Statement of Operations, as well as adjusting the cost basis of each MLP accordingly, as reported on the Portfolio of Investments.
Distributions received from investments in energy related U.S. and Canadian royalty trusts and exploration and production companies (collectively, “Energy Trusts”) and MLPs generally are comprised of ordinary income, capital gains and return of capital from the Energy Trusts or MLPs. The Portfolio records its investment income on the ex-date of the distributions from Energy Trusts and MLPs. For financial statement purposes, the Portfolio uses return of capital and income estimates to allocate the distributions received. Such estimates are based on historical information available from each Energy Trust, MLP and other industry sources.
Investment income and realized and unrealized gains and losses on investments of the Portfolio are allocated pro rata to the separate classes of shares based upon their relative net assets on the date the income is earned or realized and unrealized gains and losses are incurred.
(F) Expenses. Expenses of the Fund are allocated to the individual Portfolios in proportion to the net assets of the respective Portfolios when the expenses are incurred, except where direct allocations of expenses can be made. Expenses (other than fees incurred under the distribution and service plans, further discussed in Note 3(B), which are charged directly to the Service Class shares) are allocated to separate classes of shares pro rata based upon their relative net assets on the date the expenses are incurred. The expenses borne by the Portfolio, including those of related parties to the Portfolio, are shown in the Statement of Operations.
(G) Use of Estimates. In preparing financial statements in conformity with GAAP, management makes estimates and assumptions that affect the reported amounts and disclosures in the financial statements. Actual results could differ from those estimates.
(H) Repurchase Agreements. The Portfolio may enter into repurchase agreements (i.e., buy a security from another party with the agreement that it be sold back in the future) to earn income. The Portfolio may enter into repurchase agreements only with counterparties, usually financial institutions, that are deemed by the Manager or Subadvisor to be creditworthy, pursuant to guidelines established by
| | |
| 18 | | MainStay VP Cushing Renaissance Advantage Portfolio |
the Board. During the term of any repurchase agreement, the Manager or Subadvisor will continue to monitor the creditworthiness of the counterparty. Under the 1940 Act, repurchase agreements are considered to be collateralized loans by the Portfolio to the counterparty secured by the securities transferred to the Portfolio.
Repurchase agreements are subject to counterparty risk, meaning the Portfolio could lose money by the counterparty’s failure to perform under the terms of the agreement. The Portfolio mitigates this risk by ensuring the repurchase agreement is collateralized by cash, U.S. government securities, fixed income securities and/or other securities. The collateral is held by the Portfolio’s custodian valued daily on a mark to market basis to determine if the value, including accrued interest, exceeds the repurchase price. In the event of the counterparty’s default on the obligation to repurchase, the Portfolio has the right to liquidate the collateral and apply the proceeds in satisfaction of the obligation. Under certain circumstances, such as in the event of default or bankruptcy by the counterparty, realization and/or retention of the collateral may be limited or subject to delay, to legal proceedings and possible realized loss to the Portfolio.
(I) Foreign Currency Transactions. The Portfolio’s books and records are maintained in U.S. dollars. Prices of securities denominated in foreign currency amounts are translated into U.S. dollars at the mean between the buying and selling rates last quoted by any major U.S. bank at the following dates:
| (i) | market value of investment securities, other assets and liabilities—at the valuation date; and |
| (ii) | purchases and sales of investment securities, income and expenses—at the date of such transactions. |
The assets and liabilities that are denominated in foreign currency amounts are presented at the exchange rates and market values at the close of the period. The realized and unrealized changes in net assets arising from fluctuations in exchange rates and market prices of securities are not separately presented.
Net realized gain (loss) on foreign currency transactions represents net gains and losses on foreign currency forward contracts, net currency gains or losses realized as a result of differences between the amounts of securities sale proceeds or purchase cost, dividends, interest and withholding taxes as recorded on the Portfolio’s books, and the U.S. dollar equivalent amount actually received or paid. Net currency gains or losses from valuing such foreign currency denominated assets and liabilities, other than investments at valuation date exchange rates, are reflected in unrealized foreign exchange gains or losses.
(J) Securities Lending. In order to realize additional income, the Portfolio may engage in securities lending, subject to the limitations set forth in the 1940 Act and relevant guidance by the staff of the Securities and Exchange Commission (“SEC”). In the event the Portfolio does engage in securities lending, the Portfolio will lend through its custodian, State Street Bank and Trust Company (“State Street”). State Street will manage the Portfolio’s collateral in accordance with the lending agreement between the Portfolio and State Street, and indemnify the Portfolio against counterparty risk. The loans will be collateralized by U.S. Treasury securities at least equal at all times to the market value of the securities loaned. The Portfolio may bear the risk of
delay in recovery of, or loss of rights in, the securities loaned should the borrower of the securities experience financial difficulty. The Portfolio may also record a realized gain or loss on securities deemed sold due to a borrower’s inability to return securities on loan. The Portfolio bears the risk of any loss on investment of the collateral. The Portfolio will receive compensation for lending its securities in the form of fees or it will retain a portion of interest on the investment of any cash received as collateral. The Portfolio will also continue to receive interest and dividends on the securities loaned and any gain or loss in the market price of the securities loaned that may occur during the term of the loan will be for the account of the Portfolio. During the six-month period ended June 30, 2017, the Portfolio did not have any portfolio securities on loan.
(K) Energy Companies Risk. The Portfolio, under normal market conditions, invests at least 80% of its assets (net assets plus any borrowings for investment purposes) in a portfolio of (i) companies across the energy supply chain spectrum, including upstream, midstream and downstream energy companies, as well as oil and gas services companies, (ii) energy-intensive chemical, metal and industrial and manufacturing companies and engineering and construction companies that the Subadvisor expects to benefit from growing energy production and lower feedstock costs relative to global costs, and (iii) transportation and logistics companies providing solutions to the U.S. manufacturing industry. The Portfolio’s concentration in the energy sector may subject it to a variety of risks associated with that sector.
The Portfolio may invest up to 25% of its total assets in securities of domestic and foreign publicly traded partnerships and/or other issuers (including U.S. and Canadian royalty trusts and Canadian energy companies) engaged in the transportation, storage, processing, refining, marketing, exploration, production or mining of crude oil, natural gas, minerals or other natural resources (“Energy Companies”). The Portfolio may be particularly vulnerable to adverse events affecting Energy Companies as a result of its focus in Energy Companies.
The Portfolio may invest as a limited partner in the equity securities of MLPs. As limited partners of MLPs, holders of MLP equity securities are subject to certain risks inherent in the structure of MLPs, including (i) tax risks, (ii) the limited ability to elect or remove management or the general partner or managing member, (iii) limited voting rights, except with respect to extraordinary transactions, and (iv) conflicts of interest between the general partner or managing member and its affiliates, on the one hand, and the limited partners or members, on the other hand, including those arising from incentive distribution payments or corporate opportunities.
There are certain risks involved in investing in foreign securities that are in addition to the usual risks inherent in domestic instruments. These risks include those resulting from currency fluctuations, future adverse political or economic developments and possible imposition of currency exchange blockages or other foreign governmental laws or restrictions. These risks are likely to be greater in emerging markets than in developed markets. The ability of issuers of securities held by the Portfolio to meet their obligations may be affected by economic or political developments in a specific country, industry or region.
(L) Indemnifications. Under the Fund’s organizational documents, its officers and trustees are indemnified against certain liabilities that
Notes to Financial Statements (Unaudited) (continued)
may arise out of performance of their duties to the Fund. Additionally, in the normal course of business, the Portfolio enters into contracts with third-party service providers that contain a variety of representations and warranties and which may provide general indemnifications. The Portfolio’s maximum exposure under these arrangements is unknown, as this would involve future claims that may be made against the Portfolio that have not yet occurred. Based on experience, management is of the view that the risk of loss in connection with these potential indemnification obligations is remote. However, there can be no assurance that material liabilities related to such obligations will not arise in the future, which could adversely impact the Portfolio.
Note 3–Fees and Related Party Transactions
(A) Manager and Subadvisor. New York Life Investments, a registered investment adviser and an indirect, wholly-owned subsidiary of New York Life, serves as the Portfolio’s Manager pursuant to an Amended and Restated Management Agreement (“Management Agreement”). The Manager provides offices, conducts clerical, recordkeeping and bookkeeping services, and keeps most of the financial and accounting records required to be maintained by the Portfolio. Except for the portion of salaries and expenses that are the responsibility of the Portfolio, the Manager pays the salaries and expenses of all personnel affiliated with the Portfolio and the operational expenses of the Portfolio. The Portfolio reimburses New York Investments in an amount equal to a portion of the compensation of the Chief Pursuant to the terms of a Subadvisory Agreement with New York Life Investments, Cushing® Asset Management, LP (“Cushing”), a registered investment adviser, serves as Subadvisor to the Portfolio. New York Life Investments pays for the services of the Subadvisor. Compliance Officer attributable to the Portfolio.
The Fund, on behalf of the Portfolio, pays New York Life Investments in its capacity as the Portfolio’s investment manager and administrator, pursuant to the Management Agreement, a monthly fee for the services performed and the facilities furnished at an annual rate of the average daily net assets of 1.25%.
During the six-month period ended June 30, 2017, New York Life Investments earned fees from the Portfolio in the amount of $972,932.
State Street provides sub-administration and sub-accounting services to the Portfolio pursuant to an agreement with New York Life Investments. These services include calculating the daily NAVs of the Portfolio, maintaining the general ledger and sub-ledger accounts for the calculation of the Portfolio’s NAVs, and assisting New York Life Investments in conducting various aspects of the Portfolio’s administrative operations. For providing these services to the Portfolio, State Street is compensated by New York Life Investments.
(B) Distribution and Service Fees. The Fund, on behalf of the Portfolio, has entered into a distribution agreement with NYLIFE Distributors LLC (the “Distributor”), an indirect, wholly-owned subsidiary of New York Life. The Portfolio has adopted a distribution plan (the “Plan”) in accordance with the provisions of Rule 12b-1 under the 1940 Act. Under the Plan, the Distributor has agreed to provide, through its affiliates or independent third parties, various distribution-related, shareholder and administrative support services to the Service Class shareholders. For its services, the Distributor is entitled to a combined
distribution and service fee accrued daily and paid monthly at an annual rate of 0.25% of the average daily net assets attributable to the Service Class shares of the Portfolio.
Note 4–Federal Income Tax
During the year ended December 31, 2016, the tax character of distributions paid as reflected in the Statements of Changes in Net Assets was as follows:
Note 5–Custodian
State Street is the custodian of cash and securities held by the Portfolio. Custodial fees are charged to the Portfolio based on the Portfolio’s net assets and/or the market value of securities held by the Portfolio and the number of certain transactions incurred by the Portfolio.
Note 6–Line of Credit
The Portfolio and certain other funds managed by New York Life Investments, maintain a line of credit with a syndicate of banks in order to secure a source of funds for temporary purposes to meet unanticipated or excessive redemption requests.
Effective August 1, 2017, under the credit agreement (the “Credit Agreement”), the aggregate commitment amount is $600,000,000 with an additional uncommitted amount of $100,000,000. The commitment fee is an annual rate of 0.15% of the average commitment amount payable quarterly, regardless of usage, to State Street, who serves as the agent to the syndicate. The commitment fee is allocated among the Portfolio and certain other funds managed by New York Life Investments based upon their respective net assets and other factors. Interest on any revolving credit loan is charged based upon the Federal Funds Rate or the one month LIBOR, whichever is higher. The Credit Agreement expires on July 31, 2018, although the Portfolio, certain other funds managed by New York Life Investments and the syndicate of banks may renew the Credit Agreement for an additional year on the same or different terms. Prior to August 1, 2017, the aggregate commitment amount was $600,000,000 with an additional uncommitted amount of $100,000,000, and the commitment fee, under a credit agreement for which Bank of New York Mellon served as agent, was at an annual rate of 0.15% of the average commitment amount. During the six-month period ended June 30, 2017, there were no borrowings made or outstanding with respect to the Portfolio under the credit agreement for which Bank of New York Mellon served as agent.
Note 7–Interfund Lending Program
Pursuant to an exemptive order issued by the SEC, the Portfolio, along with certain other funds managed by New York Life Investments, may participate in an interfund lending program. The interfund lending program provides an alternative credit facility that permits the Portfolio and certain other funds managed by New York Life Investments to lend or borrow money for temporary purposes directly to or from one another, subject to the conditions of the exemptive order. During the six-month period ended June 30, 2017, there were no interfund loans made or outstanding with respect to the Portfolio.
| | |
| 20 | | MainStay VP Cushing Renaissance Advantage Portfolio |
Note 8–Purchases and Sales of Securities (in 000’s)
During the six-month period ended June 30, 2017, purchases and sales of securities, other than short-term securities, were $181,770 and $87,302, respectively.
Note 9–Capital Share Transactions
Transactions in capital shares for the six-month period ended June 30, 2017, and the year ended December 31, 2016, were as follows:
| | | | | | | | |
Initial Class | | Shares | | | Amount | |
Six-month period ended June 30, 2017: | | | | | | | | |
Shares sold | | | 9,125,673 | | | $ | 89,618,412 | |
Shares redeemed | | | (719,185 | ) | | | (6,449,847 | ) |
| | | | | | | | |
Net increase (decrease) | | | 8,406,488 | | | $ | 83,168,565 | |
| | | | | | | | |
Year ended December 31, 2016: | | | | | | | | |
Shares sold | | | 3,472,635 | | | $ | 30,175,908 | |
Shares issued to shareholders in reinvestment of dividends and distributions | | | 13,415 | | | | 120,480 | |
Shares redeemed | | | (3,890,473 | ) | | | (30,463,403 | ) |
| | | | | | | | |
Net increase (decrease) | | | (404,423 | ) | | $ | (167,015 | ) |
| | | | | | | | |
| | |
| | | | | | | | |
Service Class | | Shares | | | Amount | |
Six-month period ended June 30, 2017: | | | | | | | | |
Shares sold | | | 2,963,321 | | | $ | 27,702,306 | |
Shares redeemed | | | (2,361,767 | ) | | | (21,619,310 | ) |
| | | | | | | | |
Net increase (decrease) | | | 601,554 | | | $ | 6,082,996 | |
| | | | | | | | |
Year ended December 31, 2016: | | | | | | | | |
Shares sold | | | 4,134,804 | | | $ | 34,395,387 | |
Shares issued to shareholders in reinvestment of dividends and distributions | | | 3,989 | | | | 35,763 | |
Shares redeemed | | | (2,173,531 | ) | | | (18,167,635 | ) |
| | | | | | | | |
Net increase (decrease) | | | 1,965,262 | | | $ | 16,263,515 | |
| | | | | | | | |
Note 10–Recent Accounting Pronouncement
In October 2016, the SEC adopted new rules and amended existing rules (together, “final rules”) intended to modernize the reporting and disclosure of information by registered investment companies. In part, the final rules amend Regulation S-X and require standardized, enhanced disclosure about derivatives in investment company financial statements, as well as other amendments. The compliance date for the amendments to Regulation S-X is August 1, 2017 and applies to shareholder reports for funds with fiscal periods ending after August 1, 2017. Management is currently evaluating the impact that the adoption of the amendments to Regulation S-X will have on the Portfolio financial statements and related disclosures.
Note 11–Subsequent Events
In connection with the preparation of the financial statements of the Portfolio as of and for the six-month period ended June 30, 2017, events and transactions subsequent to June 30, 2017, through the date the financial statements were issued have been evaluated by the Portfolio’s management for possible adjustment and/or disclosure. No subsequent events requiring financial statement adjustment or disclosure have been identified.
Proxy Voting Policies and Procedures and Proxy Voting Record
A description of the policies and procedures that New York Life Investments uses to vote proxies related to the Portfolio’s securities is available without charge, upon request, (i) by calling 800-598-2019 or (ii) by visiting the SEC’s website at www.sec.gov.
The Portfolio is required to file with the SEC its proxy voting record for the 12-month period ending June 30 on Form N-PX. The Portfolio’s most recent Form N-PX or proxy voting record is available free of charge upon request (i) by calling 800-598-2019 or; (ii) by visiting the SEC’s website at www.sec.gov.
Shareholder Reports and Quarterly Portfolio Disclosure
The Portfolio is required to file its complete schedule of portfolio holdings with the SEC for its first and third fiscal quarters on Form N-Q. The Portfolio’s Form N-Q is available without charge on the SEC’s website at www.sec.gov or by calling MainStay Investments at 800-598-2019. You also can obtain and review copies of Form N-Q by visiting the SEC’s Public Reference Room in Washington, DC (information on the operation of the Public Reference Room may be obtained by calling 1-800-SEC-0330).
| | |
| 22 | | MainStay VP Cushing Renaissance Advantage Portfolio |
MainStay VP Portfolios
MainStay VP offers a wide range of Portfolios. The full array of MainStay VP offerings is listed here, with information about the manager, subadvisors, legal counsel, and independent registered public accounting firm.
Equity Portfolios
MainStay VP Common Stock Portfolio
MainStay VP Cornerstone Growth Portfolio
MainStay VP Eagle Small Cap Growth Portfolio
MainStay VP Emerging Markets Equity Portfolio
MainStay VP Epoch U.S. Equity Yield Portfolio
MainStay VP Epoch U.S. Small Cap Portfolio
MainStay VP International Equity Portfolio
MainStay VP Large Cap Growth Portfolio
MainStay VP MFS® Utilities Portfolio
MainStay VP Mid Cap Core Portfolio
MainStay VP S&P 500 Index Portfolio
MainStay VP Small Cap Core Portfolio
MainStay VP T. Rowe Price Equity Income Portfolio
MainStay VP VanEck Global Hard Assets Portfolio
Mixed Asset Portfolios
MainStay VP Balanced Portfolio
MainStay VP Convertible Portfolio
MainStay VP Cushing Renaissance Advantage Portfolio
MainStay VP Income Builder Portfolio
MainStay VP Janus Henderson Balanced Portfolio
Income Portfolios
MainStay VP Bond Portfolio
MainStay VP Floating Rate Portfolio
MainStay VP Government Portfolio
MainStay VP High Yield Corporate Bond Portfolio
MainStay VP Indexed Bond Portfolio
MainStay VP PIMCO Real Return Portfolio
MainStay VP Unconstrained Bond Portfolio
Money Market
MainStay VP U.S. Government Money Market Portfolio
Alternative
MainStay VP Absolute Return Multi-Strategy Portfolio
Asset Allocation Portfolios
MainStay VP Conservative Allocation Portfolio
MainStay VP Growth Allocation Portfolio
MainStay VP Moderate Allocation Portfolio
MainStay VP Moderate Growth Allocation Portfolio
Manager
New York Life Investment Management LLC
New York, New York
Subadvisors
Candriam Belgium*
Brussels, Belgium
Candriam France S.A.S.*
Paris, France
Cornerstone Capital Management Holdings LLC*
New York, New York
Cushing Asset Management, LP
Dallas, Texas
Eagle Asset Management, Inc.
St Petersburg, Florida
Epoch Investment Partners, Inc.
New York, New York
Janus Capital Management LLC
Denver, Colorado
MacKay Shields LLC*
New York, New York
Massachusetts Financial Services Company
Boston, Massachusetts
NYL Investors LLC*
New York, New York
Pacific Investment Management Company LLC
Newport Beach, California
T. Rowe Price Associates, Inc.
Baltimore, Maryland
Van Eck Associates Corporation
New York, New York
Winslow Capital Management, LLC
Minneapolis, Minnesota
Distributor
NYLIFE Distributors LLC*
Jersey City, New Jersey
Custodian
State Street Bank and Trust Company
Boston, Massachusetts
Independent Registered Public Accounting Firm
PricewaterhouseCoopers LLP
New York, New York
Legal Counsel
Dechert LLP
Washington, District of Columbia
Some Portfolios may not be available in all products.
* An affiliate of New York Life Investment Management LLC
Not part of the Semiannual Report
2017 Semiannual Report
This report is for the general information of New York Life Variable Annuities and NYLIAC Variable Universal Life Insurance Products policyowners. It must be preceded or accompanied by the appropriate product(s) and funds prospectuses if it is given to anyone who is not an owner of a New York Life variable annuity policy or a NYLIAC Variable Universal Life Insurance Product. This report does not offer for sale or solicit orders to purchase securities.
The performance data quoted in this report represents past performance. Past performance is no guarantee of future results. Due to market volatility and other factors, current performance may be lower or higher than the figures shown. The most recent month-end performance summary for your variable annuity or variable life policy is available by calling 800-598-2019 and is updated periodically on www.newyorklife.com.
The New York Life Variable Annuities and NYLIAC Variable Universal Life Insurance Products are issued by New York Life Insurance and Annuity Corporation (a Delaware Corporation) and distributed by NYLIFE Distributors LLC (Member FINRA/SIPC).
New York Life Insurance Company
New York Life Insurance and Annuity Corporation (NYLIAC) (A Delaware Corporation)
51 Madison Avenue, Room 551
New York, NY 10010
www.newyorklife.com
Printed on recycled paper
mainstayinvestments.com
NYLIFE Distributors LLC, 30 Hudson Street, Jersey City, NJ 07302
New York Life Investment Management LLC is the investment manager to the MainStay VP Funds Trust
©2017 by NYLIFE Distributors LLC. All rights reserved.
You may obtain copies of the Prospectus and the Statement of Additional Information free of charge, upon request, by calling toll-free 800-598-2019 or writing to New York Life Insurance and Annuity Corporation, 51 Madison Avenue, New York, NY 10010.
| | | | |
| Not FDIC Insured | | No Bank Guarantee | | May Lose Value |
| | | | |
| 1743158 | | | | MSVPCRA10-08/17 (NYLIAC) NI514 |
MainStay VP Small Cap Core Portfolio
Message from the President and Semiannual Report
Unaudited | June 30, 2017

Sign up for electronic delivery of your shareholder reports. For full details on electronic delivery, including who can participate and what you
can receive via eDelivery, please log on to www.newyorklife.com/vsc

This page intentionally left blank
Message from the President
The six months ended June 30, 2017, brought positive results to many stock and bond investors. The year began with many investors hoping that Republican control of the White House, the Senate and the House of Representatives could bring an end to political gridlock; and while debate has continued on a number of issues, the U.S. stock market climbed relatively steadily throughout the first half of 2017.
According to FTSE-Russell U.S. market data, stocks at all capitalization levels tended to record positive total returns during the reporting period, with large-cap stocks generally outperforming stocks of smaller-capitalization companies. Growth stocks outpaced value stocks at every capitalization level by substantial margins—from more than six percentage points for micro-caps and mid-caps to more than 10 percentage points for the largest 200 U.S. companies by market capitalization.
Most sectors of the stock market advanced during the reporting period, with energy and telecommunication services being notable exceptions. Energy stocks declined as oil prices fell despite moves by the Organization of Petroleum Exporting Countries (OPEC) intended to limit oil production by its members. Telecommunication services stocks tended to decline as competition increased and rising interest rates made dividend payouts less appealing.
In March and June of 2017, the Federal Reserve announced successive increases in the target range for the federal funds rate, ultimately bringing the federal funds target range to 1.00% to 1.25%. While short-term U.S. Treasury yields rose in response, yields for U.S. Treasury securities with maturities of five years or longer declined. As the difference between short- and long-term yields narrowed, the advantages of higher-yielding long-term bonds became increasingly apparent.
Virtually all taxable and tax-exempt bond sectors provided positive total returns during the reporting period. Mortgage-backed
securities, though providing positive total returns, faced headwinds when the Federal Reserve announced plans to begin normalizing its balance sheet by reducing reinvestment of principal payments on mortgage-backed securities.
International stock and bond markets were also strong during the reporting period. International stocks provided double-digit total returns that were surpassed by emerging-market stocks as a whole. Global investment-grade bonds provided single-digit returns; and emerging-market debt was somewhat stronger.
Even during periods of favorable market performance and generally positive returns, MainStay believes that it is important to carefully monitor your investments. Your risk tolerance may
change over time, leading you to reevaluate which MainStay VP Portfolios are most appropriate for your long-term goals. Your goals themselves may also change, leading you to pursue investments with more or less risk. The portfolio managers of MainStay VP Portfolios seek to provide results consistent with the investment objectives of their respective Portfolios, to give you a wide range of choices suitable to various investment needs.
The report that follows provides more detailed information about the specific markets, securities and investment decisions that influenced your MainStay VP Portfolio during the six months ended June 30, 2017. We invite you to review the report carefully as part of your ongoing investment evaluation and review.
Sincerely,

Stephen P. Fisher
President
The opinions expressed are as of the date of the accompanying report and are subject to change. Past performance is no guarantee of future results. There is no guarantee that any forecasts made will come to pass. This material does not constitute investment advice and is not intended as an endorsement of any specific investment.
Not all MainStay VP Portfolios and/or share classes are available under all policies.
Not part of the Semiannual Report
Table of Contents
Investors should refer to the Portfolio’s Summary Prospectus and/or Prospectus and consider the Portfolio’s investment objectives, strategies, risks, charges and expenses carefully before investing. The Summary Prospectus and/or Prospectus contain this and other information about the Portfolio. You may obtain copies of the Portfolio’s Summary Prospectus and/or the Prospectus and the Statement of Additional Information free of charge, upon request, by calling toll-free 800-598-2019, by writing to New York Life Insurance and Annuity Corporation, 51 Madison Avenue, Room 251, New York, New York 10010 or by sending an email to MainStayShareholdersServices@nylim.com. These documents are also available at mainstayinvestments.com/vpdocuments. Please read the Summary Prospectus and/or Prospectus carefully before investing. MainStay VP Funds Trust portfolios are separate account options which are purchased through a variable insurance or variable annuity contract.
Investment and Performance Comparison1 (Unaudited)
Performance data quoted represents past performance. Past performance is no guarantee of future results. Because of market volatility and other factors, current performance may be lower or higher than the figures shown. Investment return and principal value will fluctuate, and as a result, when shares are redeemed, they may be worth more or less than their original cost. The performance table and graph do not reflect any deduction of sales charges, mortality and expense charges, contract charges or administrative charges. Please refer to the Performance Summary appropriate for your policy. For performance information current to the most recent month-end, please call 800-598-2019 or visit www.newyorklife.com.
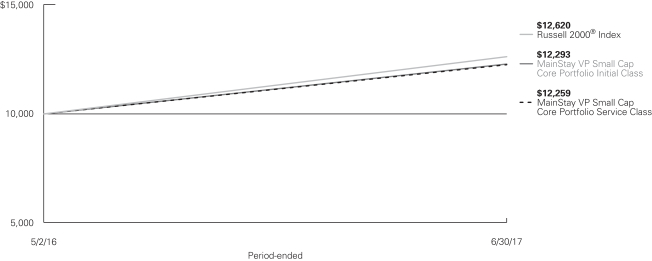
Average Annual Total Returns for the Period Ended June 30, 2017
| | | | | | | | | | |
| Class | | Inception Date | | Six Months | | One Year | | Five Years
or Since
Inception | | Gross
Expense
Ratio2 |
| Initial Class Shares | | 5/2/2016 | | 3.19% | | 22.54% | | 19.45% | | 1.03% |
| Service Class Shares | | 5/2/2016 | | 3.06 | | 22.23 | | 19.16 | | 1.28 |
| | | | | | | | | | | | |
| Benchmark Performance | | Six
Months | | | One
Year | | | Five Years
or Since
Inception | |
Russell 2000® Index3 | | | 4.99 | % | | | 24.60 | % | | | 22.20 | % |
Average Lipper Variable Products Small-Cap Core Portfolio4 | | | 3.57 | | | | 22.33 | | | | 21.29 | |
| 1. | Performance figures reflect certain fee waivers and/or expense limitations, without which total returns may have been different. For information on current fee waivers and/or expense limitations (if any), please refer to the Notes to Financial Statements. |
| 2. | The gross expense ratios presented reflect the Portfolio’s “Total Annual Portfolio Operating Expenses” from the most recent Prospectus and may differ from other expense ratios disclosed in this report. |
| 3. | The Russell 2000® Index is the Portfolio’s primary broad-based securities market index for comparison purposes. The Russell 2000® Index measures the performance of the small-cap segment of the U.S. equity universe. It is a subset of the Russell 3000® Index and includes approximately 2,000 of the smallest securities based on a combination of their market cap and current |
| | index membership. Results assume reinvestment of all dividends and capital gains. An investment cannot be made directly in an index. |
| 4. | The Average Lipper Variable Products Small-Cap Core Portfolio is representative of portfolios that, by portfolio practice, invest at least 75% of their equity assets in companies with market capitalizations (on a three-year weighted basis) below Lipper’s U.S. diversified equity small-cap ceiling. Small-cap core portfolios have more latitude in the companies in which they invest. These portfolios typically have average characteristics compared to the S&P SmallCap 600® Index. This benchmark is a product of Lipper Inc. Lipper Inc. is an independent monitor of fund performance. Results are based on average total returns of similar portfolios with all dividend and capital gain distributions reinvested. |
Cost in Dollars of a $1,000 Investment in MainStay VP Small Cap Core Portfolio (Unaudited)
The example below is intended to describe the fees and expenses borne by shareholders during the six-month period from January 1, 2017 to June 30, 2017, and the impact of those costs on your investment.
Example
As a shareholder of the Portfolio, you incur two types of costs: (1) transaction costs, including exchange fees and sales charges (loads) on purchases (as applicable), and (2) ongoing costs, including management fees, distribution and/or service (12b-1) fees, and other Portfolio expenses (as applicable). This example is intended to help you understand your ongoing costs (in dollars) of investing in the Portfolio and to compare these costs with the ongoing costs of investing in other mutual funds. The example is based on an investment of $1,000 made at the beginning of the six-month period and held for the entire period from January 1, 2017 to June 30, 2017. Shares are only sold in connection with variable life and annuity contracts and the example does not reflect any contract level or transactional fees or expenses. If these costs had been included, your costs would have been higher.
This example illustrates your Portfolio’s ongoing costs in two ways:
Actual Expenses
The second and third data columns in the table below provide information about actual account values and actual expenses. You may use the information in these columns, together with the amount you invested, to estimate the expenses that you paid during the six months ended June 30, 2017. Simply divide your account value by $1,000
(for example, an $8,600 account value divided by $1,000 = 8.6), then multiply the result by the number under the heading entitled “Expenses Paid During Period” to estimate the expenses you paid on your account during this period.
Hypothetical Example for Comparison Purposes
The fourth and fifth data columns in the table below provide information about hypothetical account values and hypothetical expenses based on the Portfolio’s actual expense ratio and an assumed rate of return of 5% per year before expenses, which is not the Portfolio’s actual return. The hypothetical account values and expenses may not be used to estimate the actual ending account balances or expenses you paid for the six-month period shown. You may use this information to compare the ongoing costs of investing in the Portfolio with the ongoing costs of investing in other mutual funds. To do so, compare this 5% hypothetical example with the 5% hypothetical examples that appear in the shareholder reports of the other mutual funds.
Please note that the expenses shown in the table are meant to highlight your ongoing costs only and do not reflect any transactional costs, such as exchange fees or sales charges (loads). Therefore, the fourth and fifth data columns of the table are useful in comparing ongoing costs only and will not help you determine the relative total costs of owning different funds. In addition, if these transactional costs were included, your costs would have been higher.
| | | | | | | | | | | | | | | | | | | | | | |
| | | | | | | | | | | | | | | | | | |
| Share Class | | Beginning
Account
Value
1/1/17 | | | Ending Account
Value (Based
on Actual
Returns and
Expenses)
6/30/17 | | | Expenses
Paid
During
Period1 | | | Ending Account
Value (Based
on Hypothetical
5% Annualized
Return and
Actual Expenses)
6/30/17 | | | Expenses
Paid
During
Period1 | | | Net Expense
Ratio
During
Period2 |
| | | | | | |
| Initial Class Shares | | $ | 1,000.00 | | | $ | 1,031.90 | | | $ | 4.58 | | | $ | 1,020.30 | | | $ | 4.56 | | | 0.91% |
| | | | | | |
| Service Class Shares | | $ | 1,000.00 | | | $ | 1,030.60 | | | $ | 5.84 | | | $ | 1,019.00 | | | $ | 5.81 | | | 1.16% |
| 1. | Expenses are equal to the Portfolio’s annualized expense ratio of each class multiplied by the average account value over the period, divided by 365 and multiplied by 181 (to reflect the six-month period). The table above represents the actual expenses incurred during the six-month period. |
| 2. | Expenses are equal to the Portfolio’s annualized expense ratio to reflect the six-month period. |
| | |
| 6 | | MainStay VP Small Cap Core Portfolio |
Industry Composition as of June 30, 2017 (Unaudited)
| | | | |
| Banks | | | 9.6 | % |
| Biotechnology | | | 6.0 | |
| Equity Real Estate Investment Trusts (REITs) | | | 6.0 | |
| Machinery | | | 4.2 | |
| Electronic Equipment, Instruments & Components | | | 4.0 | |
| Hotels, Restaurants & Leisure | | | 4.0 | |
| Chemicals | | | 3.7 | |
| Health Care Equipment & Supplies | | | 3.7 | |
| Thrifts & Mortgage Finance | | | 3.7 | |
| Pharmaceuticals | | | 3.3 | |
| Semiconductors & Semiconductor Equipment | | | 3.2 | |
| Household Durables | | | 3.1 | |
| Commercial Services & Supplies | | | 3.0 | |
| Internet Software & Services | | | 2.9 | |
| Software | | | 2.9 | |
| Oil, Gas & Consumable Fuels | | | 2.7 | |
| Food Products | | | 2.2 | |
| Professional Services | | | 2.1 | |
| Consumer Finance | | | 2.0 | |
| Trading Companies & Distributors | | | 2.0 | |
| Health Care Providers & Services | | | 1.9 | |
| Specialty Retail | | | 1.8 | |
| Diversified Consumer Services | | | 1.7 | |
| Electrical Equipment | | | 1.7 | |
| Internet & Direct Marketing Retail | | | 1.5 | |
| Media | | | 1.5 | |
| Energy Equipment & Services | | | 1.4 | |
| Aerospace & Defense | | | 1.2 | |
| | | | |
| Diversified Telecommunication Services | | | 1.1 | % |
| Health Care Technology | | | 1.1 | |
| Real Estate Management & Development | | | 1.0 | |
| Communications Equipment | | | 0.9 | |
| IT Services | | | 0.9 | |
| Household Products | | | 0.8 | |
| Insurance | | | 0.8 | |
| Life Sciences Tools & Services | | | 0.8 | |
| Exchange Traded Funds | | | 0.7 | |
| Independent Power & Renewable Electricity Producers | | | 0.7 | |
| Tobacco | | | 0.7 | |
| Water Utilities | | | 0.7 | |
| Beverages | | | 0.6 | |
| Leisure Products | | | 0.5 | |
| Capital Markets | | | 0.4 | |
| Auto Components | | | 0.3 | |
| Electric Utilities | | | 0.3 | |
| Building Products | | | 0.2 | |
| Construction & Engineering | | | 0.2 | |
| Diversified Financial Services | | | 0.1 | |
| Marine | | | 0.1 | |
| Paper & Forest Products | | | 0.1 | |
| Air Freight & Logistics | | | 0.0 | ‡ |
| Multiline Retail | | | 0.0 | ‡ |
| Personal Products | | | 0.0 | ‡ |
| Technology Hardware, Storage & Peripherals | | | 0.0 | ‡ |
| Other Assets, Less Liabilities | | | 0.0 | ‡ |
| | | | |
| | | 100.0 | % |
| | | | |
See Portfolio of Investments beginning on page 10 for specific holdings within these categories.
| ‡ | Less than one-tenth of a percent. |
Top Ten Holdings as of June 30, 2017 (excluding short-term investment) (Unaudited)
| 4. | Sunstone Hotel Investors, Inc. |
| 8. | McDermott International, Inc. |
| 10. | PS Business Parks, Inc. |
Portfolio Management Discussion and Analysis (Unaudited)
Answers to the questions reflect the views of portfolio managers Migene Kim, CFA, Andrew Ver Planck, CFA, and Mona Patni of Cornerstone Capital Management Holdings LLC, the Portfolio’s Subadvisor.
How did MainStay VP Small Cap Core Portfolio perform relative to its benchmark and peers during the six months ended June 30, 2017?
For the six months ended June 30, 2017, MainStay VP Small Cap Core Portfolio returned 3.19% for Initial Class shares and 3.06% for Service Class shares. Over the same period, both share classes underperformed the 4.99% return of the Russell 2000® Index,1 which is the Portfolio’s benchmark, and the 3.57% return of the Average Lipper2 Variable Products Small-Cap Core Portfolio.
What factors affected the Portfolio’s relative performance during the reporting period?
Stock selection detracted from the Portfolio’s performance relative to the Russell 2000® Index. Allocation effects—being overweight or underweight specific sectors as a result of the Portfolio’s bottom-up stock selection process—had a modestly negative impact on relative performance during the reporting period.
Which sectors were the strongest positive contributors to the Portfolio’s relative performance, and which sectors were particularly weak?
Materials, telecommunication services and real estate were the Portfolio’s strongest-contributing sectors relative to the Russell 2000® Index during the reporting period. (Contributions take weightings and total returns into account.) The contributions in these sectors were driven by favorable stock selection. Overweight positions in the outperforming materials and telecommunication services sectors—and an underweight position in the underperforming real estate sector—also contributed modestly to the Portfolio’s relative performance.
The weakest sector contributions to the Portfolio’s relative performance came from consumer discretionary, information technology and utilities. Unfavorable stock selection detracted in each of these sectors. Underweight positions in the outperforming information technology and utilities sectors—and an overweight position in the underperforming consumer discretionary sector—also detracted modestly from the Portfolio’s relative performance.
During the reporting period, which individual stocks made the strongest positive contributions to the Portfolio’s absolute performance and which stocks detracted the most?
The stock that made the strongest positive contribution to the Portfolio’s absolute performance was industrial chemicals and refrigerants maker Chemours. The company posted strong
results on increasing product demand and solid pricing trends. Another strong absolute performer for the Portfolio was regional landline and mobile telecommunication services provider General Communications. The company’s shares rose after an announced takeover in April 2017 by Liberty Interactive. OraSure Technologies, a maker of diagnostic products for the health care segment, was also a strong absolute performer for the Portfolio. The stock moved higher after the company reported strong financial results driven by improved international sales.
On an absolute basis, the Portfolio’s weakest stock performers were coal miner Westmoreland Coal, which fell alongside energy prices and slowing demand; home furnishing retailer Pier 1 Imports, which declined as its weak digital presence weighed on the shares when compared to successful e-commerce companies like Amazon.com; and regional banking services provider Opus Bank, which declined because of deteriorating performance within its loan book.
Did the Portfolio make any significant purchases or sales during the reporting period?
The Portfolio entered into new and overweight positions relative to the Russell 2000® Index in hotel owner and operator Sunstone Hotel Investors and homebuilder Taylor Morrison Home. Both companies exhibited improving cash flow–based valuation, strong industry momentum and attractive sentiment. In our view, Taylor Morrison Home also looked attractive from a valuation perspective, while the company exhibited strong earnings trends.
The Portfolio exited positions in banking and financial services company Umpqua Holdings and owner and operator of assisted and senior living facilities National Health Investors. The Portfolio sold its position in Umpqua Holdings because of deteriorating earnings trends and what we considered to be a less-than-attractive valuation. The Portfolio sold its position in National Health Investors mainly because of poor price and earnings trends and what we viewed as a less-than-compelling valuation.
How did the Portfolio’s sector weightings change during the reporting period?
During the reporting period, the Portfolio modestly increased its weightings relative to the Russell 2000® Index in the consumer discretionary and real estate sectors. Over the same period, the Portfolio modestly reduced its weightings relative to the Index in industrials and materials.
| 1. | See footnote on page 5 for more information on the Russell 2000® Index. |
| 2. | See footnote on page 5 for more information on Lipper Inc. |
| | |
| 8 | | MainStay VP Small Cap Core Portfolio |
How was the Portfolio positioned at the end of the reporting period?
As of June 30, 2017, the Portfolio held modestly overweight positions relative to the Russell 2000® Index in the consumer discretionary and health care sectors. As of the same date, the Portfolio held modestly underweight positions relative to the Index in information technology and utilities.
The opinions expressed are those of the portfolio managers as of the date of this report and are subject to change. There is no guarantee that any forecasts made will come to pass. This material does not constitute investment advice and is not intended as an endorsement of any specific investment.
Not all MainStay VP Portfolios and/or share classes are available under all policies.
Portfolio of Investments June 30, 2017 (Unaudited)
| | | | | | | | |
| | |
Shares | | | Value | |
| Common Stocks 99.3%† | |
Aerospace & Defense 1.2% | |
Ducommun, Inc. (a) | | | 37,500 | | | $ | 1,184,250 | |
Sparton Corp. (a) | | | 43,800 | | | | 963,162 | |
Vectrus, Inc. (a) | | | 59,500 | | | | 1,923,040 | |
| | | | | | | | |
| | | | | | | 4,070,452 | |
| | | | | | | | |
Air Freight & Logistics 0.0%‡ | |
Radiant Logistics, Inc. (a) | | | 9,300 | | | | 50,034 | |
| | | | | | | | |
|
Auto Components 0.3% | |
Cooper-Standard Holdings, Inc. (a) | | | 4,700 | | | | 474,089 | |
Shiloh Industries, Inc. (a) | | | 3,300 | | | | 38,742 | |
Stoneridge, Inc. (a) | | | 43,400 | | | | 668,794 | |
| | | | | | | | |
| | | | | | | 1,181,625 | |
| | | | | | | | |
Banks 9.6% | |
ACNB Corp. | | | 400 | | | | 12,200 | |
Ames National Corp. | | | 200 | | | | 6,120 | |
Arrow Financial Corp. | | | 800 | | | | 25,320 | |
Atlantic Capital Bancshares, Inc. (a) | | | 2,000 | | | | 38,000 | |
Banc of California, Inc. | | | 55,500 | | | | 1,193,250 | |
Bancorp, Inc. (a) | | | 157,400 | | | | 1,193,092 | |
Bank of Marin Bancorp | | | 2,400 | | | | 147,720 | |
Bankwell Financial Group, Inc. | | | 3,800 | | | | 118,674 | |
Berkshire Hills Bancorp, Inc. | | | 54,400 | | | | 1,912,160 | |
Blue Hills Bancorp, Inc. | | | 7,200 | | | | 128,880 | |
Bridge Bancorp, Inc. | | | 11,990 | | | | 399,267 | |
Central Valley Community Bancorp | | | 21,700 | | | | 480,872 | |
Century Bancorp, Inc. Class A | | | 2,800 | | | | 178,080 | |
Chemung Financial Corp. | | | 100 | | | | 4,088 | |
Civista Bancshares, Inc. | | | 1,700 | | | | 35,496 | |
CNB Financial Corp. | | | 13,800 | | | | 330,786 | |
Codorus Valley Bancorp, Inc. | | | 1,600 | | | | 45,440 | |
County Bancorp, Inc. | | | 1,000 | | | | 24,000 | |
Customers Bancorp, Inc. (a) | | | 77,500 | | | | 2,191,700 | |
Farmers National Banc Corp. | | | 39,200 | | | | 568,400 | |
FB Financial Corp. (a) | | | 200 | | | | 7,238 | |
Financial Institutions, Inc. | | | 26,700 | | | | 795,660 | |
First BanCorp (a) | | | 389,500 | | | | 2,255,205 | |
First Business Financial Services, Inc. | | | 10,900 | | | | 251,572 | |
First Citizens BancShares, Inc. Class A | | | 4,500 | | | | 1,677,150 | |
First Connecticut Bancorp, Inc. | | | 1,600 | | | | 41,040 | |
First Financial Northwest, Inc. | | | 15,800 | | | | 254,854 | |
First Foundation, Inc. (a) | | | 46,200 | | | | 759,066 | |
First Internet Bancorp | | | 15,900 | | | | 445,995 | |
First Mid-Illinois Bancshares, Inc. | | | 6,000 | | | | 205,440 | |
First Northwest Bancorp (a) | | | 14,300 | | | | 225,511 | |
First of Long Island Corp. | | | 25,100 | | | | 717,860 | |
Flushing Financial Corp. | | | 23,400 | | | | 659,646 | |
| | | | | | | | |
| | |
Shares | | | Value | |
Banks (continued) | |
Franklin Financial Network, Inc. (a) | | | 43,300 | | | $ | 1,786,125 | |
Guaranty Bancorp | | | 9,000 | | | | 244,800 | |
Hanmi Financial Corp. | | | 37,400 | | | | 1,064,030 | |
Heritage Commerce Corp. | | | 6,300 | | | | 86,814 | |
Horizon Bancorp | | | 35,250 | | | | 928,837 | |
LCNB Corp. | | | 2,900 | | | | 58,000 | |
MainSource Financial Group, Inc. | | | 2,900 | | | | 97,179 | |
Mercantile Bank Corp. | | | 24,100 | | | | 758,668 | |
MidWestOne Financial Group, Inc. | | | 10,200 | | | | 345,678 | |
Northeast Bancorp | | | 1,400 | | | | 28,490 | |
Northrim BanCorp, Inc. | | | 11,600 | | | | 352,640 | |
OFG Bancorp | | | 158,600 | | | | 1,586,000 | |
Old Line Bancshares, Inc. | | | 5,200 | | | | 146,536 | |
Opus Bank | | | 24,600 | | | | 595,320 | |
Orrstown Financial Services, Inc. | | | 1,100 | | | | 25,135 | |
Peapack Gladstone Financial Corp. | | | 28,700 | | | | 898,023 | |
People’s Utah Bancorp | | | 3,900 | | | | 104,520 | |
Preferred Bank | | | 500 | | | | 26,735 | |
QCR Holdings, Inc. | | | 10,400 | | | | 492,960 | |
Republic Bancorp, Inc. Class A | | | 13,100 | | | | 467,670 | |
Shore Bancshares, Inc. | | | 10,700 | | | | 176,015 | |
Sierra Bancorp | | | 3,800 | | | | 93,290 | |
Southside Bancshares, Inc. | | | 6,150 | | | | 214,881 | |
Sunshine Bancorp, Inc. (a) | | | 900 | | | | 19,179 | |
Triumph Bancorp, Inc. (a) | | | 12,300 | | | | 301,965 | |
Valley National Bancorp | | | 179,300 | | | | 2,117,533 | |
WesBanco, Inc. | | | 49,500 | | | | 1,957,230 | |
West Bancorp., Inc. | | | 11,950 | | | | 282,618 | |
| | | | | | | | |
| | | | | | | 32,586,653 | |
| | | | | | | | |
Beverages 0.6% | |
Coca-Cola Bottling Co. Consolidated | | | 9,400 | | | | 2,151,378 | |
| | | | | | | | |
|
Biotechnology 6.0% | |
Acceleron Pharma, Inc. (a) | | | 15,802 | | | | 480,223 | |
Achillion Pharmaceuticals, Inc. (a) | | | 46,776 | | | | 214,702 | |
Acorda Therapeutics, Inc. (a) | | | 33,599 | | | | 661,900 | |
Alder Biopharmaceuticals, Inc. (a) | | | 16,007 | | | | 183,280 | |
AMAG Pharmaceuticals, Inc. (a) | | | 12,955 | | | | 238,372 | |
Amicus Therapeutics, Inc. (a) | | | 41,240 | | | | 415,287 | |
Arena Pharmaceuticals, Inc. (a) | | | 14,183 | | | | 239,267 | |
Array BioPharma, Inc. (a) | | | 46,835 | | | | 392,009 | |
Bluebird Bio, Inc. (a) | | | 9,417 | | | | 989,256 | |
Celldex Therapeutics, Inc. (a) | | | 55,498 | | | | 137,080 | |
Clovis Oncology, Inc. (a) | | | 8,948 | | | | 837,801 | |
Coherus Biosciences, Inc. (a) | | | 12,253 | | | | 175,830 | |
Eagle Pharmaceuticals, Inc. (a) | | | 3,184 | | | | 251,186 | |
Emergent BioSolutions, Inc. (a) | | | 9,692 | | | | 328,656 | |
Exact Sciences Corp. (a) | | | 23,686 | | | | 837,774 | |
| † | Percentages indicated are based on Fund net assets. |
| ¨ | | Among the Portfolio’s 10 largest holdings, as of June 30, 2017, excluding short-term investment. May be subject to change daily. |
| | | | |
| 10 | | MainStay VP Small Cap Core Portfolio | | The notes to the financial statements are an integral part of,
and should be read in conjunction with, the financial statements. |
| | | | | | | | |
| | |
Shares | | | Value | |
| Common Stocks (continued) | |
Biotechnology (continued) | |
Exelixis, Inc. (a) | | | 50,366 | | | $ | 1,240,514 | |
FibroGen, Inc. (a) | | | 15,019 | | | | 485,114 | |
Five Prime Therapeutics, Inc. (a) | | | 9,035 | | | | 272,044 | |
Genomic Health, Inc. (a) | | | 6,995 | | | | 227,687 | |
Halozyme Therapeutics, Inc. (a) | | | 30,400 | | | | 389,728 | |
Insmed, Inc. (a) | | | 18,990 | | | | 325,868 | |
Ironwood Pharmaceuticals, Inc. (a) | | | 31,452 | | | | 593,814 | |
Kite Pharma, Inc. (a) | | | 10,019 | | | | 1,038,670 | |
Ligand Pharmaceuticals, Inc. (a) | | | 4,727 | | | | 573,858 | |
MacroGenics, Inc. (a) | | | 12,188 | | | | 213,412 | |
Merrimack Pharmaceuticals, Inc. | | | 81,697 | | | | 101,304 | |
MiMedx Group, Inc. (a) | | | 27,814 | | | | 416,376 | |
Momenta Pharmaceuticals, Inc. (a) | | | 19,969 | | | | 337,476 | |
Myriad Genetics, Inc. (a) | | | 18,410 | | | | 475,714 | |
PDL BioPharma, Inc. (a) | | | 76,308 | | | | 188,481 | |
Portola Pharmaceuticals, Inc. (a) | | | 12,142 | | | | 682,016 | |
Prothena Corp. PLC (a) | | | 9,307 | | | | 503,695 | |
Puma Biotechnology, Inc. (a) | | | 6,874 | | | | 600,788 | |
Radius Health, Inc. (a) | | | 9,233 | | | | 417,609 | |
Repligen Corp. (a) | | | 4,776 | | | | 197,917 | |
Sage Therapeutics, Inc. (a) | | | 7,520 | | | | 598,893 | |
Sarepta Therapeutics, Inc. (a) | | | 13,351 | | | | 450,062 | |
Spark Therapeutics, Inc. (a) | | | 5,816 | | | | 347,448 | |
Spectrum Pharmaceuticals, Inc. (a) | | | 97,015 | | | | 722,762 | |
Synergy Pharmaceuticals, Inc. (a) | | | 69,838 | | | | 310,779 | |
TESARO, Inc. (a) | | | 6,342 | | | | 886,992 | |
Ultragenyx Pharmaceutical, Inc. (a) | | | 9,544 | | | | 592,778 | |
Versartis, Inc. (a) | | | 12,962 | | | | 226,187 | |
Xencor, Inc. (a) | | | 12,231 | | | | 258,196 | |
ZIOPHARM Oncology, Inc. (a) | | | 41,956 | | | | 260,966 | |
| | | | | | | | |
| | | | | | | 20,319,771 | |
| | | | | | | | |
Building Products 0.2% | |
Armstrong Flooring, Inc. (a) | | | 15,900 | | | | 285,723 | |
Builders FirstSource, Inc. (a) | | | 32,600 | | | | 499,432 | |
| | | | | | | | |
| | | | | | | 785,155 | |
| | | | | | | | |
Capital Markets 0.4% | |
Evercore Partners, Inc. Class A | | | 17,500 | | | | 1,233,750 | |
GAIN Capital Holdings, Inc. | | | 35,400 | | | | 220,542 | |
Investment Technology Group, Inc. | | | 700 | | | | 14,868 | |
| | | | | | | | |
| | | | | | | 1,469,160 | |
| | | | | | | | |
Chemicals 3.7% | |
AdvanSix, Inc. (a) | | | 8,400 | | | | 262,416 | |
Chemours Co. | | | 54,925 | | | | 2,082,756 | |
Core Molding Technologies, Inc. (a) | | | 2,700 | | | | 58,347 | |
Innophos Holdings, Inc. | | | 7,000 | | | | 306,880 | |
KMG Chemicals, Inc. | | | 30,000 | | | | 1,460,100 | |
Koppers Holdings, Inc. (a) | | | 41,000 | | | | 1,482,150 | |
Rayonier Advanced Materials, Inc. | | | 138,200 | | | | 2,172,504 | |
| | | | | | | | |
| | |
Shares | | | Value | |
Chemicals (continued) | |
Stepan Co. | | | 26,600 | | | $ | 2,317,924 | |
Trinseo S.A. | | | 35,200 | | | | 2,418,240 | |
| | | | | | | | |
| | | | | | | 12,561,317 | |
| | | | | | | | |
Commercial Services & Supplies 3.0% | |
ARC Document Solutions, Inc. (a) | | | 5,100 | | | | 21,216 | |
¨Brink’s Co. | | | 38,336 | | | | 2,568,512 | |
Casella Waste Systems, Inc. Class A (a) | | | 32,200 | | | | 528,402 | |
CECO Environmental Corp. | | | 89,200 | | | | 818,856 | |
Ennis, Inc. | | | 26,300 | | | | 502,330 | |
Essendant, Inc. | | | 39,500 | | | | 585,785 | |
Heritage-Crystal Clean, Inc. (a) | | | 20,400 | | | | 324,360 | |
Herman Miller, Inc. | | | 900 | | | | 27,360 | |
Quad/Graphics, Inc. | | | 95,300 | | | | 2,184,276 | |
SP Plus Corp. (a) | | | 15,100 | | | | 461,305 | |
Steelcase, Inc. Class A | | | 51,500 | | | | 721,000 | |
Viad Corp. | | | 33,292 | | | | 1,573,047 | |
| | | | | | | | |
| | | | | | | 10,316,449 | |
| | | | | | | | |
Communications Equipment 0.9% | |
Ciena Corp. (a) | | | 10,800 | | | | 270,216 | |
Comtech Telecommunications Corp. | | | 14,700 | | | | 278,859 | |
Extreme Networks, Inc. (a) | | | 219,800 | | | | 2,026,556 | |
InterDigital, Inc. | | | 5,900 | | | | 456,070 | |
KVH Industries, Inc. (a) | | | 8,800 | | | | 83,600 | |
| | | | | | | | |
| | | | | | | 3,115,301 | |
| | | | | | | | |
Construction & Engineering 0.2% | |
Argan, Inc. | | | 7,800 | | | | 468,000 | |
HC2 Holdings, Inc. (a) | | | 13,500 | | | | 79,380 | |
Orion Group Holdings, Inc. (a) | | | 13,600 | | | | 101,592 | |
Sterling Construction Co., Inc. (a) | | | 11,300 | | | | 147,691 | |
| | | | | | | | |
| | | | | | | 796,663 | |
| | | | | | | | |
Consumer Finance 2.0% | |
Elevate Credit, Inc. (a) | | | 6,400 | | | | 50,688 | |
Enova International, Inc. (a) | | | 141,700 | | | | 2,104,245 | |
EZCORP, Inc. Class A (a) | | | 28,200 | | | | 217,140 | |
Green Dot Corp. Class A (a) | | | 59,500 | | | | 2,292,535 | |
World Acceptance Corp. (a) | | | 26,900 | | | | 2,015,079 | |
| | | | | | | | |
| | | | | | | 6,679,687 | |
| | | | | | | | |
Diversified Consumer Services 1.7% | |
Adtalem Global Education, Inc. | | | 25,500 | | | | 967,725 | |
American Public Education, Inc. (a) | | | 43,500 | | | | 1,028,775 | |
Bridgepoint Education, Inc. (a) | | | 17,200 | | | | 253,872 | |
Cambium Learning Group, Inc. (a) | | | 10,900 | | | | 55,263 | |
K12, Inc. (a) | | | 118,900 | | | | 2,130,688 | |
Liberty Tax, Inc. | | | 7,000 | | | | 90,650 | |
Regis Corp. (a) | | | 135,500 | | | | 1,391,585 | |
| | | | | | | | |
| | | | 5,918,558 | |
| | | | | | | | |
| | | | | | |
The notes to the financial statements are an integral part of,
and should be read in conjunction with, the financial statements. | | | | | 11 | |
Portfolio of Investments June 30, 2017 (Unaudited) (continued)
| | | | | | | | |
| | |
Shares | | | Value | |
| Common Stocks (continued) | |
Diversified Financial Services 0.1% | |
Cherry Hill Mortgage Investment Corp. | | | 6,600 | | | $ | 121,902 | |
FNFV Group (a) | | | 6,000 | | | | 94,800 | |
Marlin Business Services Corp. | | | 3,269 | | | | 82,215 | |
| | | | | | | | |
| | | | 298,917 | |
| | | | | | | | |
Diversified Telecommunication Services 1.1% | |
General Communication, Inc. Class A (a) | | | 39,700 | | | | 1,454,608 | |
Hawaiian Telcom Holdco, Inc. (a) | | | 9,300 | | | | 232,407 | |
Vonage Holdings Corp. (a) | | | 287,600 | | | | 1,880,904 | |
| | | | | | | | |
| | | | 3,567,919 | |
| | | | | | | | |
Electric Utilities 0.3% | |
Genie Energy, Ltd. Class B | | | 12,244 | | | | 93,299 | |
Portland General Electric Co. | | | 1,600 | | | | 73,104 | |
Spark Energy, Inc. Class A | | | 39,000 | | | | 733,200 | |
| | | | | | | | |
| | | | 899,603 | |
| | | | | | | | |
Electrical Equipment 1.7% | |
Allied Motion Technologies, Inc. | | | 32,400 | | | | 881,928 | |
Atkore International Group, Inc. (a) | | | 41,800 | | | | 942,590 | |
General Cable Corp. | | | 136,400 | | | | 2,230,140 | |
LSI Industries, Inc. | | | 34,100 | | | | 308,605 | |
Powell Industries, Inc. | | | 28,900 | | | | 924,511 | |
Preformed Line Products Co. | | | 700 | | | | 32,494 | |
TPI Composites, Inc. (a) | | | 18,000 | | | | 332,640 | |
| | | | | | | | |
| | | | 5,652,908 | |
| | | | | | | | |
Electronic Equipment, Instruments & Components 4.0% | |
Bel Fuse, Inc. Class B | | | 27,900 | | | | 689,130 | |
Benchmark Electronics, Inc. (a) | | | 8,500 | | | | 274,550 | |
Daktronics, Inc. | | | 4,900 | | | | 47,187 | |
ePlus, Inc. (a) | | | 7,000 | | | | 518,700 | |
Insight Enterprises, Inc. (a) | | | 48,500 | | | | 1,939,515 | |
Kemet Corp. (a) | | | 60,900 | | | | 779,520 | |
Kimball Electronics, Inc. (a) | | | 16,300 | | | | 294,215 | |
PCM, Inc. (a) | | | 3,800 | | | | 71,250 | |
Sanmina Corp. (a) | | | 64,074 | | | | 2,441,219 | |
ScanSource, Inc. (a) | | | 43,200 | | | | 1,740,960 | |
¨Tech Data Corp. (a) | | | 26,300 | | | | 2,656,300 | |
TTM Technologies, Inc. (a) | | | 127,100 | | | | 2,206,456 | |
| | | | | | | | |
| | | | 13,659,002 | |
| | | | | | | | |
Energy Equipment & Services 1.4% | |
Era Group, Inc. (a) | | | 4,500 | | | | 42,570 | |
Exterran Corp. (a) | | | 73,500 | | | | 1,962,450 | |
¨McDermott International, Inc. (a) | | | 353,765 | | | | 2,536,495 | |
PHI, Inc. (a) | | | 6,600 | | | | 64,416 | |
RigNet, Inc. (a) | | | 15,200 | | | | 243,960 | |
| | | | | | | | |
| | | | 4,849,891 | |
| | | | | | | | |
Equity Real Estate Investment Trusts (REITs) 6.0% | |
Apollo Commercial Real Estate Finance, Inc. | | | 85,600 | | | | 1,587,880 | |
Ashford Hospitality Prime, Inc. | | | 25,800 | | | | 265,482 | |
| | | | | | | | |
| | |
Shares | | | Value | |
Equity Real Estate Investment Trusts (REITs) (continued) | |
Ashford Hospitality Trust, Inc. | | | 206,600 | | | $ | 1,256,128 | |
Chesapeake Lodging Trust | | | 11,800 | | | | 288,746 | |
Cousins Properties, Inc. | | | 72,900 | | | | 640,791 | |
DiamondRock Hospitality Co. | | | 22,900 | | | | 250,755 | |
GEO Group, Inc. | | | 24,050 | | | | 711,158 | |
Hersha Hospitality Trust | | | 29,000 | | | | 536,790 | |
iStar, Inc. (a) | | | 2,700 | | | | 32,508 | |
LaSalle Hotel Properties | | | 64,656 | | | | 1,926,749 | |
Owens Realty Mortgage, Inc. | | | 6,400 | | | | 108,544 | |
Potlatch Corp. | | | 49,478 | | | | 2,261,145 | |
¨PS Business Parks, Inc. | | | 18,759 | | | | 2,483,504 | |
QTS Realty Trust, Inc. Class A | | | 5,500 | | | | 287,815 | |
Quality Care Properties, Inc. (a) | | | 27,900 | | | | 510,849 | |
RLJ Lodging Trust | | | 5,500 | | | | 109,285 | |
Ryman Hospitality Properties, Inc. | | | 38,364 | | | | 2,455,680 | |
Summit Hotel Properties, Inc. | | | 92,000 | | | | 1,715,800 | |
¨Sunstone Hotel Investors, Inc. | | | 161,600 | | | | 2,604,992 | |
Xenia Hotels & Resorts, Inc. | | | 28,700 | | | | 555,919 | |
| | | | | | | | |
| | | | 20,590,520 | |
| | | | | | | | |
Food Products 2.2% | |
Dean Foods Co. | | | 73,100 | | | | 1,242,700 | |
Fresh Del Monte Produce, Inc. | | | 34,061 | | | | 1,734,046 | |
John B. Sanfilippo & Son, Inc. | | | 18,800 | | | | 1,186,468 | |
Omega Protein Corp. | | | 95,600 | | | | 1,711,240 | |
Sanderson Farms, Inc. | | | 14,700 | | | | 1,700,055 | |
| | | | | | | | |
| | | | 7,574,509 | |
| | | | | | | | |
Health Care Equipment & Supplies 3.7% | |
AngioDynamics, Inc. (a) | | | 42,600 | | | | 690,546 | |
Cutera, Inc. (a) | | | 20,000 | | | | 518,000 | |
Exactech, Inc. (a) | | | 21,700 | | | | 646,660 | |
Fonar Corp. (a) | | | 2,200 | | | | 61,050 | |
Halyard Health, Inc. (a) | | | 38,953 | | | | 1,530,074 | |
Integer Holdings Corp. (a) | | | 5,700 | | | | 246,525 | |
Lantheus Holdings, Inc. (a) | | | 21,200 | | | | 374,180 | |
LeMaitre Vascular, Inc. | | | 40,600 | | | | 1,267,532 | |
¨Masimo Corp. (a) | | | 28,463 | | | | 2,595,256 | |
OraSure Technologies, Inc. (a) | | | 130,500 | | | | 2,252,430 | |
Orthofix International N.V. (a) | | | 45,300 | | | | 2,105,544 | |
Surmodics, Inc. (a) | | | 14,800 | | | | 416,620 | |
| | | | | | | | |
| | | | 12,704,417 | |
| | | | | | | | |
Health Care Providers & Services 1.9% | |
Cross Country Healthcare, Inc. (a) | | | 24,100 | | | | 311,131 | |
Diplomat Pharmacy, Inc. (a) | | | 81,400 | | | | 1,204,720 | |
LHC Group, Inc. (a) | | | 12,200 | | | | 828,258 | |
Molina Healthcare, Inc. (a) | | | 35,800 | | | | 2,476,644 | |
Providence Service Corp. (a) | | | 11,500 | | | | 582,015 | |
RadNet, Inc. (a) | | | 34,300 | | | | 265,825 | |
Triple-S Management Corp. Class B (a) | | | 7,838 | | | | 132,541 | |
WellCare Health Plans, Inc. (a) | | | 3,700 | | | | 664,372 | |
| | | | | | | | |
| | | | 6,465,506 | |
| | | | | | | | |
| | | | |
| 12 | | MainStay VP Small Cap Core Portfolio | | The notes to the financial statements are an integral part of,
and should be read in conjunction with, the financial statements. |
| | | | | | | | |
| | |
Shares | | | Value | |
| Common Stocks (continued) | |
Health Care Technology 1.1% | |
HMS Holdings Corp. (a) | | | 84,547 | | | $ | 1,564,120 | |
Quality Systems, Inc. (a) | | | 127,200 | | | | 2,189,112 | |
| | | | | | | | |
| | | | 3,753,232 | |
| | | | | | | | |
Hotels, Restaurants & Leisure 4.0% | |
BJ’s Restaurants, Inc. (a) | | | 47,200 | | | | 1,758,200 | |
Bloomin’ Brands, Inc. | | | 112,377 | | | | 2,385,764 | |
Caesars Entertainment Corp. (a) | | | 172,700 | | | | 2,072,400 | |
Carrols Restaurant Group, Inc. (a) | | | 145,500 | | | | 1,782,375 | |
Century Casinos, Inc. (a) | | | 25,237 | | | | 185,996 | |
ClubCorp Holdings, Inc. | | | 149,800 | | | | 1,962,380 | |
Del Frisco’s Restaurant Group, Inc. (a) | | | 33,300 | | | | 536,130 | |
Golden Entertainment, Inc. (a) | | | 11,600 | | | | 240,236 | |
J. Alexander’s Holdings, Inc. (a) | | | 4,600 | | | | 56,350 | |
Monarch Casino & Resort, Inc. (a) | | | 2,700 | | | | 81,675 | |
Pinnacle Entertainment, Inc. (a) | | | 30,200 | | | | 596,752 | |
Potbelly Corp. (a) | | | 67,500 | | | | 776,250 | |
Red Robin Gourmet Burgers, Inc. (a) | | | 2,300 | | | | 150,075 | |
Ruth’s Hospitality Group, Inc. | | | 52,300 | | | | 1,137,525 | |
| | | | | | | | |
| | | | 13,722,108 | |
| | | | | | | | |
Household Durables 3.1% | |
AV Homes, Inc. (a) | | | 30,300 | | | | 607,515 | |
Bassett Furniture Industries, Inc. | | | 24,800 | | | | 941,160 | |
Beazer Homes USA, Inc. (a) | | | 69,500 | | | | 953,540 | |
Flexsteel Industries, Inc. | | | 14,000 | | | | 757,540 | |
Hooker Furniture Corp. | | | 36,100 | | | | 1,485,515 | |
Hovnanian Enterprises, Inc. Class A (a) | | | 397,300 | | | | 1,112,440 | |
KB Home | | | 19,500 | | | | 467,415 | |
La-Z-Boy, Inc. | | | 1,500 | | | | 48,750 | |
Lifetime Brands, Inc. | | | 8,300 | | | | 150,645 | |
NACCO Industries, Inc. Class A | | | 12,300 | | | | 871,455 | |
New Home Co., Inc. (a) | | | 9,800 | | | | 112,406 | |
Taylor Morrison Home Corp. Class A (a) | | | 95,600 | | | | 2,295,356 | |
ZAGG, Inc. (a) | | | 71,200 | | | | 615,880 | |
| | | | | | | | |
| | | | 10,419,617 | |
| | | | | | | | |
Household Products 0.8% | |
Central Garden & Pet Co. Class A (a) | | | 31,300 | | | | 939,626 | |
HRG Group, Inc. (a) | | | 103,000 | | | | 1,824,130 | |
Oil-Dri Corp. of America | | | 774 | | | | 32,516 | |
| | | | | | | | |
| | | | 2,796,272 | |
| | | | | | | | |
Independent Power & Renewable Electricity Producers 0.7% | |
Ormat Technologies, Inc. | | | 40,255 | | | | 2,362,163 | |
| | | | | | | | |
|
Insurance 0.8% | |
American Equity Investment Life Holding Co. | | | 4,200 | | | | 110,376 | |
AmTrust Financial Services, Inc. | | | 75,700 | | | | 1,146,098 | |
Argo Group International Holdings, Ltd. | | | 1,500 | | | | 90,900 | |
Crawford & Co. Class B | | | 2,300 | | | | 21,390 | |
| | | | | | | | |
| | |
Shares | | | Value | |
Insurance (continued) | |
Donegal Group, Inc. Class A | | | 500 | | | $ | 7,950 | |
Hallmark Financial Services, Inc. (a) | | | 4,500 | | | | 50,715 | |
Independence Holding Co. | | | 3,100 | | | | 63,395 | |
Infinity Property & Casualty Corp. | | | 5,800 | | | | 545,200 | |
Stewart Information Services Corp. | | | 11,400 | | | | 517,332 | |
Universal Insurance Holdings, Inc. | | | 2,500 | | | | 63,000 | |
| | | | | | | | |
| | | | 2,616,356 | |
| | | | | | | | |
Internet & Direct Marketing Retail 1.5% | |
1-800-Flowers.com, Inc. Class A (a) | | | 85,900 | | | | 837,525 | |
FTD Cos., Inc. (a) | | | 19,800 | | | | 396,000 | |
HSN, Inc. | | | 69,500 | | | | 2,217,050 | |
Overstock.com, Inc. (a) | | | 44,300 | | | | 722,090 | |
Shutterfly, Inc. (a) | | | 21,100 | | | | 1,002,250 | |
| | | | | | | | |
| | | | 5,174,915 | |
| | | | | | | | |
Internet Software & Services 2.9% | |
Bankrate, Inc. (a) | | | 94,900 | | | | 1,219,465 | |
Blucora, Inc. (a) | | | 54,000 | | | | 1,144,800 | |
Carbonite, Inc. (a) | | | 46,800 | | | | 1,020,240 | |
Care.com, Inc. (a) | | | 27,200 | | | | 410,720 | |
DHI Group, Inc. (a) | | | 132,200 | | | | 376,770 | |
Endurance International Group Holdings, Inc. (a) | | | 118,900 | | | | 992,815 | |
Gogo, Inc. (a) | | | 40,300 | | | | 464,659 | |
Internap Corp. (a) | | | 19,100 | | | | 70,097 | |
j2 Global, Inc. | | | 8,400 | | | | 714,756 | |
Limelight Networks, Inc. (a) | | | 57,200 | | | | 165,308 | |
Liquidity Services, Inc. (a) | | | 48,400 | | | | 307,340 | |
LivePerson, Inc. (a) | | | 8,700 | | | | 95,700 | |
Meet Group, Inc. (a) | | | 95,200 | | | | 480,760 | |
QuinStreet, Inc. (a) | | | 13,400 | | | | 55,878 | |
Rocket Fuel, Inc. (a) | | | 19,700 | | | | 54,175 | |
TechTarget, Inc. (a) | | | 1,400 | | | | 14,518 | |
Web.com Group, Inc. (a) | | | 25,300 | | | | 640,090 | |
WebMD Health Corp. (a) | | | 23,983 | | | | 1,406,603 | |
XO Group, Inc. (a) | | | 9,100 | | | | 160,342 | |
| | | | | | | | |
| | | | 9,795,036 | |
| | | | | | | | |
IT Services 0.9% | |
Convergys Corp. | | | 22,700 | | | | 539,806 | |
Everi Holdings, Inc. (a) | | | 27,500 | | | | 200,200 | |
Hackett Group, Inc. | | | 1,700 | | | | 26,350 | |
NCI, Inc. Class A (a) | | | 7,400 | | | | 156,140 | |
Science Applications International Corp. | | | 22,800 | | | | 1,582,776 | |
StarTek, Inc. (a) | | | 3,400 | | | | 41,616 | |
TeleTech Holdings, Inc. | | | 13,600 | | | | 554,880 | |
| | | | | | | | |
| | | | 3,101,768 | |
| | | | | | | | |
Leisure Products 0.5% | |
Callaway Golf Co. | | | 7,800 | | | | 99,684 | |
Johnson Outdoors, Inc. Class A | | | 21,600 | | | | 1,041,336 | |
Malibu Boats, Inc. (a) | | | 18,300 | | | | 473,421 | |
| | | | | | | | |
| | | | 1,614,441 | |
| | | | | | | | |
| | | | | | |
The notes to the financial statements are an integral part of,
and should be read in conjunction with, the financial statements. | | | | | 13 | |
Portfolio of Investments June 30, 2017 (Unaudited) (continued)
| | | | | | | | |
| | |
Shares | | | Value | |
| Common Stocks (continued) | |
Life Sciences Tools & Services 0.8% | |
INC Research Holdings, Inc. Class A (a) | | | 36,700 | | | $ | 2,146,950 | |
PAREXEL International Corp. (a) | | | 5,900 | | | | 512,769 | |
| | | | | | | | |
| | | | 2,659,719 | |
| | | | | | | | |
Machinery 4.2% | |
Astec Industries, Inc. | | | 11,300 | | | | 627,263 | |
Chart Industries, Inc. (a) | | | 41,400 | | | | 1,437,822 | |
Commercial Vehicle Group, Inc. (a) | | | 66,800 | | | | 564,460 | |
DMC Global, Inc. | | | 2,900 | | | | 37,990 | |
FreightCar America, Inc. | | | 32,400 | | | | 563,436 | |
Global Brass & Copper Holdings, Inc. | | | 68,400 | | | | 2,089,620 | |
Greenbrier Cos., Inc. | | | 47,300 | | | | 2,187,625 | |
Hurco Cos., Inc. | | | 700 | | | | 24,325 | |
Hyster-Yale Materials Handling, Inc. | | | 900 | | | | 63,225 | |
L.B. Foster Co. Class A | | | 2,900 | | | | 62,205 | |
Lydall, Inc. (a) | | | 3,100 | | | | 160,270 | |
Meritor, Inc. (a) | | | 108,100 | | | | 1,795,541 | |
Miller Industries, Inc. | | | 5,600 | | | | 139,160 | |
NN, Inc. | | | 14,600 | | | | 400,770 | |
Park-Ohio Holdings Corp. | | | 2,700 | | | | 102,870 | |
Spartan Motors, Inc. | | | 118,100 | | | | 1,045,185 | |
Supreme Industries, Inc. | | | 29,900 | | | | 491,855 | |
Titan International, Inc. | | | 5,700 | | | | 68,457 | |
Wabash National Corp. | | | 105,100 | | | | 2,310,098 | |
| | | | | | | | |
| | | | 14,172,177 | |
| | | | | | | | |
Marine 0.1% | |
Matson, Inc. | | | 6,600 | | | | 198,264 | |
| | | | | | | | |
|
Media 1.5% | |
New Media Investment Group, Inc. | | | 120,300 | | | | 1,621,644 | |
Reading International, Inc. Class A (a) | | | 200 | | | | 3,226 | |
Salem Media Group, Inc. | | | 3,900 | | | | 27,690 | |
Scholastic Corp. | | | 3,700 | | | | 161,283 | |
Time, Inc. | | | 151,300 | | | | 2,171,155 | |
Townsquare Media, Inc. Class A (a) | | | 17,400 | | | | 178,176 | |
tronc, Inc. (a) | | | 70,100 | | | | 903,589 | |
| | | | | | | | |
| | | | 5,066,763 | |
| | | | | | | | |
Multiline Retail 0.0%‡ | |
Big Lots, Inc. | | | 1,000 | | | | 48,300 | |
| | | | | | | | |
|
Oil, Gas & Consumable Fuels 2.7% | |
Contango Oil & Gas Co. (a) | | | 45,600 | | | | 302,784 | |
CVR Energy, Inc. | | | 90,600 | | | | 1,971,456 | |
Delek U.S. Holdings, Inc. | | | 82,300 | | | | 2,176,012 | |
Evolution Petroleum Corp. | | | 55,600 | | | | 450,360 | |
Green Plains, Inc. | | | 82,200 | | | | 1,689,210 | |
Pacific Ethanol, Inc. (a) | | | 65,900 | | | | 411,875 | |
Renewable Energy Group, Inc. (a) | | | 64,000 | | | | 828,800 | |
REX American Resources Corp. (a) | | | 9,600 | | | | 926,976 | |
| | | | | | | | |
| | |
Shares | | | Value | |
Oil, Gas & Consumable Fuels (continued) | |
Stone Energy Corp. (a) | | | 9,500 | | | $ | 174,610 | |
Westmoreland Coal Co. (a) | | | 65,900 | | | | 320,933 | |
| | | | | | | | |
| | | | 9,253,016 | |
| | | | | | | | |
Paper & Forest Products 0.1% | |
Boise Cascade Co. (a) | | | 5,600 | | | | 170,240 | |
| | | | | | | | |
|
Personal Products 0.0%‡ | |
Natural Health Trends Corp. | | | 1,400 | | | | 38,990 | |
| | | | | | | | |
|
Pharmaceuticals 3.3% | |
Amphastar Pharmaceuticals, Inc. (a) | | | 122,700 | | | | 2,191,422 | |
¨Catalent, Inc. (a) | | | 74,725 | | | | 2,622,848 | |
Corcept Therapeutics, Inc. (a) | | | 14,500 | | | | 171,100 | |
Heska Corp. (a) | | | 20,900 | | | | 2,133,263 | |
Intersect ENT, Inc. (a) | | | 21,100 | | | | 589,745 | |
Phibro Animal Health Corp. Class A | | | 52,200 | | | | 1,934,010 | |
SciClone Pharmaceuticals, Inc. (a) | | | 37,276 | | | | 410,036 | |
Sucampo Pharmaceuticals, Inc. Class A (a) | | | 45,000 | | | | 472,500 | |
Supernus Pharmaceuticals, Inc. (a) | | | 18,100 | | | | 780,110 | |
| | | | | | | | |
| | | | 11,305,034 | |
| | | | | | | | |
Professional Services 2.1% | |
Barrett Business Services, Inc. | | | 19,500 | | | | 1,117,155 | |
CRA International, Inc. | | | 17,000 | | | | 617,440 | |
Insperity, Inc. | | | 25,600 | | | | 1,817,600 | |
TriNet Group, Inc. (a) | | | 39,400 | | | | 1,289,956 | |
TrueBlue, Inc. (a) | | | 81,508 | | | | 2,159,962 | |
Willdan Group, Inc. (a) | | | 3,600 | | | | 109,980 | |
| | | | | | | | |
| | | | | | | 7,112,093 | |
| | | | | | | | |
Real Estate Management & Development 1.0% | |
Altisource Portfolio Solutions S.A. (a) | | | 47,800 | | | | 1,042,996 | |
Forestar Group, Inc. (a) | | | 60,300 | | | | 1,034,145 | |
Maui Land & Pineapple Co., Inc. (a) | | | 2,600 | | | | 52,780 | |
RMR Group, Inc. Class A | | | 27,500 | | | | 1,337,875 | |
| | | | | | | | |
| | | | | | | 3,467,796 | |
| | | | | | | | |
Semiconductors & Semiconductor Equipment 3.2% | |
Advanced Energy Industries, Inc. (a) | | | 7,022 | | | | 454,253 | |
Alpha & Omega Semiconductor, Ltd. (a) | | | 63,900 | | | | 1,065,213 | |
Amkor Technology, Inc. (a) | | | 16,200 | | | | 158,274 | |
Cabot Microelectronics Corp. | | | 4,100 | | | | 302,703 | |
CEVA, Inc. (a) | | | 3,400 | | | | 154,530 | |
Cirrus Logic, Inc. (a) | | | 10,943 | | | | 686,345 | |
Entegris, Inc. (a) | | | 24,978 | | | | 548,267 | |
FormFactor, Inc. (a) | | | 11,100 | | | | 137,640 | |
Inphi Corp. (a) | | | 7,237 | | | | 248,229 | |
Integrated Device Technology, Inc. (a) | | | 23,849 | | | | 615,066 | |
Lattice Semiconductor Corp. (a) | | | 21,000 | | | | 139,860 | |
MACOM Technology Solutions Holdings, Inc. (a) | | | 7,100 | | | | 395,967 | |
MaxLinear, Inc. Class A (a) | | | 9,600 | | | | 267,744 | |
| | | | |
| 14 | | MainStay VP Small Cap Core Portfolio | | The notes to the financial statements are an integral part of,
and should be read in conjunction with, the financial statements. |
| | | | | | | | |
| | |
Shares | | | Value | |
| Common Stocks (continued) | |
Semiconductors & Semiconductor Equipment (continued) | |
MKS Instruments, Inc. | | | 9,393 | | | $ | 632,149 | |
Monolithic Power Systems, Inc. | | | 6,788 | | | | 654,363 | |
Nanometrics, Inc. (a) | | | 3,800 | | | | 96,102 | |
NeoPhotonics Corp. (a) | | | 22,100 | | | | 170,612 | |
PDF Solutions, Inc. (a) | | | 4,100 | | | | 67,445 | |
Photronics, Inc. (a) | | | 50,500 | | | | 474,700 | |
Power Integrations, Inc. | | | 4,815 | | | | 351,013 | |
Semtech Corp. (a) | | | 11,259 | | | | 402,509 | |
Silicon Laboratories, Inc. (a) | | | 7,320 | | | | 500,322 | |
Synaptics, Inc. (a) | | | 6,460 | | | | 334,047 | |
Ultra Clean Holdings, Inc. (a) | | | 103,400 | | | | 1,938,750 | |
Xperi Corp. | | | 8,636 | | | | 257,353 | |
| | | | | | | | |
| | | | | | | 11,053,456 | |
| | | | | | | | |
Software 2.9% | |
ACI Worldwide, Inc. (a) | | | 31,600 | | | | 706,892 | |
American Software, Inc. Class A | | | 23,500 | | | | 241,815 | |
Barracuda Networks, Inc. (a) | | | 53,400 | | | | 1,231,404 | |
CommVault Systems, Inc. (a) | | | 22,700 | | | | 1,281,415 | |
Ellie Mae, Inc. (a) | | | 5,700 | | | | 626,487 | |
Fair Isaac Corp. | | | 3,023 | | | | 421,436 | |
Progress Software Corp. | | | 13,600 | | | | 420,104 | |
QAD, Inc. Class A | | | 6,700 | | | | 214,735 | |
RealPage, Inc. (a) | | | 55,387 | | | | 1,991,163 | |
Rosetta Stone, Inc. (a) | | | 31,100 | | | | 335,258 | |
Rubicon Project, Inc. (a) | | | 133,500 | | | | 686,190 | |
Take-Two Interactive Software, Inc. (a) | | | 17,200 | | | | 1,262,136 | |
Verint Systems, Inc. (a) | | | 4,600 | | | | 187,220 | |
Zix Corp. (a) | | | 76,000 | | | | 432,440 | |
| | | | | | | | |
| | | | 10,038,695 | |
| | | | | | | | |
Specialty Retail 1.8% | |
Big 5 Sporting Goods Corp. | | | 36,600 | | | | 477,630 | |
Haverty Furniture Cos., Inc. | | | 8,200 | | | | 205,820 | |
Kirkland’s, Inc. (a) | | | 45,700 | | | | 469,796 | |
¨Office Depot, Inc. | | | 458,000 | | | | 2,583,120 | |
Pier 1 Imports, Inc. | | | 392,100 | | | | 2,034,999 | |
Tilly’s, Inc. Class A | | | 5,200 | | | | 52,780 | |
West Marine, Inc. | | | 17,800 | | | | 228,730 | |
| | | | | | | | |
| | | | 6,052,875 | |
| | | | | | | | |
Technology Hardware, Storage & Peripherals 0.0%‡ | |
Quantum Corp. (a) | | | 9,500 | | | | 74,195 | |
| | | | | | | | |
|
Thrifts & Mortgage Finance 3.7% | |
BofI Holding, Inc. (a) | | | 35,100 | | | | 832,572 | |
BSB Bancorp, Inc. (a) | | | 200 | | | | 5,850 | |
Charter Financial Corp. | | | 19,300 | | | | 347,400 | |
Dime Community Bancshares, Inc. | | | 104,300 | | | | 2,044,280 | |
¨Essent Group, Ltd. (a) | | | 67,000 | | | | 2,488,380 | |
Flagstar Bancorp, Inc. (a) | | | 69,700 | | | | 2,148,154 | |
| | | | | | | | |
| | |
Shares | | | Value | |
Thrifts & Mortgage Finance (continued) | |
HFF, Inc. Class A | | | 9,900 | | | $ | 344,223 | |
HomeStreet, Inc. (a) | | | 51,100 | | | | 1,414,192 | |
Meta Financial Group, Inc. | | | 21,800 | | | | 1,940,200 | |
Riverview Bancorp, Inc. | | | 2,700 | | | | 17,928 | |
SI Financial Group, Inc. | | | 5,300 | | | | 85,330 | |
Territorial Bancorp, Inc. | | | 6,600 | | | | 205,854 | |
United Community Financial Corp. | | | 4,900 | | | | 40,719 | |
United Financial Bancorp, Inc. | | �� | 5,200 | | | | 86,788 | |
Walker & Dunlop, Inc. (a) | | | 13,500 | | | | 659,205 | |
| | | | | | | | |
| | | | 12,661,075 | |
| | | | | | | | |
Tobacco 0.7% | |
Universal Corp. | | | 34,400 | | | | 2,225,680 | |
| | | | | | | | |
|
Trading Companies & Distributors 2.0% | |
DXP Enterprises, Inc. (a) | | | 23,300 | | | | 803,850 | |
MRC Global, Inc. (a) | | | 27,516 | | | | 454,564 | |
Neff Corp. (a) | | | 8,700 | | | | 165,300 | |
¨Rush Enterprises, Inc. (a) | | | | | | | | |
Class A | | | 61,900 | | | | 2,301,442 | |
Class B | | | 9,100 | | | | 331,331 | |
Titan Machinery, Inc. (a) | | | 27,700 | | | | 498,046 | |
Univar, Inc. (a) | | | 67,900 | | | | 1,982,680 | |
Veritiv Corp. (a) | | | 2,400 | | | | 108,000 | |
| | | | | | | | |
| | | | 6,645,213 | |
| | | | | | | | |
Water Utilities 0.7% | |
Artesian Resources Corp. Class A | | | 643 | | | | 24,203 | |
California Water Service Group | | | 10,700 | | | | 393,760 | |
SJW Corp. | | | 39,800 | | | | 1,957,364 | |
| | | | | | | | |
| | | | 2,375,327 | |
| | | | | | | | |
Total Common Stocks
(Cost $311,526,119) | | | | | | | 338,240,211 | |
| | | | | | | | |
|
| Exchange-Traded Funds 0.7% (b) | |
iShares Russell 2000 ETF | | | 17,002 | | | | 2,395,922 | |
| | | | | | | | |
Total Exchange-Traded Funds
(Cost $2,348,285) | | | | | | | 2,395,922 | |
| | | | | | | | |
Total Investments
(Cost $313,874,404) (c) | | | 100.0 | % | | | 340,636,133 | |
Other Assets, Less Liabilities | | | (0.0 | )‡ | | | (13,993 | ) |
Net Assets | | | 100.0 | % | | $ | 340,622,140 | |
| ‡ | Less than one-tenth of a percent. |
| (a) | Non-income producing security. |
| (b) | Exchange-Traded Fund—An investment vehicle that represents a basket of securities that is traded on an exchange. |
| | | | | | |
The notes to the financial statements are an integral part of,
and should be read in conjunction with, the financial statements. | | | | | 15 | |
Portfolio of Investments June 30, 2017 (Unaudited) (continued)
| (c) | As of June 30, 2017, cost is $316,263,598 for federal income tax purposes and net unrealized appreciation is as follows: |
| | | | |
Gross unrealized appreciation | | $ | 37,762,395 | |
Gross unrealized depreciation | | | (13,389,860 | ) |
| | | | |
Net unrealized appreciation | | $ | 24,372,535 | |
| | | | |
The following abbreviation is used in the preceding pages:
ETF—Exchange-Traded Fund
The following is a summary of the fair valuations according to the inputs used as of June 30, 2017, for valuing the Portfolio’s assets.
Asset Valuation Inputs
| | | | | | | | | | | | | | | | |
Description | | Quoted Prices in Active Markets for
Identical Assets (Level 1) | | | Significant
Other
Observable
Inputs (Level 2) | | | Significant
Unobservable
Inputs (Level 3) | | | Total | |
| Investments in Securities (a) | | | | | | | | | | | | | | | | |
| Common Stocks | | $ | 338,240,211 | | | $ | — | | | $ | — | | | $ | 338,240,211 | |
| Exchange-Traded Funds | | | | | | | | | | | | | | | | |
Equity Funds | | | 2,395,922 | | | | — | | | | — | | | | 2,395,922 | |
| | | | | | | | | | | | | | | | |
| Total Investments in Securities | | $ | 340,636,133 | | | $ | — | | | $ | — | | | $ | 340,636,133 | |
| | | | | | | | | | | | | | | | |
| (a) | For a complete listing of investments and their industries, see the Portfolio of Investments. |
The Portfolio recognizes transfers between the levels as of the beginning of the period.
For the period ended June 30, 2017, the Portfolio did not have any transfers among levels. (See Note 2)
As of June 30, 2017, the Portfolio did not hold any investments with significant unobservable inputs (Level 3). (See Note 2)
| | | | |
| 16 | | MainStay VP Small Cap Core Portfolio | | The notes to the financial statements are an integral part of,
and should be read in conjunction with, the financial statements. |
Statement of Assets and Liabilities as of June 30, 2017 (Unaudited)
| | | | |
| Assets | |
Investment in securities, at value
(identified cost $313,874,404) | | $ | 340,636,133 | |
Cash | | | 14,111 | |
Receivables: | |
Dividends and interest | | | 282,680 | |
Fund shares sold | | | 120,782 | |
Other assets | | | 2,438 | |
| | | | |
Total assets | | | 341,056,144 | |
| | | | |
| |
| Liabilities | | | | |
Payables: | |
Manager (See Note 3) | | | 237,955 | |
Fund shares redeemed | | | 83,523 | |
NYLIFE Distributors (See Note 3) | | | 34,906 | |
Shareholder communication | | | 30,391 | |
Professional fees | | | 23,243 | |
Custodian | | | 20,158 | |
Trustees | | | 579 | |
Accrued expenses | | | 3,249 | |
| | | | |
Total liabilities | | | 434,004 | |
| | | | |
Net assets | | $ | 340,622,140 | |
| | | | |
| |
| Composition of Net Assets | | | | |
Shares of beneficial interest outstanding (par value of $.001 per share) unlimited number of shares authorized | | $ | 28,168 | |
Additional paid-in capital | | | 294,581,388 | |
| | | | |
| | | 294,609,556 | |
Undistributed net investment income | | | 783 | |
Accumulated net realized gain (loss) on investments | | | 19,250,072 | |
Net unrealized appreciation (depreciation) on investments | | | 26,761,729 | |
| | | | |
Net assets | | $ | 340,622,140 | |
| | | | |
| | | | |
Initial Class | |
Net assets applicable to outstanding shares | | $ | 170,966,164 | |
| | | | |
Shares of beneficial interest outstanding | | | 14,123,686 | |
| | | | |
Net asset value per share outstanding | | $ | 12.10 | |
| | | | |
Service Class | |
Net assets applicable to outstanding shares | | $ | 169,655,976 | |
| | | | |
Shares of beneficial interest outstanding | | | 14,044,265 | |
| | | | |
Net asset value per share outstanding | | $ | 12.08 | |
| | | | |
| | | | | | |
The notes to the financial statements are an integral part of,
and should be read in conjunction with, the financial statements. | | | | | 17 | |
Statement of Operations for the six months ended June 30, 2017 (Unaudited)
| | | | |
| Investment Income (Loss) | |
Income | |
Dividends (a) | | $ | 1,725,510 | |
Interest | | | 66 | |
| | | | |
Total income | | | 1,725,576 | |
| | | | |
Expenses | |
Manager (See Note 3) | | | 1,413,631 | |
Distribution/Service—Service Class (See Note 3) | | | 210,630 | |
Shareholder communication | | | 33,603 | |
Professional fees | | | 31,425 | |
Custodian | | | 21,486 | |
Trustees | | | 4,158 | |
Miscellaneous | | | 7,147 | |
| | | | |
Total expenses | | | 1,722,080 | |
| | | | |
Net investment income (loss) | | | 3,496 | |
| | | | |
|
| Realized and Unrealized Gain (Loss) on Investments | |
Net realized gain (loss) on investments | | | 15,828,393 | |
Net change in unrealized appreciation (depreciation) on investments | | | (5,399,154 | ) |
| | | | |
Net realized and unrealized gain (loss) on investments | | | 10,429,239 | |
| | | | |
Net increase (decrease) in net assets resulting from operations | | $ | 10,432,735 | |
| | | | |
| (a) | Dividends recorded net of foreign withholding taxes in the amount of $1,903. |
| | | | |
| 18 | | MainStay VP Small Cap Core Portfolio | | The notes to the financial statements are an integral part of,
and should be read in conjunction with, the financial statements. |
Statements of Changes in Net Assets
for the six months ended June 30, 2017 (Unaudited) and the period May 2, 2016 (inception date) through December 31, 2016
| | | | | | | | |
| | | 2017 | | | 2016 | |
| Increase (Decrease) in Net Assets | |
Operations: | | | | | | | | |
Net investment income (loss) | | $ | 3,496 | | | $ | 363,682 | |
Net realized gain (loss) on investments | | | 15,828,393 | | | | 8,155,591 | |
Net change in unrealized appreciation (depreciation) on investments | | | (5,399,154 | ) | | | 32,160,883 | |
| | | | |
Net increase (decrease) in net assets resulting from operations | | | 10,432,735 | | | | 40,680,156 | |
| | | | |
Dividends and distributions to shareholders: | |
From net investment income: | |
Initial Class | | | — | | | | (260,882 | ) |
Service Class | | | — | | | | (139,146 | ) |
| | | | |
| | | — | | | | (400,028 | ) |
| | | | |
From net realized gain on investments: | |
Initial Class | | | — | | | | (2,267,736 | ) |
Service Class | | | — | | | | (2,432,543 | ) |
| | | | |
| | | — | | | | (4,700,279 | ) |
| | | | |
Total dividends and distributions to shareholders | | | — | | | | (5,100,307 | ) |
| | | | |
Capital share transactions: | | | | | | | | |
Net proceeds from sale of shares | | | 16,094,517 | | | | 320,847,155 | |
Net asset value of shares issued to shareholders in reinvestment of dividends and distributions | | | — | | | | 5,100,307 | |
Cost of shares redeemed | | | (25,173,405 | ) | | | (22,259,018 | ) |
| | | | |
Increase (decrease) in net assets derived from capital share transactions | | | (9,078,888 | ) | | | 303,688,444 | |
| | | | |
Net increase (decrease) in net assets | | | 1,353,847 | | | | 339,268,293 | |
|
| Net Assets | |
Beginning of period | | | 339,268,293 | | | | — | |
| | | | |
End of period | | $ | 340,622,140 | | | $ | 339,268,293 | |
| | | | |
Undistributed (distributions in excess of) net investment income at end of period | | $ | 783 | | | $ | (2,713 | ) |
| | | | |
| | | | | | |
The notes to the financial statements are an integral part of,
and should be read in conjunction with, the financial statements. | | | | | 19 | |
Financial Highlights selected per share data and ratios
| | | | | | | | | | | | | | | | | | | | |
| | | Initial Class | | | | | | Service Class | |
| | | Six months
ended June 30, 2017* | | | May 2,
2016**
through
December 31,
2016 | | | | | | Six months
ended June 30, 2017* | | | May 2, 2016**
through December 31,
2016 | |
Net asset value at beginning of period | | $ | 11.73 | | | $ | 10.00 | | | | | | | $ | 11.72 | | | $ | 10.00 | |
| | | | | | | | | | | | | | | | | | | | |
Net investment income (loss) (a) | | | 0.01 | | | | 0.03 | | | | | | | | (0.01 | ) | | | 0.01 | |
Net realized and unrealized gain (loss) on investments | | | 0.36 | | | | 1.88 | | | | | | | | 0.37 | | | | 1.88 | |
| | | | | | | | | | | | | | | | | | | | |
Total from investment operations | | | 0.37 | | | | 1.91 | | | | | | | | 0.36 | | | | 1.89 | |
| | | | | | | | | | | | | | | | | | | | |
| Less dividends and distributions: | | | | | | | | | | | | | | | | | | | | |
From net investment income | | | — | | | | (0.02 | ) | | | | | | | — | | | | (0.01 | ) |
From net realized gain on investments | | | — | | | | (0.16 | ) | | | | | | | — | | | | (0.16 | ) |
| | | | | | | | | | | | | | | | | | | | |
| | | — | | | | (0.18 | ) | | | | | | | — | | | | (0.17 | ) |
| | | | | | | | | | | | | | | | | | | | |
Net asset value at end of period | | $ | 12.10 | | | $ | 11.73 | | | | | | | $ | 12.08 | | | $ | 11.72 | |
| | | | | | | | | | | | | | | | | | | | |
Total investment return (b) | | | 3.15 | %(c) | | | 19.14 | % | | | | | | | 3.07 | % (c) | | | 18.95 | % |
| Ratios (to average net assets)/Supplemental Data: | | | | | | | | | | | | | | | | | | | | |
Net investment income (loss) †† | | | 0.13 | % | | | 0.39 | % | | | | | | | (0.12 | %) | | | 0.16 | % |
Net expenses †† | | | 0.91 | % | | | 1.00 | % | | | | | | | 1.16 | % | | | 1.25 | % |
Portfolio turnover rate | | | 90 | % | | | 180 | % | | | | | | | 90 | % | | | 180 | % |
Net assets at end of period (in 000’s) | | $ | 170,966 | | | $ | 164,253 | | | | | | | $ | 169,656 | | | $ | 175,015 | |
| (a) | Per share data based on average shares outstanding during the period. |
| (b) | Total return does not reflect any deduction of sales charges, mortality and expense charges, contract charges or administrative charges. For periods of less than one year, total return is not annualized. |
| (c) | Total investment return may reflect adjustments to conform to generally accepted accounting principles. |
| | | | |
| 20 | | MainStay VP Small Cap Core Portfolio | | The notes to the financial statements are an integral part of,
and should be read in conjunction with, the financial statements. |
Notes to Financial Statements (Unaudited)
Note 1–Organization and Business
MainStay VP Funds Trust (the “Fund”) was organized as a Delaware statutory trust on February 1, 2011. The Fund is registered under the Investment Company Act of 1940, as amended (the “1940 Act”), as an open-end management investment company. The Fund is comprised of thirty-two separate series (collectively referred to as the “Portfolios”). These financial statements and notes relate to the MainStay VP Small Cap Core Portfolio (the “Portfolio”), a “diversified” portfolio, as that term is defined in the 1940 Act, as interpreted or modified by regulatory authorities having jurisdiction, from time to time.
Shares of the Portfolio are currently offered to certain separate accounts to fund variable annuity policies and variable universal life insurance policies issued by New York Life Insurance and Annuity Corporation (“NYLIAC”), a wholly-owned subsidiary of New York Life Insurance Company (“New York Life”). NYLIAC allocates shares of the Portfolios to, among others, NYLIAC Variable Annuity Separate Accounts-I, II, III and IV, VUL Separate Account-I and CSVUL Separate Account-I (collectively, the “Separate Accounts”). Shares of the Portfolio are also offered to the MainStay VP Conservative Allocation Portfolio, MainStay VP Moderate Allocation Portfolio, MainStay VP Moderate Growth Allocation Portfolio and MainStay VP Growth Allocation Portfolio, which operate as “funds-of-funds.”
The Portfolio currently offers two classes of shares. Initial Class and Service Class shares commenced operations on May 2, 2016. Shares of the Portfolio are sold and are redeemed at a price equal to their respective net asset value (“NAV”) per share. No sales or redemption charge is applicable to the purchase or redemption of the Portfolio’s shares. Under the terms of the Fund’s multiple class plan, adopted pursuant to Rule 18f-3 under the 1940 Act, the classes differ in that, among other things, Service Class shares of the Portfolio pay a combined distribution and service fee of 0.25% of average daily net assets attributable to Service Class shares of the Portfolio to the Distributor (as defined in Note 3(B)) pursuant to a plan adopted in accordance with Rule 12b-1 under the 1940 Act.
The Portfolio’s investment objective is to seek long-term growth of capital.
Note 2–Significant Accounting Policies
The Portfolio is an investment company and accordingly follows the investment company accounting and reporting guidance of the Financial Accounting Standards Board (“FASB”) Accounting Standard Codification Topic 946 Financial Services—Investment Companies. The Portfolio prepares its financial statements in accordance with generally accepted accounting principles (“GAAP”) in the United States of America and follows the significant accounting policies described below.
(A) Securities Valuation. Investments are usually valued as of the close of regular trading on the New York Stock Exchange (the “Exchange”) (usually 4:00 p.m. Eastern time) on each day the Portfolio is open for business (“valuation date”).
The Board of Trustees (the “Board”) of the Fund adopted procedures establishing methodologies for the valuation of the Portfolio’s securities and other assets and delegated the responsibility for valuation determinations under those procedures to the Valuation Committee of the Fund (the “Valuation Committee”). The Board authorized the Valuation
Committee to appoint a Valuation Sub-Committee (the “Sub-Committee”) to deal in the first instance with establishing the prices of securities for which market quotations are not readily available or the prices of which are not otherwise readily determinable under these procedures. The Sub-Committee meets (in person, via electronic mail or via teleconference) on an as-needed basis. Subsequently, the Valuation Committee meets to ensure that actions taken by the Sub-Committee were appropriate. The procedures recognize that, subject to the oversight of the Board and unless otherwise noted, the responsibility for the day-to-day valuation of portfolio assets (including fair value measurements for the Portfolio’s assets and liabilities) rests with New York Life Investment Management LLC (“New York Life Investments” or the “Manager”), aided to whatever extent necessary by the Subadvisor (as defined in Note 3(A)) to the Portfolio.
To assess the appropriateness of security valuations, the Manager, the Subadvisor or the Portfolio’s third party service provider, who is subject to oversight by the Manager, regularly compares prior day prices, prices on comparable securities and the sale prices to the prior and current day prices and challenges prices with changes exceeding certain tolerance levels with third party pricing services or broker sources. For those securities valued through either a standardized fair valuation methodology or a fair valuation measurement, the Sub-Committee deals in the first instance with such valuation and the Valuation Committee reviews and affirms, if appropriate, the reasonableness of the valuation based on such methodologies and measurements on a regular basis after considering all relevant information that is reasonably available. Any action taken by the Sub-Committee with respect to the valuation of a portfolio security or other asset is submitted by the Valuation Committee to the Board for its review and ratification, if appropriate, at its next regularly scheduled meeting.
“Fair value” is defined as the price the Portfolio would reasonably expect to receive upon selling an asset or liability in an orderly transaction to an independent buyer in the principal or most advantageous market for the asset or liability. Fair value measurements are determined within a framework that establishes a three-tier hierarchy which maximizes the use of observable market data and minimizes the use of unobservable inputs to establish a classification of fair value measurements for disclosure purposes. “Inputs” refer broadly to the assumptions that market participants would use in pricing the asset or liability, including assumptions about risk, such as the risk inherent in a particular valuation technique used to measure fair value using a pricing model and/or the risk inherent in the inputs for the valuation technique. Inputs may be observable or unobservable. Observable inputs reflect the assumptions market participants would use in pricing the asset or liability based on market data obtained from sources independent of the Portfolio. Unobservable inputs reflect the Portfolio’s own assumptions about the assumptions market participants would use in pricing the asset or liability based on the information available. The inputs or methodology used for valuing assets or liabilities may not be an indication of the risks associated with investing in those assets or liabilities. The three-tier hierarchy of inputs is summarized below.
| • | | Level 1—quoted prices in active markets for an identical asset or liability |
Notes to Financial Statements (Unaudited) (continued)
| • | | Level 2—other significant observable inputs (including quoted prices for a similar asset or liability in active markets, interest rates and yield curves, prepayment speeds, credit risk, etc.) |
| • | | Level 3—significant unobservable inputs (including the Portfolio’s own assumptions about the assumptions that market participants would use in measuring fair value of an asset or liability) |
The level of an asset or liability within the fair value hierarchy is based on the lowest level of an input, both individually and in the aggregate, that is significant to the fair value measurement. As of June 30, 2017, the aggregate value by input level of the Portfolio’s assets and liabilities is included at the end of the Portfolio’s Portfolio of Investments.
The Portfolio may use third party vendor evaluations, whose prices may be derived from one or more of the following standard inputs, among others:
| | |
• Reported trades | | • Broker/dealer quotes |
• Two-sided markets | | • Benchmark securities |
• Bids/offers | | • Reference data (corporate actions or material event notices) |
• Industry and economic events | | • Monthly payment information |
An asset or liability for which market values cannot be measured using the methodologies described above is valued by methods deemed reasonable in good faith by the Valuation Committee, following the procedures established by the Board, to represent fair value. Under these procedures, the Portfolio generally uses a market-based approach which may use related or comparable assets or liabilities, recent transactions, market multiples, book values, and other relevant information. The Portfolio may also use an income-based valuation approach in which the anticipated future cash flows of the asset or liability are discounted to calculate fair value. Discounts may also be applied due to the nature and/or duration of any restrictions on the disposition of the asset or liability. Fair value represents a good faith approximation of the value of a security. Fair value determinations involve the consideration of a number of subjective factors, an analysis of applicable facts and circumstances and the exercise of judgment. As a result, it is possible that the fair value for a security determined in good faith in accordance with the Portfolio’s valuation procedures may differ from valuations for the same security determined by other funds using their own valuation procedures. Although the Portfolio’s valuation procedures are designed to value a security at the price the Portfolio may reasonably expect to receive upon the security’s sale in an orderly transaction, there can be no assurance that any fair value determination thereunder would, in fact, approximate the amount that the Portfolio would actually realize upon the sale of the security or the price at which the security would trade if a reliable market price were readily available. During the six-month six-month period ended June 30, 2017, there were no material changes to the fair value methodologies.
Securities which may be valued in this manner include, but are not limited to: (i) a security for which trading has been halted or suspended; (ii) a debt security that has recently gone into default and for which there is not a current market quotation; (iii) a security of an issuer that has entered into a restructuring; (iv) a security that has been de-listed from a national exchange; (v) a security for which the market price is not readily available from a third party pricing source or, if so provided, does
not, in the opinion of the Manager or Subadvisor, reflect the security’s market value; (vi) a security subject to trading collars for which no or limited trading takes place; and (vii) a security whose principal market has been temporarily closed at a time when, under normal conditions, it would be open. Securities for which market quotations or observable inputs are not readily available are generally categorized as Level 3 in the hierarchy. As of June 30, 2017, there were no securities held by the Portfolio that were fair valued in such a manner.
Equity securities and shares of Exchange-Traded Funds (“ETFs”) are valued at the last quoted sales prices as of the close of regular trading on the relevant exchange on each valuation date. Securities that are not traded on the valuation date are valued at the mean of the last quoted bid and ask prices. Prices are normally taken from the principal market in which each security trades. These Securities are generally categorized as Level 1 in the hierarchy.
Temporary cash investments acquired in excess of 60 days to maturity at the time of purchase are valued using the latest bid prices or using valuations based on a matrix system (which considers such factors as security prices, yields, maturities, and ratings), both as furnished by independent pricing services. Other temporary cash investments which mature in 60 days or less at the time of purchase (“Short-Term Investments”) are valued using the amortized cost method of valuation, unless the use of such method would be inappropriate. The amortized cost method involves valuing a security at its cost on the date of purchase and thereafter assuming a constant amortization to maturity of the difference between such cost and the value on maturity date. Amortized cost approximates the current fair value of a security. Securities valued using the amortized cost method are not valued using quoted prices in an active market and are generally categorized as Level 2 in the hierarchy.
The information above is not intended to reflect an exhaustive list of the methodologies that may be used to value portfolio investments. The valuation procedures permit the use of a variety of valuation methodologies in connection with valuing portfolio investments. The methodology used for a specific type of investment may vary based on the market data available or other considerations. The methodologies summarized above may not represent the specific means by which portfolio investments are valued on any particular business day.
(B) Income Taxes. The Portfolio’s policy is to comply with the requirements of the Internal Revenue Code of 1986, as amended (the “Internal Revenue Code”), applicable to regulated investment companies and to distribute all of its taxable income to the shareholders of the Portfolio within the allowable time limits. Therefore, no federal, state and local income tax provisions are required.
Management evaluates the Portfolio’s tax positions to determine if the tax positions taken meet the minimum recognition threshold in connection with accounting for uncertainties in income tax positions taken or expected to be taken for the purposes of measuring and recognizing tax liabilities in the financial statements. Recognition of tax benefits of an uncertain tax position is permitted only to the extent the position is “more likely than not” to be sustained assuming examination by taxing authorities. Management has analyzed the Portfolio’s tax positions taken on federal, state and local income tax returns for all open tax years (for up to three tax years), and has concluded that no provisions for federal,
| | |
| 22 | | MainStay VP Small Cap Core Portfolio |
state and local income tax are required in the Portfolio’s financial statements. The Portfolio’s federal, state and local income and federal excise tax returns for tax years for which the applicable statutes of limitations have not expired are subject to examination by the Internal Revenue Service and state and local departments of revenue.
(C) Dividends and Distributions to Shareholders. Dividends and distributions are recorded on the ex-dividend date. The Portfolio intends to declare and pay dividends from net investment income and distributions from net realized capital and currency gains, if any, at least annually. Unless the shareholder elects otherwise, all dividends and distributions are reinvested in the same class of shares of the Portfolio, at NAV. Dividends and distributions to shareholders are determined in accordance with federal income tax regulations and may differ from GAAP.
(D) Security Transactions and Investment Income. The Portfolio records security transactions on the trade date. Realized gains and losses on security transactions are determined using the identified cost method. Dividend income is recognized on the ex-dividend date; net of any foreign tax withheld at the source, and interest income is accrued as earned using the effective interest rate method and includes any realized gains and losses from repayment of principal on mortgage-backed securities. Discounts and premiums on Short-Term Investments are accreted and amortized, respectively, on the straight-line method. The straight-line method approximates the effective interest method for Short-Term Investments.
Investment income and realized and unrealized gains and losses on investments of the Portfolio are allocated pro rata to the separate classes of shares based upon their relative net assets on the date the income is earned or realized and unrealized gains and losses are incurred.
(E) Expenses. Expenses of the Fund are allocated to the individual Portfolios in proportion to the net assets of the respective Portfolios when the expenses are incurred, except where direct allocations of expenses can be made. Expenses (other than fees incurred under the distribution and service plans, further discussed in Note 3(B), which are charged directly to the Service Class shares) are allocated to separate classes of shares pro rata based upon their relative net assets on the date the expenses are incurred. The expenses borne by the Portfolio, including those of related parties to the Portfolio, are shown in the Statement of Operations. Additionally, the Portfolio may invest in shares of ETFs or mutual funds, which are subject to management fees and other fees that may increase their costs versus the costs of owning the underlying securities directly. These indirect expenses of ETFs or mutual funds are not included in the amounts shown as expenses on the Portfolio’s Statement of Operations or in the expense ratios included in the financial highlights.
(F) Use of Estimates. In preparing financial statements in conformity with GAAP, management makes estimates and assumptions that affect the reported amounts and disclosures in the financial statements. Actual results could differ from those estimates.
(G) Repurchase Agreements. The Portfolio may enter into repurchase agreements (i.e., buy a security from another party with the agreement that it be sold back in the future) to earn income. The Portfolio may enter into repurchase agreements only with
counterparties, usually financial institutions, that are deemed by the Manager or Subadvisor to be creditworthy, pursuant to guidelines established by the Board. During the term of any repurchase agreement, the Manager or Subadvisor will continue to monitor the creditworthiness of the counterparty. Under the 1940 Act, repurchase agreements are considered to be collateralized loans by the Portfolio to the counterparty secured by the securities transferred to the Portfolio.
Repurchase agreements are subject to counterparty risk, meaning the Portfolio could lose money by the counterparty’s failure to perform under the terms of the agreement. The Portfolio mitigates this risk by ensuring the repurchase agreement is collateralized by cash, U.S. government securities, fixed income securities and/or other securities. The collateral is held by the Portfolio’s custodian and valued daily on a mark to market basis to determine if the value, including accrued interest, exceeds the repurchase price. In the event of the counterparty’s default on the obligation to repurchase, the Portfolio has the right to liquidate the collateral and apply the proceeds in satisfaction of the obligation. Under certain circumstances, such as in the event of default or bankruptcy by the counterparty, realization and/or retention of the collateral may be limited or subject to delay, to legal proceedings and possible realized loss to the Portfolio.
(H) Securities Lending. In order to realize additional income, the Portfolio may engage in securities lending, subject to the limitations set forth in the 1940 Act and relevant guidance by the staff of the Securities and Exchange Commission (“SEC”). In the event the Portfolio does engage in securities lending, the Portfolio will lend through its custodian, State Street Bank and Trust Company (“State Street”). State Street will manage the Portfolio’s collateral in accordance with the lending agreement between the Portfolio and State Street, and indemnify the Portfolio against counterparty risk. The loans will be collateralized by U.S. Treasury securities at least equal at all times to the market value of the securities loaned. The Portfolio may bear the risk of delay in recovery of, or loss of rights in, the securities loaned should the borrower of the securities experience financial difficulty. The Portfolio may also record a realized gain or loss on securities deemed sold due to a borrower’s inability to return securities on loan. The Portfolio bears the risk of any loss on investment of the collateral. The Portfolio will receive compensation for lending its securities in the form of fees or it will retain a portion of interest on the investment of any cash received as collateral. The Portfolio will also continue to receive interest and dividends on the securities loaned and any gain or loss in the market price of the securities loaned that may occur during the term of the loan will be for the account of the Portfolio. During the six-month six-month period ended June 30, 2017, the Portfolio did not have any portfolio securities on loan.
(I) Indemnifications. Under the Fund’s organizational documents, its officers and trustees are indemnified against certain liabilities that may arise out of performance of their duties to the Fund. Additionally, in the normal course of business, the Portfolio enters into contracts with third-party service providers that contain a variety of representations and warranties and which may provide general indemnifications. The Portfolio’s maximum exposure under these arrangements is unknown, as this would involve future claims that may be made against the Portfolio that have not yet occurred. Based on experience, management is of the view that the risk of loss in connection with these potential
Notes to Financial Statements (Unaudited) (continued)
indemnification obligations is remote. However, there can be no assurance that material liabilities related to such obligations will not arise in the future, which could adversely impact the Portfolio.
Note 3–Fees and Related Party Transactions
(A) Manager and Subadvisor. New York Life Investments, a registered investment adviser and an indirect, wholly-owned subsidiary of New York Life, serves as the Portfolio’s Manager pursuant to an Amended and Restated Management Agreement (“Management Agreement”). The Manager provides offices, conducts clerical, recordkeeping and bookkeeping services, and keeps most of the financial and accounting records required to be maintained by the Portfolio. Except for the portion of salaries and expenses that are the responsibility of the Portfolio, the Manager pays the salaries and expenses of all personnel affiliated with the Portfolio and the operational expenses of the Portfolio. The Portfolio reimburses New York Life Investments in an amount equal to a portion of the compensation of the Chief Compliance Officer attributable to the Portfolio. Cornerstone Capital Management Holdings LLC (“Cornerstone Holdings” or “Subadvisor”), a registered investment adviser and an indirect, wholly-owned subsidiary of New York Life, serves as Subadvisor to the Portfolio. New York Life Investments pays for the services of the Subadvisor.
The Fund, on behalf of the Portfolio, pays New York Life Investments in its capacity as the Portfolio’s investment manager and administrator, pursuant to the Management Agreement, a monthly fee for the services performed and facilities furnished at an annual percentage of the Portfolio’s average daily net assets as follows: 0.85% up to $1 billion; and 0.80% in excess of $1 billion. New York Life Investments has contractually agreed to waive fees and/or reimburse expenses so that the total annual operating expenses (excluding taxes, interest, litigation, extraordinary expenses, brokerage and other transaction expenses relating to the purchase or sale of portfolio investments, and acquired (underlying) fund fees and expenses) do not exceed 1.00% for Initial Class and 1.25% for the Service Class shares. This agreement expires on May 1, 2018 and may only be amended or terminated prior to that date by action of the Board. During the six-month period ended June 30, 2017, the effective management fee rate was 0.85%.
During the six-month six-month period ended June 30, 2017, New York Life Investments earned fees from the Portfolio in the amount of $1,413,631.
State Street provides sub-administration and sub-accounting services to the Portfolio pursuant to an agreement with New York Life Investments. These services include calculating the daily NAVs of the Portfolio, maintaining the general ledger and sub-ledger accounts for the calculation of the Portfolio’s NAVs, and assisting New York Life Investments in conducting various aspects of the Portfolio’s administrative operations. For providing these services to the Portfolio, State Street is compensated by New York Life Investments.
(B) Distribution and Service Fees. The Fund, on behalf of the Portfolio, has entered into a distribution agreement with NYLIFE Distributors LLC (the “Distributor”), an indirect, wholly-owned subsidiary of New York Life. The Portfolio has adopted a distribution plan (the “Plan”) in accordance with the provisions of Rule 12b-1 under the 1940 Act. Under the Plan, the Distributor has agreed to provide, through its
affiliates or independent third parties, various distribution-related, shareholder and administrative support services to the Service Class shareholders. For its services, the Distributor is entitled to a combined distribution and service fee accrued daily and paid monthly at an annual rate of 0.25% of the average daily net assets attributable to the Service Class shares of the Portfolio.
Note 4–Federal Income Tax
During the period ended December 31, 2016, the tax character of distributions paid as reflected in the Statements of Changes in Net Assets was as follows:
| | |
| 2016 |
Tax-Based
Distributions
from Ordinary
Income | | Tax-Based
Distributions
from Long-Term
Gains |
| $5,100,307 | | $— |
Note 5–Custodian
State Street is the custodian of cash and securities held by the Portfolio. Custodial fees are charged to the Portfolio based on the Portfolio’s net assets and/or the market value of securities held by the Portfolio and the number of certain transactions incurred by the Portfolio.
Note 6–Line of Credit
The Portfolio and certain other funds managed by New York Life Investments, maintain a line of credit with a syndicate of banks in order to secure a source of funds for temporary purposes to meet unanticipated or excessive redemption requests.
Effective August 1, 2017, under the credit agreement (the “Credit Agreement”), the aggregate commitment amount is $600,000,000 with an additional uncommitted amount of $100,000,000. The commitment fee is an annual rate of 0.15% of the average commitment amount payable quarterly, regardless of usage, to State Street, who serves as the agent to the syndicate. The commitment fee is allocated among the Portfolio and certain other funds managed by New York Life Investments based upon their respective net assets and other factors. Interest on any revolving credit loan is charged based upon the Federal Funds Rate or the one month LIBOR, whichever is higher. The Credit Agreement expires on July 31, 2018, although the Portfolio, certain other funds managed by New York Life Investments and the syndicate of banks may renew the Credit Agreement for an additional year on the same or different terms. Prior to August 1, 2017, the aggregate commitment amount was $600,000,000 with an additional uncommitted amount of $100,000,000, and the commitment fee, under a credit agreement for which Bank of New York Mellon served as agent, was at an annual rate of 0.15% of the average commitment amount. During the six-month period ended June 30, 2017, there were no borrowings made or outstanding with respect to the Portfolio under the credit agreement for which Bank of New York Mellon served as agent.
Note 7–Interfund Lending Program
Pursuant to an exemptive order issued by the SEC, the Portfolio, along with certain other funds managed by New York Life Investments, may
| | |
| 24 | | MainStay VP Small Cap Core Portfolio |
participate in an interfund lending program. The interfund lending program provides an alternative credit facility that permits the Portfolio and certain other funds managed by New York Life Investments to lend or borrow money for temporary purposes directly to or from one another subject to the conditions of the exemptive order. During the six-month six-month period ended June 30, 2017, there were no interfund loans made or outstanding with respect to the Portfolio.
Note 8–Purchases and Sales of Securities (in 000’s)
During the six-month period ended June 30, 2017, purchases and sales of securities, other than short-term securities, were $302,606 and $310,494, respectively.
Note 9–Capital Share Transactions
| | | | | | | | |
Initial Class | | Shares | | | Amount | |
Six-month period ended June 30, 2017: | | | | | | | | |
Shares sold | | | 605,092 | | | $ | 7,080,728 | |
Shares redeemed | | | (482,979 | ) | | | (5,669,216 | ) |
| | | | |
Net increase (decrease) | | | 122,113 | | | $ | 1,411,512 | |
| | | | |
Period ended December 31, 2016 (a): | | | | | | | | |
Shares sold | | | 14,457,082 | | | $ | 149,616,611 | |
Shares issued to shareholders in reinvestment of dividends and distributions | | | 214,227 | | | | 2,528,618 | |
Shares redeemed | | | (669,736 | ) | | | (7,707,448 | ) |
| | | | |
Net increase (decrease) | | | 14,001,573 | | | $ | 144,437,781 | |
| | | | |
| | |
| | | | | | | | |
Service Class | | Shares | | | Amount | |
Six-month period ended June 30, 2017: | | | | | | | | |
Shares sold | | | 766,841 | | | $ | 9,013,789 | |
Shares redeemed | | | (1,653,699 | ) | | | (19,504,189 | ) |
| | | | |
Net increase (decrease) | | | (886,858 | ) | | $ | (10,490,400 | ) |
| | | | |
Period ended December 31, 2016 (a): | | | | | | | | |
Shares sold | | | 16,019,074 | | | $ | 171,230,544 | |
Shares issued to shareholders in reinvestment of dividends and distributions | | | 218,049 | | | | 2,571,689 | |
Shares redeemed | | | (1,306,000 | ) | | | (14,551,570 | ) |
| | | | |
Net increase (decrease) | | | 14,931,123 | | | $ | 159,250,663 | |
| | | | |
| (a) | Inception date was May 2, 2016. |
Note 10–Recent Accounting Pronouncement
In October 2016, the SEC adopted new rules and amended existing rules (together, “final rules”) intended to modernize the reporting and disclosure of information by registered investment companies. In part, the final rules amend Regulation S-X and require standardized, enhanced disclosure about derivatives in investment company financial statements, as well as other amendments. The compliance date for the amendments to Regulation S-X is August 1, 2017 and applies to shareholder reports for funds with fiscal periods ending after August 1, 2017. Management is currently evaluating the impact that the adoption of the amendments to Regulation S-X will have on the Portfolio’s financial statements and related disclosures.
Note 11–Subsequent Events
In connection with the preparation of the financial statements of the Portfolio as of and for the six-month period ended June 30, 2017, events and transactions subsequent to June 30, 2017, through the date the financial statements were issued have been evaluated by the Portfolio’s management for possible adjustment and/or disclosure. No subsequent events requiring financial statement adjustment or disclosure have been identified.
Proxy Voting Policies and Procedures and Proxy Voting Record
A description of the policies and procedures that New York Life Investments uses to vote proxies related to the Portfolio’s securities is available without charge, upon request, (i) by calling 800-598-2019 or (ii) by visiting the SEC’s website at www.sec.gov.
The Portfolio is required to file with the SEC its proxy voting record for the 12-month period ending June 30 on Form N-PX. The Portfolio’s most recent Form N-PX or proxy voting record is available free of charge upon request (i) by calling 800-598-2019 or; (ii) by visiting the SEC’s website at www.sec.gov.
Shareholder Reports and Quarterly Portfolio Disclosure
The Portfolio is required to file its complete schedule of portfolio holdings with the SEC for its first and third fiscal quarters on Form N-Q. The Portfolio’s Form N-Q is available without charge on the SEC’s website at www.sec.gov or by calling MainStay Investments at 800-598-2019. You also can obtain and review copies of Form N-Q by visiting the SEC’s Public Reference Room in Washington, DC (information on the operation of the Public Reference Room may be obtained by calling 1-800-SEC-0330).
| | |
| 26 | | MainStay VP Small Cap Core Portfolio |
MainStay VP Portfolios
MainStay VP offers a wide range of Portfolios. The full array of MainStay VP offerings is listed here, with information about the manager, subadvisors, legal counsel, and independent registered public accounting firm.
Equity Portfolios
MainStay VP Common Stock Portfolio
MainStay VP Cornerstone Growth Portfolio
MainStay VP Eagle Small Cap Growth Portfolio
MainStay VP Emerging Markets Equity Portfolio
MainStay VP Epoch U.S. Equity Yield Portfolio
MainStay VP Epoch U.S. Small Cap Portfolio
MainStay VP International Equity Portfolio
MainStay VP Large Cap Growth Portfolio
MainStay VP MFS® Utilities Portfolio
MainStay VP Mid Cap Core Portfolio
MainStay VP S&P 500 Index Portfolio
MainStay VP Small Cap Core Portfolio
MainStay VP T. Rowe Price Equity Income Portfolio
MainStay VP VanEck Global Hard Assets Portfolio
Mixed Asset Portfolios
MainStay VP Balanced Portfolio
MainStay VP Convertible Portfolio
MainStay VP Cushing Renaissance Advantage Portfolio
MainStay VP Income Builder Portfolio
MainStay VP Janus Henderson Balanced Portfolio
Income Portfolios
MainStay VP Bond Portfolio
MainStay VP Floating Rate Portfolio
MainStay VP Government Portfolio
MainStay VP High Yield Corporate Bond Portfolio
MainStay VP Indexed Bond Portfolio
MainStay VP PIMCO Real Return Portfolio
MainStay VP Unconstrained Bond Portfolio
Money Market
MainStay VP U.S. Government Money Market Portfolio
Alternative
MainStay VP Absolute Return Multi-Strategy Portfolio
Asset Allocation Portfolios
MainStay VP Conservative Allocation Portfolio
MainStay VP Growth Allocation Portfolio
MainStay VP Moderate Allocation Portfolio
MainStay VP Moderate Growth Allocation Portfolio
Manager
New York Life Investment Management LLC
New York, New York
Subadvisors
Candriam Belgium*
Brussels, Belgium
Candriam France S.A.S.*
Paris, France
Cornerstone Capital Management Holdings LLC*
New York, New York
Cushing Asset Management, LP
Dallas, Texas
Eagle Asset Management, Inc.
St Petersburg, Florida
Epoch Investment Partners, Inc.
New York, New York
Janus Capital Management LLC
Denver, Colorado
MacKay Shields LLC*
New York, New York
Massachusetts Financial Services Company
Boston, Massachusetts
NYL Investors LLC*
New York, New York
Pacific Investment Management Company LLC
Newport Beach, California
T. Rowe Price Associates, Inc.
Baltimore, Maryland
Van Eck Associates Corporation
New York, New York
Winslow Capital Management, LLC
Minneapolis, Minnesota
Distributor
NYLIFE Distributors LLC*
Jersey City, New Jersey
Custodian
State Street Bank and Trust Company
Boston, Massachusetts
Independent Registered Public Accounting Firm
PricewaterhouseCoopers LLP
New York, New York
Legal Counsel
Dechert LLP
Washington, District of Columbia
Some Portfolios may not be available in all products.
* An affiliate of New York Life Investment Management LLC
Not part of the Semiannual Report
2017 Semiannual Report
This report is for the general information of New York Life Variable Annuities and NYLIAC Variable Universal Life Insurance Products policyowners. It must be preceded or accompanied by the appropriate product(s) and funds prospectuses if it is given to anyone who is not an owner of a New York Life variable annuity policy or a NYLIAC Variable Universal Life Insurance Product. This report does not offer for sale or solicit orders to purchase securities.
The performance data quoted in this report represents past performance. Past performance is no guarantee of future results. Due to market volatility and other factors, current performance may be lower or higher than the figures shown. The most recent month-end performance summary for your variable annuity or variable life policy is available by calling 800-598-2019 and is updated periodically on www.newyorklife.com.
The New York Life Variable Annuities and NYLIAC Variable Universal Life Insurance Products are issued by New York Life Insurance and Annuity Corporation (a Delaware Corporation) and distributed by NYLIFE Distributors LLC (Member FINRA/SIPC).
New York Life Insurance Company
New York Life Insurance and Annuity Corporation (NYLIAC) (A Delaware Corporation)
51 Madison Avenue, Room 551
New York, NY 10010
www.newyorklife.com
Printed on recycled paper
mainstayinvestments.com
NYLIFE Distributors LLC, 30 Hudson Street, Jersey City, NJ 07302
New York Life Investment Management LLC is the investment manager to the MainStay VP Funds Trust
©2017 by NYLIFE Distributors LLC. All rights reserved.
You may obtain copies of the Prospectus and the Statement of Additional Information free of charge, upon request, by calling toll-free 800-598-2019 or writing to New York Life Insurance and Annuity Corporation, 51 Madison Avenue, New York, NY 10010.
| | | | |
| Not FDIC Insured | | No Bank Guarantee | | May Lose Value |
| | | | |
1744203 | | | | MSVPSCC10-08/17 (NYLIAC) NI530 |
MainStay VP Indexed Bond Portfolio
Message from the President and Semiannual Report
Unaudited | June 30, 2017

Sign up for electronic delivery of your shareholder reports. For full details on electronic delivery, including who can participate and what you
can receive via eDelivery, please log on to www.newyorklife.com/vsc

This page intentionally left blank
Message from the President
The six months ended June 30, 2017, brought positive results to many stock and bond investors. The year began with many investors hoping that Republican control of the White House, the Senate and the House of Representatives could bring an end to political gridlock; and while debate has continued on a number of issues, the U.S. stock market climbed relatively steadily throughout the first half of 2017.
According to FTSE-Russell U.S. market data, stocks at all capitalization levels tended to record positive total returns during the reporting period, with large-cap stocks generally outperforming stocks of smaller-capitalization companies. Growth stocks outpaced value stocks at every capitalization level by substantial margins—from more than six percentage points for micro-caps and mid-caps to more than 10 percentage points for the largest 200 U.S. companies by market capitalization.
Most sectors of the stock market advanced during the reporting period, with energy and telecommunication services being notable exceptions. Energy stocks declined as oil prices fell despite moves by the Organization of Petroleum Exporting Countries (OPEC) intended to limit oil production by its members. Telecommunication services stocks tended to decline as competition increased and rising interest rates made dividend payouts less appealing.
In March and June of 2017, the Federal Reserve announced successive increases in the target range for the federal funds rate, ultimately bringing the federal funds target range to 1.00% to 1.25%. While short-term U.S. Treasury yields rose in response, yields for U.S. Treasury securities with maturities of five years or longer declined. As the difference between short- and long-term yields narrowed, the advantages of higher-yielding long-term bonds became increasingly apparent.
Virtually all taxable and tax-exempt bond sectors provided positive total returns during the reporting period. Mortgage-backed
securities, though providing positive total returns, faced headwinds when the Federal Reserve announced plans to begin normalizing its balance sheet by reducing reinvestment of principal payments on mortgage-backed securities.
International stock and bond markets were also strong during the reporting period. International stocks provided double-digit total returns that were surpassed by emerging-market stocks as a whole. Global investment-grade bonds provided single-digit returns; and emerging-market debt was somewhat stronger.
Even during periods of favorable market performance and generally positive returns, MainStay believes that it is important to carefully monitor your investments. Your risk tolerance may
change over time, leading you to reevaluate which MainStay VP Portfolios are most appropriate for your long-term goals. Your goals themselves may also change, leading you to pursue investments with more or less risk. The portfolio managers of MainStay VP Portfolios seek to provide results consistent with the investment objectives of their respective Portfolios, to give you a wide range of choices suitable to various investment needs.
The report that follows provides more detailed information about the specific markets, securities and investment decisions that influenced your MainStay VP Portfolio during the six months ended June 30, 2017. We invite you to review the report carefully as part of your ongoing investment evaluation and review.
Sincerely,

Stephen P. Fisher
President
The opinions expressed are as of the date of the accompanying report and are subject to change. Past performance is no guarantee of future results. There is no guarantee that any forecasts made will come to pass. This material does not constitute investment advice and is not intended as an endorsement of any specific investment.
Not all MainStay VP Portfolios and/or share classes are available under all policies.
Not part of the Semiannual Report
Table of Contents
Investors should refer to the Portfolio’s Summary Prospectus and/or Prospectus and consider the Portfolio’s investment objectives, strategies, risks, charges and expenses carefully before investing. The Summary Prospectus and/or Prospectus contain this and other information about the Portfolio. You may obtain copies of the Portfolio’s Summary Prospectus and/or the Prospectus and the Statement of Additional Information free of charge, upon request, by calling toll-free 800-598-2019, by writing to New York Life Insurance and Annuity Corporation, 51 Madison Avenue, Room 251, New York, New York 10010 or by sending an email to MainStayShareholdersServices@nylim.com. These documents are also available at mainstayinvestments.com/vpdocuments. Please read the Summary Prospectus and/or Prospectus carefully before investing. MainStay VP Funds Trust portfolios are separate account options which are purchased through a variable insurance or variable annuity contract.
Investment and Performance Comparison (Unaudited)
Performance data quoted represents past performance. Past performance is no guarantee of future results. Because of market volatility and other factors, current performance may be lower or higher than the figures shown. Investment return and principal value will fluctuate, and as a result, when shares are redeemed, they may be worth more or less than their original cost. The performance table and graph do not reflect any deduction of sales charges, mortality and expense charges, contract charges or administrative charges. Please refer to the Performance Summary appropriate for your policy. For performance information current to the most recent month-end, please call 800-598-2019 or visit www.newyorklife.com.
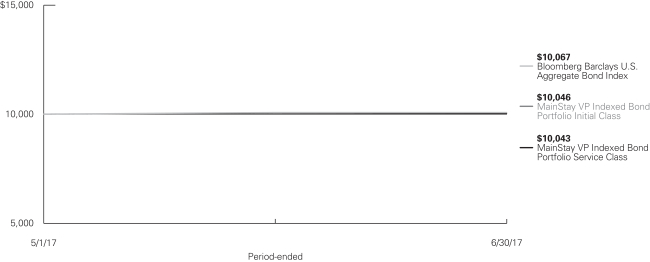
Average Annual Total Returns for the Period Ended June 30, 2017
| | | | | | | | | | | | |
| Class | | Inception Date | | | Six Months
or Since Inception | | | Gross
Expense
Ratio1 | |
Initial Class Shares | | | 5/1/2017 | | | | 0.46 | % | | | 0.37 | % |
Service Class Shares | | | 5/1/2017 | | | | 0.43 | | | | 0.62 | |
| | | | |
| Benchmark Performance | | Six Months or Since Inception | |
Bloomberg Barclays U.S. Aggregate Bond Index2 | | | 0.67 | % |
Average Lipper Variable Products Core Bond Portfolio3 | | | 0.69 | |
| 1. | The gross expense ratios presented reflect the Portfolio’s “Total Annual Portfolio Operating Expenses” from the most recent Prospectus and may differ from other expense ratios disclosed in this report. |
| 2. | The Bloomberg Barclays U.S. Aggregate Bond Index is the Portfolio’s primary broad-based securities market index for comparison purposes. The Bloomberg Barclays U.S. Aggregate Bond Index is a broad-based benchmark that measures performance of the investment-grade, U.S. dollar denominated, fixed-rate taxable bond market, including Treasurys, government-related and corporate securities, mortgage-backed securities (agency fixed-rate and hybrid adjustable-rate mortgage pass-throughs), asset-backed securities and commercial mortgage-backed securities. |
| | Results assume reinvestment of all dividends and capital gains. An investment cannot be made directly in an index. |
| 3. | The Average Lipper Variable Products Core Bond Portfolio is representative of portfolios that invest at least 85% in domestic investment-grade debt issues (rated in the top four grades) with any remaining investment in non-benchmark sectors such as high-yield, global and emerging market debt. These portfolios maintain dollar-weighted average maturities of five to ten years. The benchmark is a product of Lipper Inc. Lipper Inc. is an independent monitor of fund performance. Results are based on average total returns of similar portfolios with all dividends and capital gain distributions reinvested. |
Cost in Dollars of a $1,000 Investment in MainStay VP Indexed Bond Portfolio (Unaudited)
The example below is intended to describe the fees and expenses borne by shareholders during the period from May 1, 2017 (the inception date of the Portfolio) to June 30, 2017, and the impact of those costs on your investment.
Example
As a shareholder of the Portfolio, you incur two types of costs: (1) transaction costs, including exchange fees and sales charges (loads) on purchases (as applicable), and (2) ongoing costs, including management fees, distribution and/or service (12b-1) fees, and other Portfolio expenses (as applicable). This example is intended to help you understand your ongoing costs (in dollars) of investing in the Portfolio and to compare these costs with the ongoing costs of investing in other mutual funds. The example is based on an investment of $1,000 made at the beginning of the period and held for the entire period from May 1, 2017 to June 30, 2017. Shares are only sold in connection with variable life and annuity contracts and the example does not reflect any contract level or transactional fees or expenses. If these costs had been included, your costs would have been higher.
This example illustrates your Portfolio’s ongoing costs in two ways:
Actual Expenses
The second and third data columns in the table below provide information about actual account values and actual expenses. You may use the information in these columns, together with the amount you invested, to estimate the expenses that you paid during the period ended June 30, 2017. Simply divide your account value by $1,000
(for example, an $8,600 account value divided by $1,000 = 8.6), then multiply the result by the number under the heading entitled “Expenses Paid During Period” to estimate the expenses you paid on your account during this period.
Hypothetical Example for Comparison Purposes
The fourth and fifth data columns in the table below provide information about hypothetical account values and hypothetical expenses based on the Portfolio’s actual expense ratio and an assumed rate of return of 5% per year before expenses, which is not the Portfolio’s actual return. The hypothetical account values and expenses may not be used to estimate the actual ending account balances or expenses you paid for the period shown. You may use this information to compare the ongoing costs of investing in the Portfolio with the ongoing costs of investing in other mutual funds. To do so, compare this 5% hypothetical example with the 5% hypothetical examples that appear in the shareholder reports of the other mutual funds.
Please note that the expenses shown in the table are meant to highlight your ongoing costs only and do not reflect any transactional costs, such as exchange fees or sales charges (loads). Therefore, the fourth and fifth data columns of the table are useful in comparing ongoing costs only and will not help you determine the relative total costs of owning different funds. In addition, if these transactional costs were included, your costs would have been higher.
| | | | | | | | | | | | | | | | | | | | | | |
| | | | | | | | | | | | | | | | | | |
| Share Class | | Beginning
Account
Value
5/1/171 | | | Ending Account
Value (Based
on Actual
Returns and
Expenses)
6/30/17 | | | Expenses
Paid
During
Period2 | | | Ending Account
Value (Based
on Hypothetical
5% Annualized
Return and
Actual Expenses)
6/30/17 | | | Expenses
Paid
During
Period2 | | | Net Expense
Ratio
During
Period3 |
| | | | | | |
| Initial Class Shares | | $ | 1,000.00 | | | $ | 1,004.60 | | | $ | 0.62 | | | $ | 1,007.70 | | | $ | 0.62 | | | 0.37% |
| | | | | | |
| Service Class Shares | | $ | 1,000.00 | | | $ | 1,004.30 | | | $ | 1.04 | | | $ | 1,007.30 | | | $ | 1.04 | | | 0.62% |
| 1. | The inception date of the Portfolio. |
| 2. | Expenses are equal to the Portfolio’s annualized expense ratio of each class multiplied by the average account value over the period, divided by 365 and multiplied by 61 (to reflect the period). The table above represents the actual expenses incurred during the period. |
| 3. | Expenses are equal to the Portfolio’s annualized expense ratio to reflect the period. |
| | |
| 6 | | MainStay VP Indexed Bond Portfolio |
Portfolio Composition as of June 30, 2017 (Unaudited)
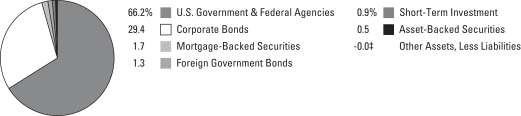
See Portfolio of Investments beginning on page 9 for specific holdings within these categories.
| ‡ | Less than one-tenth of a percent. |
Top Ten Issuers Held as of June 30, 2017 (excluding short-term investment) (Unaudited)
| 1. | United States Treasury Notes, 0.875%–2.625%, due 4/30/18–5/15/27 |
| 2. | Federal National Mortgage Association (Mortgage Pass-Through Securities), 2.50%–5.50%, due 5/1/19–7/1/47 |
| 3. | Federal Home Loan Mortgage Corporation (Mortgage Pass-Through Securities), 1.375%–5.50%, due 6/1/19–12/1/46 |
| 4. | Government National Mortgage Association (Mortgage Pass-Through Securities), 2.50%–5.00%, due 4/15/45–4/20/47 |
| 5. | United States Treasury Bonds, 2.875%–5.375%, due 2/15/31–2/15/47 |
| 6. | KfW, 1.50%–2.125%, due 4/20/20–3/7/22 |
| 7. | European Investment Bank, 1.25%–2.25%, due 5/15/19–8/15/22 |
| 8. | Inter-American Development Bank, 1.00%–1.75%, due 5/13/19–4/14/22 |
| 9. | Federal National Mortgage Association, 1.875%, due 4/5/22–9/24/26 |
| 10. | GS Mortgage Securities Trust, 2.85%–3.862%, due 6/10/47–10/10/49 |
Portfolio Management Discussion and Analysis (Unaudited)
Answers to the questions reflect the views of Donald F. Serek, CFA, Thomas J. Girard and George S. Cherpelis of NYL Investors LLC, the Portfolio’s subadvisor.
How did MainStay VP Indexed Bond Portfolio perform relative to its benchmark and peers during the period from May 1, 2017 through June 30, 2017?
The inception date for MainStay VP Indexed Bond Portfolio was May 1, 2017. From this date through June 30, 2017, the Portfolio returned 0.46% for Initial Class shares and 0.43% for Service Class shares. From May 1, 2017, through June 30, 2017, both share classes underperformed the 0.67% return of the Bloomberg Barclays U.S. Aggregate Bond Index,1 which is the Portfolio’s broad-based securities-market index. Although the Portfolio seeks investment results that correspond to the total return performance of fixed-income securities in the aggregate, as represented by the Portfolio’s broad-based securities-market index, the Portfolio’s performance will typically lag that of the Index because the Portfolio incurs fees and expenses that the Index does not. Over the same period, both share classes underperformed the 0.69% return of the Average Lipper2 Variable Products Core Bond Portfolio.
During the reporting period, which credit-rating categories were strong performers and which credit rating categories were weak?
During the reporting period, lower-quality securities outperformed higher-quality securities. Credits rated AA and AAA3 had the lowest excess returns. Credits rated single A4 followed those rated AAA and AA. Credits rated BBB5 outperformed these higher-quality segments of the market. Crossover credit6 outperformed all investment-grade categories by a wide margin.
What was the Portfolio’s duration7 strategy during the reporting period?
The Portfolio pursues a passive strategy, and in terms of durations seeks to replicate the duration of its benchmark. The
Portfolio’s duration strategy had a neutral impact on performance during the reporting period. As of June 30, 2017, the Portfolio’s duration was approximately 5.85 years, which compared to a duration of 5.84 years for the Bloomberg Barclays U.S. Aggregate Bond Index.
Which market sectors made the strongest contributions to the Portfolio’s performance, and which market sectors detracted the most?
During the reporting period, all of the broad sectors in the Bloomberg Barclays U.S. Aggregate Bond Index produced positive total returns. The U.S. corporate sector, led by utilities and industrials, outperformed all of the other asset classes in the Index. In the non-corporate sector, the sovereign subsector was the best performer. Within securitized products, commercial mortgage-backed securities outperformed both mortgage-backed securities and asset-backed securities. U.S. government agency securities outperformed U.S. Treasury securities during the reporting period.
Were there any significant changes to the composition of the Portfolio’s benchmark during the reporting period?
During the reporting period, there were no changes to the composition of the Bloomberg Barclays U.S. Aggregate Bond Index that we considered material.
| 1. | See footnote on page 5 for more information on the Bloomberg Barclays U.S. Aggregate Bond Index. |
| 2. | See footnote on page 5 for more information on Lipper Inc. |
| 3. | An obligation rated ‘AAA’ has the highest rating assigned by Standard & Poor’s (“S&P”), and in the opinion of S&P, the obligor’s capacity to meet its financial commitment on the obligation is extremely strong. An obligation rated ‘AA’ by S&P is deemed by S&P to differ from the highest-rated obligations only to a small degree. In the opinion of S&P, the obligor’s capacity to meet its financial commitment on the obligation is very strong. When applied to Portfolio holdings, ratings are based solely on the creditworthiness of the bonds in the portfolio and are not meant to represent the security or safety of the Portfolio. |
| 4. | An obligation rated ‘A’ by S&P is deemed by S&P to be somewhat more susceptible to the adverse effects of changes in circumstances and economic conditions than obligations in higher-rated categories. In the opinion of S&P, however, the obligor’s capacity to meet its financial commitment on the obligation is still strong. When applied to Portfolio holdings, ratings are based solely on the creditworthiness of the bonds in the portfolio and are not meant to represent the security or safety of the Portfolio. |
| 5. | An obligation rated ‘BBB’ by S&P is deemed by S&P to exhibit adequate protection parameters. In the opinion of S&P, however, adverse economic conditions or changing circumstances are more likely to lead to a weakened capacity of the obligor to meet its financial commitment on the obligation. When applied to Portfolio holdings, ratings are based solely on the creditworthiness of the bonds in the portfolio and are not meant to represent the security or safety of the Portfolio. |
| 6. | Crossover credit typically refers to bonds that are rated investment grade by one rating agency but below investment grade by another. |
| 7. | Duration is a measure of the price sensitivity of a fixed-income investment to changes in interest rates. Duration is expressed as a number of years and is considered a more accurate sensitivity gauge than average maturity. |
The opinions expressed are those of the portfolio managers as of the date of this report and are subject to change. There is no guarantee that any forecasts made will come to pass. This material does not constitute investment advice and is not intended as an endorsement of any specific investment.
Not all MainStay VP Portfolios and/or share classes are available under all policies.
| | |
| 8 | | MainStay VP Indexed Bond Portfolio |
Portfolio of Investments June 30, 2017 (Unaudited)
| | | | | | | | |
| | | Principal
Amount | | | Value | |
Long-Term Bonds 99.1%† Asset-Backed Securities 0.5% | | | | | | | | |
Automobile 0.2% | | | | | | | | |
Hyundai Auto Receivables Trust
Series 2016-A, Class A3
1.560%, due 9/15/20 | | $ | 100,000 | | | $ | 99,962 | |
Mercedes Benz Auto Lease Trust
Series 2017-A, Class A3
1.790%, due 4/15/20 | | | 100,000 | | | | 100,106 | |
| | | | | | | | |
| | | | | | | 200,068 | |
| | | | | | | | |
Credit Cards 0.3% | | | | | | | | |
Chase Issuance Trust
Series 2015-A7, Class A7
1.620%, due 7/15/20 | | | 100,000 | | | | 100,098 | |
Discover Card Execution Note Trust
Series 2014-A4, Class A4
2.120%, due 12/15/21 | | | 200,000 | | | | 201,483 | |
| | | | | | | | |
| | | | | | | 301,581 | |
| | | | | | | | |
Total Asset-Backed Securities
(Cost $501,842) | | | | | | | 501,649 | |
| | | | | | | | |
| | |
| Corporate Bonds 29.4% | | | | | | | | |
Aerospace & Defense 0.5% | | | | | | | | |
Lockheed Martin Corp.
4.070%, due 12/15/42 | | | 125,000 | | | | 127,766 | |
Northrop Grumman Corp.
7.750%, due 2/15/31 | | | 100,000 | | | | 142,871 | |
United Technologies Corp.
2.650%, due 11/1/26 | | | 230,000 | | | | 223,632 | |
| | | | | | | | |
| | | | | | | 494,269 | |
| | | | | | | | |
Auto Manufacturers 0.6% | | | | | | | | |
Ford Motor Credit Co. LLC
3.219%, due 1/9/22 | | | 200,000 | | | | 201,778 | |
General Motors Financial Co., Inc.
4.350%, due 1/17/27 | | | 180,000 | | | | 182,215 | |
Toyota Motor Credit Corp.
2.250%, due 10/18/23 | | | 140,000 | | | | 136,979 | |
| | | | | | | | |
| | | | | | | 520,972 | |
| | | | | | | | |
Banks 6.9% | | | | | | | | |
Bank of America Corp. | | | | | | | | |
3.248%, due 10/21/27 | | | 90,000 | | | | 86,970 | |
3.300%, due 1/11/23 | | | 260,000 | | | | 265,121 | |
5.000%, due 1/21/44 | | | 80,000 | | | | 90,436 | |
Bank of New York Mellon Corp.
3.000%, due 2/24/25 | | | 130,000 | | | | 129,771 | |
Bank of Nova Scotia
2.700%, due 3/7/22 | | | 180,000 | | | | 181,124 | |
| | | | | | | | |
| | | Principal
Amount | | | Value | |
Banks (continued) | | | | | | | | |
Barclays PLC
5.250%, due 8/17/45 | | $ | 200,000 | | | $ | 224,216 | |
BNP Paribas S.A.
3.250%, due 3/3/23 | | | 220,000 | | | | 225,660 | |
Capital One Financial Co.
3.050%, due 3/9/22 | | | 130,000 | | | | 131,021 | |
Citigroup, Inc. | | | | | | | | |
3.375%, due 3/1/23 | | | 220,000 | | | | 224,538 | |
4.450%, due 9/29/27 | | | 90,000 | | | | 93,602 | |
4.650%, due 7/30/45 | | | 80,000 | | | | 86,991 | |
Cooperatieve Centrale Raiffeisen-Boerenleenbank B.A.
5.250%, due 5/24/41 | | | 70,000 | | | | 85,461 | |
Credit Suisse Group Funding Guernsey, Ltd.
3.800%, due 6/9/23 | | | 250,000 | | | | 257,739 | |
Goldman Sachs Group, Inc. | | | | | | | | |
2.908%, due 6/5/23 (a) | | | 180,000 | | | | 179,643 | |
3.850%, due 1/26/27 | | | 130,000 | | | | 132,250 | |
6.250%, due 2/1/41 | | | 110,000 | | | | 143,692 | |
HSBC Holdings PLC | | | | | | | | |
2.650%, due 1/5/22 | | | 220,000 | | | | 219,493 | |
3.900%, due 5/25/26 | | | 200,000 | | | | 206,440 | |
JPMorgan Chase & Co. | | | | | | | | |
4.250%, due 10/1/27 | | | 220,000 | | | | 229,482 | |
4.260%, due 2/22/48 (a) | | | 130,000 | | | | 135,994 | |
¨KfW | | | | | | | | |
1.500%, due 4/20/20 | | | 405,000 | | | | 402,550 | |
2.125%, due 3/7/22 | | | 530,000 | | | | 532,248 | |
Lloyds Banking Group PLC
3.750%, due 1/11/27 | | | 200,000 | | | | 200,793 | |
Morgan Stanley | | | | | | | | |
3.625%, due 1/20/27 | | | 180,000 | | | | 181,294 | |
3.750%, due 2/25/23 | | | 170,000 | | | | 176,768 | |
PNC Bank N.A.
2.625%, due 2/17/22 | | | 250,000 | | | | 251,818 | |
Royal Bank of Canada
2.750%, due 2/1/22 | | | 220,000 | | | | 223,734 | |
Royal Bank of Scotland Group PLC
3.875%, due 9/12/23 | | | 200,000 | | | | 204,222 | |
Toronto-Dominion Bank
2.500%, due 12/14/20 | | | 220,000 | | | | 222,538 | |
U.S. Bank N.A.
2.000%, due 1/24/20 | | | 250,000 | | | | 251,077 | |
Wells Fargo & Co. | | | | | | | | |
3.000%, due 4/22/26 | | | 90,000 | | | | 87,899 | |
3.500%, due 3/8/22 | | | 170,000 | | | | 176,606 | |
4.750%, due 12/7/46 | | | 90,000 | | | | 96,091 | |
Westpac Banking Corp.
2.800%, due 1/11/22 | | | 220,000 | | | | 223,197 | |
| | | | | | | | |
| | | | | | | 6,560,479 | |
| | | | | | | | |
| † | Percentages indicated are based on Portfolio net assets. |
| ¨ | | Among the Portfolio’s 10 largest issuers, as of June 30, 2017, excluding short-term investment. May be subject to change daily. |
| | | | | | |
The notes to the financial statements are an integral part of,
and should be read in conjunction with, the financial statements. | | | | | 9 | |
Portfolio of Investments June 30, 2017 (Unaudited) (continued)
| | | | | | | | |
| | | Principal
Amount | | | Value | |
| Corporate Bonds (continued) | |
Beverages 0.9% | | | | | | | | |
Anheuser-Busch InBev Finance, Inc. | | | | | | | | |
3.650%, due 2/1/26 | | $ | 130,000 | | | $ | 133,935 | |
4.900%, due 2/1/46 | | | 120,000 | | | | 135,437 | |
Anheuser-Busch InBev Worldwide, Inc.
2.500%, due 7/15/22 | | | 130,000 | | | | 129,816 | |
Coca Cola Co.
2.250%, due 9/1/26 | | | 90,000 | | | | 85,450 | |
Diageo Capital PLC
5.875%, due 9/30/36 | | | 108,000 | | | | 139,022 | |
Molson Coors Brewing Co.
4.200%, due 7/15/46 | | | 50,000 | | | | 49,309 | |
PepsiCo, Inc. | | | | | | | | |
2.750%, due 3/1/23 | | | 90,000 | | | | 91,174 | |
4.450%, due 4/14/46 | | | 80,000 | | | | 87,206 | |
| | | | | | | | |
| | | | | | | 851,349 | |
| | | | | | | | |
Biotechnology 0.6% | | | | | | | | |
Amgen, Inc. | | | | | | | | |
2.700%, due 5/1/22 | | | 90,000 | | | | 90,517 | |
4.400%, due 5/1/45 | | | 90,000 | | | | 92,443 | |
Baxalta, Inc.
3.600%, due 6/23/22 | | | 130,000 | | | | 134,619 | |
Celgene Corp.
3.550%, due 8/15/22 | | | 90,000 | | | | 93,691 | |
Gilead Sciences, Inc. | | | | | | | | |
3.650%, due 3/1/26 | | | 90,000 | | | | 92,550 | |
4.600%, due 9/1/35 | | | 90,000 | | | | 96,500 | |
| | | | | | | | |
| | | | | | | 600,320 | |
| | | | | | | | |
Chemicals 0.2% | | | | | | | | |
Dow Chemical Co.
3.000%, due 11/15/22 | | | 220,000 | | | | 224,239 | |
| | | | | | | | |
| | |
Computers 0.7% | | | | | | | | |
Apple, Inc. | | | | | | | | |
2.150%, due 2/9/22 | | | 90,000 | | | | 89,412 | |
3.350%, due 2/9/27 | | | 11,000 | | | | 11,246 | |
4.250%, due 2/9/47 | | | 90,000 | | | | 95,456 | |
4.500%, due 2/23/36 | | | 120,000 | | | | 134,654 | |
Dell International LLC / EMC Corp.
5.450%, due 6/15/23 (b) | | | 120,000 | | | | 130,220 | |
Hewlett Packard Enterprise Co.
4.400%, due 10/15/22 | | | 90,000 | | | | 95,412 | |
IBM Corp.
3.450%, due 2/19/26 | | | 130,000 | | | | 133,196 | |
| | | | | | | | |
| | | | | | | 689,596 | |
| | | | | | | | |
Cosmetics & Personal Care 0.5% | | | | | | | | |
Colgate-Palmolive Co.
1.750%, due 3/15/19 | | | 220,000 | | | | 220,602 | |
Procter & Gamble Co.
1.900%, due 11/1/19 | | | 220,000 | | | | 221,008 | |
| | | | | | | | |
| | | | | | | 441,610 | |
| | | | | | | | |
| | | | | | | | |
| | | Principal
Amount | | | Value | |
Diversified Financial Services 0.7% | | | | | | | | |
American Express Credit Corp.
2.700%, due 3/3/22 | | $ | 180,000 | | | $ | 181,658 | |
GE Capital International Funding Co.
3.373%, due 11/15/25 | | | 210,000 | | | | 217,131 | |
National Rural Utilities Cooperative Finance Corp.
2.700%, due 2/15/23 | | | 90,000 | | | | 90,108 | |
Visa, Inc.
2.800%, due 12/14/22 | | | 130,000 | | | | 132,358 | |
| | | | | | | | |
| | | | | | | 621,255 | |
| | | | | | | | |
Electric 1.5% | | | | | | | | |
Commonwealth Edison Co.
3.650%, due 6/15/46 | | | 140,000 | | | | 136,064 | |
Consolidated Edison Co. of New York, Inc.
5.850%, due 3/15/36 | | | 110,000 | | | | 136,741 | |
DTE Electric Co.
3.375%, due 3/1/25 | | | 90,000 | | | | 92,915 | |
Duke Energy Carolinas LLC | | | | | | | | |
3.875%, due 3/15/46 | | | 90,000 | | | | 91,764 | |
4.000%, due 9/30/42 | | | 100,000 | | | | 103,173 | |
Edison International
2.950%, due 3/15/23 | | | 90,000 | | | | 90,882 | |
Emera U.S. Finance, L.P.
2.700%, due 6/15/21 | | | 90,000 | | | | 90,138 | |
Florida Power & Light Co.
2.750%, due 6/1/23 | | | 90,000 | | | | 90,969 | |
MidAmerican Energy Co.
3.950%, due 8/1/47 | | | 90,000 | | | | 92,551 | |
Pacific Gas & Electric Co.
5.400%, due 1/15/40 | | | 110,000 | | | | 135,744 | |
Southern Co. | | | | | | | | |
2.950%, due 7/1/23 | | | 90,000 | | | | 89,423 | |
4.400%, due 7/1/46 | | | 50,000 | | | | 50,908 | |
Virginia Electric & Power Co.
4.000%, due 1/15/43 | | | 130,000 | | | | 132,836 | |
Xcel Energy, Inc.
3.300%, due 6/1/25 | | | 90,000 | | | | 90,798 | |
| | | | | | | | |
| | | | | | | 1,424,906 | |
| | | | | | | | |
Energy 0.1% | | | | | | | | |
Exxon Mobil Corp.
4.114%, due 3/1/46 | | | 90,000 | | | | 94,941 | |
| | | | | | | | |
| | |
Food 0.4% | | | | | | | | |
General Mills, Inc.
3.150%, due 12/15/21 | | | 90,000 | | | | 92,788 | |
Kraft Heinz Foods Co.
3.000%, due 6/1/26 | | | 140,000 | | | | 133,987 | |
Unilever Capital Corp.
3.100%, due 7/30/25 | | | 100,000 | | | | 100,762 | |
| | | | | | | | |
| | | | | | | 327,537 | |
| | | | | | | | |
| | | | |
| 10 | | MainStay VP Indexed Bond Portfolio | | The notes to the financial statements are an integral part of,
and should be read in conjunction with, the financial statements. |
| | | | | | | | |
| | | Principal
Amount | | | Value | |
| Corporate Bonds (continued) | |
Forest Products & Paper 0.1% | | | | | | | | |
International Paper Co.
3.800%, due 1/15/26 | | $ | 130,000 | | | $ | 133,608 | |
| | | | | | | | |
| | |
Health Care—Products 0.5% | | | | | | | | |
Abbott Laboratories
3.750%, due 11/30/26 | | | 130,000 | | | | 132,706 | |
Medtronic, Inc.
4.625%, due 3/15/45 | | | 210,000 | | | | 236,341 | |
Thermo Fisher Scientific, Inc.
2.950%, due 9/19/26 | | | 90,000 | | | | 87,515 | |
| | | | | | | | |
| | | | | | | 456,562 | |
| | | | | | | | |
Health Care—Services 0.6% | | | | | | | | |
Aetna, Inc.
6.625%, due 6/15/36 | | | 100,000 | | | | 134,917 | |
Anthem, Inc.
2.250%, due 8/15/19 | | | 220,000 | | | | 221,019 | |
Unitedhealth Group, Inc.
3.100%, due 3/15/26 | | | 180,000 | | | | 180,927 | |
| | | | | | | | |
| | | | | | | 536,863 | |
| | | | | | | | |
Housewares 0.1% | | | | | | | | |
Newell Brands, Inc.
3.850%, due 4/1/23 | | | 90,000 | | | | 94,495 | |
| | | | | | | | |
| | |
Insurance 0.7% | | | | | | | | |
American International Group, Inc.
3.750%, due 7/10/25 | | | 90,000 | | | | 91,672 | |
Berkshire Hathaway Finance Corp.
4.300%, due 5/15/43 | | | 170,000 | | | | 180,956 | |
Chubb INA Holdings, Inc.
3.350%, due 5/3/26 | | | 90,000 | | | | 92,053 | |
Metlife, Inc.
3.000%, due 3/1/25 | | | 90,000 | | | | 90,268 | |
Prudential Financial, Inc.
4.500%, due 11/15/20 | | | 205,000 | | | | 219,927 | |
| | | | | | | | |
| | | | | | | 674,876 | |
| | | | | | | | |
Internet 0.2% | | | | | | | | |
Amazon.com, Inc.
2.600%, due 12/5/19 | | | 175,000 | | | | 178,296 | |
| | | | | | | | |
| | |
Iron & Steel 0.1% | | | | | | | | |
Vale Overseas, Ltd.
6.875%, due 11/21/36 | | | 100,000 | | | | 107,250 | |
| | | | | | | | |
| | |
Machinery—Construction & Mining 0.1% | | | | | | | | |
Caterpillar, Inc.
5.300%, due 9/15/35 | | | 100,000 | | | | 118,523 | |
| | | | | | | | |
| | | | | | | | |
| | | Principal
Amount | | | Value | |
Machinery—Diversified 0.2% | | | | | | | | |
Deere & Co.
3.900%, due 6/9/42 | | $ | 150,000 | | | $ | 156,581 | |
| | | | | | | | |
| | |
Media 0.9% | | | | | | | | |
21st Century Fox America, Inc.
3.000%, due 9/15/22 | | | 130,000 | | | | 131,894 | |
Charter Communications Operating LLC / Charter Communications Operating Capital
4.908%, due 7/23/25 | | | 170,000 | | | | 183,654 | |
Comcast Corp. | | | | | | | | |
1.625%, due 1/15/22 | | | 140,000 | | | | 136,123 | |
3.400%, due 7/15/46 | | | 150,000 | | | | 136,590 | |
Time Warner, Inc.
3.600%, due 7/15/25 | | | 130,000 | | | | 129,705 | |
Walt Disney Co.
2.350%, due 12/1/22 | | | 130,000 | | | | 130,283 | |
| | | | | | | | |
| | | | | | | 848,249 | |
| | | | | | | | |
Mining 0.2% | | | | | | | | |
BHP Billiton Finance USA, Ltd.
3.850%, due 9/30/23 | | | 210,000 | | | | 223,492 | |
| | | | | | | | |
| | |
Miscellaneous—Manufacturing 0.2% | | | | | | | | |
General Electric Co.
4.125%, due 10/9/42 | | | 200,000 | | | | 210,480 | |
| | | | | | | | |
| | |
Multi-National 1.9% | | | | | | | | |
¨European Investment Bank | | | | | | | | |
1.250%, due 5/15/19 | | | 445,000 | | | | 442,507 | |
2.250%, due 8/15/22 | | | 450,000 | | | | 452,705 | |
¨Inter-American Development Bank | | | | | | | | |
1.000%, due 5/13/19 | | | 450,000 | | | | 445,212 | |
1.750%, due 4/14/22 | | | 450,000 | | | | 443,846 | |
| | | | | | | | |
| | | | | | | 1,784,270 | |
| | | | | | | | |
Oil & Gas 2.1% | | | | | | | | |
Anadarko Petroleum Corp.
5.550%, due 3/15/26 | | | 80,000 | | | | 89,400 | |
BP Capital Markets PLC Co.
3.588%, due 4/14/27 | | | 180,000 | | | | 182,637 | |
Canadian Natural Resources, Ltd.
6.250%, due 3/15/38 | | | 75,000 | | | | 87,415 | |
Cenovus Energy, Inc.
5.250%, due 6/15/37 (b) | | | 150,000 | | | | 140,088 | |
Chevron Corp.
3.191%, due 6/24/23 | | | 130,000 | | | | 134,548 | |
ConocoPhillips Co. | | | | | | | | |
2.875%, due 11/15/21 | | | 90,000 | | | | 91,445 | |
5.950%, due 3/15/46 | | | 70,000 | | | | 87,546 | |
Devon Energy Corp.
4.750%, due 5/15/42 | | | 100,000 | | | | 96,953 | |
| | | | | | |
The notes to the financial statements are an integral part of,
and should be read in conjunction with, the financial statements. | | | | | 11 | |
Portfolio of Investments June 30, 2017 (Unaudited) (continued)
| | | | | | | | |
| | | Principal
Amount | | | Value | |
| Corporate Bonds (continued) | |
Oil & Gas (continued) | | | | | | | | |
EOG Resources, Inc.
3.900%, due 4/1/35 | | $ | 90,000 | | | $ | 87,283 | |
Hess Corp.
7.125%, due 3/15/33 | | | 75,000 | | | | 84,724 | |
Nabors Industries, Inc.
5.000%, due 9/15/20 | | | 150,000 | | | | 149,625 | |
Occidental Petroleum Corp.
3.000%, due 2/15/27 | | | 90,000 | | | | 87,638 | |
Petroleos Mexicanos
6.500%, due 6/2/41 | | | 250,000 | | | | 248,250 | |
Shell International Finance B.V. | | | | | | | | |
2.375%, due 8/21/22 | | | 140,000 | | | | 139,193 | |
3.750%, due 9/12/46 | | | 100,000 | | | | 94,631 | |
Statoil ASA
5.100%, due 8/17/40 | | | 175,000 | | | | 201,729 | |
| | | | | | | | |
| | | | | | | 2,003,105 | |
| | | | | | | | |
Oil & Gas Services 0.1% | | | | | | | | |
Halliburton Co.
3.800%, due 11/15/25 | | | 130,000 | | | | 133,227 | |
| | | | | | | | |
| | |
Pharmaceuticals 1.3% | | | | | | | | |
AbbVie, Inc. | | | | | | | | |
3.200%, due 11/6/22 | | | 90,000 | | | | 92,309 | |
4.700%, due 5/14/45 | | | 90,000 | | | | 95,638 | |
Allergan Funding SCS
3.800%, due 3/15/25 | | | 130,000 | | | | 134,465 | |
Express Scripts Holding Co.
3.900%, due 2/15/22 | | | 90,000 | | | | 94,213 | |
Johnson & Johnson
4.950%, due 5/15/33 | | | 190,000 | | | | 229,980 | |
Merck Sharp & Dohme Corp.
5.750%, due 11/15/36 | | | 100,000 | | | | 127,002 | |
Novartis Capital Corp.
4.000%, due 11/20/45 | | | 130,000 | | | | 136,154 | |
Pfizer, Inc. | | | | | | | | |
3.000%, due 6/15/23 | | | 90,000 | | | | 92,852 | |
4.000%, due 12/15/36 | | | 100,000 | | | | 105,646 | |
Teva Pharmaceutical Finance Netherlands III B.V.
3.150%, due 10/1/26 | | | 150,000 | | | | 142,452 | |
| | | | | | | | |
| | | | | | | 1,250,711 | |
| | | | | | | | |
Pipelines 0.9% | | | | | | | | |
Enbridge, Inc.
4.500%, due 6/10/44 | | | 100,000 | | | | 97,864 | |
Energy Transfer, L.P.
4.050%, due 3/15/25 | | | 130,000 | | | | 130,522 | |
Enterprise Products Operating LLC
3.700%, due 2/15/26 | | | 130,000 | | | | 132,405 | |
Kinder Morgan, Inc.
4.300%, due 6/1/25 | | | 130,000 | | | | 135,158 | |
| | | | | | | | |
| | | Principal
Amount | | | Value | |
Pipelines (continued) | | | | | | | | |
Phillips 66 Partners, L.P.
4.680%, due 2/15/45 | | $ | 100,000 | | | $ | 95,787 | |
Plains All American Pipeline, L.P. / PAA Finance Corp.
3.650%, due 6/1/22 | | | 90,000 | | | | 91,814 | |
Transcanada Pipelines, Ltd.
4.875%, due 1/15/26 | | | 80,000 | | | | 89,484 | |
Williams Partners, L.P.
3.350%, due 8/15/22 | | | 90,000 | | | | 90,483 | |
| | | | | | | | |
| | | | | | | 863,517 | |
| | | | | | | | |
Real Estate 0.1% | | | | | | | | |
Prologis, L.P.
3.750%, due 11/1/25 | | | 90,000 | | | | 93,695 | |
| | | | | | | | |
| | |
Real Estate Investment Trusts 0.6% | | | | | | | | |
American Tower Corp.
5.000%, due 2/15/24 | | | 80,000 | | | | 88,395 | |
AvalonBay Communities, Inc.
2.900%, due 10/15/26 | | | 90,000 | | | | 87,050 | |
Boston Properties, L.P.
5.625%, due 11/15/20 | | | 200,000 | | | | 219,594 | |
Simon Property Group, L.P.
3.375%, due 6/15/27 | | | 130,000 | | | | 129,571 | |
| | | | | | | | |
| | | | | | | 524,610 | |
| | | | | | | | |
Retail 1.0% | | | | | | | | |
CVS Health Corp.
2.750%, due 12/1/22 | | | 130,000 | | | | 130,162 | |
Home Depot, Inc.
4.250%, due 4/1/46 | | | 170,000 | | | | 182,389 | |
Lowe’s Cos., Inc. | | | | | | | | |
1.150%, due 4/15/19 | | | 225,000 | | | | 222,624 | |
3.375%, due 9/15/25 | | | 90,000 | | | | 92,965 | |
McDonald’s Corp.
3.375%, due 5/26/25 | | | 130,000 | | | | 132,960 | |
Wal-Mart Stores, Inc. | | | | | | | | |
3.300%, due 4/22/24 | | | 90,000 | | | | 93,974 | |
4.300%, due 4/22/44 | | | 80,000 | | | | 88,608 | |
| | | | | | | | |
| | | | | | | 943,682 | |
| | | | | | | | |
Semiconductors 0.4% | | | | | | | | |
Applied Materials, Inc.
5.100%, due 10/1/35 | | | 100,000 | | | | 117,605 | |
Broadcom Corp. / Broadcom Cayman Finance Co.
3.000%, due 1/15/22 (b) | | | 90,000 | | | | 90,804 | |
Intel Corp.
3.700%, due 7/29/25 | | | 90,000 | | | | 94,485 | |
QUALCOMM, Inc.
4.650%, due 5/20/35 | | | 100,000 | | | | 108,978 | |
| | | | | | | | |
| | | | | | | 411,872 | |
| | | | | | | | |
| | | | |
| 12 | | MainStay VP Indexed Bond Portfolio | | The notes to the financial statements are an integral part of,
and should be read in conjunction with, the financial statements. |
| | | | | | | | |
| | | Principal
Amount | | | Value | |
| Corporate Bonds (continued) | |
Software 0.8% | | | | | | | | |
Fidelity National Information Services, Inc.
3.500%, due 4/15/23 | | $ | 90,000 | | | $ | 93,518 | |
Microsoft Corp. | | | | | | | | |
2.400%, due 2/6/22 | | | 130,000 | | | | 131,222 | |
3.300%, due 2/6/27 | | | 130,000 | | | | 133,909 | |
4.250%, due 2/6/47 | | | 130,000 | | | | 140,745 | |
Oracle Corp. | | | | | | | | |
4.000%, due 7/15/46 | | | 90,000 | | | | 90,891 | |
5.375%, due 7/15/40 | | | 150,000 | | | | 182,432 | |
| | | | | | | | |
| | | | | | | 772,717 | |
| | | | | | | | |
Telecommunications 1.8% | | | | | | | | |
AT&T, Inc. | | | | | | | | |
3.200%, due 3/1/22 | | | 130,000 | | | | 131,586 | |
4.250%, due 3/1/27 | | | 130,000 | | | | 134,414 | |
5.450%, due 3/1/47 | | | 130,000 | | | | 139,948 | |
Cisco Systems, Inc.
2.950%, due 2/28/26 | | | 130,000 | | | | 130,033 | |
Deutsche Telekom International Finance B.V.
8.750%, due 6/15/30 | | | 100,000 | | | | 148,308 | |
Orange S.A.
5.375%, due 7/8/19 | | | 205,000 | | | | 218,164 | |
Telefonica Emisiones SAU | | | | | | | | |
3.192%, due 4/27/18 | | | 215,000 | | | | 217,273 | |
7.045%, due 6/20/36 | | | 100,000 | | | | 131,366 | |
Verizon Communications, Inc. | | | | | | | | |
3.125%, due 3/16/22 | | | 130,000 | | | | 131,919 | |
4.125%, due 3/16/27 | | | 130,000 | | | | 134,261 | |
5.500%, due 3/16/47 | | | 200,000 | | | | 218,633 | |
| | | | | | | | |
| | | | | | | 1,735,905 | |
| | | | | | | | |
Transportation 0.9% | | | | | | | | |
Burlington Northern Santa Fe LLC
3.250%, due 6/15/27 | | | 90,000 | | | | 91,942 | |
CSX Corp.
3.700%, due 11/1/23 | | | 80,000 | | | | 84,106 | |
Fedex Corp.
2.625%, due 8/1/22 | | | 130,000 | | | | 130,623 | |
Norfolk Southern Corp.
4.800%, due 8/15/43 | | | 80,000 | | | | 89,872 | |
Union Pacific Corp.
2.250%, due 2/15/19 | | | 220,000 | | | | 222,003 | |
United Parcel Service, Inc.
5.125%, due 4/1/19 | | | 210,000 | | | | 221,999 | |
| | | | | | | | |
| | | | | | | 840,545 | |
| | | | | | | | |
Total Corporate Bonds
(Cost $27,805,573) | | | | | | | 27,948,604 | |
| | | | | | | | |
| | | | | | | | |
| | | Principal
Amount | | | Value | |
| Foreign Government Bonds 1.3% | | | | | |
Foreign Governments 1.3% | | | | | | | | |
Export Development Canada
1.250%, due 2/4/19 | | $ | 445,000 | | | $ | 443,177 | |
Korea Development Bank
2.250%, due 5/18/20 | | | 220,000 | | | | 219,013 | |
Philippine Government International Bond
5.000%, due 1/13/37 | | | 200,000 | | | | 237,334 | |
Republic of Colombia
6.125%, due 1/18/41 | | | 100,000 | | | | 115,300 | |
United Mexican States
4.125%, due 1/21/26 | | | 200,000 | | | | 207,900 | |
| | | | | | | | |
Total Foreign Government Bonds
(Cost $1,222,653) | | | | | | | 1,222,724 | |
| | | | | | | | |
| |
| Mortgage-Backed Securities 1.7% | | | | | |
Commercial Mortgage Loans
(Collateralized Mortgage Obligations) 1.7% | | | | | |
CFCRE Commercial Mortgage Trust
Series 2017-C8, Class A3
3.305%, due 6/15/50 | | | 200,000 | | | | 200,310 | |
Citigroup Commercial Mortgage Trust
Series 2015-GC35, Class A4
3.818%, due 11/10/48 | | | 300,000 | | | | 314,820 | |
¨ GS Mortgage Securities Trust | | | | | | | | |
Series 2016-GS3, Class A4
| | | | | | | | |
2.850%, due 10/10/49 | | | 300,000 | | | | 293,246 | |
Series 2014-GC22, Class A5
| | | | | | | | |
3.862%, due 6/10/47 | | | 300,000 | | | | 316,480 | |
Morgan Stanley Bank of America
Merrill Lynch Trust
Series 2013-C7, Class A4
2.918%, due 2/15/46 | | | 300,000 | | | | 304,100 | |
WFRBS Commercial Mortgage Trust
Series 2012-C8, Class A3
3.001%, due 8/15/45 | | | 200,000 | | | | 204,275 | |
| | | | | | | | |
Total Mortgage-Backed Securities
(Cost $1,635,469) | | | | | | | 1,633,231 | |
| | | | | | | | |
| |
| U.S. Government & Federal Agencies 66.2% | | | | | |
Federal Home Loan Bank 0.6% | | | | | | | | |
1.375%, due 3/18/19 | | | 550,000 | | | | 549,759 | |
| | | | | | | | |
|
¨ Federal Home Loan Mortgage Corporation
(Mortgage Pass-Through Securities) 8.5% | |
1.375%, due 4/20/20 | | | 500,000 | | | | 497,042 | |
2.500%, due 2/1/32 | | | 696,343 | | | | 700,830 | |
3.000%, due 4/1/32 | | | 396,861 | | | | 407,863 | |
3.000%, due 9/1/36 | | | 190,153 | | | | 193,508 | |
3.000%, due 9/1/46 | | | 1,689,039 | | | | 1,686,480 | |
| | | | | | |
The notes to the financial statements are an integral part of,
and should be read in conjunction with, the financial statements. | | | | | 13 | |
Portfolio of Investments June 30, 2017 (Unaudited) (continued)
| | | | | | | | |
| | | Principal
Amount | | | Value | |
| U.S. Government & Federal Agencies (continued) | |
Federal Home Loan Mortgage Corporation
(Mortgage Pass-Through Securities) (continued) | |
3.000%, due 12/1/46 | | $ | 99,990 | | | $ | 99,839 | |
3.500%, due 12/1/25 | | | 97,210 | | | | 101,309 | |
3.500%, due 2/1/37 | | | 292,443 | | | | 303,723 | |
3.500%, due 8/1/46 | | | 1,784,477 | | | | 1,834,674 | |
4.000%, due 6/1/19 | | | 92,321 | | | | 95,598 | |
4.000%, due 4/1/46 | | | 984,291 | | | | 1,035,974 | |
4.500%, due 10/1/46 | | | 386,558 | | | | 414,141 | |
5.000%, due 11/1/41 | | | 198,925 | | | | 217,903 | |
5.000%, due 2/1/42 | | | 210,655 | | | | 229,450 | |
5.500%, due 7/1/38 | | | 199,559 | | | | 221,268 | |
| | | | | | | | |
| | | | | | | 8,039,602 | |
| | | | | | | | |
¨ Federal National Mortgage Association 0.8% | | | | | |
1.875%, due 4/5/22 | | | 300,000 | | | | 299,058 | |
1.875%, due 9/24/26 | | | 500,000 | | | | 474,072 | |
| | | | | | | | |
| | | | | | | 773,130 | |
| | | | | | | | |
¨ Federal National Mortgage Association
(Mortgage Pass-Through Securities) 12.6% | |
2.500%, due 1/1/32 | | | 994,967 | | | | 1,000,824 | |
2.500%, due 4/1/46 | | | 99,810 | | | | 96,304 | |
3.000%, due 1/1/32 | | | 688,890 | | | | 707,536 | |
3.000%, due 5/1/32 | | | 100,000 | | | | 102,706 | |
3.000%, due 2/1/37 | | | 293,325 | | | | 298,384 | |
3.000%, due 12/1/46 | | | 2,587,314 | | | | 2,585,649 | |
3.000%, due 4/1/47 | | | 100,000 | | | | 99,935 | |
3.500%, due 3/1/22 | | | 191,347 | | | | 199,214 | |
3.500%, due 10/1/46 | | | 2,858,542 | | | | 2,937,720 | |
4.000%, due 5/1/19 | | | 94,365 | | | | 97,690 | |
4.000%, due 2/1/37 | | | 94,455 | | | | 100,354 | |
4.000%, due 5/1/46 | | | 1,649,768 | | | | 1,735,085 | |
4.000%, due 9/1/46 | | | 200,000 | | | | 210,343 | |
4.000%, due 7/1/47 TBA (c) | | | 100,000 | | | | 105,238 | |
4.500%, due 4/1/47 | | | 698,405 | | | | 749,443 | |
5.000%, due 6/1/39 | | | 291,853 | | | | 318,612 | |
5.500%, due 6/1/36 | | | 373,056 | | | | 415,773 | |
5.500%, due 5/1/44 | | | 183,911 | | | | 205,930 | |
| | | | | | | | |
| | | | | | | 11,966,740 | |
| | | | | | | | |
¨ Government National Mortgage Association
(Mortgage Pass-Through Securities) 7.9% | |
2.500%, due 4/20/47 | | | 99,804 | | | | 97,431 | |
3.000%, due 6/15/45 | | | 97,107 | | | | 98,229 | |
3.000%, due 9/20/46 | | | 100,000 | | | | 101,113 | |
3.000%, due 1/20/47 | | | 2,089,711 | | | | 2,112,984 | |
3.500%, due 4/15/45 | | | 99,834 | | | | 103,494 | |
3.500%, due 7/20/46 | | | 100,000 | | | | 103,687 | |
3.500%, due 10/20/46 | | | 100,000 | | | | 103,687 | |
3.500%, due 11/20/46 | | | 2,469,565 | | | | 2,560,622 | |
4.000%, due 8/15/46 | | | 195,848 | | | | 206,173 | |
4.000%, due 12/20/46 | | | 100,010 | | | | 105,322 | |
4.000%, due 1/20/47 | | | 992,513 | | | | 1,045,472 | |
4.500%, due 8/15/46 | | | 153,072 | | | | 164,075 | |
| | | | | | | | |
| | | Principal
Amount | | | Value | |
Government National Mortgage Association
(Mortgage Pass-Through Securities) (continued) | |
4.500%, due 8/20/46 | | $ | 293,357 | | | $ | 311,946 | |
5.000%, due 8/20/45 | | | 290,856 | | | | 312,126 | |
5.000%, due 4/15/47 | | | 99,809 | | | | 109,788 | |
| | | | | | | | |
| | | | | | | 7,536,149 | |
| | | | | | | | |
¨ United States Treasury Bonds 6.9% | | | | | | | | |
2.875%, due 5/15/43 | | | 1,950,000 | | | | 1,968,892 | |
2.875%, due 11/15/46 | | | 140,000 | | | | 140,771 | |
3.000%, due 2/15/47 | | | 425,000 | | | | 438,414 | |
3.625%, due 2/15/44 | | | 1,000,000 | | | | 1,152,305 | |
4.500%, due 2/15/36 | | | 1,275,000 | | | | 1,645,746 | |
4.625%, due 2/15/40 | | | 750,000 | | | | 988,945 | |
5.375%, due 2/15/31 | | | 150,000 | | | | 201,598 | |
| | | | | | | | |
| | | | | | | 6,536,671 | |
| | | | | | | | |
¨ United States Treasury Notes 28.9% | | | | | | | | |
0.875%, due 5/31/18 | | | 1,350,000 | | | | 1,345,148 | |
1.250%, due 4/30/19 | | | 1,175,000 | | | | 1,172,108 | |
1.250%, due 5/31/19 | | | 200,000 | | | | 199,516 | |
1.250%, due 6/30/19 | | | 700,000 | | | | 698,086 | |
1.500%, due 4/15/20 | | | 5,900,000 | | | | 5,895,852 | |
1.500%, due 5/15/20 | | | 2,500,000 | | | | 2,497,167 | |
1.500%, due 6/15/20 | | | 3,025,000 | | | | 3,020,747 | |
1.750%, due 6/30/22 | | | 1,825,000 | | | | 1,813,167 | |
1.875%, due 4/30/22 | | | 1,725,000 | | | | 1,724,664 | |
2.000%, due 4/30/24 | | | 4,475,000 | | | | 4,441,612 | |
2.250%, due 2/15/27 | | | 425,000 | | | | 423,025 | |
2.375%, due 5/15/27 | | | 375,000 | | | | 377,373 | |
2.625%, due 4/30/18 | | | 3,800,000 | | | | 3,841,412 | |
| | | | | | | | |
| | | | | | | 27,449,877 | |
| | | | | | | | |
Total U.S. Government & Federal Agencies
(Cost $62,807,838) | | | | | | | 62,851,928 | |
| | | | | | | | |
Total Long-Term Bonds
(Cost $93,973,375) | | | | | | | 94,158,136 | |
| | | | | | | | |
|
| Short-Term Investment 0.9% | |
Repurchase Agreement 0.9% | | | | | | | | |
Fixed Income Clearing Corp.
0.12%, dated 6/30/17
due 7/3/17
Proceeds at Maturity $799,318
(Collateralized by a United States Treasury Note with a rate of 1.125% and a maturity date of 8/31/21, with a Principal Amount of $835,000 and a Market Value of $817,200) | | | 799,310 | | | | 799,310 | |
| | | | | | | | |
Total Short-Term Investment
(Cost $799,310) | | | | | | | 799,310 | |
| | | | | | | | |
Total Investments
(Cost $94,772,685) (d) | | | 100.0 | % | | | 94,957,446 | |
Other Assets, Less Liabilities | | | (0.0 | )‡ | | | (25,586 | ) |
Net Assets | | | 100.0 | % | | $ | 94,931,860 | |
| | | | |
| 14 | | MainStay VP Indexed Bond Portfolio | | The notes to the financial statements are an integral part of,
and should be read in conjunction with, the financial statements. |
| ‡ | Less than one-tenth of a percent. |
| (a) | Floating rate—Rate shown was the rate in effect as of June 30, 2017. |
| (b) | May be sold to institutional investors only under Rule 144A or securities offered pursuant to Section 4(a)(2) of the Securities Act of 1933, as amended. |
| (c) | TBA—Securities purchased on a forward commitment basis with an approximate principal amount and maturity date. The actual principal amount and maturity date will be determined upon settlement. As of |
| | June 30, 2017, the total net market value of this security was $105,238, which represented 0.1% of the Portfolio’s net assets. All or a portion of this security is a part of a mortgage dollar roll agreement. |
| (d) | As of June 30, 2017, cost was $94,772,686 for federal income tax purposes and net unrealized appreciation was as follows: |
| | | | |
Gross unrealized appreciation | | $ | 337,691 | |
Gross unrealized depreciation | | | (152,931 | ) |
| | | | |
Net unrealized appreciation | | $ | 184,760 | |
| | | | |
As of June 30, 2017, the Portfolio held the following futures contracts1:
| | | | | | | | | | | | | | | | |
Type | | Number of
Contracts
Long
(Short) | | | Expiration Date | | | Notional
Amount | | | Unrealized
Appreciation
(Depreciation)2 | |
| 2-Year United States Treasury Note | | | 11 | | | | September 2017 | | | $ | 2,377,203 | | | $ | (1,665 | ) |
| 5-Year United States Treasury Note | | | 4 | | | | September 2017 | | | | 471,344 | | | | (390 | ) |
| 10-Year United States Treasury Note | | | 5 | | | | September 2017 | | | | 627,656 | | | | 216 | |
| United States Treasury Long Bond | | | (6 | ) | | | September 2017 | | | | (922,125 | ) | | | (10,054 | ) |
| | | | | | | | | | | | | | | | |
| | | $ | 2,554,078 | | | $ | (11,893 | ) |
| | | | | | | | | | | | | | | | |
| 1. | As of June 30, 2017, cash in the amount of $9,446 was on deposit with a broker or futures commission merchant for futures transactions. |
| 2. | Represents the difference between the value of the contracts at the time they were opened and the value as of June 30, 2017. |
The following is a summary of the fair valuations according to the inputs used as of June 30, 2017, for valuing the Portfolio’s assets and liabilities.
Asset Valuation Inputs
| | | | | | | | | | | | | | | | |
Description | | Quoted
Prices in
Active
Markets for
Identical
Assets (Level 1) | | | Significant
Other
Observable
Inputs (Level 2) | | | Significant
Unobservable
Inputs (Level 3) | | | Total | |
| Investments in Securities (a) | | | | | | | | | | | | | | | | |
| Long-Term Bonds | | | | | | | | | | | | | | | | |
Asset-Backed Securities | | $ | — | | | $ | 501,649 | | | $ | — | | | $ | 501,649 | |
Corporate Bonds | | | — | | | | 27,948,604 | | | | — | | | | 27,948,604 | |
Foreign Government Bonds | | | — | | | | 1,222,724 | | | | — | | | | 1,222,724 | |
Mortgage-Backed Securities | | | — | | | | 1,633,231 | | | | — | | | | 1,633,231 | |
U.S. Government & Federal Agencies | | | — | | | | 62,851,928 | | | | — | | | | 62,851,928 | |
| | | | | | | | | | | | | | | | |
| Total Long-Term Bonds | | | — | | | | 94,158,136 | | | | — | | | | 94,158,136 | |
| | | | | | | | | | | | | | | | |
| Short-Term Investment | | | | | | | | | | | | | | | | |
Repurchase Agreement | | | — | | | | 799,310 | | | | — | | | | 799,310 | |
| | | | | | | | | | | | | | | | |
| Total Investments in Securities | | | — | | | | 94,957,446 | | | | — | | | | 94,957,446 | |
| | | | | | | | | | | | | | | | |
| Other Financial Instruments | | | | | | | | | | | | | | | | |
Futures Contracts (b) | | | 216 | | | | — | | | | — | | | | 216 | |
| | | | | | | | | | | | | | | | |
| Total Investments in Securities and Other Financial Instruments | | $ | 216 | | | $ | 94,957,446 | | | $ | — | | | $ | 94,957,662 | |
| | | | | | | | | | | | | | | | |
| | | | | | |
The notes to the financial statements are an integral part of,
and should be read in conjunction with, the financial statements. | | | | | 15 | |
Portfolio of Investments June 30, 2017 (Unaudited) (continued)
Liability Valuation Inputs
| | | | | | | | | | | | | | | | |
Description | | Quoted
Prices in
Active
Markets for
Identical
Assets (Level 1) | | | Significant
Other
Observable
Inputs (Level 2) | | | Significant
Unobservable
Inputs (Level 3) | | | Total | |
| Other Financial Instruments | | | | | | | | | | | | | | | | |
Futures Contracts (b) | | $ | (12,109 | ) | | $ | — | | | $ | — | | | $ | (12,109 | ) |
| | | | | | | | | | | | | | | | |
| (a) | For a complete listing of investments and their industries, see the Portfolio of Investments. |
| (b) | The value listed for these securities reflects unrealized appreciation (depreciation) as shown on the Portfolio of Investments. |
The Portfolio recognizes transfers between the levels as of the beginning of the period.
For the period ended June 30, 2017, the Portfolio did not have any transfers between among levels. (See Note 2)
As of June 30, 2017, the Portfolio did not hold any investments with significant unobservable inputs (Level 3). (See Note 2)
| | | | |
| 16 | | MainStay VP Indexed Bond Portfolio | | The notes to the financial statements are an integral part of,
and should be read in conjunction with, the financial statements. |
Statement of Assets and Liabilities as of June 30, 2017 (Unaudited)
| | | | |
| Assets | |
Investment in securities, at value
(identified cost $94,772,685) | | $ | 94,957,446 | |
Cash collateral on deposit at broker | | | 9,446 | |
Receivables: | | | | |
Investment securities sold | | | 602,398 | |
Interest | | | 500,823 | |
Fund shares sold | | | 76,312 | |
Variation margin on futures contracts | | | 298 | |
Other assets | | | 6,496 | |
| | | | |
Total assets | | | 96,153,219 | |
| | | | |
| |
| Liabilities | | | | |
Payables: | | | | |
Investment securities purchased | | | 1,183,290 | |
Manager (See Note 3) | | | 19,666 | |
Professional fees | | | 13,314 | |
Shareholder communication | | | 2,507 | |
Offering costs | | | 1,059 | |
Custodian | | | 681 | |
Trustees | | | 290 | |
NYLIFE Distributors (See Note 3) | | | 61 | |
Fund shares redeemed | | | 4 | |
Accrued expenses | | | 487 | |
| | | | |
Total liabilities | | | 1,221,359 | |
| | | | |
Net assets | | $ | 94,931,860 | |
| | | | |
| |
| Composition of Net Assets | | | | |
Shares of beneficial interest outstanding (par value of $.001 per share) unlimited number of shares authorized | | $ | 9,450 | |
Additional paid-in capital | | | 94,461,764 | |
| | | | |
| | | 94,471,214 | |
Undistributed net investment income | | | 286,375 | |
Accumulated net realized gain (loss) on investments and futures transactions | | | 1,403 | |
Net unrealized appreciation (depreciation) on investments and futures contracts | | | 172,868 | |
| | | | |
Net assets | | $ | 94,931,860 | |
| | | | |
| | | | |
Initial Class | | | | |
Net assets applicable to outstanding shares | | $ | 94,478,079 | |
| | | | |
Shares of beneficial interest outstanding | | | 9,404,600 | |
| | | | |
Net asset value per share outstanding | | $ | 10.05 | |
| | | | |
Service Class | | | | |
Net assets applicable to outstanding shares | | $ | 453,781 | |
| | | | |
Shares of beneficial interest outstanding | | | 45,185 | |
| | | | |
Net asset value per share outstanding | | $ | 10.04 | |
| | | | |
| | | | | | |
The notes to the financial statements are an integral part of,
and should be read in conjunction with, the financial statements. | | | | | 17 | |
Statement of Operations for the period May 1, 2017 (inception date) through June 30, 2017 (Unaudited)
| | | | |
| Investment Income (Loss) | |
Income | | | | |
Interest | | $ | 343,865 | |
| | | | |
Expenses | | | | |
Manager (See Note 3) | | | 38,811 | |
Professional fees | | | 13,316 | |
Shareholder communication | | | 2,507 | |
Offering (See Note 2) | | | 1,304 | |
Custodian | | | 681 | |
Trustees | | | 290 | |
Distribution/Service—Service Class (See Note 3) | | | 91 | |
Miscellaneous | | | 490 | |
| | | | |
Total expenses | | | 57,490 | |
| | | | |
Net investment income (loss) | | | 286,375 | |
| | | | |
|
| Realized and Unrealized Gain (Loss) on Investments and Futures Contracts | |
Net realized gain (loss) on: | | | | |
Investment transactions | | | 7,617 | |
Futures transactions | | | (6,214 | ) |
| | | | |
Net realized gain (loss) on investments and futures transactions | | | 1,403 | |
| | | | |
Net change in unrealized appreciation (depreciation) on: | | | | |
Investments | | | 184,761 | |
Futures contracts | | | (11,893 | ) |
| | | | |
Net change in unrealized appreciation (depreciation) on investments and futures contracts | | | 172,868 | |
| | | | |
Net realized and unrealized gain (loss) on investments and futures transactions | | | 174,271 | |
| | | | |
Net increase (decrease) in net assets resulting from operations | | $ | 460,646 | |
| | | | |
| | | | |
| 18 | | MainStay VP Indexed Bond Portfolio | | The notes to the financial statements are an integral part of,
and should be read in conjunction with, the financial statements. |
Statements of Changes in Net Assets
for the period May 1, 2017 (inception date) through June 30, 2017 (Unaudited)
| | | | |
| | | 2017 | |
| Increase (Decrease) in Net Assets | |
Operations: | | | | |
Net investment income (loss) | | $ | 286,375 | |
Net realized gain (loss) on investments and futures transactions | | | 1,403 | |
Net change in unrealized appreciation (depreciation) on investments and futures contracts | | | 172,868 | |
| | | | |
Net increase (decrease) in net assets resulting from operations | | | 460,646 | |
| | | | |
Capital share transactions: | | | | |
Net proceeds from sale of shares | | | 96,432,913 | |
Cost of shares redeemed | | | (1,961,699 | ) |
| | | | |
Increase (decrease) in net assets derived from capital share transactions | | | 94,471,214 | |
| | | | |
Net increase (decrease) in net assets | | | 94,931,860 | |
|
| Net Assets | |
Beginning of period | | | — | |
| | | | |
End of period | | $ | 94,931,860 | |
| | | | |
Undistributed net investment income at end of period | | $ | 286,375 | |
| | | | |
| | | | | | |
The notes to the financial statements are an integral part of,
and should be read in conjunction with, the financial statements. | | | | | 19 | |
Financial Highlights selected per share data and ratios
| | | | |
| Initial Class | | May 1,
2017**
through
June 30,
2017* | |
Net asset value at beginning of period | | $ | 10.00 | |
| | | | |
Net investment income (loss) (a) | | | 0.03 | |
Net realized and unrealized gain (loss) on investments | | | 0.02 | |
| | | | |
Total from investment operations | | | 0.05 | |
| | | | |
Net asset value at end of period | | $ | 10.05 | |
| | | | |
Total investment return (b)(c) | | | 0.50 | % |
| Ratios (to average net assets)/Supplemental Data: | | | | |
Net investment income (loss) | | | 1.84 | %†† |
Net expenses | | | 0.37 | %†† |
Portfolio turnover rate (d) | | | 58 | % |
Net assets at end of period (in 000’s) | | $ | 94,478 | |
| (a) | Per share data based on average shares outstanding during the period. |
| (b) | Total return does not reflect any deduction of sales charges, mortality and expense charges, contract charges or administrative charges. For periods of less than one year, total return is not annualized. |
| (c) | Total investment return may reflect adjustments to conform to generally accepted accounting principles. |
| (d) | The portfolio turnover rate not including mortgage dollar rolls was 29% for the period ended June 30, 2017. |
| | | | |
| Service Class | | May 1,
2017**
through
June 30,
2017* | |
Net asset value at beginning of period | | $ | 10.00 | |
| | | | |
Net investment income (loss) (a) | | | 0.03 | |
Net realized and unrealized gain (loss) on investments | | | 0.01 | |
| | | | |
Total from investment operations | | | 0.04 | |
| | | | |
Net asset value at end of period | | $ | 10.04 | |
| | | | |
Total investment return (b)(c) | | | 0.40 | % |
| Ratios (to average net assets)/Supplemental Data: | | | | |
Net investment income (loss) | | | 1.76 | %†† |
Net expenses | | | 0.62 | %†† |
Portfolio turnover rate (d) | | | 58 | % |
Net assets at end of period (in 000’s) | | $ | 454 | |
| (a) | Per share data based on average shares outstanding during the period. |
| (b) | Total investment return may reflect adjustments to conform to generally accepted accounting principles. |
| (c) | Total return does not reflect any deduction of sales charges, mortality and expense charges, contract charges or administrative charges. For periods of less than one year, total return is not annualized. |
| (d) | The portfolio turnover rate not including mortgage dollar rolls was 29% for the period ended June 30, 2017. |
| | | | |
| 20 | | MainStay VP Indexed Bond Portfolio | | The notes to the financial statements are an integral part of,
and should be read in conjunction with, the financial statements. |
Notes to Financial Statements (Unaudited)
Note 1–Organization and Business
MainStay VP Funds Trust (the “Fund”) was organized as a Delaware statutory trust on February 1, 2011. The Fund is registered under the Investment Company Act of 1940, as amended (the “1940 Act”), as an open-end management investment company. The Fund is comprised of thirty-two separate series (collectively referred to as the “Portfolios”). These financial statements and notes relate to the MainStay VP Indexed Bond Portfolio (the “Portfolio”), a “diversified” portfolio, as that term is defined in the 1940 Act, as interpreted or modified by regulatory authorities having jurisdiction, from time to time.
Shares of the Portfolio are currently offered to certain separate accounts to fund variable annuity policies and variable universal life insurance policies issued by New York Life Insurance and Annuity Corporation (“NYLIAC”), a wholly-owned subsidiary of New York Life Insurance Company (“New York Life”). NYLIAC allocates shares of the Portfolios to, among others, NYLIAC Variable Annuity Separate Accounts-I, II, III and IV, VUL Separate Account-I and CSVUL Separate Account-I (collectively, the “Separate Accounts”). Shares of the Portfolio are also offered to the MainStay VP Conservative Allocation Portfolio, MainStay VP Moderate Allocation Portfolio, MainStay VP Moderate Growth Allocation Portfolio and MainStay VP Growth Allocation Portfolio, which operate as “funds-of-funds.”
The Portfolio currently offers two classes of shares. Initial and Service Class shares commenced operations on May 1, 2017. Shares of the Portfolio are sold and are redeemed at a price equal to their respective net asset value (“NAV”) per share. No sales or redemption charge is applicable to the purchase or redemption of the Portfolio’s shares. Under the terms of the Fund’s multiple class plan, adopted pursuant to Rule 18f-3 under the 1940 Act, the classes differ in that, among other things, Service Class shares of the Portfolio pay a combined distribution and service fee of 0.25% of average daily net assets attributable to Service Class shares of the Portfolio to the Distributor (as defined in Note 3(B)) pursuant to a plan adopted in accordance with Rule 12b-1 under the 1940 Act. Contract owners of variable annuity contracts purchased after June 2, 2003, are permitted to invest only in the Service Class shares.
The Portfolio’s investment objective is to seek investment results that correspond to the total return performance of fixed-income securities in the aggregate, as represented by the Portfolio’s primary benchmark index.
Note 2–Significant Accounting Policies
The Portfolio is an investment company and accordingly follows the investment company accounting and reporting guidance of the Financial Accounting Standards Board (“FASB”) Accounting Standard Codification Topic 946 Financial Services—Investment Companies. The Portfolio prepares its financial statements in accordance with generally accepted accounting principles (“GAAP”) in the United States of America and follows the significant accounting policies described below.
(A) Securities Valuation. Investments are usually valued as of the close of regular trading on the New York Stock Exchange (the “Exchange”) (usually 4:00 p.m. Eastern time) on each day the Portfolio is open for business (“valuation date”).
The Board of Trustees (the “Board”) of the Fund adopted procedures establishing methodologies for the valuation of the Portfolio’s securities and other assets and delegated the responsibility for valuation determinations under those procedures to the Valuation Committee of the Fund (the “Valuation Committee”). The Board authorized the Valuation Committee to appoint a Valuation Sub-Committee (the “Sub-Committee”) to deal in the first instance with establishing the prices of securities for which market quotations are not readily available or the prices of which are not otherwise readily determinable under these procedures. The Sub-Committee meets (in person, via electronic mail or via teleconference) on an as-needed basis. Subsequently, the Valuation Committee meets to ensure that actions taken by the Sub-Committee were appropriate. The procedures recognize that, subject to the oversight of the Board and unless otherwise noted, the responsibility for the day-to-day valuation of portfolio assets (including fair value measurements for the Portfolio’s assets and liabilities) rests with New York Life Investment Management LLC (“New York Life Investments” or the “Manager”), aided to whatever extent necessary by the Subadvisor (as defined in Note 3(A)) to the Portfolio.
To assess the appropriateness of security valuations, the Manager, the Subadvisor or the Portfolio’s third party service provider, who is subject to oversight by the Manager, regularly compares prior day prices, prices on comparable securities, and the sale prices to the prior and current day prices and challenges prices with changes exceeding certain tolerance levels with third party pricing services or broker sources. For those securities valued through either a standardized fair valuation methodology or a fair valuation measurement, the Sub-Committee deals in the first instance with such valuation and the Valuation Committee reviews and affirms, if appropriate, the reasonableness of the valuation based on such methodologies and measurements on a regular basis after considering all relevant information that is reasonably available. Any action taken by the Sub-Committee with respect to the valuation of a portfolio security or other asset is submitted by the Valuation Committee to the Board for its review and ratification, if appropriate, at its next regularly scheduled meeting.
“Fair value” is defined as the price the Portfolio would reasonably expect to receive upon selling an asset or liability in an orderly transaction to an independent buyer in the principal or most advantageous market for the asset or liability. Fair value measurements are determined within a framework that establishes a three-tier hierarchy which maximizes the use of observable market data and minimizes the use of unobservable inputs to establish a classification of fair value measurements for disclosure purposes. “Inputs” refer broadly to the assumptions that market participants would use in pricing the asset or liability, including assumptions about risk, such as the risk inherent in a particular valuation technique used to measure fair value using a pricing model and/or the risk inherent in the inputs for the valuation technique. Inputs may be observable or unobservable. Observable inputs reflect the assumptions market participants would use in pricing the asset or liability based on market data obtained from sources independent of the Portfolio. Unobservable inputs reflect the Portfolio’s own assumptions about the assumptions market participants would use in pricing the asset or liability based on the information available. The inputs or methodology used for valuing assets or liabilities may not be an indication of the risks
Notes to Financial Statements (Unaudited) (continued)
associated with investing in those assets or liabilities. The three-tier hierarchy of inputs is summarized below.
| • | | Level 1—quoted prices in active markets for an identical asset or liability |
| • | | Level 2—other significant observable inputs (including quoted prices for a similar asset or liability in active markets, interest rates and yield curves, prepayment speeds, credit risk, etc.) |
| • | | Level 3—significant unobservable inputs (including the Portfolio’s own assumptions about the assumptions that market participants would use in measuring fair value of an asset or liability) |
The level of an asset or liability within the fair value hierarchy is based on the lowest level of an input, both individually and in the aggregate, that is significant to the fair value measurement. As of June 30, 2017, the aggregate value by input level of the Portfolio’s assets and liabilities is included at the end of the Portfolio’s Portfolio of Investments.
The Portfolio may use third party vendor evaluations, whose prices may be derived from one or more of the following standard inputs, among others:
| | |
• Benchmark yields | | • Reported trades |
• Broker/dealer quotes | | • Issuer spreads |
• Two-sided markets | | • Benchmark securities |
• Bids/offers | | • Reference data (corporate actions or material event notices) |
• Industry and economic events | | • Comparable bonds |
• Equity and credit default swap curves | | • Monthly payment information |
An asset or liability for which market values cannot be measured using the methodologies described above is valued by methods deemed reasonable in good faith by the Valuation Committee, following the procedures established by the Board, to represent fair value. Under these procedures, the Portfolio generally uses a market-based approach which may use related or comparable assets or liabilities, recent transactions, market multiples, book values, and other relevant information. The Portfolio may also use an income-based valuation approach in which the anticipated future cash flows of the asset or liability are discounted to calculate fair value. Discounts may also be applied due to the nature and/or duration of any restrictions on the disposition of the asset or liability. Fair value represents a good faith approximation of the value of a security. Fair value determinations involve the consideration of a number of subjective factors, an analysis of applicable facts and circumstances and the exercise of judgment. As a result, it is possible that the fair value for a security determined in good faith in accordance with the Portfolio’s valuation procedures may differ from valuations for the same security determined by other funds using their own valuation procedures. Although the Portfolio’s valuation procedures are designed to value a security at the price the Portfolio may reasonably expect to receive upon the security’s sale in an orderly transaction, there can be no assurance that any fair value determination thereunder would, in fact, approximate the amount that the Portfolio would actually realize upon the sale of the security or the price at which the security would trade if a reliable market price were readily available. During the period ended June 30, 2017, there were no material changes to the fair value methodologies.
Securities which may be valued in this manner include, but are not limited to: (i) a security for which trading has been halted or suspended; (ii) a debt security that has recently gone into default and for which there is not a current market quotation; (iii) a security of an issuer that has entered into a restructuring; (iv) a security that has been de-listed from a national exchange; (v) a security for which the market price is not readily available from a third party pricing source or, if so provided, does not, in the opinion of the Manager or Subadvisor, reflect the security’s market value; (vi) a security subject to trading collars for which no or limited trading takes place; and (vii) a security whose principal market has been temporarily closed at a time when, under normal conditions, it would be open. Securities for which market quotations or observable inputs are not readily available are generally categorized as Level 3 in the hierarchy. As of June 30, 2017, there were no securities held by the Portfolio that were fair valued in such a manner.
Futures contracts are valued at the last posted settlement price on the market where such futures are primarily traded. These securities are generally categorized as Level 1 in the hierarchy.
Debt securities (other than convertible and municipal bonds) are valued at the evaluated bid prices (evaluated mean prices in the case of convertible and municipal bonds) supplied by a pricing agent or brokers selected by the Manager, in consultation with the Subadvisor. Those values reflect broker/dealer supplied prices and electronic data processing techniques, if the evaluated bid or mean prices are deemed by the Manager, in consultation with the Subadvisor to be representative of market values, at the regular close of trading of the Exchange on each valuation date. Debt securities purchased on a delayed delivery basis are marked to market daily until settlement at the forward settlement date. Debt securities, including corporate bonds, U.S. government & federal agency bonds, municipal bonds, foreign bonds, convertible bonds, asset-backed securities and mortgage-backed securities are generally categorized as Level 2 in the hierarchy.
Temporary cash investments acquired in excess of 60 days to maturity at the time of purchase are valued using the latest bid prices or using valuations based on a matrix system (which considers such factors as security prices, yields, maturities, and ratings), both as furnished by independent pricing services. Other temporary cash investments which mature in 60 days or less at the time of purchase (“Short-Term Investments”) are valued using the amortized cost method of valuation, unless the use of such method would be inappropriate. The amortized cost method involves valuing a security at its cost on the date of purchase and thereafter assuming a constant amortization to maturity of the difference between such cost and the value on maturity date. Amortized cost approximates the current fair value of a security. Securities valued using the amortized cost method are not valued using quoted prices in an active market and are generally categorized as Level 2 in the hierarchy.
The information above is not intended to reflect an exhaustive list of the methodologies that may be used to value portfolio investments. The valuation procedures permit the use of a variety of valuation methodologies in connection with valuing portfolio investments. The methodology used for a specific type of investment may vary based on the market data available or other considerations. The methodologies summarized above may not represent the specific means by which portfolio investments are valued on any particular business day.
| | |
| 22 | | MainStay VP Indexed Bond Portfolio |
(B) Income Taxes. The Portfolio’s policy is to comply with the requirements of the Internal Revenue Code of 1986, as amended (the “Internal Revenue Code”), applicable to regulated investment companies and to distribute all of its taxable income to the shareholders of the Portfolio within the allowable time limits. Therefore, no federal, state and local income tax provisions are required.
Management evaluates the Portfolio’s tax positions to determine if the tax positions taken meet the minimum recognition threshold in connection with accounting for uncertainties in income tax positions taken or expected to be taken for the purposes of measuring and recognizing tax liabilities in the financial statements. Recognition of tax benefits of an uncertain tax position is permitted only to the extent the position is “more likely than not” to be sustained assuming examination by taxing authorities. Management has analyzed the Portfolio’s tax positions taken on federal, state and local income tax returns for all open tax years (for up to three tax years), and has concluded that no provisions for federal, state and local income tax are required in the Portfolio’s financial statements. The Portfolio’s federal, state and local income and federal excise tax returns for tax years for which the applicable statutes of limitations have not expired are subject to examination by the Internal Revenue Service and state and local departments of revenue.
(C) Dividends and Distributions to Shareholders. Dividends and distributions are recorded on the ex-dividend date. The Portfolio intends to declare and pay dividends from net investment income and distributions from net realized capital and currency gains, if any, at least annually. Unless the shareholder elects otherwise, all dividends and distributions are reinvested in the same class of shares of the Portfolio, at NAV. Dividends and distributions to shareholders are determined in accordance with federal income tax regulations and may differ from GAAP.
(D) Security Transactions and Investment Income. The Portfolio records security transactions on the trade date. Realized gains and losses on security transactions are determined using the identified cost method. Dividend income is recognized on the ex-dividend date; net of any foreign tax withheld at the source, and interest income is accrued as earned using the effective interest rate method. Discounts and premiums on securities purchased, other than Short-Term Investments, for the Portfolio are accreted and amortized, respectively, on the effective interest rate method over the life of the respective securities. Discounts and premiums on Short-Term Investments are accreted and amortized, respectively, on the straight-line method. The straight-line method approximates the effective interest method for Short-Term Investments.
Investment income and realized and unrealized gains and losses on investments of the Portfolio are allocated pro rata to the separate classes of shares based upon their relative net assets on the date the income is earned or realized and unrealized gains and losses are incurred.
The Portfolio may place a debt security on non-accrual status and reduce related interest income by ceasing current accruals and writing off all or a portion of any interest receivables when the collection of all or a portion of such interest has become doubtful. A debt security is removed from non-accrual status when the issuer resumes interest payments or when collectability of interest is reasonably assured.
(E) Expenses. Expenses of the Fund are allocated to the individual Portfolios in proportion to the net assets of the respective Portfolios when the expenses are incurred, except where direct allocations of expenses can be made. Expenses (other than fees incurred under the distribution and service plans, further discussed in Note 3(B), which are charged directly to the Service Class shares) are allocated to separate classes of shares pro rata based upon their relative net assets on the date the expenses are incurred. The expenses borne by the Portfolio, including those of related parties to the Portfolio, are shown in the Statement of Operations.
(F) Use of Estimates. In preparing financial statements in conformity with GAAP, management makes estimates and assumptions that affect the reported amounts and disclosures in the financial statements. Actual results could differ from those estimates.
(G) Repurchase Agreements. The Portfolio may enter into repurchase agreements (i.e., buy a security from another party with the agreement that it be sold back in the future) to earn income. The Portfolio may enter into repurchase agreements only with counterparties, usually financial institutions that are deemed by the Manager or Subadvisor to be creditworthy, pursuant to guidelines established by the Board. During the term of any repurchase agreement, the Manager or Subadvisor will continue to monitor the creditworthiness of the counterparty. Under the 1940 Act, repurchase agreements are considered to be collateralized loans by the Portfolio to the counterparty secured by the securities transferred to the Portfolio.
Repurchase agreements are subject to counterparty risk, meaning the Portfolio could lose money by the counterparty’s failure to perform under the terms of the agreement. The Portfolio mitigates this risk by ensuring the repurchase agreement is collateralized by cash, U.S. government securities, fixed income securities and/or other securities. The collateral is held by the Portfolio’s custodian valued daily on a mark to market basis to determine if the value, including accrued interest, exceeds the repurchase price. In the event of the counterparty’s default on the obligation to repurchase, the Portfolio has the right to liquidate the collateral and apply the proceeds in satisfaction of the obligation. Under certain circumstances, such as in the event of default or bankruptcy by the counterparty, realization and/or retention of the collateral may be limited or subject to delay, to legal proceedings and possible realized loss to the Portfolio.
(H) Futures Contracts. A futures contract is an agreement to purchase or sell a specified quantity of an underlying instrument at a specified future date and price, or to make or receive a cash payment based on the value of a financial instrument (e.g., foreign currency, interest rate, security, or securities index). The Portfolio is subject to risks such as market price risk and/or interest rate risk in the normal course of investing in these transactions. Upon entering into a futures contract, the Portfolio is required to pledge to the broker or futures commission merchant an amount of cash and/or U.S. Government securities equal to a certain percentage of the collateral amount, known as the “initial margin.” During the period the futures contract is open, changes in the value of the contract are recognized as unrealized appreciation or depreciation by marking to market such contract on a daily basis to reflect the market value of the contract at the end of each day’s trading. The Portfolio agrees to receive from or pay to the broker or futures commission merchant an amount of cash equal to the daily
Notes to Financial Statements (Unaudited) (continued)
fluctuation in the value of the contract. Such receipts or payments are known as “variation margin.” When the futures contract is closed, the Portfolio records a realized gain or loss equal to the difference between the proceeds from (or cost of) the closing transaction and the Portfolio’s basis in the contract.
The use of futures contracts involves, to varying degrees, elements of market risk in excess of the amount recognized in the Statement of Assets and Liabilities. The contract or notional amounts and variation margin reflect the extent of the Portfolio’s involvement in open futures positions. There are several risks associated with the use of futures contracts as hedging techniques. There can be no assurance that a liquid market will exist at the time when the Portfolio seeks to close out a futures contract. If no liquid market exists, the Portfolio would remain obligated to meet margin requirements until the position is closed. Futures may involve a small initial investment relative to the risk assumed, which could result in losses greater than if they had not been used. Futures may be more volatile than direct investments in the instrument underlying the futures, and may not correlate to the underlying instrument, causing a given hedge not to achieve its objectives. The Portfolio’s activities in futures contracts have minimal counterparty risk as they are conducted through regulated exchanges that guarantee the futures against default by the counterparty. In the event of a bankruptcy or insolvency of a futures commission merchant that holds margin on behalf of the Portfolio, the Portfolio may not be entitled to the return of the entire margin owed to the Portfolio, potentially resulting in a loss. The Portfolio’s investment in futures contracts and other derivatives may increase the volatility of the Portfolio’s NAV and may result in a loss to the Portfolio. As of June 30, 2017, all open futures contracts are shown in the Portfolio of Investments.
(I) Dollar Rolls. The Portfolio may enter into dollar roll transactions in which it sells mortgage-backed securities (“MBS”) from its portfolio to a counterparty from whom it simultaneously agrees to buy a similar security on a delayed delivery basis. The Portfolio generally transfers MBS where the MBS are “to be announced,” therefore, the Portfolio accounts for these transactions as purchases and sales.
The securities sold in connection with the dollar rolls are removed from the portfolio and a realized gain or loss is recognized. The securities the Portfolio has agreed to acquire are included at market value in the Portfolio of Investments and liabilities for such purchase commitments are included as payables for investments purchased. During the roll period, the Portfolio foregoes principal and interest paid on the securities. The Portfolio is compensated by the difference between the current sales price and the forward price for the future as well as by the earnings on the cash proceeds of the initial sale. Dollar rolls may be renewed without physical delivery of the securities subject to the contract. The Portfolio maintains liquid assets from its portfolio having a value not less than the repurchase price, including accrued interest. Dollar roll transactions involve certain risks, including the risk that the securities returned to the Portfolio at the end of the roll period, while substantially similar, could be inferior to what was initially sold to the counterparty.
The Portfolio accounts for a dollar roll transaction as a purchase and sale whereby the difference in the sales price and purchase price of the security sold is recorded as a realized gain (loss).
(J) Securities Lending. In order to realize additional income, the Portfolio may engage in securities lending, subject to the limitations set forth in the 1940 Act and relevant guidance by the staff of the Securities and Exchange Commission (“SEC”). In the event the Portfolio does engage in securities lending, the Portfolio will lend through its custodian, State Street Bank and Trust Company (“State Street”). State Street will manage the Portfolio’s collateral in accordance with the lending agreement between the Portfolio and State Street, and indemnify the Portfolio against counterparty risk. The loans will be collateralized by U.S. Treasury securities at least equal at all times to the market value of the securities loaned. The Portfolio may bear the risk of delay in recovery of, or loss of rights in, the securities loaned should the borrower of the securities experience financial difficulty. The Portfolio may also record a realized gain or loss on securities deemed sold due to a borrower’s inability to return securities on loan. The Portfolio bears the risk of any loss on investment of the collateral. The Portfolio will receive compensation for lending its securities in the form of fees or it will retain a portion of interest on the investment of any cash received as collateral. The Portfolio will also continue to receive interest and dividends on the securities loaned and any gain or loss in the market price of the securities loaned that may occur during the term of the loan will be for the account of the Portfolio. During the period ended June 30, 2017, the Portfolio did not have any portfolio securities on loan.
(K) Securities Risk. Investments in the Portfolio are not guaranteed, even though some of the Portfolio’s underlying investments are guaranteed by the U.S. government or its agencies or instrumentalities. The principal risk of mortgage-related and asset-backed securities is that the underlying debt may be prepaid ahead of schedule, if interest rates fall, thereby reducing the value of the Portfolio’s investment. If interest rates rise, less of the debt may be prepaid and the Portfolio may lose money. The Portfolio is subject to interest-rate risk and its holdings in bonds can lose principal value when interest rates rise. Bonds are also subject to credit risk, in which the bond issuer may fail to pay interest and principal in a timely manner.
The Portfolio may invest in foreign debt securities, which carry certain risks that are in addition to the usual risks inherent in domestic debt securities. These risks include those resulting from currency fluctuations, future adverse political or economic developments and possible imposition of currency exchange blockages or other foreign governmental laws or restrictions. These risks are likely to be greater in emerging markets than in developed markets. The ability of issuers of securities held by the Portfolio to meet their obligations may be affected by economic or political developments in a specific country, industry or region.
(L) Indemnifications. Under the Fund’s organizational documents, its officers and trustees are indemnified against certain liabilities that may arise out of performance of their duties to the Fund. Additionally, in the normal course of business, the Portfolio enters into contracts with third-party service providers that contain a variety of representations and warranties and which may provide general indemnifications. The Portfolio maximum exposure under these arrangements is unknown, as this would involve future claims that may be made against the Portfolio that have not yet occurred. Based on experience, management is of the view that the risk of loss in connection with these potential indemnification obligations is remote. However, there can be no
| | |
| 24 | | MainStay VP Indexed Bond Portfolio |
assurance that material liabilities related to such obligations will not arise in the future, which could adversely impact the Portfolio.
(M) Quantitative Disclosure of Derivative Holdings. The following tables show additional disclosures related to the Portfolio’s derivative and hedging activities, including how such activities are accounted for and their effect on the Portfolio’s financial positions, performance and cash flows. The Portfolio entered into futures contracts in order to hedge against anticipated changes in interest rates that might otherwise have an adverse effect upon the value of the Portfolio’s securities as well as help manage the duration and yield curve of the portfolio.
Fair value of derivative instruments as of June 30, 2017:
Asset Derivatives
| | | | | | | | | | |
| | | Statement of
Assets and
Liabilities Location | | Interest
Rate
Contracts
Risk | | | Total | |
Futures Contracts | | Net Assets—Net unrealized appreciation (depreciation) on investments and futures contracts (a) | | $ | 216 | | | $ | 216 | |
| | | | | | |
Total Fair Value | | | | $ | 216 | | | $ | 216 | |
| | | | | | |
Liability Derivatives
| | | | | | | | | | |
| | | Statement of
Assets and
Liabilities Location | | Interest
Rate
Contracts
Risk | | | Total | |
Futures Contracts | | Net Assets—Net unrealized appreciation (depreciation) on investments and futures contracts (a) | | $ | (12,109 | ) | | $ | (12,109 | ) |
| | | | | | |
Total Fair Value | | | | $ | (12,109 | ) | | $ | (12,109 | ) |
| | | | | | |
| (a) | Includes cumulative appreciation (depreciation) of futures contracts as reported in the Portfolio of Investments. Only current day’s variation margin is reported within the Statement of Assets and Liabilities. |
The effect of derivative instruments on the Statement of Operations for the period ended June 30, 2017:
Realized Gain (Loss)
| | | | | | | | | | |
| | | Statement of
Operations
Location | | Interest
Rate
Contracts
Risk | | | Total | |
Futures Contracts | | Net realized gain (loss) on futures transactions | | $ | (6,214 | ) | | $ | (6,214 | ) |
| | | | | | |
Total Realized
Gain (Loss) | | | | $ | (6,214 | ) | | $ | (6,214 | ) |
| | | | | | |
Change in Unrealized Appreciation (Depreciation)
| | | | | | | | | | |
| | | Statement of
Operations
Location | | Interest
Rate
Contracts
Risk | | | Total | |
Futures Contracts | | Net change in unrealized appreciation (depreciation) on futures transactions | | $ | (11,893 | ) | | $ | (11,893 | ) |
| | | | | | |
Total Change in Unrealized Appreciation (Depreciation) | | | | $ | (11,893 | ) | | $ | (11,893 | ) |
| | | | | | |
Average Notional Amount
| | | | | | | | |
| | | Interest
Rate
Contracts
Risk | | | Total | |
Futures Contracts Long | | $ | 3,048,164 | | | $ | 3,048,164 | |
| Futures Contracts Short | | $ | (922,500 | ) | | $ | (922,500 | ) |
| | | | |
Note 3–Fees and Related Party Transactions
(A) Manager and Subadvisor. New York Life Investments, a registered investment adviser and an indirect, wholly-owned subsidiary of New York Life, serves as the Portfolio’s Manager pursuant to an Amended and Restated Management Agreement (“Management Agreement”). The Manager provides offices, conducts clerical, recordkeeping and bookkeeping services, and keeps most of the financial and accounting records required to be maintained by the Portfolio. Except for the portion of salaries and expenses that are the responsibility of the Portfolio, the Manager pays the salaries and expenses of all personnel affiliated with the Portfolio and certain operational expenses of the Portfolio. The Portfolio reimburses New York Life Investments in an amount equal to a portion of the compensation of the Chief Compliance Officer attributable to the Portfolio. Pursuant to the terms of a Subadvisory Agreement with New York Life Investments, NYL Investors LLC (“NYL Investors”), a registered investment adviser and a direct, wholly-owned subsidiary of New York Life, serves as Subadvisor to the Portfolio. New York Life Investments pays for the services of the Subadvisor.
The Fund, on behalf of the Portfolio, pays New York Life Investments in its capacity as the Portfolio’s investment manager and administrator, pursuant to the Management Agreement, a monthly fee for services performed and facilities furnished at an annual rate of the Portfolio’s average daily net assets as follows: 0.25% up to $1 billion and 0.20% in excess of $1 billion. During the period ended June 30, 2017, the effective management fee rate was 0.25%.
New York Life Investments has contractually agreed to waive fees and/or reimburse expenses so that Total Annual Portfolio Operating Expenses do not exceed the following percentages of average daily net assets: Initial Class, 0.375%; and Service Class, 0.625%. Total Annual Portfolio Operating Expenses excludes taxes, interest, litigation, extraordinary expenses, brokerage and other transaction expenses relating to the purchase or sale of portfolio investments, and acquired (underlying) fund fees and expenses. This agreement will remain in effect until
Notes to Financial Statements (Unaudited) (continued)
May 1, 2018, and shall renew automatically for one-year terms unless New York Life Investments provides written notice of termination prior to the start of the next term or upon approval by the Board.
During the period ended June 30, 2017, New York Life Investments earned fees from the Portfolio in the amount of $38,811.
State Street provides sub-administration and sub-accounting services to the Portfolio pursuant to an agreement with New York Life Investments. These services include calculating the daily NAVs of the Portfolio, maintaining the general ledger and sub-ledger accounts for the calculation of the Portfolio’s NAVs, and assisting New York Life Investments in conducting various aspects of the Portfolio’s administrative operations. For providing these services to the Portfolio, State Street is compensated by New York Life Investments.
(B) Distribution and Service Fees. The Fund, on behalf of the Portfolio, has entered into a distribution agreement with NYLIFE Distributors LLC (the “Distributor”), an indirect, wholly-owned subsidiary of New York Life. The Portfolio has adopted a distribution plan (the “Plan”) in accordance with the provisions of Rule 12b-1 under the 1940 Act. Under the Plan, the Distributor has agreed to provide, through its affiliates or independent third parties, various distribution-related, shareholder and administrative support services to the Service Class shareholders. For its services, the Distributor is entitled to a combined distribution and service fee accrued daily and paid monthly at an annual rate of 0.25% of the average daily net assets attributable to the Service Class shares of the Portfolio.
(C) Capital. As of June 30, 2017, New York Life and its affiliates beneficially held shares of the Portfolio with values and percentages of net assets as follows:
| | | | | | | | |
Initial Class | | $ | 979,875 | | | | 1.0 | % |
Service Class | | | 25,100 | | | | 5.5 | |
Note 4–Custodian
State Street is the custodian of cash and securities held by the Portfolio. Custodial fees are charged to the Portfolio based on the Portfolio’s net assets and/or the market value of securities held by the Portfolio and the number of certain transactions incurred by the Portfolio.
Note 5–Line of Credit
The Portfolio and certain other funds managed by New York Life Investments, maintain a line of credit with a syndicate of banks in order to secure a source of funds for temporary purposes to meet unanticipated or excessive redemption requests.
Effective August 1, 2017, under the credit agreement (the “Credit Agreement”), the aggregate commitment amount is $600,000,000 with an additional uncommitted amount of $100,000,000. The commitment fee is an annual rate of 0.15% of the average commitment amount payable quarterly, regardless of usage, to State Street, who serves as the agent to the syndicate. The commitment fee is allocated among the Portfolio and certain other funds managed by New York Life Investments based upon their respective net assets and other factors. Interest on any revolving credit loan is charged based upon the Federal Funds Rate or the one month LIBOR, whichever is higher. The Credit Agreement
expires on July 31, 2018, although the Portfolio, certain other funds managed by New York Life Investments and the syndicate of banks may renew the Credit Agreement for an additional year on the same or different terms. Prior to August 1, 2017, the aggregate commitment amount was $600,000,000 with an additional uncommitted amount of $100,000,000, and the commitment fee, under a credit agreement for which Bank of New York Mellon served as agent, was at an annual rate of 0.15% of the average commitment amount. During the period ended June 30, 2017, there were no borrowings made or outstanding with respect to the Portfolio under the credit agreement for which Bank of New York Mellon served as agent.
Note 6–Interfund Lending Program
Pursuant to an exemptive order issued by the SEC, the Portfolio, along with certain other funds managed by New York Life Investments, may participate in an interfund lending program. The interfund lending program provides an alternative credit facility that permits the Portfolio and certain other funds managed by New York Life Investments to lend or borrow money for temporary purposes directly to or from one another subject to the conditions of the exemptive order. During the period ended June 30, 2017, there were no interfund loans made or outstanding with respect to the Portfolio.
Note 7–Purchases and Sales of Securities (in 000’s)
During the period ended June 30, 2017, purchases and sales of U.S. government securities were $109,943 and $50,966, respectively. Purchases and sales of securities, other than U.S. government securities and short-term securities, were $32,509 and $1,545, respectively.
Note 8–Capital Share Transactions
Transactions in capital shares for the period ended June 30, 2017 were as follows:
| | | | | | | | |
Initial Class | | Shares | | | Amount | |
Period ended June 30, 2017 (a): | | | | | | | | |
Shares sold | | | 9,598,804 | | | $ | 95,974,727 | |
Shares redeemed | | | (194,204 | ) | | | (1,956,609 | ) |
| | | | |
Net increase (decrease) | | | 9,404,600 | | | $ | 94,018,118 | |
| | | | |
|
| |
Service Class | | Shares | | | Amount | |
Period ended June 30, 2017 (a): | | | | | | | | |
Shares sold | | | 45,692 | | | $ | 458,186 | |
Shares redeemed | | | (507 | ) | | | (5,090 | ) |
| | | | |
Net increase (decrease) | | | 45,185 | | | $ | 453,096 | |
| | | | |
| (a) | Inception date was May 1, 2017. |
Note 9–Recent Accounting Pronouncement
In October 2016, the SEC adopted new rules and amended existing rules (together, “final rules”) intended to modernize the reporting and disclosure of information by registered investment companies. In part, the final rules amend Regulation S-X and require standardized, enhanced disclosure about derivatives in investment company financial
| | |
| 26 | | MainStay VP Indexed Bond Portfolio |
statements, as well as other amendments. The compliance date for the amendments to Regulation S-X is August 1, 2017 and applies to shareholder reports for funds with fiscal periods ending after August 1, 2017. Management is currently evaluating the impact that the adoption of the amendments to Regulation S-X will have on the Portfolio’s financial statements and related disclosures.
Note 10–Subsequent Events
In connection with the preparation of the financial statements of the Portfolio as of and for the period ended June 30, 2017, events and
transactions subsequent to June 30, 2017, through the date the financial statements were issued have been evaluated by the Portfolio’s management for possible adjustment and/or disclosure. No subsequent events requiring financial statement adjustment or disclosure have been identified.
Board Consideration and Approval of Management Agreement and
Subadvisory Agreement (Unaudited)
Section 15(c) of the Investment Company Act of 1940, as amended (the “1940 Act”), requires that each mutual fund’s board of trustees, including a majority of the independent trustees, initially approve and, following an initial term of up to two years, annually review and approve the fund’s investment advisory agreements. At its March 21, 2017 meeting, the Board of Trustees of the MainStay Group of Funds (“Board”) unanimously approved the Management Agreement with respect to the MainStay VP Indexed Bond Portfolio (“Portfolio”) and New York Life Investment Management LLC (“New York Life Investments”), and the Subadvisory Agreement between New York Life Investments and NYL Investors LLC (“NYL Investors”) with respect to the Portfolio.
In reaching its decisions to approve the Agreements, the Board considered information furnished by New York Life Investments and NYL Investors specifically in connection with the contract review process that took place in advance of the March 2017 meeting, which included responses from New York Life Investments and NYL Investors to a comprehensive list of questions encompassing a variety of topics prepared on behalf of the Board by independent legal counsel to the Board and its independent trustees (the “Independent Trustees”). The Board also considered information provided by New York Life Investments and NYL Investors on the fees charged to any other investment advisory clients (including institutional separate accounts) that follow investment strategies similar to those proposed for the Portfolio, including MainStay Indexed Bond Fund, which is subadvised by NYL Investors and has materially identical investment strategies as the Portfolio, and the rationale for any differences in the Portfolio’s proposed management and subadvisory fees and the fees charged to those other investment advisory clients. In addition, the Board considered relevant information previously provided to the Board in connection with its review of the investment advisory and subadvisory agreements for other MainStay Funds.
In considering the Agreements, the Trustees comprehensively reviewed and evaluated all of the information and factors they believed to be relevant and appropriate in light of legal advice furnished to them by independent legal counsel and through the exercise of their own business judgment. The broad factors considered by the Board are described in greater detail below and included, among other factors: (i) the nature, extent and quality of the services to be provided to the Portfolio by New York Life Investments and NYL Investors; (ii) the qualifications of the proposed portfolio managers for the Portfolio and the historical investment performance of products managed by such portfolio managers with similar investment strategies to the Portfolio, including MainStay Indexed Bond Fund; (iii) the anticipated costs of the services to be provided, and profits expected to be realized, by New York Life Investments and its affiliates, including NYL Investors, from their relationships with the Portfolio; (iv) the extent to which economies of scale may be realized if the Portfolio grows, and the extent to which economies of scale may benefit the Portfolio’s shareholders; and (v) the reasonableness of the Portfolio’s proposed management and subadvisory fees and overall total ordinary operating expenses, particularly as compared to any similar funds and accounts managed by New York Life Investments and NYL Investors. Although the Board recognized that the comparisons between the Portfolio’s anticipated fees and expenses and those of identified peer funds are imprecise given different terms of agreements and variations in fund strategies, the Board considered the reasonableness of the Portfolio’s proposed management fee and
anticipated overall total ordinary operating expenses as compared to the peer funds identified by New York Life Investments.
Although individual Trustees may have weighed certain factors or information differently, the Board’s decisions to approve the Agreements were based on a consideration of the information provided to the Trustees throughout the year, as well as information furnished specifically in connection with the contract review process. The Board’s conclusions with respect to the Agreements may have been based, in part, on the Board’s knowledge of New York Life Investments and NYL Investors resulting from, among other things, the Board’s consideration of the MainStay Group of Funds’ advisory and subadvisory agreements in prior years. In addition to considering the above-referenced factors, the Board observed that in the marketplace there are a range of investment options available to variable life insurance policyholders and variable annuity contract owners who invest in the Portfolio, and that these policyholders and contract owners, having had the opportunity to consider other investment options, will have chosen to invest in the Portfolio. The factors that figured prominently in the Board’s decisions to approve the Agreements are summarized in more detail below.
Nature, Extent and Quality of Services to Be Provided by New York Life Investments and NYL Investors
The Board examined the nature, extent and quality of the services that New York Life Investments proposed to provide to the Portfolio. The Board evaluated New York Life Investments’ experience and capabilities in serving as manager of other mutual funds, noting that New York Life Investments manages other mutual funds, serves a variety of other investment advisory clients, including other pooled investment vehicles, and has experience with overseeing mutual fund service providers, including subadvisers. The Board considered the experience of senior personnel at New York Life Investments proposed to provide management and administrative services to the Portfolio, as well as New York Life Investments’ reputation and financial condition. The Board observed that New York Life Investments will devote significant resources and time to providing advisory and non-advisory services to the Portfolio, including its extensive oversight of NYL Investors. The Board also considered the full range of services that New York Life Investments will supply to the Portfolio under the terms of the Management Agreement, including: (i) fund accounting and on-going oversight services to be provided by New York Life Investments’ Fund Administration and Accounting Group; (ii) investment oversight and analytical services to be provided by New York Life Investments’ Investment Consulting Group; (iii) compliance services to be provided by the Portfolio’s Chief Compliance Officer as well as New York Life Investments’ Compliance Department, including oversight and implementation of the Portfolio’s compliance program; (iv) legal services to be provided by New York Life Investments’ Office of the General Counsel; and (v) risk management and portfolio trading oversight and analysis by compliance and investment personnel. The Board noted that additional information about the non-advisory services provided by New York Life Investments is set forth in the Management Agreement. The Board also considered New York Life Investments’ willingness to invest in personnel, infrastructure, technology, operational enhancements, cyber security, information security, and shareholder privacy resources that are designed to benefit the Portfolio, and noted that New York Life Investments is responsible for compensating the MainStay VP Funds Trust’s officers.
| | |
| 28 | | MainStay VP Indexed Bond Portfolio |
The Board also examined the nature, extent and quality of the investment advisory services that NYL Investors proposed to provide to the Portfolio. The Board evaluated NYL Investors’ experience in managing other portfolios, including those with similar investment strategies to the Portfolio, such as MainStay Indexed Bond Fund. It examined NYL Investors’ track record and experience in providing investment advisory services, the experience of investment advisory, senior management and administrative personnel at NYL Investors, and NYL Investors’ overall legal and compliance environment. The Board further considered New York Life Investments’ policies, procedures and systems to reasonably assure compliance with applicable laws and regulations. In addition, the Board considered the policies and procedures in place with respect to matters that may involve conflicts of interest between the Portfolio’s investments and those of other accounts managed by NYL Investors. The Board also reviewed NYL Investors’ willingness to invest in personnel and other resources designed to benefit the Portfolio. In this regard, the Board considered the experience of the Portfolio’s proposed portfolio managers, including with respect to other products with similar investment strategies to the Portfolio, the number of accounts managed by the portfolio managers and the method for compensating the portfolio managers.
Based on these considerations, the Board concluded, within the context of its overall determinations regarding the Agreements, that the Portfolio likely would benefit from the nature, extent and quality of these services as a result of New York Life Investments’ and NYL Investors’ experience, personnel, operations and resources.
Investment Performance
In connection with the Board’s consideration of the Agreements, the Board noted that the Portfolio had no investment performance track record because the Portfolio had not yet commenced investment operations. The Board discussed with management and the Portfolio’s proposed portfolio management team the Portfolio’s investment process, strategies and risks, recognizing that these would be materially identical to MainStay Indexed Bond Fund. Additionally, the Board considered the historical performance of other investment portfolios with similar investment strategies that are or have been managed by the proposed portfolio managers for the Portfolio, including MainStay Indexed Bond Fund. Based on these considerations, the Board concluded that the Portfolio was likely to be managed responsibly and capably by NYL Investors.
Costs of the Services to Be Provided, and Profits to Be Realized, by New York Life Investments and NYL Investors
The Board considered the anticipated costs of the services to be provided by New York Life Investments and NYL Investors under the Agreements, and the profits expected to be realized by New York Life Investments and its affiliates, including NYL Investors, from their relationships with the Portfolio. Because NYL Investors is an affiliate of New York Life Investments whose subadvisory fees are paid directly by New York Life Investments, the Board considered the anticipated cost and profitability information for New York Life Investments and NYL Investors in the aggregate.
In evaluating the anticipated costs of the services to be provided by New York Life Investments and NYL Investors and the expected profits to be
realized by New York Life Investments and its affiliates, including NYL Investors, from their relationships with the Portfolio, the Board considered, among other factors, each party’s investments in personnel, systems, equipment and other resources necessary to manage the Portfolio, and that New York Life Investments will be responsible for paying the subadvisory fees for the Portfolio. The Board acknowledged that New York Life Investments and NYL Investors must be in a position to pay and retain experienced professional personnel to provide services to the Portfolio, and that the ability to maintain a strong financial position is important for New York Life Investments and NYL Investors to be able to provide high-quality services to the Portfolio. The Board also recognized that the Portfolio will benefit from the allocation of certain fixed costs across the MainStay Group of Funds, among other expected benefits resulting from its relationship with New York Life Investments.
In addition, the Board acknowledged the difficulty in obtaining reliable comparative data about mutual fund managers’ profitability, because such information generally is not publicly available and may be impacted by numerous factors, including the structure of a fund manager’s organization, the types of funds it manages, the methodology used to allocate certain fixed costs to specific funds, and the manager’s capital structure and costs of capital. In connection with the annual fund profitability analysis that New York Life Investments presents to the Board, the Board in 2014 engaged Bobroff Consulting, Inc., an independent third-party consultant, to review the methods used to allocate costs to the MainStay Funds, and among individual Funds. As part of this engagement, the consultant analyzed: (i) the various New York Life Investments’ business units and affiliated subadvisers that provide services to the MainStay Funds; (ii) how costs are allocated to funds managed by New York Life Investments, and to other lines of businesses; and (iii) how New York Life Investments’ cost allocation methods and profitability reports compare to industry practices. The Board noted that the independent consultant had concluded that New York Life Investments’ methods for allocating costs and procedures for estimating overall profitability of the funds in the MainStay Group of Funds are reasonable, consistent with industry practice and likely to produce reasonable profitability estimates. Although the Board recognized the difficulty in evaluating a manager’s likely profitability with respect to the Portfolio, and noting that other profitability methodologies may also be reasonable, the Board concluded that the profitability methodology presented by New York Life Investments to the Board was reasonable in all material respects.
In considering the anticipated costs and profitability, the Board also considered certain fall-out benefits that may be realized by New York Life Investments and its affiliates, including NYL Investors, from their relationships with the Portfolio. The Board recognized, for example, the potential benefits to NYL Investors from legally permitted “soft-dollar” arrangements by which brokers provide research and other services to NYL Investors in exchange for commissions paid by the Portfolio with respect to trades in the Portfolio’s portfolio securities.
The Board noted that New York Life Investments designed the Portfolio to serve as an investment option under variable contracts issued by affiliates of New York Life Investments that would receive certain fees under those contracts. The Board further considered that, in addition to fees earned by New York Life Investments for managing the Portfolio, New York Life Investments’ affiliates would also earn revenues from
Board Consideration and Approval of Management Agreement and
Subadvisory Agreement (Unaudited) (continued)
serving the Portfolio in various other capacities, including as the Portfolio’s distributor. The Board observed that information about these other revenues, and their impact on the anticipated profitability of the Portfolio to New York Life Investments and its affiliates, was furnished to the Board as part of the contract review process. The Board noted that, although it assessed the overall anticipated profitability of the Portfolio to New York Life Investments and its affiliates, including NYL Investors as part of the contract review process, when considering the reasonableness of the fees to be paid to New York Life Investments and its affiliates, including NYL Investors, under the Agreements, the Board considered the profitability of New York Life Investments’ relationship with the Portfolio on a pre-tax basis, and without regard to distribution expenses incurred by New York Life Investments from its own resources.
After evaluating the information presented to the Board, the Board concluded, within the context of its overall determinations regarding the Agreements, that any profits expected to be realized by New York Life Investments and its affiliates, including NYL Investors, due to their relationships with the Portfolio supported the Board’s decisions to approve the Agreements.
Extent to Which Economies of Scale May Be Realized if the Portfolio Grows
In addition, the Board considered whether the Portfolio’s proposed expense structure will permit economies of scale to be shared with Portfolio shareholders. The Board also considered a report from New York Life Investments, prepared at the request of the Board, that addressed economies of scale in the mutual fund business generally, the changing economics of the mutual fund business and the various ways in which the benefits of economies of scale may be shared with the Portfolio and other MainStay Funds. Although the Board recognized the difficulty of determining economies of scale with precision, the Board acknowledged that economies of scale may be shared with the Portfolio in a number of ways, including, for example, through the imposition of management fee breakpoints, initially setting relatively low management fees or making additional investments to enhance shareholder services. The Board reviewed information from New York Life Investments showing how the Portfolio’s management fee schedule compared to fee schedules of other funds and accounts managed by New York Life Investments, including MainStay Indexed Bond Fund, and how it hypothetically would compare with fees paid for similar services by peer funds at varying asset levels.
Based on this information, the Board concluded, within the context of its overall determinations regarding the Agreements, that the Portfolio’s expense structure appropriately reflects economies of scale for the benefit of Portfolio shareholders. The Board noted, however, that it would continue to evaluate the reasonableness of the Portfolio’s expense structure if the Portfolio grows over time.
Management and Subadvisory Fees and Total Ordinary Operating Expenses
The Board evaluated the reasonableness of the fees to be paid under the Agreements and the Portfolio’s expected total ordinary operating expenses. The Board primarily considered the reasonableness of the management fee to be paid by the Portfolio to New York Life
Investments, because the fees to be paid to NYL Investors will be paid by New York Life Investments, not the Portfolio.
In assessing the reasonableness of the Portfolio’s fees and expenses, the Board primarily considered comparative data provided by New York Life Investments on the fees and expenses charged by similar mutual funds managed by other investment advisers. In addition, the Board considered information provided by New York Life Investments and NYL Investors on fees charged to other investment advisory clients, including institutional separate accounts and other funds that follow similar investment strategies as the Portfolio. In this regard, the Board took into account explanations provided by New York Life Investments about the different scope of services provided to registered investment companies as compared with other investment advisory clients. Additionally, the Board considered the potential impact of any contractual breakpoints, voluntary waivers, and expense limitation arrangements on the Portfolio’s net management fee and expenses. The Board noted that the management and subadvisory fees proposed for the Portfolio would be equivalent to those of MainStay Indexed Bond Fund.
After considering all of the factors outlined above, the Board concluded that the Portfolio’s management and subadvisory fees and anticipated total ordinary operating expenses were within a range that is competitive and, within the context of the Board’s overall conclusions regarding the Agreements, support a conclusion that these fees and expenses are reasonable.
Conclusion
On the basis of the information and factors summarized above and the evaluation thereof, the Board as a whole, including the Independent Trustees who are not parties to the Agreements or “interested persons” of any such party voting separately, unanimously voted to approve the Agreements.
| | |
| 30 | | MainStay VP Indexed Bond Portfolio |
Proxy Voting Policies and Procedures and Proxy Voting Record
A description of the policies and procedures that New York Life Investments uses to vote proxies related to the Portfolio’s securities is available without charge, upon request, (i) by calling 800-598-2019 or (ii) by visiting the SEC’s website at www.sec.gov.
The Portfolio is required to file with the SEC its proxy voting record for the 12-month period ending June 30 on Form N-PX. The Portfolio’s most recent Form N-PX or proxy voting record is available free of charge upon request (i) by calling 800-598-2019 or; (ii) by visiting the SEC’s website at www.sec.gov.
Shareholder Reports and Quarterly Portfolio Disclosure
The Portfolio is required to file its complete schedule of portfolio holdings with the SEC for its first and third fiscal quarters on Form N-Q. The Portfolio’s Form N-Q is available without charge on the SEC’s website at www.sec.gov or by calling MainStay Investments at 800-598-2019. You also can obtain and review copies of Form N-Q by visiting the SEC’s Public Reference Room in Washington, DC (information on the operation of the Public Reference Room may be obtained by calling 1-800-SEC-0330).
This page intentionally left blank
This page intentionally left blank
This page intentionally left blank
MainStay VP Portfolios
MainStay VP offers a wide range of Portfolios. The full array of MainStay VP offerings is listed here, with information about the manager, subadvisors, legal counsel, and independent registered public accounting firm.
Equity Portfolios
MainStay VP Common Stock Portfolio
MainStay VP Cornerstone Growth Portfolio
MainStay VP Eagle Small Cap Growth Portfolio
MainStay VP Emerging Markets Equity Portfolio
MainStay VP Epoch U.S. Equity Yield Portfolio
MainStay VP Epoch U.S. Small Cap Portfolio
MainStay VP International Equity Portfolio
MainStay VP Large Cap Growth Portfolio
MainStay VP MFS® Utilities Portfolio
MainStay VP Mid Cap Core Portfolio
MainStay VP S&P 500 Index Portfolio
MainStay VP Small Cap Core Portfolio
MainStay VP T. Rowe Price Equity Income Portfolio
MainStay VP VanEck Global Hard Assets Portfolio
Mixed Asset Portfolios
MainStay VP Balanced Portfolio
MainStay VP Convertible Portfolio
MainStay VP Cushing Renaissance Advantage Portfolio
MainStay VP Income Builder Portfolio
MainStay VP Janus Henderson Balanced Portfolio
Income Portfolios
MainStay VP Bond Portfolio
MainStay VP Floating Rate Portfolio
MainStay VP Government Portfolio
MainStay VP High Yield Corporate Bond Portfolio
MainStay VP Indexed Bond Portfolio
MainStay VP PIMCO Real Return Portfolio
MainStay VP Unconstrained Bond Portfolio
Money Market
MainStay VP U.S. Government Money Market Portfolio
Alternative
MainStay VP Absolute Return Multi-Strategy Portfolio
Asset Allocation Portfolios
MainStay VP Conservative Allocation Portfolio
MainStay VP Growth Allocation Portfolio
MainStay VP Moderate Allocation Portfolio
MainStay VP Moderate Growth Allocation Portfolio
Manager
New York Life Investment Management LLC
New York, New York
Subadvisors
Candriam Belgium*
Brussels, Belgium
Candriam France S.A.S.*
Paris, France
Cornerstone Capital Management Holdings LLC*
New York, New York
Cushing Asset Management, LP
Dallas, Texas
Eagle Asset Management, Inc.
St Petersburg, Florida
Epoch Investment Partners, Inc.
New York, New York
Janus Capital Management LLC
Denver, Colorado
MacKay Shields LLC*
New York, New York
Massachusetts Financial Services Company
Boston, Massachusetts
NYL Investors LLC*
New York, New York
Pacific Investment Management Company LLC
Newport Beach, California
T. Rowe Price Associates, Inc.
Baltimore, Maryland
Van Eck Associates Corporation
New York, New York
Winslow Capital Management, LLC
Minneapolis, Minnesota
Distributor
NYLIFE Distributors LLC*
Jersey City, New Jersey
Custodian
State Street Bank and Trust Company
Boston, Massachusetts
Independent Registered Public Accounting Firm
PricewaterhouseCoopers LLP
New York, New York
Legal Counsel
Dechert LLP
Washington, District of Columbia
Some Portfolios may not be available in all products.
* An affiliate of New York Life Investment Management LLC
Not part of the Semiannual Report
2017 Semiannual Report
This report is for the general information of New York Life Variable Annuities and NYLIAC Variable Universal Life Insurance Products policyowners. It must be preceded or accompanied by the appropriate product(s) and funds prospectuses if it is given to anyone who is not an owner of a New York Life variable annuity policy or a NYLIAC Variable Universal Life Insurance Product. This report does not offer for sale or solicit orders to purchase securities.
The performance data quoted in this report represents past performance. Past performance is no guarantee of future results. Due to market volatility and other factors, current performance may be lower or higher than the figures shown. The most recent month-end performance summary for your variable annuity or variable life policy is available by calling 800-598-2019 and is updated periodically on www.newyorklife.com.
The New York Life Variable Annuities and NYLIAC Variable Universal Life Insurance Products are issued by New York Life Insurance and Annuity Corporation (a Delaware Corporation) and distributed by NYLIFE Distributors LLC (Member FINRA/SIPC).
New York Life Insurance Company
New York Life Insurance and Annuity Corporation (NYLIAC) (A Delaware Corporation)
51 Madison Avenue, Room 551
New York, NY 10010
www.newyorklife.com
Printed on recycled paper
mainstayinvestments.com
NYLIFE Distributors LLC, 30 Hudson Street, Jersey City, NJ 07302
New York Life Investment Management LLC is the investment manager to the MainStay VP Funds Trust
©2017 by NYLIFE Distributors LLC. All rights reserved.
You may obtain copies of the Prospectus and the Statement of Additional Information free of charge, upon request, by calling toll-free 800-598-2019 or writing to New York Life Insurance and Annuity Corporation, 51 Madison Avenue, New York, NY 10010.
| | | | |
| Not FDIC Insured | | No Bank Guarantee | | May Lose Value |
| | | | |
1744028 | | | | MSVPIN10-08/17 (NYLIAC) NI555 |
Not applicable.
| Item 3. | Audit Committee Financial Expert. |
Not applicable.
| Item 4. | Principal Accountant Fees and Services. |
Not applicable.
| Item 5. | Audit Committee of Listed Registrants |
Not applicable.
| Item 6. | Schedule of Investments |
The Schedule of Investments is included as part of Item 1 of this report.
| Item 7. | Disclosure of Proxy Voting Policies and Procedures for Closed-End Management Investment Companies. |
Not applicable.
| Item 8. | Portfolio Managers of Closed-End Management Investment Companies. |
Not applicable.
| Item 9. | Purchases of Equity Securities by Closed-End Management Investment Company and Affiliated Purchasers. |
Not Applicable.
| Item 10. | Submission of Matters to a Vote of Security Holders. |
Since the Registrant’s last response to this Item, there have been no material changes to the procedures by which shareholders may recommend nominees to the Registrant’s Board of Trustees.
| Item 11. | Controls and Procedures. |
| (a) | Based on an evaluation of the Registrant’s Disclosure Controls and Procedures (as defined in Rule 30a-3(c) under the Investment Company Act of 1940) (the “Disclosure Controls”), as of a date within 90 days prior to the filing date (the “Filing Date”) of this Form N-CSR (the “Report”), the Registrant’s principal executive officer and principal financial officer have concluded that the Disclosure Controls are reasonably designed to ensure that information required to be disclosed by the Registrant in the Report is |
recorded, processed, summarized and reported by the Filing Date, including ensuring that information required to be disclosed in the Report is accumulated and communicated to the Registrant’s management, including the Registrant’s principal executive officer and principal financial officer, as appropriate to allow timely decisions regarding required disclosure.
| (b) | There were no changes in the Registrant’s internal control over financial reporting (as defined in Rule 30a-3(d)) under the Investment Company Act of 1940 that occurred during the second fiscal quarter of the period covered by this report that has materially affected, or is reasonably likely to materially affect, the Registrant’s internal control over financial reporting. |
| (a) | Certifications of principal executive officer and principal financial officer as required by Rule 30a-2 under the Investment Company Act of 1940. |
| (b) | Certifications of principal executive officer and principal financial officer as required by Section 906 of the Sarbanes-Oxley Act of 2002. |
SIGNATURES
Pursuant to the requirements of the Securities Exchange Act of 1934 and the Investment Company Act of 1940, the Registrant has duly caused this Report to be signed on its behalf by the undersigned, thereunto duly authorized.
MAINSTAY VP FUNDS TRUST
| | |
| By: | | /s/ Stephen P. Fisher |
| | Stephen P. Fisher President and Principal Executive Officer |
| |
| Date: | | September 5, 2017 |
Pursuant to the requirements of the Securities Exchange Act of 1934 and the Investment Company Act of 1940, this Report has been signed below by the following persons on behalf of the Registrant and in the capacities and on the dates indicated.
| | |
| By: | | /s/ Stephen P. Fisher |
| | Stephen P. Fisher President and Principal Executive Officer |
| |
| Date: | | September 5, 2017 |
| |
| By: | | /s/ Jack R. Benintende |
| | Jack R. Benintende |
| | Treasurer and Principal Financial and Accounting Officer |
| |
| Date: | | September 5, 2017 |
EXHIBIT INDEX
| (a) | Certifications of principal executive officer and principal financial officer as required by Rule 30a-2 under the Investment Company Act of 1940. |
| (b) | Certification of principal executive officer and principal financial officer as required by Section 906 of the Sarbanes-Oxley Act of 2002. |