UNITED STATES
SECURITIES AND EXCHANGE COMMISSION
Washington, D.C. 20549
Form N-CSR
CERTIFIED SHAREHOLDER REPORT OF REGISTERED MANAGEMENT
INVESTMENT COMPANIES
Investment Company Act File Number 811-03833
MAINSTAY VP FUNDS TRUST
(Exact name of Registrant as specified in charter)
51 Madison Avenue, New York, NY 10010
(Address of principal executive offices) (Zip code)
J. Kevin Gao, Esq.
30 Hudson Street
Jersey City, New Jersey 07302
(Name and address of agent for service)
Registrant’s telephone number, including area code: (212) 576-7000
Date of fiscal year end: December 31
Date of reporting period: June 30, 2020
| Item 1. | Reports to Stockholders. |
MainStay VP Balanced Portfolio
Message from the President and Semiannual Report
Unaudited | June 30, 2020
Sign up for electronic delivery of your shareholder reports. For full details on electronic delivery, including who can participate and what you can receive via eDelivery, please log on to www.newyorklife.com/vsc

This page intentionally left blank
Message from the President
High levels of volatility shook financial markets in response to the COVID-19 pandemic and an abrupt decline in global economic activity during the six months ended June 30, 2020.
Markets entered 2020 riding strong fourth quarter performance and an economic expansion of historic longevity. Most broad stock and bond indices began to dip in late February as growing numbers of COVID-19 cases were seen in hotspots around the world. On March 11, 2020, the World Health Organization acknowledged that the disease had reached pandemic proportions, with over 80,000 identified cases in China, thousands in Italy, South Korea and the United States, and more in dozens of additional countries. Governments and central banks pledged trillions of dollars to address the mounting economic and public health crisis; however, “stay-at-home” orders and other restrictions on non-essential activity caused global economic activity to slow. Most stocks and bonds lost significant ground in this challenging environment, with equities declining by roughly a third and the yield on high-yield credit indices shooting higher.
Policymakers responded with extraordinary speed to address the situation. In the United States, the Federal Reserve (“Fed”) cut interest rates to near zero and announced unlimited quantitative easing. With help from Treasury, the Fed later rolled out a series of lending facilities to directly support market functioning. In late March, the Federal government declared a national emergency; Congress passed, and the President signed, a $2 trillion CARES Act (The Coronavirus Aid, Relief, and Economic Security Act), with the promise of further assistance for consumers and businesses to come. This enormous wave of policy support helped fuel a rapid recovery in market pricing as stocks bounced back and credit spreads narrowed. Some states rushed to ease restrictions on travel and social gatherings, further fueling optimism that the effects of the pandemic might prove short lived. However, the final weeks of the reporting period saw infection rates beginning to rise in some of the first states to reopen, raising concerns that a second round of restrictive government policies might prove necessary, once again stifling economic activity.
Despite all the market volatility, the broadly based S&P 500® Index finished the first half of 2020 only slightly below its starting point and the technology-heavy NASDAQ Composite Index posted gains, closing in near record territory. Small-cap stocks tended to trail their large cap counterparts, as illustrated by the Russell 2000® Index’s loss of approximately 15%, while value-oriented stocks lagged growth-oriented issues. From a global perspective, U.S. stocks generally outperformed international equities, with emerging markets hit particularly hard by the flight from risk.
Fixed-income markets also experienced unusually high levels of volatility. Recognized safe havens, such as U.S. government bonds, attracted increased investment, driving yields lower and prices higher, positioning long-term Treasury bonds to deliver particularly strong gains. Investment-grade corporate bonds lost value in March before recovering in the closing months of the reporting period, while relatively speculative high-yield credit faced the brunt of risk-off sentiment. Emerging market debt underperformed most other bonds types as investors sought to minimize currency and sovereign risks.
Today, as we at New York Life Investments continue to track the ongoing health crisis and its financial ramifications, we are particularly mindful of the people at the heart of our enterprise—our colleagues and valued clients. By taking appropriate steps to minimize community spread of COVID-19 within our organization, we strive to safeguard the health of our investment professionals so they can continue to provide you, as a MainStay investor, with world class investment solutions in this rapidly evolving environment.
Sincerely,

Kirk C. Lehneis
President
The opinions expressed are as of the date of this report and are subject to change. There is no guarantee that any forecast made will come to pass. This material does not constitute investment advice and is not intended as an endorsement of any specific investment. Past performance is no guarantee of future results.
Not part of the Semiannual Report
Table of Contents
Investors should refer to the Portfolio’s Summary Prospectus and/or Prospectus and consider the Portfolio’s investment objectives, strategies, risks, charges and expenses carefully before investing. The Summary Prospectus and/or Prospectus contain this and other information about the Portfolio. You may obtain copies of the Portfolio’s Summary Prospectus and/or the Prospectus and the Statement of Additional Information free of charge, upon request, by calling toll-free 800-598-2019, by writing to New York Life Insurance and Annuity Corporation, 51 Madison Avenue, Room 251, New York, New York 10010 or by sending an email to MainStayShareholdersServices@nylim.com. These documents are also available at nylinvestments.com/vpdocuments. Please read the Summary Prospectus and/or Prospectus carefully before investing. MainStay VP Funds Trust portfolios are separate account options which are purchased through a variable insurance or variable annuity contract.
Investment and Performance Comparison1 (Unaudited)
Performance data quoted represents past performance. Past performance is no guarantee of future results. Because of market volatility and other factors, current performance may be lower or higher than the figures shown. Investment return and principal value will fluctuate, and as a result, when shares are redeemed, they may be worth more or less than their original cost. The performance table and graph do not reflect any deduction of sales charges, mortality and expense charges, contract charges or administrative charges. Please refer to the Performance Summary appropriate for your policy. For performance information current to the most recent month-end, please call 800-598-2019 or visit www.newyorklife.com.
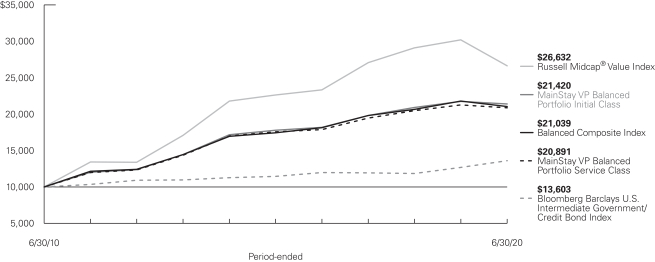
Average Annual Total Returns for the Period-Ended June 30, 2020
| | | | | | | | | | | | | | | | | | | | | | |
| Class | | Inception
Date | | Six Months | | | One Year | | | Five Years | | | Ten Years | | | Gross
Expense
Ratio2 | |
| | | | | | |
| Initial Class Shares | | 5/2/2005 | | | –5.73 | % | | | –1.56 | % | | | 3.77 | % | | | 7.92 | % | | | 0.77 | % |
| Service Class Shares | | 5/2/2005 | | | –5.84 | | | | –1.81 | | | | 3.51 | | | | 7.65 | | | | 1.02 | |
| | | | | | | | | | | | | | | | |
| Benchmark Performance | | Six Months | | | One Year | | | Five Years | | | Ten Years | |
| | | | |
Russell Midcap® Value Index3 | | | –18.09 | % | | | –11.81 | % | | | 3.32 | % | | | 10.29 | % |
Bloomberg Barclays U.S. Intermediate Government/Credit Bond Index4 | | | 5.28 | | | | 7.12 | | | | 3.46 | | | | 3.13 | |
Balanced Composite Index5 | | | –8.41 | | | | –3.52 | | | | 3.82 | | | | 7.72 | |
Morningstar Allocation—50% to 70% Equity Category Average6 | | | –3.58 | | | | 2.30 | | | | 5.22 | | | | 7.88 | |
| 1. | Performance figures may reflect certain fee waivers and/or expense limitations, without which total returns may have been different. For information on current fee waivers and/or expense limitations (if any), please refer to the Notes to Financial Statements. |
| 2. | The gross expense ratios presented reflect the Portfolio’s “Total Annual Portfolio Operating Expenses” from the most recent Prospectus and may differ from other expense ratios disclosed in this report. |
| 3. | The Russell Midcap® Value Index is the Portfolio’s primary broad-based securities market index for comparison purposes. The Russell Midcap® Value Index measures the performance of the mid-cap value segment of the U.S. equity universe. It includes those Russell Midcap® Index companies with lower price-to-book ratios and lower forecasted growth values. Results assume reinvestment of all dividends and capital gains. An investment cannot be made directly in an index. |
| 4. | The Portfolio has selected the Bloomberg Barclays U.S. Intermediate Government/Credit Bond Index as a secondary benchmark. The Bloomberg Barclays U.S. Intermediate Government/Credit Bond Index measures the performance of U.S. dollar-denominated U.S. Treasurys, government-related |
| | and investment-grade U.S. corporate securities that have a remaining maturity of greater than one year and less than ten years. Results assume reinvestment of all dividends and capital gains. An investment cannot be made directly in an index. |
| 5. | The Portfolio has selected the Balanced Composite Index as an additional benchmark. The Balanced Composite Index consists of the Russell Midcap® Value Index (60% weighted) and the Bloomberg Barclays U.S. Intermediate Government/Credit Bond Index (40% weighted). Results assume reinvestment of all dividends and capital gains. An investment cannot be made directly in an index. |
| 6. | The Morningstar Allocation—50% to 70% Equity Category Average is representative of funds that seek to provide both income and capital appreciation by investing in multiple asset classes, including stocks, bonds, and cash. These portfolios are dominated by domestic holdings and have equity exposures between 50% and 70%. Results are based on average total returns of similar funds with all dividends and capital gain distributions reinvested. |
Cost in Dollars of a $1,000 Investment in MainStay VP Balanced Portfolio (Unaudited)
The example below is intended to describe the fees and expenses borne by shareholders during the six-month period from January 1, 2020, to June 30, 2020, and the impact of those costs on your investment.
Example
As a shareholder of the Portfolio you incur two types of costs: (1) transaction costs, including exchange fees and sales charges (loads) on purchases (as applicable), and (2) ongoing costs, including management fees, distribution and/or service (12b-1) fees, and other Portfolio expenses (as applicable). This example is intended to help you understand your ongoing costs (in dollars) of investing in the Portfolio and to compare these costs with the ongoing costs of investing in other mutual funds. The example is based on an investment of $1,000 made at the beginning of the six-month period and held for the entire period from January 1, 2020, to June 30, 2020. Shares are only sold in connection with variable life and annuity contracts and the example does not reflect any contract level or transactional fees or expenses. If these costs had been included, your costs would have been higher.
This example illustrates your Portfolio’s ongoing costs in two ways:
Actual Expenses
The second and third data columns in the table below provide information about actual account values and actual expenses. You may use the information in these columns, together with the amount you invested, to estimate the expenses that you paid during the six months ended June 30, 2020. Simply divide your account value by $1,000
(for example, an $8,600 account value divided by $1,000 = 8.6), then multiply the result by the number under the heading entitled “Expenses Paid During Period” to estimate the expenses you paid on your account during this period.
Hypothetical Example for Comparison Purposes
The fourth and fifth data columns in the table below provide information about hypothetical account values and hypothetical expenses based on the Portfolio’s actual expense ratio and an assumed rate of return of 5% per year before expenses, which is not the Portfolio’s actual return. The hypothetical account values and expenses may not be used to estimate the actual ending account balances or expenses you paid for the six-month period shown. You may use this information to compare the ongoing costs of investing in the Portfolio with the ongoing costs of investing in other mutual funds. To do so, compare this 5% hypothetical example with the 5% hypothetical examples that appear in the shareholder reports of the other mutual funds.
Please note that the expenses shown in the table are meant to highlight your ongoing costs only and do not reflect any transactional costs, such as exchange fees or sales charges (loads). Therefore, the fourth and fifth data columns of the table are useful in comparing ongoing costs only and will not help you determine the relative total costs of owning different funds. In addition, if these transactional costs were included, your costs would have been higher.
| | | | | | | | | | | | | | | | | | | | | | |
| | | | | | | | | | | | | | | | | | |
| Share Class | | Beginning
Account
Value
1/1/20 | | | Ending Account
Value (Based
on Actual
Returns and
Expenses)
6/30/20 | | | Expenses
Paid
During
Period1 | | | Ending Account
Value (Based on
Hypothetical
5% Annualized
Return and
Actual Expenses)
6/30/20 | | | Expenses
Paid
During
Period1 | | | Net Expense
Ratio
During
Period2 |
| | | | | | |
| Initial Class Shares | | $ | 1,000.00 | | | $ | 942.70 | | | $ | 3.67 | | | $ | 1,021.08 | | | $ | 3.82 | | | 0.76% |
| | | | | | |
| Service Class Shares | | $ | 1,000.00 | | | $ | 941.60 | | | $ | 4.88 | | | $ | 1,019.84 | | | $ | 5.07 | | | 1.01% |
| 1. | Expenses are equal to the Portfolio’s annualized expense ratio of each class multiplied by the average account value over the period, divided by 366 and multiplied by 182 (to reflect the six-month period). The table above represents the actual expenses incurred during the six-month period. In addition to the fees and expenses which the Portfolio bears directly, it also indirectly bears a pro rata share of the fees and expenses of the underlying funds in which it invests. Such indirect expenses are not included in the above-reported expense figures. |
| 2. | Expenses are equal to the Portfolio’s annualized expense ratio to reflect the six-month period. |
| | |
| 6 | | MainStay VP Balanced Portfolio |
Portfolio Composition as of June 30, 2020 (Unaudited)
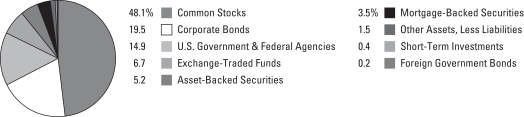
See Portfolio of Investments beginning on page 11 for specific holdings within these categories. The Portfolio’s holdings are subject to change.
Top Ten Holdings or Issuers Held as of June 30, 2020 (excluding short-term investments) (Unaudited)
| 1. | United States Treasury Notes, 0.125%–1.625%, due 6/30/22–5/15/30 |
| 2. | Vanguard Mid-Cap Value ETF |
| 3. | Federal Home Loan Bank, 2.50%–3.25%, due 9/13/24–11/16/28 |
| 4. | iShares Intermediate Government / Credit Bond ETF |
| 5. | iShares Russell 1000 Value ETF |
| 6. | Federal Farm Credit Bank, 0.71%–2.44%, due 6/17/24–5/28/30 |
| 7. | Federal National Mortgage Association, 0.50%–2.00%, due 7/2/24–6/17/25 |
Portfolio Management Discussion and Analysis (Unaudited)
Answers to the questions reflect the views of portfolio managers Jae S. Yoon, CFA, and Jonathan Swaney of New York Life Investment Management LLC, the Portfolio’s Manager; Kenneth Sommer and AJ Rzad, CFA, of NYL Investors LLC, the Portfolio’s fixed-income Subadvisor; and Migene Kim, CFA, and Mona Patni of MacKay Shields LLC, the Portfolio’s equity Subadvisor.
How did MainStay VP Balanced Portfolio perform relative to its benchmarks and peers during the six months ended June 30, 2020?
For the six months ended June 30, 2020, MainStay VP Balanced Portfolio returned –5.73% for Initial Class shares and –5.84% for Service Class shares. Over the same period, both share classes outperformed the –18.09% return of the Russell Midcap® Value Index, which is the Portfolio’s primary benchmark, and underperformed the 5.28% return of the Bloomberg Barclays U.S. Intermediate Government/Credit Bond Index, which is a secondary benchmark of the Portfolio. For the six months ended June 30, 2020, both share classes outperformed the –8.41% return of the Balanced Composite Index, which is an additional benchmark of the Portfolio, and underperformed the –3.58% return of the Morningstar Allocation—50% to 70% Equity Category Average.1
During the reporting period, were there any liquidity events that materially impacted the Portfolio’s performance?
With the 11-year equity bull market abruptly ending due to the social and economic impact of the COVID-19 pandemic, global equity markets were subject to extreme volatility and correlation during the reporting period. While the CBOE Volatility Index came down after peaking on March 16, volatility still remained elevated as uncertainties regarding reopening plans and vaccine/treatment progress persisted. This general market environment, with high volatility and frequent oscillation between positive and negative sentiments, did present occasional liquidity challenges, requiring us to be particularly prudent in terms of trade implementation and risk management. However, during the reporting period, we did not see liquidity events meaningfully impact the performance of the equity portion of the Portfolio.
During the reporting period, were there any market events that materially impacted the Portfolio’s performance or liquidity?
During the reporting period, the performance of the fixed-income portion of the Portfolio was materially impacted by the coronavirus pandemic. During the month of March, option-adjusted spreads2 (“OAS”) on relatively high-risk assets moved sharply wider as the virus spread throughout the United States, undermining the performance of the Portfolio’s overweight positions in corporates, commercial mortgage-backed securities and mortgage-backed securities compared to matched-duration3 U.S. Treasury bonds. The fixed-income portion of the Portfolio’s
overweight position in asset-backed securities also detracted from performance during the reporting period.
From a liquidity perspective, the first three months of the reporting period proved to be a challenging environment for all fixed-income investors. As investors flocked to the relative safety of cash and/or U.S. Treasury holdings, portfolio redemptions resulted in forced selling across the corporate landscape. This led to wider bid-ask spreads and a more difficult environment in which to transact. While the U.S. Federal Reserve’s heavy-handed response opened the primary market, secondary liquidity remained challenging until investors became more confident in the stability of the market.
What factors affected the Portfolio’s performance relative to its primary benchmark during the reporting period?
Both during and after the steep equity market decline in March 2020, growth-oriented stocks outperformed their value-oriented counterparts, accentuating a multi-year trend. Investors regarded familiar large-cap growth stocks as “safe,” while shunning cheaper stocks in areas such as energy, financials and industrials. Consequently, the spread4 between the Russell 1000® Growth Index and the Russell 1000® Value Index widened to historic levels. Not surprisingly, value-oriented investment vehicles experienced major drawdowns during the first quarter of 2020. Within the equity portion of the Portfolio, our momentum-based stock selection signals, which capture historical price trends, performed well during the first quarter, mitigating some of the headwinds from value, but momentum-driven investments were subject to a sharp, volatile sell-off during the second quarter amid market inflection. Quality and profitability signals mitigated downside risk, particularly during the March market downturn. However, hedge fund sentiment proved to be an ineffective indicator as the hedge fund community had a challenging time coping with market turmoil. The Portfolio’s balanced approach and defensive positioning with respect to risk helped it weather the market turmoil during the reporting period.
The fixed-income portion of the Portfolio maintained overweight positions relative to the Bloomberg Barclays U.S. Intermediate Government/Credit Bond Index in the corporate, asset-backed securities, commercial mortgage-backed securities, mortgage-backed securities and U.S. government agency sectors throughout the reporting period. The corporate sector was the best performing sector relative to the Index during the reporting period. Within the corporate sector, the Portfolio’s allocation to
| 1. | See page 5 for more information on benchmark and peer group returns. |
| 2. | The terms “spread” and “yield spread” may refer to the difference in yield between a security or type of security and comparable U.S. Treasury issues. The terms may also refer to the difference in yield between two specific securities or types of securities at a given time. |
| 3. | Duration is a measure of the price sensitivity of a fixed-income investment to changes in interest rates. Duration is expressed as a number of years and is considered a more accurate sensitivity gauge than average maturity. |
| 4. | The terms “spread” and “yield spread” may refer to the difference in yield between a security or type of security and comparable U.S. Treasury issues. The terms may also refer to the difference in yield between two specific securities or types of securities at a given time. |
| | |
| 8 | | MainStay VP Balanced Portfolio |
industrials, most specifically the basic, energy and transportation subsectors, was most accretive to returns. Within the utilities sector, the Portfolio’s allocation to the electric subsector was also accretive to performance during the reporting period. Within the non-corporate sector, the Portfolio’s underweight positioning relative to the Index in the foreign agencies subsector was accretive to performance as well. The Portfolio’s overweight position in commercial mortgage-backed securities, specifically the AA5 non-agency subcomponent, detracted from performance during the reporting period. Within the asset-backed securities sector, the Portfolio’s allocation to collateralized loan obligations detracted from performance. The Portfolio’s allocation to the fixed-rate subsector within the asset-backed securities sector was accretive to performance during the reporting period. The best performing subcomponents within the fixed-rate asset-backed securities sector were student loans and specialty finance.
During the reporting period, how was the Portfolio’s performance materially affected by investments in derivatives?
During the reporting period, the equity portion of the Portfolio did not use derivatives. Over the same period, the use of derivatives by the fixed-income portion of Portfolio was limited to interest-rate derivatives used to keep the duration of the Portfolio in line with the Subadvisor’s target. These interest-rate derivatives had a negative impact on performance.
During the reporting period, which sectors were the strongest positive contributors to relative performance in the equity portion of Portfolio and which sectors were particularly weak?
During the reporting period, the sectors making the strongest positive contributions to the performance of the equity portion of the Portfolio relative to the Russell Midcap® Value Index included the health care, technology and communication services sectors. (Contributions take weightings and total returns into account.) During the same period, the most significant detractors from benchmark-relative performance were the materials, industrials and utilities sectors.
During the reporting period, which individual stocks made the strongest positive contributions to the absolute performance of the equity portion of the Portfolio and which individual stocks detracted the most?
The stocks that made the most substantial positive contributions to the absolute performance of the equity portion of the Portfolio during the reporting period included gold miner Newmont, research & consulting services CoreLogic and global drug delivery outsourcing company Catalent. The stocks that
detracted most from the absolute performance of the equity portion of the Portfolio during the same period included mortgage REIT (real estate investment trust) MFA Financial, cruise company Norwegian Cruise Line Holdings and oil & gas driller Patterson-UTI Energy.
Did the equity portion of the Portfolio make any significant purchases or sales during the reporting period?
During the reporting period, the equity portion of the Portfolio made its largest initial purchase in shares of insurance broker Willis Towers Watson and its largest increase in position size in
industrial distributor HD Supply. Over the same period, the equity portion of the Portfolio made its largest complete sale of its position in multi-line insurer Hartford Financial Services Group and its most substantial decrease in position size in casino & gaming company MGM Resorts International.
How did sector weightings change in the equity portion of the Portfolio during the reporting period?
Relative to the Russell Midcap® Value Index, the equity portion of the Portfolio saw its most substantial weighting increases of the reporting period in the real estate and utilities sectors. Over the same period, the equity portion of the Portfolio saw its most significant decreases in sector exposures relative to the primary benchmark in consumer discretionary and industrials.
How was the equity portion of the Portfolio positioned at the end of the reporting period?
As of June 30, 2020, the equity portion of the Portfolio held its most substantially overweight sector positions relative to the Russell Midcap® Value Index in health care and consumer staples. As of the same date, the equity portion of the Portfolio held its most substantially underweight sector positions relative to the Russell Midcap® Value Index in real estate and consumer discretionary.
What was the duration strategy of the fixed-income portion of the Portfolio during the reporting period?
During the reporting period, the fixed-income portion of the Portfolio generally maintained a duration that was relatively close to that of the Bloomberg Barclays U.S. Intermediate Government/Credit Bond Index. During the first half of the reporting period, the Portfolio initiated a short duration position relative to its primary benchmark; this strategy had a negative impact on performance. During the second half of the reporting period, the Portfolio initiated a long duration position relative to its primary benchmark; this strategy was accretive to performance. Overall, the Portfolio’s duration strategy during the reporting period detracted from performance relative to its primary benchmark. As of June 30, 2020, the fixed-income
| 5. | An obligation rated ‘AA’ by Standard & Poor’s (“S&P”) is deemed by S&P to differ from the highest-rated obligations only to a small degree. In the opinion of S&P, the obligor’s capacity to meet its financial commitment on the obligation is very strong. When applied to Portfolio holdings, ratings are based solely on the creditworthiness of the bonds in the Portfolio and are not meant to represent the security or safety of the Portfolio. |
portion of the Portfolio had a duration of 4.09 years, equal to the duration of 4.09 years for the Bloomberg Barclays U.S. Intermediate Government/Credit Bond Index.
What specific factors, risks or market forces prompted significant decisions for the fixed-income portion of the Portfolio during the reporting period?
During the reporting period, the fixed-income portion of the Portfolio maintained overweight positions relative to the Bloomberg Barclays U.S. Intermediate Government/Credit Bond Index in corporate bonds, commercial mortgage-backed securities, asset-backed securities and U.S. government agencies. Toward the middle of the reporting period, as OAS on corporate bonds moved markedly higher, we increased the Portfolio’s exposure to the corporate sector; this decision was accretive to performance. Toward the end of the reporting period, COVID-19 cases began to once again spike after a short period of relative tranquility. In response to heightened volatility, we decreased our allocation to the corporate bond sector; this decision detracted slightly from performance. During the first half of the reporting period, we increased the Portfolio’s allocation to U.S. government callable agency securities. Spreads on U.S. government callable agency securities moved wider, creating an attractive opportunity to add to the Portfolio’s overweight position within the sector; this decision was slightly accretive to performance.
During the reporting period, which market segments made the strongest positive contributions to the performance of the fixed-income portion of the Portfolio and which market segments were particularly weak?
During the reporting period, the corporate sector made the strongest positive contribution to the performance of the fixed-income portion of the Portfolio. Within the corporate sector, positioning in the financials, industrials, and utilities subsectors made the largest contributions to absolute performance. Overweight positions in diversified financial companies Bank of
America and JPMorgan Chase, metals and mineral miner Anglo American and health services provider CVS Health all enhanced absolute performance. Positioning in the Treasury, U.S. government agencies, and mortgage-backed securities sectors also proved accretive to absolute performance.
During the same period, the commercial mortgage-backed securities sector was the weakest contributor to the absolute performance of the fixed-income portion of the Portfolio. Within the commercial mortgage-backed securities sector, positioning in credits rated AA proved particularly weak.
Did the fixed-income portion of the Portfolio make any significant purchases or sales during the reporting period?
During the reporting period, the fixed-income portion of the Portfolio generally sought to purchase corporate bonds during episodes of market weakness. As the market stabilized, the fixed-income portion of the Portfolio sold corporate bonds to reduce its overweight exposure relative to Bloomberg Barclays U.S. Intermediate Government/Credit Bond Index.
During the reporting period, how did sector weightings change in the fixed-income portion of the Portfolio?
During the reporting period, primarily between the beginning of March and the second half of April 2020, the fixed-income portion of the Portfolio reduced its allocation to commercial mortgage-backed securities by approximately 100 bps. (A basis point is one one-hundredth of a percentage point.) This shift reflected our cautious attitude regarding commercial real estate fundamentals; in each instance in which the Portfolio’s exposure was reduced we believed capital could be better allocated to opportunities in investment-grade credit. In another weighting change, the fixed-income portion of the Portfolio reduced its allocation to asset-backed securities by approximately 250 bps, primarily during the first quarter of 2020. Shorter-duration, higher-quality, low-yielding securities were sold to purchase investment-grade credit.
How was the fixed-income portion of the Portfolio positioned at the end of the reporting period?
As of June 30, 2020, the fixed-income portion of the Portfolio held overweight exposure relative to the Bloomberg Barclays U.S. Intermediate Government/Credit Bond Index in corporate bonds. Within the corporate sector, the fixed-income portion of the Portfolio held overweight exposure to financials, industrials and utilities. The fixed-income portion of the Portfolio also held overweight positions in asset-backed securities, commercial mortgage-backed securities, and U.S. government agencies, with the largest overweight allocation in the asset-backed securities sector. As of the same date, the fixed-income portion of the Portfolio held underweight exposure to the non-corporate sector, most notably the supranational subsector.
As of June 30, 2020, the fixed-income portion of the Portfolio maintained a duration that was equal to the duration of the Bloomberg Barclays U.S. Intermediate Government/Credit Bond Index.
The opinions expressed are those of the portfolio managers as of the date of this report and are subject to change. There is no guarantee that any forecasts will come to pass. This material does not constitute investment advice and is not intended as an endorsement of any specific investment.
Not all MainStay VP Portfolios and/or share classes are available under all policies.
| | |
| 10 | | MainStay VP Balanced Portfolio |
Portfolio of Investments June 30, 2020 (Unaudited)
| | | | | | | | |
| | | Principal
Amount | | | Value | |
Long-Term Bonds 43.3%† Asset-Backed Securities 5.2% | |
Automobile Asset-Backed Securities 0.1% | |
Toyota Auto Loan Extended Note Trust
Series 2020-1A, Class A
1.35%, due 5/25/33 (a) | | $ | 500,000 | | | $ | 507,494 | |
| | | | | | | | |
|
Other Asset-Backed Securities 5.1% | |
AIMCO CLO
Series 2017-AA, Class A
2.395% (3 Month LIBOR + 1.26%), due 7/20/29 (a)(b) | | | 250,000 | | | | 246,697 | |
Apidos CLO XV
Series 2013-15A, Class A1RR
2.145% (3 Month LIBOR + 1.01%), due 4/20/31 (a)(b) | | | 500,000 | | | | 487,022 | |
Apidos CLO XXV
Series 2016-25A, Class A1R
2.305% (3 Month LIBOR + 1.17%), due 10/20/31 (a)(b) | | | 400,000 | | | | 392,508 | |
Apidos CLO XXXII
Series 2019-32A, Class A1
3.003% (3 Month LIBOR + 1.32%), due 1/20/33 (a)(b) | | | 500,000 | | | | 490,700 | |
Ares XLI CLO, Ltd.
Series 2016-41A, Class AR
2.419% (3 Month LIBOR + 1.20%), due 1/15/29 (a)(b) | | | 600,000 | | | | 592,567 | |
Ares XXIX CLO, Ltd.
Series 2014-1A, Class A1R
2.325% (3 Month LIBOR + 1.19%), due 4/17/26 (a)(b) | | | 35,098 | | | | 35,082 | |
Bain Capital Credit CLO, Ltd.
Series 2016-2A, Class AR
2.359% (3 Month LIBOR + 1.14%), due 1/15/29 (a)(b) | | | 400,000 | | | | 396,304 | |
Benefit Street Partners CLO IV, Ltd.
Series 2014-IVA, Class A1
2.385% (3 Month LIBOR + 1.25%), due 1/20/29 (a)(b) | | | 300,000 | | | | 296,840 | |
Benefit Street Partners CLO XVIII, Ltd.
Series 2019-18A, Class A
2.559% (3 Month LIBOR + 1.34%), due 10/15/32 (a)(b) | | | 250,000 | | | | 244,453 | |
Cedar Funding IV CLO, Ltd.
Series 2014-4A, Class AR
2.273% (3 Month LIBOR + 1.23%), due 7/23/30 (a)(b) | | | 750,000 | | | | 739,750 | |
Dell Equipment Finance Trust
Series 2020-1, Class A2
2.26%, due 6/22/22 (a) | | | 300,000 | | | | 305,133 | |
| | | | | | | | |
| | | Principal
Amount | | | Value | |
Other Asset-Backed Securities (continued) | |
Deutsche Bank Master Finance LLC
Series 2019-1A, Class A2I
3.787%, due 5/20/49 (a) | | $ | 545,875 | | | $ | 563,338 | |
Domino’s Pizza Master Issuer LLC
Series 2017-1A, Class A2II
3.082%, due 7/25/47 (a) | | | 1,267,500 | | | | 1,294,599 | |
Dryden 57 CLO, Ltd.
Series 2018-57A, Class A
1.402% (3 Month LIBOR + 1.01%), due 5/15/31 (a)(b) | | | 600,000 | | | | 583,234 | |
Dryden CLO, Ltd.
Series 2019-76A, Class A1
2.465% (3 Month LIBOR + 1.33%), due 10/20/32 (a)(b) | | | 250,000 | | | | 246,253 | |
Elara HGV Timeshare Issuer LLC
Series 2017-A, Class A
2.69%, due 3/25/30 (a) | | | 85,457 | | | | 85,403 | |
ELFI Graduate Loan Program LLC
Series 2019-A, Class A
2.54%, due 3/25/44 (a) | | | 562,108 | | | | 576,092 | |
FOCUS Brands Funding LLC
Series 2017-1A, Class A2I
3.857%, due 4/30/47 (a) | | | 97,000 | | | | 91,553 | |
Galaxy XXII CLO, Ltd.
Series 2016-22A, Class A1R
2.176% (3 Month LIBOR + 1.00%), due 7/16/28 (a)(b) | | | 250,000 | | | | 246,481 | |
Hilton Grand Vacations Trust
Series 2018-AA, Class A
3.54%, due 2/25/32 (a) | | | 266,435 | | | | 271,399 | |
HPS Loan Management, Ltd.
Series 2011A-17, Class AR
2.815% (3 Month LIBOR + 1.02%), due 5/6/30 (a)(b) | | | 850,000 | | | | 829,064 | |
Magnetite XVIII, Ltd. (a)(b) | | | | | | | | |
Series 2016-18A, Class AR
1.472% (3 Month LIBOR + 1.08%), due 11/15/28 | | | 400,000 | | | | 394,118 | |
Series 2019-23A, Class A
2.291% (3 Month LIBOR + 1.30%), due 10/25/32 | | | 250,000 | | | | 245,191 | |
MVW Owner Trust
Series 2019-1A, Class A
2.89%, due 11/20/36 (a) | | | 198,496 | | | | 201,911 | |
Navient Private Education Refi Loan Trust
Series 2019-CA, Class A2
3.13%, due 2/15/68 (a) | | | 300,000 | | | | 309,487 | |
Neuberger Berman CLO XIV, Ltd.
Series 2013-14A, Class AR2
1.917% (3 Month LIBOR + 1.03%), due 1/28/30 (a)(b) | | | 250,000 | | | | 245,515 | |
| | | | | | |
The notes to the financial statements are an integral part of,
and should be read in conjunction with, the financial statements. | | | | | 11 | |
Portfolio of Investments June 30, 2020 (Unaudited) (continued)
| | | | | | | | |
| | | Principal
Amount | | | Value | |
| Asset-Backed Securities (continued) | |
Other Asset-Backed Securities (continued) | |
Neuberger Berman Loan Advisers CLO,Ltd.
Series 2017-24A, Class AR
2.155% (3 Month LIBOR + 1.02%), due 4/19/30 (a)(b) | | $ | 250,000 | | | $ | 245,362 | |
Octagon Investment Partners 29, Ltd.
Series 2016-1A, Class AR
2.20% (3 Month LIBOR + 1.18%), due 1/24/33 (a)(b) | | | 350,000 | | | | 338,151 | |
Octagon Investment Partners 30, Ltd.
Series 2017-1A, Class A1
2.455% (3 Month LIBOR + 1.32%), due 3/17/30 (a)(b) | | | 350,000 | | | | 343,749 | |
Palmer Square CLO, Ltd. (a)(b) | | | | | | | | |
Series 2015-1A, Class A1R2
1.594% (3 Month LIBOR + 1.22%), due 5/21/29 | | | 500,000 | | | | 495,535 | |
Series 2014-1A, Class A1R2
2.265% (3 Month LIBOR + 1.13%), due 1/17/31 | | | 250,000 | | | | 245,888 | |
Series-2015-2A, Class A2R2
2.685% (3 Month LIBOR + 1.55%), due 7/20/30 | | | 750,000 | | | | 728,557 | |
Regatta VI Funding, Ltd.
Series 2016-1A, Class AR
2.215% (3 Month LIBOR + 1.08%), due 7/20/28 (a)(b) | | | 650,000 | | | | 642,146 | |
Sierra Timeshare Receivables Funding Co. LLC
Series 2019-1A, Class A
3.20%, due 1/20/36 (a) | | | 104,559 | | | | 106,590 | |
SMB Private Education Loan Trust
Series 2019-B, Class A2A
2.84%, due 6/15/37 (a) | | | 500,000 | | | | 516,407 | |
SoFi Professional Loan Program LLC (a) | | | | | | | | |
Series 2019-C, Class A2FX
2.37%, due 11/16/48 | | | 250,000 | | | | 255,200 | |
Series 2020-A, Class A2FX
2.54%, due 5/15/46 | | | 200,000 | | | | 207,250 | |
Series 2019-A, Class A1FX
3.18%, due 6/15/48 | | | 89,797 | | | | 90,382 | |
Taco Bell Funding, LLC
Series 2018-1A, Class A2I
4.318%, due 11/25/48 (a) | | | 394,000 | | | | 402,384 | |
THL Credit Wind River CLO, Ltd.
Series 2017-4A, Class A
1.527% (3 Month LIBOR + 1.15%), due 11/20/30 (a)(b) | | | 250,000 | | | | 244,705 | |
TIAA CLO III, Ltd.
Series 2017-2A, Class A
2.326% (3 Month LIBOR + 1.15%), due 1/16/31 (a)(b) | | | 350,000 | | | | 336,901 | |
| | | | | | | | |
| | | Principal
Amount | | | Value | |
Other Asset-Backed Securities (continued) | |
TICP CLO XIII, Ltd.
Series 2019 13A, Class A
2.519% (3 Month LIBOR + 1.30%), due 7/15/32 (a)(b) | | $ | 350,000 | | | $ | 345,818 | |
Treman Park CLO, Ltd.
Series 2015-1A, Class ARR
2.205% (3 Month LIBOR + 1.07%), due 10/20/28 (a)(b) | | | 260,000 | | | | 256,926 | |
Voya CLO, Ltd.
Series 2019-1A, Class AR
2.279% (3 Month LIBOR + 1.06%), due 4/15/31 (a)(b) | | | 250,000 | | | | 242,403 | |
Westcott Park CLO, Ltd.
Series 2016 1A, Class AR
2.345% (3 Month LIBOR + 1.21%), due 7/20/28 (a)(b) | | | 400,000 | | | | 395,552 | |
| | | | | | | | |
| | | | | | | 16,850,600 | |
| | | | | | | | |
Total Asset-Backed Securities
(Cost $17,424,485) | | | | | | | 17,358,094 | |
| | | | | | | | |
|
| Corporate Bonds 19.5% | |
Aerospace & Defense 0.6% | |
BAE Systems Holdings, Inc.
3.85%, due 12/15/25 (a) | | | 445,000 | | | | 492,744 | |
Boeing Co. | | | | | | | | |
2.70%, due 2/1/27 | | | 325,000 | | | | 317,449 | |
2.95%, due 2/1/30 | | | 375,000 | | | | 369,584 | |
3.10%, due 5/1/26 | | | 240,000 | | | | 244,556 | |
5.15%, due 5/1/30 | | | 425,000 | | | | 473,888 | |
| | | | | | | | |
| | | | | | | 1,898,221 | |
| | | | | | | | |
Apparel 0.2% | |
Nike, Inc.
2.85%, due 3/27/30 | | | 325,000 | | | | 361,422 | |
Ralph Lauren Corp.
1.70%, due 6/15/22 | | | 150,000 | | | | 152,484 | |
| | | | | | | | |
| | | | | | | 513,906 | |
| | | | | | | | |
Auto Manufacturers 1.4% | |
Daimler Finance North America LLC
1.292% (3 Month LIBOR + 0.90%), due 2/15/22 (a)(b) | | | 550,000 | | | | 543,469 | |
Ford Motor Credit Co. LLC | | | | | | | | |
3.087%, due 1/9/23 | | | 425,000 | | | | 404,813 | |
3.664%, due 9/8/24 | | | 975,000 | | | | 919,142 | |
General Motors Financial Co., Inc. | | | | | | | | |
4.35%, due 4/9/25 | | | 600,000 | | | | 632,215 | |
5.20%, due 3/20/23 | | | 175,000 | | | | 187,025 | |
Toyota Motor Credit Corp.
1.80%, due 2/13/25 | | | 600,000 | | | | 621,919 | |
| | | | |
| 12 | | MainStay VP Balanced Portfolio | | The notes to the financial statements are an integral part of,
and should be read in conjunction with, the financial statements. |
| | | | | | | | |
| | | Principal
Amount | | | Value | |
| Corporate Bonds (continued) | |
Auto Manufacturers (continued) | |
Volkswagen Group of America Finance LLC (a) | | | | | | | | |
1.157% (3 Month LIBOR + 0.86%), due 9/24/21 (b) | | $ | 275,000 | | | $ | 274,023 | |
4.00%, due 11/12/21 | | | 925,000 | | | | 962,928 | |
| | | | | | | | |
| | | | | | | 4,545,534 | |
| | | | | | | | |
Banks 4.3% | |
Bank of America Corp.
4.45%, due 3/3/26 | | | 2,130,000 | | | | 2,452,151 | |
BNP Paribas S.A.
2.219%, due 6/9/26 (a)(c) | | | 250,000 | | | | 256,004 | |
Citigroup, Inc.
4.60%, due 3/9/26 | | | 805,000 | | | | 919,347 | |
Credit Suisse A.G.
2.95%, due 4/9/25 | | | 475,000 | | | | 515,739 | |
Credit Suisse Group A.G.
2.193%, due 6/5/26 (a)(c) | | | 665,000 | | | | 673,511 | |
Fifth Third Bancorp
4.30%, due 1/16/24 | | | 875,000 | | | | 965,037 | |
Goldman Sachs Group, Inc.
3.85%, due 1/26/27 | | | 550,000 | | | | 620,408 | |
Huntington Bancshares, Inc.
2.625%, due 8/6/24 | | | 1,250,000 | | | | 1,323,576 | |
JPMorgan Chase & Co. (c) | | | | | | | | |
2.083%, due 4/22/26 | | | 1,405,000 | | | | 1,459,259 | |
2.956%, due 5/13/31 | | | 450,000 | | | | 477,263 | |
Lloyds Banking Group PLC
2.907%, due 11/7/23 (c) | | | 430,000 | | | | 447,484 | |
Mizuho Financial Group, Inc. (b) | | | | | | | | |
0.99% (3 Month LIBOR + 0.63%), due 5/25/24 | | | 1,430,000 | | | | 1,401,408 | |
1.163% (3 Month LIBOR + 0.85%), due 9/13/23 | | | 300,000 | | | | 298,269 | |
Morgan Stanley | | | | | | | | |
3.625%, due 1/20/27 | | | 300,000 | | | | 338,712 | |
4.35%, due 9/8/26 | | | 695,000 | | | | 801,391 | |
Santander UK PLC
2.10%, due 1/13/23 | | | 200,000 | | | | 206,788 | |
Swedbank A.B.
1.30%, due 6/2/23 (a) | | | 725,000 | | | | 733,693 | |
Truist Bank
1.50%, due 3/10/25 | | | 400,000 | | | | 410,550 | |
| | | | | | | | |
| | | | | | | 14,300,590 | |
| | | | | | | | |
Beverages 0.3% | |
Anheuser-Busch InBev Worldwide, Inc.
4.75%, due 1/23/29 | | | 660,000 | | | | 797,474 | |
Diageo Capital PLC
2.125%, due 4/29/32 | | | 325,000 | | | | 336,988 | |
| | | | | | | | |
| | | | | | | 1,134,462 | |
| | | | | | | | |
| | | | | | | | |
| | | Principal
Amount | | | Value | |
Building Materials 0.6% | |
Carrier Global Corp.
2.722%, due 2/15/30 (a) | | $ | 425,000 | | | $ | 426,846 | |
Masco Corp.
4.45%, due 4/1/25 | | | 675,000 | | | | 764,503 | |
Owens Corning
3.95%, due 8/15/29 | | | 600,000 | | | | 653,657 | |
Vulcan Materials Co.
3.50%, due 6/1/30 | | | 125,000 | | | | 136,166 | |
| | | | | | | | |
| | | | | | | 1,981,172 | |
| | | | | | | | |
Chemicals 0.5% | |
Air Products & Chemicals, Inc.
2.05%, due 5/15/30 | | | 300,000 | | | | 314,881 | |
Albemarle Corp.
1.442% (3 Month LIBOR + 1.05%), due 11/15/22 (a)(b) | | | 575,000 | | | | 552,546 | |
E.I. du Pont de Nemours & Co.
1.70%, due 7/15/25 | | | 150,000 | | | | 154,869 | |
NewMarket Corp.
4.10%, due 12/15/22 | | | 475,000 | | | | 504,992 | |
Nutrien, Ltd.
3.625%, due 3/15/24 | | | 175,000 | | | | 189,114 | |
| | | | | | | | |
| | | | | | | 1,716,402 | |
| | | | | | | | |
Commercial Services 0.2% | |
Equifax, Inc.
2.60%, due 12/15/25 | | | 675,000 | | | | 719,026 | |
| | | | | | | | |
|
Computers 0.1% | |
DXC Technology Co.
4.00%, due 4/15/23 | | | 175,000 | | | | 183,666 | |
NetApp, Inc.
1.875%, due 6/22/25 | | | 150,000 | | | | 152,137 | |
| | | | | | | | |
| | | | | | | 335,803 | |
| | | | | | | | |
Diversified Financial Services 0.6% | |
Blackstone Holdings Finance Co. LLC
2.50%, due 1/10/30 (a) | | | 300,000 | | | | 312,937 | |
GE Capital International Funding Co.
3.373%, due 11/15/25 | | | 1,215,000 | | | | 1,274,865 | |
Intercontinental Exchange, Inc.
2.10%, due 6/15/30 | | | 425,000 | | | | 431,844 | |
| | | | | | | | |
| | | | | | | 2,019,646 | |
| | | | | | | | |
Electric 2.5% | |
Commonwealth Edison Co.
3.10%, due 11/1/24 | | | 475,000 | | | | 509,960 | |
DTE Electric Co.
2.65%, due 6/15/22 | | | 450,000 | | | | 465,401 | |
Electricite de France S.A.
2.35%, due 10/13/20 (a) | | | 1,775,000 | | | | 1,780,902 | |
Emera U.S. Finance, L.P.
2.70%, due 6/15/21 | | | 875,000 | | | | 890,996 | |
| | | | | | |
The notes to the financial statements are an integral part of,
and should be read in conjunction with, the financial statements. | | | | | 13 | |
Portfolio of Investments June 30, 2020 (Unaudited) (continued)
| | | | | | | | |
| | | Principal
Amount | | | Value | |
| Corporate Bonds (continued) | |
Electric (continued) | |
Entergy Arkansas LLC
3.70%, due 6/1/24 | | $ | 450,000 | | | $ | 495,912 | |
Entergy Corp.
4.00%, due 7/15/22 | | | 875,000 | | | | 928,705 | |
Evergy, Inc.
4.85%, due 6/1/21 | | | 330,000 | | | | 339,070 | |
Exelon Corp.
4.05%, due 4/15/30 | | | 250,000 | | | | 288,675 | |
FirstEnergy Transmission LLC
4.35%, due 1/15/25 (a) | | | 600,000 | | | | 678,581 | |
NextEra Energy Capital Holdings, Inc.
3.25%, due 4/1/26 | | | 450,000 | | | | 503,721 | |
PacifiCorp
2.70%, due 9/15/30 | | | 425,000 | | | | 463,006 | |
Pinnacle West Capital Corp.
1.30%, due 6/15/25 | | | 525,000 | | | | 531,450 | |
WEC Energy Group, Inc.
3.375%, due 6/15/21 | | | 400,000 | | | | 411,200 | |
| | | | | | | | |
| | | | | | | 8,287,579 | |
| | | | | | | | |
Electrical Components & Equipment 0.1% | |
Emerson Electric Co.
1.80%, due 10/15/27 | | | 350,000 | | | | 362,053 | |
| | | | | | | | |
|
Food 0.2% | |
Conagra Brands, Inc.
4.85%, due 11/1/28 | | | 400,000 | | | | 480,243 | |
Ingredion, Inc.
4.625%, due 11/1/20 | | | 175,000 | | | | 176,944 | |
| | | | | | | | |
| | | | | | | 657,187 | |
| | | | | | | | |
Health Care—Products 0.1% | |
Boston Scientific Corp.
1.90%, due 6/1/25 | | | 150,000 | | | | 155,454 | |
Stryker Corp.
1.95%, due 6/15/30 | | | 265,000 | | | | 266,768 | |
| | | | | | | | |
| | | | | | | 422,222 | |
| | | | | | | | |
Insurance 0.3% | |
MET Tower Global Funding
0.608% (SOFR + 0.55%), due 1/17/23 (a)(b) | | | 850,000 | | | | 843,513 | |
| | | | | | | | |
|
Iron & Steel 0.5% | |
Carpenter Technology Corp.
4.45%, due 3/1/23 | | | 125,000 | | | | 123,731 | |
Nucor Corp.
2.00%, due 6/1/25 | | | 250,000 | | | | 258,890 | |
Reliance Steel & Aluminum Co.
4.50%, due 4/15/23 | | | 825,000 | | | | 884,816 | |
| | | | | | | | |
| | | Principal
Amount | | | Value | |
Iron & Steel (continued) | | | | | | | | |
Steel Dynamics, Inc. | | | | | | | | |
2.40%, due 6/15/25 | | $ | 225,000 | | | $ | 231,727 | |
3.25%, due 1/15/31 | | | 100,000 | | | | 101,995 | |
| | | | | | | | |
| | | | | | | 1,601,159 | |
| | | | | | | | |
Machinery—Diversified 0.2% | |
CNH Industrial Capital LLC
1.95%, due 7/2/23 | | | 275,000 | | | | 276,805 | |
Deere & Co.
3.10%, due 4/15/30 | | | 400,000 | | | | 453,539 | |
| | | | | | | | |
| | | | | | | 730,344 | |
| | | | | | | | |
Media 0.2% | |
Comcast Corp.
3.10%, due 4/1/25 | | | 325,000 | | | | 358,121 | |
Discovery Communications LLC
3.625%, due 5/15/30 | | | 125,000 | | | | 136,600 | |
| | | | | | | | |
| | | | | | | 494,721 | |
| | | | | | | | |
Mining 0.1% | |
Anglo American Capital PLC
5.625%, due 4/1/30 (a) | | | 400,000 | | | | 483,171 | |
| | | | | | | | |
|
Oil & Gas 0.3% | |
Chevron Corp.
2.236%, due 5/11/30 | | | 400,000 | | | | 418,903 | |
Equinor ASA
1.75%, due 1/22/26 | | | 200,000 | | | | 204,859 | |
Occidental Petroleum Corp.
1.842% (3 Month LIBOR + 1.45%), due 8/15/22 (b) | | | 375,000 | | | | 345,073 | |
| | | | | | | | |
| | | | | | | 968,835 | |
| | | | | | | | |
Oil & Gas Services 0.4% | |
Schlumberger Holdings Corp.
3.75%, due 5/1/24 (a) | | | 1,075,000 | | | | 1,157,128 | |
| | | | | | | | |
|
Packaging & Containers 0.3% | |
WRKCo., Inc.
3.75%, due 3/15/25 | | | 800,000 | | | | 884,362 | |
| | | | | | | | |
|
Pharmaceuticals 1.6% | |
AbbVie, Inc.
2.95%, due 11/21/26 (a) | | | 825,000 | | | | 897,310 | |
Bayer U.S. Finance II LLC
4.375%, due 12/15/28 (a) | | | 600,000 | | | | 701,197 | |
Becton Dickinson & Co.
2.894%, due 6/6/22 | | | 1,413,000 | | | | 1,463,270 | |
Cigna Corp.
4.125%, due 11/15/25 | | | 1,140,000 | | | | 1,310,461 | |
CVS Health Corp.
3.75%, due 4/1/30 | | | 915,000 | | | | 1,054,177 | |
| | | | | | | | |
| | | | | | | 5,426,415 | |
| | | | | | | | |
| | | | |
| 14 | | MainStay VP Balanced Portfolio | | The notes to the financial statements are an integral part of,
and should be read in conjunction with, the financial statements. |
| | | | | | | | |
| | | Principal
Amount | | | Value | |
| Corporate Bonds (continued) | |
Pipelines 1.0% | |
Energy Transfer Partners, L.P. / Regency Energy Finance Corp.
5.875%, due 3/1/22 | | $ | 1,000,000 | | | $ | 1,055,174 | |
Kinder Morgan, Inc.
5.00%, due 2/15/21 (a) | | | 1,489,000 | | | | 1,521,005 | |
MPLX, L.P.
1.213% (3 Month LIBOR + 0.90%), due 9/9/21 (b) | | | 400,000 | | | | 396,829 | |
Texas Eastern Transmission, L.P.
2.80%, due 10/15/22 (a) | | | 200,000 | | | | 203,553 | |
| | | | | | | | |
| | | | | | | 3,176,561 | |
| | | | | | | | |
Real Estate Investment Trusts 1.6% | |
American Campus Communities Operating Partnership, L.P.
3.30%, due 7/15/26 | | | 775,000 | | | | 794,762 | |
CyrusOne L.P. / CyrusOne Finance Corp.
3.45%, due 11/15/29 | | | 275,000 | | | | 286,261 | |
Healthpeak Properties, Inc.
3.25%, due 7/15/26 | | | 525,000 | | | | 573,753 | |
Highwoods Realty, L.P.
3.875%, due 3/1/27 | | | 1,175,000 | | | | 1,241,324 | |
Kimco Realty Corp.
3.80%, due 4/1/27 | | | 200,000 | | | | 213,605 | |
Realty Income Corp.
3.25%, due 10/15/22 | | | 550,000 | | | | 576,075 | |
SBA Tower Trust
2.836%, due 1/15/25 (a) | | | 500,000 | | | | 515,515 | |
VEREIT Operating Partnership, L.P.
3.95%, due 8/15/27 | | | 1,015,000 | | | | 1,056,299 | |
| | | | | | | | |
| | | | | | | 5,257,594 | |
| | | | | | | | |
Semiconductors 0.2% | |
Applied Materials, Inc.
1.75%, due 6/1/30 | | | 375,000 | | | | 383,260 | |
Broadcom, Inc.
2.25%, due 11/15/23 (a) | | | 275,000 | | | | 284,133 | |
| | | | | | | | |
| | | | | | | 667,393 | |
| | | | | | | | |
Software 0.2% | |
Fiserv, Inc.
2.25%, due 6/1/27 | | | 550,000 | | | | 575,132 | |
Infor, Inc.
1.75%, due 7/15/25 (a) | | | 200,000 | | | | 200,836 | |
| | | | | | | | |
| | | | | | | 775,968 | |
| | | | | | | | |
Telecommunications 0.8% | |
AT&T, Inc.
4.35%, due 3/1/29 | | | 675,000 | | | | 787,022 | |
T-Mobile USA, Inc.
2.55%, due 2/15/31 (a) | | | 1,000,000 | | | | 1,003,520 | |
| | | | | | | | |
| | | Principal
Amount | | | Value | |
Telecommunications (continued) | |
Verizon Communications, Inc. | | | | | | | | |
3.376%, due 2/15/25 | | $ | 6,000 | | | $ | 6,676 | |
4.016%, due 12/3/29 | | | 787,000 | | | | 938,559 | |
| | | | | | | | |
| | | | | | | 2,735,777 | |
| | | | | | | | |
Textiles 0.1% | |
Mohawk Industries, Inc.
3.625%, due 5/15/30 | | | 390,000 | | | | 424,840 | |
| | | | | | | | |
Total Corporate Bonds
(Cost $61,325,642) | | | | | | | 64,521,584 | |
| | | | | | | | |
|
| Foreign Government Bonds 0.2% | |
Colombia 0.1% | |
Colombia Government International Bond
3.875%, due 4/25/27 | | | 220,000 | | | | 231,277 | |
| | | | | | | | |
|
Mexico 0.1% | |
United Mexican States
3.75%, due 1/11/28 | | | 300,000 | | | | 312,105 | |
| | | | | | | | |
|
Philippines 0.0%‡ | |
Philippine Government International Bond
3.00%, due 2/1/28 | | | 200,000 | | | | 215,766 | |
| | | | | | | | |
|
Poland 0.0%‡ | |
Republic of Poland Government International Bond
5.00%, due 3/23/22 | | | 50,000 | | | | 53,625 | |
| | | | | | | | |
Total Foreign Government Bonds
(Cost $748,931) | | | | | | | 812,773 | |
| | | | | | | | |
|
| Mortgage-Backed Securities 3.5% | |
Commercial Mortgage Loans
(Collateralized Mortgage Obligations) 2.6% | |
Bank | | | | | | | | |
Series 2017-BNK5, Class A2
2.987%, due 6/15/60 | | | 300,000 | | | | 308,321 | |
Series 2018-BN14, Class A2
4.128%, due 9/15/60 | | | 400,000 | | | | 433,587 | |
Benchmark Mortgage Trust | | | | | | | | |
Series 2018-B1, Class A2
3.571%, due 1/15/51 | | | 200,000 | | | | 206,512 | |
Series 2018-B2, Class A2
3.662%, due 2/15/51 | | | 150,000 | | | | 157,148 | |
BX Commercial Mortgage Trust
Series 2019-XL, Class A
1.105% (1 Month LIBOR + 0.92%), due 10/15/36 (a)(b) | | | 477,700 | | | | 474,064 | |
| | | | | | |
The notes to the financial statements are an integral part of,
and should be read in conjunction with, the financial statements. | | | | | 15 | |
Portfolio of Investments June 30, 2020 (Unaudited) (continued)
| | | | | | | | |
| | | Principal
Amount | | | Value | |
| Mortgage-Backed Securities (continued) | |
Commercial Mortgage Loans
(Collateralized Mortgage Obligations) (continued) | |
CD Mortgage Trust
Series 2017-CD4, Class A2
3.03%, due 5/10/50 | | $ | 600,000 | | | $ | 615,908 | |
CFCRE Commercial Mortgage Trust
Series 2017-C8, Class A2
2.982%, due 6/15/50 | | | 900,000 | | | | 922,596 | |
Citigroup Commercial Mortgage Trust
Series 2020-GC46, Class A5
2.717%, due 2/15/53 | | | 500,000 | | | | 539,324 | |
Colony Mortgage Capital, Ltd.
Series 2019-IKPR, Class B
1.663% (1 Month LIBOR + 1.478%), due 11/15/38 (a)(b) | | | 1,250,000 | | | | 1,093,510 | |
Credit Suisse Mortgage Trust
Series 2020-WEST, Class A
3.04%, due 2/15/35 (a) | | | 750,000 | | | | 698,315 | |
DBJPM Mortgage Trust
Series 2017-C6, Class A2
2.917%, due 6/10/50 | | | 800,000 | | | | 822,989 | |
Morgan Stanley Bank of America Merrill Lynch Trust
Series 2017-C33, Class A2
3.14%, due 5/15/50 | | | 1,000,000 | | | | 1,028,611 | |
Morgan Stanley Capital I Trust
Series 2017-H1, Class A2
3.089%, due 6/15/50 | | | 900,000 | | | | 926,377 | |
UBS Commercial Mortgage Trust
Series 2018-C8, Class A2
3.713%, due 2/15/51 | | | 500,000 | | | | 523,008 | |
| | | | | | | | |
| | | | | | | 8,750,270 | |
| | | | | | | | |
Whole Loan (Collateralized Mortgage Obligations) 0.9% | |
COLT Mortgage Loan Trust
Series 2019-4, Class A1
2.579%, due 11/25/49 (a)(d) | | | 352,098 | | | | 355,540 | |
JP Morgan Mortgage Trust
Series 2019-1, Class A11
1.135% (1 Month LIBOR + 0.95%), due 5/25/49 (a)(b) | | | 524,102 | | | | 522,817 | |
New Residential Mortgage Loan Trust
Series 2020-NQM1, Class A1
2.464%, due 1/26/60 (a)(d) | | | 282,469 | | | | 287,251 | |
Sequoia Mortgage Trust (a)(d) | | | | | | | | |
Series 2020-3, Class A1
3.00%, due 4/25/50 | | | 724,900 | | | | 753,611 | |
Series 2020-1, Class A1
3.50%, due 2/25/50 | | | 168,448 | | | | 173,102 | |
| | | | | | | | |
| | | Principal
Amount | | | Value | |
Whole Loan (Collateralized Mortgage Obligations) (continued) | |
Sequoia Mortgage Trust (a)(d) (continued) | | | | | | | | |
Series 2020-2, Class A1
3.50%, due 3/25/50 | | $ | 709,811 | | | $ | 729,800 | |
| | | | | | | | |
| | | | | | | 2,822,121 | |
| | | | | | | | |
Total Mortgage-Backed Securities
(Cost $11,714,346) | | | | | | | 11,572,391 | |
| | | | | | | | |
|
| U.S. Government & Federal Agencies 14.9% | |
Federal Farm Credit Bank 1.3% | |
0.71%, due 6/17/24 | | | 725,000 | | | | 724,791 | |
1.25%, due 10/30/26 | | | 675,000 | | | | 675,100 | |
1.35%, due 11/27/28 | | | 425,000 | | | | 425,057 | |
1.37%, due 6/1/29 | | | 650,000 | | | | 650,336 | |
1.57%, due 5/28/30 | | | 575,000 | | | | 575,088 | |
2.03%, due 1/21/28 | | | 850,000 | | | | 928,814 | |
2.44%, due 10/16/28 | | | 500,000 | | | | 503,303 | |
| | | | | | | | |
| | | | | | | 4,482,489 | |
| | | | | | | | |
Federal Home Loan Bank 2.4% | |
2.50%, due 12/10/27 | | | 1,050,000 | | | | 1,176,850 | |
2.875%, due 9/13/24 | | | 1,175,000 | | | | 1,297,382 | |
3.00%, due 3/10/28 | | | 300,000 | | | | 348,721 | |
3.125%, due 9/12/25 | | | 800,000 | | | | 907,397 | |
3.25%, due 6/9/28 | | | 800,000 | | | | 946,563 | |
3.25%, due 11/16/28 | | | 2,775,000 | | | | 3,307,039 | |
| | | | | | | | |
| | | | | | | 7,983,952 | |
| | | | | | | | |
Federal Home Loan Mortgage Corporation 0.6% | |
0.90%, due 6/30/25 | | | 575,000 | | | | 575,030 | |
1.50%, due 2/12/25 | | | 1,300,000 | | | | 1,362,151 | |
| | | | | | | | |
| | | | | | | 1,937,181 | |
| | | | | | | | |
Federal National Mortgage Association 0.9% | |
0.50%, due 6/17/25 | | | 650,000 | | | | 650,248 | |
0.625%, due 4/22/25 | | | 1,275,000 | | | | 1,285,328 | |
1.75%, due 7/2/24 | | | 525,000 | | | | 554,262 | |
2.00%, due 1/24/25 | | | 575,000 | | | | 575,474 | |
| | | | | | | | |
| | | | | | | 3,065,312 | |
| | | | | | | | |
United States Treasury Notes 9.7% | |
0.125%, due 6/30/22 | | | 3,650,000 | | | | 3,647,719 | |
0.25%, due 6/15/23 | | | 8,925,000 | | | | 8,943,826 | |
0.25%, due 6/30/25 | | | 4,275,000 | | | | 4,266,650 | |
0.50%, due 6/30/27 | | | 3,325,000 | | | | 3,327,728 | |
0.625%, due 5/15/30 | | | 1,285,000 | | | | 1,281,436 | |
1.625%, due 11/15/22 | | | 10,215,000 | | | | 10,566,141 | |
| | | | | | | | |
| | | | | | | 32,033,500 | |
| | | | | | | | |
Total U.S. Government & Federal Agencies
(Cost $48,117,458) | | | | | | | 49,502,434 | |
| | | | | | | | |
Total Long-Term Bonds
(Cost $139,330,862) | | | | | | | 143,767,276 | |
| | | | | | | | |
| | | | |
| 16 | | MainStay VP Balanced Portfolio | | The notes to the financial statements are an integral part of,
and should be read in conjunction with, the financial statements. |
| | | | | | | | |
| | |
Shares | | | Value | |
| Common Stocks 48.1% | |
Aerospace & Defense 1.1% | |
Boeing Co. | | | 2,100 | | | $ | 384,930 | |
Curtiss-Wright Corp. | | | 1,558 | | | | 139,098 | |
General Dynamics Corp. | | | 2,533 | | | | 378,582 | |
Huntington Ingalls Industries, Inc. | | | 2,457 | | | | 428,722 | |
L3Harris Technologies, Inc. | | | 2,974 | | | | 504,598 | |
Northrop Grumman Corp. | | | 1,669 | | | | 513,118 | |
Raytheon Technologies Corp. | | | 6,012 | | | | 370,460 | |
Spirit AeroSystems Holdings, Inc., Class A | | | 12,316 | | | | 294,845 | |
Textron, Inc. | | | 21,359 | | | | 702,925 | |
| | | | | | | | |
| | | | | | | 3,717,278 | |
| | | | | | | | |
Air Freight & Logistics 0.3% | |
FedEx Corp. | | | 2,746 | | | | 385,044 | |
United Parcel Service, Inc., Class B | | | 3,389 | | | | 376,789 | |
XPO Logistics, Inc. (e) | | | 4,085 | | | | 315,566 | |
| | | | | | | | |
| | | | | | | 1,077,399 | |
| | | | | | | | |
Automobiles 0.2% | |
Ford Motor Co. | | | 35,763 | | | | 217,439 | |
General Motors Co. | | | 14,680 | | | | 371,404 | |
Thor Industries, Inc. | | | 1,053 | | | | 112,176 | |
| | | | | | | | |
| | | | | | | 701,019 | |
| | | | | | | | |
Banks 1.9% | |
Bank of America Corp. | | | 18,380 | | | | 436,525 | |
Citigroup, Inc. | | | 7,303 | | | | 373,183 | |
Comerica, Inc. | | | 8,161 | | | | 310,934 | |
Fifth Third Bancorp | | | 41,334 | | | | 796,919 | |
First Hawaiian, Inc. | | | 32,680 | | | | 563,403 | |
JPMorgan Chase & Co. | | | 3,919 | | | | 368,621 | |
PacWest Bancorp | | | 24,485 | | | | 482,599 | |
PNC Financial Services Group, Inc. | | | 3,589 | | | | 377,599 | |
Signature Bank | | | 5,658 | | | | 604,953 | |
SVB Financial Group (e) | | | 184 | | | | 39,658 | |
Synovus Financial Corp. | | | 15,579 | | | | 319,837 | |
Truist Financial Corp. | | | 11,620 | | | | 436,331 | |
U.S. Bancorp | | | 11,869 | | | | 437,017 | |
Umpqua Holdings Corp. | | | 25,793 | | | | 274,438 | |
Wells Fargo & Co. | | | 16,755 | | | | 428,928 | |
| | | | | | | | |
| | | | | | | 6,250,945 | |
| | | | | | | | |
Beverages 0.7% | |
Coca-Cola Co. | | | 8,311 | | | | 371,335 | |
Constellation Brands, Inc., Class A | | | 2,548 | | | | 445,773 | |
Keurig Dr. Pepper, Inc. | | | 15,409 | | | | 437,616 | |
Molson Coors Beverage Co., Class B | | | 15,067 | | | | 517,702 | |
PepsiCo., Inc. | | | 3,377 | | | | 446,642 | |
| | | | | | | | |
| | | | | | | 2,219,068 | |
| | | | | | | | |
Biotechnology 0.7% | |
AbbVie, Inc. | | | 5,298 | | | | 520,158 | |
Alexion Pharmaceuticals, Inc. (e) | | | 2,148 | | | | 241,091 | |
| | | | | | | | |
| | |
Shares | | | Value | |
Biotechnology (continued) | |
Alkermes PLC (e) | | | 8,808 | | | $ | 170,919 | |
Biogen, Inc. (e) | | | 1,916 | | | | 512,626 | |
Bluebird Bio, Inc. (e) | | | 51 | | | | 3,113 | |
Exelixis, Inc. (e) | | | 7,711 | | | | 183,059 | |
Gilead Sciences, Inc. | | | 6,639 | | | | 510,805 | |
United Therapeutics Corp. (e) | | | 1,663 | | | | 201,223 | |
| | | | | | | | |
| | | | | | | 2,342,994 | |
| | | | | | | | |
Building Products 0.9% | |
Carrier Global Corp. | | | 5,414 | | | | 120,299 | |
Fortune Brands Home & Security, Inc. | | | 3,685 | | | | 235,582 | |
Johnson Controls International PLC | | | 14,609 | | | | 498,751 | |
Masco Corp. | | | 16,245 | | | | 815,661 | |
Owens Corning | | | 11,635 | | | | 648,768 | |
Trane Technologies PLC | | | 8,364 | | | | 744,229 | |
| | | | | | | | |
| | | | | | | 3,063,290 | |
| | | | | | | | |
Capital Markets 2.9% | |
Ameriprise Financial, Inc. | | | 6,045 | | | | 906,992 | |
Bank of New York Mellon Corp. | | | 13,541 | | | | 523,360 | |
BlackRock, Inc. | | | 812 | | | | 441,801 | |
Cboe Global Markets, Inc. | | | 308 | | | | 28,730 | |
Charles Schwab Corp. | | | 10,979 | | | | 370,431 | |
CME Group, Inc. | | | 2,612 | | | | 424,554 | |
Evercore, Inc., Class A | | | 9,569 | | | | 563,806 | |
Franklin Resources, Inc. | | | 17,609 | | | | 369,261 | |
Goldman Sachs Group, Inc. | | | 2,210 | | | | 436,740 | |
Intercontinental Exchange, Inc. | | | 5,557 | | | | 509,021 | |
Lazard, Ltd., Class A | | | 19,833 | | | | 567,819 | |
LPL Financial Holdings, Inc. | | | 3,934 | | | | 308,426 | |
Morgan Stanley | | | 7,904 | | | | 381,763 | |
Nasdaq, Inc. | | | 6,518 | | | | 778,705 | |
Northern Trust Corp. | | | 268 | | | | 21,263 | |
Raymond James Financial, Inc. | | | 9,631 | | | | 662,902 | |
S&P Global, Inc. | | | 1,585 | | | | 522,226 | |
State Street Corp. | | | 15,787 | | | | 1,003,264 | |
T. Rowe Price Group, Inc. | | | 6,756 | | | | 834,366 | |
| | | | | | | | |
| | | | | | | 9,655,430 | |
| | | | | | | | |
Chemicals 1.3% | |
Air Products & Chemicals, Inc. | | | 1,877 | | | | 453,220 | |
Axalta Coating Systems, Ltd. (e) | | | 9,261 | | | | 208,836 | |
Cabot Corp. | | | 4,408 | | | | 163,316 | |
CF Industries Holdings, Inc. | | | 22,221 | | | | 625,299 | |
Corteva, Inc. (e) | | | 16,128 | | | | 432,069 | |
Dow, Inc. (e) | | | 9,651 | | | | 393,375 | |
DuPont de Nemours, Inc. | | | 7,200 | | | | 382,536 | |
Ecolab, Inc. | | | 2,225 | | | | 442,664 | |
Huntsman Corp. | | | 32,501 | | | | 584,043 | |
Linde PLC | | | 1,800 | | | | 381,798 | |
LyondellBasell Industries N.V., Class A | | | 5,878 | | | | 386,302 | |
| | | | | | | | |
| | | | | | | 4,453,458 | |
| | | | | | | | |
| | | | | | |
The notes to the financial statements are an integral part of,
and should be read in conjunction with, the financial statements. | | | | | 17 | |
Portfolio of Investments June 30, 2020 (Unaudited) (continued)
| | | | | | | | |
| | |
Shares | | | Value | |
| Common Stocks (continued) | |
Commercial Services & Supplies 0.5% | |
ADT, Inc. (f) | | | 13,421 | | | $ | 107,100 | |
Cintas Corp. | | | 719 | | | | 191,513 | |
Clean Harbors, Inc. (e) | | | 9,583 | | | | 574,788 | |
Republic Services, Inc. | | | 5,702 | | | | 467,849 | |
Waste Management, Inc. | | | 4,316 | | | | 457,107 | |
| | | | | | | | |
| | | | | | | 1,798,357 | |
| | | | | | | | |
Communications Equipment 0.2% | |
Cisco Systems, Inc. | | | 11,266 | | | | 525,446 | |
Motorola Solutions, Inc. | | | 1,865 | | | | 261,343 | |
| | | | | | | | |
| | | | | | | 786,789 | |
| | | | | | | | |
Consumer Finance 0.7% | |
American Express Co. | | | 5,367 | | | | 510,938 | |
Capital One Financial Corp. | | | 6,685 | | | | 418,414 | |
Discover Financial Services | | | 3,520 | | | | 176,317 | |
SLM Corp. | | | 51,239 | | | | 360,210 | |
Synchrony Financial | | | 35,428 | | | | 785,085 | |
| | | | | | | | |
| | | | | | | 2,250,964 | |
| | | | | | | | |
Containers & Packaging 0.0%‡ | |
Ardagh Group S.A. | | | 3,304 | | | | 42,655 | |
| | | | | | | | |
|
Distributors 0.2% | |
LKQ Corp. (e) | | | 25,198 | | | | 660,188 | |
| | | | | | | | |
|
Diversified Consumer Services 0.2% | |
frontdoor, Inc. (e) | | | 1,326 | | | | 58,782 | |
Graham Holdings Co., Class B | | | 1,491 | | | | 510,921 | |
| | | | | | | | |
| | | | | | | 569,703 | |
| | | | | | | | |
Diversified Financial Services 0.5% | |
Berkshire Hathaway, Inc., Class B (e) | | | 2,089 | | | | 372,908 | |
Equitable Holdings, Inc. | | | 35,576 | | | | 686,261 | |
Voya Financial, Inc. | | | 9,777 | | | | 456,097 | |
| | | | | | | | |
| | | | | | | 1,515,266 | |
| | | | | | | | |
Diversified Telecommunication Services 0.2% | |
AT&T, Inc. | | | 12,614 | | | | 381,321 | |
Verizon Communications, Inc. | | | 6,881 | | | | 379,350 | |
| | | | | | | | |
| | | | | | | 760,671 | |
| | | | | | | | |
Electric Utilities 1.8% | |
American Electric Power Co., Inc. | | | 4,597 | | | | 366,105 | |
Duke Energy Corp. | | | 4,611 | | | | 368,373 | |
Entergy Corp. | | | 8,814 | | | | 826,841 | |
Evergy, Inc. | | | 9,954 | | | | 590,173 | |
Eversource Energy | | | 1,392 | | | | 115,912 | |
Exelon Corp. | | | 10,175 | | | | 369,251 | |
FirstEnergy Corp. | | | 10,956 | | | | 424,874 | |
NextEra Energy, Inc. | | | 1,535 | | | | 368,661 | |
NRG Energy, Inc. | | | 18,884 | | | | 614,863 | |
| | | | | | | | |
| | |
Shares | | | Value | |
Electric Utilities (continued) | |
OGE Energy Corp. | | | 15,391 | | | $ | 467,271 | |
PG&E Corp. (e) | | | 20,522 | | | | 182,030 | |
Pinnacle West Capital Corp. | | | 2,934 | | | | 215,033 | |
PPL Corp. | | | 22,521 | | | | 581,942 | |
Southern Co. | | | 7,085 | | | | 367,357 | |
Xcel Energy, Inc. | | | 3,497 | | | | 218,562 | |
| | | | | | | | |
| | | | | | | 6,077,248 | |
| | | | | | | | |
Electrical Equipment 0.5% | |
Acuity Brands, Inc. | | | 1,993 | | | | 190,810 | |
Eaton Corp. PLC | | | 5,209 | | | | 455,683 | |
Emerson Electric Co. | | | 6,223 | | | | 386,013 | |
Regal Beloit Corp. | | | 7,025 | | | | 613,423 | |
| | | | | | | | |
| | | | | | | 1,645,929 | |
| | | | | | | | |
Electronic Equipment, Instruments & Components 0.7% | |
Arrow Electronics, Inc. (e) | | | 9,045 | | | | 621,301 | |
Avnet, Inc. | | | 19,640 | | | | 547,662 | |
Jabil, Inc. | | | 18,479 | | | | 592,806 | |
SYNNEX Corp. | | | 5,695 | | | | 682,090 | |
| | | | | | | | |
| | | | | | | 2,443,859 | |
| | | | | | | | |
Energy Equipment & Services 0.1% | |
Helmerich & Payne, Inc. | | | 1,057 | | | | 20,622 | |
Schlumberger, Ltd. | | | 20,779 | | | | 382,126 | |
| | | | | | | | |
| | | | | | | 402,748 | |
| | | | | | | | |
Entertainment 0.9% | |
Activision Blizzard, Inc. | | | 6,670 | | | | 506,253 | |
Cinemark Holdings, Inc. | | | 18,561 | | | | 214,379 | |
Electronic Arts, Inc. (e) | | | 3,852 | | | | 508,657 | |
Lions Gate Entertainment Corp., Class B (e) | | | 64,142 | | | | 438,090 | |
Take-Two Interactive Software, Inc. (e) | | | 4,020 | | | | 561,071 | |
Walt Disney Co. | | | 3,311 | | | | 369,210 | |
Zynga, Inc., Class A (e) | | | 37,658 | | | | 359,257 | |
| | | | | | | | |
| | | | | | | 2,956,917 | |
| | | | | | | | |
Equity Real Estate Investment Trusts 3.3% | |
Alexandria Real Estate Equities, Inc. | | | 3,520 | | | | 571,120 | |
American Homes 4 Rent, Class A | | | 3,530 | | | | 94,957 | |
Apartment Investment & Management Co., Class A | | | 6,880 | | | | 258,963 | |
AvalonBay Communities, Inc. | | | 3,889 | | | | 601,395 | |
Boston Properties, Inc. | | | 2,051 | | | | 185,369 | |
Camden Property Trust | | | 2,691 | | | | 245,473 | |
CoreSite Realty Corp. | | | 1,294 | | | | 156,652 | |
Crown Castle International Corp. | | | 2,699 | | | | 451,678 | |
CubeSmart | | | 9,228 | | | | 249,064 | |
CyrusOne, Inc. | | | 4,279 | | | | 311,297 | |
Digital Realty Trust, Inc. | | | 6,729 | | | | 956,259 | |
Duke Realty Corp. | | | 11,907 | | | | 421,389 | |
Equity Residential | | | 10,211 | | | | 600,611 | |
Essex Property Trust, Inc. | | | 1,985 | | | | 454,903 | |
Extra Space Storage, Inc. | | | 2,071 | | | | 191,298 | |
| | | | |
| 18 | | MainStay VP Balanced Portfolio | | The notes to the financial statements are an integral part of,
and should be read in conjunction with, the financial statements. |
| | | | | | | | |
| | |
Shares | | | Value | |
| Common Stocks (continued) | |
Equity Real Estate Investment Trusts (continued) | |
Gaming and Leisure Properties, Inc. | | | 7,963 | | | $ | 275,520 | |
Healthpeak Properties, Inc. | | | 6,637 | | | | 182,916 | |
Host Hotels & Resorts, Inc. | | | 3,477 | | | | 37,517 | |
Invitation Homes, Inc. | | | 11,441 | | | | 314,971 | |
Iron Mountain, Inc. | | | 504 | | | | 13,154 | |
Kilroy Realty Corp. | | | 102 | | | | 5,987 | |
Kimco Realty Corp. | | | 725 | | | | 9,309 | |
Life Storage, Inc. | | | 2,473 | | | | 234,811 | |
Medical Properties Trust, Inc. | | | 3,434 | | | | 64,559 | |
Mid-America Apartment Communities, Inc. | | | 3,655 | | | | 419,119 | |
Omega Healthcare Investors, Inc. | | | 451 | | | | 13,408 | |
Prologis, Inc. | | | 4,873 | | | | 454,797 | |
Public Storage | | | 1,958 | | | | 375,721 | |
Rayonier, Inc. | | | 3,979 | | | | 98,639 | |
Realty Income Corp. | | | 4,812 | | | | 286,314 | |
Regency Centers Corp. | | | 517 | | | | 23,725 | |
SBA Communications Corp. | | | 1,751 | | | | 521,658 | |
SL Green Realty Corp. | | | 4,763 | | | | 234,768 | |
STORE Capital Corp. | | | 497 | | | | 11,834 | |
Sun Communities, Inc. | | | 2,096 | | | | 284,385 | |
UDR, Inc. | | | 3,023 | | | | 113,000 | |
Ventas, Inc. | | | 4,112 | | | | 150,581 | |
VEREIT, Inc. | | | 759 | | | | 4,880 | |
VICI Properties, Inc. | | | 4,053 | | | | 81,830 | |
Vornado Realty Trust | | | 517 | | | | 19,755 | |
W.P. Carey, Inc. | | | 1,685 | | | | 113,990 | |
Welltower, Inc. | | | 6,135 | | | | 317,486 | |
Weyerhaeuser Co. | | | 22,589 | | | | 507,349 | |
| | | | | | | | |
| | | | | | | 10,922,411 | |
| | | | | | | | |
Food & Staples Retailing 1.2% | |
Casey’s General Stores, Inc. | | | 1,292 | | | | 193,180 | |
Costco Wholesale Corp. | | | 1,468 | | | | 445,112 | |
Kroger Co. | | | 31,936 | | | | 1,081,034 | |
Sprouts Farmers Market, Inc. (e) | | | 20,578 | | | | 526,591 | |
Sysco Corp. | | | 9,186 | | | | 502,107 | |
U.S. Foods Holding Corp. (e) | | | 10,040 | | | | 197,989 | |
Walgreens Boots Alliance, Inc. | | | 10,629 | | | | 450,563 | |
Walmart, Inc. | | | 4,190 | | | | 501,878 | |
| | | | | | | | |
| | | | | | | 3,898,454 | |
| | | | | | | | |
Food Products 1.1% | |
General Mills, Inc. | | | 7,258 | | | | 447,456 | |
Hershey Co. | | | 4,116 | | | | 533,516 | |
Ingredion, Inc. | | | 5,759 | | | | 477,997 | |
Kraft Heinz Co. | | | 13,620 | | | | 434,342 | |
Mondelez International, Inc., Class A | | | 8,641 | | | | 441,814 | |
Pilgrim’s Pride Corp. (e) | | | 23,460 | | | | 396,239 | |
Seaboard Corp. | | | 19 | | | | 55,743 | |
Tyson Foods, Inc., Class A | | | 14,330 | | | | 855,644 | |
| | | | | | | | |
| | | | | | | 3,642,751 | |
| | | | | | | | |
| | | | | | | | |
| | |
Shares | | | Value | |
Health Care Equipment & Supplies 1.6% | |
Abbott Laboratories | | | 5,012 | | | $ | 458,247 | |
Baxter International, Inc. | | | 6,112 | | | | 526,243 | |
Becton Dickinson and Co. | | | 1,593 | | | | 381,157 | |
Boston Scientific Corp. (e) | | | 10,963 | | | | 384,911 | |
Danaher Corp. | | | 2,552 | | | | 451,270 | |
DENTSPLY SIRONA, Inc. | | | 16,244 | | | | 715,711 | |
Hill-Rom Holdings, Inc. | | | 5,728 | | | | 628,820 | |
Hologic, Inc. (e) | | | 8,004 | | | | 456,228 | |
ICU Medical, Inc. (e) | | | 1,761 | | | | 324,570 | |
Medtronic PLC | | | 4,965 | | | | 455,290 | |
Stryker Corp. | | | 2,104 | | | | 379,120 | |
West Pharmaceutical Services, Inc. | | | 115 | | | | 26,125 | |
Zimmer Biomet Holdings, Inc. | | | 1,400 | | | | 167,104 | |
| | | | | | | | |
| | | | | | | 5,354,796 | |
| | | | | | | | |
Health Care Providers & Services 2.1% | |
AmerisourceBergen Corp. | | | 3,215 | | | | 323,975 | |
Anthem, Inc. | | | 1,959 | | | | 515,178 | |
Cardinal Health, Inc. | | | 8,045 | | | | 419,868 | |
Centene Corp. (e) | | | 5,997 | | | | 381,109 | |
Cigna Corp. (e) | | | 2,740 | | | | 514,161 | |
CVS Health Corp. | | | 7,979 | | | | 518,396 | |
DaVita, Inc. (e) | | | 7,941 | | | | 628,451 | |
HCA Healthcare, Inc. | | | 5,378 | | | | 521,989 | |
Humana, Inc. | | | 1,355 | | | | 525,401 | |
Laboratory Corp. of America Holdings (e) | | | 4,822 | | | | 800,982 | |
McKesson Corp. | | | 5,388 | | | | 826,627 | |
UnitedHealth Group, Inc. | | | 1,743 | | | | 514,098 | |
Universal Health Services, Inc., Class B | | | 6,540 | | | | 607,501 | |
| | | | | | | | |
| | | | | | | 7,097,736 | |
| | | | | | | | |
Hotels, Restaurants & Leisure 0.9% | |
Aramark | | | 1,610 | | | | 36,338 | |
Darden Restaurants, Inc. | | | 4,727 | | | | 358,165 | |
Extended Stay America, Inc. | | | 14,376 | | | | 160,867 | |
Las Vegas Sands Corp. | | | 11,218 | | | | 510,868 | |
Marriott International, Inc., Class A | | | 4,365 | | | | 374,211 | |
McDonald’s Corp. | | | 2,374 | | | | 437,932 | |
MGM Resorts International | | | 3,657 | | | | 61,437 | |
Starbucks Corp. | | | 5,942 | | | | 437,272 | |
Yum China Holdings, Inc. | | | 2,727 | | | | 131,087 | |
Yum! Brands, Inc. | | | 5,824 | | | | 506,164 | |
| | | | | | | | |
| | | | | | | 3,014,341 | |
| | | | | | | | |
Household Durables 0.4% | |
D.R. Horton, Inc. | | | 1,159 | | | | 64,266 | |
Lennar Corp. | | | | | | | | |
Class A | | | 2,888 | | | | 177,959 | |
Class B | | | 6,957 | | | | 320,648 | |
PulteGroup, Inc. | | | 20,529 | | | | 698,602 | |
| | | | | | | | |
| | | | | | | 1,261,475 | |
| | | | | | | | |
| | | | | | |
The notes to the financial statements are an integral part of,
and should be read in conjunction with, the financial statements. | | | | | 19 | |
Portfolio of Investments June 30, 2020 (Unaudited) (continued)
| | | | | | | | |
| | |
Shares | | | Value | |
| Common Stocks (continued) | |
Household Products 0.4% | |
Colgate-Palmolive Co. | | | 6,075 | | | $ | 445,055 | |
Kimberly-Clark Corp. | | | 3,655 | | | | 516,634 | |
Procter & Gamble Co. | | | 3,758 | | | | 449,344 | |
| | | | | | | | |
| | | | | | | 1,411,033 | |
| | | | | | | | |
Independent Power & Renewable Electricity Producers 0.4% | |
AES Corp. | | | 45,609 | | | | 660,874 | |
Vistra Energy Corp. | | | 35,032 | | | | 652,296 | |
| | | | | | | | |
| | | | | | | 1,313,170 | |
| | | | | | | | |
Industrial Conglomerates 0.5% | |
3M Co. | | | 2,437 | | | | 380,148 | |
General Electric Co. | | | 56,833 | | | | 388,169 | |
Honeywell International, Inc. | | | 3,163 | | | | 457,338 | |
Roper Technologies, Inc. | | | 1,146 | | | | 444,946 | |
| | | | | | | | |
| | | | | | | 1,670,601 | |
| | | | | | | | |
Insurance 2.2% | |
Aflac, Inc. | | | 14,334 | | | | 516,454 | |
Allstate Corp. | | | 5,423 | | | | 525,977 | |
American International Group, Inc. | | | 16,638 | | | | 518,773 | |
American National Insurance Co. | | | 1,835 | | | | 132,248 | |
Brighthouse Financial, Inc. (e) | | | 11,467 | | | | 319,012 | |
Chubb, Ltd. | | | 3,468 | | | | 439,118 | |
Fidelity National Financial, Inc. | | | 22,599 | | | | 692,885 | |
First American Financial Corp. | | | 2,574 | | | | 123,604 | |
Marsh & McLennan Cos., Inc. | | | 4,210 | | | | 452,028 | |
MetLife, Inc. | | | 14,189 | | | | 518,182 | |
Progressive Corp. | | | 4,801 | | | | 384,608 | |
Prudential Financial, Inc. | | | 2,821 | | | | 171,799 | |
Reinsurance Group of America, Inc. | | | 6,924 | | | | 543,119 | |
Travelers Cos., Inc. | | | 3,287 | | | | 374,882 | |
Unum Group | | | 36,702 | | | | 608,886 | |
Willis Towers Watson PLC | | | 5,234 | | | | 1,030,836 | |
| | | | | | | | |
| | | | | | | 7,352,411 | |
| | | | | | | | |
Interactive Media & Services 0.4% | |
Alphabet, Inc. (e) | | | | | | | | |
Class A | | | 304 | | | | 431,087 | |
Class C | | | 305 | | | | 431,151 | |
IAC/InterActiveCorp (e) | | | 361 | | | | 116,748 | |
TripAdvisor, Inc. | | | 14,027 | | | | 266,653 | |
Zillow Group, Inc., Class A (e) | | | 341 | | | | 19,601 | |
| | | | | | | | |
| | | | | | | 1,265,240 | |
| | | | | | | | |
Internet & Direct Marketing Retail 0.4% | |
eBay, Inc. | | | 10,337 | | | | 542,176 | |
Qurate Retail, Inc., Series A (e) | | | 65,982 | | | | 626,829 | |
| | | | | | | | |
| | | | | | | 1,169,005 | |
| | | | | | | | |
| | | | | | | | |
| | |
Shares | | | Value | |
IT Services 1.8% | |
Akamai Technologies, Inc. (e) | | | 5,264 | | | $ | 563,722 | |
Alliance Data Systems Corp. | | | 6,234 | | | | 281,278 | |
Amdocs, Ltd. | | | 10,876 | | | | 662,131 | |
Automatic Data Processing, Inc. | | | 3,021 | | | | 449,797 | |
CACI International, Inc., Class A (e) | | | 1,527 | | | | 331,176 | |
Cognizant Technology Solutions Corp., Class A | | | 9,370 | | | | 532,403 | |
DXC Technology Co. | | | 20,304 | | | | 335,016 | |
Fidelity National Information Services, Inc. | | | 2,804 | | | | 375,988 | |
Fiserv, Inc. (e) | | | 3,840 | | | | 374,861 | |
Global Payments, Inc. | | | 2,223 | | | | 377,065 | |
International Business Machines Corp. | | | 3,758 | | | | 453,853 | |
Leidos Holdings, Inc. | | | 7,840 | | | | 734,373 | |
Sabre Corp. | | | 56,282 | | | | 453,633 | |
Twilio, Inc., Class A (e) | | | 209 | | | | 45,859 | |
| | | | | | | | |
| | | | | | | 5,971,155 | |
| | | | | | | | |
Leisure Products 0.0%‡ | |
Polaris, Inc. | | | 1,438 | | | | 133,087 | |
| | | | | | | | |
|
Life Sciences Tools & Services 0.6% | |
Agilent Technologies, Inc. | | | 2,616 | | | | 231,176 | |
Bio-Rad Laboratories, Inc., Class A (e) | | | 291 | | | | 131,384 | |
IQVIA Holdings, Inc. (e) | | | 5,812 | | | | 824,606 | |
PPD, Inc. (e) | | | 1,096 | | | | 29,373 | |
PRA Health Sciences, Inc. (e) | | | 2,044 | | | | 198,861 | |
Thermo Fisher Scientific, Inc. | | | 1,257 | | | | 455,461 | |
| | | | | | | | |
| | | | | | | 1,870,861 | |
| | | | | | | | |
Machinery 1.1% | |
AGCO Corp. | | | 1,298 | | | | 71,987 | |
Caterpillar, Inc. | | | 3,039 | | | | 384,433 | |
Crane Co. | | | 6,143 | | | | 365,263 | |
Cummins, Inc. | | | 6,049 | | | | 1,048,050 | |
Deere & Co. | | | 2,465 | | | | 387,375 | |
Illinois Tool Works, Inc. | | | 2,195 | | | | 383,796 | |
Otis Worldwide Corp. | | | 4,221 | | | | 240,006 | |
PACCAR, Inc. | | | 1,692 | | | | 126,646 | |
Parker-Hannifin Corp. | | | 1,896 | | | | 347,480 | |
Timken Co. | | | 4,387 | | | | 199,564 | |
| | | | | | | | |
| | | | | | | 3,554,600 | |
| | | | | | | | |
Media 0.5% | |
Charter Communications, Inc., Class A (e) | | | 992 | | | | 505,960 | |
Comcast Corp., Class A | | | 11,349 | | | | 442,384 | |
Fox Corp., Class B (e) | | | 21,083 | | | | 565,868 | |
News Corp., Class B | | | 11,469 | | | | 137,054 | |
| | | | | | | | |
| | | | | | | 1,651,266 | |
| | | | | | | | |
Metals & Mining 0.9% | |
Newmont Corp. | | | 22,042 | | | | 1,360,873 | |
Reliance Steel & Aluminum Co. | | | 6,813 | | | | 646,758 | |
Southern Copper Corp. | | | 11,676 | | | | 464,354 | |
| | | | |
| 20 | | MainStay VP Balanced Portfolio | | The notes to the financial statements are an integral part of,
and should be read in conjunction with, the financial statements. |
| | | | | | | | |
| | |
Shares | | | Value | |
| Common Stocks (continued) | |
Metals & Mining (continued) | |
Steel Dynamics, Inc. | | | 23,697 | | | $ | 618,255 | |
| | | | | | | | |
| | | | | | | 3,090,240 | |
| | | | | | | | |
Multi-Utilities 0.9% | |
CenterPoint Energy, Inc. | | | 1,382 | | | | 25,802 | |
Consolidated Edison, Inc. | | | 12,000 | | | | 863,160 | |
Dominion Energy, Inc. | | | 4,493 | | | | 364,742 | |
DTE Energy Co. | | | 949 | | | | 102,018 | |
MDU Resources Group, Inc. | | | 22,741 | | | | 504,395 | |
Public Service Enterprise Group, Inc. | | | 7,658 | | | | 376,467 | |
Sempra Energy | | | 4,480 | | | | 525,191 | |
WEC Energy Group, Inc. | | | 3,753 | | | | 328,950 | |
| | | | | | | | |
| | | | | | | 3,090,725 | |
| | | | | | | | |
Multiline Retail 0.3% | |
Dollar General Corp. | | | 1,535 | | | | 292,433 | |
Dollar Tree, Inc. (e) | | | 2,857 | | | | 264,787 | |
Target Corp. | | | 4,211 | | | | 505,025 | |
| | | | | | | | |
| | | | | | | 1,062,245 | |
| | | | | | | | |
Oil, Gas & Consumable Fuels 1.9% | |
Apache Corp. | | | 4,521 | | | | 61,033 | |
Cabot Oil & Gas Corp. | | | 9,214 | | | | 158,297 | |
Chevron Corp. | | | 5,752 | | | | 513,251 | |
Cimarex Energy Co. | | | 597 | | | | 16,412 | |
ConocoPhillips | | | 10,676 | | | | 448,605 | |
Devon Energy Corp. | | | 49,528 | | | | 561,647 | |
EOG Resources, Inc. | | | 8,939 | | | | 452,850 | |
Exxon Mobil Corp. | | | 8,339 | | | | 372,920 | |
HollyFrontier Corp. | | | 19,113 | | | | 558,100 | |
Kinder Morgan, Inc. | | | 29,550 | | | | 448,273 | |
Kosmos Energy, Ltd. | | | 125,007 | | | | 207,512 | |
Marathon Petroleum Corp. | | | 7,646 | | | | 285,807 | |
PBF Energy, Inc., Class A | | | 1,336 | | | | 13,681 | |
Phillips 66 | | | 7,203 | | | | 517,896 | |
Pioneer Natural Resources Co. | | | 179 | | | | 17,488 | |
Targa Resources Corp. | | | 23,493 | | | | 471,504 | |
Valero Energy Corp. | | | 8,689 | | | | 511,087 | |
Williams Cos., Inc. | | | 27,182 | | | | 517,002 | |
| | | | | | | | |
| | | | | | | 6,133,365 | |
| | | | | | | | |
Paper & Forest Products 0.1% | |
Domtar Corp. | | | 10,476 | | | | 221,148 | |
| | | | | | | | |
|
Personal Products 0.4% | |
Estee Lauder Cos., Inc., Class A | | | 2,330 | | | | 439,625 | |
Herbalife Nutrition, Ltd. (e) | | | 6,550 | | | | 294,619 | |
Nu Skin Enterprises, Inc., Class A | | | 10,962 | | | | 419,077 | |
| | | | | | | | |
| | | | | | | 1,153,321 | |
| | | | | | | | |
Pharmaceuticals 1.3% | |
Bristol-Myers Squibb Co. | | | 7,576 | | | | 445,469 | |
| | | | | | | | |
| | |
Shares | | | Value | |
Pharmaceuticals (continued) | |
Catalent, Inc. (e) | | | 4,840 | | | $ | 354,772 | |
Jazz Pharmaceuticals PLC (e) | | | 3,997 | | | | 441,029 | |
Johnson & Johnson | | | 3,605 | | | | 506,971 | |
Merck & Co., Inc. | | | 6,645 | | | | 513,858 | |
Mylan N.V. (e) | | | 32,730 | | | | 526,299 | |
Perrigo Co. PLC | | | 11,799 | | | | 652,131 | |
Pfizer, Inc. | | | 15,662 | | | | 512,147 | |
Zoetis, Inc. | | | 3,258 | | | | 446,476 | |
| | | | | | | | |
| | | | | | | 4,399,152 | |
| | | | | | | | |
Professional Services 0.7% | |
CoreLogic, Inc. | | | 11,607 | | | | 780,222 | |
IHS Markit, Ltd. | | | 10,522 | | | | 794,411 | |
ManpowerGroup, Inc. | | | 8,225 | | | | 565,469 | |
| | | | | | | | |
| | | | | | | 2,140,102 | |
| | | | | | | | |
Road & Rail 0.8% | |
CSX Corp. | | | 7,469 | | | | 520,888 | |
J.B. Hunt Transport Services, Inc. | | | 676 | | | | 81,350 | |
Norfolk Southern Corp. | | | 2,586 | | | | 454,024 | |
Schneider National, Inc., Class B | | | 22,389 | | | | 552,336 | |
Uber Technologies, Inc. (e) | | | 14,122 | | | | 438,912 | |
Union Pacific Corp. | | | 3,045 | | | | 514,818 | |
| | | | | | | | |
| | | | | | | 2,562,328 | |
| | | | | | | | |
Semiconductors & Semiconductor Equipment 1.6% | |
Advanced Micro Devices, Inc. (e) | | | 8,353 | | | | 439,451 | |
Analog Devices, Inc. | | | 4,219 | | | | 517,418 | |
Broadcom, Inc. | | | 1,642 | | | | 518,232 | |
Cirrus Logic, Inc. (e) | | | 2,054 | | | | 126,896 | |
Intel Corp. | | | 8,531 | | | | 510,410 | |
Lam Research Corp. | | | 1,101 | | | | 356,129 | |
Micron Technology, Inc. (e) | | | 9,041 | | | | 465,792 | |
Qorvo, Inc. (e) | | | 7,099 | | | | 784,653 | |
Skyworks Solutions, Inc. | | | 7,542 | | | | 964,320 | |
Texas Instruments, Inc. | | | 4,065 | | | | 516,133 | |
| | | | | | | | |
| | | | | | | 5,199,434 | |
| | | | | | | | |
Software 1.0% | |
Autodesk, Inc. (e) | | | 2,159 | | | | 516,411 | |
CDK Global, Inc. | | | 7,174 | | | | 297,147 | |
Citrix Systems, Inc. | | | 4,338 | | | | 641,634 | |
Nuance Communications, Inc. (e) | | | 5,990 | | | | 151,577 | |
Oracle Corp. | | | 9,260 | | | | 511,800 | |
salesforce.com, Inc. (e) | | | 2,716 | | | | 508,788 | |
SS&C Technologies Holdings, Inc. | | | 7,152 | | | | 403,945 | |
Synopsys, Inc. (e) | | | 820 | | | | 159,900 | |
| | | | | | | | |
| | | | | | | 3,191,202 | |
| | | | | | | | |
Specialty Retail 1.3% | |
AutoNation, Inc. (e) | | | 14,265 | | | | 536,079 | |
AutoZone, Inc. (e) | | | 315 | | | | 355,358 | |
Best Buy Co., Inc. | | | 9,801 | | | | 855,333 | |
Dick’s Sporting Goods, Inc. | | | 14,285 | | | | 589,399 | |
| | | | | | |
The notes to the financial statements are an integral part of,
and should be read in conjunction with, the financial statements. | | | | | 21 | |
Portfolio of Investments June 30, 2020 (Unaudited) (continued)
| | | | | | | | |
| | |
Shares | | | Value | |
| Common Stocks (continued) | |
Specialty Retail (continued) | |
Foot Locker, Inc. | | | 3,535 | | | $ | 103,081 | |
Gap, Inc. | | | 1,161 | | | | 14,652 | |
Home Depot, Inc. | | | 2,048 | | | | 513,044 | |
Ross Stores, Inc. | | | 4,262 | | | | 363,293 | |
TJX Cos., Inc. | | | 7,201 | | | | 364,082 | |
Ulta Beauty, Inc. (e) | | | 298 | | | | 60,619 | |
Williams-Sonoma, Inc. | | | 5,284 | | | | 433,341 | |
| | | | | | | | |
| | | | | | | 4,188,281 | |
| | | | | | | | |
Technology Hardware, Storage & Peripherals 0.5% | |
Dell Technologies, Inc., Class C (e) | | | 8,241 | | | | 452,761 | |
HP, Inc. | | | 29,059 | | | | 506,498 | |
Xerox Holdings Corp. (e) | | | 33,705 | | | | 515,349 | |
| | | | | | | | |
| | | | | | | 1,474,608 | |
| | | | | | | | |
Thrifts & Mortgage Finance 0.2% | |
MGIC Investment Corp. | | | 68,791 | | | | 563,399 | |
New York Community Bancorp, Inc. | | | 6,766 | | | | 69,013 | |
| | | | | | | | |
| | | | | | | 632,412 | |
| | | | | | | | |
Tobacco 0.3% | |
Altria Group, Inc. | | | 11,099 | | | | 435,636 | |
Philip Morris International, Inc. | | | 7,192 | | | | 503,871 | |
| | | | | | | | |
| | | | | | | 939,507 | |
| | | | | | | | |
Trading Companies & Distributors 0.4% | |
HD Supply Holdings, Inc. (e) | | | 18,735 | | | | 649,168 | |
MSC Industrial Direct Co., Inc., Class A | | | 5,981 | | | | 435,476 | |
WESCO International, Inc. (e) | | | 9,208 | | | | 323,293 | |
| | | | | | | | |
| | | | | | | 1,407,937 | |
| | | | | | | | |
Water Utilities 0.0%‡ | |
American Water Works Co., Inc. | | | 851 | | | | 109,490 | |
| | | | | | | | |
|
Wireless Telecommunication Services 0.1% | |
T-Mobile U.S., Inc. (e) | | | 3,422 | | | | 356,402 | |
Telephone & Data Systems, Inc. | | | 4,748 | | | | 94,390 | |
| | | | | | | | |
| | | | | | | 450,792 | |
| | | | | | | | |
Total Common Stocks
(Cost $137,381,040) | | | | | | | 159,392,857 | |
| | | | | | | | |
|
| Exchange-Traded Funds 6.7% | |
iShares Intermediate Government / Credit Bond ETF | | | 54,181 | | | | 6,378,187 | |
iShares Russell 1000 Value ETF | | | 48,872 | | | | 5,503,965 | |
iShares Russell Mid-Cap ETF | | | 14,582 | | | | 781,595 | |
SPDR S&P 500 ETF Trust | | | 2,644 | | | | 815,304 | |
Vanguard Mid-Cap Value ETF | | | 92,803 | | | | 8,881,247 | |
| | | | | | | | |
Total Exchange-Traded Funds
(Cost $22,133,310) | | | | | | | 22,360,298 | |
| | | | | | | | |
| | | | | | | | |
| | | Principal
Amount | | | Value | |
| Short-Term Investments 0.4% | |
Repurchase Agreement 0.4% | |
Fixed Income Clearing Corp.
0.00%, dated 6/30/20
due 7/1/20
Proceeds at Maturity $1,213,778 (Collateralized by a United States Treasury Note with rate of 1.25% and maturity date of 8/31/24, with a Principal Amount of $1,183,400 and a Market Value of $1,238,182) | | $ | 1,213,778 | | | $ | 1,213,778 | |
| | | | | | | | |
Total Repurchase Agreement
(Cost $1,213,778) | | | | | | | 1,213,778 | |
| | | | | | | | |
| | |
| | | | | | | | |
| | | Shares | | | | |
Unaffiliated Investment Company 0.0%‡ | |
State Street Navigator Securities Lending Government Money Market Portfolio, 0.13% (g)(h) | | | 106,288 | | | | 106,288 | |
| | | | | | | | |
Total Unaffiliated Investment Company
(Cost $106,288) | | | | | | | 106,288 | |
| | | | | | | | |
Total Short-Term Investments
(Cost $1,320,066) | | | | | | | 1,320,066 | |
| | | | | | | | |
Total Investments
(Cost $300,165,278) | | | 98.5 | % | | | 326,840,497 | |
Other Assets, Less Liabilities | | | 1.5 | | | | 4,823,539 | |
Net Assets | | | 100.0 | % | | $ | 331,664,036 | |
| † | Percentages indicated are based on Portfolio net assets. |
| ‡ | Less than one-tenth of a percent. |
| (a) | May be sold to institutional investors only under Rule 144A or securities offered pursuant to Section 4(a)(2) of the Securities Act of 1933, as amended. |
| (b) | Floating rate—Rate shown was the rate in effect as of June 30, 2020. |
| (c) | Fixed to floating rate—Rate shown was the rate in effect as of June 30, 2020. |
| (d) | Coupon rate may change based on changes of the underlying collateral or prepayments of principal. Rate shown was the rate in effect as of June 30, 2020. |
| (e) | Non-income producing security. |
| (f) | All or a portion of this security was held on loan. As of June 30, 2020, the aggregate market value of securities on loan was $106,022. The Portfolio received cash collateral with a value of $106,288 (See Note 2(I)). |
| (g) | Current yield as of June 30, 2020. |
| (h) | Represents a security purchased with cash collateral received for securities on loan. |
| | | | |
| 22 | | MainStay VP Balanced Portfolio | | The notes to the financial statements are an integral part of,
and should be read in conjunction with, the financial statements. |
Futures Contracts
As of June 30, 2020, the Portfolio held the following futures contracts1:
| | | | | | | | | | | | | | | | | | | | |
Type | | Number of
Contracts | | | Expiration
Date | | | Value at
Trade Date | | | Current
Notional
Amount | | | Unrealized
Appreciation
(Depreciation)2 | |
| | | | | |
Long Contracts | | | | | | | | | | | | | | | | | | | | |
| 2-Year United States Treasury Note | | | 35 | | | | September 2020 | | | $ | 7,728,986 | | | $ | 7,728,984 | | | $ | (2 | ) |
| 5-Year United States Treasury Note | | | 78 | | | | September 2020 | | | | 9,790,583 | | | | 9,807,890 | | | | 17,307 | |
| 10-Year United States Treasury Note | | | 39 | | | | September 2020 | | | | 5,419,007 | | | | 5,427,704 | | | | 8,697 | |
| | | | | | | | | | | | | | | | | | | | |
| Total Long Contracts | | | | | | | | | | | | | | | | | | | 26,002 | |
| | | | | | | | | | | | | | | | | | | | |
| | | | | |
Short Contracts | | | | | | | | | | | | | | | | | | | | |
| 10-Year United States Treasury Ultra Note | | | (20 | ) | | | September 2020 | | | | (3,144,183 | ) | | | (3,149,687 | ) | | | (5,504 | ) |
| United States Treasury Long Bond | | | (2 | ) | | | September 2020 | | | | (348,840 | ) | | | (357,125 | ) | | | (8,285 | ) |
| | | | | | | | | | | | | | | | | | | | |
| Total Short Contracts | | | | | | | | | | | | | | | | | | | (13,789 | ) |
| | | | | | | | | | | | | | | | | | | | |
| Net Unrealized Appreciation | | | | | | | | | | | | | | | | | | $ | 12,213 | |
| | | | | | | | | | | | | | | | | | | | |
| 1. | As of June 30, 2020, cash in the amount of $87,300 was on deposit with a broker or futures commission merchant for futures transactions. |
| 2. | Represents the difference between the value of the contracts at the time they were opened and the value as of June 30, 2020. |
The following abbreviations are used in the preceding pages:
CME—Chicago Mercantile Exchange
ETF—Exchange-Traded Fund
LIBOR—London Interbank Offered Rate
SOFR—Secured Overnight Financing Rate
SPDR—Standard & Poor’s Depositary Receipt
| | | | | | |
The notes to the financial statements are an integral part of,
and should be read in conjunction with, the financial statements. | | | | | 23 | |
Portfolio of Investments June 30, 2020 (Unaudited) (continued)
The following is a summary of the fair valuations according to the inputs used as of June 30, 2020, for valuing the Portfolio’s assets and liabilities:
| | | | | | | | | | | | | | | | |
Description | | Quoted
Prices in
Active
Markets for
Identical
Assets
(Level 1) | | | Significant
Other
Observable
Inputs
(Level 2) | | | Significant
Unobservable
Inputs
(Level 3) | | | Total | |
| | | | |
Asset Valuation Inputs | | | | | | | | | | | | | | | | |
| Investments in Securities (a) | | | | | | | | | | | | | | | | |
| Long-Term Bonds | | | | | | | | | | | | | | | | |
Asset-Backed Securities | | $ | — | | | $ | 17,358,094 | | | $ | — | | | $ | 17,358,094 | |
Corporate Bonds | | | — | | | | 64,521,584 | | | | — | | | | 64,521,584 | |
Foreign Government Bonds | | | — | | | | 812,773 | | | | — | | | | 812,773 | |
Mortgage-Backed Securities | | | — | | | | 11,572,391 | | | | — | | | | 11,572,391 | |
U.S. Government & Federal Agencies | | | — | | | | 49,502,434 | | | | — | | | | 49,502,434 | |
| | | | | | | | | | | | | | | | |
| Total Long-Term Bonds | | | — | | | | 143,767,276 | | | | — | | | | 143,767,276 | |
| | | | | | | | | | | | | | | | |
| Common Stocks | | | 159,392,857 | | | | — | | | | — | | | | 159,392,857 | |
| Exchange-Traded Funds | | | 22,360,298 | | | | — | | | | — | | | | 22,360,298 | |
| Short-Term Investments | | | | | | | | | | | | | | | | |
Repurchase Agreement | | | — | | | | 1,213,778 | | | | — | | | | 1,213,778 | |
Unaffiliated Investment Company | | | 106,288 | | | | — | | | | — | | | | 106,288 | |
| | | | | | | | | | | | | | | | |
| Total Short-Term Investments | | | 106,288 | | | | 1,213,778 | | | | — | | | | 1,320,066 | |
| | | | | | | | | | | | | | | | |
| Total Investments in Securities | | | 181,859,443 | | | | 144,981,054 | | | | — | | | | 326,840,497 | |
| | | | | | | | | | | | | | | | |
| Other Financial Instruments | | | | | | | | | | | | | | | | |
Futures Contracts (b) | | | 26,004 | | | | — | | | | — | | | | 26,004 | |
| | | | | | | | | | | | | | | | |
| Total Investments in Securities and Other Financial Instruments | | $ | 181,885,447 | | | $ | 144,981,054 | | | $ | — | | | $ | 326,866,501 | |
| | | | | | | | | | | | | | | | |
| | | | |
Liability Valuation Inputs | | | | | | | | | | | | | | | | |
| Other Financial Instruments | | | | | | | | | | | | | | | | |
Futures Contracts (b) | | $ | (13,791 | ) | | $ | — | | | $ | — | | | $ | (13,791 | ) |
| | | | | | | | | | | | | | | | |
| (a) | For a complete listing of investments and their industries, see the Portfolio of Investments. |
| (b) | The value listed for these securities reflects unrealized appreciation (depreciation) as shown on the Portfolio of Investments. |
| | | | |
| 24 | | MainStay VP Balanced Portfolio | | The notes to the financial statements are an integral part of,
and should be read in conjunction with, the financial statements. |
Statement of Assets and Liabilities as of June 30, 2020 (Unaudited)
| | | | |
| Assets | | | | |
Investment in securities, at value
(identified cost $300,165,278) including securities on loan of $106,022 | | $ | 326,840,497 | |
Cash | | | 5,021,048 | |
Cash collateral on deposit at broker for futures contracts | | | 87,300 | |
Receivables: | | | | |
Dividends and interest | | | 913,233 | |
Investment securities sold | | | 661,114 | |
Portfolio shares sold | | | 102,306 | |
Securities lending | | | 3,118 | |
Other assets | | | 1,663 | |
| | | | |
Total assets | | | 333,630,279 | |
| | | | |
| |
| Liabilities | | | | |
Cash collateral received for securities on loan | | | 106,288 | |
Payables: | | | | |
Investment securities purchased | | | 1,286,542 | |
Portfolio shares redeemed | | | 222,163 | |
Manager (See Note 3) | | | 189,712 | |
NYLIFE Distributors (See Note 3) | | | 65,176 | |
Shareholder communication | | | 33,373 | |
Professional fees | | | 28,417 | |
Custodian | | | 17,685 | |
Variation margin on futures contracts | | | 12,814 | |
Trustees | | | 535 | |
Accrued expenses | | | 3,538 | |
| | | | |
Total liabilities | | | 1,966,243 | |
| | | | |
Net assets | | $ | 331,664,036 | |
| | | | |
| |
| Composition of Net Assets | | | | |
Shares of beneficial interest outstanding (par value of $.001 per share) unlimited number of shares authorized | | $ | 24,390 | |
Additional paid-in capital | | | 297,838,499 | |
| | | | |
| | | 297,862,889 | |
Total distributable earnings (loss) | | | 33,801,147 | |
| | | | |
Net assets | | $ | 331,664,036 | |
| | | | |
| | | | |
Initial Class | | | | |
Net assets applicable to outstanding shares | | $ | 16,988,799 | |
| | | | |
Shares of beneficial interest outstanding | | | 1,235,424 | |
| | | | |
Net asset value per share outstanding | | $ | 13.75 | |
| | | | |
Service Class | | | | |
Net assets applicable to outstanding shares | | $ | 314,675,237 | |
| | | | |
Shares of beneficial interest outstanding | | | 23,154,110 | |
| | | | |
Net asset value per share outstanding | | $ | 13.59 | |
| | | | |
| | | | | | |
The notes to the financial statements are an integral part of,
and should be read in conjunction with, the financial statements. | | | | | 25 | |
Statement of Operations for the six months ended June 30, 2020 (Unaudited)
| | | | |
| Investment Income (Loss) | | | | |
Income | | | | |
Dividends (a) | | $ | 2,512,034 | |
Interest | | | 1,845,251 | |
Securities lending | | | 7,629 | |
| | | | |
Total income | | | 4,364,914 | |
| | | | |
Expenses | | | | |
Manager (See Note 3) | | | 1,215,032 | |
Distribution/Service—Service Class (See Note 3) | | | 412,642 | |
Professional fees | | | 40,882 | |
Custodian | | | 29,044 | |
Shareholder communication | | | 25,950 | |
Trustees | | | 4,522 | |
Miscellaneous | | | 8,699 | |
| | | | |
Total expenses | | | 1,736,771 | |
| | | | |
Net investment income (loss) | | | 2,628,143 | |
| | | | |
| |
| Realized and Unrealized Gain (Loss) on Investments and Futures Contracts | | | | |
Net realized gain (loss) on: | | | | |
Investment transactions | | | (11,426,723 | ) |
Futures transactions | | | 776,716 | |
| | | | |
Net realized gain (loss) on investments and futures transactions | | | (10,650,007 | ) |
| | | | |
Net change in unrealized appreciation (depreciation) on: | | | | |
Investments | | | (17,546,452 | ) |
Futures contracts | | | 89,884 | |
| | | | |
Net change in unrealized appreciation (depreciation) on investments and futures contracts | | | (17,456,568 | ) |
| | | | |
Net realized and unrealized gain (loss) on investments and futures transactions | | | (28,106,575 | ) |
| | | | |
Net increase (decrease) in net assets resulting from operations | | $ | (25,478,432 | ) |
| | | | |
| (a) | Dividends recorded net of foreign withholding taxes in the amount of $338. |
| | | | |
| 26 | | MainStay VP Balanced Portfolio | | The notes to the financial statements are an integral part of,
and should be read in conjunction with, the financial statements. |
Statements of Changes in Net Assets
for the six months ended June 30, 2020 (Unaudited) and the year ended December 31, 2019
| | | | | | | | |
| | | 2020 | | | 2019 | |
| Increase (Decrease) in Net Assets | | | | | |
Operations: | | | | | | | | |
Net investment income (loss) | | $ | 2,628,143 | | | $ | 5,910,879 | |
Net realized gain (loss) on investments and futures transactions | | | (10,650,007 | ) | | | 15,008,899 | |
Net change in unrealized appreciation (depreciation) on investments and futures contracts | | | (17,456,568 | ) | | | 37,960,055 | |
| | | | |
Net increase (decrease) in net assets resulting from operations | | | (25,478,432 | ) | | | 58,879,833 | |
| | | | |
Distributions to shareholders: | | | | | | | | |
Initial Class | | | — | | | | (984,754 | ) |
Service Class | | | — | | | | (19,651,493 | ) |
| | | | |
Total distributions to shareholders | | | — | | | | (20,636,247 | ) |
| | | | |
Capital share transactions: | | | | | | | | |
Net proceeds from sale of shares | | | 13,640,975 | | | | 29,650,468 | |
Net asset value of shares issued to shareholders in reinvestment of distributions | | | — | | | | 20,636,247 | |
Cost of shares redeemed | | | (50,201,805 | ) | | | (63,406,846 | ) |
| | | | |
Increase (decrease) in net assets derived from capital share transactions | | | (36,560,830 | ) | | | (13,120,131 | ) |
| | | | |
Net increase (decrease) in net assets | | | (62,039,262 | ) | | | 25,123,455 | |
| | |
| Net Assets | | | | | | | | |
Beginning of period | | | 393,703,298 | | | | 368,579,843 | |
| | | | |
End of period | | $ | 331,664,036 | | | $ | 393,703,298 | |
| | | | |
| | | | | | |
The notes to the financial statements are an integral part of,
and should be read in conjunction with, the financial statements. | | | | | 27 | |
Financial Highlights selected per share data and ratios
| | | | | | | | | | | | | | | | | | | | | | | | | | | | | | | | | | | |
| | | |
| | | Six months
ended
June 30, | | | | Year ended December 31, |
| | | | | | | |
| Initial Class | | 2020* | | | | 2019 | | 2018 | | 2017 | | 2016 | | 2015 |
| | | | | | | |
Net asset value at beginning of period | | | $ | 14.59 | | | | | | | | | $ | 13.23 | | | | $ | 15.18 | | | | $ | 14.26 | | | | $ | 13.57 | | | | $ | 15.04 | |
| | | | | | | | | | | | | | | | | | | | | | | | | | | | | | | | | | | |
| | | | | | | |
Net investment income (loss) (a) | | | | 0.12 | | | | | | | | | | 0.25 | | | | | 0.28 | | | | | 0.23 | | | | | 0.21 | | | | | 0.22 | |
| | | | | | | |
Net realized and unrealized gain (loss) on investments | | | | (0.96 | ) | | | | | | | | | 1.93 | | | | | (1.31 | ) | | | | 1.18 | | | | | 1.15 | | | | | (0.61 | ) |
| | | | | | | | | | | | | | | | | | | | | | | | | | | | | | | | | | | |
| | | | | | | |
Total from investment operations | | | | (0.84 | ) | | | | | | | | | 2.18 | | | | | (1.03 | ) | | | | 1.41 | | | | | 1.36 | | | | | (0.39 | ) |
| | | | | | | | | | | | | | | | | | | | | | | | | | | | | | | | | | | |
| | | | | | | |
| Less distributions: | | | | | | | | | | | | | | | | | | | | | | | | | | | | | | | | | | | |
| | | | | | | |
From net investment income | | | | — | | | | | | | | | | (0.29 | ) | | | | (0.25 | ) | | | | (0.19 | ) | | | | (0.20 | ) | | | | (0.16 | ) |
| | | | | | | |
From net realized gain on investments | | | | — | | | | | | | | | | (0.53 | ) | | | | (0.67 | ) | | | | (0.30 | ) | | | | (0.47 | ) | | | | (0.92 | ) |
| | | | | | | | | | | | | | | | | | | | | | | | | | | | | | | | | | | |
| | | | | | | |
Total distributions | | | | — | | | | | | | | | | (0.82 | ) | | | | (0.92 | ) | | | | (0.49 | ) | | | | (0.67 | ) | | | | (1.08 | ) |
| | | | | | | | | | | | | | | | | | | | | | | | | | | | | | | | | | | |
| | | | | | | |
Net asset value at end of period | | | $ | 13.75 | | | | | | | | | $ | 14.59 | | | | $ | 13.23 | | | | $ | 15.18 | | | | $ | 14.26 | | | | $ | 13.57 | |
| | | | | | | | | | | | | | | | | | | | | | | | | | | | | | | | | | | |
| | | | | | | |
Total investment return (b) | | | | (5.76 | %)(c) | | | | | | | | | 16.75 | % | | | | (7.36 | %) | | | | 10.02 | % | | | | 10.24 | % | | | | (2.59 | %) |
| | | | | | | |
| Ratios (to average net assets)/Supplemental Data: | | | | | | | | | | | | | | | | | | | | | | | | | | | | | | | | | | | |
| | | | | | | |
Net investment income (loss) | | | | 1.75 | % †† | | | | | | | | | 1.75 | % | | | | 1.88 | % | | | | 1.54 | % | | | | 1.47 | %(d) | | | | 1.49 | % |
| | | | | | | |
Net expenses (e) | | | | 0.76 | % †† | | | | | | | | | 0.76 | % | | | | 0.74 | % | | | | 0.74 | % | | | | 0.74 | %(f) | | | | 0.76 | % |
| | | | | | | |
Expenses (before waiver/reimbursement) (e) | | | | 0.76 | % †† | | | | | | | | | 0.76 | % | | | | 0.74 | % | | | | 0.74 | % | | | | 0.76 | % | | | | 0.76 | % |
| | | | | | | |
Portfolio turnover rate | | | | 121 | % | | | | | | | | | 186 | % | | | | 209 | % | | | | 174 | % | | | | 253 | % | | | | 214 | % |
| | | | | | | |
Net assets at end of period (in 000’s) | | | $ | 16,989 | | | | | | | | | $ | 18,653 | | | | $ | 16,084 | | | | $ | 17,209 | | | | $ | 15,666 | | | | $ | 14,037 | |
| (a) | Per share data based on average shares outstanding during the period. |
| (b) | Total return does not reflect any deduction of sales charges, mortality and expense charges, contract charges or administrative charges. For periods of less than one year, total return is not annualized. |
| (c) | Total investment return may reflect adjustments to conform to generally accepted accounting principles. |
| (d) | Without the custody fee reimbursement, net investment income (loss) would have been 1.45%. |
| (e) | In addition to the fees and expenses which the Portfolio bears directly, it also indirectly bears a pro-rata share of the fees and expenses of the underlying funds in which it invests. Such indirect expenses are not included in the above expense ratios. |
| (f) | Without the custody fee reimbursement, net expenses would have been 0.76%. |
| | | | | | | | | | | | | | | | | | | | | | | | | | | | | | | | | | | |
| | | |
| | | Six months
ended
June 30, | | | | Year ended December 31, |
| | | | | | | |
| Service Class | | 2020* | | | | 2019 | | 2018 | | 2017 | | 2016 | | 2015 |
| | | | | | | |
Net asset value at beginning of period | | | $ | 14.43 | | | | | | | | | $ | 13.09 | | | | $ | 15.03 | | | | $ | 14.13 | | | | $ | 13.45 | | | | $ | 14.92 | |
| | | | | | | | | | | | | | | | | | | | | | | | | | | | | | | | | | | |
| | | | | | | |
Net investment income (loss) (a) | | | | 0.10 | | | | | | | | | | 0.21 | | | | | 0.24 | | | | | 0.19 | | | | | 0.17 | | | | | 0.18 | |
| | | | | | | |
Net realized and unrealized gain (loss) on investments | | | | (0.94 | ) | | | | | | | | | 1.91 | | | | | (1.30 | ) | | | | 1.17 | | | | | 1.15 | | | | | (0.60 | ) |
| | | | | | | | | | | | | | | | | | | | | | | | | | | | | | | | | | | |
| | | | | | | |
Total from investment operations | | | | (0.84 | ) | | | | | | | | | 2.12 | | | | | (1.06 | ) | | | | 1.36 | | | | | 1.32 | | | | | (0.42 | ) |
| | | | | | | | | | | | | | | | | | | | | | | | | | | | | | | | | | | |
| | | | | | | |
| Less distributions: | | | | | | | | | | | | | | | | | | | | | | | | | | | | | | | | | | | |
| | | | | | | |
From net investment income | | | | — | | | | | | | | | | (0.25 | ) | | | | (0.21 | ) | | | | (0.16 | ) | | | | (0.17 | ) | | | | (0.13 | ) |
| | | | | | | |
From net realized gain on investments | | | | — | | | | | | | | | | (0.53 | ) | | | | (0.67 | ) | | | | (0.30 | ) | | | | (0.47 | ) | | | | (0.92 | ) |
| | | | | | | | | | | | | | | | | | | | | | | | | | | | | | | | | | | |
| | | | | | | |
Total distributions | | | | — | | | | | | | | | | (0.78 | ) | | | | (0.88 | ) | | | | (0.46 | ) | | | | (0.64 | ) | | | | (1.05 | ) |
| | | | | | | | | | | | | | | | | | | | | | | | | | | | | | | | | | | |
| | | | | | | |
Net asset value at end of period | | | $ | 13.59 | | | | | | | | | $ | 14.43 | | | | $ | 13.09 | | | | $ | 15.03 | | | | $ | 14.13 | | | | $ | 13.45 | |
| | | | | | | | | | | | | | | | | | | | | | | | | | | | | | | | | | | |
| | | | | | | |
Total investment return (b) | | | | (5.82 | %)(c) | | | | | | | | | 16.46 | % | | | | (7.59 | %) | | | | 9.75 | % | | | | 9.96 | % | | | | (2.83 | %) |
| | | | | | | |
| Ratios (to average net assets)/Supplemental Data: | | | | | | | | | | | | | | | | | | | | | | | | | | | | | | | | | | | |
| | | | | | | |
Net investment income (loss) | | | | 1.50 | % †† | | | | | | | | | 1.50 | % | | | | 1.62 | % | | | | 1.28 | % | | | | 1.22 | %(d) | | | | 1.24 | % |
| | | | | | | |
Net expenses (e) | | | | 1.01 | % †† | | | | | | | | | 1.01 | % | | | | 0.99 | % | | | | 0.99 | % | | | | 0.99 | %(f) | | | | 1.01 | % |
| | | | | | | |
Expenses (before waiver/reimbursement) (e) | | | | 1.01 | % †† | | | | | | | | | 1.01 | % | | | | 0.99 | % | | | | 0.99 | % | | | | 1.01 | % | | | | 1.01 | % |
| | | | | | | |
Portfolio turnover rate | | | | 121 | % | | | | | | | | | 186 | % | | | | 209 | % | | | | 174 | % | | | | 253 | % | | | | 214 | % |
| | | | | | | |
Net assets at end of period (in 000’s) | | | $ | 314,675 | | | | | | | | | $ | 375,050 | | | | $ | 352,496 | | | | $ | 426,646 | | | | $ | 395,611 | | | | $ | 353,238 | |
| (a) | Per share data based on average shares outstanding during the period. |
| (b) | Total return does not reflect any deduction of sales charges, mortality and expense charges, contract charges or administrative charges. For periods of less than one year, total return is not annualized. |
| (c) | Total investment return may reflect adjustments to conform to generally accepted accounting principles. |
| (d) | Without the custody fee reimbursement, net investment income (loss) would have been 1.20%. |
| (e) | In addition to the fees and expenses which the Portfolio bears directly, it also indirectly bears a pro-rata share of the fees and expenses of the underlying funds in which it invests. Such indirect expenses are not included in the above expense ratios. |
| (f) | Without the custody fee reimbursement, net expenses would have been 1.01%. |
| | | | |
| 28 | | MainStay VP Balanced Portfolio | | The notes to the financial statements are an integral part of,
and should be read in conjunction with, the financial statements. |
Notes to Financial Statements (Unaudited)
Note 1–Organization and Business
MainStay VP Funds Trust (the “Fund”) was organized as a Delaware statutory trust on February 1, 2011. The Fund is registered under the Investment Company Act of 1940, as amended (the “1940 Act”), as an open-end management investment company. The Fund is comprised of thirty-one separate series (collectively referred to as the “Portfolios”). These financial statements and notes relate to the MainStay VP Balanced Portfolio (the “Portfolio”), a “diversified” portfolio, as that term is defined in the 1940 Act, as interpreted or modified by regulatory authorities having jurisdiction, from time to time.
Shares of the Portfolio are currently offered to certain separate accounts to fund variable annuity policies and variable universal life insurance policies issued by New York Life Insurance and Annuity Corporation (“NYLIAC”), a wholly-owned subsidiary of New York Life Insurance Company (“New York Life”) and may also be offered to fund variable annuity policies and variable universal life insurance policies issued by other insurance companies. NYLIAC allocates shares of the Portfolios to, among others, certain NYLIAC separate accounts. Shares of the Portfolio are also offered to the MainStay VP Conservative Allocation Portfolio, MainStay VP Moderate Allocation Portfolio, MainStay VP Moderate Growth Allocation Portfolio and MainStay VP Growth Allocation Portfolio, which operate as “funds-of-funds,” and other variable insurance funds.
The Portfolio currently offers two classes of shares. Initial Class and Service Class shares commenced operations on May 2, 2005. Shares of the Portfolio are offered and are redeemed at a price equal to their respective net asset value (“NAV”) per share. No sales or redemption charge is applicable to the purchase or redemption of the Portfolio’s shares. Under the terms of the Fund’s multiple class plan, adopted pursuant to Rule 18f-3 under the 1940 Act, the classes differ in that, among other things, Service Class shares of the Portfolio pay a combined distribution and service fee of 0.25% of average daily net assets attributable to Service Class shares of the Portfolio to the Distributor (as defined in Note 3(B)) pursuant to a plan adopted in accordance with Rule 12b-1 under the 1940 Act. Contract owners of variable annuity contracts purchased after June 2, 2003, are permitted to invest only in the Service Class shares.
The Portfolio’s investment objective is to seek total return.
Note 2–Significant Accounting Policies
The Portfolio is an investment company and accordingly follows the investment company accounting and reporting guidance of the Financial Accounting Standards Board (“FASB”) Accounting Standard Codification Topic 946 Financial Services—Investment Companies. The Portfolio prepares its financial statements in accordance with generally accepted accounting principles (“GAAP”) in the United States of America and follows the significant accounting policies described below.
(A) Securities Valuation. Investments are usually valued as of the close of regular trading on the New York Stock Exchange (the “Exchange”) (usually 4:00 p.m. Eastern time) on each day the Portfolio is open for business (“valuation date”).
The Board of Trustees of the Fund (the “Board”) adopted procedures establishing methodologies for the valuation of the Portfolio’s securities
and other assets and delegated the responsibility for valuation determinations under those procedures to the Valuation Committee of the Fund (the “Valuation Committee”). The procedures state that, subject to the oversight of the Board and unless otherwise noted, the responsibility for the day-to-day valuation of portfolio assets (including fair value measurements for the Portfolio’s assets and liabilities) rests with New York Life Investment Management LLC (“New York Life Investments” or the “Manager”), aided to whatever extent necessary by the Subadvisors (as defined in Note 3(A)). To assess the appropriateness of security valuations, the Manager, the Subadvisors or the Portfolio’s third-party service provider, who is subject to oversight by the Manager, regularly compares prior day prices, prices on comparable securities and the sale prices to the prior and current day prices and challenges prices with changes exceeding certain tolerance levels with third-party pricing services or broker sources.
The Board authorized the Valuation Committee to appoint a Valuation Subcommittee (the “Subcommittee”) to establish the prices of securities for which market quotations are not readily available or the prices of which are not otherwise readily determinable under the procedures. The Subcommittee meets (in person, via electronic mail or via teleconference) on an as-needed basis. The Valuation Committee meets to ensure that actions taken by the Subcommittee were appropriate.
For those securities valued through either a standardized fair valuation methodology or a fair valuation measurement, the Subcommittee deals with such valuation and the Valuation Committee reviews and affirms, if appropriate, the reasonableness of the valuation based on such methodologies and measurements on a regular basis after considering information that is reasonably available and deemed relevant by the Valuation Committee. Any action taken by the Subcommittee with respect to the valuation of a portfolio security or other asset is submitted for review and ratification (if appropriate) to the Valuation Committee and the Board at the next regularly scheduled meeting.
“Fair value” is defined as the price the Portfolio would reasonably expect to receive upon selling an asset or liability in an orderly transaction to an independent buyer in the principal or most advantageous market for the asset or liability. Fair value measurements are determined within a framework that establishes a three-tier hierarchy that maximizes the use of observable market data and minimizes the use of unobservable inputs to establish a classification of fair value measurements for disclosure purposes. “Inputs” refer broadly to the assumptions that market participants would use in pricing the asset or liability, including assumptions about risk, such as the risk inherent in a particular valuation technique used to measure fair value using a pricing model and/or the risk inherent in the inputs for the valuation technique. Inputs may be observable or unobservable. Observable inputs reflect the assumptions market participants would use in pricing the asset or liability based on market data obtained from sources independent of the Portfolio. Unobservable inputs reflect the Portfolio’s own assumptions about the assumptions market participants would use in pricing the asset or liability based on the information available. The inputs or methodology used for valuing assets or liabilities may not be an indication of the risks associated with investing in those assets or liabilities. The three-tier hierarchy of inputs is summarized below.
| • | | Level 1—quoted prices in active markets for an identical asset or liability |
Notes to Financial Statements (Unaudited) (continued)
| • | | Level 2—other significant observable inputs (including quoted prices for a similar asset or liability in active markets, interest rates and yield curves, prepayment speeds, credit risk, etc.) |
| • | | Level 3—significant unobservable inputs (including the Portfolio’s own assumptions about the assumptions that market participants would use in measuring fair value of an asset or liability) |
The level of an asset or liability within the fair value hierarchy is based on the lowest level of an input, both individually and in the aggregate, that is significant to the fair value measurement. The aggregate value by input level of the Portfolio’s assets and liabilities as of June 30, 2020 is included at the end of the Portfolio of Investments.
The Portfolio may use third-party vendor evaluations, whose prices may be derived from one or more of the following standard inputs, among others:
| | |
• Benchmark yields | | • Reported trades |
• Broker/dealer quotes | | • Issuer spreads |
• Two-sided markets | | • Benchmark securities |
• Bids/offers | | • Reference data (corporate actions or material event notices) |
• Industry and economic events | | • Comparable bonds |
• Monthly payment information | | |
An asset or liability for which market values cannot be measured using the methodologies described above is valued by methods deemed reasonable in good faith by the Valuation Committee, following the procedures established by the Board, to represent fair value. Under these procedures, the Portfolio generally uses a market-based approach which may use related or comparable assets or liabilities, recent transactions, market multiples, book values and other relevant information. The Portfolio may also use an income-based valuation approach in which the anticipated future cash flows of the asset or liability are discounted to calculate fair value. Discounts may also be applied due to the nature and/or duration of any restrictions on the disposition of the asset or liability. Fair value represents a good faith approximation of the value of a security. Fair value determinations involve the consideration of a number of subjective factors, an analysis of applicable facts and circumstances and the exercise of judgment. As a result, it is possible that the fair value for a security determined in good faith in accordance with the Portfolio’s valuation procedures may differ from valuations for the same security determined by other funds using their own valuation procedures. Although the Portfolio’s valuation procedures are designed to value a security at the price the Portfolio may reasonably expect to receive upon the security’s sale in an orderly transaction, there can be no assurance that any fair value determination thereunder would, in fact, approximate the amount that the Portfolio would actually realize upon the sale of the security or the price at which the security would trade if a reliable market price were readily available. During the six-month period ended June 30, 2020, there were no material changes to the fair value methodologies.
Securities which may be valued in this manner include, but are not limited to: (i) a security for which trading has been halted or suspended; (ii) a debt security that has recently gone into default and for which there is not a current market quotation; (iii) a security of an issuer that has entered into a restructuring; (iv) a security that has been delisted
from a national exchange; (v) a security for which the market price is not readily available from a third-party pricing source or, if so provided, does not, in the opinion of the Manager or the Subadvisors, reflect the security’s market value; (vi) a security subject to trading collars for which no or limited trading takes place; and (vii) a security whose principal market has been temporarily closed at a time when, under normal conditions, it would be open. Securities valued in this manner are generally categorized as Level 3 in the hierarchy. As of June 30, 2020, no securities held by the Portfolio were fair valued in such a manner.
Equity securities, including exchange-traded funds (“ETFs”), are valued at the last quoted sales prices as of the close of regular trading on the relevant exchange on each valuation date. Securities that are not traded on the valuation date are valued at the mean of the last quoted bid and ask prices. Prices are normally taken from the principal market in which each security trades. Futures contracts are valued at the last posted settlement price on the market where such futures are primarily traded. These securities are generally categorized as Level 1 in the hierarchy.
Investments in mutual funds, including money market funds, are valued at their respective NAVs as of the close of the Exchange on the valuation date. These securities are generally categorized as Level 1 in the hierarchy.
Debt securities (other than convertible and municipal bonds) are valued at the evaluated bid prices (evaluated mean prices in the case of convertible and municipal bonds) supplied by a pricing agent or brokers selected by the Manager, in consultation with the Subadvisors. The evaluations are market-based measurements processed through a pricing application and represents the pricing agent’s good faith determination as to what a holder may receive in an orderly transaction under market conditions. The rules based logic utilizes valuation techniques that reflect participants’ assumptions and vary by asset class and per methodology, maximizing the use of relevant observable data including quoted prices for similar assets, benchmark yield curves and market corroborated inputs. The evaluated bid or mean prices are deemed by the Manager, in consultation with the Subadvisors, to be representative of market values at the regular close of trading of the Exchange on each valuation date. Debt securities purchased on a delayed delivery basis are marked to market daily until settlement at the forward settlement date. Debt securities, including corporate bonds, U.S. government and federal agency bonds, municipal bonds, foreign bonds, convertible bonds, asset-backed securities and mortgage-backed securities are generally categorized as Level 2 in the hierarchy.
Temporary cash investments acquired in excess of 60 days to maturity at the time of purchase are valued using the latest bid prices or using valuations based on a matrix system (which considers such factors as security prices, yields, maturities and ratings), both as furnished by independent pricing services. Temporary cash investments that mature in 60 days or less at the time of purchase (“Short-Term Investments”) are valued using the amortized cost method of valuation, unless the use of such method would be inappropriate. The amortized cost method involves valuing a security at its cost on the date of purchase and thereafter assuming a constant amortization to maturity of the difference between such cost and the value on maturity date. Amortized cost approximates the current fair value of a security. Securities valued using the amortized cost method are not valued using quoted prices in an active market and are generally categorized as Level 2 in the hierarchy.
| | |
| 30 | | MainStay VP Balanced Portfolio |
The information above is not intended to reflect an exhaustive list of the methodologies that may be used to value portfolio investments. The valuation procedures permit the use of a variety of valuation methodologies in connection with valuing portfolio investments. The methodology used for a specific type of investment may vary based on the market data available or other considerations. The methodologies summarized above may not represent the specific means by which portfolio investments are valued on any particular business day.
(B) Income Taxes. The Portfolio’s policy is to comply with the requirements of the Internal Revenue Code of 1986, as amended (the “Internal Revenue Code”), applicable to regulated investment companies and to distribute all of its taxable income to the shareholders of the Portfolio within the allowable time limits.
The Manager evaluates the Portfolio’s tax positions to determine if the tax positions taken meet the minimum recognition threshold in connection with accounting for uncertainties in income tax positions taken or expected to be taken for the purposes of measuring and recognizing tax liabilities in the financial statements. Recognition of tax benefits of an uncertain tax position is permitted only to the extent the position is “more likely than not” to be sustained assuming examination by taxing authorities. The Manager analyzed the Portfolio’s tax positions taken on federal, state and local income tax returns for all open tax years (for up to three tax years) and has concluded that no provisions for federal, state and local income tax are required in the Portfolio’s financial statements. The Portfolio’s federal, state and local income tax and federal excise tax returns for tax years for which the applicable statutes of limitations have not expired are subject to examination by the Internal Revenue Service and state and local departments of revenue.
(C) Dividends and Distributions to Shareholders. Dividends and distributions are recorded on the ex-dividend date. The Portfolio intends to declare and pay dividends from net investment income and distributions from net realized capital and currency gains, if any, at least annually. Unless a shareholder elects otherwise, all dividends and distributions are reinvested at NAV in the same class of shares of the Portfolio. Dividends and distributions to shareholders are determined in accordance with federal income tax regulations and may differ from determinations using GAAP.
(D) Security Transactions and Investment Income. The Portfolio records security transactions on the trade date. Realized gains and losses on security transactions are determined using the identified cost method. Dividend income is recognized on the ex-dividend date, net of any foreign tax withheld at the source, and interest income is accrued as earned using the effective interest rate method. Distributions received from real estate investment trusts may be classified as dividends, capital gains and/or return of capital. Discounts and premiums on securities purchased for the Portfolio are accreted and amortized, respectively, on the effective interest rate method.
Investment income and realized and unrealized gains and losses on investments of the Portfolio are allocated pro rata to the separate classes of shares based upon their relative net assets on the date the income is earned or realized and unrealized gains and losses are incurred.
The Portfolio may place a debt security on non-accrual status and reduce related interest income by ceasing current accruals and writing
off all or a portion of any interest receivables when the collection of all or a portion of such interest has become doubtful. A debt security is removed from non-accrual status when the issuer resumes interest payments or when collectability of interest is reasonably assured.
(E) Expenses. Expenses of the Fund are allocated to the individual Portfolios in proportion to the net assets of the respective Portfolios when the expenses are incurred, except where direct allocations of expenses can be made. Expenses (other than fees incurred under the distribution and service plans, further discussed in Note 3(B), which are charged directly to the Service Class shares) are allocated to separate classes of shares pro rata based upon their relative net assets on the date the expenses are incurred. The expenses borne by the Portfolio, including those of related parties to the Portfolio, are shown in the Statement of Operations.
Additionally, the Portfolio may invest in ETFs and mutual funds, which are subject to management fees and other fees that may cause the costs of investing in ETFs and mutual funds to be greater than the costs of owning the underlying securities directly. These indirect expenses of ETFs and mutual funds are not included in the amounts shown as expenses in the Portfolio’s Statement of Operations or in the expense ratios included in the Financial Highlights.
(F) Use of Estimates. In preparing financial statements in conformity with GAAP, the Manager makes estimates and assumptions that affect the reported amounts and disclosures in the financial statements. Actual results could differ from those estimates.
(G) Repurchase Agreements. The Portfolio may enter into repurchase agreements (i.e., buy a security from another party with the agreement that it will be sold back in the future) to earn income. The Portfolio may enter into repurchase agreements only with counterparties, usually financial institutions, that are deemed by the Manager or the Subadvisors to be creditworthy, pursuant to guidelines established by the Board. During the term of any repurchase agreement, the Manager or the Subadvisors will continue to monitor the creditworthiness of the counterparty. Under the 1940 Act, repurchase agreements are considered to be collateralized loans by the Portfolio to the counterparty secured by the securities transferred to the Portfolio.
Repurchase agreements are subject to counterparty risk, meaning the Portfolio could lose money by the counterparty’s failure to perform under the terms of the agreement. The Portfolio mitigates this risk by ensuring the repurchase agreement is collateralized by cash, U.S. government securities, fixed income securities and/or other securities. The collateral is held by the Portfolio’s custodian and valued daily on a mark to market basis to determine if the value, including accrued interest, exceeds the repurchase price. In the event of the counterparty’s default on the obligation to repurchase, the Portfolio has the right to liquidate the collateral and apply the proceeds in satisfaction of the obligation. Under certain circumstances, such as in the event of default or bankruptcy by the counterparty, realization and/or retention of the collateral may be limited or subject to delay, to legal proceedings and possible realized loss to the Portfolio. Repurchase agreements as of June 30, 2020, are shown in the Portfolio of Investments.
(H) Futures Contracts. A futures contract is an agreement to purchase or sell a specified quantity of an underlying instrument at a specified future date and price, or to make or receive a cash payment
Notes to Financial Statements (Unaudited) (continued)
based on the value of a financial instrument (e.g., foreign currency, interest rate, security, or securities index). The Portfolio is subject to risks such as market price risk and/or interest rate risk in the normal course of investing in these contracts. Upon entering into a futures contract, the Portfolio is required to pledge to the broker or futures commission merchant an amount of cash and/or U.S. government securities equal to a certain percentage of the collateral amount, known as the “initial margin.” During the period the futures contract is open, changes in the value of the contract are recognized as unrealized appreciation or depreciation by marking to market such contract on a daily basis to reflect the market value of the contract at the end of each day’s trading. The Portfolio agrees to receive from or pay to the broker or futures commission merchant an amount of cash equal to the daily fluctuation in the value of the contract. Such receipts or payments are known as “variation margin.” When the futures contract is closed, the Portfolio records a realized gain or loss equal to the difference between the proceeds from (or cost of) the closing transaction and the Portfolio’s basis in the contract.
The use of futures contracts involves, to varying degrees, elements of market risk in excess of the amount recognized in the Statement of Assets and Liabilities. The contract or notional amounts and variation margin reflect the extent of the Portfolio’s involvement in open futures positions. There are several risks associated with the use of futures contracts as hedging techniques. There can be no assurance that a liquid market will exist at the time when the Portfolio seeks to close out a futures contract. If no liquid market exists, the Portfolio would remain obligated to meet margin requirements until the position is closed. Futures contracts may involve a small initial investment relative to the risk assumed, which could result in losses greater than if the Portfolio did not invest in futures contracts. Futures contracts may be more volatile than direct investments in the instrument underlying the futures and may not correlate to the underlying instrument, causing a given hedge not to achieve its objectives. The Portfolio’s activities in futures contracts have minimal counterparty risk as they are conducted through regulated exchanges that guarantee the futures against default by the counterparty. In the event of a bankruptcy or insolvency of a futures commission merchant that holds margin on behalf of the Portfolio, the Portfolio may not be entitled to the return of the entire margin owed to the Portfolio, potentially resulting in a loss. The Portfolio’s investment in futures contracts and other derivatives may increase the volatility of the Portfolio’s NAVs and may result in a loss to the Portfolio. Open futures contracts as of June 30, 2020, are shown in the Portfolio of Investments.
(I) Securities Lending. In order to realize additional income, the Portfolio may engage in securities lending, subject to the limitations set forth in the 1940 Act and relevant guidance by the staff of the Securities and Exchange Commission (“SEC”). If the Portfolio engages in securities lending, the Portfolio will lend through its custodian, currently State Street Bank and Trust Company (“State Street”), acting as securities lending agent on behalf of the Portfolio. Under the current arrangement, State Street will manage the Portfolio’s collateral in accordance with the securities lending agency agreement between the Portfolio and State Street, and indemnify the Portfolio against counterparty risk. The loans will be collateralized by cash (which may be invested in a money market fund) and/or non-cash collateral (which may include U.S. Treasury securities and/or U.S. government agency securities issued or guaranteed by the United States government or its agencies or instrumentalities) at least equal at all times to the market value of the
securities loaned. The Portfolio bears the risk of delay in recovery of, or loss of rights in, the securities loaned. The Portfolio may also record a realized gain or loss on securities deemed sold due to a borrower’s inability to return securities on loan. The Portfolio bears the risk of any loss on investment of cash collateral. The Portfolio will receive compensation for lending its securities in the form of fees or it will retain a portion of interest earned on the investment of any cash collateral. The Portfolio will also continue to receive interest and dividends on the securities loaned and any gain or loss in the market price of the securities loaned that may occur during the term of the loan will be for the account of the Portfolio. Income earned from securities lending activities, if any, is reflected in the Statement of Operations. As of June 30, 2020, the Portfolio had securities on loan with an aggregate market value of $106,022 and received cash collateral, which was invested into the State Street Navigator Securities Lending Government Money Market Portfolio, with a value of $106,288.
(J) Debt Securities Risk. The ability of issuers of debt securities held by the Portfolio to meet their obligations may be affected by, among other things, economic or political developments in a specific country, industry or region. Debt securities are also subject to the risks associated with changes in interest rates.
Investments in the Portfolio are not guaranteed, even though some of the Portfolio’s underlying investments are guaranteed by the U.S. government or its agencies or instrumentalities. The principal risk of mortgage-related and asset-backed securities is that the underlying debt may be prepaid ahead of schedule, if interest rates fall, thereby reducing the value of the Portfolio’s investment. If interest rates rise, less of the debt may be prepaid and the Portfolio may lose money because the Portfolio may be unable to invest in higher yielding assets. The Portfolio is subject to interest-rate risk and can lose principal value when interest rates rise. Bonds are also subject to credit risk, in which the bond issuer may fail to pay interest and principal in a timely manner.
The Portfolio may invest in foreign debt securities, which carry certain risks that are in addition to the usual risks inherent in domestic instruments. These risks include those resulting from currency fluctuations, future adverse political or economic developments and possible imposition of currency exchange blockages or other foreign governmental laws or restrictions. These risks are likely to be greater in emerging markets than in developed markets.
(K) LIBOR Replacement Risk. The Portfolio may invest in certain debt securities, derivatives or other financial instruments that utilize the London Interbank Offered Rate (“LIBOR”), as a “benchmark” or “reference rate” for various interest rate calculations. The United Kingdom Financial Conduct Authority, which regulates LIBOR, announced that after 2021 it will cease its active encouragement of banks to provide the quotations needed to sustain LIBOR. As a result, it is anticipated that LIBOR will be discontinued or will no longer be sufficiently robust to be representative of its underlying market around that time. Although financial regulators and industry working groups have suggested alternative reference rates, such as the European Interbank Offer Rate (“EURIBOR”), Sterling Overnight Interbank Average Rate (“SONIA”) and Secured Overnight Financing Rate (“SOFR”), there are challenges to converting certain contracts and transactions to a new benchmark and neither the full effects of the transition process nor its ultimate outcome is known.
| | |
| 32 | | MainStay VP Balanced Portfolio |
The elimination of LIBOR or changes to other reference rates or any other changes or reforms to the determination or supervision of reference rates could have an adverse impact on the market for, or value of, any securities or payments linked to those reference rates, which may adversely affect the Portfolio’s performance and/or net asset value. Uncertainty and risk also remain regarding the willingness and ability of issuers and lenders to include revised provisions in new and existing contracts or instruments. Consequently, the transition away from LIBOR to other reference rates may lead to increased volatility and illiquidity in markets that are tied to LIBOR, fluctuations in values of LIBOR-related investments or investments in issuers that utilize LIBOR, increased difficulty in borrowing or refinancing and diminished effectiveness of hedging strategies, adversely affecting the Portfolio’s performance. Furthermore, the risks associated with the expected discontinuation of LIBOR and transition may be exacerbated if the work necessary to effect an orderly transition to an alternative reference rate is not completed in a timely manner. Because the usefulness of LIBOR as a benchmark could deteriorate during the transition period, these effects could occur prior to the end of 2021.
(L) Indemnifications. Under the Fund’s organizational documents, its officers and trustees are indemnified against certain liabilities that may arise out of performance of their duties to the Fund. Additionally, in the normal course of business, the Portfolio enters into contracts with third-party service providers that contain a variety of representations and warranties and that may provide general indemnifications. The Portfolio’s maximum exposure under these arrangements is unknown, as this would involve future claims that may be made against the Portfolio that have not yet occurred. The Manager believes that the risk of loss in connection with these potential indemnification obligations is remote. However, there can be no assurance that material liabilities related to such obligations will not arise in the future, which could adversely impact the Portfolio.
(M) Quantitative Disclosure of Derivative Holdings. The following tables show additional disclosures related to the Portfolio’s derivative and hedging activities, including how such activities are accounted for and their effect on the Portfolio’s financial positions, performance and cash flows. The Portfolio entered into futures contracts to help manage the duration and yield curve positioning of the portfolio while minimizing the exposure to wider bid/ask spreads in traditional bonds. These derivatives are not accounted for as hedging instruments.
Fair value of derivative instruments as of June 30, 2020:
Asset Derivatives
| | | | | | | | | | |
| | | Statement of
Assets and
Liabilities
Location | | Interest
Rate
Contracts
Risk | | | Total | |
| | | |
Futures Contracts | | Net Assets—Net unrealized appreciation on investments and futures contracts (a) | | $ | 26,004 | | | $ | 26,004 | |
| | | | | | |
Total Fair Value | | | | $ | 26,004 | | | $ | 26,004 | |
| | | | | | |
Liability Derivatives
| | | | | | | | | | |
| | | Statement of
Assets and
Liabilities
Location | | Interest
Rate
Contracts
Risk | | | Total | |
| | | |
Futures Contracts | | Net Assets—Net unrealized depreciation on investments and futures contracts (a) | | $ | (13,791 | ) | | $ | (13,791 | ) |
| | | | | | |
Total Fair Value | | | | $ | (13,791 | ) | | $ | (13,791 | ) |
| | | | | | |
| (a) | Includes cumulative appreciation (depreciation) of futures contracts as reported in the Portfolio of Investments. Only current day’s variation margin is reported within the Statement of Assets and Liabilities. |
The effect of derivative instruments on the Statement of Operations for the period ended June 30, 2020:
Realized Gain (Loss)
| | | | | | | | | | |
| | | Statement of
Operations
Location | | Interest
Rate
Contracts
Risk | | | Total | |
| | | |
Futures Contracts | | Net realized gain (loss) on futures transactions | | $ | 776,716 | | | $ | 776,716 | |
| | | | | | |
Total Realized Gain (Loss) | | | | $ | 776,716 | | | $ | 776,716 | |
| | | | | | |
Change in Unrealized Appreciation (Depreciation)
| | | | | | | | | | |
| | | Statement of
Operations
Location | | Interest
Rate
Contracts
Risk | | | Total | |
| | | |
Futures Contracts | | Net change in unrealized appreciation (depreciation) on futures contracts | | $ | 89,884 | | | $ | 89,884 | |
| | | | | | |
Total Change in Unrealized Appreciation (Depreciation) | | | | $ | 89,884 | | | $ | 89,884 | |
| | | | | | |
Average Notional Amount
| | | | | | | | |
| | | Interest
Rate
Contracts
Risk | | | Total | |
| | |
Futures Contracts Long | | $ | 22,978,587 | | | $ | 22,978,587 | |
Futures Contracts Short | | $ | (3,391,716 | ) | | $ | (3,391,716 | ) |
| | | | |
Note 3–Fees and Related Party Transactions
(A) Manager and Subadvisors. New York Life Investments, a registered investment adviser and an indirect, wholly-owned subsidiary of New York Life, serves as the Portfolio’s Manager pursuant to an Amended and Restated Management Agreement (“Management
Notes to Financial Statements (Unaudited) (continued)
Agreement”). The Manager provides offices, conducts clerical, recordkeeping and bookkeeping services, and keeps most of the financial and accounting records required to be maintained by the Portfolio. Except for the portion of salaries and expenses that are the responsibility of the Portfolio, the Manager pays the salaries and expenses of all personnel affiliated with the Portfolio and certain operational expenses of the Portfolio. The Portfolio reimburses New York Life Investments in an amount equal to the portion of the compensation of the Chief Compliance Officer attributable to the Portfolio. MacKay Shields LLC (“MacKay Shields” or “Subadvisor”), a registered investment adviser and an indirect, wholly-owned subsidiary of New York Life, serves as a Subadvisor to the Portfolio and is responsible for the day-to-day portfolio management of the equity portion of the Portfolio, pursuant to the terms of an Amended and Restated Subadvisory Agreement (a “Subadvisory Agreement”) between New York Life Investments and MacKay Shields. NYL Investors LLC (“NYL Investors” or “Subadvisor,” and, together with MacKay Shields, the “Subadvisors”), a registered investment adviser and a direct, wholly-owned subsidiary of New York Life, serves as a Subadvisor to the Portfolio, pursuant to the terms of a Subadvisory Agreement between New York Life Investments and NYL Investors and is responsible for the day-to-day portfolio management of the fixed-income portion of the Portfolio. New York Life Investments pays for the services of the Subadvisors.
The Fund, on behalf of the Portfolio, pays New York Life Investments in its capacity as the Portfolio’s investment manager and administrator, pursuant to the Management Agreement, a monthly fee for the services performed and the facilities furnished at an annual rate of the Portfolio’s average daily net assets as follows: 0.70% up to $1 billion; 0.65% from $1 billion to $2 billion; and 0.60% in excess of $2 billion. During the six-month period ended June 30, 2020, the effective management fee rate was 0.70%.
During the six-month period ended June 30, 2020, New York Life Investments earned fees from the Portfolio in the amount of $1,215,032 and paid MacKay Shields and NYL Investors $320,147 and $258,622, respectively.
State Street provides sub-administration and sub-accounting services to the Portfolio pursuant to an agreement with New York Life Investments. These services include calculating the daily NAVs of the Portfolio, maintaining the general ledger and sub-ledger accounts for the calculation of the Portfolio’s NAVs and assisting New York Life Investments in conducting various aspects of the Portfolio’s administrative operations. For providing these services to the Portfolio, State Street is compensated by New York Life Investments.
Pursuant to an agreement between the Fund and New York Life Investments, New York Life Investments is responsible for providing or procuring certain regulatory reporting services for the Portfolio. The Portfolio will reimburse New York Life Investments for the actual costs incurred by New York Life Investments in connection with providing or procuring these services for the Portfolio.
(B) Distribution and Service Fees. The Fund, on behalf of the Portfolio, has entered into a distribution agreement with NYLIFE Distributors LLC (the “Distributor”), an indirect, wholly-owned subsidiary of New York Life. The Portfolio has adopted a distribution plan (the “Plan”) in accordance with the provisions of Rule 12b-1 under the 1940 Act.
Under the Plan, the Distributor has agreed to provide, through its affiliates or independent third parties, various distribution-related, shareholder and administrative support services to the Service Class shareholders. For its services, the Distributor is entitled to a combined distribution and service fee accrued daily and paid monthly at an annual rate of 0.25% of the average daily net assets attributable to the Service Class shares of the Portfolio.
Note 4–Federal Income Tax
As of June 30, 2020, the cost and unrealized appreciation (depreciation) of the Portfolio’s investment portfolio, including applicable derivative contracts and other financial instruments, as determined on a federal income tax basis, was as follows:
| | | | | | | | | | | | | | | | |
| | | Federal
Tax Cost | | | Gross
Unrealized
Appreciation | | | Gross
Unrealized
(Depreciation) | | | Net
Unrealized
Appreciation/
(Depreciation) | |
| | | | |
Investments in Securities | | $ | 304,247,485 | | | $ | 31,999,814 | | | $ | (9,406,802 | ) | | $ | 22,593,012 | |
During the year ended December 31, 2019, the tax character of distributions paid as reflected in the Statements of Changes in Net Assets was as follows:
| | |
|
| 2019 |
Tax-Based
Distributions
from Ordinary
Income | | Tax-Based
Distributions
from Long-Term
Gains |
| |
| $6,650,092 | | $13,986,155 |
Note 5–Custodian
State Street is the custodian of cash and securities held by the Portfolio. Custodial fees are charged to the Portfolio based on the Portfolio’s net assets and/or the market value of securities held by the Portfolio and the number of certain transactions incurred by the Portfolio.
Note 6–Line of Credit
The Portfolio and certain other funds managed by New York Life Investments maintain a line of credit with a syndicate of banks in order to secure a source of funds for temporary purposes to meet unanticipated or excessive redemption requests.
Effective July 28, 2020, under the credit agreement (the “Credit Agreement”), the aggregate commitment amount is $600,000,000 with an additional uncommitted amount of $100,000,000. The commitment fee is an annual rate of 0.15% of the average commitment amount payable quarterly, regardless of usage, to JP Morgan Chase Bank NA, who serves as the agent to the syndicate. The commitment fee is allocated among the Portfolio and certain other funds managed by New York Life Investments based upon their respective net assets and other factors. Interest on any revolving credit loan is charged based upon the Federal Funds Rate or the one-month LIBOR, whichever is higher. The Credit Agreement expires on July 27, 2021, although the Portfolio, certain other funds managed by New York Life Investments and the syndicate of banks may renew the Credit Agreement for an additional
| | |
| 34 | | MainStay VP Balanced Portfolio |
year on the same or different terms or enter into a credit agreement with a different syndicate of banks. Prior to July 28, 2020, the aggregate commitment amount and the commitment fee were the same as those under the current Credit Agreement, but State Street Served as agent to the syndicate. As of June 30, 2020, there were no borrowings outstanding with respect to the Portfolio under the Credit Agreement or the credit agreement for which State Street served as agent.
Note 7–Interfund Lending Program
Pursuant to an exemptive order issued by the SEC, the Portfolio, along with certain other funds managed by New York Life Investments, may participate in an interfund lending program. The interfund lending program provides an alternative credit facility that permits the Portfolio and certain other funds managed by New York Life Investments to lend or borrow money for temporary purposes directly to or from one another, subject to the conditions of the exemptive order. During the six-month period ended June 30, 2020, there were no interfund loans made or outstanding with respect to the Portfolio.
Note 8–Purchases and Sales of Securities (in 000’s)
During the six-month period ended June 30, 2020, purchases and sales of U.S. government securities were $119,675 and $145,933, respectively. Purchases and sales of securities, other than U.S. government securities and short-term securities, were $300,282 and $311,410, respectively.
Note 9–Capital Share Transactions
Transactions in capital shares for the six-month period ended June 30, 2020 and the year ended December 31, 2019, were as follows:
| | | | | | | | |
Initial Class | | Shares | | | Amount | |
| | |
Six-month period ended June 30, 2020: | | | | | | | | |
Shares sold | | | 49,173 | | | $ | 671,684 | |
Shares redeemed | | | (92,528 | ) | | | (1,241,037 | ) |
| | | | |
Net increase (decrease) | | | (43,355 | ) | | $ | (569,353 | ) |
| | | | |
Year ended December 31, 2019: | | | | | | | | |
Shares sold | | | 116,654 | | | $ | 1,695,814 | |
Shares issued to shareholders in reinvestment of distributions | | | 70,731 | | | | 984,754 | |
Shares redeemed | | | (124,405 | ) | | | (1,795,584 | ) |
| | | | |
Net increase (decrease) | | | 62,980 | | | $ | 884,984 | |
| | | | |
| | |
| | | | | | | | |
Service Class | | Shares | | | Amount | |
Six-month period ended June 30, 2020: | | | | | | | | |
Shares sold | | | 955,188 | | | $ | 12,969,291 | |
Shares redeemed | | | (3,784,672 | ) | | | (48,960,768 | ) |
| | | | |
Net increase (decrease) | | | (2,829,484 | ) | | $ | (35,991,477 | ) |
| | | | |
Year ended December 31, 2019: | | | | | | | | |
Shares sold | | | 1,955,145 | | | $ | 27,954,654 | |
Shares issued to shareholders in reinvestment of distributions | | | 1,425,556 | | | | 19,651,493 | |
Shares redeemed | | | (4,315,727 | ) | | | (61,611,262 | ) |
| | | | |
Net increase (decrease) | | | (935,026 | ) | | $ | (14,005,115 | ) |
| | | | |
Note 10–Recent Accounting Pronouncement
In March 2020, the Financial Accounting Standards Board (“FASB”) issued Accounting Standards Update 2020-04 (“ASU 2020-04”), which provides optional guidance to ease the potential accounting burden associated with transitioning away from LIBOR and other reference rates that are expected to be discontinued. ASU 2020-04 is effective immediately upon release of the update on March 12, 2020 through December 31, 2022. At this time, the Manager is evaluating the implications of certain other provisions of ASU 2020-04 related to new disclosure requirements and any impact on the financial statement disclosures has not yet been determined.
Note 11–Subsequent Events
In connection with the preparation of the financial statements of the Portfolio as of and for the six-month period ended June 30, 2020, events and transactions subsequent to June 30, 2020, through the date the financial statements were issued have been evaluated by the Manager, for possible adjustment and/or disclosure. No subsequent events requiring financial statement adjustment or disclosure have been identified.
Note 12–Other Matters
An outbreak of COVID-19, first detected in December 2019, has developed into a global pandemic and has resulted in travel restrictions, closure of international borders, certain businesses and securities markets, restrictions on securities trading activities, prolonged quarantines, supply chain disruptions, and lower consumer demand, as well as general concern and uncertainty. The continued impact of COVID-19 is uncertain and could further adversely affect the global economy, national economies, individual issuers and capital markets in unforeseeable ways and result in a substantial and extended economic downturn. Developments that disrupt global economies and financial markets, such as COVID-19, may magnify factors that affect the Portfolio’s performance.
Discussion of the Operation and Effectiveness of the Portfolio’s Liquidity Risk
Management Program (Unaudited)
In compliance with Rule 22e-4 under the Investment Company Act of 1940, as amended (the “Liquidity Rule”), the Portfolio has adopted and implemented a liquidity risk management program (the “Program”), which New York Life Investment Management LLC believes is reasonably designed to assess and manage the Portfolio’s liquidity risk. The Board designated New York Life Investment Management LLC as administrator of the Program (the “Administrator”). The Administrator has established a Liquidity Risk Management Committee to assist the Administrator in the implementation and day-to-day administration of the Program and to otherwise support the Administrator in fulfilling its responsibilities under the Program.
At a meeting of the Board held on March 11, 2020, the Administrator provided the Board with a written report addressing the Program’s operation, adequacy and effectiveness of implementation for the period from December 1, 2018 through December 31, 2019, as required under the Liquidity Rule. The report noted that the Administrator concluded that (i) the Program operated effectively to assess and manage the Portfolio’s liquidity risk, (ii) the Program has been adequately and effectively implemented to monitor and, as applicable, respond to the Portfolio’s liquidity developments and (iii) the Portfolio’s investment strategy continues to be appropriate for an open-end portfolio.
In accordance with the Program, the Portfolio’s liquidity risk is assessed no less frequently than annually taking into consideration certain factors, as applicable, such as (i) investment strategy and liquidity of portfolio investments, (ii) short-term and long-term cash flow projections and (iii) holdings of cash and cash equivalents and borrowing arrangements and other funding sources. Certain factors are considered under both normal and reasonably foreseeable stressed conditions.
Each Portfolio portfolio investment is classified into one of four liquidity categories. The classification is based on a determination of the number of days it is reasonably expected to take to convert the investment into cash, or sell or dispose of the investment, in current market conditions without significantly changing the market value of the investment. The Administrator has delegated liquidity classification determinations to the Portfolio’s subadvisors, subject to appropriate oversight by the Administrator, and classification determinations are made by taking into account the Portfolio’s reasonably anticipated trade size, various market, trading and investment-specific considerations, as well as market depth, and, in certain cases, third-party vendor data.
The Liquidity Rule requires portfolios that do not primarily hold assets that are highly liquid investments to adopt a minimum amount of net assets that must be invested in highly liquid investments that are assets (an “HLIM”). In addition, the Liquidity Rule limits a portfolio’s investments in illiquid investments. Specifically, the Liquidity Rule prohibits acquisition of illiquid investments if doing so would result in a portfolio holding more than 15% of its net assets in illiquid investments that are assets. The Program includes provisions reasonably designed to determine, periodically review and comply with the HLIM requirement, as applicable, and to comply with the 15% limit on illiquid investments.
| | |
| 36 | | MainStay VP Balanced Portfolio |
Proxy Voting Policies and Procedures and Proxy Voting Record
A description of the policies and procedures that New York Life Investments uses to vote proxies related to the Portfolio’s securities is available free of charge upon request (i) by calling 800-598-2019; (ii) by visiting New York Life Investments’ website at https://www.nylinvestments.com/mainstay/products-and-performance/mainstay-vp-funds-trust; or (iii) by visiting the SEC’s website at www.sec.gov.
The Portfolio is required to file with the SEC its proxy voting record for the 12-month period ending June 30 on Form N-PX. The Portfolio’s most recent Form N-PX or proxy voting record is available free of charge upon request (i) by calling 800-598-2019; (ii) by visiting New York Life Investments’ website at https://www.nylinvestments.com/mainstay/products-and-performance/mainstay-vp-funds-trust; or (iii) by visiting the SEC’s website at www.sec.gov.
Shareholder Reports and Quarterly Portfolio Disclosure
The Portfolio is required to file its complete schedule of portfolio holdings with the SEC 60 days after its first and third fiscal quarter on Form N-PORT. The Portfolio’s holdings report is available free of charge upon request by calling 800-598-2019 or by visiting the SEC’s website at www.sec.gov.
MainStay VP Portfolios
MainStay VP offers a wide range of Portfolios. The full array of MainStay VP offerings is listed here, with information about the manager, subadvisors, legal counsel, and independent registered public accounting firm.
Equity Portfolios
MainStay VP Emerging Markets Equity Portfolio
MainStay VP Epoch U.S. Equity Yield Portfolio
MainStay VP Fidelity Institutional AM® Utilities Portfolio†
MainStay VP MacKay Common Stock Portfolio
MainStay VP MacKay Growth Portfolio
MainStay VP MacKay International Equity Portfolio
MainStay VP MacKay Mid Cap Core Portfolio
MainStay VP MacKay S&P 500 Index Portfolio
MainStay VP MacKay Small Cap Core Portfolio
MainStay VP Mellon Natural Resources Portfolio
MainStay VP Small Cap Growth Portfolio
MainStay VP T. Rowe Price Equity Income Portfolio
MainStay VP Winslow Large Cap Growth Portfolio
Mixed Asset Portfolios
MainStay VP Balanced Portfolio
MainStay VP Income Builder Portfolio
MainStay VP Janus Henderson Balanced Portfolio
MainStay VP MacKay Convertible Portfolio
Income Portfolios
MainStay VP Bond Portfolio
MainStay VP Floating Rate Portfolio
MainStay VP Indexed Bond Portfolio
MainStay VP MacKay Government Portfolio
MainStay VP MacKay High Yield Corporate Bond Portfolio
MainStay VP MacKay Unconstrained Bond Portfolio
MainStay VP PIMCO Real Return Portfolio
Money Market
MainStay VP U.S. Government Money Market Portfolio
Alternative
MainStay VP CBRE Global Infrastructure Portfolio
MainStay VP IQ Hedge Multi-Strategy Portfolio
Asset Allocation Portfolios
MainStay VP Conservative Allocation Portfolio
MainStay VP Growth Allocation Portfolio
MainStay VP Moderate Allocation Portfolio
MainStay VP Moderate Growth Allocation Portfolio
Manager
New York Life Investment Management LLC
New York, New York
Subadvisors
Brown Advisory LLC
Baltimore, Maryland
Candriam Belgium S.A.*
Brussels, Belgium
CBRE Clarion Securities LLC
Radnor, Pennsylvania
Epoch Investment Partners, Inc.
New York, New York
FIAM LLC
Smithfield, Rhode Island
IndexIQ Advisors LLC*
New York, New York
Janus Capital Management LLC
Denver, Colorado
MacKay Shields LLC*
New York, New York
Mellon Investments Corporation
Boston, Massachusetts
NYL Investors LLC*
New York, New York
Pacific Investment Management Company LLC
Newport Beach, California
Segall Bryant & Hamill, LLC
Chicago, Illinois
T. Rowe Price Associates, Inc.
Baltimore, Maryland
Winslow Capital Management, LLC
Minneapolis, Minnesota
Distributor
NYLIFE Distributors LLC*
Jersey City, New Jersey
Custodian
State Street Bank and Trust Company
Boston, Massachusetts
Independent Registered Public Accounting Firm
PricewaterhouseCoopers LLP
New York, New York
Legal Counsel
Dechert LLP
Washington, District of Columbia
Some Portfolios may not be available in all products.
| † | Fidelity Institutional AM is a registered trade mark of FMR LLC. Used with permission. |
| * | An affiliate of New York Life Investment Management LLC |
Not part of the Semiannual Report
2020 Semiannual Report
This report is for the general information of New York Life Variable Annuities and NYLIAC Variable Universal Life Insurance Products policyowners. It must be preceded or accompanied by the appropriate product(s) and funds prospectuses if it is given to anyone who is not an owner of a New York Life variable annuity policy or a NYLIAC Variable Universal Life Insurance Product. This report does not offer for sale or solicit orders to purchase securities.
The performance data quoted in this report represents past performance. Past performance is no guarantee of future results. Due to market volatility and other factors, current performance may be lower or higher than the figures shown. The most recent month-end performance summary for your variable annuity or variable life policy is available by calling 800-598-2019 and is updated periodically on www.newyorklife.com.
The New York Life Variable Annuities and NYLIAC Variable Universal Life Insurance Products are issued by New York Life Insurance and Annuity Corporation (a Delaware Corporation) and distributed by NYLIFE Distributors LLC (Member FINRA/SIPC).
New York Life Insurance Company
New York Life Insurance and Annuity Corporation (NYLIAC) (A Delaware Corporation)
51 Madison Avenue, Room 551
New York, NY 10010
www.newyorklife.com
Printed on recycled paper
nylinvestments.com
NYLIFE Distributors LLC, 30 Hudson Street, Jersey City, NJ 07302
New York Life Investment Management LLC is the investment manager to the MainStay VP Funds Trust
©2020 by NYLIFE Distributors LLC. All rights reserved.
You may obtain copies of the Prospectus and the Statement of Additional Information free of charge, upon request, by calling toll-free 800-598-2019 or writing to New York Life Insurance and Annuity Corporation, 51 Madison Avenue, New York, NY 10010.
| | | | |
| Not FDIC Insured | | No Bank Guarantee | | May Lose Value |
| | | | |
| 1781603 | | | | MSVPBL10-08/20 (NYLIAC) NI508 |
MainStay VP MacKay Common
Stock Portfolio
Message from the President and Semiannual Report
Unaudited | June 30, 2020
Beginning on January 1, 2021, as permitted by regulations adopted by the Securities and Exchange Commission, paper copies of the MainStay VP Portfolio annual and semi-annual shareholder reports may no longer be sent by mail, unless you specifically request paper copies of the reports from the insurance company that offers your policy. Instead, the reports will be made available online, and you will be notified by mail each time a report is posted and provided with a website link to access the report. Instructions for requesting paper copies will be provided by your insurance company.
If you already elected to receive shareholder reports electronically, you will not be affected by this change and you need not take any action. At any time, you may elect to receive reports and other communications from the insurance company electronically by following the instructions provided by the insurance company.
You may elect to receive all future shareholder reports in paper form free of charge. You can inform the insurance company that you wish to receive paper copies of reports by following the instructions provided by the insurance company. Your election to receive reports in paper form will apply to all portfolio companies available under your contract.
| | | | | | | | |
| Not FDIC/NCUA Insured | | Not a Deposit | | May Lose Value | | No Bank Guarantee | | Not Insured by Any Government Agency |

This page intentionally left blank
Message from the President
High levels of volatility shook financial markets in response to the COVID-19 pandemic and an abrupt decline in global economic activity during the six months ended June 30, 2020.
Markets entered 2020 riding strong fourth quarter performance and an economic expansion of historic longevity. Most broad stock and bond indices began to dip in late February as growing numbers of COVID-19 cases were seen in hotspots around the world. On March 11, 2020, the World Health Organization acknowledged that the disease had reached pandemic proportions, with over 80,000 identified cases in China, thousands in Italy, South Korea and the United States, and more in dozens of additional countries. Governments and central banks pledged trillions of dollars to address the mounting economic and public health crisis; however, “stay-at-home” orders and other restrictions on non-essential activity caused global economic activity to slow. Most stocks and bonds lost significant ground in this challenging environment, with equities declining by roughly a third and the yield on high-yield credit indices shooting higher.
Policymakers responded with extraordinary speed to address the situation. In the United States, the Federal Reserve (“Fed”) cut interest rates to near zero and announced unlimited quantitative easing. With help from Treasury, the Fed later rolled out a series of lending facilities to directly support market functioning. In late March, the Federal government declared a national emergency; Congress passed, and the President signed, a $2 trillion CARES Act (The Coronavirus Aid, Relief, and Economic Security Act), with the promise of further assistance for consumers and businesses to come. This enormous wave of policy support helped fuel a rapid recovery in market pricing as stocks bounced back and credit spreads narrowed. Some states rushed to ease restrictions on travel and social gatherings, further fueling optimism that the effects of the pandemic might prove short lived. However, the final weeks of the reporting period saw infection rates beginning to rise in some of the first states to reopen, raising concerns that a second round of restrictive government policies might prove necessary, once again stifling economic activity.
Despite all the market volatility, the broadly based S&P 500® Index finished the first half of 2020 only slightly below its starting point and the technology-heavy NASDAQ Composite Index posted gains, closing in near record territory. Small-cap stocks tended to trail their large cap counterparts, as illustrated by the Russell 2000® Index’s loss of approximately 15%, while value-oriented stocks lagged growth-oriented issues. From a global perspective, U.S. stocks generally outperformed international equities, with emerging markets hit particularly hard by the flight from risk.
Fixed-income markets also experienced unusually high levels of volatility. Recognized safe havens, such as U.S. government bonds, attracted increased investment, driving yields lower and prices higher, positioning long-term Treasury bonds to deliver particularly strong gains. Investment-grade corporate bonds lost value in March before recovering in the closing months of the reporting period, while relatively speculative high-yield credit faced the brunt of risk-off sentiment. Emerging market debt underperformed most other bonds types as investors sought to minimize currency and sovereign risks.
Today, as we at New York Life Investments continue to track the ongoing health crisis and its financial ramifications, we are particularly mindful of the people at the heart of our enterprise—our colleagues and valued clients. By taking appropriate steps to minimize community spread of COVID-19 within our organization, we strive to safeguard the health of our investment professionals so they can continue to provide you, as a MainStay investor, with world class investment solutions in this rapidly evolving environment.
Sincerely,

Kirk C. Lehneis
President
The opinions expressed are as of the date of this report and are subject to change. There is no guarantee that any forecast made will come to pass. This material does not constitute investment advice and is not intended as an endorsement of any specific investment. Past performance is no guarantee of future results.
Not part of the Semiannual Report
Table of Contents
Investors should refer to the Portfolio’s Summary Prospectus and/or Prospectus and consider the Portfolio’s investment objectives, strategies, risks, charges and expenses carefully before investing. The Summary Prospectus and/or Prospectus contain this and other information about the Portfolio. You may obtain copies of the Portfolio’s Summary Prospectus and/or the Prospectus and the Statement of Additional Information free of charge, upon request, by calling toll-free 800-598-2019, by writing to New York Life Insurance and Annuity Corporation, 51 Madison Avenue, Room 251, New York, New York 10010 or by sending an email to MainStayShareholdersServices@nylim.com. These documents are also available at nylinvestments.com/vpdocuments. Please read the Summary Prospectus and/or Prospectus carefully before investing. MainStay VP Funds Trust portfolios are separate account options which are purchased through a variable insurance or variable annuity contract.
Investment and Performance Comparison1 (Unaudited)
Performance data quoted represents past performance. Past performance is no guarantee of future results. Because of market volatility and other factors, current performance may be lower or higher than the figures shown. Investment return and principal value will fluctuate, and as a result, when shares are redeemed, they may be worth more or less than their original cost. The performance table and graph do not reflect any deduction of sales charges, mortality and expense charges, contract charges or administrative charges. Please refer to the Performance Summary appropriate for your policy. For performance information current to the most recent month-end, please call 800-598-2019 or visit www.newyorklife.com.
Average Annual Total Returns for the Period-Ended June 30, 2020
| | | | | | | | | | | | | | | | | | | | | | |
| Class | | Inception
Date | | Six Months | | | One Year | | | Five Years | | | Ten Years | | | Gross
Expense
Ratio2 | |
| | | | | | |
| Initial Class Shares | | 1/23/1984 | | | -4.15 | % | | | 5.04 | % | | | 8.77 | % | | | 13.24 | % | | | 0.58 | % |
| Service Class Shares | | 6/5/2003 | | | -4.26 | | | | 4.78 | | | | 8.50 | | | | 12.95 | | | | 0.83 | |
| | | | | | | | | | | | | | | | |
| Benchmark Performance | | Six
Months | | | One Year | | | Five
Years | | | Ten
Years | |
| | | | |
S&P 500® Index3 | | | -3.08 | % | | | 7.51 | % | | | 10.73 | % | | | 13.99 | % |
Russell 1000® Index4 | | | -2.81 | | | | 7.48 | | | | 10.47 | | | | 13.97 | |
Morningstar Large Blend Category Average5 | | | -5.48 | | | | 3.74 | | | | 8.35 | | | | 12.22 | |
| 1. | Performance figures may reflect certain fee waivers and/or expense limitations, without which total returns may have been different. For information on current fee waivers and/or expense limitations (if any), please refer to the Notes to Financial Statements. |
| 2. | The gross expense ratios presented reflect the Portfolio’s “Total Annual Portfolio Operating Expenses” from the most recent Prospectus, as supplemented, and may differ from other expense ratios disclosed in this report. |
| 3. | The S&P 500® Index is the Portfolio’s primary broad-based securities market index for comparison purposes. “S&P 500®” is a trademark of The McGraw-Hill Companies, Inc. The S&P 500® Index is widely regarded as the standard index for measuring large-cap U.S. stock market performance. Results assume reinvestment of all dividends and capital gains. An investment cannot be made directly in an index. |
| 4. | The Russell 1000® Index is the Portfolio’s secondary benchmark. The Russell 1000® Index measures the performance of the large-cap segment of |
| | the U.S. equity universe. It is a subset of the Russell 3000® Index and includes approximately 1,000 of the largest securities based on a combination of their market cap and current index membership. Results assume reinvestment of all dividends and capital gains. An investment cannot be made directly in an index. |
| 5. | The Morningstar Large Blend Category Average is representative of funds that represent the overall U.S. stock market in size, growth rates and price. Stocks in the top 70% of the capitalization of the U.S. equity market are defined as large cap. The blend style is assigned to funds where neither growth nor value characteristics predominate. These funds tend to invest across the spectrum of U.S. industries, and owing to their broad exposure, the funds’ returns are often similar to those of the S&P 500® Index. Results are based on average total returns of similar funds with all dividends and capital gain distributions reinvested. |
Cost in Dollars of a $1,000 Investment in MainStay VP MacKay Common Stock Portfolio (Unaudited)
The example below is intended to describe the fees and expenses borne by shareholders during the six-month period from January 1, 2020, to June 30, 2020, and the impact of those costs on your investment.
Example
As a shareholder of the Portfolio you incur two types of costs: (1) transaction costs, including exchange fees and sales charges (loads) on purchases (as applicable), and (2) ongoing costs, including management fees, distribution and/or service (12b-1) fees, and other Portfolio expenses (as applicable). This example is intended to help you understand your ongoing costs (in dollars) of investing in the Portfolio and to compare these costs with the ongoing costs of investing in other mutual funds. The example is based on an investment of $1,000 made at the beginning of the six-month period and held for the entire period from January 1, 2020, to June 30, 2020. Shares are only sold in connection with variable life and annuity contracts and the example does not reflect any contract level or transactional fees or expenses. If these costs had been included, your costs would have been higher.
This example illustrates your Portfolio’s ongoing costs in two ways:
Actual Expenses
The second and third data columns in the table below provide information about actual account values and actual expenses. You may use the information in these columns, together with the amount you invested, to estimate the expenses that you paid during the six months
ended June 30, 2020. Simply divide your account value by $1,000 (for example, an $8,600 account value divided by $1,000 = 8.6), then multiply the result by the number under the heading entitled “Expenses Paid During Period” to estimate the expenses you paid on your account during this period.
Hypothetical Example for Comparison Purposes
The fourth and fifth data columns in the table below provide information about hypothetical account values and hypothetical expenses based on the Portfolio’s actual expense ratio and an assumed rate of return of 5% per year before expenses, which is not the Portfolio’s actual return. The hypothetical account values and expenses may not be used to estimate the actual ending account balances or expenses you paid for the six-month period shown. You may use this information to compare the ongoing costs of investing in the Portfolio with the ongoing costs of investing in other mutual funds. To do so, compare this 5% hypothetical example with the 5% hypothetical examples that appear in the shareholder reports of the other mutual funds.
Please note that the expenses shown in the table are meant to highlight your ongoing costs only and do not reflect any transactional costs, such as exchange fees or sales charges (loads). Therefore, the fourth and fifth data columns of the table are useful in comparing ongoing costs only and will not help you determine the relative total costs of owning different funds. In addition, if these transactional costs were included, your costs would have been higher.
| | | | | | | | | | | | | | | | | | | | | | |
| | | | | | | | | | | | | | | | | | |
| Share Class | | Beginning
Account
Value
1/1/20 | | | Ending Account
Value (Based
on Actual
Returns and
Expenses)
6/30/20 | | | Expenses
Paid
During
Period1 | | | Ending Account
Value (Based
on Hypothetical
5% Annualized
Return and
Actual Expenses)
6/30/20 | | | Expenses
Paid
During
Period1 | | | Net Expense
Ratio
During
Period2 |
| | | | | | |
| Initial Class Shares | | $ | 1,000.00 | | | $ | 958.50 | | | $ | 2.82 | | | $ | 1,021.98 | | | $ | 2.92 | | | 0.58% |
| | | | | | |
| Service Class Shares | | $ | 1,000.00 | | | $ | 957.40 | | | $ | 4.04 | | | $ | 1,020.74 | | | $ | 4.17 | | | 0.83% |
| 1 | Expenses are equal to the Portfolio’s annualized expense ratio of each class multiplied by the average account value over the period, divided by 366 and multiplied by 182 (to reflect the six-month period). The table above represents the actual expenses incurred during the six-month period. In addition to the fees and expenses which the Portfolio bears directly, it also indirectly bears a pro rata share of the fees and expenses of the underlying funds in which it invests. Such indirect expenses are not included in the above-reported expense figures. |
| 2 | Expenses are equal to the Portfolio’s annualized expense ratio to reflect the six-month period. |
| | |
| 6 | | MainStay VP MacKay Common Stock Portfolio |
Industry Composition as of June 30, 2020 (Unaudited)
| | | | |
| |
| Software | | | 10.0 | % |
| |
| Technology Hardware, Storage & Peripherals | | | 7.2 | |
| |
| Internet & Direct Marketing Retail | | | 5.6 | |
| |
| Interactive Media & Services | | | 5.3 | |
| |
| IT Services | | | 5.0 | |
| |
| Semiconductors & Semiconductor Equipment | | | 4.8 | |
| |
| Health Care Providers & Services | | | 4.5 | |
| |
| Pharmaceuticals | | | 4.3 | |
| |
| Biotechnology | | | 4.2 | |
| |
| Banks | | | 3.6 | |
| |
| Capital Markets | | | 3.2 | |
| |
| Food & Staples Retailing | | | 2.7 | |
| |
| Specialty Retail | | | 2.5 | |
| |
| Aerospace & Defense | | | 2.4 | |
| |
| Oil, Gas & Consumable Fuels | | | 2.4 | |
| |
| Electric Utilities | | | 2.3 | |
| |
| Equity Real Estate Investment Trusts | | | 2.1 | |
| |
| Exchange-Traded Fund | | | 2.1 | |
| |
| Health Care Equipment & Supplies | | | 1.9 | |
| |
| Household Products | | | 1.9 | |
| |
| Road & Rail | | | 1.7 | |
| |
| Hotels, Restaurants & Leisure | | | 1.6 | |
| |
| Building Products | | | 1.5 | |
| |
| Entertainment | | | 1.5 | |
| |
| Metals & Mining | | | 1.5 | |
| |
| Electronic Equipment, Instruments & Components | | | 1.3 | |
| |
| Media | | | 1.0 | |
| | | | |
| |
| Multiline Retail | | | 1.0 | % |
| |
| Professional Services | | | 1.0 | |
| |
| Diversified Financial Services | | | 0.9 | |
| |
| Diversified Telecommunication Services | | | 0.8 | |
| |
| Life Sciences Tools & Services | | | 0.8 | |
| |
| Machinery | | | 0.8 | |
| |
| Beverages | | | 0.7 | |
| |
| Insurance | | | 0.7 | |
| |
| Consumer Finance | | | 0.6 | |
| |
| Food Products | | | 0.6 | |
| |
| Multi-Utilities | | | 0.6 | |
| |
| Communications Equipment | | | 0.4 | |
| |
| Distributors | | | 0.4 | |
| |
| Electrical Equipment | | | 0.4 | |
| |
| Household Durables | | | 0.4 | |
| |
| Chemicals | | | 0.3 | |
| |
| Textiles, Apparel & Luxury Goods | | | 0.3 | |
| |
| Trading Companies & Distributors | | | 0.3 | |
| |
| Commercial Services & Supplies | | | 0.2 | |
| |
| Energy Equipment & Services | | | 0.2 | |
| |
| Tobacco | | | 0.2 | |
| |
| Containers & Packaging | | | 0.1 | |
| |
| Independent Power & Renewable Electricity Producers | | | 0.0 | ‡ |
| |
| Thrifts & Mortgage Finance | | | 0.0 | ‡ |
| |
| Short-Term Investment | | | 0.1 | |
| |
| Other Assets, Less Liabilities | | | 0.1 | |
| | | | |
| | | 100.0 | % |
| | | | |
See Portfolio of Investments beginning on page 9 for specific holdings within these categories. The Portfolio’s holdings are subject to change.
| ‡ | Less than one-tenth of a percent |
Top Ten Holdings as of June 30, 2020 (excluding short-term investment) (Unaudited)
| 5. | Facebook, Inc., Class A |
| 10. | UnitedHealth Group, Inc. |
Portfolio Management Discussion and Analysis (Unaudited)
Answers to the questions reflect the views of portfolio managers Migene Kim, CFA, and Mona Patni of MacKay Shields LLC, the Portfolio’s Subadvisor.
How did MainStay VP MacKay Common Stock Portfolio perform relative to its benchmarks and peers during the six months ended June 30, 2020?
For the six months ended June 30, 2020, MainStay VP MacKay Common Stock Portfolio returned –4.15% for Initial Class shares and –4.26% for Service Class shares. Over the same period, both share classes underperformed the –3.08% return of the S&P 500® Index, which is the Portfolio’s primary benchmark, and the –2.81% return of the Russell 1000® Index, which is the secondary benchmark of the Portfolio. For the six months ended June 30, 2020, both share classes outperformed the –5.48% return of the Morningstar Large Blend Category Average.1
What factors affected the Portfolio’s relative performance during the reporting period?
Both during and after the steep market decline that occurred in March 2020, growth-oriented stocks outperformed their value-oriented counterparts, accentuating a multi-year trend. Investors regarded familiar large-cap growth stocks as “safe,” while shunning cheaper stocks in areas such as energy, financials and industrials. Consequently, the spread2 between the Russell 1000® Growth Index and the Russell 1000® Value Index widened to historic levels. Not surprisingly, value-oriented investment vehicles experienced major drawdowns during the first quarter of 2020. The Portfolio’s momentum-based stock selection signals, which capture historical price trends, performed well during the first quarter, mitigating some of the headwinds from value, but momentum-driven investments were subject to a sharp, volatile sell-off during the second quarter amid market inflection. Quality and profitability signals mitigated downside risk, particularly during the March 2020 market downturn.
Which sectors were the strongest positive contributors to the Portfolio’s relative performance, and which sectors were particularly weak?
During the reporting period, the strongest positive contributors to the Portfolio’s benchmark-relative performance were the financials, communication services and health care sectors. (Contributions take weightings and total returns into account.) During the same period, the top detractors from benchmark-
relative performance were the consumer staples, consumer discretionary and real estate sectors.
During the reporting period, which individual stocks made the strongest positive contributions to the Portfolio’s absolute performance and which stocks detracted the most?
The stocks providing the strongest positive contributions to the Portfolio’s absolute performance during the reporting period included Internet & direct marketing retailer Amazon.com, systems software developer Microsoft and consumer electronics maker Apple. During the same period, the most significant detractors from absolute performance were diversified financial firm JPMorgan Chase, multi-sector holdings Berkshire Hathaway and diversified financial firm Bank of America.
Did the Portfolio make any significant purchases or sales during the reporting period?
During the reporting period, the Portfolio’s largest initial purchase was in shares of gold miner Newmont, while the largest increase in position size was in Amazon.com. During the same period, the Portfolio’s largest full sale was its position in coffee products maker and retailer Starbucks, while its largest decreased position size was in JPMorgan Chase.
How did the Portfolio’s sector weightings change during the reporting period?
Relative to the S&P 500® Index, the Portfolio’s most-substantial exposure increases during the reporting period were in industrials and health care. Conversely, the Portfolio’s largest decreases in benchmark-relative sector exposures were in communication services and consumer discretionary.
How was the Portfolio positioned at the end of the reporting period?
As of June 30, 2020, the Portfolio’s most overweight positions relative to the S&P 500® Index were in the information technology and health care sectors. As of the same date, the Portfolio’s most substantially underweight positions relative to the Index were in the communication services and financials sectors.
| 1. | See page 5 for more information on benchmark and peer group returns. |
| 2. | The terms “spread” and “yield spread” may refer to the difference in yield between a security or type of security and comparable U.S. Treasury issues. The terms may also refer to the difference in yield between two specific securities or types of securities at a given time. |
The opinions expressed are those of the portfolio managers as of the date of this report and are subject to change. There is no guarantee that any forecasts will come to pass. This material does not constitute investment advice and is not intended as an endorsement of any specific investment.
Not all MainStay VP Portfolios and/or share classes are available under all policies.
| | |
| 8 | | MainStay VP MacKay Common Stock Portfolio |
Portfolio of Investments June 30, 2020 (Unaudited)
| | | | | | | | |
| | |
| | | Shares | | | Value | |
| Common Stocks 97.7%† | |
Aerospace & Defense 2.4% | |
Boeing Co. | | | 12,404 | | | $ | 2,273,653 | |
L3Harris Technologies, Inc. | | | 1,683 | | | | 285,555 | |
Lockheed Martin Corp. | | | 13,903 | | | | 5,073,483 | |
Northrop Grumman Corp. | | | 12,910 | | | | 3,969,050 | |
Raytheon Technologies Corp. | | | 37,067 | | | | 2,284,069 | |
Textron, Inc. | | | 82,439 | | | | 2,713,067 | |
| | | | | | | | |
| | | | | | | 16,598,877 | |
| | | | | | | | |
Banks 3.6% | |
Bank of America Corp. | | | 201,709 | | | | 4,790,589 | |
Citigroup, Inc. | | | 3,834 | | | | 195,917 | |
Comerica, Inc. | | | 10,350 | | | | 394,335 | |
East West Bancorp, Inc. | | | 42,720 | | | | 1,548,173 | |
Fifth Third Bancorp | | | 143,044 | | | | 2,757,888 | |
JPMorgan Chase & Co. | | | 52,600 | | | | 4,947,556 | |
Signature Bank | | | 26,239 | | | | 2,805,474 | |
SVB Financial Group (a) | | | 3,364 | | | | 725,043 | |
Synovus Financial Corp. | | | 92,483 | | | | 1,898,676 | |
Truist Financial Corp. | | | 83,752 | | | | 3,144,888 | |
Wells Fargo & Co. | | | 62,179 | | | | 1,591,782 | |
| | | | | | | | |
| | | | | | | 24,800,321 | |
| | | | | | | | |
Beverages 0.7% | |
Coca-Cola Co. | | | 36,439 | | | | 1,628,094 | |
Molson Coors Beverage Co., Class B | | | 32,839 | | | | 1,128,348 | |
PepsiCo., Inc. | | | 15,907 | | | | 2,103,860 | |
| | | | | | | | |
| | | | | | | 4,860,302 | |
| | | | | | | | |
Biotechnology 4.2% | |
AbbVie, Inc. | | | 55,118 | | | | 5,411,485 | |
Alexion Pharmaceuticals, Inc. (a) | | | 1,360 | | | | 152,646 | |
Amgen, Inc. | | | 19,501 | | | | 4,599,506 | |
Biogen, Inc. (a) | | | 15,085 | | | | 4,035,992 | |
Exelixis, Inc. (a) | | | 123,932 | | | | 2,942,146 | |
Gilead Sciences, Inc. | | | 73,223 | | | | 5,633,777 | |
Incyte Corp. (a) | | | 25,139 | | | | 2,613,702 | |
Regeneron Pharmaceuticals, Inc. (a) | | | 2,992 | | | | 1,865,961 | |
United Therapeutics Corp. (a) | | | 12,325 | | | | 1,491,325 | |
| | | | | | | | |
| | | | | | | 28,746,540 | |
| | | | | | | | |
Building Products 1.5% | |
Johnson Controls International PLC | | | 60,611 | | | | 2,069,259 | |
Masco Corp. | | | 71,770 | | | | 3,603,572 | |
Owens Corning | | | 51,637 | | | | 2,879,279 | |
Trane Technologies PLC | | | 21,501 | | | | 1,913,159 | |
| | | | | | | | |
| | | | | | | 10,465,269 | |
| | | | | | | | |
Capital Markets 3.2% | |
Ameriprise Financial, Inc. | | | 22,244 | | | | 3,337,490 | |
Bank of New York Mellon Corp. | | | 30,583 | | | | 1,182,033 | |
Franklin Resources, Inc. | | | 6,087 | | | | 127,644 | |
Intercontinental Exchange, Inc. | | | 46,402 | | | | 4,250,423 | |
| | | | | | | | |
| | |
| | | Shares | | | Value | |
Capital Markets (continued) | |
Moody’s Corp. | | | 12,527 | | | $ | 3,441,543 | |
Raymond James Financial, Inc. | | | 29,138 | | | | 2,005,569 | |
S&P Global, Inc. | | | 13,330 | | | | 4,391,968 | |
State Street Corp. | | | 53,189 | | | | 3,380,161 | |
| | | | | | | | |
| | | | | | | 22,116,831 | |
| | | | | | | | |
Chemicals 0.3% | |
CF Industries Holdings, Inc. | | | 16,413 | | | | 461,862 | |
DuPont de Nemours, Inc. | | | 19,010 | | | | 1,010,001 | |
LyondellBasell Industries N.V., Class A | | | 7,525 | | | | 494,543 | |
| | | | | | | | |
| | | | | | | 1,966,406 | |
| | | | | | | | |
Commercial Services & Supplies 0.2% | |
Republic Services, Inc. | | | 8,585 | | | | 704,399 | |
Tetra Tech, Inc. | | | 5,305 | | | | 419,732 | |
Waste Management, Inc. | | | 3,086 | | | | 326,838 | |
| | | | | | | | |
| | | | | | | 1,450,969 | |
| | | | | | | | |
Communications Equipment 0.4% | |
Cisco Systems, Inc. | | | 52,636 | | | | 2,454,943 | |
| | | | | | | | |
|
Consumer Finance 0.6% | |
American Express Co. | | | 15,851 | | | | 1,509,015 | |
Synchrony Financial | | | 129,457 | | | | 2,868,767 | |
| | | | | | | | |
| | | | | | | 4,377,782 | |
| | | | | | | | |
Containers & Packaging 0.1% | |
International Paper Co. | | | 23,445 | | | | 825,498 | |
| | | | | | | | |
|
Distributors 0.4% | |
LKQ Corp. (a) | | | 101,864 | | | | 2,668,837 | |
| | | | | | | | |
|
Diversified Financial Services 0.9% | |
Berkshire Hathaway, Inc., Class B (a) | | | 35,226 | | | | 6,288,193 | |
| | | | | | | | |
|
Diversified Telecommunication Services 0.8% | |
AT&T, Inc. | | | 93,948 | | | | 2,840,048 | |
Verizon Communications, Inc. | | | 53,385 | | | | 2,943,115 | |
| | | | | | | | |
| | | | | | | 5,783,163 | |
| | | | | | | | |
Electric Utilities 2.3% | |
Entergy Corp. | | | 22,709 | | | | 2,130,331 | |
Evergy, Inc. | | | 53,395 | | | | 3,165,790 | |
NextEra Energy, Inc. | | | 21,117 | | | | 5,071,670 | |
NRG Energy, Inc. | | | 69,787 | | | | 2,272,265 | |
OGE Energy Corp. | | | 46,600 | | | | 1,414,776 | |
Pinnacle West Capital Corp. | | | 619 | | | | 45,366 | |
PPL Corp. | | | 55,850 | | | | 1,443,164 | |
Southern Co. | | | 4,204 | | | | 217,977 | |
| | | | | | | | |
| | | | | | | 15,761,339 | |
| | | | | | | | |
Electrical Equipment 0.4% | |
Acuity Brands, Inc. | | | 8,882 | | | | 850,363 | |
| | | | | | |
The notes to the financial statements are an integral part of,
and should be read in conjunction with, the financial statements. | | | | | 9 | |
Portfolio of Investments June 30, 2020 (Unaudited) (continued)
| | | | | | | | |
| | |
| | | Shares | | | Value | |
| Common Stocks (continued) | |
Electrical Equipment (continued) | |
Eaton Corp. PLC | | | 18,665 | | | $ | 1,632,814 | |
| | | | | | | | |
| | | | | | | 2,483,177 | |
| | | | | | | | |
Electronic Equipment, Instruments & Components 1.3% | |
Arrow Electronics, Inc. (a) | | | 40,259 | | | | 2,765,391 | |
CDW Corp. | | | 1,491 | | | | 173,224 | |
Jabil, Inc. | | | 89,159 | | | | 2,860,221 | |
SYNNEX Corp. | | | 26,591 | | | | 3,184,804 | |
| | | | | | | | |
| | | | | | | 8,983,640 | |
| | | | | | | | |
Energy Equipment & Services 0.2% | |
TechnipFMC PLC | | | 235,188 | | | | 1,608,686 | |
| | | | | | | | |
| | |
Entertainment 1.5% | | | | | | | | |
Activision Blizzard, Inc. | | | 27,731 | | | | 2,104,783 | |
Electronic Arts, Inc. (a) | | | 31,873 | | | | 4,208,830 | |
Netflix, Inc. (a) | | | 4,000 | | | | 1,820,160 | |
Walt Disney Co. | | | 21,542 | | | | 2,402,148 | |
| | | | | | | | |
| | | | | | | 10,535,921 | |
| | | | | | | | |
Equity Real Estate Investment Trusts 2.1% | |
American Tower Corp. | | | 15,267 | | | | 3,947,130 | |
Crown Castle International Corp. | | | 12,985 | | | | 2,173,040 | |
Digital Realty Trust, Inc. | | | 14,073 | | | | 1,999,914 | |
Duke Realty Corp. | | | 8,918 | | | | 315,608 | |
Equinix, Inc. | | | 3,798 | | | | 2,667,335 | |
Prologis, Inc. | | | 13,766 | | | | 1,284,781 | |
SBA Communications Corp. | | | 6,386 | | | | 1,902,517 | |
| | | | | | | | |
| | | | | | | 14,290,325 | |
| | | | | | | | |
Food & Staples Retailing 2.7% | |
BJ’s Wholesale Club Holdings, Inc. (a) | | | 45,339 | | | | 1,689,784 | |
Costco Wholesale Corp. | | | 16,934 | | | | 5,134,558 | |
Kroger Co. | | | 114,661 | | | | 3,881,275 | |
Walmart, Inc. | | | 62,665 | | | | 7,506,014 | |
| | | | | | | | |
| | | | | | | 18,211,631 | |
| | | | | | | | |
Food Products 0.6% | |
Hershey Co. | | | 7,520 | | | | 974,743 | |
Ingredion, Inc. | | | 279 | | | | 23,157 | |
Tyson Foods, Inc., Class A | | | 52,503 | | | | 3,134,954 | |
| | | | | | | | |
| | | | | | | 4,132,854 | |
| | | | | | | | |
Health Care Equipment & Supplies 1.9% | |
Abbott Laboratories | | | 27,160 | | | | 2,483,239 | |
Baxter International, Inc. | | | 25,098 | | | | 2,160,938 | |
DENTSPLY SIRONA, Inc. | | | 1,625 | | | | 71,598 | |
Edwards Lifesciences Corp. (a) | | | 846 | | | | 58,467 | |
Hill-Rom Holdings, Inc. | | | 29,708 | | | | 3,261,344 | |
Hologic, Inc. (a) | | | 6,624 | | | | 377,568 | |
ICU Medical, Inc. (a) | | | 6,222 | | | | 1,146,777 | |
Medtronic PLC | | | 33,582 | | | | 3,079,469 | |
| | | | | | | | |
| | |
| | | Shares | | | Value | |
Health Care Equipment & Supplies (continued) | |
West Pharmaceutical Services, Inc. | | | 2,161 | | | $ | 490,914 | |
| | | | | | | | |
| | | | | | | 13,130,314 | |
| | | | | | | | |
Health Care Providers & Services 4.5% | |
AmerisourceBergen Corp. | | | 34,162 | | | | 3,442,505 | |
Anthem, Inc. | | | 16,658 | | | | 4,380,721 | |
Cardinal Health, Inc. | | | 59,740 | | | | 3,117,830 | |
DaVita, Inc. (a) | | | 26,419 | | | | 2,090,800 | |
Humana, Inc. | | | 11,172 | | | | 4,331,943 | |
McKesson Corp. | | | 22,983 | | | | 3,526,052 | |
UnitedHealth Group, Inc. | | | 32,372 | | | | 9,548,121 | |
| | | | | | | | |
| | | | | | | 30,437,972 | |
| | | | | | | | |
Hotels, Restaurants & Leisure 1.6% | |
Chipotle Mexican Grill, Inc. (a) | | | 404 | | | | 425,154 | |
Darden Restaurants, Inc. | | | 40,101 | | | | 3,038,453 | |
Domino’s Pizza, Inc. | | | 9,280 | | | | 3,428,403 | |
McDonald’s Corp. | | | 8,920 | | | | 1,645,472 | |
Yum! Brands, Inc. | | | 29,622 | | | | 2,574,448 | |
| | | | | | | | |
| | | | | | | 11,111,930 | |
| | | | | | | | |
Household Durables 0.4% | |
PulteGroup, Inc. | | | 82,966 | | | | 2,823,333 | |
| | | | | | | | |
| | |
Household Products 1.9% | | | | | | | | |
Colgate-Palmolive Co. | | | 10,759 | | | | 788,204 | |
Kimberly-Clark Corp. | | | 11,644 | | | | 1,645,880 | |
Procter & Gamble Co. | | | 90,563 | | | | 10,828,618 | |
| | | | | | | | |
| | | | | | | 13,262,702 | |
| | | | | | | | |
Independent Power & Renewable Electricity Producers 0.0%‡ | |
AES Corp. | | | 17,654 | | | | 255,806 | |
| | | | | | | | |
| | |
Insurance 0.7% | | | | | | | | |
American International Group, Inc. | | | 19,562 | | | | 609,943 | |
MetLife, Inc. | | | 41,808 | | | | 1,526,828 | |
Reinsurance Group of America, Inc. | | | 17,551 | | | | 1,376,701 | |
Unum Group | | | 76,259 | | | | 1,265,137 | |
| | | | | | | | |
| | | | | | | 4,778,609 | |
| | | | | | | | |
Interactive Media & Services 5.3% | |
Alphabet, Inc. (a) | |
Class A | | | 6,460 | | | | 9,160,603 | |
Class C | | | 6,776 | | | | 9,578,622 | |
Facebook, Inc., Class A (a) | | | 75,874 | | | | 17,228,709 | |
| | | | | | | | |
| | | | | | | 35,967,934 | |
| | | | | | | | |
Internet & Direct Marketing Retail 5.6% | |
Amazon.com, Inc. (a) | | | 11,889 | | | | 32,799,611 | |
Booking Holdings, Inc. (a) | | | 498 | | | | 792,985 | |
eBay, Inc. | | | 83,784 | | | | 4,394,471 | |
| | | | | | | | |
| | | | | | | 37,987,067 | |
| | | | | | | | |
| | | | |
| 10 | | MainStay VP MacKay Common Stock Portfolio | | The notes to the financial statements are an integral part of,
and should be read in conjunction with, the financial statements. |
| | | | | | | | |
| | |
| | | Shares | | | Value | |
| Common Stocks (continued) | |
IT Services 5.0% | |
Accenture PLC, Class A | | | 4,031 | | | $ | 865,536 | |
Akamai Technologies, Inc. (a) | | | 28,184 | | | | 3,018,225 | |
Alliance Data Systems Corp. | | | 21,276 | | | | 959,973 | |
CACI International, Inc., Class A (a) | | | 607 | | | | 131,646 | |
DXC Technology Co. | | | 85,453 | | | | 1,409,975 | |
Fidelity National Information Services, Inc. | | | 5,134 | | | | 688,418 | |
Leidos Holdings, Inc. | | | 32,608 | | | | 3,054,391 | |
Mastercard, Inc., Class A | | | 28,575 | | | | 8,449,627 | |
MAXIMUS, Inc. | | | 19,582 | | | | 1,379,552 | |
PayPal Holdings, Inc. (a) | | | 30,531 | | | | 5,319,416 | |
Science Applications International Corp. | | | 3,426 | | | | 266,132 | |
Visa, Inc., Class A | | | 44,534 | | | | 8,602,633 | |
| | | | | | | | |
| | | | | | | 34,145,524 | |
| | | | | | | | |
Life Sciences Tools & Services 0.8% | |
IQVIA Holdings, Inc. (a) | | | 24,154 | | | | 3,426,970 | |
PRA Health Sciences, Inc. (a) | | | 11,667 | | | | 1,135,082 | |
Thermo Fisher Scientific, Inc. | | | 1,677 | | | | 607,644 | |
| | | | | | | | |
| | | | | | | 5,169,696 | |
| | | | | | | | |
Machinery 0.8% | |
Cummins, Inc. | | | 20,806 | | | | 3,604,848 | |
PACCAR, Inc. | | | 20,450 | | | | 1,530,682 | |
| | | | | | | | |
| | | | | | | 5,135,530 | |
| | | | | | | | |
Media 1.0% | |
Charter Communications, Inc., Class A (a) | | | 9,752 | | | | 4,973,910 | |
Comcast Corp., Class A | | | 44,618 | | | | 1,739,210 | |
Fox Corp., Class B (a) | | | 4,200 | | | | 112,728 | |
| | | | | | | | |
| | | | | | | 6,825,848 | |
| | | | | | | | |
Metals & Mining 1.5% | |
Newmont Corp. | | | 76,977 | | | | 4,752,560 | |
Reliance Steel & Aluminum Co. | | | 26,465 | | | | 2,512,322 | |
Steel Dynamics, Inc. | | | 105,074 | | | | 2,741,381 | |
| | | | | | | | |
| | | | | | | 10,006,263 | |
| | | | | | | | |
Multi-Utilities 0.6% | |
Consolidated Edison, Inc. | | | 48,350 | | | | 3,477,816 | |
Dominion Energy, Inc. | | | 9,357 | | | | 759,601 | |
MDU Resources Group, Inc. | | | 939 | | | | 20,827 | |
| | | | | | | | |
| | | | | | | 4,258,244 | |
| | | | | | | | |
Multiline Retail 1.0% | |
Dollar General Corp. | | | 23,320 | | | | 4,442,693 | |
Target Corp. | | | 18,706 | | | | 2,243,411 | |
| | | | | | | | |
| | | | | | | 6,686,104 | |
| | | | | | | | |
Oil, Gas & Consumable Fuels 2.4% | |
Chevron Corp. | | | 50,755 | | | | 4,528,869 | |
Devon Energy Corp. | | | 206,417 | | | | 2,340,769 | |
Exxon Mobil Corp. | | | 49,965 | | | | 2,234,435 | |
HollyFrontier Corp. | | | 87,168 | | | | 2,545,306 | |
| | | | | | | | |
| | |
| | | Shares | | | Value | |
Oil, Gas & Consumable Fuels (continued) | |
Kinder Morgan, Inc. | | | 115,874 | | | $ | 1,757,808 | |
Valero Energy Corp. | | | 51,604 | | | | 3,035,347 | |
| | | | | | | | |
| | | | | | | 16,442,534 | |
| | | | | | | | |
Pharmaceuticals 4.3% | |
Bristol-Myers Squibb Co. | | | 10,344 | | | | 608,227 | |
Eli Lilly & Co. | | | 1,157 | | | | 189,956 | |
Johnson & Johnson | | | 88,855 | | | | 12,495,679 | |
Merck & Co., Inc. | | | 72,761 | | | | 5,626,608 | |
Mylan N.V. (a) | | | 111,419 | | | | 1,791,618 | |
Perrigo Co. PLC | | | 57,179 | | | | 3,160,283 | |
Pfizer, Inc. | | | 165,777 | | | | 5,420,908 | |
| | | | | | | | |
| | | | | | | 29,293,279 | |
| | | | | | | | |
Professional Services 1.0% | |
CoreLogic, Inc. | | | 60,797 | | | | 4,086,774 | |
ManpowerGroup, Inc. | | | 39,248 | | | | 2,698,300 | |
| | | | | | | | |
| | | | | | | 6,785,074 | |
| | | | | | | | |
Road & Rail 1.7% | |
CSX Corp. | | | 56,620 | | | | 3,948,679 | |
Norfolk Southern Corp. | | | 9,203 | | | | 1,615,771 | |
Union Pacific Corp. | | | 35,473 | | | | 5,997,420 | |
| | | | | | | | |
| | | | | | | 11,561,870 | |
| | | | | | | | |
Semiconductors & Semiconductor Equipment 4.8% | |
Advanced Micro Devices, Inc. (a) | | | 1,173 | | | | 61,712 | |
Applied Materials, Inc. | | | 48,587 | | | | 2,937,084 | |
Broadcom, Inc. | | | 17,727 | | | | 5,594,819 | |
Cirrus Logic, Inc. (a) | | | 18,426 | | | | 1,138,358 | |
Intel Corp. | | | 163,153 | | | | 9,761,444 | |
KLA Corp. | | | 6,690 | | | | 1,301,071 | |
NVIDIA Corp. | | | 11,706 | | | | 4,447,226 | |
Qorvo, Inc. (a) | | | 15,608 | | | | 1,725,152 | |
QUALCOMM, Inc. | | | 62,817 | | | | 5,729,539 | |
Texas Instruments, Inc. | | | 675 | | | | 85,705 | |
| | | | | | | | |
| | | | | | | 32,782,110 | |
| | | | | | | | |
Software 10.0% | |
Adobe, Inc. (a) | | | 10,358 | | | | 4,508,941 | |
Autodesk, Inc. (a) | | | 19,048 | | | | 4,556,091 | |
CDK Global, Inc. | | | 28,111 | | | | 1,164,358 | |
Citrix Systems, Inc. | | | 1,979 | | | | 292,714 | |
Fortinet, Inc. (a) | | | 26,369 | | | | 3,619,673 | |
Intuit, Inc. | | | 9,125 | | | | 2,702,734 | |
Microsoft Corp. | | | 213,740 | | | | 43,498,227 | |
Oracle Corp. | | | 43,848 | | | | 2,423,479 | |
salesforce.com, Inc. (a) | | | 22,729 | | | | 4,257,823 | |
ServiceNow, Inc. (a) | | | 3,078 | | | | 1,246,775 | |
| | | | | | | | |
| | | | | | | 68,270,815 | |
| | | | | | | | |
Specialty Retail 2.5% | |
AutoZone, Inc. (a) | | | 62 | | | | 69,943 | |
Best Buy Co., Inc. | | | 43,002 | | | | 3,752,785 | |
| | | | | | |
The notes to the financial statements are an integral part of,
and should be read in conjunction with, the financial statements. | | | | | 11 | |
Portfolio of Investments June 30, 2020 (Unaudited) (continued)
| | | | | | | | |
| | |
| | | Shares | | | Value | |
| Common Stocks (continued) | |
Specialty Retail (continued) | |
Home Depot, Inc. | | | 29,907 | | | $ | 7,492,003 | |
O’Reilly Automotive, Inc. (a) | | | 9,379 | | | | 3,954,843 | |
Tractor Supply Co. | | | 9,441 | | | | 1,244,229 | |
Williams-Sonoma, Inc. | | | 6,644 | | | | 544,874 | |
| | | | | | | | |
| | | | | | | 17,058,677 | |
| | | | | | | | |
Technology Hardware, Storage & Peripherals 7.2% | |
Apple, Inc. | | | 117,337 | | | | 42,804,537 | |
HP, Inc. | | | 207,928 | | | | 3,624,185 | |
Xerox Holdings Corp. (a) | | | 160,940 | | | | 2,460,773 | |
| | | | | | | | |
| | | | | | | 48,889,495 | |
| | | | | | | | |
Textiles, Apparel & Luxury Goods 0.3% | |
NIKE, Inc., Class B | | | 18,369 | | | | 1,801,080 | |
| | | | | | | | |
|
Thrifts & Mortgage Finance 0.0%‡ | |
New York Community Bancorp, Inc. | | | 238 | | | | 2,428 | |
| | | | | | | | |
|
Tobacco 0.2% | |
Philip Morris International, Inc. | | | 21,558 | | | | 1,510,354 | |
| | | | | | | | |
|
Trading Companies & Distributors 0.3% | |
MSC Industrial Direct Co., Inc., Class A | | | 25,618 | | | | 1,865,247 | |
| | | | | | | | |
Total Common Stocks
(Cost $570,714,820) | | | | 667,657,343 | |
| | | | | |
| | | | | | | | |
| | |
| | | Shares | | | Value | |
| Exchange-Traded Fund 2.1% | |
SPDR S&P 500 ETF Trust | | | 46,287 | | | $ | 14,273,059 | |
| | | | | | | | |
Total Exchange-Traded Fund
(Cost $14,836,270) | | | | 14,273,059 | |
| | | | | |
|
| Short-Term Investment 0.1% | |
Affiliated Investment Company 0.1% | |
MainStay U.S. Government Liquidity Fund, 0.05% (b) | | | 934,979 | | | | 934,979 | |
| | | | | | | | |
Total Short-Term Investment
(Cost $934,979) | | | | 934,979 | |
| | | | | |
Total Investments
(Cost $586,486,069) | | | 99.9 | % | | | 682,865,381 | |
Other Assets, Less Liabilities | | | 0.1 | | | | 424,186 | |
Net Assets | | | 100.0 | % | | $ | 683,289,567 | |
| † | Percentages indicated are based on Portfolio net assets. |
| ‡ | Less than one-tenth of a percent. |
| (a) | Non-income producing security. |
| (b) | Current yield as of June 30, 2020. |
The following abbreviations are used in the preceding pages:
ETF—Exchange-Traded Fund
SPDR—Standard & Poor’s Depositary Receipt
The following is a summary of the fair valuations according to the inputs used as of June 30, 2020, for valuing the Portfolio’s assets:
| | | | | | | | | | | | | | | | |
Description | | Quoted
Prices in
Active
Markets for
Identical
Assets (Level 1) | | | Significant
Other
Observable
Inputs (Level 2) | | | Significant
Unobservable
Inputs (Level 3) | | | Total | |
|
Asset Valuation Inputs | |
| Investments in Securities (a) | | | | | | | | | |
| Common Stocks | | $ | 667,657,343 | | | $ | — | | | $ | — | | | $ | 667,657,343 | |
| Exchange-Traded Fund | | | 14,273,059 | | | | — | | | | — | | | | 14,273,059 | |
| Short-Term Investment | | | | | | | | | |
Affiliated Investment Company | | | 934,979 | | | | — | | | | — | | | | 934,979 | |
| | | | | | | | | | | | | | | | |
| Total Investments in Securities | | $ | 682,865,381 | | | $ | — | | | $ | — | | | $ | 682,865,381 | |
| | | | | | | | | | | | | | | | |
| (a) | For a complete listing of investments and their industries, see the Portfolio of Investments. |
| | | | |
| 12 | | MainStay VP MacKay Common Stock Portfolio | | The notes to the financial statements are an integral part of,
and should be read in conjunction with, the financial statements. |
Statement of Assets and Liabilities as of June 30, 2020 (Unaudited)
| | | | |
| Assets | | | | |
Investment in unaffiliated securities, at value
(identified cost $585,551,090) | | $ | 681,930,402 | |
Investment in affiliated investment company, at value
(identified cost $934,979) | | | 934,979 | |
Receivables: | | | | |
Dividends | | | 565,487 | |
Portfolio shares sold | | | 533,848 | |
Securities lending | | | 914 | |
Other assets | | | 3,547 | |
| | | | |
Total assets | | | 683,969,177 | |
| | | | |
|
| Liabilities | |
Payables: | |
Manager (See Note 3) | | | 305,197 | |
Portfolio shares redeemed | | | 246,464 | |
NYLIFE Distributors (See Note 3) | | | 50,010 | |
Shareholder communication | | | 44,651 | |
Professional fees | | | 19,789 | |
Custodian | | | 8,506 | |
Trustees | | | 958 | |
Accrued expenses | | | 4,035 | |
| | | | |
Total liabilities | | | 679,610 | |
| | | | |
Net assets | | $ | 683,289,567 | |
| | | | |
|
| Composition of Net Assets | |
Shares of beneficial interest outstanding (par value of $.001 per share) unlimited number of shares authorized | | $ | 26,708 | |
Additional paid-in capital | | | 528,892,453 | |
| | | | |
| | | 528,919,161 | |
Total distributable earnings (loss) | | | 154,370,406 | |
| | | | |
Net assets | | $ | 683,289,567 | |
| | | | |
| | | | |
Initial Class | | | | |
Net assets applicable to outstanding shares | | $ | 439,711,150 | |
| | | | |
Shares of beneficial interest outstanding | | | 17,096,618 | |
| | | | |
Net asset value per share outstanding | | $ | 25.72 | |
| | | | |
Service Class | |
Net assets applicable to outstanding shares | | $ | 243,578,417 | |
| | | | |
Shares of beneficial interest outstanding | | | 9,611,842 | |
| | | | |
Net asset value per share outstanding | | $ | 25.34 | |
| | | | |
| | | | | | |
The notes to the financial statements are an integral part of,
and should be read in conjunction with, the financial statements. | | | | | 13 | |
Statement of Operations for the six months ended June 30, 2020 (Unaudited)
| | | | |
| Investment Income (Loss) | |
Income | |
Dividends-unaffiliated | | $ | 6,444,062 | |
Securities lending | | | 6,913 | |
Dividends-affiliated | | | 227 | |
| | | | |
Total income | | | 6,451,202 | |
| | | | |
Expenses | |
Manager (See Note 3) | | | 1,922,083 | |
Distribution/Service—Service Class (See Note 3) | | | 299,834 | |
Professional fees | | | 48,682 | |
Shareholder communication | | | 41,636 | |
Custodian | | | 15,053 | |
Trustees | | | 9,036 | |
Miscellaneous | | | 13,810 | |
| | | | |
Total expenses | | | 2,350,134 | |
| | | | |
Net investment income (loss) | | | 4,101,068 | |
| | | | |
|
| Realized and Unrealized Gain (Loss) on Investments | |
| |
Net realized gain (loss) on unaffiliated investments | | | (6,124,739 | ) |
Net change in unrealized appreciation (depreciation) on unaffiliated investments | | | (36,363,988 | ) |
| | | | |
Net realized and unrealized gain (loss) on investments | | | (42,488,727 | ) |
| | | | |
Net increase (decrease) in net assets resulting from operations | | $ | (38,387,659 | ) |
| | | | |
| | | | |
| 14 | | MainStay VP MacKay Common Stock Portfolio | | The notes to the financial statements are an integral part of,
and should be read in conjunction with, the financial statements. |
Statements of Changes in Net Assets
for the six months ended June 30, 2020 (Unaudited) and the year ended December 31, 2019
| | | | | | | | |
| | | 2020 | | | 2019 | |
| Increase (Decrease) in Net Assets | |
Operations: | |
Net investment income (loss) | | $ | 4,101,068 | | | $ | 9,874,992 | |
Net realized gain (loss) on investments | | | (6,124,739 | ) | | | 55,609,434 | |
Net change in unrealized appreciation (depreciation) on investments | | | (36,363,988 | ) | | | 110,755,278 | |
| | | | |
Net increase (decrease) in net assets resulting from operations | | | (38,387,659 | ) | | | 176,239,704 | |
| | | | |
Distributions to shareholders: | | | | | | | | |
Initial Class | | | — | | | | (78,373,394 | ) |
Service Class | | | — | | | | (39,245,821 | ) |
| | | | |
Total distributions to shareholders | | | — | | | | (117,619,215 | ) |
| | | | |
Capital share transactions: | | | | | | | | |
Net proceeds from sale of shares | | | 29,793,072 | | | | 49,807,188 | |
Net asset value of shares issued to shareholders in reinvestment of distributions | | | — | | | | 117,619,215 | |
Cost of shares redeemed | | | (120,463,297 | ) | | | (105,597,950 | ) |
| | | | |
Increase (decrease) in net assets derived from capital share transactions | | | (90,670,225 | ) | | | 61,828,453 | |
| | | | |
Net increase (decrease) in net assets | | | (129,057,884 | ) | | | 120,448,942 | |
|
| Net Assets | |
Beginning of period | | | 812,347,451 | | | | 691,898,509 | |
| | | | |
End of period | | $ | 683,289,567 | | | $ | 812,347,451 | |
| | | | |
| | | | | | |
The notes to the financial statements are an integral part of,
and should be read in conjunction with, the financial statements. | | | | | 15 | |
Financial Highlights selected per share data and ratios
| | | | | | | | | | | | | | | | | | | | | | | | |
| | |
| | | Six months
ended
June 30, | | | Year ended December 31, | |
| | | | | | |
| Initial Class | | 2020* | | | 2019 | | | 2018 | | | 2017 | | | 2016 | | | 2015 | |
| | | | | | |
Net asset value at beginning of period | | $ | 26.83 | | | $ | 25.23 | | | $ | 29.75 | | | $ | 25.60 | | | $ | 25.43 | | | $ | 27.80 | |
| | | | | | | | | | | | | | | | | | | | | | | | |
| | | | | | |
Net investment income (loss) (a) | | | 0.15 | | | | 0.38 | | | | 0.42 | | | | 0.43 | | | | 0.40 | | | | 0.42 | |
| | | | | | |
Net realized and unrealized gain (loss) on investments | | | (1.26 | ) | | | 5.74 | | | | (1.69 | ) | | | 5.30 | | | | 1.82 | | | | (0.28 | ) |
| | | | | | | | | | | | | | | | | | | | | | | | |
| | | | | | |
Total from investment operations | | | (1.11 | ) | | | 6.12 | | | | (1.27 | ) | | | 5.73 | | | | 2.22 | | | | 0.14 | |
| | | | | | | | | | | | | | | | | | | | | | | | |
| | | | | | |
| Less distributions: | | | | | | | | | | | | | | | | | | | | | | | | |
| | | | | | |
From net investment income | | | — | | | | (0.43 | ) | | | (0.49 | ) | | | (0.39 | ) | | | (0.40 | ) | | | (0.38 | ) |
| | | | | | |
From net realized gain on investments | | | — | | | | (4.09 | ) | | | (2.76 | ) | | | (1.19 | ) | | | (1.65 | ) | | | (2.13 | ) |
| | | | | | | | | | | | | | | | | | | | | | | | |
| | | | | | |
Total distributions | | | — | | | | (4.52 | ) | | | (3.25 | ) | | | (1.58 | ) | | | (2.05 | ) | | | (2.51 | ) |
| | | | | | | | | | | | | | | | | | | | | | | | |
| | | | | | |
Net asset value at end of period | | $ | 25.72 | | | $ | 26.83 | | | $ | 25.23 | | | $ | 29.75 | | | $ | 25.60 | | | $ | 25.43 | |
| | | | | | | | | | | | | | | | | | | | | | | | |
| | | | | | |
Total investment return (b) | | | (4.14 | %)(c) | | | 26.21 | % | | | (5.84 | %) | | | 22.83 | % | | | 9.12 | % | | | 0.85 | % |
| | | | | | |
| Ratios (to average net assets)/Supplemental Data: | | | | | | | | | | | | | | | | | | | | | | | | |
| | | | | | |
Net investment income (loss) | | | 1.24 | % †† | | | 1.37 | % | | | 1.40 | % | | | 1.53 | % | | | 1.57 | % | | | 1.55 | % |
| | | | | | |
Net expenses (d) | | | 0.58 | % †† | | | 0.58 | % | | | 0.57 | % | | | 0.57 | % | | | 0.58 | % | | | 0.57 | % |
| | | | | | |
Portfolio turnover rate | | | 70 | % | | | 119 | % | | | 125 | % | | | 98 | % | | | 125 | % | | | 112 | % |
| | | | | | |
Net assets at end of period (in 000’s) | | $ | 439,711 | | | $ | 543,355 | | | $ | 454,804 | | | $ | 639,120 | | | $ | 577,310 | | | $ | 580,635 | |
| (a) | Per share data based on average shares outstanding during the period. |
| (b) | Total return does not reflect any deduction of sales charges, mortality and expense charges, contract charges or administrative charges. For periods of less than one year, total return is not annualized. |
| (c) | Total investment return may reflect adjustments to conform to generally accepted accounting principles. |
| (d) | In addition to the fees and expenses which the Portfolio bears directly, it also indirectly bears a pro-rata share of the fees and expenses of the underlying funds in which it invests. Such indirect expenses are not included in the above expense ratios. |
| | | | |
| 16 | | MainStay VP MacKay Common Stock Portfolio | | The notes to the financial statements are an integral part of,
and should be read in conjunction with, the financial statements. |
Financial Highlights selected per share data and ratios
| | | | | | | | | | | | | | | | | | | | | | | �� | |
| | |
| | | Six months
ended
June 30, | | | Year ended December 31, | |
| | | | | | |
| Service Class | | 2020* | | | 2019 | | | 2018 | | | 2017 | | | 2016 | | | 2015 | |
| | | | | | |
Net asset value at beginning of period | | $ | 26.47 | | | $ | 24.94 | | | $ | 29.45 | | | $ | 25.37 | | | $ | 25.23 | | | $ | 27.61 | |
| | | | | | | | | | | | | | | | | | | | | | | | |
| | | | | | |
Net investment income (loss) (a) | | | 0.12 | | | | 0.31 | | | | 0.35 | | | | 0.35 | | | | 0.33 | | | | 0.35 | |
| | | | | | |
Net realized and unrealized gain (loss) on investments | | | (1.25 | ) | | | 5.67 | | | | (1.68 | ) | | | 5.26 | | | | 1.81 | | | | (0.27 | ) |
| | | | | | | | | | | | | | | | | | | | | | | | |
| | | | | | |
Total from investment operations | | | (1.13 | ) | | | 5.98 | | | | (1.33 | ) | | | 5.61 | | | | 2.14 | | | | 0.08 | |
| | | | | | | | | | | | | | | | | | | | | | | | |
|
| Less distributions: | |
| | | | | | |
From net investment income | | | — | | | | (0.36 | ) | | | (0.42 | ) | | | (0.34 | ) | | | (0.35 | ) | | | (0.33 | ) |
| | | | | | |
From net realized gain on investments | | | — | | | | (4.09 | ) | | | (2.76 | ) | | | (1.19 | ) | | | (1.65 | ) | | | (2.13 | ) |
| | | | | | | | | | | | | | | | | | | | | | | | |
| | | | | | |
Total distributions | | | — | | | | (4.45 | ) | | | (3.18 | ) | | | (1.53 | ) | | | (2.00 | ) | | | (2.46 | ) |
| | | | | | | | | | | | | | | | | | | | | | | | |
| | | | | | |
Net asset value at end of period | | $ | 25.34 | | | $ | 26.47 | | | $ | 24.94 | | | $ | 29.45 | | | $ | 25.37 | | | $ | 25.23 | |
| | | | | | | | | | | | | | | | | | | | | | | | |
| | | | | | |
Total investment return (b) | | | (4.27 | %)(c) | | | 25.89 | % | | | (6.08 | %) | | | 22.52 | % | | | 8.85 | % | | | 0.60 | % |
|
| Ratios (to average net assets)/Supplemental Data: | |
| | | | | | |
Net investment income (loss) | | | 1.00 | % †† | | | 1.12 | % | | | 1.17 | % | | | 1.28 | % | | | 1.32 | % | | | 1.30 | % |
| | | | | | |
Net expenses (d) | | | 0.83 | % †† | | | 0.83 | % | | | 0.82 | % | | | 0.82 | % | | | 0.83 | % | | | 0.82 | % |
| | | | | | |
Portfolio turnover rate | | | 70 | % | | | 119 | % | | | 125 | % | | | 98 | % | | | 125 | % | | | 112 | % |
| | | | | | |
Net assets at end of period (in 000’s) | | $ | 243,578 | | | $ | 268,992 | | | $ | 237,094 | | | $ | 268,526 | | | $ | 194,992 | | | $ | 149,358 | |
| (a) | Per share data based on average shares outstanding during the period. |
| (b) | Total return does not reflect any deduction of sales charges, mortality and expense charges, contract charges or administrative charges. For periods of less than one year, total return is not annualized. |
| (c) | Total investment return may reflect adjustments to conform to generally accepted accounting principles. |
| (d) | In addition to the fees and expenses which the Portfolio bears directly, it also indirectly bears a pro-rata share of the fees and expenses of the underlying funds in which it invests. Such indirect expenses are not included in the above expense ratios. |
| | | | | | |
The notes to the financial statements are an integral part of,
and should be read in conjunction with, the financial statements. | | | | | 17 | |
Notes to Financial Statements (Unaudited)
Note 1–Organization and Business
MainStay VP Funds Trust (the ‘‘Fund’’) was organized as a Delaware statutory trust on February 1, 2011. The Fund is registered under the Investment Company Act of 1940, as amended (the “1940 Act”), as an open-end management investment company. The Fund is comprised of thirty-one separate series (collectively referred to as the “Portfolios”). These financial statements and notes relate to the MainStay VP MacKay Common Stock Portfolio (the “Portfolio”), a “diversified” portfolio, as that term is defined in the 1940 Act, as interpreted or modified by regulatory authorities having jurisdiction, from time to time.
Shares of the Portfolio are currently offered to certain separate accounts to fund variable annuity policies and variable universal life insurance policies issued by New York Life Insurance and Annuity Corporation (“NYLIAC”), a wholly-owned subsidiary of New York Life Insurance Company (“New York Life”) and may also be offered to fund variable annuity policies and variable universal life insurance policies issued by other insurance companies. NYLIAC allocates shares of the Portfolios to, among others, certain NYLIAC separate accounts. Shares of the Portfolio are also offered to the MainStay VP Conservative Allocation Portfolio, MainStay VP Moderate Allocation Portfolio, MainStay VP Moderate Growth Allocation Portfolio and MainStay VP Growth Allocation Portfolio, which operate as “funds-of-funds,” and other variable insurance funds.
The Portfolio currently offers two classes of shares. Initial Class shares commenced operations on January 23, 1984. Service Class shares commenced operations on June 5, 2003. Shares of the Portfolio are offered and are redeemed at a price equal to their respective net asset value (“NAV”) per share. No sales or redemption charge is applicable to the purchase or redemption of the Portfolio’s shares. Under the terms of the Fund’s multiple class plan adopted pursuant to Rule 18f-3 under the 1940 Act, the classes differ in that, among other things, Service Class shares of the Portfolio pay a combined distribution and service fee of 0.25% of average daily net assets attributable to Service Class shares of the Portfolio to the Distributor (as defined in Note 3(B)) pursuant to a plan adopted in accordance with Rule 12b-1 under the 1940 Act. Contract owners of variable annuity contracts purchased after June 2, 2003, are permitted to invest only in the Service Class shares.
The Portfolio’s investment objective is to seek long-term growth of capital.
Note 2–Significant Accounting Policies
The Portfolio is an investment company and accordingly follows the investment company accounting and reporting guidance of the Financial Accounting Standards Board (“FASB”) Accounting Standard Codification Topic 946 Financial Services–Investment Companies. The Portfolio prepares its financial statements in accordance with generally accepted accounting principles (“GAAP”) in the United States of America and follows the significant accounting policies described below.
(A) Securities Valuation. Investments are usually valued as of the close of regular trading on the New York Stock Exchange (the “Exchange”) (usually 4:00 p.m. Eastern time) on each day the Portfolio is open for business (“valuation date”).
The Board of Trustees of the Fund (the “Board”) adopted procedures establishing methodologies for the valuation of the Portfolio’s securities and other assets and delegated the responsibility for valuation determinations under those procedures to the Valuation Committee of the Fund (the “Valuation Committee”). The procedures state that, subject to the oversight of the Board and unless otherwise noted, the responsibility for the day-to-day valuation of portfolio assets (including fair value measurements for the Portfolio’s assets and liabilities) rests with New York Life Investment Management LLC (“New York Life Investments” or the “Manager”), aided to whatever extent necessary by the Subadvisor (as defined in Note 3(A)). To assess the appropriateness of security valuations, the Manager, the Subadvisor or the Portfolio’s third-party service provider, who is subject to oversight by the Manager, regularly compares prior day prices, prices on comparable securities and the sale prices to the prior and current day prices and challenges prices with changes exceeding certain tolerance levels with third-party pricing services or broker sources.
The Board authorized the Valuation Committee to appoint a Valuation Subcommittee (the “Subcommittee”) to establish the prices of securities for which market quotations are not readily available or the prices of which are not otherwise readily determinable under the procedures. The Subcommittee meets (in person, via electronic mail or via teleconference) on an as-needed basis. The Valuation Committee meets to ensure that actions taken by the Subcommittee were appropriate.
For those securities valued through either a standardized fair valuation methodology or a fair valuation measurement, the Subcommittee deals with such valuation and the Valuation Committee reviews and affirms, if appropriate, the reasonableness of the valuation based on such methodologies and measurements on a regular basis after considering information that is reasonably available and deemed relevant by the Valuation Committee. Any action taken by the Subcommittee with respect to the valuation of a portfolio security or other asset is submitted for review and ratification (if appropriate) to the Valuation Committee and the Board at the next regularly scheduled meeting.
“Fair value” is defined as the price the Portfolio would reasonably expect to receive upon selling an asset or liability in an orderly transaction to an independent buyer in the principal or most advantageous market for the asset or liability. Fair value measurements are determined within a framework that establishes a three-tier hierarchy that maximizes the use of observable market data and minimizes the use of unobservable inputs to establish a classification of fair value measurements for disclosure purposes. “Inputs” refer broadly to the assumptions that market participants would use in pricing the asset or liability, including assumptions about risk, such as the risk inherent in a particular valuation technique used to measure fair value using a pricing model and/or the risk inherent in the inputs for the valuation technique. Inputs may be observable or unobservable. Observable inputs reflect the assumptions market participants would use in pricing the asset or liability based on market data obtained from sources independent of the Portfolio. Unobservable inputs reflect the Portfolio’s own assumptions about the assumptions market participants would use in pricing the asset or liability based on the information available. The inputs or methodology used for valuing assets or liabilities may not be an indication of the risks associated with investing in those assets or liabilities. The three-tier hierarchy of inputs is summarized below.
| | |
| 18 | | MainStay VP MacKay Common Stock Portfolio |
| • | | Level 1—quoted prices in active markets for an identical asset or liability |
| • | | Level 2—other significant observable inputs (including quoted prices for a similar asset or liability in active markets, interest rates and yield curves, prepayment speeds, credit risk, etc.) |
| • | | Level 3—significant unobservable inputs (including the Portfolio’s own assumptions about the assumptions that market participants would use in measuring fair value of an asset or liability) |
The level of an asset or liability within the fair value hierarchy is based on the lowest level of an input, both individually and in the aggregate, that is significant to the fair value measurement. The aggregate value by input level of the Portfolio’s assets and liabilities as of June 30, 2020 is included at the end of the Portfolio of Investments.
The Portfolio may use third-party vendor evaluations, whose prices may be derived from one or more of the following standard inputs, among others:
| | |
• Broker/dealer quotes | | • Benchmark securities |
• Two-sided markets | | • Reference data (corporate actions or material event notices) |
• Bids/offers | | • Monthly payment information |
• Industry and economic events | | • Reported trades |
An asset or liability for which market values cannot be measured using the methodologies described above is valued by methods deemed reasonable in good faith by the Valuation Committee, following the procedures established by the Board, to represent fair value. Under these procedures, the Portfolio generally uses a market-based approach which may use related or comparable assets or liabilities, recent transactions, market multiples, book values and other relevant information. The Portfolio may also use an income-based valuation approach in which the anticipated future cash flows of the asset or liability are discounted to calculate fair value. Discounts may also be applied due to the nature and/or duration of any restrictions on the disposition of the asset or liability. Fair value represents a good faith approximation of the value of a security. Fair value determinations involve the consideration of a number of subjective factors, an analysis of applicable facts and circumstances and the exercise of judgment. As a result, it is possible that the fair value for a security determined in good faith in accordance with the Portfolio’s valuation procedures may differ from valuations for the same security determined by other funds using their own valuation procedures. Although the Portfolio’s valuation procedures are designed to value a security at the price the Portfolio may reasonably expect to receive upon the security’s sale in an orderly transaction, there can be no assurance that any fair value determination thereunder would, in fact, approximate the amount that the Portfolio would actually realize upon the sale of the security or the price at which the security would trade if a reliable market price were readily available. During the six-month period ended June 30, 2020, there were no material changes to the fair value methodologies.
Securities which may be valued in this manner include, but are not limited to: (i) a security for which trading has been halted or suspended; (ii) a debt security that has recently gone into default and for which there is not a current market quotation; (iii) a security of an issuer that
has entered into a restructuring; (iv) a security that has been delisted from a national exchange; (v) a security for which the market price is not readily available from a third-party pricing source or, if so provided, does not, in the opinion of the Manager or the Subadvisor, reflect the security’s market value; (vi) a security subject to trading collars for which no or limited trading takes place; and (vii) a security whose principal market has been temporarily closed at a time when, under normal conditions, it would be open. Securities valued in this manner are generally categorized as Level 3 in the hierarchy. As of June 30, 2020, no securities held by the Portfolio were fair valued in such a manner.
Equity securities, including exchange-traded funds (“ETFs”), are valued at the last quoted sales prices as of the close of regular trading on the relevant exchange on each valuation date. Securities that are not traded on the valuation date are valued at the mean of the last quoted bid and ask prices. Prices are normally taken from the principal market in which each security trades. These securities are generally categorized as Level 1 in the hierarchy.
Investments in mutual funds, including money market funds, are valued at their respective NAVs as of the close of the Exchange on the valuation date. These securities are generally categorized as Level 1 in the hierarchy.
Temporary cash investments acquired in excess of 60 days to maturity at the time of purchase are valued using the latest bid prices or using valuations based on a matrix system (which considers such factors as security prices, yields, maturities and ratings), both as furnished by independent pricing services. Temporary cash investments that mature in 60 days or less at the time of purchase (“Short-Term Investments”) are valued using the amortized cost method of valuation, unless the use of such method would be inappropriate. The amortized cost method involves valuing a security at its cost on the date of purchase and thereafter assuming a constant amortization to maturity of the difference between such cost and the value on maturity date. Amortized cost approximates the current fair value of a security. Securities valued using the amortized cost method are not valued using quoted prices in an active market and are generally categorized as Level 2 in the hierarchy.
The information above is not intended to reflect an exhaustive list of the methodologies that may be used to value portfolio investments. The valuation procedures permit the use of a variety of valuation methodologies in connection with valuing portfolio investments. The methodology used for a specific type of investment may vary based on the market data available or other considerations. The methodologies summarized above may not represent the specific means by which portfolio investments are valued on any particular business day.
(B) Income Taxes. The Portfolio’s policy is to comply with the requirements of the Internal Revenue Code of 1986, as amended (the “Internal Revenue Code”), applicable to regulated investment companies and to distribute all of its taxable income to the shareholders of the Portfolio within the allowable time limits.
The Manager evaluates the Portfolio’s tax positions to determine if the tax positions taken meet the minimum recognition threshold in connection with accounting for uncertainties in income tax positions taken or expected to be taken for the purposes of measuring and recognizing tax liabilities in the financial statements. Recognition of tax benefits of an uncertain tax position is permitted only to the extent the position is
Notes to Financial Statements (Unaudited) (continued)
“more likely than not” to be sustained assuming examination by taxing authorities. The Manager analyzed the Portfolio’s tax positions taken on federal, state and local income tax returns for all open tax years (for up to three tax years) and has concluded that no provisions for federal, state and local income tax are required in the Portfolio’s financial statements. The Portfolio’s federal, state and local income tax and federal excise tax returns for tax years for which the applicable statutes of limitations have not expired are subject to examination by the Internal Revenue Service and state and local departments of revenue.
(C) Dividends and Distributions to Shareholders. Dividends and distributions are recorded on the ex-dividend date. The Portfolio intends to declare and pay dividends from net investment income and distributions from net realized capital and currency gains, if any, at least annually. Unless a shareholder elects otherwise, all dividends and distributions are reinvested at NAV in the same class of shares of the Portfolio. Dividends and distributions to shareholders are determined in accordance with federal income tax regulations and may differ from determinations using GAAP.
(D) Security Transactions and Investment Income. The Portfolio records security transactions on the trade date. Realized gains and losses on security transactions are determined using the identified cost method. Dividend income is recognized on the ex-dividend date, net of any foreign tax withheld at the source, and interest income is accrued as earned using the effective interest rate method. Distributions received from real estate investment trusts may be classified as dividends, capital gains and/or return of capital.
Investment income and realized and unrealized gains and losses on investments of the Portfolio are allocated pro rata to the separate classes of shares based upon their relative net assets on the date the income is earned or realized and unrealized gains and losses are incurred.
(E) Expenses. Expenses of the Fund are allocated to the individual Portfolios in proportion to the net assets of the respective Portfolios when the expenses are incurred, except where direct allocations of expenses can be made. Expenses (other than fees incurred under the distribution and service plans, further discussed in Note 3(B), which are charged directly to the Service Class shares) are allocated to separate classes of shares pro rata based upon their relative net assets on the date the expenses are incurred. The expenses borne by the Portfolio, including those of related parties to the Portfolio, are shown in the Statement of Operations.
Additionally, the Portfolio may invest in ETFs and mutual funds, which are subject to management fees and other fees that may cause the costs of investing in ETFs and mutual funds to be greater than the costs of owning the underlying securities directly. These indirect expenses of ETFs and mutual funds are not included in the amounts shown as expenses in the Portfolio’s Statement of Operations or in the expense ratios included in the Financial Highlights.
(F) Use of Estimates. In preparing financial statements in conformity with GAAP, the Manager makes estimates and assumptions that affect the reported amounts and disclosures in the financial statements. Actual results could differ from those estimates.
(G) Securities Lending. In order to realize additional income, the Portfolio may engage in securities lending, subject to the limitations set
forth in the 1940 Act and relevant guidance by the staff of the Securities and Exchange Commission (“SEC”). If the Portfolio engages in securities lending, the Portfolio will lend through its custodian, currently State Street Bank and Trust Company (“State Street”), acting as securities lending agent on behalf of the Portfolio. Under the current arrangement, State Street will manage the Portfolio’s collateral in accordance with the securities lending agency agreement between the Portfolio and State Street, and indemnify the Portfolio against counterparty risk. The loans will be collateralized by cash (which may be invested in a money market fund) and/or non-cash collateral (which may include U.S. Treasury securities and/or U.S. government agency securities issued or guaranteed by the United States government or its agencies or instrumentalities) at least equal at all times to the market value of the securities loaned. The Portfolio bears the risk of delay in recovery of, or loss of rights in, the securities loaned. The Portfolio may also record a realized gain or loss on securities deemed sold due to a borrower’s inability to return securities on loan. The Portfolio bears the risk of any loss on investment of cash collateral. The Portfolio will receive compensation for lending its securities in the form of fees or it will retain a portion of interest earned on the investment of any cash collateral. The Portfolio will also continue to receive interest and dividends on the securities loaned and any gain or loss in the market price of the securities loaned that may occur during the term of the loan will be for the account of the Portfolio. Income earned from securities lending activities, if any, is reflected in the Statement of Operations. As of June 30, 2020, the Portfolio did not have any portfolio securities on loan.
(H) Indemnifications. Under the Fund’s organizational documents, its officers and trustees are indemnified against certain liabilities that may arise out of performance of their duties to the Fund. Additionally, in the normal course of business, the Portfolio enters into contracts with third-party service providers that contain a variety of representations and warranties and that may provide general indemnifications. The Portfolio’s maximum exposure under these arrangements is unknown, as this would involve future claims that may be made against the Portfolio that have not yet occurred. The Manager believes that the risk of loss in connection with these potential indemnification obligations is remote. However, there can be no assurance that material liabilities related to such obligations will not arise in the future, which could adversely impact the Portfolio.
Note 3–Fees and Related Party Transactions
(A) Manager and Subadvisor. New York Life Investments, a registered investment adviser and an indirect, wholly-owned subsidiary of New York Life, serves as the Portfolio’s Manager pursuant to an Amended and Restated Management Agreement (“Management Agreement”). The Manager provides offices, conducts clerical, recordkeeping and bookkeeping services, and keeps most of the financial and accounting records required to be maintained by the Portfolio. Except for the portion of salaries and expenses that are the responsibility of the Portfolio, the Manager pays the salaries and expenses of all personnel affiliated with the Portfolio and certain operational expenses of the Portfolio. The Portfolio reimburses New York Life Investments in an amount equal to the portion of the compensation of the Chief Compliance Officer attributable to the Portfolio. MacKay Shields LLC
(“MacKay Shields” or the “Subadvisor”), a registered investment adviser and an indirect, wholly-owned subsidiary of New York Life, serves as
| | |
| 20 | | MainStay VPMacKay Common Stock Portfolio |
Subadvisor to the Portfolio and is responsible for the day-to-day portfolio management of the Portfolio. Pursuant to the terms of an Amended and Restated Subadvisory Agreement (“Subadvisory Agreement”) between New York Life Investments and MacKay Shields, New York Life Investments pays for the services of the Subadvisor.
The Fund, on behalf of the Portfolio, pays New York Life Investments in its capacity as the Portfolio’s investment manager and administrator, pursuant to the Management Agreement, a monthly fee for the services performed and facilities furnished at an annual rate of the Portfolio’s average daily net assets as follows: 0.55% up to $500 million; 0.525% from $500 million to $1 billion; and 0.50% in excess of $1 billion. During the six-month period ended June 30, 2020, the effective management fee rate was 0.54%.
During the six-month period ended June 30, 2020, New York Life Investments earned fees from the Portfolio in the amount of $1,922,083 and paid the Subadvisor in the amount of $961,042.
State Street provides sub-administration and sub-accounting services to the Portfolio pursuant to an agreement with New York Life Investments. These services include calculating the daily NAVs of the Portfolio, maintaining the general ledger and sub-ledger accounts for the calculation of the Portfolio’s NAVs and assisting New York Life Investments in
conducting various aspects of the Portfolio’s administrative operations. For providing these services to the Portfolio, State Street is compensated by New York Life Investments.
Pursuant to an agreement between the Fund and New York Life Investments, New York Life Investments is responsible for providing or procuring certain regulatory reporting services for the Portfolio. The Portfolio will reimburse New York Life Investments for the actual costs incurred by New York Life Investments in connection with providing or procuring these services for the Portfolio.
(B) Distribution and Service Fees. The Fund, on behalf of the Portfolio, has entered into a distribution agreement with NYLIFE Distributors LLC (the “Distributor”), an indirect, wholly-owned subsidiary of New York Life. The Portfolio has adopted a distribution plan (the “Plan”) in accordance with the provisions of Rule 12b-1 under the 1940 Act. Under the Plan, the Distributor has agreed to provide, through its affiliates or independent third parties, various distribution-related, shareholder and administrative support services to the Service Class shareholders. For its services, the Distributor is entitled to a combined distribution and service fee accrued daily and paid monthly at an annual rate of 0.25% of the average daily net assets attributable to the Service Class shares of the Portfolio.
(C) Investments in Affiliates (in 000’s). During the six-month period ended June 30, 2020, purchases and sales transactions, income earned from investments and shares held of investment companies managed by New York Life Investments or its affiliates were as follows:
| | | | | | | | | | | | | | | | | | | | | | | | | | | | | | | | | | | | |
Affiliated Investment Company | | Value,
Beginning of
Period | | | Purchases
at Cost | | | Proceeds
from Sales | | | Net
Realized
Gain/(Loss)
on Sales | | | Change in
Unrealized
Appreciation/
(Depreciation) | | | Value,
End of
Period | | | Dividend
Income | | | Other
Distributions | | | Shares
End of
Period | |
| | | | | | | | | |
MainStay U.S. Government Liquidity Fund | | $ | — | | | $ | 14,816 | | | $ | (13,881 | ) | | $ | — | | | $ | — | | | $ | 935 | | | $ | 0 | (a) | | $ | — | | | | 935 | |
| (a) | Amount is less than $500. |
Note 4–Federal Income Tax
As of June 30, 2020, the cost and unrealized appreciation (depreciation) of the Portfolio’s investment portfolio, including applicable derivative contracts and other financial instruments, as determined on a federal income tax basis, was as follows:
| | | | | | | | | | | | | | | | |
| | | Federal Tax Cost | | | Gross
Unrealized
Appreciation | | | Gross
Unrealized
(Depreciation) | | | Net
Unrealized
Appreciation/
(Depreciation) | |
| | | | |
Investments in Securities | | $ | 588,889,482 | | | $ | 123,074,861 | | | $ | (29,098,962 | ) | | $ | 93,975,899 | |
During the year ended December 31, 2019, the tax character of distributions paid as reflected in the Statements of Changes in Net Assets was as follows:
| | |
|
| 2019 |
Tax-Based Distributions from Ordinary Income | | Tax-Based Distributions from Long-Term Gains |
| |
| $22,514,192 | | $95,105,023 |
Note 5–Custodian
State Street is the custodian of cash and securities held by the Portfolio. Custodial fees are charged to the Portfolio based on the Portfolio’s net assets and/or the market value of securities held by the Portfolio and the number of certain transactions incurred by the Portfolio.
Note 6–Line of Credit
The Portfolio and certain other funds managed by New York Life Investments maintain a line of credit with a syndicate of banks in order to secure a source of funds for temporary purposes to meet unanticipated or excessive redemption requests.
Effective July 28, 2020, under the credit agreement (the “Credit Agreement”), the aggregate commitment amount is $600,000,000 with an additional uncommitted amount of $100,000,000. The commitment fee is an annual rate of 0.15% of the average commitment amount payable quarterly, regardless of usage, to JP Morgan Chase Bank NA, who serves as the agent to the syndicate. The commitment fee is allocated among the Portfolio and certain other funds managed by New York Life Investments based upon their respective net assets and other factors. Interest on any revolving credit loan is charged based upon the Federal Funds Rate or the one-month London Interbank Offered Rate (“LIBOR”), whichever is higher. The Credit Agreement expires on July 27, 2021,
Notes to Financial Statements (Unaudited) (continued)
although the Portfolio, certain other funds managed by New York Life Investments and the syndicate of banks may renew the Credit Agreement for an additional year on the same or different terms or enter into a credit agreement with a different syndicate of banks. Prior to July 28, 2020, the aggregate commitment amount and the commitment fee were the same as those under the current Credit Agreement, but State Street served as agent to the syndicate. During the six-month period ended June 30, 2020, there were no borrowings made or outstanding with respect to the Portfolio under the Credit Agreement or the credit agreement for which State Street served as agent.
Note 7–Interfund Lending Program
Pursuant to an exemptive order issued by the SEC, the Portfolio, along with certain other funds managed by New York Life Investments, may participate in an interfund lending program. The interfund lending program provides an alternative credit facility that permits the Portfolio and certain other funds managed by New York Life Investments to lend or borrow money for temporary purposes directly to or from one another subject to the conditions of the exemptive order. During the six-month period ended June 30, 2020, there were no interfund loans made or outstanding with respect to the Portfolio.
Note 8–Purchases and Sales of Securities (in 000’s)
During the six-month period ended June 30, 2020, purchases and sales of securities, other than short-term securities, were $499,828 and $587,834, respectively.
Note 9–Capital Share Transactions
Transactions in capital shares for the six-month period ended June 30, 2020 and the year ended December 31, 2019, were as follows:
| | | | | | | | |
Initial Class | | Shares | | | Amount | |
| | |
Six-month period ended June 30, 2020: | | | | | | | | |
| | |
Shares sold | | | 806,784 | | | $ | 18,706,595 | |
Shares redeemed | | | (3,960,867 | ) | | | (95,265,586 | ) |
| | | | |
Net increase (decrease) | | | (3,154,083 | ) | | $ | (76,558,991 | ) |
| | | | |
| | |
Year ended December 31, 2019: | | | | | | | | |
| | |
Shares sold | | | 1,148,674 | | | $ | 31,640,863 | |
| | |
Shares issued to shareholders in reinvestment of distributions | | | 3,236,986 | | | | 78,373,394 | |
Shares redeemed | | | (2,161,189 | ) | | | (60,096,250 | ) |
| | | | |
Net increase (decrease) | | | 2,224,471 | | | $ | 49,918,007 | |
| | | | | | | | |
| | |
| | | | | | | | |
Service Class | | Shares | | | Amount | |
| | |
Six-month period ended June 30, 2020: | | | | | | | | |
| | |
Shares sold | | | 491,487 | | | $ | 11,086,477 | |
Shares redeemed | | | (1,041,686 | ) | | | (25,197,711 | ) |
| | | | |
Net increase (decrease) | | | (550,199 | ) | | $ | (14,111,234 | ) |
| | | | |
| | |
Year ended December 31, 2019: | | | | | | | | |
| | |
Shares sold | | | 671,797 | | | $ | 18,166,325 | |
| | |
Shares issued to shareholders in reinvestment of distributions | | | 1,642,047 | | | | 39,245,821 | |
Shares redeemed | | | (1,659,491 | ) | | | (45,501,700 | ) |
| | | | |
Net increase (decrease) | | | 654,353 | | | $ | 11,910,446 | |
| | | | | | | | |
Note 10–Litigation
The Portfolio has been named as a defendant in the case entitled Kirschner v. FitzSimons, No. 12-2652 (S.D.N.Y.) (the “FitzSimons action”) as a result of its ownership of shares in the Tribune Company (“Tribune”) in 2007 when Tribune effected a leveraged buyout transaction (“LBO”) by which Tribune converted to a privately-held company. In its complaint, the plaintiff asserts claims against certain insiders, major shareholders, professional advisers, and others involved in the LBO. Separately, the complaint also seeks to obtain from former Tribune shareholders, including the Portfolio, any proceeds they received in connection with the LBO. The sole claim and cause of action brought against the Portfolio is for fraudulent conveyance pursuant to United States Bankruptcy Code Section 548(a)(1)(A).
In June 2011, certain Tribune creditors filed numerous additional actions asserting state law constructive fraudulent conveyance claims (the “SLCFC actions”) against specifically-named former Tribune shareholders and, in some cases, putative defendant classes comprised of former Tribune shareholders. One of the SLCFC actions, entitled Deutsche Bank Trust Co. Americas v. Blackrock Institutional Trust Co., No. 11-9319 (S.D.N.Y.) (the “Deutsche Bank action”), named the Portfolio as a defendant.
The FitzSimons action and Deutsche Bank action have been consolidated with the majority of the other Tribune LBO related lawsuits in a multidistrict litigation proceeding entitled In re Tribune Co. Fraudulent Conveyance Litig., No. 11-md-2296 (S.D.N.Y.) (the “MDL Proceeding”).
On September 23, 2013, the District Court granted the defendants’ motion to dismiss the SLCFC actions, including the Deutsche Bank action, on the basis that the plaintiffs did not have standing to pursue their claims. On September 30, 2013, the plaintiffs in the SLCFC actions filed a notice of appeal to the United States Court of Appeals for the Second Circuit. On October 28, 2013, the defendants filed a joint notice of cross-appeal of that same order. On March 29, 2016, the United States Court of Appeals for the Second Circuit issued its opinion on the appeal of the SLCFC actions. The appeals court affirmed the District Court’s dismissal of those lawsuits, but on different grounds than the District Court. The appeals court held that while the plaintiffs have standing under the U.S. Bankruptcy Code, their claims were preempted by Section 546(e) of the Bankruptcy Code-the statutory safe harbor for settlement payments. On April 12, 2016 the Plaintiffs in the SLCFC actions filed a petition seeking rehearing en banc before the appeals court. On July 22, 2016, the appeals court denied the petition. On September 9, 2016, the plaintiffs filed a petition for writ of certiorari in the U.S. Supreme Court challenging the Second Circuit’s decision that the safe harbor of Section 546(e) applied to their claims. Certain shareholder defendants filed a joint brief in opposition to the petition for certiorari on October 24, 2016. The plaintiffs filed a reply in support of the petition on November 4, 2016. On April 3, 2018, Justice Kennedy and Justice Thomas issued a “Statement” related to the petition for certiorari noting that “there might not be a quorum in [the Supreme Court]” to rule and suggesting that the Second Circuit and/or District Court may want to take steps to reexamine the application of the Section 546(e) safe harbor to the previously dismissed state law constructive fraudulent transfer claims based on the Supreme Court’s decision in Merit Management Group LP v. FTI Consulting, Inc. On April 10, 2018, the plaintiffs filed in the Second Circuit a motion for that court to recall its
| | |
| 22 | | MainStay VP MacKay Common Stock Portfolio |
mandate, vacate its prior decision, and remand to the District Court for further proceedings consistent with Merit Management. On April 20, 2018, the shareholder defendants filed a response to the plaintiffs’ motion to recall the mandate. On May 15, 2018, the Second Circuit issued an order recalling the mandate “in anticipation of further panel review.” On December 19, 2019, the Second Circuit issued an amended opinion that again affirmed the district court’s ruling on the basis that plaintiffs’ claims were preempted by Section 546(e) of the Bankruptcy Code. Plaintiffs filed a motion for rehearing and rehearing en banc on January 2, 2020, which was denied on February 6, 2020. On July 6, 2020, the plaintiffs filed a new petition for a writ of certiorari in the U.S. Supreme Court. In that petition, the plaintiffs stated that “[t]o make it more likely that there will be a quorum for this petition,” they have “abandon[ed] the case and let the judgment below stand” with respect to certain defendants, including the Fund, as issuer of the Portfolio.
On August 2, 2013, the plaintiff in the FitzSimons action filed a Fifth Amended Complaint. On May 23, 2014, the defendants filed motions to dismiss the FitzSimons action, including a global motion to dismiss Count I, which is the claim brought against former Tribune shareholders, for intentional fraudulent conveyance under U.S. federal law.
On January 6, 2017, the United States District Court for the Southern District of New York granted the shareholder defendants’ motion to dismiss the intentional fraudulent conveyance claim in the FitzSimons action. In dismissing the intentional fraudulent conveyance claim, the Court denied the plaintiff’s request to amend the complaint. While the District Court’s dismissal of the intentional fraudulent conveyance claim was not immediately appealable, the Trustee asked the District Court to enter judgment immediately so that an appeal could be taken. On February 23, 2017, the Court issued an order stating that it intended to permit an interlocutory appeal of the dismissal order, but would wait to do so until it has resolved outstanding motions to dismiss filed by other defendants.
On July 18, 2017, the plaintiff submitted a letter to the District Court seeking leave to amend its complaint to add a constructive fraudulent transfer claim. The shareholder defendants opposed that request.
On August 24, 2017, the Court denied the plaintiff’s request without prejudice to renewal of the request in the event of an intervening change in the law. On March 8, 2018, the plaintiff renewed the request for leave to file a motion to amend the complaint to assert a constructive fraudulent transfer claim based on the Supreme Court’s ruling in Merit Management. The shareholder defendants opposed that request. On June 18, 2018, the District Court ordered that the request would be stayed pending further action by the Second Circuit in the still-pending appeal, discussed above. On December 18, 2018, the plaintiff filed a letter with the District Court requesting that the stay be dissolved in order to permit briefing on the motion to amend the complaint and indicating the plaintiff’s intention to file another motion to amend the complaint to reinstate claims for intentional fraudulent transfer. The shareholder defendants opposed that request. On January 14, 2019, the Court held a case management conference, during which the Court stated that it would not lift the stay prior to further action from the Second Circuit. The Court stated that it would allow the plaintiff to file a motion to amend to try to reinstate its intentional fraudulent transfer claim. On January 23, 2019, the Court ordered the parties still facing
pending claims to participate in a mediation. On March 27, 2019, the Court held a telephone conference and decided to allow the plaintiff to file a motion for leave to amend. On April 4, 2019, the plaintiff filed a motion to amend the Fifth Amended Complaint to assert a federal constructive fraudulent transfer claim against certain shareholder defendants. On April 10, 2019, the shareholder defendants filed a brief in opposition to the plaintiff’s motion to amend. On April 12, 2019, the plaintiff filed a reply brief. The Court denied leave to amend the complaint on April 23, 2019. On June 13, 2019, the Court entered judgment pursuant to Rule 54(b), which would permit an appeal of the Court’s dismissal of the claim against the shareholder defendants. On July 15, 2019, the Trustee filed a notice of appeal to the Second Circuit. Appellant filed his opening brief on January 7, 2020. The shareholder defendants filed an opposition brief on April 27, 2020, and Appellant filed a reply brief on May 18, 2020. On June 22, 2020, the Court scheduled oral argument to occur on August 24, 2020. The District Court has entered two bar orders in connection with the plaintiff’s settlement with certain non-shareholder defendants. The orders bar claims against the settling defendants, but contain a judgment reduction provision that preserves the value of any potential claim by a shareholder defendant against a settling defendant. Specifically, the judgment reduction provision reduces the amount of money recoverable against a shareholder defendant to the extent the shareholder defendant could have recovered on a claim against a settling defendant.
The value of the proceeds received by the Portfolio in connection with the LBO and the Portfolio’s cost basis in shares of Tribune was as follows:
| | | | | | |
Portfolio | | Proceeds | | Cost Basis | |
| | |
MainStay VP MacKay Common Stock Portfolio | | $1,300,602 | | $ | 1,174,184 | |
At this stage of the proceedings, it would be difficult to assess with any reasonable certainty the probable outcome of the pending litigation or the effect, if any, on the Portfolio’s net asset value.
Note 11–Recent Accounting Pronouncement
In March 2020, the Financial Accounting Standards Board (“FASB”) issued Accounting Standards Update 2020-04 (“ASU 2020-04”), which provides optional guidance to ease the potential accounting burden associated with transitioning away from LIBOR and other reference rates that are expected to be discontinued. ASU 2020-04 is effective immediately upon release of the update on March 12, 2020 through December 31, 2022. At this time, the Manager is evaluating the implications of certain other provisions of ASU 2020-04 related to new disclosure requirements and any impact on the financial statement disclosures has not yet been determined.
Note 12–Subsequent Events
In connection with the preparation of the financial statements of the Portfolio as of and for the six-month period ended June 30, 2020, events and transactions subsequent to June 30, 2020, through the date the financial statements were issued have been evaluated by the Manager, for possible adjustment and/or disclosure. No subsequent events requiring financial statement adjustment or disclosure have been identified.
Notes to Financial Statements (Unaudited) (continued)
Note 13–Other Matters
An outbreak of COVID-19, first detected in December 2019, has developed into a global pandemic and has resulted in travel restrictions, closure of international borders, certain businesses and securities markets, restrictions on securities trading activities, prolonged quarantines, supply chain disruptions, and lower consumer demand, as well as general concern and uncertainty. The continued impact of COVID-19 is uncertain and could further adversely affect the global economy, national economies, individual issuers and capital markets in unforeseeable ways and result in a substantial and extended economic downturn. Developments that disrupt global economies and financial markets, such as COVID-19, may magnify factors that affect the Portfolio’s performance.
| | |
| 24 | | MainStay VP MacKay Common Stock Portfolio |
Discussion of the Operation and Effectiveness of the Portfolio’s
Liquidity Risk Management Program (Unaudited)
In compliance with Rule 22e-4 under the Investment Company Act of 1940, as amended (the “Liquidity Rule”), the Portfolio has adopted and implemented a liquidity risk management program (the “Program”), which New York Life Investment Management LLC believes is reasonably designed to assess and manage the Portfolio’s liquidity risk. The Board designated New York Life Investment Management LLC as administrator of the Program (the “Administrator”). The Administrator has established a Liquidity Risk Management Committee to assist the Administrator in the implementation and day-to-day administration of the Program and to otherwise support the Administrator in fulfilling its responsibilities under the Program.
At a meeting of the Board held on March 11, 2020, the Administrator provided the Board with a written report addressing the Program’s operation, adequacy and effectiveness of implementation for the period from December 1, 2018 through December 31, 2019, as required under the Liquidity Rule. The report noted that the Administrator concluded that (i) the Program operated effectively to assess and manage the Portfolio’s liquidity risk, (ii) the Program has been adequately and effectively implemented to monitor and, as applicable, respond to the Portfolio’s liquidity developments and (iii) the Portfolio’s investment strategy continues to be appropriate for an open-end portfolio.
In accordance with the Program, the Portfolio’s liquidity risk is assessed no less frequently than annually taking into consideration certain factors, as applicable, such as (i) investment strategy and liquidity of portfolio investments, (ii) short-term and long-term cash flow projections and (iii) holdings of cash and cash equivalents and borrowing arrangements and other funding sources. Certain factors are considered under both normal and reasonably foreseeable stressed conditions.
Each Portfolio portfolio investment is classified into one of four liquidity categories. The classification is based on a determination of the number of days it is reasonably expected to take to convert the investment into cash, or sell or dispose of the investment, in current market conditions without significantly changing the market value of the investment. The Administrator has delegated liquidity classification determinations to the Portfolio’s subadvisor, subject to appropriate oversight by the Administrator, and classification determinations are made by taking into account the Portfolio’s reasonably anticipated trade size, various market, trading and investment-specific considerations, as well as market depth, and, in certain cases, third-party vendor data.
The Liquidity Rule requires portfolios that do not primarily hold assets that are highly liquid investments to adopt a minimum amount of net assets that must be invested in highly liquid investments that are assets (an “HLIM”). In addition, the Liquidity Rule limits a portfolio’s investments in illiquid investments. Specifically, the Liquidity Rule prohibits acquisition of illiquid investments if doing so would result in a portfolio holding more than 15% of its net assets in illiquid investments that are assets. The Program includes provisions reasonably designed to determine, periodically review and comply with the HLIM requirement, as applicable, and to comply with the 15% limit on illiquid investments.
Proxy Voting Policies and Procedures and Proxy Voting Record
A description of the policies and procedures that New York Life Investments uses to vote proxies related to the Portfolio’s securities is available free of charge upon request (i) by calling 800-598-2019; (ii) by visiting New York Life Investments’ website at https://www.nylinvestments.com/mainstay/products-and-performance/mainstay-vp-funds-trust; or (iii) by visiting the SEC’s website at www.sec.gov.
The Portfolio is required to file with the SEC its proxy voting record for the 12-month period ending June 30 on Form N-PX. The Portfolio’s most recent Form N-PX or proxy voting record is available free of charge upon request (i) by calling 800-598-2019; (ii) by visiting New York Life Investments’ website at https://www.nylinvestments.com/mainstay/products-and-performance/mainstay-vp-funds-trust; or (iii) by visiting the SEC’s website at www.sec.gov.
Shareholder Reports and Quarterly Portfolio Disclosure
The Portfolio is required to file its complete schedule of portfolio holdings with the SEC 60 days after its first and third fiscal quarter on Form N-PORT. The Portfolio’s holdings report is available free of charge upon request by calling 800-598-2019 or by visiting the SEC’s website at www.sec.gov.
| | |
| 26 | | MainStay VP MacKay Common Stock Portfolio |
MainStay VP Portfolios
MainStay VP offers a wide range of Portfolios. The full array of MainStay VP offerings is listed here, with information about the manager, subadvisors, legal counsel, and independent registered public accounting firm.
Equity Portfolios
MainStay VP Emerging Markets Equity Portfolio
MainStay VP Epoch U.S. Equity Yield Portfolio
MainStay VP Fidelity Institutional AM® Utilities Portfolio†
MainStay VP MacKay Common Stock Portfolio
MainStay VP MacKay Growth Portfolio
MainStay VP MacKay International Equity Portfolio
MainStay VP MacKay Mid Cap Core Portfolio
MainStay VP MacKay S&P 500 Index Portfolio
MainStay VP MacKay Small Cap Core Portfolio
MainStay VP Mellon Natural Resources Portfolio
MainStay VP Small Cap Growth Portfolio
MainStay VP T. Rowe Price Equity Income Portfolio
MainStay VP Winslow Large Cap Growth Portfolio
Mixed Asset Portfolios
MainStay VP Balanced Portfolio
MainStay VP Income Builder Portfolio
MainStay VP Janus Henderson Balanced Portfolio
MainStay VP MacKay Convertible Portfolio
Income Portfolios
MainStay VP Bond Portfolio
MainStay VP Floating Rate Portfolio
MainStay VP Indexed Bond Portfolio
MainStay VP MacKay Government Portfolio
MainStay VP MacKay High Yield Corporate Bond Portfolio
MainStay VP MacKay Unconstrained Bond Portfolio
MainStay VP PIMCO Real Return Portfolio
Money Market
MainStay VP U.S. Government Money Market Portfolio
Alternative
MainStay VP CBRE Global Infrastructure Portfolio
MainStay VP IQ Hedge Multi-Strategy Portfolio
Asset Allocation Portfolios
MainStay VP Conservative Allocation Portfolio
MainStay VP Growth Allocation Portfolio
MainStay VP Moderate Allocation Portfolio
MainStay VP Moderate Growth Allocation Portfolio
Manager
New York Life Investment Management LLC
New York, New York
Subadvisors
Brown Advisory LLC
Baltimore, Maryland
Candriam Belgium S.A.*
Brussels, Belgium
CBRE Clarion Securities LLC
Radnor, Pennsylvania
Epoch Investment Partners, Inc.
New York, New York
FIAM LLC
Smithfield, Rhode Island
IndexIQ Advisors LLC*
New York, New York
Janus Capital Management LLC
Denver, Colorado
MacKay Shields LLC*
New York, New York
Mellon Investments Corporation
Boston, Massachusetts
NYL Investors LLC*
New York, New York
Pacific Investment Management Company LLC
Newport Beach, California
Segall Bryant & Hamill, LLC
Chicago, Illinois
T. Rowe Price Associates, Inc.
Baltimore, Maryland
Winslow Capital Management, LLC
Minneapolis, Minnesota
Distributor
NYLIFE Distributors LLC*
Jersey City, New Jersey
Custodian
State Street Bank and Trust Company
Boston, Massachusetts
Independent Registered Public Accounting Firm
PricewaterhouseCoopers LLP
New York, New York
Legal Counsel
Dechert LLP
Washington, District of Columbia
Some Portfolios may not be available in all products.
| † | Fidelity Institutional AM is a registered trade mark of FMR LLC. Used with permission. |
| * | An affiliate of New York Life Investment Management LLC |
Not part of the Semiannual Report
2020 Semiannual Report
This report is for the general information of New York Life Variable Annuities and NYLIAC Variable Universal Life Insurance Products policyowners. It must be preceded or accompanied by the appropriate product(s) and funds prospectuses if it is given to anyone who is not an owner of a New York Life variable annuity policy or a NYLIAC Variable Universal Life Insurance Product. This report does not offer for sale or solicit orders to purchase securities.
The performance data quoted in this report represents past performance. Past performance is no guarantee of future results. Due to market volatility and other factors, current performance may be lower or higher than the figures shown. The most recent month-end performance summary for your variable annuity or variable life policy is available by calling 800-598-2019 and is updated periodically on www.newyorklife.com.
The New York Life Variable Annuities and NYLIAC Variable Universal Life Insurance Products are issued by New York Life Insurance and Annuity Corporation (a Delaware Corporation) and distributed by NYLIFE Distributors LLC (Member FINRA/SIPC).
New York Life Insurance Company
New York Life Insurance and Annuity Corporation (NYLIAC) (A Delaware Corporation)
51 Madison Avenue, Room 551
New York, NY 10010
www.newyorklife.com
Printed on recycled paper
nylinvestments.com
NYLIFE Distributors LLC, 30 Hudson Street, Jersey City, NJ 07302
New York Life Investment Management LLC is the investment manager to the MainStay VP Funds Trust
©2020 by NYLIFE Distributors LLC. All rights reserved.
You may obtain copies of the Prospectus and the Statement of Additional Information free of charge, upon request, by calling toll-free 800-598-2019 or writing to New York Life Insurance and Annuity Corporation, 51 Madison Avenue, New York, NY 10010.
| | | | |
| Not FDIC Insured | | No Bank Guarantee | | May Lose Value |
| | | | |
| 1781606 | | | | MSVPCS10-08/20 (NYLIAC) NI511 |
MainStay VP MacKay Convertible
Portfolio
Message from the President and Semiannual Report
Unaudited | June 30, 2020
Beginning on January 1, 2021, as permitted by regulations adopted by the Securities and Exchange Commission, paper copies of the MainStay VP Portfolio annual and semi-annual shareholder reports may no longer be sent by mail, unless you specifically request paper copies of the reports from the insurance company that offers your policy. Instead, the reports will be made available online, and you will be notified by mail each time a report is posted and provided with a website link to access the report. Instructions for requesting paper copies will be provided by your insurance company.
If you already elected to receive shareholder reports electronically, you will not be affected by this change and you need not take any action. At any time, you may elect to receive reports and other communications from the insurance company electronically by following the instructions provided by the insurance company.
You may elect to receive all future shareholder reports in paper form free of charge. You can inform the insurance company that you wish to receive paper copies of reports by following the instructions provided by the insurance company. Your election to receive reports in paper form will apply to all portfolio companies available under your contract.
| | | | | | | | |
| Not FDIC/NCUA Insured | | Not a Deposit | | May Lose Value | | No Bank Guarantee | | Not Insured by Any Government Agency |

This page intentionally left blank
Message from the President
High levels of volatility shook financial markets in response to the COVID-19 pandemic and an abrupt decline in global economic activity during the six months ended June 30, 2020.
Markets entered 2020 riding strong fourth quarter performance and an economic expansion of historic longevity. Most broad stock and bond indices began to dip in late February as growing numbers of COVID-19 cases were seen in hotspots around the world. On March 11, 2020, the World Health Organization acknowledged that the disease had reached pandemic proportions, with over 80,000 identified cases in China, thousands in Italy, South Korea and the United States, and more in dozens of additional countries. Governments and central banks pledged trillions of dollars to address the mounting economic and public health crisis; however, “stay-at-home” orders and other restrictions on non-essential activity caused global economic activity to slow. Most stocks and bonds lost significant ground in this challenging environment, with equities declining by roughly a third and the yield on high-yield credit indices shooting higher.
Policymakers responded with extraordinary speed to address the situation. In the United States, the Federal Reserve (“Fed”) cut interest rates to near zero and announced unlimited quantitative easing. With help from Treasury, the Fed later rolled out a series of lending facilities to directly support market functioning. In late March, the Federal government declared a national emergency; Congress passed, and the President signed, a $2 trillion CARES Act (The Coronavirus Aid, Relief, and Economic Security Act), with the promise of further assistance for consumers and businesses to come. This enormous wave of policy support helped fuel a rapid recovery in market pricing as stocks bounced back and credit spreads narrowed. Some states rushed to ease restrictions on travel and social gatherings, further fueling optimism that the effects of the pandemic might prove short lived. However, the final weeks of the reporting period saw infection rates beginning to rise in some of the first states to reopen, raising concerns that a second round of restrictive government policies might prove necessary, once again stifling economic activity.
Despite all the market volatility, the broadly based S&P 500® Index finished the first half of 2020 only slightly below its starting point and the technology-heavy NASDAQ Composite Index posted gains, closing in near record territory. Small-cap stocks tended to trail their large cap counterparts, as illustrated by the Russell 2000® Index’s loss of approximately 15%, while value-oriented stocks lagged growth-oriented issues. From a global perspective, U.S. stocks generally outperformed international equities, with emerging markets hit particularly hard by the flight from risk.
Fixed-income markets also experienced unusually high levels of volatility. Recognized safe havens, such as U.S. government bonds, attracted increased investment, driving yields lower and prices higher, positioning long-term Treasury bonds to deliver particularly strong gains. Investment-grade corporate bonds lost value in March before recovering in the closing months of the reporting period, while relatively speculative high-yield credit faced the brunt of risk-off sentiment. Emerging market debt underperformed most other bonds types as investors sought to minimize currency and sovereign risks.
Today, as we at New York Life Investments continue to track the ongoing health crisis and its financial ramifications, we are particularly mindful of the people at the heart of our enterprise—our colleagues and valued clients. By taking appropriate steps to minimize community spread of COVID-19 within our organization, we strive to safeguard the health of our investment professionals so they can continue to provide you, as a MainStay investor, with world class investment solutions in this rapidly evolving environment.
Sincerely,

Kirk C. Lehneis
President
The opinions expressed are as of the date of this report and are subject to change. There is no guarantee that any forecast made will come to pass. This material does not constitute investment advice and is not intended as an endorsement of any specific investment. Past performance is no guarantee of future results.
Not part of the Semiannual Report
Table of Contents
Investors should refer to the Portfolio’s Summary Prospectus and/or Prospectus and consider the Portfolio’s investment objectives, strategies, risks, charges and expenses carefully before investing. The Summary Prospectus and/or Prospectus contain this and other information about the Portfolio. You may obtain copies of the Portfolio’s Summary Prospectus and/or the Prospectus and the Statement of Additional Information free of charge, upon request, by calling toll-free 800-598-2019, by writing to New York Life Insurance and Annuity Corporation, 51 Madison Avenue, Room 251, New York, New York 10010 or by sending an email to MainStayShareholdersServices@nylim.com. These documents are also available at nylinvestments.com/vpdocuments. Please read the Summary Prospectus and/or Prospectus carefully before investing. MainStay VP Funds Trust portfolios are separate account options which are purchased through a variable insurance or variable annuity contract.
Investment and Performance Comparison1 (Unaudited)
Performance data quoted represents past performance. Past performance is no guarantee of future results. Because of market volatility and other factors, current performance may be lower or higher than the figures shown. Investment return and principal value will fluctuate, and as a result, when shares are redeemed, they may be worth more or less than their original cost. The performance table and graph do not reflect any deduction of sales charges, mortality and expense charges, contract charges or administrative charges. Please refer to the Performance Summary appropriate for your policy. For performance information current to the most recent month-end, please call 800-598-2019 or visit www.newyorklife.com.
Average Annual Total Returns for the Period-Ended June 30, 2020
| | | | | | | | | | | | | | | | | | | | | | |
| Class | | Inception
Date | | Six Months | | | One Year | | | Five Years
or Since Inception | | | Ten Years
or Since Inception | | | Gross
Expense
Ratio2 | |
| | | | | | |
| Initial Class Shares | | 10/1/1996 | | | 6.41 | % | | | 12.17 | % | | | 8.76 | % | | | 10.44 | % | | | 0.62 | % |
| Service Class Shares | | 6/5/2003 | | | 6.28 | | | | 11.89 | | | | 8.49 | | | | 10.17 | | | | 0.87 | |
| Service 2 Class Shares | | 4/26/2016 | | | 6.22 | | | | 11.78 | | | | 11.05 | | | | 11.05 | | | | 0.97 | |
| | | | | | | | | | | | | | | | |
| Benchmark Performance | | Six
Months | | | One
Year | | | Five
Years | | | Ten
Years | |
| | | | |
ICE BofAML U.S. Convertible Index3 | | | 7.25 | % | | | 15.34 | % | | | 9.24 | % | | | 10.91 | % |
Morningstar Convertibles Category Average4 | | | 7.14 | | | | 13.77 | | | | 8.37 | | | | 9.80 | |
| 1. | Performance figures may reflect certain fee waivers and/or expense limitations, without which total returns may have been different. For information on current fee waivers and/or expense limitations (if any), please refer to the Notes to Financial Statements. |
| 2. | The gross expense ratios presented reflect the Portfolio’s “Total Annual Portfolio Operating Expenses” from the most recent Prospectus, as supplemented, and may differ from other expense ratios disclosed in this report. |
| 3. | The ICE BofAML U.S. Convertible Index is the Portfolio’s primary broad-based securities market index for comparison purposes. The ICE BofAML |
| | U.S. Convertible Index is a market-capitalization weighted index of domestic corporate convertible securities. In order to be included in this Index, bonds and preferred stocks must be convertible only to common stock. Results assume reinvestment of all dividends and capital gains. An investment cannot be made directly in an index. |
| 4. | The Morningstar Convertibles Category Average is representative of funds that are designed to offer some of the capital-appreciation potential of stock portfolios while also supplying some of the safety and yield of bond portfolios. Results are based on average total returns of similar funds with all dividends and capital gain distributions reinvested. |
Cost in Dollars of a $1,000 Investment in MainStay VP MacKay Convertible Portfolio (Unaudited)
The example below is intended to describe the fees and expenses borne by shareholders during the six-month period from January 1, 2020, to June 30, 2020, and the impact of those costs on your investment.
Example
As a shareholder of the Portfolio you incur two types of costs: (1) transaction costs, including exchange fees and sales charges (loads) on purchases (as applicable), and (2) ongoing costs, including management fees, distribution and/or service (12b-1) fees, and other Portfolio expenses (as applicable). This example is intended to help you understand your ongoing costs (in dollars) of investing in the Portfolio and to compare these costs with the ongoing costs of investing in other mutual funds. The example is based on an investment of $1,000 made at the beginning of the six-month period and held for the entire period from January 1, 2020, to June 30, 2020. Shares are only sold in connection with variable life and annuity contracts and the example does not reflect any contract level or transactional fees or expenses. If these costs had been included, your costs would have been higher.
This example illustrates your Portfolio’s ongoing costs in two ways:
Actual Expenses
The second and third data columns in the table below provide information about actual account values and actual expenses. You may use the information in these columns, together with the amount you invested, to estimate the expenses that you paid during the six months
ended June 30, 2020. Simply divide your account value by $1,000 (for example, an $8,600 account value divided by $1,000 = 8.6), then multiply the result by the number under the heading entitled “Expenses Paid During Period” to estimate the expenses you paid on your account during this period.
Hypothetical Example for Comparison Purposes
The fourth and fifth data columns in the table below provide information about hypothetical account values and hypothetical expenses based on the Portfolio’s actual expense ratio and an assumed rate of return of 5% per year before expenses, which is not the Portfolio’s actual return. The hypothetical account values and expenses may not be used to estimate the actual ending account balances or expenses you paid for the six-month period shown. You may use this information to compare the ongoing costs of investing in the Portfolio with the ongoing costs of investing in other mutual funds. To do so, compare this 5% hypothetical example with the 5% hypothetical examples that appear in the shareholder reports of the other mutual funds.
Please note that the expenses shown in the table are meant to highlight your ongoing costs only and do not reflect any transactional costs, such as exchange fees or sales charges (loads). Therefore, the fourth and fifth data columns of the table are useful in comparing ongoing costs only and will not help you determine the relative total costs of owning different funds. In addition, if these transactional costs were included, your costs would have been higher.
| | | | | | | | | | | | | | | | | | | | | | |
| | | | | | | | | | | | | | | | | | |
| Share Class | | Beginning
Account
Value
1/1/20 | | | Ending Account
Value (Based
on Actual
Returns and
Expenses)
6/30/20 | | | Expenses
Paid
During
Period1 | | | Ending Account
Value (Based
on Hypothetical
5% Annualized
Return and
Actual Expenses)
6/30/20 | | | Expenses
Paid
During
Period1 | | | Net Expense
Ratio
During
Period2 |
| | | | | | |
| Initial Class Shares | | $ | 1,000.00 | | | $ | 1,064.10 | | | $ | 3.13 | | | $ | 1,021.83 | | | $ | 3.07 | | | 0.61% |
| | | | | | |
| Service Class Shares | | $ | 1,000.00 | | | $ | 1,062.80 | | | $ | 4.41 | | | $ | 1,020.59 | | | $ | 4.32 | | | 0.86% |
| | | | | | |
| Service 2 Class Shares | | $ | 1,000.00 | | | $ | 1,062.20 | | | $ | 4.92 | | | $ | 1,020.09 | | | $ | 4.82 | | | 0.96% |
| 1 | Expenses are equal to the Portfolio’s annualized expense ratio of each class multiplied by the average account value over the period, divided by 366 and multiplied by 182 (to reflect the six-month period). The table above represents the actual expenses incurred during the six-month period. In addition to the fees and expenses which the Portfolio bears directly, it also indirectly bears a pro rata share of the fees and expenses of the underlying funds in which it invests. Such indirect expenses are not included in the above-reported expense figures. |
| 2 | Expenses are equal to the Portfolio’s annualized expense ratio to reflect the six-month period. |
| | |
| 6 | | MainStay VP MacKay Convertible Portfolio |
Portfolio Composition as of June 30, 2020 (Unaudited)

See Portfolio of Investments beginning on page 10 for specific holdings within these categories. The Portfolio’s holdings are subject to change.
Top Ten Issuers as of June 30, 2020 (excluding short-term investments) (Unaudited)
| 1. | Danaher Corp.,(zero Coupon), due 1/22/21 |
| 2. | NICE Systems, Inc., 1.25%, due 1/15/24 |
| 3. | Anthem, Inc., 2.75%, due 10/15/42 |
| 4. | Inphi Corp., 0.75%, due 4/15/25 |
| 5. | Teladoc Health, Inc., 1.25%-1.375%, due 5/15/25-6/1/27 |
| 6. | BioMarin Pharmaceutical, Inc., 0.599%, due 8/1/24 |
| 7. | Southwest Airlines Co., 1.25%, due 5/1/25 |
| 8. | Microchip Technology, Inc., 1.625%, due 2/15/25-2/15/27 |
| 9. | DexCom, Inc., 0.25%, due 11/15/25 |
| 10. | RingCentral, Inc.,(zero coupon), due 3/1/25 |
Portfolio Management Discussion and Analysis (Unaudited)
Answers to the questions reflect the views of portfolio manager Edward Silverstein, CFA, of MacKay Shields LLC, the Portfolio’s Subadvisor.
How did MainStay VP MacKay Convertible Portfolio perform relative to its benchmark and peers during the six months ended June 30, 2020?
For the six months ended June 30, 2020, MainStay VP MacKay Convertible Portfolio returned 6.41% for Initial Class shares, 6.28% for Service Class shares and 6.22% for Service 2 Class shares. Over the same period, all share classes underperformed the 7.25% return of the ICE BofAML U.S. Convertible Index (“Index”), which is the Portfolio’s benchmark, and the 7.14% return of the Morningstar Convertibles Category Average.1
During the reporting period, were there any market events that materially impacted the Portfolio’s performance or liquidity?
The Portfolio was not materially impacted by the COVID-19 pandemic. However, convertible bonds and equities did fall sharply from mid-February through the end of March 2020 as it became increasingly evident that the virus was not merely a medical concern, but an economic one with larger fiscal implications than those related to personal health. Other than Treasury securities, nearly all asset classes saw steep losses including gold, which is usually a haven in the market during times of uncertainty. The shutdown of most sectors of the economy for a prolonged period of time posed risks to the consumer as well as the industrial sector. Having experienced the relatively mild economic impact of past pandemics, we underestimated the scope and impact that this COVID-19 pandemic would have on the economy.
What factors affected the Portfolio’s relative performance during the reporting period?
The Portfolio underperformed the ICE BofAML U.S. Convertible Index due to the Portfolio’s underweight exposure to the convertible bonds of electric car maker Tesla, which is the largest constituent in the Index and the Index’s best performer during the reporting period. The Portfolio did benefit from several strong performers in the health care and information technology sectors, but not enough to offset the impact of its underweight exposure to Tesla and losses from several holdings in the energy sector.
During the reporting period, which sectors were the strongest positive contributors to the Fund’s relative performance and which sectors were particularly weak?
Relative to the ICE BofAML U.S. Convertible Index, the Portfolio’s weakest performing sectors were consumer discretionary, energy and industrials. In the case of energy and industrials, the Portfolio’s relative performance suffered due to several under-
performing securities. In the consumer discretionary sector, the Portfolio suffered due to its underweight exposure to Tesla, mentioned above.
The Portfolio’s three strongest performing sectors relative to the Index were health care, information technology and utilities. In health care, the Portfolio benefitted from its large holdings of convertible bonds from telemedicine company Teladoc and convertibles from medical and industrial device maker Danaher, which was the Portfolio’s largest single holding and a strong performer. In information technology, several holdings produced substantial gains, including convertible bonds from semiconductor maker Inphi, enterprise software developer NICE, software-as-a-service solutions provider RingCentral and cloud-based web platform Wix.com. In the lagging utilities sector, the Portfolio’s relatively underweight exposure bolstered returns compared to the Index.
During the reporting period, which market segments were the strongest positive contributors to the Portfolio’s absolute performance and which market segments were particularly weak?
The strongest positive contributors to the Portfolio’s absolute performance during the reporting period included the convertible bonds of Teladoc Health, Inphi and NICE, all mentioned above. (Contributions take weightings and total returns into account.) Teladoc convertibles rose in part due to the company’s announcement of its acquisition of InTouch Health, which opened Teladoc’s service to new markets. More importantly, Teladoc was one of a few companies to benefit from the COVID pandemic as patients, unable to visit their doctors, sought treatment online using Teladoc’s internet portal. While we believe the level of patient visits is nearly certain to recede once the virus fears pass, we expect the acceptance of telemedicine as an alternative to an in-office visit to persist, providing longer-term benefits for the company. Inphi convertibles gained ground as demand for the company’s networking chips remained strong. NICE convertibles performed well as the company continued to steadily grow its customer relationship management and data analysis software with little, if any, impact from the pandemic.
The three securities that detracted most significantly from the Portfolio’s absolute performance during the same period were the convertible bonds of oil & gas equipment & services provider Oil States International, offshore drilling services company Valaris, and equipment engineer for the energy and industrial gas industries Chart Industries. Oil States International convertibles declined on what we believed was investors increasing concerns that only the best capitalized energy companies would survive the industry downturn. Oil prices reached levels at which it was uneconomical for nearly all U.S. producers to drill
| 1. | See page 5 for more information on benchmark and peer group returns. |
| | |
| 8 | | MainStay VP MacKay Convertible Portfolio |
for or explore for oil. We believe that Oil States can survive if it is able to amend its debt covenants and if the price of oil is able to rebound in the next 12-18 months so that lenders are comfortable extending credit to the company. Valaris convertibles declined as, we believe, it became increasingly evident that, with the collapse of oil prices, few if any exploration and production companies would be interested in leasing Valaris’ rigs. In our opinion, the sharp decline in Valaris’ business, combined with the company’s high debt levels make it a near certainty that the company will need to reorganize in bankruptcy. Chart Industries convertibles declined sharply because the company’s share price and convertible bonds are often linked to the performance of the broader energy market, which, in our opinion, appeared particularly bleak. While a large portion of Chart’s business is energy related, it is not involved in the exploration or production of oil or natural gas; rather, Chart’s products are used in the liquification of natural gas so that it can be shipped in tankers.
Did the Portfolio make any significant purchases or sales during the reporting period?
During the reporting period, the Portfolio initiated a position in convertible bonds from Southwest Airlines reflecting our view that Southwest is a well-run, investment-grade airline that is likely to eventually return to profitability. The Portfolio also initiated a position in convertible bonds from Permian Basin oil producer Pioneer Natural Resources as the company was able to generate free cash flow despite sub-$45 crude oil due to its low cost structure. We expect commodity prices to eventually rise due to a sharp decline in U.S. output. Another new position for the Portfolio was in convertible bonds of glucose monitoring device company, Dexcom. In our opinion, Dexcom devices appear to be achieving rapid adoption by diabetics as a better alternative to daily blood-sugar needle sticks.
During the same period, the Portfolio’s holdings of Echo Global Logistics convertibles matured and were redeemed for cash. We
sold the Portfolio’s holdings of convertible bonds from offshore oil & gas drilling contractor Transocean due to our concerns about demand for the company’s drilling rigs with the price of oil at multi-decade lows. We also trimmed the Portfolio’s holdings of convertibles from satellite-based television and Internet provider DISH Network due to our view of the company’s high debt levels and its unclear plan to transform from a pay television provider to a cell network. In addition, with the decline in the company’s share price, we believed its convertible bonds no longer offered significant equity sensitivity. Lastly, the bonds of both Becton Dickinson and Echo Global Logistics both matured during the period.
How did the Portfolio’s sector weightings change during the reporting period?
Most of the Portfolio’s sector weights remained unchanged during the reporting period. Exposure to the consumer discretionary sector increased due to the purchase of convertible bonds from Tesla, and the purchase of several new issues such as convertibles from apparel retailers Burlington Stores and American Eagle Outfitters. The only other changes of note included a decrease in the exposure to the communication services sector—largely due to the Portfolio’s sale of its DISH Network holdings—and a decrease in exposure to the energy sector—due to the depreciation of holdings as well as the sale of Transocean convertibles.
How was the Portfolio positioned at the end of the reporting period?
As of June 30, 2020, the Portfolio held overweight exposure relative to the ICE BofAML U.S. Convertible Index to the information technology, industrials, health care and energy sectors. As of the same date, the Portfolio held relatively underweight sector exposure to utilities, consumer discretionary, consumer staples, financials and real estate, and market-weight exposure to consumer staples and materials.
The opinions expressed are those of the portfolio managers as of the date of this report and are subject to change. There is no guarantee that any forecasts will come to pass. This material does not constitute investment advice and is not intended as an endorsement of any specific investment.
Not all MainStay VP Portfolios and/or share classes are available under all policies.
Portfolio of Investments June 30, 2020 (Unaudited)
| | | | | | | | |
| | | Principal
Amount | | | Value | |
Convertible Securities 98.1% † Convertible Bonds 91.5% | |
Advertising 0.6% | |
Quotient Technology, Inc.
1.75%, due 12/1/22 | | $ | 5,756,000 | | | $ | 5,216,241 | |
| | | | | | | | |
|
Aerospace & Defense 1.2% | |
Aerojet Rocketdyne Holdings, Inc.
2.25%, due 12/15/23 | | | 7,117,000 | | | | 11,412,074 | |
| | | | | | | | |
|
Airlines 2.7% | |
American Airlines Group, Inc.
6.50%, due 7/1/25 (a) | | | 4,290,000 | | | | 4,054,711 | |
Southwest Airlines Co.
1.25%, due 5/1/25 | | | 17,704,000 | | | | 21,351,573 | |
| | | | | | | | |
| | | | | | | 25,406,284 | |
| | | | | | | | |
|
Auto Manufacturers 2.0% | |
Tesla, Inc.
1.25%, due 3/1/21 | | | 6,043,000 | | | | 18,121,502 | |
| | | | | | | | |
|
Biotechnology 6.6% | |
Apellis Pharmaceuticals, Inc.
3.50%, due 9/15/26 (b) | | | 4,715,000 | | | | 5,270,264 | |
BioMarin Pharmaceutical, Inc.
0.599%, due 8/1/24 (a) | | | 18,042,000 | | | | 22,093,493 | |
Bridgebio Pharma, Inc.
2.50%, due 3/15/27 (b) | | | 4,381,000 | | | | 4,516,695 | |
Exact Sciences Corp.
1.00%, due 1/15/25 | | | 8,726,000 | | | | 11,954,108 | |
Illumina, Inc.
(zero coupon), due 8/15/23 (a) | | | 7,893,000 | | | | 8,650,414 | |
Ionis Pharmaceuticals, Inc.
1.00%, due 11/15/21 | | | 8,329,000 | | | | 9,202,939 | |
| | | | | | | | |
| | | | | | | 61,687,913 | |
| | | | | | | | |
|
Building Materials 1.3% | |
Patrick Industries, Inc.
1.00%, due 2/1/23 | | | 11,666,000 | | | | 11,747,503 | |
| | | | | | | | |
|
Commercial Services 3.0% | |
Chegg, Inc.
0.125%, due 3/15/25 | | | 6,835,000 | | | | 9,699,890 | |
Euronet Worldwide, Inc.
0.75%, due 3/15/49 | | | 7,730,000 | | | | 7,512,594 | |
| | | | | | | | |
| | | Principal
Amount | | | Value | |
Commercial Services (continued) | |
Square, Inc.
0.125%, due 3/1/25 (b) | | $ | 4,495,000 | | | $ | 5,114,556 | |
0.50%, due 5/15/23 | | | 3,658,000 | | | | 5,449,714 | |
| | | | | | | | |
| | | | | | | 27,776,754 | |
| | | | | | | | |
|
Computers 2.8% | |
Lumentum Holdings, Inc.
0.25%, due 3/15/24 | | | 12,334,000 | | | | 18,007,640 | |
Western Digital Corp.
1.50%, due 2/1/24 | | | 4,634,000 | | | | 4,379,288 | |
Zscaler, Inc.
0.125%, due 7/1/25 (b) | | | 3,575,000 | | | | 3,669,417 | |
| | | | | | | | |
| | | | | | | 26,056,345 | |
| | | | | | | | |
|
Diversified Financial Services 0.4% | |
LendingTree, Inc.
0.625%, due 6/1/22 | | | 2,437,000 | | | | 3,664,232 | |
| | | | | | | | |
|
Electric 1.0% | |
NRG Energy, Inc.
2.75%, due 6/1/48 | | | 9,299,000 | | | | 9,447,905 | |
| | | | | | | | |
|
Energy—Alternate Sources 0.3% | |
Enphase Energy, Inc.
0.25%, due 3/1/25 (b) | | | 2,995,000 | | | | 2,733,746 | |
| | | | | | | | |
|
Entertainment 0.5% | |
Live Nation Entertainment, Inc.
2.50%, due 3/15/23 | | | 4,439,000 | | | | 4,513,908 | |
| | | | | | | | |
|
Food 0.9% | |
Chefs’ Warehouse, Inc.
1.875%, due 12/1/24 (b) | | | 10,997,000 | | | | 7,998,006 | |
| | | | | | | | |
|
Health Care—Products 5.5% | |
Cantel Medical Corp.
3.25%, due 5/15/25 (b) | | | 2,749,000 | | | | 3,448,108 | |
CONMED Corp.
2.625%, due 2/1/24 | | | 9,264,000 | | | | 9,741,850 | |
Danaher Corp.
(zero coupon), due 1/22/21 | | | 4,340,000 | | | | 29,292,596 | |
Integra LifeSciences Holdings Corp.
0.50%, due 8/15/25 (b) | | | 4,154,000 | | | | 3,797,047 | |
NuVasive, Inc.
0.375%, due 3/15/25 (b) | | | 4,971,000 | | | | 4,364,784 | |
| | | | | | | | |
| | | | | | | 50,644,385 | |
| | | | | | | | |
| | | | |
| 10 | | MainStay VP MacKay Convertible Portfolio | | The notes to the financial statements are an integral part of,
and should be read in conjunction with, the financial statements. |
| | | | | | | | |
| | | Principal
Amount | | | Value | |
| Convertible Bonds (continued) | |
Health Care—Services 5.3% | |
Anthem, Inc.
2.75%, due 10/15/42 | | $ | 7,296,000 | | | $ | 26,725,060 | |
Teladoc Health, Inc.
1.25%, due 6/1/27 (b) | | | 8,562,000 | | | | 9,502,633 | |
1.375%, due 5/15/25 | | | 3,750,000 | | | | 13,390,443 | |
| | | | | | | | |
| | | | | | | 49,618,136 | |
| | | | | | | | |
|
Internet 11.1% | |
Boingo Wireless, Inc.
1.00%, due 10/1/23 | | | 4,790,000 | | | | 4,275,075 | |
Booking Holdings, Inc.
0.90%, due 9/15/21 | | | 13,680,000 | | | | 14,569,013 | |
Etsy, Inc.
0.125%, due 10/1/26 (b) | | | 11,300,000 | | | | 15,464,452 | |
FireEye, Inc.
0.875%, due 6/1/24 | | | 3,663,000 | | | | 3,331,638 | |
IAC FinanceCo 2, Inc.
0.875%, due 6/15/26 (b) | | | 7,897,000 | | | | 9,739,624 | |
Okta, Inc.
0.125%, due 9/1/25 (b) | | | 7,065,000 | | | | 8,768,783 | |
Palo Alto Networks, Inc.
0.375%, due 6/1/25 (b) | | | 5,715,000 | | | | 5,717,835 | |
0.75%, due 7/1/23 | | | 8,986,000 | | | | 9,628,292 | |
Q2 Holdings, Inc.
0.75%, due 6/1/26 | | | 2,800,000 | | | | 3,193,474 | |
Snap, Inc.
0.75%, due 8/1/26 (b) | | | 6,296,000 | | | | 7,889,675 | |
Wix.com, Ltd.
(zero coupon), due 7/1/23 | | | 7,665,000 | | | | 14,261,691 | |
Zendesk, Inc.
0.25%, due 3/15/23 | | | 1,447,000 | | | | 2,161,983 | |
0.625%, due 6/15/25 (b) | | | 3,580,000 | | | | 3,836,770 | |
| | | | | | | | |
| | | | | | | 102,838,305 | |
| | | | | | | | |
|
Iron & Steel 0.2% | |
Cleveland-Cliffs, Inc.
1.50%, due 1/15/25 | | | 2,342,000 | | | | 2,143,778 | |
| | | | | | | | |
|
Leisure Time 1.7% | |
Carnival Corp.
5.75%, due 4/1/23 (b) | | | 5,827,000 | | | | 9,402,928 | |
NCL Corp., Ltd.
6.00%, due 5/15/24 (b) | | | 1,756,000 | | | | 2,346,680 | |
Royal Caribbean Cruises, Ltd.
4.25%, due 6/15/23 (b) | | | 3,070,000 | | | | 2,870,450 | |
Sabre GLBL, Inc.
4.00%, due 4/15/25 (a)(b) | | | 1,185,000 | | | | 1,516,686 | |
| | | | | | | | |
| | | | | | | 16,136,744 | |
| | | | | | | | |
| | | | | | | | |
| | | Principal
Amount | | | Value | |
Lodging 0.5% | |
Caesars Entertainment Corp.
5.00%, due 10/1/24 | | $ | 2,616,000 | | | $ | 4,409,814 | |
| | | | | | | | |
|
Machinery—Diversified 1.8% | |
Chart Industries, Inc.
1.00%, due 11/15/24 (b) | | | 15,599,000 | | | | 16,483,585 | |
| | | | | | | | |
|
Media 2.4% | |
DISH Network Corp.
3.375%, due 8/15/26 | | | 10,403,000 | | | | 9,582,356 | |
Liberty Media Corp-Liberty Formula One
1.00%, due 1/30/23 | | | 6,664,000 | | | | 7,259,352 | |
Liberty Media Corp.
1.375%, due 10/15/23 | | | 5,512,000 | | | | 5,811,853 | |
| | | | | | | | |
| | | | | | | 22,653,561 | |
| | | | | | | | |
|
Oil & Gas 2.2% | |
Ensco Jersey Finance, Ltd.
3.00%, due 1/31/24 (a) | | | 11,037,000 | | | | 1,488,987 | |
EQT Corp.
1.75%, due 5/1/26 (b) | | | 8,505,000 | | | | 8,839,568 | |
Pioneer Natural Resources Co.
0.25%, due 5/15/25 (b) | | | 8,757,000 | | | | 10,375,179 | |
| | | | | | | | |
| | | | | | | 20,703,734 | |
| | | | | | | | |
|
Oil & Gas Services 1.9% | |
Helix Energy Solutions Group, Inc.
4.125%, due 9/15/23 | | | 6,078,000 | | | | 5,051,514 | |
Newpark Resources, Inc.
4.00%, due 12/1/21 | | | 5,174,000 | | | | 4,640,331 | |
Oil States International, Inc.
1.50%, due 2/15/23 | | | 13,274,000 | | | | 6,694,356 | |
Weatherford International, Ltd.
11.00%, due 12/1/24 (b) | | | 1,137,000 | | | | 793,058 | |
| | | | | | | | |
| | | | | | | 17,179,259 | |
| | | | | | | | |
|
Pharmaceuticals 3.8% | |
DexCom, Inc.
0.25%, due 11/15/25 (b) | | | 18,004,000 | | | | 18,521,421 | |
Neurocrine Biosciences, Inc.
2.25%, due 5/15/24 | | | 6,250,000 | | | | 10,454,543 | |
Pacira BioSciences, Inc.
2.375%, due 4/1/22 | | | 5,779,000 | | | | 6,320,521 | |
| | | | | | | | |
| | | | | | | 35,296,485 | |
| | | | | | | | |
|
Retail 1.6% | |
American Eagle Outfitters, Inc.
3.75%, due 4/15/25 (b) | | | 3,570,000 | | | | 5,094,973 | |
| | | | | | |
The notes to the financial statements are an integral part of,
and should be read in conjunction with, the financial statements. | | | | | 11 | |
Portfolio of Investments June 30, 2020 (Unaudited) (continued)
| | | | | | | | |
| | | Principal
Amount | | | Value | |
| Convertible Bonds (continued) | |
Retail (continued) | |
Burlington Stores, Inc.
2.25%, due 4/15/25 (b) | | $ | 8,536,000 | | | $ | 9,743,417 | |
| | | | | | | | |
| | | | | | | 14,838,390 | |
| | | | | | | | |
|
Semiconductors 8.9% | |
Cree, Inc.
1.75%, due 5/1/26 (b) | | | 1,495,000 | | | | 2,111,688 | |
Inphi Corp.
0.75%, due 4/15/25 (b) | | | 21,195,000 | | | | 25,541,528 | |
Microchip Technology, Inc.
1.625%, due 2/15/25 | | | 6,103,000 | | | | 13,629,272 | |
1.625%, due 2/15/27 | | | 5,198,000 | | | | 7,680,289 | |
Micron Technology, Inc.
3.125%, due 5/1/32 | | | 1,993,000 | | | | 10,194,622 | |
Novellus Systems, Inc.
2.625%, due 5/15/41 | | | 724,000 | | | | 7,365,874 | |
ON Semiconductor Corp.
1.625%, due 10/15/23 | | | 1,450,000 | | | | 1,763,215 | |
Rambus, Inc.
1.375%, due 2/1/23 | | | 6,552,000 | | | | 6,854,125 | |
Silicon Laboratories, Inc.
0.625%, due 6/15/25 (b) | | | 7,180,000 | | | | 7,744,836 | |
| | | | | | | | |
| | | | | | | 82,885,449 | |
| | | | | | | | |
|
Software 17.9% | |
Akamai Technologies, Inc.
0.375%, due 9/1/27 (b) | | | 7,080,000 | | | | 7,714,906 | |
Atlassian, Inc.
0.625%, due 5/1/23 | | | 5,325,000 | | | | 11,860,577 | |
Coupa Software, Inc.
0.125%, due 6/15/25 | | | 3,509,000 | | | | 6,396,193 | |
Datadog, Inc.
0.125%, due 6/15/25 (b) | | | 4,595,000 | | | | 5,447,617 | |
Envestnet, Inc.
1.75%, due 6/1/23 | | | 7,583,000 | | | | 9,365,910 | |
Everbridge, Inc.
0.125%, due 12/15/24 (b) | | | 3,415,000 | | | | 4,649,018 | |
Five9, Inc.
0.50%, due 6/1/25 (b) | | | 2,865,000 | | | | 3,081,666 | |
J2 Global, Inc.
1.75%, due 11/1/26 (b) | | | 3,285,000 | | | | 2,779,084 | |
MongoDB, Inc.
0.25%, due 1/15/26 (b) | | | 4,445,000 | | | | 5,618,500 | |
NICE Systems, Inc.
1.25%, due 1/15/24 | | | 12,416,000 | | | | 28,428,828 | |
Nuance Communications, Inc.
1.25%, due 4/1/25 | | | 8,331,000 | | | | 11,657,211 | |
RingCentral, Inc.
(zero coupon), due 3/1/25 (b) | | | 16,999,000 | | | | 18,285,670 | |
| | | | | | | | |
| | | Principal
Amount | | | Value | |
Software (continued) | |
ServiceNow, Inc.
(zero coupon), due 6/1/22 | | $ | 4,071,000 | | | $ | 12,206,789 | |
Splunk, Inc.
0.50%, due 9/15/23 | | | 10,919,000 | | | | 15,764,039 | |
Twilio, Inc.
0.25%, due 6/1/23 | | | 2,263,000 | | | | 7,032,887 | |
Workday, Inc.
0.25%, due 10/1/22 | | | 5,605,000 | | | | 7,732,021 | |
Zynga, Inc.
0.25%, due 6/1/24 | | | 6,772,000 | | | | 8,784,855 | |
| | | | | | | | |
| | | | | | | 166,805,771 | |
| | | | | | | | |
|
Telecommunications 2.5% | |
Infinera Corp.
2.50%, due 3/1/27 (b) | | | 4,490,000 | | | | 4,411,674 | |
InterDigital, Inc.
2.00%, due 6/1/24 (b) | | | 2,860,000 | | | | 2,843,841 | |
Viavi Solutions, Inc.
1.00%, due 3/1/24 | | | 9,569,000 | | | | 11,036,977 | |
Vonage Holdings Corp.
1.75%, due 6/1/24 | | | 5,148,000 | | | | 4,827,484 | |
| | | | | | | | |
| | | | | | | 23,119,976 | |
| | | | | | | | |
|
Transportation 0.9% | |
Atlas Air Worldwide Holdings, Inc.
2.25%, due 6/1/22 | | | 9,024,000 | | | | 8,613,839 | |
| | | | | | | | |
Total Convertible Bonds
(Cost $731,978,958) | | | | 850,153,624 | |
| | | | | |
| | |
| | | | | | | | |
| | |
| | | Shares | | | | |
| Convertible Preferred Stocks 6.6% | |
Banks 2.4% | |
Bank of America Corp.
Series L
7.25% | | | 8,636 | | | | 11,591,239 | |
Wells Fargo & Co.
Series L
7.50% | | | 8,264 | | | | 10,718,408 | |
| | | | | | | | |
| | | | | | | 22,309,647 | |
| | | | | | | | |
|
Chemicals 0.4% | |
Lyondellbasell Advanced Polymers, Inc.
6.00% | | | 4,110 | | | | 4,183,980 | |
| | | | | | | | |
|
Electric Utilities 0.7% | |
PG&E Corp.
5.50% | | | 68,000 | | | | 6,528,000 | |
| | | | | | | | |
| | | | |
| 12 | | MainStay VP MacKay Convertible Portfolio | | The notes to the financial statements are an integral part of,
and should be read in conjunction with, the financial statements. |
| | | | | | | | |
| | |
| | | Shares | | | Value | |
| Convertible Preferred Stocks (continued) | |
Equity Real Estate Investment Trusts 1.0% | |
Crown Castle International Corp.
6.875% | | | 5,982 | | | $ | 8,885,005 | |
| | | | | | | | |
|
Health Care Equipment & Supplies 0.3% | |
Becton Dickinson & Co.
6.00% | | | 50,000 | | | | 2,660,000 | |
| | | | | | | | |
|
Machinery 1.1% | |
Stanley Black & Decker, Inc.
5.25% | | | 115,000 | | | | 10,290,200 | |
| | | | | | | | |
|
Semiconductors & Semiconductor Equipment 0.7% | |
Broadcom, Inc.
8.00% | | | 6,025 | | | | 6,713,959 | |
| | | | | | | | |
Total Convertible Preferred Stocks
(Cost $57,964,080) | | | | 61,570,791 | |
| | | | | |
Total Convertible Securities
(Cost $789,943,038) | | | | 911,724,415 | |
| | | | | |
|
| Common Stocks 0.7% | |
Banks 0.7% | |
Bank of America Corp. | | | 267,678 | | | | 6,357,351 | |
| | | | | | | | |
Energy Equipment & Services 0.0% ‡ | |
Weatherford International PLC (c) | | | 157,538 | | | | 310,350 | |
| | | | | | | | |
Total Common Stocks
(Cost $7,568,418) | | | | 6,667,701 | |
| | | | | |
| | | | | | | | |
| | |
| | | Shares | | | Value | |
| Short-Term Investments 3.1% | |
Affiliated Investment Company 1.4% | |
MainStay U.S. Government Liquidity Fund, 0.05% (d) | | | 12,966,989 | | | $ | 12,966,989 | |
| | | | | | | | |
|
Unaffiliated Investment Company 1.7% | |
State Street Navigator Securities Lending Government Money Market Portfolio, 0.13% (d)(e) | | | 16,131,060 | | | | 16,131,060 | |
| | | | | | | | |
Total Short-Term Investments
(Cost $29,098,049) | | | | 29,098,049 | |
| | | | | |
Total Investments
(Cost $826,609,505) | | | 101.9 | % | | | 947,490,165 | |
Other Assets, Less Liabilities | | | (1.9 | ) | | | (18,057,382 | ) |
Net Assets | | | 100.0 | % | | $ | 929,432,783 | |
| † | Percentages indicated are based on Portfolio net assets. |
| ‡ | Less than one-tenth of a percent. |
| (a) | All or a portion of this security was held on loan. As of June 30, 2020, the aggregate market value of securities on loan was $29,806,706; the total market value of collateral held by the Portfolio was $30,598,577. The market value of the collateral held included non-cash collateral in the form of U.S. Treasury securities with a value of $14,467,517 (See Note 2(H)). |
| (b) | May be sold to institutional investors only under Rule 144A or securities offered pursuant to Section 4(a)(2) of the Securities Act of 1933, as amended. |
| (c) | Non-income producing security. |
| (d) | Current yield as of June 30, 2020. |
| (e) | Represents a security purchased with cash collateral received for securities on loan. |
| | | | | | |
The notes to the financial statements are an integral part of,
and should be read in conjunction with, the financial statements. | | | | | 13 | |
Portfolio of Investments June 30, 2020 (Unaudited) (continued)
The following is a summary of the fair valuations according to the inputs used as of June 30, 2020, for valuing the Portfolio’s assets:
| | | | | | | | | | | | | | | | |
Description | | Quoted
Prices in
Active
Markets
for
Identical
Assets
(Level 1) | | | Significant
Other
Observable
Inputs
(Level 2) | | | Significant
Unobservable
Inputs
(Level 3) | | | Total | |
| | | | |
Asset Valuation Inputs | | | | | | | | | | | | | | | | |
| Investments in Securities (a) | | | | | | | | | | | | | | | | |
| Convertible Securities | | | | | | | | | | | | | | | | |
Convertible Bonds | | $ | — | | | $ | 850,153,624 | | | $ | — | | | $ | 850,153,624 | |
Convertible Preferred Stocks | | | 61,570,791 | | | | — | | | | — | | | | 61,570,791 | |
| | | | | | | | | | | | | | | | |
| Total Convertible Securities | | | 61,570,791 | | | | 850,153,624 | | | | — | | | | 911,724,415 | |
| | | | | | | | | | | | | | | | |
| Common Stocks | | | 6,667,701 | | | | — | | | | — | | | | 6,667,701 | |
| Short-Term Investments | | | | | | | | | | | | | | | | |
Affiliated Investment Company | | | 12,966,989 | | | | — | | | | — | | | | 12,966,989 | |
Unaffiliated Investment Company | | | 16,131,060 | | | | — | | | | — | | | | 16,131,060 | |
| | | | | | | | | | | | | | | | |
| Total Short-Term Investments | | | 29,098,049 | | | | — | | | | — | | | | 29,098,049 | |
| | | | | | | | | | | | | | | | |
| Total Investments in Securities | | $ | 97,336,541 | | | $ | 850,153,624 | | | $ | — | | | $ | 947,490,165 | |
| | | | | | | | | | | | | | | | |
| (a) | For a complete listing of investments and their industries, see the Portfolio of Investments. |
| | | | |
| 14 | | MainStay VP MacKay Convertible Portfolio | | The notes to the financial statements are an integral part of,
and should be read in conjunction with, the financial statements. |
Statement of Assets and Liabilities as of June 30, 2020 (Unaudited)
| | | | |
| Assets | | | | |
Investment in unaffiliated securities, at value (identified cost $813,642,516) including securities on loan of $29,806,706 | | $ | 934,523,176 | |
Investment in affiliated investment company, at value (identified cost $12,966,989) | | | 12,966,989 | |
Receivables: | | | | |
Investment securities sold | | | 3,719,513 | |
Dividends and interest | | | 2,236,303 | |
Portfolio shares sold | | | 423,207 | |
Securities lending | | | 6,809 | |
Other assets | | | 4,713 | |
| | | | |
Total assets | | | 953,880,710 | |
| | | | |
| |
| Liabilities | | | | |
Cash collateral received for securities on loan | | | 16,131,060 | |
Payables: | | | | |
Investment securities purchased | | | 6,810,200 | |
Portfolio shares redeemed | | | 821,513 | |
Manager (See Note 3) | | | 435,244 | |
NYLIFE Distributors (See Note 3) | | | 157,350 | |
Shareholder communication | | | 38,794 | |
Professional fees | | | 33,227 | |
Custodian | | | 8,834 | |
Trustees | | | 1,118 | |
Accrued expenses | | | 10,587 | |
| | | | |
Total liabilities | | | 24,447,927 | |
| | | | |
Net assets | | $ | 929,432,783 | |
| | | | |
| |
| Composition of Net Assets | | | | |
Shares of beneficial interest outstanding (par value of $.001 per share) unlimited number of shares authorized | | $ | 65,079 | |
Additional paid-in capital | | | 735,238,222 | |
| | | | |
| | | 735,303,301 | |
Total distributable earnings (loss) | | | 194,129,482 | |
| | | | |
Net assets | | $ | 929,432,783 | |
| | | | |
| | | | |
Initial Class | | | | |
Net assets applicable to outstanding shares | | $ | 151,983,101 | |
| | | | |
Shares of beneficial interest outstanding | | | 10,556,015 | |
| | | | |
Net asset value per share outstanding | | $ | 14.40 | |
| | | | |
Service Class | | | | |
Net assets applicable to outstanding shares | | $ | 769,867,160 | |
| | | | |
Shares of beneficial interest outstanding | | | 53,991,374 | |
| | | | |
Net asset value per share outstanding | | $ | 14.26 | |
| | | | |
Service 2 Class | | | | |
Net assets applicable to outstanding shares | | $ | 7,582,522 | |
| | | | |
Shares of beneficial interest outstanding | | | 531,753 | |
| | | | |
Net asset value and offering price per share outstanding | | $ | 14.26 | |
| | | | |
| | | | | | |
The notes to the financial statements are an integral part of,
and should be read in conjunction with, the financial statements. | | | | | 15 | |
Statement of Operations for the six months ended June 30, 2020 (Unaudited)
| | | | |
| Investment Income (Loss) | | | | |
Income | | | | |
Interest | | $ | 4,349,974 | |
Dividends-unaffiliated | | | 1,886,679 | |
Dividends-affiliated | | | 169,124 | |
Securities lending | | | 119,467 | |
| | | | |
Total income | | | 6,525,244 | |
| | | | |
Expenses | | | | |
Manager (See Note 3) | | | 2,603,174 | |
Distribution/Service—Service Class (See Note 3) | | | 899,006 | |
Distribution/Service—Service 2 Class (See Note 3) | | | 9,285 | |
Professional fees | | | 66,435 | |
Shareholder communication | | | 42,809 | |
Custodian | | | 16,872 | |
Trustees | | | 11,198 | |
Miscellaneous | | | 18,277 | |
| | | | |
Total expenses | | | 3,667,056 | |
| | | | |
Net investment income (loss) | | | 2,858,188 | |
| | | | |
|
| Realized and Unrealized Gain (Loss) on Investments | |
Net realized gain (loss) on unaffiliated investments | | | 73,762,091 | |
Net change in unrealized appreciation (depreciation) on unaffiliated investments | | | (29,076,636 | ) |
| | | | |
Net realized and unrealized gain (loss) on investments | | | 44,685,455 | |
| | | | |
Net increase (decrease) in net assets resulting from operations | | $ | 47,543,643 | |
| | | | |
| | | | |
| 16 | | MainStay VP MacKay Convertible Portfolio | | The notes to the financial statements are an integral part of,
and should be read in conjunction with, the financial statements. |
Statements of Changes in Net Assets
for the six months ended June 30, 2020 (Unaudited) and the year ended December 31, 2019
| | | | | | | | |
| | | 2020 | | | 2019 | |
| Increase (Decrease) in Net Assets | | | | | |
Operations: | | | | | | | | |
Net investment income (loss) | | $ | 2,858,188 | | | $ | 6,608,388 | |
Net realized gain (loss) on investments | | | 73,762,091 | | | | 34,946,367 | |
Net change in unrealized appreciation (depreciation) on investments | | | (29,076,636 | ) | | | 131,357,026 | |
| | | | |
Net increase (decrease) in net assets resulting from operations | | | 47,543,643 | | | | 172,911,781 | |
| | | | |
Distributions to shareholders: | | | | | | | | |
Initial Class | | | (846,190 | ) | | | (19,421,628 | ) |
Service Class | | | (2,659,470 | ) | | | (70,027,704 | ) |
Service 2 Class | | | (16,334 | ) | | | (608,113 | ) |
| | | | |
Total distributions to shareholders | | | (3,521,994 | ) | | | (90,057,445 | ) |
| | | | |
Capital share transactions: | | | | | | | | |
Net proceeds from sale of shares | | | 77,127,900 | | | | 127,439,644 | |
Net asset value of shares issued to shareholders in reinvestment of distributions | | | 3,521,994 | | | | 90,057,445 | |
Cost of shares redeemed | | | (156,567,361 | ) | | | (111,848,379 | ) |
| | | | |
Increase (decrease) in net assets derived from capital share transactions | | | (75,917,467 | ) | | | 105,648,710 | |
| | | | |
Net increase (decrease) in net assets | | | (31,895,818 | ) | | | 188,503,046 | |
| | |
| Net Assets | | | | | | | | |
Beginning of period | | | 961,328,601 | | | | 772,825,555 | |
| | | | |
End of period | | $ | 929,432,783 | | | $ | 961,328,601 | |
| | | | |
| | | | | | |
The notes to the financial statements are an integral part of,
and should be read in conjunction with, the financial statements. | | | | | 17 | |
Financial Highlights selected per share data and ratios
| | | | | | | | | | | | | | | | | | | | | | | | |
| | |
| | | Six months
ended June 30, | | | Year ended December 31, | |
| | | | | | |
| Initial Class | | 2020* | | | 2019 | | | 2018 | | | 2017 | | | 2016 | | | 2015 | |
| | | | | | |
Net asset value at beginning of period | | $ | 13.60 | | | $ | 12.31 | | | $ | 13.29 | | | $ | 12.28 | | | $ | 11.86 | | | $ | 13.41 | |
| | | | | | | | | | | | | | | | | | | | | | | | |
| | | | | | |
Net investment income (loss) (a) | | | 0.05 | | | | 0.13 | | | | 0.17 | | | | 0.18 | | | | 0.19 | | | | 0.14 | |
| | | | | | |
Net realized and unrealized gain (loss) on investments | | | 0.82 | | | | 2.56 | | | | (0.41 | ) | | | 1.28 | | | | 1.18 | | | | (0.32 | ) |
| | | | | | | | | | | | | | | | | | | | | | | | |
| | | | | | |
Total from investment operations | | | 0.87 | | | | 2.69 | | | | (0.24 | ) | | | 1.46 | | | | 1.37 | | | | (0.18 | ) |
| | | | | | | | | | | | | | | | | | | | | | | | |
| | | | | | |
| Less distributions: | | | | | | | | | | | | | | | | | | | | | | | | |
| | | | | | |
From net investment income | | | (0.07 | ) | | | (0.20 | ) | | | (0.23 | ) | | | (0.23 | ) | | | (0.47 | ) | | | (0.36 | ) |
| | | | | | |
From net realized gain on investments | | | — | | | | (1.20 | ) | | | (0.51 | ) | | | (0.22 | ) | | | (0.48 | ) | | | (1.01 | ) |
| | | | | | | | | | | | | | | | | | | | | | | | |
| | | | | | |
Total distributions | | | (0.07 | ) | | | (1.40 | ) | | | (0.74 | ) | | | (0.45 | ) | | | (0.95 | ) | | | (1.37 | ) |
| | | | | | | | | | | | | | | | | | | | | | | | |
| | | | | | |
Net asset value at end of period | | $ | 14.40 | | | $ | 13.60 | | | $ | 12.31 | | | $ | 13.29 | | | $ | 12.28 | | | $ | 11.86 | |
| | | | | | | | | | | | | | | | | | | | | | | | |
| | | | | | |
Total investment return (b) | | | 6.41 | % | | | 22.46 | % | | | (2.27 | %) | | | 11.99 | % | | | 12.07 | % | | | (1.33 | %) |
| | | | | | |
| Ratios (to average net assets)/Supplemental Data: | | | | | | | | | | | | | | | | | | | | | | | | |
| | | | | | |
Net investment income (loss) | | | 0.83 | % †† | | | 0.94 | % | | | 1.24 | % | | | 1.40 | % | | | 1.59 | % | | | 1.08 | % |
| | | | | | |
Net expenses (c) | | | 0.61 | % †† | | | 0.61 | % | | | 0.61 | % | | | 0.62 | % | | | 0.64 | % | | | 0.62 | % |
| | | | | | |
Portfolio turnover rate | | | 31 | % | | | 26 | % | | | 43 | % | | | 34 | % | | | 39 | % | | | 58 | % |
| | | | | | |
Net assets at end of period (in 000’s) | | $ | 151,983 | | | $ | 202,104 | | | $ | 177,136 | | | $ | 227,285 | | | $ | 162,462 | | | $ | 142,942 | |
| (a) | Per share data based on average shares outstanding during the period. |
| (b) | Total return does not reflect any deduction of sales charges, mortality and expense charges, contract charges or administrative charges. For periods of less than one year, total return is not annualized. |
| (c) | In addition to the fees and expenses which the Portfolio bears directly, it also indirectly bears a pro-rata share of the fees and expenses of the underlying funds in which it invests. Such indirect expenses are not included in the above expense ratios. |
| | | | |
| 18 | | MainStay VP MacKay Convertible Portfolio | | The notes to the financial statements are an integral part of,
and should be read in conjunction with, the financial statements. |
Financial Highlights selected per share data and ratios
| | | | | | | | | | | | | | | | | | | | | | | | |
| | |
| | | Six months
ended
June 30, | | | Year ended December 31, | |
| | | | | | |
| Service Class | | 2020* | | | 2019 | | | 2018 | | | 2017 | | | 2016 | | | 2015 | |
| | | | | | |
Net asset value at beginning of period | | $ | 13.47 | | | $ | 12.21 | | | $ | 13.18 | | | $ | 12.18 | | | $ | 11.77 | | | $ | 13.32 | |
| | | | | | | | | | | | | | | | | | | | | | | | |
| | | | | | |
Net investment income (loss) (a) | | | 0.04 | | | | 0.09 | | | | 0.13 | | | | 0.15 | | | | 0.16 | | | | 0.11 | |
| | | | | | |
Net realized and unrealized gain (loss) on investments | | | 0.80 | | | | 2.53 | | | | (0.40 | ) | | | 1.26 | | | | 1.17 | | | | (0.32 | ) |
| | | | | | | | | | | | | | | | | | | | | | | | |
| | | | | | |
Total from investment operations | | | 0.84 | | | | 2.62 | | | | (0.27 | ) | | | 1.41 | | | | 1.33 | | | | (0.21 | ) |
| | | | | | | | | | | | | | | | | | | | | | | | |
| | | | | | |
| Less distributions: | | | | | | | | | | | | | | | | | | | | | | | | |
| | | | | | |
From net investment income | | | (0.05 | ) | | | (0.16 | ) | | | (0.19 | ) | | | (0.19 | ) | | | (0.44 | ) | | | (0.33 | ) |
| | | | | | |
From net realized gain on investments | | | — | | | | (1.20 | ) | | | (0.51 | ) | | | (0.22 | ) | | | (0.48 | ) | | | (1.01 | ) |
| | | | | | | | | | | | | | | | | | | | | | | | |
| | | | | | |
Total distributions | | | (0.05 | ) | | | (1.36 | ) | | | (0.70 | ) | | | (0.41 | ) | | | (0.92 | ) | | | (1.34 | ) |
| | | | | | | | | | | | | | | | | | | | | | | | |
| | | | | | |
Net asset value at end of period | | $ | 14.26 | | | $ | 13.47 | | | $ | 12.21 | | | $ | 13.18 | | | $ | 12.18 | | | $ | 11.77 | |
| | | | | | | | | | | | | | | | | | | | | | | | |
| | | | | | |
Total investment return (b) | | | 6.28 | % | | | 22.15 | % | | | (2.52 | %) | | | 11.72 | % | | | 11.79 | % | | | (1.57 | %) |
| | | | | | |
| Ratios (to average net assets)/Supplemental Data: | | | | | | | | | | | | | | | | | | | | | | | | |
| | | | | | |
Net investment income (loss) | | | 0.59 | % †† | | | 0.69 | % | | | 0.99 | % | | | 1.15 | % | | | 1.35 | % | | | 0.84 | % |
| | | | | | |
Net expenses (c) | | | 0.86 | % †† | | | 0.86 | % | | | 0.86 | % | | | 0.87 | % | | | 0.89 | % | | | 0.87 | % |
| | | | | | |
Portfolio turnover rate | | | 31 | % | | | 26 | % | | | 43 | % | | | 34 | % | | | 39 | % | | | 58 | % |
| | | | | | |
Net assets at end of period (in 000’s) | | $ | 769,867 | | | $ | 752,670 | | | $ | 592,673 | | | $ | 565,974 | | | $ | 476,926 | | | $ | 460,883 | |
| (a) | Per share data based on average shares outstanding during the period. |
| (b) | Total return does not reflect any deduction of sales charges, mortality and expense charges, contract charges or administrative charges. For periods of less than one year, total return is not annualized. |
| (c) | In addition to the fees and expenses which the Portfolio bears directly, it also indirectly bears a pro-rata share of the fees and expenses of the underlying funds in which it invests. Such indirect expenses are not included in the above expense ratios. |
| | | | | | |
The notes to the financial statements are an integral part of,
and should be read in conjunction with, the financial statements. | | | | | 19 | |
Financial Highlights selected per share data and ratios
| | | | | | | | | | | | | | | | | | | | |
| | | |
| | | Six months
ended
June 30, | | | Year ended December 31, | | | April 26,
2016^
through
December 31, | |
| | | | | |
| Service 2 Class | | 2020* | | | 2019 | | | 2018 | | | 2017 | | | 2016 | |
| | | | | |
Net asset value at beginning of period | | $ | 13.47 | | | $ | 12.21 | | | $ | 13.18 | | | $ | 12.18 | | | $ | 11.63 | |
| | | | | | | | | | | | | | | | | | | | |
| | | | | |
Net investment income (loss) (a) | | | 0.03 | | | | 0.08 | | | | 0.12 | | | | 0.14 | | | | 0.11 | |
| | | | | |
Net realized and unrealized gain (loss) on investments | | | 0.80 | | | | 2.53 | | | | (0.40 | ) | | | 1.26 | | | | 1.04 | |
| | | | | | | | | | | | | | | | | | | | |
| | | | | |
Total from investment operations | | | 0.83 | | | | 2.61 | | | | (0.28 | ) | | | 1.40 | | | | 1.15 | |
| | | | | | | | | | | | | | | | | | | | |
| | | | | |
| Less distributions: | | | | | | | | | | | | | | | | | | | | |
| | | | | |
From net investment income | | | (0.04 | ) | | | (0.15 | ) | | | (0.18 | ) | | | (0.18 | ) | | | (0.12 | ) |
| | | | | |
From net realized gain on investments | | | — | | | | (1.20 | ) | | | (0.51 | ) | | | (0.22 | ) | | | (0.48 | ) |
| | | | | | | | | | | | | | | | | | | | |
| | | | | |
Total distributions | | | (0.04 | ) | | | (1.35 | ) | | | (0.69 | ) | | | (0.40 | ) | | | (0.60 | ) |
| | | | | | | | | | | | | | | | | | | | |
| | | | | |
Net asset value at end of period | | $ | 14.26 | | | $ | 13.47 | | | $ | 12.21 | | | $ | 13.18 | | | $ | 12.18 | |
| | | | | | | | | | | | | | | | | | | | |
| | | | | |
Total investment return (b) | | | 6.22 | % | | | 22.03 | % | | | (2.59 | %) | | | 11.60 | % | | | 10.01 | % |
| | | | | |
| Ratios (to average net assets)/Supplemental Data: | | | | | | | | | | | | | | | | | | | | |
| | | | | |
Net investment income (loss) | | | 0.48 | %†† | | | 0.56 | % | | | 0.88 | % | | | 1.05 | % | | | 1.33 | %†† |
| | | | | |
Net expenses (c) | | | 0.96 | %†† | | | 0.96 | % | | | 0.96 | % | | | 0.97 | % | | | 1.00 | %†† |
| | | | | |
Portfolio turnover rate | | | 31 | % | | | 26 | % | | | 43 | % | | | 34 | % | | | 39 | % |
| | | | | |
Net assets at end of period (in 000’s) | | $ | 7,583 | | | $ | 6,555 | | | $ | 3,016 | | | $ | 2,179 | | | $ | 797 | |
| (a) | Per share data based on average shares outstanding during the period. |
| (b) | Total return does not reflect any deduction of sales charges, mortality and expense charges, contract charges or administrative charges. For periods of less than one year, total return is not annualized. |
| (c) | In addition to the fees and expenses which the Portfolio bears directly, it also indirectly bears a pro-rata share of the fees and expenses of the underlying funds in which it invests. Such indirect expenses are not included in the above expense ratios. |
| | | | |
| 20 | | MainStay VP MacKay Convertible Portfolio | | The notes to the financial statements are an integral part of,
and should be read in conjunction with, the financial statements. |
Notes to Financial Statements (Unaudited)
Note 1–Organization and Business
MainStay VP Funds Trust (the ‘‘Fund’’) was organized as a Delaware statutory trust on February 1, 2011. The Fund is registered under the Investment Company Act of 1940, as amended (the “1940 Act”), as an open-end management investment company. The Fund is comprised of thirty-one separate series (collectively referred to as the “Portfolios”). These financial statements and notes relate to the MainStay VP MacKay Convertible Portfolio (the “Portfolio”), a “diversified” portfolio, as that term is defined in the 1940 Act, as interpreted or modified by regulatory authorities having jurisdiction, from time to time.
Shares of the Portfolio are currently offered to certain separate accounts to fund variable annuity policies and variable universal life insurance policies issued by New York Life Insurance and Annuity Corporation (“NYLIAC”), a wholly-owned subsidiary of New York Life Insurance Company (“New York Life”) and may also be offered to fund variable annuity policies and variable universal life insurance policies issued by other insurance companies. NYLIAC allocates shares of the Portfolios to, among others, certain NYLIAC separate accounts. Service 2 Class shares of the Portfolio are currently offered to certain separate accounts to fund variable annuity policies and variable universal life insurance policies issued by participating insurance companies. Shares of the Portfolio are also offered to the MainStay VP Conservative Allocation Portfolio, MainStay VP Moderate Allocation Portfolio, MainStay VP Moderate Growth Allocation Portfolio and MainStay VP Growth Allocation Portfolio, which operate as “funds-of-funds,” and other variable insurance funds.
The Portfolio currently offers three classes of shares. Initial Class shares commenced operations on October 1, 1996. Service Class shares commenced operations on June 5, 2003. Service 2 Class shares commenced operations on April 26, 2016. Shares of the Portfolio are offered and are redeemed at a price equal to their respective net asset value (“NAV”) per share. No sales or redemption charge is applicable to the purchase or redemption of the Portfolio’s shares. Under the terms of the Fund’s multiple class plan adopted pursuant to Rule 18f-3 under the 1940 Act, the classes differ in that, among other things, Service Class and Service 2 Class shares of the Portfolio pay a combined distribution and service fee of 0.25% of average daily net assets attributable to Service Class and Service 2 Class shares of the Portfolio to the Distributor (as defined in Note 3(B)) pursuant to a plan adopted in accordance with Rule 12b-1 under the 1940 Act. Contract owners of variable annuity contracts purchased after June 2, 2003, are permitted to invest only in the Service Class and Service 2 Class shares.
The Portfolio’s investment objective is to seek capital appreciation together with current income.
Note 2–Significant Accounting Policies
The Portfolio is an investment company and accordingly follows the investment company accounting and reporting guidance of the Financial Accounting Standards Board (“FASB”) Accounting Standard Codification Topic 946 Financial Services—Investment Companies. The Portfolio prepares its financial statements in accordance with generally accepted accounting principles (“GAAP”) in the United States of America and follows the significant accounting policies described below.
(A) Securities Valuation. Investments are usually valued as of the close of regular trading on the New York Stock Exchange (the “Exchange”) (usually 4:00 p.m. Eastern time) on each day the Portfolio is open for business (“valuation date”).
The Board of Trustees of the Fund (the “Board”) adopted procedures establishing methodologies for the valuation of the Portfolio’s securities and other assets and delegated the responsibility for valuation determinations under those procedures to the Valuation Committee of the Fund (the “Valuation Committee”). The procedures state that, subject to the oversight of the Board and unless otherwise noted, the responsibility for the day-to-day valuation of portfolio assets (including fair value measurements for the Portfolio’s assets and liabilities) rests with New York Life Investment Management LLC (“New York Life Investments” or the “Manager”), aided to whatever extent necessary by the Subadvisor (as defined in Note 3(A)). To assess the appropriateness of security valuations, the Manager, the Subadvisor or the Portfolio’s third-party service provider, who is subject to oversight by the Manager, regularly compares prior day prices, prices on comparable securities and the sale prices to the prior and current day prices and challenges prices with changes exceeding certain tolerance levels with third-party pricing services or broker sources.
The Board authorized the Valuation Committee to appoint a Valuation Subcommittee (the “Subcommittee”) to establish the prices of securities for which market quotations are not readily available or the prices of which are not otherwise readily determinable under the procedures. The Subcommittee meets (in person, via electronic mail or via teleconference) on an as-needed basis. The Valuation Committee meets to ensure that actions taken by the Subcommittee were appropriate.
For those securities valued through either a standardized fair valuation methodology or a fair valuation measurement, the Subcommittee deals with such valuation and the Valuation Committee reviews and affirms, if appropriate, the reasonableness of the valuation based on such methodologies and measurements on a regular basis after considering information that is reasonably available and deemed relevant by the Valuation Committee. Any action taken by the Subcommittee with respect to the valuation of a portfolio security or other asset is submitted for review and ratification (if appropriate) to the Valuation Committee and the Board at the next regularly scheduled meeting.
“Fair value” is defined as the price the Portfolio would reasonably expect to receive upon selling an asset or liability in an orderly transaction to an independent buyer in the principal or most advantageous market for the asset or liability. Fair value measurements are determined within a framework that establishes a three-tier hierarchy that maximizes the use of observable market data and minimizes the use of unobservable inputs to establish a classification of fair value measurements for disclosure purposes. “Inputs” refer broadly to the assumptions that market participants would use in pricing the asset or liability, including assumptions about risk, such as the risk inherent in a particular valuation technique used to measure fair value using a pricing model and/or the risk inherent in the inputs for the valuation technique. Inputs may be observable or unobservable. Observable inputs reflect the assumptions market participants would use in pricing the asset or liability based on market data obtained from sources independent of the Portfolio. Unobservable inputs reflect the Portfolio’s own assumptions about the assumptions market participants would use in pricing the asset or
Notes to Financial Statements (Unaudited) (continued)
liability based on the information available. The inputs or methodology used for valuing assets or liabilities may not be an indication of the risks associated with investing in those assets or liabilities. The three-tier hierarchy of inputs is summarized below.
| • | | Level 1—quoted prices in active markets for an identical asset or liability |
| • | | Level 2—other significant observable inputs (including quoted prices for a similar asset or liability in active markets, interest rates and yield curves, prepayment speeds, credit risk, etc.) |
| • | | Level 3—significant unobservable inputs (including the Portfolio’s own assumptions about the assumptions that market participants would use in measuring fair value of an asset or liability) |
The level of an asset or liability within the fair value hierarchy is based on the lowest level of an input, both individually and in the aggregate, that is significant to the fair value measurement. The aggregate value by input level of the Portfolio’s assets and liabilities as of June 30, 2020 is included at the end of the Portfolio of Investments.
The Portfolio may use third-party vendor evaluations, whose prices may be derived from one or more of the following standard inputs, among others:
| | |
• Benchmark yields | | • Reported trades |
• Broker/dealer quotes | | • Issuer spreads |
• Two-sided markets | | • Benchmark securities |
• Bids/offers | | • Reference data (corporate actions or material event notices) |
• Industry and economic events | | • Comparable bonds |
• Monthly payment information | | |
An asset or liability for which market values cannot be measured using the methodologies described above is valued by methods deemed reasonable in good faith by the Valuation Committee, following the procedures established by the Board, to represent fair value. Under these procedures, the Portfolio generally uses a market-based approach which may use related or comparable assets or liabilities, recent transactions, market multiples, book values and other relevant information. The Portfolio may also use an income-based valuation approach in which the anticipated future cash flows of the asset or liability are discounted to calculate fair value. Discounts may also be applied due to the nature and/or duration of any restrictions on the disposition of the asset or liability. Fair value represents a good faith approximation of the value of a security. Fair value determinations involve the consideration of a number of subjective factors, an analysis of applicable facts and circumstances and the exercise of judgment. As a result, it is possible that the fair value for a security determined in good faith in accordance with the Portfolio’s valuation procedures may differ from valuations for the same security determined by other funds using their own valuation procedures. Although the Portfolio’s valuation procedures are designed to value a security at the price the Portfolio may reasonably expect to receive upon the security’s sale in an orderly transaction, there can be no assurance that any fair value determination thereunder would, in fact, approximate the amount that the Portfolio would actually realize upon the sale of the security or the price at which the security would trade if a reliable market price were readily available. During the
six-month period ended June 30, 2020, there were no material changes to the fair value methodologies.
Securities which may be valued in this manner include, but are not limited to: (i) a security for which trading has been halted or suspended; (ii) a debt security that has recently gone into default and for which there is not a current market quotation; (iii) a security of an issuer that has entered into a restructuring; (iv) a security that has been delisted from a national exchange; (v) a security for which the market price is not readily available from a third-party pricing source or, if so provided, does not, in the opinion of the Manager or the Subadvisor, reflect the security’s market value; (vi) a security subject to trading collars for which no or limited trading takes place; and (vii) a security whose principal market has been temporarily closed at a time when, under normal conditions, it would be open. Securities valued in this manner are generally categorized as Level 3 in the hierarchy. As of June 30, 2020, no securities held by the Portfolio were fair valued in such a manner.
Equity securities are valued at the last quoted sales prices as of the close of regular trading on the relevant exchange on each valuation date. Securities that are not traded on the valuation date are valued at the mean of the last quoted bid and ask prices. Prices are normally taken from the principal market in which each security trades. These securities are generally categorized as Level 1 in the hierarchy.
Investments in mutual funds, including money market funds, are valued at their respective NAVs as of the close of the Exchange on the valuation date. These securities are generally categorized as Level 1 in the hierarchy.
Debt securities (other than convertible and municipal bonds) are valued at the evaluated bid prices (evaluated mean prices in the case of convertible and municipal bonds) supplied by a pricing agent or broker selected by the Manager, in consultation with the Subadvisor. The evaluations are market-based measurements processed through a pricing application and represents the pricing agent’s good faith determination as to what a holder may receive in an orderly transaction under market conditions. The rules based logic utilizes valuation techniques that reflect participants’ assumptions and vary by asset class and per methodology, maximizing the use of relevant observable data including quoted prices for similar assets, benchmark yield curves and market corroborated inputs. The evaluated bid or mean prices are deemed by the Manager, in consultation with the Subadvisor, to be representative of market values at the regular close of trading of the Exchange on each valuation date. Debt securities purchased on a delayed delivery basis are marked to market daily until settlement at the forward settlement date. Debt securities, including corporate bonds, U.S. government and federal agency bonds, municipal bonds, foreign bonds, convertible bonds, asset-backed securities and mortgage-backed securities are generally categorized as Level 2 in the hierarchy.
Temporary cash investments acquired in excess of 60 days to maturity at the time of purchase are valued using the latest bid prices or using valuations based on a matrix system (which considers such factors as security prices, yields, maturities and ratings), both as furnished by independent pricing services. Temporary cash investments that mature in 60 days or less at the time of purchase (“Short-Term Investments”) are valued using the amortized cost method of valuation, unless the use of such method would be inappropriate. The amortized cost method
| | |
| 22 | | MainStay VP MacKay Convertible Portfolio |
involves valuing a security at its cost on the date of purchase and thereafter assuming a constant amortization to maturity of the difference between such cost and the value on maturity date. Amortized cost approximates the current fair value of a security. Securities valued using the amortized cost method are not valued using quoted prices in an active market and are generally categorized as Level 2 in the hierarchy.
The information above is not intended to reflect an exhaustive list of the methodologies that may be used to value portfolio investments. The valuation procedures permit the use of a variety of valuation methodologies in connection with valuing portfolio investments. The methodology used for a specific type of investment may vary based on the market data available or other considerations. The methodologies summarized above may not represent the specific means by which portfolio investments are valued on any particular business day.
(B) Income Taxes. The Portfolio’s policy is to comply with the requirements of the Internal Revenue Code of 1986, as amended (the “Internal Revenue Code”), applicable to regulated investment companies and to distribute all of its taxable income to the shareholders of the Portfolio within the allowable time limits.
The Manager evaluates the Portfolio’s tax positions to determine if the tax positions taken meet the minimum recognition threshold in connection with accounting for uncertainties in income tax positions taken or expected to be taken for the purposes of measuring and recognizing tax liabilities in the financial statements. Recognition of tax benefits of an uncertain tax position is permitted only to the extent the position is “more likely than not” to be sustained assuming examination by taxing authorities. The Manager analyzed the Portfolio’s tax positions taken on federal, state and local income tax returns for all open tax years (for up to three tax years) and has concluded that no provisions for federal, state and local income tax are required in the Portfolio’s financial statements. The Portfolio’s federal, state and local income tax and federal excise tax returns for tax years for which the applicable statutes of limitations have not expired are subject to examination by the Internal Revenue Service and state and local departments of revenue.
(C) Dividends and Distributions to Shareholders. Dividends and distributions are recorded on the ex-dividend date. The Portfolio intends to declare and pay dividends from net investment income, if any, at least quarterly and distributions from net realized capital and currency gains, if any, at least annually. Unless a shareholder elects otherwise, all dividends and distributions are reinvested at NAV in the same class of shares of the Portfolio. Dividends and distributions to shareholders are determined in accordance with federal income tax regulations and may differ from determinations using GAAP.
(D) Security Transactions and Investment Income. The Portfolio records security transactions on the trade date. Realized gains and losses on security transactions are determined using the identified cost method. Dividend income is recognized on the ex-dividend date, net of any foreign tax withheld at the source, and interest income is accrued as earned using the effective interest rate method. Distributions received from real estate investment trusts may be classified as dividends, capital gains and/or return of capital. Discounts and premiums on securities purchased for the Portfolio are accreted and amortized, respectively, on the effective interest rate method.
Investment income and realized and unrealized gains and losses on investments of the Portfolio are allocated pro rata to the separate classes of shares based upon their relative net assets on the date the income is earned or realized and unrealized gains and losses are incurred.
The Portfolio may place a debt security on non-accrual status and reduce related interest income by ceasing current accruals and writing off all or a portion of any interest receivables when the collection of all or a portion of such interest has become doubtful. A debt security is removed from non-accrual status when the issuer resumes interest payments or when collectability of interest is reasonably assured.
(E) Expenses. Expenses of the Fund are allocated to the individual Portfolios in proportion to the net assets of the respective Portfolios when the expenses are incurred, except where direct allocations of expenses can be made. Expenses (other than fees incurred under the distribution and service plans and shareholder service plans, further discussed in Note 3(B), which are charged directly to the Service Class shares and Service 2 Class shares, as applicable) are allocated to separate classes of shares pro rata based upon their relative net assets on the date the expenses are incurred. The expenses borne by the Portfolio, including those of related parties to the Portfolio, are shown in the Statement of Operations.
Additionally, the Portfolio may invest in mutual funds, which are subject to management fees and other fees that may cause the costs of investing in mutual funds to be greater than the costs of owning the underlying securities directly. These indirect expenses of mutual funds are not included in the amounts shown as expenses in the Portfolio’s Statement of Operations or in the expense ratios included in the Financial Highlights.
(F) Use of Estimates. In preparing financial statements in conformity with GAAP, the Manager makes estimates and assumptions that affect the reported amounts and disclosures in the financial statements. Actual results could differ from those estimates.
(G) Repurchase Agreements. The Portfolio may enter into repurchase agreements (i.e., buy a security from another party with the agreement that it will be sold back in the future) to earn income. The Portfolio may enter into repurchase agreements only with counterparties, usually financial institutions, that are deemed by the Manager or the Subadvisor to be creditworthy, pursuant to guidelines established by the Board. During the term of any repurchase agreement, the Manager or the Subadvisor will continue to monitor the creditworthiness of the counterparty. Under the 1940 Act, repurchase agreements are considered to be collateralized loans by the Portfolio to the counterparty secured by the securities transferred to the Portfolio.
Repurchase agreements are subject to counterparty risk, meaning the Portfolio could lose money by the counterparty’s failure to perform under the terms of the agreement. The Portfolio mitigates this risk by ensuring the repurchase agreement is collateralized by cash, U.S. government securities, fixed income securities and/or other securities. The collateral is held by the Portfolio’s custodian and valued daily on a mark to market basis to determine if the value, including accrued interest, exceeds the repurchase price. In the event of the counterparty’s default on the obligation to repurchase, the Portfolio has the right to liquidate the collateral and apply the proceeds in satisfaction of
Notes to Financial Statements (Unaudited) (continued)
the obligation. Under certain circumstances, such as in the event of default or bankruptcy by the counterparty, realization and/or retention of the collateral may be limited or subject to delay, to legal proceedings and possible realized loss to the Portfolio. As of June 30, 2020, the Portfolio did not hold any repurchase agreements.
(H) Securities Lending. In order to realize additional income, the Portfolio may engage in securities lending, subject to the limitations set forth in the 1940 Act and relevant guidance by the staff of the Securities and Exchange Commission (“SEC”). If the Portfolio engages in securities lending, the Portfolio will lend through its custodian, currently State Street Bank and Trust Company (“State Street”), acting as securities lending agent on behalf of the Portfolio. Under the current arrangement, State Street will manage the Portfolio’s collateral in accordance with the securities lending agency agreement between the Portfolio and State Street, and indemnify the Portfolio against counterparty risk. The loans will be collateralized by cash (which may be invested in a money market fund) and/or non-cash collateral (which may include U.S. Treasury securities and/or U.S. government agency securities issued or guaranteed by the United States government or its agencies or instrumentalities) at least equal at all times to the market value of the securities loaned. The Portfolio bears the risk of delay in recovery of, or loss of rights in, the securities loaned. The Portfolio may also record a realized gain or loss on securities deemed sold due to a borrower’s inability to return securities on loan. The Portfolio bears the risk of any loss on investment of cash collateral. The Portfolio will receive compensation for lending its securities in the form of fees or it will retain a portion of interest earned on the investment of any cash collateral. The Portfolio will also continue to receive interest and dividends on the securities loaned and any gain or loss in the market price of the securities loaned that may occur during the term of the loan will be for the account of the Portfolio. Income earned from securities lending activities, if any, is reflected in the Statement of Operations. As of June 30, 2020, the Portfolio had securities on loan with an aggregate market value of $29,806,706; the total market value of collateral held by the Portfolio was $30,598,577. The market value of the collateral held included non-cash collateral, in the form of U.S. Treasury securities, with a value of $14,467,517 and cash collateral, which was invested into the State Street Navigator Securities Lending Government Money Market Portfolio, with a value of $16,131,060.
(I) Debt and Convertible Securities Risk. The ability of issuers of debt securities held by the Portfolio to meet their obligations may be affected by, among other things, economic or political developments in a specific country, industry or region. Debt securities are also subject to the risks associated with changes in interest rates.
Convertible securities may be subordinate to other securities. In part, the total return for a convertible security depends upon the performance of the underlying stock into which it can be converted. Also, issuers of convertible securities are often not as strong financially as those issuing securities with higher credit ratings, are more likely to encounter financial difficulties and typically are more vulnerable to changes in the economy, such as a recession or a sustained period of rising interest rates, which could affect their ability to make interest and principal payments.
(J) Indemnifications. Under the Fund’s organizational documents, its officers and trustees are indemnified against certain liabilities that
may arise out of performance of their duties to the Fund. Additionally, in the normal course of business, the Portfolio enters into contracts with third-party service providers that contain a variety of representations and warranties and that may provide general indemnifications. The Portfolio’s maximum exposure under these arrangements is unknown, as this would involve future claims that may be made against the Portfolio that have not yet occurred. The Manager believes that the risk of loss in connection with these potential indemnification obligations is remote. However, there can be no assurance that material liabilities related to such obligations will not arise in the future, which could adversely impact the Portfolio.
Note 3–Fees and Related Party Transactions
(A) Manager and Subadvisor. New York Life Investments, a registered investment adviser and an indirect, wholly-owned subsidiary of New York Life, serves as the Portfolio’s Manager pursuant to an Amended and Restated Management Agreement (“Management Agreement”). The Manager provides offices, conducts clerical, recordkeeping and bookkeeping services, and keeps most of the financial and accounting records required to be maintained by the Portfolio. Except for the portion of salaries and expenses that are the responsibility of the Portfolio, the Manager pays the salaries and expenses of all personnel affiliated with the Portfolio and certain operational expenses of the Portfolio. The Portfolio reimburses New York Life Investments in an amount equal to the portion of the compensation of the Chief Compliance Officer attributable to the Portfolio. MacKay Shields LLC (“MacKay Shields” or “Subadvisor”), a registered investment adviser and an indirect, wholly-owned subsidiary of New York Life, serves as Subadvisor to the Portfolio and is responsible for the day-to-day portfolio management of the Portfolio. Pursuant to the terms of an Amended and Restated Subadvisory Agreement (“Subadvisory Agreement”) between New York Life Investments and MacKay Shields, New York Life Investments pays for the services of the Subadvisor.
The Fund, on behalf of the Portfolio, pays New York Life Investments in its capacity as the Portfolio’s investment manager and administrator, pursuant to the Management Agreement, a monthly fee for the services performed and the facilities furnished at an annual rate of the Portfolio’s average daily net assets as follows: 0.60% up to $500 million; 0.55% from $500 million to $1 billion; 0.50% from $1 billion to $2 billion; and 0.49% in excess of $2 billion. During the six-month period ended June 30, 2020, the effective management fee rate was 0.58%.
During the six-month period ended June 30, 2020, New York Life Investments earned fees from the Portfolio in the amount of $2,603,174 and paid the Subadvisor in the amount of $1,301,587.
State Street provides sub-administration and sub-accounting services to the Portfolio pursuant to an agreement with New York Life Investments. These services include calculating the daily NAVs of the Portfolio, maintaining the general ledger and sub-ledger accounts for the calculation of the Portfolio’s NAVs and assisting New York Life Investments in conducting various aspects of the Portfolio’s administrative operations. For providing these services to the Portfolio, State Street is compensated by New York Life Investments.
Pursuant to an agreement between the Fund and New York Life Investments, New York Life Investments is responsible for providing or
| | |
| 24 | | MainStay VP MacKay Convertible Portfolio |
procuring certain regulatory reporting services for the Portfolio. The Portfolio will reimburse New York Life Investments for the actual costs incurred by New York Life Investments in connection with providing or procuring these services for the Portfolio.
(B) Distribution, Service and Shareholder Service Fees. The Fund, on behalf of the Portfolio, has entered into a distribution agreement with NYLIFE Distributors LLC (the “Distributor”), an indirect, wholly-owned subsidiary of New York Life. The Portfolio has adopted a distribution plan (the “Plan”) in accordance with the provisions of Rule 12b-1 under the 1940 Act. Under the Plan, the Distributor has agreed to provide, through its affiliates or independent third parties, various distribution-related, shareholder and administrative support services to the Service Class and Service 2 Class shareholders. For its services, the Distributor is entitled to a combined distribution and service fee accrued daily and paid monthly at an annual rate of 0.25% of the average daily net assets attributable to the Service Class and Service 2 Class shares of the Portfolio.
The Board has adopted a shareholder services plan (the “Service Plan”) with respect to the Service 2 Class shares of the Portfolio. Under the terms of the Services Plan, the Portfolio is authorized to pay to New York Life Investments, its affiliates or independent third-party service providers, as compensation for services rendered to shareholders of the Service 2 Class shares, in connection with the administration of plans or programs that use Portfolio shares as their funding medium a shareholder servicing fee at the rate of 0.10% on an annualized basis of the average daily net assets of the Service 2 Class shares.
(C) Transfer and Dividend Disbursing Agent. NYLIM Service Company LLC, an affiliate of New York Life Investments, serves as the transfer agent and dividend disbursing agent for Service Class and Service 2 Class shares of the Portfolio. NYLIM Service Company LLC has entered into an agreement with DST Asset Manager Solutions, Inc. (“DST”), pursuant to which DST performs certain transfer agent services on behalf of NYLIM Service Company LLC. During the six-month period ended June 30, 2020, all associated fees were paid by the Manager.
(D) Investments in Affiliates (in 000’s). During the six-month period ended June 30, 2020, purchases and sales transactions, income earned from investments and shares held of investment companies managed by New York Life Investments or its affiliates were as follows:
| | | | | | | | | | | | | | | | | | | | | | | | | | | | | | | | | | | | |
Affiliated Investment Company | | Value,
Beginning
of Period | | | Purchases
at Cost | | | Proceeds
from Sales | | | Net
Realized
Gain/(Loss)
on Sales | | | Change in
Unrealized
Appreciation/
(Depreciation) | | | Value,
End of
Period | | | Dividend
Income | | | Other
Distributions | | | Shares
End of
Period | |
MainStay U.S. Government Liquidity Fund | | $ | 56,751 | | | $ | 163,020 | | | $ | (206,804 | ) | | $ | — | | | $ | — | | | $ | 12,967 | | | $ | 169 | | | $ | — | | | | 12,967 | |
Note 4–Federal Income Tax
As of June 30, 2020, the cost and unrealized appreciation (depreciation) of the Portfolio’s investment portfolio, including applicable derivative contracts and other financial instruments, as determined on a federal income tax basis, were as follows:
| | | | | | | | | | | | | | | | |
| | | Federal Tax
Cost | | | Gross
Unrealized
Appreciation | | | Gross
Unrealized
(Depreciation) | | | Net
Unrealized
Appreciation/
(Depreciation) | |
| | | | |
Investments in Securities | | $ | 837,369,293 | | | $ | 177,837,417 | | | $ | (67,716,545 | ) | | $ | 110,120,872 | |
During the year ended December 31, 2019, the tax character of distributions paid as reflected in the Statements of Changes in Net Assets was as follows:
| | |
|
| 2019 |
Tax-Based
Distributions from Ordinary
Income | | Tax-Based
Distributions from Long-Term
Gains |
| |
| $22,040,458 | | $68,016,987 |
Note 5–Custodian
State Street is the custodian of cash and securities held by the Portfolio. Custodial fees are charged to the Portfolio based on the Portfolio’s net assets and/or the market value of securities held by the Portfolio and the number of certain transactions incurred by the Portfolio.
Note 6–Line of Credit
The Portfolio and certain other funds managed by New York Life Investments maintain a line of credit with a syndicate of banks in order to secure a source of funds for temporary purposes to meet unanticipated or excessive redemption requests.
Effective July 28, 2020, under the credit agreement (the “Credit Agreement”), the aggregate commitment amount is $600,000,000 with an additional uncommitted amount of $100,000,000. The commitment fee is an annual rate of 0.15% of the average commitment amount payable quarterly, regardless of usage, to JP Morgan Chase Bank NA, who serves as the agent to the syndicate. The commitment fee is allocated among the Portfolio and certain other funds managed by New York Life Investments based upon their respective net assets and other factors. Interest on any revolving credit loan is charged based upon the Federal Funds Rate or the one-month London Interbank Offered Rate (“LIBOR”), whichever is higher. The Credit Agreement expires on July 27, 2021, although the Portfolio, certain other funds managed by New York Life Investments and the syndicate of banks may renew the Credit Agreement for an additional year on the same or different terms or enter into a credit agreement with a different syndicate of banks. Prior to July 28, 2020, the aggregate commitment amount and the commitment fee were the same as those under the current Credit Agreement, but State Street served as agent to the syndicate. During the six-month period ended June 30, 2020, there were no borrowings made or outstanding with respect to the Portfolio under the Credit Agreement or the credit agreement for which State Street served as agent.
Notes to Financial Statements (Unaudited) (continued)
Note 7–Interfund Lending Program
Pursuant to an exemptive order issued by the SEC, the Portfolio, along with certain other funds managed by New York Life Investments, may participate in an interfund lending program. The interfund lending program provides an alternative credit facility that permits the Portfolio and certain other funds managed by New York Life Investments to lend or borrow money for temporary purposes directly to or from one another subject to the conditions of the exemptive order. During the six-month period ended June 30, 2020, there were no interfund loans made or outstanding with respect to the Portfolio.
Note 8–Purchases and Sales of Securities (in 000’s)
During the six-month period ended June 30, 2020, purchases and sales of securities, other than short-term securities, were $271,615 and $301,144, respectively.
Note 9–Capital Share Transactions
Transactions in capital shares for the six-month period ended June 30, 2020 and the year ended December 31, 2019, were as follows:
| | | | | | | | |
Initial Class | | Shares | | | Amount | |
| | |
Six-month period ended June 30, 2020: | | | | | | | | |
Shares sold | | | 261,329 | | | $ | 3,496,607 | |
Shares issued to shareholders in reinvestment of distributions | | | 67,628 | | | | 846,190 | |
Shares redeemed | | | (4,631,144 | ) | | | (59,985,221 | ) |
| | | | |
Net increase (decrease) | | | (4,302,187 | ) | | $ | (55,642,424 | ) |
| | | | |
Year ended December 31, 2019: | | | | | | | | |
Shares sold | | | 560,120 | | | $ | 7,679,603 | |
Shares issued to shareholders in reinvestment of distributions | | | 1,470,789 | | | | 19,421,628 | |
Shares redeemed | | | (1,557,410 | ) | | | (21,416,483 | ) |
| | | | |
Net increase (decrease) | | | 473,499 | | | $ | 5,684,748 | |
| | | | |
| | |
| | | | | | | | |
Service Class | | Shares | | | Amount | |
| | |
Six-month period ended June 30, 2020: | | | | | | | | |
Shares sold | | | 5,244,317 | | | $ | 69,054,812 | |
Shares issued to shareholders in reinvestment of distributions | | | 212,464 | | | | 2,659,470 | |
Shares redeemed | | | (7,338,552 | ) | | | (93,095,632 | ) |
| | | | |
Net increase (decrease) | | | (1,881,771 | ) | | $ | (21,381,350 | ) |
| | | | |
Year ended December 31, 2019: | | | | | | | | |
Shares sold | | | 8,523,095 | | | $ | 116,039,790 | |
Shares issued to shareholders in reinvestment of distributions | | | 5,357,066 | | | | 70,027,704 | |
Shares redeemed | | | (6,555,192 | ) | | | (89,395,608 | ) |
| | | | |
Net increase (decrease) | | | 7,324,969 | | | $ | 96,671,886 | |
| | | | |
| | |
| | | | | | | | |
| | | | | | | | |
Service 2 Class | | Shares | | | Amount | |
| | |
Six-month period ended June 30, 2020: | | | | | | | | |
Shares sold | | | 325,893 | | | $ | 4,576,481 | |
Shares issued to shareholders in reinvestment of distributions | | | 1,263 | | | | 16,334 | |
Shares redeemed | | | (282,027 | ) | | | (3,486,508 | ) |
| | | | |
Net increase (decrease) | | | 45,129 | | | $ | 1,106,307 | |
| | | | |
Year ended December 31, 2019: | | | | | | | | |
Shares sold | | | 268,924 | | | $ | 3,720,251 | |
Shares issued to shareholders in reinvestment of distributions | | | 46,583 | | | | 608,113 | |
Shares redeemed | | | (75,955 | ) | | | (1,036,288 | ) |
| | | | |
Net increase (decrease) | | | 239,552 | | | $ | 3,292,076 | |
| | | | |
Note 10–Recent Accounting Pronouncement
In March 2020, the Financial Accounting Standards Board (“FASB”) issued Accounting Standards Update 2020-04 (“ASU 2020-04”), which provides optional guidance to ease the potential accounting burden associated with transitioning away from LIBOR and other reference rates that are expected to be discontinued. ASU 2020-04 is effective immediately upon release of the update on March 12, 2020 through December 31, 2022. At this time, the Manager is evaluating the implications of certain other provisions of ASU 2020-04 related to new disclosure requirements and any impact on the financial statement disclosures has not yet been determined.
Note 11–Subsequent Events
In connection with the preparation of the financial statements of the Portfolio as of and for the six-month period ended June 30, 2020, events and transactions subsequent to June 30, 2020, through the date the financial statements were issued have been evaluated by the Manager, for possible adjustment and/or disclosure. No subsequent events requiring financial statement adjustment or disclosure have been identified.
Note 12–Other Matters
An outbreak of COVID-19, first detected in December 2019, has developed into a global pandemic and has resulted in travel restrictions, closure of international borders, certain businesses and securities markets, restrictions on securities trading activities, prolonged quarantines, supply chain disruptions, and lower consumer demand, as well as general concern and uncertainty. The continued impact of COVID-19 is uncertain and could further adversely affect the global economy, national economies, individual issuers and capital markets in unforeseeable ways and result in a substantial and extended economic downturn. Developments that disrupt global economies and financial markets, such as COVID-19, may magnify factors that affect the Portfolio’s performance.
| | |
| 26 | | MainStay VP MacKay Convertible Portfolio |
Discussion of the Operation and Effectiveness of the Portfolio’s
Liquidity Risk Management Program (Unaudited)
In compliance with Rule 22e-4 under the Investment Company Act of 1940, as amended (the “Liquidity Rule”), the Portfolio has adopted and implemented a liquidity risk management program (the “Program”), which New York Life Investment Management LLC believes is reasonably designed to assess and manage the Portfolio’s liquidity risk. The Board designated New York Life Investment Management LLC as administrator of the Program (the “Administrator”). The Administrator has established a Liquidity Risk Management Committee to assist the Administrator in the implementation and day-to-day administration of the Program and to otherwise support the Administrator in fulfilling its responsibilities under the Program.
At a meeting of the Board held on March 11, 2020, the Administrator provided the Board with a written report addressing the Program’s operation, adequacy and effectiveness of implementation for the period from December 1, 2018 through December 31, 2019, as required under the Liquidity Rule. The report noted that the Administrator concluded that (i) the Program operated effectively to assess and manage the Portfolio’s liquidity risk, (ii) the Program has been adequately and effectively implemented to monitor and, as applicable, respond to the Portfolio’s liquidity developments and (iii) the Portfolio’s investment strategy continues to be appropriate for an open-end portfolio.
In accordance with the Program, the Portfolio’s liquidity risk is assessed no less frequently than annually taking into consideration certain factors, as applicable, such as (i) investment strategy and liquidity of portfolio investments, (ii) short-term and long-term cash flow projections and (iii) holdings of cash and cash equivalents and borrowing arrangements and other funding sources. Certain factors are considered under both normal and reasonably foreseeable stressed conditions.
Each Portfolio portfolio investment is classified into one of four liquidity categories. The classification is based on a determination of the number of days it is reasonably expected to take to convert the investment into cash, or sell or dispose of the investment, in current market conditions without significantly changing the market value of the investment. The Administrator has delegated liquidity classification determinations to the Portfolio’s subadvisor, subject to appropriate oversight by the Administrator, and classification determinations are made by taking into account the Portfolio’s reasonably anticipated trade size, various market, trading and investment-specific considerations, as well as market depth, and, in certain cases, third-party vendor data.
The Liquidity Rule requires portfolios that do not primarily hold assets that are highly liquid investments to adopt a minimum amount of net assets that must be invested in highly liquid investments that are assets (an “HLIM”). In addition, the Liquidity Rule limits a portfolio’s investments in illiquid investments. Specifically, the Liquidity Rule prohibits acquisition of illiquid investments if doing so would result in a portfolio holding more than 15% of its net assets in illiquid investments that are assets. The Program includes provisions reasonably designed to determine, periodically review and comply with the HLIM requirement, as applicable, and to comply with the 15% limit on illiquid investments.
Proxy Voting Policies and Procedures and Proxy Voting Record
A description of the policies and procedures that New York Life Investments uses to vote proxies related to the Portfolio’s securities is available free of charge upon request (i) by calling 800-598-2019; (ii) by visiting New York Life Investments’ website at https://www.nylinvestments.com/mainstay/products-and-performance/mainstay-vp-funds-trust; or (iii) by visiting the SEC’s website at www.sec.gov.
The Portfolio is required to file with the SEC its proxy voting record for the 12-month period ending June 30 on Form N-PX. The Portfolio’s most recent Form N-PX or proxy voting record is available free of charge upon request (i) by calling 800-598-2019; (ii) by visiting New York Life Investments’ website at https://www.nylinvestments.com/mainstay/products-and-performance/mainstay-vp-funds-trust; or (iii) by visiting the SEC’s website at www.sec.gov.
Shareholder Reports and Quarterly Portfolio Disclosure
The Portfolio is required to file its complete schedule of portfolio holdings with the SEC 60 days after its first and third fiscal quarter on Form N-PORT. The Portfolio’s holdings report is available free of charge upon request by calling 800-598-2019 or by visiting the SEC’s website at www.sec.gov.
| | |
| 28 | | MainStay VP MacKay Convertible Portfolio |
MainStay VP Portfolios
MainStay VP offers a wide range of Portfolios. The full array of MainStay VP offerings is listed here, with information about the manager, subadvisors, legal counsel, and independent registered public accounting firm.
Equity Portfolios
MainStay VP Emerging Markets Equity Portfolio
MainStay VP Epoch U.S. Equity Yield Portfolio
MainStay VP Fidelity Institutional AM® Utilities Portfolio†
MainStay VP MacKay Common Stock Portfolio
MainStay VP MacKay Growth Portfolio
MainStay VP MacKay International Equity Portfolio
MainStay VP MacKay Mid Cap Core Portfolio
MainStay VP MacKay S&P 500 Index Portfolio
MainStay VP MacKay Small Cap Core Portfolio
MainStay VP Mellon Natural Resources Portfolio
MainStay VP Small Cap Growth Portfolio
MainStay VP T. Rowe Price Equity Income Portfolio
MainStay VP Winslow Large Cap Growth Portfolio
Mixed Asset Portfolios
MainStay VP Balanced Portfolio
MainStay VP Income Builder Portfolio
MainStay VP Janus Henderson Balanced Portfolio
MainStay VP MacKay Convertible Portfolio
Income Portfolios
MainStay VP Bond Portfolio
MainStay VP Floating Rate Portfolio
MainStay VP Indexed Bond Portfolio
MainStay VP MacKay Government Portfolio
MainStay VP MacKay High Yield Corporate Bond Portfolio
MainStay VP MacKay Unconstrained Bond Portfolio
MainStay VP PIMCO Real Return Portfolio
Money Market
MainStay VP U.S. Government Money Market Portfolio
Alternative
MainStay VP CBRE Global Infrastructure Portfolio
MainStay VP IQ Hedge Multi-Strategy Portfolio
Asset Allocation Portfolios
MainStay VP Conservative Allocation Portfolio
MainStay VP Growth Allocation Portfolio
MainStay VP Moderate Allocation Portfolio
MainStay VP Moderate Growth Allocation Portfolio
Manager
New York Life Investment Management LLC
New York, New York
Subadvisors
Brown Advisory LLC
Baltimore, Maryland
Candriam Belgium S.A.*
Brussels, Belgium
CBRE Clarion Securities LLC
Radnor, Pennsylvania
Epoch Investment Partners, Inc.
New York, New York
FIAM LLC
Smithfield, Rhode Island
IndexIQ Advisors LLC*
New York, New York
Janus Capital Management LLC
Denver, Colorado
MacKay Shields LLC*
New York, New York
Mellon Investments Corporation
Boston, Massachusetts
NYL Investors LLC*
New York, New York
Pacific Investment Management Company LLC
Newport Beach, California
Segall Bryant & Hamill, LLC
Chicago, Illinois
T. Rowe Price Associates, Inc.
Baltimore, Maryland
Winslow Capital Management, LLC
Minneapolis, Minnesota
Distributor
NYLIFE Distributors LLC*
Jersey City, New Jersey
Custodian
State Street Bank and Trust Company
Boston, Massachusetts
Independent Registered Public Accounting Firm
PricewaterhouseCoopers LLP
New York, New York
Legal Counsel
Dechert LLP
Washington, District of Columbia
Some Portfolios may not be available in all products.
| † | Fidelity Institutional AM is a registered trade mark of FMR LLC. Used with permission. |
| * | An affiliate of New York Life Investment Management LLC |
Not part of the Semiannual Report
2020 Semiannual Report
This report is for the general information of policyowners of New York Life Variable Annuities and NYLIAC Variable Universal Life Insurance Products or policies issued by other insurance companies. It must be preceded or accompanied by the appropriate product(s) and funds prospectuses if it is given to anyone who is not an owner of a New York Life variable annuity policy or a NYLIAC Variable Universal Life Insurance Product. This report does not offer for sale or solicit orders to purchase securities.
The performance data quoted in this report represents past performance. Past performance is no guarantee of future results. Due to market volatility and other factors, current performance may be lower or higher than the figures shown. The most recent month-end performance summary for your New York Life Variable Annuities and NYLIAC Variable Universal Life Insurance Product is available by calling 800-598-2019 and is updated periodically on www.newyorklife.com.
The New York Life Variable Annuities and NYLIAC Variable Universal Life Insurance Products are issued by New York Life Insurance and Annuity Corporation (a Delaware Corporation) and distributed by NYLIFE Distributors LLC (Member FINRA/SIPC).
New York Life Insurance Company
New York Life Insurance and Annuity Corporation (NYLIAC) (A Delaware Corporation)
51 Madison Avenue, Room 551
New York, NY 10010
www.newyorklife.com
Printed on recycled paper
nylinvestments.com
NYLIFE Distributors LLC, 30 Hudson Street, Jersey City, NJ 07302
New York Life Investment Management LLC is the investment manager to the MainStay VP Funds Trust
©2020 by NYLIFE Distributors LLC. All rights reserved.
You may obtain copies of the Prospectus and the Statement of Additional Information free of charge, upon request, by calling toll-free 800-598-2019 or writing to New York Life Insurance and Annuity Corporation, 51 Madison Avenue, New York, NY 10010.
| | | | |
| Not FDIC Insured | | No Bank Guarantee | | May Lose Value |
| | | | |
| 1781608 | | | | MSVPC10-08/20 (NYLIAC) NI512 |
MainStay VP MacKay Growth Portfolio
Message from the President and Semiannual Report
Unaudited | June 30, 2020
Beginning on January 1, 2021, as permitted by regulations adopted by the Securities and Exchange Commission, paper copies of the MainStay VP Portfolio annual and semi-annual shareholder reports may no longer be sent by mail, unless you specifically request paper copies of the reports from the insurance company that offers your policy. Instead, the reports will be made available online, and you will be notified by mail each time a report is posted and provided with a website link to access the report. Instructions for requesting paper copies will be provided by your insurance company.
If you already elected to receive shareholder reports electronically, you will not be affected by this change and you need not take any action. At any time, you may elect to receive reports and other communications from the insurance company electronically by following the instructions provided by the insurance company.
You may elect to receive all future shareholder reports in paper form free of charge. You can inform the insurance company that you wish to receive paper copies of reports by following the instructions provided by the insurance company. Your election to receive reports in paper form will apply to all portfolio companies available under your contract.
| | | | | | | | |
| Not FDIC/NCUA Insured | | Not a Deposit | | May Lose Value | | No Bank Guarantee | | Not Insured by Any Government Agency |

This page intentionally left blank
Message from the President
High levels of volatility shook financial markets in response to the COVID-19 pandemic and an abrupt decline in global economic activity during the six months ended June 30, 2020.
Markets entered 2020 riding strong fourth quarter performance and an economic expansion of historic longevity. Most broad stock and bond indices began to dip in late February as growing numbers of COVID-19 cases were seen in hotspots around the world. On March 11, 2020, the World Health Organization acknowledged that the disease had reached pandemic proportions, with over 80,000 identified cases in China, thousands in Italy, South Korea and the United States, and more in dozens of additional countries. Governments and central banks pledged trillions of dollars to address the mounting economic and public health crisis; however, “stay-at-home” orders and other restrictions on non-essential activity caused global economic activity to slow. Most stocks and bonds lost significant ground in this challenging environment, with equities declining by roughly a third and the yield on high-yield credit indices shooting higher.
Policymakers responded with extraordinary speed to address the situation. In the United States, the Federal Reserve (“Fed”) cut interest rates to near zero and announced unlimited quantitative easing. With help from Treasury, the Fed later rolled out a series of lending facilities to directly support market functioning. In late March, the Federal government declared a national emergency; Congress passed, and the President signed, a $2 trillion CARES Act (The Coronavirus Aid, Relief, and Economic Security Act), with the promise of further assistance for consumers and businesses to come. This enormous wave of policy support helped fuel a rapid recovery in market pricing as stocks bounced back and credit spreads narrowed. Some states rushed to ease restrictions on travel and social gatherings, further fueling optimism that the effects of the pandemic might prove short lived. However, the final weeks of the reporting period saw infection rates beginning to rise in some of the first states to reopen, raising concerns that a second round of restrictive government policies might prove necessary, once again stifling economic activity.
Despite all the market volatility, the broadly based S&P 500® Index finished the first half of 2020 only slightly below its starting point and the technology-heavy NASDAQ Composite Index posted gains, closing in near record territory. Small-cap stocks tended to trail their large cap counterparts, as illustrated by the Russell 2000® Index’s loss of approximately 15%, while value-oriented stocks lagged growth-oriented issues. From a global perspective, U.S. stocks generally outperformed international equities, with emerging markets hit particularly hard by the flight from risk.
Fixed-income markets also experienced unusually high levels of volatility. Recognized safe havens, such as U.S. government bonds, attracted increased investment, driving yields lower and prices higher, positioning long-term Treasury bonds to deliver particularly strong gains. Investment-grade corporate bonds lost value in March before recovering in the closing months of the reporting period, while relatively speculative high-yield credit faced the brunt of risk-off sentiment. Emerging market debt underperformed most other bonds types as investors sought to minimize currency and sovereign risks.
Today, as we at New York Life Investments continue to track the ongoing health crisis and its financial ramifications, we are particularly mindful of the people at the heart of our enterprise—our colleagues and valued clients. By taking appropriate steps to minimize community spread of COVID-19 within our organization, we strive to safeguard the health of our investment professionals so they can continue to provide you, as a MainStay investor, with world class investment solutions in this rapidly evolving environment.
Sincerely,

Kirk C. Lehneis
President
The opinions expressed are as of the date of this report and are subject to change. There is no guarantee that any forecast made will come to pass. This material does not constitute investment advice and is not intended as an endorsement of any specific investment. Past performance is no guarantee of future results.
Not part of the Semiannual Report
Table of Contents
Investors should refer to the Portfolio’s Summary Prospectus and/or Prospectus and consider the Portfolio’s investment objectives, strategies, risks, charges and expenses carefully before investing. The Summary Prospectus and/or Prospectus contain this and other information about the Portfolio. You may obtain copies of the Portfolio’s Summary Prospectus and/or the Prospectus and the Statement of Additional Information free of charge, upon request, by calling toll-free 800-598-2019, by writing to New York Life Insurance and Annuity Corporation, 51 Madison Avenue, Room 251, New York, New York 10010 or by sending an email to MainStayShareholdersServices@nylim.com. These documents are also available at nylinvestments.com/vpdocuments. Please read the Summary Prospectus and/or Prospectus carefully before investing. MainStay VP Funds Trust portfolios are separate account options which are purchased through a variable insurance or variable annuity contract.
Investment and Performance Comparison1 (Unaudited)
Performance data quoted represents past performance. Past performance is no guarantee of future results. Because of market volatility and other factors, current performance may be lower or higher than the figures shown. Investment return and principal value will fluctuate, and as a result, when shares are redeemed, they may be worth more or less than their original cost. The performance table and graph do not reflect any deduction of sales charges, mortality and expense charges, contract charges or administrative charges. Please refer to the Performance Summary appropriate for your policy. For performance information current to the most recent month-end, please call 800-598-2019 or visit www.newyorklife.com.
Average Annual Total Returns for the Period-Ended June 30, 2020
| | | | | | | | | | | | | | | | | | | | | | |
| Class | | Inception Date2 | | Six Months | | | One Year | | | Five Years | | | Ten Years | | | Gross
Expense
Ratio3 | |
| | | | | | |
| Initial Class Shares | | 1/29/1993 | | | 6.75 | % | | | 18.44 | % | | | 11.38 | % | | | 13.21 | % | | | 0.72 | % |
| Service Class Shares | | 6/5/2003 | | | 6.62 | | | | 18.15 | | | | 11.10 | | | | 12.93 | | | | 0.97 | |
| | | | | | | | | | | | | | | | |
| Benchmark Performance | | Six
Months | | | One Year | | | Five Years | | | Ten Years | |
| | | | |
Russell 1000® Growth Index4 | | | 9.81 | % | | | 23.28 | % | | | 15.89 | % | | | 17.23 | % |
| | | | |
S&P 500® Index5 | | | -3.08 | | | | 7.51 | | | | 10.73 | | | | 13.99 | |
Morningstar Large Growth Category Average6 | | | 7.84 | | | | 17.34 | | | | 12.84 | | | | 15.12 | |
| 1. | Performance figures may reflect certain fee waivers and/or expense limitations, without which total returns may have been different. For information on current fee waivers and/or expense limitations (if any), please refer to the Notes to Financial Statements. |
| 2. | Effective January 11, 2013 and July 29, 2016, the Portfolio modified its principal investment strategies in connection with changes in the Portfolio’s Subadvisor. The past performance in the bar chart and table reflect the Subadvisors and strategies in place during their respective time periods. |
| 3. | The gross expense ratios presented reflect the Portfolio’s “Total Annual Portfolio Operating Expenses” from the most recent Prospectus, as supplemented, and may differ from other expense ratios disclosed in this report. |
| 4. | The Russell 1000® Growth Index is the Portfolio’s primary broad-based securities market index for comparison purposes. The Russell 1000® Growth Index measures the performance of the large-cap growth segment of the U.S. equity universe. It includes those Russell 1000® Index companies with |
| | higher price-to-book ratios and higher forecasted growth values. Results assume reinvestment of all dividends and capital gains. An investment cannot be made directly in an index. |
| 5. | The S&P 500® Index is the Portfolio’s secondary benchmark. “S&P 500®” is a trademark of The McGraw-Hill Companies, Inc. The S&P 500® Index is widely regarded as the standard index for measuring large-cap U.S. stock market performance. Results assume reinvestment of all dividends and capital gains. An investment cannot be made directly in an index. |
| 6. | The Morningstar Large Growth Category Average is representative of funds that invest primarily in big U.S. companies that are projected to grow faster than other large-cap stocks. Stocks in the top 70% of the capitalization of the U.S. equity market are defined as large cap. Growth is defined based on fast growth and high valuations. Most of these funds focus on companies in rapidly expanding industries. Results are based on average total returns of similar funds with all dividends and capital gain distributions reinvested. |
Cost in Dollars of a $1,000 Investment in MainStay VP MacKay Growth Portfolio (Unaudited)
The example below is intended to describe the fees and expenses borne by shareholders during the six-month period from January 1, 2020, to June 30, 2020, and the impact of those costs on your investment.
Example
As a shareholder of the Portfolio you incur two types of costs: (1) transaction costs, including exchange fees and sales charges (loads) on purchases (as applicable), and (2) ongoing costs, including management fees, distribution and/or service (12b-1) fees, and other Portfolio expenses (as applicable). This example is intended to help you understand your ongoing costs (in dollars) of investing in the Portfolio and to compare these costs with the ongoing costs of investing in other mutual funds. The example is based on an investment of $1,000 made at the beginning of the six-month period and held for the entire period from January 1, 2020, to June 30, 2020. Shares are only sold in connection with variable life and annuity contracts and the example does not reflect any contract level or transactional fees or expenses. If these costs had been included, your costs would have been higher.
This example illustrates your Portfolio’s ongoing costs in two ways:
Actual Expenses
The second and third data columns in the table below provide information about actual account values and actual expenses. You may use the information in these columns, together with the amount you invested, to estimate the expenses that you paid during the six months
ended June 30, 2020. Simply divide your account value by $1,000 (for example, an $8,600 account value divided by $1,000 = 8.6), then multiply the result by the number under the heading entitled “Expenses Paid During Period” to estimate the expenses you paid on your account during this period.
Hypothetical Example for Comparison Purposes
The fourth and fifth data columns in the table below provide information about hypothetical account values and hypothetical expenses based on the Portfolio’s actual expense ratio and an assumed rate of return of 5% per year before expenses, which is not the Portfolio’s actual return. The hypothetical account values and expenses may not be used to estimate the actual ending account balances or expenses you paid for the six-month period shown. You may use this information to compare the ongoing costs of investing in the Portfolio with the ongoing costs of investing in other mutual funds. To do so, compare this 5% hypothetical example with the 5% hypothetical examples that appear in the shareholder reports of the other mutual funds.
Please note that the expenses shown in the table are meant to highlight your ongoing costs only and do not reflect any transactional costs, such as exchange fees or sales charges (loads). Therefore, the fourth and fifth data columns of the table are useful in comparing ongoing costs only and will not help you determine the relative total costs of owning different funds. In addition, if these transactional costs were included, your costs would have been higher.
| | | | | | | | | | | | | | | | | | | | | | |
| Share Class | | Beginning
Account
Value
1/1/20 | | | Ending Account
Value (Based
on Actual
Returns and
Expenses)
6/30/20 | | | Expenses
Paid
During
Period1 | | | Ending Account
Value (Based
on Hypothetical
5% Annualized
Return and
Actual Expenses)
6/30/20 | | | Expenses
Paid
During
Period1 | | | Net Expense
Ratio
During
Period2 |
| | | | | | |
| Initial Class Shares | | $ | 1,000.00 | | | $ | 1,067.50 | | | $ | 3.70 | | | $ | 1,021.28 | | | $ | 3.62 | | | 0.72% |
| | | | | | |
| Service Class Shares | | $ | 1,000.00 | | | $ | 1,066.20 | | | $ | 4.98 | | | $ | 1,020.04 | | | $ | 4.87 | | | 0.97% |
| 1 | Expenses are equal to the Portfolio’s annualized expense ratio of each class multiplied by the average account value over the period, divided by 366 and multiplied by 182 (to reflect the six-month period). The table above represents the actual expenses incurred during the six-month period. In addition to the fees and expenses which the Portfolio bears directly, it also indirectly bears a pro rata share of the fees and expenses of the underlying funds in which it invests. Such indirect expenses are not included in the above-reported expense figures. |
| 2 | Expenses are equal to the Portfolio’s annualized expense ratio to reflect the six-month period. |
| | |
| 6 | | MainStay VP MacKay Growth Portfolio |
Industry Composition as of June 30, 2020 (Unaudited)
| | | | |
| |
| Software | | | 21.4 | % |
| |
| Internet & Direct Marketing Retail | | | 10.4 | |
| |
| Technology Hardware, Storage & Peripherals | | | 8.9 | |
| |
| Interactive Media & Services | | | 8.7 | |
| |
| IT Services | | | 8.4 | |
| |
| Biotechnology | | | 7.1 | |
| |
| Semiconductors & Semiconductor Equipment | | | 6.9 | |
| |
| Health Care Providers & Services | | | 5.5 | |
| |
| Specialty Retail | | | 2.9 | |
| |
| Equity Real Estate Investment Trusts | | | 2.1 | |
| |
| Entertainment | | | 1.8 | |
| |
| Life Sciences Tools & Services | | | 1.7 | |
| |
| Automobiles | | | 1.5 | |
| |
| Aerospace & Defense | | | 1.4 | |
| |
| Media | | | 1.4 | |
| |
| Road & Rail | | | 1.1 | |
| |
| Pharmaceuticals | | | 1.0 | |
| |
| Electronic Equipment, Instruments & Components | | | 0.9 | |
| | | | |
| |
| Food & Staples Retailing | | | 0.9 | |
| |
| Multiline Retail | | | 0.9 | |
| |
| Capital Markets | | | 0.7 | |
| |
| Professional Services | | | 0.7 | |
| |
| Exchange-Traded Fund | | | 0.6 | |
| |
| Hotels, Restaurants & Leisure | | | 0.6 | |
| |
| Beverages | | | 0.5 | |
| |
| Health Care Equipment & Supplies | | | 0.5 | |
| |
| Health Care Technology | | | 0.3 | |
| |
| Household Products | | | 0.3 | |
| |
| Personal Products | | | 0.3 | |
| |
| Textiles, Apparel & Luxury Goods | | | 0.3 | |
| |
| Oil, Gas & Consumable Fuels | | | 0.2 | |
| |
| Air Freight & Logistics | | | 0.1 | |
| |
| Short-Term Investment | | | 0.1 | |
| |
| Other Assets, Less Liabilities | | | –0.1 | |
| | | | |
| | | 100.0 | % |
| | | | |
See Portfolio of Investments beginning on page 10 for specific holdings within these categories. The Portfolio’s holdings are subject to change.
Top Ten Holdings as of June 30, 2020 (excluding short-term investment) (Unaudited)
| 5. | Facebook, Inc., Class A |
| 7. | UnitedHealth Group, Inc. |
| 9. | Mastercard, Inc., Class A |
Portfolio Management Discussion and Analysis (Unaudited)
Answers to the questions reflect the views of portfolio managers Migene Kim, CFA, and Mona Patni of MacKay Shields LLC, the Portfolio’s Subadvisor.
How did MainStay VP MacKay Growth Portfolio perform relative to its benchmarks and peers during the six months ended June 30, 2020?
For the six months ended June 30, 2020, MainStay VP MacKay Growth Portfolio returned 6.75% for Initial Class shares and 6.62% for Service Class shares. Over the same period, both share classes underperformed the 9.81% return of the Russell 1000® Growth Index, which is the Portfolio’s primary benchmark, and outperformed the –3.08% return of the S&P 500® Index, which is a secondary benchmark of the Portfolio. For the six months ended June 30, 2020, both share classes underperformed the 7.84% return of the Morningstar Large Growth Category Average.1
During the reporting period, were there any liquidity events that materially impacted the Fund’s performance?
With the 11-year equity bull market abruptly ending due to the social and economic impact of the COVID-19 pandemic, global equity markets were subject to extreme volatility and correlation during the reporting period. While the CBOE Volatility Index came down after peaking on March 16th, volatility still remained elevated as uncertainties around reopening plans and vaccine/treatment progress persisted. This general market environment, with high volatility and frequent oscillation between positive and negative sentiments, did present occasional liquidity challenges, requiring us to be particularly prudent in terms of trade implementation and risk management. However, during the reporting period, we did not see liquidity events meaningfully impact the Portfolio’s performance.
What factors affected the Portfolio’s relative performance during the reporting period?
Both during and after the steep market decline that occurred in March 2020, growth-oriented stocks outperformed their value-oriented counterparts, accentuating a multi-year trend. Investors regarded familiar large-cap growth stocks as “safe,” while shunning cheaper stocks in areas such as energy, financials and industrials. Consequently, the spread2 between the Russell 1000® Growth Index and the Russell 1000® Value Index widened to historic levels. Value-oriented investment vehicles experienced major drawdowns during the first quarter of 2020. The Portfolio’s momentum-based stock selection signals, which capture historical price trends, performed well during the first quarter, mitigating some of the headwinds from value, but momentum-driven investments were subject to a sharp, volatile sell-off during the second quarter amid market inflection. Quality and profitability signals mitigated downside risk, particularly
during the March market downturn. However, hedge fund sentiment proved an ineffective indicator as the hedge fund community had a challenging time coping with market turmoil. In short, the reporting period did not present a conducive environment for stock selection. Nevertheless, the Portfolio fared better than the underlying model as diversification and risk management with respect to style mitigated some downside risk.
Which sectors were the strongest positive contributors to the Portfolio’s relative performance, and which sectors were particularly weak?
During the reporting period, the strongest positive contributors to the Portfolio’s benchmark-relative performance were the materials and consumer staples sectors. (Contributions take weightings and total returns into account.) During the same period, the most significant detractors from benchmark-relative performance were the technology, consumer discretionary, and health care sectors.
During the reporting period, which individual stocks made the strongest positive contributions to the Portfolio’s absolute performance and which stocks detracted the most?
The stocks providing the strongest positive contributions to the Portfolio’s absolute performance during the reporting period included Internet & direct marketing retailer Amazon.com, systems software developer Microsoft and consumer electronics maker Apple. During the same period, the most significant detractors from absolute performance were cruise line operator Norwegian Cruise Line Holdings, life & health insurer Athene Holding and aerospace & defense contractor Boeing.
Did the Portfolio make any significant purchases or sales during the reporting period?
During the reporting period, the Portfolio’s largest initial purchase was in shares of electric car maker Tesla, while its largest increased position size was in software developer Microsoft Corporation. During the same period, the Portfolio’s largest full sale was its position in semiconductor maker Texas Instruments, while its largest decreased position size was in enterprise software and services provider Oracle.
How did the Portfolio’s sector weightings change during the reporting period?
Relative to the Russell 1000® Growth Index, the Portfolio’s most substantial exposure increases during the reporting period were in the industrials and communication services sectors.
| 1. | See page 5 for more information on benchmark and peer group returns. |
| 2. | The terms “spread” and “yield spread” may refer to the difference in yield between a security or type of security and comparable U.S. Treasury issues. The terms may also refer to the difference in yield between two specific securities or types of securities at a given time. |
| | |
| 8 | | MainStay VP MacKay Growth Portfolio |
Conversely, the Portfolio’s largest decreases in benchmark-relative sector exposures were in the consumer staples and financials sectors.
How was the Portfolio positioned at the end of the reporting period?
As of June 30, 2020, the Portfolio’s most substantially overweight positions relative to the Russell 1000® Growth Index
were in the information technology and consumer discretionary sectors. As of the same date, the Portfolio held its most substantially underweight positions relative to the Index in the consumer staples and industrials sectors.
The opinions expressed are those of the portfolio managers as of the date of this report and are subject to change. There is no guarantee that any forecasts will come to pass. This material does not constitute investment advice and is not intended as an endorsement of any specific investment.
Not all MainStay VP Portfolios and/or share classes are available under all policies.
Portfolio of Investments June 30, 2020 (Unaudited)
| | | | | | | | |
| | | Shares | | | Value | |
| Common Stocks 99.4%† | |
Aerospace & Defense 1.4% | |
Lockheed Martin Corp. | | | 20,204 | | | $ | 7,372,844 | |
Northrop Grumman Corp. | | | 5,255 | | | | 1,615,597 | |
| | | | | | | | |
| | | | | | | 8,988,441 | |
| | | | | | | | |
|
Air Freight & Logistics 0.1% | |
XPO Logistics, Inc. (a) | | | 11,110 | | | | 858,247 | |
| | | | | | | | |
|
Automobiles 1.5% | |
Tesla, Inc. (a) | | | 9,259 | | | | 9,997,961 | |
| | | | | | | | |
|
Beverages 0.5% | |
Coca-Cola Co. | | | 23,197 | | | | 1,036,442 | |
PepsiCo., Inc. | | | 18,492 | | | | 2,445,752 | |
| | | | | | | | |
| | | | | | | 3,482,194 | |
| | | | | | | | |
|
Biotechnology 7.1% | |
AbbVie, Inc. | | | 110,924 | | | | 10,890,518 | |
Alexion Pharmaceuticals, Inc. (a) | | | 16,050 | | | | 1,801,452 | |
Alkermes PLC (a) | | | 94,753 | | | | 1,838,682 | |
Amgen, Inc. | | | 36,390 | | | | 8,582,946 | |
Biogen, Inc. (a) | | | 15,564 | | | | 4,164,148 | |
Exelixis, Inc. (a) | | | 153,412 | | | | 3,642,001 | |
Gilead Sciences, Inc. | | | 37,528 | | | | 2,887,404 | |
Incyte Corp. (a) | | | 41,835 | | | | 4,349,585 | |
Moderna, Inc. (a) | | | 12,006 | | | | 770,905 | |
Regeneron Pharmaceuticals, Inc. (a) | | | 9,964 | | | | 6,214,049 | |
United Therapeutics Corp. (a) | | | 14,621 | | | | 1,769,141 | |
Vertex Pharmaceuticals, Inc. (a) | | | 498 | | | | 144,574 | |
| | | | | | | | |
| | | | | | | 47,055,405 | |
| | | | | | | | |
|
Capital Markets 0.7% | |
LPL Financial Holdings, Inc. | | | 45,290 | | | | 3,550,736 | |
Moody’s Corp. | | | 3,397 | | | | 933,258 | |
S&P Global, Inc. | | | 884 | | | | 291,260 | |
| | | | | | | | |
| | | | | | | 4,775,254 | |
| | | | | | | | |
|
Electronic Equipment, Instruments & Components 0.9% | |
Jabil, Inc. | | | 110,641 | | | | 3,549,363 | |
Tech Data Corp. (a)(b) | | | 16,680 | | | | 2,418,600 | |
| | | | | | | | |
| | | | | | | 5,967,963 | |
| | | | | | | | |
|
Entertainment 1.8% | |
Activision Blizzard, Inc. | | | 22,512 | | | | 1,708,661 | |
Electronic Arts, Inc. (a) | | | 24,671 | | | | 3,257,806 | |
Lions Gate Entertainment Corp., Class B (a) | | | 131,687 | | | | 899,422 | |
| | | | | | | | |
| | | Shares | | | Value | |
Entertainment (continued) | |
Netflix, Inc. (a) | | | 11,290 | | | $ | 5,137,402 | |
Roku, Inc. (a) | | | 4,546 | | | | 529,745 | |
| | | | | | | | |
| | | | | | | 11,533,036 | |
| | | | | | | | |
|
Equity Real Estate Investment Trusts 2.1% | |
American Tower Corp. | | | 18,357 | | | | 4,746,019 | |
Equinix, Inc. | | | 7,240 | | | | 5,084,652 | |
SBA Communications Corp. | | | 12,742 | | | | 3,796,096 | |
| | | | | | | | |
| | | | | | | 13,626,767 | |
| | | | | | | | |
|
Food & Staples Retailing 0.9% | |
Costco Wholesale Corp. | | | 5,565 | | | | 1,687,364 | |
Kroger Co. | | | 23,136 | | | | 783,153 | |
Sprouts Farmers Market, Inc. (a) | | | 132,129 | | | | 3,381,181 | |
| | | | | | | | |
| | | | | | | 5,851,698 | |
| | | | | | | | |
|
Health Care Equipment & Supplies 0.5% | |
West Pharmaceutical Services, Inc. | | | 14,521 | | | | 3,298,736 | |
| | | | | | | | |
|
Health Care Providers & Services 5.5% | |
AmerisourceBergen Corp. | | | 38,184 | | | | 3,847,802 | |
Anthem, Inc. | | | 16,408 | | | | 4,314,976 | |
Cardinal Health, Inc. | | | 80,503 | | | | 4,201,452 | |
DaVita, Inc. (a) | | | 17,119 | | | | 1,354,798 | |
Humana, Inc. | | | 11,664 | | | | 4,522,716 | |
McKesson Corp. | | | 28,525 | | | | 4,376,305 | |
UnitedHealth Group, Inc. | | | 47,293 | | | | 13,949,070 | |
| | | | | | | | |
| | | | | | | 36,567,119 | |
| | | | | | | | |
|
Health Care Technology 0.3% | |
Cerner Corp. | | | 11,334 | | | | 776,946 | |
Veeva Systems, Inc., Class A (a) | | | 5,967 | | | | 1,398,784 | |
| | | | | | | | |
| | | | | | | 2,175,730 | |
| | | | | | | | |
|
Hotels, Restaurants & Leisure 0.6% | |
Domino’s Pizza, Inc. | | | 11,213 | | | | 4,142,531 | |
| | | | | | | | |
|
Household Products 0.3% | |
Procter & Gamble Co. | | | 18,679 | | | | 2,233,448 | |
| | | | | | | | |
|
Interactive Media & Services 8.7% | |
Alphabet, Inc. (a) | |
Class A | | | 9,538 | | | | 13,525,361 | |
Class C | | | 11,369 | | | | 16,071,332 | |
Facebook, Inc., Class A (a) | | | 122,525 | | | | 27,821,752 | |
| | | | | | | | |
| | | | | | | 57,418,445 | |
| | | | | | | | |
| | | | |
| 10 | | MainStay VP MacKay Growth Portfolio | | The notes to the financial statements are an integral part of,
and should be read in conjunction with, the financial statements. |
| | | | | | | | |
| | | Shares | | | Value | |
| Common Stocks (continued) | |
Internet & Direct Marketing Retail 10.4% | |
Amazon.com, Inc. (a) | | | 18,605 | | | $ | 51,327,846 | |
Booking Holdings, Inc. (a) | | | 3,795 | | | | 6,042,930 | |
eBay, Inc. | | | 100,199 | | | | 5,255,438 | |
Etsy, Inc. (a) | | | 25,483 | | | | 2,707,059 | |
Qurate Retail, Inc., Series A (a) | | | 392,183 | | | | 3,725,739 | |
| | | | | | | | |
| | | | | | | 69,059,012 | |
| | | | | | | | |
|
IT Services 8.4% | |
Accenture PLC, Class A | | | 11,501 | | | | 2,469,495 | |
Akamai Technologies, Inc. (a) | | | 40,935 | | | | 4,383,729 | |
Booz Allen Hamilton Holding Corp. | | | 13,148 | | | | 1,022,783 | |
CACI International, Inc., Class A (a) | | | 475 | | | | 103,018 | |
DXC Technology Co. | | | 113,701 | | | | 1,876,066 | |
GoDaddy, Inc., Class A (a) | | | 53,148 | | | | 3,897,343 | |
Leidos Holdings, Inc. | | | 38,214 | | | | 3,579,505 | |
Mastercard, Inc., Class A | | | 45,036 | | | | 13,317,145 | |
PayPal Holdings, Inc. (a) | | | 54,098 | | | | 9,425,495 | |
Twilio, Inc., Class A (a) | | | 4,779 | | | | 1,048,608 | |
Visa, Inc., Class A | | | 75,599 | | | | 14,603,459 | |
| | | | | | | | |
| | | | | | | 55,726,646 | |
| | | | | | | | |
|
Life Sciences Tools & Services 1.7% | |
Bruker Corp. | | | 7,208 | | | | 293,222 | |
Charles River Laboratories International, Inc. (a) | | | 18,555 | | | | 3,235,064 | |
IQVIA Holdings, Inc. (a) | | | 29,232 | | | | 4,147,436 | |
PRA Health Sciences, Inc. (a) | | | 37,000 | | | | 3,599,730 | |
Thermo Fisher Scientific, Inc. | | | 265 | | | | 96,020 | |
| | | | | | | | |
| | | | | | | 11,371,472 | |
| | | | | | | | |
|
Media 1.4% | |
Altice U.S.A., Inc., Class A (a) | | | 120,167 | | | | 2,708,564 | |
Charter Communications, Inc., Class A (a) | | | 12,605 | | | | 6,429,055 | |
Interpublic Group of Cos., Inc. | | | 7,626 | | | | 130,862 | |
| | | | | | | | |
| | | | | | | 9,268,481 | |
| | | | | | | | |
|
Multiline Retail 0.9% | |
Dollar General Corp. | | | 30,045 | | | | 5,723,873 | |
| | | | | | | | |
|
Oil, Gas & Consumable Fuels 0.2% | |
HollyFrontier Corp. | | | 42,497 | | | | 1,240,912 | |
| | | | | | | | |
|
Personal Products 0.3% | |
Herbalife Nutrition, Ltd. (a) | | | 41,597 | | | | 1,871,033 | |
Nu Skin Enterprises, Inc., Class A | | | 9,531 | | | | 364,370 | |
| | | | | | | | |
| | | | | | | 2,235,403 | |
| | | | | | | | |
| | | | | | | | |
| | | Shares | | | Value | |
Pharmaceuticals 1.0% | |
Eli Lilly and Co. | | | 15,650 | | | $ | 2,569,417 | |
Merck & Co., Inc. | | | 52,701 | | | | 4,075,368 | |
| | | | | | | | |
| | | | | | | 6,644,785 | |
| | | | | | | | |
|
Professional Services 0.7% | |
CoreLogic, Inc. | | | 14,208 | | | | 955,062 | |
ManpowerGroup, Inc. | | | 51,959 | | | | 3,572,181 | |
| | | | | | | | |
| | | | | | | 4,527,243 | |
| | | | | | | | |
|
Road & Rail 1.1% | |
Old Dominion Freight Line, Inc. | | | 21,879 | | | | 3,710,460 | |
Schneider National, Inc., Class B | | | 68,954 | | | | 1,701,095 | |
Union Pacific Corp. | | | 9,325 | | | | 1,576,578 | |
| | | | | | | | |
| | | | | | | 6,988,133 | |
| | | | | | | | |
|
Semiconductors & Semiconductor Equipment 6.9% | |
Advanced Micro Devices, Inc. (a) | | | 14,925 | | | | 785,204 | |
Applied Materials, Inc. | | | 88,121 | | | | 5,326,914 | |
Broadcom, Inc. | | | 28,215 | | | | 8,904,936 | |
Inphi Corp. (a) | | | 6,761 | | | | 794,418 | |
KLA Corp. | | | 25,425 | | | | 4,944,654 | |
Lam Research Corp. | | | 9,400 | | | | 3,040,524 | |
NVIDIA Corp. | | | 35,928 | | | | 13,649,407 | |
QUALCOMM, Inc. | | | 90,381 | | | | 8,243,651 | |
SolarEdge Technologies, Inc. (a) | | | 1,886 | | | | 261,739 | |
| | | | | | | | |
| | | | | | | 45,951,447 | |
| | | | | | | | |
|
Software 21.4% | |
Adobe, Inc. (a) | | | 25,601 | | | | 11,144,371 | |
Alteryx, Inc., Class A (a) | | | 2,350 | | | | 386,058 | |
Anaplan, Inc. (a) | | | 5,806 | | | | 263,070 | |
Atlassian Corp. PLC, Class A (a) | | | 25,790 | | | | 4,649,163 | |
Autodesk, Inc. (a) | | | 21,615 | | | | 5,170,092 | |
CDK Global, Inc. | | | 75,948 | | | | 3,145,766 | |
Coupa Software, Inc. (a) | | | 2,964 | | | | 821,147 | |
Dropbox, Inc., Class A (a) | | | 167,813 | | | | 3,653,289 | |
Fair Isaac Corp. (a) | | | 9,750 | | | | 4,075,890 | |
Fortinet, Inc. (a) | | | 32,085 | | | | 4,404,308 | |
Intuit, Inc. | | | 15,214 | | | | 4,506,235 | |
Microsoft Corp. | | | 329,028 | | | | 66,960,488 | |
Oracle Corp. | | | 13,521 | | | | 747,306 | |
Palo Alto Networks, Inc. (a) | | | 19,929 | | | | 4,577,093 | |
Proofpoint, Inc. (a) | | | 35,337 | | | | 3,926,647 | |
RingCentral, Inc., Class A (a) | | | 3,414 | | | | 973,024 | |
salesforce.com, Inc. (a) | | | 35,935 | | | | 6,731,704 | |
ServiceNow, Inc. (a) | | | 17,399 | | | | 7,047,639 | |
SS&C Technologies Holdings, Inc. | | | 27,988 | | | | 1,580,762 | |
Synopsys, Inc. (a) | | | 6,436 | | | | 1,255,020 | |
Workday, Inc., Class A (a) | | | 9,196 | | | | 1,722,963 | |
Zendesk, Inc. (a) | | | 5,072 | | | | 449,024 | |
| | | | | | |
The notes to the financial statements are an integral part of,
and should be read in conjunction with, the financial statements. | | | | | 11 | |
Portfolio of Investments June 30, 2020 (Unaudited) (continued)
| | | | | | | | |
| | | Shares | | | Value | |
| Common Stocks (continued) | |
Software (continued) | |
Zoom Video Communications, Inc., Class A (a) | | | 13,598 | | | $ | 3,447,637 | |
| | | | | | | | |
| | | | | | | 141,638,696 | |
| | | | | | | | |
|
Specialty Retail 2.9% | |
AutoZone, Inc. (a) | | | 2,530 | | | | 2,854,144 | |
Best Buy Co., Inc. | | | 44,799 | | | | 3,909,609 | |
Home Depot, Inc. | | | 9,609 | | | | 2,407,150 | |
Lowe’s Cos., Inc. | | | 6,995 | | | | 945,164 | |
O’Reilly Automotive, Inc. (a) | | | 11,741 | | | | 4,950,827 | |
Tractor Supply Co. | | | 32,730 | | | | 4,313,487 | |
| | | | | | | | |
| | | | | | | 19,380,381 | |
| | | | | | | | |
|
Technology Hardware, Storage & Peripherals 8.9% | |
Apple, Inc. | | | 162,323 | | | | 59,215,430 | |
| | | | | | | | |
|
Textiles, Apparel & Luxury Goods 0.3% | |
NIKE, Inc., Class B | | | 18,079 | | | | 1,772,646 | |
| | | | | | | | |
Total Common Stocks
(Cost $499,131,998) | | | | 658,717,535 | |
| | | | | | | | |
|
| Exchange-Traded Fund 0.6% | |
iShares Russell 1000 Growth ETF | | | 21,045 | | | | 4,039,588 | |
| | | | | | | | |
Total Exchange-Traded Fund
(Cost $3,711,462) | | | | 4,039,588 | |
| | | | | | | | |
| | | | | | | | |
| | | Shares | | | Value | |
| Short-Term Investment 0.1% | |
Affiliated Investment Company 0.1% | |
MainStay U.S. Government Liquidity Fund,
0.05% (c) | | | 802,691 | | | $ | 802,691 | |
| | | | | | | | |
Total Short-Term Investment
(Cost $802,691) | | | | 802,691 | |
| | | | | | | | |
Total Investments
(Cost $503,646,151) | | | 100.1 | % | | | 663,559,814 | |
Other Assets, Less Liabilities | | | (0.1 | ) | | | (403,689 | ) |
| | | | | | | | |
Net Assets | | | 100.0 | % | | $ | 663,156,125 | |
| | | | | | | | |
| † | Percentages indicated are based on Portfolio net assets. |
| (a) | Non-income producing security. |
| (b) | Fair valued security—Represents fair value as measured in good faith under procedures approved by the Board of Trustees. As of June 30, 2020, the total market value of fair valued securities was $2,418,600, which represented less than one tenth percent of the Portfolio’s net assets. |
| (c) | Current yield as of June 30, 2020. |
The following abbreviation is used in the preceding pages:
ETF—Exchange-Traded Fund
The following is a summary of the fair valuations according to the inputs used as of June 30, 2020, for valuing the Portfolio’s assets:
| | | | | | | | | | | | | | | | |
Description | | Quoted
Prices in
Active
Markets for
Identical
Assets (Level 1) | | | Significant
Other
Observable
Inputs (Level 2) | | | Significant
Unobservable
Inputs (Level 3) | | | Total | |
| | | | |
Asset Valuation Inputs | | | | | | | | | | | | | | | | |
Investments in Securities (a) | | | | | | | | | |
Common Stocks | | $ | 656,298,935 | | | $ | 2,418,600 | | | $ | — | | | $ | 658,717,535 | |
Exchange-Traded Fund | | | 4,039,588 | | | | — | | | | — | | | | 4,039,588 | |
Short-Term Investment | | | | | | | | | |
Affiliated Investment Company | | | 802,691 | | | | — | | | | — | | | | 802,691 | |
| | | | | | | | | | | | | | | | |
Total Investments in Securities | | $ | 661,141,214 | | | $ | 2,418,600 | | | $ | — | | | $ | 663,559,814 | |
| | | | | | | | | | | | | | | | |
| (a) | For a complete listing of investments and their industries, see the Portfolio of Investments. |
| | | | |
| 12 | | MainStay VP MacKay Growth Portfolio | | The notes to the financial statements are an integral part of,
and should be read in conjunction with, the financial statements. |
Statement of Assets and Liabilities as of June 30, 2020 (Unaudited)
| | | | |
| Assets | | | | |
Investment in unaffiliated securities, at value (identified cost $502,843,460) | | $ | 662,757,123 | |
Investment in affiliated investment company, at value (identified cost $802,691) | | | 802,691 | |
Receivables: | | | | |
Dividends | | | 210,761 | |
Portfolio shares sold | | | 4,900 | |
Securities lending | | | 6 | |
Other assets | | | 3,342 | |
| | | | |
Total assets | | | 663,778,823 | |
| | | | |
| |
| Liabilities | | | | |
Payables: | | | | |
Manager (See Note 3) | | | 371,567 | |
Portfolio shares redeemed | | | 174,462 | |
Shareholder communication | | | 32,020 | |
Professional fees | | | 21,394 | |
NYLIFE Distributors (See Note 3) | | | 10,693 | |
Custodian | | | 8,416 | |
Trustees | | | 833 | |
Accrued expenses | | | 3,313 | |
| | | | |
Total liabilities | | | 622,698 | |
| | | | |
Net assets | | $ | 663,156,125 | |
| | | | |
| |
| Composition of Net Assets | | | | |
Shares of beneficial interest outstanding (par value of $.001 per share) unlimited number of shares authorized | | $ | 19,058 | |
Additional paid-in capital | | | 427,648,702 | |
| | | | |
| | | 427,667,760 | |
Total distributable earnings (loss) | | | 235,488,365 | |
| | | | |
Net assets | | $ | 663,156,125 | |
| | | | |
| | | | |
Initial Class | | | | |
Net assets applicable to outstanding shares | | $ | 610,798,442 | |
| | | | |
Shares of beneficial interest outstanding | | | 17,532,170 | |
| | | | |
Net asset value per share outstanding | | $ | 34.84 | |
| | | | |
Service Class | | | | |
Net assets applicable to outstanding shares | | $ | 52,357,683 | |
| | | | |
Shares of beneficial interest outstanding | | | 1,525,407 | |
| | | | |
Net asset value per share outstanding | | $ | 34.32 | |
| | | | |
| | | | | | |
The notes to the financial statements are an integral part of,
and should be read in conjunction with, the financial statements. | | | | | 13 | |
Statement of Operations for the six months ended June 30, 2020 (Unaudited)
| | | | |
| Investment Income (Loss) | | | | |
Income | | | | |
Dividends-unaffiliated | | $ | 3,479,414 | |
Dividends-affiliated | | | 635 | |
Securities lending | | | 49 | |
| | | | |
Total income | | | 3,480,098 | |
| | | | |
Expenses | | | | |
Manager (See Note 3) | | | 2,222,224 | |
Distribution/Service—Service Class (See Note 3) | | | 63,294 | |
Professional fees | | | 45,391 | |
Shareholder communication | | | 32,850 | |
Custodian | | | 16,435 | |
Trustees | | | 7,955 | |
Miscellaneous | | | 11,990 | |
| | | | |
Total expenses | | | 2,400,139 | |
| | | | |
Net investment income (loss) | | | 1,079,959 | |
| | | | |
|
| Realized and Unrealized Gain (Loss) on Investments | |
Net realized gain (loss) on unaffiliated investments | | | 11,754,141 | |
Net change in unrealized appreciation (depreciation) on unaffiliated investments | | | 28,262,130 | |
| | | | |
Net realized and unrealized gain (loss) on investments | | | 40,016,271 | |
| | | | |
Net increase (decrease) in net assets resulting from operations | | $ | 41,096,230 | |
| | | | |
| | | | |
| 14 | | MainStay VP MacKay Growth Portfolio | | The notes to the financial statements are an integral part of,
and should be read in conjunction with, the financial statements. |
Statements of Changes in Net Assets
for the six months ended June 30, 2020 (Unaudited) and the year ended December 31, 2019
| | | | | | | | |
| | | 2020 | | | 2019 | |
| Increase (Decrease) in Net Assets | | | | | |
Operations: | | | | | | | | |
Net investment income (loss) | | $ | 1,079,959 | | | $ | 3,500,855 | |
Net realized gain (loss) on investments | | | 11,754,141 | | | | 63,339,088 | |
Net change in unrealized appreciation (depreciation) on investments | | | 28,262,130 | | | | 95,862,626 | |
| | | | |
Net increase (decrease) in net assets resulting from operations | | | 41,096,230 | | | | 162,702,569 | |
| | | | |
Distributions to shareholders: | | | | | | | | |
Initial Class | | | — | | | | (56,327,914 | ) |
Service Class | | | — | | | | (4,862,710 | ) |
| | | | |
Total distributions to shareholders | | | — | | | | (61,190,624 | ) |
| | | | |
Capital share transactions: | | | | | | | | |
Net proceeds from sale of shares | | | 6,624,651 | | | | 116,738,533 | |
Net asset value of shares issued to shareholders in reinvestment of distributions | | | — | | | | 61,190,624 | |
Cost of shares redeemed | | | (92,767,413 | ) | | | (84,449,310 | ) |
| | | | |
Increase (decrease) in net assets derived from capital share transactions | | | (86,142,762 | ) | | | 93,479,847 | |
| | | | |
Net increase (decrease) in net assets | | | (45,046,532 | ) | | | 194,991,792 | |
| | |
| Net Assets | | | | | | | | |
Beginning of period | | | 708,202,657 | | | | 513,210,865 | |
| | | | |
End of period | | $ | 663,156,125 | | | $ | 708,202,657 | |
| | | | |
| | | | | | |
The notes to the financial statements are an integral part of,
and should be read in conjunction with, the financial statements. | | | | | 15 | |
Financial Highlights selected per share data and ratios
| | | | | | | | | | | | | | | | | | | | | | | | |
| | |
| | | Six months
ended June 30, | | | Year ended December 31, | |
| | | | | | |
| Initial Class | | 2020* | | | 2019 | | | 2018 | | | 2017 | | | 2016 | | | 2015 | |
| | | | | | |
Net asset value at beginning of period | | $ | 32.64 | | | $ | 27.74 | | | $ | 30.87 | | | $ | 23.90 | | | $ | 26.09 | | | $ | 29.42 | |
| | | | | | | | | | | | | | | | | | | | | | | | |
| | | | | | |
Net investment income (loss) (a) | | | 0.06 | | | | 0.18 | | | | 0.19 | | | | 0.19 | | | | 0.09 | | | | 0.04 | |
| | | | | | |
Net realized and unrealized gain (loss) on investments | | | 2.14 | | | | 7.77 | | | | (1.10 | ) | | | 7.05 | | | | (0.02 | ) | | | 0.58 | |
| | | | | | | | | | | | | | | | | | | | | | | | |
| | | | | | |
Total from investment operations | | | 2.20 | | | | 7.95 | | | | (0.91 | ) | | | 7.24 | | | | 0.07 | | | | 0.62 | |
| | | | | | | | | | | | | | | | | | | | | | | | |
| | | | | | |
| Less distributions: | | | | | | | | | | | | | | | | | | | | | | | | |
| | | | | | |
From net investment income | | | — | | | | (0.19 | ) | | | (0.21 | ) | | | (0.07 | ) | | | (0.04 | ) | | | — | |
| | | | | | |
From net realized gain on investments | | | — | | | | (2.86 | ) | | | (2.01 | ) | | | (0.20 | ) | | | (2.22 | ) | | | (3.95 | ) |
| | | | | | | | | | | | | | | | | | | | | | | | |
| | | | | | |
Total distributions | | | — | | | | (3.05 | ) | | | (2.22 | ) | | | (0.27 | ) | | | (2.26 | ) | | | (3.95 | ) |
| | | | | | | | | | | | | | | | | | | | | | | | |
| | | | | | |
Net asset value at end of period | | $ | 34.84 | | | $ | 32.64 | | | $ | 27.74 | | | $ | 30.87 | | | $ | 23.90 | | | $ | 26.09 | |
| | | | | | | | | | | | | | | | | | | | | | | | |
| | | | | | |
Total investment return (b) | | | 6.74 | %(c) | | | 30.01 | % | | | (4.24 | %) | | | 30.41 | % | | | 0.40 | % | | | 2.58 | % |
| | | | | | |
| Ratios (to average net assets)/Supplemental Data: | | | | | | | | | | | | | | | | | | | | | | | | |
| | | | | | |
Net investment income (loss) | | | 0.35 | %†† | | | 0.56 | % | | | 0.60 | % | | | 0.71 | % | | | 0.35 | %(d) | | | 0.15 | % |
| | | | | | |
Net expenses (e) | | | 0.72 | %†† | | | 0.72 | % | | | 0.73 | % | | | 0.74 | % | | | 0.76 | %(f) | | | 0.73 | % |
| | | | | | |
Portfolio turnover rate | | | 97 | % | | | 156 | % | | | 127 | % | | | 141 | % | | | 177 | % | | | 112 | % |
| | | | | | |
Net assets at end of period (in 000’s) | | $ | 610,798 | | | $ | 652,081 | | | $ | 461,537 | | | $ | 525,483 | | | $ | 337,401 | | | $ | 370,679 | |
| (a) | Per share data based on average shares outstanding during the period. |
| (b) | Total return does not reflect any deduction of sales charges, mortality and expense charges, contract charges or administrative charges. For periods of less than one year, total return is not annualized. |
| (c) | Total investment return may reflect adjustments to conform to generally accepted accounting principles. |
| (d) | Without the custody fee reimbursement, net investment income (loss) would have been 0.34%. |
| (e) | In addition to the fees and expenses which the Portfolio bears directly, it also indirectly bears a pro-rata share of the fees and expenses of the underlying funds in which it invests. Such indirect expenses are not included in the above expense ratios. |
| (f) | Without the custody fee reimbursement, net expenses would have been 0.77%. |
| | | | |
| 16 | | MainStay VP MacKay Growth Portfolio | | The notes to the financial statements are an integral part of,
and should be read in conjunction with, the financial statements. |
Financial Highlights selected per share data and ratios
| | | | | | | | | | | | | | | | | | | | | | | | |
| | |
| | | Six months
ended
June 30, | | | Year ended December 31, | |
| | | | | | |
| Service Class | | 2020* | | | 2019 | | | 2018 | | | 2017 | | | 2016 | | | 2015 | |
| | | | | | |
Net asset value at beginning of period | | $ | 32.19 | | | $ | 27.38 | | | $ | 30.50 | | | $ | 23.62 | | | $ | 25.83 | | | $ | 29.24 | |
| | | | | | | | | | | | | | | | | | | | | | | | |
| | | | | | |
Net investment income (loss) (a) | | | 0.02 | | | | 0.10 | | | | 0.11 | | | | 0.12 | | | | 0.02 | | | | (0.03 | ) |
| | | | | | |
Net realized and unrealized gain (loss) on investments | | | 2.11 | | | | 7.66 | | | | (1.10 | ) | | | 6.97 | | | | (0.01 | ) | | | 0.57 | |
| | | | | | | | | | | | | | | | | | | | | | | | |
| | | | | | |
Total from investment operations | | | 2.13 | | | | 7.76 | | | | (0.99 | ) | | | 7.09 | | | | 0.01 | | | | 0.54 | |
| | | | | | | | | | | | | | | | | | | | | | | | |
| | | | | | |
| Less distributions: | | | | | | | | | | | | | | | | | | | | | | | | |
| | | | | | |
From net investment income | | | — | | | | (0.09 | ) | | | (0.12 | ) | | | (0.01 | ) | | | — | | | | — | |
| | | | | | |
From net realized gain on investments | | | — | | | | (2.86 | ) | | | (2.01 | ) | | | (0.20 | ) | | | (2.22 | ) | | | (3.95 | ) |
| | | | | | | | | | | | | | | | | | | | | | | | |
| | | | | | |
Total distributions | | | — | | | | (2.95 | ) | | | (2.13 | ) | | | (0.21 | ) | | | (2.22 | ) | | | (3.95 | ) |
| | | | | | | | | | | | | | | | | | | | | | | | |
| | | | | | |
Net asset value at end of period | | $ | 34.32 | | | $ | 32.19 | | | $ | 27.38 | | | $ | 30.50 | | | $ | 23.62 | | | $ | 25.83 | |
| | | | | | | | | | | | | | | | | | | | | | | | |
| | | | | | |
Total investment return (b) | | | 6.62 | % | | | 29.69 | % | | | (4.48 | %) | | | 30.09 | % | | | 0.15 | % | | | 2.33 | % |
| | | | | | |
| Ratios (to average net assets)/Supplemental Data: | | | | | | | | | | | | | | | | | | | | | | | | |
| | | | | | |
Net investment income (loss) | | | 0.11 | %†† | | | 0.32 | % | | | 0.35 | % | | | 0.46 | % | | | 0.10 | %(c) | | | (0.09 | %) |
| | | | | | |
Net expenses (d) | | | 0.97 | %†† | | | 0.97 | % | | | 0.98 | % | | | 0.99 | % | | | 1.01 | %(e) | | | 0.98 | % |
| | | | | | |
Portfolio turnover rate | | | 97 | % | | | 156 | % | | | 127 | % | | | 141 | % | | | 177 | % | | | 112 | % |
| | | | | | |
Net assets at end of period (in 000’s) | | $ | 52,358 | | | $ | 56,122 | | | $ | 51,674 | | | $ | 66,735 | | | $ | 58,448 | | | $ | 63,846 | |
| (a) | Per share data based on average shares outstanding during the period. |
| (b) | Total return does not reflect any deduction of sales charges, mortality and expense charges, contract charges or administrative charges. For periods of less than one year, total return is not annualized. |
| (c) | Without the custody fee reimbursement, net investment income (loss) would have been 0.09%. |
| (d) | In addition to the fees and expenses which the Portfolio bears directly, it also indirectly bears a pro-rata share of the fees and expenses of the underlying funds in which it invests. Such indirect expenses are not included in the above expense ratios. |
| (e) | Without the custody fee reimbursement, net expenses would have been 1.02%. |
| | | | | | |
The notes to the financial statements are an integral part of,
and should be read in conjunction with, the financial statements. | | | | | 17 | |
Notes to Financial Statements (Unaudited)
Note 1–Organization and Business
MainStay VP Funds Trust (the ‘‘Fund’’) was organized as a Delaware statutory trust on February 1, 2011. The Fund is registered under the Investment Company Act of 1940, as amended (the “1940 Act”), as an open-end management investment company. The Fund is comprised of thirty-one separate series (collectively referred to as the “Portfolios”). These financial statements and notes relate to the MainStay VP MacKay Growth Portfolio (the “Portfolio”), a “diversified” portfolio, as that term is defined in the 1940 Act, as interpreted or modified by regulatory authorities having jurisdiction, from time to time.
Shares of the Portfolio are currently offered to certain separate accounts to fund variable annuity policies and variable universal life insurance policies issued by New York Life Insurance and Annuity Corporation (“NYLIAC”), a wholly-owned subsidiary of New York Life Insurance Company (“New York Life”) and may also be offered to fund variable annuity policies and variable universal life insurance policies issued by other insurance companies. NYLIAC allocates shares of the Portfolios to, among others, certain NYLIAC separate accounts. Shares of the Portfolio are also offered to the MainStay VP Conservative Allocation Portfolio, MainStay VP Moderate Allocation Portfolio, MainStay VP Moderate Growth Allocation Portfolio and MainStay VP Growth Allocation Portfolio, which operate as “funds-of-funds,” and other variable insurance funds.
The Portfolio currently offers two classes of shares. Initial Class shares commenced operations on January 29, 1993. Service Class shares commenced operations on June 5, 2003. Shares of the Portfolio are offered and are redeemed at a price equal to their respective net asset value (“NAV”) per share. No sales or redemption charge is applicable to the purchase or redemption of the Portfolio’s shares. Under the terms of the Fund’s multiple class plan adopted pursuant to Rule 18f-3 under the 1940 Act, the classes differ in that, among other things, Service Class shares of the Portfolio pay a combined distribution and service fee of 0.25% of average daily net assets attributable to Service Class shares of the Portfolio to the Distributor (as defined in Note 3(B)) pursuant to a plan adopted in accordance with Rule 12b-1 under the 1940 Act. Contract owners of variable annuity contracts purchased after June 2, 2003, are permitted to invest only in the Service Class shares.
The Portfolio’s investment objective is to seek long-term growth of capital.
Note 2–Significant Accounting Policies
The Portfolio is an investment company and accordingly follows the investment company accounting and reporting guidance of the Financial Accounting Standards Board (“FASB”) Accounting Standard Codification Topic 946 Financial Services – Investment Companies. The Portfolio prepares its financial statements in accordance with generally accepted accounting principles (“GAAP”) in the United States of America and follows the significant accounting policies described below.
(A) Securities Valuation. Investments are usually valued as of the close of regular trading on the New York Stock Exchange (the “Exchange”) (usually 4:00 p.m. Eastern time) on each day the Portfolio is open for business (“valuation date”).
The Board of Trustees of the Fund (the “Board”) adopted procedures establishing methodologies for the valuation of the Portfolio’s securities and other assets and delegated the responsibility for valuation determinations under those procedures to the Valuation Committee of the Fund (the “Valuation Committee”). The procedures state that, subject to the oversight of the Board and unless otherwise noted, the responsibility for the day-to-day valuation of portfolio assets (including fair value measurements for the Portfolio’s assets and liabilities) rests with New York Life Investment Management LLC (“New York Life Investments” or the “Manager”), aided to whatever extent necessary by the Subadvisor (as defined in Note 3(A)). To assess the appropriateness of security valuations, the Manager, the Subadvisor or the Portfolio’s third-party service provider, who is subject to oversight by the Manager, regularly compares prior day prices, prices on comparable securities and the sale prices to the prior and current day prices and challenges prices with changes exceeding certain tolerance levels with third-party pricing services or broker sources.
The Board authorized the Valuation Committee to appoint a Valuation Subcommittee (the “Subcommittee”) to establish the prices of securities for which market quotations are not readily available or the prices of which are not otherwise readily determinable under the procedures. The Subcommittee meets (in person, via electronic mail or via teleconference) on an as-needed basis. The Valuation Committee meets to ensure that actions taken by the Subcommittee were appropriate.
For those securities valued through either a standardized fair valuation methodology or a fair valuation measurement, the Subcommittee deals with such valuation and the Valuation Committee reviews and affirms, if appropriate, the reasonableness of the valuation based on such methodologies and measurements on a regular basis after considering information that is reasonably available and deemed relevant by the Valuation Committee. Any action taken by the Subcommittee with respect to the valuation of a portfolio security or other asset is submitted for review and ratification (if appropriate) to the Valuation Committee and the Board at the next regularly scheduled meeting.
“Fair value” is defined as the price the Portfolio would reasonably expect to receive upon selling an asset or liability in an orderly transaction to an independent buyer in the principal or most advantageous market for the asset or liability. Fair value measurements are determined within a framework that establishes a three-tier hierarchy that maximizes the use of observable market data and minimizes the use of unobservable inputs to establish a classification of fair value measurements for disclosure purposes. “Inputs” refer broadly to the assumptions that market participants would use in pricing the asset or liability, including assumptions about risk, such as the risk inherent in a particular valuation technique used to measure fair value using a pricing model and/or the risk inherent in the inputs for the valuation technique. Inputs may be observable or unobservable. Observable inputs reflect the assumptions market participants would use in pricing the asset or liability based on market data obtained from sources independent of the Portfolio. Unobservable inputs reflect the Portfolio’s own assumptions about the assumptions market participants would use in pricing the asset or liability based on the information available. The inputs or methodology used for valuing assets or liabilities may not be an indication of the risks
| | |
| 18 | | MainStay VP MacKay Growth Portfolio |
associated with investing in those assets or liabilities. The three-tier hierarchy of inputs is summarized below.
| • | | Level 1—quoted prices in active markets for an identical asset or liability |
| • | | Level 2—other significant observable inputs (including quoted prices for a similar asset or liability in active markets, interest rates and yield curves, prepayment speeds, credit risk, etc.) |
| • | | Level 3—significant unobservable inputs (including the Portfolio’s own assumptions about the assumptions that market participants would use in measuring fair value of an asset or liability) |
The level of an asset or liability within the fair value hierarchy is based on the lowest level of an input, both individually and in the aggregate, that is significant to the fair value measurement. The aggregate value by input level of the Portfolio’s assets and liabilities as of June 30, 2020 is included at the end of the Portfolio of Investments.
The Portfolio may use third-party vendor evaluations, whose prices may be derived from one or more of the following standard inputs, among others:
| | |
• Broker/dealer quotes | | • Benchmark securities |
• Two-sided markets | | • Reference data (corporate actions or material event notices) |
• Bids/offers | | • Monthly payment information |
• Industry and economic events | | • Reported trades |
An asset or liability for which market values cannot be measured using the methodologies described above is valued by methods deemed reasonable in good faith by the Valuation Committee, following the procedures established by the Board, to represent fair value. Under these procedures, the Portfolio generally uses a market-based approach which may use related or comparable assets or liabilities, recent transactions, market multiples, book values and other relevant information. The Portfolio may also use an income-based valuation approach in which the anticipated future cash flows of the asset or liability are discounted to calculate fair value. Discounts may also be applied due to the nature and/or duration of any restrictions on the disposition of the asset or liability. Fair value represents a good faith approximation of the value of a security. Fair value determinations involve the consideration of a number of subjective factors, an analysis of applicable facts and circumstances and the exercise of judgment. As a result, it is possible that the fair value for a security determined in good faith in accordance with the Portfolio’s valuation procedures may differ from valuations for the same security determined by other funds using their own valuation procedures. Although the Portfolio’s valuation procedures are designed to value a security at the price the Portfolio may reasonably expect to receive upon the security’s sale in an orderly transaction, there can be no assurance that any fair value determination thereunder would, in fact, approximate the amount that the Portfolio would actually realize upon the sale of the security or the price at which the security would trade if a reliable market price were readily available. During the six-month period ended June 30, 2020, there were no material changes to the fair value methodologies.
Securities which may be valued in this manner include, but are not limited to: (i) a security for which trading has been halted or suspended;
(ii) a debt security that has recently gone into default and for which there is not a current market quotation; (iii) a security of an issuer that has entered into a restructuring; (iv) a security that has been delisted from a national exchange; (v) a security for which the market price is not readily available from a third-party pricing source or, if so provided, does not, in the opinion of the Manager or the Subadvisor, reflect the security’s market value; (vi) a security subject to trading collars for which no or limited trading takes place; and (vii) a security whose principal market has been temporarily closed at a time when, under normal conditions, it would be open. Securities valued in this manner are generally categorized as Level 3 in the hierarchy. As of June 30, 2020, no securities held by the Portfolio were fair valued in such a manner.
Equity securities, including exchange-traded funds (“ETFs”), are valued at the last quoted sales prices as of the close of regular trading on the relevant exchange on each valuation date. Securities that are not traded on the valuation date are valued at the mean of the last quoted bid and ask prices. Prices are normally taken from the principal market in which each security trades. These securities are generally categorized as Level 1 in the hierarchy.
Investments in mutual funds, including money market funds, are valued at their respective NAVs as of the close of the Exchange on the valuation date. These securities are generally categorized as Level 1 in the hierarchy.
Temporary cash investments acquired in excess of 60 days to maturity at the time of purchase are valued using the latest bid prices or using valuations based on a matrix system (which considers such factors as security prices, yields, maturities and ratings), both as furnished by independent pricing services. Temporary cash investments that mature in 60 days or less at the time of purchase (“Short-Term Investments”) are valued using the amortized cost method of valuation, unless the use of such method would be inappropriate. The amortized cost method involves valuing a security at its cost on the date of purchase and thereafter assuming a constant amortization to maturity of the difference between such cost and the value on maturity date. Amortized cost approximates the current fair value of a security. Securities valued using the amortized cost method are not valued using quoted prices in an active market and are generally categorized as Level 2 in the hierarchy.
The information above is not intended to reflect an exhaustive list of the methodologies that may be used to value portfolio investments. The valuation procedures permit the use of a variety of valuation methodologies in connection with valuing portfolio investments. The methodology used for a specific type of investment may vary based on the market data available or other considerations. The methodologies summarized above may not represent the specific means by which portfolio investments are valued on any particular business day.
(B) Income Taxes. The Portfolio’s policy is to comply with the requirements of the Internal Revenue Code of 1986, as amended (the “Internal Revenue Code”), applicable to regulated investment companies and to distribute all of its taxable income to the shareholders of the Portfolio within the allowable time limits.
The Manager evaluates the Portfolio’s tax positions to determine if the tax positions taken meet the minimum recognition threshold in connection with accounting for uncertainties in income tax positions taken
Notes to Financial Statements (Unaudited) (continued)
or expected to be taken for the purposes of measuring and recognizing tax liabilities in the financial statements. Recognition of tax benefits of an uncertain tax position is permitted only to the extent the position is “more likely than not” to be sustained assuming examination by taxing authorities. The Manager analyzed the Portfolio’s tax positions taken on federal, state and local income tax returns for all open tax years (for up to three tax years) and has concluded that no provisions for federal, state and local income tax are required in the Portfolio’s financial statements. The Portfolio’s federal, state and local income tax and federal excise tax returns for tax years for which the applicable statutes of limitations have not expired are subject to examination by the Internal Revenue Service and state and local departments of revenue.
(C) Dividends and Distributions to Shareholders. Dividends and distributions are recorded on the ex-dividend date. The Portfolio intends to declare and pay dividends from net investment income and distributions from net realized capital and currency gains, if any, at least annually. Unless a shareholder elects otherwise, all dividends and distributions are reinvested at NAV in the same class of shares of the Portfolio. Dividends and distributions to shareholders are determined in accordance with federal income tax regulations and may differ from determinations using GAAP.
(D) Security Transactions and Investment Income. The Portfolio records security transactions on the trade date. Realized gains and losses on security transactions are determined using the identified cost method. Dividend income is recognized on the ex-dividend date, net of any foreign tax withheld at the source, and interest income is accrued as earned using the effective interest rate method. Distributions received from real estate investment trusts may be classified as dividends, capital gains and/or return of capital.
Investment income and realized and unrealized gains and losses on investments of the Portfolio are allocated pro rata to the separate classes of shares based upon their relative net assets on the date the income is earned or realized and unrealized gains and losses are incurred.
(E) Expenses. Expenses of the Fund are allocated to the individual Portfolios in proportion to the net assets of the respective Portfolios when the expenses are incurred, except where direct allocations of expenses can be made. Expenses (other than fees incurred under the distribution and service plans, further discussed in Note 3(B), which are charged directly to the Service Class shares) are allocated to separate classes of shares pro rata based upon their relative net assets on the date the expenses are incurred. The expenses borne by the Portfolio, including those of related parties to the Portfolio, are shown in the Statement of Operations.
Additionally, the Portfolio may invest in ETFs and mutual funds, which are subject to management fees and other fees that may cause the costs of investing in ETFs and mutual funds to be greater than the costs of owning the underlying securities directly. These indirect expenses of ETFs and mutual funds are not included in the amounts shown as expenses in the Portfolio’s Statement of Operations or in the expense ratios included in the Financial Highlights.
(F) Use of Estimates. In preparing financial statements in conformity with GAAP, the Manager makes estimates and assumptions that
affect the reported amounts and disclosures in the financial statements. Actual results could differ from those estimates.
(G) Securities Lending. In order to realize additional income, the Portfolio may engage in securities lending, subject to the limitations set forth in the 1940 Act and relevant guidance by the staff of the Securities and Exchange Commission (“SEC”). If the Portfolio engages in securities lending, the Portfolio will lend through its custodian, currently State Street Bank and Trust Company (“State Street”), acting as securities lending agent on behalf of the Portfolio. Under the current arrangement, State Street will manage the Portfolio’s collateral in accordance with the securities lending agency agreement between the Portfolio and State Street, and indemnify the Portfolio against counterparty risk. The loans will be collateralized by cash (which may be invested in a money market fund) and/or non-cash collateral (which may include U.S. Treasury securities and/or U.S. government agency securities issued or guaranteed by the United States government or its agencies or instrumentalities) at least equal at all times to the market value of the securities loaned. The Portfolio bears the risk of delay in recovery of, or loss of rights in, the securities loaned. The Portfolio may also record a realized gain or loss on securities deemed sold due to a borrower’s inability to return securities on loan. The Portfolio bears the risk of any loss on investment of cash collateral. The Portfolio will receive compensation for lending its securities in the form of fees or it will retain a portion of interest earned on the investment of any cash collateral. The Portfolio will also continue to receive interest and dividends on the securities loaned and any gain or loss in the market price of the securities loaned that may occur during the term of the loan will be for the account of the Portfolio. Income earned from securities lending activities, if any, is reflected in the Statement of Operations. As of June 30, 2020, the Portfolio did not have any portfolio securities on loan.
(H) Indemnifications. Under the Fund’s organizational documents, its officers and trustees are indemnified against certain liabilities that may arise out of performance of their duties to the Fund. Additionally, in the normal course of business, the Portfolio enters into contracts with third-party service providers that contain a variety of representations and warranties and that may provide general indemnifications. The Portfolio’s maximum exposure under these arrangements is unknown, as this would involve future claims that may be made against the Portfolio that have not yet occurred. The Manager believes that the risk of loss in connection with these potential indemnification obligations is remote. However, there can be no assurance that material liabilities related to such obligations will not arise in the future, which could adversely impact the Portfolio.
Note 3–Fees and Related Party Transactions
(A) Manager and Subadvisor. New York Life Investments, a registered investment adviser and an indirect, wholly-owned subsidiary of New York Life, serves as the Portfolio’s Manager, pursuant to an Amended and Restated Management Agreement (“Management Agreement”). The Manager provides offices, conducts clerical, recordkeeping and bookkeeping services and keeps most of the financial and accounting records required to be maintained by the Portfolio. Except for the portion of salaries and expenses that are the responsibility of the Portfolio, the Manager pays the salaries and expenses of all personnel affiliated with the Portfolio and certain operational expenses of the
| | |
| 20 | | MainStay VP MacKay Growth Portfolio |
Portfolio. The Portfolio reimburses New York Life Investments in an amount equal to the portion of the compensation of the Chief Compliance Officer attributable to the Portfolio. MacKay Shields LLC (“MacKay Shields” or the “Subadvisor”), a registered investment adviser and an indirect, wholly-owned subsidiary of New York Life, serves as Subadvisor to the Portfolio and is responsible for the day-to-day portfolio management of the Portfolio. Pursuant to the terms of an Amended and Restated Subadvisory Agreement (“Subadvisory Agreement”) between New York Life Investments and MacKay Shields, New York Life Investments pays for the services of the Subadvisor.
The Fund, on behalf of the Portfolio, pays New York Life Investments in its capacity as the Portfolio’s investment manager and administrator, pursuant to the Management Agreement, a monthly fee for the services performed and the facilities furnished at an annual rate of the Portfolio’s average daily net assets as follows: 0.70% up to $500 million; 0.65% from $500 million to $1 billion; 0.625% from $1 billion to $2 billion; and 0.60% in excess of $2 billion. During the six-month period ended June 30, 2020, the effective management fee rate was 0.69%.
During the six-month period ended June 30, 2020, New York Life Investments earned fees from the Portfolio in the amount of $2,222,224 and paid the Subadvisor in the amount of $1,111,112.
State Street provides sub-administration and sub-accounting services to the Portfolio pursuant to an agreement with New York Life Investments. These services include calculating the daily NAVs of the Portfolio,
maintaining the general ledger and sub-ledger accounts for the calculation of the Portfolio’s NAVs and assisting New York Life Investments in conducting various aspects of the Portfolio’s administrative operations. For providing these services to the Portfolio, State Street is compensated by New York Life Investments.
Pursuant to an agreement between the Fund and New York Life Investments, New York Life Investments is responsible for providing or procuring certain regulatory reporting services for the Portfolio. The Portfolio will reimburse New York Life Investments for the actual costs incurred by New York Life Investments in connection with providing or procuring these services for the Portfolio.
(B) Distribution and Service Fees. The Fund, on behalf of the Portfolio, has entered into a distribution agreement with NYLIFE Distributors LLC (the “Distributor”), an indirect, wholly-owned subsidiary of New York Life. The Portfolio has adopted a distribution plan (the “Plan”) in accordance with the provisions of Rule 12b-1 under the 1940 Act. Under the Plan, the Distributor has agreed to provide, through its affiliates or independent third parties, various distribution-related, shareholder and administrative support services to the Service Class shareholders. For its services, the Distributor is entitled to a combined distribution and service fee accrued daily and paid monthly at an annual rate of 0.25% of the average daily net assets attributable to the Service Class shares of the Portfolio.
(C) Investments in Affiliates (in 000’s). During the six-month period ended June 30, 2020, purchases and sales transactions, income earned from investments and shares held of investment companies managed by New York Life Investments or its affiliates were as follows:
| | | | | | | | | | | | | | | | | | | | | | | | | | | | | | | | | | | | |
Affiliated Investment Company | | Value,
Beginning
of Period | | | Purchases
at Cost | | | Proceeds
from
Sales | | | Net
Realized
Gain/(Loss)
on Sales | | | Change in
Unrealized
Appreciation/
(Depreciation) | | | Value,
End of
Period | | | Dividend
Income | | | Other
Distributions | | | Shares
End of
Period | |
MainStay U.S. Government Liquidity Fund | | $ | — | | | $ | 13,526 | | | $ | (12,723 | ) | | $ | — | | | $ | — | | | $ | 803 | | | $ | 1 | | | $ | — | | | | 803 | |
Note 4–Federal Income Tax
As of June 30, 2020, the cost and unrealized appreciation (depreciation) of the Portfolio’s investment portfolio, including applicable derivative contracts and other financial instruments, as determined on a federal income tax basis, was as follows:
| | | | | | | | | | | | | | | | |
| | | Federal Tax
Cost | | | Gross
Unrealized
Appreciation | | | Gross
Unrealized
(Depreciation) | | | Net
Unrealized
Appreciation/
(Depreciation) | |
| | | | |
Investments in Securities | | $ | 505,786,803 | | | $ | 162,975,088 | | | $ | (5,202,077 | ) | | $ | 157,773,011 | |
During the year ended December 31, 2019, the tax character of distributions paid as reflected in the Statements of Changes in Net Assets was as follows:
| | |
|
| 2019 |
Tax-Based
Distributions from Ordinary
Income | | Tax-Based
Distributions from Long-Term
Gains |
| |
| $11,411,163 | | $49,779,461 |
Note 5–Custodian
State Street is the custodian of cash and securities held by the Portfolio. Custodial fees are charged to the Portfolio based on the Portfolio’s net assets and/or the market value of securities held by the Portfolio and the number of certain transactions incurred by the Portfolio.
Note 6–Line of Credit
The Portfolio and certain other funds managed by New York Life Investments maintain a line of credit with a syndicate of banks in order to secure a source of funds for temporary purposes to meet unanticipated or excessive redemption requests.
Effective July 28, 2020, under the credit agreement (the “Credit Agreement”), the aggregate commitment amount is $600,000,000 with an additional uncommitted amount of $100,000,000. The commitment fee is an annual rate of 0.15% of the average commitment amount payable quarterly, regardless of usage, to JP Morgan Chase Bank NA, who serves as the agent to the syndicate. The commitment fee is allocated among the Portfolio and certain other funds managed by New York Life Investments based upon their respective net assets and other factors. Interest on any revolving credit loan is charged based upon the
Notes to Financial Statements (Unaudited) (continued)
Federal Funds Rate or the one-month London Interbank Offered Rate (“LIBOR”), whichever is higher. The Credit Agreement expires on July 27, 2021, although the Portfolio, certain other funds managed by New York Life Investments and the syndicate of banks may renew the Credit Agreement for an additional year on the same or different terms or enter into a credit agreement with a different syndicate of banks. Prior to July 28, 2020, the aggregate commitment amount and the commitment fee were the same as those under the current Credit Agreement, but State Street served as agent to the syndicate. As of June 30, 2020, there were no borrowings outstanding with respect to the Portfolio under the Credit Agreement or the credit agreement for which State Street served as agent.
Note 7–Interfund Lending Program
Pursuant to an exemptive order issued by the SEC, the Portfolio, along with certain other funds managed by New York Life Investments, may participate in an interfund lending program. The interfund lending program provides an alternative credit facility that permits the Portfolio and certain other funds managed by New York Life Investments to lend or borrow money for temporary purposes directly to or from one another subject to the conditions of the exemptive order. During the six-month period ended June 30, 2020, there were no interfund loans made or outstanding with respect to the Portfolio.
Note 8–Purchases and Sales of Securities (in 000’s)
During the six-month period ended June 30, 2020, purchases and sales of securities, other than short-term securities, were $631,100 and $716,820, respectively.
Note 9–Capital Share Transactions
Transactions in capital shares for the six-month period ended June 30, 2020 and the year ended December 31, 2019, were as follows:
| | | | | | | | |
Initial Class | | Shares | | | Amount | |
| | |
Six-month period ended June 30, 2020: | | | | | | | | |
Shares sold | | | 241,001 | | | $ | 6,303,305 | |
Shares redeemed | | | (2,689,316 | ) | | | (85,674,293 | ) |
| | | | | | | | |
Net increase (decrease) | | | (2,448,315 | ) | | $ | (79,370,988 | ) |
| | | | | | | | |
| | |
Year ended December 31, 2019: | | | | | | | | |
Shares sold | | | 3,740,349 | | | $ | 115,915,029 | |
Shares issued to shareholders in reinvestment of distributions | | | 1,922,384 | | | | 56,327,914 | |
Shares redeemed | | | (2,322,580 | ) | | | (73,800,486 | ) |
| | | | | | | | |
Net increase (decrease) | | | 3,340,153 | | | $ | 98,442,457 | |
| | | | | | | | |
| | |
| | | | | | | | |
| | | | | | | | |
Service Class | | Shares | | | Amount | |
Six-month period ended June 30, 2020: | | | | | | | | |
Shares sold | | | 10,952 | | | $ | 321,346 | |
Shares redeemed | | | (228,804 | ) | | | (7,093,120 | ) |
| | | | | | | | |
Net increase (decrease) | | | (217,852 | ) | | $ | (6,771,774 | ) |
| | | | | | | | |
Year ended December 31, 2019: | | | | | | | | |
Shares sold | | | 27,093 | | | $ | 823,504 | |
Shares issued to shareholders in reinvestment of distributions | | | 168,134 | | | | 4,862,710 | |
Shares redeemed | | | (339,306 | ) | | | (10,648,824 | ) |
| | | | | | | | |
Net increase (decrease) | | | (144,079 | ) | | $ | (4,962,610 | ) |
| | | | | | | | |
Note 10–Recent Accounting Pronouncement
In March 2020, the Financial Accounting Standards Board (“FASB”) issued Accounting Standards Update 2020-04 (“ASU 2020-04”), which provides optional guidance to ease the potential accounting burden associated with transitioning away from LIBOR and other reference rates that are expected to be discontinued. ASU 2020-04 is effective immediately upon release of the update on March 12, 2020 through December 31, 2022. At this time, the Manager is evaluating the implications of certain other provisions of ASU 2020-04 related to new disclosure requirements and any impact on the financial statement disclosures has not yet been determined.
Note 11–Subsequent Events
In connection with the preparation of the financial statements of the Portfolio as of and for the six-month period ended June 30, 2020, events and transactions subsequent to June 30, 2020, through the date the financial statements were issued have been evaluated by the Manager, for possible adjustment and/or disclosure. No subsequent events requiring financial statement adjustment or disclosure have been identified.
Note 12–Other Matters
An outbreak of COVID-19, first detected in December 2019, has developed into a global pandemic and has resulted in travel restrictions, closure of international borders, certain businesses and securities markets, restrictions on securities trading activities, prolonged quarantines, supply chain disruptions, and lower consumer demand, as well as general concern and uncertainty. The continued impact of COVID-19 is uncertain and could further adversely affect the global economy, national economies, individual issuers and capital markets in unforeseeable ways and result in a substantial and extended economic downturn. Developments that disrupt global economies and financial markets, such as COVID-19, may magnify factors that affect the Portfolio’s performance.
| | |
| 22 | | MainStay VP MacKay Growth Portfolio |
Discussion of the Operation and Effectiveness of the Portfolio’s
Liquidity Risk Management Program (Unaudited)
In compliance with Rule 22e-4 under the Investment Company Act of 1940, as amended (the “Liquidity Rule”), the Portfolio has adopted and implemented a liquidity risk management program (the “Program”), which New York Life Investment Management LLC believes is reasonably designed to assess and manage the Portfolio’s liquidity risk. The Board designated New York Life Investment Management LLC as administrator of the Program (the “Administrator”). The Administrator has established a Liquidity Risk Management Committee to assist the Administrator in the implementation and day-to-day administration of the Program and to otherwise support the Administrator in fulfilling its responsibilities under the Program.
At a meeting of the Board held on March 11, 2020, the Administrator provided the Board with a written report addressing the Program’s operation, adequacy and effectiveness of implementation for the period from December 1, 2018 through December 31, 2019, as required under the Liquidity Rule. The report noted that the Administrator concluded that (i) the Program operated effectively to assess and manage the Portfolio’s liquidity risk, (ii) the Program has been adequately and effectively implemented to monitor and, as applicable, respond to the Portfolio’s liquidity developments and (iii) the Portfolio’s investment strategy continues to be appropriate for an open-end portfolio.
In accordance with the Program, the Portfolio’s liquidity risk is assessed no less frequently than annually taking into consideration certain factors, as applicable, such as (i) investment strategy and liquidity of portfolio investments, (ii) short-term and long-term cash flow projections and (iii) holdings of cash and cash equivalents and borrowing arrangements and other funding sources. Certain factors are considered under both normal and reasonably foreseeable stressed conditions.
Each Portfolio portfolio investment is classified into one of four liquidity categories. The classification is based on a determination of the number of days it is reasonably expected to take to convert the investment into cash, or sell or dispose of the investment, in current market conditions without significantly changing the market value of the investment. The Administrator has delegated liquidity classification determinations to the Portfolio’s subadvisor, subject to appropriate oversight by the Administrator, and classification determinations are made by taking into account the Portfolio’s reasonably anticipated trade size, various market, trading and investment-specific considerations, as well as market depth, and, in certain cases, third-party vendor data.
The Liquidity Rule requires portfolios that do not primarily hold assets that are highly liquid investments to adopt a minimum amount of net assets that must be invested in highly liquid investments that are assets (an “HLIM”). In addition, the Liquidity Rule limits a portfolio’s investments in illiquid investments. Specifically, the Liquidity Rule prohibits acquisition of illiquid investments if doing so would result in a portfolio holding more than 15% of its net assets in illiquid investments that are assets. The Program includes provisions reasonably designed to determine, periodically review and comply with the HLIM requirement, as applicable, and to comply with the 15% limit on illiquid investments.
Proxy Voting Policies and Procedures and Proxy Voting Record
A description of the policies and procedures that New York Life Investments uses to vote proxies related to the Portfolio’s securities is available free of charge upon request (i) by calling 800-598-2019; (ii) by visiting New York Life Investments’ website at https://www.nylinvestments.com/mainstay/products-and-performance/mainstay-vp-funds-trust; or (iii) by visiting the SEC’s website at www.sec.gov.
The Portfolio is required to file with the SEC its proxy voting record for the 12-month period ending June 30 on Form N-PX. The Portfolio’s most recent Form N-PX or proxy voting record is available free of charge upon request (i) by calling 800-598-2019; (ii) by visiting New York Life Investments’ website at https://www.nylinvestments.com/mainstay/products-and-performance/mainstay-vp-funds-trust ; or (iii) by visiting the SEC’s website at www.sec.gov.
Shareholder Reports and Quarterly Portfolio Disclosure
The Portfolio is required to file its complete schedule of portfolio holdings with the SEC 60 days after its first and third fiscal quarter on Form N-PORT. The Portfolio’s holdings report is available free of charge upon request by calling 800-598-2019 or by visiting the SEC’s website at www.sec.gov.
| | |
| 24 | | MainStay VP MacKay Growth Portfolio |
MainStay VP Portfolios
MainStay VP offers a wide range of Portfolios. The full array of MainStay VP offerings is listed here, with information about the manager, subadvisors, legal counsel, and independent registered public accounting firm.
Equity Portfolios
MainStay VP Emerging Markets Equity Portfolio
MainStay VP Epoch U.S. Equity Yield Portfolio
MainStay VP Fidelity Institutional AM® Utilities Portfolio†
MainStay VP MacKay Common Stock Portfolio
MainStay VP MacKay Growth Portfolio
MainStay VP MacKay International Equity Portfolio
MainStay VP MacKay Mid Cap Core Portfolio
MainStay VP MacKay S&P 500 Index Portfolio
MainStay VP MacKay Small Cap Core Portfolio
MainStay VP Mellon Natural Resources Portfolio
MainStay VP Small Cap Growth Portfolio
MainStay VP T. Rowe Price Equity Income Portfolio
MainStay VP Winslow Large Cap Growth Portfolio
Mixed Asset Portfolios
MainStay VP Balanced Portfolio
MainStay VP Income Builder Portfolio
MainStay VP Janus Henderson Balanced Portfolio
MainStay VP MacKay Convertible Portfolio
Income Portfolios
MainStay VP Bond Portfolio
MainStay VP Floating Rate Portfolio
MainStay VP Indexed Bond Portfolio
MainStay VP MacKay Government Portfolio
MainStay VP MacKay High Yield Corporate Bond Portfolio
MainStay VP MacKay Unconstrained Bond Portfolio
MainStay VP PIMCO Real Return Portfolio
Money Market
MainStay VP U.S. Government Money Market Portfolio
Alternative
MainStay VP CBRE Global Infrastructure Portfolio
MainStay VP IQ Hedge Multi-Strategy Portfolio
Asset Allocation Portfolios
MainStay VP Conservative Allocation Portfolio
MainStay VP Growth Allocation Portfolio
MainStay VP Moderate Allocation Portfolio
MainStay VP Moderate Growth Allocation Portfolio
Manager
New York Life Investment Management LLC
New York, New York
Subadvisors
Brown Advisory LLC
Baltimore, Maryland
Candriam Belgium S.A.*
Brussels, Belgium
CBRE Clarion Securities LLC
Radnor, Pennsylvania
Epoch Investment Partners, Inc.
New York, New York
FIAM LLC
Smithfield, Rhode Island
IndexIQ Advisors LLC*
New York, New York
Janus Capital Management LLC
Denver, Colorado
MacKay Shields LLC*
New York, New York
Mellon Investments Corporation
Boston, Massachusetts
NYL Investors LLC*
New York, New York
Pacific Investment Management Company LLC
Newport Beach, California
Segall Bryant & Hamill, LLC
Chicago, Illinois
T. Rowe Price Associates, Inc.
Baltimore, Maryland
Winslow Capital Management, LLC
Minneapolis, Minnesota
Distributor
NYLIFE Distributors LLC*
Jersey City, New Jersey
Custodian
State Street Bank and Trust Company
Boston, Massachusetts
Independent Registered Public Accounting Firm
PricewaterhouseCoopers LLP
New York, New York
Legal Counsel
Dechert LLP
Washington, District of Columbia
Some Portfolios may not be available in all products.
| † | Fidelity Institutional AM is a registered trade mark of FMR LLC. Used with permission. |
| * | An affiliate of New York Life Investment Management LLC |
Not part of the Semiannual Report
2020 Semiannual Report
This report is for the general information of New York Life Variable Annuities and NYLIAC Variable Universal Life Insurance Products policyowners. It must be preceded or accompanied by the appropriate product(s) and funds prospectuses if it is given to anyone who is not an owner of a New York Life variable annuity policy or a NYLIAC Variable Universal Life Insurance Product. This report does not offer for sale or solicit orders to purchase securities.
The performance data quoted in this report represents past performance. Past performance is no guarantee of future results. Due to market volatility and other factors, current performance may be lower or higher than the figures shown. The most recent month-end performance summary for your variable annuity or variable life policy is available by calling 800-598-2019 and is updated periodically on www.newyorklife.com.
The New York Life Variable Annuities and NYLIAC Variable Universal Life Insurance Products are issued by New York Life Insurance and Annuity Corporation (a Delaware Corporation) and distributed by NYLIFE Distributors LLC (Member FINRA/SIPC).
New York Life Insurance Company
New York Life Insurance and Annuity
Corporation (NYLIAC) (A Delaware Corporation)
51 Madison Avenue, Room 551
New York, NY 10010
www.newyorklife.com
Printed on recycled paper
nylinvestments.com
NYLIFE Distributors LLC, 30 Hudson Street, Jersey City, NJ 07302
New York Life Investment Management LLC is the investment manager to the MainStay VP Funds Trust
©2020 by NYLIFE Distributors LLC. All rights reserved.
You may obtain copies of the Prospectus and the Statement of Additional Information free of charge, upon request, by calling toll-free 800-598-2019 or writing to New York Life Insurance and Annuity Corporation, 51 Madison Avenue, New York, NY 10010.
| | | | |
| Not FDIC Insured | | No Bank Guarantee | | May Lose Value |
| | | | |
| 1781610 | | | | MSVPCG10-08/20 (NYLIAC) NI513 |
MainStay VP CBRE Global Infrastructure Portfolio
(Formerly MainStay VP Cushing® Renaissance Advantage Portfolio)
Message from the President and Semiannual Report
Unaudited | June 30, 2020
Beginning on January 1, 2021, as permitted by regulations adopted by the Securities and Exchange Commission, paper copies of the MainStay VP Portfolio annual and semi-annual shareholder reports may no longer be sent by mail, unless you specifically request paper copies of the reports from the insurance company that offers your policy. Instead, the reports will be made available online, and you will be notified by mail each time a report is posted and provided with a website link to access the report. Instructions for requesting paper copies will be provided by your insurance company.
If you already elected to receive shareholder reports electronically, you will not be affected by this change and you need not take any action. At any time, you may elect to receive reports and other communications from the insurance company electronically by following the instructions provided by the insurance company.
You may elect to receive all future shareholder reports in paper form free of charge. You can inform the insurance company that you wish to receive paper copies of reports by following the instructions provided by the insurance company. Your election to receive reports in paper form will apply to all portfolio companies available under your contract.
| | | | | | | | |
| Not FDIC/NCUA Insured | | Not a Deposit | | May Lose Value | | No Bank Guarantee | | Not Insured by Any Government Agency |

This page intentionally left blank
Message from the President
High levels of volatility shook financial markets in response to the COVID-19 pandemic and an abrupt decline in global economic activity during the six months ended June 30, 2020.
Markets entered 2020 riding strong fourth quarter performance and an economic expansion of historic longevity. Most broad stock and bond indices began to dip in late February as growing numbers of COVID-19 cases were seen in hotspots around the world. On March 11, 2020, the World Health Organization acknowledged that the disease had reached pandemic proportions, with over 80,000 identified cases in China, thousands in Italy, South Korea and the United States, and more in dozens of additional countries. Governments and central banks pledged trillions of dollars to address the mounting economic and public health crisis; however, “stay-at-home” orders and other restrictions on non-essential activity caused global economic activity to slow. Most stocks and bonds lost significant ground in this challenging environment, with equities declining by roughly a third and the yield on high-yield credit indices shooting higher.
Policymakers responded with extraordinary speed to address the situation. In the United States, the Federal Reserve (“Fed”) cut interest rates to near zero and announced unlimited quantitative easing. With help from Treasury, the Fed later rolled out a series of lending facilities to directly support market functioning. In late March, the Federal government declared a national emergency; Congress passed, and the President signed, a $2 trillion CARES Act (The Coronavirus Aid, Relief, and Economic Security Act), with the promise of further assistance for consumers and businesses to come. This enormous wave of policy support helped fuel a rapid recovery in market pricing as stocks bounced back and credit spreads narrowed. Some states rushed to ease restrictions on travel and social gatherings, further fueling optimism that the effects of the pandemic might prove short lived. However, the final weeks of the reporting period saw infection rates beginning to rise in some of the first states to reopen, raising concerns that a second round of restrictive government policies might prove necessary, once again stifling economic activity.
Despite all the market volatility, the broadly based S&P 500® Index finished the first half of 2020 only slightly below its starting point and the technology-heavy NASDAQ Composite Index posted gains, closing in near record territory. Small-cap stocks tended to trail their large cap counterparts, as illustrated by the Russell 2000® Index’s loss of approximately 15%, while value-oriented stocks lagged growth-oriented issues. From a global perspective, U.S. stocks generally outperformed international equities, with emerging markets hit particularly hard by the flight from risk.
Fixed-income markets also experienced unusually high levels of volatility. Recognized safe havens, such as U.S. government bonds, attracted increased investment, driving yields lower and prices higher, positioning long-term Treasury bonds to deliver particularly strong gains. Investment-grade corporate bonds lost value in March before recovering in the closing months of the reporting period, while relatively speculative high-yield credit faced the brunt of risk-off sentiment. Emerging market debt underperformed most other bonds types as investors sought to minimize currency and sovereign risks.
Today, as we at New York Life Investments continue to track the ongoing health crisis and its financial ramifications, we are particularly mindful of the people at the heart of our enterprise—our colleagues and valued clients. By taking appropriate steps to minimize community spread of COVID-19 within our organization, we strive to safeguard the health of our investment professionals so they can continue to provide you, as a MainStay investor, with world class investment solutions in this rapidly evolving environment.
Sincerely,

Kirk C. Lehneis
President
The opinions expressed are as of the date of this report and are subject to change. There is no guarantee that any forecast made will come to pass. This material does not constitute investment advice and is not intended as an endorsement of any specific investment. Past performance is no guarantee of future results.
Not part of the Semiannual Report
Table of Contents
Investors should refer to the Portfolio’s Summary Prospectus and/or Prospectus and consider the Portfolio’s investment objectives, strategies, risks, charges and expenses carefully before investing. The Summary Prospectus and/or Prospectus contain this and other information about the Portfolio. You may obtain copies of the Portfolio’s Summary Prospectus and/or the Prospectus and the Statement of Additional Information free of charge, upon request, by calling toll-free 800-598-2019, by writing to New York Life Insurance and Annuity Corporation, 51 Madison Avenue, Room 251, New York, New York 10010 or by sending an email to MainStayShareholdersServices@nylim.com. These documents are also available at nylinvestments.com/vpdocuments. Please read the Summary Prospectus and/or Prospectus carefully before investing. MainStay VP Funds Trust portfolios are separate account options which are purchased through a variable insurance or variable annuity contract.
Investment and Performance Comparison1 (Unaudited)
Performance data quoted represents past performance. Past performance is no guarantee of future results. Because of market volatility and other factors, current performance may be lower or higher than the figures shown. Investment return and principal value will fluctuate, and as a result, when shares are redeemed, they may be worth more or less than their original cost. The performance table and graph do not reflect any deduction of sales charges, mortality and expense charges, contract charges or administrative charges. Please refer to the Performance Summary appropriate for your policy. For performance information current to the most recent month-end, please call 800-598-2019 or visit www.newyorklife.com.
Average Annual Total Returns for the Period-Ended June 30, 2020
| | | | | | | | | | | | | | | | | | | | | | |
| Class | | Inception Date | | Six Months | | | One Year | | | Five Years | | | Since Inception2 | | | Gross
Expense
Ratio3 | |
| | | | | | |
| Initial Class Shares | | 5/1/2015 | | | –21.35 | % | | | –27.23 | % | | | –7.91 | % | | | –8.38 | % | | | 1.28 | % |
| Service Class Shares | | 5/1/2015 | | | –21.45 | | | | –27.41 | | | | –8.13 | | | | –8.60 | | | | 1.53 | |
| | | | | | | | | | | | | | | | |
| Benchmark Performance | | Six
Months | | | One
Year | | | Five
Years | | | Since Inception | |
| | | | |
FTSE Global Infrastructure 50/50 Index4 | | | –13.30 | % | | | –8.02 | % | | | 5.47 | % | | | 4.18 | % |
S&P 500® Index5 | | | –3.08 | | | | 7.51 | | | | 10.73 | | | | 10.22 | |
Morningstar Infrastructure Category Average6 | | | –11.74 | | | | –6.10 | | | | 4.18 | | | | 2.38 | |
| 1. | Performance figures may reflect certain fee waivers and/or expense limitations, without which total returns may have been different. For information on current fee waivers and/or expense limitations (if any), please refer to the Notes to Financial Statements. |
| 2. | Effective February 28, 2020, the Portfolio replaced its subadvisor and modified its principal investment strategies. The past performance in the bar chart and table prior to that date reflects the Portfolio’s prior subadvisor and principal investment strategies. |
| 3. | The gross expense ratios presented reflect the Portfolio’s “Total Annual Portfolio Operating Expenses” from the most recent Prospectus, as supplemented, and may differ from other expense ratios disclosed in this report. |
| 4. | The Portfolio has selected the FTSE Global Core Infrastructure 50/50 Index as its primary benchmark as a replacement for the Standard & Poor’s 500® Index (“S&P 500® Index”) because it believes that the FTSE Global Core Infrastructure 50/50 Index is more reflective of its current investment style. The FTSE Global Core Infrastructure 50/50 Index is a market-capitalization |
| | weighted index of worldwide infrastructure and infrastructure-related securities. Constituent weights are adjusted semi-annually according to three broad industry sectors: 50% utilities, 30% transportation, and a 20% mix of other sectors. |
| 5. | The S&P 500® Index is the Portfolio’s previous benchmark. “S&P 500®” is a trademark of the McGraw-Hill Companies, Inc. The S&P 500® Index is widely regarded as the standard index for measuring large-cap U.S. stock market performance. Results assume reinvestment of all dividends and capital gains. An investment cannot be made directly in an index. |
| 6. | The Morningstar Infrastructure Category Average is representative of funds that invest primarily more than 60% of their assets in stocks of companies engaged in infrastructure activities. Industries considered to be part of the infrastructure sector include: oil & gas midstream; waste management; airports; integrated shipping; railroads; shipping & ports; trucking; engineering & construction; infrastructure operations; and the utilities sector. Results are based on average total returns of similar funds with all dividends and capital gain distributions reinvested. |
Cost in Dollars of a $1,000 Investment in MainStay VP CBRE Global Infrastructure Portfolio (Unaudited)
The example below is intended to describe the fees and expenses borne by shareholders during the six-month period from January 1, 2020, to June 30, 2020, and the impact of those costs on your investment.
Example
As a shareholder of the Portfolio you incur two types of costs: (1) transaction costs, including exchange fees and sales charges (loads) on purchases (as applicable), and (2) ongoing costs, including management fees, distribution and/or service (12b-1) fees, and other Portfolio expenses (as applicable). This example is intended to help you understand your ongoing costs (in dollars) of investing in the Portfolio and to compare these costs with the ongoing costs of investing in other mutual funds. The example is based on an investment of $1,000 made at the beginning of the six-month period and held for the entire period from January 1, 2020, to June 30, 2020. Shares are only sold in connection with variable life and annuity contracts and the example does not reflect any contract level or transactional fees or expenses. If these costs had been included, your costs would have been higher.
This example illustrates your Portfolio’s ongoing costs in two ways:
Actual Expenses
The second and third data columns in the table below provide information about actual account values and actual expenses. You may use the information in these columns, together with the amount you invested, to estimate the expenses that you paid during the six months ended June 30, 2020. Simply divide your account value by $1,000 (for example, an $8,600 account value divided by $1,000 = 8.6), then
multiply the result by the number under the heading entitled “Expenses Paid During Period” to estimate the expenses you paid on your account during this period.
Hypothetical Example for Comparison Purposes
The fourth and fifth data columns in the table below provide information about hypothetical account values and hypothetical expenses based on the Portfolio’s actual expense ratio and an assumed rate of return of 5% per year before expenses, which is not the Portfolio’s actual return. The hypothetical account values and expenses may not be used to estimate the actual ending account balances or expenses you paid for the six-month period shown. You may use this information to compare the ongoing costs of investing in the Portfolio with the ongoing costs of investing in other mutual funds. To do so, compare this 5% hypothetical example with the 5% hypothetical examples that appear in the shareholder reports of the other mutual funds.
Please note that the expenses shown in the table are meant to highlight your ongoing costs only and do not reflect any transactional costs, such as exchange fees or sales charges (loads). Therefore, the fourth and fifth data columns of the table are useful in comparing ongoing costs only and will not help you determine the relative total costs of owning different funds. In addition, if these transactional costs were included, your costs would have been higher.
| | | | | | | | | | | | | | | | | | | | | | |
| | | | | | | | | | | | | | | | | | |
| Share Class | | Beginning
Account
Value
1/1/20 | | | Ending Account
Value (Based
on Actual
Returns and
Expenses)
6/30/20 | | | Expenses
Paid
During
Period1 | | | Ending Account
Value (Based
on Hypothetical
5% Annualized
Return and
Actual
Expenses)
6/30/20 | | | Expenses
Paid
During
Period1 | | | Net Expense
Ratio
During
Period2 |
| | | | | | |
| Initial Class Shares | | $ | 1,000.00 | | | $ | 786.50 | | | $ | 6.00 | | | $ | 1,018.15 | | | $ | 6.77 | | | 1.35% |
| | | | | | |
| Service Class Shares | | $ | 1,000.00 | | | $ | 785.50 | | | $ | 8.21 | | | $ | 1,015.66 | | | $ | 9.27 | | | 1.85% |
| 1 | Expenses are equal to the Portfolio’s annualized expense ratio of each class multiplied by the average account value over the period, divided by 366 and multiplied by 182 (to reflect the six-month period). The table above represents the actual expenses incurred during the six-month period. In addition to the fees and expenses which the Portfolio bears directly, it also indirectly bears a pro rata share of the fees and expenses of the underlying funds in which it invests. Such indirect expenses are not included in the above-reported expense figures. |
| 2 | Expenses are equal to the Portfolio’s annualized expense ratio to reflect the six-month period. |
| | |
| 6 | | MainStay VP CBRE Global Infrastructure Portfolio |
Country Composition as of June 30, 2020 (Unaudited)
| | | | |
| |
| United States | | | 57.4 | % |
| |
| Italy | | | 7.4 | |
| |
| Spain | | | 6.6 | |
| |
| United Kingdom | | | 5.8 | |
| |
| Australia | | | 5.2 | |
| |
| Canada | | | 5.0 | |
| |
| France | | | 3.7 | |
| |
| Portugal | | | 2.1 | |
| | | | |
| |
| Mexico | | | 1.9 | |
| |
| Germany | | | 1.6 | |
| |
| Japan | | | 1.4 | |
| |
| Singapore | | | 1.2 | |
| |
| Hong Kong | | | 0.8 | |
| |
| New Zealand | | | 0.8 | |
| |
| Other Assets, Less Liabilities | | | -0.9 | |
| | | | |
| |
| | | 100.0 | % |
| | | | |
See Portfolio of Investments beginning on page 11 for specific holdings within these categories. The Portfolio’s holdings are subject to change.
Top Ten Holdings as of June 30, 2020 (excluding short-term investments) (Unaudited)
| 1. | Crown Castle International Corp. |
| 2. | American Electric Power Co., Inc. |
Portfolio Management Discussion and Analysis (Unaudited)
Answers to the questions reflect the views of portfolio managers Jerry V. Swank and Saket Kumar of Cushing® Asset Management, LP (“Cushing”), the Portfolio’s former Subadvisor, and portfolio managers T. Ritson Ferguson, CFA, Jeremy Anagnos, CFA, Daniel Foley, CFA, and Hinds Howard of CBRE Clarion Securities, LLC (“CBRE”), the Portfolio’s current Subadvisor.
How did MainStay VP CBRE Global Infrastructure Portfolio perform relative to its benchmarks and peers during the six months ended June 30, 2020?
For the six months ended June 30, 2020, MainStay VP CBRE Global Infrastructure Portfolio returned –21.35% for Initial Class shares and –21.45% for Service Class shares. Over the same period, both share classes underperformed the –13.30% return of the FTSE Global Core Infrastructure 50/50 Index, which became the Portfolio’s primary benchmark effective February 28th, and the –3.08% performance of the S&P 500® Index, which is the Portfolio’s previous benchmark. Both share classes also underperformed the –11.74% return of the Morningstar Infrastructure Category Average.1
Were there any changes to the Portfolio during the reporting period?
Effective February 28, 2020, several changes to the Portfolio were made. The Portfolio was renamed MainStay VP CBRE Global Infrastructure Portfolio and the Portfolio’s principal investment strategies, investment process and principal risks were modified, among other changes. Also, effective that date, Cushing was removed as Subadvisor and Jerry V. Swank and Saket Kumar were removed as portfolio managers of the Portfolio. As of that same date, CBRE was added as Subadvisor and T. Ritson Ferguson, Jeremy Anagnos, Daniel Foley and Hinds Howard were added as portfolio managers of the Portfolio. For more information about these changes, refer to the supplement dated December 13, 2019.
During the reporting period, were there any market events that materially impacted the Portfolio’s performance or liquidity?
Cushing
The Cushing team subadvised the Portfolio from January 1, 2020 through February 28, 2020. This portion of the reporting period saw the equity market begin to decline in reaction to the spreading COVID-19 pandemic. Those events weighed on the Portfolio’s performance. Energy sector stocks were particularly weak because of the expectation for a reduction in oil demand.
What factors affected the Portfolio’s relative performance during the reporting period?
Cushing
From January 1 through February 28, 2020, the Portfolio’s performance relative to the S&P 500® Index, which was its primary benchmark at the time, was undermined by declining
energy commodity prices. The Portfolio invested primarily in energy stocks while the S&P 500® is a diversified index.
CBRE
The CBRE team subadvised the Portfolio from February 29, 2020 through June 30, 2020. During this portion of the reporting period, the Portfolio outperformed the FTSE Global Core Infrastructure 50/50 Index due to both positive stock selection and sector allocation. The Portfolio’s thematic positioning toward communications stocks and renewable-focused utilities positively contributed to relative performance. Moreover, the Portfolio increased exposure to both those sectors during the reporting period, which also benefited performance. Interaction with our private market infrastructure colleagues at CBRE reinforced our view that these subsectors offered attractive valuations and stable growth.
During the reporting period, which subsectors were the strongest contributors to the Portfolio’s performance, and which subsectors were particularly weak?
Cushing
From January 1 through February 28, 2020, the subsectors making the strongest contributions to the Portfolio’s performance were utilities, engineering & construction (“E&C”), and industrials. (Contributions take weightings and total returns into account.) These subsectors had the most defensive names and least energy exposure. The weakest contributors to the Portfolio’s performance were subsectors with more energy and cyclical exposure, namely exploration & production (“E&P”), transportation and oil services.
CBRE
From February 29, 2020 through June 30, 2020, overweight exposure to European utilities relative to the FTSE Global Core Infrastructure 50/50 Index provided the strongest positive contribution to the Portfolio’s performance. Underweight exposure to the lagging emerging markets region also contributed positively to relative performance. Overweight exposure to the communications subsector further bolstered relative performance as communications companies were well positioned to benefit from the pandemic-related increase in remote working. Conversely, overweight exposure to the transportation sub-sector in continental Europe provided the weakest contribution to the Portfolio’s relative performance. Transportation stocks, including airports and toll roads, experienced significant declines in demand due to quarantine measures and travel restrictions.
| 1. | See page 5 for more information on benchmark and peer group returns. |
| | |
| 8 | | MainStay VP CBRE Global Infrastructure Portfolio |
During the reporting period, which individual stocks made the strongest positive contributions to the Portfolio’s absolute performance and which stocks detracted the most?
Cushing
From January 1 through February 28, 2020, the Portfolio’s top performer was global engineering company Jacobs Engineering. Other positive contributors included renewable generation company Clearway Energy and diversified industrial firm Eaton. The most significant detractor from the Portfolio’s performance during the same period was liquefied natural gas shipper GasLog Partners, which cut their dividend. Also detracting from performance were shares in E&P company Diamondback Energy and refiner Valero Energy, which were down on declining oil demand expectations.
CBRE
From February 29, 2020 through June 30, 2020, two of the largest positive contributors to the Portfolio’s absolute performance were communications sector holdings Cellnex and Equinix. Cellnex, a Spain-based tower operator, continued to acquire tower assets in Europe from mobile operators and appeared positioned to become a leader in Europe. Equinix is a U.S.-based owner of data centers globally. The company saw robust demand as data storage requirements increased with more cloud-based storage activity. The demand for improved connectivity in the midst of the pandemic drove notable gains in several other Portfolio holdings as well, including mobile communications tower companies Crown Castle International and American Tower.
The most significant detractor from the Portfolio’s absolute performance during the same period was Fraport, a German airport company operating Frankfurt Airport. Airport travel halted in Europe in March 2020, and the time frame for the resumption of travel remains uncertain. Nonetheless, we retained the Portfolio’s position in the company as we believe it has sufficient liquidity to withstand this period, and further believe that the sharp sell-off in the company’s stock was overdone. Vinci, a French toll road concession operator, was another significant detractor from absolute performance. The Portfolio retained its holdings in the company as we expect toll road traffic to recover quickly after the pandemic recedes, at which time people are likely to choose car travel over other forms of transport. In addition, toll roads have higher margins and generate higher cash levels than airports.
Did the Portfolio make any significant purchases or sales during the reporting period?
Cushing
The Portfolio sold its position in liquid natural gas shipper Gaslog Partners during the period following the company’s decision to cut its dividend. There were no other trades during the period Cushing managed the Portfolio.
CBRE
From February 29, 2020 through June 30, 2020, the Portfolio increased the size of its positions in American Tower, mentioned above, and NextEra Energy, a Florida-based utility that is the largest renewable developer in the United States. We see American Tower benefiting from increased data transmission growth, while NextEra Energy is well positioned to continue to deliver renewable generation projects due to its scale. During the same period, the Portfolio sold its entire position in Enbridge, a midstream company owning natural gas assets, and Public Service Enterprises Group (PSEG), a New Jersey-based utility operating power generation assets. In our opinion, Enbridge may see decreased gas volumes in its pipelines due to reduced producer activity; the company also faces significant project risks. PEG’s revenue stream appears vulnerable to lower commodity prices.
How did the Portfolio’s sector/subsector weightings change during the reporting period?
Cushing
There were no trades impacting relative sector positioning during the period Cushing managed the Portfolio.
CBRE
From February 29, 2020 through June 30, 2020, the Portfolio increased its exposure to the utilities and communications sectors, while decreasing exposure to railroad, toll roads and airports. Utilities are benefiting from the global drive to reduce carbon emissions through investment in renewable generation assets. Communications infrastructure is proving resilient as the secular growth in data is accelerating in the stay-at-home work environment prompted by the pandemic. Transportation assets are experiencing lower volumes due to reduced travel and activity globally. Airports are under significant pressure as travel restrictions have halted activity, and uncertainty remains as to when either business or leisure air travel will resume.
How was the Portfolio positioned at the end of the reporting period?
CBRE
As of June 30, 2020, the Portfolio held overweight sector positions relative to the FTSE Global Core Infrastructure 50/50 Index in communications and utilities, both of which we believe are set to benefit from stable earnings due to secular themes. Communications infrastructure provides the necessary assets to
support secular data growth. Utilities are investing significant amounts for the next decade to facilitate the world’s transition to cleaner energy and decarbonization through renewable generation. As of the same date, the Portfolio held an underweight position in the airport subsector, which is directly exposed to pandemic-related travel restrictions. The Portfolio also holds underweight exposure to railroad infrastructure as we believe volumes for both passenger and freight trains are likely to remain depressed.
The opinions expressed are those of the portfolio managers as of the date of this report and are subject to change. There is no guarantee that any forecasts will come to pass. This material does not constitute investment advice and is not intended as an endorsement of any specific investment.
Not all MainStay VP Portfolios and/or share classes are available under all policies.
| | |
| 10 | | MainStay VP CBRE Global Infrastructure Portfolio |
Portfolio of Investments June 30, 2020 (Unaudited)
| | | | | | | | |
| | |
Shares | | | Value | |
| Common Stocks 97.7% † | |
Australia 5.2% | |
APA Group (Utilities) | | | 27,431 | | | $ | 211,229 | |
Atlas Arteria, Ltd. (Transportation) | | | 155,391 | | | | 713,551 | |
Sydney Airport (Transportation) | | | 22,411 | | | | 87,870 | |
Transurban Group (Transportation) | | | 17,173 | | | | 167,696 | |
| | | | | | | | |
| | | | | | | 1,180,346 | |
| | | | | | | | |
Canada 5.0% | |
Fortis, Inc. (Utilities) | | | 12,200 | | | | 463,970 | |
Pembina Pipeline Corp. (Midstream / Pipelines) | | | 8,700 | | | | 217,500 | |
TC Energy Corp. (Midstream / Pipelines) (a) | | | 10,500 | | | | 448,586 | |
| | | | | | | | |
| | | | | | | 1,130,056 | |
| | | | | | | | |
France 3.7% | |
Vinci S.A. (Transportation) | | | 9,186 | | | | 844,733 | |
| | | | | | | | |
|
Germany 1.6% | |
Fraport A.G. Frankfurt Airport Services Worldwide (Transportation) (b) | | | 8,190 | | | | 356,868 | |
| | | | | | | | |
|
Hong Kong 0.8% | |
CK Infrastructure Holdings, Ltd. (Utilities) | | | 36,000 | | | | 185,481 | |
| | | | | | | | |
|
Italy 7.4% | |
Atlantia S.p.A. (Transportation) (b) | | | 19,105 | | | | 306,415 | |
Enel S.p.A. (Utilities) | | | 100,441 | | | | 865,316 | |
Infrastrutture Wireless Italiane S.p.A (Communications) | | | 10,338 | | | | 103,523 | |
Terna Rete Elettrica Nazionale S.p.A. (Utilities) | | | 58,086 | | | | 398,798 | |
| | | | | | | | |
| | | | | | | 1,674,052 | |
| | | | | | | | |
Japan 1.4% | |
Chubu Electric Power Co., Inc. (Utilities) | | | 25,000 | | | | 314,457 | |
| | | | | | | | |
|
Mexico 1.9% | |
Grupo Aeroportuario del Centro Norte S.A.B. de C.V. (Transportation) (b) | | | 21,800 | | | | 101,324 | |
| | | | | | | | |
Promotora Y Operadora de Infraestructura S.A.B. de C.V. (Transportation) (b) | | | 44,800 | | | | 323,538 | |
| | | | | | | | |
| | | | | | | 424,862 | |
| | | | | | | | |
New Zealand 0.8% | |
Infratil, Ltd. (Diversified Property Holdings) | | | 60,924 | | | | 184,449 | |
| | | | | | | | |
Portugal 2.1% | |
EDP—Energias de Portugal S.A. (Utilities) | | | 102,606 | | | | 489,339 | |
| | | | | | | | |
|
Singapore 1.2% | |
NetLink NBN Trust (Communications) | | | 386,198 | | | | 270,396 | |
| | | | | | | | |
| | | | | | | | |
| | |
Shares | | | Value | |
|
Spain 6.6% | |
Cellnex Telecom S.A. (Communications) | | | 13,540 | | | | 824,085 | |
Ferrovial S.A. (Transportation) | | | 8,592 | | | | 228,449 | |
Iberdrola S.A. (Utilities) | | | 18,893 | | | | 218,825 | |
Red Electrica Corp. S.A. (Utilities) (a) | | | 11,799 | | | | 219,934 | |
| | | | | | | | |
| | | | | | | 1,491,293 | |
| | | | | | | | |
United Kingdom 5.8% | |
National Grid PLC (Utilities) | | | 69,434 | | | | 850,235 | |
United Utilities Group PLC (Utilities) | | | 40,350 | | | | 454,517 | |
| | | | | | | | |
| | | | | | | 1,304,752 | |
| | | | | | | | |
United States 54.2% | |
AES Corp. (Utilities) | | | 19,600 | | | | 284,004 | |
Alliant Energy Corp. (Utilities) | | | 7,000 | | | | 334,880 | |
Ameren Corp. (Utilities) | | | 9,200 | | | | 647,312 | |
American Electric Power Co., Inc. (Utilities) | | | 12,100 | | | | 963,644 | |
American Tower Corp. (Communications) | | | 3,386 | | | | 875,416 | |
Atmos Energy Corp. (Utilities) | | | 5,900 | | | | 587,522 | |
Cheniere Energy, Inc. (Midstream / Pipelines) (b) | | | 15,400 | | | | 744,128 | |
CMS Energy Corp. (Utilities) | | | 6,300 | | | | 368,046 | |
Crown Castle International Corp. (Communications) | | | 5,980 | | | | 1,000,753 | |
Edison International (Utilities) | | | 11,400 | | | | 619,134 | |
Equinix, Inc. (Communications) | | | 973 | | | | 683,338 | |
Essential Utilities, Inc. (Utilities) | | | 15,000 | | | | 633,600 | |
Exelon Corp. (Utilities) | | | 18,000 | | | | 653,220 | |
FirstEnergy Corp. (Utilities) | | | 21,700 | | | | 841,526 | |
Kinder Morgan, Inc. (Midstream / Pipelines) | | | 27,400 | | | | 415,658 | |
NextEra Energy, Inc. (Utilities) | | | 3,700 | | | | 888,629 | |
NiSource, Inc. (Utilities) | | | 10,600 | | | | 241,044 | |
Norfolk Southern Corp. (Transportation) | | | 3,000 | | | | 526,710 | |
Sempra Energy (Utilities) | | | 3,500 | | | | 410,305 | |
Union Pacific Corp. (Transportation) | | | 3,200 | | | | 541,024 | |
| | | | | | | | |
| | | | | | | 12,259,893 | |
| | | | | | | | |
Total Common Stocks
(Cost $22,967,693) | | | | | | | 22,110,977 | |
| | | | | | | | |
| | | | | | |
The notes to the financial statements are an integral part of,
and should be read in conjunction with, the financial statements. | | | | | 11 | |
Portfolio of Investments June 30, 2020 (Unaudited) (continued)
| | | | | | | | |
| | |
Shares | | | Value | |
| Short-Term Investments 3.2% | |
Affiliated Investment Company 3.2% | |
United States 3.2% | |
MainStay U.S. Government Liquidity Fund,
0.05% (c) | | | 718,900 | | | | 718,900 | |
| | | | | | | | |
|
Unaffiliated Investment Company 0.0% ‡ | |
United States 0.0% ‡ | |
State Street Navigator Securities Lending Government Money Market Portfolio,
0.13% (c)(d) | | | 8,624 | | | | 8,624 | |
| | | | | | | | |
Total Short-Term Investments
(Cost $727,524) | | | | | | | 727,524 | |
| | | | | | | | |
Total Investments
(Cost $23,695,217) | | | 100.9 | % | | | 22,838,501 | |
Other Assets, Less Liabilities | | | (0.9 | ) | | | (205,116 | ) |
Net Assets | | | 100.0 | % | | $ | 22,633,385 | |
| † | Percentages indicated are based on Portfolio net assets. |
| ‡ | Less than one-tenth of a percent. |
| (a) | All or a portion of this security was held on loan. As of June 30, 2020, the aggregate market value of securities on loan was $212,167; the total market value of collateral held by the Portfolio was $226,161. The market value of the collateral held included non-cash collateral in the form of U.S. Treasury securities with a value of $217,537 (See Note 2(J)). |
| (b) | Non-income producing security. |
| (c) | Current yield as of June 30, 2020. |
| (d) | Represents a security purchased with cash collateral received for securities on loan. |
The following is a summary of the fair valuations according to the inputs used as of June 30, 2020, for valuing the Portfolio’s assets:
| | | | | | | | | | | | | | | | |
Description | | Quoted
Prices in
Active
Markets for
Identical
Assets
(Level 1) | | | Significant Other
Observable Inputs
(Level 2) | | | Significant
Unobservable Inputs (Level 3) | | | Total | |
| | | | |
Asset Valuation Inputs | | | | | | | | | | | | | | | | |
| Investments in Securities (a) | | | | | | | | | | | | | | | | |
| Common Stocks | | | | | | | | | | | | | | | | |
Australia | | $ | — | | | $ | 1,180,346 | | | $ | — | | | $ | 1,180,346 | |
France | | | — | | | | 844,733 | | | | — | | | | 844,733 | |
Germany | | | — | | | | 356,868 | | | | — | | | | 356,868 | |
Hong Kong | | | — | | | | 185,481 | | | | — | | | | 185,481 | |
Italy | | | — | | | | 1,674,052 | | | | — | | | | 1,674,052 | |
Japan | | | — | | | | 314,457 | | | | — | | | | 314,457 | |
New Zealand | | | — | | | | 184,449 | | | | — | | | | 184,449 | |
Portugal | | | — | | | | 489,339 | | | | — | | | | 489,339 | |
Singapore | | | — | | | | 270,396 | | | | — | | | | 270,396 | |
Spain | | | — | | | | 1,491,293 | | | | — | | | | 1,491,293 | |
United Kingdom | | | — | | | | 1,304,752 | | | | — | | | | 1,304,752 | |
All Other Countries | | | 13,814,811 | | | | — | | | | — | | | | 13,814,811 | |
| | | | | | | | | | | | | | | | |
| Total Common Stocks | | | 13,814,811 | | | | 8,296,166 | | | | — | | | | 22,110,977 | |
| | | | | | | | | | | | | | | | |
| Short-Term Investments | | | | | | | | | | | | | | | | |
Affiliated Investment Company | | | 718,900 | | | | — | | | | — | | | | 718,900 | |
Unaffiliated Investment Company | | | 8,624 | | | | — | | | | — | | | | 8,624 | |
| | | | | | | | | | | | | | | | |
| Total Short-Term Investments | | | 727,524 | | | | — | | | | — | | | | 727,524 | |
| | | | | | | | | | | | | | | | |
| Total Investments in Securities | | $ | 14,542,335 | | | $ | 8,296,166 | | | $ | — | | | $ | 22,838,501 | |
| | | | | | | | | | | | | | | | |
| (a) | For a complete listing of investments and their industries, see the Portfolio of Investments. |
| | | | |
| 12 | | MainStay VP CBRE Global Infrastructure Portfolio | | The notes to the financial statements are an integral part of,
and should be read in conjunction with, the financial statements. |
Portfolio of Investments June 30, 2020 (Unaudited) (continued)
The table below sets forth the diversification of the Portfolio’s investments by sector.
Sector Diversification
| | | | | | | | |
| | | Value | | | Percent† | |
Communications | | $ | 3,757,511 | | | | 16.6 | % |
Diversified Property Holdings | | | 184,449 | | | | 0.8 | |
Midstream / Pipelines | | | 1,825,872 | | | | 8.1 | |
Transportation | | | 4,198,178 | | | | 18.5 | |
Utilities | | | 12,144,967 | | | | 53.7 | |
| | | | | | | | |
| | | 22,110,977 | | | | 97.7 | |
Short-Term Investment | | | 727,524 | | | | 3.2 | |
Other Assets, Less Liabilities | | | (205,116 | ) | | | -0.9 | |
| | | | | | | | |
Net Assets | | $ | 22,633,385 | | | | 100.0 | % |
| | | | | | | | |
| † | Percentages indicated are based on Portfolio net assets. |
| | | | | | |
The notes to the financial statements are an integral part of,
and should be read in conjunction with, the financial statements. | | | | | 13 | |
Statement of Assets and Liabilities as of June 30, 2020 (Unaudited)
| | | | |
| Assets | |
Investment in unaffiliated securities, at
value (identified cost $22,976,317) including securities on loan of $212,167 | | $ | 22,119,601 | |
Investment in affiliated investment company, at
value (identified cost $718,900) | | | 718,900 | |
Cash denominated in foreign currencies
(identified cost $16,052) | | | 16,016 | |
Receivables: | |
Portfolio shares sold | | | 109,560 | |
Dividends | | | 52,025 | |
Securities lending | | | 338 | |
Investment securities sold | | | 60 | |
Other assets | | | 1,766 | |
| | | | |
Total assets | | | 23,018,266 | |
| | | | |
|
| Liabilities | |
Cash collateral received for securities on loan | | | 8,624 | |
Payables: | | | | |
Investment securities purchased | | | 324,117 | |
Professional fees | | | 27,718 | |
Shareholder communication | | | 10,997 | |
Manager (See Note 3) | | | 6,725 | |
NYLIFE Distributors (See Note 3) | | | 3,796 | |
Portfolio shares redeemed | | | 1,259 | |
Trustees | | | 34 | |
Accrued expenses | | | 1,611 | |
| | | | |
Total liabilities | | | 384,881 | |
| | | | |
Net assets | | $ | 22,633,385 | |
| | | | |
|
| Composition of Net Assets | |
Shares of beneficial interest outstanding (par value of $.001 per share) unlimited number of shares authorized | | $ | 3,624 | |
Additional paid-in capital | | | 61,368,452 | |
| | | | |
| | | 61,372,076 | |
Total distributable earnings (loss) | | | (38,738,691 | ) |
| | | | |
Net assets | | $ | 22,633,385 | |
| | | | |
Initial Class | |
Net assets applicable to outstanding shares | | $ | 4,404,941 | |
| | | | |
Shares of beneficial interest outstanding | | | 698,906 | |
| | | | |
Net asset value per share outstanding | | $ | 6.30 | |
| | | | |
Service Class | |
Net assets applicable to outstanding shares | | $ | 18,228,444 | |
| | | | |
Shares of beneficial interest outstanding | | | 2,924,629 | |
| | | | |
Net asset value per share outstanding | | $ | 6.23 | |
| | | | |
| | | | |
| 14 | | MainStay Xxxx Fund | | The notes to the financial statements are an integral part of,
and should be read in conjunction with, the financial statements. |
Statement of Operations for the six months ended June 30, 2020 (Unaudited)
| | | | |
| Investment Income (Loss) | |
Income | |
Dividends-unaffiliated (a) | | $ | 337,656 | |
Dividends-affiliated | | | 10,423 | |
Securities lending | | | 539 | |
Interest | | | 344 | |
| | | | |
Total income | | | 348,962 | |
| | | | |
Expenses | |
Manager (See Note 3) | | | 93,472 | |
Professional fees | | | 48,873 | |
Shareholder communication | | | 28,778 | |
Distribution/Service—Service Class (See Note 3) | | | 23,157 | |
Custodian | | | 12,425 | |
Trustees | | | 245 | |
Miscellaneous | | | 3,457 | |
| | | | |
Total expenses before waiver/reimbursement | | | 210,407 | |
Expense waiver/reimbursement from Manager (See Note 3) | | | (30,015 | ) |
| | | | |
Net expenses | | | 180,392 | |
| | | | |
Net investment income (loss) | | | 168,570 | |
| | | | |
|
| Realized and Unrealized Gain (Loss) on Investments and Foreign Currency Transactions | |
Net realized gain (loss) on: | |
Unaffiliated investment transactions | | | (4,830,896 | ) |
Foreign currency transactions | | | (16,730 | ) |
| | | | |
Net realized gain (loss) on investments and foreign currency transactions | | | (4,847,626 | ) |
| | | | |
Net change in unrealized appreciation (depreciation) on: | |
Unaffiliated investments | | | (274,245 | ) |
Translation of other assets and liabilities in foreign currencies | | | 40 | |
| | | | |
Net change in unrealized appreciation (depreciation) on investments and foreign currencies | | | (274,205 | ) |
| | | | |
Net realized and unrealized gain (loss) on investments and foreign currency transactions | | | (5,121,831 | ) |
| | | | |
Net increase (decrease) in net assets resulting from operations | | $ | (4,953,261 | ) |
| | | | |
| (a) | Dividends recorded net of foreign withholding taxes in the amount of $15,885. |
| | | | | | |
The notes to the financial statements are an integral part of,
and should be read in conjunction with, the financial statements. | | | | | 15 | |
Statements of Changes in Net Assets
for the six months ended June 30, 2020 (Unaudited) and the year ended December 31, 2019
| | | | | | | | |
| | | 2020 | | | 2019 | |
| Increase (Decrease) in Net Assets | |
Operations: | |
Net investment income (loss) | | $ | 168,570 | | | $ | 162,670 | |
Net realized gain (loss) on investments and foreign currency transactions | | | (4,847,626 | ) | | | (17,318,501 | ) |
Net change in unrealized appreciation (depreciation) on investments and foreign currencies | | | (274,205 | ) | | | 28,106,125 | |
| | | | |
Net increase (decrease) in net assets resulting from operations | | | (4,953,261 | ) | | | 10,950,294 | |
| | | | |
Capital share transactions: | |
Net proceeds from sale of shares | | | 6,905,364 | | | | 9,220,180 | |
Cost of shares redeemed | | | (3,125,100 | ) | | | (109,177,848 | ) |
| | | | |
Increase (decrease) in net assets derived from capital share transactions | | | 3,780,264 | | | | (99,957,668 | ) |
| | | | |
Net increase (decrease) in net assets | | | (1,172,997 | ) | | | (89,007,374 | ) |
|
| Net Assets | |
| |
Beginning of period | | | 23,806,382 | | | | 112,813,756 | |
| | | | |
End of period | | $ | 22,633,385 | | | $ | 23,806,382 | |
| | | | |
| | | | |
| 16 | | MainStay Xxxx Fund | | The notes to the financial statements are an integral part of,
and should be read in conjunction with, the financial statements. |
Financial Highlights selected per share data and ratios
| | | | | | | | | | | | | | | | | | | | | | | | |
| | | |
| | | Six months
ended June 30, 2020* | | | Year ended December 31, | | | May 1, 2015^
through December 31, | |
| Initial Class | | 2019 | | | 2018 | | | 2017 | | | 2016 | | | 2015 | |
| | | | | | |
Net asset value at beginning of period | | $ | 8.01 | | | $ | 7.61 | | | $ | 10.52 | | | $ | 9.75 | | | $ | 7.59 | | | $ | 10.00 | |
| | | | | | | | | | | | | | | | | | | | | | | | |
| | | | | | |
Net investment income (loss) (a) | | | 0.08 | | | | 0.03 | | | | (0.07 | ) | | | (0.05 | ) | | | 0.00 | ‡ | | | 0.04 | |
| | | | | | |
Net realized and unrealized gain (loss) on investments | | | (1.78 | ) | | | 0.37 | | | | (2.84 | ) | | | 0.82 | | | | 2.18 | | | | (2.40 | ) |
| | | | | | |
Net realized and unrealized gain (loss) on foreign currency transactions | | | (0.01 | ) | | | 0.00 | ‡ | | | (0.00 | )‡ | | | (0.00 | ) ‡ | | | 0.00 | ‡ | | | (0.00 | )‡ |
| | | | | | | | | | | | | | | | | | | | | | | | |
| | | | | | |
Total from investment operations | | | (1.71 | ) | | | 0.40 | | | | (2.91 | ) | | | 0.77 | | | | 2.18 | | | | (2.36 | ) |
| | | | | | | | | | | | | | | | | | | | | | | | |
|
| Less distributions: | |
| | | | | | |
From net investment income | | | — | | | | — | | | | — | | | | — | | | | (0.02 | ) | | | (0.05 | ) |
| | | | | | | | | | | | | | | | | | | | | | | | |
| | | | | | |
Net asset value at end of period | | $ | 6.30 | | | $ | 8.01 | | | $ | 7.61 | | | $ | 10.52 | | | $ | 9.75 | | | $ | 7.59 | |
| | | | | | | | | | | | | | | | | | | | | | | | |
| | | | | | |
Total investment return (b) | | | (21.35 | %) | | | 5.26 | % (c) | | | (27.66 | %) (c) | | | 7.90 | % | | | 28.77 | % | | | (23.58 | %) |
|
| Ratios (to average net assets)/Supplemental Data: | |
| | | | | | |
Net investment income (loss) | | | 2.54 | % †† | | | 0.33 | % | | | (0.66 | %) | | | (0.49 | %) | | | 0.06 | % | | | 0.60 | % †† |
| | | | | | |
Net expenses (d) | | | 1.35 | % †† | | | 1.21 | % | | | 1.21 | % | | | 1.31 | % | | | 1.38 | % | | | 1.35 | % †† |
| | | | | | |
Expenses (before waiver/reimbursement) (d) | | | 1.72 | % †† | | | 1.21 | % | | | 1.21 | % | | | 1.31 | % | | | 1.38 | % | | | 1.35 | % †† |
| | | | | | |
Portfolio turnover rate | | | 119 | % | | | 119 | % | | | 162 | % | | | 116 | % | | | 356 | % | | | 122 | % (e) |
| | | | | | |
Net assets at end of period (in 000’s) | | $ | 4,405 | | | $ | 1,009 | | | $ | 90,681 | | | $ | 158,846 | | | $ | 71,036 | | | $ | 58,364 | |
| ‡ | Less than one cent per share. |
| (a) | Per share data based on average shares outstanding during the period. |
| (b) | Total return does not reflect any deduction of sales charges, mortality and expense charges, contract charges or administrative charges. For periods of less than one year, total return is not annualized. |
| (c) | Total investment return may reflect adjustments to conform to generally accepted accounting principles. |
| (d) | In addition to the fees and expenses which the Portfolio bears directly, it also indirectly bears a pro-rata share of the fees and expenses of the underlying funds in which it invests. Such indirect expenses are not included in the above expense ratios. |
| (e) | Portfolio turnover rate is not annualized. |
| | | | | | |
The notes to the financial statements are an integral part of,
and should be read in conjunction with, the financial statements. | | | | | 17 | |
Financial Highlights selected per share data and ratios
| | | | | | | | | | | | | | | | | | | | | | | | |
| | | |
| Service Class | | Six months
ended
June 30, 2020* | | | Year ended December 31, | | | May 1, 2015^
through
December 31, | |
| | | 2019 | | | 2018 | | | 2017 | | | 2016 | | | 2015 | |
| | | | | | |
Net asset value at beginning of period | | $ | 7.93 | | | $ | 7.55 | | | $ | 10.47 | | | $ | 9.73 | | | $ | 7.59 | | | $ | 10.00 | |
| | | | | | | | | | | | | | | | | | | | | | | | |
| | | | | | |
Net investment income (loss) (a) | | | 0.05 | | | | 0.01 | | | | (0.09 | ) | | | (0.07 | ) | | | (0.02 | ) | | | 0.02 | |
| | | | | | |
Net realized and unrealized gain (loss) on investments | | | (1.74 | ) | | | 0.37 | | | | (2.83 | ) | | | 0.81 | | | | 2.18 | | | | (2.39 | ) |
| | | | | | |
Net realized and unrealized gain (loss) on foreign currency transactions | | | (0.01 | ) | | | 0.00 | ‡ | | | (0.00 | )‡ | | | (0.00 | )‡ | | | 0.00 | ‡ | | | (0.00 | )‡ |
| | | | | | | | | | | | | | | | | | | | | | | | |
| | | | | | |
Total from investment operations | | | (1.70 | ) | | | 0.38 | | | | (2.92 | ) | | | 0.74 | | | | 2.16 | | | | (2.37 | ) |
| | | | | | | | | | | | | | | | | | | | | | | | |
| | | | | | |
| Less distributions: | | | | | | | | | | | | | | | | | | | | | | | | |
| | | | | | |
From net investment income | | | — | | | | — | | | | — | | | | — | | | | (0.02 | ) | | | (0.04 | ) |
| | | | | | | | | | | | | | | | | | | | | | | | |
| | | | | | |
Net asset value at end of period | | $ | 6.23 | | | $ | 7.93 | | | $ | 7.55 | | | $ | 10.47 | | | $ | 9.73 | | | $ | 7.59 | |
| | | | | | | | | | | | | | | | | | | | | | | | |
| | | | | | |
Total investment return (b) | | | (21.44 | %)(c) | | | 5.03 | %(c) | | | (27.89 | %)(c) | | | 7.61 | %(c) | | | 28.48 | % | | | (23.70 | %) |
| | | | | | |
| Ratios (to average net assets)/Supplemental Data: | | | | | | | | | | | | | | | | | | | | | | | | |
| | | | | | |
Net investment income (loss) | | | 1.63 | %†† | | | 0.11 | % | | | (0.91 | %) | | | (0.74 | %) | | | (0.37 | %) | | | 0.37 | %†† |
| | | | | | |
Net expenses (d) | | | 1.85 | %†† | | | 1.62 | % | | | 1.46 | % | | | 1.56 | % | | | 1.64 | % | | | 1.60 | %†† |
| | | | | | |
Expenses (before waiver/reimbursement) (d) | | | 2.15 | %†† | | | 1.62 | % | | | 1.46 | % | | | 1.56 | % | | | 1.64 | % | | | 1.60 | %†† |
| | | | | | |
Portfolio turnover rate | | | 119 | % | | | 119 | % | | | 162 | % | | | 116 | % | | | 356 | % | | | 122 | %(e) |
| | | | | | |
Net assets at end of period (in 000’s) | | $ | 18,228 | | | $ | 22,798 | | | $ | 22,133 | | | $ | 32,457 | | | $ | 26,714 | | | $ | 5,927 | |
| ‡ | Less than one cent per share. |
| (a) | Per share data based on average shares outstanding during the period. |
| (b) | Total return does not reflect any deduction of sales charges, mortality and expense charges, contract charges or administrative charges. For periods of less than one year, total return is not annualized. |
| (c) | Total investment return may reflect adjustments to conform to generally accepted accounting principles. |
| (d) | In addition to the fees and expenses which the Portfolio bears directly, it also indirectly bears a pro-rata share of the fees and expenses of the underlying funds in which it invests. Such indirect expenses are not included in the above expense ratios. |
| (e) | Portfolio turnover rate is not annualized. |
| | | | |
| 18 | | MainStay Xxxx Fund | | The notes to the financial statements are an integral part of,
and should be read in conjunction with, the financial statements. |
Notes to Financial Statements (Unaudited)
Note 1–Organization and Business
MainStay VP Funds Trust (the “Fund”) was organized as a Delaware statutory trust on February 1, 2011. The Fund is registered under the Investment Company Act of 1940, as amended (the “1940 Act”), as an open-end management investment company. The Fund is comprised of thirty-one separate series (collectively referred to as the “Portfolios”). These financial statements and notes relate to the MainStay VP CBRE Global Infrastructure Portfolio (formerly known as MainStay VP Cushing® Renaissance Advantage Portfolio) (the “Portfolio”), a “non-diversified” portfolio, as that term is defined in the 1940 Act, as interpreted or modified by regulatory authorities having jurisdiction, from time to time. Since the Portfolio has historically operated as a “diversified” portfolio, it will not operate as “non-diversified” without first obtaining shareholder approval.
Shares of the Portfolio are currently offered to certain separate accounts to fund variable annuity policies and variable universal life insurance policies issued by New York Life Insurance and Annuity Corporation (“NYLIAC”), a wholly-owned subsidiary of New York Life Insurance Company (“New York Life”) and may also be offered to fund variable annuity policies and variable universal life insurance policies issued by other insurance companies. NYLIAC allocates shares of the Portfolios to, among others, certain NYLIAC separate accounts. Shares of the Portfolio are also offered to the MainStay VP Conservative Allocation Portfolio, MainStay VP Moderate Allocation Portfolio, MainStay VP Moderate Growth Allocation Portfolio and MainStay VP Growth Allocation Portfolio, which operate as “funds-of-funds,” and other variable insurance funds.
The Portfolio currently offers two classes of shares. Initial Class and Service Class shares commenced operations on May 1, 2015. Shares of the Portfolio are offered and are redeemed at a price equal to their respective net asset value (“NAV”) per share. No sales or redemption charge is applicable to the purchase or redemption of the Portfolio’s shares. Under the terms of the Fund’s multiple class plan, adopted pursuant to Rule 18f-3 under the 1940 Act, the classes differ in that, among other things, Service Class shares of the Portfolio pay a combined distribution and service fee of 0.25% of average daily net assets attributable to Service Class shares of the Portfolio to the Distributor (as defined in Note 3(B)) pursuant to a plan adopted in accordance with Rule 12b-1 under the 1940 Act. Contract owners of variable annuity contracts purchased after June 2, 2003, are permitted to invest only in the Service Class shares.
The Portfolio’s investment objective is to seek total return.
Note 2–Significant Accounting Policies
The Portfolio is an investment company and accordingly follows the investment company accounting and reporting guidance of the Financial Accounting Standards Board (“FASB”) Accounting Standard Codification Topic 946 Financial Services – Investment Companies. The Portfolio prepares its financial statements in accordance with generally accepted accounting principles (“GAAP”) in the United States of America and follows the significant accounting policies described below.
(A) Securities Valuation. Investments are usually valued as of the close of regular trading on the New York Stock Exchange (the “Exchange”) (usually 4:00 p.m. Eastern time) on each day the Portfolio is open for business (“valuation date”).
The Board of Trustees of the Fund (the “Board”) adopted procedures establishing methodologies for the valuation of the Portfolio’s securities and other assets and delegated the responsibility for valuation determinations under those procedures to the Valuation Committee of the Fund (the “Valuation Committee”). The procedures state that, subject to the oversight of the Board and unless otherwise noted, the responsibility for the day-to-day valuation of portfolio assets (including fair value measurements for the Portfolio’s assets and liabilities) rests with New York Life Investment Management LLC (“New York Life Investments” or the “Manager”), aided to whatever extent necessary by the Subadvisor (as defined in Note 3(A)). To assess the appropriateness of security valuations, the Manager, the Subadvisor or the Portfolio’s third-party service provider, who is subject to oversight by the Manager, regularly compares prior day prices, prices on comparable securities and the sale prices to the prior and current day prices and challenges prices with changes exceeding certain tolerance levels with third-party pricing services or broker sources.
The Board authorized the Valuation Committee to appoint a Valuation Subcommittee (the “Subcommittee”) to establish the prices of securities for which market quotations are not readily available or the prices of which are not otherwise readily determinable under the procedures. The Subcommittee meets (in person, via electronic mail or via teleconference) on an as-needed basis. The Valuation Committee meets to ensure that actions taken by the Subcommittee were appropriate.
For those securities valued through either a standardized fair valuation methodology or a fair valuation measurement, the Subcommittee deals with such valuation and the Valuation Committee reviews and affirms, if appropriate, the reasonableness of the valuation based on such methodologies and measurements on a regular basis after considering information that is reasonably available and deemed relevant by the Valuation Committee. Any action taken by the Subcommittee with respect to the valuation of a portfolio security or other asset is submitted for review and ratification (if appropriate) to the Valuation Committee and the Board at the next regularly scheduled meeting.
“Fair value” is defined as the price the Portfolio would reasonably expect to receive upon selling an asset or liability in an orderly transaction to an independent buyer in the principal or most advantageous market for the asset or liability. Fair value measurements are determined within a framework that establishes a three-tier hierarchy that maximizes the use of observable market data and minimizes the use of unobservable inputs to establish a classification of fair value measurements for disclosure purposes. “Inputs” refer broadly to the assumptions that market participants would use in pricing the asset or liability, including assumptions about risk, such as the risk inherent in a particular valuation technique used to measure fair value using a pricing model and/or the risk inherent in the inputs for the valuation technique. Inputs may be observable or unobservable. Observable inputs reflect the assumptions market participants would use in pricing the asset or liability based on market data obtained from sources independent of the Portfolio. Unobservable inputs reflect the Portfolio’s own assumptions about the assumptions market participants would use in pricing the asset or liability based on the information available. The inputs or methodology used for valuing assets or liabilities may not be an indication of the risks
Notes to Financial Statements (Unaudited) (continued)
associated with investing in those assets or liabilities. The three-tier hierarchy of inputs is summarized below.
| • | | Level 1—quoted prices in active markets for an identical asset or liability |
| • | | Level 2—other significant observable inputs (including quoted prices for a similar asset or liability in active markets, interest rates and yield curves, prepayment speeds, credit risk, etc.) |
| • | | Level 3—significant unobservable inputs (including the Portfolio’s own assumptions about the assumptions that market participants would use in measuring fair value of an asset or liability) |
The level of an asset or liability within the fair value hierarchy is based on the lowest level of an input, both individually and in the aggregate, that is significant to the fair value measurement. The aggregate value by input level of the Portfolio’s assets and liabilities as of June 30, 2020 is included at the end of the Portfolio of Investments.
The Portfolio may use third-party vendor evaluations, whose prices may be derived from one or more of the following standard inputs, among others:
| | |
• Broker/dealer quotes | | • Benchmark securities |
• Two-sided markets | | • Reference data (corporate actions or material event notices) |
• Bids/offers | | • Monthly payment information |
• Industry and economic events | | • Reported trades |
An asset or liability for which market values cannot be measured using the methodologies described above is valued by methods deemed reasonable in good faith by the Valuation Committee, following the procedures established by the Board, to represent fair value. Under these procedures, the Portfolio generally uses a market-based approach which may use related or comparable assets or liabilities, recent transactions, market multiples, book values and other relevant information. The Portfolio may also use an income-based valuation approach in which the anticipated future cash flows of the asset or liability are discounted to calculate fair value. Discounts may also be applied due to the nature and/or duration of any restrictions on the disposition of the asset or liability. Fair value represents a good faith approximation of the value of a security. Fair value determinations involve the consideration of a number of subjective factors, an analysis of applicable facts and circumstances and the exercise of judgment. As a result, it is possible that the fair value for a security determined in good faith in accordance with the Portfolio’s valuation procedures may differ from valuations for the same security determined by other funds using their own valuation procedures. Although the Portfolio’s valuation procedures are designed to value a security at the price the Portfolio may reasonably expect to receive upon the security’s sale in an orderly transaction, there can be no assurance that any fair value determination thereunder would, in fact, approximate the amount that the Portfolio would actually realize upon the sale of the security or the price at which the security would trade if a reliable market price were readily available. During the six-month period ended June 30, 2020, there were no material changes to the fair value methodologies.
Securities which may be valued in this manner include, but are not limited to: (i) a security for which trading has been halted or suspended;
(ii) a debt security that has recently gone into default and for which there is not a current market quotation; (iii) a security of an issuer that has entered into a restructuring; (iv) a security that has been delisted from a national exchange; (v) a security for which the market price is not readily available from a third-party pricing source or, if so provided, does not, in the opinion of the Manager or the Subadvisor, reflect the security’s market value; (vi) a security subject to trading collars for which no or limited trading takes place; and (vii) a security whose principal market has been temporarily closed at a time when, under normal conditions, it would be open. Securities valued in this manner are generally categorized as Level 3 in the hierarchy. As of June 30, 2020, no securities held by the Portfolio were fair valued in such a manner.
Certain securities held by the Portfolio may principally trade in foreign markets. Events may occur between the time the foreign markets close and the time at which the Portfolio’s NAVs are calculated. These events may include, but are not limited to, situations relating to a single issuer in a market sector, significant fluctuations in U.S. or foreign markets, natural disasters, armed conflicts, governmental actions or other developments not tied directly to the securities markets. Should the Manager or the Subadvisor conclude that such events may have affected the accuracy of the last price of such securities reported on the local foreign market, the Subcommittee may, pursuant to procedures adopted by the Board, adjust the value of the local price to reflect the estimated impact on the price of such securities as a result of such events. In this instance, securities are generally categorized as Level 3 in the hierarchy. Additionally, certain foreign equity securities are also fair valued whenever the movement of a particular index exceeds certain thresholds. In such cases, the securities are fair valued by applying factors provided by a third-party vendor in accordance with valuation procedures adopted by the Board and are generally categorized as Level 2 in the hierarchy. As of June 30, 2020, no securities held by the Portfolio were fair valued in such a manner.
Equity securities are valued at the last quoted sales prices as of the close of regular trading on the relevant exchange on each valuation date. Securities that are not traded on the valuation date are valued at the mean of the last quoted bid and ask prices. Prices are normally taken from the principal market in which each security trades. These securities are generally categorized as Level 1 in the hierarchy.
Investments in mutual funds, including money market funds, are valued at their respective NAVs as of the close of the Exchange on the valuation date. These securities are generally categorized as Level 1 in the hierarchy.
Temporary cash investments acquired in excess of 60 days to maturity at the time of purchase are valued using the latest bid prices or using valuations based on a matrix system (which considers such factors as security prices, yields, maturities and ratings), both as furnished by independent pricing services. Temporary cash investments that mature in 60 days or less at the time of purchase (“Short-Term Investments”) are valued using the amortized cost method of valuation, unless the use of such method would be inappropriate. The amortized cost method involves valuing a security at its cost on the date of purchase and thereafter assuming a constant amortization to maturity of the difference between such cost and the value on maturity date. Amortized cost approximates the current fair value of a security. Securities valued using
| | |
| 20 | | MainStay VP CBRE Global Infrastructure Portfolio |
the amortized cost method are not valued using quoted prices in an active market and are generally categorized as Level 2 in the hierarchy.
The information above is not intended to reflect an exhaustive list of the methodologies that may be used to value portfolio investments. The valuation procedures permit the use of a variety of valuation methodologies in connection with valuing portfolio investments. The methodology used for a specific type of investment may vary based on the market data available or other considerations. The methodologies summarized above may not represent the specific means by which portfolio investments are valued on any particular business day.
(B) Income Taxes. The Portfolio’s policy is to comply with the requirements of the Internal Revenue Code of 1986, as amended (the “Internal Revenue Code”), applicable to regulated investment companies and to distribute all of its taxable income to the shareholders of the Portfolio within the allowable time limits.
The Manager evaluates the Portfolio’s tax positions to determine if the tax positions taken meet the minimum recognition threshold in connection with accounting for uncertainties in income tax positions taken or expected to be taken for the purposes of measuring and recognizing tax liabilities in the financial statements. Recognition of tax benefits of an uncertain tax position is permitted only to the extent the position is “more likely than not” to be sustained assuming examination by taxing authorities. The Manager analyzed the Portfolio’s tax positions taken on federal, state and local income tax returns for all open tax years (for up to three tax years) and has concluded that no provisions for federal, state and local income tax are required in the Portfolio’s financial statements. The Portfolio’s federal, state and local income tax and federal excise tax returns for tax years for which the applicable statutes of limitations have not expired are subject to examination by the Internal Revenue Service and state and local departments of revenue.
(C) Foreign Taxes. The Portfolio may be subject to foreign taxes on income and other transaction-based taxes imposed by certain countries in which it invests. A portion of the taxes on gains on investments or currency purchases/repatriation may be reclaimable. The Portfolio will accrue such taxes and reclaims as applicable, based upon its current interpretation of tax rules and regulations that exist in the markets in which it invests.
The Portfolio may be subject to taxation on realized capital gains, repatriation proceeds and other transaction-based taxes imposed by certain countries in which it invests. The Portfolio will accrue such taxes as applicable based upon its current interpretation of tax rules and regulations that exist in the market in which it invests. Capital gains taxes relating to positions still held are reflected as a liability on the Statement of Assets and Liabilities, as well as an adjustment to the Portfolio’s net unrealized appreciation (depreciation). Taxes related to capital gains realized, if any, are reflected as part of net realized gain (loss) in the Statement of Operations. Changes in tax liabilities related to capital gains taxes on unrealized investment gains, if any, are reflected as part of the change in net unrealized appreciation (depreciation) on investments in the Statement of Operations. Transaction-based charges are generally assessed as a percentage of the transaction amount.
(D) Dividends and Distributions to Shareholders. Dividends and distributions are recorded on the ex-dividend date. The Portfolio intends to declare and pay dividends from net investment income and
distributions from net realized capital and currency gains, if any, at least annually. Unless a shareholder elects otherwise, all dividends and distributions are reinvested at NAV in the same class of shares of the Portfolio. Dividends and distributions to shareholders are determined in accordance with federal income tax regulations and may differ from determinations using GAAP.
(E) Security Transactions and Investment Income. The Portfolio records security transactions on the trade date. Realized gains and losses on security transactions are determined using the identified cost method. Dividend income is recognized on the ex-dividend date, net of any foreign tax withheld at the source, and interest income is accrued as earned using the effective interest rate method. Distributions received from real estate investment trusts may be classified as dividends, capital gains and/or return of capital.
The Portfolio may invest no more than 25% of its total assets in certain master limited partnerships (“MLPs”) on an annual basis. Distributions on a MLP are generally recorded based on the characterization reported on the Portfolio’s Form 1065, Schedule K-1, received from the MLP. The Portfolio records its pro rata share of the income and deductions, and capital gains and losses allocated from each MLP on the Statement of Operations, as well as adjusting the cost basis of each MLP accordingly, as reported on the Portfolio of Investments.
Distributions received from investments in energy related U.S. and Canadian royalty trusts and exploration and production companies (collectively, “Energy Trusts”) and MLPs generally are comprised of ordinary income, capital gains and return of capital from the Energy Trusts and MLPs. The Portfolio records its investment income on the ex-date of the distributions from Energy Trusts and MLPs. For financial statement purposes, the Portfolio uses return of capital and income estimates to allocate the distributions received. Such estimates are based on historical information available from each Energy Trust, MLP and other industry sources.
Investment income and realized and unrealized gains and losses on investments of the Portfolio are allocated pro rata to the separate classes of shares based upon their relative net assets on the date the income is earned or realized and unrealized gains and losses are incurred.
(F) Expenses. Expenses of the Fund are allocated to the individual Portfolios in proportion to the net assets of the respective Portfolios when the expenses are incurred, except where direct allocations of expenses can be made. Expenses (other than fees incurred under the distribution and service plans, further discussed in Note 3(B), which are charged directly to the Service Class shares) are allocated to separate classes of shares pro rata based upon their relative net assets on the date the expenses are incurred. The expenses borne by the Portfolio, including those of related parties to the Portfolio, are shown in the Statement of Operations.
Additionally, the Portfolio may invest in mutual funds, which are subject to management fees and other fees that may cause the costs of investing in mutual funds to be greater than the costs of owning the underlying securities directly. These indirect expenses of mutual funds are not included in the amounts shown as expenses in the Portfolio’s Statement of Operations or in the expense ratios included in the Financial Highlights.
Notes to Financial Statements (Unaudited) (continued)
(G) Use of Estimates. In preparing financial statements in conformity with GAAP, the Manager makes estimates and assumptions that affect the reported amounts and disclosures in the financial statements. Actual results could differ from those estimates.
(H) Repurchase Agreements. The Portfolio may enter into repurchase agreements (i.e., buy a security from another party with the agreement that it will be sold back in the future) to earn income. The Portfolio may enter into repurchase agreements only with counterparties, usually financial institutions, that are deemed by the Manager or the Subadvisor to be creditworthy, pursuant to guidelines established by the Board. During the term of any repurchase agreement, the Manager or the Subadvisor will continue to monitor the creditworthiness of the counterparty. Under the 1940 Act, repurchase agreements are considered to be collateralized loans by the Portfolio to the counterparty secured by the securities transferred to the Portfolio.
Repurchase agreements are subject to counterparty risk, meaning the Portfolio could lose money by the counterparty’s failure to perform under the terms of the agreement. The Portfolio mitigates this risk by ensuring the repurchase agreement is collateralized by cash, U.S. government securities, fixed income securities and/or other securities. The collateral is held by the Portfolio’s custodian and valued daily on a mark to market basis to determine if the value, including accrued interest, exceeds the repurchase price. In the event of the counterparty’s default on the obligation to repurchase, the Portfolio has the right to liquidate the collateral and apply the proceeds in satisfaction of the obligation. Under certain circumstances, such as in the event of default or bankruptcy by the counterparty, realization and/or retention of the collateral may be limited or subject to delay, to legal proceedings and possible realized loss to the Portfolio. As of June 30, 2020, the Portfolio did not hold any repurchase agreements.
(I) Foreign Currency Transactions. The Portfolio’s books and records are maintained in U.S. dollars. Prices of securities denominated in foreign currency amounts are translated into U.S. dollars at the mean between the buying and selling rates last quoted by any major U.S. bank at the following dates:
| (i) | market value of investment securities, other assets and liabilities— at the valuation date; and |
| (ii) | purchases and sales of investment securities, income and expenses —at the date of such transactions. |
The assets and liabilities that are denominated in foreign currency amounts are presented at the exchange rates and market values at the close of the period. The realized and unrealized changes in net assets arising from fluctuations in exchange rates and market prices of securities are not separately presented.
Net realized gain (loss) on foreign currency transactions represents net currency gains or losses realized as a result of differences between the amounts of securities sale proceeds or purchase cost, dividends, interest and withholding taxes as recorded on the Portfolio’s books, and the U.S. dollar equivalent amount actually received or paid. Net currency gains or losses from valuing such foreign currency denominated assets and liabilities, other than investments at valuation date exchange rates, are reflected in unrealized foreign exchange gains or losses.
(J) Securities Lending. In order to realize additional income, the Portfolio may engage in securities lending, subject to the limitations set forth in the 1940 Act and relevant guidance by the staff of the Securities and Exchange Commission (“SEC”). If the Portfolio engages in securities lending, the Portfolio will lend through its custodian, currently State Street Bank and Trust Company (“State Street”), acting as securities lending agent on behalf of the Portfolio. Under the current arrangement, State Street will manage the Portfolio’s collateral in accordance with the securities lending agency agreement between the Portfolio and State Street, and indemnify the Portfolio against counterparty risk. The loans will be collateralized by cash (which may be invested in a money market fund) and/or non-cash collateral (which may include U.S. Treasury securities and/or U.S. government agency securities issued or guaranteed by the United States government or its agencies or instrumentalities) at least equal at all times to the market value of the securities loaned. The Portfolio bears the risk of delay in recovery of, or loss of rights in, the securities loaned. The Portfolio may also record a realized gain or loss on securities deemed sold due to a borrower’s inability to return securities on loan. The Portfolio bears the risk of any loss on investment of cash collateral. The Portfolio will receive compensation for lending its securities in the form of fees or it will retain a portion of interest earned on the investment of any cash collateral. The Portfolio will also continue to receive interest and dividends on the securities loaned and any gain or loss in the market price of the securities loaned that may occur during the term of the loan will be for the account of the Portfolio. Income earned from securities lending activities, if any, is reflected in the Statement of Operations. As of June 30, 2020, the Portfolio had securities on loan with an aggregate market value of $212,167; the total market value of collateral held by the Portfolio was $226,161. The market value of the collateral held included non-cash collateral, in the form of U.S. Treasury securities, with a value of $217,537 and cash collateral, which was invested into the State Street Navigator Securities Lending Government Money Market Portfolio, with a value of $8,624.
(K) Foreign Securities and MLP Risk. Investments in foreign (non-U.S.) securities may be riskier than investments in U.S. securities. Foreign regulatory regimes and securities markets can have less stringent investor protections and disclosure standards and less liquid trading markets than U.S. regulatory regimes and securities markets, and can experience political, social and economic developments that may affect the value of the Portfolio’s investments in foreign securities. Foreign securities may also subject the Portfolio’s investments to changes in currency rates. Changes in the value of foreign currencies may make the return on an investment increase or decrease, unrelated to the quality or performance of the investment itself. The Portfolio may seek to hedge against its exposure to changes in the value of foreign currency, but there is no guarantee that such hedging techniques will be successful in reducing any related foreign currency valuation risks.
MLPs carry many of the risks inherent in investing in a partnership. State law governing partnerships is often less restrictive than state law governing corporations. Accordingly, there may be fewer protections afforded investors in a MLP. Limited partners may also have more limited control and limited rights to vote on matters affecting the MLP.
(L) Indemnifications. Under the Fund’s organizational documents, its officers and trustees are indemnified against certain liabilities that
| | |
| 22 | | MainStay VP CBRE Global Infrastructure Portfolio |
may arise out of performance of their duties to the Fund. Additionally, in the normal course of business, the Portfolio enters into contracts with third-party service providers that contain a variety of representations and warranties and that may provide general indemnifications. The Portfolio’s maximum exposure under these arrangements is unknown, as this would involve future claims that may be made against the Portfolio that have not yet occurred. The Manager believes that the risk of loss in connection with these potential indemnification obligations is remote. However, there can be no assurance that material liabilities related to such obligations will not arise in the future, which could adversely impact the Portfolio.
Note 3—Fees and Related Party Transactions
(A) Manager and Subadvisor. New York Life Investments, a registered investment adviser and an indirect, wholly-owned subsidiary of New York Life, serves as the Portfolio’s Manager pursuant to an Amended and Restated Management Agreement (“Management Agreement”). The Manager provides offices, conducts clerical, recordkeeping and bookkeeping services, and keeps most of the financial and accounting records required to be maintained by the Portfolio. Except for the portion of salaries and expenses that are the responsibility of the Portfolio, the Manager pays the salaries and expenses of all personnel affiliated with the Portfolio and certain operational expenses of the Portfolio. The Portfolio reimburses New York Life Investments in an amount equal to the portion of the compensation of the Chief Compliance Officer attributable to the Portfolio. The Fund’s subadvisor changed effective February 28, 2020 due to the termination of Cushing® Asset Management, LP as the Portfolio’s subadvisor and the appointment of CBRE Clarion Securities LLC (“CBRE Clarion” or “Subadvisor) as the Portfolio’s subadvisor. CBRE Clarion, a registered investment adviser, serves as Subadvisor to the Portfolio and is responsible for the day-to-day portfolio management of the Portfolio. Pursuant to the terms of a Subadvisory Agreement (“Subadvisory Agreement”) between New York Life Investments and CBRE Clarion, New York Life Investments pays for the services of the Subadvisor.
Effective February 28, 2020, the Fund, on behalf of the Portfolio, pays New York Life Investments in its capacity as the Portfolio’s investment manager and administrator, pursuant to the Management Agreement, a monthly fee for the services performed and the facilities furnished at an annual rate of 0.85% of the Portfolio’s average daily net assets.
Prior to February 28, 2020, the Portfolio paid the Manager a monthly fee for the services performed and the facilities furnished at an annual rate of the Portfolio’s average daily net assets as follows: 1.10% up to $500 million; and 1.05% in excess of $500 million. During the
six-month period ended June 30, 2020, the effective management fee rate was 0.94%.
Effective February 28, 2020, New York Life Investment has contractually agreed to waive fees and/or reimburse expenses so that total annual operating expenses (excluding taxes, interest, litigation, extraordinary expenses, brokerage and other transaction expenses relating to the purchase or sale of portfolio investments, and acquired (underlying) portfolio/fund fees and expenses) of Initial and Service Class shares do not exceed 0.95% and 1.20% of the Portfolio’s average daily net assets, respectively. This agreement will remain in effect until May 1, 2021, and shall renew automatically for one-year terms unless New York Life Investments provides written notice of termination prior to the start of the next term or upon approval of the Board.
During the six-month period ended June 30, 2020, New York Life Investments earned fees from the Portfolio in the amount of $93,472 and waived fees/reimbursed expenses in the amount of $30,015 and paid Cushing® Asset Management, LP and CBRE Clarion $19,681 and $12,047, respectively.
State Street provides sub-administration and sub-accounting services to the Portfolio pursuant to an agreement with New York Life Investments. These services include calculating the daily NAVs of the Portfolio, maintaining the general ledger and sub-ledger accounts for the calculation of the Portfolio’s NAVs and assisting New York Life Investments in conducting various aspects of the Portfolio’s administrative operations. For providing these services to the Portfolio, State Street is compensated by New York Life Investments.
Pursuant to an agreement between the Fund and New York Life Investments, New York Life Investments is responsible for providing or procuring certain regulatory reporting services for the Portfolio. The Portfolio will reimburse New York Life Investments for the actual costs incurred by New York Life Investments in connection with providing or procuring these services for the Portfolio.
(B) Distribution and Service Fees. The Fund, on behalf of the Portfolio, has entered into a distribution agreement with NYLIFE Distributors LLC (the “Distributor”), an indirect, wholly-owned subsidiary of New York Life. The Portfolio has adopted a distribution plan (the “Plan”) in accordance with the provisions of Rule 12b-1 under the 1940 Act. Under the Plan, the Distributor has agreed to provide, through its affiliates or independent third parties, various distribution-related, shareholder and administrative support services to the Service Class shareholders. For its services, the Distributor is entitled to a combined distribution and service fee accrued daily and paid monthly at an annual rate of 0.25% of the average daily net assets attributable to the Service Class shares of the Portfolio.
(C) Investments in Affiliates (in 000’s). During the six-month period ended June 30, 2020, purchases and sales transactions, income earned from investments and shares held of investment companies managed by New York Life Investments or its affiliates were as follows:
| | | | | | | | | | | | | | | | | | | | | | | | | | | | | | | | | | | | |
Affiliated Investment Company | | Value,
Beginning
of Period | | | Purchases
at Cost | | | Proceeds
from
Sales | | | Net
Realized
Gain/(Loss)
on Sales | | | Change in
Unrealized
Appreciation/
(Depreciation) | | | Value,
End of
Period | | | Dividend
Income | | | Other
Distributions | | | Shares
End of
Period | |
MainStay U.S. Government Liquidity Fund | | $ | 4,217 | | | $ | 8,933 | | | $ | (12,431 | ) | | $ | — | | | $ | — | | | $ | 719 | | | $ | 10 | | | $ | — | | | | 719 | |
Notes to Financial Statements (Unaudited) (continued)
Note 4—Federal Income Tax
As of June 30, 2020, the cost and unrealized appreciation (depreciation) of the Portfolio’s investment portfolio, including applicable derivative contracts and other financial instruments, as determined on a federal income tax basis, was as follows:
| | | | | | | | | | | | | | | | |
| | | Federal Tax
Cost | | | Gross
Unrealized
Appreciation | | | Gross
Unrealized
(Depreciation) | | | Net
Unrealized
Appreciation/
(Depreciation) | |
| | | | |
Investments in Securities | | $ | 23,020,378 | | | $ | 780,057 | | | $ | (961,934 | ) | | $ | (181,877 | ) |
As of December 31, 2019, for federal income tax purposes, capital loss carryforwards of $34,463,477, as shown in the table below, were available to the extent provided by the regulations to offset future realized gains of the Portfolio through the years indicated. Accordingly, no capital gains distributions are expected to be paid to shareholders until net gains have been realized in excess of such amounts.
| | | | |
Capital Loss
Available Through | | Short-Term
Capital Loss
Amounts (000’s) | | Long-Term
Capital Loss
Amounts (000’s) |
| | |
| Unlimited | | $31,698 | | $2,765 |
During the year ended December 31, 2019, the tax character of distributions paid as reflected in the Statements of Changes in Net Assets was as follows:
| | |
|
| 2019 |
Tax-Based
Distributions from Ordinary
Income | | Tax-Based
Distributions from Long-Term
Gains |
| |
| $— | | $— |
Note 5—Custodian
State Street is the custodian of cash and securities held by the Portfolio. Custodial fees are charged to the Portfolio based on the Portfolio’s net assets and/or the market value of securities held by the Portfolio and the number of certain transactions incurred by the Portfolio.
Note 6—Line of Credit
The Portfolio and certain other funds managed by New York Life Investments maintain a line of credit with a syndicate of banks in order to secure a source of funds for temporary purposes to meet unanticipated or excessive redemption requests.
Effective July 28, 2020, under the credit agreement (the “Credit Agreement”), the aggregate commitment amount is $600,000,000 with an additional uncommitted amount of $100,000,000. The commitment fee is an annual rate of 0.15% of the average commitment amount payable quarterly, regardless of usage, to JP Morgan Chase Bank NA, who serves as the agent to the syndicate. The commitment fee is allocated among the Portfolio and certain other funds managed by New York Life Investments based upon their respective net assets and other factors. Interest on any revolving credit loan is charged based upon the Federal Funds Rate or the one-month London Interbank Offered Rate
(“LIBOR”), whichever is higher. The Credit Agreement expires on July 27, 2021, although the Portfolio, certain other funds managed by New York Life Investments and the syndicate of banks may renew the Credit Agreement for an additional year on the same or different terms or enter into a credit agreement with a different syndicate of banks. Prior to July 28, 2020, the aggregate commitment amount and the commitment fee were the same as those under the current Credit Agreement, but State Street served as agent to the syndicate. During the six-month period ended June 30, 2020, there were no borrowings made or outstanding with respect to the Portfolio under the Credit Agreement or the credit agreement for which State Street served as agent.
Note 7—Interfund Lending Program
Pursuant to an exemptive order issued by the SEC, the Portfolio, along with certain other funds managed by New York Life Investments, may participate in an interfund lending program. The interfund lending program provides an alternative credit facility that permits the Portfolio and certain other funds managed by New York Life Investments to lend or borrow money for temporary purposes directly to or from one another, subject to the conditions of the exemptive order. During the six-month period ended June 30, 2020, there were no interfund loans made or outstanding with respect to the Portfolio.
Note 8—Purchases and Sales of Securities (in 000’s)
During the six-month period ended June 30, 2020, purchases and sales of securities, other than short-term securities, were $30,228 and $22,647, respectively.
Note 9—Capital Share Transactions
Transactions in capital shares for the six-month period ended June 30, 2020 and the year ended December 31, 2019, were as follows:
| | | | | | | | |
Initial Class | | Shares | | | Amount | |
| | |
Six-month period ended June 30, 2020: | | | | | | | | |
Shares sold | | | 627,407 | | | $ | 3,922,997 | |
Shares redeemed | | | (54,368 | ) | | | (345,777 | ) |
| | | | |
Net increase (decrease) | | | 573,039 | | | $ | 3,577,220 | |
| | | | |
Year ended December 31, 2019: | | | | | | | | |
Shares sold | | | 319,036 | | | $ | 2,706,401 | |
Shares redeemed | | | (12,113,453 | ) | | | (102,131,699 | ) |
| | | | |
Net increase (decrease) | | | (11,794,417 | ) | | $ | (99,425,298 | ) |
| | | | |
| | |
| | | | | | | | |
Service Class | | Shares | | | Amount | |
| | |
Six-month period ended June 30, 2020: | | | | | | | | |
Shares sold | | | 487,829 | | | $ | 2,982,367 | |
Shares redeemed | | | (436,607 | ) | | | (2,779,323 | ) |
| | | | |
Net increase (decrease) | | | 51,222 | | | $ | 203,044 | |
| | | | |
Year ended December 31, 2019: | | | | | | | | |
Shares sold | | | 795,233 | | | $ | 6,513,779 | |
Shares redeemed | | | (852,807 | ) | | | (7,046,149 | ) |
| | | | |
Net increase (decrease) | | | (57,574 | ) | | $ | (532,370 | ) |
| | | | |
Note 10—Recent Accounting Pronouncement
In March 2020, the Financial Accounting Standards Board (“FASB”) issued Accounting Standards Update 2020-04 (“ASU 2020-04”), which
| | |
| 24 | | MainStay VP CBRE Global Infrastructure Portfolio |
provides optional guidance to ease the potential accounting burden associated with transitioning away from LIBOR and other reference rates that are expected to be discontinued. ASU 2020-04 is effective immediately upon release of the update on March 12, 2020 through December 31, 2022. At this time, the Manager is evaluating the implications of certain other provisions of ASU 2020-04 related to new disclosure requirements and any impact on the financial statement disclosures has not yet been determined.
Note 11—Subsequent Events
In connection with the preparation of the financial statements of the Portfolio as of and for the six-month period ended June 30, 2020, events and transactions subsequent to June 30, 2020, through the date the financial statements were issued have been evaluated by the Manager, for possible adjustment and/or disclosure. No subsequent events requiring financial statement adjustment or disclosure have been identified.
Note 12—Other Matters
An outbreak of COVID-19, first detected in December 2019, has developed into a global pandemic and has resulted in travel restrictions, closure of international borders, certain businesses and securities markets, restrictions on securities trading activities, prolonged quarantines, supply chain disruptions, and lower consumer demand, as well as general concern and uncertainty. The continued impact of COVID-19 is uncertain and could further adversely affect the global economy, national economies, individual issuers and capital markets in unforeseeable ways and result in a substantial and extended economic downturn. Developments that disrupt global economies and financial markets, such as COVID-19, may magnify factors that affect the Portfolio’s performance.
At meetings held on December 10-11, 2019, the Board considered and approved submitting the following proposals (“Proposals”) to shareholders of the Portfolio at a special meeting held on February 18, 2020 (with any postponements or adjournments, “Special Meeting”):
| 1. | To approve a new subadvisory agreement between New York Life Investments and CBRE Clarion with respect to the Portfolio; and |
| 2. | To approve an amendment to the Portfolio’s fundamental investment restriction related to industry concentration from investments in the industry or group of industries that constitute the energy sector to investments in the securities of issuers conducting their business activities in the infrastructure group of industries. |
On or about January 6, 2020, shareholders of record of the Portfolio as of the close of business on December 19, 2019 were sent a proxy statement containing further information regarding the Proposals. The proxy statement also included information about the Special Meeting, at which shareholders of the Portfolio were asked to consider and approve the Proposals. In addition, the proxy statement included information about voting on the Proposals and options shareholders had to either attend the Special Meeting in person or by proxy to authorize and instruct New York Life Investments how to vote their respective shares.
The results of the Proposals were as follows:
| 1. | To approve a new subadvisory agreement between New York Life Investments and CBRE Clarion with respect to the Portfolio; and |
| | | | | | |
Shares Voted For | | Shares Voted Against | | Shares Voted Abstain | | Total |
| | | |
| 2,584,038.178 | | 138,959.588 | | 264,720.234 | | 2,987,718.000 |
| 2. | To approve an amendment to the Portfolio’s fundamental investment restriction related to industry concentration from investments in the industry or group of industries that constitute the energy sector to investments in the securities of issuers conducting their business activities in the infrastructure group of industries. |
| | | | | | |
Shares Voted For | | Shares Voted Against | | Shares Voted Abstain | | Total |
| | | |
| 2,562,954.488 | | 47,666.731 | | 377,096.781 | | 2,987,718.000 |
The Special Meeting was held on February 18, 2020, and both Proposals passed. Effective February 28, 2020, CBRE Clarion serves as the subadvisor to the Portfolio.
Discussion of the Operation and Effectiveness of the Portfolio’s Liquidity Risk Management Program (Unaudited)
In compliance with Rule 22e-4 under the Investment Company Act of 1940, as amended (the “Liquidity Rule”), the Portfolio has adopted and implemented a liquidity risk management program (the “Program”), which New York Life Investment Management LLC believes is reasonably designed to assess and manage the Portfolio’s liquidity risk. The Board designated New York Life Investment Management LLC as administrator of the Program (the “Administrator”). The Administrator has established a Liquidity Risk Management Committee to assist the Administrator in the implementation and day-to-day administration of the Program and to otherwise support the Administrator in fulfilling its responsibilities under the Program.
At a meeting of the Board held on March 11, 2020, the Administrator provided the Board with a written report addressing the Program’s operation, adequacy and effectiveness of implementation for the period from December 1, 2018 through December 31, 2019, as required under the Liquidity Rule. The report noted that the Administrator concluded that (i) the Program operated effectively to assess and manage the Portfolio’s liquidity risk, (ii) the Program has been adequately and effectively implemented to monitor and, as applicable, respond to the Portfolio’s liquidity developments and (iii) the Portfolio’s investment strategy continues to be appropriate for an open-end portfolio.
In accordance with the Program, the Portfolio’s liquidity risk is assessed no less frequently than annually taking into consideration certain factors, as applicable, such as (i) investment strategy and liquidity of portfolio investments, (ii) short-term and long-term cash flow projections and (iii) holdings of cash and cash equivalents and borrowing arrangements and other funding sources. Certain factors are considered under both normal and reasonably foreseeable stressed conditions.
Each Portfolio portfolio investment is classified into one of four liquidity categories. The classification is based on a determination of the number of days it is reasonably expected to take to convert the investment into cash, or sell or dispose of the investment, in current market conditions without significantly changing the market value of the investment. The Administrator has delegated liquidity classification determinations to the Portfolio’s subadvisor, subject to appropriate oversight by the Administrator, and classification determinations are made by taking into account the Portfolio’s reasonably anticipated trade size, various market, trading and investment-specific considerations, as well as market depth, and, in certain cases, third-party vendor data.
The Liquidity Rule requires portfolios that do not primarily hold assets that are highly liquid investments to adopt a minimum amount of net assets that must be invested in highly liquid investments that are assets (an “HLIM”). In addition, the Liquidity Rule limits a portfolio’s investments in illiquid investments. Specifically, the Liquidity Rule prohibits acquisition of illiquid investments if doing so would result in a portfolio holding more than 15% of its net assets in illiquid investments that are assets. The Program includes provisions reasonably designed to determine, periodically review and comply with the HLIM requirement, as applicable, and to comply with the 15% limit on illiquid investments.
| | |
| 26 | | MainStay VP CBRE Global Infrastructure Portfolio |
Proxy Voting Policies and Procedures and Proxy Voting Record
A description of the policies and procedures that New York Life Investments uses to vote proxies related to the Portfolio’s securities is available free of charge upon request (i) by calling 800-598-2019; (ii) by visiting New York Life Investments’ website at https://www.nylinvestments.com/mainstay/products-and-performance/mainstay-vp-funds-trust; or (iii) by visiting the SEC’s website at www.sec.gov.
The Portfolio is required to file with the SEC its proxy voting record for the 12-month period ending June 30 on Form N-PX. The Portfolio’s most recent Form N-PX or proxy voting record is available free of charge upon request (i) by calling 800-598-2019; (ii) by visiting New York Life Investments’ website at https://www.nylinvestments.com/mainstay/products-and-performance/mainstay-vp-funds-trust; or (iii) by visiting the SEC’s website at www.sec.gov.
Shareholder Reports and Quarterly Portfolio Disclosure
The Portfolio is required to file its complete schedule of portfolio holdings with the SEC 60 days after its first and third fiscal quarter on Form N-PORT. The Portfolio’s holdings report is available free of charge upon request by calling 800-598-2019 or by visiting the SEC’s website at www.sec.gov.
MainStay VP Portfolios
MainStay VP offers a wide range of Portfolios. The full array of MainStay VP offerings is listed here, with information about the manager, subadvisors, legal counsel, and independent registered public accounting firm.
Equity Portfolios
MainStay VP Emerging Markets Equity Portfolio
MainStay VP Epoch U.S. Equity Yield Portfolio
MainStay VP Fidelity Institutional AM® Utilities Portfolio†
MainStay VP MacKay Common Stock Portfolio
MainStay VP MacKay Growth Portfolio
MainStay VP MacKay International Equity Portfolio
MainStay VP MacKay Mid Cap Core Portfolio
MainStay VP MacKay S&P 500 Index Portfolio
MainStay VP MacKay Small Cap Core Portfolio
MainStay VP Mellon Natural Resources Portfolio
MainStay VP Small Cap Growth Portfolio
MainStay VP T. Rowe Price Equity Income Portfolio
MainStay VP Winslow Large Cap Growth Portfolio
Mixed Asset Portfolios
MainStay VP Balanced Portfolio
MainStay VP Income Builder Portfolio
MainStay VP Janus Henderson Balanced Portfolio
MainStay VP MacKay Convertible Portfolio
Income Portfolios
MainStay VP Bond Portfolio
MainStay VP Floating Rate Portfolio
MainStay VP Indexed Bond Portfolio
MainStay VP MacKay Government Portfolio
MainStay VP MacKay High Yield Corporate Bond Portfolio
MainStay VP MacKay Unconstrained Bond Portfolio
MainStay VP PIMCO Real Return Portfolio
Money Market
MainStay VP U.S. Government Money Market Portfolio
Alternative
MainStay VP CBRE Global Infrastructure Portfolio
MainStay VP IQ Hedge Multi-Strategy Portfolio
Asset Allocation Portfolios
MainStay VP Conservative Allocation Portfolio
MainStay VP Growth Allocation Portfolio
MainStay VP Moderate Allocation Portfolio
MainStay VP Moderate Growth Allocation Portfolio
Manager
New York Life Investment Management LLC
New York, New York
Subadvisors
Brown Advisory LLC
Baltimore, Maryland
Candriam Belgium S.A.*
Brussels, Belgium
CBRE Clarion Securities LLC
Radnor, Pennsylvania
Epoch Investment Partners, Inc.
New York, New York
FIAM LLC
Smithfield, Rhode Island
IndexIQ Advisors LLC*
New York, New York
Janus Capital Management LLC
Denver, Colorado
MacKay Shields LLC*
New York, New York
Mellon Investments Corporation
Boston, Massachusetts
NYL Investors LLC*
New York, New York
Pacific Investment Management Company LLC
Newport Beach, California
Segall Bryant & Hamill, LLC
Chicago, Illinois
T. Rowe Price Associates, Inc.
Baltimore, Maryland
Winslow Capital Management, LLC
Minneapolis, Minnesota
Distributor
NYLIFE Distributors LLC*
Jersey City, New Jersey
Custodian
State Street Bank and Trust Company
Boston, Massachusetts
Independent Registered Public Accounting Firm
PricewaterhouseCoopers LLP
New York, New York
Legal Counsel
Dechert LLP
Washington, District of Columbia
Some Portfolios may not be available in all products.
| † | Fidelity Institutional AM is a registered trade mark of FMR LLC. Used with permission. |
| * | An affiliate of New York Life Investment Management LLC |
Not part of the Semiannual Report
2020 Semiannual Report
This report is for the general information of New York Life Variable Annuities and NYLIAC Variable Universal Life Insurance Products policyowners. It must be preceded or accompanied by the appropriate product(s) and funds prospectuses if it is given to anyone who is not an owner of a New York Life variable annuity policy or a NYLIAC Variable Universal Life Insurance Product. This report does not offer for sale or solicit orders to purchase securities.
The performance data quoted in this report represents past performance. Past performance is no guarantee of future results. Due to market volatility and other factors, current performance may be lower or higher than the figures shown. The most recent month-end performance summary for your variable annuity or variable life policy is available by calling 800-598-2019 and is updated periodically on www.newyorklife.com.
The New York Life Variable Annuities and NYLIAC Variable Universal Life Insurance Products are issued by New York Life Insurance and Annuity Corporation (a Delaware Corporation) and distributed by NYLIFE Distributors LLC (Member FINRA/SIPC).
New York Life Insurance Company
New York Life Insurance and Annuity Corporation (NYLIAC) (A Delaware Corporation)
51 Madison Avenue, Room 551
New York, NY 10010
www.newyorklife.com
Printed on recycled paper
nylinvestments.com
NYLIFE Distributors LLC, 30 Hudson Street, Jersey City, NJ 07302
New York Life Investment Management LLC is the investment manager to the MainStay VP Funds Trust
©2020 by NYLIFE Distributors LLC. All rights reserved.
You may obtain copies of the Prospectus and the Statement of Additional Information free of charge, upon request, by calling toll-free 800-598-2019 or writing to New York Life Insurance and Annuity Corporation, 51 Madison Avenue, New York, NY 10010.
| | | | |
| Not FDIC Insured | | No Bank Guarantee | | May Lose Value |
| | | | |
| 1781612 | | | | MSVPCRA10-08/20 (NYLIAC) NI514 |
MainStay VP Small Cap Growth Portfolio
(Formerly MainStay VP Eagle Small Cap Growth Portfolio)
Message from the President and Semiannual Report
Unaudited | June 30, 2020
Beginning on January 1, 2021, as permitted by regulations adopted by the Securities and Exchange Commission, paper copies of the MainStay VP Portfolio annual and semi-annual shareholder reports may no longer be sent by mail, unless you specifically request paper copies of the reports from the insurance company that offers your policy. Instead, the reports will be made available online, and you will be notified by mail each time a report is posted and provided with a website link to access the report. Instructions for requesting paper copies will be provided by your insurance company.
If you already elected to receive shareholder reports electronically, you will not be affected by this change and you need not take any action. At any time, you may elect to receive reports and other communications from the insurance company electronically by following the instructions provided by the insurance company.
You may elect to receive all future shareholder reports in paper form free of charge. You can inform the insurance company that you wish to receive paper copies of reports by following the instructions provided by the insurance company. Your election to receive reports in paper form will apply to all portfolio companies available under your contract.
| | | | | | | | |
| Not FDIC/NCUA Insured | | Not a Deposit | | May Lose Value | | No Bank Guarantee | | Not Insured by Any Government Agency |

This page intentionally left blank
Message from the President
High levels of volatility shook financial markets in response to the COVID-19 pandemic and an abrupt decline in global economic activity during the six months ended June 30, 2020.
Markets entered 2020 riding strong fourth quarter performance and an economic expansion of historic longevity. Most broad stock and bond indices began to dip in late February as growing numbers of COVID-19 cases were seen in hotspots around the world. On March 11, 2020, the World Health Organization acknowledged that the disease had reached pandemic proportions, with over 80,000 identified cases in China, thousands in Italy, South Korea and the United States, and more in dozens of additional countries. Governments and central banks pledged trillions of dollars to address the mounting economic and public health crisis; however, “stay-at-home” orders and other restrictions on non-essential activity caused global economic activity to slow. Most stocks and bonds lost significant ground in this challenging environment, with equities declining by roughly a third and the yield on high-yield credit indices shooting higher.
Policymakers responded with extraordinary speed to address the situation. In the United States, the Federal Reserve (“Fed”) cut interest rates to near zero and announced unlimited quantitative easing. With help from Treasury, the Fed later rolled out a series of lending facilities to directly support market functioning. In late March, the Federal government declared a national emergency; Congress passed, and the President signed, a $2 trillion CARES Act (The Coronavirus Aid, Relief, and Economic Security Act), with the promise of further assistance for consumers and businesses to come. This enormous wave of policy support helped fuel a rapid recovery in market pricing as stocks bounced back and credit spreads narrowed. Some states rushed to ease restrictions on travel and social gatherings, further fueling optimism that the effects of the pandemic might prove short lived. However, the final weeks of the reporting period saw infection rates beginning to rise in some of the first states to reopen, raising concerns that a second round of restrictive government policies might prove necessary, once again stifling economic activity.
Despite all the market volatility, the broadly based S&P 500® Index finished the first half of 2020 only slightly below its starting point and the technology-heavy NASDAQ Composite Index posted gains, closing in near record territory. Small-cap stocks tended to trail their large cap counterparts, as illustrated by the Russell 2000® Index’s loss of approximately 15%, while value-oriented stocks lagged growth-oriented issues. From a global perspective, U.S. stocks generally outperformed international equities, with emerging markets hit particularly hard by the flight from risk.
Fixed-income markets also experienced unusually high levels of volatility. Recognized safe havens, such as U.S. government bonds, attracted increased investment, driving yields lower and prices higher, positioning long-term Treasury bonds to deliver particularly strong gains. Investment-grade corporate bonds lost value in March before recovering in the closing months of the reporting period, while relatively speculative high-yield credit faced the brunt of risk-off sentiment. Emerging market debt underperformed most other bonds types as investors sought to minimize currency and sovereign risks.
Today, as we at New York Life Investments continue to track the ongoing health crisis and its financial ramifications, we are particularly mindful of the people at the heart of our enterprise—our colleagues and valued clients. By taking appropriate steps to minimize community spread of COVID-19 within our organization, we strive to safeguard the health of our investment professionals so they can continue to provide you, as a MainStay investor, with world class investment solutions in this rapidly evolving environment.
Sincerely,

Kirk C. Lehneis
President
The opinions expressed are as of the date of this report and are subject to change. There is no guarantee that any forecast made will come to pass. This material does not constitute investment advice and is not intended as an endorsement of any specific investment. Past performance is no guarantee of future results.
Not part of the Semiannual Report
Table of Contents
Investors should refer to the Portfolio’s Summary Prospectus and/or Prospectus and consider the Portfolio’s investment objectives, strategies, risks, charges and expenses carefully before investing. The Summary Prospectus and/or Prospectus contain this and other information about the Portfolio. You may obtain copies of the Portfolio’s Summary Prospectus and/or the Prospectus and the Statement of Additional Information free of charge, upon request, by calling toll-free 800-598-2019, by writing to New York Life Insurance and Annuity Corporation, 51 Madison Avenue, Room 251, New York, New York 10010 or by sending an email to MainStayShareholdersServices@nylim.com. These documents are also available at nylinvestments.com/vpdocuments. Please read the Summary Prospectus and/or Prospectus carefully before investing. MainStay VP Funds Trust portfolios are separate account options which are purchased through a variable insurance or variable annuity contract.
Investment and Performance Comparison1 (Unaudited)
Performance data quoted represents past performance. Past performance is no guarantee of future results. Because of market volatility and other factors, current performance may be lower or higher than the figures shown. Investment return and principal value will fluctuate, and as a result, when shares are redeemed, they may be worth more or less than their original cost. The performance table and graph do not reflect any deduction of sales charges, mortality and expense charges, contract charges or administrative charges. Please refer to the Performance Summary appropriate for your policy. For performance information current to the most recent month-end, please call 800-598-2019 or visit www.newyorklife.com.
Average Annual Total Returns for the Period-Ended June 30, 2020
| | | | | | | | | | | | | | | | | | | | | | |
| Class | | Inception Date | | Six Months | | | One Year | | | Five Years | | | Since
Inception2 | | | Gross Expense Ratio3 | |
| | | | | | |
| Initial Class Shares | | 2/17/2012 | | | 0.33 | % | | | 5.42 | % | | | 7.42 | % | | | 9.03 | % | | | 0.85 | % |
| Service Class Shares | | 2/17/2012 | | | 0.21 | | | | 5.15 | | | | 7.16 | | | | 8.76 | | | | 1.10 | |
| | | | | | | | | | | | | | | | |
| Benchmark Performance | | Six
Months | | | One Year | | | Five Years | | | Since
Inception | |
| | | | |
Russell 2000® Growth Index4 | | | –3.06 | % | | | 3.48 | % | | | 6.86 | % | | | 10.64 | % |
Morningstar Small Growth Category Average5 | | | –0.10 | | | | 4.46 | | | | 8.28 | | | | 10.36 | |
| 1. | Performance figures may reflect certain fee waivers and/or expense limitations, without which total returns may have been different. For information on current fee waivers and/or expense limitations (if any), please refer to the Notes to Financial Statements. |
| 2. | The Portfolio replaced its subadvisor and modified its principal investment strategies as of May 1, 2020. Therefore, the performance information shown in this report prior to May 1, 2020 reflects the Portfolio’s prior subadvisor and its principal investment strategies. |
| 3. | The gross expense ratios presented reflect the Portfolio’s “Total Annual Portfolio Operating Expenses” from the most recent Prospectus, as supplemented, and may differ from other expense ratios disclosed in this report. |
| 4. | The Russell 2000® Growth Index is the Portfolio’s primary broad-based securities market index for comparison purposes. The Russell 2000® Growth Index measures the performance of the small-cap growth segment of the U.S. equity universe. It includes those Russell 2000® Index companies with higher price-to-book ratios and higher forecasted growth values. Results assume reinvestment of all dividends and capital gains. An investment cannot be made directly in an index. |
| 5. | The Morningstar Small Growth Category Average is representative of funds that focus on faster-growing companies whose shares are at the lower end of the market-capitalization range. These funds tend to favor companies in up-and-coming industries or young firms in their early growth stages. Results are based on average total returns of similar funds with all dividends and capital gain distributions reinvested. |
Cost in Dollars of a $1,000 Investment in MainStay VP Small Cap Growth Portfolio (Unaudited)
The example below is intended to describe the fees and expenses borne by shareholders during the six-month period from January 1, 2020, to June 30, 2020, and the impact of those costs on your investment.
Example
As a shareholder of the Portfolio you incur two types of costs: (1) transaction costs, including exchange fees and sales charges (loads) on purchases (as applicable), and (2) ongoing costs, including management fees, distribution and/or service (12b-1) fees, and other Portfolio expenses (as applicable). This example is intended to help you understand your ongoing costs (in dollars) of investing in the Portfolio and to compare these costs with the ongoing costs of investing in other mutual funds. The example is based on an investment of $1,000 made at the beginning of the six-month period and held for the entire period from January 1, 2020, to June 30, 2020. Shares are only sold in connection with variable life and annuity contracts and the example does not reflect any contract level or transactional fees or expenses. If these costs had been included, your costs would have been higher.
This example illustrates your Portfolio’s ongoing costs in two ways:
Actual Expenses
The second and third data columns in the table below provide information about actual account values and actual expenses. You may use the information in these columns, together with the amount you invested, to estimate the expenses that you paid during the six months
ended June 30, 2020. Simply divide your account value by $1,000 (for example, an $8,600 account value divided by $1,000 = 8.6), then multiply the result by the number under the heading entitled “Expenses Paid During Period” to estimate the expenses you paid on your account during this period.
Hypothetical Example for Comparison Purposes
The fourth and fifth data columns in the table below provide information about hypothetical account values and hypothetical expenses based on the Portfolio’s actual expense ratio and an assumed rate of return of 5% per year before expenses, which is not the Portfolio’s actual return. The hypothetical account values and expenses may not be used to estimate the actual ending account balances or expenses you paid for the six-month period shown. You may use this information to compare the ongoing costs of investing in the Portfolio with the ongoing costs of investing in other mutual funds. To do so, compare this 5% hypothetical example with the 5% hypothetical examples that appear in the shareholder reports of the other mutual funds.
Please note that the expenses shown in the table are meant to highlight your ongoing costs only and do not reflect any transactional costs, such as exchange fees or sales charges (loads). Therefore, the fourth and fifth data columns of the table are useful in comparing ongoing costs only and will not help you determine the relative total costs of owning different funds. In addition, if these transactional costs were included, your costs would have been higher.
| | | | | | | | | | | | | | | | | | | | | | |
| | | | | | | | | | | | | | | | | | |
| Share Class | | Beginning
Account
Value
1/1/20 | | | Ending Account
Value (Based
on Actual
Returns and
Expenses)
6/30/20 | | | Expenses
Paid
During
Period1 | | | Ending Account
Value (Based
on Hypothetical
5% Annualized
Return and
Actual Expenses)
6/30/20 | | | Expenses
Paid
During
Period1 | | | Net Expense
Ratio
During
Period2 |
| | | | | | |
| Initial Class Shares | | $ | 1,000.00 | | | $ | 1,003.30 | | | $ | 4.23 | | | $ | 1,020.64 | | | $ | 4.27 | | | 0.85% |
| | | | | | |
| Service Class Shares | | $ | 1,000.00 | | | $ | 1,002.10 | | | $ | 5.48 | | | $ | 1,019.39 | | | $ | 5.52 | | | 1.10% |
| 1 | Expenses are equal to the Portfolio’s annualized expense ratio of each class multiplied by the average account value over the period, divided by 366 and multiplied by 182 (to reflect the six-month period). The table above represents the actual expenses incurred during the six-month period. In addition to the fees and expenses which the Portfolio bears directly, it also indirectly bears a pro rata share of the fees and expenses of the underlying funds in which it invests. Such indirect expenses are not included in the above-reported expense figures. |
| 2 | Expenses are equal to the Portfolio’s annualized expense ratio to reflect the six-month period. |
| | |
| 6 | | MainStay VP Small Cap Growth Portfolio |
Industry Composition as of June 30, 2020 (Unaudited)
| | | | |
| |
| Software | | | 11.7 | % |
| |
| Biotechnology | | | 6.6 | |
| |
| Semiconductors & Semiconductor Equipment | | | 6.2 | |
| |
| IT Services | | | 5.2 | |
| |
| Life Sciences Tools & Services | | | 4.7 | |
| |
| Commercial Services & Supplies | | | 4.5 | |
| |
| Health Care Equipment & Supplies | | | 4.5 | |
| |
| Health Care Providers & Services | | | 3.7 | |
| |
| Diversified Consumer Services | | | 3.3 | |
| |
| Aerospace & Defense | | | 3.0 | |
| |
| Capital Markets | | | 2.9 | |
| |
| Hotels, Restaurants & Leisure | | | 2.7 | |
| |
| Machinery | | | 2.7 | |
| |
| Equity Real Estate Investment Trusts | | | 2.6 | |
| |
| Insurance | | | 2.6 | |
| |
| Pharmaceuticals | | | 2.4 | |
| |
| Chemicals | | | 2.3 | |
| |
| Diversified Telecommunication Services | | | 2.1 | |
| |
| Health Care Technology | | | 2.1 | |
| |
| Entertainment | | | 1.9 | |
| |
| Internet & Direct Marketing Retail | | | 1.9 | |
| |
| Electrical Equipment | | | 1.8 | |
| | | | |
| |
| Food Products | | | 1.7 | % |
| |
| Professional Services | | | 1.7 | |
| |
| Banks | | | 1.3 | |
| |
| Trading Companies & Distributors | | | 1.3 | |
| |
| Specialty Retail | | | 1.2 | |
| |
| Building Products | | | 1.0 | |
| |
| Electronic Equipment, Instruments & Components | | | 1.0 | |
| |
| Auto Components | | | 0.9 | |
| |
| Household Durables | | | 0.9 | |
| |
| Multiline Retail | | | 0.8 | |
| |
| Road & Rail | | | 0.8 | |
| |
| Food & Staples Retailing | | | 0.6 | |
| |
| Leisure Products | | | 0.5 | |
| |
| Media | | | 0.5 | |
| |
| Consumer Finance | | | 0.4 | |
| |
| Energy Equipment & Services | | | 0.2 | |
| |
| Interactive Media & Services | | | 0.2 | |
| |
| Short-Term Investments | | | 4.3 | |
| |
| Other Assets, Less Liabilities | | | –0.7 | |
| | | | |
| |
| | | 100.0 | % |
| | | | |
See Portfolio of Investments beginning on page 12 for specific holdings within these categories. The Portfolio’s holdings are subject to change.
Top Ten Holdings as of June 30, 2020 (excluding short-term investments) (Unaudited)
| 1. | Bright Horizons Family Solutions, Inc. |
| 4. | Charles River Laboratories International, Inc. |
| 6. | Waste Connections, Inc. |
| 7. | GCI Liberty, Inc., Class A |
| 9. | Goosehead Insurance, Inc., Class A |
| 10. | Hain Celestial Group, Inc. |
Portfolio Management Discussion and Analysis (Unaudited)
Answers to the questions reflect the views of portfolio managers Bert L. Boksen, CFA, Eric Mintz, CFA, and Christopher Sassouni of Eagle Asset Management, Inc. (“Eagle”), the Portfolio’s former Subadvisor, Brian C. Fitzsimons, CFA, and Mitch S. Begun, CFA, of Segall Bryant & Hamill, LLC (“SBH”), one of the Portfolio’s current Subadvisors, and Christopher A. Berrier and George Sakellaris, CFA, of Brown Advisory LLC (“Brown Advisory”), the Portfolio’s other current Subadvisor.
How did MainStay VP Small Cap Growth Portfolio perform relative to its benchmark and peers during the six months ended June 30, 2020?
For the six months ended June 30, 2020, MainStay VP Small Cap Growth Portfolio returned 0.33% for Initial Class shares and 0.21% for Service Class shares. Over the same period, both share classes outperformed the –3.06% return of the Russell 2000® Growth Index, which is the Portfolio’s broad-based securities-market index, and the –0.10% return of the Morningstar Small Growth Category Average.1
During the reporting period, were there any market events that materially impacted the Portfolio’s performance or liquidity?
Eagle
Eagle Asset Management, Inc. subadvised the Portfolio from January 1, 2020 through April 30, 2020. This portion of the reporting period saw unprecedented volatility throughout the capital markets, with the stock market experiencing one of its steepest declines on record. However, towards the end of this portion of the reporting period, the government began to take swift action through both monetary and massive fiscal stimulus to dampen the economic blow.
SBH
Segall Bryant & Hamill, LLC co-subadvised the Portfolio from May 1, 2020 through June 30, 2020. During this portion of the reporting period, equity markets remained highly volatile, rising with a snapback rally as market participants looked optimistically to the future despite the economy entering a severe recession.
Brown Advisory
Brown Advisory LLC co-subadvised the Portfolio from May 1, 2020 through June 30, 2020. During this portion of the reporting period, the COVID-19 pandemic deeply affected the U.S. economy and equity markets. The pandemic did not, however, have an impact on the Portfolio’s liquidity.
What factors affected the Portfolio’s relative performance during the reporting period?
Eagle
From January 1 through April 30, 2020, the Portfolio saw positive returns relative to the Russell 2000® Growth Index due in large part to the Eagle team’s success in identifying several secular growth trends prior to the onset of the pandemic. Although the team did not forecast the severity of the economic
fallout from the pandemic, they did see a number of these trends accelerate rapidly, with most appearing to have considerable staying power. These trends included cloud computing, work-from-home, telemedicine and remote learning.
SBH
From May 1 through June 30, 2020, the portion of the Portfolio subadvised by SBH outperformed the Russell 2000® Growth Index primarily due to security selection and sector allocation decisions.
Brown Advisory
From May 1 through June 30, 2020, the portion of the Portfolio subadvised by Brown Advisory outperformed the Russell 2000® Growth Index largely due to strong security selections despite the challenging investment environment we encountered. Our portfolio selection process focuses on characteristics we regard as higher “quality.” Lower quality characteristics, such as low share price, low return on equity, highly shorted, high leverage and unprofitable stocks led returns across most sectors during the second quarter of 2020. Such characteristics do not represent tailwinds for the portion of the Portfolio we manage and, in fact, are somewhat ill-suited to our strategy of seeking to outperform the benchmark.
Were there any changes to the Portfolio during the reporting period?
Effective May 1, 2020, several changes to the Portfolio were made. The Portfolio was renamed MainStay VP Small Cap Growth Portfolio and the Portfolio’s principal investment strategies and principal risks were modified. Eagle, as subadvisor, was removed along with Bert L. Boksen, Eric Mintz and Christopher Sassouni as the portfolio managers. The new portfolio managers named were Brian C. Fitzsimons and Mitch S. Begun of SBH as well as Christopher A. Berrier and George Sakellaris of Brown Advisory, all co-subadvisors of the Portfolio. For more information about these changes, refer to the supplement dated March 19, 2020.
Which sectors were the strongest positive contributors to the Portfolio’s relative performance, and which sectors were particularly weak?
Eagle
Although all sectors saw negative returns on an absolute basis from January 1 through April 30, 2020, strong stock selections in health care, consumer staples and information technology provided positive contributions to the Portfolio’s outperformance
| 1. | See page 5 for more information on benchmark and peer group returns. |
| | |
| 8 | | MainStay VP Small Cap Growth Portfolio |
relative to the Russell 2000® Growth Index. (Contributions take weightings and total returns into account.) Slightly overweight exposure relative to the benchmark in the materials and energy sectors detracted most from the Portfolio’s performance. Disappointing stock selections in real estate also dragged slightly on relative performance, but to a lesser degree.
SBH
Relative to the benchmark, the three sectors that contributed most to the performance of the portion of the Portfolio subadvised by SBH were information technology, financials and consumer discretionary. Conversely, the three sectors that detracted most were health care, materials and real estate.
Brown Advisory
The three sectors making the strongest contribution to the portion of the Portfolio subadvised by Brown Advisory relative to the Russell 2000® Growth Index were information technology, consumer discretionary and financials. Within the information technology sector, most of the Portfolio’s outperformance was the result of stock selection. The three weakest-contributing sectors were industrials, health care and consumer staples. Within the industrials sector most of the relatively weak performance was the result of stock selection.
During the reporting period, which individual stocks made the strongest positive contributions to the Portfolio’s absolute performance and which stocks detracted the most?
Eagle
The leading individual contributors to the Portfolio’s absolute performance from January 1 through April 30, 2020 included telemedicine provider Teladoc, fast-casual chicken wing restaurant chain Wingstop and biotechnology company Acceleron Pharma. Teladoc saw shares rise sharply as the firm’s unique value proposition rose to the forefront of the health care industry, enabling patients and physicians to connect virtually in an environment in which physical contact was heavily restricted. Wingstop reported very strong comparable same-store sales and earnings. Their business model is very well suited for digital ordering and delivery, both of which combined to drive the strong performance. Shares in Acceleron Pharma jumped as the firm’s Phase-2 drug candidate for patients with severe pulmonary arterial hypertension successfully met both primary clinical endpoints. Another notably positive contributor to performance, real-time communications platform Everbridge, benefited as the firm’s platform was used by states and local governments to alert their constituents of important issues via alerts and text messages throughout the COVID-19 pandemic.
During the same portion of the reporting period, the stocks that detracted most from the Portfolio’s absolute performance included casino gaming manufacturer Everi, aerospace control system manufacturer Woodward and real estate investment trust (“REIT”) Seritage Growth Properties. Everi performed poorly as widespread, pandemic-related closures of casinos swept across the United States, weighing heavily on shares. Woodward saw shares fall as the firm’s previously announced strategic acquisition of an aerospace composite components producer was sidelined, while sudden demand slowdowns weighed on the key business segments. Seritage Growth Properties suffered as social distancing and stay-at-home orders brought consumer foot traffic to a standstill, undermining the firm’s efforts to attract retail tenants.
SBH
The three strongest performing holdings in the portion of the Portfolio subadvised by SBH included value retailer Ollie’s Bargain Outlet Holdings, information technology services provider Globant and independent insurance agency Goosehead Insurance. Shares in all three companies rose as they reported strong results during the second quarter of 2020 despite concerns that the COVID-19 pandemic would create material headwinds to growth.
The stocks that detracted most from absolute performance were consulting services firm Huron Consulting Group, medical device company Cardiovascular Systems and aerospace & defense technology provider Mercury Systems. Huron’s two primary end markets, hospitals and education, were severely disrupted by the pandemic. Cardiovascular Systems faced difficulties as elective medical procedures slowed materially. Mercury Systems underperformed after a period of strength as the market digested previous gains.
Brown Advisory
The three strongest performing holdings in the portion of the Portfolio subadvised by Brown Advisory included online marketplace Etsy, student-first connected learning platform Chegg, and contract provider of laboratory testing and research services Charles River Laboratories International. Etsy’s stock surged due to increased demand across its platform as consumers shifted to online spending during the pandemic. The company attracted new customers and saw increased purchase frequency across existing customers. Chegg reported earnings that encouraged investors and supported our investment thesis that the company should benefit from the shift to online learning. They experienced a reacceleration in subscriber growth and issued strong guidance. Following a steep sell-off in March 2020, Charles River Laboratories stock experienced a robust rebound as its pre-clinical research activities proved resilient in the face of the pandemic.
The stocks that detracted most from absolute performance were inpatient rehabilitation hospital owner and operator Encompass Health, fertility benefits provider Progyny and biotechnology product developer Iovance Biotherapeutics. Stock in Encompass Health lagged due to the potential lingering effects of the pandemic on inpatient rehabilitation admissions, and concerns regarding the possibility of changes in policy priorities resulting from the upcoming U.S. election. Progyny shares lost ground despite robust revenue growth and high customer retention rates. We remained confident in the company’s differentiated approach to plan design, member support and active network management, which we believe drive better clinical outcomes and lower costs. Iovance Biotherapeutics stock faltered as it consolidated recent gains.
Did the Portfolio make any significant purchases or sales during the reporting period?
Eagle
Significant purchases included shares of digital sports and gaming company DraftKings and cloud-based software provider Smartsheet. DraftKings appeared to be in an attractive position to capitalize on the secular trend toward increasing online sports betting and gaming. Smartsheet saw encouraging demand for their online work management platform from both federal agencies and health care companies amid the pandemic. Notable sales included casino entertainment and resort company Eldorado Resorts and human resources software developer Cornerstone OnDemand. We sold the Portfolio’s position in Eldorado Resorts to lower exposure to the casino and gaming industry during the global pandemic. We sold the Portfolio’s position in Cornerstone OnDemand after the company reported disappointing financial results and provided underwhelming future guidance in the wake of a questionable acquisition.
SBH
Significant new purchases included information technology services provider Endava and engineering consultant Tetra Tech. We believed Endava was well positioned to consistently grow its cash flows over time due to a strong competitive position in next-generation technology development. We were attracted to Tetra Tech’s leading position in the water services industry, where meaningful investments are needed to overhaul an outdated infrastructure.
Significant sales included positions in security software provider Zscaler and entertainment company Live Nation. Both were sold due to valuation concerns, as well as consideration of market capitalizations that had risen beyond the small-cap universe.
Brown Advisory
Significant purchases included Bruker Corporation, a supplier of high-end analytical instruments for life science research, and Inari Medical, a developer of differentiated devices for the removal of blood clots from the venous system. We believe Bruker stands to benefit from several initiatives and end-market developments have the potential to accelerate organic growth over the next few years. Inari Medical’s novel products are seeing rapid adoption by interventionists for the treatment of deep vein thrombosis and pulmonary embolism, markets that we estimate total approximately $5 billion worldwide and are only approximately 5% penetrated today.
Significant sales included the Portfolio’s position in Marvell Technology Group, a semiconductor provider of application-specific standard products, to reallocate the Portfolio’s capital into smaller-cap semiconductor ideas.
How did the Portfolio’s sector weightings change during the reporting period?
Eagle
From January 1 through April 30, 2020, the Portfolio increased the size of its overweight exposure to the consumer discretionary sector relative to the Russell 2000® Growth Index and increased its consumer staples exposure from slightly underweight to mildly overweight relative to the benchmark. During the same portion of the reporting period, the Portfolio significantly trimmed its relatively overweight exposure to the information technology sector and increased the degree of its underweight position in health care.
SBH
From May 1 through June 30, 2020, the portion of the Portfolio subadvised by SBH made its largest sector increases relative to the Russell 2000® Growth Index in industrials and financials, and its largest sector decreases relative to the benchmark in information technology and consumer discretionary.
Brown Advisory
From May 1 through June 30, 2020, the only notable change to the portion of the Portfolio subadvised by Brown Advisory was to a slight increase in health care exposure relative to the Russell 2000® Growth Index while still maintaining an underweight position in the sector.
| | |
| 10 | | MainStay VP Small Cap Growth Portfolio |
How was the Portfolio positioned at the end of the reporting period?
Eagle
As of April 30, 2020, the Portfolio’s largest overweight positions relative to the Russell 2000® Growth Index were in the consumer discretionary and information technology sectors, while its most underweight positions were in real estate and health care.
SBH
As of June 30, 2020, the portion of the Portfolio subadvised by SBH held its largest overweight exposures relative to the Russell 2000® Growth Index in the financials and industrials sectors, while its most relatively underweight positions were in the health care and consumer staples sectors.
Brown Advisory
As of June 30, 2020, the portion of the Portfolio subadvised by Brown Advisory maintained underweight exposure relative to the Russell 2000® Growth Index in the technology and health care sectors. Both positions reflected our internal sector allocation framework. We believe that certain components of the market are gripped by momentum and exceptionally crowded. Accordingly, we seek to ensure that the Portfolio does not hold overweight exposure to those market segments. As of the same date, the portion of the Portfolio subadvised by Brown Advisory held relatively overweight exposure to the consumer sectors, but this exposure was trending downwards, and we believe our companies within those sectors are fairly well diversified.
The opinions expressed are those of the portfolio managers as of the date of this report and are subject to change. There is no guarantee that any forecasts will come to pass. This material does not constitute investment advice and is not intended as an endorsement of any specific investment.
Not all MainStay VP Portfolios and/or share classes are available under all policies.
Portfolio of Investments June 30, 2020 (Unaudited)
| | | | | | | | |
| | |
| | | Shares | | | Value | |
| | | | | | | | |
| Common Stocks 96.4%† | |
Aerospace & Defense 3.0% | |
AeroVironment, Inc. (a) | | | 26,800 | | | $ | 2,134,084 | |
BWX Technologies, Inc. | | | 71,774 | | | | 4,065,279 | |
Hexcel Corp. | | | 75,500 | | | | 3,414,110 | |
Mercury Systems, Inc. (a) | | | 59,700 | | | | 4,696,002 | |
| | | | | | | | |
| | | | | | | 14,309,475 | |
| | | | | | | | |
Auto Components 0.9% | |
Fox Factory Holding Corp. (a) | | | 49,900 | | | | 4,122,239 | |
| | | | | | | | |
|
Banks 1.3% | |
Bank OZK | | | 44,000 | | | | 1,032,680 | |
Eagle Bancorp, Inc. | | | 59,100 | | | | 1,935,525 | |
Prosperity Bancshares, Inc. | | | 54,500 | | | | 3,236,210 | |
| | | | | | | | |
| | | | | | | 6,204,415 | |
| | | | | | | | |
Biotechnology 6.6% | |
Acceleron Pharma, Inc. (a) | | | 20,500 | | | | 1,953,035 | |
Amicus Therapeutics, Inc. (a) | | | 143,600 | | | | 2,165,488 | |
Biohaven Pharmaceutical Holding Co., Ltd. (a) | | | 39,300 | | | | 2,873,223 | |
Blueprint Medicines Corp. (a) | | | 63,003 | | | | 4,914,234 | |
Coherus Biosciences, Inc. (a) | | | 41,800 | | | | 746,548 | |
Fate Therapeutics, Inc. (a) | | | 54,110 | | | | 1,856,514 | |
Global Blood Therapeutics, Inc. (a) | | | 24,800 | | | | 1,565,624 | |
Iovance Biotherapeutics, Inc. (a) | | | 36,000 | | | | 988,200 | |
Natera, Inc. (a) | | | 82,300 | | | | 4,103,478 | |
Neurocrine Biosciences, Inc. (a) | | | 31,600 | | | | 3,855,200 | |
Turning Point Therapeutics, Inc. (a) | | | 37,700 | | | | 2,435,043 | |
Twist Bioscience Corp. (a) | | | 49,696 | | | | 2,251,229 | |
Xencor, Inc. (a) | | | 68,100 | | | | 2,205,759 | |
| | | | | | | | |
| | | | | | | 31,913,575 | |
| | | | | | | | |
Building Products 1.0% | |
Trex Co., Inc. (a) | | | 36,000 | | | | 4,682,520 | |
| | | | | | | | |
|
Capital Markets 2.9% | |
Ares Management Corp., Class A | | | 107,600 | | | | 4,271,720 | |
Evercore, Inc., Class A | | | 21,000 | | | | 1,237,320 | |
Focus Financial Partners, Inc., Class A (a) | | | 62,800 | | | | 2,075,540 | |
Hamilton Lane, Inc., Class A | | | 61,500 | | | | 4,143,255 | |
Houlihan Lokey, Inc. | | | 39,102 | | | | 2,175,635 | |
| | | | | | | | |
| | | | | | | 13,903,470 | |
| | | | | | | | |
Chemicals 2.3% | |
Ingevity Corp. (a) | | | 51,100 | | | | 2,686,327 | |
Innospec, Inc. | | | 24,300 | | | | 1,877,175 | |
Livent Corp. (a) | | | 165,200 | | | | 1,017,632 | |
PolyOne Corp. | | | 76,300 | | | | 2,001,349 | |
Quaker Chemical Corp. | | | 18,700 | | | | 3,471,655 | |
| | | | | | | | |
| | | | | | | 11,054,138 | |
| | | | | | | | |
| | | | | | | | |
| | |
| | | Shares | | | Value | |
| | | | | | | | |
Commercial Services & Supplies 4.5% | |
IAA, Inc. (a) | | | 136,600 | | | $ | 5,268,662 | |
MSA Safety, Inc. | | | 23,428 | | | | 2,681,100 | |
Ritchie Brothers Auctioneers, Inc. | | | 91,900 | | | | 3,754,115 | |
Tetra Tech, Inc. | | | 22,082 | | | | 1,747,278 | |
Waste Connections, Inc. | | | 85,854 | | | | 8,052,247 | |
| | | | | | | | |
| | | | | | | 21,503,402 | |
| | | | | | | | |
Consumer Finance 0.4% | |
LendingTree, Inc. (a)(b) | | | 6,500 | | | | 1,881,945 | |
| | | | | | | | |
|
Diversified Consumer Services 3.3% | |
Bright Horizons Family Solutions, Inc. (a) | | | 88,703 | | | | 10,395,991 | |
Chegg, Inc. (a) | | | 79,745 | | | | 5,363,649 | |
| | | | | | | | |
| | | | | | | 15,759,640 | |
| | | | | | | | |
Diversified Telecommunication Services 2.1% | |
Cogent Communications Holdings, Inc. | | | 34,400 | | | | 2,661,184 | |
GCI Liberty, Inc., Class A (a) | | | 107,800 | | | | 7,666,736 | |
| | | | | | | | |
| | | | | | | 10,327,920 | |
| | | | | | | | |
Electrical Equipment 1.8% | |
Generac Holdings, Inc. (a) | | | 46,800 | | | | 5,706,324 | |
TPI Composites, Inc. (a) | | | 122,000 | | | | 2,851,140 | |
| | | | | | | | |
| | | | | | | 8,557,464 | |
| | | | | | | | |
Electronic Equipment, Instruments & Components 1.0% | |
Littelfuse, Inc. | | | 10,100 | | | | 1,723,363 | |
Novanta, Inc. (a) | | | 28,200 | | | | 3,010,914 | |
| | | | | | | | |
| | | | | | | 4,734,277 | |
| | | | | | | | |
Energy Equipment & Services 0.2% | |
Cactus, Inc., Class A | | | 44,400 | | | | 915,972 | |
| | | | | | | | |
|
Entertainment 1.9% | |
Zynga, Inc., Class A (a) | | | 950,600 | | | | 9,068,724 | |
| | | | | | | | |
|
Equity Real Estate Investment Trusts 2.6% | |
Americold Realty Trust | | | 71,000 | | | | 2,577,300 | |
EastGroup Properties, Inc. | | | 31,488 | | | | 3,734,792 | |
QTS Realty Trust, Inc., Class A | | | 78,100 | | | | 5,005,429 | |
Terreno Realty Corp. | | | 20,500 | | | | 1,079,120 | |
| | | | | | | | |
| | | | | | | 12,396,641 | |
| | | | | | | | |
Food & Staples Retailing 0.6% | |
Casey’s General Stores, Inc. | | | 20,996 | | | | 3,139,322 | |
| | | | | | | | |
|
Food Products 1.7% | |
Hain Celestial Group, Inc. (a) | | | 225,341 | | | | 7,100,495 | |
Simply Good Foods Co. (a) | | | 65,400 | | | | 1,215,132 | |
| | | | | | | | |
| | | | | | | 8,315,627 | |
| | | | | | | | |
| | | | |
| 12 | | MainStay VP Small Cap Growth Portfolio | | The notes to the financial statements are an integral part of,
and should be read in conjunction with, the financial statements. |
| | | | | | | | |
| | |
| | | Shares | | | Value | |
| | | | | | | | |
| Common Stocks (continued) | |
Health Care Equipment & Supplies 4.5% | |
Cardiovascular Systems, Inc. (a) | | | 71,600 | | | $ | 2,258,980 | |
CONMED Corp. | | | 33,500 | | | | 2,411,665 | |
Establishment Labs Holdings, Inc. (a) | | | 69,980 | | | | 1,307,226 | |
Globus Medical, Inc., Class A (a) | | | 86,200 | | | | 4,112,602 | |
Inari Medical, Inc. (a) | | | 13,656 | | | | 661,497 | |
Integra LifeSciences Holdings Corp. (a) | | | 65,500 | | | | 3,077,845 | |
LivaNova PLC (a) | | | 30,300 | | | | 1,458,339 | |
Nevro Corp. (a) | | | 10,242 | | | | 1,223,612 | |
OrthoPediatrics Corp. (a) | | | 43,100 | | | | 1,886,056 | |
Silk Road Medical, Inc. (a) | | | 73,100 | | | | 3,062,159 | |
| | | | | | | | |
| | | | | | | 21,459,981 | |
| | | | | | | | |
Health Care Providers & Services 3.7% | |
Addus HomeCare Corp. (a) | | | 44,800 | | | | 4,146,688 | |
Amedisys, Inc. (a) | | | 29,900 | | | | 5,936,346 | |
BioTelemetry, Inc. (a) | | | 39,800 | | | | 1,798,562 | |
Encompass Health Corp. | | | 30,200 | | | | 1,870,286 | |
HealthEquity, Inc. (a) | | | 52,300 | | | | 3,068,441 | |
Progyny, Inc. (a) | | | 48,662 | | | | 1,255,966 | |
| | | | | | | | |
| | | | | | | 18,076,289 | |
| | | | | | | | |
Health Care Technology 2.1% | |
Inspire Medical Systems, Inc. (a) | | | 32,300 | | | | 2,810,746 | |
Omnicell, Inc. (a) | | | 45,900 | | | | 3,241,458 | |
Phreesia, Inc. (a) | | | 86,000 | | | | 2,432,080 | |
Tabula Rasa HealthCare, Inc. (a)(b) | | | 26,700 | | | | 1,461,291 | |
| | | | | | | | |
| | | | | | | 9,945,575 | |
| | | | | | | | |
Hotels, Restaurants & Leisure 2.7% | |
Choice Hotels International, Inc. | | | 20,700 | | | | 1,633,230 | |
Churchill Downs, Inc. | | | 35,300 | | | | 4,700,195 | |
Shake Shack, Inc., Class A (a) | | | 51,100 | | | | 2,707,278 | |
Vail Resorts, Inc. | | | 10,000 | | | | 1,821,500 | |
Wingstop, Inc. | | | 16,100 | | | | 2,237,417 | |
| | | | | | | | |
| | | | | | | 13,099,620 | |
| | | | | | | | |
Household Durables 0.9% | |
TopBuild Corp. (a) | | | 36,900 | | | | 4,198,113 | |
| | | | | | | | |
|
Insurance 2.6% | |
AMERISAFE, Inc. | | | 23,994 | | | | 1,467,473 | |
Goosehead Insurance, Inc., Class A (a) | | | 95,300 | | | | 7,162,748 | |
Trupanion, Inc. (a)(b) | | | 96,400 | | | | 4,115,316 | |
| | | | | | | | |
| | | | | | | 12,745,537 | |
| | | | | | | | |
Interactive Media & Services 0.2% | |
Eventbrite, Inc., Class A (a) | | | 101,600 | | | | 870,712 | |
| | | | | | | | |
|
Internet & Direct Marketing Retail 1.9% | |
Etsy, Inc. (a) | | | 41,699 | | | | 4,429,685 | |
MakeMyTrip, Ltd. (a) | | | 169,300 | | | | 2,593,676 | |
| | | | | | | | |
| | |
| | | Shares | | | Value | |
| | | | | | | | |
Internet & Direct Marketing Retail (continued) | |
Revolve Group, Inc. (a) | | | 62,200 | | | $ | 924,292 | |
Stitch Fix, Inc., Class A (a)(b) | | | 49,384 | | | | 1,231,637 | |
| | | | | | | | |
| | | | | | | 9,179,290 | |
| | | | | | | | |
IT Services 5.2% | |
Broadridge Financial Solutions, Inc. | | | 18,600 | | | | 2,347,134 | |
Endava PLC, Sponsored ADR (a) | | | 58,875 | | | | 2,843,662 | |
Evo Payments, Inc., Class A (a) | | | 228,200 | | | | 5,209,806 | |
Genpact, Ltd. | | | 231,200 | | | | 8,443,424 | |
MAXIMUS, Inc. | | | 68,200 | | | | 4,804,690 | |
WEX, Inc. (a) | | | 8,000 | | | | 1,320,080 | |
| | | | | | | | |
| | | | | | | 24,968,796 | |
| | | | | | | | |
Leisure Products 0.5% | |
Callaway Golf Co. | | | 92,300 | | | | 1,616,173 | |
Clarus Corp. | | | 84,593 | | | | 979,587 | |
| | | | | | | | |
| | | | | | | 2,595,760 | |
| | | | | | | | |
Life Sciences Tools & Services 4.7% | |
Adaptive Biotechnologies Corp. (a) | | | 73,400 | | | | 3,551,092 | |
Bruker Corp. | | | 41,175 | | | | 1,674,999 | |
Charles River Laboratories International, Inc. (a) | | | 50,800 | | | | 8,856,980 | |
NeoGenomics, Inc. (a) | | | 189,867 | | | | 5,882,080 | |
PRA Health Sciences, Inc. (a) | | | 26,500 | | | | 2,578,185 | |
| | | | | | | | |
| | | | | | | 22,543,336 | |
| | | | | | | | |
Machinery 2.7% | |
ESCO Technologies, Inc. | | | 13,200 | | | | 1,115,796 | |
IDEX Corp. | | | 19,400 | | | | 3,065,976 | |
John Bean Technologies Corp. | | | 53,500 | | | | 4,602,070 | |
Proto Labs, Inc. (a) | | | 25,300 | | | | 2,845,491 | |
Woodward, Inc. | | | 18,700 | | | | 1,450,185 | |
| | | | | | | | |
| | | | | | | 13,079,518 | |
| | | | | | | | |
Media 0.5% | |
New York Times Co., Class A | | | 54,600 | | | | 2,294,838 | |
| | | | | | | | |
|
Multiline Retail 0.8% | |
Ollie’s Bargain Outlet Holdings, Inc. (a) | | | 38,640 | | | | 3,773,196 | |
| | | | | | | | |
|
Pharmaceuticals 2.4% | |
Catalent, Inc. (a) | | | 128,089 | | | | 9,388,924 | |
Pacira BioSciences, Inc. (a) | | | 41,700 | | | | 2,187,999 | |
| | | | | | | | |
| | | | | | | 11,576,923 | |
| | | | | | | | |
Professional Services 1.7% | |
ASGN, Inc. (a) | | | 37,600 | | | | 2,507,168 | |
Huron Consulting Group, Inc. (a) | | | 61,300 | | | | 2,712,525 | |
Upwork, Inc. (a) | | | 207,116 | | | | 2,990,755 | |
| | | | | | | | |
| | | | | | | 8,210,448 | |
| | | | | | | | |
| | | | | | |
The notes to the financial statements are an integral part of,
and should be read in conjunction with, the financial statements. | | | | | 13 | |
Portfolio of Investments June 30, 2020 (Unaudited) (continued)
| | | | | | | | |
| | |
| | | Shares | | | Value | |
| | | | | | | | |
| Common Stocks (continued) | |
Road & Rail 0.8% | |
Knight-Swift Transportation Holdings, Inc. | | | 34,200 | | | $ | 1,426,482 | |
Saia, Inc. (a) | | | 22,700 | | | | 2,523,786 | |
| | | | | | | | |
| | | | | | | 3,950,268 | |
| | | | | | | | |
Semiconductors & Semiconductor Equipment 6.2% | |
Entegris, Inc. | | | 127,900 | | | | 7,552,495 | |
Inphi Corp. (a) | | | 42,300 | | | | 4,970,250 | |
Lattice Semiconductor Corp. (a) | | | 131,600 | | | | 3,736,124 | |
Monolithic Power Systems, Inc. | | | 13,383 | | | | 3,171,771 | |
Onto Innovation, Inc. (a) | | | 82,900 | | | | 2,821,916 | |
Power Integrations, Inc. | | | 24,100 | | | | 2,846,933 | |
Silicon Laboratories, Inc. (a) | | | 47,100 | | | | 4,722,717 | |
| | | | | | | | |
| | | | | | | 29,822,206 | |
| | | | | | | | |
Software 11.7% | |
Anaplan, Inc. (a) | | | 43,300 | | | | 1,961,923 | |
Aspen Technology, Inc. (a) | | | 16,783 | | | | 1,738,887 | |
Blackline, Inc. (a) | | | 52,400 | | | | 4,344,484 | |
Dynatrace, Inc. (a) | | | 113,800 | | | | 4,620,280 | |
Envestnet, Inc. (a) | | | 68,800 | | | | 5,059,552 | |
Everbridge, Inc. (a) | | | 17,400 | | | | 2,407,464 | |
Globant S.A. (a) | | | 46,500 | | | | 6,968,025 | |
Guidewire Software, Inc. (a) | | | 29,079 | | | | 3,223,407 | |
Mimecast, Ltd. (a) | | | 135,100 | | | | 5,628,266 | |
Nuance Communications, Inc. (a) | | | 136,000 | | | | 3,441,480 | |
PROS Holdings, Inc. (a) | | | 69,501 | | | | 3,087,929 | |
RealPage, Inc. (a) | | | 31,500 | | | | 2,047,815 | |
Workiva, Inc. (a) | | | 110,800 | | | | 5,926,692 | |
Zendesk, Inc. (a) | | | 39,000 | | | | 3,452,670 | |
Zuora, Inc., Class A (a) | | | 209,500 | | | | 2,671,125 | |
| | | | | | | | |
| | | | | | | 56,579,999 | |
| | | | | | | | |
Specialty Retail 1.2% | |
National Vision Holdings, Inc. (a) | | | 102,400 | | | | 3,125,248 | |
RH (a) | | | 10,900 | | | | 2,713,010 | |
| | | | | | | | |
| | | | | | | 5,838,258 | |
| | | | | | | | |
Trading Companies & Distributors 1.3% | |
SiteOne Landscape Supply, Inc. (a) | | | 55,600 | | | | 6,336,732 | |
| | | | | | | | |
Total Common Stocks
(Cost $392,385,238) | | | | 463,936,161 | |
| | | | | |
| | | | | | | | |
| | |
| | | Shares | | | Value | |
| | | | | | | | |
| Short-Term Investments 4.3% | |
Affiliated Investment Company 3.3% | |
MainStay U.S. Government Liquidity Fund, 0.05% (c) | | | 15,887,212 | | | $ | 15,887,212 | |
| | | | | | | | |
|
Unaffiliated Investment Company 1.0% | |
State Street Navigator Securities Lending Government Money Market Portfolio, 0.13% (c)(d) | | | 4,891,709 | | | | 4,891,709 | |
| | | | | | | | |
Total Short-Term Investments
(Cost $20,778,921) | | | | 20,778,921 | |
| | | | | |
Total Investments
(Cost $413,164,159) | | | 100.7 | % | | | 484,715,082 | |
Other Assets, Less Liabilities | | | (0.7 | ) | | | (3,204,923 | ) |
Net Assets | | | 100.0 | % | | $ | 481,510,159 | |
| † | Percentages indicated are based on Portfolio net assets. |
| (a) | Non-income producing security. |
| (b) | All or a portion of this security was held on loan. As of June 30, 2020, the aggregate market value of securities on loan was $8,405,898; the total market value of collateral held by the Portfolio was $8,557,791. The market value of the collateral held included non-cash collateral in the form of U.S. Treasury securities with a value of $3,666,082 (See Note 2(H)). |
| (c) | Current yield as of June 30, 2020. |
| (d) | Represents a security purchased with cash collateral received for securities on loan. |
The following abbreviation is used in the preceding pages:
ADR—American Depositary Receipt
| | | | |
| 14 | | MainStay VP Small Cap Growth Portfolio | | The notes to the financial statements are an integral part of,
and should be read in conjunction with, the financial statements. |
The following is a summary of the fair valuations according to the inputs used as of June 30, 2020, for valuing the Portfolio’s assets:
| | | | | | | | | | | | | | | | |
Description | | Quoted Prices in Active Markets for Identical Assets (Level 1) | | | Significant Other Observable Inputs (Level 2) | | | Significant Unobservable Inputs (Level 3) | | | Total | |
|
Asset Valuation Inputs | |
| Investments in Securities (a) | | | | | | | | | |
Common Stocks | | $ | 463,936,161 | | | $ | — | | | $ | — | | | $ | 463,936,161 | |
Short-Term Investments | | | | | | | | | |
Affiliated Investment Company | | | 15,887,212 | | | | — | | | | — | | | | 15,887,212 | |
Unaffiliated Investment Company | | | 4,891,709 | | | | — | | | | — | | | | 4,891,709 | |
| | | | | | | | | | | | | | | | |
| Total Short-Term Investments | | | 20,778,921 | | | | — | | | | — | | | | 20,778,921 | |
| | | | | | | | | | | | | | | | |
| Total Investments in Securities | | $ | 484,715,082 | | | $ | — | | | $ | — | | | $ | 484,715,082 | |
| | | | | | | | | | | | | | | | |
| (a) | For a complete listing of investments and their industries, see the Portfolio of Investments. |
| | | | | | |
The notes to the financial statements are an integral part of,
and should be read in conjunction with, the financial statements. | | | | | 15 | |
Statement of Assets and Liabilities as of June 30, 2020 (Unaudited)
| | | | |
| Assets | |
Investment in unaffiliated securities, at value
(identified cost $397,276,947) including securities on loan of $8,405,898 | | $ | 468,827,870 | |
Investment in affiliated investment company, at value (identified cost $15,887,212) | | | 15,887,212 | |
Cash | | | 34,142 | |
Receivables: | |
Investment securities sold | | | 3,932,883 | |
Dividends | | | 179,168 | |
Securities lending | | | 13,375 | |
Portfolio shares sold | | | 11,532 | |
Other assets | | | 2,242 | |
| | | | |
Total assets | | | 488,888,424 | |
| | | | |
|
| Liabilities | |
Cash collateral received for securities on loan | | | 4,891,709 | |
Payables: | |
Investment securities purchased | | | 2,001,526 | |
Manager (See Note 3) | | | 316,022 | |
Portfolio shares redeemed | | | 89,508 | |
NYLIFE Distributors (See Note 3) | | | 24,121 | |
Shareholder communication | | | 23,618 | |
Professional fees | | | 23,317 | |
Custodian | | | 4,967 | |
Trustees | | | 433 | |
Accrued expenses | | | 3,044 | |
| | | | |
Total liabilities | | | 7,378,265 | |
| | | | |
Net assets | | $ | 481,510,159 | |
| | | | |
|
| Composition of Net Assets | |
Shares of beneficial interest outstanding (par value of $.001 per share) unlimited number of shares authorized | | $ | 36,313 | |
Additional paid-in capital | | | 369,070,487 | |
| | | | |
| | | 369,106,800 | |
Total distributable earnings (loss) | | | 112,403,359 | |
| | | | |
Net assets | | $ | 481,510,159 | |
| | | | |
| | | | |
Initial Class | |
Net assets applicable to outstanding shares | | $ | 363,036,196 | |
| | | | |
Shares of beneficial interest outstanding | | | 27,196,435 | |
| | | | |
Net asset value per share outstanding | | $ | 13.35 | |
| | | | |
Service Class | |
Net assets applicable to outstanding shares | | $ | 118,473,963 | |
| | | | |
Shares of beneficial interest outstanding | | | 9,116,834 | |
| | | | |
Net asset value per share outstanding | | $ | 13.00 | |
| | | | |
| | | | |
| 16 | | MainStay VP Small Cap Growth Portfolio | | The notes to the financial statements are an integral part of,
and should be read in conjunction with, the financial statements. |
Statement of Operations for the six months ended June 30, 2020 (Unaudited)
| | | | |
| Investment Income (Loss) | |
Income | |
Dividends-unaffiliated (a) | | $ | 1,038,461 | |
Securities lending | | | 52,074 | |
Dividends-affiliated | | | 23,756 | |
| | | | |
Total income | | | 1,114,291 | |
| | | | |
Expenses | |
Manager (See Note 3) | | | 1,811,600 | |
Distribution/Service—Service Class (See Note 3) | | | 140,139 | |
Professional fees | | | 38,569 | |
Shareholder communication | | | 22,666 | |
Custodian | | | 9,418 | |
Trustees | | | 5,198 | |
Miscellaneous | | | 8,630 | |
| | | | |
Total expenses | | | 2,036,220 | |
| | | | |
Net investment income (loss) | | | (921,929 | ) |
| | | | |
|
| Realized and Unrealized Gain (Loss) on Investments and Foreign Currency Transactions | |
| |
Net realized gain (loss) on: | |
Unaffiliated investment transactions | | | 27,087,020 | |
Foreign currency transactions | | | 60 | |
| | | | |
Net realized gain (loss) on investments and foreign currency transactions | | | 27,087,080 | |
| | | | |
Net change in unrealized appreciation (depreciation) on unaffiliated investments | | | (26,708,074 | ) |
| | | | |
Net realized and unrealized gain (loss) on investments and foreign currency transactions | | | 379,006 | |
| | | | |
Net increase (decrease) in net assets resulting from operations | | $ | (542,923 | ) |
| | | | |
| (a) | Dividends recorded net of foreign withholding taxes in the amount of $9,609. |
| | | | | | |
The notes to the financial statements are an integral part of,
and should be read in conjunction with, the financial statements. | | | | | 17 | |
Statements of Changes in Net Assets
for the six months ended June 30, 2020 (Unaudited) and the year ended December 31, 2019
| | | | | | | | |
| | | 2020 | | | 2019 | |
| Increase (Decrease) in Net Assets | |
Operations: | |
Net investment income (loss) | | $ | (921,929 | ) | | $ | (1,914,324 | ) |
Net realized gain (loss) on investments and foreign currency transactions | | | 27,087,080 | | | | 15,222,386 | |
Net change in unrealized appreciation (depreciation) on investments | | | (26,708,074 | ) | | | 75,200,132 | |
| | | | |
Net increase (decrease) in net assets resulting from operations | | | (542,923 | ) | | | 88,508,194 | |
| | | | |
Distributions to shareholders: | |
Initial Class | | | — | | | | (35,509,408 | ) |
Service Class | | | — | | | | (15,063,430 | ) |
| | | | |
Total distributions to shareholders | | | — | | | | (50,572,838 | ) |
| | | | |
Capital share transactions: | |
Net proceeds from sale of shares | | | 56,856,148 | | | | 96,615,245 | |
Net asset value of shares issued to shareholders in reinvestment of distributions | | | — | | | | 50,572,838 | |
Cost of shares redeemed | | | (32,583,638 | ) | | | (75,386,760 | ) |
| | | | |
Increase (decrease) in net assets derived from capital share transactions | | | 24,272,510 | | | | 71,801,323 | |
| | | | |
Net increase (decrease) in net assets | | | 23,729,587 | | | | 109,736,679 | |
|
| Net Assets | |
Beginning of period | | | 457,780,572 | | | | 348,043,893 | |
| | | | |
End of period | | $ | 481,510,159 | | | $ | 457,780,572 | |
| | | | |
| | | | |
| 18 | | MainStay VP Small Cap Growth Portfolio | | The notes to the financial statements are an integral part of,
and should be read in conjunction with, the financial statements. |
Financial Highlights selected per share data and ratios
| | | | | | | | | | | | | | | | | | | | | | | | | | | | |
| | | |
| | | Six months
ended
June 30, | | | | | | Year ended December 31, | |
| | | | | | | |
| Initial Class | | 2020* | | | | | | 2019 | | | 2018 | | | 2017 | | | 2016 | | | 2015 | |
| | | | | | | |
Net asset value at beginning of period | | $ | 13.31 | | | | | | | $ | 12.20 | | | $ | 14.09 | | | $ | 12.03 | | | $ | 11.53 | | | $ | 13.33 | |
| | | | | | | | | | | | | | | | | | | | | | | | | | | | |
| | | | | | | |
Net investment income (loss) (a) | | | (0.02 | ) | | | | | | | (0.06 | ) | | | (0.06 | ) | | | (0.06 | ) | | | (0.05 | ) | | | (0.07 | ) |
| | | | | | | |
Net realized and unrealized gain (loss) on investments | | | 0.06 | | | | | | | | 2.96 | | | | (1.04 | ) | | | 2.78 | | | | 1.19 | | | | (0.09 | ) |
| | | | | | | | | | | | | | | | | | | | | | | | | | | | |
| | | | | | | |
Total from investment operations | | | 0.04 | | | | | | | | 2.90 | | | | (1.10 | ) | | | 2.72 | | | | 1.14 | | | | (0.16 | ) |
| | | | | | | | | | | | | | | | | | | | | | | | | | | | |
| | | | | | | |
| Less distributions: | | | | | | | | | | | | | | | | | | | | | | | | | | | | |
| | | | | | | |
From net realized gain on investments | | | — | | | | | | | | (1.79 | ) | | | (0.79 | ) | | | (0.66 | ) | | | (0.64 | ) | | | (1.64 | ) |
| | | | | | | | | | | | | | | | | | | | | | | | | | | | |
| | | | | | | |
Net asset value at end of period | | $ | 13.35 | | | | | | | $ | 13.31 | | | $ | 12.20 | | | $ | 14.09 | | | $ | 12.03 | | | $ | 11.53 | |
| | | | | | | | | | | | | | | | | | | | | | | | | | | | |
| | | | | | | |
Total investment return (b) | | | 0.30 | % (c) | | | | | | | 25.59 | % | | | (8.88 | %) | | | 22.83 | % | | | 10.01 | % | | | (0.91 | %) |
| | | | | | | |
| Ratios (to average net assets)/Supplemental Data: | | | | | | | | | | | | | | | | | | | | | | | | | | | | |
| | | | | | | |
Net investment income (loss) | | | (0.35 | %) †† | | | | | | | (0.41 | %) | | | (0.40 | %) | | | (0.48 | %) | | | (0.41 | %) | | | (0.53 | %) |
| | | | | | | |
Net expenses (d) | | | 0.85 | % †† | | | | | | | 0.85 | % | | | 0.85 | % | | | 0.85 | % | | | 0.86 | % | | | 0.85 | % |
| | | | | | | |
Portfolio turnover rate | | | 86 | % | | | | | | | 46 | % | | | 41 | % | | | 41 | % | | | 36 | % | | | 50 | % |
| | | | | | | |
Net assets at end of period (in 000’s) | | $ | 363,036 | | | | | | | $ | 332,474 | | | $ | 251,547 | | | $ | 312,106 | | | $ | 282,378 | | | $ | 319,580 | |
| (a) | Per share data based on average shares outstanding during the period. |
| (b) | Total return does not reflect any deduction of sales charges, mortality and expense charges, contract charges or administrative charges. For periods of less than one year, total return is not annualized. |
| (c) | Total investment return may reflect adjustments to conform to generally accepted accounting principles. |
| (d) | In addition to the fees and expenses which the Portfolio bears directly, it also indirectly bears a pro-rata share of the fees and expenses of the underlying funds in which it invests. Such indirect expenses are not included in the above expense ratios. |
| | | | | | | | | | | | | | | | | | | | | | | | | | | | |
| | | |
| | | Six months
ended
June 30, | | | | | | Year ended December 31, | |
| | | | | | | |
| Service Class | | 2020* | | | | | | 2019 | | | 2018 | | | 2017 | | | 2016 | | | 2015 | |
| | | | | | | |
Net asset value at beginning of period | | $ | 12.97 | | | | | | | $ | 11.96 | | | $ | 13.87 | | | $ | 11.88 | | | $ | 11.42 | | | $ | 13.25 | |
| | | | | | | | | | | | | | | | | | | | | | | | | | | | |
| | | | | | | |
Net investment income (loss) (a) | | | (0.04 | ) | | | | | | | (0.09 | ) | | | (0.09 | ) | | | (0.09 | ) | | | (0.07 | ) | | | (0.10 | ) |
| | | | | | | |
Net realized and unrealized gain (loss) on investments | | | 0.07 | | | | | | | | 2.89 | | | | (1.03 | ) | | | 2.74 | | | | 1.17 | | | | (0.09 | ) |
| | | | | | | | | | | | | | | | | | | | | | | | | | | | |
| | | | | | | |
Total from investment operations | | | 0.03 | | | | | | | | 2.80 | | | | (1.12 | ) | | | 2.65 | | | | 1.10 | | | | (0.19 | ) |
| | | | | | | | | | | | | | | | | | | | | | | | | | | | |
| | | | | | | |
| Less distributions: | | | | | | | | | | | | | | | | | | | | | | | | | | | | |
| | | | | | | |
From net realized gain on investments | | | — | | | | | | | | (1.79 | ) | | | (0.79 | ) | | | (0.66 | ) | | | (0.64 | ) | | | (1.64 | ) |
| | | | | | | | | | | | | | | | | | | | | | | | | | | | |
| | | | | | | |
Net asset value at end of period | | $ | 13.00 | | | | | | | $ | 12.97 | | | $ | 11.96 | | | $ | 13.87 | | | $ | 11.88 | | | $ | 11.42 | |
| | | | | | | | | | | | | | | | | | | | | | | | | | | | |
| | | | | | | |
Total investment return (b) | | | 0.23 | % (c) | | | | | | | 25.28 | % | | | (9.11 | %) | | | 22.53 | % | | | 9.73 | % | | | (1.16 | %) |
| | | | | | | |
| Ratios (to average net assets)/Supplemental Data: | | | | | | | | | | | | | | | | | | | | | | | | | | | | |
| | | | | | | |
Net investment income (loss) | | | (0.60 | %) †† | | | | | | | (0.65 | %) | | | (0.64 | %) | | | (0.72 | %) | | | (0.66 | %) | | | (0.79 | %) |
| | | | | | | |
Net expenses (d) | | | 1.10 | % †† | | | | | | | 1.10 | % | | | 1.10 | % | | | 1.10 | % | | | 1.11 | % | | | 1.10 | % |
| | | | | | | |
Portfolio turnover rate | | | 86 | % | | | | | | | 46 | % | | | 41 | % | | | 41 | % | | | 36 | % | | | 50 | % |
| | | | | | | |
Net assets at end of period (in 000’s) | | $ | 118,474 | | | | | | | $ | 125,306 | | | $ | 96,497 | | | $ | 90,887 | | | $ | 70,131 | | | $ | 71,135 | |
| (a) | Per share data based on average shares outstanding during the period. |
| (b) | Total return does not reflect any deduction of sales charges, mortality and expense charges, contract charges or administrative charges. For periods of less than one year, total return is not annualized. |
| (c) | Total investment return may reflect adjustments to conform to generally accepted accounting principles. |
| (d) | In addition to the fees and expenses which the Portfolio bears directly, it also indirectly bears a pro-rata share of the fees and expenses of the underlying funds in which it invests. Such indirect expenses are not included in the above expense ratios. |
| | | | | | |
The notes to the financial statements are an integral part of,
and should be read in conjunction with, the financial statements. | | | | | 19 | |
Notes to Financial Statements (Unaudited)
Note 1–Organization and Business
MainStay VP Funds Trust (the ‘‘Fund’’) was organized as a Delaware statutory trust on February 1, 2011. The Fund is registered under the Investment Company Act of 1940, as amended (the “1940 Act”), as an open-end management investment company. The Fund is comprised of thirty-one separate series (collectively referred to as the “Portfolios”). These financial statements and notes relate to the MainStay VP Small Cap Growth Portfolio (formerly MainStay VP Eagle Small Cap Growth Portfolio) (the “Portfolio”), a “diversified” portfolio, as that term is defined in the 1940 Act, as interpreted or modified by regulatory authorities having jurisdiction, from time to time.
Shares of the Portfolio are currently offered to certain separate accounts to fund variable annuity policies and variable universal life insurance policies issued by New York Life Insurance and Annuity Corporation (“NYLIAC”), a wholly-owned subsidiary of New York Life Insurance Company (“New York Life”) and may also be offered to fund variable annuity policies and variable universal life insurance policies issued by other insurance companies. NYLIAC allocates shares of the Portfolios to, among others, certain NYLIAC separate accounts. Shares of the Portfolio are also offered to the MainStay VP Conservative Allocation Portfolio, MainStay VP Moderate Allocation Portfolio, MainStay VP Moderate Growth Allocation Portfolio and MainStay VP Growth Allocation Portfolio, which operate as “funds-of-funds,” and other variable insurance funds.
The Portfolio currently offers two classes of shares. Initial Class and Service Class shares commenced operations on February 17, 2012. Shares of the Portfolio are offered and are redeemed at a price equal to their respective net asset value (“NAV”) per share. No sales or redemption charge is applicable to the purchase or redemption of the Portfolio’s shares. Under the terms of the Fund’s multiple class plan adopted pursuant to Rule 18f-3 under the 1940 Act, the classes differ in that, among other things, Service Class shares of the Portfolio pay a combined distribution and service fee of 0.25% of average daily net assets attributable to Service Class shares of the Portfolio to the Distributor (as defined in Note 3(B)) pursuant to a plan adopted in accordance with Rule 12b-1 under the 1940 Act. Contract owners of variable annuity contracts purchased after June 2, 2003, are permitted to invest only in the Service Class shares.
The Portfolio’s investment objective is to seek long-term capital appreciation.
Note 2–Significant Accounting Policies
The Portfolio is an investment company and accordingly follows the investment company accounting and reporting guidance of the Financial Accounting Standards Board (“FASB”) Accounting Standard Codification Topic 946 Financial Services – Investment Companies. The Portfolio prepares its financial statements in accordance with generally accepted accounting principles (“GAAP”) in the United States of America and follows the significant accounting policies described below.
(A) Securities Valuation. Investments are usually valued as of the close of regular trading on the New York Stock Exchange (the “Exchange”) (usually 4:00 p.m. Eastern time) on each day the Portfolio is open for business (“valuation date”).
The Board of Trustees of the Fund (the “Board”) adopted procedures establishing methodologies for the valuation of the Portfolio’s securities and other assets and delegated the responsibility for valuation determinations under those procedures to the Valuation Committee of the Fund (the “Valuation Committee”). The procedures state that, subject to the oversight of the Board and unless otherwise noted, the responsibility for the day-to-day valuation of portfolio assets (including fair value measurements for the Portfolio’s assets and liabilities) rests with New York Life Investment Management LLC (“New York Life Investments” or the “Manager”), aided to whatever extent necessary by the Subadvisor (as defined in Note 3(A)). To assess the appropriateness of security valuations, the Manager, the Subadvisor or the Portfolio’s third-party service provider, who is subject to oversight by the Manager, regularly compares prior day prices, prices on comparable securities and the sale prices to the prior and current day prices and challenges prices with changes exceeding certain tolerance levels with third-party pricing services or broker sources.
The Board authorized the Valuation Committee to appoint a Valuation Subcommittee (the “Subcommittee”) to establish the prices of securities for which market quotations are not readily available or the prices of which are not otherwise readily determinable under the procedures. The Subcommittee meets (in person, via electronic mail or via teleconference) on an as-needed basis. The Valuation Committee meets to ensure that actions taken by the Subcommittee were appropriate.
For those securities valued through either a standardized fair valuation methodology or a fair valuation measurement, the Subcommittee deals with such valuation and the Valuation Committee reviews and affirms, if appropriate, the reasonableness of the valuation based on such methodologies and measurements on a regular basis after considering information that is reasonably available and deemed relevant by the Valuation Committee. Any action taken by the Subcommittee with respect to the valuation of a portfolio security or other asset is submitted for review and ratification (if appropriate) to the Valuation Committee and the Board at the next regularly scheduled meeting.
“Fair value” is defined as the price the Portfolio would reasonably expect to receive upon selling an asset or liability in an orderly transaction to an independent buyer in the principal or most advantageous market for the asset or liability. Fair value measurements are determined within a framework that establishes a three-tier hierarchy that maximizes the use of observable market data and minimizes the use of unobservable inputs to establish a classification of fair value measurements for disclosure purposes. “Inputs” refer broadly to the assumptions that market participants would use in pricing the asset or liability, including assumptions about risk, such as the risk inherent in a particular valuation technique used to measure fair value using a pricing model and/or the risk inherent in the inputs for the valuation technique. Inputs may be observable or unobservable. Observable inputs reflect the assumptions market participants would use in pricing the asset or liability based on market data obtained from sources independent of the Portfolio. Unobservable inputs reflect the Portfolio’s own assumptions about the assumptions market participants would use in pricing the asset or liability based on the information available. The inputs or methodology used for valuing assets or liabilities may not be an indication of the risks associated with investing in those assets or liabilities. The three-tier hierarchy of inputs is summarized below.
| | |
| 20 | | MainStay VP Small Cap Growth Portfolio |
| • | | Level 1—quoted prices in active markets for an identical asset or liability |
| • | | Level 2—other significant observable inputs (including quoted prices for a similar asset or liability in active markets, interest rates and yield curves, prepayment speeds, credit risk, etc.) |
| • | | Level 3—significant unobservable inputs (including the Portfolio’s own assumptions about the assumptions that market participants would use in measuring fair value of an asset or liability) |
The level of an asset or liability within the fair value hierarchy is based on the lowest level of an input, both individually and in the aggregate, that is significant to the fair value measurement. The aggregate value by input level of the Portfolio’s assets and liabilities as of June 30, 2020 is included at the end of the Portfolio of Investments.
The Portfolio may use third-party vendor evaluations, whose prices may be derived from one or more of the following standard inputs, among others:
| | |
• Broker/dealer quotes | | • Benchmark securities |
• Two-sided markets | | • Reference data (corporate actions or material event notices) |
• Bids/offers | | • Monthly payment information |
• Industry and economic events | | • Reported trades |
An asset or liability for which market values cannot be measured using the methodologies described above is valued by methods deemed reasonable in good faith by the Valuation Committee, following the procedures established by the Board, to represent fair value. Under these procedures, the Portfolio generally uses a market-based approach which may use related or comparable assets or liabilities, recent transactions, market multiples, book values and other relevant information. The Portfolio may also use an income-based valuation approach in which the anticipated future cash flows of the asset or liability are discounted to calculate fair value. Discounts may also be applied due to the nature and/or duration of any restrictions on the disposition of the asset or liability. Fair value represents a good faith approximation of the value of a security. Fair value determinations involve the consideration of a number of subjective factors, an analysis of applicable facts and circumstances and the exercise of judgment. As a result, it is possible that the fair value for a security determined in good faith in accordance with the Portfolio’s valuation procedures may differ from valuations for the same security determined by other funds using their own valuation procedures. Although the Portfolio’s valuation procedures are designed to value a security at the price the Portfolio may reasonably expect to receive upon the security’s sale in an orderly transaction, there can be no assurance that any fair value determination thereunder would, in fact, approximate the amount that the Portfolio would actually realize upon the sale of the security or the price at which the security would trade if a reliable market price were readily available. During the six-month period ended June 30, 2020, there were no material changes to the fair value methodologies.
Securities which may be valued in this manner include, but are not limited to: (i) a security for which trading has been halted or suspended; (ii) a debt security that has recently gone into default and for which there is not a current market quotation; (iii) a security of an issuer that
has entered into a restructuring; (iv) a security that has been delisted from a national exchange; (v) a security for which the market price is not readily available from a third-party pricing source or, if so provided, does not, in the opinion of the Manager or the Subadvisors, reflect the security’s market value; (vi) a security subject to trading collars for which no or limited trading takes place; and (vii) a security whose principal market has been temporarily closed at a time when, under normal conditions, it would be open. Securities valued in this manner are generally categorized as Level 3 in the hierarchy. As of June 30, 2020, no securities held by the Portfolio were fair valued in such a manner.
Equity securities are valued at the last quoted sales prices as of the close of regular trading on the relevant exchange on each valuation date. Securities that are not traded on the valuation date are valued at the mean of the last quoted bid and ask prices. Prices are normally taken from the principal market in which each security trades. These securities are generally categorized as Level 1 in the hierarchy.
Investments in mutual funds, including money market funds, are valued at their respective NAVs as of the close of the Exchange on the valuation date. These securities are generally categorized as Level 1 in the hierarchy.
Temporary cash investments acquired in excess of 60 days to maturity at the time of purchase are valued using the latest bid prices or using valuations based on a matrix system (which considers such factors as security prices, yields, maturities and ratings), both as furnished by independent pricing services. Temporary cash investments that mature in 60 days or less at the time of purchase (“Short-Term Investments”) are valued using the amortized cost method of valuation, unless the use of such method would be inappropriate. The amortized cost method involves valuing a security at its cost on the date of purchase and thereafter assuming a constant amortization to maturity of the difference between such cost and the value on maturity date. Amortized cost approximates the current fair value of a security. Securities valued using the amortized cost method are not valued using quoted prices in an active market and are generally categorized as Level 2 in the hierarchy.
The information above is not intended to reflect an exhaustive list of the methodologies that may be used to value portfolio investments. The valuation procedures permit the use of a variety of valuation methodologies in connection with valuing portfolio investments. The methodology used for a specific type of investment may vary based on the market data available or other considerations. The methodologies summarized above may not represent the specific means by which portfolio investments are valued on any particular business day.
(B) Income Taxes. The Portfolio’s policy is to comply with the requirements of the Internal Revenue Code of 1986, as amended (the “Internal Revenue Code”), applicable to regulated investment companies and to distribute all of its taxable income to the shareholders of the Portfolio within the allowable time limits.
The Manager evaluates the Portfolio’s tax positions to determine if the tax positions taken meet the minimum recognition threshold in connection with accounting for uncertainties in income tax positions taken or expected to be taken for the purposes of measuring and recognizing tax liabilities in the financial statements. Recognition of tax benefits of an uncertain tax position is permitted only to the extent the position is
Notes to Financial Statements (Unaudited) (continued)
“more likely than not” to be sustained assuming examination by taxing authorities. The Manager analyzed the Portfolio’s tax positions taken on federal, state and local income tax returns for all open tax years (for up to three tax years) and has concluded that no provisions for federal, state and local income tax are required in the Portfolio’s financial statements. The Portfolio’s federal, state and local income tax and federal excise tax returns for tax years for which the applicable statutes of limitations have not expired are subject to examination by the Internal Revenue Service and state and local departments of revenue.
(C) Dividends and Distributions to Shareholders. Dividends and distributions are recorded on the ex-dividend date. The Portfolio intends to declare and pay dividends from net investment income and distributions from net realized capital and currency gains, if any, at least annually. Unless a shareholder elects otherwise, all dividends and distributions are reinvested at NAV in the same class of shares of the Portfolio. Dividends and distributions to shareholders are determined in accordance with federal income tax regulations and may differ from determinations using GAAP.
(D) Security Transactions and Investment Income. The Portfolio records security transactions on the trade date. Realized gains and losses on security transactions are determined using the identified cost method. Dividend income is recognized on the ex-dividend date, net of any foreign tax withheld at the source, and interest income is accrued as earned using the effective interest rate method. Distributions received from real estate investment trusts may be classified as dividends, capital gains and/or return of capital.
Investment income and realized and unrealized gains and losses on investments of the Portfolio are allocated pro rata to the separate classes of shares based upon their relative net assets on the date the income is earned or realized and unrealized gains and losses are incurred.
(E) Expenses. Expenses of the Fund are allocated to the individual Portfolios in proportion to the net assets of the respective Portfolios when the expenses are incurred, except where direct allocations of expenses can be made. Expenses (other than fees incurred under the distribution and service plans, further discussed in Note 3(B), which are charged directly to the Service Class shares) are allocated to separate classes of shares pro rata based upon their relative net assets on the date the expenses are incurred. The expenses borne by the Portfolio, including those of related parties to the Portfolio, are shown in the Statement of Operations.
Additionally, the Portfolio may invest in mutual funds, which are subject to management fees and other fees that may cause the costs of investing in mutual funds to be greater than the costs of owning the underlying securities directly. These indirect expenses of mutual funds are not included in the amounts shown as expenses in the Portfolio’s Statement of Operations or in the expense ratios included in the Financial Highlights.
(F) Use of Estimates. In preparing financial statements in conformity with GAAP, the Manager makes estimates and assumptions that affect the reported amounts and disclosures in the financial statements. Actual results could differ from those estimates.
(G) Repurchase Agreements. The Portfolio may enter into
repurchase agreements (i.e., buy a security from another party with the
agreement that it will be sold back in the future) to earn income. The Portfolio may enter into repurchase agreements only with counterparties, usually financial institutions, that are deemed by the Manager or the Subadvisors to be creditworthy, pursuant to guidelines established by the Board. During the term of any repurchase agreement, the Manager or the Subadvisors will continue to monitor the creditworthiness of the counterparty. Under the 1940 Act, repurchase agreements are considered to be collateralized loans by the Portfolio to the counterparty secured by the securities transferred to the Portfolio.
Repurchase agreements are subject to counterparty risk, meaning the Portfolio could lose money by the counterparty’s failure to perform under the terms of the agreement. The Portfolio mitigates this risk by ensuring the repurchase agreement is collateralized by cash, U.S. government securities, fixed income securities and/or other securities. The collateral is held by the Portfolio’s custodian and valued daily on a mark to market basis to determine if the value, including accrued interest, exceeds the repurchase price. In the event of the counterparty’s default on the obligation to repurchase, the Portfolio has the right to liquidate the collateral and apply the proceeds in satisfaction of the obligation. Under certain circumstances, such as in the event of default or bankruptcy by the counterparty, realization and/or retention of the collateral may be limited or subject to delay, to legal proceedings and possible realized loss to the Portfolio. As of June 30, 2020, the Portfolio did not hold any repurchase agreements.
(H) Securities Lending. In order to realize additional income, the Portfolio may engage in securities lending, subject to the limitations set forth in the 1940 Act and relevant guidance by the staff of the Securities and Exchange Commission (“SEC”). If the Portfolio engages in securities lending, the Portfolio will lend through its custodian, currently State Street Bank and Trust Company (“State Street”), acting as securities lending agent on behalf of the Portfolio. Under the current arrangement, State Street will manage the Portfolio’s collateral in accordance with the securities lending agency agreement between the Portfolio and State Street, and indemnify the Portfolio against counterparty risk. The loans will be collateralized by cash (which may be invested in a money market fund) and/or non-cash collateral (which may include U.S. Treasury securities and/or U.S. government agency securities issued or guaranteed by the United States government or its agencies or instrumentalities) at least equal at all times to the market value of the securities loaned. The Portfolio bears the risk of delay in recovery of, or loss of rights in, the securities loaned. The Portfolio may also record a realized gain or loss on securities deemed sold due to a borrower’s inability to return securities on loan. The Portfolio bears the risk of any loss on investment of cash collateral. The Portfolio will receive compensation for lending its securities in the form of fees or it will retain a portion of interest earned on the investment of any cash collateral. The Portfolio will also continue to receive interest and dividends on the securities loaned and any gain or loss in the market price of the securities loaned that may occur during the term of the loan will be for the account of the Portfolio. Income earned from securities lending activities, if any, is reflected in the Statement of Operations. As of June 30, 2020, the Portfolio had securities on loan with an aggregate market value of $8,405,898; the total market value of collateral held by the Portfolio was $8,557,791. The market value of the collateral held included non-cash collateral, in the form of U.S. Treasury securities, with a value of $3,666,082 and cash collateral, which was invested into
| | |
| 22 | | MainStay VP Small Cap Growth Portfolio |
the State Street Navigator Securities Lending Government Money Market Portfolio, with a value of $4,891,709.
(I) Indemnifications. Under the Fund’s organizational documents, its officers and trustees are indemnified against certain liabilities that may arise out of performance of their duties to the Fund. Additionally, in the normal course of business, the Portfolio enters into contracts with third-party service providers that contain a variety of representations and warranties and that may provide general indemnifications. The Portfolio’s maximum exposure under these arrangements is unknown, as this would involve future claims that may be made against the Portfolio that have not yet occurred. The Manager believes that the risk of loss in connection with these potential indemnification obligations is remote. However, there can be no assurance that material liabilities related to such obligations will not arise in the future, which could adversely impact the Portfolio.
Note 3–Fees and Related Party Transactions
(A) Manager and Subadvisors. New York Life Investments, a registered investment adviser and an indirect, wholly-owned subsidiary of New York Life, serves as the Portfolio’s Manager pursuant to an Amended and Restated Management Agreement (“Management Agreement”). The Manager provides offices, conducts clerical, recordkeeping and bookkeeping services, and keeps most of the financial and accounting records required to be maintained by the Portfolio. Except for the portion of salaries and expenses that are the responsibility of the Portfolio, the Manager pays the salaries and expenses of all personnel affiliated with the Portfolio and certain operational expenses of the Portfolio. The Portfolio reimburses New York Life Investments in an amount equal to the portion of the compensation of the Chief Compliance Officer attributable to the Portfolio. The Portfolio’s subadvisor changed effective May 1, 2020, due to the termination of Eagle Asset Managment, Inc. as the Portfolio’s subadvisor and the appointment of Segall Bryant & Hamill, LLC (“SBH” or a “Subadvisor”) and Brown Advisory LLC (“Brown Advisory” or a “Subadvisor”, and together, with SBH, the “Subadvisors”), as the Portfolio’s subadvisors. SBH, a registered investment adviser, serves as a Subadvisor to the Portfolio, pursuant to the terms of a Subadvisory Agreement between New York Life Investments and SBH. Brown Advisory, a registered investment adviser, serves as a Subadvisor to the Portfolio, pursuant to the terms of a Subadvisory Agreement between New York Life Investments and Brown Advisory. Each Subadvisor is responsible for managing a portion of the
Portfolio’s assets, as designated by the Manager from time to time. New York Life Investments pays for the services of the Subadvisors.
The Fund, on behalf of the Portfolio, pays New York Life Investments in its capacity as the Portfolio’s investment manager and administrator, pursuant to the Management Agreement, a monthly fee for the services performed and the facilities furnished at an annual percentage of the average daily net assets as follows: 0.81% up to $1 billion and 0.785% in excess of $1 billion. During the six-month period ended June 30, 2020, the effective management fee rate was 0.81%.
During the six-month period ended June 30, 2020, New York Life Investments earned fees from the Portfolio in the amount of $1,811,600 and paid Eagle Asset Management, SBH and Brown Advisory in the amounts of $605,574, $149,057 and $161,482, respectively.
State Street provides sub-administration and sub-accounting services to the Portfolio pursuant to an agreement with New York Life Investments. These services include calculating the daily NAVs of the Portfolio, maintaining the general ledger and sub-ledger accounts for the calculation of the Portfolio’s NAVs and assisting New York Life Investments in conducting various aspects of the Portfolio’s administrative operations. For providing these services to the Portfolio, State Street is compensated by New York Life Investments.
Pursuant to an agreement between the Fund and New York Life Investments, New York Life Investments is responsible for providing or procuring certain regulatory reporting services for the Portfolio. The Portfolio will reimburse New York Life Investments for the actual costs incurred by New York Life Investments in connection with providing or procuring these services for the Portfolio.
(B) Distribution and Service Fees. The Fund, on behalf of the Portfolio, has entered into a distribution agreement with NYLIFE Distributors LLC (the “Distributor”), an indirect, wholly-owned subsidiary of New York Life. The Portfolio has adopted a distribution plan (the “Plan”) in accordance with the provisions of Rule 12b-1 under the 1940 Act. Under the Plan, the Distributor has agreed to provide, through its affiliates or independent third parties, various distribution-related, shareholder and administrative support services to the Service Class shareholders. For its services, the Distributor is entitled to a combined distribution and service fee accrued daily and paid monthly at an annual rate of 0.25% of the average daily net assets attributable to the Service Class shares of the Portfolio.
(C) Investments in Affiliates (in 000’s). During the six-month period ended June 30, 2020, purchases and sales transactions, income earned from investments and shares held of investment companies managed by New York Life Investments or its affiliates were as follows:
| | | | | | | | | | | | | | | | | | | | | | | | | | | | | | | | | | | | |
Affiliated Investment
Company | | Value,
Beginning of
Period | | | Purchases
at Cost | | | Proceeds
from Sales | | | Net
Realized
Gain/(Loss)
on Sales | | | Change in
Unrealized
Appreciation/
(Depreciation) | | | Value,
End of
Period | | | Dividend
Income | | | Other
Distributions | | | Shares
End of
Period | |
| | | | | | | | | |
MainStay U.S. Government Liquidity Fund | | $ | 7,407 | | | $ | 122,033 | | | $ | (113,553 | ) | | $ | — | | | $ | — | | | $ | 15,887 | | | $ | 24 | | | $ | — | | | | 15,887 | |
Notes to Financial Statements (Unaudited) (continued)
Note 4–Federal Income Tax
As of June 30, 2020, the cost and unrealized appreciation (depreciation) of the Portfolio’s investment portfolio, including applicable derivative contracts and other financial instruments, as determined on a federal income tax basis, was as follows:
| | | | | | | | | | | | | | | | |
| | | Federal Tax
Cost | | | Gross
Unrealized
Appreciation | | | Gross
Unrealized
(Depreciation) | | | Net
Unrealized
Appreciation/
(Depreciation) | |
| | | | |
Investments in Securities | | $ | 413,524,213 | | | $ | 78,612,151 | | | $ | (7,421,282 | ) | | $ | 71,190,869 | |
During the year ended December 31, 2019, the tax character of distributions paid as reflected in the Statements of Changes in Net Assets was as follows:
| | |
|
| 2019 |
Tax-Based
Distributions from Ordinary
Income | | Tax-Based
Distributions from Long-Term
Gains |
| |
| $— | | $50,572,838 |
Note 5–Custodian
State Street is the custodian of cash and securities held by the Portfolio. Custodial fees are charged to the Portfolio based on the Portfolio’s net assets and/or the market value of securities held by the Portfolio and the number of certain transactions incurred by the Portfolio.
Note 6–Line of Credit
The Portfolio and certain other funds managed by New York Life Investments maintain a line of credit with a syndicate of banks in order to secure a source of funds for temporary purposes to meet unanticipated or excessive redemption requests.
Effective July 28, 2020, under the credit agreement (the “Credit Agreement”), the aggregate commitment amount is $600,000,000 with an additional uncommitted amount of $100,000,000. The commitment fee is an annual rate of 0.15% of the average commitment amount payable quarterly, regardless of usage, to JP Morgan Chase Bank NA, who serves as the agent to the syndicate. The commitment fee is allocated among the Portfolio and certain other funds managed by New York Life Investments based upon their respective net assets and other factors. Interest on any revolving credit loan is charged based upon the Federal Funds Rate or the one-month London Interbank Offered Rate (“LIBOR”), whichever is higher. The Credit Agreement expires on July 27, 2021, although the Portfolio, certain other funds managed by New York Life Investments and the syndicate of banks may renew the Credit Agreement for an additional year on the same or different terms or enter into a credit agreement with a different syndicate of banks. Prior to July 28, 2020, the aggregate commitment amount and the commitment fee were the same as those under the current Credit Agreement, but State Street served as agent to the syndicate. During the six-month period ended June 30, 2020, there were no borrowings made or outstanding with respect to the Portfolio under the Credit Agreement or the credit agreement for which State Street served as agent.
Note 7–Interfund Lending Program
Pursuant to an exemptive order issued by the SEC, the Portfolio, along with certain other funds managed by New York Life Investments, may participate in an interfund lending program. The interfund lending program provides an alternative credit facility that permits the Portfolio and certain other funds managed by New York Life Investments to lend or borrow money for temporary purposes directly to or from one another subject to the conditions of the exemptive order. During the six-month period ended June 30, 2020, there were no interfund loans made or outstanding with respect to the Portfolio.
Note 8–Purchases and Sales of Securities (in 000’s)
During the six-month period ended June 30, 2020, purchases and sales of securities, other than short-term securities, were $392,711 and $379,906, respectively.
Note 9–Capital Share Transactions
Transactions in capital shares for the six-month period ended June 30, 2020 and the year ended December 31, 2019, were as follows:
| | | | | | | | |
Initial Class | | Shares | | | Amount | |
| | |
Six-month period ended June 30, 2020: | | | | | | | | |
Shares sold | | | 3,482,606 | | | $ | 46,582,849 | |
Shares redeemed | | | (1,274,315 | ) | | | (15,518,890 | ) |
| | | | | | | | |
Net increase (decrease) | | | 2,208,291 | | | $ | 31,063,959 | |
| | | | | | | | |
| | |
Year ended December 31, 2019: | | | | | | | | |
Shares sold | | | 5,034,102 | | | $ | 68,113,782 | |
Shares issued to shareholders in reinvestment of distributions | | | 3,010,535 | | | | 35,509,408 | |
Shares redeemed | | | (3,675,671 | ) | | | (50,983,840 | ) |
| | | | | | | | |
Net increase (decrease) | | | 4,368,966 | | | $ | 52,639,350 | |
| | | | | | | | |
| | |
| | | | | | | | |
Service Class | | Shares | | | Amount | |
| | |
Six-month period ended June 30, 2020: | | | | | | | | |
Shares sold | | | 886,758 | | | $ | 10,273,299 | |
Shares redeemed | | | (1,431,970 | ) | | | (17,064,748 | ) |
| | | | | | | | |
Net increase (decrease) | | | (545,212 | ) | | $ | (6,791,449 | ) |
| | | | | | | | |
| | |
Year ended December 31, 2019: | | | | | | | | |
Shares sold | | | 2,098,915 | | | $ | 28,501,463 | |
Shares issued to shareholders in reinvestment of distributions | | | 1,309,425 | | | | 15,063,430 | |
Shares redeemed | | | (1,814,114 | ) | | | (24,402,920 | ) |
| | | | | | | | |
Net increase (decrease) | | | 1,594,226 | | | $ | 19,161,973 | |
| | | | | | | | |
Note 10–Recent Accounting Pronouncement
In March 2020, the Financial Accounting Standards Board (“FASB”) issued Accounting Standards Update 2020-04 (“ASU 2020-04”), which provides optional guidance to ease the potential accounting burden associated with transitioning away from LIBOR and other reference rates that are expected to be discontinued. ASU 2020-04 is effective immediately upon release of the update on March 12, 2020 through December 31, 2022. At this time, the Manager is evaluating the implications of certain other provisions of ASU 2020-04 related to new
| | |
| 24 | | MainStay VP Small Cap Growth Portfolio |
disclosure requirements and any impact on the financial statement disclosures has not yet been determined.
Note 11–Subsequent Events
In connection with the preparation of the financial statements of the Portfolio as of and for the six-month period ended June 30, 2020, events and transactions subsequent to June 30, 2020, through the date the financial statements were issued have been evaluated by the Manager, for possible adjustment and/or disclosure. No subsequent events requiring financial statement adjustment or disclosure have been identified.
Note 12–Other Matters
An outbreak of COVID-19, first detected in December 2019, has developed into a global pandemic and has resulted in travel restrictions, closure of international borders, certain businesses and securities markets, restrictions on securities trading activities, prolonged quarantines, supply chain disruptions, and lower consumer demand, as well as general concern and uncertainty. The continued impact of COVID-19 is uncertain and could further adversely affect the global economy, national economies, individual issuers and capital markets in unforeseeable ways and result in a substantial and extended economic downturn. Developments that disrupt global economies and financial markets, such as COVID-19, may magnify factors that affect the Portfolio’s performance.
Board Consideration and Approval of Management Agreement and
Subsidiary Agreement (Unaudited)
The Subadvisory Agreement between New York Life Investment Management LLC (“New York Life Investments”) and Segall Bryant & Hamill, LLC (“SBH”) with respect to the MainStay VP Small Cap Growth Portfolio (“Portfolio”) and the Subadvisory Agreement between New York Life Investments and Brown Advisory LLC (“Brown Advisory”) with respect to the Portfolio (together, “New Subadvisory Agreements”), must be approved initially and, following an initial term of up to two years, are each subject to annual review and approval by the Board of Trustees of MainStay VP Funds Trust (“Board” of the “Trust”) in accordance with Section 15 of the Investment Company Act of 1940, as amended (“1940 Act”). At its March 17-18, 2020 meeting, the Board, including the Trustees who are not “interested persons” (as such term is defined in the 1940 Act) of the Trust (“Independent Trustees”) voting separately, approved each of the New Subadvisory Agreements for an initial two-year period.
At its March 17-18, 2020 meeting, the Board considered and approved New York Life Investments’ recommendations to terminate Eagle Asset Management, Inc. (“Eagle”) as the subadvisor to the Portfolio, to appoint SBH and Brown Advisory as subadvisors to the Portfolio, to approve the New Subadvisory Agreements, and to approve the related changes to the Portfolio’s principal investment strategies and name change (the “Repositioning”), all effective on or about May 1, 2020. The New Subadvisory Agreements provide that SBH and Brown Advisory will manage the assets of the Portfolio allocated to each of them by New York Life Investments from time to time, subject to the supervision of New York Life Investments and the oversight of the Board, and pursuant to the Trust’s registration statement. The Board noted that the material terms of the New Subadvisory Agreements are substantially identical to the corresponding terms of the then-current subadvisory agreement with Eagle with respect to the Portfolio, but that the subadvisory fee schedule under the New Subadvisory Agreement with SBH includes a breakpoint with a fee that is lower than the subadvisory fee paid to Eagle under the then-current subadvisory agreement.
New York Life Investments proposed that SBH and Brown Advisory be appointed as the subadvisors to the Portfolio based on, among other things, the nature, extent and quality of the services SBH and Brown Advisory would be expected to provide to the Portfolio. After considering such factors, among others, and New York Life Investments’ rationale for the Repositioning and the New Subadvisory Agreements and following discussions with New York Life Investments, the Board concluded it would be in the best interests of the Portfolio to appoint SBH and Brown Advisory as subadvisors to the Portfolio in replacement of Eagle. In connection with their consideration of New York Life Investments’ recommendation to appoint SBH and Brown Advisory as subadvisors to the Portfolio, each to subadvise a portion of the Portfolio’s assets, the Trustees reviewed each of SBH’s and Brown Advisory’s qualifications to serve as the Portfolio’s subadvisors.
In reaching the decisions to approve the Repositioning and the New Subadvisory Agreements, the Board considered information furnished by New York Life Investments, SBH and Brown Advisory in connection with meetings of the Board and its Contracts, Investment and Risk and Compliance Oversight Committees held on March 17-18, 2020, as well as other information furnished to the Board and the Committees throughout the year, as deemed relevant by the Trustees. The Board also considered information on the fees charged to other investment
advisory clients of SBH and Brown Advisory that follow investment strategies similar to those proposed for the Portfolio, as repositioned, and, when applicable, the rationale for any differences in the Portfolio’s proposed subadvisory fee and the fees charged to those other investment advisory clients. In addition, the Board considered information previously provided to the Board in connection with its review of the subadvisory agreements for other funds in the MainStay Group of Funds, as deemed relevant to each Trustee. The Board also considered information furnished by each of SBH and Brown Advisory in response to requests prepared on behalf of the Board, and in consultation with the Independent Trustees, by independent legal counsel to the Independent Trustees, that encompassed a variety of topics, including those summarized below.
The Board took into account information provided in connection with its meetings throughout the year, including, among other items, information regarding the legal standards and fiduciary obligations applicable to its consideration of the New Subadvisory Agreements and investment performance reports on the Portfolio prepared by the Investment Consulting Group of New York Life Investments as well as presentations from New York Life Investments personnel. The contract review process, including the structure and format for materials provided to the Board, has been developed in consultation with the Board. The Independent Trustees also met in executive sessions with their independent legal counsel and, for a portion thereof, with senior management of New York Life Investments joining.
In considering the Repositioning and the New Subadvisory Agreements, the Trustees reviewed and evaluated all of the information and factors they believed to reasonably be necessary and appropriate in light of legal advice furnished to them by independent legal counsel and through the exercise of their own business judgment. Although individual Trustees may have weighed certain factors or information differently, the factors considered by the Board are described in greater detail below and include, among other factors: (i) the nature, extent and quality of the services to be provided to the Portfolio by each of SBH and Brown Advisory; (ii) the investment performance of the Portfolio, the qualifications of the proposed portfolio managers of the Portfolio and the historical investment performance of products managed by such portfolio managers with investment strategies similar to those of the Portfolio, as repositioned; (iii) the anticipated costs of the services to be provided, and profits expected to be realized, by each of SBH and Brown Advisory from its relationship with the Portfolio; (iv) the extent to which economies of scale have been realized or may be realized as the Portfolio grows and the extent to which economies of scale have benefited or may benefit the Portfolio’s shareholders; and (v) the reasonableness of the Portfolio’s proposed subadvisory fee to be paid by New York Life Investments to each of SBH and Brown Advisory and estimated overall total ordinary operating expenses. Although the Board recognized that comparisons between the Portfolio’s proposed fees and estimated expenses and those of other funds are imprecise given different terms of agreements, variations in fund strategies and other factors, the Board considered the reasonableness of the Portfolio’s proposed fees and estimated overall total ordinary operating expenses as compared to similar funds and accounts managed or subadvised by each of SBH and Brown Advisory and/or the peer funds identified by Strategic Insight Mutual Fund Research and Consulting, LLC (“Strategic Insight”), an independent third-party service provider engaged by the Board to report objectively on investment performance, management fees and total expenses.
| | |
| 26 | | MainStay VP Small Cap Growth Portfolio |
The Board’s decisions to approve the Repositioning and the New Subadvisory Agreements were based on a consideration of the information provided to the Trustees throughout the year and in connection with its meeting held on March 17-18, 2020, such as a presentation from each of SBH and Brown Advisory personnel, including certain members of the proposed portfolio management team, as well as information furnished specifically in connection with the contract review process for the Portfolio, in each case as deemed relevant to each Trustee. The Trustees noted that, throughout the year, the Trustees would be afforded an opportunity to ask questions of, and request additional information or materials from, New York Life Investments, SBH and Brown Advisory. The Board’s conclusions with respect to the Repositioning and the New Subadvisory Agreements may have also been based, in part, on New York Life Investments’ belief that each of SBH and Brown Advisory, with its resources and historical investment performance track record for strategies similar to those of the Portfolio, as repositioned, is qualified to serve as a subadvisor to the Portfolio. In addition to considering the above-referenced factors, the Board observed that in the marketplace there are a range of investment options available to the Portfolio’s shareholders and such shareholders, having had the opportunity to consider other investment options, would have chosen to invest in the Portfolio. The factors that figured prominently in the Board’s decisions to approve the Repositioning and the New Subadvisory Agreements are summarized in more detail below, and the Board did not consider any factor or information controlling in making such approval. The Board evaluated the information available to it with respect to each New Subadvisory Agreement separately, and its decision was made separately with respect to each New Subadvisory Agreement.
Nature, Extent and Quality of Services to be Provided by SBH and Brown Advisory
In considering the Repositioning and the New Subadvisory Agreements, the Board considered New York Life Investments’ responsibilities as manager of the Portfolio, noting that New York Life Investments is responsible for supervising the Portfolio’s subadvisors. The Board examined the nature, extent and quality of the investment advisory services that SBH and Brown Advisory proposed to provide to the Portfolio. Further, the Board evaluated and/or examined the following with regard to each of SBH and Brown Advisory:
| • | | experience in providing investment advisory services; |
| • | | experience in serving as advisor or subadvisor to other funds with similar strategies as those of the Portfolio, as repositioned, and the performance track record of these funds; |
| • | | experience of investment advisory, senior management and administrative personnel; |
| • | | overall legal and compliance environment, resources and history and policies and procedures in place with respect to matters that may involve conflicts of interest between the Portfolio’s investments and those of other accounts managed by each of SBH and Brown Advisory; |
| • | | New York Life Investments and each of SBH and Brown Advisory believe their compliance policies and procedures are reasonably designed to prevent violation of the federal securities laws; |
| • | | ability to attract and retain qualified investment professionals and investment in personnel to service and support the Portfolio; |
| • | | portfolio construction and risk management processes; |
| • | | experience of the Portfolio’s proposed portfolio managers, including with respect to investment strategies similar to those of the Portfolio, as repositioned, the number of accounts managed by the portfolio managers and the method for compensating the portfolio managers; and |
| • | | overall reputation, financial condition and assets under management. |
Based on these considerations, the Board concluded that the Portfolio would likely benefit from the nature, extent and quality of the proposed investment advisory services to be provided by each of SBH and Brown Advisory.
Investment Performance
The Board considered the Portfolio’s investment performance results over various periods in light of the Portfolio’s investment objective, strategies and risks, generally placing greater emphasis on the Portfolio’s long-term performance track record. The Board considered investment reports on, and analysis of, the Portfolio’s performance provided to the Board throughout the year by the Investment Consulting Group of New York Life Investments. These reports include, among other items, information on the Portfolio’s gross and net returns, the Portfolio’s investment performance compared to relevant investment categories and the Portfolio’s benchmark, the Portfolio’s risk-adjusted investment performance and the Portfolio’s investment performance as compared to peer funds, as appropriate, as well as portfolio attribution information and commentary on the effect of current and recent market conditions.
The Board also gave weight to its discussions with senior management at New York Life Investments concerning the Portfolio’s investment performance and remediation efforts undertaken by New York Life Investments, and other alternatives to the Repositioning and the New Subadvisory Agreements considered by New York Life Investments. In addition, the Board considered steps taken to seek to improve the Portfolio’s investment performance and prior discussions between the Portfolio’s current portfolio managers and the members of the Board’s Investment Committee. The Board further considered that shareholders may benefit from each of SBH’s and Brown Advisory’s investment process, including its portfolio construction and risk management processes. The Board noted that the Repositioning had not yet been implemented so an investment performance track record for the Portfolio, as repositioned, was not available.
The Board evaluated the Portfolio’s proposed portfolio management team, investment process, strategies and risks. The Board noted that each of SBH and Brown Advisory currently manage a portfolio with investment strategies similar to those of the Portfolio, as repositioned. Additionally, the Board considered the historical performance of these investment portfolios and other portfolios managed by the proposed portfolio managers for the Portfolio. Based on these considerations, the Board concluded that the Portfolio was likely to be managed responsibly and capably by SBH and Brown Advisory.
Board Consideration and Approval of Management Agreement and
Subsidiary Agreement (Unaudited) (continued)
Also based on these considerations, the Board concluded that the selection of SBH and Brown Advisory as the subadvisors to the Portfolio is likely to benefit the Portfolio’s long-term investment performance.
Costs of the Services to be Provided, and Profits to be Realized, by SBH and Brown Advisory
The Board considered information provided by each of SBH and Brown Advisory with respect to the anticipated costs of the services to be provided by each of SBH and Brown Advisory under the New Subadvisory Agreements and the profits expected to be realized by each of SBH and Brown Advisory due to its relationship with the Portfolio. The Board considered that each of SBH’s and Brown Advisory’s subadvisory fees had been negotiated at arm’s-length by New York Life Investments and that these fees would be paid by New York Life Investments, not the Portfolio.
In evaluating the anticipated costs of the services to be provided by each of SBH and Brown Advisory and the profits expected to be realized by each of SBH and Brown Advisory, the Board considered, among other factors, SBH’s and Brown Advisory’s investments in, or willingness to invest in, personnel, systems, equipment and other resources and infrastructure to support and further enhance the services proposed to be provided to the Portfolio, and that New York Life Investments would be responsible for paying the subadvisory fee to each of SBH and Brown Advisory. The Board considered the financial resources of each of SBH and Brown Advisory and acknowledged that each of SBH and Brown Advisory must be in a position to attract and retain experienced professional personnel and to maintain a strong financial position for each of SBH and Brown Advisory to be able to provide high-quality services to the Portfolio.
The Board also considered certain fall-out benefits that may be realized by each of SBH and Brown Advisory and its affiliates due to their relationships with the Portfolio, including reputational and other indirect benefits. The Board recognized, for example, the potential benefits to each of SBH and Brown Advisory from legally permitted “soft-dollar” arrangements by which brokers would provide research and other services to each of SBH and Brown Advisory in exchange for commissions paid by the Portfolio with respect to trades in the Portfolio’s portfolio securities.
The Board took into account that the Portfolio would undergo changes to its principal investment strategies in connection with the Repositioning. The Board noted estimates from New York Life Investments, SBH and Brown Advisory that a significant portion of the holdings of the Portfolio would be sold to align the Portfolio’s holdings with the Portfolio’s strategies, as repositioned. Additionally, the Board considered New York Life Investments’ representation that New York Life Investments would seek to develop and implement an efficient transition strategy and seek to minimize potential costs, such as market impact, associated with the Repositioning.
The Board considered that any profits realized by each of SBH and Brown Advisory due to its relationship with the Portfolio would be the result of arm’s-length negotiations between New York Life Investments and each of SBH and Brown Advisory, acknowledging that any such profits would be based on the subadvisory fee paid to each of SBH and Brown Advisory by New York Life Investments, not the Portfolio.
Subadvisory Fees and Estimated Total Ordinary Operating Expenses
The Board evaluated the reasonableness of the fee to be paid under each of the New Subadvisory Agreements and the Portfolio’s estimated total ordinary operating expenses. The Board primarily considered the reasonableness of the management fee paid by the Portfolio to New York Life Investments under the Management Agreement, because the subadvisory fee to be paid to each of SBH and Brown Advisory would be paid by New York Life Investments, not the Portfolio. The Board also considered the reasonableness of the subadvisory fees to be paid by New York Life Investments and the amount of the management fee expected to be retained by New York Life Investments, including that due to the subadvisory fee schedule under the New Subadvisory Agreement with SBH, which includes a breakpoint with a fee that is lower than the subadvisory fee paid to Eagle under the then-current subadvisory agreement, New York Life Investments’ retained management fee would increase.
In assessing the reasonableness of the Portfolio’s proposed fees and estimated expenses, the Board considered information provided by New York Life Investments on the fees and expenses of peer funds identified by Strategic Insight and information provided by each of SBH and Brown Advisory on fees charged to other investment advisory clients, including institutional separate accounts and/or other funds that follow investment strategies similar to those of the Portfolio, as repositioned. The Board considered the similarities and differences in the contractual fee schedules of the Portfolio and these similarly-managed funds, taking into account the rationale for any differences in fee schedules. The Board also considered that in proposing fees for the Portfolio, New York Life Investments considers the competitive marketplace for mutual funds.
Based on the factors outlined above, the Board concluded that the Portfolio’s overall fees were within a range that is competitive and support a conclusion that these fees and expenses are reasonable.
Economies of Scale
The Board considered information regarding economies of scale, including whether the Portfolio’s proposed expense structure would permit economies of scale to be appropriately shared with the Portfolio’s shareholders. The Board also considered a report from New York Life Investments, previously prepared at the request of the Board, that addressed economies of scale, including with respect to the mutual fund business generally and the various ways in which the benefits of economies of scale may be shared with the funds in the MainStay Group of Funds. Although the Board recognized the difficulty of determining future economies of scale with precision, the Board acknowledged that economies of scale may be shared with the Portfolio in a number of ways, including, for example, through the imposition of management fee breakpoints, initially setting management fee rates at scale or making additional investments to enhance services.
Based on this information, the Board concluded that economies of scale are appropriately reflected for the benefit of the Portfolio’s shareholders through the Portfolio’s expense structure and other methods to share benefits from economies of scale.
| | |
| 28 | | MainStay VP Small Cap Growth Portfolio |
Conclusion
On the basis of the information and factors summarized above and the evaluation thereof, the Board, including the Independent Trustees voting separately, unanimously voted to approve the Repositioning and each of the New Subadvisory Agreements.
Discussion of the Operation and Effectiveness of the Portfolio’s Liquidity Risk
Management Program (Unaudited)
In compliance with Rule 22e-4 under the Investment Company Act of 1940, as amended (the “Liquidity Rule”), the Portfolio has adopted and implemented a liquidity risk management program (the “Program”), which New York Life Investment Management LLC believes is reasonably designed to assess and manage the Portfolio’s liquidity risk. The Board designated New York Life Investment Management LLC as administrator of the Program (the “Administrator”). The Administrator has established a Liquidity Risk Management Committee to assist the Administrator in the implementation and day-to-day administration of the Program and to otherwise support the Administrator in fulfilling its responsibilities under the Program.
At a meeting of the Board held on March 11, 2020, the Administrator provided the Board with a written report addressing the Program’s operation, adequacy and effectiveness of implementation for the period from December 1, 2018 through December 31, 2019, as required under the Liquidity Rule. The report noted that the Administrator concluded that (i) the Program operated effectively to assess and manage the Portfolio’s liquidity risk, (ii) the Program has been adequately and effectively implemented to monitor and, as applicable, respond to the Portfolio’s liquidity developments and (iii) the Portfolio’s investment strategy continues to be appropriate for an open-end portfolio.
In accordance with the Program, the Portfolio’s liquidity risk is assessed no less frequently than annually taking into consideration certain factors, as applicable, such as (i) investment strategy and liquidity of portfolio investments, (ii) short-term and long-term cash flow projections and (iii) holdings of cash and cash equivalents and borrowing arrangements and other funding sources. Certain factors are considered under both normal and reasonably foreseeable stressed conditions.
Each Portfolio portfolio investment is classified into one of four liquidity categories. The classification is based on a determination of the number of days it is reasonably expected to take to convert the investment into cash, or sell or dispose of the investment, in current market conditions without significantly changing the market value of the investment. The Administrator has delegated liquidity classification determinations to the Portfolio’s subadvisors, subject to appropriate oversight by the Administrator, and classification determinations are made by taking into account the Portfolio’s reasonably anticipated trade size, various market, trading and investment-specific considerations, as well as market depth, and, in certain cases, third-party vendor data.
The Liquidity Rule requires portfolios that do not primarily hold assets that are highly liquid investments to adopt a minimum amount of net assets that must be invested in highly liquid investments that are assets (an “HLIM”). In addition, the Liquidity Rule limits a portfolio’s investments in illiquid investments. Specifically, the Liquidity Rule prohibits acquisition of illiquid investments if doing so would result in a portfolio holding more than 15% of its net assets in illiquid investments that are assets. The Program includes provisions reasonably designed to determine, periodically review and comply with the HLIM requirement, as applicable, and to comply with the 15% limit on illiquid investments.
| | |
| 30 | | MainStay VP Small Cap Growth Portfolio |
Proxy Voting Policies and Procedures and Proxy Voting Record
A description of the policies and procedures that New York Life Investments uses to vote proxies related to the Portfolio’s securities is available free of charge upon request (i) by calling 800-598-2019; (ii) by visiting New York Life Investments’ website at https://www.nylinvestments.com/mainstay/products-and-performance/mainstay-vp-funds-trust; or (iii) by visiting the SEC’s website at www.sec.gov.
The Portfolio is required to file with the SEC its proxy voting record for the 12-month period ending June 30 on Form N-PX. The Portfolio’s most recent Form N-PX or proxy voting record is available free of charge upon request (i) by calling 800-598-2019; (ii) by visiting New York Life Investments’ website at https://www.nylinvestments.com/mainstay/products-and-performance/mainstay-vp-funds-trust; or (iii) by visiting the SEC’s website at www.sec.gov.
Shareholder Reports and Quarterly Portfolio Disclosure
The Portfolio is required to file its complete schedule of portfolio holdings with the SEC 60 days after its first and third fiscal quarter on Form N-PORT. The Portfolio’s holdings report is available free of charge upon request by calling 800-598-2019 or by visiting the SEC’s website at www.sec.gov.
MainStay VP Portfolios
MainStay VP offers a wide range of Portfolios. The full array of MainStay VP offerings is listed here, with information about the manager, subadvisors, legal counsel, and independent registered public accounting firm.
Equity Portfolios
MainStay VP Emerging Markets Equity Portfolio
MainStay VP Epoch U.S. Equity Yield Portfolio
MainStay VP Fidelity Institutional AM® Utilities Portfolio†
MainStay VP MacKay Common Stock Portfolio
MainStay VP MacKay Growth Portfolio
MainStay VP MacKay International Equity Portfolio
MainStay VP MacKay Mid Cap Core Portfolio
MainStay VP MacKay S&P 500 Index Portfolio
MainStay VP MacKay Small Cap Core Portfolio
MainStay VP Mellon Natural Resources Portfolio
MainStay VP Small Cap Growth Portfolio
MainStay VP T. Rowe Price Equity Income Portfolio
MainStay VP Winslow Large Cap Growth Portfolio
Mixed Asset Portfolios
MainStay VP Balanced Portfolio
MainStay VP Income Builder Portfolio
MainStay VP Janus Henderson Balanced Portfolio
MainStay VP MacKay Convertible Portfolio
Income Portfolios
MainStay VP Bond Portfolio
MainStay VP Floating Rate Portfolio
MainStay VP Indexed Bond Portfolio
MainStay VP MacKay Government Portfolio
MainStay VP MacKay High Yield Corporate Bond Portfolio
MainStay VP MacKay Unconstrained Bond Portfolio
MainStay VP PIMCO Real Return Portfolio
Money Market
MainStay VP U.S. Government Money Market Portfolio
Alternative
MainStay VP CBRE Global Infrastructure Portfolio
MainStay VP IQ Hedge Multi-Strategy Portfolio
Asset Allocation Portfolios
MainStay VP Conservative Allocation Portfolio
MainStay VP Growth Allocation Portfolio
MainStay VP Moderate Allocation Portfolio
MainStay VP Moderate Growth Allocation Portfolio
Manager
New York Life Investment Management LLC
New York, New York
Subadvisors
Brown Advisory LLC
Baltimore, Maryland
Candriam Belgium S.A.*
Brussels, Belgium
CBRE Clarion Securities LLC
Radnor, Pennsylvania
Epoch Investment Partners, Inc.
New York, New York
FIAM LLC
Smithfield, Rhode Island
IndexIQ Advisors LLC*
New York, New York
Janus Capital Management LLC
Denver, Colorado
MacKay Shields LLC*
New York, New York
Mellon Investments Corporation
Boston, Massachusetts
NYL Investors LLC*
New York, New York
Pacific Investment Management Company LLC
Newport Beach, California
Segall Bryant & Hamill, LLC
Chicago, Illinois
T. Rowe Price Associates, Inc.
Baltimore, Maryland
Winslow Capital Management, LLC
Minneapolis, Minnesota
Distributor
NYLIFE Distributors LLC*
Jersey City, New Jersey
Custodian
State Street Bank and Trust Company
Boston, Massachusetts
Independent Registered Public Accounting Firm
PricewaterhouseCoopers LLP
New York, New York
Legal Counsel
Dechert LLP
Washington, District of Columbia
Some Portfolios may not be available in all products.
| † | Fidelity Institutional AM is a registered trade mark of FMR LLC. Used with permission. |
| * | An affiliate of New York Life Investment Management LLC |
Not part of the Semiannual Report
2020 Semiannual Report
This report is for the general information of New York Life Variable Annuities and NYLIAC Variable Universal Life Insurance Products policyowners. It must be preceded or accompanied by the appropriate product(s) and funds prospectuses if it is given to anyone who is not an owner of a New York Life variable annuity policy or a NYLIAC Variable Universal Life Insurance Product. This report does not offer for sale or solicit orders to purchase securities.
The performance data quoted in this report represents past performance. Past performance is no guarantee of future results. Due to market volatility and other factors, current performance may be lower or higher than the figures shown. The most recent month-end performance summary for your variable annuity or variable life policy is available by calling 800-598-2019 and is updated periodically on www.newyorklife.com.
The New York Life Variable Annuities and NYLIAC Variable Universal Life Insurance Products are issued by New York Life Insurance and Annuity Corporation (a Delaware Corporation) and distributed by NYLIFE Distributors LLC (Member FINRA/SIPC).
New York Life Insurance Company
New York Life Insurance and Annuity Corporation (NYLIAC) (A Delaware Corporation)
51 Madison Avenue, Room 551
New York, NY 10010
www.newyorklife.com
Printed on recycled paper
nylinvestments.com
NYLIFE Distributors LLC, 30 Hudson Street, Jersey City, NJ 07302
New York Life Investment Management LLC is the investment manager to the MainStay VP Funds Trust
©2020 by NYLIFE Distributors LLC. All rights reserved.
You may obtain copies of the Prospectus and the Statement of Additional Information free of charge, upon request, by calling toll-free 800-598-2019 or writing to New York Life Insurance and Annuity Corporation, 51 Madison Avenue, New York, NY 10010.
| | | | |
| Not FDIC Insured | | No Bank Guarantee | | May Lose Value |
| | | | |
| 1781614 | | | | MSVPESCG10-08/20 (NYLIAC) NI515 |
MainStay VP Epoch U.S. Equity Yield Portfolio
Message from the President and Semiannual Report
Unaudited | June 30, 2020
Beginning on January 1, 2021, as permitted by regulations adopted by the Securities and Exchange Commission, paper copies of the MainStay VP Portfolio annual and semi-annual shareholder reports may no longer be sent by mail, unless you specifically request paper copies of the reports from the insurance company that offers your policy. Instead, the reports will be made available online, and you will be notified by mail each time a report is posted and provided with a website link to access the report. Instructions for requesting paper copies will be provided by your insurance company.
If you already elected to receive shareholder reports electronically, you will not be affected by this change and you need not take any action. At any time, you may elect to receive reports and other communications from the insurance company electronically by following the instructions provided by the insurance company.
You may elect to receive all future shareholder reports in paper form free of charge. You can inform the insurance company that you wish to receive paper copies of reports by following the instructions provided by the insurance company. Your election to receive reports in paper form will apply to all portfolio companies available under your contract.
| | | | | | | | |
| Not FDIC/NCUA Insured | | Not a Deposit | | May Lose Value | | No Bank Guarantee | | Not Insured by Any Government Agency |

This page intentionally left blank
Message from the President
High levels of volatility shook financial markets in response to the COVID-19 pandemic and an abrupt decline in global economic activity during the six months ended June 30, 2020.
Markets entered 2020 riding strong fourth quarter performance and an economic expansion of historic longevity. Most broad stock and bond indices began to dip in late February as growing numbers of COVID-19 cases were seen in hotspots around the world. On March 11, 2020, the World Health Organization acknowledged that the disease had reached pandemic proportions, with over 80,000 identified cases in China, thousands in Italy, South Korea and the United States, and more in dozens of additional countries. Governments and central banks pledged trillions of dollars to address the mounting economic and public health crisis; however, “stay-at-home” orders and other restrictions on non-essential activity caused global economic activity to slow. Most stocks and bonds lost significant ground in this challenging environment, with equities declining by roughly a third and the yield on high-yield credit indices shooting higher.
Policymakers responded with extraordinary speed to address the situation. In the United States, the Federal Reserve (“Fed”) cut interest rates to near zero and announced unlimited quantitative easing. With help from Treasury, the Fed later rolled out a series of lending facilities to directly support market functioning. In late March, the Federal government declared a national emergency; Congress passed, and the President signed, a $2 trillion CARES Act (The Coronavirus Aid, Relief, and Economic Security Act), with the promise of further assistance for consumers and businesses to come. This enormous wave of policy support helped fuel a rapid recovery in market pricing as stocks bounced back and credit spreads narrowed. Some states rushed to ease restrictions on travel and social gatherings, further fueling optimism that the effects of the pandemic might prove short lived. However, the final weeks of the reporting period saw infection rates beginning to rise in some of the first states to reopen, raising concerns that a second round of restrictive government policies might prove necessary, once again stifling economic activity.
Despite all the market volatility, the broadly based S&P 500® Index finished the first half of 2020 only slightly below its starting point and the technology-heavy NASDAQ Composite Index posted gains, closing in near record territory. Small-cap stocks tended to trail their large cap counterparts, as illustrated by the Russell 2000® Index’s loss of approximately 15%, while value-oriented stocks lagged growth-oriented issues. From a global perspective, U.S. stocks generally outperformed international equities, with emerging markets hit particularly hard by the flight from risk.
Fixed-income markets also experienced unusually high levels of volatility. Recognized safe havens, such as U.S. government bonds, attracted increased investment, driving yields lower and prices higher, positioning long-term Treasury bonds to deliver particularly strong gains. Investment-grade corporate bonds lost value in March before recovering in the closing months of the reporting period, while relatively speculative high-yield credit faced the brunt of risk-off sentiment. Emerging market debt underperformed most other bonds types as investors sought to minimize currency and sovereign risks.
Today, as we at New York Life Investments continue to track the ongoing health crisis and its financial ramifications, we are particularly mindful of the people at the heart of our enterprise—our colleagues and valued clients. By taking appropriate steps to minimize community spread of COVID-19 within our organization, we strive to safeguard the health of our investment professionals so they can continue to provide you, as a MainStay investor, with world class investment solutions in this rapidly evolving environment.
Sincerely,

Kirk C. Lehneis
President
The opinions expressed are as of the date of this report and are subject to change. There is no guarantee that any forecast made will come to pass. This material does not constitute investment advice and is not intended as an endorsement of any specific investment. Past performance is no guarantee of future results.
Not part of the Semiannual Report
Table of Contents
Investors should refer to the Portfolio’s Summary Prospectus and/or Prospectus and consider the Portfolio’s investment objectives, strategies, risks, charges and expenses carefully before investing. The Summary Prospectus and/or Prospectus contain this and other information about the Portfolio. You may obtain copies of the Portfolio’s Summary Prospectus and/or the Prospectus and the Statement of Additional Information free of charge, upon request, by calling toll-free 800-598-2019, by writing to New York Life Insurance and Annuity Corporation, 51 Madison Avenue, Room 251, New York, New York 10010 or by sending an email to MainStayShareholdersServices@nylim.com. These documents are also available at nylinvestments.com/vpdocuments. Please read the Summary Prospectus and/or Prospectus carefully before investing. MainStay VP Funds Trust portfolios are separate account options which are purchased through a variable insurance or variable annuity contract.
Investment and Performance Comparison1 (Unaudited)
Performance data quoted represents past performance. Past performance is no guarantee of future results. Because of market volatility and other factors, current performance may be lower or higher than the figures shown. Investment return and principal value will fluctuate, and as a result, when shares are redeemed, they may be worth more or less than their original cost. The performance table and graph do not reflect any deduction of sales charges, mortality and expense charges, contract charges or administrative charges. Please refer to the Performance Summary appropriate for your policy. For performance information current to the most recent month-end, please call 800-598-2019 or visit www.newyorklife.com.
Average Annual Total Returns for the Period-Ended June 30, 2020
| | | | | | | | | | | | | | | | | | | | | | |
| Class | | Inception
Date2 | | Six Months | | | One Year | | | Five Years | | | Ten Years | | | Gross
Expense
Ratio3 | |
| | | | | | |
| Initial Class Shares | | 5/1/1998 | | | –14.53 | % | | | –7.34 | % | | | 3.37 | % | | | 9.06 | % | | | 0.72 | % |
| Service Class Shares | | 6/5/2003 | | | –14.64 | | | | –7.57 | | | | 3.11 | | | | 8.79 | | | | 0.97 | |
| | | | | | | | | | | | | | | | |
| Benchmark Performance | | Six Months | | | One Year | | | Five Years | | | Ten Years | |
| | | | |
Russell 1000® Value Index4 | | | –16.26 | % | | | –8.84 | % | | | 4.64 | % | | | 10.41 | % |
U.S. Equity Yield Composite Index5 | | | –9.85 | | | | –2.76 | | | | 8.74 | | | | 12.30 | |
Morningstar Large Value Category Average6 | | | –15.20 | | | | –7.59 | | | | 4.47 | | | | 9.75 | |
| 1. | Performance figures may reflect certain fee waivers and/or expense limitations, without which total returns may have been different. For information on current fee waivers and/or expense limitations (if any), please refer to the Notes to Financial Statements. |
| 2. | Effective January 9, 2017, the Portfolio replaced its subadvisor and modified its principal investment as of March 13, 2017. The past performance in the bar chart and table prior to those dates reflects the Portfolio’s prior subadvisor and principal investment strategies. |
| 3. | The gross expense ratios presented reflect the Portfolio’s “Total Annual Portfolio Operating Expenses” from the most recent Prospectus, as supplemented, and may differ from other expense ratios disclosed in this report. |
| 4. | The Russell 1000® Value Index is the Portfolio’s primary broad-based securities market index for comparison purposes. The Russell 1000® Value Index measures the performance of the large-cap value segment of the U.S. equity universe. It includes those Russell 1000® Index companies with lower price-to-book ratios and lower expected growth values. Results assume reinvestment of all dividends and capital gains. An investment cannot be made directly in an index. |
| 5. | The Portfolio has selected the U.S. Equity Yield Composite Index as its secondary benchmark. The U.S. Equity Yield Composite Index consists of the |
| | MSCI USA High Dividend Yield Index and the MSCI USA Minimum Volatility (USD) Index weighted at 60% and 40%, respectively. The MSCI USA High Dividend Yield Index is based on the MSCI USA Index and includes large and mid-cap stocks. The MSCI USA High Dividend Yield Index is designed to reflect the performance of equities in the MSCI USA Index (excluding real estate investment trusts) with higher dividend income and quality characteristics than average dividend yields that are both sustainable and persistent. The MSCI USA Minimum Volatility (USD) Index aims to reflect the performance characteristics of a minimum variance strategy applied to the large and mid-cap USA equity universe. The MSCI USA Minimum Volatility (USD) Index is calculated by optimizing the MSCI USA Index in USD for the lowest absolute risk (within a given set of constraints). Results assume reinvestment of all dividends and capital gains. An investment cannot be made directly in an index. |
| 6. | The Morningstar Large Value Category Average is representative of funds that invest primarily in big U.S. companies that are less expensive or growing more slowly than other large-cap stocks. Results are based on average total returns of similar funds with all dividends and capital gain distributions reinvested. |
Cost in Dollars of a $1,000 Investment in MainStay VP Epoch U.S. Equity Yield Portfolio (Unaudited)
The example below is intended to describe the fees and expenses borne by shareholders during the six-month period from January 1, 2020, to June 30, 2020, and the impact of those costs on your investment.
Example
As a shareholder of the Portfolio you incur two types of costs: (1) transaction costs, including exchange fees and sales charges (loads) on purchases (as applicable), and (2) ongoing costs, including management fees, distribution and/or service (12b-1) fees, and other Portfolio expenses (as applicable). This example is intended to help you understand your ongoing costs (in dollars) of investing in the Portfolio and to compare these costs with the ongoing costs of investing in other mutual funds. The example is based on an investment of $1,000 made at the beginning of the six-month period and held for the entire period from January 1, 2020, to June 30, 2020. Shares are only sold in connection with variable life and annuity contracts and the example does not reflect any contract level or transactional fees or expenses. If these costs had been included, your costs would have been higher.
This example illustrates your Portfolio’s ongoing costs in two ways:
Actual Expenses
The second and third data columns in the table below provide information about actual account values and actual expenses. You may use the information in these columns, together with the amount you invested, to estimate the expenses that you paid during the six months ended June 30, 2020. Simply divide your account value by $1,000 (for
example, an $8,600 account value divided by $1,000 = 8.6), then multiply the result by the number under the heading entitled “Expenses Paid During Period” to estimate the expenses you paid on your account during this period.
Hypothetical Example for Comparison Purposes
The fourth and fifth data columns in the table below provide information about hypothetical account values and hypothetical expenses based on the Portfolio’s actual expense ratio and an assumed rate of return of 5% per year before expenses, which is not the Portfolio’s actual return. The hypothetical account values and expenses may not be used to estimate the actual ending account balances or expenses you paid for the six-month period shown. You may use this information to compare the ongoing costs of investing in the Portfolio with the ongoing costs of investing in other mutual funds. To do so, compare this 5% hypothetical example with the 5% hypothetical examples that appear in the shareholder reports of the other mutual funds.
Please note that the expenses shown in the table are meant to highlight your ongoing costs only and do not reflect any transactional costs, such as exchange fees or sales charges (loads). Therefore, the fourth and fifth data columns of the table are useful in comparing ongoing costs only and will not help you determine the relative total costs of owning different funds. In addition, if these transactional costs were included, your costs would have been higher.
| | | | | | | | | | | | | | | | | | | | | | | | |
| | | | | | | | | | | | | | | | | | | |
| Share Class | | Beginning
Account
Value
1/1/20 | | | Ending Account
Value (Based
on Actual
Returns and
Expenses)
6/30/20 | | | Expenses
Paid
During
Period1 | | | Ending Account
Value (Based
on Hypothetical
5% Annualized
Return and
Actual Expenses)
6/30/20 | | | Expenses
Paid
During
Period1 | | | Net Expense
Ratio
During
Period2 | |
| | | | | | |
| Initial Class Shares | | $ | 1,000.00 | | | $ | 854.70 | | | $ | 3.14 | | | $ | 1,021.48 | | | $ | 3.42 | | | | 0.68 | % |
| | | | | | |
| Service Class Shares | | $ | 1,000.00 | | | $ | 853.60 | | | $ | 4.29 | | | $ | 1,020.24 | | | $ | 4.67 | | | | 0.93 | % |
| 1 | Expenses are equal to the Portfolio’s annualized expense ratio of each class multiplied by the average account value over the period, divided by 366 and multiplied by 182 (to reflect the six-month period). The table above represents the actual expenses incurred during the six-month period. In addition to the fees and expenses which the Portfolio bears directly, it also indirectly bears a pro rata share of the fees and expenses of the underlying funds in which it invests. Such indirect expenses are not included in the above-reported expense figures. |
| 2 | Expenses are equal to the Portfolio’s annualized expense ratio to reflect the six-month period. |
| | |
| 6 | | MainStay VP Epoch U.S. Equity Yield Portfolio |
MainStay VP Epoch U.S. Equity Yield Portfolio
Industry Composition as of June 30, 2020 (Unaudited)
| | | | |
| |
| Electric Utilities | | | 7.5 | % |
| |
| Pharmaceuticals | | | 6.5 | |
| |
| Semiconductors & Semiconductor Equipment | | | 6.4 | |
| |
| Insurance | | | 5.4 | |
| |
| Banks | | | 5.2 | |
| |
| Multi-Utilities | | | 4.8 | |
| |
| Oil, Gas & Consumable Fuels | | | 4.6 | |
| |
| Household Products | | | 4.2 | |
| |
| Diversified Telecommunication Services | | | 3.8 | |
| |
| Biotechnology | | | 3.7 | |
| |
| Tobacco | | | 3.5 | |
| |
| Beverages | | | 3.1 | |
| |
| Chemicals | | | 3.0 | |
| |
| Aerospace & Defense | | | 2.9 | |
| |
| Equity Real Estate Investment Trusts | | | 2.9 | |
| |
| Capital Markets | | | 2.7 | |
| |
| Electrical Equipment | | | 2.6 | |
| |
| Health Care Providers & Services | | | 2.4 | |
| |
| Hotels, Restaurants & Leisure | | | 2.4 | |
| |
| Software | | | 2.3 | |
| | | | |
| |
| Commercial Services & Supplies | | | 2.0 | |
| |
| IT Services | | | 1.9 | |
| |
| Health Care Equipment & Supplies | | | 1.6 | |
| |
| Food & Staples Retailing | | | 1.4 | |
| |
| Communications Equipment | | | 1.3 | |
| |
| Multiline Retail | | | 1.3 | |
| |
| Industrial Conglomerates | | | 1.2 | |
| |
| Containers & Packaging | | | 1.0 | |
| |
| Media | | | 1.0 | |
| |
| Specialty Retail | | | 1.0 | |
| |
| Technology Hardware, Storage & Peripherals | | | 0.9 | |
| |
| Air Freight & Logistics | | | 0.7 | |
| |
| Trading Companies & Distributors | | | 0.7 | |
| |
| Food Products | | | 0.6 | |
| |
| Household Durables | | | 0.5 | |
| |
| Textiles, Apparel & Luxury Goods | | | 0.5 | |
| |
| Short-Term Investments | | | 2.4 | |
| |
| Other Assets, Less Liabilities | | | 0.1 | |
| | | | |
| |
| | | 100.0 | % |
| | | | |
See Portfolio of Investments beginning on page 10 for specific holdings within these categories. The Portfolio’s holdings are subject to change.
Top Ten Holdings as of June 30, 2020 (excluding short-term investments) (Unaudited)
| 2. | Verizon Communications, Inc. |
Portfolio Management Discussion and Analysis (Unaudited)
Answers to the questions reflect the views of portfolio managers Michael A. Welhoelter, CFA, William W. Priest, CFA, John M. Tobin, PhD, CFA, Kera Van Valen, CFA, of Epoch Investment Partners, Inc. (“Epoch”), the Portfolio’s Subadvisor.
How did MainStay VP Epoch U.S. Equity Yield Portfolio perform relative to its benchmarks and peers during the six months ended June 30, 2020?
For the six months ended June 30, 2020, MainStay VP Epoch U.S. Equity Yield Portfolio returned –14.53% for Initial Class shares and –14.64% for Service Class shares. Over the same period, both share classes outperformed the –16.26% return of the Russell 1000® Value Index, which is the Portfolio’s primary benchmark, and underperformed the –9.85% return of the U.S. Equity Yield Composite Index, which is the Portfolio’s secondary benchmark. For the six months ended June 30, 2020, both share classes outperformed the –15.20% return of the Morningstar Large Value Category Average.1
What factors affected the Portfolio’s relative performance during the reporting period?
The Portfolio’s outperformance relative to the Russell 1000® Value Index was primarily due to underweight exposure to the financials sector, one of the worst performing sectors in the benchmark; stock selection in the sector also helped. Overweight exposure and stock selection in information technology further bolstered relative returns, as did stock selection in industrials. The strategy was not immune to the indiscriminate, pandemic-related sell-off that broadly affected the equity market. Nevertheless, the strategy upheld its downside protection while outperforming the benchmark through this challenging time. While we understand cash distributions to shareholders have been called into question because of extreme policy measures to stimulate the global economy, we believe the blanket disregard for dividend-paying stocks has been undiscerning and we remain confident in the Portfolio’s holdings. We believe that not all businesses face the same degree of stress. Some businesses are experiencing strains but are still generating material cash flow and entered the reporting period with ample liquidity and strong balance sheets. We assess risks on a company-by-company basis and remain highly confident that the Portfolio can continue to deliver attractive dividend income from a diversified group of high-quality equities.
Which sectors were the strongest positive contributors to the Portfolio’s relative performance, and which sectors were particularly weak?
During the reporting period, the strongest positive sector contributions to the Portfolio’s performance relative to the Russell 1000® Value Index came from financials, information technology and industrials. (Contributions take weightings and total returns into account.) Underweight exposure to financials, overweight exposure to information technology and stock selection in each drove most of the contributions. Stock selection in industrials
also contributed positively to the Portfolio’s relative performance. Over the same period, health care was the most significant detractor from the Portfolio’s relative performance, followed by communication services, materials and consumer discretionary. Specifically, sector allocation and stock selection in health care, as well as stock selection in communication services and materials, hindered relative performance.
During the reporting period, which individual stocks made the strongest positive contributions to the Portfolio’s absolute performance and which stocks detracted the most?
Holdings of Microsoft and KLA shares were among the top individual positive contributors to the Portfolio’s absolute performance. Microsoft is a global software company serving enterprises and consumers. Shares rose on Microsoft’s role in supporting the increasing trend of people working from home. Their cloud-based businesses of Azure, as well as productivity software such as Office and Teams, became increasingly important as the spreading pandemic forced more people to work remotely. Microsoft’s shift toward subscription-based services also supported revenues. At the same time, management remained dedicated to shareholder returns through continued improvements to its dividend and share repurchase plans. KLA is a dominant provider of tools for inspection, process control and yield management for the semiconductor industry. Shares rose on strong capital expenditure forecasts for semiconductor manufacturers, solidifying demand for its process controls. We believe that the announcement that Taiwan Semiconductor Manufacturing Company was planning to build a plant in the United States, together with escalating trade tensions between the United States and China, further improved the demand outlook for semiconductor equipment going forward. KLA returns a high percentage of free cash flow to shareholders through a progressive dividend and share repurchases.
Las Vegas Sands and Darden Restaurants were the largest detractors from absolute performance. Las Vegas Sands is the world’s largest developer, owner and operator of integrated casino resorts. Shares underperformed due to limited visitation and revenue beginning in February due to ongoing COVID-19-related travel restrictions in the company’s core Macao and Singapore markets. The company also suspended its dividend to bolster liquidity in response to the pandemic while noting that it is committed to revisiting the suspension of the dividend at the earliest opportunity. We believe Las Vegas Sands’ strong balance sheet will support it through this challenging period; demand should recover over time and the company will resume an attractive dividend policy once busi-
| 1. | See page 5 for more information on benchmark and peer group returns. |
| | |
| 8 | | MainStay VP Epoch U.S. Equity Yield Portfolio |
ness conditions stabilize. Darden is a full-service, casual dining restaurant company with eight brands, including Olive Garden and LongHorn Steakhouse. Shares underperformed due to concerns over the operational and financial impacts to Darden’s business from the significant reduction in effective restaurant seating capacity and other restrictions mandated by state and local governments in response to the pandemic. In response, the Portfolio exited its position in March 2020. Darden subsequently suspended its quarterly cash dividend and stated that it intends to review the company’s quarterly cash dividend policy as developments warrant.
Did the Portfolio make any significant purchases or sales during the reporting period?
New purchases for the reporting period included Bank of America and PPG Industries. Bank of America is a global financial services firm providing lending, capital markets and asset & wealth management services to retail and institutional clients. Growth is driven by balance sheet expansion through deposits and loans, capital markets activity (including trading and investment banking fees) and positive asset flows/higher equity markets in the wealth management business. Despite a low interest-rate environment, we expect the company to leverage their diverse business operations to generate cash flow growth. Bank of America is well capitalized and offers an attractive dividend. Following the COVID-19 outbreak, all large banks voluntarily suspended their repurchase programs to maintain maximum liquidity in the interim. PPG is a manufacturer of paints, coatings, and specialty materials, such as solvents, sealants and adhesives. The company operates globally and serves customers in a wide variety of end-use industries, including architectural, auto, aerospace, agriculture & construction equipment, infrastructure, marine, railcar and packaging. Cash flows are sustained by the company’s strong brands and market positions, with growth tied to global GDP (gross domestic product) and supplemented historically with strategic acquisitions of smaller competitors. We believe that PPG has a strong balance sheet and returns capital to shareholders via an attractive and consistently growing dividend and regular share repurchases.
Among the Portfolio’s closed positions during the reporting period were CenterPoint Energy and Wells Fargo. CenterPoint Energy is a mostly regulated utility. The company has a stake in a midstream business that has been negatively impacted by the pandemic and the price war in the oil markets. It was not sur-
prising that the midstream company reduced their cash distribution to CenterPoint Energy; however, we were surprised by the abrupt reaction from CenterPoint to reduce their dividend. The distribution reduction was relatively small compared to the capital program and the expected proceeds from two recent asset sales. Our outlook for the company was further clouded by abrupt management departures before and around the time of the dividend decision. As a result, we sold the Portfolio’s position. Wells Fargo, one of the largest banks in the United States, reported relatively weaker first quarter results, including a large provision for possible future loan losses. The company’s exposure to multiple vulnerable sectors such as oil & gas, retail, commercial real estate and transportation, among others, raised concerns about further credit deterioration and subsequent loan reserving. A broad and material deterioration in loan quality could affect capital adequacy relative to regulatory requirements, in turn affecting dividend growth and sustainability. As a result, we decided to sell the Portfolio’s position early in the second quarter of 2020. The company subsequently announced a dividend reduction after the release of the annual stress test in June.
How did the Portfolio’s sector weightings change during the reporting period?
The Portfolio’s most significant sector weighting changes during the reporting period were increases in exposure to health care and information technology, and reductions in exposure to utilities and energy. The Portfolio’s sector and country allocations are a result of our bottom-up fundamental investment process and reflect the companies and securities that we confidently believe can collect and distribute sustainable, growing shareholder yield. Large differences in sector returns over the reporting period and the subsequent relative performance of sectors may affect sector weightings.
How was the Portfolio positioned at the end of the reporting period?
As of June 30, 2020, the Portfolio’s largest sector positions were in health care and financials, and the smallest sector positions were real estate and materials. As of the same date, the Portfolio held its largest allocation relative to the Russell 1000® Value Index in utilities, a defensive sector that is typically more heavily represented in the Portfolio. The Portfolio’s most substantially underweight sector positions relative to the Index were in the financials and communication services sectors.
The opinions expressed are those of the portfolio managers as of the date of this report and are subject to change. There is no guarantee that any forecasts will come to pass. This material does not constitute investment advice and is not intended as an endorsement of any specific investment.
Not all MainStay VP Portfolios and/or share classes are available under all policies.
Portfolio of Investments June 30, 2020 (Unaudited)
| | | | | | | | |
| | |
| | | Shares | | | Value | |
| | | | | | | | |
| COMMON STOCKS 97.5% † | |
Aerospace & Defense 2.9% | |
General Dynamics Corp. | | | 39,096 | | | $ | 5,843,288 | |
Lockheed Martin Corp. | | | 31,430 | | | | 11,469,436 | |
Raytheon Technologies Corp. | | | 133,004 | | | | 8,195,706 | |
| | | | | | | | |
| | | | | | | 25,508,430 | |
| | | | | | | | |
Air Freight & Logistics 0.7% | |
United Parcel Service, Inc., Class B | | | 55,578 | | | | 6,179,162 | |
| | | | | | | | |
Banks 5.2% | |
Bank of America Corp. | | | 186,492 | | | | 4,429,185 | |
JPMorgan Chase & Co. | | | 91,669 | | | | 8,622,386 | |
M&T Bank Corp. | | | 58,644 | | | | 6,097,217 | |
People’s United Financial, Inc. | | | 485,640 | | | | 5,618,855 | |
PNC Financial Services Group, Inc. | | | 47,529 | | | | 5,000,526 | |
Truist Financial Corp. | | | 255,660 | | | | 9,600,033 | |
U.S. Bancorp | | | 168,651 | | | | 6,209,730 | |
| | | | | | | | |
| | | | | | | 45,577,932 | |
| | | | | | | | |
Beverages 3.1% | |
Coca-Cola Co. | | | 197,399 | | | | 8,819,788 | |
Coca-Cola European Partners PLC | | | 195,099 | | | | 7,366,938 | |
PepsiCo., Inc. | | | 86,989 | | | | 11,505,165 | |
| | | | | | | | |
| | | | | | | 27,691,891 | |
| | | | | | | | |
Biotechnology 3.7% | |
AbbVie, Inc. | | | 165,968 | | | | 16,294,738 | |
Amgen, Inc. | | | 67,702 | | | | 15,968,194 | |
| | | | | | | | |
| | | | | | | 32,262,932 | |
| | | | | | | | |
Capital Markets 2.7% | |
BlackRock, Inc. | | | 20,698 | | | | 11,261,575 | |
CME Group, Inc. | | | 50,212 | | | | 8,161,459 | |
Lazard, Ltd., Class A | | | 167,118 | | | | 4,784,588 | |
| | | | | | | | |
| | | | | | | 24,207,622 | |
| | | | | | | | |
Chemicals 3.0% | |
Dow, Inc. | | | 211,964 | | | | 8,639,653 | |
LyondellBasell Industries N.V., Class A | | | 86,242 | | | | 5,667,824 | |
Nutrien, Ltd. | | | 228,063 | | | | 7,320,822 | |
PPG Industries, Inc. | | | 44,757 | | | | 4,746,928 | |
| | | | | | | | |
| | | | | | | 26,375,227 | |
| | | | | | | | |
Commercial Services & Supplies 2.0% | |
Republic Services, Inc. | | | 103,874 | | | | 8,522,862 | |
Waste Management, Inc. | | | 83,176 | | | | 8,809,170 | |
| | | | | | | | |
| | | | | | | 17,332,032 | |
| | | | | | | | |
Communications Equipment 1.3% | |
Cisco Systems, Inc. | | | 252,082 | | | | 11,757,104 | |
| | | | | | | | |
Containers & Packaging 1.0% | |
Amcor PLC | | | 859,741 | | | | 8,777,956 | |
| | | | | | | | |
| | | | | | | | |
| | |
| | | Shares | | | Value | |
| | | | | | | | |
Diversified Telecommunication Services 3.8% | |
AT&T, Inc. | | | 486,012 | | | $ | 14,692,143 | |
Verizon Communications, Inc. | | | 336,537 | | | | 18,553,285 | |
| | | | | | | | |
| | | | | | | 33,245,428 | |
| | | | | | | | |
Electric Utilities 7.5% | |
Alliant Energy Corp. | | | 118,056 | | | | 5,647,799 | |
American Electric Power Co., Inc. | | | 109,623 | | | | 8,730,376 | |
Duke Energy Corp. | | | 107,323 | | | | 8,574,034 | |
Entergy Corp. | | | 139,521 | | | | 13,088,465 | |
Evergy, Inc. | | | 110,773 | | | | 6,567,731 | |
Eversource Energy | | | 94,822 | | | | 7,895,828 | |
FirstEnergy Corp. | | | 245,311 | | | | 9,513,161 | |
PPL Corp. | | | 218,480 | | | | 5,645,523 | |
| | | | | | | | |
| | | | | | | 65,662,917 | |
| | | | | | | | |
Electrical Equipment 2.6% | |
Eaton Corp. PLC | | | 134,921 | | | | 11,802,889 | |
Emerson Electric Co. | | | 178,234 | | | | 11,055,855 | |
| | | | | | | | |
| | | | | | | 22,858,744 | |
| | | | | | | | |
Equity Real Estate Investment Trusts 2.9% | |
American Tower Corp. | | | 30,012 | | | | 7,759,302 | |
Iron Mountain, Inc. | | | 396,090 | | | | 10,337,949 | |
Welltower, Inc. | | | 148,336 | | | | 7,676,388 | |
| | | | | | | | |
| | | | | | | 25,773,639 | |
| | | | | | | | |
Food & Staples Retailing 1.4% | |
Walmart, Inc. | | | 105,790 | | | | 12,671,526 | |
| | | | | | | | |
Food Products 0.6% | |
McCormick & Co., Inc. | | | 30,601 | | | | 5,490,125 | |
| | | | | | | | |
Health Care Equipment & Supplies 1.6% | |
Medtronic PLC | | | 152,045 | | | | 13,942,526 | |
| | | | | | | | |
Health Care Providers & Services 2.4% | |
CVS Health Corp. | | | 133,771 | | | | 8,691,102 | |
UnitedHealth Group, Inc. | | | 43,312 | | | | 12,774,874 | |
| | | | | | | | |
| | | | | | | 21,465,976 | |
| | | | | | | | |
Hotels, Restaurants & Leisure 2.4% | |
Las Vegas Sands Corp. | | | 145,270 | | | | 6,615,596 | |
McDonald’s Corp. | | | 50,978 | | | | 9,403,912 | |
Vail Resorts, Inc. | | | 27,597 | | | | 5,026,793 | |
| | | | | | | | |
| | | | | | | 21,046,301 | |
| | | | | | | | |
Household Durables 0.5% | |
Leggett & Platt, Inc. | | | 131,088 | | | | 4,607,743 | |
| | | | | | | | |
Household Products 4.2% | |
Colgate-Palmolive Co. | | | 75,893 | | | | 5,559,921 | |
Kimberly-Clark Corp. | | | 108,857 | | | | 15,386,937 | |
Procter & Gamble Co. | | | 130,705 | | | | 15,628,397 | |
| | | | | | | | |
| | | | | | | 36,575,255 | |
| | | | | | | | |
| | | | |
| 10 | | MainStay VP Epoch U.S. Equity Yield Portfolio | | The notes to the financial statements are an integral part of,
and should be read in conjunction with, the financial statements. |
| | | | | | | | |
| | |
| | | Shares | | | Value | |
| | | | | | | | |
| Common Stocks (continued) | |
Industrial Conglomerates 1.2% | |
Honeywell International, Inc. | | | 71,293 | | | $ | 10,308,255 | |
| | | | | | | | |
Insurance 5.4% | |
Allianz S.E., Sponsored ADR | | | 416,646 | | | | 8,549,576 | |
Arthur J. Gallagher & Co. | | | 119,972 | | | | 11,696,070 | |
Marsh & McLennan Cos., Inc. | | | 61,327 | | | | 6,584,680 | |
MetLife, Inc. | | | 352,252 | | | | 12,864,243 | |
Travelers Cos., Inc. | | | 65,544 | | | | 7,475,293 | |
| | | | | | | | |
| | | | | | | 47,169,862 | |
| | | | | | | | |
IT Services 1.9% | |
Automatic Data Processing, Inc. | | | 34,880 | | | | 5,193,283 | |
International Business Machines Corp. | | | 47,145 | | | | 5,693,702 | |
Paychex, Inc. | | | 77,043 | | | | 5,836,007 | |
| | | | | | | | |
| | | | | | | 16,722,992 | |
| | | | | | | | |
Media 1.0% | |
Comcast Corp., Class A | | | 230,248 | | | | 8,975,067 | |
| | | | | | | | |
Multi-Utilities 4.8% | |
Ameren Corp. | | | 144,425 | | | | 10,161,743 | |
CMS Energy Corp. | | | 89,308 | | | | 5,217,373 | |
Dominion Energy, Inc. | | | 122,272 | | | | 9,926,041 | |
NiSource, Inc. | | | 248,163 | | | | 5,643,227 | |
WEC Energy Group, Inc. | | | 126,105 | | | | 11,053,103 | |
| | | | | | | | |
| | | | | | | 42,001,487 | |
| | | | | | | | |
Multiline Retail 1.3% | |
Target Corp. | | | 96,974 | | | | 11,630,092 | |
| | | | | | | | |
Oil, Gas & Consumable Fuels 4.6% | |
Chevron Corp. | | | 113,980 | | | | 10,170,435 | |
Enterprise Products Partners, L.P. | | | 418,179 | | | | 7,598,313 | |
Exxon Mobil Corp. | | | 189,554 | | | | 8,476,855 | |
Magellan Midstream Partners, L.P. | | | 145,653 | | | | 6,287,840 | |
Phillips 66 | | | 106,557 | | | | 7,661,448 | |
| | | | | | | | |
| | | | | | | 40,194,891 | |
| | | | | | | | |
Pharmaceuticals 6.5% | |
Eli Lilly & Co. | | | 54,045 | | | | 8,873,108 | |
Johnson & Johnson | | | 128,022 | | | | 18,003,734 | |
Merck & Co., Inc. | | | 220,014 | | | | 17,013,682 | |
Pfizer, Inc. | | | 400,931 | | | | 13,110,444 | |
| | | | | | | | |
| | | | | | | 57,000,968 | |
| | | | | | | | |
Semiconductors & Semiconductor Equipment 6.4% | |
Analog Devices, Inc. | | | 68,993 | | | | 8,461,302 | |
Broadcom, Inc. | | | 19,548 | | | | 6,169,544 | |
Intel Corp. | | | 155,236 | | | | 9,287,770 | |
KLA Corp. | | | 78,140 | | | | 15,196,667 | |
Maxim Integrated Products, Inc. | | | 89,569 | | | | 5,428,777 | |
Texas Instruments, Inc. | | | 96,208 | | | | 12,215,530 | |
| | | | | | | | |
| | | | | | | 56,759,590 | |
| | | | | | | | |
Software 2.3% | |
Microsoft Corp. | | | 99,567 | | | | 20,262,880 | |
| | | | | | | | |
| | | | | | | | |
| | |
| | | Shares | | | Value | |
| | | | | | | | |
Specialty Retail 1.0% | |
Home Depot, Inc. | | | 36,413 | | | $ | 9,121,821 | |
| | | | | | | | |
Technology Hardware, Storage & Peripherals 0.9% | |
Apple, Inc. | | | 20,698 | | | | 7,550,630 | |
| | | | | | | | |
Textiles, Apparel & Luxury Goods 0.5% | |
Hanesbrands, Inc. | | | 366,434 | | | | 4,137,040 | |
| | | | | | | | |
Tobacco 3.5% | |
Altria Group, Inc. | | | 297,922 | | | | 11,693,439 | |
British American Tobacco PLC, Sponsored ADR (a) | | | 238,412 | | | | 9,255,154 | |
Philip Morris International, Inc. | | | 136,837 | | | | 9,586,800 | |
| | | | | | | | |
| | | | | | | 30,535,393 | |
| | | | | | | | |
Trading Companies & Distributors 0.7% | |
Watsco, Inc. | | | 37,180 | | | | 6,606,886 | |
| | | | | | | | |
Total Common Stocks
(Cost $837,592,588) | | | | 857,988,322 | |
| | | | | |
| Short-Term Investments 2.4% | |
Affiliated Investment Company 2.4% | |
MainStay U.S. Government Liquidity Fund, 0.05% (b) | | | 21,347,466 | | | | 21,347,466 | |
| | | | | | | | |
Unaffiliated Investment Company 0.0% ‡ | |
State Street Navigator Securities Lending Government Money Market Portfolio, 0.13% (b)(c) | | | 108,000 | | | | 108,000 | |
| | | | | | | | |
Total Short-Term Investments
(Cost $21,455,466) | | | | 21,455,466 | |
| | | | | |
Total Investments
(Cost $859,048,054) | | | 99.9 | % | | | 879,443,788 | |
Other Assets, Less Liabilities | | | 0.1 | | | | 1,087,430 | |
| | | | | | | | |
Net Assets | | | 100.0 | % | | $ | 880,531,218 | |
| | | | | | | | |
| † | Percentages indicated are based on Portfolio net assets. |
| ‡ | Less than one-tenth of a percent. |
| (a) | All or a portion of this security was held on loan. As of June 30, 2020, the aggregate market value of securities on loan was $5,410,842; the total market value of collateral held by the Portfolio was $5,586,518. The market value of the collateral held included non-cash collateral in the form of U.S. Treasury securities with a value of $5,478,518 (See Note 2(H)). |
| (b) | Current yield as of June 30, 2020. |
| (c) | Represents a security purchased with cash collateral received for securities on loan. |
| | | | | | |
The notes to the financial statements are an integral part of,
and should be read in conjunction with, the financial statements. | | | | | 11 | |
The following abbreviation is used in the preceding pages:
ADR—American Depositary Receipt
The following is a summary of the fair valuations according to the inputs used as of June 30, 2020, for valuing the Portfolio’s assets:
| | | | | | | | | | | | | | | | |
Description | | Quoted Prices in Active Markets for
Identical
Assets (Level 1) | | | Significant
Other
Observable
Inputs (Level 2) | | | Significant
Unobservable
Inputs (Level 3) | | | Total | |
Asset Valuation Inputs | | | | | | | | | | | | | | | | |
| Investments in Securities (a) | | | | | | | | | | | | | �� | | | |
| Common Stocks | | $ | 857,988,322 | | | $ | — | | | $ | — | | | $ | 857,988,322 | |
| Short-Term Investments | | | | | | | | | | | | | | | | |
Affiliated Investment Company | | | 21,347,466 | | | | — | | | | — | | | | 21,347,466 | |
Unaffiliated Investment Company | | | 108,000 | | | | — | | | | — | | | | 108,000 | |
| | | | | | | | | | | | | | | | |
| Total Short-Term Investments | | | 21,455,466 | | | | — | | | | — | | | | 21,455,466 | |
| | | | | | | | | | | | | | | | |
| Total Investments in Securities | | $ | 879,443,788 | | | $ | — | | | $ | — | | | $ | 879,443,788 | |
| | | | | | | | | | | | | | | | |
| (a) | For a complete listing of investments and their industries, see the Portfolio of Investments. |
| | | | |
| 12 | | MainStay VP Epoch U.S. Equity Yield Portfolio | | The notes to the financial statements are an integral part of,
and should be read in conjunction with, the financial statements. |
Statement of Assets and Liabilities as of June 30, 2020 (Unaudited)
| | | | |
| Assets | |
Investment in unaffiliated securities, at value (identified cost $837,700,588) including securities on loan of $5,410,842 | | $ | 858,096,322 | |
Investment in affiliated investment company, at value (identified cost $21,347,466) | | | 21,347,466 | |
Receivables: | |
Investment securities sold | | | 4,560,298 | |
Dividends | | | 2,180,997 | |
Portfolio shares sold | | | 238,623 | |
Securities lending | | | 692 | |
Other assets | | | 4,247 | |
| | | | |
Total assets | | | 886,428,645 | |
| | | | |
|
| Liabilities | |
Cash collateral received for securities on loan | | | 108,000 | |
Payables: | |
Investment securities purchased | | | 4,648,470 | |
Portfolio shares redeemed | | | 503,513 | |
Manager (See Note 3) | | | 474,828 | |
NYLIFE Distributors (See Note 3) | | | 79,768 | |
Shareholder communication | | | 45,480 | |
Professional fees | | | 25,943 | |
Custodian | | | 4,590 | |
Trustees | | | 1,230 | |
Accrued expenses | | | 5,605 | |
| | | | |
Total liabilities | | | 5,897,427 | |
| | | | |
Net assets | | $ | 880,531,218 | |
| | | | |
|
| Composition of Net Assets | |
Shares of beneficial interest outstanding (par value of $.001 per share) unlimited number of shares authorized | | $ | 64,356 | |
Additional paid-in capital | | | 829,733,879 | |
| | | | |
| | | 829,798,235 | |
Total distributable earnings (loss) | | | 50,732,983 | |
| | | | |
Net assets | | $ | 880,531,218 | |
| | | | |
Initial Class | |
Net assets applicable to outstanding shares | | $ | 498,480,906 | |
| | | | |
Shares of beneficial interest outstanding | | | 36,182,128 | |
| | | | |
Net asset value per share outstanding | | $ | 13.78 | |
| | | | |
Service Class | |
Net assets applicable to outstanding shares | | $ | 382,050,312 | |
| | | | |
Shares of beneficial interest outstanding | | | 28,174,133 | |
| | | | |
Net asset value per share outstanding | | $ | 13.56 | |
| | | | |
| | | | | | |
The notes to the financial statements are an integral part of,
and should be read in conjunction with, the financial statements. | | | | | 13 | |
Statement of Operations for the six months ended June 30, 2020 (Unaudited)
| | | | |
| Investment Income (Loss) | |
Income | | | | |
Dividends-unaffiliated (a) | | $ | 16,484,437 | |
Dividends-affiliated | | | 53,292 | |
Securities lending | | | 1,642 | |
| | | | |
Total income | | | 16,539,371 | |
| | | | |
Expenses | | | | |
Manager (See Note 3) | | | 3,144,150 | |
Distribution/Service—Service Class (See Note 3) | | | 495,410 | |
Professional fees | | | 60,126 | |
Shareholder communication | | | 46,686 | |
Custodian | | | 12,309 | |
Trustees | | | 11,651 | |
Miscellaneous | | | 17,828 | |
| | | | |
Total expenses before waiver/reimbursement | | | 3,788,160 | |
Expense waiver/reimbursement from Manager (See Note 3) | | | (196,625 | ) |
| | | | |
Net expenses | | | 3,591,535 | |
| | | | |
Net investment income (loss) | | | 12,947,836 | |
| | | | |
|
| Realized and Unrealized Gain (Loss) on Investments | |
Net realized gain (loss) on unaffiliated investments | | | (34,201,524 | ) |
Net change in unrealized appreciation (depreciation) on unaffiliated investments | | | (130,877,860 | ) |
| | | | |
Net realized and unrealized gain (loss) on investments | | | (165,079,384 | ) |
| | | | |
Net increase (decrease) in net assets resulting from operations | | $ | (152,131,548 | ) |
| | | | |
| (a) | Dividends recorded net of foreign withholding taxes in the amount of $133,499. |
| | | | |
| 14 | | MainStay VP Epoch U.S. Equity Yield Portfolio | | The notes to the financial statements are an integral part of,
and should be read in conjunction with, the financial statements. |
Statements of Changes in Net Assets
for the six months ended June 30, 2020 (Unaudited) and the year ended December 31, 2019
| | | | | | | | |
| | | 2020 | | | 2019 | |
| Increase (Decrease) in Net Assets | |
Operations: | |
Net investment income (loss) | | $ | 12,947,836 | | | $ | 23,402,242 | |
Net realized gain (loss) on investments and foreign currency transactions | | | (34,201,524 | ) | | | 32,134,611 | |
Net change in unrealized appreciation (depreciation) on investments and foreign currencies | | | (130,877,860 | ) | | | 163,085,263 | |
| | | | |
Net increase (decrease) in net assets resulting from operations | | | (152,131,548 | ) | | | 218,622,116 | |
| | | | |
Distributions to shareholders: | |
Initial Class | | | — | | | | (39,107,129 | ) |
Service Class | | | — | | | | (31,871,243 | ) |
| | | | |
Total distributions to shareholders | | | — | | | | (70,978,372 | ) |
| | | | |
Capital share transactions: | |
Net proceeds from sale of shares | | | 29,006,984 | | | | 85,886,650 | |
Net asset value of shares issued to shareholders in reinvestment of distributions | | | — | | | | 70,978,372 | |
Cost of shares redeemed | | | (48,322,334 | ) | | | (233,046,248 | ) |
| | | | |
Increase (decrease) in net assets derived from capital share transactions | | | (19,315,350 | ) | | | (76,181,226 | ) |
| | | | |
Net increase (decrease) in net assets | | | (171,446,898 | ) | | | 71,462,518 | |
|
| Net Assets | |
Beginning of period | | | 1,051,978,116 | | | | 980,515,598 | |
| | | | |
End of period | | $ | 880,531,218 | | | $ | 1,051,978,116 | |
| | | | |
| | | | | | |
The notes to the financial statements are an integral part of,
and should be read in conjunction with, the financial statements. | | | | | 15 | |
Financial Highlights selected per share data and ratios
| | | | | | | | | | | | | | | | | | | | | | | | | | | | |
| | | |
| | | Six months
ended
June 30, | | | | | | Year ended December 31, | |
| | | | | | | |
| Initial Class | | 2020* | | | | | | 2019 | | | 2018 | | | 2017 | | | 2016 | | | 2015 | |
| | | | | | | |
Net asset value at beginning of period | | $ | 16.12 | | | | | | | $ | 14.01 | | | $ | 16.15 | | | $ | 13.79 | | | $ | 15.58 | | | $ | 18.94 | |
| | | | | | | | | | | | | | | | | | | | | | | | | | | | |
| | | | | | | |
Net investment income (loss) | | | 0.22 | | | | | | | | 0.38 | (a) | | | 0.39 | (a) | | | 0.30 | (a) | | | 0.21 | (a) | | | 0.19 | (a) |
| | | | | | | |
Net realized and unrealized gain (loss) on investments | | | (2.56 | ) | | | | | | | 2.92 | | | | (1.12 | ) | | | 2.26 | | | | 0.47 | | | | (0.95 | ) |
| | | | | | | |
Net realized and unrealized gain (loss) on foreign currency transactions | | | — | | | | | | | | 0.00 | ‡ | | | — | | | | — | | | | — | | | | — | |
| | | | | | | | | | | | | | | | | | | | | | | | | | | | |
| | | | | | | |
Total from investment operations | | | (2.34 | ) | | | | | | | 3.30 | | | | (0.73 | ) | | | 2.56 | | | | 0.68 | | | | (0.76 | ) |
| | | | | | | | | | | | | | | | | | | | | | | | | | | | |
| | | | | | | |
| Less distributions: | | | | | | | | | | | | | | | | | | | | | | | | | | | | |
| | | | | | | |
From net investment income | | | — | | | | | | | | (0.52 | ) | | | (0.35 | ) | | | (0.20 | ) | | | (0.18 | ) | | | (0.51 | ) |
| | | | | | | |
From net realized gain on investments | | | — | | | | | | | | (0.67 | ) | | | (1.06 | ) | | | — | | | | (2.29 | ) | | | (2.09 | ) |
| | | | | | | | | | | | | | | | | | | | | | | | | | | | |
| | | | | | | |
Total distributions | | | — | | | | | | | | (1.19 | ) | | | (1.41 | ) | | | (0.20 | ) | | | (2.47 | ) | | | (2.60 | ) |
| | | | | | | | | | | | | | | | | | | | | | | | | | | | |
| | | | | | | |
Net asset value at end of period | | $ | 13.78 | | | | | | | $ | 16.12 | | | $ | 14.01 | | | $ | 16.15 | | | $ | 13.79 | | | $ | 15.58 | |
| | | | | | | | | | | | | | | | | | | | | | | | | | | | |
| | | | | | | |
Total investment return (b) | | | (14.52 | %) (c) | | | | | | | 24.18 | % | | | (5.23 | %) | | | 18.66 | % | | | 4.90 | % | | | (3.78 | %) |
| | | | | | | |
Ratios (to average net assets)/Supplemental Data: | | | | | | | | | | | | | | | | | | | | | | | | | | | | |
| | | | | | | |
Net investment income (loss) | | | 2.95 | % †† | | | | | | | 2.43 | % | | | 2.49 | % | | | 2.01 | % | | | 1.41 | % | | | 1.07 | % |
| | | | | | | |
Net expenses (d) | | | 0.68 | % †† | | | | | | | 0.68 | % | | | 0.68 | % | | | 0.73 | % | | | 0.79 | % | | | 0.78 | % |
| | | | | | | |
Expenses (before waiver/reimbursement) (d) | | | 0.72 | % †† | | | | | | | 0.72 | % | | | 0.71 | % | | | 0.74 | % | | | 0.79 | % | | | 0.78 | % |
| | | | | | | |
Portfolio turnover rate | | | 18 | % | | | | | | | 22 | % | | | 25 | % | | | 122 | % | | | 99 | % | | | 86 | % |
| | | | | | | |
Net assets at end of period (in 000’s) | | $ | 498,481 | | | | | | | $ | 591,185 | | | $ | 548,881 | | | $ | 791,462 | | | $ | 637,936 | | | $ | 655,690 | |
| ‡ | Less than one cent per share. |
| (a) | Per share data based on average shares outstanding during the period. |
| (b) | Total return does not reflect any deduction of sales charges, mortality and expense charges, contract charges or administrative charges. For periods of less than one year, total return is not annualized. |
| (c) | Total investment return may reflect adjustments to conform to generally accepted accounting principles. |
| (d) | In addition to the fees and expenses which the Portfolio bears directly, it also indirectly bears a pro-rata share of the fees and expenses of the underlying funds in which it invests. Such indirect expenses are not included in the above expense ratios. |
| | | | |
| 16 | | MainStay VP Epoch U.S. Equity Yield Portfolio | | The notes to the financial statements are an integral part of,
and should be read in conjunction with, the financial statements. |
Financial Highlights selected per share data and ratios
| | | | | | | | | | | | | | | | | | | | | | | | | | | | |
| | | |
| | | Six months
ended
June 30, | | | | | | Year ended December 31, | |
| | | | | | | |
| Service Class | | 2020* | | | | | | 2019 | | | 2018 | | | 2017 | | | 2016 | | | 2015 | |
| | | | | | | |
Net asset value at beginning of period | | $ | 15.89 | | | | | | | $ | 13.81 | | | $ | 15.94 | | | $ | 13.61 | | | $ | 15.40 | | | $ | 18.75 | |
| | | | | | | | | | | | | | | | | | | | | | | | | | | | |
| | | | | | | |
Net investment income (loss) | | | 0.20 | | | | | | | | 0.34 | (a) | | | 0.35 | (a) | | | 0.26 | (a) | | | 0.17 | (a) | | | 0.15 | (a) |
| | | | | | | |
Net realized and unrealized gain (loss) on investments | | | (2.53 | ) | | | | | | | 2.88 | | | | (1.12 | ) | | | 2.24 | | | | 0.46 | | | | (0.95 | ) |
| | | | | | | |
Net realized and unrealized gain (loss) on foreign currency transactions | | | — | | | | | | | | 0.00 | ‡ | | | — | | | | — | | | | — | | | | — | |
| | | | | | | | | | | | | | | | | | | | | | | | | | | | |
| | | | | | | |
Total from investment operations | | | (2.33 | ) | | | | | | | 3.22 | | | | (0.77 | ) | | | 2.50 | | | | 0.63 | | | | (0.80 | ) |
| | | | | | | | | | | | | | | | | | | | | | | | | | | | |
| | | | | | | |
| Less distributions: | | | | | | | | | | | | | | | | | | | | | | | | | | | | |
| | | | | | | |
From net investment income | | | — | | | | | | | | (0.47 | ) | | | (0.30 | ) | | | (0.17 | ) | | | (0.13 | ) | | | (0.46 | ) |
| | | | | | | |
From net realized gain on investments | | | — | | | | | | | | (0.67 | ) | | | (1.06 | ) | | | — | | | | (2.29 | ) | | | (2.09 | ) |
| | | | | | | | | | | | | | | | | | | | | | | | | | | | |
| | | | | | | |
Total distributions | | | — | | | | | | | | (1.14 | ) | | | (1.36 | ) | | | (0.17 | ) | | | (2.42 | ) | | | (2.55 | ) |
| | | | | | | | | | | | | | | | | | | | | | | | | | | | |
| | | | | | | |
Net asset value at end of period | | $ | 13.56 | | | | | | | $ | 15.89 | | | $ | 13.81 | | | $ | 15.94 | | | $ | 13.61 | | | $ | 15.40 | |
| | | | | | | | | | | | | | | | | | | | | | | | | | | | |
| | | | | | | |
Total investment return (b) | | | (14.66 | %) (c) | | | | | | | 23.87 | % | | | (5.46 | %) | | | 18.37 | % | | | 4.63 | % | | | (4.02 | %) |
| | | | | | | |
Ratios (to average net assets)/Supplemental Data: | | | | | | | | | | | | | | | | | | | | | | | | | | | | |
| | | | | | | |
Net investment income (loss) | | | 2.70 | % †† | | | | | | | 2.18 | % | | | 2.23 | % | | | 1.73 | % | | | 1.16 | % | | | 0.82 | % |
| | | | | | | |
Net expenses (d) | | | 0.93 | % †† | �� | | | | | | 0.93 | % | | | 0.93 | % | | | 0.98 | % | | | 1.04 | % | | | 1.03 | % |
| | | | | | | |
Expenses (before waiver/reimbursement) (d) | | | 0.97 | % †† | | | | | | | 0.97 | % | | | 0.96 | % | | | 0.99 | % | | | 1.04 | % | | | 1.03 | % |
| | | | | | | |
Portfolio turnover rate | | | 18 | % | | | | | | | 22 | % | | | 25 | % | | | 122 | % | | | 99 | % | | | 86 | % |
| | | | | | | |
Net assets at end of period (in 000’s) | | $ | 382,050 | | | | | | | $ | 460,793 | | | $ | 431,635 | | | $ | 536,044 | | | $ | 526,452 | | | $ | 569,660 | |
| ‡ | Less than one cent per share. |
| (a) | Per share data based on average shares outstanding during the period. |
| (b) | Total return does not reflect any deduction of sales charges, mortality and expense charges, contract charges or administrative charges. For periods of less than one year, total return is not annualized. |
| (c) | Total investment return may reflect adjustments to conform to generally accepted accounting principles. |
| (d) | In addition to the fees and expenses which the Portfolio bears directly, it also indirectly bears a pro-rata share of the fees and expenses of the underlying funds in which it invests. Such indirect expenses are not included in the above expense ratios. |
| | | | | | |
The notes to the financial statements are an integral part of,
and should be read in conjunction with, the financial statements. | | | | | 17 | |
Notes to Financial Statements (Unaudited)
Note 1–Organization and Business
MainStay VP Funds Trust (the ‘‘Fund’’) was organized as a Delaware statutory trust on February 1, 2011. The Fund is registered under the Investment Company Act of 1940, as amended (the “1940 Act”), as an open-end management investment company. The Fund is comprised of thirty-one separate series (collectively referred to as the “Portfolios”). These financial statements and notes relate to the MainStay VP Epoch U.S. Equity Yield Portfolio (the “Portfolio”), a “diversified” portfolio, as that term is defined in the 1940 Act, as interpreted or modified by regulatory authorities having jurisdiction, from time to time.
Shares of the Portfolio are currently offered to certain separate accounts to fund variable annuity policies and variable universal life insurance policies issued by New York Life Insurance and Annuity Corporation (“NYLIAC”), a wholly-owned subsidiary of New York Life Insurance Company (“New York Life”) and may also be offered to fund variable annuity policies and variable universal life insurance policies issued by other insurance companies. NYLIAC allocates shares of the Portfolios to, among others, certain NYLIAC separate accounts. Shares of the Portfolio are also offered to the MainStay VP Conservative Allocation Portfolio, MainStay VP Moderate Allocation Portfolio, MainStay VP Moderate Growth Allocation Portfolio and MainStay VP Growth Allocation Portfolio, which operate as “funds-of-funds,” and other variable insurance funds.
The Portfolio currently offers two classes of shares. Initial Class shares commenced operations on May 1, 1998. Service Class shares commenced operations on June 5, 2003. Shares of the Portfolio are offered and are redeemed at a price equal to their respective net asset value (“NAV”) per share. No sales or redemption charge is applicable to the purchase or redemption of the Portfolio’s shares. Under the terms of the Fund’s multiple class plan adopted pursuant to Rule 18f-3 under the 1940 Act, the classes differ in that, among other things, Service Class shares of the Portfolio pay a combined distribution and service fee of 0.25% of average daily net assets attributable to Service Class shares of the Portfolio to the Distributor (as defined in Note 3(B)) pursuant to a plan adopted in accordance with Rule 12b-1 under the 1940 Act. Contract owners of variable annuity contracts purchased after June 2, 2003, are permitted to invest only in the Service Class shares.
The Portfolio’s investment objective is to seek current income and capital appreciation.
Note 2–Significant Accounting Policies
The Portfolio is an investment company and accordingly follows the investment company accounting and reporting guidance of the Financial Accounting Standards Board (“FASB”) Accounting Standard Codification Topic 946 Financial Services—Investment Companies. The Portfolio prepares its financial statements in accordance with generally accepted accounting principles (“GAAP”) in the United States of America and follows the significant accounting policies described below.
(A) Securities Valuation. Investments are usually valued as of the close of regular trading on the New York Stock Exchange (the “Exchange”) (usually 4:00 p.m. Eastern time) on each day the Portfolio is open for business (“valuation date”).
The Board of Trustees of the Fund (the “Board”) adopted procedures establishing methodologies for the valuation of the Portfolio’s securities and other assets and delegated the responsibility for valuation determinations under those procedures to the Valuation Committee of the Fund (the “Valuation Committee”). The procedures state that, subject to the oversight of the Board and unless otherwise noted, the responsibility for the day-to-day valuation of portfolio assets (including fair value measurements for the Portfolio’s assets and liabilities) rests with New York Life Investment Management LLC (“New York Life Investments” or the “Manager”), aided to whatever extent necessary by the Subadvisor (as defined in Note 3(A)). To assess the appropriateness of security valuations, the Manager, the Subadvisor or the Portfolio’s third-party service provider, who is subject to oversight by the Manager, regularly compares prior day prices, prices on comparable securities and the sale prices to the prior and current day prices and challenges prices with changes exceeding certain tolerance levels with third-party pricing services or broker sources.
The Board authorized the Valuation Committee to appoint a Valuation Subcommittee (the “Subcommittee”) to establish the prices of securities for which market quotations are not readily available or the prices of which are not otherwise readily determinable under the procedures. The Subcommittee meets (in person, via electronic mail or via teleconference) on an as-needed basis. The Valuation Committee meets to ensure that actions taken by the Subcommittee were appropriate.
For those securities valued through either a standardized fair valuation methodology or a fair valuation measurement, the Subcommittee deals with such valuation and the Valuation Committee reviews and affirms, if appropriate, the reasonableness of the valuation based on such methodologies and measurements on a regular basis after considering information that is reasonably available and deemed relevant by the Valuation Committee. Any action taken by the Subcommittee with respect to the valuation of a portfolio security or other asset is submitted for review and ratification (if appropriate) to the Valuation Committee and the Board at the next regularly scheduled meeting.
“Fair value” is defined as the price the Portfolio would reasonably expect to receive upon selling an asset or liability in an orderly transaction to an independent buyer in the principal or most advantageous market for the asset or liability. Fair value measurements are determined within a framework that establishes a three-tier hierarchy that maximizes the use of observable market data and minimizes the use of unobservable inputs to establish a classification of fair value measurements for disclosure purposes. “Inputs” refer broadly to the assumptions that market participants would use in pricing the asset or liability, including assumptions about risk, such as the risk inherent in a particular valuation technique used to measure fair value using a pricing model and/or the risk inherent in the inputs for the valuation technique. Inputs may be observable or unobservable. Observable inputs reflect the assumptions market participants would use in pricing the asset or liability based on market data obtained from sources independent of the Portfolio. Unobservable inputs reflect the Portfolio’s own assumptions about the assumptions market participants would use in pricing the asset or liability based on the information available. The inputs or methodology used for valuing assets or liabilities may not be an indication of the risks associated with investing in those assets or liabilities. The three-tier hierarchy of inputs is summarized below.
| | |
| 18 | | MainStay VP Epoch U.S. Equity Yield Portfolio |
| • | | Level 1—quoted prices in active markets for an identical asset or liability |
| • | | Level 2—other significant observable inputs (including quoted prices for a similar asset or liability in active markets, interest rates and yield curves, prepayment speeds, credit risk, etc.) |
| • | | Level 3—significant unobservable inputs (including the Portfolio’s own assumptions about the assumptions that market participants would use in measuring fair value of an asset or liability) |
The level of an asset or liability within the fair value hierarchy is based on the lowest level of an input, both individually and in the aggregate, that is significant to the fair value measurement. The aggregate value by input level of the Portfolio’s assets and liabilities as of June 30, 2020 is included at the end of the Portfolio of Investments.
The Portfolio may use third-party vendor evaluations, whose prices may be derived from one or more of the following standard inputs, among others:
| | |
• Broker/dealer quotes | | • Benchmark securities |
• Two-sided markets | | • Reference data (corporate actions or material event notices) |
• Bids/offers | | • Monthly payment information |
• Industry and economic events | | • Reported trades |
An asset or liability for which market values cannot be measured using the methodologies described above is valued by methods deemed reasonable in good faith by the Valuation Committee, following the procedures established by the Board, to represent fair value. Under these procedures, the Portfolio generally uses a market-based approach which may use related or comparable assets or liabilities, recent transactions, market multiples, book values and other relevant information. The Portfolio may also use an income-based valuation approach in which the anticipated future cash flows of the asset or liability are discounted to calculate fair value. Discounts may also be applied due to the nature and/or duration of any restrictions on the disposition of the asset or liability. Fair value represents a good faith approximation of the value of a security. Fair value determinations involve the consideration of a number of subjective factors, an analysis of applicable facts and circumstances and the exercise of judgment. As a result, it is possible that the fair value for a security determined in good faith in accordance with the Portfolio’s valuation procedures may differ from valuations for the same security determined by other funds using their own valuation procedures. Although the Portfolio’s valuation procedures are designed to value a security at the price the Portfolio may reasonably expect to receive upon the security’s sale in an orderly transaction, there can be no assurance that any fair value determination thereunder would, in fact, approximate the amount that the Portfolio would actually realize upon the sale of the security or the price at which the security would trade if a reliable market price were readily available. During the six-month period ended June 30, 2020, there were no material changes to the fair value methodologies.
Securities which may be valued in this manner include, but are not limited to: (i) a security for which trading has been halted or suspended; (ii) a debt security that has recently gone into default and for which there is not a current market quotation; (iii) a security of an issuer that
has entered into a restructuring; (iv) a security that has been delisted from a national exchange; (v) a security for which the market price is not readily available from a third-party pricing source or, if so provided, does not, in the opinion of the Manager or the Subadvisor, reflect the security’s market value; (vi) a security subject to trading collars for which no or limited trading takes place; and (vii) a security whose principal market has been temporarily closed at a time when, under normal conditions, it would be open. Securities valued in this manner are generally categorized as Level 3 in the hierarchy. As of June 30, 2020, no securities held by the Portfolio were fair valued in such a manner.
Equity securities are valued at the last quoted sales prices as of the close of regular trading on the relevant exchange on each valuation date. Securities that are not traded on the valuation date are valued at the mean of the last quoted bid and ask prices. Prices are normally taken from the principal market in which each security trades. These securities are generally categorized as Level 1 in the hierarchy.
Investments in mutual funds, including money market funds, are valued at their respective NAVs as of the close of the Exchange on the valuation date. These securities are generally categorized as Level 1 in the hierarchy.
Temporary cash investments acquired in excess of 60 days to maturity at the time of purchase are valued using the latest bid prices or using valuations based on a matrix system (which considers such factors as security prices, yields, maturities and ratings), both as furnished by independent pricing services. Temporary cash investments that mature in 60 days or less at the time of purchase (“Short-Term Investments”) are valued using the amortized cost method of valuation, unless the use of such method would be inappropriate. The amortized cost method involves valuing a security at its cost on the date of purchase and thereafter assuming a constant amortization to maturity of the difference between such cost and the value on maturity date. Amortized cost approximates the current fair value of a security. Securities valued using the amortized cost method are not valued using quoted prices in an active market and are generally categorized as Level 2 in the hierarchy.
The information above is not intended to reflect an exhaustive list of the methodologies that may be used to value portfolio investments. The valuation procedures permit the use of a variety of valuation methodologies in connection with valuing portfolio investments. The methodology used for a specific type of investment may vary based on the market data available or other considerations. The methodologies summarized above may not represent the specific means by which portfolio investments are valued on any particular business day.
(B) Income Taxes. The Portfolio’s policy is to comply with the requirements of the Internal Revenue Code of 1986, as amended (the “Internal Revenue Code”), applicable to regulated investment companies and to distribute all of its taxable income to the shareholders of the Portfolio within the allowable time limits.
The Manager evaluates the Portfolio’s tax positions to determine if the tax positions taken meet the minimum recognition threshold in connection with accounting for uncertainties in income tax positions taken or expected to be taken for the purposes of measuring and recognizing tax liabilities in the financial statements. Recognition of tax benefits of an uncertain tax position is permitted only to the extent the position is
Notes to Financial Statements (Unaudited) (continued)
“more likely than not” to be sustained assuming examination by taxing authorities. The Manager analyzed the Portfolio’s tax positions taken on federal, state and local income tax returns for all open tax years (for up to three tax years) and has concluded that no provisions for federal, state and local income tax are required in the Portfolio’s financial statements. The Portfolio’s federal, state and local income tax and federal excise tax returns for tax years for which the applicable statutes of limitations have not expired are subject to examination by the Internal Revenue Service and state and local departments of revenue.
(C) Dividends and Distributions to Shareholders. Dividends and distributions are recorded on the ex-dividend date. The Portfolio intends to declare and pay dividends from net investment income and distributions from net realized capital and currency gains, if any, at least annually. Unless a shareholder elects otherwise, all dividends and distributions are reinvested at NAV in the same class of shares of the Portfolio. Dividends and distributions to shareholders are determined in accordance with federal income tax regulations and may differ from determinations using GAAP.
(D) Security Transactions and Investment Income. The Portfolio records security transactions on the trade date. Realized gains and losses on security transactions are determined using the identified cost method. Dividend income is recognized on the ex-dividend date, net of any foreign tax withheld at the source, and interest income is accrued as earned using the effective interest rate method. Distributions received from real estate investment trusts may be classified as dividends, capital gains and/or return of capital.
Investment income and realized and unrealized gains and losses on investments of the Portfolio are allocated pro rata to the separate classes of shares based upon their relative net assets on the date the income is earned or realized and unrealized gains and losses are incurred.
(E) Expenses. Expenses of the Fund are allocated to the individual Portfolios in proportion to the net assets of the respective Portfolios when the expenses are incurred, except where direct allocations of expenses can be made. Expenses (other than fees incurred under the distribution and service plans, further discussed in Note 3(B), which are charged directly to the Service Class shares) are allocated to separate classes of shares pro rata based upon their relative net assets on the date the expenses are incurred. The expenses borne by the Portfolio, including those of related parties to the Portfolio, are shown in the Statement of Operations.
Additionally, the Portfolio may invest in ETFs and mutual funds, which are subject to management fees and other fees that may cause the costs of investing in ETFs and mutual funds to be greater than the costs of owning the underlying securities directly. These indirect expenses of ETFs and mutual funds are not included in the amounts shown as expenses in the Portfolio’s Statement of Operations or in the expense ratios included in the Financial Highlights.
(F) Use of Estimates. In preparing financial statements in conformity with GAAP, the Manager makes estimates and assumptions that affect the reported amounts and disclosures in the financial statements. Actual results could differ from those estimates.
(G) Repurchase Agreements. The Portfolio may enter into repurchase agreements (i.e., buy a security from another party with the agreement that it will be sold back in the future) to earn income. The Portfolio may enter into repurchase agreements only with counterparties, usually financial institutions, that are deemed by the Manager or the Subadvisor to be creditworthy, pursuant to guidelines established by the Board. During the term of any repurchase agreement, the Manager or the Subadvisor will continue to monitor the creditworthiness of the counterparty. Under the 1940 Act, repurchase agreements are considered to be collateralized loans by the Portfolio to the counterparty secured by the securities transferred to the Portfolio.
Repurchase agreements are subject to counterparty risk, meaning the Portfolio could lose money by the counterparty’s failure to perform under the terms of the agreement. The Portfolio mitigates this risk by ensuring the repurchase agreement is collateralized by cash, U.S. government securities, fixed income securities and/or other securities. The collateral is held by the Portfolio’s custodian and valued daily on a mark to market basis to determine if the value, including accrued interest, exceeds the repurchase price. In the event of the counterparty’s default on the obligation to repurchase, the Portfolio has the right to liquidate the collateral and apply the proceeds in satisfaction of the obligation. Under certain circumstances, such as in the event of default or bankruptcy by the counterparty, realization and/or retention of the collateral may be limited or subject to delay, to legal proceedings and possible realized loss to the Portfolio. As of June 30, 2020, the Portfolio did not hold any repurchase agreements.
(H) Securities Lending. In order to realize additional income, the Portfolio may engage in securities lending, subject to the limitations set forth in the 1940 Act and relevant guidance by the staff of the Securities and Exchange Commission (“SEC”). If the Portfolio engages in securities lending, the Portfolio will lend through its custodian, currently State Street Bank and Trust Company (“State Street”), acting as securities lending agent on behalf of the Portfolio. Under the current arrangement, State Street will manage the Portfolio’s collateral in accordance with the securities lending agency agreement between the Portfolio and State Street, and indemnify the Portfolio against counterparty risk. The loans will be collateralized by cash (which may be invested in a money market fund) and/or non-cash collateral (which may include U.S. Treasury securities and/or U.S. government agency securities issued or guaranteed by the United States government or its agencies or instrumentalities) at least equal at all times to the market value of the securities loaned. The Portfolio bears the risk of delay in recovery of, or loss of rights in, the securities loaned. The Portfolio may also record a realized gain or loss on securities deemed sold due to a borrower’s inability to return securities on loan. The Portfolio bears the risk of any loss on investment of cash collateral. The Portfolio will receive compensation for lending its securities in the form of fees or it will retain a portion of interest earned on the investment of any cash collateral. The Portfolio will also continue to receive interest and dividends on the securities loaned and any gain or loss in the market price of the securities loaned that may occur during the term of the loan will be for the account of the Portfolio. Income earned from securities lending activities, if any, is reflected in the Statement of Operations. As of June 30, 2020, the Portfolio had securities on loan with an aggregate market value of $5,410,842; the total market value of collateral held by the
| | |
| 20 | | MainStay VP Epoch U.S. Equity Yield Portfolio |
Portfolio was $5,586,518. The market value of the collateral held included non-cash collateral, in the form of U.S. Treasury securities, with a value of $5,478,518 and cash collateral, which was invested into the State Street Navigator Securities Lending Government Money Market Portfolio, with a value of $108,000.
(I) Indemnifications. Under the Fund’s organizational documents, its officers and trustees are indemnified against certain liabilities that may arise out of performance of their duties to the Fund. Additionally, in the normal course of business, the Portfolio enters into contracts with third-party service providers that contain a variety of representations and warranties and that may provide general indemnifications. The Portfolio’s maximum exposure under these arrangements is unknown, as this would involve future claims that may be made against the Portfolio that have not yet occurred. The Manager believes that the risk of loss in connection with these potential indemnification obligations is remote. However, there can be no assurance that material liabilities related to such obligations will not arise in the future, which could adversely impact the Portfolio.
Note 3–Fees and Related Party Transactions
(A) Manager and Subadvisor. New York Life Investments, a registered investment adviser and an indirect, wholly-owned subsidiary of New York Life, serves as the Portfolio’s Manager pursuant to an Amended and Restated Management Agreement (“Management Agreement”). The Manager provides offices, conducts clerical, recordkeeping and bookkeeping services, and keeps most of the financial and accounting records required to be maintained by the Portfolio. Except for the portion of salaries and expenses that are the responsibility of the Portfolio, the Manager pays the salaries and expenses of all personnel affiliated with the Portfolio and certain operational expenses of the Portfolio. The Portfolio reimburses New York Life Investments in an amount equal to the portion of the compensation of the Chief Compliance Officer attributable to the Portfolio. Epoch Investment Partners, Inc. (“Epoch” or the “Subadvisor”), a registered investment adviser, serves as Subadvisor to the Portfolio and is responsible for the day-to-day portfolio management of the Portfolio. Pursuant to the terms of an Amended and Restated Subadvisory Agreement (“Subadvisory Agreement”) between New York Life Investments and Epoch, New York Life Investments pays for the services of the Subadvisor.
The Fund, on behalf of the Portfolio, pays New York Life Investments in its capacity as the Portfolio’s investment manager and administrator, pursuant to the Management Agreement, a monthly fee for the services performed and the facilities furnished at an annual rate of the Portfolio’s average daily net assets. The Fund, on behalf of the Portfolio, pays New York Life Investments at the rate of 0.70% up to $500 million; 0.68% from $500 million to $1 billion; 0.66% from $1 billion to $2 billion; and 0.65% on assets over $2 billion. During the six-month period ended June 30, 2020, the effective management fee rate was 0.69% (exclusive of any applicable waivers/reimbursements).
New York Life Investments has contractually agreed to waive fees and/or reimburse expenses so that Total Annual Portfolio Operating Expenses (excluding taxes, interest, litigation, extraordinary expenses, brokerage and other transaction expenses relating to the purchase or sale of portfolio investments, and acquired (underlying) portfolio/fund fees and expenses) of Service Class shares do not exceed 0.93% of the Portfolio’s average daily net assets. New York Life Investments will apply an equivalent waiver or reimbursement to Initial Class shares. This agreement will remain in effect until May 1, 2021, and shall renew automatically for one-year terms unless New York Life Investments provides written notice of termination prior to the start of the next term or upon approval of the Board.
During the six-month period ended June 30, 2020, New York Life Investments earned fees from the Portfolio in the amount of $3,144,150 and waived fees/reimbursed expenses in the amount of $196,625.
State Street provides sub-administration and sub-accounting services to the Portfolio pursuant to an agreement with New York Life Investments. These services include calculating the daily NAVs of the Portfolio, maintaining the general ledger and sub-ledger accounts for the calculation of the Portfolio’s NAVs and assisting New York Life Investments in conducting various aspects of the Portfolio’s administrative operations. For providing these services to the Portfolio, State Street is compensated by New York Life Investments.
Pursuant to an agreement between the Fund and New York Life Investments, New York Life Investments is responsible for providing or procuring certain regulatory reporting services for the Portfolio. The Portfolio will reimburse New York Life Investments for the actual costs incurred by New York Life Investments in connection with providing or procuring these services for the Portfolio.
(B) Distribution and Service Fees. The Fund, on behalf of the Portfolio, has entered into a distribution agreement with NYLIFE Distributors LLC (the “Distributor”), an indirect, wholly-owned subsidiary of New York Life. The Portfolio has adopted a distribution plan (the “Plan”) in accordance with the provisions of Rule 12b-1 under the 1940 Act. Under the Plan, the Distributor has agreed to provide, through its affiliates or independent third parties, various distribution-related, shareholder and administrative support services to the Service Class shareholders. For its services, the Distributor is entitled to a combined distribution and service fee accrued daily and paid monthly at an annual rate of 0.25% of the average daily net assets attributable to the Service Class shares of the Portfolio.
Notes to Financial Statements (Unaudited) (continued)
(C) Investments in Affiliates (in 000’s). During the six-month period ended June 30, 2020, purchases and sales transactions, income earned from investments and shares held of investment companies managed by New York Life Investments or its affiliates were as follows:
| | | | | | | | | | | | | | | | | | |
Affiliated Investment
Company | | Value,
Beginning
of Period | | Purchases
at Cost | | Proceeds
from Sales | | Net Realized
Gain/(Loss)
on Sales | | Change in
Unrealized
Appreciation/
(Depreciation) | | Value, End
of Period | | Dividend
Income | | Other
Distributions | | Shares
End of
Period |
| | | | | | | | | |
MainStay U.S. Government Liquidity Fund | | $20,306 | | $75,057 | | $(74,016) | | $— | | $— | | $21,347 | | $53 | | $— | | 21,347 |
Note 4–Federal Income Tax
As of June 30, 2020, the cost and unrealized appreciation (depreciation) of the Portfolio’s investment portfolio, including applicable derivative contracts and other financial instruments, as determined on a federal income tax basis, was as follows:
| | | | | | | | |
| | | Federal Tax Cost | | Gross
Unrealized
Appreciation | | Gross
Unrealized
(Depreciation) | | Net
Unrealized
Appreciation/
(Depreciation) |
| | | | |
Investments in Securities | | $863,142,062 | | $110,713,691 | | $(94,411,965) | | $16,301,726 |
During the year ended December 31, 2019, the tax character of distributions paid as reflected in the Statements of Changes in Net Assets was as follows:
| | |
|
| 2019 |
Tax-Based Distributions
from Ordinary Income | | Tax-Based Distributions from Long-Term Gains |
| |
| $37,871,466 | | $33,106,906 |
Note 5–Custodian
State Street is the custodian of cash and securities held by the Portfolio. Custodial fees are charged to the Portfolio based on the Portfolio’s net assets and/or the market value of securities held by the Portfolio and the number of certain transactions incurred by the Portfolio.
Note 6–Line of Credit
The Portfolio and certain other funds managed by New York Life Investments maintain a line of credit with a syndicate of banks in order to secure a source of funds for temporary purposes to meet unanticipated or excessive redemption requests.
Effective July 28, 2020, under the credit agreement (the “Credit Agreement”), the aggregate commitment amount is $600,000,000 with an additional uncommitted amount of $100,000,000. The commitment fee is an annual rate of 0.15% of the average commitment amount payable quarterly, regardless of usage, to JP Morgan Chase Bank NA, who serves as the agent to the syndicate. The commitment fee is allocated among the Portfolio and certain other funds managed by New York Life Investments based upon their respective net assets and other
factors. Interest on any revolving credit loan is charged based upon the Federal Funds Rate or the one-month London Interbank Offered Rate (“LIBOR”), whichever is higher. The Credit Agreement expires on July 27, 2021, although the Portfolio, certain other funds managed by New York Life Investments and the syndicate of banks may renew the Credit Agreement for an additional year on the same or different terms or enter into a credit agreement with a different syndicate of banks. Prior to July 28, 2020, the aggregate commitment amount and the commitment fee were the same as those under the current Credit Agreement. During the six-month period ended June 30, 2020, there were no borrowings made or outstanding with respect to the Portfolio under the Credit Agreement.
Note 7–Interfund Lending Program
Pursuant to an exemptive order issued by the SEC, the Portfolio, along with certain other funds managed by New York Life Investments, may participate in an interfund lending program. The interfund lending program provides an alternative credit facility that permits the Portfolio and certain other funds managed by New York Life Investments to lend or borrow money for temporary purposes directly to or from one another subject to the conditions of the exemptive order. During the six-month period ended June 30, 2020, there were no interfund loans made or outstanding with respect to the Portfolio.
Note 8–Purchases and Sales of Securities (in 000’s)
During the six-month period ended June 30, 2020, purchases and sales of securities, other than short-term securities, were $ 157,984 and $ 167,051, respectively.
| | |
| 22 | | MainStay VP Epoch U.S. Equity Yield Portfolio |
Note 9–Capital Share Transactions
Transactions in capital shares for the six-month period ended June 30, 2020 and the year ended December 31, 2019, were as follows:
| | | | | | | | |
Initial Class | | Shares | | | Amount | |
Six-month period ended June 30, 2020: | | | | | | | | |
Shares sold | | | 682,566 | | | $ | 9,744,523 | |
Shares redeemed | | | (1,174,567 | ) | | | (16,771,253 | ) |
| | | | | | | | |
Net increase (decrease) | | | (492,001 | ) | | $ | (7,026,730 | ) |
| | | | | | | | |
Year ended December 31, 2019: | | | | | | | | |
Shares sold | | | 4,092,676 | | | $ | 64,745,845 | |
Shares issued to shareholders in reinvestment of distributions | | | 2,591,742 | | | | 39,107,129 | |
Shares redeemed | | | (9,201,187 | ) | | | (144,241,738 | ) |
| | | | | | | | |
Net increase (decrease) | | | (2,516,769 | ) | | $ | (40,388,764 | ) |
| | | | | | | | |
| | |
| | | | | | | | |
Service Class | | Shares | | | Amount | |
Six-month period ended June 30, 2020: | | | | | | | | |
Shares sold | | | 1,425,707 | | | $ | 19,262,461 | |
Shares redeemed | | | (2,257,424 | ) | | | (31,551,081 | ) |
| | | | | | | | |
Net increase (decrease) | | | (831,717 | ) | | $ | (12,288,620 | ) |
| | | | | | | | |
Year ended December 31, 2019: | | | | | | | | |
Shares sold | | | 1,367,949 | | | $ | 21,140,805 | |
Shares issued to shareholders in reinvestment of distributions | | | 2,141,971 | | | | 31,871,243 | |
Shares redeemed | | | (5,755,158 | ) | | | (88,804,510 | ) |
| | | | | | | | |
Net increase (decrease) | | | (2,245,238 | ) | | $ | (35,792,462 | ) |
| | | | | | | | |
Note 10–Recent Accounting Pronouncement
In March 2020, the Financial Accounting Standards Board (“FASB”) issued Accounting Standards Update 2020-04 (“ASU 2020-04”), which provides optional guidance to ease the potential accounting burden associated with transitioning away from LIBOR and other reference rates that are expected to be discontinued. ASU 2020-04 is effective immediately upon release of the update on March 12, 2020 through December 31, 2022. At this time, the Manager is evaluating the implications of certain other provisions of ASU 2020-04 related to new disclosure requirements and any impact on the financial statement disclosures has not yet been determined.
Note 11–Subsequent Events
In connection with the preparation of the financial statements of the Portfolio as of and for the six-month period ended June 30, 2020, events and transactions subsequent to June 30, 2020, through the date the financial statements were issued have been evaluated by the Manager, for possible adjustment and/or disclosure. No subsequent events requiring financial statement adjustment or disclosure have been identified.
Note 12–Other Matters
An outbreak of COVID-19, first detected in December 2019, has developed into a global pandemic and has resulted in travel restrictions, closure of international borders, certain businesses and securities markets, restrictions on securities trading activities, prolonged quar-
antines, supply chain disruptions, and lower consumer demand, as well as general concern and uncertainty. The continued impact of COVID-19 is uncertain and could further adversely affect the global economy, national economies, individual issuers and capital markets in unforeseeable ways and result in a substantial and extended economic downturn. Developments that disrupt global economies and financial markets, such as COVID-19, may magnify factors that affect the Portfolio’s performance.
Discussion of the Operation and Effectiveness of the Portfolio’s
Liquidity Risk Management Program (Unaudited)
In compliance with Rule 22e-4 under the Investment Company Act of 1940, as amended (the “Liquidity Rule”), the Portfolio has adopted and implemented a liquidity risk management program (the “Program”), which New York Life Investment Management LLC believes is reasonably designed to assess and manage the Portfolio’s liquidity risk. The Board designated New York Life Investment Management LLC as administrator of the Program (the “Administrator”). The Administrator has established a Liquidity Risk Management Committee to assist the Administrator in the implementation and day-to-day administration of the Program and to otherwise support the Administrator in fulfilling its responsibilities under the Program.
At a meeting of the Board held on March 11, 2020, the Administrator provided the Board with a written report addressing the Program’s operation, adequacy and effectiveness of implementation for the period from December 1, 2018 through December 31, 2019, as required under the Liquidity Rule. The report noted that the Administrator concluded that (i) the Program operated effectively to assess and manage the Portfolio’s liquidity risk, (ii) the Program has been adequately and effectively implemented to monitor and, as applicable, respond to the Portfolio’s liquidity developments and (iii) the Portfolio’s investment strategy continues to be appropriate for an open-end portfolio.
In accordance with the Program, the Portfolio’s liquidity risk is assessed no less frequently than annually taking into consideration certain factors, as applicable, such as (i) investment strategy and liquidity of portfolio investments, (ii) short-term and long-term cash flow projections and (iii) holdings of cash and cash equivalents and borrowing arrangements and other funding sources. Certain factors are considered under both normal and reasonably foreseeable stressed conditions.
Each Portfolio portfolio investment is classified into one of four liquidity categories. The classification is based on a determination of the number of days it is reasonably expected to take to convert the investment into cash, or sell or dispose of the investment, in current market conditions without significantly changing the market value of the investment. The Administrator has delegated liquidity classification determinations to the Portfolio’s subadvisor, subject to appropriate oversight by the Administrator, and classification determinations are made by taking into account the Portfolio’s reasonably anticipated trade size, various market, trading and investment-specific considerations, as well as market depth, and, in certain cases, third-party vendor data.
The Liquidity Rule requires portfolios that do not primarily hold assets that are highly liquid investments to adopt a minimum amount of net assets that must be invested in highly liquid investments that are assets (an “HLIM”). In addition, the Liquidity Rule limits a portfolio’s investments in illiquid investments. Specifically, the Liquidity Rule prohibits acquisition of illiquid investments if doing so would result in a portfolio holding more than 15% of its net assets in illiquid investments that are assets. The Program includes provisions reasonably designed to determine, periodically review and comply with the HLIM requirement, as applicable, and to comply with the 15% limit on illiquid investments.
| | |
| 24 | | MainStay VP Epoch U.S. Equity Yield Portfolio |
Proxy Voting Policies and Procedures and Proxy Voting Record
A description of the policies and procedures that New York Life Investments uses to vote proxies related to the Portfolio’s securities is available free of charge upon request (i) by calling 800-598-2019; (ii) by visiting New York Life Investments’ website at https://www.nylinvestments.com/mainstay/products-and-performance/mainstay-vp-funds-trust; or (iii) by visiting the SEC’s website at www.sec.gov.
The Portfolio is required to file with the SEC its proxy voting record for the 12-month period ending June 30 on Form N-PX. The Portfolio’s most recent Form N-PX or proxy voting record is available free of charge upon request (i) by calling 800-598-2019; (ii) by visiting New York Life Investments’ website at https://www.nylinvestments.com/mainstay/products-and-performance/mainstay-vp-funds-trust; or (iii) by visiting the SEC’s website at www.sec.gov.
Shareholder Reports and Quarterly Portfolio Disclosure
The Portfolio is required to file its complete schedule of portfolio holdings with the SEC 60 days after its first and third fiscal quarter on Form N-PORT. The Portfolio’s holdings report is available free of charge upon request by calling 800-598-2019 or by visiting the SEC’s website at www.sec.gov.
MainStay VP Portfolios
MainStay VP offers a wide range of Portfolios. The full array of MainStay VP offerings is listed here, with information about the manager, subadvisors, legal counsel, and independent registered public accounting firm.
Equity Portfolios
MainStay VP Emerging Markets Equity Portfolio
MainStay VP Epoch U.S. Equity Yield Portfolio
MainStay VP Fidelity Institutional AM® Utilities Portfolio†
MainStay VP MacKay Common Stock Portfolio
MainStay VP MacKay Growth Portfolio
MainStay VP MacKay International Equity Portfolio
MainStay VP MacKay Mid Cap Core Portfolio
MainStay VP MacKay S&P 500 Index Portfolio
MainStay VP MacKay Small Cap Core Portfolio
MainStay VP Mellon Natural Resources Portfolio
MainStay VP Small Cap Growth Portfolio
MainStay VP T. Rowe Price Equity Income Portfolio
MainStay VP Winslow Large Cap Growth Portfolio
Mixed Asset Portfolios
MainStay VP Balanced Portfolio
MainStay VP Income Builder Portfolio
MainStay VP Janus Henderson Balanced Portfolio
MainStay VP MacKay Convertible Portfolio
Income Portfolios
MainStay VP Bond Portfolio
MainStay VP Floating Rate Portfolio
MainStay VP Indexed Bond Portfolio
MainStay VP MacKay Government Portfolio
MainStay VP MacKay High Yield Corporate Bond Portfolio
MainStay VP MacKay Unconstrained Bond Portfolio
MainStay VP PIMCO Real Return Portfolio
Money Market
MainStay VP U.S. Government Money Market Portfolio
Alternative
MainStay VP CBRE Global Infrastructure Portfolio
MainStay VP IQ Hedge Multi-Strategy Portfolio
Asset Allocation Portfolios
MainStay VP Conservative Allocation Portfolio
MainStay VP Growth Allocation Portfolio
MainStay VP Moderate Allocation Portfolio
MainStay VP Moderate Growth Allocation Portfolio
Manager
New York Life Investment Management LLC
New York, New York
Subadvisors
Brown Advisory LLC
Baltimore, Maryland
Candriam Belgium S.A.*
Brussels, Belgium
CBRE Clarion Securities LLC
Radnor, Pennsylvania
Epoch Investment Partners, Inc.
New York, New York
FIAM LLC
Smithfield, Rhode Island
IndexIQ Advisors LLC*
New York, New York
Janus Capital Management LLC
Denver, Colorado
MacKay Shields LLC*
New York, New York
Mellon Investments Corporation
Boston, Massachusetts
NYL Investors LLC*
New York, New York
Pacific Investment Management Company LLC
Newport Beach, California
Segall Bryant & Hamill, LLC
Chicago, Illinois
T. Rowe Price Associates, Inc.
Baltimore, Maryland
Winslow Capital Management, LLC
Minneapolis, Minnesota
Distributor
NYLIFE Distributors LLC*
Jersey City, New Jersey
Custodian
State Street Bank and Trust Company
Boston, Massachusetts
Independent Registered Public Accounting Firm
PricewaterhouseCoopers LLP
New York, New York
Legal Counsel
Dechert LLP
Washington, District of Columbia
Some Portfolios may not be available in all products.
| † | Fidelity Institutional AM is a registered trade mark of FMR LLC. Used with permission. |
| * | An affiliate of New York Life Investment Management LLC |
Not part of the Semiannual Report
2020 Semiannual Report
This report is for the general information of New York Life Variable Annuities and NYLIAC Variable Universal Life Insurance Products policyowners. It must be preceded or accompanied by the appropriate product(s) and funds prospectuses if it is given to anyone who is not an owner of a New York Life variable annuity policy or a NYLIAC Variable Universal Life Insurance Product. This report does not offer for sale or solicit orders to purchase securities.
The performance data quoted in this report represents past performance. Past performance is no guarantee of future results. Due to market volatility and other factors, current performance may be lower or higher than the figures shown. The most recent month-end performance summary for your variable annuity or variable life policy is available by calling 800-598-2019 and is updated periodically on www.newyorklife.com.
The New York Life Variable Annuities and NYLIAC Variable Universal Life Insurance Products are issued by New York Life Insurance and Annuity Corporation (a Delaware Corporation) and distributed by NYLIFE Distributors LLC (Member FINRA/SIPC).
New York Life Insurance Company
New York Life Insurance and Annuity Corporation (NYLIAC) (A Delaware Corporation)
51 Madison Avenue, Room 551
New York, NY 10010
www.newyorklife.com
Printed on recycled paper
nylinvestments.com
NYLIFE Distributors LLC, 30 Hudson Street, Jersey City, NJ 07302
New York Life Investment Management LLC is the investment manager to the MainStay VP Funds Trust
©2020 by NYLIFE Distributors LLC. All rights reserved.
You may obtain copies of the Prospectus and the Statement of Additional Information free of charge, upon request, by calling toll-free 800-598-2019 or writing to New York Life Insurance and Annuity Corporation, 51 Madison Avenue, New York, NY 10010.
| | | | |
| Not FDIC Insured | | No Bank Guarantee | | May Lose Value |
| | | | |
| 1781616 | | | | MSVPEUE10-08/20 (NYLIAC) NI521 |
MainStay VP MacKay International
Equity Portfolio
Message from the President and Semiannual Report
Unaudited | June 30, 2020
Beginning on January 1, 2021, as permitted by regulations adopted by the Securities and Exchange Commission, paper copies of the MainStay VP Portfolio annual and semi-annual shareholder reports may no longer be sent by mail, unless you specifically request paper copies of the reports from the insurance company that offers your policy. Instead, the reports will be made available online, and you will be notified by mail each time a report is posted and provided with a website link to access the report. Instructions for requesting paper copies will be provided by your insurance company.
If you already elected to receive shareholder reports electronically, you will not be affected by this change and you need not take any action. At any time, you may elect to receive reports and other communications from the insurance company electronically by following the instructions provided by the insurance company.
You may elect to receive all future shareholder reports in paper form free of charge. You can inform the insurance company that you wish to receive paper copies of reports by following the instructions provided by the insurance company. Your election to receive reports in paper form will apply to all portfolio companies available under your contract.
| | | | | | | | |
| Not FDIC/NCUA Insured | | Not a Deposit | | May Lose Value | | No Bank Guarantee | | Not Insured by Any Government Agency |

This page intentionally left blank
Message from the President
High levels of volatility shook financial markets in response to the COVID-19 pandemic and an abrupt decline in global economic activity during the six months ended June 30, 2020.
Markets entered 2020 riding strong fourth quarter performance and an economic expansion of historic longevity. Most broad stock and bond indices began to dip in late February as growing numbers of COVID-19 cases were seen in hotspots around the world. On March 11, 2020, the World Health Organization acknowledged that the disease had reached pandemic proportions, with over 80,000 identified cases in China, thousands in Italy, South Korea and the United States, and more in dozens of additional countries. Governments and central banks pledged trillions of dollars to address the mounting economic and public health crisis; however, “stay-at-home” orders and other restrictions on non-essential activity caused global economic activity to slow. Most stocks and bonds lost significant ground in this challenging environment, with equities declining by roughly a third and the yield on high-yield credit indices shooting higher.
Policymakers responded with extraordinary speed to address the situation. In the United States, the Federal Reserve (“Fed”) cut interest rates to near zero and announced unlimited quantitative easing. With help from Treasury, the Fed later rolled out a series of lending facilities to directly support market functioning. In late March, the Federal government declared a national emergency; Congress passed, and the President signed, a $2 trillion CARES Act (The Coronavirus Aid, Relief, and Economic Security Act), with the promise of further assistance for consumers and businesses to come. This enormous wave of policy support helped fuel a rapid recovery in market pricing as stocks bounced back and credit spreads narrowed. Some states rushed to ease restrictions on travel and social gatherings, further fueling optimism that the effects of the pandemic might prove short lived. However, the final weeks of the reporting period saw infection rates beginning to rise in some of the first states to reopen, raising concerns that a second round of restrictive government policies might prove necessary, once again stifling economic activity.
Despite all the market volatility, the broadly based S&P 500® Index finished the first half of 2020 only slightly below its starting point and the technology-heavy NASDAQ Composite Index posted gains, closing in near record territory. Small-cap stocks tended to trail their large cap counterparts, as illustrated by the Russell 2000® Index’s loss of approximately 15%, while value-oriented stocks lagged growth-oriented issues. From a global perspective, U.S. stocks generally outperformed international equities, with emerging markets hit particularly hard by the flight from risk.
Fixed-income markets also experienced unusually high levels of volatility. Recognized safe havens, such as U.S. government bonds, attracted increased investment, driving yields lower and prices higher, positioning long-term Treasury bonds to deliver particularly strong gains. Investment-grade corporate bonds lost value in March before recovering in the closing months of the reporting period, while relatively speculative high-yield credit faced the brunt of risk-off sentiment. Emerging market debt underperformed most other bonds types as investors sought to minimize currency and sovereign risks.
Today, as we at New York Life Investments continue to track the ongoing health crisis and its financial ramifications, we are particularly mindful of the people at the heart of our enterprise—our colleagues and valued clients. By taking appropriate steps to minimize community spread of COVID-19 within our organization, we strive to safeguard the health of our investment professionals so they can continue to provide you, as a MainStay investor, with world class investment solutions in this rapidly evolving environment.
Sincerely,

Kirk C. Lehneis
President
The opinions expressed are as of the date of this report and are subject to change. There is no guarantee that any forecast made will come to pass. This material does not constitute investment advice and is not intended as an endorsement of any specific investment. Past performance is no guarantee of future results.
Not part of the Semiannual Report
Table of Contents
Investors should refer to the Portfolio’s Summary Prospectus and/or Prospectus and consider the Portfolio’s investment objectives, strategies, risks, charges and expenses carefully before investing. The Summary Prospectus and/or Prospectus contain this and other information about the Portfolio. You may obtain copies of the Portfolio’s Summary Prospectus and/or the Prospectus and the Statement of Additional Information free of charge, upon request, by calling toll-free 800-598-2019, by writing to New York Life Insurance and Annuity Corporation, 51 Madison Avenue, Room 251, New York, New York 10010 or by sending an email to MainStayShareholdersServices@nylim.com. These documents are also available at nylinvestments.com/vpdocuments. Please read the Summary Prospectus and/or Prospectus carefully before investing. MainStay VP Funds Trust portfolios are separate account options which are purchased through a variable insurance or variable annuity contract.
Investment and Performance Comparison1 (Unaudited)
Performance data quoted represents past performance. Past performance is no guarantee of future results. Because of market volatility and other factors, current performance may be lower or higher than the figures shown. Investment return and principal value will fluctuate, and as a result, when shares are redeemed, they may be worth more or less than their original cost. The performance table and graph do not reflect any deduction of sales charges, mortality and expense charges, contract charges or administrative charges. Please refer to the Performance Summary appropriate for your policy. For performance information current to the most recent month-end, please call 800-598-2019 or visit www.newyorklife.com.
Average Annual Total Returns for the Period-Ended June 30, 2020
| | | | | | | | | | | | | | | | | | | | | | |
| Class | | Inception Date | | Six Months | | | One Year | | | Five Years | | | Ten Years | | | Gross
Expense
Ratio2 | |
| | | | | | |
| Initial Class Shares | | 5/1/1995 | | | –4.12 | % | | | 6.20 | % | | | 6.03 | % | | | 6.70 | % | | | 0.96 | % |
| Service Class Shares | | 6/5/2003 | | | –4.24 | | | | 5.94 | | | | 5.77 | | | | 6.43 | | | | 1.21 | |
| | | | | | | | | | | | | | | | |
| Benchmark Performance | | Six
Months | | | One
Year | | | Five
Years | | | Ten
Years | |
| | | | |
MSCI ACWI® Ex U.S. Index3 | | | –11.00 | % | | | –4.80 | % | | | 2.26 | % | | | 4.97 | % |
MSCI EAFE® Index4 | | | –11.34 | | | | –5.13 | | | | 2.05 | | | | 5.73 | |
Morningstar Foreign Large Growth Category Average5 | | | –1.60 | | | | 6.44 | | | | 5.58 | | | | 7.79 | |
| 1. | Performance figures may reflect certain fee waivers and/or expense limitations, without which total returns may have been different. For information on current fee waivers and/or expense limitations (if any), please refer to the Notes to Financial Statements. |
| 2. | The gross expense ratios presented reflect the Portfolio’s “Total Annual Portfolio Operating Expenses” from the most recent Prospectus, as supplemented, and may differ from other expense ratios disclosed in this report. |
| 3. | The Portfolio has selected the MSCI ACWI® (All Country World Index) Ex U.S. Index as its primary broad-based securities market index. The MSCI ACWI® Ex U.S. Index is a free float-adjusted market capitalization weighted index that is designed to measure the equity market performance of developed and emerging markets, excluding the U.S. Results assume reinvestment of all dividends and capital gains. An investment cannot be made directly in an index. |
| 4. | The MSCI EAFE® Index is the Portfolio’s secondary benchmark. The MSCI EAFE® Index consists of international stocks representing the developed world outside of North America. Results assume reinvestment of all dividends and capital gains. An investment cannot be made directly in an index. |
| 5. | The Morningstar Foreign Large Growth Category Average is representative of funds that focus on high-priced growth stocks, mainly outside of the United States. Most of these funds divide their assets among a dozen or more developed markets, including Japan, Britain, France, and Germany. These funds primarily invest in stocks that have market caps in the top 70% of each economically integrated market and will have less than 20% of assets invested in U.S. stocks. Results are based on average total returns of similar funds with all dividends and capital gain distributions reinvested. |
Cost in Dollars of a $1,000 Investment in MainStay VP MacKay International Equity Portfolio (Unaudited)
The example below is intended to describe the fees and expenses borne by shareholders during the six-month period from January 1, 2020, to June 30, 2020, and the impact of those costs on your investment.
Example
As a shareholder of the Portfolio you incur two types of costs: (1) transaction costs, including exchange fees and sales charges (loads) on purchases (as applicable), and (2) ongoing costs, including management fees, distribution and/or service (12b-1) fees, and other Portfolio expenses (as applicable). This example is intended to help you understand your ongoing costs (in dollars) of investing in the Portfolio and to compare these costs with the ongoing costs of investing in other mutual funds. The example is based on an investment of $1,000 made at the beginning of the six-month period and held for the entire period from January 1, 2020, to June 30, 2020. Shares are only sold in connection with variable life and annuity contracts and the example does not reflect any contract level or transactional fees or expenses. If these costs had been included, your costs would have been higher.
This example illustrates your Portfolio’s ongoing costs in two ways:
Actual Expenses
The second and third data columns in the table below provide information about actual account values and actual expenses. You may use the information in these columns, together with the amount you invested, to estimate the expenses that you paid during the six months
ended June 30, 2020. Simply divide your account value by $1,000 (for example, an $8,600 account value divided by $1,000 = 8.6), then multiply the result by the number under the heading entitled “Expenses Paid During Period” to estimate the expenses you paid on your account during this period.
Hypothetical Example for Comparison Purposes
The fourth and fifth data columns in the table below provide information about hypothetical account values and hypothetical expenses based on the Portfolio’s actual expense ratio and an assumed rate of return of 5% per year before expenses, which is not the Portfolio’s actual return. The hypothetical account values and expenses may not be used to estimate the actual ending account balances or expenses you paid for the six-month period shown. You may use this information to compare the ongoing costs of investing in the Portfolio with the ongoing costs of investing in other mutual funds. To do so, compare this 5% hypothetical example with the 5% hypothetical examples that appear in the shareholder reports of the other mutual funds.
Please note that the expenses shown in the table are meant to highlight your ongoing costs only and do not reflect any transactional costs, such as exchange fees or sales charges (loads). Therefore, the fourth and fifth data columns of the table are useful in comparing ongoing costs only and will not help you determine the relative total costs of owning different funds. In addition, if these transactional costs were included, your costs would have been higher.
| | | | | | | | | | | | | | | | | | | | | | |
| | | | | | | | | | | | | | | | | | |
| Share Class | | Beginning
Account
Value
1/1/20 | | | Ending Account
Value (Based
on Actual
Returns and
Expenses)
6/30/20 | | | Expenses
Paid
During
Period1 | | | Ending Account
Value (Based
on Hypothetical
5% Annualized
Return and
Actual Expenses)
6/30/20 | | | Expenses
Paid
During
Period1 | | | Net Expense
Ratio
During
Period2 |
| | | | | | |
| Initial Class Shares | | $ | 1,000.00 | | | $ | 958.80 | | | $ | 4.68 | | | $ | 1,020.09 | | | $ | 4.82 | | | 0.96% |
| | | | | | |
| Service Class Shares | | $ | 1,000.00 | | | $ | 957.60 | | | $ | 5.89 | | | $ | 1,018.85 | | | $ | 6.07 | | | 1.21% |
| 1 | Expenses are equal to the Portfolio’s annualized expense ratio of each class multiplied by the average account value over the period, divided by 366 and multiplied by 182 (to reflect the six-month period). The table above represents the actual expenses incurred during the six-month period. In addition to the fees and expenses which the Portfolio bears directly, it also indirectly bears a pro rata share of the fees and expenses of the underlying funds in which it invests. Such indirect expenses are not included in the above-reported expense figures. |
| 2 | Expenses are equal to the Portfolio’s annualized expense ratio to reflect the six-month period. |
| | |
| 6 | | MainStay VP MacKay International Equity Portfolio |
Country Composition as of June 30, 2020 (Unaudited)
| | | | |
| |
| United Kingdom | | | 18.0 | % |
| |
| Germany | | | 11.6 | |
| |
| Japan | | | 8.3 | |
| |
| Netherlands | | | 7.3 | |
| |
| France | | | 7.1 | |
| |
| Ireland | | | 6.9 | |
| |
| Switzerland | | | 5.6 | |
| |
| India | | | 5.4 | |
| |
| Spain | | | 5.4 | |
| |
| China | | | 3.8 | |
| |
| Sweden | | | 3.5 | |
| | | | |
| |
| Denmark | | | 3.3 | % |
| |
| Taiwan | | | 2.8 | |
| |
| United States | | | 2.6 | |
| |
| Brazil | | | 1.4 | |
| |
| Argentina | | | 1.1 | |
| |
| Canada | | | 1.0 | |
| |
| Israel | | | 1.0 | |
| |
| Mexico | | | 0.9 | |
| |
| Other Assets, Less Liabilities | | | 3.0 | |
| | | | |
| |
| | | 100.0 | % |
| | | | |
See Portfolio of Investments beginning on page 9 for specific holdings within these categories. The Portfolio’s holdings are subject to change.
Top Ten Holdings as of June 30, 2020 (excluding short-term investments) (Unaudited)
| 2. | Koninklijke Philips N.V. |
| 7. | Novo Nordisk A/S, Class B |
Portfolio Management Discussion and Analysis (Unaudited)
Questions answered by portfolio managers Carlos Garcia-Tunon, CFA, Ian Murdoch, CFA, and Lawrence Rosenberg, CFA, of MacKay Shields LLC, the Portfolio’s Subadvisor.
How did MainStay VP MacKay International Equity Portfolio perform relative to its benchmarks and peers during the six months ended June 30, 2020?
For the six months ended June 30, 2020, MainStay VP MacKay International Equity Portfolio returned –4.12% for Initial Class shares and –4.24% for Service Class shares. Over the same period, both share classes outperformed the –11.00% return of the MSCI ACWI® Ex U.S. Index, which is the Portfolio’s primary benchmark, and the –11.34% return of the MSCI EAFE® Index, which is a secondary benchmark of the Portfolio. For the six months ended June 30, 2020, both share classes underperformed the –1.60% return of the Morningstar Foreign Large Growth Category Average.1
During the reporting period, were there any market events that materially impacted the Fund’s performance or liquidity?
During the reporting period, the COVID-19 pandemic emerged as an unprecedented threat to global health and economic stability. This event incited one of the sharpest historic declines in markets for risk assets followed by an almost equally strong recovery. Notwithstanding such extreme volatility, the Portfolio’s relative performance and liquidity both held up well on both slopes of the valley.
What factors affected the Portfolio’s relative performance during the reporting period?
The Portfolio’s performance relative to the MSCI ACWI® Ex U.S. Index held up well against the extreme volatility experienced in the reporting period. However, the Portfolio was not immune from the global attributes of the pandemic. Select equities owned in the Portfolio that had previously demonstrated defensiveness against exogenous shocks proved vulnerable to the distinctive challenges posed by the pandemic on the global economy.
Which sectors were the strongest positive contributors to the Portfolio’s relative performance, and which sectors were particularly weak?
During the reporting period, the strongest positive contributors to the Portfolio’s benchmark-relative performance were the communication services, health care and industrials sectors.
(Contributions take weightings and total returns into account.)
During the same period, the weakest contributors to benchmark-relative performance were the consumer discretionary, real estate and utilities sectors.
During the reporting period, which individual stocks made the strongest positive contributions to the Portfolio’s absolute performance and which stocks detracted the most?
The strongest positive contributions to the Portfolio’s absolute performance during the reporting period came from Swiss contract development and manufacturing organization (CDMO) Lonza Group, Chinese Internet value-added service provider Tencent and Japanese Internet-based services provider CyberAgent. The top three detractors in terms of absolute contribution were U.K.-domiciled multinational food caterer Compass Group, Indian corporate and retail banking group HDFC Bank, and Mexican client-focused bank Regional.
Did the Portfolio make any significant purchases or sales during the reporting period?
The Portfolio’s most substantial initial purchase during the reporting period was shares of German enterprise software provider SAP, while the largest increase in position size was in U.K.-domiciled global life insurer Prudential. The Portfolio’s largest full sale during the same period was in U.K. specialty chemicals company Johnson Matthey, while the largest decreased position size was in Japanese household products creator Lion.
How did the Portfolio’s sector weightings change during the reporting period?
The Portfolio’s most substantial sector-weighting increases relative to the MSCI ACWI® Ex U.S. Index were in information technology and health care. Conversely, the Portfolio’s largest decreases in benchmark-relative sector exposures were in consumer discretionary and materials.
How was the Portfolio positioned at the end of the reporting period?
As of June 30, 2020, the Portfolio held its most overweight sector positions relative to the MSCI ACWI® Ex U.S. Index in information technology and health care. As of the same date, the Portfolio’s most substantially underweight sector positions relative to the Index were in consumer discretionary and consumer staples.
| 1. | See page 5 for more information on benchmark and peer group returns. |
The opinions expressed are those of the portfolio managers as of the date of this report and are subject to change. There is no guarantee that any forecasts will come to pass. This material does not constitute investment advice and is not intended as an endorsement of any specific investment.
Not all MainStay VP Portfolios and/or share classes are available under all policies.
| | |
| 8 | | MainStay VP MacKay International Equity Portfolio |
Portfolio of Investments June 30, 2020 (Unaudited)
| | | | | | | | |
| | | Shares | | | Value | |
| Common Stocks 96.8%† | |
Argentina 1.1% | |
Globant S.A. (Software) (a) | | | 34,793 | | | $ | 5,213,731 | |
| | | | | | | | |
|
Brazil 1.4% | |
Notre Dame Intermedica Participacoes S.A. (Health Care Providers & Services) | | | 521,464 | | | | 6,521,536 | |
| | | | | | | | |
|
Canada 1.0% | |
Constellation Software, Inc. (Software) | | | 4,103 | | | | 4,632,769 | |
| | | | | | | | |
|
China 3.8% | |
Tencent Holdings, Ltd. (Interactive Media & Services) | | | 278,668 | | | | 17,899,907 | |
| | | | | | | | |
|
Denmark 3.3% | |
Novo Nordisk A/S, Class B (Pharmaceuticals) | | | 244,468 | | | | 15,819,813 | |
| | | | | | | | |
|
France 7.1% | |
Dassault Systemes S.E. (Software) | | | 28,546 | | | | 4,919,721 | |
Edenred (IT Services) | | | 350,453 | | | | 15,310,184 | |
Teleperformance S.E. (Professional Services) | | | 53,247 | | | | 13,499,376 | |
| | | | | | | | |
| | | | | | | 33,729,281 | |
| | | | | | | | |
Germany 11.6% | |
Carl Zeiss Meditec A.G. (Health Care Equipment & Supplies) (a) | | | 52,781 | | | | 5,142,877 | |
Fresenius Medical Care A.G. & Co. KGaA (Health Care Providers & Services) | | | 129,049 | | | | 11,002,412 | |
SAP S.E. (Software) | | | 124,476 | | | | 17,326,499 | |
Scout24 A.G. (Interactive Media & Services) (b) | | | 82,257 | | | | 6,393,442 | |
Symrise A.G. (Chemicals) | | | 129,491 | | | | 15,023,499 | |
| | | | | | | | |
| | | | | | | 54,888,729 | |
| | | | | | | | |
India 5.4% | |
HDFC Bank, Ltd. (Banks) | | | 919,961 | | | | 13,121,063 | |
Housing Development Finance Corp., Ltd. (Thrifts & Mortgage Finance) | | | 526,887 | | | | 12,403,409 | |
| | | | | | | | |
| | | | | | | 25,524,472 | |
| | | | | | | | |
Ireland 6.9% | |
Accenture PLC, Class A (IT Services) | | | 64,748 | | | | 13,902,691 | |
ICON PLC (Life Sciences Tools & Services) (a) | | | 113,181 | | | | 19,066,471 | |
| | | | | | | | |
| | | | | | | 32,969,162 | |
| | | | | | | | |
Israel 1.0% | |
Nice, Ltd., Sponsored ADR (Software) (a) | | | 24,505 | | | | 4,637,326 | |
| | | | | | | | |
|
Japan 8.3% | |
CyberAgent, Inc. (Media) | | | 230,800 | | | | 11,322,209 | |
Lion Corp. (Household Products) | | | 78,600 | | | | 1,884,425 | |
Menicon Co., Ltd. (Health Care Equipment & Supplies) | | | 77,200 | | | | 3,790,710 | |
| | | | | | | | |
| | | Shares | | | Value | |
Japan (continued) | |
Relo Group, Inc. (Real Estate Management & Development) | | | 488,100 | | | $ | 9,179,776 | |
TechnoPro Holdings, Inc. (Professional Services) | | | 227,000 | | | | 13,142,471 | |
| | | | | | | | |
| | | | | | | 39,319,591 | |
| | | | | | | | |
Mexico 0.9% | |
Regional S.A.B. de C.V. (Banks) (a) | | | 1,620,111 | | | | 4,334,253 | |
| | | | | | | | |
|
Netherlands 7.3% | |
Koninklijke DSM N.V. (Chemicals) | | | 114,086 | | | | 15,769,296 | |
Koninklijke Philips N.V. (Health Care Equipment & Supplies) (a) | | | 409,603 | | | | 19,073,831 | |
| | | | | | | | |
| | | | | | | 34,843,127 | |
| | | | | | | | |
Spain 5.4% | |
Amadeus IT Group S.A. (IT Services) | | | 237,854 | | | | 12,376,215 | |
Industria de Diseno Textil S.A. (Specialty Retail) | | | 508,835 | | | | 13,453,219 | |
| | | | | | | | |
| | | | | | | 25,829,434 | |
| | | | | | | | |
Sweden 3.5% | |
Hexagon AB, Class B (Electronic Equipment, Instruments & Components) (a) | | | 288,682 | | | | 16,826,263 | |
| | | | | | | | |
|
Switzerland 5.6% | |
Lonza Group A.G., Registered (Life Sciences Tools & Services) | | | 24,620 | | | | 12,981,980 | |
TE Connectivity, Ltd. (Electronic Equipment, Instruments & Components) | | | 167,488 | | | | 13,658,646 | |
| | | | | | | | |
| | | | | | | 26,640,626 | |
| | | | | | | | |
Taiwan 2.8% | |
Taiwan Semiconductor Manufacturing Co., Ltd., Sponsored ADR (Semiconductors & Semiconductor Equipment) | | | 237,386 | | | | 13,476,403 | |
| | | | | | | | |
|
United Kingdom 18.0% | |
Big Yellow Group PLC (Equity Real Estate Investment Trusts) | | | 521,125 | | | | 6,478,112 | |
Compass Group PLC (Hotels, Restaurants & Leisure) | | | 650,938 | | | | 8,955,035 | |
Diageo PLC (Beverages) | | | 412,424 | | | | 13,689,983 | |
Experian PLC (Professional Services) | | | 270,691 | | | | 9,441,460 | |
HomeServe PLC (Commercial Services & Supplies) | | | 629,354 | | | | 10,165,960 | |
Prudential PLC (Insurance) | | | 1,452,289 | | | | 21,870,988 | |
St. James’s Place PLC (Capital Markets) | | | 1,240,994 | | | | 14,628,783 | |
| | | | | | | | |
| | | | | | | 85,230,321 | |
| | | | | | | | |
| | | | | | |
The notes to the financial statements are an integral part of,
and should be read in conjunction with, the financial statements. | | | | | 9 | |
Portfolio of Investments June 30, 2020 (Unaudited) (continued)
| | | | | | | | |
| | | Shares | | | Value | |
| Common Stocks (continued) | |
United States 2.4% | |
STERIS PLC (Health Care Equipment & Supplies) | | | 73,096 | | | $ | 11,215,850 | |
| | | | | | | | |
Total Common Stocks
(Cost $423,141,489) | | | | 459,552,594 | |
| | | | | | | | |
|
| Short-Term Investments 0.2% | |
Affiliated Investment Company 0.0%‡ | |
United States 0.0%‡ | |
MainStay U.S. Government Liquidity Fund, 0.05% (c) | | | 75,540 | | | | 75,540 | |
| | | | | | | | |
Total Affiliated Investment Company
(Cost $75,540) | | | | 75,540 | |
| | | | | | | | |
| | |
| | | | | | | | |
| | | Principal
Amount | | | | |
Repurchase Agreement 0.2% | |
Fixed Income Clearing Corp.
0.00%, dated 6/30/20
due 7/1/20
Proceeds at Maturity $1,041,633 (Collateralized by a United States Treasury Note with a rate of 1.250% and a maturity date of 8/31/24, with a Principal Amount of $1,015,500 and a Market Value of $1,062,510) | | $ | 1,041,633 | | | | 1,041,633 | |
| | | | | | | | |
Total Repurchase Agreement
(Cost $1,041,633) | | | | 1,041,633 | |
| | | | | | | | |
Total Short-Term Investments
(Cost $1,117,173) | | | | 1,117,173 | |
| | | | | | | | |
Total Investments
(Cost $424,258,662) | | | 97.0 | % | | | 460,669,767 | |
Other Assets, Less Liabilities | | | 3.0 | | | | 14,229,455 | |
Net Assets | | | 100.0 | % | | $ | 474,899,222 | |
| † | Percentages indicated are based on Portfolio net assets. |
| ‡ | Less than one-tenth of a percent. |
| (a) | Non-income producing security. |
| (b) | May be sold to institutional investors only under Rule 144A or securities offered pursuant to Section 4(a)(2) of the Securities Act of 1933, as amended. |
| (c) | Current yield as of June 30, 2020. |
The following abbreviation is used in the preceding pages:
ADR—American Depositary Receipt
| | | | |
| 10 | | MainStay VP MacKay International Equity Portfolio | | The notes to the financial statements are an integral part of,
and should be read in conjunction with, the financial statements. |
The following is a summary of the fair valuations according to the inputs used as of June 30, 2020, for valuing the Portfolio’s assets:
| | | | | | | | | | | | | | | | |
Description | | Quoted
Prices in
Active
Markets for
Identical
Assets (Level 1) | | | Significant
Other
Observable
Inputs (Level 2) | | | Significant
Unobservable
Inputs (Level 3) | | | Total | |
|
Asset Valuation Inputs | |
| Investments in Securities (a) | | | | | | | | | |
| Common Stocks | | | | | | | | | | | | | | | | |
China | | $ | — | | | $ | 17,899,907 | | | $ | — | | | $ | 17,899,907 | |
Denmark | | | — | | | | 15,819,813 | | | | — | | | | 15,819,813 | |
France | | | — | | | | 33,729,281 | | | | — | | | | 33,729,281 | |
Germany | | | — | | | | 54,888,729 | | | | — | | | | 54,888,729 | |
India | | | — | | | | 25,524,472 | | | | — | | | | 25,524,472 | |
Japan | | | — | | | | 39,319,591 | | | | — | | | | 39,319,591 | |
Netherlands | | | — | | | | 34,843,127 | | | | — | | | | 34,843,127 | |
Spain | | | — | | | | 25,829,434 | | | | — | | | | 25,829,434 | |
Sweden | | | — | | | | 16,826,263 | | | | — | | | | 16,826,263 | |
Switzerland | | | 13,658,646 | | | | 12,981,980 | | | | — | | | | 26,640,626 | |
United Kingdom | | | — | | | | 85,230,321 | | | | — | | | | 85,230,321 | |
All Other Countries | | | 83,001,030 | | | | — | | | | — | | | | 83,001,030 | |
| | | | | | | | | | | | | | | | |
| Total Common Stocks | | | 96,659,676 | | | | 362,892,918 | | | | — | | | | 459,552,594 | |
| | | | | | | | | | | | | | | | |
| Short-Term Investments | | | | | | | | | |
Affiliated Investment Company | | | 75,540 | | | | — | | | | — | | | | 75,540 | |
Repurchase Agreement | | | — | | | | 1,041,633 | | | | — | | | | 1,041,633 | |
| | | | | | | | | | | | | | | | |
| Total Short-Term Investments | | | 75,540 | | | | 1,041,633 | | | | — | | | | 1,117,173 | |
| | | | | | | | | | | | | | | | |
| Total Investments in Securities | | $ | 96,735,216 | | | $ | 363,934,551 | | | $ | — | | | $ | 460,669,767 | |
| | | | | | | | | | | | | | | | |
| (a) | For a complete listing of investments and their industries, see the Portfolio of Investments. |
| | | | | | |
The notes to the financial statements are an integral part of,
and should be read in conjunction with, the financial statements. | | | | | 11 | |
Portfolio of Investments June 30, 2020 (Unaudited) (continued)
The table below sets forth the diversification of the Portfolio’s investments by industry.
Industry Diversification (Unaudited)
| | | | | | | | |
| | | Value | | | Percent † | |
Banks | | $ | 17,455,316 | | | | 3.7 | % |
Beverages | | | 13,689,983 | | | | 2.9 | |
Capital Markets | | | 14,628,783 | | | | 3.1 | |
Chemicals | | | 30,792,795 | | | | 6.5 | |
Commercial Services & Supplies | | | 10,165,960 | | | | 2.1 | |
Electronic Equipment, Instruments & Components | | | 30,484,909 | | | | 6.4 | |
Equity Real Estate Investment Trusts | | | 6,478,112 | | | | 1.4 | |
Health Care Equipment & Supplies | | | 39,223,268 | | | | 8.3 | |
Health Care Providers & Services | | | 17,523,948 | | | | 3.7 | |
Hotels, Restaurants & Leisure | | | 8,955,035 | | | | 1.9 | |
Household Products | | | 1,884,425 | | | | 0.4 | |
Insurance | | | 21,870,988 | | | | 4.6 | |
Interactive Media & Services | | | 24,293,349 | | | | 5.1 | |
IT Services | | | 41,589,090 | | | | 8.8 | |
Life Sciences Tools & Services | | | 32,048,451 | | | | 6.8 | |
Media | | | 11,322,209 | | | | 2.4 | |
Pharmaceuticals | | | 15,819,813 | | | | 3.3 | |
Professional Services | | | 36,083,307 | | | | 7.6 | |
Real Estate Management & Development | | | 9,179,776 | | | | 1.9 | |
Semiconductors & Semiconductor Equipment | | | 13,476,403 | | | | 2.8 | |
Software | | | 36,730,046 | | | | 7.7 | |
Specialty Retail | | | 13,453,219 | | | | 2.8 | |
Thrifts & Mortgage Finance | | | 12,403,409 | | | | 2.6 | |
| | | | | | | | |
| | | 459,552,594 | | | | 96.8 | |
Short-Term Investments | | | 1,117,173 | | | | 0.2 | |
Other Assets, Less Liabilities | | | 14,229,455 | | | | 3.0 | |
| | | | | | | | |
Net Assets | | $ | 474,899,222 | | | | 100.0 | % |
| | | | | | | | |
| † | Percentages indicated are based on Portfolio net assets. |
| | | | |
| 12 | | MainStay VP MacKay International Equity Portfolio | | The notes to the financial statements are an integral part of,
and should be read in conjunction with, the financial statements. |
Statement of Assets and Liabilities as of June 30, 2020 (Unaudited)
| | | | |
| Assets | |
Investment in unaffiliated securities, at value (identified cost $424,183,122) | | $ | 460,594,227 | |
Investment in affiliated investment company, at value (identified cost $75,540) | | | 75,540 | |
Cash denominated in foreign currencies (identified cost $15,090,449) | | | 15,210,753 | |
Receivables: | |
Dividends | | | 1,616,654 | |
Portfolio shares sold | | | 121,597 | |
Securities lending | | | 7,252 | |
Investment securities sold | | | 142 | |
Other assets | | | 2,290 | |
| | | | |
Total assets | | | 477,628,455 | |
| | | | |
|
| Liabilities | |
Payables: | |
Investment securities purchased | | | 1,692,302 | |
Portfolio shares redeemed | | | 539,670 | |
Manager (See Note 3) | | | 347,017 | |
NYLIFE Distributors (See Note 3) | | | 57,258 | |
Shareholder communication | | | 41,439 | |
Professional fees | | | 23,019 | |
Custodian | | | 20,539 | |
Trustees | | | 585 | |
Accrued expenses | | | 7,404 | |
| | | | |
Total liabilities | | | 2,729,233 | |
| | | | |
Net assets | | $ | 474,899,222 | |
| | | | |
|
| Composition of Net Assets | |
Shares of beneficial interest outstanding (par value of $.001 per share) unlimited number of shares authorized | | $ | 30,748 | |
Additional paid-in capital | | | 409,385,527 | |
| | | | |
| | | 409,416,275 | |
Total distributable earnings (loss) | | | 65,482,947 | |
| | | | |
Net assets | | $ | 474,899,222 | |
| | | | |
| | | | |
Initial Class | |
Net assets applicable to outstanding shares | | $ | 196,732,866 | |
| | | | |
Shares of beneficial interest outstanding | | | 12,656,898 | |
| | | | |
Net asset value per share outstanding | | $ | 15.54 | |
| | | | |
Service Class | |
Net assets applicable to outstanding shares | | $ | 278,166,356 | |
| | | | |
Shares of beneficial interest outstanding | | | 18,091,468 | |
| | | | |
Net asset value per share outstanding | | $ | 15.38 | |
| | | | |
| | | | | | |
The notes to the financial statements are an integral part of,
and should be read in conjunction with, the financial statements. | | | | | 13 | |
Statement of Operations for the six months ended June 30, 2020 (Unaudited)
| | | | |
| Investment Income (Loss) | |
Income | |
Dividends-unaffiliated (a) | | $ | 3,602,097 | |
Securities lending | | | 36,849 | |
Interest | | | 8,762 | |
Dividends-affiliated | | | 2,044 | |
Other | | | 37 | |
| | | | |
Total income | | | 3,649,789 | |
| | | | |
Expenses | |
Manager (See Note 3) | | | 2,034,014 | |
Distribution/Service—Service Class (See Note 3) | | | 336,046 | |
Custodian | | | 58,379 | |
Professional fees | | | 47,012 | |
Shareholder communication | | | 32,796 | |
Trustees | | | 5,694 | |
Miscellaneous | | | 14,403 | |
| | | | |
Total expenses | | | 2,528,344 | |
| | | | |
Net investment income (loss) | | | 1,121,445 | |
| | | | |
|
| Realized and Unrealized Gain (Loss) on Investments and Foreign Currency Transactions | |
Net realized gain (loss) on: | |
Unaffiliated investment transactions | | | 1,796,532 | |
Foreign currency transactions | | | (941,393 | ) |
| | | | |
Net realized gain (loss) on investments and foreign currency transactions | | | 855,139 | |
| | | | |
Net change in unrealized appreciation (depreciation) on: | |
Unaffiliated investments | | | (24,173,262 | ) |
Translation of other assets and liabilities in foreign currencies | | | (157,498 | ) |
| | | | |
Net change in unrealized appreciation (depreciation) on investments and foreign currencies | | | (24,330,760 | ) |
| | | | |
Net realized and unrealized gain (loss) on investments and foreign currency transactions | | | (23,475,621 | ) |
| | | | |
Net increase (decrease) in net assets resulting from operations | | $ | (22,354,176 | ) |
| | | | |
| (a) | Dividends recorded net of foreign withholding taxes in the amount of $242,320. |
| | | | |
| 14 | | MainStay VP MacKay International Equity Portfolio | | The notes to the financial statements are an integral part of,
and should be read in conjunction with, the financial statements. |
Statements of Changes in Net Assets
for the six months ended June 30, 2020 (Unaudited) and the year ended December 31, 2019
| | | | | | | | |
| | | 2020 | | | 2019 | |
| Increase (Decrease) in Net Assets | |
Operations: | |
Net investment income (loss) | | $ | 1,121,445 | | | $ | 2,794,612 | |
Net realized gain (loss) on investments and foreign currency transactions | | | 855,139 | | | | 28,337,229 | |
Net change in unrealized appreciation (depreciation) on investments and foreign currencies | | | (24,330,760 | ) | | | 70,681,161 | |
| | | | |
Net increase (decrease) in net assets resulting from operations | | | (22,354,176 | ) | | | 101,813,002 | |
| | | | |
Distributions to shareholders: | |
Initial Class | | | — | | | | (23,648,369 | ) |
Service Class | | | — | | | | (36,383,426 | ) |
| | | | |
Total distributions to shareholders | | | — | | | | (60,031,795 | ) |
| | | | |
Capital share transactions: | |
Net proceeds from sale of shares | | | 23,084,444 | | | | 63,009,779 | |
Net asset value of shares issued to shareholders in reinvestment of distributions | | | — | | | | 60,031,795 | |
Cost of shares redeemed | | | (38,243,558 | ) | | | (68,932,644 | ) |
| | | | |
Increase (decrease) in net assets derived from capital share transactions | | | (15,159,114 | ) | | | 54,108,930 | |
| | | | |
Net increase (decrease) in net assets | | | (37,513,290 | ) | | | 95,890,137 | |
|
| Net Assets | |
Beginning of period | | | 512,412,512 | | | | 416,522,375 | |
| | | | |
End of period | | $ | 474,899,222 | | | $ | 512,412,512 | |
| | | | |
| | | | | | |
The notes to the financial statements are an integral part of,
and should be read in conjunction with, the financial statements. | | | | | 15 | |
Financial Highlights selected per share data and ratios
| | | | | | | | | | | | | | | | | | | | | | | | | | | | |
| | | Six months
ended
June 30, | | | | | | Year ended December 31, | |
| | | | | | | |
| Initial Class | | 2020* | | | | | | 2019 | | | 2018 | | | 2017 | | | 2016 | | | 2015 | |
| | | | | | | |
Net asset value at beginning of period | | $ | 16.21 | | | | | | | $ | 14.99 | | | $ | 17.46 | | | $ | 13.24 | | | $ | 14.04 | | | $ | 13.36 | |
| | | | | | | | | | | | | | | | | | | | | | | | | | | | |
| | | | | | | |
Net investment income (loss) (a) | | | 0.05 | | | | | | | | 0.12 | | | | 0.10 | | | | 0.07 | | | | 0.10 | | | | 0.10 | |
| | | | | | | |
Net realized and unrealized gain (loss) on investments | | | (0.69 | ) | | | | | | | 3.28 | | | | (2.00 | ) | | | 4.21 | | | | (0.77 | ) | | | 0.75 | |
| | | | | | | |
Net realized and unrealized gain (loss) on foreign currency transactions | | | (0.03 | ) | | | | | | | 0.03 | | | | (0.04 | ) | | | 0.03 | | | | (0.02 | ) | | | (0.03 | ) |
| | | | | | | | | | | | | | | | | | | | | | | | | | | | |
| | | | | | | |
Total from investment operations | | | (0.67 | ) | | | | | | | 3.43 | | | | (1.94 | ) | | | 4.31 | | | | (0.69 | ) | | | 0.82 | |
| | | | | | | | | | | | | | | | | | | | | | | | | | | | |
|
| Less distributions: | |
| | | | | | | |
From net investment income | | | — | | | | | | | | (0.08 | ) | | | (0.21 | ) | | | (0.09 | ) | | | (0.11 | ) | | | (0.14 | ) |
| | | | | | | |
From net realized gain on investments | | | — | | | | | | | | (2.13 | ) | | | (0.32 | ) | | | — | | | | — | | | | — | |
| | | | | | | | | | | | | | | | | | | | | | | | | | | | |
| | | | | | | |
Total distributions | | | — | | | | | | | | (2.21 | ) | | | (0.53 | ) | | | (0.09 | ) | | | (0.11 | ) | | | (0.14 | ) |
| | | | | | | | | | | | | | | | | | | | | | | | | | | | |
| | | | | | | |
Net asset value at end of period | | $ | 15.54 | | | | | | | $ | 16.21 | | | $ | 14.99 | | | $ | 17.46 | | | $ | 13.24 | | | $ | 14.04 | |
| | | | | | | | | | | | | | | | | | | | | | | | | | | | |
| | | | | | | |
Total investment return (b) | | | (4.13 | %)(c) | | | | | | | 24.80 | % | | | (11.56 | %) | | | 32.61 | % | | | (4.95 | %) | | | 6.17 | % |
|
| Ratios (to average net assets)/Supplemental Data: | |
| | | | | | | |
Net investment income (loss) | | | 0.64 | % †† | | | | | | | 0.74 | % | | | 0.55 | % | | | 0.43 | % | | | 0.71 | %(d) | | | 0.74 | % |
| | | | | | | |
Net expenses (e) | | | 0.96 | % †† | | | | | | | 0.96 | % | | | 0.96 | % | | | 0.96 | % | | | 0.95 | %(f) | | | 0.95 | % |
| | | | | | | |
Portfolio turnover rate | | | 75 | % | | | | | | | 66 | % | | | 46 | % | | | 49 | % | | | 28 | % | | | 40 | % |
| | | | | | | |
Net assets at end of period (in 000’s) | | $ | 196,733 | | | | | | | $ | 209,278 | | | $ | 158,215 | | | $ | 196,676 | | | $ | 171,048 | | | $ | 243,076 | |
| (a) | Per share data based on average shares outstanding during the period. |
| (b) | Total return does not reflect any deduction of sales charges, mortality and expense charges, contract charges or administrative charges. For periods of less than one year, total return is not annualized. |
| (c) | Total investment return may reflect adjustments to conform to generally accepted accounting principles. |
| (d) | Without the custody fee reimbursement, net investment income (loss) would have been 0.70%. |
| (e) | In addition to the fees and expenses which the Portfolio bears directly, it also indirectly bears a pro-rata share of the fees and expenses of the underlying funds in which it invests. Such indirect expenses are not included in the above expense ratios. |
| (f) | Without the custody fee reimbursement, net expenses would have been 0.96%. |
| | | | | | | | | | | | | | | | | | | | | | | | | | | | |
| | | Six months
ended
June 30, | | | | | | Year ended December 31, | |
| | | | | | | |
| Service Class | | 2020* | | | | | | 2019 | | | 2018 | | | 2017 | | | 2016 | | | 2015 | |
| | | | | | | |
Net asset value at beginning of period | | $ | 16.06 | | | | | | | $ | 14.86 | | | $ | 17.32 | | | $ | 13.13 | | | $ | 13.92 | | | $ | 13.24 | |
| | | | | | | | | | | | | | | | | | | | | | | | | | | | |
| | | | | | | |
Net investment income (loss) (a) | | | 0.03 | | | | | | | | 0.08 | | | | 0.05 | | | | 0.03 | | | | 0.05 | | | | 0.07 | |
| | | | | | | |
Net realized and unrealized gain (loss) on investments | | | (0.68 | ) | | | | | | | 3.25 | | | | (1.99 | ) | | | 4.18 | | | | (0.74 | ) | | | 0.74 | |
| | | | | | | |
Net realized and unrealized gain (loss) on foreign currency transactions | | | (0.03 | ) | | | | | | | 0.03 | | | | (0.04 | ) | | | 0.03 | | | | (0.03 | ) | | | (0.03 | ) |
| | | | | | | | | | | | | | | | | | | | | | | | | | | | |
| | | | | | | |
Total from investment operations | | | (0.68 | ) | | | | | | | 3.36 | | | | (1.98 | ) | | | 4.24 | | | | (0.72 | ) | | | 0.78 | |
| | | | | | | | | | | | | | | | | | | | | | | | | | | | |
|
| Less distributions: | |
| | | | | | | |
From net investment income | | | — | | | | | | | | (0.03 | ) | | | (0.16 | ) | | | (0.05 | ) | | | (0.07 | ) | | | (0.10 | ) |
| | | | | | | |
From net realized gain on investments | | | — | | | | | | | | (2.13 | ) | | | (0.32 | ) | | | — | | | | — | | | | — | |
| | | | | | | | | | | | | | | | | | | | | | | | | | | | |
| | | | | | | |
Total distributions | | | — | | | | | | | | (2.16 | ) | | | (0.48 | ) | | | (0.05 | ) | | | (0.07 | ) | | | (0.10 | ) |
| | | | | | | | | | | | | | | | | | | | | | | | | | | | |
| | | | | | | |
Net asset value at end of period | | $ | 15.38 | | | | | | | $ | 16.06 | | | $ | 14.86 | | | $ | 17.32 | | | $ | 13.13 | | | $ | 13.92 | |
| | | | | | | | | | | | | | | | | | | | | | | | | | | | |
| | | | | | | |
Total investment return (b) | | | (4.23 | %)(c) | | | | | | | 24.49 | % | | | (11.78 | %) | | | 32.28 | % | | | (5.17 | %) | | | 5.90 | % |
|
| Ratios (to average net assets)/Supplemental Data: | |
| | | | | | | |
Net investment income (loss) | | | 0.39 | % †† | | | | | | | 0.52 | % | | | 0.32 | % | | | 0.18 | % | | | 0.40 | %(d) | | | 0.48 | % |
| | | | | | | |
Net expenses (e) | | | 1.21 | % †† | | | | | | | 1.21 | % | | | 1.21 | % | | | 1.21 | % | | | 1.20 | %(f) | | | 1.20 | % |
| | | | | | | |
Portfolio turnover rate | | | 75 | % | | | | | | | 66 | % | | | 46 | % | | | 49 | % | | | 28 | % | | | 40 | % |
| | | | | | | |
Net assets at end of period (in 000’s) | | $ | 278,166 | | | | | | | $ | 303,135 | | | $ | 258,307 | | | $ | 310,793 | | | $ | 251,474 | | | $ | 300,184 | |
| (a) | Per share data based on average shares outstanding during the period. |
| (b) | Total return does not reflect any deduction of sales charges, mortality and expense charges, contract charges or administrative charges. For periods of less than one year, total return is not annualized. |
| (c) | Total investment return may reflect adjustments to conform to generally accepted accounting principles. |
| (d) | Without the custody fee reimbursement, net investment income (loss) would have been 0.39%. |
| (e) | In addition to the fees and expenses which the Portfolio bears directly, it also indirectly bears a pro-rata share of the fees and expenses of the underlying funds in which it invests. Such indirect expenses are not included in the above expense ratios. |
| (f) | Without the custody fee reimbursement, net expenses would have been 1.21%. |
| | | | |
| 16 | | MainStay VP MacKay International Equity Portfolio | | The notes to the financial statements are an integral part of,
and should be read in conjunction with, the financial statements. |
Notes to Financial Statements (Unaudited)
Note 1–Organization and Business
MainStay VP Funds Trust (the ‘‘Fund’’) was organized as a Delaware statutory trust on February 1, 2011. The Fund is registered under the Investment Company Act of 1940, as amended (the “1940 Act”), as an open-end management investment company. The Fund is comprised of thirty-one separate series (collectively referred to as the “Portfolios”). These financial statements and notes relate to the MainStay VP MacKay International Equity Portfolio (the “Portfolio”), a “diversified” portfolio, as that term is defined in the 1940 Act, as interpreted or modified by regulatory authorities having jurisdiction, from time to time.
Shares of the Portfolio are currently offered to certain separate accounts to fund variable annuity policies and variable universal life insurance policies issued by New York Life Insurance and Annuity Corporation (“NYLIAC”), a wholly-owned subsidiary of New York Life Insurance Company (“New York Life”) and may also be offered to fund variable annuity policies and variable universal life insurance policies issued by other insurance companies. NYLIAC allocates shares of the Portfolios to, among others, certain NYLIAC separate accounts. Shares of the Portfolio are also offered to the MainStay VP Conservative Allocation Portfolio, MainStay VP Moderate Allocation Portfolio, MainStay VP Moderate Growth Allocation Portfolio and MainStay VP Growth Allocation Portfolio, which operate as “funds-of-funds,” and other variable insurance funds.
The Portfolio currently offers two classes of shares. Initial Class shares commenced operations on May 1, 1995. Service Class shares commenced operations on June 5, 2003. Shares of the Portfolio are offered and are redeemed at a price equal to their respective net asset value (“NAV”) per share. No sales or redemption charge is applicable to the purchase or redemption of the Portfolio’s shares. Under the terms of the Fund’s multiple class plan, adopted pursuant to Rule 18f-3 under the 1940 Act, the classes differ in that, among other things, Service Class shares of the Portfolio pay a combined distribution and service fee of 0.25% of average daily net assets attributable to Service Class shares of the Portfolio to the Distributor (as defined in Note 3(B)) pursuant to a plan adopted in accordance with Rule 12b-1 under the 1940 Act. Contract owners of variable annuity contracts purchased after June 2, 2003, are permitted to invest only in the Service Class shares.
The Portfolio’s investment objective is to seek long-term growth of capital.
Note 2–Significant Accounting Policies
The Portfolio is an investment company and accordingly follows the investment company accounting and reporting guidance of the Financial Accounting Standards Board (“FASB”) Accounting Standard Codification Topic 946 Financial Services – Investment Companies. The Portfolio prepares its financial statements in accordance with generally accepted accounting principles (“GAAP”) in the United States of America and follows the significant accounting policies described below.
(A) Securities Valuation. Investments are usually valued as of the close of regular trading on the New York Stock Exchange (the “Exchange”) (usually 4:00 p.m. Eastern time) on each day the Portfolio is open for business (“valuation date”).
The Board of Trustees of the Fund (the “Board”) adopted procedures establishing methodologies for the valuation of the Portfolio’s securities and other
assets and delegated the responsibility for valuation determinations under those procedures to the Valuation Committee of the Fund (the “Valuation Committee”). The procedures state that, subject to the oversight of the Board and unless otherwise noted, the responsibility for the day-to-day valuation of portfolio assets (including fair value measurements for the Portfolio’s assets and liabilities) rests with New York Life Investment Management LLC (“New York Life Investments” or the “Manager”), aided to whatever extent necessary by the Subadvisor (as defined in Note 3(A)). To assess the appropriateness of security valuations, the Manager, the Subadvisor or the Portfolio’s third-party service provider, who is subject to oversight by the Manager, regularly compares prior day prices, prices on comparable securities and the sale prices to the prior and current day prices and challenges prices with changes exceeding certain tolerance levels with third-party pricing services or broker sources.
The Board authorized the Valuation Committee to appoint a Valuation Subcommittee (the “Subcommittee”) to establish the prices of securities for which market quotations are not readily available or the prices of which are not otherwise readily determinable under the procedures. The Subcommittee meets (in person, via electronic mail or via teleconference) on an as-needed basis. The Valuation Committee meets to ensure that actions taken by the Subcommittee were appropriate.
For those securities valued through either a standardized fair valuation methodology or a fair valuation measurement, the Subcommittee deals with such valuation and the Valuation Committee reviews and affirms, if appropriate, the reasonableness of the valuation based on such methodologies and measurements on a regular basis after considering information that is reasonably available and deemed relevant by the Valuation Committee. Any action taken by the Subcommittee with respect to the valuation of a portfolio security or other asset is submitted for review and ratification (if appropriate) to the Valuation Committee and the Board at the next regularly scheduled meeting.
“Fair value” is defined as the price the Portfolio would reasonably expect to receive upon selling an asset or liability in an orderly transaction to an independent buyer in the principal or most advantageous market for the asset or liability. Fair value measurements are determined within a framework that establishes a three-tier hierarchy that maximizes the use of observable market data and minimizes the use of unobservable inputs to establish a classification of fair value measurements for disclosure purposes. “Inputs” refer broadly to the assumptions that market participants would use in pricing the asset or liability, including assumptions about risk, such as the risk inherent in a particular valuation technique used to measure fair value using a pricing model and/or the risk inherent in the inputs for the valuation technique. Inputs may be observable or unobservable. Observable inputs reflect the assumptions market participants would use in pricing the asset or liability based on market data obtained from sources independent of the Portfolio. Unobservable inputs reflect the Portfolio’s own assumptions about the assumptions market participants would use in pricing the asset or liability based on the information available. The inputs or methodology used for valuing assets or liabilities may not be an indication of the risks associated with investing in those assets or liabilities. The three-tier hierarchy of inputs is summarized below.
| • | | Level 1—quoted prices in active markets for an identical asset or liability |
Notes to Financial Statements (Unaudited) (continued)
| • | | Level 2—other significant observable inputs (including quoted prices for a similar asset or liability in active markets, interest rates and yield curves, prepayment speeds, credit risk, etc.) |
| • | | Level 3—significant unobservable inputs (including the Portfolio’s own assumptions about the assumptions that market participants would use in measuring fair value of an asset or liability) |
The level of an asset or liability within the fair value hierarchy is based on the lowest level of an input, both individually and in the aggregate, that is significant to the fair value measurement. The aggregate value by input level of the Portfolio’s assets and liabilities as of June 30, 2020 is included at the end of the Portfolio of Investments.
The Portfolio may use third-party vendor evaluations, whose prices may be derived from one or more of the following standard inputs, among others:
| | |
• Broker/dealer quotes | | • Benchmark securities |
• Two-sided markets | | • Reference data (corporate actions or material event notices) |
• Bids/offers | | • Monthly payment information |
• Industry and economic events | | • Reported trades |
An asset or liability for which market values cannot be measured using the methodologies described above is valued by methods deemed reasonable in good faith by the Valuation Committee, following the procedures established by the Board, to represent fair value. Under these procedures, the Portfolio generally uses a market-based approach which may use related or comparable assets or liabilities, recent transactions, market multiples, book values and other relevant information. The Portfolio may also use an income-based valuation approach in which the anticipated future cash flows of the asset or liability are discounted to calculate fair value. Discounts may also be applied due to the nature and/or duration of any restrictions on the disposition of the asset or liability. Fair value represents a good faith approximation of the value of a security. Fair value determinations involve the consideration of a number of subjective factors, an analysis of applicable facts and circumstances and the exercise of judgment. As a result, it is possible that the fair value for a security determined in good faith in accordance with the Portfolio’s valuation procedures may differ from valuations for the same security determined by other funds using their own valuation procedures. Although the Portfolio’s valuation procedures are designed to value a security at the price the Portfolio may reasonably expect to receive upon the security’s sale in an orderly transaction, there can be no assurance that any fair value determination thereunder would, in fact, approximate the amount that the Portfolio would actually realize upon the sale of the security or the price at which the security would trade if a reliable market price were readily available. During the six-month period ended June 30, 2020, there were no material changes to the fair value methodologies.
Securities which may be valued in this manner include, but are not limited to: (i) a security for which trading has been halted or suspended; (ii) a debt security that has recently gone into default and for which there is not a current market quotation; (iii) a security of an issuer that has entered into a restructuring; (iv) a security that has been delisted from a national exchange; (v) a security for which the market price is not readily available from a third-party pricing source or, if so provided,
does not, in the opinion of the Manager or the Subadvisor, reflect the security’s market value; (vi) a security subject to trading collars for which no or limited trading takes place; and (vii) a security whose principal market has been temporarily closed at a time when, under normal conditions, it would be open. Securities valued in this manner are generally categorized as Level 3 in the hierarchy. As of June 30, 2020, no securities held by the Portfolio were fair valued in such a manner.
Certain securities held by the Portfolio may principally trade in foreign markets. Events may occur between the time the foreign markets close and the time at which the Portfolio’s NAVs are calculated. These events may include, but are not limited to, situations relating to a single issuer in a market sector, significant fluctuations in U.S. or foreign markets, natural disasters, armed conflicts, governmental actions or other developments not tied directly to the securities markets. Should the Manager or the Subadvisor conclude that such events may have affected the accuracy of the last price of such securities reported on the local foreign market, the Subcommittee may, pursuant to procedures adopted by the Board, adjust the value of the local price to reflect the estimated impact on the price of such securities as a result of such events. In this instance, securities are generally categorized as Level 3 in the hierarchy. Additionally, certain foreign equity securities are also fair valued whenever the movement of a particular index exceeds certain thresholds. In such cases, the securities are fair valued by applying factors provided by a third-party vendor in accordance with valuation procedures adopted by the Board and are generally categorized as Level 2 in the hierarchy. As of June 30, 2020, no foreign equity securities held by the Portfolio were fair valued in such a manner.
Equity securities, including exchange-traded funds (“ETFs”), are valued at the last quoted sales prices as of the close of regular trading on the relevant exchange on each valuation date. Securities that are not traded on the valuation date are valued at the mean of the last quoted bid and ask prices. Prices are normally taken from the principal market in which each security trades. These securities are generally categorized as Level 1 in the hierarchy.
Investments in mutual funds, including money market funds, are valued at their respective NAVs as of the close of the Exchange on the valuation date. These securities are generally categorized as Level 1 in the hierarchy.
Foreign currency forward contracts are valued at their fair market values measured on the basis of the mean between the last current bid and ask prices based on dealer or exchange quotations and are generally categorized as Level 2 in the hierarchy.
Temporary cash investments acquired in excess of 60 days to maturity at the time of purchase are valued using the latest bid prices or using valuations based on a matrix system (which considers such factors as security prices, yields, maturities and ratings), both as furnished by independent pricing services. Temporary cash investments that mature in 60 days or less at the time of purchase (“Short-Term Investments”) are valued using the amortized cost method of valuation, unless the use of such method would be inappropriate. The amortized cost method involves valuing a security at its cost on the date of purchase and thereafter assuming a constant amortization to maturity of the difference between such cost and the value on maturity date. Amortized cost
| | |
| 18 | | MainStay VP MacKay International Equity Portfolio |
approximates the current fair value of a security. Securities valued using the amortized cost method are not valued using quoted prices in an active market and are generally categorized as Level 2 in the hierarchy.
The information above is not intended to reflect an exhaustive list of the methodologies that may be used to value portfolio investments. The valuation procedures permit the use of a variety of valuation methodologies in connection with valuing portfolio investments. The methodology used for a specific type of investment may vary based on the market data available or other considerations. The methodologies summarized above may not represent the specific means by which portfolio investments are valued on any particular business day.
(B) Income Taxes. The Portfolio’s policy is to comply with the requirements of the Internal Revenue Code of 1986, as amended (the “Internal Revenue Code”), applicable to regulated investment companies and to distribute all of its taxable income to the shareholders of the Portfolio within the allowable time limits.
The Manager evaluates the Portfolio’s tax positions to determine if the tax positions taken meet the minimum recognition threshold in connection with accounting for uncertainties in income tax positions taken or expected to be taken for the purposes of measuring and recognizing tax liabilities in the financial statements. Recognition of tax benefits of an uncertain tax position is permitted only to the extent the position is “more likely than not” to be sustained assuming examination by taxing authorities. The Manager analyzed the Portfolio’s tax positions taken on federal, state and local income tax returns for all open tax years (for up to three tax years) and has concluded that no provisions for federal, state and local income tax are required in the Portfolio’s financial statements. The Portfolio’s federal, state and local income tax and federal excise tax returns for tax years for which the applicable statutes of limitations have not expired are subject to examination by the Internal Revenue Service and state and local departments of revenue.
(C) Foreign Taxes. The Portfolio may be subject to foreign taxes on income and other transaction-based taxes imposed by certain countries in which it invests. A portion of the taxes on gains on investments or currency purchases/repatriation may be reclaimable. The Portfolio will accrue such taxes and reclaims as applicable, based upon its current interpretation of tax rules and regulations that exist in the markets in which it invests.
The Portfolio may be subject to taxation on realized capital gains, repatriation proceeds and other transaction-based taxes imposed by certain countries in which it invests. The Portfolio will accrue such taxes as applicable based upon its current interpretation of tax rules and regulations that exist in the market in which it invests. Capital gains taxes relating to positions still held are reflected as a liability in the Statement of Assets and Liabilities, as well as an adjustment to the Portfolio’s net unrealized appreciation (depreciation). Taxes related to capital gains realized, if any, are reflected as part of net realized gain (loss) in the Statement of Operations. Changes in tax liabilities related to capital gains taxes on unrealized investment gains, if any, are reflected as part of the change in net unrealized appreciation (depreciation) on investments in the Statement of Operations. Transaction-based charges are generally assessed as a percentage of the transaction amount.
(D) Dividends and Distributions to Shareholders. Dividends and distributions are recorded on the ex-dividend date. The Portfolio
intends to declare and pay dividends from net investment income and distributions from net realized capital and currency gains, if any, at least annually. Unless a shareholder elects otherwise, all dividends and distributions are reinvested at NAV in the same class of shares of the Portfolio. Dividends and distributions to shareholders are determined in accordance with federal income tax regulations and may differ from determinations using GAAP.
(E) Security Transactions and Investment Income. The Portfolio records security transactions on the trade date. Realized gains and losses on security transactions are determined using the identified cost method. Dividend income is recognized on the ex-dividend date, net of any foreign tax withheld at the source, and interest income is accrued as earned using the effective interest rate method. Distributions received from real estate investment trusts may be classified as dividends, capital gains and/or return of capital.
Investment income and realized and unrealized gains and losses on investments of the Portfolio are allocated pro rata to the separate classes of shares based upon their relative net assets on the date the income is earned or realized and unrealized gains and losses are incurred.
(F) Expenses. Expenses of the Fund are allocated to the individual Portfolios in proportion to the net assets of the respective Portfolios when the expenses are incurred, except where direct allocations of expenses can be made. Expenses (other than fees incurred under the distribution and service plans, further discussed in Note 3(B), which are charged directly to the Service Class shares) are allocated to separate classes of shares pro rata based upon their relative net assets on the date the expenses are incurred. The expenses borne by the Portfolio, including those of related parties to the Portfolio, are shown in the Statement of Operations.
Additionally, the Portfolio may invest in ETFs and mutual funds, which are subject to management fees and other fees that may cause the costs of investing in ETFs and mutual funds to be greater than the costs of owning the underlying securities directly. These indirect expenses of ETFs and mutual funds are not included in the amounts shown as expenses in the Portfolio’s Statement of Operations or in the expense ratios included in the Financial Highlights.
(G) Use of Estimates. In preparing financial statements in conformity with GAAP, the Manager makes estimates and assumptions that affect the reported amounts and disclosures in the financial statements. Actual results could differ from those estimates.
(H) Repurchase Agreements. The Portfolio may enter into repurchase agreements (i.e., buy a security from another party with the agreement that it will be sold back in the future) to earn income. The Portfolio may enter into repurchase agreements only with counterparties, usually financial institutions, that are deemed by the Manager or the Subadvisor to be creditworthy, pursuant to guidelines established by the Board. During the term of any repurchase agreement, the Manager or the Subadvisor will continue to monitor the creditworthiness of the counterparty. Under the 1940 Act, repurchase agreements are considered to be collateralized loans by the Portfolio to the counterparty secured by the securities transferred to the Portfolio.
Repurchase agreements are subject to counterparty risk, meaning the Portfolio could lose money by the counterparty’s failure to perform
Notes to Financial Statements (Unaudited) (continued)
under the terms of the agreement. The Portfolio mitigates this risk by ensuring the repurchase agreement is collateralized by cash, U.S. government securities, fixed income securities and/or other securities. The collateral is held by the Portfolio’s custodian and valued daily on a mark to market basis to determine if the value, including accrued interest, exceeds the repurchase price. In the event of the counterparty’s default on the obligation to repurchase, the Portfolio has the right to liquidate the collateral and apply the proceeds in satisfaction of the obligation. Under certain circumstances, such as in the event of default or bankruptcy by the counterparty, realization and/or retention of the collateral may be limited or subject to delay, to legal proceedings and possible realized loss to the Portfolio. As of June 30, 2020, the Portfolio did not hold any repurchase agreements.
(I) Foreign Currency Transactions. The Portfolio’s books and records are maintained in U.S. dollars. Prices of securities denominated in foreign currency amounts are translated into U.S. dollars at the mean between the buying and selling rates last quoted by any major U.S. bank at the following dates:
| (i) | market value of investment securities, other assets and liabilities—at the valuation date; and |
| (ii) | purchases and sales of investment securities, income and expenses—at the date of such transactions. |
The assets and liabilities that are denominated in foreign currency amounts are presented at the exchange rates and market values at the close of the period. The realized and unrealized changes in net assets arising from fluctuations in exchange rates and market prices of securities are not separately presented.
Net realized gain (loss) on foreign currency transactions represents net currency gains or losses realized as a result of differences between the amounts of securities sale proceeds or purchase cost, dividends, interest and withholding taxes as recorded on the Portfolio’s books, and the U.S. dollar equivalent amount actually received or paid. Net currency gains or losses from valuing such foreign currency denominated assets and liabilities, other than investments at valuation date exchange rates, are reflected in unrealized foreign exchange gains or losses.
(J) Securities Lending. In order to realize additional income, the Portfolio may engage in securities lending, subject to the limitations set forth in the 1940 Act and relevant guidance by the staff of the Securities and Exchange Commission (“SEC”). If the Portfolio engages in securities lending, the Portfolio will lend through its custodian, currently State Street Bank and Trust Company (“State Street”), acting as securities lending agent on behalf of the Portfolio. Under the current arrangement, State Street will manage the Portfolio’s collateral in accordance with the securities lending agency agreement between the Portfolio and State Street, and indemnify the Portfolio against counterparty risk. The loans will be collateralized by cash (which may be invested in a money market fund) and/or non-cash collateral (which may include U.S. Treasury securities and/or U.S. government agency securities issued or guaranteed by the United States government or its agencies or instrumentalities) at least equal at all times to the market value of the securities loaned. The Portfolio bears the risk of delay in recovery of, or loss of rights in, the securities loaned. The Portfolio may also record a realized gain or loss on securities deemed sold due to a borrower’s inability to return securities on loan. The Portfolio bears the risk of any
loss on investment of cash collateral. The Portfolio will receive compensation for lending its securities in the form of fees or it will retain a portion of interest earned on the investment of any cash collateral. The Portfolio will also continue to receive interest and dividends on the securities loaned and any gain or loss in the market price of the securities loaned that may occur during the term of the loan will be for the account of the Portfolio. Income earned from securities lending activities, if any, is reflected in the Statement of Operations. As of June 30, 2020, the Portfolio did not have any portfolio securities on loan.
(K) Foreign Currency Forward Contracts. The Portfolio may enter into foreign currency forward contracts, which are agreements to buy or sell foreign currencies on a specified future date at a specified rate. The Portfolio is subject to foreign currency exchange rate risk in the normal course of investing in these transactions. During the period the forward contract is open, changes in the value of the contract are recognized as unrealized appreciation or depreciation by marking to market such contract on a daily basis to reflect the market value of the contract at the end of each day’s trading. Cash movement occurs on settlement date. When the forward contract is closed, the Portfolio records a realized gain or loss equal to the difference between the proceeds from (or cost of) the closing transaction and the Portfolio’s basis in the contract. The Portfolio may purchase and sell foreign currency forward contracts for purposes of seeking to enhance portfolio returns and manage portfolio risk more efficiently. Foreign currency forward contracts may also be used to gain exposure to a particular currency or to hedge against the risk of loss due to changing currency exchange rates. Foreign currency forward contracts to purchase or sell a foreign currency may also be used in anticipation of future purchases or sales of securities denominated in foreign currency, even if the specific investments have not yet been selected.
The use of foreign currency forward contracts involves, to varying degrees, elements of risk in excess of the amount recognized in the Statement of Assets and Liabilities, including counterparty risk, market risk and illiquidity risk. Counterparty risk is heightened for these instruments because foreign currency forward contracts are not exchange-traded and therefore no clearinghouse or exchange stands ready to meet the obligations under such contracts. Thus, the Portfolio faces the risk that its counterparties under such contracts may not perform their obligations. Market risk is the risk that the value of a foreign currency forward contract will depreciate due to unfavorable changes in exchange rates. Illiquidity risk arises because the secondary market for foreign currency forward contracts may have less liquidity relative to markets for other securities and financial instruments. Risks also arise from the possible movements in the foreign exchange rates underlying these instruments. While the Portfolio may enter into forward contracts to reduce currency exchange risks, changes in currency exchange rates may result in poorer overall performance for the Portfolio than if it had not engaged in such transactions. Exchange rate movements can be large, depending on the currency, and can last for extended periods of time, affecting the value of the Portfolio’s assets. Moreover, there may be an imperfect correlation between the Portfolio’s holdings of securities denominated in a particular currency and forward contracts entered into by the Portfolio. Such imperfect correlation may prevent the Portfolio from achieving the intended hedge or expose the Portfolio to the risk of currency exchange loss. The unrealized appreciation (depreciation) on forward contracts also reflects the Portfolio’s exposure at the valuation
| | |
| 20 | | MainStay VP MacKay International Equity Portfolio |
date to credit loss in the event of a counterparty’s failure to perform its obligations. As of June 30, 2020, the Portfolio did not hold any foreign currency forward contracts.
(L) Foreign Securities Risk. The Portfolio invests in foreign securities, which carry certain risks that are in addition to the usual risks inherent in domestic securities. These risks include those resulting from currency fluctuations, future adverse political or economic developments and possible imposition of currency exchange blockages or other foreign governmental laws or restrictions. These risks are likely to be greater in emerging markets than in developed markets. The ability of issuers of securities held by the Portfolio to meet their obligations may be affected by, among other things, economic or political developments in a specific country, industry or region.
(M) Indemnifications. Under the Fund’s organizational documents, its officers and trustees are indemnified against certain liabilities that may arise out of performance of their duties to the Fund. Additionally, in the normal course of business, the Portfolio enters into contracts with third-party service providers that contain a variety of representations and warranties and that may provide general indemnifications. The Portfolio’s maximum exposure under these arrangements is unknown, as this would involve future claims that may be made against the Portfolio that have not yet occurred. The Manager believes that the risk of loss in connection with these potential indemnification obligations is remote. However, there can be no assurance that material liabilities related to such obligations will not arise in the future, which could adversely impact the Portfolio.
Note 3–Fees and Related Party Transactions
(A) Manager and Subadvisor. New York Life Investments, a registered investment adviser and an indirect, wholly-owned subsidiary of New York Life, serves as the Portfolio’s Manager, pursuant to an Amended and Restated Management Agreement (“Management Agreement”). The Manager provides offices, conducts clerical, recordkeeping and bookkeeping services and keeps most of the financial and accounting records required to be maintained by the Portfolio. Except for the portion of salaries and expenses that are the responsibility of the Portfolio, the Manager pays the salaries and expenses of all personnel affiliated with the Portfolio and certain operational expenses of the Portfolio. The Portfolio reimburses New York Life Investments in an amount equal to the portion of the compensation of the Chief Compliance Officer attributable to the Portfolio. MacKay Shields LLC (“MacKay Shields” or the “Subadvisor”), a registered investment adviser and an indirect, wholly-owned subsidiary of New York Life, serves as
Subadvisor to the Portfolio and is responsible for the day-to-day portfolio management of the Portfolio. Pursuant to the terms of an Amended and Restated Subadvisory Agreement (“Subadvisory Agreement”) between New York Life Investments and MacKay Shields, New York Life Investments pays for the services of the Subadvisor.
The Fund, on behalf of the Portfolio, pays New York Life Investments in its capacity as the Portfolio’s investment manager and administrator, pursuant to the Management Agreement, a monthly fee for the services performed and the facilities furnished at an annual rate of the Portfolio’s average daily net assets as follows: 0.89% up to $500 million; and 0.85% in excess of $500 million. During the six-month period ended June 30, 2020, the effective management fee rate was 0.89%.
During the six-month period ended June 30, 2020, New York Life Investments earned fees from the Portfolio in the amount of $2,034,014 and paid the Subadvisor in the amount of $1,017,007.
State Street provides sub-administration and sub-accounting services to the Portfolio pursuant to an agreement with New York Life Investments. These services include calculating the daily NAVs of the Portfolio, maintaining the general ledger and sub-ledger accounts for the calculation of the Portfolio’s NAVs and assisting New York Life Investments in conducting various aspects of the Portfolio’s administrative operations. For providing these services to the Portfolio, State Street is compensated by New York Life Investments.
Pursuant to an agreement between the Fund and New York Life Investments, New York Life Investments is responsible for providing or procuring certain regulatory reporting services for the Portfolio. The Portfolio will reimburse New York Life Investments for the actual costs incurred by New York Life Investments in connection with providing or procuring these services for the Portfolio.
(B) Distribution and Service Fees. The Fund, on behalf of the Portfolio, has entered into a distribution agreement with NYLIFE Distributors LLC (the “Distributor”), an indirect, wholly-owned subsidiary of New York Life. The Portfolio has adopted a distribution plan (the “Plan”) in accordance with the provisions of Rule 12b-1 under the 1940 Act. Under the Plan, the Distributor has agreed to provide, through its affiliates or independent third parties, various distribution-related, shareholder and administrative support services to the Service Class shareholders. For its services, the Distributor is entitled to a combined distribution and service fee accrued daily and paid monthly at an annual rate of 0.25% of the average daily net assets attributable to the Service Class shares of the Portfolio.
(C) Investments in Affiliates (in 000’s). During the six-month period ended June 30, 2020, purchases and sales transactions, income earned from investments and shares held of investment companies managed by New York Life Investments or its affiliates were as follows:
| | | | | | | | | | | | | | | | | | | | | | | | | | | | | | | | | | | | |
Affiliated Investment Company | | Value,
Beginning of
Period | | | Purchases
at Cost | | | Proceeds
from Sales | | | Net Realized
Gain/(Loss)
on Sales | | | Change in
Unrealized
Appreciation/
(Depreciation) | | | Value,
End of
Period | | | Dividend
Income | | | Other
Distributions | | | Shares
End of
Period | |
| | | | | | | | | |
MainStay U.S. Government Liquidity Fund | | $ | 770 | | | $ | 17,286 | | | $ | (17,980 | ) | | $ | — | | | $ | — | | | $ | 76 | | | $ | 2 | | | $ | — | | | | 76 | |
Notes to Financial Statements (Unaudited) (continued)
Note 4–Federal Income Tax
As of June 30, 2020, the cost and unrealized appreciation (depreciation) of the Portfolio’s investment portfolio, including applicable derivative contracts and other financial instruments, as determined on a federal income tax basis, were as follows:
| | | | | | | | | | | | | | | | |
| | | Federal Tax
Cost | | | Gross
Unrealized
Appreciation | | | Gross
Unrealized
(Depreciation) | | | Net
Unrealized
Appreciation/
(Depreciation) | |
| | | | |
Investments in Securities | | $ | 427,605,694 | | | $ | 48,449,606 | | | $ | (15,385,533 | ) | | $ | 33,064,073 | |
During the year ended December 31, 2019, the tax character of distributions paid as reflected in the Statements of Changes in Net Assets was as follows:
| | |
|
| 2019 |
Tax-Based
Distributions
from Ordinary
Income | | Tax-Based
Distributions
from Long-Term
Gains |
| |
| $7,857,422 | | $52,174,373 |
Note 5–Custodian
State Street is the custodian of cash and securities held by the Portfolio. Custodial fees are charged to the Portfolio based on the Portfolio’s net assets and/or the market value of securities held by the Portfolio and the number of certain transactions incurred by the Portfolio.
Note 6–Line of Credit
The Portfolio and certain other funds managed by New York Life Investments maintain a line of credit with a syndicate of banks in order to secure a source of funds for temporary purposes to meet unanticipated or excessive redemption requests.
Effective July 28, 2020, under the credit agreement (the “Credit Agreement”), the aggregate commitment amount is $600,000,000 with an additional uncommitted amount of $100,000,000. The commitment fee is an annual rate of 0.15% of the average commitment amount payable quarterly, regardless of usage, to JP Morgan Chase Bank NA, who serves as the agent to the syndicate. The commitment fee is allocated among the Portfolio and certain other funds managed by New York Life Investments based upon their respective net assets and other factors. Interest on any revolving credit loan is charged based upon the Federal Funds Rate or the one-month London Interbank Offered Rate (“LIBOR”), whichever is higher. The Credit Agreement expires on July 27, 2021, although the Portfolio, certain other funds managed by New York Life Investments and the syndicate of banks may renew the Credit Agreement for an additional year on the same or different terms or enter into a credit agreement with a different syndicate of banks. Prior to July 28, 2020, the aggregate commitment amount and the commitment fee were the same as those under the current Credit Agreement, but State Street served as agent to the syndicate. During the six-month period ended June 30, 2020, there were no borrowings made or outstanding with respect to the Portfolio under the Credit Agreement or the credit agreement for which State Street served as agent.
Note 7–Interfund Lending Program
Pursuant to an exemptive order issued by the SEC, the Portfolio, along with certain other funds managed by New York Life Investments, may participate in an interfund lending program. The interfund lending program provides an alternative credit facility that permits the Portfolio and certain other funds managed by New York Life Investments to lend or borrow money for temporary purposes directly to or from one another subject to the conditions of the exemptive order. During the six-month period ended June 30, 2020, there were no interfund loans made or outstanding with respect to the Portfolio.
Note 8–Purchases and Sales of Securities (in 000’s)
During the six-month period ended June 30, 2020, purchases and sales of securities, other than short-term securities, were $336,241 and $344,119, respectively.
Note 9–Capital Share Transactions
Transactions in capital shares for the six-month period ended June 30, 2020 and the year ended December 31, 2019, were as follows:
| | | | | | | | |
Initial Class | | Shares | | | Amount | |
| | |
Six-month period ended June 30, 2020: | | | | | | | | |
Shares sold | | | 322,063 | | | $ | 5,096,768 | |
Shares redeemed | | | (574,771 | ) | | | (8,351,638 | ) |
| | | | | | | | |
Net increase (decrease) | | | (252,708 | ) | | $ | (3,254,870 | ) |
| | | | | | | | |
| | |
Year ended December 31, 2019: | | | | | | | | |
Shares sold | | | 1,746,149 | | | $ | 27,979,808 | |
Shares issued to shareholders in reinvestment of distributions | | | 1,647,701 | | | | 23,648,369 | |
Shares redeemed | | | (1,041,402 | ) | | | (16,855,658 | ) |
| | | | | | | | |
Net increase (decrease) | | | 2,352,448 | | | $ | 34,772,519 | |
| | | | | | | | |
| | |
| | | | | | | | |
Service Class | | Shares | | | Amount | |
| | |
Six-month period ended June 30, 2020: | | | | | | | | |
Shares sold | | | 1,257,848 | | | $ | 17,987,676 | |
Shares redeemed | | | (2,046,431 | ) | | | (29,891,920 | ) |
| | | | | | | | |
Net increase (decrease) | | | (788,583 | ) | | $ | (11,904,244 | ) |
| | | | | | | | |
| | |
Year ended December 31, 2019: | | | | | | | | |
Shares sold | | | 2,193,563 | | | $ | 35,029,971 | |
Shares issued to shareholders in reinvestment of distributions | | | 2,557,964 | | | | 36,383,426 | |
Shares redeemed | | | (3,257,115 | ) | | | (52,076,986 | ) |
| | | | | | | | |
Net increase (decrease) | | | 1,494,412 | | | $ | 19,336,411 | |
| | | | | | | | |
Note 10–Recent Accounting Pronouncement
In March 2020, the Financial Accounting Standards Board (“FASB”) issued Accounting Standards Update 2020-04 (“ASU 2020-04”), which provides optional guidance to ease the potential accounting burden associated with transitioning away from LIBOR and other reference rates that are expected to be discontinued. ASU 2020-04 is effective immediately upon release of the update on March 12, 2020 through December 31, 2022. At this time, the Manager is evaluating the implications of certain other provisions of ASU 2020-04 related to new
| | |
| 22 | | MainStay VP MacKay International Equity Portfolio |
disclosure requirements and any impact on the financial statement disclosures has not yet been determined.
Note 11–Subsequent Events
In connection with the preparation of the financial statements of the Portfolio as of and for the six-month period ended June 30, 2020, events and transactions subsequent to June 30, 2020, through the date the financial statements were issued have been evaluated by the Manager, for possible adjustment and/or disclosure. No subsequent events requiring financial statement adjustment or disclosure have been identified.
Note 12–Other Matters
An outbreak of COVID-19, first detected in December 2019, has developed into a global pandemic and has resulted in travel restrictions,
closure of international borders, certain businesses and securities markets, restrictions on securities trading activities, prolonged quarantines, supply chain disruptions, and lower consumer demand, as well as general concern and uncertainty. The continued impact of COVID-19 is uncertain and could further adversely affect the global economy, national economies, individual issuers and capital markets in unforeseeable ways and result in a substantial and extended economic downturn. Developments that disrupt global economies and financial markets, such as COVID-19, may magnify factors that affect the Portfolio’s performance.
Discussion of the Operation and Effectiveness of the Portfolio’s
Liquidity Risk Management Program (Unaudited)
In compliance with Rule 22e-4 under the Investment Company Act of 1940, as amended (the “Liquidity Rule”), the Portfolio has adopted and implemented a liquidity risk management program (the “Program”), which New York Life Investment Management LLC believes is reasonably designed to assess and manage the Portfolio’s liquidity risk. The Board designated New York Life Investment Management LLC as administrator of the Program (the “Administrator”). The Administrator has established a Liquidity Risk Management Committee to assist the Administrator in the implementation and day-to-day administration of the Program and to otherwise support the Administrator in fulfilling its responsibilities under the Program.
At a meeting of the Board held on March 11, 2020, the Administrator provided the Board with a written report addressing the Program’s operation, adequacy and effectiveness of implementation for the period from December 1, 2018 through December 31, 2019, as required under the Liquidity Rule. The report noted that the Administrator concluded that (i) the Program operated effectively to assess and manage the Portfolio’s liquidity risk, (ii) the Program has been adequately and effectively implemented to monitor and, as applicable, respond to the Portfolio’s liquidity developments and (iii) the Portfolio’s investment strategy continues to be appropriate for an open-end portfolio.
In accordance with the Program, the Portfolio’s liquidity risk is assessed no less frequently than annually taking into consideration certain factors, as applicable, such as (i) investment strategy and liquidity of portfolio investments, (ii) short-term and long-term cash flow projections and (iii) holdings of cash and cash equivalents and borrowing arrangements and other funding sources. Certain factors are considered under both normal and reasonably foreseeable stressed conditions.
Each Portfolio portfolio investment is classified into one of four liquidity categories. The classification is based on a determination of the number of days it is reasonably expected to take to convert the investment into cash, or sell or dispose of the investment, in current market conditions without significantly changing the market value of the investment. The Administrator has delegated liquidity classification determinations to the Portfolio’s subadvisor, subject to appropriate oversight by the Administrator, and classification determinations are made by taking into account the Portfolio’s reasonably anticipated trade size, various market, trading and investment-specific considerations, as well as market depth, and, in certain cases, third-party vendor data.
The Liquidity Rule requires portfolios that do not primarily hold assets that are highly liquid investments to adopt a minimum amount of net assets that must be invested in highly liquid investments that are assets (an “HLIM”). In addition, the Liquidity Rule limits a portfolio’s investments in illiquid investments. Specifically, the Liquidity Rule prohibits acquisition of illiquid investments if doing so would result in a portfolio holding more than 15% of its net assets in illiquid investments that are assets. The Program includes provisions reasonably designed to determine, periodically review and comply with the HLIM requirement, as applicable, and to comply with the 15% limit on illiquid investments.
| | |
| 24 | | MainStay VP MacKay International Equity Portfolio |
Proxy Voting Policies and Procedures and Proxy Voting Record
A description of the policies and procedures that New York Life Investments uses to vote proxies related to the Portfolio’s securities is available free of charge upon request (i) by calling 800-598-2019; (ii) by visiting New York Life Investments’ website at https://www.nylinvestments.com/mainstay/products-and-performance/mainstay-vp-funds-trust; or (iii) by visiting the SEC’s website at www.sec.gov.
The Portfolio is required to file with the SEC its proxy voting record for the 12-month period ending June 30 on Form N-PX. The Portfolio’s most recent Form N-PX or proxy voting record is available free of charge upon request (i) by calling 800-598-2019; (ii) by visiting New York Life Investments’ website at https://www.nylinvestments.com/mainstay/products-and-performance/mainstay-vp-funds-trust; or (iii) by visiting the SEC’s website at www.sec.gov.
Shareholder Reports and Quarterly Portfolio Disclosure
The Portfolio is required to file its complete schedule of portfolio holdings with the SEC 60 days after its first and third fiscal quarter on Form N-PORT. The Portfolio’s holdings report is available free of charge upon request by calling 800-598-2019 or by visiting the SEC’s website at www.sec.gov.
MainStay VP Portfolios
MainStay VP offers a wide range of Portfolios. The full array of MainStay VP offerings is listed here, with information about the manager, subadvisors, legal counsel, and independent registered public accounting firm.
Equity Portfolios
MainStay VP Emerging Markets Equity Portfolio
MainStay VP Epoch U.S. Equity Yield Portfolio
MainStay VP Fidelity Institutional AM® Utilities Portfolio†
MainStay VP MacKay Common Stock Portfolio
MainStay VP MacKay Growth Portfolio
MainStay VP MacKay International Equity Portfolio
MainStay VP MacKay Mid Cap Core Portfolio
MainStay VP MacKay S&P 500 Index Portfolio
MainStay VP MacKay Small Cap Core Portfolio
MainStay VP Mellon Natural Resources Portfolio
MainStay VP Small Cap Growth Portfolio
MainStay VP T. Rowe Price Equity Income Portfolio
MainStay VP Winslow Large Cap Growth Portfolio
Mixed Asset Portfolios
MainStay VP Balanced Portfolio
MainStay VP Income Builder Portfolio
MainStay VP Janus Henderson Balanced Portfolio
MainStay VP MacKay Convertible Portfolio
Income Portfolios
MainStay VP Bond Portfolio
MainStay VP Floating Rate Portfolio
MainStay VP Indexed Bond Portfolio
MainStay VP MacKay Government Portfolio
MainStay VP MacKay High Yield Corporate Bond Portfolio
MainStay VP MacKay Unconstrained Bond Portfolio
MainStay VP PIMCO Real Return Portfolio
Money Market
MainStay VP U.S. Government Money Market Portfolio
Alternative
MainStay VP CBRE Global Infrastructure Portfolio
MainStay VP IQ Hedge Multi-Strategy Portfolio
Asset Allocation Portfolios
MainStay VP Conservative Allocation Portfolio
MainStay VP Growth Allocation Portfolio
MainStay VP Moderate Allocation Portfolio
MainStay VP Moderate Growth Allocation Portfolio
Manager
New York Life Investment Management LLC
New York, New York
Subadvisors
Brown Advisory LLC
Baltimore, Maryland
Candriam Belgium S.A.*
Brussels, Belgium
CBRE Clarion Securities LLC
Radnor, Pennsylvania
Epoch Investment Partners, Inc.
New York, New York
FIAM LLC
Smithfield, Rhode Island
IndexIQ Advisors LLC*
New York, New York
Janus Capital Management LLC
Denver, Colorado
MacKay Shields LLC*
New York, New York
Mellon Investments Corporation
Boston, Massachusetts
NYL Investors LLC*
New York, New York
Pacific Investment Management Company LLC
Newport Beach, California
Segall Bryant & Hamill, LLC
Chicago, Illinois
T. Rowe Price Associates, Inc.
Baltimore, Maryland
Winslow Capital Management, LLC
Minneapolis, Minnesota
Distributor
NYLIFE Distributors LLC*
Jersey City, New Jersey
Custodian
State Street Bank and Trust Company
Boston, Massachusetts
Independent Registered Public Accounting Firm
PricewaterhouseCoopers LLP
New York, New York
Legal Counsel
Dechert LLP
Washington, District of Columbia
Some Portfolios may not be available in all products.
| † | Fidelity Institutional AM is a registered trade mark of FMR LLC. Used with permission. |
| * | An affiliate of New York Life Investment Management LLC |
Not part of the Semiannual Report
2020 Semiannual Report
This report is for the general information of New York Life Variable Annuities and NYLIAC Variable Universal Life Insurance Products policyowners. It must be preceded or accompanied by the appropriate product(s) and funds prospectuses if it is given to anyone who is not an owner of a New York Life variable annuity policy or a NYLIAC Variable Universal Life Insurance Product. This report does not offer for sale or solicit orders to purchase securities.
The performance data quoted in this report represents past performance. Past performance is no guarantee of future results. Due to market volatility and other factors, current performance may be lower or higher than the figures shown. The most recent month-end performance summary for your variable annuity or variable life policy is available by calling 800-598-2019 and is updated periodically on www.newyorklife.com.
The New York Life Variable Annuities and NYLIAC Variable Universal Life Insurance Products are issued by New York Life Insurance and Annuity Corporation (a Delaware Corporation) and distributed by NYLIFE Distributors LLC (Member FINRA/SIPC).
New York Life Insurance Company
New York Life Insurance and Annuity Corporation
(NYLIAC) (A Delaware Corporation)
51 Madison Avenue, Room 551
New York, NY 10010
www.newyorklife.com
Printed on recycled paper
nylinvestments.com
NYLIFE Distributors LLC, 30 Hudson Street, Jersey City, NJ 07302
New York Life Investment Management LLC is the investment manager to the MainStay VP Funds Trust
©2020 by NYLIFE Distributors LLC. All rights reserved.
You may obtain copies of the Prospectus and the Statement of Additional Information free of charge, upon request, by calling toll-free 800-598-2019 or writing to New York Life Insurance and Annuity Corporation, 51 Madison Avenue, New York, NY 10010.
| | | | |
| Not FDIC Insured | | No Bank Guarantee | | May Lose Value |
| | | | |
| 1781629 | | | | MSVPIE10-08/20 (NYLIAC) NI523 |
MainStay VP Winslow Large Cap Growth Portfolio
(Formerly MainStay VP Large Cap Growth Portfolio)
Message from the President and Semiannual Report
Unaudited | June 30, 2020
Beginning on January 1, 2021, as permitted by regulations adopted by the Securities and Exchange Commission, paper copies of the MainStay VP Portfolio annual and semi-annual shareholder reports may no longer be sent by mail, unless you specifically request paper copies of the reports from the insurance company that offers your policy. Instead, the reports will be made available online, and you will be notified by mail each time a report is posted and provided with a website link to access the report. Instructions for requesting paper copies will be provided by your insurance company.
If you already elected to receive shareholder reports electronically, you will not be affected by this change and you need not take any action. At any time, you may elect to receive reports and other communications from the insurance company electronically by following the instructions provided by the insurance company.
You may elect to receive all future shareholder reports in paper form free of charge. You can inform the insurance company that you wish to receive paper copies of reports by following the instructions provided by the insurance company. Your election to receive reports in paper form will apply to all portfolio companies available under your contract.
| | | | | | | | |
| Not FDIC/NCUA Insured | | Not a Deposit | | May Lose Value | | No Bank Guarantee | | Not Insured by Any Government Agency |

This page intentionally left blank
Message from the President
High levels of volatility shook financial markets in response to the COVID-19 pandemic and an abrupt decline in global economic activity during the six months ended June 30, 2020.
Markets entered 2020 riding strong fourth quarter performance and an economic expansion of historic longevity. Most broad stock and bond indices began to dip in late February as growing numbers of COVID-19 cases were seen in hotspots around the world. On March 11, 2020, the World Health Organization acknowledged that the disease had reached pandemic proportions, with over 80,000 identified cases in China, thousands in Italy, South Korea and the United States, and more in dozens of additional countries. Governments and central banks pledged trillions of dollars to address the mounting economic and public health crisis; however, “stay-at-home” orders and other restrictions on non-essential activity caused global economic activity to slow. Most stocks and bonds lost significant ground in this challenging environment, with equities declining by roughly a third and the yield on high-yield credit indices shooting higher.
Policymakers responded with extraordinary speed to address the situation. In the United States, the Federal Reserve (“Fed”) cut interest rates to near zero and announced unlimited quantitative easing. With help from Treasury, the Fed later rolled out a series of lending facilities to directly support market functioning. In late March, the Federal government declared a national emergency; Congress passed, and the President signed, a $2 trillion CARES Act (The Coronavirus Aid, Relief, and Economic Security Act), with the promise of further assistance for consumers and businesses to come. This enormous wave of policy support helped fuel a rapid recovery in market pricing as stocks bounced back and credit spreads narrowed. Some states rushed to ease restrictions on travel and social gatherings, further fueling optimism that the effects of the pandemic might prove short lived. However, the final weeks of the reporting period saw infection rates beginning to rise in some of the first states to reopen, raising concerns that a second round of restrictive government policies might prove necessary, once again stifling economic activity.
Despite all the market volatility, the broadly based S&P 500® Index finished the first half of 2020 only slightly below its starting point and the technology-heavy NASDAQ Composite Index posted gains, closing in near record territory. Small-cap stocks tended to trail their large cap counterparts, as illustrated by the Russell 2000® Index’s loss of approximately 15%, while value-oriented stocks lagged growth-oriented issues. From a global perspective, U.S. stocks generally outperformed international equities, with emerging markets hit particularly hard by the flight from risk.
Fixed-income markets also experienced unusually high levels of volatility. Recognized safe havens, such as U.S. government bonds, attracted increased investment, driving yields lower and prices higher, positioning long-term Treasury bonds to deliver particularly strong gains. Investment-grade corporate bonds lost value in March before recovering in the closing months of the reporting period, while relatively speculative high-yield credit faced the brunt of risk-off sentiment. Emerging market debt underperformed most other bonds types as investors sought to minimize currency and sovereign risks.
Today, as we at New York Life Investments continue to track the ongoing health crisis and its financial ramifications, we are particularly mindful of the people at the heart of our enterprise—our colleagues and valued clients. By taking appropriate steps to minimize community spread of COVID-19 within our organization, we strive to safeguard the health of our investment professionals so they can continue to provide you, as a MainStay investor, with world class investment solutions in this rapidly evolving environment.
Sincerely,

Kirk C. Lehneis
President
The opinions expressed are as of the date of this report and are subject to change. There is no guarantee that any forecast made will come to pass. This material does not constitute investment advice and is not intended as an endorsement of any specific investment. Past performance is no guarantee of future results.
Not part of the Semiannual Report
Table of Contents
Investors should refer to the Portfolio’s Summary Prospectus and/or Prospectus and consider the Portfolio’s investment objectives, strategies, risks, charges and expenses carefully before investing. The Summary Prospectus and/or Prospectus contain this and other information about the Portfolio. You may obtain copies of the Portfolio’s Summary Prospectus and/or the Prospectus and the Statement of Additional Information free of charge, upon request, by calling toll-free 800-598-2019, by writing to New York Life Insurance and Annuity Corporation, 51 Madison Avenue, Room 251, New York, New York 10010 or by sending an email to MainStayShareholdersServices@nylim.com. These documents are also available at nylinvestments.com/vpdocuments. Please read the Summary Prospectus and/or Prospectus carefully before investing. MainStay VP Funds Trust portfolios are separate account options which are purchased through a variable insurance or variable annuity contract.
Investment and Performance Comparison1 (Unaudited)
Performance data quoted represents past performance. Past performance is no guarantee of future results. Because of market volatility and other factors, current performance may be lower or higher than the figures shown. Investment return and principal value will fluctuate, and as a result, when shares are redeemed, they may be worth more or less than their original cost. The performance table and graph do not reflect any deduction of sales charges, mortality and expense charges, contract charges or administrative charges. Please refer to the Performance Summary appropriate for your policy. For performance information current to the most recent month-end, please call 800-598-2019 or visit www.newyorklife.com.
Average Annual Total Returns for the Period-Ended June 30, 2020
| | | | | | | | | | | | | | | | | | | | | | |
| Class | | Inception
Date | | Six Months | | | One Year | | | Five Years | | | Ten Years | | | Gross
Expense
Ratio2 | |
| | | | | | |
| Initial Class Shares | | 5/1/1998 | | | 12.10 | % | | | 21.79 | % | | | 15.40 | % | | | 16.72 | % | | | 0.76 | % |
| Service Class Shares | | 6/6/2003 | | | 11.96 | | | | 21.48 | | | | 15.11 | | | | 16.43 | | | | 1.01 | |
| | | | | | | | | | | | | | | | |
| Benchmark Performance | | Six
Months | | | One
Year | | | Five
Years | | | Ten
Years | |
| | | | |
Russell 1000® Growth Index3 | | | 9.81 | % | | | 23.28 | % | | | 15.89 | % | | | 17.23 | % |
S&P 500® Index4 | | | –3.08 | | | | 7.51 | | | | 10.73 | | | | 13.99 | |
Morningstar Large Growth Category Average5 | | | 7.84 | | | | 17.34 | | | | 12.84 | | | | 15.12 | |
| 1. | Performance figures may reflect certain fee waivers and/or expense limitations, without which total returns may have been different. For information on current fee waivers and/or expense limitations (if any), please refer to the Notes to Financial Statements. |
| 2. | The gross expense ratios presented reflect the Portfolio’s “Total Annual Portfolio Operating Expenses” from the most recent Prospectus, as supplemented, and may differ from other expense ratios disclosed in this report. |
| 3. | The Russell 1000® Growth Index is the Portfolio’s primary broad-based securities market index for comparison purposes. The Russell 1000® Growth Index measures the performance of the large-cap growth segment of the U.S. equity universe. It includes those Russell 1000® Index companies with higher price-to-book ratios and higher forecasted growth values. Results assume reinvestment of all dividends and capital gains. An investment cannot be made directly in an index. |
| 4. | The S&P 500® Index is the Portfolio’s secondary benchmark. “S&P 500®” is a trademark of The McGraw-Hill Companies, Inc. The S&P 500® Index is widely regarded as the standard index for measuring large-cap U.S. stock market performance. Results assume reinvestment of all dividends and capital gains. An investment cannot be made directly in an index. |
| 5. | The Morningstar Large Growth Category Average is representative of funds that invest primarily in big U.S. companies that are projected to grow faster than other large-cap stocks. Stocks in the top 70% of the capitalization of the U.S. equity market are defined as large cap. Growth is defined based on fast growth and high valuations. Most of these funds focus on companies in rapidly expanding industries. Results are based on average total returns of similar funds with all dividends and capital gain distributions reinvested. |
Cost in Dollars of a $1,000 Investment in MainStay VP Winslow Large Cap Growth Portfolio (Unaudited)
The example below is intended to describe the fees and expenses borne by shareholders during the six-month period from January 1, 2020, to June 30, 2020, and the impact of those costs on your investment.
Example
As a shareholder of the Portfolio you incur two types of costs: (1) transaction costs, including exchange fees and sales charges (loads) on purchases (as applicable), and (2) ongoing costs, including management fees, distribution and/or service (12b-1) fees, and other Portfolio expenses (as applicable). This example is intended to help you understand your ongoing costs (in dollars) of investing in the Portfolio and to compare these costs with the ongoing costs of investing in other mutual funds. The example is based on an investment of $1,000 made at the beginning of the six-month period and held for the entire period from January 1, 2020, to June 30, 2020. Shares are only sold in connection with variable life and annuity contracts and the example does not reflect any contract level or transactional fees or expenses. If these costs had been included, your costs would have been higher.
This example illustrates your Portfolio’s ongoing costs in two ways:
Actual Expenses
The second and third data columns in the table below provide information about actual account values and actual expenses. You may use the information in these columns, together with the amount you invested, to estimate the expenses that you paid during the six months
ended June 30, 2020. Simply divide your account value by $1,000 (for example, an $8,600 account value divided by $1,000 = 8.6), then multiply the result by the number under the heading entitled “Expenses Paid During Period” to estimate the expenses you paid on your account during this period.
Hypothetical Example for Comparison Purposes
The fourth and fifth data columns in the table below provide information about hypothetical account values and hypothetical expenses based on the Portfolio’s actual expense ratio and an assumed rate of return of 5% per year before expenses, which is not the Portfolio’s actual return. The hypothetical account values and expenses may not be used to estimate the actual ending account balances or expenses you paid for the six-month period shown. You may use this information to compare the ongoing costs of investing in the Portfolio with the ongoing costs of investing in other mutual funds. To do so, compare this 5% hypothetical example with the 5% hypothetical examples that appear in the shareholder reports of the other mutual funds.
Please note that the expenses shown in the table are meant to highlight your ongoing costs only and do not reflect any transactional costs, such as exchange fees or sales charges (loads). Therefore, the fourth and fifth data columns of the table are useful in comparing ongoing costs only and will not help you determine the relative total costs of owning different funds. In addition, if these transactional costs were included, your costs would have been higher.
| | | | | | | | | | | | | | | | | | | | | | |
| | | | | | | | | | | | | | | | | | |
| Share Class | | Beginning
Account
Value
1/1/20 | | | Ending Account
Value (Based
on Actual
Returns and
Expenses)
6/30/20 | | | Expenses
Paid
During
Period1 | | | Ending Account
Value (Based
on Hypothetical
5% Annualized
Return and
Actual Expenses)
6/30/20 | | | Expenses
Paid
During
Period1 | | | Net Expense
Ratio
During
Period2 |
| | | | | | |
| Initial Class Shares | | $ | 1,000.00 | | | $ | 1,121.00 | | | $ | 3.96 | | | $ | 1,021.13 | | | $ | 3.77 | | | 0.75% |
| | | | | | |
| Service Class Shares | | $ | 1,000.00 | | | $ | 1,119.60 | | | $ | 5.27 | | | $ | 1,019.89 | | | $ | 5.02 | | | 1.00% |
| 1 | Expenses are equal to the Portfolio’s annualized expense ratio of each class multiplied by the average account value over the period, divided by 366 and multiplied by 182 (to reflect the six-month period). The table above represents the actual expenses incurred during the six-month period. In addition to the fees and expenses which the Portfolio bears directly, it also indirectly bears a pro rata share of the fees and expenses of the underlying funds in which it invests. Such indirect expenses are not included in the above-reported expense figures. |
| 2 | Expenses are equal to the Portfolio’s annualized expense ratio to reflect the six-month period. |
| | |
| 6 | | MainStay VP Winslow Large Cap Growth Portfolio |
Industry Composition as of June 30, 2020 (Unaudited)
| | | | |
| |
| Software | | | 21.5 | % |
| |
| IT Services | | | 13.6 | |
| |
| Interactive Media & Services | | | 10.0 | |
| |
| Internet & Direct Marketing Retail | | | 9.7 | |
| |
| Technology Hardware, Storage & Peripherals | | | 6.5 | |
| |
| Pharmaceuticals | | | 5.0 | |
| |
| Semiconductors & Semiconductor Equipment | | | 3.3 | |
| |
| Capital Markets | | | 3.0 | |
| |
| Health Care Providers & Services | | | 3.0 | |
| |
| Equity Real Estate Investment Trusts | | | 2.9 | |
| |
| Life Sciences Tools & Services | | | 2.4 | |
| |
| Textiles, Apparel & Luxury Goods | | | 2.2 | |
| |
| Professional Services | | | 1.9 | |
| |
| Health Care Equipment & Supplies | | | 1.8 | |
| | | | |
| |
| Specialty Retail | | | 1.8 | % |
| |
| Automobiles | | | 1.5 | |
| |
| Biotechnology | | | 1.4 | |
| |
| Chemicals | | | 1.2 | |
| |
| Containers & Packaging | | | 1.2 | |
| |
| Personal Products | | | 1.2 | |
| |
| Entertainment | | | 1.1 | |
| |
| Health Care Technology | | | 1.1 | |
| |
| Hotels, Restaurants & Leisure | | | 1.1 | |
| |
| Food & Staples Retailing | | | 0.9 | |
| |
| Short-Term Investment | | | 0.7 | |
| |
| Other Assets, Less Liabilities | | | 0.0 | ‡ |
| | | | |
| |
| | | 100.0 | % |
| | | | |
See Portfolio of Investments beginning on page 10 for specific holdings within these categories. The Portfolio’s holdings are subject to change.
| ‡ | Less than one-tenth of a percent. |
Top Ten Holdings as of June 30, 2020 (excluding short-term investment) (Unaudited)
| 5. | Facebook, Inc., Class A |
| 10. | UnitedHealth Group, Inc. |
Portfolio Management Discussion and Analysis (Unaudited)
Answers to the questions reflect the views of portfolio managers Justin H. Kelly, CFA, and Patrick M. Burton, CFA, of Winslow Capital Management, LLC, the Portfolio’s Subadvisor.
How did MainStay VP Winslow Large Cap Growth Portfolio perform relative to its benchmarks and peers during the six months ended June 30, 2020?
For the six months ended June 30, 2020, MainStay VP Winslow Large Cap Growth Portfolio returned 12.10% for Initial Class shares and 11.96% for Service Class shares. Over the same period, both share classes outperformed the 9.81% return of the Russell 1000® Growth Index, which is the Portfolio’s primary benchmark and a broad-based securities-market index, and the –3.08% return of the S&P 500® Index, which is a secondary benchmark of the Portfolio. For the six months ended June 30, 2020, both share classes also outperformed the 7.84% return of the Morningstar Large Growth Category Average.1
During the reporting period, were there any market events that materially impacted the Portfolio’s performance or liquidity?
The COVID-19 pandemic materially impacted the Portfolio’s performance. During the first half of 2020, social distancing temporarily shut down large swaths of global economies, which experienced significant contractions. Governments around the world responded quickly with the largest fiscal stimuli in history and central banks introduced unprecedented monetary policy initiatives.
From mid-February highs, U.S. equity markets experienced the sharpest correction in history, driving the S&P 500® Index down –19.6%. A similarly powerful market recovery followed in the second quarter of 2020 as investors focused on unprecedented fiscal and monetary initiatives and looked forward to a 2021 economic and corporate earnings recovery.
What factors affected the Portfolio’s relative performance during the reporting period?
From an attribution perspective, the Portfolio outperformed the Russell 1000® Growth Index during the reporting period predominantly due to strong sector allocation, although stock selection also produced a modest positive contribution to the Portfolio’s relative performance. (Contributions take weightings and total returns into account.)
Which sectors were the strongest positive contributors to the Portfolio’s relative performance, and which sectors were particularly weak?
The three strongest positive-contributing sectors to the Portfolio’s relative performance versus the Russell 1000® Growth Index were industrials, consumer staples and information technology. The outperformance of the Portfolio in the industrials and consumer staples sectors was predominantly the result of the Portfolio’s underweight exposure to these lagging
sectors, although stock selection within both sectors was also additive to relative performance. Within information technology, the Portfolio’s outperformance was driven equally by its overweight sector exposure and strong security selection.
The three weakest-contributing sectors to the Portfolio’s relative performance versus the benchmark were consumer discretionary, materials and utilities.
During the reporting period, which individual stocks made the strongest positive contributions to the Portfolio’s absolute performance and which stocks detracted the most?
The leading positive contributors to the Portfolio’s absolute performance during the reporting period included holdings in online retailer Amazon.com, software developer Microsoft and digital payments platform PayPal. Gains in Amazon.com were driven by the company’s dominant ecommerce retail business, and by the growth of its public cloud offering, Amazon Web Services. The company experienced strong topline growth and expanding margins in both segments. Microsoft, the Portfolio’s largest single position during the reporting period, remained the largest software company in the world, while transitioning to also be one of the largest public cloud companies as well, through its fast-growing Azure business. PayPal Holdings, with digital payment offerings that include PayPal, Venmo and Xoom, proved well-positioned to take advantage of changes in consumer behavior due to the pandemic. All three names remain in the portfolio.
Notable detractors from the Portfolio’s absolute performance during the same period included China-based coffee retailer Luckin Coffee, home improvement specialty retailer Lowe’s and semiconductor company Microchip. We saw potential for rapid growth in Luckin Coffee given its asset-light, coffee kiosk business model and the anticipated increases in coffee consumption in China from current levels of approximately five cups per year. However, on April 2nd, the company announced potential fraud including the overstatement of reported revenues, driving the stock sharply lower. Lowe’s stock was negatively impacted by the pandemic. Microchip stock suffered due to a deteriorating fundamental outlook stemming from a weakening macroeconomic environment. The Portfolio sold all three positions.
Did the Portfolio make any significant purchases or sales during the reporting period?
The Portfolio’s three largest purchases during the reporting period included global pharmaceutical company Eli Lilly, wireless and broadcast communications infrastructure company American Tower, and home improvement specialty retailer Home Depot. The Portfolio’s new position in Eli Lilly reflected our opinion that the company’s dominant diabetes franchise would likely lead to earnings growth due to the launch of
| 1. | See page 5 for more information on benchmark and peer group returns. |
| | |
| 8 | | MainStay VP Winslow Large Cap Growth Portfolio |
multiple new treatments. The purchase of shares in American Tower was prompted by our strong outlook for the cellular tower industry. Regarding Home Depot, our channel work suggested that this operational leader was likely to experience strong sales even in the pandemic environment.
Significant sales during the reporting period included specialty retailer Lowe’s, covered above, multinational biopharmaceutical company Amgen and global aerospace manufacturer Boeing. We sold the Portfolio’s position in Amgen as our research suggested weaker future pipeline growth. In the case of Boeing, we anticipated an outsized impact of COVID-19 on air travel.
How did the Portfolio’s sector weightings change during the reporting period?
During the reporting period, the Portfolio’s sector weightings relative to the Russell 1000® Growth Index underwent several shifts due to structural changes within the Portfolio, as well as the reconstitution of the Index. The Portfolio’s exposure to the
financials sector increased in absolute terms, while changing on a relative basis from mildly underweight to mildly overweight as the Index’s weight in financials decreased. Within the information technology sector, the Portfolio’s absolute exposure increased. At the same time, the size of its information technology overweight relative to the benchmark declined somewhat as the Index weight in information technology increased.
How was the Portfolio positioned at the end of the reporting period?
As of June 30, 2020, the Portfolio’s largest sector positions on an absolute basis included information technology and consumer discretionary, both of which were slightly overweight exposures relative to the Russell 1000® Growth Index. As of the same date, the Portfolio’s smallest sector positions on an absolute basis were industrials and consumer staples, both of which were underweight positions relative to the benchmark.
The opinions expressed are those of the portfolio managers as of the date of this report and are subject to change. There is no guarantee that any forecasts will come to pass. This material does not constitute investment advice and is not intended as an endorsement of any specific investment.
Not all MainStay VP Portfolios and/or share classes are available under all policies.
Portfolio of Investments June 30, 2020 (Unaudited)
| | | | | | | | |
| | |
| | | Shares | | | Value | |
| Common Stocks 99.3%† | |
Automobiles 1.5% | |
Ferrari N.V. | | | 120,300 | | | $ | 20,572,503 | |
| | | | | | | | |
|
Biotechnology 1.4% | |
BioMarin Pharmaceutical, Inc. (a) | | | 148,700 | | | | 18,340,658 | |
| | | | | | | | |
|
Capital Markets 3.0% | |
Moody’s Corp. | | | 86,840 | | | | 23,857,553 | |
MSCI, Inc. | | | 49,000 | | | | 16,357,180 | |
| | | | | | | | |
| | | | | | | 40,214,733 | |
| | | | | | | | |
Chemicals 1.2% | |
Linde PLC | | | 74,900 | | | | 15,887,039 | |
| | | | | | | | |
|
Containers & Packaging 1.2% | |
Ball Corp. | | | 226,800 | | | | 15,760,332 | |
| | | | | | | | |
|
Entertainment 1.1% | |
Netflix, Inc. (a) | | | 33,700 | | | | 15,334,848 | |
| | | | | | | | |
|
Equity Real Estate Investment Trusts 2.9% | |
American Tower Corp. | | | 82,300 | | | | 21,277,842 | |
Equinix, Inc. | | | 25,320 | | | | 17,782,236 | |
| | | | | | | | |
| | | | | | | 39,060,078 | |
| | | | | | | | |
Food & Staples Retailing 0.9% | |
Costco Wholesale Corp. | | | 38,600 | | | | 11,703,906 | |
| | | | | | | | |
|
Health Care Equipment & Supplies 1.8% | |
Abbott Laboratories | | | 157,100 | | | | 14,363,653 | |
Boston Scientific Corp. (a) | | | 280,700 | | | | 9,855,377 | |
| | | | | | | | |
| | | | | | | 24,219,030 | |
| | | | | | | | |
Health Care Providers & Services 3.0% | |
UnitedHealth Group, Inc. | | | 137,910 | | | | 40,676,555 | |
| | | | | | | | |
|
Health Care Technology 1.1% | |
Veeva Systems, Inc., Class A (a) | | | 62,750 | | | | 14,709,855 | |
| | | | | | | | |
|
Hotels, Restaurants & Leisure 1.1% | |
Chipotle Mexican Grill, Inc. (a) | | | 14,700 | | | | 15,469,692 | |
| | | | | | | | |
|
Interactive Media & Services 10.0% | |
Alphabet, Inc. (a) | |
Class A | | | 26,255 | | | | 37,230,903 | |
Class C | | | 26,649 | | | | 37,671,293 | |
Facebook, Inc., Class A (a) | | | 266,800 | | | | 60,582,276 | |
| | | | | | | | |
| | | | | | | 135,484,472 | |
| | | | | | | | |
| | | | | | | | |
| | |
| | | Shares | | | Value | |
Internet & Direct Marketing Retail 9.7% | |
Alibaba Group Holding, Ltd., Sponsored ADR (a) | | | 59,250 | | | $ | 12,780,225 | |
Amazon.com, Inc. (a) | | | 42,935 | | | | 118,449,937 | |
| | | | | | | | |
| | | | | | | 131,230,162 | |
| | | | | | | | |
IT Services 13.6% | |
Fiserv, Inc. (a) | | | 147,300 | | | | 14,379,426 | |
GoDaddy, Inc., Class A (a) | | | 189,800 | | | | 13,918,034 | |
Mastercard, Inc., Class A | | | 135,550 | | | | 40,082,135 | |
PayPal Holdings, Inc. (a) | | | 243,100 | | | | 42,355,313 | |
Visa, Inc., Class A | | | 296,400 | | | | 57,255,588 | |
Wix.com, Ltd. (a) | | | 57,950 | | | | 14,847,949 | |
| | | | | | | | |
| | | | | | | 182,838,445 | |
| | | | | | | | |
Life Sciences Tools & Services 2.4% | |
IQVIA Holdings, Inc. (a) | | | 108,700 | | | | 15,422,356 | |
Thermo Fisher Scientific, Inc. | | | 47,500 | | | | 17,211,150 | |
| | | | | | | | |
| | | | | | | 32,633,506 | |
| | | | | | | | |
Personal Products 1.2% | |
Estee Lauder Cos., Inc., Class A | | | 87,300 | | | | 16,471,764 | |
| | | | | | | | |
|
Pharmaceuticals 5.0% | |
AstraZeneca PLC, Sponsored ADR | | | 396,600 | | | | 20,976,174 | |
Eli Lilly & Co. | | | 157,100 | | | | 25,792,678 | |
Zoetis, Inc. | | | 154,350 | | | | 21,152,124 | |
| | | | | | | | |
| | | | | | | 67,920,976 | |
| | | | | | | | |
Professional Services 1.9% | |
CoStar Group, Inc. (a) | | | 16,835 | | | | 11,964,129 | |
TransUnion | | | 152,300 | | | | 13,256,192 | |
| | | | | | | | |
| | | | | | | 25,220,321 | |
| | | | | | | | |
Semiconductors & Semiconductor Equipment 3.3% | |
ASML Holding N.V., Registered | | | 36,500 | | | | 13,433,095 | |
NVIDIA Corp. | | | 80,850 | | | | 30,715,723 | |
| | | | | | | | |
| | | | | | | 44,148,818 | |
| | | | | | | | |
Software 21.5% | |
Adobe, Inc. (a) | | | 116,000 | | | | 50,495,960 | |
Atlassian Corp. PLC, Class A (a) | | | 71,000 | | | | 12,799,170 | |
Intuit, Inc. | | | 114,650 | | | | 33,958,184 | |
Microsoft Corp. | | | 617,700 | | | | 125,708,127 | |
salesforce.com, Inc. (a) | | | 278,650 | | | | 52,199,504 | |
Workday, Inc., Class A (a) | | | 75,150 | | | | 14,080,104 | |
| | | | | | | | |
| | | | | | | 289,241,049 | |
| | | | | | | | |
Specialty Retail 1.8% | |
Home Depot, Inc. | | | 98,500 | | | | 24,675,235 | |
| | | | | | | | |
|
Technology Hardware, Storage & Peripherals 6.5% | |
Apple, Inc. | | | 239,500 | | | | 87,369,600 | |
| | | | | | | | |
| | | | |
| 10 | | MainStay VP Winslow Large Cap Growth Portfolio | | The notes to the financial statements are an integral part of,
and should be read in conjunction with, the financial statements. |
| | | | | | | | |
| | |
| | | Shares | | | Value | |
| Common Stocks (continued) | |
Textiles, Apparel & Luxury Goods 2.2% | |
NIKE, Inc., Class B | | | 299,350 | | | $ | 29,351,268 | |
| | | | | | | | |
Total Common Stocks
(Cost $846,883,518) | | | | 1,338,534,845 | |
| | | | | | | | |
|
| Short-Term Investment 0.7% | |
Affiliated Investment Company 0.7% | |
MainStay U.S. Government Liquidity Fund, 0.05% (b) | | | 9,017,694 | | | | 9,017,694 | |
| | | | | | | | |
Total Short-Term Investment
(Cost $9,017,694) | | | | | | | 9,017,694 | |
| | | | | | | | |
Total Investments
(Cost $855,901,212) | | | 100.0 | % | | | 1,347,552,539 | |
Other Assets, Less Liabilities | | | 0.0 | ‡ | | | 280,056 | |
Net Assets | | | 100.0 | % | | $ | 1,347,832,595 | |
| † | Percentages indicated are based on Portfolio net assets. |
| ‡ | Less than one-tenth of a percent. |
| (a) | Non-income producing security. |
| (b) | Current yield as of June 30, 2020. |
The following abbreviation is used in the preceding pages:
ADR—American Depositary Receipt
The following is a summary of the fair valuations according to the inputs used as of June 30, 2020, for valuing the Portfolio’s assets:
| | | | | | | | | | | | | | | | |
Description | | Quoted
Prices in
Active
Markets for
Identical
Assets
(Level 1) | | | Significant
Other
Observable
Inputs
(Level 2) | | | Significant
Unobservable
Inputs
(Level 3) | | | Total | |
|
Asset Valuation Inputs | |
| Investments in Securities (a) | | | | | | | | | |
| Common Stocks | | $ | 1,338,534,845 | | | $ | — | | | $ | — | | | $ | 1,338,534,845 | |
| Short-Term Investment | |
Affiliated Investment Company | | | 9,017,694 | | | | — | | | | — | | | | 9,017,694 | |
| | | | | | | | | | | | | | | | |
| Total Investments in Securities | | $ | 1,347,552,539 | | | $ | — | | | $ | — | | | $ | 1,347,552,539 | |
| | | | | | | | | | | | | | | | |
| (a) | For a complete listing of investments and their industries, see the Portfolio of Investments. |
| | | | | | |
The notes to the financial statements are an integral part of,
and should be read in conjunction with, the financial statements. | | | | | 11 | |
Statement of Assets and Liabilities as of June 30, 2020 (Unaudited)
| | | | |
| Assets | |
Investment in unaffiliated securities, at value (identified cost $846,883,518) | | $ | 1,338,534,845 | |
Investment in affiliated investment company, at value (identified cost $9,017,694) | | | 9,017,694 | |
Receivables: | |
Portfolio shares sold | | | 1,325,340 | |
Dividends | | | 177,266 | |
Other assets | | | 6,739 | |
| | | | |
Total assets | | | 1,349,061,884 | |
| | | | |
|
| Liabilities | |
Payables: | |
Manager (See Note 3) | | | 802,689 | |
Portfolio shares redeemed | | | 195,374 | |
NYLIFE Distributors (See Note 3) | | | 181,808 | |
Shareholder communication | | | 18,259 | |
Professional fees | | | 15,653 | |
Custodian | | | 7,794 | |
Trustees | | | 1,471 | |
Accrued expenses | | | 6,241 | |
| | | | |
Total liabilities | | | 1,229,289 | |
| | | | |
Net assets | | $ | 1,347,832,595 | |
| | | | |
|
| Composition of Net Assets | |
Shares of beneficial interest outstanding (par value of $.001 per share) unlimited number of shares authorized | | $ | 49,101 | |
Additional paid-in capital | | | 753,528,643 | |
| | | | |
| | | 753,577,744 | |
Total distributable earnings (loss) | | | 594,254,851 | |
| | | | |
Net assets | | $ | 1,347,832,595 | |
| | | | |
| | | | |
Initial Class | |
Net assets applicable to outstanding shares | | $ | 442,601,412 | |
| | | | |
Shares of beneficial interest outstanding | | | 15,478,130 | |
| | | | |
Net asset value per share outstanding | | $ | 28.60 | |
| | | | |
Service Class | |
Net assets applicable to outstanding shares | | $ | 905,231,183 | |
| | | | |
Shares of beneficial interest outstanding | | | 33,622,562 | |
| | | | |
Net asset value per share outstanding | | $ | 26.92 | |
| | | | |
| | | | |
| 12 | | MainStay VP Winslow Large Cap Growth Portfolio | | The notes to the financial statements are an integral part of,
and should be read in conjunction with, the financial statements. |
Statement of Operations for the six months ended June 30, 2020 (Unaudited)
| | | | |
| Investment Income (Loss) | |
Income | |
Dividends-unaffiliated (a) | | $ | 4,502,258 | |
Securities lending | | | 58,950 | |
Dividends-affiliated | | | 30,862 | |
| | | | |
Total income | | | 4,592,070 | |
| | | | |
Expenses | |
Manager (See Note 3) | | | 4,495,513 | |
Distribution/Service—Service Class (See Note 3) | | | 1,012,576 | |
Professional fees | | | 61,090 | |
Shareholder communication | | | 40,340 | |
Trustees | | | 14,485 | |
Custodian | | | 13,904 | |
Miscellaneous | | | 19,467 | |
| | | | |
Total expenses before waiver/reimbursement | | | 5,657,375 | |
Expense waiver/reimbursement from Manager (See Note 3) | | | (2,140 | ) |
| | | | |
Net expenses | | | 5,655,235 | |
| | | | |
Net investment income (loss) | | | (1,063,165 | ) |
| | | | |
|
| Realized and Unrealized Gain (Loss) on Investments | |
Net realized gain (loss) on unaffiliated investments | | | 3,891,686 | |
Net change in unrealized appreciation (depreciation) on unaffiliated investments | | | 143,571,477 | |
| | | | |
Net realized and unrealized gain (loss) on investments | | | 147,463,163 | |
| | | | |
Net increase (decrease) in net assets resulting from operations | | $ | 146,399,998 | |
| | | | |
| (a) | Dividends recorded net of foreign withholding taxes in the amount of $26,827. |
| | | | | | |
The notes to the financial statements are an integral part of,
and should be read in conjunction with, the financial statements. | | | | | 13 | |
Statements of Changes in Net Assets
for the six months ended June 30, 2020 (Unaudited) and the year ended December 31, 2019
| | | | | | | | |
| | | 2020 | | | 2019 | |
| Increase (Decrease) in Net Assets | |
Operations: | |
Net investment income (loss) | | $ | (1,063,165 | ) | | $ | (1,839,205 | ) |
Net realized gain (loss) on investments | | | 3,891,686 | | | | 101,606,507 | |
Net change in unrealized appreciation (depreciation) on investments | | | 143,571,477 | | | | 204,428,840 | |
| | | | |
Net increase (decrease) in net assets resulting from operations | | | 146,399,998 | | | | 304,196,142 | |
| | | | |
Distributions to shareholders: | |
Initial Class | | | — | | | | (47,407,373 | ) |
Service Class | | | — | | | | (91,386,894 | ) |
| | | | |
Total distributions to shareholders | | | — | | | | (138,794,267 | ) |
| | | | |
Capital share transactions: | |
Net proceeds from sale of shares | | | 87,030,070 | | | | 272,871,172 | |
Net asset value of shares issued to shareholders in reinvestment of distributions | | | — | | | | 138,794,267 | |
Cost of shares redeemed | | | (148,761,261 | ) | | | (175,913,643 | ) |
| | | | |
Increase (decrease) in net assets derived from capital share transactions | | | (61,731,191 | ) | | | 235,751,796 | |
| | | | |
Net increase (decrease) in net assets | | | 84,668,807 | | | | 401,153,671 | |
|
| Net Assets | |
Beginning of period | | | 1,263,163,788 | | | | 862,010,117 | |
| | | | |
End of period | | $ | 1,347,832,595 | | | $ | 1,263,163,788 | |
| | | | |
| | | | |
| 14 | | MainStay VP Winslow Large Cap Growth Portfolio | | The notes to the financial statements are an integral part of,
and should be read in conjunction with, the financial statements. |
Financial Highlights selected per share data and ratios
| | | | | | | | | | | | | | | | | | | | | | | | | | | | |
| | | |
| | | Six months
ended
June 30, | | | | | | Year ended December 31, | |
| | | | | | | |
| Initial Class | | 2020* | | | | | | 2019 | | | 2018 | | | 2017 | | | 2016 | | | 2015 | |
| | | | | | | |
Net asset value at beginning of period | | $ | 25.51 | | | | | | | $ | 21.64 | | | $ | 23.92 | | | $ | 18.71 | | | $ | 20.83 | | | $ | 22.48 | |
| | | | | | | | | | | | | | | | | | | | | | | | | | | | |
| | | | | | | |
Net investment income (loss) (a) | | | (0.00 | )‡ | | | | | | | 0.00 | ‡ | | | 0.00 | ‡ | | | 0.02 | | | | 0.01 | | | | (0.00 | )‡ |
| | | | | | | |
Net realized and unrealized gain (loss) on investments | | | 3.09 | | | | | | | | 6.95 | | | | 1.36 | | | | 6.00 | | | | (0.43 | ) | | | 1.22 | |
| | | | | | | | | | | | | | | | | | | | | | | | | | | | |
| | | | | | | |
Total from investment operations | | | 3.09 | | | | | | | | 6.95 | | | | 1.36 | | | | 6.02 | | | | (0.42 | ) | | | 1.22 | |
| | | | | | | | | | | | | | | | | | | | | | | | | | | | |
| | | | | | | |
| Less distributions: | | | | | | | | | | | | | | | | | | | | | | | | | | | | |
| | | | | | | |
From net realized gain on investments | | | — | | | | | | | | (3.08 | ) | | | (3.64 | ) | | | (0.81 | ) | | | (1.70 | ) | | | (2.87 | ) |
| | | | | | | | | | | | | | | | | | | | | | | | | | | | |
| | | | | | | |
Net asset value at end of period | | $ | 28.60 | | | | | | | $ | 25.51 | | | $ | 21.64 | | | $ | 23.92 | | | $ | 18.71 | | | $ | 20.83 | |
| | | | | | | | | | | | | | | | | | | | | | | | | | | | |
| | | | | | | |
Total investment return (b) | | | 12.11 | % (c) | | | | | | | 33.64 | % | | | 3.57 | % | | | 32.39 | % | | | (2.27 | %) | | | 6.18 | % |
| | | | | | | |
| Ratios (to average net assets)/Supplemental Data: | | | | | | | | | | | | | | | | | | | | | | | | | | | | |
| | | | | | | |
Net investment income (loss) | | | (0.01 | %)†† | | | | | | | 0.01 | % | | | 0.01 | % | | | 0.10 | % | | | 0.07 | % | | | (0.01 | %) |
| | | | | | | |
Net expenses (d) | | | 0.75 | % ††(e) | | | | | | | 0.76 | %(e) | | | 0.76 | %(e) | | | 0.76 | %(e) | | | 0.77 | % | | | 0.77 | % |
| | | | | | | |
Portfolio turnover rate | | | 26 | % | | | | | | | 56 | % | | | 58 | % | | | 53 | % | | | 94 | % | | | 71 | % |
| | | | | | | |
Net assets at end of period (in 000’s) | | $ | 442,601 | | | | | | | $ | 438,089 | | | $ | 238,174 | | | $ | 368,861 | | | $ | 518,425 | | | $ | 448,409 | |
| ‡ | Less than one cent per share. |
| (a) | Per share data based on average shares outstanding during the period. |
| (b) | Total return does not reflect any deduction of sales charges, mortality and expense charges, contract charges or administrative charges. For periods of less than one year, total return is not annualized. |
| (c) | Total investment return may reflect adjustments to conform to generally accepted accounting principles. |
| (d) | In addition to the fees and expenses which the Portfolio bears directly, it also indirectly bears a pro-rata share of the fees and expenses of the underlying funds in which it invests. Such indirect expenses are not included in the above expense ratios. |
| (e) | Expense waiver/reimbursement less than 0.01%. |
| | | | | | | | | | | | | | | | | | | | | | | | | | | | |
| | | |
| | | Six months
ended
June 30, | | | | | | Year ended December 31, | |
| | | | | | | |
| Service Class | | 2020* | | | | | | 2019 | | | 2018 | | | 2017 | | | 2016 | | | 2015 | |
| | | | | | | |
Net asset value at beginning of period | | $ | 24.05 | | | | | | | $ | 20.60 | | | $ | 22.96 | | | $ | 18.03 | | | $ | 20.18 | | | $ | 21.93 | |
| | | | | | | | | | | | | | | | | | | | | | | | | | | | |
| | | | | | | |
Net investment income (loss) (a) | | | (0.03 | ) | | | | | | | (0.06 | ) | | | (0.06 | ) | | | (0.03 | ) | | | (0.03 | ) | | | (0.06 | ) |
| | | | | | | |
Net realized and unrealized gain (loss) on investments | | | 2.90 | | | | | | | | 6.59 | | | | 1.34 | | | | 5.77 | | | | (0.42 | ) | | | 1.18 | |
| | | | | | | | | | | | | | | | | | | | | | | | | | | | |
| | | | | | | |
Total from investment operations | | | 2.87 | | | | | | | | 6.53 | | | | 1.28 | | | | 5.74 | | | | (0.45 | ) | | | 1.12 | |
| | | | | | | | | | | | | | | | | | | | | | | | | | | | |
| | | | | | | |
| Less distributions: | | | | | | | | | | | | | | | | | | | | | | | | | | | | |
| | | | | | | |
From net realized gain on investments | | | — | | | | | | | | (3.08 | ) | | | (3.64 | ) | | | (0.81 | ) | | | (1.70 | ) | | | (2.87 | ) |
| | | | | | | | | | | | | | | | | | | | | | | | | | | | |
| | | | | | | |
Net asset value at end of period | | $ | 26.92 | | | | | | | $ | 24.05 | | | $ | 20.60 | | | $ | 22.96 | | | $ | 18.03 | | | $ | 20.18 | |
| | | | | | | | | | | | | | | | | | | | | | | | | | | | |
| | | | | | | |
Total investment return (b) | | | 11.93 | % (c) | | | | | | | 33.30 | % | | | 3.31 | % | | | 32.06 | % | | | (2.52 | %) | | | 5.91 | % |
| | | | | | | |
| Ratios (to average net assets)/Supplemental Data: | | | | | | | | | | | | | | | | | | | | | | | | | | | | |
| | | | | | | |
Net investment income (loss) | | | (0.26 | %)†† | | | | | | | (0.25 | %) | | | (0.23 | %) | | | (0.15 | %) | | | (0.17 | %) | | | (0.26 | %) |
| | | | | | | |
Net expenses (d) | | | 1.00 | % ††(e) | | | | | | | 1.01 | % (e) | | | 1.01 | % (e) | | | 1.01 | % (e) | | | 1.02 | % | | | 1.02 | % |
| | | | | | | |
Portfolio turnover rate | | | 26 | % | | | | | | | 56 | % | | | 58 | % | | | 53 | % | | | 94 | % | | | 71 | % |
| | | | | | | |
Net assets at end of period (in 000’s) | | $ | 905,231 | | | | | | | $ | 825,075 | | | $ | 623,836 | | | $ | 575,514 | | | $ | 435,029 | | | $ | 440,891 | |
| (a) | Per share data based on average shares outstanding during the period. |
| (b) | Total return does not reflect any deduction of sales charges, mortality and expense charges, contract charges or administrative charges. For periods of less than one year, total return is not annualized. |
| (c) | Total investment return may reflect adjustments to conform to generally accepted accounting principles. |
| (d) | In addition to the fees and expenses which the Portfolio bears directly, it also indirectly bears a pro-rata share of the fees and expenses of the underlying funds in which it invests. Such indirect expenses are not included in the above expense ratios. |
| (e) | Expense waiver/reimbursement less than 0.01%. |
| | | | | | |
The notes to the financial statements are an integral part of,
and should be read in conjunction with, the financial statements. | | | | | 15 | |
Notes to Financial Statements (Unaudited)
Note 1–Organization and Business
MainStay VP Funds Trust (the ‘‘Fund’’) was organized as a Delaware statutory trust on February 1, 2011. The Fund is registered under the Investment Company Act of 1940, as amended (the “1940 Act”), as an open-end management investment company. The Fund is comprised of thirty-one separate series (collectively referred to as the “Portfolios”). These financial statements and notes relate to the MainStay VP Winslow Large Cap Growth Portfolio (formerly known as MainStay VP Large Cap Growth Portfolio) (the “Portfolio”), a “diversified” portfolio, as that term is defined in the 1940 Act, as interpreted or modified by regulatory authorities having jurisdiction, from time to time.
Shares of the Portfolio are currently offered to certain separate accounts to fund variable annuity policies and variable universal life insurance policies issued by New York Life Insurance and Annuity Corporation (“NYLIAC”), a wholly-owned subsidiary of New York Life Insurance Company (“New York Life”) and may also be offered to fund variable annuity policies and variable universal life insurance policies issued by other insurance companies. NYLIAC allocates shares of the Portfolios to, among others, certain NYLIAC separate accounts. Shares of the Portfolio are also offered to the MainStay VP Conservative Allocation Portfolio, MainStay VP Moderate Allocation Portfolio, MainStay VP Moderate Growth Allocation Portfolio and MainStay VP Growth Allocation Portfolio, which operate as “funds-of-funds,” and other variable insurance funds.
The Portfolio currently offers two classes of shares. Initial Class shares commenced operations on May 1, 1998. Service Class shares commenced operations on June 6, 2003. Shares of the Portfolio are offered and are redeemed at a price equal to their respective net asset value (“NAV”) per share. No sales or redemption charge is applicable to the purchase or redemption of the Portfolio’s shares. Under the terms of the Fund’s multiple class plan adopted pursuant to Rule 18f-3 under the 1940 Act, the classes differ in that, among other things, Service Class shares of the Portfolio pay a combined distribution and service fee of 0.25% of average daily net assets attributable to Service Class shares of the Portfolio to the Distributor (as defined in Note 3(B)) pursuant to a plan adopted in accordance with Rule 12b-1 under the 1940 Act. Contract owners of variable annuity contracts purchased after June 2, 2003, are permitted to invest only in the Service Class shares.
The Portfolio’s investment objective is to seek long-term growth of capital.
Note 2–Significant Accounting Policies
The Portfolio is an investment company and accordingly follows the investment company accounting and reporting guidance of the Financial Accounting Standards Board (“FASB”) Accounting Standard Codification Topic 946 Financial Services—Investment Companies. The Portfolio prepares its financial statements in accordance with generally accepted accounting principles (“GAAP”) in the United States of America and follows the significant accounting policies described below.
(A) Securities Valuation. Investments are usually valued as of the close of regular trading on the New York Stock Exchange (the “Exchange”) (usually 4:00 p.m. Eastern time) on each day the Portfolio is open for business (“valuation date”).
The Board of Trustees of the Fund (the “Board”) adopted procedures establishing methodologies for the valuation of the Portfolio’s securities and other assets and delegated the responsibility for valuation determinations under those procedures to the Valuation Committee of the Fund (the “Valuation Committee”). The procedures state that, subject to the oversight of the Board and unless otherwise noted, the responsibility for the day-to-day valuation of portfolio assets (including fair value measurements for the Portfolio’s assets and liabilities) rests with New York Life Investment Management LLC (“New York Life Investments” or the “Manager”), aided to whatever extent necessary by the Subadvisor (as defined in Note 3(A)). To assess the appropriateness of security valuations, the Manager, the Subadvisor or the Portfolio’s third-party service provider, who is subject to oversight by the Manager, regularly compares prior day prices, prices on comparable securities and the sale prices to the prior and current day prices and challenges prices with changes exceeding certain tolerance levels with third-party pricing services or broker sources.
The Board authorized the Valuation Committee to appoint a Valuation Subcommittee (the “Subcommittee”) to establish the prices of securities for which market quotations are not readily available or the prices of which are not otherwise readily determinable under the procedures. The Subcommittee meets (in person, via electronic mail or via teleconference) on an as-needed basis. The Valuation Committee meets to ensure that actions taken by the Subcommittee were appropriate.
For those securities valued through either a standardized fair valuation methodology or a fair valuation measurement, the Subcommittee deals with such valuation and the Valuation Committee reviews and affirms, if appropriate, the reasonableness of the valuation based on such methodologies and measurements on a regular basis after considering information that is reasonably available and deemed relevant by the Valuation Committee. Any action taken by the Subcommittee with respect to the valuation of a portfolio security or other asset is submitted for review and ratification (if appropriate) to the Valuation Committee and the Board at the next regularly scheduled meeting.
“Fair value” is defined as the price the Portfolio would reasonably expect to receive upon selling an asset or liability in an orderly transaction to an independent buyer in the principal or most advantageous market for the asset or liability. Fair value measurements are determined within a framework that establishes a three-tier hierarchy that maximizes the use of observable market data and minimizes the use of unobservable inputs to establish a classification of fair value measurements for disclosure purposes. “Inputs” refer broadly to the assumptions that market participants would use in pricing the asset or liability, including assumptions about risk, such as the risk inherent in a particular valuation technique used to measure fair value using a pricing model and/or the risk inherent in the inputs for the valuation technique. Inputs may be observable or unobservable. Observable inputs reflect the assumptions market participants would use in pricing the asset or liability based on market data obtained from sources independent of the Portfolio. Unobservable inputs reflect the Portfolio’s own assumptions about the assumptions market participants would use in pricing the asset or liability based on the information available. The inputs or methodology used for valuing assets or liabilities may not be an indication of the risks associated with investing in those assets or liabilities. The three-tier hierarchy of inputs is summarized below.
| | |
| 16 | | MainStay VP Winslow Large Cap Growth Portfolio |
| • | | Level 1—quoted prices in active markets for an identical asset or liability |
| • | | Level 2—other significant observable inputs (including quoted prices for a similar asset or liability in active markets, interest rates and yield curves, prepayment speeds, credit risk, etc.) |
| • | | Level 3—significant unobservable inputs (including the Portfolio’s own assumptions about the assumptions that market participants would use in measuring fair value of an asset or liability) |
The level of an asset or liability within the fair value hierarchy is based on the lowest level of an input, both individually and in the aggregate, that is significant to the fair value measurement. The aggregate value by input level of the Portfolio’s assets and liabilities as of June 30, 2020 is included at the end of the Portfolio of Investments.
The Portfolio may use third-party vendor evaluations, whose prices may be derived from one or more of the following standard inputs, among others:
| | |
• Broker/dealer quotes | | • Benchmark securities |
• Two-sided markets | | • Reference data (corporate actions or material event notices) |
• Bids/offers | | • Monthly payment information |
• Industry and economic events | | • Reported trades |
An asset or liability for which market values cannot be measured using the methodologies described above is valued by methods deemed reasonable in good faith by the Valuation Committee, following the procedures established by the Board, to represent fair value. Under these procedures, the Portfolio generally uses a market-based approach which may use related or comparable assets or liabilities, recent transactions, market multiples, book values and other relevant information. The Portfolio may also use an income-based valuation approach in which the anticipated future cash flows of the asset or liability are discounted to calculate fair value. Discounts may also be applied due to the nature and/or duration of any restrictions on the disposition of the asset or liability. Fair value represents a good faith approximation of the value of a security. Fair value determinations involve the consideration of a number of subjective factors, an analysis of applicable facts and circumstances and the exercise of judgment. As a result, it is possible that the fair value for a security determined in good faith in accordance with the Portfolio’s valuation procedures may differ from valuations for the same security determined by other funds using their own valuation procedures. Although the Portfolio’s valuation procedures are designed to value a security at the price the Portfolio may reasonably expect to receive upon the security’s sale in an orderly transaction, there can be no assurance that any fair value determination thereunder would, in fact, approximate the amount that the Portfolio would actually realize upon the sale of the security or the price at which the security would trade if a reliable market price were readily available. During the six-month period ended June 30, 2020, there were no material changes to the fair value methodologies.
Securities which may be valued in this manner include, but are not limited to: (i) a security for which trading has been halted or suspended; (ii) a debt security that has recently gone into default and for which there is not a current market quotation; (iii) a security of an issuer that
has entered into a restructuring; (iv) a security that has been delisted from a national exchange; (v) a security for which the market price is not readily available from a third-party pricing source or, if so provided, does not, in the opinion of the Manager or the Subadvisor, reflect the security’s market value; (vi) a security subject to trading collars for which no or limited trading takes place; and (vii) a security whose principal market has been temporarily closed at a time when, under normal conditions, it would be open. Securities valued in this manner are generally categorized as Level 3 in the hierarchy. As of June 30, 2020, no securities held by the Portfolio were fair valued in such a manner.
Equity securities are valued at the last quoted sales prices as of the close of regular trading on the relevant exchange on each valuation date. Securities that are not traded on the valuation date are valued at the mean of the last quoted bid and ask prices. Prices are normally taken from the principal market in which each security trades. These securities are generally categorized as Level 1 in the hierarchy.
Investments in mutual funds, including money market funds, are valued at their respective NAVs as of the close of the Exchange on the valuation date. These securities are generally categorized as Level 1 in the hierarchy.
Temporary cash investments acquired in excess of 60 days to maturity at the time of purchase are valued using the latest bid prices or using valuations based on a matrix system (which considers such factors as security prices, yields, maturities and ratings), both as furnished by independent pricing services. Temporary cash investments that mature in 60 days or less at the time of purchase (“Short-Term Investments”) are valued using the amortized cost method of valuation, unless the use of such method would be inappropriate. The amortized cost method involves valuing a security at its cost on the date of purchase and thereafter assuming a constant amortization to maturity of the difference between such cost and the value on maturity date. Amortized cost approximates the current fair value of a security. Securities valued using the amortized cost method are not valued using quoted prices in an active market and are generally categorized as Level 2 in the hierarchy.
The information above is not intended to reflect an exhaustive list of the methodologies that may be used to value portfolio investments. The valuation procedures permit the use of a variety of valuation methodologies in connection with valuing portfolio investments. The methodology used for a specific type of investment may vary based on the market data available or other considerations. The methodologies summarized above may not represent the specific means by which portfolio investments are valued on any particular business day.
(B) Income Taxes. The Portfolio’s policy is to comply with the requirements of the Internal Revenue Code of 1986, as amended (the “Internal Revenue Code”), applicable to regulated investment companies and to distribute all of its taxable income to the shareholders of the Portfolio within the allowable time limits.
The Manager evaluates the Portfolio’s tax positions to determine if the tax positions taken meet the minimum recognition threshold in connection with accounting for uncertainties in income tax positions taken or expected to be taken for the purposes of measuring and recognizing tax liabilities in the financial statements. Recognition of tax benefits of an uncertain tax position is permitted only to the extent the position is
Notes to Financial Statements (Unaudited) (continued)
“more likely than not” to be sustained assuming examination by taxing authorities. The Manager analyzed the Portfolio’s tax positions taken on federal, state and local income tax returns for all open tax years (for up to three tax years) and has concluded that no provisions for federal, state and local income tax are required in the Portfolio’s financial statements. The Portfolio’s federal, state and local income tax and federal excise tax returns for tax years for which the applicable statutes of limitations have not expired are subject to examination by the Internal Revenue Service and state and local departments of revenue.
(C) Dividends and Distributions to Shareholders. Dividends and distributions are recorded on the ex-dividend date. The Portfolio intends to declare and pay dividends from net investment income and distributions from net realized capital and currency gains, if any, at least annually. Unless a shareholder elects otherwise, all dividends and distributions are reinvested at NAV in the same class of shares of the Portfolio. Dividends and distributions to shareholders are determined in accordance with federal income tax regulations and may differ from determinations using GAAP.
(D) Security Transactions and Investment Income. The Portfolio records security transactions on the trade date. Realized gains and losses on security transactions are determined using the identified cost method. Dividend income is recognized on the ex-dividend date, net of any foreign tax withheld at the source, and interest income is accrued as earned using the effective interest rate method. Distributions received from real estate investment trusts may be classified as dividends, capital gains and/or return of capital.
Investment income and realized and unrealized gains and losses on investments of the Portfolio are allocated pro rata to the separate classes of shares based upon their relative net assets on the date the income is earned or realized and unrealized gains and losses are incurred.
(E) Expenses. Expenses of the Fund are allocated to the individual Portfolios in proportion to the net assets of the respective Portfolios when the expenses are incurred, except where direct allocations of expenses can be made. Expenses (other than fees incurred under the distribution and service plans, further discussed in Note 3(B), which are charged directly to the Service Class shares) are allocated to separate classes of shares pro rata based upon their relative net assets on the date the expenses are incurred. The expenses borne by the Portfolio, including those of related parties to the Portfolio, are shown in the Statement of Operations.
Additionally, the Portfolio may invest in mutual funds, which are subject to management fees and other fees that may cause the costs of investing in mutual funds to be greater than the costs of owning the underlying securities directly. These indirect expenses of mutual funds are not included in the amounts shown as expenses in the Portfolio’s Statement of Operations or in the expense ratios included in the Financial Highlights.
(F) Use of Estimates. In preparing financial statements in conformity with GAAP, the Manager makes estimates and assumptions that affect the reported amounts and disclosures in the financial statements. Actual results could differ from those estimates.
(G) Repurchase Agreements. The Portfolio may enter into repurchase agreements (i.e., buy a security from another party with the
agreement that it will be sold back in the future) to earn income. The Portfolio may enter into repurchase agreements only with counterparties, usually financial institutions, that are deemed by the Manager or the Subadvisor to be creditworthy, pursuant to guidelines established by the Board. During the term of any repurchase agreement, the Manager or the Subadvisor will continue to monitor the creditworthiness of the counterparty. Under the 1940 Act, repurchase agreements are considered to be collateralized loans by the Portfolio to the counterparty secured by the securities transferred to the Portfolio.
Repurchase agreements are subject to counterparty risk, meaning the Portfolio could lose money by the counterparty’s failure to perform under the terms of the agreement. The Portfolio mitigates this risk by ensuring the repurchase agreement is collateralized by cash, U.S. government securities, fixed income securities and/or other securities. The collateral is held by the Portfolio’s custodian and valued daily on a mark to market basis to determine if the value, including accrued interest, exceeds the repurchase price. In the event of the counterparty’s default on the obligation to repurchase, the Portfolio has the right to liquidate the collateral and apply the proceeds in satisfaction of the obligation. Under certain circumstances, such as in the event of default or bankruptcy by the counterparty, realization and/or retention of the collateral may be limited or subject to delay, to legal proceedings and possible realized loss to the Portfolio. As of June 30, 2020, the Portfolio did not hold any repurchase agreements.
(H) Securities Lending. In order to realize additional income, the Portfolio may engage in securities lending, subject to the limitations set forth in the 1940 Act and relevant guidance by the staff of the Securities and Exchange Commission (“SEC”). If the Portfolio engages in securities lending, the Portfolio will lend through its custodian, currently State Street Bank and Trust Company (“State Street”), acting as securities lending agent on behalf of the Portfolio. Under the current arrangement, State Street will manage the Portfolio’s collateral in accordance with the securities lending agency agreement between the Portfolio and State Street, and indemnify the Portfolio against counterparty risk. The loans will be collateralized by cash (which may be invested in a money market fund) and/or non-cash collateral (which may include U.S. Treasury securities and/or U.S. government agency securities issued or guaranteed by the United States government or its agencies or instrumentalities) at least equal at all times to the market value of the securities loaned. The Portfolio bears the risk of delay in recovery of, or loss of rights in, the securities loaned. The Portfolio may also record a realized gain or loss on securities deemed sold due to a borrower’s inability to return securities on loan. The Portfolio bears the risk of any loss on investment of cash collateral. The Portfolio will receive compensation for lending its securities in the form of fees or it will retain a portion of interest earned on the investment of any cash collateral. The Portfolio will also continue to receive interest and dividends on the securities loaned and any gain or loss in the market price of the securities loaned that may occur during the term of the loan will be for the account of the Portfolio. Income earned from securities lending activities, if any, is reflected in the Statement of Operations. As of June 30, 2020, the Portfolio did not have any portfolio securities on loan.
(I) Indemnifications. Under the Fund’s organizational documents, its officers and trustees are indemnified against certain liabilities that may arise out of performance of their duties to the Fund. Additionally, in
| | |
| 18 | | MainStay VP Winslow Large Cap Growth Portfolio |
the normal course of business, the Portfolio enters into contracts with third-party service providers that contain a variety of representations and warranties and that may provide general indemnifications. The Portfolio’s maximum exposure under these arrangements is unknown, as this would involve future claims that may be made against the Portfolio that have not yet occurred. The Manager believes that the risk of loss in connection with these potential indemnification obligations is remote. However, there can be no assurance that material liabilities related to such obligations will not arise in the future, which could adversely impact the Portfolio.
Note 3–Fees and Related Party Transactions
(A) Manager and Subadvisor. New York Life Investments, a registered investment adviser and an indirect, wholly-owned subsidiary of New York Life, serves as the Portfolio’s Manager pursuant to an Amended and Restated Management Agreement (“Management Agreement”). The Manager provides offices, conducts clerical, recordkeeping and bookkeeping services, and keeps most of the financial and accounting records required to be maintained by the Portfolio. Except for the portion of salaries and expenses that are the responsibility of the Portfolio, the Manager pays the salaries and expenses of all personnel affiliated with the Portfolio and certain operational expenses of the Portfolio. The Portfolio reimburses New York Life Investments in an amount equal to the portion of the compensation of the Chief Compliance Officer attributable to the Portfolio. Winslow Capital Management, LLC. (“Winslow” or “Subadvisor”), a registered investment adviser, serves as Subadvisor to the Portfolio and is responsible for the day-to-day portfolio management of the Portfolio. Pursuant to the terms of a Subadvisory Agreement (“Subadvisory Agreement”) between New York Life Investments and Winslow, New York Life Investments pays for the services of the Subadvisor.
The Fund, on behalf of the Portfolio, pays New York Life Investments in its capacity as the Portfolio’s investment manager and administrator, pursuant to the Management Agreement, a monthly fee for services performed and facilities furnished at an annual rate of the average daily net assets as follows: 0.75% up to $500 million; 0.725% from $500 million to $750 million; 0.71% from $750 million to $1 billion; 0.70% from $1 billion to $2 billion; 0.66% from $2 billion to $3 billion; 0.61% from $3 billion to $7 billion; 0.585% from $7 billion to $9 billion and; 0.575% in excess of $9 billion.
New York Life Investments has voluntarily agreed to waive a portion of its management fee when the subadvisory fee is reduced as a result of achieving breakpoints in the subadvisory fee schedule. The savings that result from the reduced subadvisory fee will be shared equally with the
Portfolio provided that the amount of the management fee retained by New York Life Investments, after payment of the subadvisory fee, exceeds 0.35% of the average daily net assets of the Portfolio. This waiver may be discontinued at any time.
New York Life Investments has contractually agreed to waive a portion of its management fee so that the management fee does not exceed 0.55% of the Portfolio’s average daily net assets from $11 billion to $13 billion; and 0.525% of the Portfolio’s average daily net assets over $13 billion. This agreement expires May 1, 2021, and may only be amended or terminated prior to that date by action of the Board. During the six-month period ended June 30, 2020, the effective management fee rate was 0.73% (exclusive of any applicable waivers/reimbursements).
During the six-month period ended June 30, 2020, New York Life Investments earned fees from the Portfolio in the amount of $4,495,513 and waived fees/reimbursed expenses in the amount of $2,140 and paid the Subadvisor in the amount of $1,714,066.
State Street provides sub-administration and sub-accounting services to the Portfolio pursuant to an agreement with New York Life Investments. These services include calculating the daily NAVs of the Portfolio, maintaining the general ledger and sub-ledger accounts for the calculation of the Portfolio’s NAVs and assisting New York Life Investments in conducting various aspects of the Portfolio’s administrative operations. For providing these services to the Portfolio, State Street is compensated by New York Life Investments.
Pursuant to an agreement between the Fund and New York Life Investments, New York Life Investments is responsible for providing or procuring certain regulatory reporting services for the Portfolio. The Portfolio will reimburse New York Life Investments for the actual costs incurred by New York Life Investments in connection with providing or procuring these services for the Portfolio.
(B) Distribution and Service Fees. The Fund, on behalf of the Portfolio, has entered into a distribution agreement with NYLIFE Distributors LLC (the “Distributor”), an indirect, wholly-owned subsidiary of New York Life. The Portfolio has adopted a distribution plan (the “Plan”) in accordance with the provisions of Rule 12b-1 under the 1940 Act. Under the Plan, the Distributor has agreed to provide, through its affiliates or independent third parties, various distribution-related, shareholder and administrative support services to the Service Class shareholders. For its services, the Distributor is entitled to a combined distribution and service fee accrued daily and paid monthly at an annual rate of 0.25% of the average daily net assets attributable to the Service Class shares of the Portfolio.
(C) Investments in Affiliates (in 000’s). During the six-month period ended June 30, 2020, purchases and sales transactions, income earned from investments and shares held of investment companies managed by New York Life Investments or its affiliates were as follows:
| | | | | | | | | | | | | | | | | | | | | | | | | | | | | | | | | | | | |
Affiliated Investment Company | | Value,
Beginning of
Period | | | Purchases
at Cost | | | Proceeds
from Sales | | | Net
Realized
Gain/(Loss)
on Sales | | | Change in
Unrealized
Appreciation/
(Depreciation) | | | Value,
End of
Period | | | Dividend
Income | | | Other
Distributions | | | Shares
End of
Period | |
| | | | | | | | | |
MainStay U.S. Government Liquidity Fund | | $ | 11,141 | | | $ | 124,471 | | | $ | (126,594 | ) | | $ | — | | | $ | — | | | $ | 9,018 | | | $ | 31 | | | $ | — | | | | 9,018 | |
Notes to Financial Statements (Unaudited) (continued)
Note 4–Federal Income Tax
As of June 30, 2020, the cost and unrealized appreciation (depreciation) of the Portfolio’s investment portfolio, including applicable derivative contracts and other financial instruments, as determined on a federal income tax basis, was as follows:
| | | | | | | | | | | | | | | | |
| | | Federal Tax
Cost | | | Gross
Unrealized
Appreciation | | | Gross
Unrealized
(Depreciation) | | | Net
Unrealized
Appreciation/
(Depreciation) | |
| | | | |
Investments in Securities | | $ | 856,213,569 | | | $ | 492,394,621 | | | $ | (1,055,651 | ) | | $ | 491,338,970 | |
During the year ended December 31, 2019, the tax character of distributions paid as reflected in the Statements of Changes in Net Assets was as follows:
| | |
|
| 2019 |
Tax-Based
Distributions from Ordinary
Income | | Tax-Based
Distributions from Long-Term
Gains |
| |
| $ — | | $138,794,267 |
Note 5–Custodian
State Street is the custodian of cash and securities held by the Portfolio. Custodial fees are charged to the Portfolio based on the Portfolio’s net assets and/or the market value of securities held by the Portfolio and the number of certain transactions incurred by the Portfolio.
Note 6–Line of Credit
The Portfolio and certain other funds managed by New York Life Investments maintain a line of credit with a syndicate of banks in order to secure a source of funds for temporary purposes to meet unanticipated or excessive redemption requests.
Effective July 28, 2020, under the credit agreement (the “Credit Agreement”), the aggregate commitment amount is $600,000,000 with an additional uncommitted amount of $100,000,000. The commitment fee is an annual rate of 0.15% of the average commitment amount payable quarterly, regardless of usage, to JP Morgan Chase Bank NA, who serves as the agent to the syndicate. The commitment fee is allocated among the Portfolio and certain other funds managed by New York Life Investments based upon their respective net assets and other factors. Interest on any revolving credit loan is charged based upon the Federal Funds Rate or the one-month London Interbank Offered Rate (“LIBOR”), whichever is higher. The Credit Agreement expires on July 27, 2021, although the Portfolio, certain other funds managed by New York Life Investments and the syndicate of banks may renew the Credit Agreement for an additional year on the same or different terms or enter into a credit agreement with a different syndicate of banks. Prior to July 28, 2020, the aggregate commitment amount and the commitment fee were the same as those under the current Credit Agreement. During the six-month period ended June 30, 2020, there were no borrowings made or outstanding with respect to the Portfolio under the Credit Agreement.
Note 7–Interfund Lending Program
Pursuant to an exemptive order issued by the SEC, the Portfolio, along with certain other funds managed by New York Life Investments, may participate in an interfund lending program. The interfund lending program provides an alternative credit facility that permits the Portfolio and certain other funds managed by New York Life Investments to lend or borrow money for temporary purposes directly to or from one another subject to the conditions of the exemptive order. During the six-month period ended June 30, 2020, there were no interfund loans made or outstanding with respect to the Portfolio.
Note 8–Purchases and Sales of Securities (in 000’s)
During the six-month period ended June 30, 2020, purchases and sales of securities, other than short-term securities, were $320,975 and $382,511, respectively.
Note 9–Capital Share Transactions
Transactions in capital shares for the six-month period ended June 30, 2020 and the year ended December 31, 2019, were as follows:
| | | | | | | | |
Initial Class | | Shares | | | Amount | |
| | |
Six-month period ended June 30, 2020: | | | | | | | | |
Shares sold | | | 535,044 | | | $ | 13,695,002 | |
Shares redeemed | | | (2,230,599 | ) | | | (60,192,379 | ) |
| | | | |
Net increase (decrease) | | | (1,695,555 | ) | | $ | (46,497,377 | ) |
| | | | | | | | |
Year ended December 31, 2019: | | | | | | | | |
Shares sold | | | 6,731,972 | | | $ | 168,469,834 | |
Shares issued to shareholders in reinvestment of distributions | | | 2,058,332 | | | | 47,407,373 | |
Shares redeemed | | | (2,621,462 | ) | | | (66,271,279 | ) |
| | | | |
Net increase (decrease) | | | 6,168,842 | | | $ | 149,605,928 | |
| | | | | | | | |
| | |
| | | | | | | | |
Service Class | | Shares | | | Amount | |
| | |
Six-month period ended June 30, 2020: | | | | | | | | |
Shares sold | | | 3,089,929 | | | $ | 73,335,068 | |
Shares redeemed | | | (3,777,332 | ) | | | (88,568,882 | ) |
| | | | |
Net increase (decrease) | | | (687,403 | ) | | $ | (15,233,814 | ) |
| | | | | | | | |
Year ended December 31, 2019: | | | | | | | | |
Shares sold | | | 4,393,149 | | | $ | 104,401,338 | |
Shares issued to shareholders in reinvestment of distributions | | | 4,206,440 | | | | 91,386,894 | |
Shares redeemed | | | (4,574,606 | ) | | | (109,642,364 | ) |
| | | | |
Net increase (decrease) | | | 4,024,983 | | | $ | 86,145,868 | |
| | | | | | | | |
Note 10–Recent Accounting Pronouncement
In March 2020, the Financial Accounting Standards Board (“FASB”) issued Accounting Standards Update 2020-04 (“ASU 2020-04”), which provides optional guidance to ease the potential accounting burden associated with transitioning away from LIBOR and other reference rates that are expected to be discontinued. ASU 2020-04 is effective immediately upon release of the update on March 12, 2020 through December 31, 2022. At this time, the Manager is evaluating the
| | |
| 20 | | MainStay VP��Winslow Large Cap Growth Portfolio |
implications of certain other provisions of ASU 2020-04 related to new disclosure requirements and any impact on the financial statement disclosures has not yet been determined.
Note 11–Subsequent Events
In connection with the preparation of the financial statements of the Portfolio as of and for the six-month period ended June 30, 2020, events and transactions subsequent to June 30, 2020, through the date the financial statements were issued have been evaluated by the Manager, for possible adjustment and/or disclosure. No subsequent events requiring financial statement adjustment or disclosure have been identified.
Note 12–Other Matters
An outbreak of COVID-19, first detected in December 2019, has developed into a global pandemic and has resulted in travel restrictions, closure of international borders, certain businesses and securities markets, restrictions on securities trading activities, prolonged quarantines, supply chain disruptions, and lower consumer demand, as well as general concern and uncertainty. The continued impact of COVID-19 is uncertain and could further adversely affect the global economy, national economies, individual issuers and capital markets in unforeseeable ways and result in a substantial and extended economic downturn. Developments that disrupt global economies and financial markets, such as COVID-19, may magnify factors that affect the Portfolio’s performance.
Discussion of the Operation and Effectiveness of the Portfolio’s
Liquidity Risk Management Program (Unaudited)
In compliance with Rule 22e-4 under the Investment Company Act of 1940, as amended (the “Liquidity Rule”), the Portfolio has adopted and implemented a liquidity risk management program (the “Program”), which New York Life Investment Management LLC believes is reasonably designed to assess and manage the Portfolio’s liquidity risk. The Board designated New York Life Investment Management LLC as administrator of the Program (the “Administrator”). The Administrator has established a Liquidity Risk Management Committee to assist the Administrator in the implementation and day-to-day administration of the Program and to otherwise support the Administrator in fulfilling its responsibilities under the Program.
At a meeting of the Board held on March 11, 2020, the Administrator provided the Board with a written report addressing the Program’s operation, adequacy and effectiveness of implementation for the period from December 1, 2018 through December 31, 2019, as required under the Liquidity Rule. The report noted that the Administrator concluded that (i) the Program operated effectively to assess and manage the Portfolio’s liquidity risk, (ii) the Program has been adequately and effectively implemented to monitor and, as applicable, respond to the Portfolio’s liquidity developments and (iii) the Portfolio’s investment strategy continues to be appropriate for an open-end portfolio.
In accordance with the Program, the Portfolio’s liquidity risk is assessed no less frequently than annually taking into consideration certain factors, as applicable, such as (i) investment strategy and liquidity of portfolio investments, (ii) short-term and long-term cash flow projections and (iii) holdings of cash and cash equivalents and borrowing arrangements and other funding sources. Certain factors are considered under both normal and reasonably foreseeable stressed conditions.
Each Portfolio portfolio investment is classified into one of four liquidity categories. The classification is based on a determination of the number of days it is reasonably expected to take to convert the investment into cash, or sell or dispose of the investment, in current market conditions without significantly changing the market value of the investment. The Administrator has delegated liquidity classification determinations to the Portfolio’s subadvisor, subject to appropriate oversight by the Administrator, and classification determinations are made by taking into account the Portfolio’s reasonably anticipated trade size, various market, trading and investment-specific considerations, as well as market depth, and, in certain cases, third-party vendor data.
The Liquidity Rule requires portfolios that do not primarily hold assets that are highly liquid investments to adopt a minimum amount of net assets that must be invested in highly liquid investments that are assets (an “HLIM”). In addition, the Liquidity Rule limits a portfolio’s investments in illiquid investments. Specifically, the Liquidity Rule prohibits acquisition of illiquid investments if doing so would result in a portfolio holding more than 15% of its net assets in illiquid investments that are assets. The Program includes provisions reasonably designed to determine, periodically review and comply with the HLIM requirement, as applicable, and to comply with the 15% limit on illiquid investments.
| | |
| 22 | | MainStay VP Winslow Large Cap Growth Portfolio |
Proxy Voting Policies and Procedures and Proxy Voting Record
A description of the policies and procedures that New York Life Investments uses to vote proxies related to the Portfolio’s securities is available free of charge upon request (i) by calling 800-598-2019; (ii) by visiting New York Life Investments’ website at https://www.nylinvestments.com/mainstay/products-and-performance/mainstay-vp-funds-trust; or (iii) by visiting the SEC’s website at www.sec.gov.
The Portfolio is required to file with the SEC its proxy voting record for the 12-month period ending June 30 on Form N-PX. The Portfolio’s most recent Form N-PX or proxy voting record is available free of charge upon request (i) by calling 800-598-2019; (ii) by visiting New York Life Investments’ website at https://www.nylinvestments.com/mainstay/products-and-performance/mainstay-vp-funds-trust; or (iii) by visiting the SEC’s website at www.sec.gov.
Shareholder Reports and Quarterly Portfolio Disclosure
The Portfolio is required to file its complete schedule of portfolio holdings with the SEC 60 days after its first and third fiscal quarter on Form N-PORT. The Portfolio’s holdings report is available free of charge upon request by calling 800-598-2019 or by visiting the SEC’s website at www.sec.gov.
MainStay VP Portfolios
MainStay VP offers a wide range of Portfolios. The full array of MainStay VP offerings is listed here, with information about the manager, subadvisors, legal counsel, and independent registered public accounting firm.
Equity Portfolios
MainStay VP Emerging Markets Equity Portfolio
MainStay VP Epoch U.S. Equity Yield Portfolio
MainStay VP Fidelity Institutional AM® Utilities Portfolio†
MainStay VP MacKay Common Stock Portfolio
MainStay VP MacKay Growth Portfolio
MainStay VP MacKay International Equity Portfolio
MainStay VP MacKay Mid Cap Core Portfolio
MainStay VP MacKay S&P 500 Index Portfolio
MainStay VP MacKay Small Cap Core Portfolio
MainStay VP Mellon Natural Resources Portfolio
MainStay VP Small Cap Growth Portfolio
MainStay VP T. Rowe Price Equity Income Portfolio
MainStay VP Winslow Large Cap Growth Portfolio
Mixed Asset Portfolios
MainStay VP Balanced Portfolio
MainStay VP Income Builder Portfolio
MainStay VP Janus Henderson Balanced Portfolio
MainStay VP MacKay Convertible Portfolio
Income Portfolios
MainStay VP Bond Portfolio
MainStay VP Floating Rate Portfolio
MainStay VP Indexed Bond Portfolio
MainStay VP MacKay Government Portfolio
MainStay VP MacKay High Yield Corporate Bond Portfolio
MainStay VP MacKay Unconstrained Bond Portfolio
MainStay VP PIMCO Real Return Portfolio
Money Market
MainStay VP U.S. Government Money Market Portfolio
Alternative
MainStay VP CBRE Global Infrastructure Portfolio
MainStay VP IQ Hedge Multi-Strategy Portfolio
Asset Allocation Portfolios
MainStay VP Conservative Allocation Portfolio
MainStay VP Growth Allocation Portfolio
MainStay VP Moderate Allocation Portfolio
MainStay VP Moderate Growth Allocation Portfolio
Manager
New York Life Investment Management LLC
New York, New York
Subadvisors
Brown Advisory LLC
Baltimore, Maryland
Candriam Belgium S.A.*
Brussels, Belgium
CBRE Clarion Securities LLC
Radnor, Pennsylvania
Epoch Investment Partners, Inc.
New York, New York
FIAM LLC
Smithfield, Rhode Island
IndexIQ Advisors LLC*
New York, New York
Janus Capital Management LLC
Denver, Colorado
MacKay Shields LLC*
New York, New York
Mellon Investments Corporation
Boston, Massachusetts
NYL Investors LLC*
New York, New York
Pacific Investment Management Company LLC
Newport Beach, California
Segall Bryant & Hamill, LLC
Chicago, Illinois
T. Rowe Price Associates, Inc.
Baltimore, Maryland
Winslow Capital Management, LLC
Minneapolis, Minnesota
Distributor
NYLIFE Distributors LLC*
Jersey City, New Jersey
Custodian
State Street Bank and Trust Company
Boston, Massachusetts
Independent Registered Public Accounting Firm
PricewaterhouseCoopers LLP
New York, New York
Legal Counsel
Dechert LLP
Washington, District of Columbia
Some Portfolios may not be available in all products.
| † | Fidelity Institutional AM is a registered trade mark of FMR LLC. Used with permission. |
| * | An affiliate of New York Life Investment Management LLC |
Not part of the Semiannual Report
2020 Semiannual Report
This report is for the general information of New York Life Variable Annuities and NYLIAC Variable Universal Life Insurance Products policyowners. It must be preceded or accompanied by the appropriate product(s) and funds prospectuses if it is given to anyone who is not an owner of a New York Life variable annuity policy or a NYLIAC Variable Universal Life Insurance Product. This report does not offer for sale or solicit orders to purchase securities.
The performance data quoted in this report represents past performance. Past performance is no guarantee of future results. Due to market volatility and other factors, current performance may be lower or higher than the figures shown. The most recent month-end performance summary for your variable annuity or variable life policy is available by calling 800-598-2019 and is updated periodically on www.newyorklife.com.
The New York Life Variable Annuities and NYLIAC Variable Universal Life Insurance Products are issued by New York Life Insurance and Annuity Corporation (a Delaware Corporation) and distributed by NYLIFE Distributors LLC (Member FINRA/SIPC).
New York Life Insurance Company
New York Life Insurance and Annuity Corporation
(NYLIAC) (A Delaware Corporation)
51 Madison Avenue, Room 551
New York, NY 10010
www.newyorklife.com
Printed on recycled paper
nylinvestments.com
NYLIFE Distributors LLC, 30 Hudson Street, Jersey City, NJ 07302
New York Life Investment Management LLC is the investment manager to the MainStay VP Funds Trust
©2020 by NYLIFE Distributors LLC. All rights reserved.
You may obtain copies of the Prospectus and the Statement of Additional Information free of charge, upon request, by calling toll-free 800-598-2019 or writing to New York Life Insurance and Annuity Corporation, 51 Madison Avenue, New York, NY 10010.
| | | | |
| Not FDIC Insured | | No Bank Guarantee | | May Lose Value |
| | | | |
| 1781631 | | | | MSVPLG10-08/20 (NYLIAC) NI525 |
MainStay VP Fidelity Institutional AM® Utilities Portfolio*
Message from the President and Semiannual Report
Unaudited | June 30, 2020
Beginning on January 1, 2021, as permitted by regulations adopted by the Securities and Exchange Commission, paper copies of the MainStay VP Portfolio annual and semi-annual shareholder reports may no longer be sent by mail, unless you specifically request paper copies of the reports from the insurance company that offers your policy. Instead, the reports will be made available online, and you will be notified by mail each time a report is posted and provided with a website link to access the report. Instructions for requesting paper copies will be provided by your insurance company.
If you already elected to receive shareholder reports electronically, you will not be affected by this change and you need not take any action. At any time, you may elect to receive reports and other communications from the insurance company electronically by following the instructions provided by the insurance company.
You may elect to receive all future shareholder reports in paper form free of charge. You can inform the insurance company that you wish to receive paper copies of reports by following the instructions provided by the insurance company. Your election to receive reports in paper form will apply to all portfolio companies available under your contract.
| | | | | | | | |
| Not FDIC/NCUA Insured | | Not a Deposit | | May Lose Value | | No Bank Guarantee | | Not Insured by Any Government Agency |
| * | Fidelity Institutional AM is a registered trade mark of FMR LLC. Used with permission. |

This page intentionally left blank
Message from the President
High levels of volatility shook financial markets in response to the COVID-19 pandemic and an abrupt decline in global economic activity during the six months ended June 30, 2020.
Markets entered 2020 riding strong fourth quarter performance and an economic expansion of historic longevity. Most broad stock and bond indices began to dip in late February as growing numbers of COVID-19 cases were seen in hotspots around the world. On March 11, 2020, the World Health Organization acknowledged that the disease had reached pandemic proportions, with over 80,000 identified cases in China, thousands in Italy, South Korea and the United States, and more in dozens of additional countries. Governments and central banks pledged trillions of dollars to address the mounting economic and public health crisis; however, “stay-at-home” orders and other restrictions on non-essential activity caused global economic activity to slow. Most stocks and bonds lost significant ground in this challenging environment, with equities declining by roughly a third and the yield on high-yield credit indices shooting higher.
Policymakers responded with extraordinary speed to address the situation. In the United States, the Federal Reserve (“Fed”) cut interest rates to near zero and announced unlimited quantitative easing. With help from Treasury, the Fed later rolled out a series of lending facilities to directly support market functioning. In late March, the Federal government declared a national emergency; Congress passed, and the President signed, a $2 trillion CARES Act (The Coronavirus Aid, Relief, and Economic Security Act), with the promise of further assistance for consumers and businesses to come. This enormous wave of policy support helped fuel a rapid recovery in market pricing as stocks bounced back and credit spreads narrowed. Some states rushed to ease restrictions on travel and social gatherings, further fueling optimism that the effects of the pandemic might prove short lived. However, the final weeks of the reporting period saw infection rates beginning to rise in some of the first states to reopen, raising concerns that a second round of restrictive government policies might prove necessary, once again stifling economic activity.
Despite all the market volatility, the broadly based S&P 500® Index finished the first half of 2020 only slightly below its starting point and the technology-heavy NASDAQ Composite Index posted gains, closing in near record territory. Small-cap stocks tended to trail their large cap counterparts, as illustrated by the Russell 2000® Index’s loss of approximately 15%, while value-oriented stocks lagged growth-oriented issues. From a global perspective, U.S. stocks generally outperformed international equities, with emerging markets hit particularly hard by the flight from risk.
Fixed-income markets also experienced unusually high levels of volatility. Recognized safe havens, such as U.S. government bonds, attracted increased investment, driving yields lower and prices higher, positioning long-term Treasury bonds to deliver particularly strong gains. Investment-grade corporate bonds lost value in March before recovering in the closing months of the reporting period, while relatively speculative high-yield credit faced the brunt of risk-off sentiment. Emerging market debt underperformed most other bonds types as investors sought to minimize currency and sovereign risks.
Today, as we at New York Life Investments continue to track the ongoing health crisis and its financial ramifications, we are particularly mindful of the people at the heart of our enterprise—our colleagues and valued clients. By taking appropriate steps to minimize community spread of COVID-19 within our organization, we strive to safeguard the health of our investment professionals so they can continue to provide you, as a MainStay investor, with world class investment solutions in this rapidly evolving environment.
Sincerely,

Kirk C. Lehneis
President
The opinions expressed are as of the date of this report and are subject to change. There is no guarantee that any forecast made will come to pass. This material does not constitute investment advice and is not intended as an endorsement of any specific investment. Past performance is no guarantee of future results.
Not part of the Semiannual Report
Table of Contents
Investors should refer to the Portfolio’s Summary Prospectus and/or Prospectus and consider the Portfolio’s investment objectives, strategies, risks, charges and expenses carefully before investing. The Summary Prospectus and/or Prospectus contain this and other information about the Portfolio. You may obtain copies of the Portfolio’s Summary Prospectus and/or the Prospectus and the Statement of Additional Information free of charge, upon request, by calling toll-free 800-598-2019, by writing to New York Life Insurance and Annuity Corporation, 51 Madison Avenue, Room 251, New York, New York 10010 or by sending an email to MainStayShareholdersServices@nylim.com. These documents are also available at nylinvestments.com/vpdocuments. Please read the Summary Prospectus and/or Prospectus carefully before investing. MainStay VP Funds Trust portfolios are separate account options which are purchased through a variable insurance or variable annuity contract.
Investment and Performance Comparison1 (Unaudited)
Performance data quoted represents past performance. Past performance is no guarantee of future results. Because of market volatility and other factors, current performance may be lower or higher than the figures shown. Investment return and principal value will fluctuate, and as a result, when shares are redeemed, they may be worth more or less than their original cost. The performance table and graph do not reflect any deduction of sales charges, mortality and expense charges, contract charges or administrative charges. Please refer to the Performance Summary appropriate for your policy. For performance information current to the most recent month-end, please call 800-598-2019 or visit www.newyorklife.com.
Average Annual Total Returns for the Period-Ended June 30, 2020
| | | | | | | | | | | | | | | | | | | | | | |
| Class | | Inception
Date | | Six Months | | | One Year | | | Five Years | | | Since Inception2 | | | Gross
Expense
Ratio3 | |
| | | | | | |
| Initial Class Shares | | 2/17/2012 | | | –13.96 | % | | | –6.82 | % | | | 3.43 | % | | | 6.76 | % | | | 0.68 | % |
| Service Class Shares | | 2/17/2012 | | | –14.06 | | | | –7.05 | | | | 3.18 | | | | 6.49 | | | | 0.93 | |
| | | | | | | | | | | | | | | | |
| Benchmark Performance | | Six Months | | | One Year | | | Five
Years | | | Since Inception | |
| | | | |
MSCI USA IMI Utilities 25/50 Index4 | | | –12.00 | % | | | –3.87 | % | | | 10.16 | % | | | 10.00 | % |
Dow Jones Global Utilities Index5 | | | –9.76 | | | | –2.39 | | | | 6.66 | | | | 6.14 | |
Morningstar Utilities Category Average6 | | | –11.49 | | | | –4.84 | | | | 7.67 | | | | 8.07 | |
| 1. | Performance figures may reflect certain fee waivers and/or expense limitations, without which total returns may have been different. For information on current fee waivers and/or expense limitations (if any), please refer to the Notes to Financial Statements. |
| 2. | The Portfolio replaced its subadvisor and modified its principal investment strategies and changed its classification from a diversified fund to a non-diversified fund as of November 30, 2018. Therefore, the performance information shown in this report prior to November 30, 2018 reflects the Portfolio’s prior subadvisor, principal investment strategies and diversification status. |
| 3. | The gross expense ratios presented reflect the Portfolio’s “Total Annual Portfolio Operating Expenses” from the most recent Prospectus, as supplemented, and may differ from other expense ratios disclosed in this report. |
| 4. | The MSCI USA IMI Utilities 25/50 Index is the Portfolio’s primary benchmark. The MSCI USA IMI Utilities 25/50 Index is a modified market capitalization- |
| | weighted index of stocks designed to measure the performance of utilities companies in the MSCI U.S. Index. Results assume reinvestment of all dividends and capital gains. An investment cannot be made directly in an index. |
| 5. | Prior to November 30, 2018, the Dow Jones Global Utilities Index was the Portfolio’s primary benchmark. The Dow Jones Global Utilities Index is a free-float market-capitalization-weighted index that measures the performance of utility companies in developed and emerging markets. Results assume reinvestment of all dividends and capital gains. An investment cannot be made directly in an index. |
| 6. | The Morningstar Utilities Category Average is representative of funds that seek capital appreciation by investing primarily in equity securities of U.S. or non-U.S. public utilities including electric, gas, and telephone-service providers. Results are based on average total returns of similar funds with all dividends and capital gain distributions reinvested. |
Cost in Dollars of a $1,000 Investment in MainStay VP Fidelity Institutional AM® Utilities Portfolio (Unaudited)
The example below is intended to describe the fees and expenses borne by shareholders during the six-month period from January 1, 2020, to June 30, 2020, and the impact of those costs on your investment.
Example
As a shareholder of the Portfolio you incur two types of costs: (1) transaction costs, including exchange fees and sales charges (loads) on purchases (as applicable), and (2) ongoing costs, including management fees, distribution and/or service (12b-1) fees, and other Portfolio expenses (as applicable). This example is intended to help you understand your ongoing costs (in dollars) of investing in the Portfolio and to compare these costs with the ongoing costs of investing in other mutual funds. The example is based on an investment of $1,000 made at the beginning of the six-month period and held for the entire period from January 1, 2020, to June 30, 2020. Shares are only sold in connection with variable life and annuity contracts and the example does not reflect any contract level or transactional fees or expenses. If these costs had been included, your costs would have been higher.
This example illustrates your Portfolio’s ongoing costs in two ways:
Actual Expenses
The second and third data columns in the table below provide information about actual account values and actual expenses. You may use the information in these columns, together with the amount you invested, to estimate the expenses that you paid during the six months
ended June 30, 2020. Simply divide your account value by $1,000 (for example, an $8,600 account value divided by $1,000 = 8.6), then multiply the result by the number under the heading entitled “Expenses Paid During Period” to estimate the expenses you paid on your account during this period.
Hypothetical Example for Comparison Purposes
The fourth and fifth data columns in the table below provide information about hypothetical account values and hypothetical expenses based on the Portfolio’s actual expense ratio and an assumed rate of return of 5% per year before expenses, which is not the Portfolio’s actual return. The hypothetical account values and expenses may not be used to estimate the actual ending account balances or expenses you paid for the six-month period shown. You may use this information to compare the ongoing costs of investing in the Portfolio with the ongoing costs of investing in other mutual funds. To do so, compare this 5% hypothetical example with the 5% hypothetical examples that appear in the shareholder reports of the other mutual funds.
Please note that the expenses shown in the table are meant to highlight your ongoing costs only and do not reflect any transactional costs, such as exchange fees or sales charges (loads). Therefore, the fourth and fifth data columns of the table are useful in comparing ongoing costs only and will not help you determine the relative total costs of owning different funds. In addition, if these transactional costs were included, your costs would have been higher.
| | | | | | | | | | | | | | | | | | | | | | |
| | | | | | | | | | | | | | | | | | |
| Share Class | | Beginning
Account
Value
1/1/20 | | | Ending Account
Value (Based
on Actual
Returns and
Expenses)
6/30/20 | | | Expenses
Paid
During
Period1 | | | Ending Account
Value (Based
on Hypothetical
5% Annualized
Return and
Actual Expenses)
6/30/20 | | | Expenses
Paid
During
Period1 | | | Net Expense
Ratio
During
Period2 |
| | | | | | |
| Initial Class Shares | | $ | 1,000.00 | | | $ | 860.40 | | | $ | 3.10 | | | $ | 1,021.53 | | | $ | 3.37 | | | 0.67% |
| | | | | | |
| Service Class Shares | | $ | 1,000.00 | | | $ | 859.40 | | | $ | 4.25 | | | $ | 1,020.29 | | | $ | 4.62 | | | 0.92% |
| 1 | Expenses are equal to the Portfolio’s annualized expense ratio of each class multiplied by the average account value over the period, divided by 366 and multiplied by 182 (to reflect the six-month period). The table above represents the actual expenses incurred during the six-month period. In addition to the fees and expenses which the Portfolio bears directly, it also indirectly bears a pro rata share of the fees and expenses of the underlying funds in which it invests. Such indirect expenses are not included in the above-reported expense figures. |
| 2 | Expenses are equal to the Portfolio’s annualized expense ratio to reflect the six-month period. |
| | |
| 6 | | MainStay VP Fidelity Institutional AM® Utilities Portfolio |
Industry Composition as of June 30, 2020 (Unaudited)
| | | | |
| |
| |
| Electric Utilities | | | 58.0 | % |
| |
| Multi-Utilities | | | 29.1 | |
| |
| Independent Power & Renewable Electricity Producers | | | 10.7 | |
| |
| Gas Utilities | | | 1.4 | |
| | | | |
| |
| Short-Term Investment | | | 3.3 | |
| |
| Other Assets, Less Liabilities | | | –2.5 | |
| | | | |
| |
| | | 100.0 | % |
| | | | |
See Portfolio of Investments beginning on page 10 for specific holdings within these categories. The Portfolio’s holdings are subject to change.
Top Ten Holdings as of June 30, 2020 (excluding short-term investment) (Unaudited)
| 9. | CenterPoint Energy, Inc. |
Portfolio Management Discussion and Analysis (Unaudited)
Answers to the questions reflect the views of portfolio manager Douglas Simmons of FIAM LLC (“FIAM”) the Portfolio’s Subadvisor.
How did MainStay VP Fidelity Institutional AM® Utilities Portfolio1 perform relative to its benchmarks and peers during the six months ended June 30, 2020?
For the six months ended June 30, 2020, MainStay VP Fidelity Institutional AM® Utilities Portfolio returned –13.96% for Initial Class shares and –14.06% for Service Class shares. Over the same period, both share classes underperformed the –12.00% return of the MSCI USA IMI Utilities 25/50 Index, which is the Portfolio’s primary benchmark, and the –9.76% return of the Dow Jones Global Utilities Index. For the six months ended June 30, 2020, both share classes underperformed the –11.49% return of the Morningstar Utilities Category Average.2
During the reporting period, were there any market events that materially impacted the Portfolio’s performance or liquidity?
There were no market events that materially impacted the Portfolio’s performance or liquidity relative to the MSCI USA IMI Utilities 25/50 Index. However, the dramatic sell-off and corresponding market volatility related to the spreading COVID-19 pandemic was a major factor that impacted returns for the Portfolio, the utilities sector and the broader market.
What factors affected the Portfolio’s relative performance during the reporting period?
The Portfolio underperformed its benchmark primarily due to security selection among electric utilities holdings and lack of exposure to water utilities.
Which sectors were the strongest positive contributors to the Portfolio’s relative performance, and which sectors were particularly weak?
The strongest positive contributions to the Portfolio’s relative performance from a subsector standpoint came from multi-utilities holdings, which represented a significant minority percentage of both the Portfolio and the MSCI USA IMI Utilities 25/50 Index as of June 30, 2020. (Contributions take weightings and total returns into account.) The next two strongest contributors were gas utilities and independent power producers & energy traders (“IPPs”). Conversely, the most significant detractor from relative performance was electric utilities, which is the largest subsector in the benchmark as of June 30, 2020. Water utilities was the second largest detractor, and oil & gas storage & transportation, an out-of-Index weight, was third. All the subsectors mentioned above recorded negative absolute performance during the reporting period.
During the reporting period, which individual stocks made the strongest positive contributions to the Portfolio’s absolute performance and which stocks detracted the most?
On an absolute return basis, the three largest positive contributors to the Portfolio’s overall performance were renewable energy company Clearway Energy, diversified utility Public Service Enterprise Group and diversified utility Dominion Energy. During a volatile period in the markets, Clearway Energy was a relative outperformer, largely due to its stable cash flows. In the difficult market environment that prevailed, many companies viewed as stable cash flow generators were rewarded. Clearway was regarded as such due to its long-term contracts on generation assets. Public Service Enterprise Group was able to keep its regulated earnings steady during the market sell-off, which was viewed favorably by investors. Dominion Energy’s customer mix is skewed toward relatively high-margin residential customers, which resulted in less of a burden during the pandemic shutdown than other utility companies whose customer bases skew more towards commercial and industrial customers. Another notably positive contributor to absolute performance was NextEra Energy Partners, a subsidiary of regulated electric utility NextEra Energy, which we view as a best-in-class utility that also boasts a premium renewables business.
The three most significant detractors from absolute performance during the reporting period were regulated electric utility Edison International, diversified utility Exelon and diversified utility Sempra Energy. Edison International shares sold off to the point of it becoming one of the cheapest regulated utilities in the sector. The discount was largely attributable to fears regarding future liabilities from wildfires in California. The pandemic arguably had a more meaningful impact on Exelon than some other names in the sector by delaying what was expected to be a favorable ruling on legislation in Illinois that directly affected Exelon. Lastly, Sempra Energy lagged and traded at a discount during the reporting period largely because investors were concerned about the company’s meaningful exposure to liquid natural gas, although Sempra Energy’s exposure was fully contracted.
Did the Portfolio make any significant purchases or sales during the reporting period?
The Portfolio significantly added to its stake in NextEra Energy, during the reporting period. The Portfolio also purchased shares in DTE Energy, a multi-utility that operates as a gas and electric utility in Michigan, a state with what we view to be a favorable regulatory environment at present.
| 1. | Fidelity Institutional AM is a registered trademark of FMR LLC. Used with permission. |
| 2. | See page 5 for more information on benchmark and peer group returns. |
| | |
| 8 | | MainStay VP Fidelity Institutional AM® Utilities Portfolio |
We reduced the Portfolio’s stake in American Electric Power during the reporting period. We believe this electric utility is likely to face notable equity needs in the next 3-to-5 years relative to many peers. We exited the Portfolio’s stake in Consolidated Edison, a multi-utility serving the greater New York City area. The stock has built in a defensive premium, given the company’s lack of direct commodity exposure and more diversified business units. We felt there were better valuation opportunities in the prevailing market.
How did the Portfolio’s sector weightings change during the reporting period?
The Portfolio ended the reporting period with near-neutral positioning in electric utilities relative to the MSCI USA IMI Utilities 25/50 Index. This represented a meaningful change, as the
Portfolio held largely underweight exposure to electric utilities for most of the reporting period. The Portfolio also notably narrowed its underweight exposure to multi-utilities.
How was the Portfolio positioned at the end of the reporting period?
As of June 30, 2020, IPPs remained the Portfolio’s largest subsector with overweight exposure relative to the MSCI USA IMI Utilities 25/50 Index, a position that did not change throughout the reporting period. Similarly, the Portfolio’s most significantly underweight exposure as of the same date was to water utilities, a subsector that the Portfolio had no exposure to throughout the same period. The Portfolio’s allocation to electric utilities, the largest segment of the benchmark, ended the reporting period in line with the benchmark.
The opinions expressed are those of the portfolio managers as of the date of this report and are subject to change. There is no guarantee that any forecasts will come to pass. This material does not constitute investment advice and is not intended as an endorsement of any specific investment.
Not all MainStay VP Portfolios and/or share classes are available under all policies.
Portfolio of Investments June 30, 2020 (Unaudited)
| | | | | | | | |
| | |
| | | Shares | | | Value | |
| Common Stocks 99.2% † | |
Electric Utilities 58.0% | |
Alliant Energy Corp. | | | 147,900 | | | $ | 7,075,536 | |
American Electric Power Co., Inc. | | | 241,700 | | | | 19,248,988 | |
Duke Energy Corp. | | | 535,045 | | | | 42,744,745 | |
Edison International | | | 1,256,487 | | | | 68,239,809 | |
Entergy Corp. | | | 477,998 | | | | 44,840,992 | |
Evergy, Inc. | | | 1,093,804 | | | | 64,851,639 | |
Exelon Corp. | | | 2,051,786 | | | | 74,459,314 | |
FirstEnergy Corp. | | | 1,167,818 | | | | 45,287,982 | |
NextEra Energy, Inc. | | | 386,833 | | | | 92,905,682 | |
NRG Energy, Inc. | | | 754,145 | | | | 24,554,961 | |
PG&E Corp. (a) | | | 3,453,465 | | | | 32,322,959 | |
Pinnacle West Capital Corp. | | | 53,800 | | | | 3,943,002 | |
PNM Resources, Inc. | | | 152,995 | | | | 5,881,128 | |
Southern Co. | | | 871,382 | | | | 45,181,157 | |
| | | | | | | | |
| | | | | | | 571,537,894 | |
| | | | | | | | |
Gas Utilities 1.4% | |
Atmos Energy Corp. | | | 136,000 | | | | 13,542,880 | |
| | | | | | | | |
|
Independent Power & Renewable Electricity Producers 10.7% | |
AES Corp. | | | 2,400,502 | | | | 34,783,274 | |
Clearway Energy, Inc., Class C | | | 1,355,379 | | | | 31,255,039 | |
NextEra Energy Partners, L.P. | | | 387,717 | | | | 19,882,128 | |
Vistra Energy Corp. | | | 1,041,174 | | | $ | 19,386,660 | |
| | | | | | | | |
| | | | | | | 105,307,101 | |
| | | | | | | | |
| | | | | | | | |
| | |
| | | Shares | | | Value | |
Multi-Utilities 29.1% | |
Ameren Corp. | | | 291,329 | | | $ | 20,497,908 | |
CenterPoint Energy, Inc. | | | 2,397,659 | | | | 44,764,294 | |
Dominion Energy, Inc. | | | 1,499,275 | | | | 121,711,144 | |
DTE Energy Co. | | | 162,539 | | | | 17,472,942 | |
Public Service Enterprise Group, Inc. | | | 788,331 | | | | 38,754,352 | |
Sempra Energy | | | 371,143 | | | | 43,509,094 | |
| | | | | | | | |
| | | | | | | 286,709,734 | |
| | | | | | | | |
Total Common Stocks
(Cost $960,110,931) | | | | | | | 977,097,609 | |
| | | | | |
|
| Short-Term Investments 3.3% | |
Affiliated Investment Company 3.3% | |
MainStay U.S. Government Liquidity Fund, 0.05% (b) | | | 32,287,542 | | | | 32,287,542 | |
| | | | | | | | |
Total Short-Term Investment
(Cost $32,287,542) | | | | | | | 32,287,542 | |
| | | | | |
Total Investments
(Cost $992,398,473) | | | 102.5 | % | | | 1,009,385,151 | |
Other Assets, Less Liabilities | | | (2.5 | ) | | | (24,952,791 | ) |
Net Assets | | | 100.0 | % | | $ | 984,432,360 | |
| † | Percentages indicated are based on Portfolio net assets. |
| (a) | Non-income producing security. |
| (b) | Current yield as of June 30, 2020. |
The following is a summary of the fair valuations according to the inputs used as of June 30, 2020, for valuing the Portfolio’s assets:
| | | | | | | | | | | | | | | | |
Description | | Quoted
Prices in
Active
Markets for
Identical
Assets
(Level 1) | | | Significant
Other
Observable
Inputs
(Level 2) | | | Significant
Unobservable
Inputs
(Level 3) | | | Total | |
| | | | |
Asset Valuation Inputs | | | | | | | | | | | | | | | | |
| Investments in Securities (a) | | | | | | | | | | | | | | | | |
| Common Stocks | | $ | 977,097,609 | | | $ | — | | | $ | — | | | $ | 977,097,609 | |
| Short-Term Investment | | | | | | | | | | | | | | | | |
Affiliated Investment Company | | | 32,287,542 | | | | — | | | | — | | | | 32,287,542 | |
| | | | | | | | | | | | | | | | |
| Total Investments in Securities | | $ | 1,009,385,151 | | | $ | — | | | $ | — | | | $ | 1,009,385,151 | |
| | | | | | | | | | | | | | | | |
| (a) | For a complete listing of investments and their industries, see the Portfolio of Investments. |
| | | | |
| 10 | | MainStay VP Fidelity Institutional AM® Utilities Portfolio | | The notes to the financial statements are an integral part of,
and should be read in conjunction with, the financial statements. |
Statement of Assets and Liabilities as of June 30, 2020 (Unaudited)
| | | | |
| Assets | | | | |
Investment in unaffiliated securities, at value (identified cost $960,110,931) | | $ | 977,097,609 | |
Investment in affiliated investment company, at value (identified cost $32,287,542) | | | 32,287,542 | |
Cash denominated in foreign currencies (identified cost $365,225) | | | 363,352 | |
Receivables: | | | | |
Dividends | | | 1,160,883 | |
Portfolio shares sold | | | 478,255 | |
Other assets | | | 5,328 | |
| | | | |
Total assets | | | 1,011,392,969 | |
| | | | |
| |
| Liabilities | | | | |
Payables: | | | | |
Investment securities purchased | | | 25,495,046 | |
Portfolio shares redeemed | | | 633,292 | |
Manager (See Note 3) | | | 534,203 | |
NYLIFE Distributors (See Note 3) | | | 190,509 | |
Shareholder communication | | | 64,816 | |
Professional fees | | | 23,964 | |
Trustees | | | 4,173 | |
Custodian | | | 785 | |
Accrued expenses | | | 13,821 | |
| | | | |
Total liabilities | | | 26,960,609 | |
| | | | |
Net assets | | $ | 984,432,360 | |
| | | | |
| |
| Composition of Net Assets | | | | |
Shares of beneficial interest outstanding (par value of $.001 per share) unlimited number of shares authorized | | $ | 85,253 | |
Additional paid-in capital | | | 882,579,667 | |
| | | | |
| | | 882,664,920 | |
Total distributable earnings (loss) | | | 101,767,440 | |
| | | | |
Net assets | | $ | 984,432,360 | |
| | | | |
| | | | |
Initial Class | | | | |
Net assets applicable to outstanding shares | | $ | 88,923,686 | |
| | | | |
Shares of beneficial interest outstanding | | | 7,659,559 | |
| | | | |
Net asset value per share outstanding | | $ | 11.61 | |
| | | | |
Service Class | | | | |
Net assets applicable to outstanding shares | | $ | 895,508,674 | |
| | | | |
Shares of beneficial interest outstanding | | | 77,593,373 | |
| | | | |
Net asset value per share outstanding | | $ | 11.54 | |
| | | | |
| | | | | | |
The notes to the financial statements are an integral part of,
and should be read in conjunction with, the financial statements. | | | | | 11 | |
Statement of Operations for the six months ended June 30, 2020 (Unaudited)
| | | | |
| Investment Income (Loss) | | | | |
Income | | | | |
Dividends-unaffiliated | | $ | 18,096,742 | |
Dividends-affiliated | | | 74,684 | |
| | | | |
Total income | | | 18,171,426 | |
| | | | |
Expenses | | | | |
Manager (See Note 3) | | | 3,426,012 | |
Distribution/Service—Service Class (See Note 3) | | | 1,232,428 | |
Professional fees | | | 63,420 | |
Shareholder communication | | | 60,584 | |
Custodian | | | 18,813 | |
Trustees | | | 13,085 | |
Miscellaneous | | | 26,321 | |
| | | | |
Total expenses | | | 4,840,663 | |
| | | | |
Net investment income (loss) | | | 13,330,763 | |
| | | | |
|
| Realized and Unrealized Gain (Loss) on Investments and Foreign Currency Transactions | |
Net realized gain (loss) on: | | | | |
Unaffiliated investment transactions | | | (7,665,733 | ) |
Foreign currency transactions | | | (31 | ) |
| | | | |
Net realized gain (loss) on investments and foreign currency transactions | | | (7,665,764 | ) |
| | | | |
Net change in unrealized appreciation (depreciation) on: | | | | |
Unaffiliated investments | | | (173,183,253 | ) |
Translation of other assets and liabilities in foreign currencies | | | 1,371 | |
| | | | |
Net change in unrealized appreciation (depreciation) on investments and foreign currencies | | | (173,181,882 | ) |
| | | | |
Net realized and unrealized gain (loss) on investments and foreign currency transactions | | | (180,847,646 | ) |
| | | | |
Net increase (decrease) in net assets resulting from operations | | $ | (167,516,883 | ) |
| | | | |
| | | | |
| 12 | | MainStay VP Fidelity Institutional AM® Utilities Portfolio | | The notes to the financial statements are an integral part of,
and should be read in conjunction with, the financial statements. |
Statements of Changes in Net Assets
for the six months ended June 30, 2020 (Unaudited) and the year ended December 31, 2019
| | | | | | | | |
| | | 2020 | | | 2019 | |
| Increase (Decrease) in Net Assets | |
Operations: | | | | | | | | |
Net investment income (loss) | | $ | 13,330,763 | | | $ | 26,146,249 | |
Net realized gain (loss) on investments and foreign currency transactions | | | (7,665,764 | ) | | | 58,177,918 | |
Net change in unrealized appreciation (depreciation) on investments and foreign currencies | | | (173,181,882 | ) | | | 163,521,831 | |
| | | | |
Net increase (decrease) in net assets resulting from operations | | | (167,516,883 | ) | | | 247,845,998 | |
| | | | |
Distributions to shareholders: | | | | | | | | |
Initial Class | | | — | | | | (6,045,255 | ) |
Service Class | | | — | | | | (68,833,295 | ) |
| | | | |
Total distributions to shareholders | | | — | | | | (74,878,550 | ) |
| | | | |
Capital share transactions: | | | | | | | | |
Net proceeds from sale of shares | | | 36,531,901 | | | | 38,010,038 | |
Net asset value of shares issued to shareholders in reinvestment of distributions | | | — | | | | 74,878,550 | |
Cost of shares redeemed | | | (103,742,955 | ) | | | (215,374,278 | ) |
| | | | |
Increase (decrease) in net assets derived from capital share transactions | | | (67,211,054 | ) | | | (102,485,690 | ) |
| | | | |
Net increase (decrease) in net assets | | | (234,727,937 | ) | | | 70,481,758 | |
| | |
| Net Assets | | | | | | | | |
Beginning of period | | | 1,219,160,297 | | | | 1,148,678,539 | |
| | | | |
End of period | | $ | 984,432,360 | | | $ | 1,219,160,297 | |
| | | | |
| | | | | | |
The notes to the financial statements are an integral part of,
and should be read in conjunction with, the financial statements. | | | | | 13 | |
Financial Highlights selected per share data and ratios
| | | | | | | | | | | | | | | | | | | | | | | | | | | | |
| | | |
| | | Six months ended June 30, | | | | | | Year ended December 31, | |
| | | | | | | |
| Initial Class | | 2020* | | | | | | 2019 | | | 2018 | | | 2017 | | | 2016 | | | 2015 | |
| | | | | | | |
Net asset value at beginning of period | | $ | 13.49 | | | | | | | $ | 11.68 | | | $ | 11.75 | | | $ | 10.66 | | | $ | 10.15 | | | $ | 13.42 | |
| | | | | | | | | | | | | | | | | | | | | | | | | | | | |
| | | | | | | |
Net investment income (loss) (a) | | | 0.17 | | | | | | | | 0.31 | | | | 0.28 | | | | 0.25 | | | | 0.19 | | | | 0.28 | |
| | | | | | | |
Net realized and unrealized gain (loss) on investments | | | (2.05 | ) | | | | | | | 2.39 | | | | (0.32 | ) | | | 1.49 | | | | 0.88 | | | | (2.25 | ) |
| | | | | | | |
Net realized and unrealized gain (loss) on foreign currency transactions | | | 0.00 | ‡ | | | | | | | (0.00 | )‡ | | | 0.14 | | | | (0.16 | ) | | | 0.08 | | | | 0.13 | |
| | | | | | | | | | | | | | | | | | | | | | | | | | | | |
| | | | | | | |
Total from investment operations | | | (1.88) | | | | | | | | 2.70 | | | | 0.10 | | | | 1.58 | | | | 1.15 | | | | (1.84 | ) |
| | | | | | | | | | | | | | | | | | | | | | | | | | | | |
| | | | | | | |
| Less distributions: | | | | | | | | | | | | | | | | | | | | | | | | | | | | |
| | | | | | | |
From net investment income | | | — | | | | | | | | (0.34 | ) | | | (0.15 | ) | | | (0.49 | ) | | | (0.34 | ) | | | (0.51 | ) |
| | | | | | | |
From net realized gain on investments | | | — | | | | | | | | (0.55 | ) | | | (0.02 | ) | | | — | | | | (0.30 | ) | | | (0.92 | ) |
| | | | | | | | | | | | | | | | | | | | | | | | | | | | |
| | | | | | | |
Total distributions | | | — | | | | | | | | (0.89 | ) | | | (0.17 | ) | | | (0.49 | ) | | | (0.64 | ) | | | (1.43 | ) |
| | | | | | | | | | | | | | | | | | | | | | | | | | | | |
| | | | | | | |
Net asset value at end of period | | $ | 11.61 | | | | | | | $ | 13.49 | | | $ | 11.68 | | | $ | 11.75 | | | $ | 10.66 | | | $ | 10.15 | |
| | | | | | | | | | | | | | | | | | | | | | | | | | | | |
| | | | | | | |
Total investment return (b) | | | (13.94 | %)(c) | | | | | | | 23.26 | % | | | 0.80 | % | | | 14.72 | % | | | 11.43 | % | | | (14.35 | %) |
| | | | | | | |
| Ratios (to average net assets)/Supplemental Data: | | | | | | | | | | | | | | | | | | | | | | | | | | | | |
| | | | | | | |
Net investment income (loss) | | | 2.71 | % †† | | | | | | | 2.41 | % | | | 2.31 | % | | | 2.11 | % | | | 1.76 | %(d) | | | 2.23 | % |
| | | | | | | |
Net expenses (e) | | | 0.67 | % †† | | | | | | | 0.68 | % | | | 0.76 | % | | | 0.76 | % | | | 0.75 | %(f) | | | 0.77 | % |
| | | | | | | |
Portfolio turnover rate | | | 34 | % | | | | | | | 47 | % | | | 84 | % | | | 30 | % | | | 35 | % | | | 43 | % |
| | | | | | | |
Net assets at end of period (in 000’s) | | $ | 88,924 | | | | | | | $ | 97,503 | | | $ | 81,716 | | | $ | 83,261 | | | $ | 75,772 | | | $ | 70,368 | |
| ‡ | Less than one cent per share. |
| (a) | Per share data based on average shares outstanding during the period. |
| (b) | Total return does not reflect any deduction of sales charges, mortality and expense charges, contract charges or administrative charges. For periods of less than one year, total return is not annualized. |
| (c) | Total investment return may reflect adjustments to conform to generally accepted accounting principles. |
| (d) | Without the custody fee reimbursement, net investment income (loss) would have been 1.74%. |
| (e) | In addition to the fees and expenses which the Portfolio bears directly, it also indirectly bears a pro-rata share of the fees and expenses of the underlying funds in which it invests. Such indirect expenses are not included in the above expense ratios. |
| (f) | Without the custody fee reimbursement, net expenses would have been 0.77%. |
| | | | |
| 14 | | MainStay VP Fidelity Institutional AM® Utilities Portfolio | | The notes to the financial statements are an integral part of,
and should be read in conjunction with, the financial statements. |
Financial Highlights selected per share data and ratios
| | | | | | | | | | | | | | | | | | | | | | | | | | | | |
| | | |
| | | Six months ended June 30, | | | | | | Year ended December 31, | |
| | | | | | | |
| Service Class | | 2020* | | | | | | 2019 | | | 2018 | | | 2017 | | | 2016 | | | 2015 | |
| | | | | | | |
Net asset value at beginning of period | | $ | 13.43 | | | | | | | $ | 11.63 | | | $ | 11.69 | | | $ | 10.62 | | | $ | 10.10 | | | $ | 13.36 | |
| | | | | | | | | | | | | | | | | | | | | | | | | | | | |
| | | | | | | |
Net investment income (loss) (a) | | | 0.15 | | | | | | | | 0.28 | | | | 0.25 | | | | 0.22 | | | | 0.16 | | | | 0.25 | |
| | | | | | | |
Net realized and unrealized gain (loss) on investments | | | (2.04 | ) | | | | | | | 2.37 | | | | (0.32 | ) | | | 1.47 | | | | 0.89 | | | | (2.24 | ) |
| | | | | | | |
Net realized and unrealized gain (loss) on foreign currency transactions | | | 0.00 | ‡ | | | | | | | (0.00 | )‡ | | | 0.14 | | | | (0.16 | ) | | | 0.08 | | | | 0.13 | |
| | | | | | | | | | | | | | | | | | | | | | | | | | | | |
| | | | | | | |
Total from investment operations | | | (1.89 | ) | | | | | | | 2.65 | | | | 0.07 | | | | 1.53 | | | | 1.13 | | | | (1.86 | ) |
| | | | | | | | | | | | | | | | | | | | | | | | | | | | |
| | | | | | | |
| Less distributions: | | | | | | | | | | | | | | | | | | | | | | | | | | | | |
| | | | | | | |
From net investment income | | | — | | | | | | | | (0.30 | ) | | | (0.11 | ) | | | (0.46 | ) | | | (0.31 | ) | | | (0.48 | ) |
| | | | | | | |
From net realized gain on investments | | | — | | | | | | | | (0.55 | ) | | | (0.02 | ) | | | — | | | | (0.30 | ) | | | (0.92 | ) |
| | | | | | | | | | | | | | | | | | | | | | | | | | | | |
| | | | | | | |
Total distributions | | | — | | | | | | | | (0.85 | ) | | | (0.13 | ) | | | (0.46 | ) | | | (0.61 | ) | | | (1.40 | ) |
| | | | | | | | | | | | | | | | | | | | | | | | | | | | |
| | | | | | | |
Net asset value at end of period | | $ | 11.54 | | | | | | | $ | 13.43 | | | $ | 11.63 | | | $ | 11.69 | | | $ | 10.62 | | | $ | 10.10 | |
| | | | | | | | | | | | | | | | | | | | | | | | | | | | |
| | | | | | | |
Total investment return (b) | | | (14.07 | %)(c) | | | | | | | 22.95 | % | | | 0.55 | % | | | 14.44 | % | | | 11.15 | % | | | (14.57 | %) |
| | | | | | | |
| Ratios (to average net assets)/Supplemental Data: | | | | | | | | | | | | | | | | | | | | | | | | | | | | |
| | | | | | | |
Net investment income (loss) | | | 2.46 | % †† | | | | | | | 2.15 | % | | | 2.08 | % | | | 1.87 | % | | | 1.52 | %(d) | | | 1.98 | % |
| | | | | | | |
Net expenses (e) | | | 0.92 | % †† | | | | | | | 0.93 | % | | | 1.01 | % | | | 1.01 | % | | | 1.00 | %(f) | | | 1.02 | % |
| | | | | | | |
Portfolio turnover rate | | | 34 | % | | | | | | | 47 | % | | | 84 | % | | | 30 | % | | | 35 | % | | | 43 | % |
| | | | | | | |
Net assets at end of period (in 000’s) | | $ | 895,509 | | | | | | | $ | 1,121,657 | | | $ | 1,066,963 | | | $ | 1,240,213 | | | $ | 1,160,397 | | | $ | 1,131,252 | |
| ‡ | Less than one cent per share. |
| (a) | Per share data based on average shares outstanding during the period. |
| (b) | Total return does not reflect any deduction of sales charges, mortality and expense charges, contract charges or administrative charges. For periods of less than one year, total return is not annualized. |
| (c) | Total investment return may reflect adjustments to conform to generally accepted accounting principles. |
| (d) | Without the custody fee reimbursement, net investment income (loss) would have been 1.50%. |
| (e) | In addition to the fees and expenses which the Portfolio bears directly, it also indirectly bears a pro-rata share of the fees and expenses of the underlying funds in which it invests. Such indirect expenses are not included in the above expense ratios. |
| (f) | Without the custody fee reimbursement, net expenses would have been 1.02%. |
| | | | | | |
The notes to the financial statements are an integral part of,
and should be read in conjunction with, the financial statements. | | | | | 15 | |
Notes to Financial Statements (Unaudited)
Note 1–Organization and Business
MainStay VP Funds Trust (the “Fund”) was organized as a Delaware statutory trust on February 1, 2011. The Fund is registered under the Investment Company Act of 1940, as amended (the “1940 Act”), as an open-end management investment company. The Fund is comprised of thirty-one separate series (collectively referred to as the “Portfolios”). These financial statements and notes relate to the MainStay VP Fidelity Institutional AM® Utilities Portfolio (the “Portfolio”), a “non-diversified” portfolio, as that term is defined in the 1940 Act, as interpreted or modified by regulatory authorities having jurisdiction, from time to time. Prior to November 30, 2018, MainStay VP Fidelity Institutional AM® Utilities Portfolio operated as a “diversified” portfolio.
Shares of the Portfolio are currently offered to certain separate accounts to fund variable annuity policies and variable universal life insurance policies issued by New York Life Insurance and Annuity Corporation (“NYLIAC”), a wholly-owned subsidiary of New York Life Insurance Company (“New York Life”) and may also be offered to fund variable annuity policies and variable universal life insurance policies issued by other insurance companies. NYLIAC allocates shares of the Portfolios to, among others, certain NYLIAC separate accounts. Shares of the Portfolio are also offered to the MainStay VP Conservative Allocation Portfolio, MainStay VP Moderate Allocation Portfolio, MainStay VP Moderate Growth Allocation Portfolio and MainStay VP Growth Allocation Portfolio, which operate as “funds-of-funds” and other variable insurance funds.
The Portfolio currently offers two classes of shares. Initial Class and Service Class shares commenced operations on February 17, 2012. Shares of the Portfolio are offered and are redeemed at a price equal to their respective net asset value (“NAV”) per share. No sales or redemption charge is applicable to the purchase or redemption of the Portfolio’s shares. Under the terms of the Fund’s multiple class plan adopted pursuant to Rule 18f-3 under the 1940 Act, the classes differ in that, among other things, Service Class shares of the Portfolio pay a combined distribution and service fee of 0.25% of average daily net assets attributable to Service Class shares of the Portfolio to the Distributor (as defined in Note 3(B)) pursuant to a plan adopted in accordance with Rule 12b-1 under the 1940 Act. Contract owners of variable annuity contracts are permitted to invest only in the Service Class shares.
The Portfolio’s investment objective is to seek total return.
Note 2–Significant Accounting Policies
The Portfolio is an investment company and accordingly follows the investment company accounting and reporting guidance of the Financial Accounting Standards Board (“FASB”) Accounting Standard Codification Topic 946 Financial Services—Investment Companies. The Portfolio prepares its financial statements in accordance with generally accepted accounting principles (“GAAP”) in the United States of America and follows the significant accounting policies described below.
(A) Securities Valuation. Investments are usually valued as of the close of regular trading on the New York Stock Exchange (the “Exchange”) (usually 4:00 p.m. Eastern time) on each day the Portfolio is open for business (“valuation date”).
The Board of Trustees of the Fund (the “Board”) adopted procedures establishing methodologies for the valuation of the Portfolio’s securities and other assets and delegated the responsibility for valuation determinations under those procedures to the Valuation Committee of the Fund (the “Valuation Committee”). The procedures state that, subject to the oversight of the Board and unless otherwise noted, the responsibility for the day-to-day valuation of portfolio assets (including fair value measurements for the Portfolio’s assets and liabilities) rests with New York Life Investment Management LLC (“New York Life Investments” or the “Manager”), aided to whatever extent necessary by the Subadvisor (as defined in Note 3(A)). To assess the appropriateness of security valuations, the Manager, the Subadvisor or the Portfolio’s third-party service provider, who is subject to oversight by the Manager, regularly compares prior day prices, prices on comparable securities and the sale prices to the prior and current day prices and challenges prices with changes exceeding certain tolerance levels with third-party pricing services or broker sources.
The Board authorized the Valuation Committee to appoint a Valuation Subcommittee (the “Subcommittee”) to establish the prices of securities for which market quotations are not readily available or the prices of which are not otherwise readily determinable under the procedures. The Subcommittee meets (in person, via electronic mail or via teleconference) on an as-needed basis. The Valuation Committee meets to ensure that actions taken by the Subcommittee were appropriate.
For those securities valued through either a standardized fair valuation methodology or a fair valuation measurement, the Subcommittee deals with such valuation and the Valuation Committee reviews and affirms, if appropriate, the reasonableness of the valuation based on such methodologies and measurements on a regular basis after considering information that is reasonably available and deemed relevant by the Valuation Committee. Any action taken by the Subcommittee with respect to the valuation of a portfolio security or other asset is submitted for review and ratification (if appropriate) to the Valuation Committee and the Board at the next regularly scheduled meeting.
“Fair value” is defined as the price the Portfolio would reasonably expect to receive upon selling an asset or liability in an orderly transaction to an independent buyer in the principal or most advantageous market for the asset or liability. Fair value measurements are determined within a framework that establishes a three-tier hierarchy that maximizes the use of observable market data and minimizes the use of unobservable inputs to establish a classification of fair value measurements for disclosure purposes. “Inputs” refer broadly to the assumptions that market participants would use in pricing the asset or liability, including assumptions about risk, such as the risk inherent in a particular valuation technique used to measure fair value using a pricing model and/or the risk inherent in the inputs for the valuation technique. Inputs may be observable or unobservable. Observable inputs reflect the assumptions market participants would use in pricing the asset or liability based on market data obtained from sources independent of the Portfolio. Unobservable inputs reflect the Portfolio’s own assumptions about the assumptions market participants would use in pricing the asset or liability based on the information available. The inputs or methodology used for valuing assets or liabilities may not be an indication of the risks associated with investing in those assets or liabilities. The three-tier hierarchy of inputs is summarized below.
| | |
| 16 | | MainStay VP Fidelity Institutional AM® Utilities Portfolio |
| • | | Level 1—quoted prices in active markets for an identical asset or liability |
| • | | Level 2—other significant observable inputs (including quoted prices for a similar asset or liability in active markets, interest rates and yield curves, prepayment speeds, credit risk, etc.) |
| • | | Level 3—significant unobservable inputs (including the Portfolio’s own assumptions about the assumptions that market participants would use in measuring fair value of an asset or liability) |
The level of an asset or liability within the fair value hierarchy is based on the lowest level of an input, both individually and in the aggregate, that is significant to the fair value measurement. The aggregate value by input level of the Portfolio’s assets and liabilities as of June 30, 2020 is included at the end of the Portfolio of Investments.
The Portfolio may use third-party vendor evaluations, whose prices may be derived from one or more of the following standard inputs, among others:
| | |
• Benchmark yields | | • Reported trades |
• Broker/dealer quotes | | • Issuer spreads |
• Two-sided markets | | • Benchmark securities |
• Bids/offers | | • Reference data (corporate actions or material event notices) |
• Industry and economic events | | • Monthly payment information |
An asset or liability for which market values cannot be measured using the methodologies described above is valued by methods deemed reasonable in good faith by the Valuation Committee, following the procedures established by the Board, to represent fair value. Under these procedures, the Portfolio generally uses a market-based approach which may use related or comparable assets or liabilities, recent transactions, market multiples, book values and other relevant information. The Portfolio may also use an income-based valuation approach in which the anticipated future cash flows of the asset or liability are discounted to calculate fair value. Discounts may also be applied due to the nature and/or duration of any restrictions on the disposition of the asset or liability. Fair value represents a good faith approximation of the value of a security. Fair value determinations involve the consideration of a number of subjective factors, an analysis of applicable facts and circumstances and the exercise of judgment. As a result, it is possible that the fair value for a security determined in good faith in accordance with the Portfolio’s valuation procedures may differ from valuations for the same security determined by other funds using their own valuation procedures. Although the Portfolio’s valuation procedures are designed to value a security at the price the Portfolio may reasonably expect to receive upon the security’s sale in an orderly transaction, there can be no assurance that any fair value determination thereunder would, in fact, approximate the amount that the Portfolio would actually realize upon the sale of the security or the price at which the security would trade if a reliable market price were readily available. During the six-month period ended June 30, 2020, there were no material changes to the fair value methodologies.
Securities which may be valued in this manner include, but are not limited to: (i) a security for which trading has been halted or suspended;
(ii) a debt security that has recently gone into default and for which there is not a current market quotation; (iii) a security of an issuer that has entered into a restructuring; (iv) a security that has been delisted from a national exchange; (v) a security for which the market price is not readily available from a third-party pricing source or, if so provided, does not, in the opinion of the Manager or the Subadvisor, reflect the security’s market value; (vi) a security subject to trading collars for which no or limited trading takes place; and (vii) a security whose principal market has been temporarily closed at a time when, under normal conditions, it would be open. Securities valued in this manner are generally categorized as Level 3 in the hierarchy. As of June 30, 2020, no securities held by the Portfolio were fair valued in such a manner.
Certain securities held by the Portfolio may principally trade in foreign markets. Events may occur between the time the foreign markets close and the time at which the Portfolio’s NAVs are calculated. These events may include, but are not limited to, situations relating to a single issuer in a market sector, significant fluctuations in U.S. or foreign markets, natural disasters, armed conflicts, governmental actions or other developments not tied directly to the securities markets. Should the Manager or the Subadvisor conclude that such events may have affected the accuracy of the last price of such securities reported on the local foreign market, the Subcommittee may, pursuant to procedures adopted by the Board, adjust the value of the local price to reflect the estimated impact on the price of such securities as a result of such events. In this instance, securities are generally categorized as Level 3 in the hierarchy. Additionally, certain foreign equity securities are also fair valued whenever the movement of a particular index exceeds certain thresholds. In such cases, the securities are fair valued by applying factors provided by a third-party vendor in accordance with valuation procedures adopted by the Board and are generally categorized as Level 2 in the hierarchy. As of June 30, 2020, no securities held by the Portfolio were fair valued in such a manner.
Equity securities are valued at the last quoted sales prices as of the close of regular trading on the relevant exchange on each valuation date. Securities that are not traded on the valuation date are valued at the mean of the last quoted bid and ask prices. Prices are normally taken from the principal market in which each security trades. These securities are generally categorized as Level 1 in the hierarchy.
Investments in mutual funds, including money market funds, are valued at their respective NAVs as of the close of the Exchange on the valuation date. These securities are generally categorized as Level 1 in the hierarchy.
Temporary cash investments acquired in excess of 60 days to maturity at the time of purchase are valued using the latest bid prices or using valuations based on a matrix system (which considers such factors as security prices, yields, maturities and ratings), both as furnished by independent pricing services. Temporary cash investments that mature in 60 days or less at the time of purchase (“Short-Term Investments”) are valued using the amortized cost method of valuation, unless the use of such method would be inappropriate. The amortized cost method involves valuing a security at its cost on the date of purchase and thereafter assuming a constant amortization to maturity of the difference between such cost and the value on maturity date. Amortized cost approximates the current fair value of a security. Securities valued using
Notes to Financial Statements (continued)
the amortized cost method are not valued using quoted prices in an active market and are generally categorized as Level 2 in the hierarchy.
The information above is not intended to reflect an exhaustive list of the methodologies that may be used to value portfolio investments. The valuation procedures permit the use of a variety of valuation methodologies in connection with valuing portfolio investments. The methodology used for a specific type of investment may vary based on the market data available or other considerations. The methodologies summarized above may not represent the specific means by which portfolio investments are valued on any particular business day.
(B) Income Taxes. The Portfolio’s policy is to comply with the requirements of the Internal Revenue Code of 1986, as amended (the “Internal Revenue Code”), applicable to regulated investment companies and to distribute all of its taxable income to the shareholders of the Portfolio within the allowable time limits.
The Manager evaluates the Portfolio’s tax positions to determine if the tax positions taken meet the minimum recognition threshold in connection with accounting for uncertainties in income tax positions taken or expected to be taken for the purposes of measuring and recognizing tax liabilities in the financial statements. Recognition of tax benefits of an uncertain tax position is permitted only to the extent the position is “more likely than not” to be sustained assuming examination by taxing authorities. The Manager analyzed the Portfolio’s tax positions taken on federal, state and local income tax returns for all open tax years (for up to three tax years) and has concluded that no provisions for federal, state and local income tax are required in the Portfolio’s financial statements. The Portfolio’s federal, state and local income tax and federal excise tax returns for tax years for which the applicable statutes of limitations have not expired are subject to examination by the Internal Revenue Service and state and local departments of revenue.
(C) Foreign Taxes. The Portfolio may be subject to foreign taxes on income and other transaction-based taxes imposed by certain countries in which it invests. A portion of the taxes on gains on investments or currency purchases/repatriation may be reclaimable. The Portfolio will accrue such taxes and reclaims as applicable, based upon its current interpretation of tax rules and regulations that exist in the markets in which it invests.
The Portfolio may be subject to taxation on realized capital gains, repatriation proceeds and other transaction-based taxes imposed by certain countries in which it invests. The Portfolio will accrue such taxes as applicable based upon its current interpretation of tax rules and regulations that exist in the market in which it invests. Capital gains taxes relating to positions still held are reflected as a liability on the Statement of Assets and Liabilities, as well as an adjustment to the Portfolio’s net unrealized appreciation (depreciation). Taxes related to capital gains realized, if any, are reflected as part of net realized gain (loss) in the Statement of Operations. Changes in tax liabilities related to capital gains taxes on unrealized investment gains, if any, are reflected as part of the change in net unrealized appreciation (depreciation) on investments in the Statement of Operations. Transaction-based charges are generally assessed as a percentage of the transaction amount.
(D) Dividends and Distributions to Shareholders. Dividends and distributions are recorded on the ex-dividend date. The Portfolio intends to declare and pay dividends from net investment income and
distributions from net realized capital and currency gains, if any, at least annually. Unless a shareholder elects otherwise, all dividends and distributions are reinvested at NAV in the same class of shares of the Portfolio. Dividends and distributions to shareholders are determined in accordance with federal income tax regulations and may differ from determinations using GAAP.
(E) Security Transactions and Investment Income. The Portfolio records security transactions on the trade date. Realized gains and losses on security transactions are determined using the identified cost method. Dividend income is recognized on the ex-dividend date, net of any foreign tax withheld at the source, and interest income is accrued as earned using the effective interest rate method. Distributions received from real estate investment trusts may be classified as dividends, capital gains and/or return of capital.
Investment income and realized and unrealized gains and losses on investments of the Portfolio are allocated pro rata to the separate classes of shares based upon their relative net assets on the date the income is earned or realized and unrealized gains and losses are incurred.
The Portfolio may place a debt security on non-accrual status and reduce related interest income by ceasing current accruals and writing off all or a portion of any interest receivables when the collection of all or a portion of such interest has become doubtful. A debt security is removed from non-accrual status when the issuer resumes interest payments or when collectability of interest is reasonably assured.
(F) Expenses. Expenses of the Fund are allocated to the individual Portfolios in proportion to the net assets of the respective Portfolios when the expenses are incurred, except where direct allocations of expenses can be made. Expenses (other than fees incurred under the distribution and service plans, further discussed in Note 3(B), which are charged directly to the Service Class shares) are allocated to separate classes of shares pro rata based upon their relative net assets on the date the expenses are incurred. The expenses borne by the Portfolio, including those of related parties to the Portfolio, are shown in the Statement of Operations.
Additionally, the Portfolio may invest in mutual funds, which are subject to management fees and other fees that may cause the costs of investing in mutual funds to be greater than the costs of owning the underlying securities directly. These indirect expenses of mutual funds are not included in the amounts shown as expenses in the Portfolio’s Statement of Operations or in the expense ratios included in the Financial Highlights.
(G) Use of Estimates. In preparing financial statements in conformity with GAAP, the Manager makes estimates and assumptions that affect the reported amounts and disclosures in the financial statements. Actual results could differ from those estimates.
(H) Repurchase Agreements. The Portfolio may enter into repurchase agreements (i.e., buy a security from another party with the agreement that it will be sold back in the future) to earn income. The Portfolio may enter into repurchase agreements only with counterparties, usually financial institutions, that are deemed by the Manager or the Subadvisor to be creditworthy, pursuant to guidelines established by the Board. During the term of any repurchase agreement, the Manager
| | |
| 18 | | MainStay VP Fidelity Institutional AM® Utilities Portfolio |
or the Subadvisor will continue to monitor the creditworthiness of the counterparty. Under the 1940 Act, repurchase agreements are considered to be collateralized loans by the Portfolio to the counterparty secured by the securities transferred to the Portfolio.
Repurchase agreements are subject to counterparty risk, meaning the Portfolio could lose money by the counterparty’s failure to perform under the terms of the agreement. The Portfolio mitigates this risk by ensuring the repurchase agreement is collateralized by cash, U.S. government securities, fixed income securities and/or other securities. The collateral is held by the Portfolio’s custodian and valued daily on a mark to market basis to determine if the value, including accrued interest, exceeds the repurchase price. In the event of the counterparty’s default on the obligation to repurchase, the Portfolio has the right to liquidate the collateral and apply the proceeds in satisfaction of the obligation. Under certain circumstances, such as in the event of default or bankruptcy by the counterparty, realization and/or retention of the collateral may be limited or subject to delay, to legal proceedings and possible realized loss to the Portfolio. As of June 30, 2020, the Portfolio did not hold any repurchase agreements.
(I) Foreign Currency Transactions. The Portfolio’s books and records are maintained in U.S. dollars. Prices of securities denominated in foreign currency amounts are translated into U.S. dollars at the mean between the buying and selling rates last quoted by any major U.S. bank at the following dates:
| (i) | market value of investment securities, other assets and liabilities—at the valuation date; and |
| (ii) | purchases and sales of investment securities, income and expenses—at the date of such transactions. |
The assets and liabilities that are denominated in foreign currency amounts are presented at the exchange rates and market values at the close of the period. The realized and unrealized changes in net assets arising from fluctuations in exchange rates and market prices of securities are not separately presented.
Net realized gain (loss) on foreign currency transactions represents net currency gains or losses realized as a result of differences between the amounts of securities sale proceeds or purchase cost, dividends, interest and withholding taxes as recorded on the Portfolio’s books, and the U.S. dollar equivalent amount actually received or paid. Net currency gains or losses from valuing such foreign currency denominated assets and liabilities, other than investments at valuation date exchange rates, are reflected in unrealized foreign exchange gains or losses.
(J) Securities Lending. In order to realize additional income, the Portfolio may engage in securities lending, subject to the limitations set forth in the 1940 Act and relevant guidance by the staff of the Securities and Exchange Commission (“SEC”). If the Portfolio engages in securities lending, the Portfolio will lend through its custodian, currently State Street Bank and Trust Company (“State Street”), acting as securities lending agent on behalf of the Portfolio. Under the current arrangement, State Street will manage the Portfolio’s collateral in accordance with the securities lending agency agreement between the Portfolio and State Street, and indemnify the Portfolio against counterparty risk. The loans will be collateralized by cash (which may be invested in a money market fund) and/or non-cash collateral (which may include U.S. Treasury
securities and/or U.S. government agency securities issued or guaranteed by the United States government or its agencies or instrumentalities) at least equal at all times to the market value of the securities loaned. The Portfolio bears the risk of delay in recovery of, or loss of rights in, the securities loaned. The Portfolio may also record a realized gain or loss on securities deemed sold due to a borrower’s inability to return securities on loan. The Portfolio bears the risk of any loss on investment of cash collateral. The Portfolio will receive compensation for lending its securities in the form of fees or it will retain a portion of interest earned on the investment of any cash collateral. The Portfolio will also continue to receive interest and dividends on the securities loaned and any gain or loss in the market price of the securities loaned that may occur during the term of the loan will be for the account of the Portfolio. Income earned from securities lending activities, if any, is reflected in the Statement of Operations. As of June 30, 2020, the Portfolio did not have any portfolio securities on loan.
(K) Foreign Securities Risk. The Portfolio may invest in foreign securities, which carry certain risks that are in addition to the usual risks inherent in domestic securities. These risks include those resulting from currency fluctuations, future adverse political or economic developments and possible imposition of currency exchange blockages or other foreign governmental laws or restrictions. These risks are likely to be greater in emerging markets than in developed markets. The ability of issuers of securities held by the Portfolio to meet their obligations may be affected by, among other things, economic or political developments in a specific country, industry or region.
(L) Indemnifications. Under the Fund’s organizational documents, its officers and trustees are indemnified against certain liabilities that may arise out of performance of their duties to the Fund. Additionally, in the normal course of business, the Portfolio enters into contracts with third-party service providers that contain a variety of representations and warranties and that may provide general indemnifications. The Portfolio’s maximum exposure under these arrangements is unknown, as this would involve future claims that may be made against the Portfolio that have not yet occurred. The Manager believes that the risk of loss in connection with these potential indemnification obligations is remote. However, there can be no assurance that material liabilities related to such obligations will not arise in the future, which could adversely impact the Portfolio.
Note 3–Fees and Related Party Transactions
(A) Manager and Subadvisor. New York Life Investments, a registered investment adviser and an indirect, wholly-owned subsidiary of New York Life, serves as the Portfolio’s Manager pursuant to an Amended and Restated Management Agreement (“Management Agreement”). The Manager provides offices, conducts clerical, recordkeeping and bookkeeping services, and keeps most of the financial and accounting records required to be maintained by the Portfolio. Except for the portion of salaries and expenses that are the responsibility of the Portfolio, the Manager pays the salaries and expenses of all personnel affiliated with the Portfolio and certain operational expenses of the Portfolio. The Portfolio reimburses New York Life Investments in an amount equal to the portion of the compensation of the Chief Compliance Officer attributable to the Portfolio. FIAM LLC (“FIAM or the “Subadvisor”) a registered investment adviser, serves as Subadvisor to
Notes to Financial Statements (continued)
the Portfolio and is responsible for the day-to-day portfolio management of the Portfolio. Pursuant to the terms of a Subadvisory Agreement (“Subadvisory Agreement”) between New York Life Investments and FIAM, New York Life Investments pays for the services of the Subadvisor.
The Fund, on behalf of the Portfolio, pays New York Life Investments in its capacity as the Portfolio’s investment manager and administrator, pursuant to the Management Agreement, a monthly fee for the services performed and the facilities furnished at an annual percentage of the Portfolio’s average daily net assets as follows: 0.64% up to $1 billion; 0.61% from $1 billion to $3 billion; and 0.60% in excess of $3 billion. During the six-month period ended June 30, 2020, the effective management fee rate was 0.64%.
During the six-month period ended June 30, 2020, New York Life Investments earned fees from the Portfolio in the amount of $3,426,012 and paid the Subadvisor in the amount of $1,350,067.
State Street provides sub-administration and sub-accounting services to the Portfolio pursuant to an agreement with New York Life Investments. These services include calculating the daily NAVs of the Portfolio, maintaining the general ledger and sub-ledger accounts for the calculation of the Portfolio’s NAVs and assisting New York Life Investments in
conducting various aspects of the Portfolio’s administrative operations. For providing these services to the Portfolio, State Street is compensated by New York Life Investments.
Pursuant to an agreement between the Fund and New York Life Investments, New York Life Investments is responsible for providing or procuring certain regulatory reporting services for the Portfolio. The Portfolio will reimburse New York Life Investments for the actual costs incurred by New York Life Investments in connection with providing or procuring these services for the Portfolio.
(B) Distribution and Service Fees. The Fund, on behalf of the Portfolio, has entered into a distribution agreement with NYLIFE Distributors LLC (the “Distributor”), an indirect, wholly-owned subsidiary of New York Life. The Portfolio has adopted a distribution plan (the “Plan”) in accordance with the provisions of Rule 12b-1 under the 1940 Act. Under the Plan, the Distributor has agreed to provide, through its affiliates or independent third parties, various distribution-related, shareholder and administrative support services to the Service Class shareholders. For its services, the Distributor is entitled to a combined distribution and service fee accrued daily and paid monthly at an annual rate of 0.25% of the average daily net assets attributable to the Service Class shares of the Portfolio.
(C) Investments in Affiliates (in 000’s). During the six-month period ended June 30, 2020, purchases and sales transactions, income earned from investments and shares held of investment companies managed by New York Life Investments or its affiliates were as follows:
| | | | | | | | | | | | | | | | | | | | | | | | | | | | | | | | | | | | |
Affiliated Investment Company | | Value, Beginning of Period | | | Purchases
at Cost | | | Proceeds
from
Sales | | | Net
Realized
Gain/(Loss)
on Sales | | | Change in
Unrealized
Appreciation/
(Depreciation) | | | Value, End
of Period | | | Dividend
Income | | | Other
Distributions | | | Shares
End of
Period | |
| | | | | | | | | |
MainStay U.S. Government Liquidity Fund | | $ | 51,568 | | | $ | 169,584 | | | $ | (188,864 | ) | | $ | — | | | $ | — | | | $ | 32,288 | | | $ | 75 | | | $ | — | | | | 32,288 | |
Note 4–Federal Income Tax
As of June 30, 2020, the cost and unrealized appreciation (depreciation) of the Portfolio’s investment portfolio, including applicable derivative contracts and other financial instruments, as determined on a federal income tax basis, was as follows:
| | | | | | | | | | | | | | | | |
| | | Federal Tax
Cost | | | Gross
Unrealized
Appreciation | | | Gross
Unrealized
(Depreciation) | | | Net
Unrealized
Appreciation/
(Depreciation) | |
| | | | |
Investments in Securities | | $ | 1,000,870,875 | | | $ | 61,670,867 | | | $ | (53,156,591 | ) | | $ | 8,514,276 | |
During the year ended December 31, 2019, the tax character of distributions paid as reflected in the Statements of Changes in Net Assets was as follows:
| | |
|
| 2019 |
Tax-Based
Distributions from Ordinary
Income | | Tax-Based
Distributions from Long-Term
Gains |
| |
| $26,816,286 | | $48,062,264 |
Note 5–Custodian
State Street is the custodian of cash and securities held by the Portfolio. Custodial fees are charged to the Portfolio based on the Portfolio’s net assets and/or the market value of securities held by the Portfolio and the number of certain transactions incurred by the Portfolio.
Note 6–Line of Credit
The Portfolio and certain other funds managed by New York Life Investments maintain a line of credit with a syndicate of banks in order to secure a source of funds for temporary purposes to meet unanticipated or excessive redemption requests.
Effective July 28, 2020, under the credit agreement (the “Credit Agreement”), the aggregate commitment amount is $600,000,000 with an additional uncommitted amount of $100,000,000. The commitment fee is an annual rate of 0.15% of the average commitment amount payable quarterly, regardless of usage, to JP Morgan Chase Bank NA, who serves as the agent to the syndicate. The commitment fee is allocated among the Portfolio and certain other funds managed by New York Life Investments based upon their respective net assets and other factors. Interest on any revolving credit loan is charged based upon the Federal Funds Rate or the one-month London Interbank Offered Rate (“LIBOR”), whichever is higher. The Credit Agreement expires on
| | |
| 20 | | MainStay VP Fidelity Institutional AM® Utilities Portfolio |
July 27, 2021, although the Portfolio, certain other funds managed by New York Life Investments and the syndicate of banks may renew the Credit Agreement for an additional year on the same or different terms or enter into a credit agreement with a different syndicate of banks. Prior to July 28, 2020, the aggregate commitment amount and the commitment fee were the same as those under the current Credit Agreement, but State Street served as agent to the syndicate. During the six-month period ended June 30, 2020, there were no borrowings made or outstanding with respect to the Portfolio under the Credit Agreement or the credit agreement for which State Street served as agent.
Note 7–Interfund Lending Program
Pursuant to an exemptive order issued by the SEC, the Portfolio, along with certain other funds managed by New York Life Investments, may participate in an interfund lending program. The interfund lending program provides an alternative credit facility that permits the Portfolio and certain other funds managed by New York Life Investments to lend or borrow money for temporary purposes directly to or from one another subject to the conditions of the exemptive order. During the six-month period ended June 30, 2020, there were no interfund loans made or outstanding with respect to the Portfolio.
Note 8–Purchases and Sales of Securities (in 000’s)
During the six-month period ended June 30, 2020, purchases and sales of securities, other than short-term securities, were $355,650 and $365,907, respectively.
The Portfolio may purchase securities from or sell securities to other portfolios managed by the Subadvisor. These interportfolio transactions are primarily used for cash management purposes and are made pursuant to Rule 17a-7 under the 1940 Act. The Rule 17a-7 transactions during the six-month period ended June 30, 2020, were as follows:
| | | | |
Purchases (000’s) | | Sales (000’s) | | Realized
Gain / (Loss)
(000’s) |
| | |
| $89 | | $43,277 | | $2,655 |
Note 9–Capital Share Transactions
Transactions in capital shares for the six-month period ended June 30, 2020 and the year ended December 31, 2019, were as follows:
| | | | | | | | |
Initial Class | | Shares | | | Amount | |
| | |
Six-month period ended June 30, 2020: | | | | | | | | |
Shares sold | | | 797,676 | | | $ | 9,468,660 | |
Shares redeemed | | | (364,482 | ) | | | (4,365,461 | ) |
| | | | |
Net increase (decrease) | | | 433,194 | | | $ | 5,103,199 | |
| | | | |
Year ended December 31, 2019: | | | | | | | | |
Shares sold | | | 250,314 | | | $ | 3,268,910 | |
Shares issued to shareholders in reinvestment of distributions | | | 455,955 | | | | 6,045,255 | |
Shares redeemed | | | (475,971 | ) | | | (6,266,090 | ) |
| | | | |
Net increase (decrease) | | | 230,298 | | | $ | 3,048,075 | |
| | | | |
| | |
| | | | | | | | |
Service Class | | Shares | | | Amount | |
| | |
Six-month period ended June 30, 2020: | | | | | | | | |
Shares sold | | | 2,248,261 | | | $ | 27,063,241 | |
Shares redeemed | | | (8,174,847 | ) | | | (99,377,494 | ) |
| | | | |
Net increase (decrease) | | | (5,926,586 | ) | | $ | (72,314,253 | ) |
| | | | |
Year ended December 31, 2019: | | | | | | | | |
Shares sold | | | 2,653,770 | | | $ | 34,741,128 | |
Shares issued to shareholders in reinvestment of distributions | | | 5,212,768 | | | | 68,833,295 | |
Shares redeemed | | | (16,107,348 | ) | | | (209,108,188 | ) |
| | | | |
Net increase (decrease) | | | (8,240,810 | ) | | $ | (105,533,765 | ) |
| | | | |
Note 10–Recent Accounting Pronouncement
In March 2020, the Financial Accounting Standards Board (“FASB”) issued Accounting Standards Update 2020-04 (“ASU 2020-04”), which provides optional guidance to ease the potential accounting burden associated with transitioning away from LIBOR and other reference rates that are expected to be discontinued. ASU 2020-04 is effective immediately upon release of the update on March 12, 2020 through December 31, 2022. At this time, the Manager is evaluating the implications of certain other provisions of ASU 2020-04 related to new disclosure requirements and any impact on the financial statement disclosures has not yet been determined.
Notes to Financial Statements (continued)
Note 11–Subsequent Events
In connection with the preparation of the financial statements of the Portfolio as of and for the six-month period ended June 30, 2020, events and transactions subsequent to June 30, 2020, through the date the financial statements were issued have been evaluated by the Manager for possible adjustment and/or disclosure. No subsequent events requiring financial statement adjustment or disclosure have been identified.
Note 12–Other Matters
An outbreak of COVID-19, first detected in December 2019, has developed into a global pandemic and has resulted in travel restrictions, closure of international borders, certain businesses and securities markets, restrictions on securities trading activities, prolonged quarantines, supply chain disruptions, and lower consumer demand, as well as general concern and uncertainty. The continued impact of COVID-19 is uncertain and could further adversely affect the global economy, national economies, individual issuers and capital markets in unforeseeable ways and result in a substantial and extended economic downturn. Developments that disrupt global economies and financial markets, such as COVID-19, may magnify factors that affect the Portfolio’s performance.
| | |
| 22 | | MainStay VP Fidelity Institutional AM® Utilities Portfolio |
Discussion of the Operation and Effectiveness of the Portfolio’s Liquidity Risk
Management Program (Unaudited)
In compliance with Rule 22e-4 under the Investment Company Act of 1940, as amended (the “Liquidity Rule”), the Portfolio has adopted and implemented a liquidity risk management program (the “Program”), which New York Life Investment Management LLC believes is reasonably designed to assess and manage the Portfolio’s liquidity risk. The Board designated New York Life Investment Management LLC as administrator of the Program (the “Administrator”). The Administrator has established a Liquidity Risk Management Committee to assist the Administrator in the implementation and day-to-day administration of the Program and to otherwise support the Administrator in fulfilling its responsibilities under the Program.
At a meeting of the Board held on March 11, 2020, the Administrator provided the Board with a written report addressing the Program’s operation, adequacy and effectiveness of implementation for the period from December 1, 2018 through December 31, 2019, as required under the Liquidity Rule. The report noted that the Administrator concluded that (i) the Program operated effectively to assess and manage the Portfolio’s liquidity risk, (ii) the Program has been adequately and effectively implemented to monitor and, as applicable, respond to the Portfolio’s liquidity developments and (iii) the Portfolio’s investment strategy continues to be appropriate for an open-end portfolio.
In accordance with the Program, the Portfolio’s liquidity risk is assessed no less frequently than annually taking into consideration certain factors, as applicable, such as (i) investment strategy and liquidity of portfolio investments, (ii) short-term and long-term cash flow projections and (iii) holdings of cash and cash equivalents and borrowing arrangements and other funding sources. Certain factors are considered under both normal and reasonably foreseeable stressed conditions.
Each Portfolio portfolio investment is classified into one of four liquidity categories. The classification is based on a determination of the number of days it is reasonably expected to take to convert the investment into cash, or sell or dispose of the investment, in current market conditions without significantly changing the market value of the investment. The Administrator has delegated liquidity classification determinations to the Portfolio’s subadvisor, subject to appropriate oversight by the Administrator, and classification determinations are made by taking into account the Portfolio’s reasonably anticipated trade size, various market, trading and investment-specific considerations, as well as market depth, and, in certain cases, third-party vendor data.
The Liquidity Rule requires portfolios that do not primarily hold assets that are highly liquid investments to adopt a minimum amount of net assets that must be invested in highly liquid investments that are assets (an “HLIM”). In addition, the Liquidity Rule limits a portfolio’s investments in illiquid investments. Specifically, the Liquidity Rule prohibits acquisition of illiquid investments if doing so would result in a portfolio holding more than 15% of its net assets in illiquid investments that are assets. The Program includes provisions reasonably designed to determine, periodically review and comply with the HLIM requirement, as applicable, and to comply with the 15% limit on illiquid investments.
Proxy Voting Policies and Procedures and Proxy Voting Record
A description of the policies and procedures that New York Life Investments uses to vote proxies related to the Portfolio’s securities is available free of charge upon request (i) by calling 800-598-2019; (ii) by visiting New York Life Investments’ website at https://www.nylinvestments.com/mainstay/products-and-performance/mainstay-vp-funds-trust; or (iii) by visiting the SEC’s website at www.sec.gov.
The Portfolio is required to file with the SEC its proxy voting record for the 12-month period ending June 30 on Form N-PX. The Portfolio’s most recent Form N-PX or proxy voting record is available free of charge upon request (i) by calling 800-598-2019; (ii) by visiting New York Life Investments’ website at https://www.nylinvestments.com/mainstay/products-and-performance/mainstay-vp-funds-trust; or (iii) by visiting the SEC’s website at www.sec.gov.
Shareholder Reports and Quarterly Portfolio Disclosure
The Portfolio is required to file its complete schedule of portfolio holdings with the SEC 60 days after its first and third fiscal quarter on Form N-PORT. The Portfolio’s holdings report is available free of charge upon request by calling 800-598-2019 or by visiting the SEC’s website at www.sec.gov.
| | |
| 24 | | MainStay VP Fidelity Institutional AM® Utilities Portfolio |
MainStay VP Portfolios
MainStay VP offers a wide range of Portfolios. The full array of MainStay VP offerings is listed here, with information about the manager, subadvisors, legal counsel, and independent registered public accounting firm.
Equity Portfolios
MainStay VP Emerging Markets Equity Portfolio
MainStay VP Epoch U.S. Equity Yield Portfolio
MainStay VP Fidelity Institutional AM® Utilities Portfolio†
MainStay VP MacKay Common Stock Portfolio
MainStay VP MacKay Growth Portfolio
MainStay VP MacKay International Equity Portfolio
MainStay VP MacKay Mid Cap Core Portfolio
MainStay VP MacKay S&P 500 Index Portfolio
MainStay VP MacKay Small Cap Core Portfolio
MainStay VP Mellon Natural Resources Portfolio
MainStay VP Small Cap Growth Portfolio
MainStay VP T. Rowe Price Equity Income Portfolio
MainStay VP Winslow Large Cap Growth Portfolio
Mixed Asset Portfolios
MainStay VP Balanced Portfolio
MainStay VP Income Builder Portfolio
MainStay VP Janus Henderson Balanced Portfolio
MainStay VP MacKay Convertible Portfolio
Income Portfolios
MainStay VP Bond Portfolio
MainStay VP Floating Rate Portfolio
MainStay VP Indexed Bond Portfolio
MainStay VP MacKay Government Portfolio
MainStay VP MacKay High Yield Corporate Bond Portfolio
MainStay VP MacKay Unconstrained Bond Portfolio
MainStay VP PIMCO Real Return Portfolio
Money Market
MainStay VP U.S. Government Money Market Portfolio
Alternative
MainStay VP CBRE Global Infrastructure Portfolio
MainStay VP IQ Hedge Multi-Strategy Portfolio
Asset Allocation Portfolios
MainStay VP Conservative Allocation Portfolio
MainStay VP Growth Allocation Portfolio
MainStay VP Moderate Allocation Portfolio
MainStay VP Moderate Growth Allocation Portfolio
Manager
New York Life Investment Management LLC
New York, New York
Subadvisors
Brown Advisory LLC
Baltimore, Maryland
Candriam Belgium S.A.*
Brussels, Belgium
CBRE Clarion Securities LLC
Radnor, Pennsylvania
Epoch Investment Partners, Inc.
New York, New York
FIAM LLC
Smithfield, Rhode Island
IndexIQ Advisors LLC*
New York, New York
Janus Capital Management LLC
Denver, Colorado
MacKay Shields LLC*
New York, New York
Mellon Investments Corporation
Boston, Massachusetts
NYL Investors LLC*
New York, New York
Pacific Investment Management Company LLC
Newport Beach, California
Segall Bryant & Hamill, LLC
Chicago, Illinois
T. Rowe Price Associates, Inc.
Baltimore, Maryland
Winslow Capital Management, LLC
Minneapolis, Minnesota
Distributor
NYLIFE Distributors LLC*
Jersey City, New Jersey
Custodian
State Street Bank and Trust Company
Boston, Massachusetts
Independent Registered Public Accounting Firm
PricewaterhouseCoopers LLP
New York, New York
Legal Counsel
Dechert LLP
Washington, District of Columbia
Some Portfolios may not be available in all products.
| † | Fidelity Institutional AM is a registered trade mark of FMR LLC. Used with permission. |
| * | An affiliate of New York Life Investment Management LLC |
Not part of the Semiannual Report
2020 Semiannual Report
This report is for the general information of New York Life Variable Annuities and NYLIAC Variable Universal Life Insurance Products policyowners. It must be preceded or accompanied by the appropriate product(s) and funds prospectuses if it is given to anyone who is not an owner of a New York Life variable annuity policy or a NYLIAC Variable Universal Life Insurance Product. This report does not offer for sale or solicit orders to purchase securities.
The performance data quoted in this report represents past performance. Past performance is no guarantee of future results. Due to market volatility and other factors, current performance may be lower or higher than the figures shown. The most recent month-end performance summary for your variable annuity or variable life policy is available by calling 800-598-2019 and is updated periodically on www.newyorklife.com.
The New York Life Variable Annuities and NYLIAC Variable Universal Life Insurance Products are issued by New York Life Insurance and Annuity Corporation (a Delaware Corporation) and distributed by NYLIFE Distributors LLC (Member FINRA/SIPC).
New York Life Insurance Company
New York Life Insurance and Annuity Corporation (NYLIAC) (A Delaware Corporation)
51 Madison Avenue, Room 551
New York, NY 10010
www.newyorklife.com
Printed on recycled paper
nylinvestments.com
NYLIFE Distributors LLC, 30 Hudson Street, Jersey City, NJ 07302
New York Life Investment Management LLC is the investment manager to the MainStay VP Funds Trust
©2020 by NYLIFE Distributors LLC. All rights reserved.
You may obtain copies of the Prospectus and the Statement of Additional Information free of charge, upon request, by calling toll-free 800-598-2019 or writing to New York Life Insurance and Annuity Corporation, 51 Madison Avenue, New York, NY 10010.
| | | | |
| Not FDIC Insured | | No Bank Guarantee | | May Lose Value |
| | | | |
| 1781634 | | | | MSVPMFS10-08/20 (NYLIAC) NI526 |
MainStay VP MacKay Mid Cap Core Portfolio
Message from the President and Semiannual Report
Unaudited | June 30, 2020
Beginning on January 1, 2021, as permitted by regulations adopted by the Securities and Exchange Commission, paper copies of the MainStay VP Portfolio annual and semi-annual shareholder reports may no longer be sent by mail, unless you specifically request paper copies of the reports from the insurance company that offers your policy. Instead, the reports will be made available online, and you will be notified by mail each time a report is posted and provided with a website link to access the report. Instructions for requesting paper copies will be provided by your insurance company.
If you already elected to receive shareholder reports electronically, you will not be affected by this change and you need not take any action. At any time, you may elect to receive reports and other communications from the insurance company electronically by following the instructions provided by the insurance company.
You may elect to receive all future shareholder reports in paper form free of charge. You can inform the insurance company that you wish to receive paper copies of reports by following the instructions provided by the insurance company. Your election to receive reports in paper form will apply to all portfolio companies available under your contract.
| | | | | | | | |
| Not FDIC/NCUA Insured | | Not a Deposit | | May Lose Value | | No Bank Guarantee | | Not Insured by Any Government Agency |

This page intentionally left blank
Message from the President
High levels of volatility shook financial markets in response to the COVID-19 pandemic and an abrupt decline in global economic activity during the six months ended June 30, 2020.
Markets entered 2020 riding strong fourth quarter performance and an economic expansion of historic longevity. Most broad stock and bond indices began to dip in late February as growing numbers of COVID-19 cases were seen in hotspots around the world. On March 11, 2020, the World Health Organization acknowledged that the disease had reached pandemic proportions, with over 80,000 identified cases in China, thousands in Italy, South Korea and the United States, and more in dozens of additional countries. Governments and central banks pledged trillions of dollars to address the mounting economic and public health crisis; however, “stay-at-home” orders and other restrictions on non-essential activity caused global economic activity to slow. Most stocks and bonds lost significant ground in this challenging environment, with equities declining by roughly a third and the yield on high-yield credit indices shooting higher.
Policymakers responded with extraordinary speed to address the situation. In the United States, the Federal Reserve (“Fed”) cut interest rates to near zero and announced unlimited quantitative easing. With help from Treasury, the Fed later rolled out a series of lending facilities to directly support market functioning. In late March, the Federal government declared a national emergency; Congress passed, and the President signed, a $2 trillion CARES Act (The Coronavirus Aid, Relief, and Economic Security Act), with the promise of further assistance for consumers and businesses to come. This enormous wave of policy support helped fuel a rapid recovery in market pricing as stocks bounced back and credit spreads narrowed. Some states rushed to ease restrictions on travel and social gatherings, further fueling optimism that the effects of the pandemic might prove short lived. However, the final weeks of the reporting period saw infection rates beginning to rise in some of the first states to reopen, raising concerns that a second round of restrictive government policies might prove necessary, once again stifling economic activity.
Despite all the market volatility, the broadly based S&P 500® Index finished the first half of 2020 only slightly below its starting point and the technology-heavy NASDAQ Composite Index posted gains, closing in near record territory. Small-cap stocks tended to trail their large cap counterparts, as illustrated by the Russell 2000® Index’s loss of approximately 15%, while value-oriented stocks lagged growth-oriented issues. From a global perspective, U.S. stocks generally outperformed international equities, with emerging markets hit particularly hard by the flight from risk.
Fixed-income markets also experienced unusually high levels of volatility. Recognized safe havens, such as U.S. government bonds, attracted increased investment, driving yields lower and prices higher, positioning long-term Treasury bonds to deliver particularly strong gains. Investment-grade corporate bonds lost value in March before recovering in the closing months of the reporting period, while relatively speculative high-yield credit faced the brunt of risk-off sentiment. Emerging market debt underperformed most other bonds types as investors sought to minimize currency and sovereign risks.
Today, as we at New York Life Investments continue to track the ongoing health crisis and its financial ramifications, we are particularly mindful of the people at the heart of our enterprise—our colleagues and valued clients. By taking appropriate steps to minimize community spread of COVID-19 within our organization, we strive to safeguard the health of our investment professionals so they can continue to provide you, as a MainStay investor, with world class investment solutions in this rapidly evolving environment.
Sincerely,

Kirk C. Lehneis
President
The opinions expressed are as of the date of this report and are subject to change. There is no guarantee that any forecast made will come to pass. This material does not constitute investment advice and is not intended as an endorsement of any specific investment. Past performance is no guarantee of future results.
Not part of the Semiannual Report
Table of Contents
Investors should refer to the Portfolio’s Summary Prospectus and/or Prospectus and consider the Portfolio’s investment objectives, strategies, risks, charges and expenses carefully before investing. The Summary Prospectus and/or Prospectus contain this and other information about the Portfolio. You may obtain copies of the Portfolio’s Summary Prospectus and/or the Prospectus and the Statement of Additional Information free of charge, upon request, by calling toll-free 800-598-2019, by writing to New York Life Insurance and Annuity Corporation, 51 Madison Avenue, Room 251, New York, New York 10010 or by sending an email to MainStayShareholdersServices@nylim.com. These documents are also available at nylinvestments.com/vpdocuments. Please read the Summary Prospectus and/or Prospectus carefully before investing. MainStay VP Funds Trust portfolios are separate account options which are purchased through a variable insurance or variable annuity contract.
Investment and Performance Comparison1 (Unaudited)
Performance data quoted represents past performance. Past performance is no guarantee of future results. Because of market volatility and other factors, current performance may be lower or higher than the figures shown. Investment return and principal value will fluctuate, and as a result, when shares are redeemed, they may be worth more or less than their original cost. The performance table and graph do not reflect any deduction of sales charges, mortality and expense charges, contract charges or administrative charges. Please refer to the Performance Summary appropriate for your policy. For performance information current to the most recent month-end, please call 800-598-2019 or visit www.newyorklife.com.

Average Annual Total Returns for the Period-Ended June 30, 2020
| | | | | | | | | | | | | | | | | | | | | | |
| Class | | Inception
Date | | Six Months | | | One Year | | | Five Years | | | Ten Years | | | Gross
Expense
Ratio2 | |
| | | | | | |
| Initial Class Shares | | 7/2/2001 | | | –12.04 | % | | | –6.38 | % | | | 3.50 | % | | | 11.07 | % | | | 0.88 | % |
| Service Class Shares | | 6/5/2003 | | | –12.15 | | | | –6.62 | | | | 3.24 | | | | 10.79 | | | | 1.13 | |
| | | | | | | | | | | | | | | | |
| Benchmark Performance | | Six
Months | | | One
Year | | | Five
Years | | | Ten
Years | |
| | | | |
Russell Midcap® Index3 | | | –9.13 | % | | | –2.24 | % | | | 6.76 | % | | | 12.35 | % |
Morningstar Mid-Cap Blend Category Average4 | | | –12.55 | | | | –6.19 | | | | 3.86 | | | | 10.02 | |
| 1. | Performance figures may reflect certain fee waivers and/or expense limitations, without which total returns may have been different. For information on current fee waivers and/or expense limitations (if any), please refer to the Notes to Financial Statements. |
| 2. | The gross expense ratios presented reflect the Portfolio’s “Total Annual Portfolio Operating Expenses” from the most recent Prospectus, as supplemented, and may differ from other expense ratios disclosed in this report. |
| 3. | The Russell Midcap® Index is the Portfolio’s primary broad-based securities market index for comparison purposes. The Russell Midcap® Index measures the performance of the mid-cap segment of the U.S. equity universe. The Russell Midcap® Index is a subset of the Russell 1000® Index and it includes approximately 800 of the smallest securities based on a |
| | combination of their market cap and current index membership. The Russell Midcap® Index represents approximately 31% of the total market capitalization of the Russell 1000® Index companies. Results assume reinvestment of all dividends and capital gains. An investment cannot be made directly in an index. |
| 4. | The Morningstar Mid-Cap Blend Category Average is representative of funds that invest primarily in U.S. stocks of various sizes and styles, giving it a middle-of-the-road profile. The U.S. mid-cap range for market capitalization typically falls between $1 billion and $8 billion and represents 20% of the total capitalization of the U.S. equity market. The blend style is assigned to funds where neither growth nor value characteristics predominate. Results are based on average total returns of similar funds with all dividends and capital gain distributions reinvested. |
Cost in Dollars of a $1,000 Investment in MainStay VP MacKay Mid Cap Core Portfolio (Unaudited)
The example below is intended to describe the fees and expenses borne by shareholders during the six-month period from January 1, 2020, to June 30, 2020, and the impact of those costs on your investment.
Example
As a shareholder of the Portfolio you incur two types of costs: (1) transaction costs, including exchange fees and sales charges (loads) on purchases (as applicable), and (2) ongoing costs, including management fees, distribution and/or service (12b-1) fees, and other Portfolio expenses (as applicable). This example is intended to help you understand your ongoing costs (in dollars) of investing in the Portfolio and to compare these costs with the ongoing costs of investing in other mutual funds. The example is based on an investment of $1,000 made at the beginning of the six-month period and held for the entire period from January 1, 2020, to June 30, 2020. Shares are only sold in connection with variable life and annuity contracts and the example does not reflect any contract level or transactional fees or expenses. If these costs had been included, your costs would have been higher.
This example illustrates your Portfolio’s ongoing costs in two ways:
Actual Expenses
The second and third data columns in the table below provide information about actual account values and actual expenses. You may use the information in these columns, together with the amount you invested, to estimate the expenses that you paid during the six months ended June 30, 2020. Simply divide your account value by $1,000
(for example, an $8,600 account value divided by $1,000 = 8.6), then multiply the result by the number under the heading entitled “Expenses Paid During Period” to estimate the expenses you paid on your account during this period.
Hypothetical Example for Comparison Purposes
The fourth and fifth data columns in the table below provide information about hypothetical account values and hypothetical expenses based on the Portfolio’s actual expense ratio and an assumed rate of return of 5% per year before expenses, which is not the Portfolio’s actual return. The hypothetical account values and expenses may not be used to estimate the actual ending account balances or expenses you paid for the six-month period shown. You may use this information to compare the ongoing costs of investing in the Portfolio with the ongoing costs of investing in other mutual funds. To do so, compare this 5% hypothetical example with the 5% hypothetical examples that appear in the shareholder reports of the other mutual funds.
Please note that the expenses shown in the table are meant to highlight your ongoing costs only and do not reflect any transactional costs, such as exchange fees or sales charges (loads). Therefore, the fourth and fifth data columns of the table are useful in comparing ongoing costs only and will not help you determine the relative total costs of owning different funds. In addition, if these transactional costs were included, your costs would have been higher.
| | | | | | | | | | | | | | | | | | | | | | |
| | | | | | | | | | | | | | | | | | |
| Share Class | | Beginning
Account
Value
1/1/20 | | | Ending Account
Value (Based
on Actual
Returns and
Expenses)
6/30/20 | | | Expenses
Paid
During
Period1 | | | Ending Account
Value (Based
on Hypothetical
5% Annualized
Return and
Actual Expenses)
6/30/20 | | | Expenses
Paid
During
Period1 | | | Net Expense
Ratio
During
Period2 |
| | | | | | |
| Initial Class Shares | | $ | 1,000.00 | | | $ | 879.60 | | | $ | 4.02 | | | $ | 1,020.59 | | | $ | 4.32 | | | 0.86% |
| | | | | | |
| Service Class Shares | | $ | 1,000.00 | | | $ | 878.50 | | | $ | 5.18 | | | $ | 1,019.34 | | | $ | 5.57 | | | 1.11% |
| 1. | Expenses are equal to the Portfolio’s annualized expense ratio of each class multiplied by the average account value over the period, divided by 366 and multiplied by 182 (to reflect the six-month period). The table above represents the actual expenses incurred during the six-month period. In addition to the fees and expenses which the Portfolio bears directly, it also indirectly bears a pro rata share of the fees and expenses of the underlying funds in which it invests. Such indirect expenses are not included in the above-reported expense figures. |
| 2. | Expenses are equal to the Portfolio’s annualized expense ratio to reflect the six-month period. |
| | |
| 6 | | MainStay VP MacKay Mid Cap Core Portfolio |
Industry Composition as of June 30, 2020 (Unaudited)
| | | | |
| |
| Software | | | 7.6 | % |
| |
| IT Services | | | 6.6 | |
| |
| Capital Markets | | | 5.8 | |
| |
| Equity Real Estate Investment Trusts | | | 5.2 | |
| |
| Specialty Retail | | | 4.9 | |
| |
| Semiconductors & Semiconductor Equipment | | | 4.0 | |
| |
| Professional Services | | | 3.9 | |
| |
| Health Care Providers & Services | | | 3.8 | |
| |
| Biotechnology | | | 3.3 | |
| |
| Electronic Equipment, Instruments & Components | | | 3.2 | |
| |
| Hotels, Restaurants & Leisure | | | 3.1 | |
| |
| Health Care Equipment & Supplies | | | 2.9 | |
| |
| Electric Utilities | | | 2.7 | |
| |
| Life Sciences Tools & Services | | | 2.6 | |
| |
| Building Products | | | 2.4 | |
| |
| Banks | | | 2.3 | |
| |
| Entertainment | | | 2.1 | |
| |
| Aerospace & Defense | | | 1.9 | |
| |
| Pharmaceuticals | | | 1.9 | |
| |
| Food & Staples Retailing | | | 1.8 | |
| |
| Machinery | | | 1.6 | |
| |
| Oil, Gas & Consumable Fuels | | | 1.6 | |
| |
| Internet & Direct Marketing Retail | | | 1.5 | |
| |
| Food Products | | | 1.4 | |
| |
| Insurance | | | 1.4 | |
| |
| Diversified Financial Services | | | 1.3 | |
| |
| Household Durables | | | 1.3 | |
| |
| Commercial Services & Supplies | | | 1.2 | |
| |
| Electrical Equipment | | | 1.0 | |
| |
| Independent Power & Renewable Electricity Producers | | | 1.0 | |
| | | | |
| |
| Interactive Media & Services | | | 1.0 | % |
| |
| Trading Companies & Distributors | | | 1.0 | |
| |
| Chemicals | | | 0.9 | |
| |
| Exchange-Traded Funds | | | 0.9 | |
| |
| Health Care Technology | | | 0.9 | |
| |
| Media | | | 0.9 | |
| |
| Metals & Mining | | | 0.9 | |
| |
| Multi-Utilities | | | 0.9 | |
| |
| Communications Equipment | | | 0.8 | |
| |
| Consumer Finance | | | 0.8 | |
| |
| Personal Products | | | 0.7 | |
| |
| Distributors | | | 0.6 | |
| |
| Multiline Retail | | | 0.6 | |
| |
| Road & Rail | | | 0.6 | |
| |
| Air Freight & Logistics | | | 0.5 | |
| |
| Diversified Consumer Services | | | 0.5 | |
| |
| Thrifts & Mortgage Finance | | | 0.4 | |
| |
| Auto Components | | | 0.3 | |
| |
| Technology Hardware, Storage & Peripherals | | | 0.3 | |
| |
| Textiles, Apparel & Luxury Goods | | | 0.3 | |
| |
| Construction & Engineering | | | 0.2 | |
| |
| Construction Materials | | | 0.2 | |
| |
| Containers & Packaging | | | 0.2 | |
| |
| Industrial Conglomerates | | | 0.2 | |
| |
| Energy Equipment & Services | | | 0.0 | ‡ |
| |
| Paper & Forest Products | | | 0.0 | ‡ |
| |
| Other Assets, Less Liabilities | | | 0.1 | |
| | | | |
| | | 100.0 | % |
| | | | |
See Portfolio of Investments beginning on page 9 for specific holdings within these categories. The Portfolio’s holdings are subject to change.
| ‡ | Less than one-tenth of a percent. |
Top Ten Holdings as of June 30, 2020 (excluding short-term investment) (Unaudited)
| 4. | O’Reilly Automotive, Inc. |
| 6. | Chipotle Mexican Grill, Inc. |
| 9. | iShares Russell Mid-Cap ETF |
Portfolio Management Discussion and Analysis (Unaudited)
Answers to the questions reflect the views of portfolio managers Migene Kim, CFA, and Mona Patni of MacKay Shields LLC, the Portfolio’s Subadvisor.
How did MainStay VP MacKay Mid Cap Core Portfolio perform relative to its benchmark and peers during the six months ended June 30, 2020?
For the six months ended June 30, 2020, MainStay VP MacKay Mid Cap Core Portfolio returned –12.04% for Initial Class shares and –12.15% for Service Class shares. Over the same period, both share classes underperformed the –9.13% return of the Russell Midcap® Index, which is the Portfolio’s benchmark, and outperformed the –12.55% return of the Morningstar Mid-Cap Blend Category Average.1
What factors affected the Portfolio’s relative performance during the reporting period?
Both during and after the steep market decline that occurred in March 2020, growth-oriented stocks outperformed their value-oriented counterparts, accentuating a multi-year trend. Investors regarded familiar large-cap growth stocks as “safe,” while shunning cheaper stocks in areas such as energy, financials and industrials. Consequently, the spread2 between the Russell 1000® Growth Index and the Russell 1000® Value Index widened to historic levels. Not surprisingly, value-oriented investment vehicles experienced major drawdowns during the first quarter of 2020. The Portfolio’s momentum-based stock selection signals, which capture historical price trends, performed well during the first quarter, mitigating some of the headwinds from value, but momentum-driven investments were subject to a sharp, volatile sell-off during the second quarter amid market inflection. Quality and profitability signals mitigated downside risk, particularly during the March market downturn.
Which sectors were the strongest positive contributors to the Portfolio’s relative performance, and which sectors were particularly weak?
During the reporting period, the strongest positive contributors to the Portfolio’s benchmark-relative performance were the communication services, energy and financials sectors. (Contributions take weightings and total returns into account.) During the same period, the top detractors from benchmark-relative performance were the technology, industrials and consumer staples sectors.
During the reporting period, which individual stocks made the strongest positive contributions to the Portfolio’s absolute performance and which stocks detracted the most?
The stocks providing the strongest positive contributions to the Portfolio’s absolute performance during the reporting period included gold miner Newmont, research & consulting services provider CoreLogic and systems software developer Fortinet. During the same period, the most significant detractors from absolute performance were cruise line operator Norwegian Cruise Line, food distributor US Foods and consumer finance company Synchrony Financial.
Did the Portfolio make any significant purchases or sales during the reporting period?
During the reporting period, the Portfolio’s largest initial purchase was in shares of Internet retailer Etsy, while the largest increase in position size was in business consulting firm IHS Markit. During the same period, the Portfolio’s largest full sale was its position in resort and casino operator MGM Resorts International, while its largest decreased position size was in digital hardware and software developer Cadence Design Systems.
How did the Portfolio’s sector weightings change during the reporting period?
Relative to the Russell Midcap® Index, the Portfolio’s most-substantial exposure increases during the reporting period were in industrials and communications services. Conversely, the Portfolio’s largest decreases in benchmark-relative sector exposures were in consumer staples and materials.
How was the Portfolio positioned at the end of the reporting period?
As of June 30, 2020, the Portfolio’s most overweight positions relative to the Russell Midcap® Index were in the information technology and health care sectors. As of the same date, the Portfolio’s most substantially underweight positions relative to the Index were in the materials and real estate sectors.
| 1. | See page 5 for more information on benchmark and peer group returns. |
| 2. | The terms “spread” and “yield spread” may refer to the difference in yield between a security or type of security and comparable U.S. Treasury issues. The terms may also refer to the difference in yield between two specific securities or types of securities at a given time. |
The opinions expressed are those of the portfolio managers as of the date of this report and are subject to change. There is no guarantee that any forecasts will come to pass. This material does not constitute investment advice and is not intended as an endorsement of any specific investment.
Not all MainStay VP Portfolios and/or share classes are available under all policies.
| | |
| 8 | | MainStay VP MacKay Mid Cap Core Portfolio |
Portfolio of Investments June 30, 2020 (Unaudited)
| | | | | | | | |
| | |
Shares | | | Value | |
| Common Stocks 99.0%† | |
Aerospace & Defense 1.9% | |
Curtiss-Wright Corp. | | | 25,719 | | | $ | 2,296,192 | |
Hexcel Corp. | | | 7,278 | | | | 329,111 | |
Howmet Aerospace, Inc. | | | 52,543 | | | | 832,807 | |
L3Harris Technologies, Inc. | | | 12,431 | | | | 2,109,168 | |
Spirit AeroSystems Holdings, Inc., Class A | | | 99,225 | | | | 2,375,446 | |
Teledyne Technologies, Inc. (a) | | | 5,476 | | | | 1,702,762 | |
Textron, Inc. | | | 166,023 | | | | 5,463,817 | |
| | | | | | | | |
| | | | | | | 15,109,303 | |
| | | | | | | | |
Air Freight & Logistics 0.5% | |
XPO Logistics, Inc. (a) | | | 49,594 | | | | 3,831,137 | |
| | | | | | | | |
|
Auto Components 0.3% | |
Lear Corp. | | | 19,113 | | | | 2,083,699 | |
| | | | | | | | |
|
Banks 2.3% | |
Comerica, Inc. | | | 23,668 | | | | 901,751 | |
First Hawaiian, Inc. | | | 170,193 | | | | 2,934,127 | |
First Republic Bank | | | 12,677 | | | | 1,343,635 | |
PacWest Bancorp | | | 87,200 | | | | 1,718,712 | |
Signature Bank | | | 47,482 | | | | 5,076,775 | |
SVB Financial Group (a) | | | 21,462 | | | | 4,625,705 | |
Synovus Financial Corp. | | | 109,824 | | | | 2,254,687 | |
| | | | | | | | |
| | | | | | | 18,855,392 | |
| | | | | | | | |
Biotechnology 3.3% | |
Alexion Pharmaceuticals, Inc. (a) | | | 30,592 | | | | 3,433,646 | |
Alkermes PLC (a) | | | 145,055 | | | | 2,814,792 | |
Exelixis, Inc. (a) | | | 213,594 | | | | 5,070,722 | |
Incyte Corp. (a) | | | 64,268 | | | | 6,681,944 | |
Moderna, Inc. (a) | | | 27,106 | | | | 1,740,476 | |
Neurocrine Biosciences, Inc. (a) | | | 32,381 | | | | 3,950,482 | |
United Therapeutics Corp. (a) | | | 22,951 | | | | 2,777,071 | |
| | | | | | | | |
| | | | | | | 26,469,133 | |
| | | | | | | | |
Building Products 2.4% | |
Fortune Brands Home & Security, Inc. | | | 16,708 | | | | 1,068,142 | |
Johnson Controls International PLC | | | 6,158 | | | | 210,234 | |
Masco Corp. | | | 123,350 | | | | 6,193,404 | |
Owens Corning | | | 89,469 | | | | 4,988,791 | |
Trane Technologies PLC | | | 74,719 | | | | 6,648,497 | |
| | | | | | | | |
| | | | | | | 19,109,068 | |
| | | | | | | | |
Capital Markets 5.8% | |
Ameriprise Financial, Inc. | | | 44,232 | | | | 6,636,569 | |
Cboe Global Markets, Inc. | | | 3,456 | | | | 322,376 | |
E*TRADE Financial Corp. | | | 116,834 | | | | 5,810,155 | |
Evercore, Inc., Class A | | | 47,081 | | | | 2,774,012 | |
Lazard, Ltd., Class A | | | 153,260 | | | | 4,387,834 | |
LPL Financial Holdings, Inc. | | | 66,464 | | | | 5,210,778 | |
Morningstar, Inc. | | | 12,558 | | | | 1,770,301 | |
| | | | | | | | |
| | |
Shares | | | Value | |
Capital Markets (continued) | |
MSCI, Inc. | | | 14,289 | | | $ | 4,769,954 | |
Nasdaq, Inc. | | | 43,646 | | | | 5,214,388 | |
Raymond James Financial, Inc. | | | 75,658 | | | | 5,207,540 | |
State Street Corp. | | | 43,444 | | | | 2,760,866 | |
T. Rowe Price Group, Inc. | | | 15,882 | | | | 1,961,427 | |
| | | | | | | | |
| | | | | | | 46,826,200 | |
| | | | | | | | |
Chemicals 0.9% | |
Axalta Coating Systems, Ltd. (a) | | | 70,617 | | | | 1,592,414 | |
CF Industries Holdings, Inc. | | | 23,688 | | | | 666,580 | |
Huntsman Corp. | | | 103,308 | | | | 1,856,445 | |
LyondellBasell Industries N.V., Class A | | | 45,272 | | | | 2,975,276 | |
Valvoline, Inc. | | | 23,337 | | | | 451,104 | |
| | | | | | | | |
| | | | | | | 7,541,819 | |
| | | | | | | | |
Commercial Services & Supplies 1.2% | |
Cintas Corp. | | | 15,847 | | | | 4,221,007 | |
Clean Harbors, Inc. (a) | | | 78,626 | | | | 4,715,987 | |
Republic Services, Inc. | | | 4,692 | | | | 384,979 | |
| | | | | | | | |
| | | | | | | 9,321,973 | |
| | | | | | | | |
Communications Equipment 0.8% | |
EchoStar Corp., Class A (a) | | | 31,381 | | | | 877,413 | |
Motorola Solutions, Inc. | | | 42,342 | | | | 5,933,384 | |
| | | | | | | | |
| | | | | | | 6,810,797 | |
| | | | | | | | |
Construction & Engineering 0.2% | |
AECOM (a) | | | 43,067 | | | | 1,618,458 | |
| | | | | | | | |
|
Construction Materials 0.2% | |
Eagle Materials, Inc. | | | 442 | | | | 31,037 | |
Martin Marietta Materials, Inc. | | | 1,495 | | | | 308,822 | |
Vulcan Materials Co. | | | 12,495 | | | | 1,447,546 | |
| | | | | | | | |
| | | | | | | 1,787,405 | |
| | | | | | | | |
Consumer Finance 0.8% | |
SLM Corp. | | | 182,299 | | | | 1,281,562 | |
Synchrony Financial | | | 232,462 | | | | 5,151,358 | |
| | | | | | | | |
| | | | | | | 6,432,920 | |
| | | | | | | | |
Containers & Packaging 0.2% | |
Ardagh Group S.A. | | | 7,609 | | | | 98,232 | |
Crown Holdings, Inc. (a) | | | 23,942 | | | | 1,559,343 | |
| | | | | | | | |
| | | | | | | 1,657,575 | |
| | | | | | | | |
Distributors 0.6% | |
LKQ Corp. (a) | | | 198,952 | | | | 5,212,542 | |
| | | | | | | | |
|
Diversified Consumer Services 0.5% | |
Frontdoor, Inc. (a) | | | 44,259 | | | | 1,962,001 | |
Graham Holdings Co., Class B | | | 7,101 | | | | 2,433,300 | |
| | | | | | | | |
| | | | | | | 4,395,301 | |
| | | | | | | | |
| | | | | | |
The notes to the financial statements are an integral part of,
and should be read in conjunction with, the financial statements. | | | | | 9 | |
Portfolio of Investments June 30, 2020 (Unaudited) (continued)
| | | | | | | | |
| | |
Shares | | | Value | |
| Common Stocks (continued) | |
Diversified Financial Services 1.3% | |
Equitable Holdings, Inc. | | | 267,741 | | | $ | 5,164,724 | |
Voya Financial, Inc. | | | 104,738 | | | | 4,886,028 | |
| | | | | | | | |
| | | | | | | 10,050,752 | |
| | | | | | | | |
Electric Utilities 2.7% | |
Entergy Corp. | | | 38,449 | | | | 3,606,901 | |
Evergy, Inc. | | | 78,485 | | | | 4,653,376 | |
FirstEnergy Corp. | | | 12,698 | | | | 492,429 | |
NRG Energy, Inc. | | | 146,561 | | | | 4,772,026 | |
OGE Energy Corp. | | | 146,375 | | | | 4,443,945 | |
PG&E Corp. (a) | | | 19,831 | | | | 175,901 | |
Pinnacle West Capital Corp. | | | 3,453 | | | | 253,070 | |
PPL Corp. | | | 115,879 | | | | 2,994,313 | |
| | | | | | | | |
| | | | | | | 21,391,961 | |
| | | | | | | | |
Electrical Equipment 1.0% | |
Acuity Brands, Inc. | | | 36,234 | | | | 3,469,043 | |
Regal Beloit Corp. | | | 56,363 | | | | 4,921,617 | |
| | | | | | | | |
| | | | | | | 8,390,660 | |
| | | | | | | | |
Electronic Equipment, Instruments & Components 3.2% | |
Arrow Electronics, Inc. (a) | | | 72,534 | | | | 4,982,360 | |
Avnet, Inc. | | | 158,013 | | | | 4,406,192 | |
CDW Corp. | | | 51,342 | | | | 5,964,914 | |
Jabil, Inc. | | | 157,757 | | | | 5,060,845 | |
SYNNEX Corp. | | | 46,801 | | | | 5,605,356 | |
| | | | | | | | |
| | | | | | | 26,019,667 | |
| | | | | | | | |
Energy Equipment & Services 0.0%‡ | |
Helmerich & Payne, Inc. | | | 18,242 | | | | 355,901 | |
| | | | | | | | |
|
Entertainment 2.1% | |
Lions Gate Entertainment Corp., Class B (a) | | | 593,371 | | | | 4,052,724 | |
Roku, Inc. (a) | | | 10,261 | | | | 1,195,714 | |
Take-Two Interactive Software, Inc. (a) | | | 42,252 | | | | 5,897,112 | |
Zynga, Inc., Class A (a) | | | 581,343 | | | | 5,546,012 | |
| | | | | | | | |
| | | | | | | 16,691,562 | |
| | | | | | | | |
Equity Real Estate Investment Trusts 5.2% | |
Alexandria Real Estate Equities, Inc. | | | 17,291 | | | | 2,805,465 | |
American Homes 4 Rent, Class A | | | 17,742 | | | | 477,260 | |
AvalonBay Communities, Inc. | | | 20,827 | | | | 3,220,687 | |
Boston Properties, Inc. | | | 3,764 | | | | 340,190 | |
CoreSite Realty Corp. | | | 14,000 | | | | 1,694,840 | |
CyrusOne, Inc. | | | 28,449 | | | | 2,069,665 | |
Digital Realty Trust, Inc. | | | 19,180 | | | | 2,725,670 | |
Duke Realty Corp. | | | 74,366 | | | | 2,631,813 | |
Equity LifeStyle Properties, Inc. | | | 23,416 | | | | 1,463,032 | |
Equity Residential | | | 52,710 | | | | 3,100,402 | |
Essex Property Trust, Inc. | | | 11,681 | | | | 2,676,935 | |
Extra Space Storage, Inc. | | | 1,249 | | | | 115,370 | |
Gaming and Leisure Properties, Inc. | | | 49,768 | | | | 1,721,973 | |
| | | | | | | | |
| | |
Shares | | | Value | |
Equity Real Estate Investment Trusts (continued) | |
Healthpeak Properties, Inc. | | | 13,225 | | | $ | 364,481 | |
Invitation Homes, Inc. | | | 57,478 | | | | 1,582,369 | |
Life Storage, Inc. | | | 17,099 | | | | 1,623,550 | |
Mid-America Apartment Communities, Inc. | | | 21,805 | | | | 2,500,379 | |
Realty Income Corp. | | | 16,396 | | | | 975,562 | |
SBA Communications Corp. | | | 8,406 | | | | 2,504,315 | |
Simon Property Group, Inc. | | | 8,758 | | | | 598,872 | |
SL Green Realty Corp. | | | 15,106 | | | | 744,575 | |
Sun Communities, Inc. | | | 7,633 | | | | 1,035,645 | |
UDR, Inc. | | | 1,552 | | | | 58,014 | |
Ventas, Inc. | | | 9,456 | | | | 346,279 | |
W.P. Carey, Inc. | | | 1,071 | | | | 72,453 | |
Welltower, Inc. | | | 23,307 | | | | 1,206,137 | |
Weyerhaeuser Co. | | | 138,230 | | | | 3,104,646 | |
| | | | | | | | |
| | | | | | | 41,760,579 | |
| | | | | | | | |
Food & Staples Retailing 1.8% | |
Casey’s General Stores, Inc. | | | 13,940 | | | | 2,084,309 | |
Kroger Co. | | | 215,561 | | | | 7,296,740 | |
Sprouts Farmers Market, Inc. (a) | | | 178,751 | | | | 4,574,238 | |
U.S. Foods Holding Corp. (a) | | | 40,543 | | | | 799,508 | |
| | | | | | | | |
| | | | | | | 14,754,795 | |
| | | | | | | | |
Food Products 1.4% | |
Hershey Co. | | | 19,177 | | | | 2,485,723 | |
Pilgrim’s Pride Corp. (a) | | | 169,920 | | | | 2,869,949 | |
Tyson Foods, Inc., Class A | | | 101,630 | | | | 6,068,327 | |
| | | | | | | | |
| | | | | | | 11,423,999 | |
| | | | | | | | |
Health Care Equipment & Supplies 2.9% | |
DENTSPLY SIRONA, Inc. | | | 77,798 | | | | 3,427,780 | |
DexCom, Inc. (a) | | | 7,714 | | | | 3,127,256 | |
Envista Holdings Corp. | | | 39,554 | | | | 834,194 | |
Hill-Rom Holdings, Inc. | | | 48,007 | | | | 5,270,209 | |
Hologic, Inc. (a) | | | 63,212 | | | | 3,603,084 | |
ICU Medical, Inc. (a) | | | 10,536 | | | | 1,941,890 | |
Insulet Corp. (a) | | | 6,578 | | | | 1,277,842 | |
ResMed, Inc. | | | 3,376 | | | | 648,192 | |
Varian Medical Systems, Inc. (a) | | | 1,335 | | | | 163,564 | |
West Pharmaceutical Services, Inc. | | | 13,461 | | | | 3,057,935 | |
| | | | | | | | |
| | | | | | | 23,351,946 | |
| | | | | | | | |
Health Care Providers & Services 3.8% | |
AmerisourceBergen Corp. | | | 61,323 | | | | 6,179,519 | |
Cardinal Health, Inc. | | | 111,864 | | | | 5,838,182 | |
Centene Corp. (a) | | | 119 | | | | 7,562 | |
DaVita, Inc. (a) | | | 63,979 | | | | 5,063,298 | |
Laboratory Corp. of America Holdings (a) | | | 18,821 | | | | 3,126,356 | |
McKesson Corp. | | | 46,287 | | | | 7,101,352 | |
Universal Health Services, Inc., Class B | | | 38,056 | | | | 3,535,022 | |
| | | | | | | | |
| | | | | | | 30,851,291 | |
| | | | | | | | |
| | | | |
| 10 | | MainStay VP MacKay Mid Cap Core Portfolio | | The notes to the financial statements are an integral part of,
and should be read in conjunction with, the financial statements. |
| | | | | | | | |
| | |
Shares | | | Value | |
| Common Stocks (continued) | |
Health Care Technology 0.9% | |
Cerner Corp. | | | 81,811 | | | $ | 5,608,144 | |
Veeva Systems, Inc., Class A (a) | | | 6,436 | | | | 1,508,727 | |
| | | | | | | | |
| | | | | | | 7,116,871 | |
| | | | | | | | |
Hotels, Restaurants & Leisure 3.1% | |
Aramark | | | 52,249 | | | | 1,179,260 | |
Chipotle Mexican Grill, Inc. (a) | | | 7,087 | | | | 7,458,075 | |
Darden Restaurants, Inc. | | | 70,212 | | | | 5,319,963 | |
Domino’s Pizza, Inc. | | | 15,706 | | | | 5,802,425 | |
Yum China Holdings, Inc. | | | 102,703 | | | | 4,936,933 | |
| | | | | | | | |
| | | | | | | 24,696,656 | |
| | | | | | | | |
Household Durables 1.3% | |
Lennar Corp. | | | | | | | | |
Class A | | | 9,707 | | | | 598,145 | |
Class B | | | 18,611 | | | | 857,781 | |
NVR, Inc. (a) | | | 1,023 | | | | 3,333,701 | |
PulteGroup, Inc. | | | 154,595 | | | | 5,260,868 | |
| | | | | | | | |
| | | | | | | 10,050,495 | |
| | | | | | | | |
Independent Power & Renewable Electricity Producers 1.0% | |
AES Corp. | | | 241,115 | | | | 3,493,756 | |
Vistra Energy Corp. | | | 257,174 | | | | 4,788,580 | |
| | | | | | | | |
| | | | | | | 8,282,336 | |
| | | | | | | | |
Industrial Conglomerates 0.2% | |
Carlisle Cos., Inc. | | | 10,555 | | | | 1,263,117 | |
| | | | | | | | |
|
Insurance 1.4% | |
American National Insurance Co. | | | 3,454 | | | | 248,930 | |
Brighthouse Financial, Inc. (a) | | | 75,661 | | | | 2,104,889 | |
Fidelity National Financial, Inc. | | | 16,341 | | | | 501,015 | |
Prudential Financial, Inc. | | | 2,043 | | | | 124,419 | |
Reinsurance Group of America, Inc. | | | 3,421 | | | | 268,343 | |
Unum Group | | | 207,593 | | | | 3,443,968 | |
Willis Towers Watson PLC | | | 23,704 | | | | 4,668,503 | |
| | | | | | | | |
| | | | | | | 11,360,067 | |
| | | | | | | | |
Interactive Media & Services 1.0% | |
IAC/InterActiveCorp (a) | | | 24,087 | | | | 7,789,736 | |
| | | | | | | | |
|
Internet & Direct Marketing Retail 1.5% | |
Etsy, Inc. (a) | | | 65,048 | | | | 6,910,049 | |
Qurate Retail, Inc., Series A (a) | | | 553,895 | | | | 5,262,003 | |
| | | | | | | | |
| | | | | | | 12,172,052 | |
| | | | | | | | |
IT Services 6.6% | |
Akamai Technologies, Inc. (a) | | | 58,606 | | | | 6,276,117 | |
Alliance Data Systems Corp. | | | 10,408 | | | | 469,609 | |
Amdocs, Ltd. | | | 80,533 | | | | 4,902,849 | |
Booz Allen Hamilton Holding Corp. | | | 70,569 | | | | 5,489,563 | |
| | | | | | | | |
| | |
Shares | | | Value | |
IT Services (continued) | |
CACI International, Inc., Class A (a) | | | 19,782 | | | $ | 4,290,320 | |
DXC Technology Co. | | | 161,537 | | | | 2,665,361 | |
Euronet Worldwide, Inc. (a) | | | 48,956 | | | | 4,690,964 | |
Fiserv, Inc. (a) | | | 11,928 | | | | 1,164,411 | |
Genpact, Ltd. | | | 9,058 | | | | 330,798 | |
Global Payments, Inc. | | | 4,957 | | | | 840,806 | |
GoDaddy, Inc., Class A (a) | | | 74,467 | | | | 5,460,665 | |
Leidos Holdings, Inc. | | | 56,022 | | | | 5,247,581 | |
Okta, Inc. (a) | | | 3,434 | | | | 687,590 | |
Sabre Corp. | | | 351,458 | | | | 2,832,751 | |
Square, Inc., Class A (a) | | | 16,654 | | | | 1,747,671 | |
Twilio, Inc., Class A (a) | | | 13,870 | | | | 3,043,355 | |
VeriSign, Inc. (a) | | | 15,456 | | | | 3,196,764 | |
| | | | | | | | |
| | | | | | | 53,337,175 | |
| | | | | | | | |
Life Sciences Tools & Services 2.6% | |
Bruker Corp. | | | 106,949 | | | | 4,350,685 | |
Charles River Laboratories International, Inc. (a) | | | 27,106 | | | | 4,725,931 | |
IQVIA Holdings, Inc. (a) | | | 50,314 | | | | 7,138,551 | |
PRA Health Sciences, Inc. (a) | | | 49,924 | | | | 4,857,106 | |
| | | | | | | | |
| | | | | | | 21,072,273 | |
| | | | | | | | |
Machinery 1.6% | |
AGCO Corp. | | | 64,218 | | | | 3,561,530 | |
Allison Transmission Holdings, Inc. | | | 56,062 | | | | 2,061,960 | |
Crane Co. | | | 43,462 | | | | 2,584,251 | |
Cummins, Inc. | | | 6,095 | | | | 1,056,020 | |
Dover Corp. | | | 573 | | | | 55,329 | |
Fortive Corp. | | | 2,295 | | | | 155,280 | |
Gates Industrial Corp. PLC (a) | | | 24,500 | | | | 251,860 | |
Otis Worldwide Corp. | | | 58,711 | | | | 3,338,307 | |
Parker-Hannifin Corp. | | | 231 | | | | 42,335 | |
| | | | | | | | |
| | | | | | | 13,106,872 | |
| | | | | | | | |
Media 0.9% | |
Altice U.S.A., Inc., Class A (a) | | | 209,995 | | | | 4,733,287 | |
Cable One, Inc. | | | 318 | | | | 564,402 | |
Fox Corp., Class B (a) | | | 67,771 | | | | 1,818,974 | |
| | | | | | | | |
| | | | | | | 7,116,663 | |
| | | | | | | | |
Metals & Mining 0.9% | |
Arconic Corp. (a) | | | 129,752 | | | | 1,807,445 | |
Newmont Corp. | | | 80,502 | | | | 4,970,194 | |
Reliance Steel & Aluminum Co. | | | 3,376 | | | | 320,484 | |
Steel Dynamics, Inc. | | | 4,690 | | | | 122,362 | |
| | | | | | | | |
| | | | | | | 7,220,485 | |
| | | | | | | | |
Multi-Utilities 0.9% | |
CenterPoint Energy, Inc. | | | 156,497 | | | | 2,921,799 | |
Consolidated Edison, Inc. | | | 22,347 | | | | 1,607,420 | |
MDU Resources Group, Inc. | | | 74,331 | | | | 1,648,662 | |
Public Service Enterprise Group, Inc. | | | 3,363 | | | | 165,325 | |
WEC Energy Group, Inc. | | | 9,211 | | | | 807,344 | |
| | | | | | | | |
| | | | | | | 7,150,550 | |
| | | | | | | | |
| | | | | | |
The notes to the financial statements are an integral part of,
and should be read in conjunction with, the financial statements. | | | | | 11 | |
Portfolio of Investments June 30, 2020 (Unaudited) (continued)
| | | | | | | | |
| | |
Shares | | | Value | |
| Common Stocks (continued) | |
Multiline Retail 0.6% | |
Dollar General Corp. | | | 26,473 | | | $ | 5,043,371 | |
| | | | | | | | |
|
Oil, Gas & Consumable Fuels 1.6% | |
Apache Corp. | | | 45,652 | | | | 616,302 | |
Cabot Oil & Gas Corp. | | | 93,199 | | | | 1,601,159 | |
Devon Energy Corp. | | | 319,132 | | | | 3,618,957 | |
HollyFrontier Corp. | | | 153,475 | | | | 4,481,470 | |
Marathon Petroleum Corp. | | | 33,145 | | | | 1,238,960 | |
PBF Energy, Inc., Class A | | | 141,221 | | | | 1,446,103 | |
Pioneer Natural Resources Co. | | | 588 | | | | 57,447 | |
| | | | | | | | |
| | | | | | | 13,060,398 | |
| | | | | | | | |
Paper & Forest Products 0.0%‡ | |
Domtar Corp. | | | 13,291 | | | | 280,573 | |
| | | | | | | | |
|
Personal Products 0.7% | |
Herbalife Nutrition, Ltd. (a) | | | 47,999 | | | | 2,158,995 | |
Nu Skin Enterprises, Inc., Class A | | | 85,850 | | | | 3,282,046 | |
| | | | | | | | |
| | | | | | | 5,441,041 | |
| | | | | | | | |
Pharmaceuticals 1.9% | |
Catalent, Inc. (a) | | | 1,876 | | | | 137,511 | |
Jazz Pharmaceuticals PLC (a) | | | 43,250 | | | | 4,772,205 | |
Mylan N.V. (a) | | | 319,593 | | | | 5,139,055 | |
Perrigo Co. PLC | | | 94,617 | | | | 5,229,482 | |
| | | | | | | | |
| | | | | | | 15,278,253 | |
| | | | | | | | |
Professional Services 3.9% | |
CoreLogic, Inc. | | | 99,249 | | | | 6,671,518 | |
IHS Markit, Ltd. | | | 104,434 | | | | 7,884,767 | |
ManpowerGroup, Inc. | | | 67,027 | | | | 4,608,106 | |
TransUnion | | | 67,137 | | | | 5,843,605 | |
Verisk Analytics, Inc. | | | 35,470 | | | | 6,036,994 | |
| | | | | | | | |
| | | | | | | 31,044,990 | |
| | | | | | | | |
Road & Rail 0.6% | |
JB Hunt Transport Services, Inc. | | | 1,824 | | | | 219,500 | |
Old Dominion Freight Line, Inc. | | | 953 | | | | 161,619 | |
Schneider National, Inc., Class B | | | 195,550 | | | | 4,824,219 | |
| | | | | | | | |
| | | | | | | 5,205,338 | |
| | | | | | | | |
Semiconductors & Semiconductor Equipment 4.0% | |
Advanced Micro Devices, Inc. (a) | | | 87,098 | | | | 4,582,226 | |
Cirrus Logic, Inc. (a) | | | 19,657 | | | | 1,214,409 | |
Entegris, Inc. | | | 9,217 | | | | 544,264 | |
Inphi Corp. (a) | | | 15,467 | | | | 1,817,373 | |
KLA Corp. | | | 40,967 | | | | 7,967,262 | |
Lam Research Corp. | | | 16,407 | | | | 5,307,008 | |
Qorvo, Inc. (a) | | | 53,055 | | | | 5,864,169 | |
Skyworks Solutions, Inc. | | | 31,890 | | | | 4,077,455 | |
SolarEdge Technologies, Inc. (a) | | | 4,347 | | | | 603,277 | |
| | | | | | | | |
| | | | | | | 31,977,443 | |
| | | | | | | | |
| | | | | | | | |
| | |
Shares | | | Value | |
Software 7.6% | |
Alteryx, Inc., Class A (a) | | | 5,384 | | | $ | 884,484 | |
Anaplan, Inc. (a) | | | 11,923 | | | | 540,231 | |
Aspen Technology, Inc. (a) | | | 3,058 | | | | 316,839 | |
Atlassian Corp. PLC, Class A (a) | | | 18,516 | | | | 3,337,879 | |
Cadence Design Systems, Inc. (a) | | | 4,686 | | | | 449,669 | |
CDK Global, Inc. | | | 103,402 | | | | 4,282,911 | |
Citrix Systems, Inc. | | | 26,025 | | | | 3,849,358 | |
Coupa Software, Inc. (a) | | | 7,162 | | | | 1,984,160 | |
DocuSign, Inc. (a) | | | 645 | | | | 111,075 | |
Dropbox, Inc., Class A (a) | | | 223,465 | | | | 4,864,833 | |
Fair Isaac Corp. (a) | | | 9,862 | | | | 4,122,711 | |
Fortinet, Inc. (a) | | | 46,356 | | | | 6,363,288 | |
Nuance Communications, Inc. (a) | | | 125,209 | | | | 3,168,414 | |
Palo Alto Networks, Inc. (a) | | | 29,066 | | | | 6,675,588 | |
Proofpoint, Inc. (a) | | | 44,751 | | | | 4,972,731 | |
RingCentral, Inc., Class A (a) | | | 8,304 | | | | 2,366,723 | |
SS&C Technologies Holdings, Inc. | | | 73,945 | | | | 4,176,414 | |
Synopsys, Inc. (a) | | | 40,661 | | | | 7,928,895 | |
Teradata Corp. (a) | | | 2,575 | | | | 53,560 | |
Zendesk, Inc. (a) | | | 12,346 | | | | 1,092,991 | |
| | | | | | | | |
| | | | | | | 61,542,754 | |
| | | | | | | | |
Specialty Retail 4.9% | |
AutoNation, Inc. (a) | | | 103,067 | | | | 3,873,258 | |
AutoZone, Inc. (a) | | | 6,408 | | | | 7,228,993 | |
Best Buy Co., Inc. | | | 79,599 | | | | 6,946,605 | |
Burlington Stores, Inc. (a) | | | 25,611 | | | | 5,043,574 | |
Dick’s Sporting Goods, Inc. | | | 27,219 | | | | 1,123,056 | |
Foot Locker, Inc. | | | 403 | | | | 11,751 | |
O’Reilly Automotive, Inc. (a) | | | 18,548 | | | | 7,821,135 | |
Tractor Supply Co. | | | 42,323 | | | | 5,577,748 | |
Ulta Beauty, Inc. (a) | | | 5,831 | | | | 1,186,142 | |
Williams-Sonoma, Inc. | | | 11,965 | | | | 981,250 | |
| | | | | | | | |
| | | | | | | 39,793,512 | |
| | | | | | | | |
Technology Hardware, Storage & Peripherals 0.3% | |
HP, Inc. | | | 101,794 | | | | 1,774,269 | |
Xerox Holdings Corp. (a) | | | 43,788 | | | | 669,519 | |
| | | | | | | | |
| | | | | | | 2,443,788 | |
| | | | | | | | |
Textiles, Apparel & Luxury Goods 0.3% | |
Lululemon Athletica, Inc. (a) | | | 7,139 | | | | 2,227,439 | |
| | | | | | | | |
|
Thrifts & Mortgage Finance 0.4% | |
MGIC Investment Corp. | | | 325,857 | | | | 2,668,769 | |
New York Community Bancorp, Inc. | | | 40,363 | | | | 411,702 | |
| | | | | | | | |
| | | | | | | 3,080,471 | |
| | | | | | | | |
Trading Companies & Distributors 1.0% | |
HD Supply Holdings, Inc. (a) | | | 129,129 | | | | 4,474,320 | |
United Rentals, Inc. (a) | | | 2,606 | | | | 388,398 | |
WESCO International, Inc. (a) | | | 79,370 | | | | 2,786,681 | |
| | | | | | | | |
| | | | | | | 7,649,399 | |
| | | | | | | | |
Total Common Stocks
(Cost $724,369,210) | | | | | | | 797,909,953 | |
| | | | | | | | |
| | | | |
| 12 | | MainStay VP MacKay Mid Cap Core Portfolio | | The notes to the financial statements are an integral part of,
and should be read in conjunction with, the financial statements. |
| | | | | | | | |
| | |
Shares | | | Value | |
| Exchange-Traded Funds 0.9% | |
iShares Russell Mid-Cap ETF | | | 133,593 | | | $ | 7,160,585 | |
SPDR S&P 500 ETF Trust | | | 1,173 | | | | 361,706 | |
| | | | | | | | |
Total Exchange-Traded Funds
(Cost $5,904,996) | | | | | | | 7,522,291 | |
| | | | | | | | |
Total Investments
(Cost $730,274,206) | | | 99.9 | % | | | 805,432,244 | |
Other Assets, Less Liabilities | | | 0.1 | | | | 467,393 | |
Net Assets | | | 100.0 | % | | $ | 805,899,637 | |
| † | Percentages indicated are based on Portfolio net assets. |
| ‡ | Less than one-tenth of a percent. |
| (a) | Non-income producing security. |
The following abbreviations are used in the preceding pages:
ETF—Exchange-Traded Fund
SPDR—Standard & Poor’s Depositary Receipt
The following is a summary of the fair valuations according to the inputs used as of June 30, 2020, for valuing the Portfolio’s assets:
| | | | | | | | | | | | | | | | |
Description | | Quoted
Prices in
Active
Markets for
Identical
Assets
(Level 1) | | | Significant
Other
Observable
Inputs
(Level 2) | | | Significant
Unobservable
Inputs
(Level 3) | | | Total | |
| | | | |
Asset Valuation Inputs | | | | | | | | | | | | | | | | |
| Investments in Securities (a) | | | | | | | | | | | | | | | | |
| Common Stocks | | $ | 797,909,953 | | | $ | — | | | $ | — | | | $ | 797,909,953 | |
| Exchange-Traded Funds | | | 7,522,291 | | | | — | | | | — | | | | 7,522,291 | |
| | | | | | | | | | | | | | | | |
| Total Investments in Securities | | $ | 805,432,244 | | | $ | — | | | $ | — | | | $ | 805,432,244 | |
| | | | | | | | | | | | | | | | |
| (a) | For a complete listing of investments and their industries, see the Portfolio of Investments. |
| | | | | | |
The notes to the financial statements are an integral part of,
and should be read in conjunction with, the financial statements. | | | | | 13 | |
Statement of Assets and Liabilities as of June 30, 2020 (Unaudited)
| | | | |
| Assets | |
Investment in securities, at value
(identified cost $730,274,206) | | $ | 805,432,244 | |
Cash | | | 8,354 | |
Receivables: | | | | |
Portfolio shares sold | | | 871,816 | |
Dividends | | | 619,513 | |
Securities lending | | | 37 | |
Other assets | | | 3,423 | |
| | | | |
Total assets | | | 806,935,387 | |
| | | | |
| |
| Liabilities | | | | |
Payables: | | | | |
Manager (See Note 3) | | | 550,456 | |
Portfolio shares redeemed | | | 303,579 | |
NYLIFE Distributors (See Note 3) | | | 100,181 | |
Shareholder communication | | | 50,323 | |
Professional fees | | | 18,438 | |
Custodian | | | 6,697 | |
Trustees | | | 1,097 | |
Accrued expenses | | | 4,979 | |
| | | | |
Total liabilities | | | 1,035,750 | |
| | | | |
Net assets | | $ | 805,899,637 | |
| | | | |
| |
| Composition of Net Assets | | | | |
Shares of beneficial interest outstanding (par value of $.001 per share) unlimited number of shares authorized | | $ | 68,344 | |
Additional paid-in capital | | | 747,166,125 | |
| | | | |
| | | 747,234,469 | |
Total distributable earnings (loss) | | | 58,665,168 | |
| | | | |
Net assets | | $ | 805,899,637 | |
| | | | |
| | | | |
Initial Class | | | | |
Net assets applicable to outstanding shares | | $ | 322,362,824 | |
| | | | |
Shares of beneficial interest outstanding | | | 27,018,822 | |
| | | | |
Net asset value per share outstanding | | $ | 11.93 | |
| | | | |
Service Class | | | | |
Net assets applicable to outstanding shares | | $ | 483,536,813 | |
| | | | |
Shares of beneficial interest outstanding | | | 41,325,293 | |
| | | | |
Net asset value per share outstanding | | $ | 11.70 | |
| | | | |
| | | | |
| 14 | | MainStay VP MacKay Mid Cap Core Portfolio | | The notes to the financial statements are an integral part of,
and should be read in conjunction with, the financial statements. |
Statement of Operations for the six months ended June 30, 2020 (Unaudited)
| | | | |
| Investment Income (Loss) | | | | |
Income | | | | |
Dividends-unaffiliated (a) | | $ | 5,765,917 | |
Dividends-affiliated | | | 3,414 | |
Securities lending | | | 3,354 | |
Interest | | | 24 | |
| | | | |
Total income | | | 5,772,709 | |
| | | | |
Expenses | | | | |
Manager (See Note 3) | | | 3,341,859 | |
Distribution/Service—Service Class (See Note 3) | | | 577,647 | |
Professional fees | | | 50,637 | |
Shareholder communication | | | 47,317 | |
Custodian | | | 16,521 | |
Trustees | | | 10,040 | |
Miscellaneous | | | 15,496 | |
| | | | |
Total expenses before waiver/reimbursement | | | 4,059,517 | |
Expense waiver/reimbursement from Manager (See Note 3) | | | (100,694 | ) |
| | | | |
Net expenses | | | 3,958,823 | |
| | | | |
Net investment income (loss) | | | 1,813,886 | |
| | | | |
|
| Realized and Unrealized Gain (Loss) on Investments and Foreign Currency Transactions | |
Net realized gain (loss) on: | | | | |
Unaffiliated investment transactions | | | (75,907,641 | ) |
Foreign currency transactions | | | 3 | |
| | | | |
Net realized gain (loss) on investments and foreign currency transactions | | | (75,907,638 | ) |
| | | | |
Net change in unrealized appreciation (depreciation) on: | | | | |
Unaffiliated investments | | | (29,882,268 | ) |
Translation of other assets and liabilities in foreign currencies | | | 1 | |
| | | | |
Net change in unrealized appreciation (depreciation) on investments and foreign currencies | | | (29,882,267 | ) |
| | | | |
Net realized and unrealized gain (loss) on investments and foreign currency transactions | | | (105,789,905 | ) |
| | | | |
Net increase (decrease) in net assets resulting from operations | | $ | (103,976,019 | ) |
| | | | |
| (a) | Dividends recorded net of foreign withholding taxes in the amount of $754. |
| | | | | | |
The notes to the financial statements are an integral part of,
and should be read in conjunction with, the financial statements. | | | | | 15 | |
Statements of Changes in Net Assets
for the six months ended June 30, 2020 (Unaudited) and the year ended December 31, 2019
| | | | | | | | |
| | | 2020 | | | 2019 | |
| Increase (Decrease) in Net Assets | |
Operations: | | | | | | | | |
Net investment income (loss) | | $ | 1,813,886 | | | $ | 6,318,673 | |
Net realized gain (loss) on investments and foreign currency transactions | | | (75,907,638 | ) | | | 64,752,691 | |
Net change in unrealized appreciation (depreciation) on investments and foreign currencies | | | (29,882,267 | ) | | | 112,581,705 | |
| | | | |
Net increase (decrease) in net assets resulting from operations | | | (103,976,019 | ) | | | 183,653,069 | |
| | | | |
Distributions to shareholders: | | | | | | | | |
Initial Class | | | — | | | | (29,305,651 | ) |
Service Class | | | — | | | | (35,122,238 | ) |
| | | | |
Total distributions to shareholders | | | — | | | | (64,427,889 | ) |
| | | | |
Capital share transactions: | | | | | | | | |
Net proceeds from sale of shares | | | 62,756,204 | | | | 95,825,814 | |
Net asset value of shares issued to shareholders in reinvestment of distributions | | | — | | | | 64,427,889 | |
Cost of shares redeemed | | | (67,566,260 | ) | | | (213,935,937 | ) |
| | | | |
Increase (decrease) in net assets derived from capital share transactions | | | (4,810,056 | ) | | | (53,682,234 | ) |
| | | | |
Net increase (decrease) in net assets | | | (108,786,075 | ) | | | 65,542,946 | |
|
| Net Assets | |
Beginning of period | | | 914,685,712 | | | | 849,142,766 | |
| | | | |
End of period | | $ | 805,899,637 | | | $ | 914,685,712 | |
| | | | |
| | | | |
| 16 | | MainStay VP MacKay Mid Cap Core Portfolio | | The notes to the financial statements are an integral part of,
and should be read in conjunction with, the financial statements. |
Financial Highlights selected per share data and ratios
| | | | | | | | | | | | | | | | | | | | | | | | |
| | |
| | | Six months
ended June 30, | | | Year ended December 31, | |
| | | | | | |
| Initial Class | | 2020* | | | 2019 | | | 2018 | | | 2017 | | | 2016 | | | 2015 | |
| | | | | | |
Net asset value at beginning of period | | $ | 13.56 | | | $ | 11.94 | | | $ | 15.57 | | | $ | 13.37 | | | $ | 13.00 | | | $ | 15.83 | |
| | | | | | | | | | | | | | | | | | | | | | | | |
| | | | | | |
Net investment income (loss) (a) | | | 0.04 | | | | 0.11 | | | | 0.16 | | | | 0.12 | | | | 0.13 | | | | 0.13 | |
| | | | | | |
Net realized and unrealized gain (loss) on investments | | | (1.67 | ) | | | 2.54 | | | | (1.68 | ) | | | 2.42 | | | | 1.28 | | | | (0.73 | ) |
| | | | | | | | | | | | | | | | | | | | | | | | |
| | | | | | |
Total from investment operations | | | (1.63 | ) | | | 2.65 | | | | (1.52 | ) | | | 2.54 | | | | 1.41 | | | | (0.60 | ) |
| | | | | | | | | | | | | | | | | | | | | | | | |
| | | | | | |
| Less distributions: | | | | | | | | | | | | | | | | | | | | | | | | |
| | | | | | |
From net investment income | | | — | | | | (0.16 | ) | | | (0.15 | ) | | | (0.16 | ) | | | (0.11 | ) | | | (0.09 | ) |
| | | | | | |
From net realized gain on investments | | | — | | | | (0.87 | ) | | | (1.96 | ) | | | (0.18 | ) | | | (0.93 | ) | | | (2.14 | ) |
| | | | | | | | | | | | | | | | | | | | | | | | |
| | | | | | |
Total distributions | | | — | | | | (1.03 | ) | | | (2.11 | ) | | | (0.34 | ) | | | (1.04 | ) | | | (2.23 | ) |
| | | | | | | | | | | | | | | | | | | | | | | | |
| | | | | | |
Net asset value at end of period | | $ | 11.93 | | | $ | 13.56 | | | $ | 11.94 | | | $ | 15.57 | | | $ | 13.37 | | | $ | 13.00 | |
| | | | | | | | | | | | | | | | | | | | | | | | |
| | | | | | |
Total investment return (b) | | | (12.02 | %)(c) | | | 22.88 | % | | | (11.98 | %) | | | 19.14 | % | | | 11.17 | % | | | (3.68 | %) |
| | | | | | |
| Ratios (to average net assets)/Supplemental Data: | | | | | | | | | | | | | | | | | | | | | | | | |
| | | | | | |
Net investment income (loss) | | | 0.60 | % †† | | | 0.84 | % | | | 1.08 | % | | | 0.87 | % | | | 1.09 | % | | | 0.88 | % |
| | | | | | |
Net expenses (d) | | | 0.86 | % †† | | | 0.86 | % | | | 0.86 | % | | | 0.86 | % | | | 0.86 | % | | | 0.86 | % |
| | | | | | |
Expenses (before waiver/reimbursement) (d) | | | 0.89 | % †† | | | 0.88 | % | | | 0.88 | % | | | 0.88 | % | | | 0.89 | % | | | 0.88 | % |
| | | | | | |
Portfolio turnover rate | | | 99 | % | | | 174 | % | | | 181 | % | | | 155 | % | | | 164 | % | | | 174 | % |
| | | | | | |
Net assets at end of period (in 000’s) | | $ | 322,363 | | | $ | 398,240 | | | $ | 453,343 | | | $ | 503,364 | | | $ | 558,783 | | | $ | 506,368 | |
| (a) | Per share data based on average shares outstanding during the period. |
| (b) | Total return does not reflect any deduction of sales charges, mortality and expense charges, contract charges or administrative charges. For periods of less than one year, total return is not annualized. |
| (c) | Total investment return may reflect adjustments to conform to generally accepted accounting principles. |
| (d) | In addition to the fees and expenses which the Portfolio bears directly, it also indirectly bears a pro-rata share of the fees and expenses of the underlying funds in which it invests. Such indirect expenses are not included in the above expense ratios. |
| | | | | | | | | | | | | | | | | | | | | | | | |
| | |
| | | Six months
ended
June 30, | | | Year ended December 31, | |
| | | | | | |
| Service Class | | 2020* | | | 2019 | | | 2018 | | | 2017 | | | 2016 | | | 2015 | |
| | | | | | |
Net asset value at beginning of period | | $ | 13.32 | | | $ | 11.74 | | | $ | 15.35 | | | $ | 13.18 | | | $ | 12.83 | | | $ | 15.64 | |
| | | | | | | | | | | | | | | | | | | | | | | | |
| | | | | | |
Net investment income (loss) (a) | | | 0.02 | | | | 0.08 | | | | 0.12 | | | | 0.09 | | | | 0.12 | | | | 0.09 | |
| | | | | | |
Net realized and unrealized gain (loss) on investments | | | (1.64 | ) | | | 2.49 | | | | (1.66 | ) | | | 2.38 | | | | 1.24 | | | | (0.71 | ) |
| | | | | | | | | | | | | | | | | | | | | | | | |
| | | | | | |
Total from investment operations | | | (1.62 | ) | | | 2.57 | | | | (1.54 | ) | | | 2.47 | | | | 1.36 | | | | (0.62 | ) |
| | | | | | | | | | | | | | | | | | | | | | | | |
| | | | | | |
| Less distributions: | | | | | | | | | | | | | | | | | | | | | | | | |
| | | | | | |
From net investment income | | | — | | | | (0.12 | ) | | | (0.11 | ) | | | (0.12 | ) | | | (0.08 | ) | | | (0.05 | ) |
| | | | | | |
From net realized gain on investments | | | — | | | | (0.87 | ) | | | (1.96 | ) | | | (0.18 | ) | | | (0.93 | ) | | | (2.14 | ) |
| | | | | | | | | | | | | | | | | | | | | | | | |
| | | | | | |
Total distributions | | | — | | | | (0.99 | ) | | | (2.07 | ) | | | (0.30 | ) | | | (1.01 | ) | | | (2.19 | ) |
| | | | | | | | | | | | | | | | | | | | | | | | |
| | | | | | |
Net asset value at end of period | | $ | 11.70 | | | $ | 13.32 | | | $ | 11.74 | | | $ | 15.35 | | | $ | 13.18 | | | $ | 12.83 | |
| | | | | | | | | | | | | | | | | | | | | | | | |
| | | | | | |
Total investment return (b) | | | (12.16 | %)(c) | | | 22.57 | % | | | (12.20 | %) | | | 18.85 | % | | | 10.89 | % | | | (3.92 | %) |
| | | | | | |
| Ratios (to average net assets)/Supplemental Data: | | | | | | | | | | | | | | | | | | | | | | | | |
| | | | | | |
Net investment income (loss) | | | 0.36 | % †† | | | 0.58 | % | | | 0.83 | % | | | 0.64 | % | | | 0.83 | % | | | 0.61 | % |
| | | | | | |
Net expenses (d) | | | 1.11 | % †† | | | 1.11 | % | | | 1.11 | % | | | 1.11 | % | | | 1.11 | % | | | 1.11 | % |
| | | | | | |
Expenses (before waiver/reimbursement) (d) | | | 1.14 | % †† | | | 1.13 | % | | | 1.13 | % | | | 1.13 | % | | | 1.14 | % | | | 1.13 | % |
| | | | | | |
Portfolio turnover rate | | | 99 | % | | | 174 | % | | | 181 | % | | | 155 | % | | | 164 | % | | | 174 | % |
| | | | | | |
Net assets at end of period (in 000’s) | | $ | 483,537 | | | $ | 516,445 | | | $ | 395,800 | | | $ | 477,253 | | | $ | 435,287 | | | $ | 426,143 | |
| (a) | Per share data based on average shares outstanding during the period. |
| (b) | Total return does not reflect any deduction of sales charges, mortality and expense charges, contract charges or administrative charges. For periods of less than one year, total return is not annualized. |
| (c) | Total investment return may reflect adjustments to conform to generally accepted accounting principles. |
| (d) | In addition to the fees and expenses which the Portfolio bears directly, it also indirectly bears a pro-rata share of the fees and expenses of the underlying funds in which it invests. Such indirect expenses are not included in the above expense ratios. |
| | | | | | |
The notes to the financial statements are an integral part of,
and should be read in conjunction with, the financial statements. | | | | | 17 | |
Notes to Financial Statements (Unaudited)
Note 1–Organization and Business
MainStay VP Funds Trust (the “Fund”) was organized as a Delaware statutory trust on February 1, 2011. The Fund is registered under the Investment Company Act of 1940, as amended (the “1940 Act”), as an open-end management investment company. The Fund is comprised of thirty-one separate series (collectively referred to as the “Portfolios”). These financial statements and notes relate to the MainStay VP MacKay Mid Cap Core Portfolio (the “Portfolio”), a “diversified” portfolio, as that term is defined in the 1940 Act, as interpreted or modified by regulatory authorities having jurisdiction, from time to time.
Shares of the Portfolio are currently offered to certain separate accounts to fund variable annuity policies and variable universal life insurance policies issued by New York Life Insurance and Annuity Corporation (“NYLIAC”), a wholly-owned subsidiary of New York Life Insurance Company (“New York Life”) and may also be offered to fund variable annuity policies and variable universal life insurance policies issued by other insurance companies. NYLIAC allocates shares of the Portfolios to, among others, certain NYLIAC separate accounts. Shares of the Portfolio are also offered to the MainStay VP Conservative Allocation Portfolio, MainStay VP Moderate Allocation Portfolio, MainStay VP Moderate Growth Allocation Portfolio and MainStay VP Growth Allocation Portfolio, which operate as “funds-of-funds,” and other variable insurance funds.
The Portfolio currently offers two classes of shares. Initial Class shares commenced operations on July 2, 2001. Service Class shares commenced operations on June 5, 2003. Shares of the Portfolio are offered and are redeemed at a price equal to their respective net asset value (“NAV”) per share. No sales or redemption charge is applicable to the purchase or redemption of the Portfolio’s shares. Under the terms of the Fund’s multiple class plan adopted pursuant to Rule 18f-3 under the 1940 Act, the classes differ in that, among other things, Service Class shares of the Portfolio pay a combined distribution and service fee of 0.25% of average daily net assets attributable to Service Class shares of the Portfolio to the Distributor (as defined in Note 3(B)) pursuant to a plan adopted in accordance with Rule 12b-1 under the 1940 Act. Contract owners of variable annuity contracts purchased after June 2, 2003, are permitted to invest only in the Service Class shares.
The Portfolio’s investment objective is to seek long-term growth of capital.
Note 2–Significant Accounting Policies
The Portfolio is an investment company and accordingly follows the investment company accounting and reporting guidance of the Financial Accounting Standards Board (“FASB”) Accounting Standard Codification Topic 946 Financial Services—Investment Companies. The Portfolio prepares its financial statements in accordance with generally accepted accounting principles (“GAAP”) in the United States of America and follows the significant accounting policies described below.
(A) Securities Valuation. Investments are usually valued as of the close of regular trading on the New York Stock Exchange (the “Exchange”) (usually 4:00 p.m. Eastern time) on each day the Portfolio is open for business (“valuation date”).
The Board of Trustees of the Fund (the “Board”) adopted procedures establishing methodologies for the valuation of the Portfolio’s securities and other assets and delegated the responsibility for valuation determinations under those procedures to the Valuation Committee of the Fund (the “Valuation Committee”). The procedures state that, subject to the oversight of the Board and unless otherwise noted, the responsibility for the day-to-day valuation of portfolio assets (including fair value measurements for the Portfolio’s assets and liabilities) rests with New York Life Investment Management LLC (“New York Life Investments” or the “Manager”), aided to whatever extent necessary by the Subadvisor (as defined in Note 3(A)). To assess the appropriateness of security valuations, the Manager, the Subadvisor or the Portfolio’s third-party service provider, who is subject to oversight by the Manager, regularly compares prior day prices, prices on comparable securities and the sale prices to the prior and current day prices and challenges prices with changes exceeding certain tolerance levels with third-party pricing services or broker sources.
The Board authorized the Valuation Committee to appoint a Valuation Subcommittee (the “Subcommittee”) to establish the prices of securities for which market quotations are not readily available or the prices of which are not otherwise readily determinable under the procedures. The Subcommittee meets (in person, via electronic mail or via teleconference) on an as-needed basis. The Valuation Committee meets to ensure that actions taken by the Subcommittee were appropriate.
For those securities valued through either a standardized fair valuation methodology or a fair valuation measurement, the Subcommittee deals with such valuation and the Valuation Committee reviews and affirms, if appropriate, the reasonableness of the valuation based on such methodologies and measurements on a regular basis after considering information that is reasonably available and deemed relevant by the Valuation Committee. Any action taken by the Subcommittee with respect to the valuation of a portfolio security or other asset is submitted for review and ratification (if appropriate) to the Valuation Committee and the Board at the next regularly scheduled meeting.
“Fair value” is defined as the price the Portfolio would reasonably expect to receive upon selling an asset or liability in an orderly transaction to an independent buyer in the principal or most advantageous market for the asset or liability. Fair value measurements are determined within a framework that establishes a three-tier hierarchy that maximizes the use of observable market data and minimizes the use of unobservable inputs to establish a classification of fair value measurements for disclosure purposes. “Inputs” refer broadly to the assumptions that market participants would use in pricing the asset or liability, including assumptions about risk, such as the risk inherent in a particular valuation technique used to measure fair value using a pricing model and/or the risk inherent in the inputs for the valuation technique. Inputs may be observable or unobservable. Observable inputs reflect the assumptions market participants would use in pricing the asset or liability based on market data obtained from sources independent of the Portfolio. Unobservable inputs reflect the Portfolio’s own assumptions about the assumptions market participants would use in pricing the asset or liability based on the information available. The inputs or methodology used for valuing assets or liabilities may not be an indication of the risks
| | |
| 18 | | MainStay VP MacKay Mid Cap Core Portfolio |
associated with investing in those assets or liabilities. The three-tier hierarchy of inputs is summarized below.
| • | | Level 1—quoted prices in active markets for an identical asset or liability |
| • | | Level 2—other significant observable inputs (including quoted prices for a similar asset or liability in active markets, interest rates and yield curves, prepayment speeds, credit risk, etc.) |
| • | | Level 3—significant unobservable inputs (including the Portfolio’s own assumptions about the assumptions that market participants would use in measuring fair value of an asset or liability) |
The level of an asset or liability within the fair value hierarchy is based on the lowest level of an input, both individually and in the aggregate, that is significant to the fair value measurement. The aggregate value by input level of the Portfolio’s assets and liabilities as of June 30, 2020 is included at the end of the Portfolio of Investments.
The Portfolio may use third-party vendor evaluations, whose prices may be derived from one or more of the following standard inputs, among others:
| | |
• Broker/dealer quotes | | • Benchmark securities |
• Two-sided markets | | • Reference data (corporate actions or material event notices) |
• Bids/offers | | • Monthly payment information |
• Industry and economic events | | • Reported trades |
An asset or liability for which market values cannot be measured using the methodologies described above is valued by methods deemed reasonable in good faith by the Valuation Committee, following the procedures established by the Board, to represent fair value. Under these procedures, the Portfolio generally uses a market-based approach which may use related or comparable assets or liabilities, recent transactions, market multiples, book values and other relevant information. The Portfolio may also use an income-based valuation approach in which the anticipated future cash flows of the asset or liability are discounted to calculate fair value. Discounts may also be applied due to the nature and/or duration of any restrictions on the disposition of the asset or liability. Fair value represents a good faith approximation of the value of a security. Fair value determinations involve the consideration of a number of subjective factors, an analysis of applicable facts and circumstances and the exercise of judgment. As a result, it is possible that the fair value for a security determined in good faith in accordance with the Portfolio’s valuation procedures may differ from valuations for the same security determined by other funds using their own valuation procedures. Although the Portfolio’s valuation procedures are designed to value a security at the price the Portfolio may reasonably expect to receive upon the security’s sale in an orderly transaction, there can be no assurance that any fair value determination thereunder would, in fact, approximate the amount that the Portfolio would actually realize upon the sale of the security or the price at which the security would trade if a reliable market price were readily available. During the six-month period ended June 30, 2020, there were no material changes to the fair value methodologies.
Securities which may be valued in this manner include, but are not limited to: (i) a security for which trading has been halted or suspended;
(ii) a debt security that has recently gone into default and for which there is not a current market quotation; (iii) a security of an issuer that has entered into a restructuring; (iv) a security that has been delisted from a national exchange; (v) a security for which the market price is not readily available from a third-party pricing source or, if so provided, does not, in the opinion of the Manager or the Subadvisor, reflect the security’s market value; (vi) a security subject to trading collars for which no or limited trading takes place; and (vii) a security whose principal market has been temporarily closed at a time when, under normal conditions, it would be open. Securities valued in this manner are generally categorized as Level 3 in the hierarchy. As of June 30, 2020, no securities held by the Portfolio were fair valued in such a manner.
Equity securities, including exchange-traded funds (“ETFs”), are valued at the last quoted sales prices as of the close of regular trading on the relevant exchange on each valuation date. Securities that are not traded on the valuation date are valued at the mean of the last quoted bid and ask prices. Prices are normally taken from the principal market in which each security trades. These securities are generally categorized as Level 1 in the hierarchy.
Investments in mutual funds, including money market funds, are valued at their respective NAVs as of the close of the Exchange on the valuation date. These securities are generally categorized as Level 1 in the hierarchy.
Temporary cash investments acquired in excess of 60 days to maturity at the time of purchase are valued using the latest bid prices or using valuations based on a matrix system (which considers such factors as security prices, yields, maturities and ratings), both as furnished by independent pricing services. Temporary cash investments that mature in 60 days or less at the time of purchase (“Short-Term Investments”) are valued using the amortized cost method of valuation, unless the use of such method would be inappropriate. The amortized cost method involves valuing a security at its cost on the date of purchase and thereafter assuming a constant amortization to maturity of the difference between such cost and the value on maturity date. Amortized cost approximates the current fair value of a security. Securities valued using the amortized cost method are not valued using quoted prices in an active market and are generally categorized as Level 2 in the hierarchy.
The information above is not intended to reflect an exhaustive list of the methodologies that may be used to value portfolio investments. The valuation procedures permit the use of a variety of valuation methodologies in connection with valuing portfolio investments. The methodology used for a specific type of investment may vary based on the market data available or other considerations. The methodologies summarized above may not represent the specific means by which portfolio investments are valued on any particular business day.
(B) Income Taxes. The Portfolio’s policy is to comply with the requirements of the Internal Revenue Code of 1986, as amended (the “Internal Revenue Code”), applicable to regulated investment companies and to distribute all of its taxable income to the shareholders of the Portfolio within the allowable time limits.
The Manager evaluates the Portfolio’s tax positions to determine if the tax positions taken meet the minimum recognition threshold in connection with accounting for uncertainties in income tax positions taken
Notes to Financial Statements (Unaudited) (continued)
or expected to be taken for the purposes of measuring and recognizing tax liabilities in the financial statements. Recognition of tax benefits of an uncertain tax position is permitted only to the extent the position is “more likely than not” to be sustained assuming examination by taxing authorities. The Manager analyzed the Portfolio’s tax positions taken on federal, state and local income tax returns for all open tax years (for up to three tax years) and has concluded that no provisions for federal, state and local income tax are required in the Portfolio’s financial statements. The Portfolio’s federal, state and local income tax and federal excise tax returns for tax years for which the applicable statutes of limitations have not expired are subject to examination by the Internal Revenue Service and state and local departments of revenue.
(C) Dividends and Distributions to Shareholders. Dividends and distributions are recorded on the ex-dividend date. The Portfolio intends to declare and pay dividends from net investment income and distributions from net realized capital and currency gains, if any, at least annually. Unless a shareholder elects otherwise, all dividends and distributions are reinvested at NAV in the same class of shares of the Portfolio. Dividends and distributions to shareholders are determined in accordance with federal income tax regulations and may differ from determinations using GAAP.
(D) Security Transactions and Investment Income. The Portfolio records security transactions on the trade date. Realized gains and losses on security transactions are determined using the identified cost method. Dividend income is recognized on the ex-dividend date, net of any foreign tax withheld at the source, and interest income is accrued as earned using the effective interest rate method. Distributions received from real estate investment trusts may be classified as dividends, capital gains and/or return of capital.
Investment income and realized and unrealized gains and losses on investments of the Portfolio are allocated pro rata to the separate classes of shares based upon their relative net assets on the date the income is earned or realized and unrealized gains and losses are incurred.
(E) Expenses. Expenses of the Fund are allocated to the individual Portfolios in proportion to the net assets of the respective Portfolios when the expenses are incurred, except where direct allocations of expenses can be made. Expenses (other than fees incurred under the distribution and service plans, further discussed in Note 3(B), which are charged directly to the Service Class shares) are allocated to separate classes of shares pro rata based upon their relative net assets on the date the expenses are incurred. The expenses borne by the Portfolio, including those of related parties to the Portfolio, are shown in the Statement of Operations.
Additionally, the Portfolio may invest in ETFs and mutual funds, which are subject to management fees and other fees that may cause the costs of investing in ETFs and mutual funds to be greater than the costs of owning the underlying securities directly. These indirect expenses of ETFs and mutual funds are not included in the amounts shown as expenses in the Portfolio’s Statement of Operations or in the expense ratios included in the Financial Highlights.
(F) Use of Estimates. In preparing financial statements in conformity with GAAP, the Manager makes estimates and assumptions that affect the reported amounts and disclosures in the financial statements. Actual results could differ from those estimates.
(G) Securities Lending. In order to realize additional income, the Portfolio may engage in securities lending, subject to the limitations set forth in the 1940 Act and relevant guidance by the staff of the Securities and Exchange Commission (“SEC”). If the Portfolio engages in securities lending, the Portfolio will lend through its custodian, currently State Street Bank and Trust Company (“State Street”), acting as securities lending agent on behalf of the Portfolio. Under the current arrangement, State Street will manage the Portfolio’s collateral in accordance with the securities lending agency agreement between the Portfolio and State Street, and indemnify the Portfolio against counterparty risk. The loans will be collateralized by cash (which may be invested in a money market fund) and/or non-cash collateral (which may include U.S. Treasury securities and/or U.S. government agency securities issued or guaranteed by the United States government or its agencies or instrumentalities) at least equal at all times to the market value of the securities loaned. The Portfolio bears the risk of delay in recovery of, or loss of rights in, the securities loaned. The Portfolio may also record a realized gain or loss on securities deemed sold due to a borrower’s inability to return securities on loan. The Portfolio bears the risk of any loss on investment of cash collateral. The Portfolio will receive compensation for lending its securities in the form of fees or it will retain a portion of interest earned on the investment of any cash collateral. The Portfolio will also continue to receive interest and dividends on the securities loaned and any gain or loss in the market price of the securities loaned that may occur during the term of the loan will be for the account of the Portfolio. Income earned from securities lending activities, if any, is reflected in the Statement of Operations. As of June 30, 2020, the Portfolio did not have any portfolio securities on loan.
(H) Foreign Currency Transactions. The Portfolio’s books and records are maintained in U.S. dollars. Prices of securities denominated in foreign currency amounts are translated into U.S. dollars at the mean between the buying and selling rates last quoted by any major U.S. bank at the following dates:
| (i) | market value of investment securities, other assets and liabilities— at the valuation date; and |
| (ii) | purchases and sales of investment securities, income and expenses—at the date of such transactions. |
The assets and liabilities that are denominated in foreign currency amounts are presented at the exchange rates and market values at the close of the period. The realized and unrealized changes in net assets arising from fluctuations in exchange rates and market prices of securities are not separately presented.
Net realized gain (loss) on foreign currency transactions represents net currency gains or losses realized as a result of differences between the amounts of securities sale proceeds or purchase cost, dividends, interest and withholding taxes as recorded on the Portfolio’s books, and the U.S. dollar equivalent amount actually received or paid. Net currency gains or losses from valuing such foreign currency denominated assets and liabilities, other than investments at valuation date exchange rates, are reflected in unrealized foreign exchange gains or losses.
(I) Indemnifications. Under the Fund’s organizational documents, its officers and trustees are indemnified against certain liabilities that may arise out of performance of their duties to the Fund. Additionally, in the normal course of business, the Portfolio enters into contracts with
| | |
| 20 | | MainStay VP MacKay Mid Cap Core Portfolio |
third-party service providers that contain a variety of representations and warranties and that may provide general indemnifications. The Portfolio’s maximum exposure under these arrangements is unknown, as this would involve future claims that may be made against the Portfolio that have not yet occurred. The Manager believes that the risk of loss in connection with these potential indemnification obligations is remote. However, there can be no assurance that material liabilities related to such obligations will not arise in the future, which could adversely impact the Portfolio.
Note 3–Fees and Related Party Transactions
(A) Manager and Subadvisor. New York Life Investments, a registered investment adviser and an indirect, wholly-owned subsidiary of New York Life, serves as the Portfolio’s Manager, pursuant to an Amended and Restated Management Agreement (“Management Agreement”). The Manager provides offices, conducts clerical, recordkeeping and bookkeeping services, and keeps most of the financial and accounting records required to be maintained by the Portfolio. Except for the portion of salaries and expenses that are the responsibility of the Portfolio, the Manager pays the salaries and expenses of all personnel affiliated with the Portfolio and certain operational expenses of the Portfolio. The Portfolio reimburses New York Life Investments in an amount equal to the portion of the compensation of the Chief Compliance Officer attributable to the Portfolio. MacKay Shields LLC (“MacKay Shields” or the “Subadvisor”), a registered investment adviser and an indirect, wholly-owned subsidiary of New York Life, serves as Subadvisor to the Portfolio and is responsible for the day-to-day portfolio management of the Portfolio. Pursuant to the terms of an Amended and Restated Subadvisory Agreement (“Subadvisory Agreement”) between New York Life Investments and MacKay Shields, New York Life Investments pays for the services of the Subadvisor.
The Fund, on behalf of the Portfolio, pays New York Life Investments in its capacity as the Portfolio’s investment manager and administrator, pursuant to the Management Agreement, a monthly fee for the services performed and the facilities furnished at an annual percentage of the Portfolio’s average daily net assets as follows: 0.85% up to $1 billion; 0.80% from $1 billion to $2 billion; and 0.775% in excess of $2 billion. During the six-month period ended June 30, 2020, the effective management fee rate was 0.85% (exclusive of any applicable waivers/reimbursements).
New York Life Investments has contractually agreed to waive fees and/or reimburse expenses so that the total annual operating expenses (excluding taxes, interest, litigation, extraordinary expenses, brokerage and other transaction expenses relating to the purchase or sale of portfolio investments, and acquired (underlying) portfolio/fund fees and expenses) do not exceed 0.86% for the Initial Class shares and 1.11% for Service Class shares. This agreement will remain in effect until May 1, 2021 and shall renew automatically for one year terms unless New York Life Investments provides written notice of termination prior to the start of the next term or upon approval of the Board.
During the six-month period ended June 30, 2020, New York Life Investments earned fees from the Portfolio in the amount of $3,341,859 and waived fees/reimbursed expenses in the amount of $100,694 and paid the Subadvisor in the amount of $1,620,583.
State Street provides sub-administration and sub-accounting services to the Portfolio pursuant to an agreement with New York Life Investments. These services include calculating the daily NAVs of the Portfolio, maintaining the general ledger and sub-ledger accounts for the calculation of the Portfolio’s NAVs and assisting New York Life Investments in conducting various aspects of the Portfolio’s administrative operations. For providing these services to the Portfolio, State Street is compensated by New York Life Investments.
Pursuant to an agreement between the Fund and New York Life Investments, New York Life Investments is responsible for providing or procuring certain regulatory reporting services for the Portfolio. The Portfolio will reimburse New York Life Investments for the actual costs incurred by New York Life Investments in connection with providing or procuring these services for the Portfolio.
(B) Distribution and Service Fees. The Fund, on behalf of the Portfolio, has entered into a distribution agreement with NYLIFE Distributors LLC (the “Distributor”), an indirect, wholly-owned subsidiary of New York Life. The Portfolio has adopted a distribution plan (the “Plan”) in accordance with the provisions of Rule 12b-1 under the 1940 Act. Under the Plan, the Distributor has agreed to provide, through its affiliates or independent third parties, various distribution-related, shareholder and administrative support services to the Service Class shareholders. For its services, the Distributor is entitled to a combined distribution and service fee accrued daily and paid monthly at an annual rate of 0.25% of the average daily net assets attributable to the Service Class shares of the Portfolio.
(C) Investments in Affiliates (in 000’s). During the six-month period ended June 30, 2020, purchases and sales transactions, income earned from investments and shares held of investment companies managed by New York Life Investments or its affiliates were as follows:
| | | | | | | | | | | | | | | | | | | | | | | | | | | | | | | | | | | | |
Affiliated Investment Company | | Value,
Beginning
of Period | | | Purchases
at Cost | | | Proceeds
from
Sales | | | Net
Realized
Gain/
(Loss)
on Sales | | | Change in
Unrealized
Appreciation/
(Depreciation) | | | Value,
End of
Period | | | Dividend
Income | | | Other
Distributions | | | Shares
End of
Period | |
MainStay U.S. Government Liquidity Fund | | $ | 2,349 | | | $ | 24,111 | | | $ | (26,460 | ) | | $ | — | | | $ | — | | | $ | — | | | $ | 3 | | | $ | — | | | | — | |
Notes to Financial Statements (Unaudited) (continued)
Note 4–Federal Income Tax
As of June 30, 2020, the cost and unrealized appreciation (depreciation) of the Portfolio’s investment portfolio, including applicable derivative contracts and other financial instruments, as determined on a federal income tax basis, was as follows:
| | | | | | | | | | | | | | | | |
| | | Federal Tax
Cost | | | Gross
Unrealized
Appreciation | | | Gross
Unrealized
(Depreciation) | | | Net
Unrealized
Appreciation/
(Depreciation) | |
| | | | |
Investments in Securities | | $ | 737,027,995 | | | $ | 105,431,994 | | | $ | (37,027,745 | ) | | $ | 68,404,249 | |
During the year ended December 31, 2019, the tax character of distributions paid as reflected in the Statements of Changes in Net Assets was as follows:
| | |
|
| 2019 |
Tax-Based
Distributions
from Ordinary
Income | | Tax-Based
Distributions
from Long-Term
Gains |
| |
| $8,888,934 | | $55,538,955 |
Note 5–Custodian
State Street is the custodian of cash and securities held by the Portfolio. Custodial fees are charged to the Portfolio based on the Portfolio’s net assets and/or the market value of securities held by the Portfolio and the number of certain transactions incurred by the Portfolio.
Note 6–Line of Credit
The Portfolio and certain other funds managed by New York Life Investments maintain a line of credit with a syndicate of banks in order to secure a source of funds for temporary purposes to meet unanticipated or excessive redemption requests.
Effective July 28, 2020, under the credit agreement (the “Credit Agreement”), the aggregate commitment amount is $600,000,000 with an additional uncommitted amount of $100,000,000. The commitment fee is an annual rate of 0.15% of the average commitment amount payable quarterly, regardless of usage, to JP Morgan Chase Bank NA, who serves as the agent to the syndicate. The commitment fee is allocated among the Portfolio and certain other funds managed by New York Life Investments based upon their respective net assets and other factors. Interest on any revolving credit loan is charged based upon the Federal Funds Rate or the one-month London Interbank Offered Rate (“LIBOR”), whichever is higher. The Credit Agreement expires on July 27, 2021, although the Portfolio, certain other funds managed by New York Life Investments and the syndicate of banks may renew the Credit Agreement for an additional year on the same or different terms or enter into a credit agreement with a different syndicate of banks. Prior to July 28, 2020, the aggregate commitment amount and the commitment fee were the same as those under the current Credit Agreement, but State Street served as agent to the syndicate. As of June 30, 2020, there were no borrowings made or outstanding with respect to the Portfolio under the Credit Agreement or the credit agreement for which State Street served as agent.
Note 7–Interfund Lending Program
Pursuant to an exemptive order issued by the SEC, the Portfolio, along with certain other funds managed by New York Life Investments, may participate in an interfund lending program. The interfund lending program provides an alternative credit facility that permits the Portfolio and certain other funds managed by New York Life Investments to lend or borrow money for temporary purposes directly to or from one another subject to the conditions of the exemptive order. During the six-month period ended June 30, 2020, there were no interfund loans made or outstanding with respect to the Portfolio.
Note 8–Purchases and Sales of Securities (in 000’s)
During the six-month period ended June 30, 2020, purchases and sales of securities, other than short-term securities, were $785,891 and $787,790, respectively.
Note 9–Capital Share Transactions
Transactions in capital shares for the six-month period ended June 30, 2020 and the year ended December 31, 2019, were as follows:
| | | | | | | | |
Initial Class | | Shares | | | Amount | |
| | |
Six-month period ended June 30, 2020: | | | | | | | | |
Shares sold | | | 343,505 | | | $ | 3,965,989 | |
Shares redeemed | | | (2,683,946 | ) | | | (34,844,048 | ) |
| | | | |
Net increase (decrease) | | | (2,340,441 | ) | | $ | (30,878,059 | ) |
| | | | |
Year ended December 31, 2019: | | | | | | | | |
Shares sold | | | 619,575 | | | $ | 8,402,467 | |
Shares issued to shareholders in reinvestment of distributions | | | 2,337,954 | | | | 29,305,651 | |
Shares redeemed | | | (11,560,001 | ) | | | (155,467,700 | ) |
| | | | |
Net increase (decrease) | | | (8,602,472 | ) | | $ | (117,759,582 | ) |
| | | | |
| | |
| | | | | | | | |
Service Class | | Shares | | | Amount | |
Six-month period ended June 30, 2020: | | | | | | | | |
Shares sold | | | 5,395,595 | | | $ | 58,790,215 | |
Shares redeemed | | | (2,844,962 | ) | | | (32,722,212 | ) |
| | | | |
Net increase (decrease) | | | 2,550,633 | | | $ | 26,068,003 | |
| | | | |
Year ended December 31, 2019: | | | | | | | | |
Shares sold | | | 6,621,506 | | | $ | 87,423,347 | |
Shares issued to shareholders in reinvestment of distributions | | | 2,851,850 | | | | 35,122,238 | |
Shares redeemed | | | (4,406,274 | ) | | | (58,468,237 | ) |
| | | | |
Net increase (decrease) | | | 5,067,082 | | | $ | 64,077,348 | |
| | | | |
Note 10–Litigation
The Portfolio has been named as a defendant in the case entitled Kirschner v. FitzSimons, No. 12-2652 (S.D.N.Y.) (the “FitzSimons action”) as a result of its ownership of shares in the Tribune Company (“Tribune”) in 2007 when Tribune effected a leveraged buyout transaction (“LBO”) by which Tribune converted to a privately-held company. In its complaint, the plaintiff asserts claims against certain insiders, major shareholders, professional advisers, and others involved in the LBO. Separately, the complaint also seeks to obtain from former Tribune shareholders, including the Portfolio, any proceeds they received in
| | |
| 22 | | MainStay VP MacKay Mid Cap Core Portfolio |
connection with the LBO. The sole claim and cause of action brought against the Portfolio is for fraudulent conveyance pursuant to United States Bankruptcy Code Section 548(a)(1)(A).
In June 2011, certain Tribune creditors filed numerous additional actions asserting state law constructive fraudulent conveyance claims (the “SLCFC actions”) against specifically-named former Tribune shareholders and, in some cases, putative defendant classes comprised of former Tribune shareholders. One of the SLCFC actions, entitled Deutsche Bank Trust Co. Americas v. Blackrock Institutional Trust Co., No. 11-9319 (S.D.N.Y.) (the “Deutsche Bank action”), named the Portfolio as a defendant.
The FitzSimons action and Deutsche Bank action have been consolidated with the majority of the other Tribune LBO related lawsuits in a multidistrict litigation proceeding entitled In re Tribune Co. Fraudulent Conveyance Litig., No. 11-md-2296 (S.D.N.Y.) (the “MDL Proceeding”).
On September 23, 2013, the District Court granted the defendants’ motion to dismiss the SLCFC actions, including the Deutsche Bank action, on the basis that the plaintiffs did not have standing to pursue their claims. On September 30, 2013, the plaintiffs in the SLCFC actions filed a notice of appeal to the United States Court of Appeals for the Second Circuit. On October 28, 2013, the defendants filed a joint notice of cross-appeal of that same order. On March 29, 2016, the United States Court of Appeals for the Second Circuit issued its opinion on the appeal of the SLCFC actions. The appeals court affirmed the District Court’s dismissal of those lawsuits, but on different grounds than the District Court. The appeals court held that while the plaintiffs have standing under the U.S. Bankruptcy Code, their claims were preempted by Section 546(e) of the Bankruptcy Code-the statutory safe harbor for settlement payments. On April 12, 2016 the Plaintiffs in the SLCFC actions filed a petition seeking rehearing en banc before the appeals court. On July 22, 2016, the appeals court denied the petition. On September 9, 2016, the plaintiffs filed a petition for writ of certiorari in the U.S. Supreme Court challenging the Second Circuit’s decision that the safe harbor of Section 546(e) applied to their claims. Certain shareholder defendants filed a joint brief in opposition to the petition for certiorari on October 24, 2016. The plaintiffs filed a reply in support of the petition on November 4, 2016. On April 3, 2018, Justice Kennedy and Justice Thomas issued a “Statement” related to the petition for certiorari noting that “there might not be a quorum in [the Supreme Court]” to rule and suggesting that the Second Circuit and/or District Court may want to take steps to reexamine the application of the Section 546(e) safe harbor to the previously dismissed state law constructive fraudulent transfer claims based on the Supreme Court’s decision in Merit Management Group LP v. FTI Consulting, Inc. On April 10, 2018, the plaintiffs filed in the Second Circuit a motion for that court to recall its mandate, vacate its prior decision, and remand to the District Court for further proceedings consistent with Merit Management. On April 20, 2018, the shareholder defendants filed a response to the plaintiffs’ motion to recall the mandate. On May 15, 2018, the Second Circuit issued an order recalling the mandate “in anticipation of further panel review.” On December 19, 2019, the Second Circuit issued an amended opinion that again affirmed the district court’s ruling on the basis that plaintiffs’ claims were preempted by Section 546(e) of the Bankruptcy Code. Plaintiffs filed a motion for rehearing and rehearing en banc on January 2, 2020, which was denied on February 6, 2020. On
July 6, 2020, the plaintiffs filed a new petition for a writ of certiorari in the U.S. Supreme Court. In that petition, the plaintiffs stated that “[t]o make it more likely that there will be a quorum for this petition,” they have “abandon[ed] the case and let the judgment below stand” with respect to certain defendants, including the fund, as issuer of the Portfolio.
On August 2, 2013, the plaintiff in the FitzSimons action filed a Fifth Amended Complaint. On May 23, 2014, the defendants filed motions to dismiss the FitzSimons action, including a global motion to dismiss Count I, which is the claim brought against former Tribune shareholders, for intentional fraudulent conveyance under U.S. federal law.
On January 6, 2017, the United States District Court for the Southern District of New York granted the shareholder defendants’ motion to dismiss the intentional fraudulent conveyance claim in the FitzSimons action. In dismissing the intentional fraudulent conveyance claim, the Court denied the plaintiff’s request to amend the complaint. While the District Court’s dismissal of the intentional fraudulent conveyance claim was not immediately appealable, the Trustee asked the District Court to enter judgment immediately so that an appeal could be taken. On February 23, 2017, the Court issued an order stating that it intended to permit an interlocutory appeal of the dismissal order, but would wait to do so until it has resolved outstanding motions to dismiss filed by other defendants.
On July 18, 2017, the plaintiff submitted a letter to the District Court seeking leave to amend its complaint to add a constructive fraudulent transfer claim. The shareholder defendants opposed that request.
On August 24, 2017, the Court denied the plaintiff’s request without prejudice to renewal of the request in the event of an intervening change in the law. On March 8, 2018, the plaintiff renewed the request for leave to file a motion to amend the complaint to assert a constructive fraudulent transfer claim based on the Supreme Court’s ruling in Merit Management. The shareholder defendants opposed that request. On June 18, 2018, the District Court ordered that the request would be stayed pending further action by the Second Circuit in the still-pending appeal, discussed above. On December 18, 2018, the plaintiff filed a letter with the District Court requesting that the stay be dissolved in order to permit briefing on the motion to amend the complaint and indicating the plaintiff’s intention to file another motion to amend the complaint to reinstate claims for intentional fraudulent transfer. The shareholder defendants opposed that request. On January 14, 2019, the Court held a case management conference, during which the Court stated that it would not lift the stay prior to further action from the Second Circuit. The Court stated that it would allow the plaintiff to file a motion to amend to try to reinstate its intentional fraudulent transfer claim. On January 23, 2019, the Court ordered the parties still facing pending claims to participate in a mediation. On March 27, 2019, the Court held a telephone conference and decided to allow the plaintiff to file a motion for leave to amend. On April 4, 2019, the plaintiff filed a motion to amend the Fifth Amended Complaint to assert a federal constructive fraudulent transfer claim against certain shareholder defendants. On April 10, 2019, the shareholder defendants filed a brief in opposition to the plaintiff’s motion to amend. On April 12, 2019, the plaintiff filed a reply brief. The Court denied leave to amend the complaint on April 23, 2019. On June 13, 2019, the Court entered judgment pursuant to Rule 54(b), which would permit an appeal of the
Notes to Financial Statements (Unaudited) (continued)
Court’s dismissal of the claim against the shareholder defendants. On July 15, 2019, the Trustee filed a notice of appeal to the Second Circuit. Appellant filed his opening brief on January 7, 2020. The shareholder defendants filed an opposition brief on April 27, 2020, and Appellant filed a reply brief on May 18, 2020. On June 22, 2020, the Court scheduled oral argument to occur on August 24, 2020. In addition, the District Court has entered two bar orders in connection with the plaintiff’s settlement with certain non-shareholder defendants. The orders bar claims against the settling defendants, but contain a judgment reduction provision that preserves the value of any potential claim by a shareholder defendant against a settling defendant. Specifically, the judgment reduction provision reduces the amount of money recoverable against a shareholder defendant to the extent the shareholder defendant could have recovered on a claim against a settling defendant.
The value of the proceeds received by the Portfolio in connection with the LBO and the Portfolio’s cost basis in shares of Tribune was as follows:
| | | | | | | | |
Portfolio | | Proceeds | | | Cost Basis | |
MainStay VP MacKay Mid Cap Core Portfolio | | $ | 808,180 | | | $ | 790,269 | |
At this stage of the proceedings, it would be difficult to assess with any reasonable certainty the probable outcome of the pending litigation or the effect, if any, on the Portfolio’s net asset value.
Note 11–Recent Accounting Pronouncement
In March 2020, the Financial Accounting Standards Board (“FASB”) issued Accounting Standards Update 2020-04 (“ASU 2020-04”), which provides optional guidance to ease the potential accounting burden associated with transitioning away from LIBOR and other reference rates
that are expected to be discontinued. ASU 2020-04 is effective immediately upon release of the update on March 12, 2020 through December 31, 2022. At this time, the Manager is evaluating the implications of certain other provisions of ASU 2020-04 related to new disclosure requirements and any impact on the financial statement disclosures has not yet been determined.
Note 12–Subsequent Events
In connection with the preparation of the financial statements of the Portfolio as of and for the six-month period ended June 30, 2020, events and transactions subsequent to June 30, 2020, through the date the financial statements were issued have been evaluated by the Manager, for possible adjustment and/or disclosure. No subsequent events requiring financial statement adjustment or disclosure have been identified.
Note 13–Other Matters
An outbreak of COVID-19, first detected in December 2019, has developed into a global pandemic and has resulted in travel restrictions, closure of international borders, certain businesses and securities markets, restrictions on securities trading activities, prolonged quarantines, supply chain disruptions, and lower consumer demand, as well as general concern and uncertainty. The continued impact of COVID-19 is uncertain and could further adversely affect the global economy, national economies, individual issuers and capital markets in unforeseeable ways and result in a substantial and extended economic downturn. Developments that disrupt global economies and financial markets, such as COVID-19, may magnify factors that affect the Portfolio’s performance.
| | |
| 24 | | MainStay VP MacKay Mid Cap Core Portfolio |
Discussion of the Operation and Effectiveness of the Portfolio’s
Liquidity Risk Management Program (Unaudited)
In compliance with Rule 22e-4 under the Investment Company Act of 1940, as amended (the “Liquidity Rule”), the Portfolio has adopted and implemented a liquidity risk management program (the “Program”), which New York Life Investment Management LLC believes is reasonably designed to assess and manage the Portfolio’s liquidity risk. The Board designated New York Life Investment Management LLC as administrator of the Program (the “Administrator”). The Administrator has established a Liquidity Risk Management Committee to assist the Administrator in the implementation and day-to-day administration of the Program and to otherwise support the Administrator in fulfilling its responsibilities under the Program.
At a meeting of the Board held on March 11, 2020, the Administrator provided the Board with a written report addressing the Program’s operation, adequacy and effectiveness of implementation for the period from December 1, 2018 through December 31, 2019, as required under the Liquidity Rule. The report noted that the Administrator concluded that (i) the Program operated effectively to assess and manage the Portfolio’s liquidity risk, (ii) the Program has been adequately and effectively implemented to monitor and, as applicable, respond to the Portfolio’s liquidity developments and (iii) the Portfolio’s investment strategy continues to be appropriate for an open-end portfolio.
In accordance with the Program, the Portfolio’s liquidity risk is assessed no less frequently than annually taking into consideration certain factors, as applicable, such as (i) investment strategy and liquidity of portfolio investments, (ii) short-term and long-term cash flow projections and (iii) holdings of cash and cash equivalents and borrowing arrangements and other funding sources. Certain factors are considered under both normal and reasonably foreseeable stressed conditions.
Each Portfolio portfolio investment is classified into one of four liquidity categories. The classification is based on a determination of the number of days it is reasonably expected to take to convert the investment into cash, or sell or dispose of the investment, in current market conditions without significantly changing the market value of the investment. The Administrator has delegated liquidity classification determinations to the Portfolio’s subadvisor, subject to appropriate oversight by the Administrator, and classification determinations are made by taking into account the Portfolio’s reasonably anticipated trade size, various market, trading and investment-specific considerations, as well as market depth, and, in certain cases, third-party vendor data.
The Liquidity Rule requires portfolios that do not primarily hold assets that are highly liquid investments to adopt a minimum amount of net assets that must be invested in highly liquid investments that are assets (an “HLIM”). In addition, the Liquidity Rule limits a portfolio’s investments in illiquid investments. Specifically, the Liquidity Rule prohibits acquisition of illiquid investments if doing so would result in a portfolio holding more than 15% of its net assets in illiquid investments that are assets. The Program includes provisions reasonably designed to determine, periodically review and comply with the HLIM requirement, as applicable, and to comply with the 15% limit on illiquid investments.
Proxy Voting Policies and Procedures and Proxy Voting Record
A description of the policies and procedures that New York Life Investments uses to vote proxies related to the Portfolio’s securities is available free of charge upon request (i) by calling 800-598-2019; (ii) by visiting New York Life Investments’ website at https://www.nylinvestments.com/mainstay/products-and-performance/mainstay-vp-funds-trust; or (iii) by visiting the SEC’s website at www.sec.gov.
The Portfolio is required to file with the SEC its proxy voting record for the 12-month period ending June 30 on Form N-PX. The Portfolio’s most recent Form N-PX or proxy voting record is available free of charge upon request (i) by calling 800-598-2019; (ii) by visiting New York Life Investments’ website at https://www.nylinvestments.com/mainstay/products-and-performance/mainstay-vp-funds-trust; or (iii) by visiting the SEC’s website at www.sec.gov.
Shareholder Reports and Quarterly Portfolio Disclosure
The Portfolio is required to file its complete schedule of portfolio holdings with the SEC 60 days after its first and third fiscal quarter on Form N-PORT. The Portfolio’s holdings report is available free of charge upon request by calling 800-598-2019 or by visiting the SEC’s website at www.sec.gov.
| | |
| 26 | | MainStay VP MacKay Mid Cap Core Portfolio |
MainStay VP Portfolios
MainStay VP offers a wide range of Portfolios. The full array of MainStay VP offerings is listed here, with information about the manager, subadvisors, legal counsel, and independent registered public accounting firm.
Equity Portfolios
MainStay VP Emerging Markets Equity Portfolio
MainStay VP Epoch U.S. Equity Yield Portfolio
MainStay VP Fidelity Institutional AM® Utilities Portfolio†
MainStay VP MacKay Common Stock Portfolio
MainStay VP MacKay Growth Portfolio
MainStay VP MacKay International Equity Portfolio
MainStay VP MacKay Mid Cap Core Portfolio
MainStay VP MacKay S&P 500 Index Portfolio
MainStay VP MacKay Small Cap Core Portfolio
MainStay VP Mellon Natural Resources Portfolio
MainStay VP Small Cap Growth Portfolio
MainStay VP T. Rowe Price Equity Income Portfolio
MainStay VP Winslow Large Cap Growth Portfolio
Mixed Asset Portfolios
MainStay VP Balanced Portfolio
MainStay VP Income Builder Portfolio
MainStay VP Janus Henderson Balanced Portfolio
MainStay VP MacKay Convertible Portfolio
Income Portfolios
MainStay VP Bond Portfolio
MainStay VP Floating Rate Portfolio
MainStay VP Indexed Bond Portfolio
MainStay VP MacKay Government Portfolio
MainStay VP MacKay High Yield Corporate Bond Portfolio
MainStay VP MacKay Unconstrained Bond Portfolio
MainStay VP PIMCO Real Return Portfolio
Money Market
MainStay VP U.S. Government Money Market Portfolio
Alternative
MainStay VP CBRE Global Infrastructure Portfolio
MainStay VP IQ Hedge Multi-Strategy Portfolio
Asset Allocation Portfolios
MainStay VP Conservative Allocation Portfolio
MainStay VP Growth Allocation Portfolio
MainStay VP Moderate Allocation Portfolio
MainStay VP Moderate Growth Allocation Portfolio
Manager
New York Life Investment Management LLC
New York, New York
Subadvisors
Brown Advisory LLC
Baltimore, Maryland
Candriam Belgium S.A.*
Brussels, Belgium
CBRE Clarion Securities LLC
Radnor, Pennsylvania
Epoch Investment Partners, Inc.
New York, New York
FIAM LLC
Smithfield, Rhode Island
IndexIQ Advisors LLC*
New York, New York
Janus Capital Management LLC
Denver, Colorado
MacKay Shields LLC*
New York, New York
Mellon Investments Corporation
Boston, Massachusetts
NYL Investors LLC*
New York, New York
Pacific Investment Management Company LLC
Newport Beach, California
Segall Bryant & Hamill, LLC
Chicago, Illinois
T. Rowe Price Associates, Inc.
Baltimore, Maryland
Winslow Capital Management, LLC
Minneapolis, Minnesota
Distributor
NYLIFE Distributors LLC*
Jersey City, New Jersey
Custodian
State Street Bank and Trust Company
Boston, Massachusetts
Independent Registered Public Accounting Firm
PricewaterhouseCoopers LLP
New York, New York
Legal Counsel
Dechert LLP
Washington, District of Columbia
Some Portfolios may not be available in all products.
| † | Fidelity Institutional AM is a registered trade mark of FMR LLC. Used with permission. |
| * | An affiliate of New York Life Investment Management LLC |
Not part of the Semiannual Report
2020 Semiannual Report
This report is for the general information of New York Life Variable Annuities and NYLIAC Variable Universal Life Insurance Products policyowners. It must be preceded or accompanied by the appropriate product(s) and funds prospectuses if it is given to anyone who is not an owner of a New York Life variable annuity policy or a NYLIAC Variable Universal Life Insurance Product. This report does not offer for sale or solicit orders to purchase securities.
The performance data quoted in this report represents past performance. Past performance is no guarantee of future results. Due to market volatility and other factors, current performance may be lower or higher than the figures shown. The most recent month-end performance summary for your variable annuity or variable life policy is available by calling 800-598-2019 and is updated periodically on www.newyorklife.com.
The New York Life Variable Annuities and NYLIAC Variable Universal Life Insurance Products are issued by New York Life Insurance and Annuity Corporation (a Delaware Corporation) and distributed by NYLIFE Distributors LLC (Member FINRA/SIPC).
New York Life Insurance Company
New York Life Insurance and Annuity Corporation (NYLIAC) (A Delaware Corporation)
51 Madison Avenue, Room 551
New York, NY 10010
www.newyorklife.com
Printed on recycled paper
nylinvestments.com
NYLIFE Distributors LLC, 30 Hudson Street, Jersey City, NJ 07302
New York Life Investment Management LLC is the investment manager to the MainStay VP Funds Trust
©2020 by NYLIFE Distributors LLC. All rights reserved.
You may obtain copies of the Prospectus and the Statement of Additional Information free of charge, upon request, by calling toll-free 800-598-2019 or writing to New York Life Insurance and Annuity Corporation, 51 Madison Avenue, New York, NY 10010.
| | | | |
| Not FDIC Insured | | No Bank Guarantee | | May Lose Value |
| | | | |
| 1781635 | | | | MSVPMCC10-08/20 (NYLIAC) NI527 |
MainStay VP MacKay Small Cap Core Portfolio
Message from the President and Semiannual Report
Unaudited | June 30, 2020
Beginning on January 1, 2021, as permitted by regulations adopted by the Securities and Exchange Commission, paper copies of the MainStay VP Portfolio annual and semi-annual shareholder reports may no longer be sent by mail, unless you specifically request paper copies of the reports from the insurance company that offers your policy. Instead, the reports will be made available online, and you will be notified by mail each time a report is posted and provided with a website link to access the report. Instructions for requesting paper copies will be provided by your insurance company.
If you already elected to receive shareholder reports electronically, you will not be affected by this change and you need not take any action. At any time, you may elect to receive reports and other communications from the insurance company electronically by following the instructions provided by the insurance company.
You may elect to receive all future shareholder reports in paper form free of charge. You can inform the insurance company that you wish to receive paper copies of reports by following the instructions provided by the insurance company. Your election to receive reports in paper form will apply to all portfolio companies available under your contract.
| | | | | | | | |
| Not FDIC/NCUA Insured | | Not a Deposit | | May Lose Value | | No Bank Guarantee | | Not Insured by Any Government Agency |

This page intentionally left blank
Message from the President
High levels of volatility shook financial markets in response to the COVID-19 pandemic and an abrupt decline in global economic activity during the six months ended June 30, 2020.
Markets entered 2020 riding strong fourth quarter performance and an economic expansion of historic longevity. Most broad stock and bond indices began to dip in late February as growing numbers of COVID-19 cases were seen in hotspots around the world. On March 11, 2020, the World Health Organization acknowledged that the disease had reached pandemic proportions, with over 80,000 identified cases in China, thousands in Italy, South Korea and the United States, and more in dozens of additional countries. Governments and central banks pledged trillions of dollars to address the mounting economic and public health crisis; however, “stay-at-home” orders and other restrictions on non-essential activity caused global economic activity to slow. Most stocks and bonds lost significant ground in this challenging environment, with equities declining by roughly a third and the yield on high-yield credit indices shooting higher.
Policymakers responded with extraordinary speed to address the situation. In the United States, the Federal Reserve (“Fed”) cut interest rates to near zero and announced unlimited quantitative easing. With help from Treasury, the Fed later rolled out a series of lending facilities to directly support market functioning. In late March, the Federal government declared a national emergency; Congress passed, and the President signed, a $2 trillion CARES Act (The Coronavirus Aid, Relief, and Economic Security Act), with the promise of further assistance for consumers and businesses to come. This enormous wave of policy support helped fuel a rapid recovery in market pricing as stocks bounced back and credit spreads narrowed. Some states rushed to ease restrictions on travel and social gatherings, further fueling optimism that the effects of the pandemic might prove short lived. However, the final weeks of the reporting period saw infection rates beginning to rise in some of the first states to reopen, raising concerns that a second round of restrictive government policies might prove necessary, once again stifling economic activity.
Despite all the market volatility, the broadly based S&P 500® Index finished the first half of 2020 only slightly below its starting point and the technology-heavy NASDAQ Composite Index posted gains, closing in near record territory. Small-cap stocks tended to trail their large cap counterparts, as illustrated by the Russell 2000® Index’s loss of approximately 15%, while value-oriented stocks lagged growth-oriented issues. From a global perspective, U.S. stocks generally outperformed international equities, with emerging markets hit particularly hard by the flight from risk.
Fixed-income markets also experienced unusually high levels of volatility. Recognized safe havens, such as U.S. government bonds, attracted increased investment, driving yields lower and prices higher, positioning long-term Treasury bonds to deliver particularly strong gains. Investment-grade corporate bonds lost value in March before recovering in the closing months of the reporting period, while relatively speculative high-yield credit faced the brunt of risk-off sentiment. Emerging market debt underperformed most other bonds types as investors sought to minimize currency and sovereign risks.
Today, as we at New York Life Investments continue to track the ongoing health crisis and its financial ramifications, we are particularly mindful of the people at the heart of our enterprise—our colleagues and valued clients. By taking appropriate steps to minimize community spread of COVID-19 within our organization, we strive to safeguard the health of our investment professionals so they can continue to provide you, as a MainStay investor, with world class investment solutions in this rapidly evolving environment.
Sincerely,

Kirk C. Lehneis
President
The opinions expressed are as of the date of this report and are subject to change. There is no guarantee that any forecast made will come to pass. This material does not constitute investment advice and is not intended as an endorsement of any specific investment. Past performance is no guarantee of future results.
Not part of the Semiannual Report
Table of Contents
Investors should refer to the Portfolio’s Summary Prospectus and/or Prospectus and consider the Portfolio’s investment objectives, strategies, risks, charges and expenses carefully before investing. The Summary Prospectus and/or Prospectus contain this and other information about the Portfolio. You may obtain copies of the Portfolio’s Summary Prospectus and/or the Prospectus and the Statement of Additional Information free of charge, upon request, by calling toll-free 800-598-2019, by writing to New York Life Insurance and Annuity Corporation, 51 Madison Avenue, Room 251, New York, New York 10010 or by sending an email to MainStayShareholdersServices@nylim.com. These documents are also available at nylinvestments.com/vpdocuments. Please read the Summary Prospectus and/or Prospectus carefully before investing. MainStay VP Funds Trust portfolios are separate account options which are purchased through a variable insurance or variable annuity contract.
Investment and Performance Comparison1 (Unaudited)
Performance data quoted represents past performance. Past performance is no guarantee of future results. Because of market volatility and other factors, current performance may be lower or higher than the figures shown. Investment return and principal value will fluctuate, and as a result, when shares are redeemed, they may be worth more or less than their original cost. The performance table and graph do not reflect any deduction of sales charges, mortality and expense charges, contract charges or administrative charges. Please refer to the Performance Summary appropriate for your policy. For performance information current to the most recent month-end, please call 800-598-2019 or visit www.newyorklife.com.
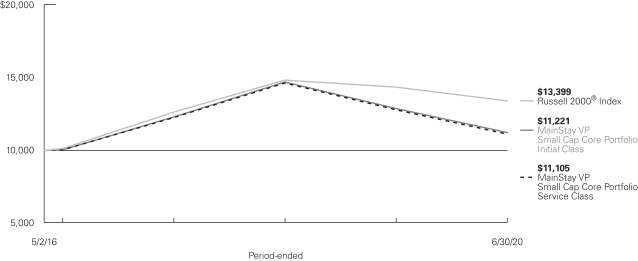
Average Annual Total Returns for the Period-Ended June 30, 2020
| | | | | | | | | | |
| Class | | Inception Date | | Six Months | | One Year | | Since
Inception | | Gross
Expense
Ratio2 |
| | | | | |
| Initial Class Shares | | 5/2/2016 | | –17.35% | | –12.87% | | 2.80% | | 0.85% |
| Service Class Shares | | 5/2/2016 | | –17.45 | | –13.09 | | 2.55 | | 1.10 |
| | | | | | | | | | | | |
| Benchmark Performance | | Six
Months | | | One Year | | | Since
Inception | |
| | | |
Russell 2000® Index3 | | | –12.98 | % | | | –6.63 | % | | | 7.28 | % |
Morningstar Small Blend Category Average4 | | | –16.88 | | | | –11.41 | | | | 4.09 | |
| 1. | Performance figures may reflect certain fee waivers and/or expense limitations, without which total returns may have been different. For information on current fee waivers and/or expense limitations (if any), please refer to the Notes to Financial Statements. |
| 2. | The gross expense ratios presented reflect the Portfolio’s “Total Annual Portfolio Operating Expenses” from the most recent Prospectus, as supplemented, and may differ from other expense ratios disclosed in this report. |
| 3. | The Russell 2000® Index is the Portfolio’s primary broad-based securities market index for comparison purposes. The Russell 2000® Index measures the performance of the small-cap segment of the U.S. equity universe. It is a subset of the Russell 3000® Index and includes approximately 2,000 of the |
| | smallest securities based on a combination of their market cap and current index membership. Results assume reinvestment of all dividends and capital gains. An investment cannot be made directly in an index. |
| 4. | The Morningstar Small Blend Category Average is representative of funds that favor U.S. firms at the smaller end of the market-capitalization range. Some aim to own an array of value and growth stocks while others employ a discipline that leads to holdings with valuations and growth rates close to the small-cap averages. Stocks in the bottom 10% of the capitalization of the U.S. equity market are defined as small cap. The blend style is assigned to funds where neither growth nor value characteristics predominate. Results are based on average total returns of similar funds with all dividends and capital gain distributions reinvested. |
Cost in Dollars of a $1,000 Investment in MainStay VP MacKay Small Cap Core Portfolio (Unaudited)
The example below is intended to describe the fees and expenses borne by shareholders during the six-month period from January 1, 2020, to June 30, 2020, and the impact of those costs on your investment.
Example
As a shareholder of the Portfolio you incur two types of costs: (1) transaction costs, including exchange fees and sales charges (loads) on purchases (as applicable), and (2) ongoing costs, including management fees, distribution and/or service (12b-1) fees, and other Portfolio expenses (as applicable). This example is intended to help you understand your ongoing costs (in dollars) of investing in the Portfolio and to compare these costs with the ongoing costs of investing in other mutual funds. The example is based on an investment of $1,000 made at the beginning of the six-month period and held for the entire period from January 1, 2020, to June 30, 2020. Shares are only sold in connection with variable life and annuity contracts and the example does not reflect any contract level or transactional fees or expenses. If these costs had been included, your costs would have been higher.
This example illustrates your Portfolio’s ongoing costs in two ways:
Actual Expenses
The second and third data columns in the table below provide information about actual account values and actual expenses. You may use the information in these columns, together with the amount you invested, to estimate the expenses that you paid during the six months
ended June 30, 2020. Simply divide your account value by $1,000 (for example, an $8,600 account value divided by $1,000 = 8.6), then multiply the result by the number under the heading entitled “Expenses Paid During Period” to estimate the expenses you paid on your account during this period.
Hypothetical Example for Comparison Purposes
The fourth and fifth data columns in the table below provide information about hypothetical account values and hypothetical expenses based on the Portfolio’s actual expense ratio and an assumed rate of return of 5% per year before expenses, which is not the Portfolio’s actual return. The hypothetical account values and expenses may not be used to estimate the actual ending account balances or expenses you paid for the six-month period shown. You may use this information to compare the ongoing costs of investing in the Portfolio with the ongoing costs of investing in other mutual funds. To do so, compare this 5% hypothetical example with the 5% hypothetical examples that appear in the shareholder reports of the other mutual funds.
Please note that the expenses shown in the table are meant to highlight your ongoing costs only and do not reflect any transactional costs, such as exchange fees or sales charges (loads). Therefore, the fourth and fifth data columns of the table are useful in comparing ongoing costs only and will not help you determine the relative total costs of owning different funds. In addition, if these transactional costs were included, your costs would have been higher.
| | | | | | | | | | | | | | | | | | | | | | |
| Share Class | | Beginning
Account
Value
1/1/20 | | | Ending Account
Value (Based
on Actual
Returns and
Expenses)
6/30/20 | | | Expenses
Paid
During
Period1 | | | Ending Account
Value (Based
on Hypothetical
5% Annualized
Return and
Actual Expenses)
6/30/20 | | | Expenses
Paid
During
Period1 | | | Net Expense
Ratio
During
Period2 |
| | | | | | |
| Initial Class Shares | | $ | 1,000.00 | | | $ | 826.50 | | | $ | 3.41 | | | $ | 1,021.13 | | | $ | 3.77 | | | 0.75% |
| | | | | | |
| Service Class Shares | | $ | 1,000.00 | | | $ | 825.50 | | | $ | 4.54 | | | $ | 1,019.89 | | | $ | 5.02 | | | 1.00% |
| 1 | Expenses are equal to the Portfolio’s annualized expense ratio of each class multiplied by the average account value over the period, divided by 366 and multiplied by 182 (to reflect the six-month period). The table above represents the actual expenses incurred during the six-month period. In addition to the fees and expenses which the Portfolio bears directly, it also indirectly bears a pro rata share of the fees and expenses of the underlying funds in which it invests. Such indirect expenses are not included in the above-reported expense figures. |
| 2 | Expenses are equal to the Portfolio’s annualized expense ratio to reflect the six-month period. |
| | |
| 6 | | MainStay VP MacKay Small Cap Core Portfolio |
Industry Composition as of June 30, 2020 (Unaudited)
| | | | |
| |
| Biotechnology | | | 10.5 | % |
| |
| Banks | | | 7.1 | |
| |
| Software | | | 5.7 | |
| |
| Equity Real Estate Investment Trusts | | | 5.4 | |
| |
| Health Care Equipment & Supplies | | | 4.6 | |
| |
| Semiconductors & Semiconductor Equipment | | | 4.5 | |
| |
| Pharmaceuticals | | | 3.2 | |
| |
| Specialty Retail | | | 3.2 | |
| |
| Machinery | | | 3.1 | |
| |
| Health Care Providers & Services | | | 2.6 | |
| |
| Household Durables | | | 2.6 | |
| |
| IT Services | | | 2.5 | |
| |
| Thrifts & Mortgage Finance | | | 2.3 | |
| |
| Electrical Equipment | | | 2.0 | |
| |
| Oil, Gas & Consumable Fuels | | | 2.0 | |
| |
| Capital Markets | | | 1.9 | |
| |
| Hotels, Restaurants & Leisure | | | 1.9 | |
| |
| Building Products | | | 1.8 | |
| |
| Commercial Services & Supplies | | | 1.8 | |
| |
| Electronic Equipment, Instruments & Components | | | 1.8 | |
| |
| Chemicals | | | 1.7 | |
| |
| Exchange-Traded Fund | | | 1.6 | |
| |
| Professional Services | | | 1.4 | |
| |
| Water Utilities | | | 1.4 | |
| |
| Construction & Engineering | | | 1.2 | |
| |
| Health Care Technology | | | 1.2 | |
| |
| Insurance | | | 1.1 | |
| |
| Internet & Direct Marketing Retail | | | 1.1 | |
| |
| Trading Companies & Distributors | | | 1.1 | |
| |
| Diversified Consumer Services | | | 1.0 | |
| |
| Leisure Products | | | 1.0 | |
| |
| Metals & Mining | | | 1.0 | |
| |
| Beverages | | | 0.9 | |
| | | | |
| |
| Communications Equipment | | | 0.9 | |
| |
| Personal Products | | | 0.9 | |
| |
| Auto Components | | | 0.8 | |
| |
| Diversified Telecommunication Services | | | 0.8 | |
| |
| Food & Staples Retailing | | | 0.8 | |
| |
| Life Sciences Tools & Services | | | 0.8 | |
| |
| Consumer Finance | | | 0.7 | |
| |
| Textiles, Apparel & Luxury Goods | | | 0.7 | |
| |
| Tobacco | | | 0.7 | |
| |
| Mortgage Real Estate Investment Trusts | | | 0.6 | |
| |
| Aerospace & Defense | | | 0.5 | |
| |
| Automobiles | | | 0.4 | |
| |
| Electric Utilities | | | 0.4 | |
| |
| Energy Equipment & Services | | | 0.4 | |
| |
| Entertainment | | | 0.4 | |
| |
| Food Products | | | 0.4 | |
| |
| Household Products | | | 0.4 | |
| |
| Independent Power & Renewable Electricity Producers | | | 0.4 | |
| |
| Interactive Media & Services | | | 0.4 | |
| |
| Multiline Retail | | | 0.4 | |
| |
| Road & Rail | | | 0.4 | |
| |
| Air Freight & Logistics | | | 0.3 | |
| |
| Media | | | 0.3 | |
| |
| Real Estate Management & Development | | | 0.3 | |
| |
| Airlines | | | 0.2 | |
| |
| Diversified Financial Services | | | 0.2 | |
| |
| Paper & Forest Products | | | 0.2 | |
| |
| Technology Hardware, Storage & Peripherals | | | 0.2 | |
| |
| Distributors | | | 0.0 | ‡ |
| |
| Real Estate | | | 0.0 | ‡ |
| |
| Short-Term Investment | | | 2.8 | |
| |
| Other Assets, Less Liabilities | | | -2.9 | |
| | | | |
| |
| | | 100.0 | % |
| | | | |
See Portfolio of Investments beginning on page 9 for specific holdings within these categories. The Portfolio’s holdings are subject to change.
| ‡ | Less than one-tenth of a percent. |
Top Ten Holdings as of June 30, 2020 (excluding short-term investment) (Unaudited)
| 1. | iShares Russell 2000 ETF |
| 4. | Green Dot Corp., Class A |
Portfolio Management Discussion and Analysis (Unaudited)
Answers to the questions reflect the views of portfolio managers Migene Kim, CFA, and Mona Patni of MacKay Shields LLC, the Portfolio’s Subadvisor.
How did MainStay VP MacKay Small Cap Core Portfolio perform relative to its benchmark and peers during the six months ended June 30, 2020?
For the six months ended June 30, 2020, MainStay VP MacKay Small Cap Core Portfolio returned –17.35% for Initial Class shares and –17.45% for Service Class shares. Over the same period, both share classes underperformed the –12.98% return of the Russell 2000® Index, which is the Portfolio’s benchmark, and the –16.88% return of the Morningstar Small Blend Category Average.1
What factors affected the Portfolio’s relative performance during the reporting period?
Stock selection was the primary driver of the Portfolio’s underperformance relative to the Russell 2000® Index during the reporting period. Risk rotations occurred frequently in the first half of 2020, with rapid shifts from risk-off to risk-on sentiment and back again. As investors become fixated on macroeconomic themes, they did not appear to pay attention to company fundamentals. As a result, the Portfolio’s valuation signals, which seek to evaluate companies across sales- and cash-based measures on a peer-relative basis, were not rewarded. The Portfolio’s momentum and sentiment measures produced positive results during the reporting period, but these were not strong enough to offset the underperformance of value.
Which sectors were the strongest positive contributors to the Portfolio’s relative performance, and which sectors were particularly weak?
During the reporting period, the strongest positive contributions to the Portfolio’s performance relative to the Russell 2000® Index came from the consumer staples, financials and utilities sectors. (Contributions take weightings and total returns into account.) During the same period, the most significant detractors from benchmark-relative performance were the industrials, health care and real estate sectors.
During the reporting period, which individual stocks made the strongest positive contributions to the Portfolio’s absolute performance and which stocks detracted the most?
The stocks that made the most substantial positive contributions to the Portfolio’s absolute performance during the reporting period included health care supplies provider Quidel, general merchandise retailer Big Lots and biotechnology developer Immunomedics. The stocks that detracted the most from the Portfolio’s absolute performance during the reporting period included casinos & gaming company Everi Holdings, real estate services provider Newmark Group and thrifts & mortgage finance firm Radian Group.
Did the Portfolio make any significant purchases or sales during the reporting period?
During the reporting period, the Portfolio’s largest initial purchase was in Quidel, mentioned above, while the largest increased position size was in financial and banking services provider Green Dot. During the same period, the most substantial position that the Portfolio exited completely was in financial software company ACI Worldwide, while the largest decreased position size was in natural food ingredient producer Darling Ingredients.
How did the Portfolio’s sector weightings change during the reporting period?
During the reporting period, the Portfolio’s largest sector weighting increases relative to the Russell 2000® Index were in health care and communication services. Conversely, the Portfolio’s largest decreases in benchmark-relative sector exposure were in consumer staples and financials.
How was the Portfolio positioned at the end of the reporting period?
As of June 30, 2020, the Portfolio held its most overweight exposure relative to the Russell 2000® Index in the health care and technology sectors. As of the same date, the Portfolio’s most significantly underweight exposures were in the financials and utilities sectors.
| 1. | See page 5 for more information on benchmark and peer group returns. |
The opinions expressed are those of the portfolio managers as of the date of this report and are subject to change. There is no guarantee that any forecasts will come to pass. This material does not constitute investment advice and is not intended as an endorsement of any specific investment.
Not all MainStay VP Portfolios and/or share classes are available under all policies.
| | |
| 8 | | MainStay VP MacKay Small Cap Core Portfolio |
Portfolio of Investments June 30, 2020 (Unaudited)
| | | | | | | | |
| | |
| | | Shares | | | Value | |
| Common Stocks 98.4%† | |
Aerospace & Defense 0.5% | |
AAR Corp. | | | 700 | | | $ | 14,469 | |
Axon Enterprise, Inc. (a) | | | 9,900 | | | | 971,487 | |
Maxar Technologies, Inc. (a) | | | 5,700 | | | | 102,372 | |
Mercury Systems, Inc. (a) | | | 1,800 | | | | 141,588 | |
Vectrus, Inc. (a) | | | 20,000 | | | | 982,600 | |
| | | | | | | | |
| | | | | | | 2,212,516 | |
| | | | | | | | |
Air Freight & Logistics 0.3% | |
Hub Group, Inc., Class A (a) | | | 28,700 | | | | 1,373,582 | |
| | | | | | | | |
Airlines 0.2% | |
Allegiant Travel Co. | | | 900 | | | | 98,289 | |
Hawaiian Holdings, Inc. | | | 900 | | | | 12,636 | |
SkyWest, Inc. | | | 16,300 | | | | 531,706 | |
Spirit Airlines, Inc. (a)(b) | | | 6,800 | | | | 121,040 | |
| | | | | | | | |
| | | | | | | 763,671 | |
| | | | | | | | |
Auto Components 0.8% | |
Adient PLC (a) | | | 85,600 | | | | 1,405,552 | |
American Axle & Manufacturing Holdings, Inc. (a) | | | 117,400 | | | | 892,240 | |
Dana, Inc. | | | 78,000 | | | | 950,820 | |
Modine Manufacturing Co. (a) | | | 28,200 | | | | 155,664 | |
| | | | | | | | |
| | | | | | | 3,404,276 | |
| | | | | | | | |
Automobiles 0.4% | |
Winnebago Industries, Inc. | | | 26,600 | | | | 1,772,092 | |
| | | | | | | | |
Banks 7.1% | |
1st Source Corp. | | | 3,000 | | | | 106,740 | |
Amalgamated Bank, Class A | | | 37,800 | | | | 477,792 | |
Ameris Bancorp | | | 3,000 | | | | 70,770 | |
Atlantic Capital Bancshares, Inc. (a) | | | 10,100 | | | | 122,816 | |
Atlantic Union Bankshares Corp. | | | 600 | | | | 13,896 | |
Bancorp, Inc. (a) | | | 101,100 | | | | 990,780 | |
BancorpSouth Bank | | | 4,600 | | | | 104,604 | |
Bank of Commerce Holdings | | | 1,100 | | | | 8,338 | |
Bank of N.T. Butterfield & Son, Ltd. | | | 17,100 | | | | 417,069 | |
Bank7 Corp. | | | 1,200 | | | | 13,026 | |
BankUnited, Inc. | | | 21,900 | | | | 443,475 | |
Bankwell Financial Group, Inc. | | | 900 | | | | 14,310 | |
Banner Corp. | | | 8,700 | | | | 330,600 | |
BCB Bancorp, Inc. | | | 13,200 | | | | 122,496 | |
Boston Private Financial Holdings, Inc. | | | 63,600 | | | | 437,568 | |
Bridge Bancorp, Inc. | | | 34,690 | | | | 792,319 | |
Cadence Bancorp | | | 122,200 | | | | 1,082,692 | |
Cathay General Bancorp | | | 24,200 | | | | 636,460 | |
Central Pacific Financial Corp. | | | 23,400 | | | | 375,102 | |
Century Bancorp, Inc., Class A | | | 5,900 | | | | 458,548 | |
CIT Group, Inc. | | | 4,600 | | | | 95,358 | |
Civista Bancshares, Inc. | | | 14,400 | | | | 221,760 | |
Columbia Banking System, Inc. | | | 1,200 | | | | 34,014 | |
Community Bank System, Inc. | | | 4,800 | | | | 273,696 | |
ConnectOne Bancorp, Inc. | | | 50,900 | | | | 820,508 | |
| | | | | | | | |
| | |
| | | Shares | | | Value | |
Banks (continued) | |
Customers Bancorp, Inc. (a) | | | 71,800 | | | $ | 863,036 | |
CVB Financial Corp. | | | 8,400 | | | | 157,416 | |
Dime Community Bancshares, Inc. | | | 28,800 | | | | 395,424 | |
Eagle Bancorp, Inc. | | | 18,300 | | | | 599,325 | |
Enterprise Financial Services Corp. | | | 400 | | | | 12,448 | |
Esquire Financial Holdings, Inc. (a) | | | 6,400 | | | | 108,160 | |
Farmers National Banc Corp. | | | 23,500 | | | | 278,710 | |
Financial Institutions, Inc. | | | 30,800 | | | | 573,188 | |
First BanCorp | | | 8,400 | | | | 46,956 | |
First Bank | | | 1,900 | | | | 12,388 | |
First Business Financial Services, Inc. | | | 19,800 | | | | 325,710 | |
First Choice Bancorp | | | 2,800 | | | | 45,864 | |
First Financial Bancorp | | | 4,400 | | | | 61,116 | |
First Financial Bankshares, Inc. | | | 15,600 | | | | 450,684 | |
First Financial Northwest, Inc. | | | 13,900 | | | | 134,691 | |
First Foundation, Inc. | | | 62,500 | | | | 1,021,250 | |
First Guaranty Bancshares, Inc. | | | 1,100 | | | | 13,453 | |
First Internet Bancorp | | | 30,500 | | | | 506,910 | |
First Merchants Corp. | | | 26,200 | | | | 722,334 | |
First Midwest Bancorp, Inc. | | | 10,600 | | | | 141,510 | |
First Northwest Bancorp | | | 15,700 | | | | 194,994 | |
First of Long Island Corp. | | | 27,800 | | | | 454,252 | |
Flushing Financial Corp. | | | 61,700 | | | | 710,784 | |
Glacier Bancorp, Inc. | | | 11,300 | | | | 398,777 | |
Great Southern Bancorp, Inc. | | | 12,000 | | | | 484,320 | |
Great Western Bancorp, Inc. | | | 3,200 | | | | 44,032 | |
Hancock Whitney Corp. | | | 2,300 | | | | 48,760 | |
Home BancShares, Inc. | | | 8,300 | | | | 127,654 | |
Hope Bancorp, Inc. | | | 67,800 | | | | 625,116 | |
Horizon Bancorp, Inc. | | | 7,500 | | | | 80,175 | |
Independent Bank Corp. | | | 8,000 | | | | 207,608 | |
International Bancshares Corp. | | | 14,100 | | | | 451,482 | |
Investar Holding Corp. | | | 300 | | | | 4,350 | |
Investors Bancorp, Inc. | | | 145,700 | | | | 1,238,450 | |
Lakeland Bancorp, Inc. | | | 74,000 | | | | 845,820 | |
LCNB Corp. | | | 1,700 | | | | 27,132 | |
Macatawa Bank Corp. | | | 5,100 | | | | 39,882 | |
MainStreet Bancshares, Inc. (a) | | | 1,400 | | | | 18,480 | |
Mercantile Bank Corp. | | | 11,000 | | | | 248,600 | |
Metropolitan Bank Holding Corp. (a) | | | 24,900 | | | | 798,792 | |
MidWestOne Financial Group, Inc. | | | 13,700 | | | | 274,000 | |
MVB Financial Corp. | | | 1,200 | | | | 15,960 | |
OceanFirst Financial Corp. | | | 33,500 | | | | 590,605 | |
OFG Bancorp | | | 1,100 | | | | 14,707 | |
Old National Bancorp | | | 9,500 | | | | 130,720 | |
Orrstown Financial Services, Inc. | | | 12,700 | | | | 187,325 | |
Pacific Premier Bancorp, Inc. | | | 1,000 | | | | 21,680 | |
PCB Bancorp | | | 4,900 | | | | 50,470 | |
Peapack-Gladstone Financial Corp. | | | 24,700 | | | | 462,631 | |
Preferred Bank / Los Angeles CA | | | 18,200 | | | | 779,870 | |
QCR Holdings, Inc. | | | 8,600 | | | | 268,148 | |
| | | | | | |
The notes to the financial statements are an integral part of,
and should be read in conjunction with, the financial statements. | | | | | 9 | |
Portfolio of Investments June 30, 2020 (Unaudited) (continued)
| | | | | | | | |
| | |
| | | Shares | | | Value | |
| Common Stocks (continued) | |
Banks (continued) | |
RBB Bancorp | | | 17,300 | | | $ | 236,145 | |
Republic Bancorp, Inc., Class A | | | 10,000 | | | | 327,100 | |
Sierra Bancorp | �� | | 400 | | | | 7,552 | |
Simmons First National Corp., Class A | | | 800 | | | | 13,688 | |
SmartFinancial, Inc. | | | 11,600 | | | | 187,688 | |
South Plains Financial, Inc. | | | 13,800 | | | | 196,512 | |
South State Corp. | | | 200 | | | | 9,532 | |
Southern National Bancorp of Virginia, Inc. | | | 21,200 | | | | 205,428 | |
Stock Yards Bancorp, Inc. | | | 600 | | | | 24,120 | |
Stonex Group, Inc. | | | 21,000 | | | | 1,155,000 | |
TriState Capital Holdings, Inc. (a) | | | 11,300 | | | | 177,523 | |
UMB Financial Corp. | | | 2,500 | | | | 128,875 | |
United Bankshares, Inc. | | | 14,100 | | | | 390,006 | |
United Community Banks, Inc. | | | 20,200 | | | | 406,424 | |
Valley National Bancorp | | | 40,900 | | | | 319,838 | |
WesBanco, Inc. | | | 41,700 | | | | 846,927 | |
West Bancorp., Inc. | | | 13,200 | | | | 230,868 | |
| | | | | | | | |
| | | | | | | 29,644,112 | |
| | | | | | | | |
Beverages 0.9% | |
Boston Beer Co., Inc., Class A (a) | | | 2,900 | | | | 1,556,285 | |
Coca-Cola Consolidated, Inc. | | | 6,200 | | | | 1,420,978 | |
Primo Water Corp. | | | 43,700 | | | | 600,875 | |
| | | | | | | | |
| | | | | | | 3,578,138 | |
| | | | | | | | |
Biotechnology 10.5% | |
ACADIA Pharmaceuticals, Inc. (a) | | | 10,700 | | | | 518,629 | |
Acceleron Pharma, Inc. (a) | | | 4,600 | | | | 438,242 | |
Adverum Biotechnologies, Inc. (a) | | | 18,600 | | | | 388,368 | |
Allakos, Inc. (a)(b) | | | 8,800 | | | | 632,368 | |
Amicus Therapeutics, Inc. (a) | | | 99,340 | | | | 1,498,047 | |
Apellis Pharmaceuticals, Inc. (a) | | | 26,700 | | | | 872,022 | |
Arena Pharmaceuticals, Inc. (a) | | | 19,783 | | | | 1,245,340 | |
Arrowhead Pharmaceuticals, Inc. (a) | | | 31,400 | | | | 1,356,166 | |
Atara Biotherapeutics, Inc. (a) | | | 47,100 | | | | 686,247 | |
Biohaven Pharmaceutical Holding Co., Ltd. (a) | | | 18,600 | | | | 1,359,846 | |
Blueprint Medicines Corp. (a) | | | 17,100 | | | | 1,333,800 | |
Bridgebio Pharma, Inc. (a)(b) | | | 25,700 | | | | 838,077 | |
ChemoCentryx, Inc. (a) | | | 17,300 | | | | 995,442 | |
Deciphera Pharmaceuticals, Inc. (a) | | | 11,400 | | | | 680,808 | |
Editas Medicine, Inc. (a) | | | 36,000 | | | | 1,064,880 | |
Emergent BioSolutions, Inc. (a) | | | 13,592 | | | | 1,074,855 | |
Enanta Pharmaceuticals, Inc. (a) | | | 9,200 | | | | 461,932 | |
Epizyme, Inc. (a) | | | 41,000 | | | | 658,460 | |
Fate Therapeutics, Inc. (a) | | | 26,900 | | | | 922,939 | |
FibroGen, Inc. (a) | | | 33,919 | | | | 1,374,737 | |
Global Blood Therapeutics, Inc. (a) | | | 6,400 | | | | 404,032 | |
Halozyme Therapeutics, Inc. (a) | | | 55,800 | | | | 1,495,998 | |
Heron Therapeutics, Inc. (a) | | | 53,000 | | | | 779,630 | |
Immunomedics, Inc. (a) | | | 19,300 | | | | 683,992 | |
Inovio Pharmaceuticals, Inc. (a)(b) | | | 35,900 | | | | 967,505 | |
Insmed, Inc. (a) | | | 45,590 | | | | 1,255,549 | |
| | | | | | | | |
| | |
| | | Shares | | | Value | |
Biotechnology (continued) | |
Intercept Pharmaceuticals, Inc. (a) | | | 14,400 | | | $ | 689,904 | |
Invitae Corp. (a)(b) | | | 51,800 | | | | 1,569,022 | |
Iovance Biotherapeutics, Inc. (a) | | | 11,700 | | | | 321,165 | |
Ironwood Pharmaceuticals, Inc. (a) | | | 60,252 | | | | 621,801 | |
Kodiak Sciences, Inc. (a) | | | 11,700 | | | | 633,204 | |
Ligand Pharmaceuticals, Inc. (a) | | | 6,327 | | | | 707,675 | |
Madrigal Pharmaceuticals, Inc. (a) | | | 5,900 | | | | 668,175 | |
Mirati Therapeutics, Inc. (a) | | | 12,400 | | | | 1,415,708 | |
Momenta Pharmaceuticals, Inc. (a) | | | 38,169 | | | | 1,269,883 | |
Myriad Genetics, Inc. (a) | | | 34,810 | | | | 394,745 | |
Natera, Inc. (a) | | | 22,500 | | | | 1,121,850 | |
Novavax, Inc. (a) | | | 13,000 | | | | 1,083,550 | |
Portola Pharmaceuticals, Inc. (a) | | | 50,942 | | | | 916,446 | |
Prothena Corp. PLC (a) | | | 42,007 | | | | 439,393 | |
PTC Therapeutics, Inc. (a) | | | 22,700 | | | | 1,151,798 | |
Radius Health, Inc. (a) | | | 35,633 | | | | 485,678 | |
REGENXBIO, Inc. (a) | | | 22,500 | | | | 828,675 | |
Retrophin, Inc. (a) | | | 40,100 | | | | 818,441 | |
Sangamo Therapeutics, Inc. (a) | | | 71,700 | | | | 642,432 | |
TG Therapeutics, Inc. (a) | | | 28,700 | | | | 559,076 | |
Turning Point Therapeutics, Inc. (a) | | | 12,100 | | | | 781,539 | |
Ultragenyx Pharmaceutical, Inc. (a) | | | 21,044 | | | | 1,646,062 | |
Vanda Pharmaceuticals, Inc. (a) | | | 38,900 | | | | 445,016 | |
Xencor, Inc. (a) | | | 23,731 | | | | 768,647 | |
| | | | | | | | |
| | | | | | | 43,967,796 | |
| | | | | | | | |
Building Products 1.8% | |
American Woodmark Corp. (a) | | | 1,700 | | | | 128,605 | |
Apogee Enterprises, Inc. | | | 13,300 | | | | 306,432 | |
Builders FirstSource, Inc. (a) | | | 78,600 | | | | 1,627,020 | |
Insteel Industries, Inc. | | | 13,100 | | | | 249,817 | |
JELD-WEN Holding, Inc. (a) | | | 23,100 | | | | 372,141 | |
Masonite International Corp. (a) | | | 17,800 | | | | 1,384,484 | |
Patrick Industries, Inc. | | | 9,900 | | | | 606,375 | |
Simpson Manufacturing Co., Inc. | | | 7,900 | | | | 666,444 | |
Trex Co., Inc. (a) | | | 2,900 | | | | 377,203 | |
UFP Industries, Inc. | | | 39,900 | | | | 1,975,449 | |
| | | | | | | | |
| | | | | | | 7,693,970 | |
| | | | | | | | |
Capital Markets 1.9% | |
Ares Management Corp., Class A | | | 6,800 | | | | 269,960 | |
Artisan Partners Asset Management, Inc., Class A | | | 52,700 | | | | 1,712,750 | |
Blucora, Inc. (a) | | | 1,000 | | | | 11,420 | |
Brightsphere Investment Group, Inc. (a) | | | 143,400 | | | | 1,786,764 | |
Federated Hermes, Inc. | | | 73,400 | | | | 1,739,580 | |
GAIN Capital Holdings, Inc. | | | 31,800 | | | | 191,436 | |
GAMCO Investors, Inc., Class A | | | 4,700 | | | | 62,557 | |
Oppenheimer Holdings, Inc., Class A | | | 600 | | | | 13,074 | |
Stifel Financial Corp. | | | 21,600 | | | | 1,024,488 | |
Virtus Investment Partners, Inc. | | | 2,700 | | | | 313,983 | |
Waddell & Reed Financial, Inc., Class A | | | 64,600 | | | | 1,001,946 | |
| | | | | | | | |
| | | | | | | 8,127,958 | |
| | | | | | | | |
| | | | |
| 10 | | MainStay VP MacKay Small Cap Core Portfolio | | The notes to the financial statements are an integral part of,
and should be read in conjunction with, the financial statements. |
| | | | | | | | |
| | |
| | | Shares | | | Value | |
| Common Stocks (continued) | |
Chemicals 1.7% | |
Advanced Emissions Solutions, Inc. | | | 30,400 | | | $ | 147,440 | |
AdvanSix, Inc. (a) | | | 30,800 | | | | 361,592 | |
Balchem Corp. | | | 600 | | | | 56,916 | |
Hawkins, Inc. | | | 1,800 | | | | 76,644 | |
Ingevity Corp. (a) | | | 1,900 | | | | 99,883 | |
Innospec, Inc. | | | 1,700 | | | | 131,325 | |
Koppers Holdings, Inc. (a) | | | 15,000 | | | | 282,600 | |
Kraton Corp. (a) | | | 38,400 | | | | 663,552 | |
Minerals Technologies, Inc. | | | 1,200 | | | | 56,316 | |
Orion Engineered Carbons S.A. | | | 98,800 | | | | 1,046,292 | |
PolyOne Corp. | | | 66,300 | | | | 1,739,049 | |
Stepan Co. | | | 17,700 | | | | 1,718,670 | |
Trecora Resources (a) | | | 7,600 | | | | 47,652 | |
Tredegar Corp. | | | 31,700 | | | | 488,180 | |
| | | | | | | | |
| | | | | | | 6,916,111 | |
| | | | | | | | |
Commercial Services & Supplies 1.8% | |
ACCO Brands Corp. | | | 8,100 | | | | 57,510 | |
Brink’s Co. | | | 11,900 | | | | 541,569 | |
Deluxe Corp. | | | 5,300 | | | | 124,762 | |
Harsco Corp. (a) | | | 5,000 | | | | 67,550 | |
Herman Miller, Inc. | | | 52,900 | | | | 1,248,969 | |
HNI Corp. | | | 51,800 | | | | 1,583,526 | |
Interface, Inc. | | | 88,700 | | | | 722,018 | |
KAR Auction Services, Inc. | | | 19,800 | | | | 272,448 | |
Kimball International, Inc., Class B | | | 45,400 | | | | 524,824 | |
Knoll, Inc. | | | 13,600 | | | | 165,784 | |
Matthews International Corp., Class A | | | 2,800 | | | | 53,480 | |
McGrath RentCorp. | | | 25,300 | | | | 1,366,453 | |
Steelcase, Inc., Class A | | | 56,200 | | | | 677,772 | |
| | | | | | | | |
| | | | | | | 7,406,665 | |
| | | | | | | | |
Communications Equipment 0.9% | |
ADTRAN, Inc. | | | 300 | | | | 3,279 | |
Calix, Inc. (a) | | | 12,600 | | | | 187,740 | |
Comtech Telecommunications Corp. | | | 13,400 | | | | 226,326 | |
Extreme Networks, Inc. (a) | | | 69,800 | | | | 302,932 | |
Genasys, Inc. (a) | | | 30,500 | | | | 148,230 | |
Infinera Corp. (a) | | | 11,900 | | | | 70,448 | |
Inseego Corp. (a)(b) | | | 2,800 | | | | 32,480 | |
InterDigital, Inc. | | | 5,200 | | | | 294,476 | |
Lumentum Holdings, Inc. (a) | | | 5,100 | | | | 415,293 | |
NetScout Systems, Inc. (a) | | | 18,400 | | | | 470,304 | |
PCTEL, Inc. (a) | | | 18,600 | | | | 124,248 | |
Ribbon Communications, Inc. (a) | | | 242,100 | | | | 951,453 | |
Viavi Solutions, Inc. (a) | | | 42,300 | | | | 538,902 | |
| | | | | | | | |
| | | | | | | 3,766,111 | |
| | | | | | | | |
Construction & Engineering 1.2% | |
Comfort Systems USA, Inc. | | | 39,600 | | | | 1,613,700 | |
EMCOR Group, Inc. | | | 29,800 | | | | 1,970,972 | |
| | | | | | | | |
| | |
| | | Shares | | | Value | |
Construction & Engineering (continued) | |
Granite Construction, Inc. | | | 2,800 | | | $ | 53,592 | |
IES Holdings, Inc. (a) | | | 13,400 | | | | 310,478 | |
MasTec, Inc. (a) | | | 100 | | | | 4,487 | |
MYR Group, Inc. (a) | | | 17,400 | | | | 555,234 | |
Primoris Services Corp. | | | 7,800 | | | | 138,528 | |
Sterling Construction Co., Inc. (a) | | | 6,800 | | | | 71,196 | |
Tutor Perini Corp. (a) | | | 21,200 | | | | 258,216 | |
| | | | | | | | |
| | | | | | | 4,976,403 | |
| | | | | | | | |
Consumer Finance 0.7% | |
Curo Group Holdings Corp. | | | 47,300 | | | | 386,441 | |
Enova International, Inc. (a) | | | 23,700 | | | | 352,419 | |
Green Dot Corp., Class A (a) | | | 43,800 | | | | 2,149,704 | |
| | | | | | | | |
| | | | | | | 2,888,564 | |
| | | | | | | | |
Distributors 0.0% ‡ | |
Core-Mark Holding Co., Inc. | | | 2,000 | | | | 49,910 | |
Weyco Group, Inc. | | | 1,100 | | | | 23,749 | |
| | | | | | | | |
| | | | | | | 73,659 | |
| | | | | | | | |
Diversified Consumer Services 1.0% | |
American Public Education, Inc. (a) | | | 13,200 | | | | 390,720 | |
Carriage Services, Inc. | | | 17,100 | | | | 309,852 | |
Chegg, Inc. (a) | | | 7,000 | | | | 470,820 | |
Collectors Universe, Inc. | | | 20,700 | | | | 709,596 | |
Laureate Education, Inc., Class A (a) | | | 7,200 | | | | 71,748 | |
Perdoceo Education Corp. (a) | | | 91,400 | | | | 1,456,002 | |
Select Interior Concepts, Inc., Class A (a) | | | 11,400 | | | | 39,900 | |
Universal Technical Institute, Inc. (a) | | | 71,800 | | | | 499,010 | |
WW International, Inc. (a) | | | 16,600 | | | | 421,308 | |
| | | | | | | | |
| | | | | | | 4,368,956 | |
| | | | | | | | |
Diversified Financial Services 0.2% | |
A-Mark Precious Metals, Inc. (a) | | | 2,800 | | | | 53,340 | |
Alerus Financial Corp. | | | 3,600 | | | | 71,136 | |
Cannae Holdings, Inc. (a) | | | 12,200 | | | | 501,420 | |
| | | | | | | | |
| | | | | | | 625,896 | |
| | | | | | | | |
Diversified Telecommunication Services 0.8% | |
Alaska Communications Systems Group, Inc. | | | 10,700 | | | | 29,853 | |
ATN International, Inc. | | | 3,000 | | | | 181,710 | |
Bandwidth, Inc., Class A (a) | | | 500 | | | | 63,500 | |
Cincinnati Bell, Inc. (a) | | | 96,300 | | | | 1,430,055 | |
Cogent Communications Holdings, Inc. | | | 7,600 | | | | 587,936 | |
Consolidated Communications Holdings, Inc. (a) | | | 18,300 | | | | 123,891 | |
IDT Corp., Class B (a) | | | 116,800 | | | | 762,704 | |
Ooma, Inc. (a) | | | 10,200 | | | | 168,096 | |
| | | | | | | | |
| | | | | | | 3,347,745 | |
| | | | | | | | |
Electric Utilities 0.4% | |
Portland General Electric Co. | | | 38,000 | | | | 1,588,780 | |
Spark Energy, Inc., Class A | | | 2,000 | | | | 14,140 | |
| | | | | | | | |
| | | | | | | 1,602,920 | |
| | | | | | | | |
| | | | | | |
The notes to the financial statements are an integral part of,
and should be read in conjunction with, the financial statements. | | | | | 11 | |
Portfolio of Investments June 30, 2020 (Unaudited) (continued)
| | | | | | | | |
| | |
| | | Shares | | | Value | |
| Common Stocks (continued) | |
Electrical Equipment 2.0% | |
Allied Motion Technologies, Inc. | | | 6,200 | | | $ | 218,860 | |
Atkore International Group, Inc. (a) | | | 54,700 | | | | 1,496,045 | |
AZZ, Inc. | | | 42,800 | | | | 1,468,896 | |
Encore Wire Corp. | | | 28,900 | | | | 1,410,898 | |
Generac Holdings, Inc. (a) | | | 11,200 | | | | 1,365,616 | |
LSI Industries, Inc. | | | 45,300 | | | | 293,091 | |
Orion Energy Systems, Inc. (a) | | | 47,100 | | | | 162,966 | |
Powell Industries, Inc. | | | 35,900 | | | | 983,301 | |
Preformed Line Products Co. | | | 2,600 | | | | 130,026 | |
TPI Composites, Inc. (a) | | | 29,500 | | | | 689,415 | |
| | | | | | | | |
| | | | | | | 8,219,114 | |
| | | | | | | | |
Electronic Equipment, Instruments & Components 1.8% | |
Bel Fuse, Inc., Class B | | | 3,900 | | | | 41,847 | |
Benchmark Electronics, Inc. | | | 14,800 | | | | 319,680 | |
II-VI, Inc. (a) | | | 18,100 | | | | 854,682 | |
Itron, Inc. (a) | | | 1,800 | | | | 119,250 | |
Kimball Electronics, Inc. (a) | | | 75,700 | | | | 1,024,978 | |
Luna Innovations, Inc. (a) | | | 23,000 | | | | 134,320 | |
MTS Systems Corp. | | | 34,800 | | | | 612,132 | |
OSI Systems, Inc. (a) | | | 2,100 | | | | 156,744 | |
Plexus Corp. (a) | | | 18,700 | | | | 1,319,472 | |
Sanmina Corp. (a) | | | 57,674 | | | | 1,444,157 | |
ScanSource, Inc. (a) | | | 31,700 | | | | 763,653 | |
Vishay Intertechnology, Inc. | | | 30,800 | | | | 470,316 | |
Vishay Precision Group, Inc. (a) | | | 9,700 | | | | 238,426 | |
| | | | | | | | |
| | | | | | | 7,499,657 | |
| | | | | | | | |
Energy Equipment & Services 0.4% | |
Dril-Quip, Inc. (a) | | | 1,400 | | | | 41,706 | |
Exterran Corp. (a) | | | 34,400 | | | | 185,416 | |
Matrix Service Co. (a) | | | 30,900 | | | | 300,348 | |
NexTier Oilfield Solutions, Inc. (a) | | | 182,100 | | | | 446,145 | |
Oceaneering International, Inc. (a) | | | 2,600 | | | | 16,614 | |
ProPetro Holding Corp. (a) | | | 139,400 | | | | 716,516 | |
| | | | | | | | |
| | | | | | | 1,706,745 | |
| | | | | | | | |
Entertainment 0.4% | |
Cinemark Holdings, Inc. | | | 20,600 | | | | 237,930 | |
Glu Mobile, Inc. (a) | | | 161,200 | | | | 1,494,324 | |
IMAX Corp. (a) | | | 4,600 | | | | 51,566 | |
Marcus Corp. | | | 800 | | | | 10,616 | |
| | | | | | | | |
| | | | | | | 1,794,436 | |
| | | | | | | | |
Equity Real Estate Investment Trusts 5.4% | |
Acadia Realty Trust | | | 5,100 | | | | 66,198 | |
Agree Realty Corp. | | | 11,000 | | | | 722,810 | |
Alexander’s, Inc. | | | 300 | | | | 72,270 | |
Alpine Income Property Trust, Inc. | | | 8,100 | | | | 131,706 | |
American Finance Trust, Inc. | | | 3,100 | | | | 24,599 | |
CareTrust REIT, Inc. | | | 18,100 | | | | 310,596 | |
Community Healthcare Trust, Inc. | | | 13,500 | | | | 552,150 | |
| | | | | | | | |
| | |
| | | Shares | | | Value | |
Equity Real Estate Investment Trusts (continued) | |
Diversified Healthcare Trust | | | 3,200 | | | $ | 14,160 | |
EastGroup Properties, Inc. | | | 7,000 | | | | 830,270 | |
Essential Properties Realty Trust, Inc. | | | 4,200 | | | | 62,328 | |
First Industrial Realty Trust, Inc. | | | 25,200 | | | | 968,688 | |
Four Corners Property Trust, Inc. | | | 41,200 | | | | 1,005,280 | |
Front Yard Residential Corp. | | | 56,300 | | | | 489,810 | |
GEO Group, Inc. | | | 74,627 | | | | 882,837 | |
Gladstone Land Corp. | | | 13,300 | | | | 210,938 | |
Global Medical REIT, Inc. | | | 900 | | | | 10,197 | |
Healthcare Realty Trust, Inc. | | | 13,900 | | | | 407,131 | |
Hersha Hospitality Trust | | | 7,300 | | | | 42,048 | |
Industrial Logistics Properties Trust | | | 45,400 | | | | 932,970 | |
Kite Realty Group Trust | | | 2,500 | | | | 28,850 | |
Lexington Realty Trust | | | 119,400 | | | | 1,259,670 | |
LTC Properties, Inc. | | | 11,600 | | | | 436,972 | |
Monmouth Real Estate Investment Corp. | | | 64,800 | | | | 938,952 | |
National Health Investors, Inc. | | | 18,600 | | | | 1,129,392 | |
National Storage Affiliates Trust | | | 5,500 | | | | 157,630 | |
Pebblebrook Hotel Trust | | | 7,200 | | | | 98,352 | |
Physicians Realty Trust | | | 34,200 | | | | 599,184 | |
Piedmont Office Realty Trust, Inc., Class A | | | 58,800 | | | | 976,668 | |
Plymouth Industrial REIT, Inc. | | | 27,800 | | | | 355,840 | |
PotlatchDeltic Corp. | | | 31,700 | | | | 1,205,551 | |
PS Business Parks, Inc. | | | 6,100 | | | | 807,640 | |
QTS Realty Trust, Inc., Class A | | | 13,700 | | | | 878,033 | |
Retail Opportunity Investments Corp. | | | 4,700 | | | | 53,251 | |
Retail Properties of America, Inc., Class A | | | 80,700 | | | | 590,724 | |
Rexford Industrial Realty, Inc. | | | 21,200 | | | | 878,316 | |
Ryman Hospitality Properties, Inc. | | | 5,500 | | | | 190,300 | |
Sabra Health Care REIT, Inc. | | | 53,300 | | | | 769,119 | |
Seritage Growth Properties, Class A (a) | | | 700 | | | | 7,980 | |
Service Properties Trust | | | 35,300 | | | | 250,277 | |
STAG Industrial, Inc. | | | 12,800 | | | | 375,296 | |
Sunstone Hotel Investors, Inc. | | | 68,600 | | | | 559,090 | |
Tanger Factory Outlet Centers, Inc. (b) | | | 2,300 | | | | 16,399 | |
Terreno Realty Corp. | | | 21,500 | | | | 1,131,760 | |
Universal Health Realty Income Trust | | | 3,100 | | | | 246,419 | |
Urban Edge Properties | | | 41,900 | | | | 497,353 | |
Urstadt Biddle Properties, Inc., Class A | | | 15,500 | | | | 184,140 | |
Xenia Hotels & Resorts, Inc. | | | 4,200 | | | | 39,186 | |
| | | | | | | | |
| | | | | | | 22,399,330 | |
| | | | | | | | |
Food & Staples Retailing 0.8% | |
BJ’s Wholesale Club Holdings, Inc. (a) | | | 26,200 | | | | 976,474 | |
Ingles Markets, Inc., Class A | | | 2,900 | | | | 124,903 | |
Performance Food Group Co. (a) | | | 16,000 | | | | 466,240 | |
Rite Aid Corp. (a)(b) | | | 7,200 | | | | 122,832 | |
SpartanNash Co. | | | 69,600 | | | | 1,479,000 | |
United Natural Foods, Inc. (a) | | | 13,300 | | | | 242,193 | |
Weis Markets, Inc. | | | 300 | | | | 15,036 | |
| | | | | | | | |
| | | | | | | 3,426,678 | |
| | | | | | | | |
| | | | |
| 12 | | MainStay VP MacKay Small Cap Core Portfolio | | The notes to the financial statements are an integral part of,
and should be read in conjunction with, the financial statements. |
| | | | | | | | |
| | |
| | | Shares | | | Value | |
| Common Stocks (continued) | |
Food Products 0.4% | |
Darling Ingredients, Inc. (a) | | | 7,200 | | | $ | 177,264 | |
Freshpet, Inc. (a) | | | 800 | | | | 66,928 | |
John B. Sanfilippo & Son, Inc. | | | 7,200 | | | | 614,376 | |
Sanderson Farms, Inc. | | | 1,000 | | | | 115,890 | |
Seneca Foods Corp., Class A (a) | | | 19,200 | | | | 649,152 | |
| | | | | | | | |
| | | | | | | 1,623,610 | |
| | | | | | | | |
Health Care Equipment & Supplies 4.6% | |
AtriCure, Inc. (a) | | | 10,700 | | | | 480,965 | |
Chembio Diagnostics, Inc. (a) | | | 32,100 | | | | 104,325 | |
CONMED Corp. | | | 22,700 | | | | 1,634,173 | |
Cutera, Inc. (a) | | | 8,600 | | | | 104,662 | |
FONAR Corp. (a) | | | 5,300 | | | | 113,261 | |
GenMark Diagnostics, Inc. (a) | | | 23,800 | | | | 350,098 | |
Glaukos Corp. (a) | | | 3,400 | | | | 130,628 | |
Haemonetics Corp. (a) | | | 12,400 | | | | 1,110,544 | |
Integer Holdings Corp. (a) | | | 22,200 | | | | 1,621,710 | |
Irhythm Technologies, Inc. (a) | | | 500 | | | | 57,945 | |
Lantheus Holdings, Inc. (a) | | | 67,200 | | | | 960,960 | |
Meridian Bioscience, Inc. (a) | | | 39,500 | | | | 919,955 | |
Natus Medical, Inc. (a) | | | 37,300 | | | | 813,886 | |
Neogen Corp. (a) | | | 16,500 | | | | 1,280,400 | |
Nevro Corp. (a) | | | 1,900 | | | | 226,993 | |
Novocure, Ltd. (a) | | | 6,700 | | | | 397,310 | |
NuVasive, Inc. (a) | | | 31,700 | | | | 1,764,422 | |
OraSure Technologies, Inc. (a) | | | 89,700 | | | | 1,043,211 | |
Orthofix Medical, Inc. (a) | | | 29,000 | | | | 928,000 | |
Quidel Corp. (a) | | | 10,100 | | | | 2,259,774 | |
Repro-Med Systems, Inc. (a) | | | 58,200 | | | | 522,636 | |
RTI Surgical Holdings, Inc. (a) | | | 25,100 | | | | 79,818 | |
STAAR Surgical Co. (a) | | | 2,400 | | | | 147,696 | |
Stereotaxis, Inc. (a) | | | 500 | | | | 2,230 | |
Vapotherm, Inc. (a) | | | 15,300 | | | | 627,147 | |
Varex Imaging Corp. (a) | | | 30,100 | | | | 456,015 | |
Zynex, Inc. (a)(b) | | | 38,300 | | | | 952,521 | |
| | | | | | | | |
| | | | | | | 19,091,285 | |
| | | | | | | | |
Health Care Providers & Services 2.6% | |
Amedisys, Inc. (a) | | | 9,100 | | | | 1,806,714 | |
AMN Healthcare Services, Inc. (a) | | | 2,800 | | | | 126,672 | |
Brookdale Senior Living, Inc. (a) | | | 24,400 | | | | 71,980 | |
Corvel Corp. (a) | | | 11,100 | | | | 786,879 | |
Ensign Group, Inc. | | | 8,300 | | | | 347,355 | |
HealthEquity, Inc. (a) | | | 15,700 | | | | 921,119 | |
InfuSystem Holdings, Inc. (a) | | | 19,800 | | | | 228,492 | |
Magellan Health, Inc. (a) | | | 11,000 | | | | 802,780 | |
National Healthcare Corp. | | | 16,100 | | | | 1,021,384 | |
Owens & Minor, Inc. | | | 136,800 | | | | 1,042,416 | |
Providence Service Corp. (a) | | | 2,300 | | | | 181,493 | |
Select Medical Holdings Corp. (a) | | | 92,600 | | | | 1,363,998 | |
Sharps Compliance Corp. (a) | | | 17,200 | | | | 120,916 | |
| | | | | | | | |
| | |
| | | Shares | | | Value | |
Health Care Providers & Services (continued) | |
Tenet Healthcare Corp. (a) | | | 44,900 | | | $ | 813,139 | |
Triple-S Management Corp., Class B (a) | | | 5,300 | | | | 100,806 | |
Viemed Healthcare, Inc. (a) | | | 103,700 | | | | 995,520 | |
| | | | | | | | |
| | | | | | | 10,731,663 | |
| | | | | | | | |
Health Care Technology 1.2% | |
Computer Programs & Systems, Inc. | | | 12,900 | | | | 293,991 | |
HealthStream, Inc. (a) | | | 34,800 | | | | 770,124 | |
HMS Holdings Corp. (a) | | | 37,400 | | | | 1,211,386 | |
NextGen Healthcare, Inc. (a) | | | 12,800 | | | | 140,544 | |
Omnicell, Inc. (a) | | | 13,000 | | | | 918,060 | |
Phreesia, Inc. (a) | | | 15,700 | | | | 443,996 | |
Tabula Rasa Healthcare, Inc. (a)(b) | | | 2,600 | | | | 142,298 | |
Teladoc Health, Inc. (a) | | | 5,200 | | | | 992,368 | |
| | | | | | | | |
| | | | | | | 4,912,767 | |
| | | | | | | | |
Hotels, Restaurants & Leisure 1.9% | |
Bloomin’ Brands, Inc. | | | 8,600 | | | | 91,676 | |
Bluegreen Vacations Corp. | | | 9,100 | | | | 49,322 | |
Boyd Gaming Corp. | | | 14,500 | | | | 303,050 | |
Brinker International, Inc. | | | 26,500 | | | | 636,000 | |
Churchill Downs, Inc. | | | 1,900 | | | | 252,985 | |
Cracker Barrel Old Country Store, Inc. | | | 1,500 | | | | 166,365 | |
Dave & Buster’s Entertainment, Inc. (b) | | | 1,400 | | | | 18,662 | |
Del Taco Restaurants, Inc. (a) | | | 65,800 | | | | 390,194 | |
Denny’s Corp. (a) | | | 25,900 | | | | 261,590 | |
Dine Brands Global, Inc. | | | 400 | | | | 16,840 | |
Eldorado Resorts, Inc. (a) | | | 3,900 | | | | 156,234 | |
Hilton Grand Vacations, Inc. (a) | | | 13,000 | | | | 254,150 | |
Marriott Vacations Worldwide Corp. | | | 2,100 | | | | 172,641 | |
Papa John’s International, Inc. | | | 11,200 | | | | 889,392 | |
Penn National Gaming, Inc. (a)(b) | | | 21,400 | | | | 653,556 | |
RCI Hospitality Holdings, Inc. | | | 79,000 | | | | 1,094,940 | |
Red Rock Resorts, Inc., Class A | | | 67,900 | | | | 740,789 | |
Ruth’s Hospitality Group, Inc. | | | 10,200 | | | | 83,232 | |
Scientific Games Corp., Class A (a) | | | 1,600 | | | | 24,736 | |
SeaWorld Entertainment, Inc. (a) | | | 1,400 | | | | 20,734 | |
Texas Roadhouse, Inc. | | | 16,500 | | | | 867,405 | |
Twin River Worldwide Holdings, Inc. | | | 19,600 | | | | 436,884 | |
Wingstop, Inc. | | | 3,300 | | | | 458,601 | |
| | | | | | | | |
| | | | | | | 8,039,978 | |
| | | | | | | | |
Household Durables 2.6% | |
Beazer Homes USA, Inc. (a) | | | 126,100 | | | | 1,269,827 | |
Cavco Industries, Inc. (a) | | | 5,600 | | | | 1,079,960 | |
Green Brick Partners, Inc. (a) | | | 57,200 | | | | 677,820 | |
Hamilton Beach Brands Holding Co., Class A | | | 5,900 | | | | 70,210 | |
Helen of Troy, Ltd. (a) | | | 500 | | | | 94,280 | |
Hooker Furniture Corp. | | | 6,100 | | | | 118,645 | |
Installed Building Products, Inc. (a) | | | 8,000 | | | | 550,240 | |
KB Home | | | 43,400 | | | | 1,331,512 | |
La-Z-Boy, Inc. | | | 19,300 | | | | 522,258 | |
| | | | | | |
The notes to the financial statements are an integral part of,
and should be read in conjunction with, the financial statements. | | | | | 13 | |
Portfolio of Investments June 30, 2020 (Unaudited) (continued)
| | | | | | | | |
| | |
| | | Shares | | | Value | |
| Common Stocks (continued) | |
Household Durables (continued) | | | | | | | | |
M/I Homes, Inc. (a) | | | 19,800 | | | $ | 681,912 | |
Meritage Homes Corp. (a) | | | 25,600 | | | | 1,948,672 | |
Purple Innovation, Inc. (a) | | | 25,200 | | | | 453,600 | |
TopBuild Corp. (a) | | | 2,900 | | | | 329,933 | |
TRI Pointe Group, Inc. (a) | | | 115,800 | | | | 1,701,102 | |
Universal Electronics, Inc. (a) | | | 1,200 | | | | 56,184 | |
VOXX International Corp. (a) | | | 12,600 | | | | 72,828 | |
| | | | | | | | |
| | | | | | | 10,958,983 | |
| | | | | | | | |
Household Products 0.4% | |
Central Garden & Pet Co., Class A (a) | | | 47,000 | | | | 1,588,130 | |
Oil-Dri Corp. of America | | | 2,000 | | | | 69,400 | |
| | | | | | | | |
| | | | | | | 1,657,530 | |
| | | | | | | | |
Independent Power & Renewable Electricity Producers 0.4% | |
Clearway Energy, Inc. | |
Class A | | | 44,000 | | | | 922,680 | |
Class C | | | 9,000 | | | | 207,540 | |
Ormat Technologies, Inc. | | | 10,600 | | | | 672,994 | |
| | | | | | | | |
| | | | | | | 1,803,214 | |
| | | | | | | | |
Insurance 1.1% | |
American Equity Investment Life Holding Co. | | | 5,500 | | | | 135,905 | |
Argo Group International Holdings, Ltd. | | | 2,600 | | | | 90,558 | |
CNO Financial Group, Inc. | | | 85,500 | | | | 1,331,235 | |
Crawford & Co., Class A | | | 20,100 | | | | 158,589 | |
eHealth, Inc. (a) | | | 1,400 | | | | 137,536 | |
Employers Holdings, Inc. | | | 23,300 | | | | 702,495 | |
Enstar Group, Ltd. (a) | | | 200 | | | | 30,554 | |
FedNat Holding Co. | | | 24,400 | | | | 270,108 | |
Fidelity National Financial, Inc. | | | 3,824 | | | | 117,244 | |
Global Indemnity, Ltd. | | | 1,200 | | | | 28,728 | |
Hallmark Financial Services, Inc. (a) | | | 47,400 | | | | 165,426 | |
ProAssurance Corp. | | | 2,700 | | | | 39,069 | |
Stewart Information Services Corp. | | | 43,000 | | | | 1,397,930 | |
| | | | | | | | |
| | | | | | | 4,605,377 | |
| | | | | | | | |
Interactive Media & Services 0.4% | |
Cargurus, Inc. (a) | | | 16,800 | | | | 425,880 | |
DHI Group, Inc. (a) | | | 105,700 | | | | 221,970 | |
Eventbrite, Inc., Class A (a) | | | 1,200 | | | | 10,284 | |
Travelzoo (a) | | | 17,600 | | | | 99,264 | |
Yelp, Inc. (a) | | | 42,500 | | | | 983,025 | |
| | | | | | | | |
| | | | | | | 1,740,423 | |
| | | | | | | | |
Internet & Direct Marketing Retail 1.1% | |
1-800-Flowers.com, Inc., Class A (a) | | | 61,800 | | | | 1,237,236 | |
Groupon, Inc. (a) | | | 505 | | | | 9,151 | |
PetMed Express, Inc. (b) | | | 39,900 | | | | 1,422,036 | |
Realreal, Inc. (The) (a) | | | 2,800 | | | | 35,812 | |
Stamps.com, Inc. (a) | | | 10,800 | | | | 1,983,852 | |
U.S. Auto Parts Network, Inc. (a) | | | 2,000 | | | | 17,320 | |
| | | | | | | | |
| | | | | | | 4,705,407 | |
| | | | | | | | |
| | | | | | | | |
| | |
| | | Shares | | | Value | |
IT Services 2.5% | |
Brightcove, Inc. (a) | | | 8,800 | | | $ | 69,344 | |
CSG Systems International, Inc. | | | 9,500 | | | | 393,205 | |
Endurance International Group Holdings, Inc. (a) | | | 274,500 | | | | 1,106,235 | |
Fastly, Inc., Class A (a) | | | 10,100 | | | | 859,813 | |
Hackett Group, Inc. | | | 2,400 | | | | 32,496 | |
Limelight Networks, Inc. (a) | | | 258,900 | | | | 1,905,504 | |
ManTech International Corp., Class A | | | 16,000 | | | | 1,095,840 | |
MAXIMUS, Inc. | | | 6,000 | | | | 422,700 | |
Perspecta, Inc. | | | 84,900 | | | | 1,972,227 | |
PFSweb, Inc. (a) | | | 15,500 | | | | 103,540 | |
Science Applications International Corp. | | | 8,900 | | | | 691,352 | |
Sykes Enterprises, Inc. (a) | | | 16,200 | | | | 448,092 | |
TTEC Holdings, Inc. | | | 26,700 | | | | 1,243,152 | |
| | | | | | | | |
| | | | | | | 10,343,500 | |
| | | | | | | | |
Leisure Products 1.0% | |
Escalade, Inc. | | | 3,000 | | | | 41,880 | |
Johnson Outdoors, Inc., Class A | | | 4,600 | | | | 418,692 | |
Malibu Boats, Inc., Class A (a) | | | 23,800 | | | | 1,236,410 | |
MasterCraft Boat Holdings, Inc. (a) | | | 58,700 | | | | 1,118,235 | |
Nautilus, Inc. (a) | | | 136,400 | | | | 1,264,428 | |
| | | | | | | | |
| | | | | | | 4,079,645 | |
| | | | | | | | |
Life Sciences Tools & Services 0.8% | |
Luminex Corp. | | | 34,800 | | | | 1,132,044 | |
Medpace Holdings, Inc. (a) | | | 6,500 | | | | 604,630 | |
Repligen Corp. (a) | | | 3,000 | | | | 370,830 | |
Syneos Health, Inc. (a) | | | 21,100 | | | | 1,229,075 | |
| | | | | | | | |
| | | | | | | 3,336,579 | |
| | | | | | | | |
Machinery 3.1% | |
Albany International Corp., Class A | | | 1,000 | | | | 58,710 | |
Altra Industrial Motion Corp. | | | 5,400 | | | | 172,044 | |
Blue Bird Corp. (a) | | | 48,500 | | | | 727,015 | |
Chart Industries, Inc. (a) | | | 1,000 | | | | 48,490 | |
EnPro Industries, Inc. | | | 6,100 | | | | 300,669 | |
ESCO Technologies, Inc. | | | 6,500 | | | | 549,445 | |
Evoqua Water Technologies Corp. (a) | | | 13,700 | | | | 254,820 | |
Franklin Electric Co., Inc. | | | 23,600 | | | | 1,239,472 | |
Kennametal, Inc. | | | 3,800 | | | | 109,098 | |
L.B. Foster Co., Class A (a) | | | 31,000 | | | | 395,870 | |
Lydall, Inc. (a) | | | 38,800 | | | | 526,128 | |
Meritor, Inc. (a) | | | 72,600 | | | | 1,437,480 | |
Miller Industries, Inc. | | | 7,500 | | | | 223,275 | |
Mueller Industries, Inc. | | | 59,800 | | | | 1,589,484 | |
Mueller Water Products, Inc., Class A | | | 22,500 | | | | 212,175 | |
Navistar International Corp. (a) | | | 55,600 | | | | 1,567,920 | |
Shyft Group, Inc. | | | 18,000 | | | | 303,120 | |
SPX Corp. (a) | | | 32,500 | | | | 1,337,375 | |
Tennant Co. | | | 7,718 | | | | 501,747 | |
Watts Water Technologies, Inc., Class A | | | 18,100 | | | | 1,466,100 | |
Welbilt, Inc. (a) | | | 8,000 | | | | 48,720 | |
| | | | | | | | |
| | | | | | | 13,069,157 | |
| | | | | | | | |
| | | | |
| 14 | | MainStay VP MacKay Small Cap Core Portfolio | | The notes to the financial statements are an integral part of,
and should be read in conjunction with, the financial statements. |
| | | | | | | | |
| | |
| | | Shares | | | Value | |
| Common Stocks (continued) | |
Media 0.3% | |
Emerald Expositions Events, Inc. | | | 20,200 | | | $ | 62,216 | |
Entravision Communications Corp., Class A | | | 151,800 | | | | 217,074 | |
Fluent, Inc. (a) | | | 30,800 | | | | 54,824 | |
Meredith Corp. | | | 900 | | | | 13,095 | |
Scholastic Corp. | | | 1,400 | | | | 41,916 | |
TEGNA, Inc. | | | 51,400 | | | | 572,596 | |
WideOpenWest, Inc. (a) | | | 92,800 | | | | 489,056 | |
| | | | | | | | |
| | | | | | | 1,450,777 | |
| | | | | | | | |
Metals & Mining 1.0% | |
Allegheny Technologies, Inc. (a) | | | 5,900 | | | | 60,121 | |
Caledonia Mining Corp. PLC | | | 23,000 | | | | 398,360 | |
Carpenter Technology Corp. | | | 4,900 | | | | 118,972 | |
Coeur Mining, Inc. (a) | | | 17,500 | | | | 88,900 | |
Commercial Metals Co. | | | 3,000 | | | | 61,200 | |
Gold Resource Corp. | | | 80,392 | | | | 330,411 | |
Hecla Mining Co. | | | 27,500 | | | | 89,925 | |
Materion Corp. | | | 9,500 | | | | 584,155 | |
Novagold Resources, Inc. (a) | | | 5,900 | | | | 54,162 | |
Olympic Steel, Inc. | | | 2,100 | | | | 24,675 | |
Ryerson Holding Corp. (a) | | | 31,500 | | | | 177,345 | |
Schnitzer Steel Industries, Inc., Class A | | | 7,900 | | | | 139,356 | |
Warrior Met Coal, Inc. | | | 80,500 | | | | 1,238,895 | |
Worthington Industries, Inc. | | | 22,700 | | | | 846,710 | |
| | | | | | | | |
| | | | | | | 4,213,187 | |
| | | | | | | | |
Mortgage Real Estate Investment Trusts 0.6% | |
Apollo Commercial Real Estate Finance, Inc. | | | 7,100 | | | | 69,651 | |
Ares Commercial Real Estate Corp. | | | 55,400 | | | | 505,248 | |
Broadmark Realty Capital, Inc. (b) | | | 5,700 | | | | 53,979 | |
Cherry Hill Mortgage Investment Corp. | | | 48,500 | | | | 437,470 | |
Ellington Residential Mortgage REIT (b) | | | 8,600 | | | | 88,580 | |
Hannon Armstrong Sustainable Infrastructure Capital, Inc. | | | 200 | | | | 5,692 | |
Invesco Mortgage Capital, Inc. (b) | | | 6,200 | | | | 23,188 | |
Ladder Capital Corp. | | | 121,500 | | | | 984,150 | |
New York Mortgage Trust, Inc. | | | 26,000 | | | | 67,860 | |
PennyMac Mortgage Investment Trust | | | 4,100 | | | | 71,873 | |
Redwood Trust, Inc. | | | 3,700 | | | | 25,900 | |
| | | | | | | | |
| | | | | | | 2,333,591 | |
| | | | | | | | |
Multiline Retail 0.4% | |
Big Lots, Inc. | | | 44,600 | | | | 1,873,200 | |
| | | | | | | | |
Oil, Gas & Consumable Fuels 2.0% | |
Arch Resources, Inc. | | | 8,600 | | | | 244,326 | |
Ardmore Shipping Corp. | | | 102,100 | | | | 443,114 | |
Berry Corp. | | | 218,300 | | | | 1,054,389 | |
Bonanza Creek Energy, Inc. (a) | | | 62,200 | | | | 921,804 | |
CNX Resources Corp. (a) | | | 157,400 | | | | 1,361,510 | |
CVR Energy, Inc. | | | 600 | | | | 12,066 | |
Delek U.S. Holdings, Inc. | | | 5,000 | | | | 87,050 | |
| | | | | | | | |
| | |
| | | Shares | | | Value | |
Oil, Gas & Consumable Fuels (continued) | |
DHT Holdings, Inc. | | | 1,900 | | | $ | 9,747 | |
Diamond S Shipping, Inc. (a) | | | 115,900 | | | | 926,041 | |
Dorian LPG, Ltd. (a) | | | 9,600 | | | | 74,304 | |
International Seaways, Inc. | | | 27,900 | | | | 455,886 | |
Laredo Petroleum, Inc. (a) | | | 810 | | | | 11,227 | |
Matador Resources Co. (a) | | | 3,800 | | | | 32,300 | |
NACCO Industries, Inc., Class A | | | 200 | | | | 4,660 | |
Overseas Shipholding Group, Inc., Class A (a) | | | 5,600 | | | | 10,416 | |
PBF Energy, Inc., Class A | | | 14,300 | | | | 146,432 | |
PDC Energy, Inc. (a) | | | 9,800 | | | | 121,912 | |
Penn Virginia Corp. (a) | | | 28,300 | | | | 269,699 | |
Renewable Energy Group, Inc. (a) | | | 20,700 | | | | 512,946 | |
REX American Resources Corp. (a) | | | 400 | | | | 27,748 | |
Scorpio Tankers, Inc. | | | 1,600 | | | | 20,496 | |
SM Energy Co. | | | 2,200 | | | | 8,250 | |
Southwestern Energy Co. (a) | | | 10,200 | | | | 26,112 | |
World Fuel Services Corp. | | | 60,600 | | | | 1,561,056 | |
| | | | | | | | |
| | | | | | | 8,343,491 | |
| | | | | | | | |
Paper & Forest Products 0.2% | |
Boise Cascade Co. | | | 15,100 | | | | 567,911 | |
Verso Corp., Class A | | | 23,500 | | | | 281,060 | |
| | | | | | | | |
| | | | | | | 848,971 | |
| | | | | | | | |
Personal Products 0.9% | |
Edgewell Personal Care Co. (a) | | | 12,600 | | | | 392,616 | |
LifeVantage Corp. (a) | | | 55,700 | | | | 753,064 | |
Medifast, Inc. (b) | | | 8,300 | | | | 1,151,791 | |
Nature’s Sunshine Products, Inc. (a) | | | 1,900 | | | | 17,119 | |
USANA Health Sciences, Inc. (a) | | | 17,800 | | | | 1,307,054 | |
| | | | | | | | |
| | | | | | | 3,621,644 | |
| | | | | | | | |
Pharmaceuticals 3.2% | |
Amphastar Pharmaceuticals, Inc. (a) | | | 14,600 | | | | 327,916 | |
ANI Pharmaceuticals, Inc. (a) | | | 1,000 | | | | 32,340 | |
Avenue Therapeutics, Inc. (a) | | | 12,400 | | | | 133,548 | |
BioDelivery Sciences International, Inc. (a) | | | 271,700 | | | | 1,184,612 | |
Collegium Pharmaceutical, Inc. (a) | | | 58,800 | | | | 1,029,000 | |
Corcept Therapeutics, Inc. (a) | | | 103,100 | | | | 1,734,142 | |
Durect Corp. (a)(b) | | | 129,600 | | | | 300,672 | |
Endo International PLC (a) | | | 49,500 | | | | 169,785 | |
Harrow Health, Inc. (a) | | | 21,400 | | | | 111,494 | |
Innoviva, Inc. (a) | | | 103,700 | | | | 1,449,726 | |
Intersect ENT, Inc. (a) | | | 24,800 | | | | 335,792 | |
Lannett Co., Inc. (a) | | | 24,300 | | | | 176,418 | |
Mallinckrodt PLC (a)(b) | | | 247,000 | | | | 661,960 | |
MyoKardia, Inc. (a) | | | 4,800 | | | | 463,776 | |
Pacira BioSciences, Inc. (a) | | | 36,100 | | | | 1,894,167 | |
Phibro Animal Health Corp., Class A | | | 45,700 | | | | 1,200,539 | |
Prestige Consumer Healthcare, Inc. (a) | | | 40,100 | | | | 1,506,156 | |
Strongbridge Biopharma PLC (a) | | | 48,800 | | | | 184,464 | |
Supernus Pharmaceuticals, Inc. (a) | | | 14,900 | | | | 353,875 | |
| | | | | | | | |
| | | | | | | 13,250,382 | |
| | | | | | | | |
| | | | | | |
The notes to the financial statements are an integral part of,
and should be read in conjunction with, the financial statements. | | | | | 15 | |
Portfolio of Investments June 30, 2020 (Unaudited) (continued)
| | | | | | | | |
| | |
| | | Shares | | | Value | |
| Common Stocks (continued) | |
Professional Services 1.4% | |
ASGN, Inc. (a) | | | 30,000 | | | $ | 2,000,400 | |
Barrett Business Services, Inc. | | | 3,100 | | | | 164,703 | |
CRA International, Inc. | | | 500 | | | | 19,750 | |
Exponent, Inc. | | | 500 | | | | 40,465 | |
Insperity, Inc. | | | 18,100 | | | | 1,171,613 | |
Kforce, Inc. | | | 35,100 | | | | 1,026,675 | |
Korn Ferry | | | 5,800 | | | | 178,234 | |
Mastech Digital, Inc. (a) | | | 10,300 | | | | 267,079 | |
TriNet Group, Inc. (a) | | | 16,600 | | | | 1,011,604 | |
| | | | | | | | |
| | | | | | | 5,880,523 | |
| | | | | | | | |
Real Estate 0.0% ‡ | |
Cushman & Wakefield PLC (a) | | | 4,700 | | | | 58,562 | |
Redfin Corp. (a) | | | 1,100 | | | | 46,101 | |
| | | | | | | | |
| | | | | | | 104,663 | |
| | | | | | | | |
Real Estate Management & Development 0.3% | |
Newmark Group, Inc., Class A | | | 163,500 | | | | 794,610 | |
RMR Group, Inc., Class A | | | 20,200 | | | | 595,294 | |
| | | | | | | | |
| | | | | | | 1,389,904 | |
| | | | | | | | |
Road & Rail 0.4% | |
ArcBest Corp. | | | 58,900 | | | | 1,561,439 | |
Universal Logistics Holdings, Inc. | | | 800 | | | | 13,904 | |
| | | | | | | | |
| | | | | | | 1,575,343 | |
| | | | | | | | |
Semiconductors & Semiconductor Equipment 4.5% | |
ACM Research, Inc., Class A (a) | | | 3,400 | | | | 212,024 | |
Advanced Energy Industries, Inc. (a) | | | 22,968 | | | | 1,557,001 | |
Alpha & Omega Semiconductor, Ltd. (a) | | | 15,400 | | | | 167,552 | |
Amkor Technology, Inc. (a) | | | 130,500 | | | | 1,606,455 | |
Axcelis Technologies, Inc. (a) | | | 54,000 | | | | 1,503,900 | |
Cabot Microelectronics Corp. | | | 1,200 | | | | 167,448 | |
CEVA, Inc. (a) | | | 1,200 | | | | 44,904 | |
Cirrus Logic, Inc. (a) | | | 22,200 | | | | 1,371,516 | |
CyberOptics Corp. (a) | | | 12,000 | | | | 386,520 | |
Enphase Energy, Inc. (a) | | | 4,200 | | | | 199,794 | |
FormFactor, Inc. (a) | | | 65,100 | | | | 1,909,383 | |
Ichor Holdings, Ltd. (a) | | | 57,500 | | | | 1,528,350 | |
Inphi Corp. (a) | | | 6,300 | | | | 740,250 | |
Lattice Semiconductor Corp. (a) | | | 25,500 | | | | 723,945 | |
MACOM Technology Solutions Holdings, Inc. (a) | | | 6,900 | | | | 237,015 | |
NeoPhotonics Corp. (a) | | | 87,500 | | | | 777,000 | |
Photronics, Inc. (a) | | | 115,900 | | | | 1,289,967 | |
Rambus, Inc. (a) | | | 59,000 | | | | 896,800 | |
Semtech Corp. (a) | | | 300 | | | | 15,666 | |
Smart Global Holdings, Inc. (a) | | | 33,700 | | | | 915,966 | |
Synaptics, Inc. (a) | | | 18,320 | | | | 1,101,398 | |
Ultra Clean Holdings, Inc. (a) | | | 66,000 | | | | 1,493,580 | |
| | | | | | | | |
| | | | | | | 18,846,434 | |
| | | | | | | | |
| | | | | | | | |
| | |
| | | Shares | | | Value | |
Software 5.7% | |
A10 Networks, Inc. (a) | | | 107,700 | | | $ | 733,437 | |
American Software, Inc., Class A | | | 39,200 | | | | 617,792 | |
AppFolio, Inc., Class A (a) | | | 3,000 | | | | 488,130 | |
Appian Corp. (a)(b) | | | 5,200 | | | | 266,500 | |
Avaya Holdings Corp. (a) | | | 111,500 | | | | 1,378,140 | |
Blackbaud, Inc. | | | 9,300 | | | | 530,844 | |
Blackline, Inc. (a) | | | 9,500 | | | | 787,645 | |
Bottomline Technologies, Inc. (a) | | | 5,100 | | | | 258,927 | |
Box, Inc., Class A (a) | | | 66,100 | | | | 1,372,236 | |
ChannelAdvisor Corp. (a) | | | 20,200 | | | | 319,968 | |
Cloudera, Inc. (a) | | | 38,700 | | | | 492,264 | |
CommVault Systems, Inc. (a) | | | 20,900 | | | | 808,830 | |
Cornerstone OnDemand, Inc. (a) | | | 45,100 | | | | 1,739,056 | |
Digital Turbine, Inc. (a) | | | 36,600 | | | | 460,062 | |
Envestnet, Inc. (a) | | | 6,200 | | | | 455,948 | |
Everbridge, Inc. (a) | | | 2,200 | | | | 304,392 | |
Five9, Inc. (a) | | | 4,600 | | | | 509,082 | |
GlobalSCAPE, Inc. | | | 17,600 | | | | 171,600 | |
j2 Global, Inc. | | | 3,800 | | | | 240,198 | |
MicroStrategy, Inc., Class A (a) | | | 11,700 | | | | 1,383,993 | |
Mimecast, Ltd. (a) | | | 19,700 | | | | 820,702 | |
Mitek Systems, Inc. (a) | | | 44,700 | | | | 429,567 | |
OneSpan, Inc. (a) | | | 20,600 | | | | 575,358 | |
Progress Software Corp. | | | 41,400 | | | | 1,604,250 | |
PROS Holdings, Inc. (a) | | | 1,400 | | | | 62,202 | |
Q2 Holdings, Inc. (a) | | | 9,900 | | | | 849,321 | |
Rimini Street, Inc. (a) | | | 23,700 | | | | 122,055 | |
Sapiens International Corp. N.V. | | | 30,800 | | | | 861,784 | |
SPS Commerce, Inc. (a) | | | 26,100 | | | | 1,960,632 | |
SVMK, Inc. (a) | | | 41,300 | | | | 972,202 | |
Telenav, Inc. (a) | | | 2,200 | | | | 12,078 | |
Tenable Holdings, Inc. (a) | | | 5,200 | | | | 155,012 | |
Verint Systems, Inc. (a) | | | 2,800 | | | | 126,504 | |
Workiva, Inc. (a) | | | 5,400 | | | | 288,846 | |
Zix Corp. (a) | | | 197,700 | | | | 1,364,130 | |
Zuora, Inc., Class A (a) | | | 11,700 | | | | 149,175 | |
| | | | | | | | |
| | | | | | | 23,672,862 | |
| | | | | | | | |
Specialty Retail 3.2% | |
Aaron’s, Inc. | | | 28,700 | | | | 1,302,980 | |
Abercrombie & Fitch Co., Class A | | | 1,600 | | | | 17,024 | |
America’s Car-Mart, Inc. (a) | | | 6,300 | | | | 553,581 | |
American Eagle Outfitters, Inc. | | | 7,800 | | | | 85,020 | |
Asbury Automotive Group, Inc. (a) | | | 5,000 | | | | 386,650 | |
Group 1 Automotive, Inc. | | | 16,000 | | | | 1,055,520 | |
Haverty Furniture Cos., Inc. | | | 30,900 | | | | 494,400 | |
Hibbett Sports, Inc. (a) | | | 6,600 | | | | 138,204 | |
Lithia Motors, Inc., Class A | | | 100 | | | | 15,133 | |
MarineMax, Inc. (a) | | | 34,600 | | | | 774,694 | |
Murphy USA, Inc. (a) | | | 17,400 | | | | 1,959,066 | |
Office Depot, Inc. | | | 283,900 | | | | 667,165 | |
| | | | |
| 16 | | MainStay VP MacKay Small Cap Core Portfolio | | The notes to the financial statements are an integral part of,
and should be read in conjunction with, the financial statements. |
| | | | | | | | |
| | |
| | | Shares | | | Value | |
| Common Stocks (continued) | |
Specialty Retail (continued) | |
Rent-A-Center, Inc. | | | 40,100 | | | $ | 1,115,582 | |
RH (a) | | | 3,900 | | | | 970,710 | |
Sally Beauty Holdings, Inc. (a) | | | 7,700 | | | | 96,481 | |
Signet Jewelers, Ltd. | | | 1,300 | | | | 13,351 | |
Sleep Number Corp. (a) | | | 38,600 | | | | 1,607,304 | |
Sportsman’s Warehouse Holdings, Inc. (a) | | | 115,400 | | | | 1,644,450 | |
Winmark Corp. | | | 1,100 | | | | 188,364 | |
Zumiez, Inc. (a) | | | 16,100 | | | | 440,818 | |
| | | | | | | | |
| | | | | | | 13,526,497 | |
| | | | | | | | |
Technology Hardware, Storage & Peripherals 0.2% | |
Super Micro Computer, Inc. (a) | | | 34,400 | | | | 976,616 | |
| | | | | | | | |
Textiles, Apparel & Luxury Goods 0.7% | |
Deckers Outdoor Corp. (a) | | | 11,000 | | | | 2,160,290 | |
G-III Apparel Group, Ltd. (a) | | | 900 | | | | 11,961 | |
Oxford Industries, Inc. | | | 300 | | | | 13,203 | |
Rocky Brands, Inc. | | | 43,000 | | | | 884,080 | |
| | | | | | | | |
| | | | | | | 3,069,534 | |
| | | | | | | | |
Thrifts & Mortgage Finance 2.3% | |
Bridgewater Bancshares, Inc. (a) | | | 37,800 | | | | 387,450 | |
Essent Group, Ltd. | | | 12,000 | | | | 435,240 | |
Federal Agricultural Mortgage Corp., Class C | | | 200 | | | | 12,802 | |
Flagstar Bancorp, Inc. | | | 51,000 | | | | 1,500,930 | |
FS Bancorp, Inc. | | | 13,400 | | | | 516,838 | |
HomeStreet, Inc. | | | 26,000 | | | | 639,860 | |
Luther Burbank Corp. | | | 16,400 | | | | 164,000 | |
Merchants Bancorp | | | 43,700 | | | | 808,013 | |
Meridian Bancorp, Inc. | | | 68,000 | | | | 788,800 | |
NMI Holdings, Inc., Class A (a) | | | 18,700 | | | | 300,696 | |
Northfield Bancorp, Inc. | | | 7,000 | | | | 80,640 | |
OP Bancorp. | | | 32,300 | | | | 222,870 | |
Provident Financial Services, Inc. | | | 96,000 | | | | 1,387,200 | |
Radian Group, Inc. | | | 99,500 | | | | 1,543,245 | |
Riverview Bancorp, Inc. | | | 26,200 | | | | 148,030 | |
Sterling Bancorp, Inc. | | | 3,400 | | | | 12,172 | |
TrustCo Bank Corp. | | | 42,000 | | | | 265,860 | |
Walker & Dunlop, Inc. | | | 1,900 | | | | 96,539 | |
Waterstone Financial, Inc. | | | 18,800 | | | | 278,804 | |
| | | | | | | | |
| | | | | | | 9,589,989 | |
| | | | | | | | |
Tobacco 0.7% | |
Universal Corp. | | | 32,200 | | | | 1,368,822 | |
Vector Group, Ltd. | | | 134,349 | | | | 1,351,551 | |
| | | | | | | | |
| | | | | | | 2,720,373 | |
| | | | | | | | |
Trading Companies & Distributors 1.0% | |
BMC Stock Holdings, Inc. (a) | | | 64,500 | | | | 1,621,530 | |
GMS, Inc. (a) | | | 26,100 | | | | 641,799 | |
NOW, Inc. (a) | | | 2,800 | | | | 24,164 | |
Rush Enterprises, Inc. | |
| | | | | | | | |
| | |
| | | Shares | | | Value | |
Trading Companies & Distributors (continued) | |
Class A | | | 29,100 | | | $ | 1,206,486 | |
Class B | | | 1,900 | | | | 67,754 | |
Siteone Landscape Supply, Inc. (a) | | | 2,700 | | | | 307,719 | |
Systemax, Inc. | | | 4,500 | | | | 92,430 | |
WESCO International, Inc. (a) | | | 3,883 | | | | 136,332 | |
| | | | | | | | |
| | | | | | | 4,098,214 | |
| | | | | | | | |
Water Utilities 1.4% | |
American States Water Co. | | | 22,300 | | | | 1,753,449 | |
Artesian Resources Corp., Class A | | | 7,900 | | | | 286,691 | |
California Water Service Group | | | 24,500 | | | | 1,168,650 | |
Consolidated Water Co., Ltd. | | | 64,300 | | | | 927,849 | |
Global Water Resources, Inc. | | | 8,300 | | | | 87,482 | |
Middlesex Water Co. | | | 1,500 | | | | 100,770 | |
Pure Cycle Corp. (a) | | | 13,200 | | | | 121,308 | |
SJW Corp. | | | 16,000 | | | | 993,760 | |
York Water Co. | | | 9,400 | | | | 450,824 | |
| | | | | | | | |
| | | | | | | 5,890,783 | |
| | | | | | | | |
Total Common Stocks
(Cost $404,121,322) | | | | 411,533,197 | |
| | | | | | | | |
|
| Convertible Preferred Stock 0.1% | |
Trading Companies & Distributors 0.1% | |
WESCO International, Inc.
10.625% | | | 10,296 | | | | 273,050 | |
| | | | | | | | |
Total Convertible Preferred Stock
(Cost $257,400) | | | | 273,050 | |
| | | | | | | | |
|
| Exchange-Traded Fund 1.6% | |
iShares Russell 2000 ETF (b) | | | 45,103 | | | | 6,457,848 | |
| | | | | | | | |
Total Exchange-Traded Fund
(Cost $5,879,556) | | | | 6,457,848 | |
| | | | | | | | |
|
| Short-Term Investment 2.8% | |
Unaffiliated Investment Company 2.8% | |
State Street Navigator Securities Lending Government Money Market Portfolio, 0.13% (c)(d) | | | 11,876,958 | | | | 11,876,958 | |
| | | | | | | | |
Total Short-Term Investment
(Cost $11,876,958) | | | | 11,876,958 | |
| | | | | | | | |
Total Investments
(Cost $422,135,236) | | | 102.9 | % | | | 430,141,053 | |
| | | | | | | | |
Other Assets, Less Liabilities | | | (2.9 | ) | | | (12,090,390 | ) |
Net Assets | | | 100.0 | % | | $ | 418,050,663 | |
| | | | | | |
The notes to the financial statements are an integral part of,
and should be read in conjunction with, the financial statements. | | | | | 17 | |
Portfolio of Investments June 30, 2020 (Unaudited) (continued)
| † | Percentages indicated are based on Portfolio net assets. |
| ‡ | Less than one-tenth of a percent. |
| (a) | Non-income producing security. |
| (b) | All or a portion of this security was held on loan. As of June 30, 2020, the aggregate market value of securities on loan was $14,449,805; the total market value of collateral held by the Portfolio was $14,873,270. The market value of the collateral held included non-cash collateral in the form of U.S. Treasury securities with a value of $2,996,312 (See Note 2(H)). |
| (c) | Represents a security purchased with cash collateral received for securities on loan. |
| (d) | Current yield as of June 30, 2020. |
The following abbreviations are used in the preceding pages:
ETF—Exchange-Traded Fund
REIT—Real Estate Investment Trust
The following is a summary of the fair valuations according to the inputs used as of June 30, 2020, for valuing the Portfolio’s assets:
| | | | | | | | | | | | | | | | |
Description | | Quoted
Prices in
Active
Markets for
Identical
Assets (Level 1) | | | Significant
Other
Observable
Inputs (Level 2) | | | Significant
Unobservable
Inputs (Level 3) | | | Total | |
|
Asset Valuation Inputs | |
| Investments in Securities (a) | | | | | | | | | |
| Common Stocks | | $ | 411,533,197 | | | $ | — | | | $ | — | | | $ | 411,533,197 | |
| Convertible Preferred Stock | | | 273,050 | | | | — | | | | — | | | | 273,050 | |
| Exchange-Traded Fund | | | 6,457,848 | | | | — | | | | — | | | | 6,457,848 | |
| Short-Term Investment | | | | | | | | | |
Unaffiliated Investment Company | | | 11,876,958 | | | | — | | | | — | | | | 11,876,958 | |
| | | | | | | | | | | | | | | | |
| Total Investments in Securities | | $ | 430,141,053 | | | $ | — | | | $ | — | | | $ | 430,141,053 | |
| | | | | | | | | | | | | | | | |
| (a) | For a complete listing of investments and their industries, see the Portfolio of Investments. |
| | | | |
| 18 | | MainStay VP MacKay Small Cap Core Portfolio | | The notes to the financial statements are an integral part of,
and should be read in conjunction with, the financial statements. |
Statement of Assets and Liabilities as of June 30, 2020 (Unaudited)
| | | | |
| Assets | | | | |
Investment in securities, at value
(identified cost $422,135,236) including securities on loan of $14,449,805 | | $ | 430,141,053 | |
Receivables: | | | | |
Dividends | | | 310,345 | |
Investment securities sold | | | 276,033 | |
Portfolio shares sold | | | 84,457 | |
Securities lending | | | 21,199 | |
Other assets | | | 2,072 | |
| | | | |
Total assets | | | 430,835,159 | |
| | | | |
|
| Liabilities | |
Due to custodian | | | 261,399 | |
Cash collateral received for securities on loan | | | 11,876,958 | |
Payables: | | | | |
Portfolio shares redeemed | | | 257,260 | |
Manager (See Note 3) | | | 232,764 | |
Shareholder communication | | | 58,278 | |
NYLIFE Distributors (See Note 3) | | | 53,282 | |
Professional fees | | | 23,038 | |
Custodian | | | 18,692 | |
Trustees | | | 659 | |
Accrued expenses | | | 2,166 | |
| | | | |
Total liabilities | | | 12,784,496 | |
| | | | |
Net assets | | $ | 418,050,663 | |
| | | | |
|
| Composition of Net Assets | |
Shares of beneficial interest outstanding (par value of $.001 per share) unlimited number of shares authorized | | $ | 47,770 | |
Additional paid-in capital | | | 503,648,630 | |
| | | | |
| | | 503,696,400 | |
Total distributable earnings (loss) | | | (85,645,737 | ) |
| | | | |
Net assets | | $ | 418,050,663 | |
| | | | |
| | | | |
Initial Class | | | | |
Net assets applicable to outstanding shares | | $ | 158,408,074 | |
| | | | |
Shares of beneficial interest outstanding | | | 17,994,217 | |
| | | | |
Net asset value per share outstanding | | $ | 8.80 | |
| | | | |
Service Class | | | | |
Net assets applicable to outstanding shares | | $ | 259,642,589 | |
| | | | |
Shares of beneficial interest outstanding | | | 29,775,359 | |
| | | | |
Net asset value per share outstanding | | $ | 8.72 | |
| | | | |
| | | | | | |
The notes to the financial statements are an integral part of,
and should be read in conjunction with, the financial statements. | | | | | 19 | |
Statement of Operations for the six months ended June 30, 2020 (Unaudited)
| | | | |
| Investment Income (Loss) | |
Income | |
Dividends-unaffiliated (a) | | $ | 2,759,507 | |
Securities lending | | | 54,015 | |
Dividends-affiliated | | | 716 | |
Interest | | | 7 | |
| | | | |
Total income | | | 2,814,245 | |
| | | | |
Expenses | |
Manager (See Note 3) | | | 1,662,706 | |
Distribution/Service—Service Class (See Note 3) | | | 320,928 | |
Professional fees | | | 43,973 | |
Shareholder communication | | | 40,755 | |
Custodian | | | 37,847 | |
Trustees | | | 5,606 | |
Miscellaneous | | | 8,634 | |
| | | | |
Total expenses before waiver/reimbursement | | | 2,120,449 | |
Expense waiver/reimbursement from Manager (See Note 3) | | | (236,521 | ) |
| | | | |
Net expenses | | | 1,883,928 | |
| | | | |
Net investment income (loss) | | | 930,317 | |
| | | | |
|
| Realized and Unrealized Gain (Loss) on Investments | |
Net realized gain (loss) on investments | | | (56,776,793 | ) |
Net change in unrealized appreciation (depreciation) on investments | | | (29,817,060 | ) |
| | | | |
Net realized and unrealized gain (loss) on investments | | | (86,593,853 | ) |
| | | | |
Net increase (decrease) in net assets resulting from operations | | $ | (85,663,536 | ) |
| | | | |
| (a) | Dividends recorded net of foreign withholding taxes in the amount of $10,830. |
| | | | |
| 20 | | MainStay VP MacKay Small Cap Core Portfolio | | The notes to the financial statements are an integral part of,
and should be read in conjunction with, the financial statements. |
Statements of Changes in Net Assets
for the six months ended June 30, 2020 (Unaudited) and the year ended December 31, 2019
| | | | | | | | |
| | | 2020 | | | 2019 | |
| Increase (Decrease) in Net Assets | |
Operations: | |
Net investment income (loss) | | $ | 930,317 | | | $ | 1,611,657 | |
Net realized gain (loss) on investments | | | (56,776,793 | ) | | | (30,626,638 | ) |
Net change in unrealized appreciation (depreciation) on investments | | | (29,817,060 | ) | | | 71,143,741 | |
| | | | |
Net increase (decrease) in net assets resulting from operations | | | (85,663,536 | ) | | | 42,128,760 | |
| | | | |
Distributions to shareholders: | | | | | | | | |
Initial Class | | | — | | | | (18,699,244 | ) |
Service Class | | | — | | | | (23,525,164 | ) |
| | | | |
Total distributions to shareholders | | | — | | | | (42,224,408 | ) |
| | | | |
Capital share transactions: | | | | | | | | |
Net proceeds from sale of shares | | | 22,281,342 | | | | 26,746,510 | |
Net asset value of shares issued in connection with the acquisition of MainStay VP Epoch U.S. Small Cap Portfolio | | | — | | | | 419,053,712 | |
Net asset value of shares issued to shareholders in reinvestment of distributions | | | — | | | | 42,224,408 | |
Cost of shares redeemed | | | (34,075,761 | ) | | | (233,242,522 | ) |
| | | | |
Increase (decrease) in net assets derived from capital share transactions | | | (11,794,419 | ) | | | 254,782,108 | |
| | | | |
Net increase (decrease) in net assets | | | (97,457,955 | ) | | | 254,686,460 | |
|
| Net Assets | |
Beginning of period | | | 515,508,618 | | | | 260,822,158 | |
| | | | |
End of period | | $ | 418,050,663 | | | $ | 515,508,618 | |
| | | | |
| | | | | | |
The notes to the financial statements are an integral part of,
and should be read in conjunction with, the financial statements. | | | | | 21 | |
Financial Highlights selected per share data and ratios
| | | | | | | | | | | | | | | | | | | | |
| | | |
| | | Six months
ended June 30, | | | Year ended December 31, | | | May 2, 2016^
through December 31, | |
| | | | | |
| Initial Class | | 2020* | | | 2019 | | | 2018 | | | 2017 | | | 2016 | |
| | | | | |
Net asset value at beginning of period | | $ | 10.65 | | | $ | 9.82 | | | $ | 13.16 | | | $ | 11.73 | | | $ | 10.00 | |
| | | | | | | | | | | | | | | | | | | | |
| | | | | |
Net investment income (loss) (a) | | | 0.03 | | | | 0.05 | | | | 0.04 | | | | 0.01 | | | | 0.03 | |
| | | | | |
Net realized and unrealized gain (loss) on investments | | | (1.88 | ) | | | 1.61 | | | | (1.71 | ) | | | 1.63 | | | | 1.88 | |
| | | | | | | | | | | | | | | | | | | | |
| | | | | |
Total from investment operations | | | (1.85 | ) | | | 1.66 | | | | (1.67 | ) | | | 1.64 | | | | 1.91 | |
| | | | | | | | | | | | | | | | | | | | |
| | | | | |
| Less distributions: | | | | | | | | | | | | | | | | | | | | |
| | | | | |
From net investment income | | | — | | | | (0.02 | ) | | | — | | | | — | | | | (0.02 | ) |
| | | | | |
From net realized gain on investments | | | — | | | | (0.81 | ) | | | (1.67 | ) | | | (0.21 | ) | | | (0.16 | ) |
| | | | | | | | | | | | | | | | | | | | |
| | | | | |
Total distributions | | | — | | | | (0.83 | ) | | | (1.67 | ) | | | (0.21 | ) | | | (0.18 | ) |
| | | | | | | | | | | | | | | | | | | | |
| | | | | |
Net asset value at end of period | | $ | 8.80 | | | $ | 10.65 | | | $ | 9.82 | | | $ | 13.16 | | | $ | 11.73 | |
| | | | | | | | | | | | | | | | | | | | |
| | | | | |
Total investment return (b) | | | (17.37 | %)(c) | | | 17.82 | % | | | (15.11 | %) | | | 13.93 | % | | | 19.14 | % |
| | | | | |
| Ratios (to average net assets)/Supplemental Data: | | | | | | | | | | | | | | | | | | | | |
| | | | | |
Net investment income (loss) | | | 0.60 | % †† | | | 0.48 | % | | | 0.33 | % | | | 0.10 | % | | | 0.39 | % †† |
| | | | | |
Net expenses (d) | | | 0.75 | % †† | | | 0.82 | % | | | 0.90 | % | | | 0.90 | % | | | 1.00 | % †† |
| | | | | |
Expenses (before waiver/reimbursement) (d) | | | 0.87 | % †† | | | 0.86 | % | | | 0.90 | % | | | 0.90 | % | | | 1.00 | % †† |
| | | | | |
Portfolio turnover rate | | | 117 | % | | | 257 | % | | | 161 | % | | | 159 | % | | | 180 | % |
| | | | | |
Net assets at end of period (in 000’s) | | $ | 158,408 | | | $ | 198,292 | | | $ | 123,857 | | | $ | 180,840 | | | $ | 164,253 | |
| (a) | Per share data based on average shares outstanding during the period. |
| (b) | Total return does not reflect any deduction of sales charges, mortality and expense charges, contract charges or administrative charges. For periods of less than one year, total return is not annualized. |
| (c) | Total investment return may reflect adjustments to conform to generally accepted accounting principles. |
| (d) | In addition to the fees and expenses which the Portfolio bears directly, it also indirectly bears a pro-rata share of the fees and expenses of the underlying funds in which it invests. Such indirect expenses are not included in the above expense ratios. |
| | | | |
| 22 | | MainStay VP MacKay Small Cap Core Portfolio | | The notes to the financial statements are an integral part of,
and should be read in conjunction with, the financial statements. |
Financial Highlights selected per share data and ratios
| | | | | | | | | | | | | | | | | | | | |
| | | |
| | | Six months
ended June 30, | | | Year ended December 31, | | | May 2, 2016^
through December 31, | |
| | | | | |
| Service Class | | 2020* | | | 2019 | | | 2018 | | | 2017 | | | 2016 | |
| | | | | |
Net asset value at beginning of period | | $ | 10.56 | | | $ | 9.76 | | | $ | 13.11 | | | $ | 11.72 | | | $ | 10.00 | |
| | | | | | | | | | | | | | | | | | | | |
| | | | | |
Net investment income (loss) (a) | | | 0.02 | | | | 0.02 | | | | 0.01 | | | | (0.02 | ) | | | 0.01 | |
| | | | | |
Net realized and unrealized gain (loss) on investments | | | (1.86 | ) | | | 1.59 | | | | (1.69 | ) | | | 1.62 | | | | 1.88 | |
| | | | | | | | | | | | | | | | | | | | |
| | | | | |
Total from investment operations | | | (1.84 | ) | | | 1.61 | | | | (1.68 | ) | | | 1.60 | | | | 1.89 | |
| | | | | | | | | | | | | | | | | | | | |
|
| Less distributions: | |
| | | | | |
From net investment income | | | — | | | | (0.00 | )‡ | | | — | | | | — | | | | (0.01 | ) |
| | | | | |
From net realized gain on investments | | | — | | | | (0.81 | ) | | | (1.67 | ) | | | (0.21 | ) | | | (0.16 | ) |
| | | | | | | | | | | | | | | | | | | | |
| | | | | |
Total distributions | | | — | | | | (0.81 | ) | | | (1.67 | ) | | | (0.21 | ) | | | (0.17 | ) |
| | | | | | | | | | | | | | | | | | | | |
| | | | | |
Net asset value at end of period | | $ | 8.72 | | | $ | 10.56 | | | $ | 9.76 | | | $ | 13.11 | | | $ | 11.72 | |
| | | | | | | | | | | | | | | | | | | | |
| | | | | |
Total investment return (b) | | | (17.42 | %)(c) | | | 17.53 | % | | | (15.32 | %) | | | 13.64 | % | | | 18.95 | % |
|
| Ratios (to average net assets)/Supplemental Data: | |
| | | | | |
Net investment income (loss) | | | 0.35 | % †† | | | 0.22 | % | | | 0.09 | % | | | (0.15 | %) | | | 0.16 | % †† |
| | | | | |
Net expenses (d) | | | 1.00 | % †† | | | 1.07 | % | | | 1.15 | % | | | 1.15 | % | | | 1.25 | % †† |
| | | | | |
Expenses (before waiver/reimbursement) (d) | | | 1.12 | % †† | | | 1.12 | % | | | 1.15 | % | | | 1.15 | % | | | 1.25 | % †† |
| | | | | |
Portfolio turnover rate | | | 117 | % | | | 257 | % | | | 161 | % | | | 159 | % | | | 180 | % |
| | | | | |
Net assets at end of period (in 000’s) | | $ | 259,643 | | | $ | 317,216 | | | $ | 136,965 | | | $ | 176,295 | | | $ | 175,015 | |
| ‡ | Less than one cent per share. |
| (a) | Per share data based on average shares outstanding during the period. |
| (b) | Total return does not reflect any deduction of sales charges, mortality and expense charges, contract charges or administrative charges. For periods of less than one year, total return is not annualized. |
| (c) | Total investment return may reflect adjustments to conform to generally accepted accounting principles. |
| (d) | In addition to the fees and expenses which the Portfolio bears directly, it also indirectly bears a pro-rata share of the fees and expenses of the underlying funds in which it invests. Such indirect expenses are not included in the above expense ratios. |
| | | | | | |
The notes to the financial statements are an integral part of,
and should be read in conjunction with, the financial statements. | | | | | 23 | |
Notes to Financial Statements (Unaudited)
Note 1–Organization and Business
MainStay VP Funds Trust (the “Fund”) was organized as a Delaware statutory trust on February 1, 2011. The Fund is registered under the Investment Company Act of 1940, as amended (the “1940 Act”), as an open-end management investment company. The Fund is comprised of thirty-one separate series (collectively referred to as the “Portfolios”). These financial statements and notes relate to the MainStay VP MacKay Small Cap Core Portfolio (the “Portfolio”), a “diversified” portfolio, as that term is defined in the 1940 Act, as interpreted or modified by regulatory authorities having jurisdiction, from time to time.
Shares of the Portfolio are currently offered to certain separate accounts to fund variable annuity policies and variable universal life insurance policies issued by New York Life Insurance and Annuity Corporation (“NYLIAC”), a wholly-owned subsidiary of New York Life Insurance Company (“New York Life”) and may also be offered to fund variable annuity policies and variable universal life insurance policies issued by other insurance companies. NYLIAC allocates shares of the Portfolios to, among others, certain NYLIAC separate accounts. Shares of the Portfolio are also offered to the MainStay VP Conservative Allocation Portfolio, MainStay VP Moderate Allocation Portfolio, MainStay VP Moderate Growth Allocation Portfolio and MainStay VP Growth Allocation Portfolio, which operate as “funds-of-funds,” and other variable insurance funds.
The Portfolio currently offers two classes of shares. Initial Class and Service Class shares commenced operations on May 2, 2016. Shares of the Portfolio are offered and are redeemed at a price equal to their respective net asset value (“NAV”) per share. No sales or redemption charge is applicable to the purchase or redemption of the Portfolio’s shares. Under the terms of the Fund’s multiple class plan adopted pursuant to Rule 18f-3 under the 1940 Act, the classes differ in that, pursuant to a plan adopted in accordance with Rule 12b-1 under the 1940 Act, Service Class shares of the Portfolio pay a combined distribution and service fee of 0.25% of average daily net assets to the Distributor (as defined below) of their shares.
The Portfolio’s investment objective is to seek long-term growth of capital.
Note 2–Significant Accounting Policies
The Portfolio is an investment company and accordingly follows the investment company accounting and reporting guidance of the Financial Accounting Standards Board (“FASB”) Accounting Standard Codification Topic 946 Financial Services—Investment Companies. The Portfolio prepares its financial statements in accordance with generally accepted accounting principles (“GAAP”) in the United States of America and follows the significant accounting policies described below.
(A) Securities Valuation. Investments are usually valued as of the close of regular trading on the New York Stock Exchange (the “Exchange”) (usually 4:00 p.m. Eastern time) on each day the Portfolio is open for business (“valuation date”).
The Board of Trustees of the Fund (the “Board”) adopted procedures establishing methodologies for the valuation of the Portfolio’s securities and other assets and delegated the responsibility for valuation determinations under those procedures to the Valuation Committee of the Fund (the “Valuation Committee”). The procedures state that, subject to the
oversight of the Board and unless otherwise noted, the responsibility for the day-to-day valuation of portfolio assets (including fair value measurements for the Portfolio’s assets and liabilities) rests with New York Life Investment Management LLC (“New York Life Investments” or the “Manager”), aided to whatever extent necessary by the Subadvisor (as defined in Note 3(A)). To assess the appropriateness of security valuations, the Manager, the Subadvisor or the Portfolio’s third-party service provider, who is subject to oversight by the Manager, regularly compares prior day prices, prices on comparable securities and the sale prices to the prior and current day prices and challenges prices with changes exceeding certain tolerance levels with third-party pricing services or broker sources.
The Board authorized the Valuation Committee to appoint a Valuation Subcommittee (the “Subcommittee”) to establish the prices of securities for which market quotations are not readily available or the prices of which are not otherwise readily determinable under the procedures. The Subcommittee meets (in person, via electronic mail or via teleconference) on an as-needed basis. The Valuation Committee meets to ensure that actions taken by the Subcommittee were appropriate.
For those securities valued through either a standardized fair valuation methodology or a fair valuation measurement, the Subcommittee deals with such valuation and the Valuation Committee reviews and affirms, if appropriate, the reasonableness of the valuation based on such methodologies and measurements on a regular basis after considering information that is reasonably available and deemed relevant by the Valuation Committee. Any action taken by the Subcommittee with respect to the valuation of a portfolio security or other asset is submitted for review and ratification (if appropriate) to the Valuation Committee and the Board at the next regularly scheduled meeting.
“Fair value” is defined as the price the Portfolio would reasonably expect to receive upon selling an asset or liability in an orderly transaction to an independent buyer in the principal or most advantageous market for the asset or liability. Fair value measurements are determined within a framework that establishes a three-tier hierarchy that maximizes the use of observable market data and minimizes the use of unobservable inputs to establish a classification of fair value measurements for disclosure purposes. “Inputs” refer broadly to the assumptions that market participants would use in pricing the asset or liability, including assumptions about risk, such as the risk inherent in a particular valuation technique used to measure fair value using a pricing model and/or the risk inherent in the inputs for the valuation technique. Inputs may be observable or unobservable. Observable inputs reflect the assumptions market participants would use in pricing the asset or liability based on market data obtained from sources independent of the Portfolio. Unobservable inputs reflect the Portfolio’s own assumptions about the assumptions market participants would use in pricing the asset or liability based on the information available. The inputs or methodology used for valuing assets or liabilities may not be an indication of the risks associated with investing in those assets or liabilities. The three-tier hierarchy of inputs is summarized below.
| • | | Level 1—quoted prices in active markets for an identical asset or liability |
| • | | Level 2—other significant observable inputs (including quoted prices for a similar asset or liability in active markets, interest rates and yield curves, prepayment speeds, credit risk, etc.) |
| | |
| 24 | | MainStay VP MacKay Small Cap Core Portfolio |
| • | | Level 3—significant unobservable inputs (including the Portfolio’s own assumptions about the assumptions that market participants would use in measuring fair value of an asset or liability) |
The level of an asset or liability within the fair value hierarchy is based on the lowest level of an input, both individually and in the aggregate, that is significant to the fair value measurement. The aggregate value by input level of the Portfolio’s assets and liabilities as of June 30, 2020 is included at the end of the Portfolio of Investments.
The Portfolio may use third-party vendor evaluations, whose prices may be derived from one or more of the following standard inputs, among others:
| | |
• Broker/dealer quotes | | • Benchmark securities |
• Two-sided markets | | • Reference data (corporate actions or material event notices) |
• Bids/offers | | • Monthly payment information |
• Industry and economic events | | • Reported trades |
An asset or liability for which market values cannot be measured using the methodologies described above is valued by methods deemed reasonable in good faith by the Valuation Committee, following the procedures established by the Board, to represent fair value. Under these procedures, the Portfolio generally uses a market-based approach which may use related or comparable assets or liabilities, recent transactions, market multiples, book values and other relevant information. The Portfolio may also use an income-based valuation approach in which the anticipated future cash flows of the asset or liability are discounted to calculate fair value. Discounts may also be applied due to the nature and/or duration of any restrictions on the disposition of the asset or liability. Fair value represents a good faith approximation of the value of a security. Fair value determinations involve the consideration of a number of subjective factors, an analysis of applicable facts and circumstances and the exercise of judgment. As a result, it is possible that the fair value for a security determined in good faith in accordance with the Portfolio’s valuation procedures may differ from valuations for the same security determined by other funds using their own valuation procedures. Although the Portfolio’s valuation procedures are designed to value a security at the price the Portfolio may reasonably expect to receive upon the security’s sale in an orderly transaction, there can be no assurance that any fair value determination thereunder would, in fact, approximate the amount that the Portfolio would actually realize upon the sale of the security or the price at which the security would trade if a reliable market price were readily available. During the six-month period ended June 30, 2020, there were no material changes to the fair value methodologies.
Securities which may be valued in this manner include, but are not limited to: (i) a security for which trading has been halted or suspended; (ii) a debt security that has recently gone into default and for which there is not a current market quotation; (iii) a security of an issuer that has entered into a restructuring; (iv) a security that has been delisted from a national exchange; (v) a security for which the market price is not readily available from a third-party pricing source or, if so provided, does not, in the opinion of the Manager or the Subadvisor, reflect the security’s market value; (vi) a security subject to trading collars for which no or limited trading takes place; and (vii) a security whose principal market has been temporarily closed at a time when, under
normal conditions, it would be open. Securities valued in this manner are generally categorized as Level 3 in the hierarchy. As of June 30, 2020, no securities held by the Portfolio were fair valued in such a manner.
Equity securities and Exchange-Traded Funds (“ETFs”) are valued at the last quoted sales prices as of the close of regular trading on the relevant exchange on each valuation date. Securities that are not traded on the valuation date are valued at the mean of the last quoted bid and ask prices. Prices are normally taken from the principal market in which each security trades. These securities are generally categorized as Level 1 in the hierarchy.
Investments in mutual funds, including money market funds, are valued at their respective NAVs as of the close of the Exchange on the valuation date. These securities are generally categorized as Level 1 in the hierarchy.
Temporary cash investments acquired in excess of 60 days to maturity at the time of purchase are valued using the latest bid prices or using valuations based on a matrix system (which considers such factors as security prices, yields, maturities and ratings), both as furnished by independent pricing services. Temporary cash investments that mature in 60 days or less at the time of purchase (“Short-Term Investments”) are valued using the amortized cost method of valuation, unless the use of such method would be inappropriate. The amortized cost method involves valuing a security at its cost on the date of purchase and thereafter assuming a constant amortization to maturity of the difference between such cost and the value on maturity date. Amortized cost approximates the current fair value of a security. Securities valued using the amortized cost method are not valued using quoted prices in an active market and are generally categorized as Level 2 in the hierarchy.
The information above is not intended to reflect an exhaustive list of the methodologies that may be used to value portfolio investments. The valuation procedures permit the use of a variety of valuation methodologies in connection with valuing portfolio investments. The methodology used for a specific type of investment may vary based on the market data available or other considerations. The methodologies summarized above may not represent the specific means by which portfolio investments are valued on any particular business day.
(B) Income Taxes. The Portfolio’s policy is to comply with the requirements of the Internal Revenue Code of 1986, as amended (the “Internal Revenue Code”), applicable to regulated investment companies and to distribute all of its taxable income to the shareholders of the Portfolio within the allowable time limits.
The Manager evaluates the Portfolio’s tax positions to determine if the tax positions taken meet the minimum recognition threshold in connection with accounting for uncertainties in income tax positions taken or expected to be taken for the purposes of measuring and recognizing tax liabilities in the financial statements. Recognition of tax benefits of an uncertain tax position is permitted only to the extent the position is “more likely than not” to be sustained assuming examination by taxing authorities. The Manager analyzed the Portfolio’s tax positions taken on federal, state and local income tax returns for all open tax years (for up to three tax years) and has concluded that no provisions for federal, state and local income tax are required in the Portfolio’s financial statements. The Portfolio’s federal, state and local income tax and
Notes to Financial Statements (Unaudited) (continued)
federal excise tax returns for tax years for which the applicable statutes of limitations have not expired are subject to examination by the Internal Revenue Service and state and local departments of revenue.
(C) Dividends and Distributions to Shareholders. Dividends and distributions are recorded on the ex-dividend date. The Portfolio intends to declare and pay dividends from net investment income and distributions from net realized capital and currency gains, if any, at least annually. Unless a shareholder elects otherwise, all dividends and distributions are reinvested at NAV in the same class of shares of the Portfolio. Dividends and distributions to shareholders are determined in accordance with federal income tax regulations and may differ from determinations using GAAP.
(D) Security Transactions and Investment Income. The Portfolio records security transactions on the trade date. Realized gains and losses on security transactions are determined using the identified cost method. Dividend income is recognized on the ex-dividend date, net of any foreign tax withheld at the source, and interest income is accrued as earned using the effective interest rate method. Distributions received from real estate investment trusts may be classified as dividends, capital gains and/or return of capital.
Investment income and realized and unrealized gains and losses on investments of the Portfolio are allocated pro rata to the separate classes of shares based upon their relative net assets on the date the income is earned or realized and unrealized gains and losses are incurred.
(E) Expenses. Expenses of the Fund are allocated to the individual Portfolios in proportion to the net assets of the respective Portfolios when the expenses are incurred, except where direct allocations of expenses can be made. Expenses (other than fees incurred under the distribution and service plans, further discussed in Note 3(B), which are charged directly to the Service Class shares) are allocated to separate classes of shares pro rata based upon their relative net assets on the date the expenses are incurred. The expenses borne by the Portfolio, including those of related parties to the Portfolio, are shown in the Statement of Operations.
Additionally, the Portfolio may invest in ETFs and mutual funds, which are subject to management fees and other fees that may cause the costs of investing in ETFs and mutual funds to be greater than the costs of owning the underlying securities directly. These indirect expenses of ETFs and mutual funds are not included in the amounts shown as expenses in the Portfolio’s Statement of Operations or in the expense ratios included in the Financial Highlights.
(F) Use of Estimates. In preparing financial statements in conformity with GAAP, the Manager makes estimates and assumptions that affect the reported amounts and disclosures in the financial statements. Actual results could differ from those estimates.
(G) Repurchase Agreements. The Portfolio may enter into repurchase agreements (i.e., buy a security from another party with the agreement that it will be sold back in the future) to earn income. The Portfolio may enter into repurchase agreements only with counterparties, usually financial institutions, that are deemed by the Manager or the Subadvisor to be creditworthy, pursuant to guidelines established by the Board. During the term of any repurchase agreement, the Manager
or the Subadvisor will continue to monitor the creditworthiness of the counterparty. Under the 1940 Act, repurchase agreements are considered to be collateralized loans by the Portfolio to the counterparty secured by the securities transferred to the Portfolio.
Repurchase agreements are subject to counterparty risk, meaning the Portfolio could lose money by the counterparty’s failure to perform under the terms of the agreement. The Portfolio mitigates this risk by ensuring the repurchase agreement is collateralized by cash, U.S. government securities, fixed income securities and/or other securities. The collateral is held by the Portfolio’s custodian and valued daily on a mark to market basis to determine if the value, including accrued interest, exceeds the repurchase price. In the event of the counterparty’s default on the obligation to repurchase, the Portfolio has the right to liquidate the collateral and apply the proceeds in satisfaction of the obligation. Under certain circumstances, such as in the event of default or bankruptcy by the counterparty, realization and/or retention of the collateral may be limited or subject to delay, to legal proceedings and possible realized loss to the Portfolio. As of June 30, 2020, the Portfolio did not hold any repurchase agreements.
(H) Securities Lending. In order to realize additional income, the Portfolio may engage in securities lending, subject to the limitations set forth in the 1940 Act and relevant guidance by the staff of the Securities and Exchange Commission (“SEC”). If the Portfolio engages in securities lending, the Portfolio will lend through its custodian, currently State Street Bank and Trust Company (“State Street”), acting as securities lending agent on behalf of the Portfolio. Under the current arrangement, State Street will manage the Portfolio’s collateral in accordance with the securities lending agency agreement between the Portfolio and State Street, and indemnify the Portfolio against counterparty risk. The loans will be collateralized by cash (which may be invested in a money market fund) and/or non-cash collateral (which may include U.S. Treasury securities and/or U.S. government agency securities issued or guaranteed by the United States government or its agencies or instrumentalities) at least equal at all times to the market value of the securities loaned. The Portfolio bears the risk of delay in recovery of, or loss of rights in, the securities loaned. The Portfolio may also record a realized gain or loss on securities deemed sold due to a borrower’s inability to return securities on loan. The Portfolio bears the risk of any loss on investment of cash collateral. The Portfolio will receive compensation for lending its securities in the form of fees or it will retain a portion of interest earned on the investment of any cash collateral. The Portfolio will also continue to receive interest and dividends on the securities loaned and any gain or loss in the market price of the securities loaned that may occur during the term of the loan will be for the account of the Portfolio. Income earned from securities lending activities, if any, is reflected in the Statement of Operations. As of June 30, 2020, the Portfolio had securities on loan with an aggregate market value of $14,449,805; the total market value of collateral held by the Portfolio was $14,873,270. The market value of the collateral held included non-cash collateral, in the form of U.S. Treasury securities, with a value of $2,996,312 and cash collateral, which was invested into the State Street Navigator Securities Lending Government Money Market Portfolio, with a value of $11,876,958.
(I) Indemnifications. Under the Fund’s organizational documents, its officers and trustees are indemnified against certain liabilities that may arise out of performance of their duties to the Fund. Additionally, in
| | |
| 26 | | MainStay VP MacKay Small Cap Core Portfolio |
the normal course of business, the Portfolio enters into contracts with third-party service providers that contain a variety of representations and warranties and that may provide general indemnifications. The Portfolio’s maximum exposure under these arrangements is unknown, as this would involve future claims that may be made against the Portfolio that have not yet occurred. The Manager believes that the risk of loss in connection with these potential indemnification obligations is remote. However, there can be no assurance that material liabilities related to such obligations will not arise in the future, which could adversely impact the Portfolio.
Note 3–Fees and Related Party Transactions
(A) Manager and Subadvisor. New York Life Investments, a registered investment adviser and an indirect, wholly-owned subsidiary of New York Life, serves as the Portfolio’s Manager pursuant to an Amended and Restated Management Agreement (“Management Agreement”). The Manager provides offices, conducts clerical, recordkeeping and bookkeeping services, and keeps most of the financial and accounting records required to be maintained by the Portfolio. Except for the portion of salaries and expenses that are the responsibility of the Portfolio, the Manager pays the salaries and expenses of all personnel affiliated with the Portfolio and certain operational expenses of the Portfolio. The Portfolio reimburses New York Life Investments in an amount equal to the portion of the compensation of the Chief Compliance Officer attributable to the Portfolio. MacKay Shields LLC (“MacKay Shields” or “Subadvisor”), a registered investment adviser and an indirect, wholly-owned subsidiary of New York Life, serves as Subadvisor to the Portfolio and is responsible for the day-to-day portfolio management of the Portfolio. Pursuant to the terms of an Amended and Restated Subadvisory Agreement (“Subadvisory Agreement”) between New York Life Investments and MacKay Shields, New York Life Investments pays for the services of the Subadvisor.
The Fund, on behalf of the Portfolio, pays New York Life Investments in its capacity as the Portfolio’s investment manager and administrator, pursuant to the Management Agreement, a monthly fee for the services performed and the facilities furnished at an annual percentage of the Portfolio’s average daily net assets as follows: 0.80% up to $1 billion, 0.775% from $1 billion to $2 billion and 0.75% in excess of $2 billion. During the six-month period ended June 30, 2020, the effective management fee rate was 0.80%.
Effective January 31, 2020, New York Life Investments has contractually agreed to waive fees and/or reimburse expenses so that the total annual operating expenses (excluding taxes, interest, litigation, extraordinary expenses, brokerage and other transaction expenses relating to the purchase or sale of portfolio investments, and acquired (underlying) fund fees and expenses) of Initial Class shares do not
exceed 0.74% of average daily net assets. New York Life Investments will apply an equivalent waiver or reimbursement to Service Class shares. This agreement will remain in effect until May 1, 2021, and shall renew automatically for one-year terms unless New York Life Investments provides written notice of termination prior to the start of the next term or upon approval of the Board. Prior to May 1, 2020, New York Life Investments had agreed to waive fees and/or reimburse expenses so that the total annual operating expenses (excluding taxes, interest, litigation, extraordinary expenses, brokerage and other transaction expenses relating to the purchase or sale of portfolio investments, and acquired (underlying) fund fees and expenses) of Initial Class shares do not exceed 0.80% of average daily net assets. New York Life Investments will apply an equivalent waiver or reimbursement to Service Class shares.
During the six-month period ended June 30, 2020, New York Life Investments earned fees from the Portfolio in the amount of $1,662,706 and waived fees/reimbursed expenses in the amount of $236,521 and paid the Subadvisor in the amount of $713,093.
State Street provides sub-administration and sub-accounting services to the Portfolio pursuant to an agreement with New York Life Investments. These services include calculating the daily NAVs of the Portfolio, maintaining the general ledger and sub-ledger accounts for the calculation of the Portfolio’s NAVs and assisting New York Life Investments in conducting various aspects of the Portfolio’s administrative operations. For providing these services to the Portfolio, State Street is compensated by New York Life Investments.
Pursuant to an agreement between the Fund and New York Life Investments, New York Life Investments is responsible for providing or procuring certain regulatory reporting services for the Portfolio. The Portfolio will reimburse New York Life Investments for the actual costs incurred by New York Life Investments in connection with providing or procuring these services for the Portfolio.
(B) Distribution and Service Fees. The Fund, on behalf of the Portfolio, has entered into a distribution agreement with NYLIFE Distributors LLC (the “Distributor”), an indirect, wholly-owned subsidiary of New York Life. The Portfolio has adopted a distribution plan (the “Plan”) in accordance with the provisions of Rule 12b-1 under the 1940 Act. Under the Plan, the Distributor has agreed to provide, through its affiliates or independent third parties, various distribution-related, shareholder and administrative support services to the Service Class shareholders. For its services, the Distributor is entitled to a combined distribution and service fee accrued daily and paid monthly at an annual rate of 0.25% of the average daily net assets attributable to the Service Class shares of the Portfolio.
(C) Investments in Affiliates (in 000’s). During the six-month period ended June 30, 2020, purchases and sales transactions, income earned from investments and shares held of investment companies managed by New York Life Investments or its affiliates were as follows:
| | | | | | | | | | | | | | | | | | | | | | | | | | | | | | | | | | | | |
Affiliated Investment Company | | Value, Beginning of Period | | | Purchases at Cost | | | Proceeds from Sales | | | Net Realized Gain/(Loss) on Sales | | | Change in Unrealized Appreciation/ (Depreciation) | | | Value, End of Period | | | Dividend Income | | | Other Distributions | | | Shares End of Period | |
| | | | | | | | | |
MainStay U.S. Government Liquidity Fund | | $ | — | | | $ | 15,367 | | | $ | (15,367 | ) | | $ | — | | | $ | — | | | $ | — | | | $ | 1 | | | $ | — | | | | — | |
Notes to Financial Statements (Unaudited) (continued)
Note 4–Federal Income Tax
As of June 30, 2020, the cost and unrealized appreciation (depreciation) of the Portfolio’s investment portfolio, including applicable derivative contracts and other financial instruments, as determined on a federal income tax basis, was as follows:
| | | | | | | | | | | | | | | | |
| | | Federal Tax
Cost | | | Gross
Unrealized
Appreciation | | | Gross
Unrealized
(Depreciation) | | | Net
Unrealized
Appreciation/
(Depreciation) | |
| | | | |
Investments in Securities | | $ | 433,407,339 | | | $ | 41,989,429 | | | $ | (45,255,715 | ) | | $ | (3,266,286 | ) |
As of June 30, 2020, for federal income tax purposes, capital loss carryforwards of $28,455,160, as shown in the table below, were available to the extent provided by the regulations to offset future realized gains of the Portfolio through the years indicated. Accordingly, no capital gains distributions are expected to be paid to shareholders until net gains have been realized in excess of such amounts.
| | | | |
Capital Loss
Available Through | | Short-Term Capital Loss
Amounts (000’s) | | Long-Term Capital Loss
Amounts (000’s) |
| | |
| Unlimited | | $28,455 | | $ — |
During the year ended December 31, 2019, the tax character of distributions paid as reflected in the Statements of Changes in Net Assets was as follows:
| | |
|
| 2019 |
Tax-Based
Distributions from Ordinary
Income | | Tax-Based
Distributions from Long-Term
Gains |
| |
| $14,795,365 | | $27,429,043 |
Note 5–Custodian
State Street is the custodian of cash and securities held by the Portfolio. Custodial fees are charged to the Portfolio based on the Portfolio’s net assets and/or the market value of securities held by the Portfolio and the number of certain transactions incurred by the Portfolio.
Note 6–Line of Credit
The Portfolio and certain other funds managed by New York Life Investments maintain a line of credit with a syndicate of banks in order to secure a source of funds for temporary purposes to meet unanticipated or excessive redemption requests.
Effective July 28, 2020, under the credit agreement (the “Credit Agreement”), the aggregate commitment amount is $600,000,000 with an additional uncommitted amount of $100,000,000. The commitment fee is an annual rate of 0.15% of the average commitment amount payable quarterly, regardless of usage, to JP Morgan Chase Bank NA, who serves as the agent to the syndicate. The commitment fee is allocated among the Portfolio and certain other funds managed by New York Life Investments based upon their respective net assets and other factors. Interest on any revolving credit loan is charged based upon the Federal Funds Rate or the one-month London Interbank Offered Rate
(“LIBOR”), whichever is higher. The Credit Agreement expires on July 27, 2021, although the Portfolio, certain other funds managed by New York Life Investments and the syndicate of banks may renew the Credit Agreement for an additional year on the same or different terms or enter into a credit agreement with a different syndicate of banks. Prior to July 28, 2020, the aggregate commitment amount and the commitment fee were the same as those under the current Credit Agreement, but State Street served as agent to the syndicate. As of June 30, 2020, there were no borrowings made or outstanding with respect to the Portfolio under the Credit Agreement or the credit agreement for which State Street served as agent.
Note 7–Interfund Lending Program
Pursuant to an exemptive order issued by the SEC, the Portfolio, along with certain other funds managed by New York Life Investments, may participate in an interfund lending program. The interfund lending program provides an alternative credit facility that permits the Portfolio and certain other funds managed by New York Life Investments to lend or borrow money for temporary purposes directly to or from one another subject to the conditions of the exemptive order. During the six-month period ended June 30, 2020, there were no interfund loans made or outstanding with respect to the Portfolio.
Note 8–Purchases and Sales of Securities (in 000’s)
During the six-month period ended June 30, 2020, purchases and sales of securities, other than short-term securities, were $497,032 and $507,677, respectively.
Note 9–Capital Share Transactions
Transactions in capital shares for the six-month period ended June 30, 2020 and the year ended December 31, 2019, were as follows:
| | | | | | | | |
Initial Class | | Shares | | | Amount | |
| | |
Six-month period ended June 30, 2020: | | | | | | | | |
| | |
Shares sold | | | 334,263 | | | $ | 2,618,400 | |
Shares redeemed | | | (957,544 | ) | | | (8,868,842 | ) |
| | | | |
Net increase (decrease) | | | (623,281 | ) | | $ | (6,250,442 | ) |
| | | | |
| | |
Year ended December 31, 2019: | | | | | | | | |
| | |
Shares sold | | | 1,083,800 | | | $ | 11,864,785 | |
| | |
Shares issued in connection with the acquisition of MainStay VP Epoch U.S. Small Cap Portfolio | | | 20,218,171 | | | | 228,363,711 | |
| | |
Shares issued to shareholders in reinvestment of distributions | | | 1,957,293 | | | | 18,699,244 | |
Shares redeemed | | | (17,249,518 | ) | | | (181,221,905 | ) |
| | | | |
Net increase (decrease) | | | 6,009,746 | | | $ | 77,705,835 | |
| | | | |
| | |
| | | | | | | | |
| | |
| 28 | | MainStay VP MacKay Small Cap Core Portfolio |
| | | | | | | | |
Service Class | | Shares | | | Amount | |
| | |
Six-month period ended June 30, 2020: | | | | | | | | |
| | |
Shares sold | | | 2,580,549 | | | $ | 19,662,942 | |
| | |
Shares redeemed | | | (2,835,165 | ) | | | (25,206,919 | ) |
| | | | |
Net increase (decrease) | | | (254,616 | ) | | $ | (5,543,977 | ) |
| | | | |
| | |
Year ended December 31, 2019: | | | | | | | | |
| | |
Shares sold | | | 1,425,683 | | | $ | 14,881,725 | |
| | |
Shares issued in connection with the acquisition of MainStay VP Epoch U.S. Small Cap Portfolio | | | 17,008,219 | | | | 190,690,001 | |
| | |
Shares issued to shareholders in reinvestment of distributions | | | 2,481,334 | | | | 23,525,164 | |
| | |
Shares redeemed | | | (4,919,326 | ) | | | (52,020,617 | ) |
| | | | |
Net increase (decrease) | | | 15,995,910 | | | $ | 177,076,273 | |
| | | | | | | | |
Note 10–Recent Accounting Pronouncement
In March 2020, the Financial Accounting Standards Board (“FASB”) issued Accounting Standards Update 2020-04 (“ASU 2020-04”), which provides optional guidance to ease the potential accounting burden associated with transitioning away from LIBOR and other reference rates that are expected to be discontinued. ASU 2020-04 is effective immediately upon release of the update on March 12, 2020 through December 31, 2022. At this time, the Manager is evaluating the implications of certain other provisions of ASU 2020-04 related to new disclosure requirements and any impact on the financial statement disclosures has not yet been determined.
Note 11–Subsequent Events
In connection with the preparation of the financial statements of the Portfolio as of and for the six-month period ended June 30, 2020, events and transactions subsequent to June 30, 2020, through the date the financial statements were issued have been evaluated by the Manager, for possible adjustment and/or disclosure. No subsequent events requiring financial statement adjustment or disclosure have been identified.
Note 12–Other Matters
An outbreak of COVID-19, first detected in December 2019, has developed into a global pandemic and has resulted in travel restrictions, closure of international borders, certain businesses and securities markets, restrictions on securities trading activities, prolonged quarantines, supply chain disruptions, and lower consumer demand, as well as general concern and uncertainty. The continued impact of COVID-19 is uncertain and could further adversely affect the global economy, national economies, individual issuers and capital markets in unforeseeable ways and result in a substantial and extended economic downturn. Developments that disrupt global economies and financial markets, such as COVID-19, may magnify factors that affect the Portfolio’s performance.
Discussion of the Operation and Effectiveness of the Portfolio’s Liquidity Risk Management Program (Unaudited)
In compliance with Rule 22e-4 under the Investment Company Act of 1940, as amended (the “Liquidity Rule”), the Portfolio has adopted and implemented a liquidity risk management program (the “Program”), which New York Life Investment Management LLC believes is reasonably designed to assess and manage the Portfolio’s liquidity risk. The Board designated New York Life Investment Management LLC as administrator of the Program (the “Administrator”). The Administrator has established a Liquidity Risk Management Committee to assist the Administrator in the implementation and day-to-day administration of the Program and to otherwise support the Administrator in fulfilling its responsibilities under the Program.
At a meeting of the Board held on March 11, 2020, the Administrator provided the Board with a written report addressing the Program’s operation, adequacy and effectiveness of implementation for the period from December 1, 2018 through December 31, 2019, as required under the Liquidity Rule. The report noted that the Administrator concluded that (i) the Program operated effectively to assess and manage the Portfolio’s liquidity risk, (ii) the Program has been adequately and effectively implemented to monitor and, as applicable, respond to the Portfolio’s liquidity developments and (iii) the Portfolio’s investment strategy continues to be appropriate for an open-end portfolio.
In accordance with the Program, the Portfolio’s liquidity risk is assessed no less frequently than annually taking into consideration certain factors, as applicable, such as (i) investment strategy and liquidity of portfolio investments, (ii) short-term and long-term cash flow projections and (iii) holdings of cash and cash equivalents and borrowing arrangements and other funding sources. Certain factors are considered under both normal and reasonably foreseeable stressed conditions.
Each Portfolio portfolio investment is classified into one of four liquidity categories. The classification is based on a determination of the number of days it is reasonably expected to take to convert the investment into cash, or sell or dispose of the investment, in current market conditions without significantly changing the market value of the investment. The Administrator has delegated liquidity classification determinations to the Portfolio’s subadvisor, subject to appropriate oversight by the Administrator, and classification determinations are made by taking into account the Portfolio’s reasonably anticipated trade size, various market, trading and investment-specific considerations, as well as market depth, and, in certain cases, third-party vendor data.
The Liquidity Rule requires portfolios that do not primarily hold assets that are highly liquid investments to adopt a minimum amount of net assets that must be invested in highly liquid investments that are assets (an “HLIM”). In addition, the Liquidity Rule limits a portfolio’s investments in illiquid investments. Specifically, the Liquidity Rule prohibits acquisition of illiquid investments if doing so would result in a portfolio holding more than 15% of its net assets in illiquid investments that are assets. The Program includes provisions reasonably designed to determine, periodically review and comply with the HLIM requirement, as applicable, and to comply with the 15% limit on illiquid investments.
| | |
| 30 | | MainStay VP MacKay Small Cap Core Portfolio |
Proxy Voting Policies and Procedures and Proxy Voting Record
A description of the policies and procedures that New York Life Investments uses to vote proxies related to the Portfolio’s securities is available free of charge upon request (i) by calling 800-598-2019; (ii) by visiting New York Life Investments’ website at https://www.nylinvestments.com/mainstay/products-and-performance/mainstay-vp-funds-trust; or (iii) by visiting the SEC’s website at www.sec.gov.
The Portfolio is required to file with the SEC its proxy voting record for the 12-month period ending June 30 on Form N-PX. The Portfolio’s most recent Form N-PX or proxy voting record is available free of charge upon request (i) by calling 800-598-2019; (ii) by visiting New York Life Investments’ website at https://www.nylinvestments.com/mainstay/products-and-performance/mainstay-vp-funds-trust ; or (iii) by visiting the SEC’s website at www.sec.gov.
Shareholder Reports and Quarterly Portfolio Disclosure
The Portfolio is required to file its complete schedule of portfolio holdings with the SEC 60 days after its first and third fiscal quarter on Form N-PORT. The Portfolio’s holdings report is available free of charge upon request by calling 800-598-2019 or by visiting the SEC’s website at www.sec.gov.
MainStay VP Portfolios
MainStay VP offers a wide range of Portfolios. The full array of MainStay VP offerings is listed here, with information about the manager, subadvisors, legal counsel, and independent registered public accounting firm.
Equity Portfolios
MainStay VP Emerging Markets Equity Portfolio
MainStay VP Epoch U.S. Equity Yield Portfolio
MainStay VP Fidelity Institutional AM® Utilities Portfolio†
MainStay VP MacKay Common Stock Portfolio
MainStay VP MacKay Growth Portfolio
MainStay VP MacKay International Equity Portfolio
MainStay VP MacKay Mid Cap Core Portfolio
MainStay VP MacKay S&P 500 Index Portfolio
MainStay VP MacKay Small Cap Core Portfolio
MainStay VP Mellon Natural Resources Portfolio
MainStay VP Small Cap Growth Portfolio
MainStay VP T. Rowe Price Equity Income Portfolio
MainStay VP Winslow Large Cap Growth Portfolio
Mixed Asset Portfolios
MainStay VP Balanced Portfolio
MainStay VP Income Builder Portfolio
MainStay VP Janus Henderson Balanced Portfolio
MainStay VP MacKay Convertible Portfolio
Income Portfolios
MainStay VP Bond Portfolio
MainStay VP Floating Rate Portfolio
MainStay VP Indexed Bond Portfolio
MainStay VP MacKay Government Portfolio
MainStay VP MacKay High Yield Corporate Bond Portfolio
MainStay VP MacKay Unconstrained Bond Portfolio
MainStay VP PIMCO Real Return Portfolio
Money Market
MainStay VP U.S. Government Money Market Portfolio
Alternative
MainStay VP CBRE Global Infrastructure Portfolio
MainStay VP IQ Hedge Multi-Strategy Portfolio
Asset Allocation Portfolios
MainStay VP Conservative Allocation Portfolio
MainStay VP Growth Allocation Portfolio
MainStay VP Moderate Allocation Portfolio
MainStay VP Moderate Growth Allocation Portfolio
Manager
New York Life Investment Management LLC
New York, New York
Subadvisors
Brown Advisory LLC
Baltimore, Maryland
Candriam Belgium S.A.*
Brussels, Belgium
CBRE Clarion Securities LLC
Radnor, Pennsylvania
Epoch Investment Partners, Inc.
New York, New York
FIAM LLC
Smithfield, Rhode Island
IndexIQ Advisors LLC*
New York, New York
Janus Capital Management LLC
Denver, Colorado
MacKay Shields LLC*
New York, New York
Mellon Investments Corporation
Boston, Massachusetts
NYL Investors LLC*
New York, New York
Pacific Investment Management Company LLC
Newport Beach, California
Segall Bryant & Hamill, LLC
Chicago, Illinois
T. Rowe Price Associates, Inc.
Baltimore, Maryland
Winslow Capital Management, LLC
Minneapolis, Minnesota
Distributor
NYLIFE Distributors LLC*
Jersey City, New Jersey
Custodian
State Street Bank and Trust Company
Boston, Massachusetts
Independent Registered Public Accounting Firm
PricewaterhouseCoopers LLP
New York, New York
Legal Counsel
Dechert LLP
Washington, District of Columbia
Some Portfolios may not be available in all products.
| † | Fidelity Institutional AM is a registered trade mark of FMR LLC. Used with permission. |
| * | An affiliate of New York Life Investment Management LLC |
Not part of the Semiannual Report
2020 Semiannual Report
This report is for the general information of New York Life Variable Annuities and NYLIAC Variable Universal Life Insurance Products policyowners. It must be preceded or accompanied by the appropriate product(s) and funds prospectuses if it is given to anyone who is not an owner of a New York Life variable annuity policy or a NYLIAC Variable Universal Life Insurance Product. This report does not offer for sale or solicit orders to purchase securities.
The performance data quoted in this report represents past performance. Past performance is no guarantee of future results. Due to market volatility and other factors, current performance may be lower or higher than the figures shown. The most recent month-end performance summary for your variable annuity or variable life policy is available by calling 800-598-2019 and is updated periodically on www.newyorklife.com.
The New York Life Variable Annuities and NYLIAC Variable Universal Life Insurance Products are issued by New York Life Insurance and Annuity Corporation (a Delaware Corporation) and distributed by NYLIFE Distributors LLC (Member FINRA/SIPC).
New York Life Insurance Company
New York Life Insurance and Annuity Corporation (NYLIAC) (A Delaware Corporation)
51 Madison Avenue, Room 551
New York, NY 10010
www.newyorklife.com
Printed on recycled paper
nylinvestments.com
NYLIFE Distributors LLC, 30 Hudson Street, Jersey City, NJ 07302
New York Life Investment Management LLC is the investment manager to the MainStay VP Funds Trust
©2020 by NYLIFE Distributors LLC. All rights reserved.
You may obtain copies of the Prospectus and the Statement of Additional Information free of charge, upon request, by calling toll-free 800-598-2019 or writing to New York Life Insurance and Annuity Corporation, 51 Madison Avenue, New York, NY 10010.
| | | | |
| Not FDIC Insured | | No Bank Guarantee | | May Lose Value |
| | | | |
| 1781641 | | | | MSVPSCC10-08/20 (NYLIAC) NI530 |
MainStay VP T. Rowe Price Equity Income Portfolio
Message from the President and Semiannual Report
Unaudited | June 30, 2020
Beginning on January 1, 2021, as permitted by regulations adopted by the Securities and Exchange Commission, paper copies of the MainStay VP Portfolio annual and semi-annual shareholder reports may no longer be sent by mail, unless you specifically request paper copies of the reports from the insurance company that offers your policy. Instead, the reports will be made available online, and you will be notified by mail each time a report is posted and provided with a website link to access the report. Instructions for requesting paper copies will be provided by your insurance company.
If you already elected to receive shareholder reports electronically, you will not be affected by this change and you need not take any action. At any time, you may elect to receive reports and other communications from the insurance company electronically by following the instructions provided by the insurance company.
You may elect to receive all future shareholder reports in paper form free of charge. You can inform the insurance company that you wish to receive paper copies of reports by following the instructions provided by the insurance company. Your election to receive reports in paper form will apply to all portfolio companies available under your contract.
| | | | | | | | |
| Not FDIC/NCUA Insured | | Not a Deposit | | May Lose Value | | No Bank Guarantee | | Not Insured by Any Government Agency |

This page intentionally left blank
Message from the President
High levels of volatility shook financial markets in response to the COVID-19 pandemic and an abrupt decline in global economic activity during the six months ended June 30, 2020.
Markets entered 2020 riding strong fourth quarter performance and an economic expansion of historic longevity. Most broad stock and bond indices began to dip in late February as growing numbers of COVID-19 cases were seen in hotspots around the world. On March 11, 2020, the World Health Organization acknowledged that the disease had reached pandemic proportions, with over 80,000 identified cases in China, thousands in Italy, South Korea and the United States, and more in dozens of additional countries. Governments and central banks pledged trillions of dollars to address the mounting economic and public health crisis; however, “stay-at-home” orders and other restrictions on non-essential activity caused global economic activity to slow. Most stocks and bonds lost significant ground in this challenging environment, with equities declining by roughly a third and the yield on high-yield credit indices shooting higher.
Policymakers responded with extraordinary speed to address the situation. In the United States, the Federal Reserve (“Fed”) cut interest rates to near zero and announced unlimited quantitative easing. With help from Treasury, the Fed later rolled out a series of lending facilities to directly support market functioning. In late March, the Federal government declared a national emergency; Congress passed, and the President signed, a $2 trillion CARES Act (The Coronavirus Aid, Relief, and Economic Security Act), with the promise of further assistance for consumers and businesses to come. This enormous wave of policy support helped fuel a rapid recovery in market pricing as stocks bounced back and credit spreads narrowed. Some states rushed to ease restrictions on travel and social gatherings, further fueling optimism that the effects of the pandemic might prove short lived. However, the final weeks of the reporting period saw infection rates beginning to rise in some of the first states to reopen, raising concerns that a second round of restrictive government policies might prove necessary, once again stifling economic activity.
Despite all the market volatility, the broadly based S&P 500® Index finished the first half of 2020 only slightly below its starting point and the technology-heavy NASDAQ Composite Index posted gains, closing in near record territory. Small-cap stocks tended to trail their large cap counterparts, as illustrated by the Russell 2000® Index’s loss of approximately 15%, while value-oriented stocks lagged growth-oriented issues. From a global perspective, U.S. stocks generally outperformed international equities, with emerging markets hit particularly hard by the flight from risk.
Fixed-income markets also experienced unusually high levels of volatility. Recognized safe havens, such as U.S. government bonds, attracted increased investment, driving yields lower and prices higher, positioning long-term Treasury bonds to deliver particularly strong gains. Investment-grade corporate bonds lost value in March before recovering in the closing months of the reporting period, while relatively speculative high-yield credit faced the brunt of risk-off sentiment. Emerging market debt underperformed most other bonds types as investors sought to minimize currency and sovereign risks.
Today, as we at New York Life Investments continue to track the ongoing health crisis and its financial ramifications, we are particularly mindful of the people at the heart of our enterprise—our colleagues and valued clients. By taking appropriate steps to minimize community spread of COVID-19 within our organization, we strive to safeguard the health of our investment professionals so they can continue to provide you, as a MainStay investor, with world class investment solutions in this rapidly evolving environment.
Sincerely,

Kirk C. Lehneis
President
The opinions expressed are as of the date of this report and are subject to change. There is no guarantee that any forecast made will come to pass. This material does not constitute investment advice and is not intended as an endorsement of any specific investment. Past performance is no guarantee of future results.
Not part of the Semiannual Report
Table of Contents
Investors should refer to the Portfolio’s Summary Prospectus and/or Prospectus and consider the Portfolio’s investment objectives, strategies, risks, charges and expenses carefully before investing. The Summary Prospectus and/or Prospectus contain this and other information about the Portfolio. You may obtain copies of the Portfolio’s Summary Prospectus and/or the Prospectus and the Statement of Additional Information free of charge, upon request, by calling toll-free 800-598-2019, by writing to New York Life Insurance and Annuity Corporation, 51 Madison Avenue, Room 251, New York, New York 10010 or by sending an email to MainStayShareholdersServices@nylim.com. These documents are also available at nylinvestments.com/vpdocuments. Please read the Summary Prospectus and/or Prospectus carefully before investing. MainStay VP Funds Trust portfolios are separate account options which are purchased through a variable insurance or variable annuity contract.
Investment and Performance Comparison1 (Unaudited)
Performance data quoted represents past performance. Past performance is no guarantee of future results. Because of market volatility and other factors, current performance may be lower or higher than the figures shown. Investment return and principal value will fluctuate, and as a result, when shares are redeemed, they may be worth more or less than their original cost. The performance table and graph do not reflect any deduction of sales charges, mortality and expense charges, contract charges or administrative charges. Please refer to the Performance Summary appropriate for your policy. For performance information current to the most recent month-end, please call 800-598-2019 or visit www.newyorklife.com.
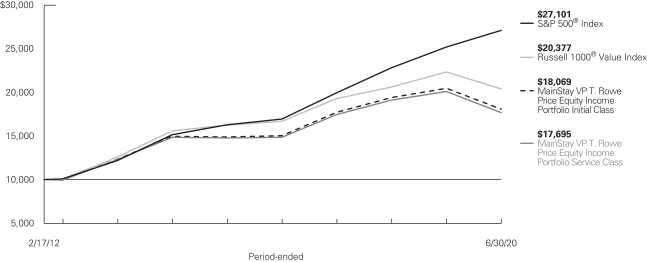
Average Annual Total Returns for the Period-Ended June 30, 2020
| | | | | | | | | | | | | | | | |
| Class | | Inception
Date | | Six Months | | One Year | | Five Years | | Since
Inception | | | Gross
Expense
Ratio2 | |
| | | | | | |
| Initial Class Shares | | 2/17/2012 | | –19.08% | | –11.67% | | 3.94% | | | 7.32 | % | | | 0.75 | % |
| Service Class Shares | | 2/17/2012 | | –19.18 | | –11.90 | | 3.68 | | | 7.05 | | | | 1.00 | |
| | | | | | | | | | | | | | | | |
| Benchmark Performance | | Six
Months | | | One
Year | | | Five
Years | | | Since
Inception | |
| | | | |
Russell 1000® Value Index3 | | | –16.26 | % | | | –8.84 | % | | | 4.64 | % | | | 8.88 | % |
S&P 500® Index4 | | | –3.08 | | | | 7.51 | | | | 10.73 | | | | 12.66 | |
Morningstar Large Value Category Average5 | | | –15.20 | | | | –7.59 | | | | 4.47 | | | | 7.86 | |
| 1. | Performance figures may reflect certain fee waivers and/or expense limitations, without which total returns may have been different. For information on current fee waivers and/or expense limitations (if any), please refer to the Notes to Financial Statements. |
| 2. | The gross expense ratios presented reflect the Portfolio’s “Total Annual Portfolio Operating Expenses” from the most recent Prospectus, as supplemented, and may differ from other expense ratios disclosed in this report. |
| 3. | The Russell 1000® Value Index is the Portfolio’s primary broad-based securities market index for comparison purposes. The Russell 1000® Value Index measures the performance of the large-cap value segment of the U.S. equity universe. It includes those Russell 1000® Index companies with lower price-to-book ratios and lower expected growth values. Results assume |
| | reinvestment of all dividends and capital gains. An investment cannot be made directly in an index. |
| 4. | The S&P 500® Index is the Portfolio’s secondary benchmark. “S&P 500®” is a trademark of the McGraw-Hill Companies, Inc. The S&P 500® Index is widely regarded as the standard index for measuring large-cap U.S. stock market performance. Results assume reinvestment of all dividends and capital gains. An investment cannot be made directly in an index. |
| 5. | The Morningstar Large Value Category Average is representative of funds that invest primarily in big U.S. companies that are less expensive or growing more slowly than other large-cap stocks. Results are based on average total returns of similar funds with all dividends and capital gain distributions reinvested. |
Cost in Dollars of a $1,000 Investment in MainStay VP T. Rowe Price Equity Income Portfolio (Unaudited)
The example below is intended to describe the fees and expenses borne by shareholders during the six-month period from January 1, 2020, to June 30, 2020, and the impact of those costs on your investment.
Example
As a shareholder of the Portfolio you incur two types of costs: (1) transaction costs, including exchange fees and sales charges (loads) on purchases (as applicable), and (2) ongoing costs, including management fees, distribution and/or service (12b-1) fees, and other Portfolio expenses (as applicable). This example is intended to help you understand your ongoing costs (in dollars) of investing in the Portfolio and to compare these costs with the ongoing costs of investing in other mutual funds. The example is based on an investment of $1,000 made at the beginning of the six-month period and held for the entire period from January 1, 2020, to June 30, 2020. Shares are only sold in connection with variable life and annuity contracts and the example does not reflect any contract level or transactional fees or expenses. If these costs had been included, your costs would have been higher.
This example illustrates your Portfolio’s ongoing costs in two ways:
Actual Expenses
The second and third data columns in the table below provide information about actual account values and actual expenses. You may use the information in these columns, together with the amount you invested, to estimate the expenses that you paid
during the six months ended June 30, 2020. Simply divide your account value by $1,000 (for example, an $8,600 account value divided by $1,000 = 8.6), then multiply the result by the number under the heading entitled “Expenses Paid During Period” to estimate the expenses you paid on your account during this period.
Hypothetical Example for Comparison Purposes
The fourth and fifth data columns in the table below provide information about hypothetical account values and hypothetical expenses based on the Portfolio’s actual expense ratio and an assumed rate of return of 5% per year before expenses, which is not the Portfolio’s actual return. The hypothetical account values and expenses may not be used to estimate the actual ending account balances or expenses you paid for the six-month period shown. You may use this information to compare the ongoing costs of investing in the Portfolio with the ongoing costs of investing in other mutual funds. To do so, compare this 5% hypothetical example with the 5% hypothetical examples that appear in the shareholder reports of the other mutual funds.
Please note that the expenses shown in the table are meant to highlight your ongoing costs only and do not reflect any transactional costs, such as exchange fees or sales charges (loads). Therefore, the fourth and fifth data columns of the table are useful in comparing ongoing costs only and will not help you determine the relative total costs of owning different funds. In addition, if these transactional costs were included, your costs would have been higher.
| | | | | | | | | | | | | | | | | | | | | | | | |
| | | | | | | | | | | | | | | | | | | |
| Share Class | | Beginning
Account
Value
1/1/20 | | | Ending Account
Value (Based
on Actual
Returns and
Expenses)
6/30/20 | | | Expenses
Paid
During
Period1 | | | Ending Account
Value (Based
on Hypothetical
5% Annualized
Return and
Actual Expenses)
6/30/20 | | | Expenses
Paid
During
Period1 | | | Net Expense
Ratio
During
Period2 | |
| | | | | | |
| Initial Class Shares | | $ | 1,000.00 | | | $ | 809.20 | | | $ | 3.42 | | | $ | 1,021.08 | | | $ | 3.82 | | | | 0.76 | % |
| | | | | | |
| Service Class Shares | | $ | 1,000.00 | | | $ | 808.20 | | | $ | 4.54 | | | $ | 1,019.84 | | | $ | 5.07 | | | | 1.01 | % |
| 1 | Expenses are equal to the Portfolio’s annualized expense ratio of each class multiplied by the average account value over the period, divided by 366 and multiplied by 182 (to reflect the six-month period). The table above represents the actual expenses incurred during the six-month period. In addition to the fees and expenses which the Portfolio bears directly, it also indirectly bears a pro rata share of the fees and expenses of the underlying funds in which it invests. Such indirect expenses are not included in the above-reported expense figures. |
| 2 | Expenses are equal to the Portfolio’s annualized expense ratio to reflect the six-month period. |
| | |
| 6 | | MainStay VP T. Rowe Price Equity Income Portfolio |
Industry Composition as of June 30, 2020 (Unaudited)
| | | | |
| |
| Insurance | | | 7.8 | % |
| |
| Oil, Gas & Consumable Fuels | | | 7.8 | |
| |
| Banks | | | 6.3 | |
| |
| Semiconductors & Semiconductor Equipment | | | 5.4 | |
| |
| Electric Utilities | | | 5.2 | |
| |
| Capital Markets | | | 4.7 | |
| |
| Pharmaceuticals | | | 4.6 | |
| |
| Equity Real Estate Investment Trusts | | | 4.1 | |
| |
| Multi-Utilities | | | 3.9 | |
| |
| Chemicals | | | 3.8 | |
| |
| Food Products | | | 3.8 | |
| |
| Health Care Equipment & Supplies | | | 3.7 | |
| |
| Media | | | 3.6 | |
| |
| Health Care Providers & Services | | | 3.3 | |
| |
| Biotechnology | | | 3.1 | |
| |
| Aerospace & Defense | | | 2.8 | |
| |
| Air Freight & Logistics | | | 2.1 | |
| |
| Tobacco | | | 2.0 | |
| |
| Industrial Conglomerates | | | 1.9 | |
| |
| Household Products | | | 1.8 | |
| |
| Communications Equipment | | | 1.6 | |
| |
| Software | | | 1.5 | |
| | | | |
| |
| Containers & Packaging | | | 1.4 | % |
| |
| Hotels, Restaurants & Leisure | | | 1.3 | |
| |
| Machinery | | | 1.2 | |
| |
| Diversified Telecommunication Services | | | 0.9 | |
| |
| Commercial Services & Supplies | | | 0.8 | |
| |
| Electrical Equipment | | | 0.8 | |
| |
| Diversified Financial Services | | | 0.7 | |
| |
| Entertainment | | | 0.7 | |
| |
| Professional Services | | | 0.7 | |
| |
| Automobiles | | | 0.6 | |
| |
| Energy Equipment & Services | | | 0.6 | |
| |
| Food & Staples Retailing | | | 0.6 | |
| |
| Building Products | | | 0.5 | |
| |
| Leisure Products | | | 0.5 | |
| |
| Electronic Equipment, Instruments & Components | | | 0.4 | |
| |
| Multiline Retail | | | 0.4 | |
| |
| Airlines | | | 0.3 | |
| |
| Technology Hardware, Storage & Peripherals | | | 0.1 | |
| |
| Short-Term Investment | | | 2.8 | |
| |
| Other Assets, Less Liabilities | | | -0.1 | |
| | | | |
| | | 100.0 | % |
| | | | |
See Portfolio of Investments beginning on page 11 for specific holdings within these categories. The Portfolio’s holdings are subject to change.
Top Ten Holdings as of June 30, 2020 (excluding short-term investment) (Unaudited)
| 7. | DuPont de Nemours, Inc. |
| 8. | United Parcel Service, Inc., Class B |
Portfolio Management Discussion and Analysis (Unaudited)
Answers to the questions reflect the views of portfolio manager John D. Linehan, CFA, of T. Rowe Price Associates, Inc., the Portfolio’s Subadvisor.
How did MainStay VP T. Rowe Price Equity Income Portfolio perform relative to its benchmarks and peers during the six months ended June 30, 2020?
For the six months ended June 30, 2020, MainStay VP T. Rowe Price Equity Income Portfolio returned –19.08% for Initial Class shares and –19.18% for Service Class shares. Over the same period, both share classes underperformed the –16.26% return of the Russell 1000® Value Index, which is the Portfolio’s primary benchmark, and the –3.08% return of the S&P 500® Index, which is the Portfolio’s secondary benchmark. For the six months ended June 30, 2020, both share classes underperformed the –15.20% return of the Morningstar Large Value Category Average.1
During the reporting period, were there any market events that materially impacted the Portfolio’s performance or liquidity?
The Portfolio’s value bias undermined performance as large-cap value stocks underperformed large-cap growth stocks for the reporting period, as measured by the Russell 1000® Value Index and Russell 1000® Growth Index, respectively. While market conditions can have a meaningful impact on returns in the short run, we believe the consistent application of our philosophy and process will continue to result in superior long-term, risk-adjusted performance.
What factors affected the Portfolio’s relative performance during the reporting period?
Stock selection detracted from the Portfolio’s performance relative to the Russell 1000® Value Index during the reporting period, while sector allocation had a slight positive impact on relative results.
Which sectors were the strongest positive contributors to the Portfolio’s relative performance, and which sectors were particularly weak?
The information technology sector had the most positive impact on the Portfolio’s performance relative to the Russell 1000® Value Index due to stock selection and overweight allocation. Despite registering negative total returns, the energy sector also supported relative results due to favorable security choices. No other sectors contributed positively to relative performance. (Contributions take weightings and total returns into account.)
The industrials sector generated negative total returns and was the largest detractor from the Portfolio’s relative returns due to security selection. The consumer staples sector posted negative
total returns and undermined relative results due to security choices and an underweight allocation. The materials sector also registered negative total returns and detracted from relative performance due to stock selection.
During the reporting period, which individual stocks made the strongest positive contributions to the Portfolio’s absolute performance and which stocks detracted the most?
Leading positive contributors to the Portfolio’s absolute performance during the reporting period included positions in software developer Microsoft, biopharmaceutical company AbbVie and biotechnology company Gilead Sciences.
Microsoft shares held their value during the first quarter of 2020 despite the broad pandemic-related sell-off in equities. Shares then rose later in the reporting period following a strong quarterly earnings report highlighted by robust growth within the company’s Intelligent Cloud segment. Investors appeared to prioritize Microsoft’s solid fundamentals, defensible business model and attractive growth potential. We continue to believe Microsoft is positioned favorably to outperform in most market environments but have continued to trim the Portfolio’s position in recent periods based on the stock’s relative valuation.
AbbVie shares declined early in the reporting period but rebounded strongly off the market bottom due to strong operational results and the completion of the company’s acquisition of Allergan in May 2020. We believe the company should realize benefits from the acquisition through a more diversified revenue model. Additionally, AbbVie’s strong research and development capabilities strengthen our confidence in the company’s long-term potential.
Shares of Gilead Sciences outperformed on a relative basis on hopes that the company’s remdesivir drug might prove effective as a COVID-19 treatment. While we remain optimistic about the company’s longer-term growth prospects, we sold shares on strength.
The most significant detractors from the Portfolio’s absolute performance during the reporting period included multinational financial services company Wells Fargo, global bank JPMorgan Chase and industrial conglomerate General Electric (“GE”).
Shares of Wells Fargo generated negative total returns and underperformed on a relative basis due to the pandemic-related equity market sell-off, with investors expressing concern over the outbreak’s potential impact on global growth. While we expect
| 1. | See page 5 for more information on benchmark and peer group returns. |
| | |
| 8 | | MainStay VP T. Rowe Price Equity Income Portfolio |
additional rate and credit pressure going forward, we believe Wells Fargo has strong long-term fundamentals and an attractive valuation. Additionally, in our view, the company’s strict balance sheet requirements in the wake of a recent sales scandal could limit its potential credit losses.
JPMorgan Chase stock was another detractor amid challenging market conditions for financial institutions. The company has above-average balance sheet strength and diversified business lines that are highly levered to consumers. We reduced the Portfolio’s position as we continue to believe the stock is trading at a relative valuation premium and are wary that the market underappreciates the earnings and credit headwinds the business faces.
Shares of GE declined as investors remained concerned with the industrial conglomerate’s exposure to aviation and liquidity. Although we acknowledge the company may face short-term headwinds caused by the pandemic, we remain confident in GE’s leadership team and their ability to navigate current conditions. We continue to believe that GE has the liquidity needed for the prevailing environment and that the company remains undervalued compared with its sum of its parts.
Did the Portfolio make any significant purchases or sales during the reporting period?
During the reporting period, the Portfolio bought shares of specialty chemical conglomerate DuPont de Nemours on weakness. The stock underperformed the broader market early in the reporting period amid a sharp decline in global chemical demand, particularly in China, the epicenter of the coronavirus outbreak. Although we remain mindful of the potential liabilities stemming from the company’s alleged role in creating and selling PFAS chemicals, which are under scrutiny for their adverse health and environmental effects, we are drawn to the stock’s attractive risk/reward profile and desirable end markets.
The Portfolio initiated a position in gas and oil pipeline company Enbridge, purchasing shares on weakness across the energy sector due to concerns about sustained low demand for fuel amid the coronavirus pandemic. We remain confident in the company’s resilient revenue model and high-quality asset base.
The Portfolio sold shares of global bank JPMorgan Chase, as described above. We also reduced the Portfolio’s holdings in U.S. wireless operator Verizon Communications. While Verizon stock has held up relatively well amid the coronavirus pandemic due to investor expectations of resilient demand for wireless services, we believe the business faces threats from rising competitive intensity in the wireless space.
How did the Portfolio’s sector weightings change during the reporting period?
The Portfolio’s benchmark, the Russell 1000® Value Index, was reconstituted in late June 2020. Changes to the Portfolio’s relative
sector weightings in part reflect the benchmark’s reconstitution rather than solely investment decisions made within the Portfolio.
At the beginning of the reporting period, the Portfolio’s most substantially overweight positions relative to the benchmark were in industrials and utilities. As of June 30, 2020, utilities and energy were the Portfolio’s most substantially overweight positions. The most substantial increases in relative weighting in the Portfolio during the reporting period were in energy and utilities.
The Portfolio’s most substantially underweight positions relative to the Russell 1000® Value Index at the beginning of the reporting period were in the consumer discretionary and communication services sectors. As of June 30, 2020, consumer discretionary and communication services remained the most substantially underweight positions. During the reporting period, the most substantial decreases in relative weighting in the Portfolio occurred in industrials, information technology and communication services.
How was the Portfolio positioned at the end of the reporting period?
The Portfolio uses a diversified, bottom-up investment strategy with a long-term focus that has historically resulted in lower turnover relative to peers. Changes to our sector positioning are a result of our stock selection process.
As of June 30, 2020, the Portfolio’s most notable overweight exposures relative to the Russell 1000® Value Index were in utilities, energy and financials. The utilities sector contains several companies that deliver durable cash flows and relatively high dividend yields. Although the sector has not performed as expected during the coronavirus pandemic, we are attracted to the durability of utility earnings, and believe that efforts to modernize the U.S. electric grid while shifting more power production to renewables offers a multiyear rate-base growth opportunity. In the energy sector, after oil prices reached unusually low levels early in 2020, we expect to see a significant response in production levels that will help contribute to price stabilization over time. We are cognizant of the near-term risk that oil prices may continue to be volatile, which is why we have focused on energy companies with strong balance sheets and the ability to sustain operations in this type of environment. Among financials, we tend to prefer defensively positioned names with solid balance sheets and diversified revenue streams as we are mindful of the adverse impact of lower interest rates on bank lending margins and potential weakening of the credit cycle.
As of the same date, the Portfolio’s most significantly underweight exposures relative to the Russell 1000® Value Index were in the consumer discretionary, communication services and industrials sectors. The consumer discretionary sector is composed of a diverse group of industries, including retailers, diversified consumer services, auto manufacturers, and hotel
and restaurant operators. We are cautious on several industries within the sector that we believe are exposed to short- and long-term headwinds, including the pandemic’s economic impact and the shift from brick-and-mortar shopping to e-commerce. The communication services sector contains several types of companies, including media and entertainment businesses and telecommunication services names. Our main industry exposure is to the media and entertainment industries,
where we hold companies that produce or distribute must-see content and typically generate strong cash flow. We also hold positions in the diversified telecommunication services industry, where we generally prefer high-quality companies that have solid balance sheets, stable cash flow growth, and high dividend payout ratios. Among industrials, we selectively invest in companies that reach many different end markets and have solid business models and/or an ability to generate strong cash flows.
The opinions expressed are those of the portfolio managers as of the date of this report and are subject to change. There is no guarantee that any forecasts will come to pass. This material does not constitute investment advice and is not intended as an endorsement of any specific investment.
Not all MainStay VP Portfolios and/or share classes are available under all policies.
| | |
| 10 | | MainStay VP T. Rowe Price Equity Income Portfolio |
Portfolio of Investments June 30, 2020 (Unaudited)
| | | | | | | | |
| | | Principal
Amount | | | Value | |
Long-Term Bond 0.2% † Convertible Bond 0.2% | | | | | | | | |
Insurance 0.2% | |
AXA S.A.
7.25%, due 5/15/21 (a) | | $ | 1,495,000 | | | $ | 1,370,728 | |
| | | | | | | | |
Total Long-Term Bond
(Cost $1,495,246) | | | | | | | 1,370,728 | |
| | | | | | | | |
| | |
| | | | | | | | |
| | |
| | | Shares | | | | |
| Common Stocks 95.1% | |
Aerospace & Defense 2.8% | |
Boeing Co. | | | 45,907 | | | | 8,414,753 | |
L3Harris Technologies, Inc. | | | 44,132 | | | | 7,487,877 | |
| | | | | | | | |
| | | | | | | 15,902,630 | |
| | | | | | | | |
Air Freight & Logistics 2.1% | |
United Parcel Service, Inc., Class B | | | 104,919 | | | | 11,664,894 | |
| | | | | | | | |
|
Airlines 0.3% | |
Alaska Air Group, Inc. | | | 43,901 | | | | 1,591,850 | |
| | | | | | | | |
|
Automobiles 0.6% | |
General Motors Co. | | | 42,300 | | | | 1,070,190 | |
Volkswagen A.G., ADR | | | 152,705 | | | | 2,327,224 | |
| | | | | | | | |
| | | | | | | 3,397,414 | |
| | | | | | | | |
Banks 6.3% | |
Bank of America Corp. | | | 60,373 | | | | 1,433,859 | |
Fifth Third Bancorp | | | 419,378 | | | | 8,085,608 | |
JPMorgan Chase & Co. | | | 80,443 | | | | 7,566,468 | |
PNC Financial Services Group, Inc. | | | 33,871 | | | | 3,563,568 | |
Wells Fargo & Co. | | | 584,205 | | | | 14,955,648 | |
| | | | | | | | |
| | | | | | | 35,605,151 | |
| | | | | | | | |
Biotechnology 3.1% | |
AbbVie, Inc. | | | 112,950 | | | | 11,089,431 | |
Gilead Sciences, Inc. | | | 80,614 | | | | 6,202,441 | |
| | | | | | | | |
| | | | | | | 17,291,872 | |
| | | | | | | | |
Building Products 0.5% | |
Johnson Controls International PLC | | | 85,466 | | | | 2,917,809 | |
| | | | | | | | |
|
Capital Markets 4.7% | |
Franklin Resources, Inc. | | | 106,836 | | | | 2,240,351 | |
Morgan Stanley | | | 252,973 | | | | 12,218,596 | |
Northern Trust Corp. | | | 9,723 | | | | 771,423 | |
Raymond James Financial, Inc. | | | 49,246 | | | | 3,389,602 | |
State Street Corp. | | | 124,336 | | | | 7,901,553 | |
| | | | | | | | |
| | | | | | | 26,521,525 | |
| | | | | | | | |
Chemicals 3.8% | |
Akzo Nobel N.V. | | | 12,742 | | | | 1,139,958 | |
| | | | | | | | |
| | |
| | | Shares | | | Value | |
Chemicals (continued) | |
CF Industries Holdings, Inc. | | | 252,128 | | | $ | 7,094,882 | |
DuPont de Nemours, Inc. | | | 227,931 | | | | 12,109,974 | |
PPG Industries, Inc. | | | 12,322 | | | | 1,306,871 | |
| | | | | | | | |
| | | | | | | 21,651,685 | |
| | | | | | | | |
Commercial Services & Supplies 0.8% | |
Stericycle, Inc. (b) | | | 79,097 | | | | 4,427,850 | |
| | | | | | | | |
|
Communications Equipment 1.6% | |
Cisco Systems, Inc. | | | 188,292 | | | | 8,781,939 | |
| | | | | | | | |
|
Containers & Packaging 1.4% | |
International Paper Co. | | | 221,152 | | | | 7,786,762 | |
| | | | | | | | |
|
Diversified Financial Services 0.7% | |
Equitable Holdings, Inc. | | | 199,709 | | | | 3,852,387 | |
| | | | | | | | |
|
Diversified Telecommunication Services 0.9% | |
AT&T, Inc. | | | 40,445 | | | | 1,222,652 | |
Verizon Communications, Inc. | | | 74,537 | | | | 4,109,225 | |
| | | | | | | | |
| | | | | | | 5,331,877 | |
| | | | | | | | |
Electric Utilities 4.4% | |
Edison International | | | 112,999 | | | | 6,136,976 | |
NextEra Energy, Inc. | | | 18,970 | | | | 4,556,025 | |
Southern Co. | | | 279,253 | | | | 14,479,268 | |
| | | | | | | | |
| | | | | | | 25,172,269 | |
| | | | | | | | |
Electrical Equipment 0.8% | |
Emerson Electric Co. | | | 58,607 | | | | 3,635,392 | |
nVent Electric PLC | | | 38,098 | | | | 713,576 | |
| | | | | | | | |
| | | | | | | 4,348,968 | |
| | | | | | | | |
Electronic Equipment, Instruments & Components 0.4% | |
Corning, Inc. | | | 48,400 | | | | 1,253,560 | |
TE Connectivity, Ltd. | | | 13,500 | | | | 1,100,925 | |
| | | | | | | | |
| | | | | | | 2,354,485 | |
| | | | | | | | |
Energy Equipment & Services 0.6% | |
Halliburton Co. | | | 256,200 | | | | 3,325,476 | |
| | | | | | | | |
|
Entertainment 0.7% | |
Walt Disney Co. | | | 37,052 | | | | 4,131,669 | |
| | | | | | | | |
|
Equity Real Estate Investment Trusts 4.1% | |
Equity Residential | | | 111,214 | | | | 6,541,607 | |
Rayonier, Inc. | | | 180,032 | | | | 4,462,993 | |
SL Green Realty Corp. | | | 78,519 | | | | 3,870,202 | |
Weyerhaeuser Co. | | | 371,000 | | | | 8,332,660 | |
| | | | | | | | |
| | | | | | | 23,207,462 | |
| | | | | | | | |
Food & Staples Retailing 0.6% | |
Walmart, Inc. | | | 28,675 | | | | 3,434,692 | |
| | | | | | | | |
| | | | | | |
The notes to the financial statements are an integral part of,
and should be read in conjunction with, the financial statements. | | | | | 11 | |
Portfolio of Investments June 30, 2020 (Unaudited) (continued)
| | | | | | | | |
| | |
| | | Shares | | | Value | |
Food Products 3.8% | |
Bunge, Ltd. | | | 38,486 | | | $ | 1,582,929 | |
Conagra Brands, Inc. | | | 262,018 | | | | 9,215,173 | |
Mondelez International, Inc., Class A | | | 13,600 | | | | 695,368 | |
Tyson Foods, Inc., Class A | | | 168,905 | | | | 10,085,318 | |
| | | | | | | | |
| | | | | | | 21,578,788 | |
| | | | | | | | |
Health Care Equipment & Supplies 3.2% | |
Becton Dickinson & Co. | | | 30,417 | | | | 7,277,876 | |
Medtronic PLC | | | 88,950 | | | | 8,156,715 | |
Zimmer Biomet Holdings, Inc. | | | 22,703 | | | | 2,709,830 | |
| | | | | | | | |
| | | | | | | 18,144,421 | |
| | | | | | | | |
Health Care Providers & Services 3.3% | |
Anthem, Inc. | | | 34,097 | | | | 8,966,829 | |
CVS Health Corp. | | | 153,469 | | | | 9,970,881 | |
| | | | | | | | |
| | | | | | | 18,937,710 | |
| | | | | | | | |
Hotels, Restaurants & Leisure 1.3% | |
Las Vegas Sands Corp. | | | 110,440 | | | | 5,029,437 | |
McDonald’s Corp. | | | 7,300 | | | | 1,346,631 | |
MGM Resorts International | | | 31,800 | | | | 534,240 | |
Royal Caribbean Cruises, Ltd. | | | 7,489 | | | | 376,697 | |
| | | | | | | | |
| | | | | | | 7,287,005 | |
| | | | | | | | |
Household Products 1.8% | |
Kimberly-Clark Corp. | | | 70,409 | | | | 9,952,312 | |
| | | | | | | | |
|
Industrial Conglomerates 1.9% | |
General Electric Co. | | | 1,588,881 | | | | 10,852,057 | |
| | | | | | | | |
|
Insurance 7.6% | |
American International Group, Inc. | | | 326,368 | | | | 10,176,154 | |
Chubb, Ltd. | | | 101,641 | | | | 12,869,784 | |
Loews Corp. | | | 197,453 | | | | 6,770,663 | |
Marsh & McLennan Cos., Inc. | | | 15,574 | | | | 1,672,180 | |
MetLife, Inc. | | | 276,448 | | | | 10,095,881 | |
Willis Towers Watson PLC | | | 8,342 | | | | 1,642,957 | |
| | | | | | | | |
| | | | | | | 43,227,619 | |
| | | | | | | | |
Leisure Products 0.5% | |
Mattel, Inc. (b)(c) | | | 295,854 | | | | 2,860,908 | |
| | | | | | | | |
|
Machinery 1.2% | |
Flowserve Corp. | | | 17,635 | | | | 502,950 | |
PACCAR, Inc. | | | 38,800 | | | | 2,904,180 | |
Snap-On, Inc. | | | 22,900 | | | | 3,171,879 | |
| | | | | | | | |
| | | | | | | 6,579,009 | |
| | | | | | | | |
Media 3.6% | |
Comcast Corp., Class A | | | 228,197 | | | | 8,895,119 | |
Fox Corp., Class B (b) | | | 230,887 | | | | 6,197,007 | |
News Corp., Class A | | | 465,491 | | | | 5,520,723 | |
| | | | | | | | |
| | | | | | | 20,612,849 | |
| | | | | | | | |
Multi-Utilities 3.2% | |
Ameren Corp. | | | 22,100 | | | | 1,554,956 | |
| | | | | | | | |
| | |
| | | Shares | | | Value | |
Multi-Utilities (continued) | |
CenterPoint Energy, Inc. | | | 109,400 | | | $ | 2,042,498 | |
NiSource, Inc. | | | 465,168 | | | | 10,577,920 | |
Sempra Energy | | | 34,405 | | | | 4,033,298 | |
| | | | | | | | |
| | | | | | | 18,208,672 | |
| | | | | | | | |
Multiline Retail 0.4% | |
Kohl’s Corp. | | | 106,877 | | | | 2,219,835 | |
| | | | | | | | |
|
Oil, Gas & Consumable Fuels 7.8% | |
Chevron Corp. | | | 16,743 | | | | 1,493,978 | |
Enbridge, Inc. | | | 170,100 | | | | 5,174,442 | |
EOG Resources, Inc. | | | 32,500 | | | | 1,646,450 | |
Exxon Mobil Corp. | | | 125,564 | | | | 5,615,222 | |
Hess Corp. | | | 21,780 | | | | 1,128,422 | |
Occidental Petroleum Corp. | | | 118,343 | | | | 2,165,677 | |
Pioneer Natural Resources Co. | | | 18,306 | | | | 1,788,496 | |
Targa Resources Corp. | | | 182,950 | | | | 3,671,807 | |
TC Energy Corp. | | | 200,097 | | | | 8,576,157 | |
TOTAL S.A. | | | 301,996 | | | | 11,502,905 | |
TOTAL S.A., Sponsored ADR | | | 38,000 | | | | 1,461,480 | |
| | | | | | | | |
| | | | | | | 44,225,036 | |
| | | | | | | | |
Pharmaceuticals 4.6% | |
Bristol-Myers Squibb Co. | | | 19,800 | | | | 1,164,240 | |
GlaxoSmithKline PLC | | | 120,076 | | | | 2,432,973 | |
GlaxoSmithKline PLC, Sponsored ADR | | | 33,400 | | | | 1,362,386 | |
Johnson & Johnson | | | 72,082 | | | | 10,136,891 | |
Merck & Co., Inc. | | | 28,300 | | | | 2,188,439 | |
Pfizer, Inc. | | | 259,354 | | | | 8,480,876 | |
| | | | | | | | |
| | | | | | | 25,765,805 | |
| | | | | | | | |
Professional Services 0.7% | |
Nielsen Holdings PLC | | | 265,323 | | | | 3,942,700 | |
| | | | | | | | |
|
Semiconductors & Semiconductor Equipment 5.4% | |
Applied Materials, Inc. | | | 100,784 | | | | 6,092,393 | |
NXP Semiconductors N.V. | | | 14,638 | | | | 1,669,318 | |
QUALCOMM, Inc. | | | 183,378 | | | | 16,725,907 | |
Texas Instruments, Inc. | | | 48,996 | | | | 6,221,022 | |
| | | | | | | | |
| | | | | | | 30,708,640 | |
| | | | | | | | |
Software 1.5% | |
Microsoft Corp. | | | 41,640 | | | | 8,474,157 | |
| | | | | | | | |
|
Technology Hardware, Storage & Peripherals 0.1% | |
Western Digital Corp. | | | 14,105 | | | | 622,736 | |
| | | | | | | | |
|
Tobacco 2.0% | |
Altria Group, Inc. | | | 20,500 | | | | 804,625 | |
Philip Morris International, Inc. | | | 146,831 | | | | 10,286,980 | |
| | | | | | | | |
| | | | | | | 11,091,605 | |
| | | | | | | | |
Total Common Stocks
(Cost $539,828,450) | | | | 537,992,530 | |
| | | | | | | | |
| | | | |
| 12 | | MainStay VP T. Rowe Price Equity Income Portfolio | | The notes to the financial statements are an integral part of,
and should be read in conjunction with, the financial statements. |
| | | | | | | | |
| | |
| | | Shares | | | Value | |
| Convertible Preferred Stocks 2.0% | |
Electric Utilities 0.8% | |
NextEra Energy, Inc.
5.279% | | | 44,642 | | | $ | 1,895,053 | |
Southern Co.
6.75% | | | 56,931 | | | | 2,508,380 | |
| | | | | | | | |
| | | | | | | 4,403,433 | |
| | | | | | | | |
Health Care Equipment & Supplies 0.5% | |
Becton Dickinson & Co.
6.00% | | | 51,345 | | | | 2,731,554 | |
| | | | | | | | |
|
Multi-Utilities 0.7% | |
Sempra Energy
6.00% | | | 33,680 | | | | 3,291,546 | |
6.75% | | | 10,478 | | | | 1,029,568 | |
| | | | | | | | |
| | | | | | | 4,321,114 | |
| | | | | | | | |
Total Convertible Preferred Stocks
(Cost $12,018,366) | | | | 11,456,101 | |
| | | | | | | | |
| | | | | | | | |
| | |
| | | Shares | | | Value | |
| Short-Term Investment 2.8% | |
Affiliated Investment Company 2.8% | |
MainStay U.S. Government Liquidity Fund,
0.05% (d) | | | 15,789,785 | | | $ | 15,789,785 | |
| | | | | | | | |
Total Short-Term Investment
(Cost $15,789,785) | | | | | | | 15,789,785 | |
| | | | | | | | |
Total Investments
(Cost $569,131,847) | | | 100.1 | % | | | 566,609,144 | |
Other Assets, Less Liabilities | | | (0.1 | ) | | | (635,835 | ) |
Net Assets | | | 100.0 | % | | $ | 565,973,309 | |
| † | Percentages indicated are based on Portfolio net assets. |
| (a) | May be sold to institutional investors only under Rule 144A or securities offered pursuant to Section 4(a)(2) of the Securities Act of 1933, as amended. |
| (b) | Non-income producing security. |
| (c) | All or a portion of this security was held on loan. As of June 30, 2020, the aggregate market value of securities on loan was $78,902. The Portfolio received non-cash collateral in the form of U.S. Treasury securities with a value of $83,306 (See Note 2(K)). |
| (d) | Current yield as of June 30, 2020. |
Futures Contracts
As of June 30, 2020, the Portfolio held the following futures contracts1:
| | | | | | | | | | | | | | | | | | | | |
Type | | Number of
Contracts | | | Expiration
Date | | | Value at
Trade Date | | | Current
Notional
Amount | | | Unrealized
Appreciation
(Depreciation)2 | |
|
Long Contracts | |
| S&P 500 Index Mini | | | 30 | | | | September 2020 | | | $ | 4,529,654 | | | $ | 4,635,300 | | | $ | 105,646 | |
| | | | | | | | | | | | | | | | | | | | |
| 1. | As of June 30, 2020, cash in the amount of $360,000 was on deposit with a broker or futures commission merchant for futures transactions. |
| 2. | Represents the difference between the value of the contracts at the time they were opened and the value as of June 30, 2020. |
The following abbreviation is used in the preceding pages:
ADR—American Depositary Receipt
| | | | | | |
The notes to the financial statements are an integral part of,
and should be read in conjunction with, the financial statements. | | | | | 13 | |
Portfolio of Investments June 30, 2020 (Unaudited) (continued)
The following is a summary of the fair valuations according to the inputs used as of June 30, 2020, for valuing the Portfolio’s assets:
| | | | | | | | | | | | | | | | |
Description | | Quoted
Prices in
Active
Markets for
Identical
Assets (Level 1) | | | Significant
Other
Observable
Inputs (Level 2) | | | Significant
Unobservable
Inputs (Level 3) | | | Total | |
|
Asset Valuation Inputs | |
| Investments in Securities (a) | | | | | | | | | | | | | | | | |
| Long-Term Bond | | | | | | | | | | | | | | | | |
Convertible Bond | | $ | — | | | $ | 1,370,728 | | | $ | — | | | $ | 1,370,728 | |
| Common Stocks | | | | | | | | | | | | | | | | |
Chemicals | | | 20,511,727 | | | | 1,139,958 | | | | — | | | | 21,651,685 | |
Oil, Gas & Consumable Fuels | | | 32,722,131 | | | | 11,502,905 | | | | — | | | | 44,225,036 | |
Pharmaceuticals | | | 23,332,832 | | | | 2,432,973 | | | | — | | | | 25,765,805 | |
All Other Industries | | | 446,350,004 | | | | — | | | | — | | | | 446,350,004 | |
| | | | | | | | | | | | | | | | |
| Total Common Stocks | | | 522,916,694 | | | | 15,075,836 | | | | — | | | | 537,992,530 | |
| | | | | | | | | | | | | | | | |
| Convertible Preferred Stocks | | | 11,456,101 | | | | — | | | | — | | | | 11,456,101 | |
| Short-Term Investment | | | | | | | | | | | | | | | | |
Affiliated Investment Company | | | 15,789,785 | | | | — | | | | — | | | | 15,789,785 | |
| | | | | | | | | | | | | | | | |
| Total Investments in Securities | | | 550,162,580 | | | | 16,446,564 | | | | — | | | | 566,609,144 | |
| | | | | | | | | | | | | | | | |
| Other Financial Instruments | | | | | | | | | | | | | | | | |
Futures Contracts (b) | | | 105,646 | | | | — | | | | — | | | | 105,646 | |
| | | | | | | | | | | | | | | | |
| Total Investments in Securities and Other Financial Instruments | | $ | 550,268,226 | | | $ | 16,446,564 | | | $ | — | | | $ | 566,714,790 | |
| | | | | | | | | | | | | | | | |
| (a) | For a complete listing of investments and their industries, see the Portfolio of Investments. |
| (b) | The value listed for these securities reflects unrealized appreciation (depreciation) as shown on the Portfolio of Investments. |
| | | | |
| 14 | | MainStay VP T. Rowe Price Equity Income Portfolio | | The notes to the financial statements are an integral part of,
and should be read in conjunction with, the financial statements. |
Statement of Assets and Liabilities as of June 30, 2020 (Unaudited)
| | | | |
| Assets | |
Investment in unaffiliated securities, at value
(identified cost $553,342,062) including securities on loan of $78,902 | | $ | 550,819,359 | |
Investment in affiliated investment company, at value
(identified cost $15,789,785) | | | 15,789,785 | |
Due from custodian | | | 939,247 | |
Cash collateral on deposit at broker for futures contracts | | | 360,000 | |
Receivables: | |
Dividends and interest | | | 1,314,276 | |
Investment securities sold | | | 215,950 | |
Variation margin on futures contracts | | | 124,951 | |
Portfolio shares sold | | | 23,726 | |
Securities lending | | | 248 | |
Other assets | | | 2,820 | |
| | | | |
Total assets | | | 569,590,362 | |
| | | | |
|
| Liabilities | |
Payables: | |
Investment securities purchased | | | 2,964,207 | |
Manager (See Note 3) | | | 346,980 | |
Portfolio shares redeemed | | | 199,800 | |
NYLIFE Distributors (See Note 3) | | | 42,691 | |
Shareholder communication | | | 27,266 | |
Professional fees | | | 23,851 | |
Custodian | | | 6,923 | |
Trustees | | | 862 | |
Accrued expenses | | | 4,473 | |
| | | | |
Total liabilities | | | 3,617,053 | |
| | | | |
Net assets | | $ | 565,973,309 | |
| | | | |
|
| Composition of Net Assets | |
Shares of beneficial interest outstanding (par value of $.001 per share) unlimited number of shares authorized | | $ | 54,382 | |
Additional paid-in capital | | | 513,926,335 | |
| | | | |
| | | 513,980,717 | |
Total distributable earnings (loss) | | | 51,992,592 | |
| | | | |
Net assets | | $ | 565,973,309 | |
| | | | |
| | | | |
Initial Class | |
Net assets applicable to outstanding shares | | $ | 363,488,979 | |
| | | | |
Shares of beneficial interest outstanding | | | 34,859,276 | |
| | | | |
Net asset value per share outstanding | | $ | 10.43 | |
| | | | |
Service Class | |
Net assets applicable to outstanding shares | | $ | 202,484,330 | |
| | | | |
Shares of beneficial interest outstanding | | | 19,523,120 | |
| | | | |
Net asset value per share outstanding | | $ | 10.37 | |
| | | | |
| | | | | | |
The notes to the financial statements are an integral part of,
and should be read in conjunction with, the financial statements. | | | | | 15 | |
Statement of Operations for the six months ended June 30, 2020 (Unaudited)
| | | | |
| Investment Income (Loss) | | | | |
Income | | | | |
Dividends-unaffiliated (a) | | $ | 10,382,152 | |
Interest | | | 54,095 | |
Dividends-affiliated | | | 28,200 | |
Securities lending | | | 3,346 | |
| | | | |
Total income | | | 10,467,793 | |
| | | | |
Expenses | | | | |
Manager (See Note 3) | | | 2,207,162 | |
Distribution/Service—Service Class (See Note 3) | | | 268,499 | |
Professional fees | | | 47,709 | |
Shareholder communication | | | 29,772 | |
Custodian | | | 16,965 | |
Trustees | | | 7,976 | |
Miscellaneous | | | 12,841 | |
| | | | |
Total expenses | | | 2,590,924 | |
| | | | |
Net investment income (loss) | | | 7,876,869 | |
| | | | |
|
| Realized and Unrealized Gain (Loss) on Investments, Futures Contracts and Foreign Currency Transactions | |
Net realized gain (loss) on: | | | | |
Unaffiliated investment transactions | | | (8,171,968 | ) |
Foreign currency transactions | | | (1,828 | ) |
| | | | |
Net realized gain (loss) on investments and foreign
currency transactions | | | (8,173,796 | ) |
| | | | |
Net change in unrealized appreciation (depreciation) on: | | | | |
Unaffiliated investments | | | (133,065,782 | ) |
Futures contracts | | | 105,646 | |
Translation of other assets and liabilities in
foreign currencies | | | (1,876 | ) |
| | | | |
Net change in unrealized appreciation (depreciation) on investments, futures contracts and foreign currencies | | | (132,962,012 | ) |
| | | | |
Net realized and unrealized gain (loss) on investments, futures transactions and foreign currency transactions | | | (141,135,808 | ) |
| | | | |
Net increase (decrease) in net assets resulting
from operations | | $ | (133,258,939 | ) |
| | | | |
| (a) | Dividends recorded net of foreign withholding taxes in the amount of $171,652. |
| | | | |
| 16 | | MainStay VP T. Rowe Price Equity Income Portfolio | | The notes to the financial statements are an integral part of,
and should be read in conjunction with, the financial statements. |
Statements of Changes in Net Assets
for the six months ended June 30, 2020 (Unaudited) and the year ended December 31, 2019
| | | | | | | | |
| | | 2020 | | | 2019 | |
| Increase (Decrease) in Net Assets | |
Operations: | |
Net investment income (loss) | | $ | 7,876,869 | | | $ | 15,857,120 | |
Net realized gain (loss) on investments, futures transactions and foreign currency transactions | | | (8,173,796 | ) | | | 42,585,435 | |
Net change in unrealized appreciation (depreciation) on investments, futures contracts and foreign currencies | | | (132,962,012 | ) | | | 108,962,641 | |
| | | | |
Net increase (decrease) in net assets resulting from operations | | | (133,258,939 | ) | | | 167,405,196 | |
| | | | |
Distributions to shareholders: | |
Initial Class | | | — | | | | (44,741,064 | ) |
Service Class | | | — | | | | (25,702,898 | ) |
| | | | |
Total distributions to shareholders | | | — | | | | (70,443,962 | ) |
| | | | |
Capital share transactions: | |
Net proceeds from sale of shares | | | 35,279,538 | | | | 18,551,651 | |
Net asset value of shares issued to shareholders in reinvestment of distributions | | | — | | | | 70,443,962 | |
Cost of shares redeemed | | | (62,884,843 | ) | | | (147,949,625 | ) |
| | | | |
Increase (decrease) in net assets derived from capital share transactions | | | (27,605,305 | ) | | | (58,954,012 | ) |
| | | | |
Net increase (decrease) in net assets | | | (160,864,244 | ) | | | 38,007,222 | |
|
| Net Assets | |
| |
Beginning of period | | | 726,837,553 | | | | 688,830,331 | |
| | | | |
End of period | | $ | 565,973,309 | | | $ | 726,837,553 | |
| | | | |
| | | | | | |
The notes to the financial statements are an integral part of,
and should be read in conjunction with, the financial statements. | | | | | 17 | |
Financial Highlights selected per share data and ratios
| | | | | | | | | | | | | | | | | | | | | | | | |
| | |
| | | Six months
ended
June 30, | | | Year ended December 31, | |
| | | | | | |
| Initial Class | | 2020* | | | 2019 | | | 2018 | | | 2017 | | | 2016 | | | 2015 | |
| | | | | | |
Net asset value at beginning of period | | $ | 12.89 | | | $ | 11.39 | | | $ | 14.10 | | | $ | 12.99 | | | $ | 11.97 | | | $ | 13.90 | |
| | | | | | | | | | | | | | | | | | | | | | | | |
| | | | | | |
Net investment income (loss) (a) | | | 0.14 | | | | 0.29 | | | | 0.29 | | | | 0.24 | | | | 0.27 | | | | 0.25 | |
| | | | | | |
Net realized and unrealized gain (loss) on investments | | | (2.60 | ) | | | 2.58 | | | | (1.40 | ) | | | 1.83 | | | | 1.90 | | | | (1.21 | ) |
| | | | | | |
Net realized and unrealized gain (loss) on foreign currency transactions ‡ | | | (0.00 | ) | | | 0.00 | | | | (0.00 | ) | | | 0.00 | | | | (0.00 | ) | | | (0.00 | ) |
| | | | | | | | | | | | | | | | | | | | | | | | |
| | | | | | |
Total from investment operations | | | (2.46 | ) | | | 2.87 | | | | (1.11 | ) | | | 2.07 | | | | 2.17 | | | | (0.96 | ) |
| | | | | | | | | | | | | | | | | | | | | | | | |
| | | | | | |
| Less distributions: | | | | | | | | | | | | | | | | | | | | | | | | |
| | | | | | |
From net investment income | | | — | | | | (0.31 | ) | | | (0.29 | ) | | | (0.30 | ) | | | (0.25 | ) | | | (0.24 | ) |
| | | | | | |
From net realized gain on investments | | | — | | | | (1.06 | ) | | | (1.31 | ) | | | (0.66 | ) | | | (0.90 | ) | | | (0.73 | ) |
| | | | | | | | | | | | | | | | | | | | | | | | |
| | | | | | |
Total distributions | | | — | | | | (1.37 | ) | | | (1.60 | ) | | | (0.96 | ) | | | (1.15 | ) | | | (0.97 | ) |
| | | | | | | | | | | | | | | | | | | | | | | | |
| | | | | | |
Net asset value at end of period | | $ | 10.43 | | | $ | 12.89 | | | $ | 11.39 | | | $ | 14.10 | | | $ | 12.99 | | | $ | 11.97 | |
| | | | | | | | | | | | | | | | | | | | | | | | |
| | | | | | |
Total investment return (b) | | | (19.08 | %) | | | 26.36 | %(c) | | | (9.38 | %) | | | 16.20 | % | | | 18.82 | % | | | (6.78 | %) |
| | | | | | |
| Ratios (to average net assets)/Supplemental Data: | | | | | | | | | | | | | | | | | | | | | | | | |
| | | | | | |
Net investment income (loss) | | | 2.66 | %†† | | | 2.30 | % | | | 2.11 | % | | | 1.78 | % | | | 2.18 | % | | | 1.90 | % |
| | | | | | |
Net expenses (d) | | | 0.76 | %†† | | | 0.75 | % | | | 0.77 | % | | | 0.77 | % | | | 0.78 | % | | | 0.77 | % |
| | | | | | |
Expenses (before waiver/reimbursement) (d) | | | 0.76 | %†† | | | 0.75 | % | | | 0.77 | % | | | 0.77 | % | | | 0.78 | % | | | 0.77 | % |
| | | | | | |
Portfolio turnover rate | | | 20 | % | | | 16 | % | | | 22 | % | | | 24 | % | | | 23 | % | | | 42 | % |
| | | | | | |
Net assets at end of period (in 000’s) | | $ | 363,489 | | | $ | 464,120 | | | $ | 431,672 | | | $ | 469,556 | | | $ | 472,125 | | | $ | 473,818 | |
| ‡ | Less than one cent per share. |
| (a) | Per share data based on average shares outstanding during the period. |
| (b) | Total return does not reflect any deduction of sales charges, mortality and expense charges, contract charges or administrative charges. For periods of less than one year, total return is not annualized. |
| (c) | In 2019, the Portfolio’s total investment return includes impact of payments from affiliates due to trade communications error. Excluding these items, total return would have been 26.36%. |
| (d) | In addition to the fees and expenses which the Portfolio bears directly, it also indirectly bears a pro-rata share of the fees and expenses of the underlying funds in which it invests. Such indirect expenses are not included in the above expense ratios. |
| | | | |
| 18 | | MainStay VP T. Rowe Price Equity Income Portfolio | | The notes to the financial statements are an integral part of,
and should be read in conjunction with, the financial statements. |
Financial Highlights selected per share data and ratios
| | | | | | | | | | | | | | | | | | | | | | | | |
| | |
| | | Six months
ended
June 30, | | | Year ended December 31, | |
| | | | | | |
| Service Class | | 2020* | | | 2019 | | | 2018 | | | 2017 | | | 2016 | | | 2015 | |
| | | | | | |
Net asset value at beginning of period | | $ | 12.83 | | | $ | 11.34 | | | $ | 14.04 | | | $ | 12.94 | | | $ | 11.93 | | | $ | 13.85 | |
| | | | | | | | | | | | | | | | | | | | | | | | |
| | | | | | |
Net investment income (loss) (a) | | | 0.13 | | | | 0.26 | | | | 0.25 | | | | 0.21 | | | | 0.24 | | | | 0.22 | |
| | | | | | |
Net realized and unrealized gain (loss) on investments | | | (2.59 | ) | | | 2.56 | | | | (1.39 | ) | | | 1.82 | | | | 1.89 | | | | (1.21 | ) |
| | | | | | |
Net realized and unrealized gain (loss) on foreign
currency transactions ‡ | | | (0.00 | ) | | | 0.00 | | | | (0.00 | ) | | | 0.00 | | | | (0.00 | ) | | | (0.00 | ) |
| | | | | | | | | | | | | | | | | | | | | | | | |
| | | | | | |
Total from investment operations | | | (2.46 | ) | | | 2.82 | | | | (1.14 | ) | | | 2.03 | | | | 2.13 | | | | (0.99 | ) |
| | | | | | | | | | | | | | | | | | | | | | | | |
| | | | | | |
| Less distributions: | | | | | | | | | | | | | | | | | | | | | | | | |
| | | | | | |
From net investment income | | | — | | | | (0.27 | ) | | | (0.25 | ) | | | (0.27 | ) | | | (0.22 | ) | | | (0.20 | ) |
| | | | | | |
From net realized gain on investments | | | — | | | | (1.06 | ) | | | (1.31 | ) | | | (0.66 | ) | | | (0.90 | ) | | | (0.73 | ) |
| | | | | | | | | | | | | | | | | | | | | | | | |
| | | | | | |
Total distributions | | | — | | | | (1.33 | ) | | | (1.56 | ) | | | (0.93 | ) | | | (1.12 | ) | | | (0.93 | ) |
| | | | | | | | | | | | | | | | | | | | | | | | |
| | | | | | |
Net asset value at end of period | | $ | 10.37 | | | $ | 12.83 | | | $ | 11.34 | | | $ | 14.04 | | | $ | 12.94 | | | $ | 11.93 | |
| | | | | | | | | | | | | | | | | | | | | | | | |
| | | | | | |
Total investment return (b) | | | (19.17 | %)(c) | | | 26.04 | %(d) | | | (9.61 | %) | | | 15.91 | % | | | 18.53 | % | | | (7.01 | %) |
| | | | | | |
| Ratios (to average net assets)/Supplemental Data: | | | | | | | | | | | | | | | | | | | | | | | | |
| | | | | | |
Net investment income (loss) | | | 2.40 | %†† | | | 2.05 | % | | | 1.84 | % | | | 1.54 | % | | | 1.93 | % | | | 1.64 | % |
| | | | | | |
Net expenses (e) | | | 1.01 | %†† | | | 1.00 | % | | | 1.02 | % | | | 1.02 | % | | | 1.03 | % | | | 1.02 | % |
| | | | | | |
Expenses (before waiver/reimbursement) (e) | | | 1.01 | %†† | | | 1.00 | % | | | 1.02 | % | | | 1.02 | % | | | 1.03 | % | | | 1.02 | % |
| | | | | | |
Portfolio turnover rate | | | 20 | % | | | 16 | % | | | 22 | % | | | 24 | % | | | 23 | % | | | 42 | % |
| | | | | | |
Net assets at end of period (in 000’s) | | $ | 202,484 | | | $ | 262,717 | | | $ | 257,159 | | | $ | 348,450 | | | $ | 318,059 | | | $ | 281,340 | |
| ‡ | Less than one cent per share. |
| (a) | Per share data based on average shares outstanding during the period. |
| (b) | Total return does not reflect any deduction of sales charges, mortality and expense charges, contract charges or administrative charges. For periods of less than one year, total return is not annualized. |
| (c) | Total investment return may reflect adjustments to conform to generally accepted accounting principles. |
| (d) | In 2019, the Portfolio’s total investment return includes impact of payments from affiliates due to trade communications error. Excluding these items, total return would have been 26.04%. |
| (e) | In addition to the fees and expenses which the Portfolio bears directly, it also indirectly bears a pro-rata share of the fees and expenses of the underlying funds in which it invests. Such indirect expenses are not included in the above expense ratios. |
| | | | | | |
The notes to the financial statements are an integral part of,
and should be read in conjunction with, the financial statements. | | | | | 19 | |
Notes to Financial Statements (Unaudited)
Note 1–Organization and Business
MainStay VP Funds Trust (the “Fund”) was organized as a Delaware statutory trust on February 1, 2011. The Fund is registered under the Investment Company Act of 1940, as amended (the “1940 Act”), as an open-end management investment company. The Fund is comprised of thirty-one separate series (collectively referred to as the “Portfolios”). These financial statements and notes relate to the MainStay VP T. Rowe Price Equity Income Portfolio (the “Portfolio”), a “diversified” portfolio, as that term is defined in the 1940 Act, as interpreted or modified by regulatory authorities having jurisdiction, from time to time.
Shares of the Portfolio are currently offered to certain separate accounts to fund variable annuity policies and variable universal life insurance policies issued by New York Life Insurance and Annuity Corporation (“NYLIAC”), a wholly-owned subsidiary of New York Life Insurance Company (“New York Life”) and may also be offered to fund variable annuity policies and variable universal life insurance policies issued by other insurance companies. NYLIAC allocates shares of the Portfolios to, among others, certain NYLIAC separate accounts. Shares of the Portfolio are also offered to the MainStay VP Conservative Allocation Portfolio, MainStay VP Moderate Allocation Portfolio, MainStay VP Moderate Growth Allocation Portfolio and MainStay VP Growth Allocation Portfolio, which operate as “funds-of-funds,” and other variable insurance funds.
The Portfolio currently offers two classes of shares. Initial Class and Service Class shares commenced operations on February 17, 2012. Shares of the Portfolio are offered and are redeemed at a price equal to their respective net asset value (“NAV”) per share. No sales or redemption charge is applicable to the purchase or redemption of the Portfolio’s shares. Under the terms of the Fund’s multiple class plan adopted pursuant to Rule 18f-3 under the 1940 Act, the classes differ in that, among other things, Service Class shares of the Portfolio pay a combined distribution and service fee of 0.25% of average daily net assets attributable to Service Class shares of the Portfolio to the Distributor (as defined in Note 3(B)) pursuant to a plan adopted in accordance with Rule 12b-1 under the 1940 Act. Contract owners of variable annuity contracts purchased after June 2, 2003, are permitted to invest only in the Service Class shares.
The Portfolio’s investment objective is to seek a high level of dividend income and long-term capital growth primarily through investments in stocks.
Note 2–Significant Accounting Policies
The Portfolio is an investment company and accordingly follows the investment company accounting and reporting guidance of the Financial Accounting Standards Board (“FASB”) Accounting Standard Codification Topic 946 Financial Services—Investment Companies. The Portfolio prepares its financial statements in accordance with generally accepted accounting principles (“GAAP”) in the United States of America and follows the significant accounting policies described below.
(A) Securities Valuation. Investments are usually valued as of the close of regular trading on the New York Stock Exchange (the “Exchange”) (usually 4:00 p.m. Eastern time) on each day the Portfolio is open for business (“valuation date”).
The Board of Trustees of the Fund (the “Board”) adopted procedures establishing methodologies for the valuation of the Portfolio’s securities and other assets and delegated the responsibility for valuation determinations under those procedures to the Valuation Committee of the Fund (the “Valuation Committee”). The procedures state that, subject to the oversight of the Board and unless otherwise noted, the responsibility for the day-to-day valuation of portfolio assets (including fair value measurements for the Portfolio’s assets and liabilities) rests with New York Life Investment Management LLC (“New York Life Investments” or the “Manager”), aided to whatever extent necessary by the Subadvisor (as defined in Note 3(A)). To assess the appropriateness of security valuations, the Manager, the Subadvisor or the Portfolio’s third-party service provider, who is subject to oversight by the Manager, regularly compares prior day prices, prices on comparable securities and the sale prices to the prior and current day prices and challenges prices with changes exceeding certain tolerance levels with third-party pricing services or broker sources.
The Board authorized the Valuation Committee to appoint a Valuation Subcommittee (the “Subcommittee”) to establish the prices of securities for which market quotations are not readily available or the prices of which are not otherwise readily determinable under the procedures. The Subcommittee meets (in person, via electronic mail or via teleconference) on an as-needed basis. The Valuation Committee meets to ensure that actions taken by the Subcommittee were appropriate.
For those securities valued through either a standardized fair valuation methodology or a fair valuation measurement, the Subcommittee deals with such valuation and the Valuation Committee reviews and affirms, if appropriate, the reasonableness of the valuation based on such methodologies and measurements on a regular basis after considering information that is reasonably available and deemed relevant by the Valuation Committee. Any action taken by the Subcommittee with respect to the valuation of a portfolio security or other asset is submitted for review and ratification (if appropriate) to the Valuation Committee and the Board at the next regularly scheduled meeting.
“Fair value” is defined as the price the Portfolio would reasonably expect to receive upon selling an asset or liability in an orderly transaction to an independent buyer in the principal or most advantageous market for the asset or liability. Fair value measurements are determined within a framework that establishes a three-tier hierarchy that maximizes the use of observable market data and minimizes the use of unobservable inputs to establish a classification of fair value measurements for disclosure purposes. “Inputs” refer broadly to the assumptions that market participants would use in pricing the asset or liability, including assumptions about risk, such as the risk inherent in a particular valuation technique used to measure fair value using a pricing model and/or the risk inherent in the inputs for the valuation technique. Inputs may be observable or unobservable. Observable inputs reflect the assumptions market participants would use in pricing the asset or liability based on market data obtained from sources independent of the Portfolio. Unobservable inputs reflect the Portfolio’s own assumptions about the assumptions market participants would use in pricing the asset or liability based on the information available. The inputs or methodology used for valuing assets or liabilities may not be an indication of the risks associated with investing in those assets or liabilities. The three-tier hierarchy of inputs is summarized below.
| | |
| 20 | | MainStay VP T. Rowe Price Equity Income Portfolio |
| • | | Level 1—quoted prices in active markets for an identical asset or liability |
| • | | Level 2—other significant observable inputs (including quoted prices for a similar asset or liability in active markets, interest rates and yield curves, prepayment speeds, credit risk, etc.) |
| • | | Level 3—significant unobservable inputs (including the Portfolio’s own assumptions about the assumptions that market participants would use in measuring fair value of an asset or liability) |
The level of an asset or liability within the fair value hierarchy is based on the lowest level of an input, both individually and in the aggregate, that is significant to the fair value measurement. The aggregate value by input level of the Portfolio’s assets and liabilities as of June 30, 2020 is included at the end of the Portfolio of Investments.
The Portfolio may use third-party vendor evaluations, whose prices may be derived from one or more of the following standard inputs, among others:
| | |
• Benchmark yields | | • Reported trades |
• Broker/dealer quotes | | • Issuer spreads |
• Two-sided markets | | • Benchmark securities |
• Bids/offers | | • Reference data (corporate actions or material event notices) |
• Industry and economic events | | • Comparable bonds |
• Monthly payment information | | |
An asset or liability for which market values cannot be measured using the methodologies described above is valued by methods deemed reasonable in good faith by the Valuation Committee, following the procedures established by the Board, to represent fair value. Under these procedures, the Portfolio generally uses a market-based approach which may use related or comparable assets or liabilities, recent transactions, market multiples, book values and other relevant information. The Portfolio may also use an income-based valuation approach in which the anticipated future cash flows of the asset or liability are discounted to calculate fair value. Discounts may also be applied due to the nature and/or duration of any restrictions on the disposition of the asset or liability. Fair value represents a good faith approximation of the value of a security. Fair value determinations involve the consideration of a number of subjective factors, an analysis of applicable facts and circumstances and the exercise of judgment. As a result, it is possible that the fair value for a security determined in good faith in accordance with the Portfolio’s valuation procedures may differ from valuations for the same security determined by other funds using their own valuation procedures. Although the Portfolio’s valuation procedures are designed to value a security at the price the Portfolio may reasonably expect to receive upon the security’s sale in an orderly transaction, there can be no assurance that any fair value determination thereunder would, in fact, approximate the amount that the Portfolio would actually realize upon the sale of the security or the price at which the security would trade if a reliable market price were readily available. During the six-month period ended June 30, 2020, there were no material changes to the fair value methodologies.
Securities which may be valued in this manner include, but are not limited to: (i) a security for which trading has been halted or suspended;
(ii) a debt security that has recently gone into default and for which there is not a current market quotation; (iii) a security of an issuer that has entered into a restructuring; (iv) a security that has been delisted from a national exchange; (v) a security for which the market price is not readily available from a third-party pricing source or, if so provided, does not, in the opinion of the Manager or the Subadvisor, reflect the security’s market value; (vi) a security subject to trading collars for which no or limited trading takes place; and (vii) a security whose principal market has been temporarily closed at a time when, under normal conditions, it would be open. Securities valued in this manner are generally categorized as Level 3 in the hierarchy. As of June 30, 2020, no securities held by the Portfolio were fair valued in such a manner.
Certain securities held by the Portfolio may principally trade in foreign markets. Events may occur between the time the foreign markets close and the time at which the Portfolio’s NAVs are calculated. These events may include, but are not limited to, situations relating to a single issuer in a market sector, significant fluctuations in U.S. or foreign markets, natural disasters, armed conflicts, governmental actions or other developments not tied directly to the securities markets. Should the Manager or the Subadvisor conclude that such events may have affected the accuracy of the last price of such securities reported on the local foreign market, the Subcommittee may, pursuant to procedures adopted by the Board, adjust the value of the local price to reflect the estimated impact on the price of such securities as a result of such events. In this instance, securities are generally categorized as Level 3 in the hierarchy. Additionally, certain foreign equity securities are also fair valued whenever the movement of a particular index exceeds certain thresholds. In such cases, the securities are fair valued by applying factors provided by a third-party vendor in accordance with valuation procedures adopted by the Board and are generally categorized as Level 2 in the hierarchy.
Equity securities are valued at the last quoted sales prices as of the close of regular trading on the relevant exchange on each valuation date. Securities that are not traded on the valuation date are valued at the mean of the last quoted bid and ask prices. Prices are normally taken from the principal market in which each security trades. Futures contracts are valued at the last posted settlement price on the market where such futures are primarily traded. These securities are generally categorized as Level 1 in the hierarchy.
Investments in mutual funds, including money market funds, are valued at their respective NAVs as of the close of the Exchange on the valuation date. These securities are generally categorized as Level 1 in the hierarchy.
Debt securities (other than convertible and municipal bonds) are valued at the evaluated bid prices (evaluated mean prices in the case of convertible and municipal bonds) supplied by a pricing agent or broker selected by the Manager, in consultation with the Subadvisor. The evaluations are market-based measurements processed through a pricing application and represents the pricing agent’s good faith determination as to what a holder may receive in an orderly transaction under market conditions. The rules based logic utilizes valuation techniques that reflect participants’ assumptions and vary by asset class and per methodology, maximizing the use of relevant observable data including quoted prices for similar assets, benchmark yield curves and
Notes to Financial Statements (continued)
market corroborated inputs. The evaluated bid or mean prices are deemed by the Manager, in consultation with the Subadvisor to be representative of market values at the regular close of trading of the Exchange on each valuation date. Debt securities purchased on a delayed delivery basis are marked to market daily until settlement at the forward settlement date. Debt securities, including corporate bonds, U.S. government and federal agency bonds, municipal bonds, foreign bonds, convertible bonds, asset-backed securities and mortgage-backed securities are generally categorized as Level 2 in the hierarchy.
Temporary cash investments acquired in excess of 60 days to maturity at the time of purchase are valued using the latest bid prices or using valuations based on a matrix system (which considers such factors as security prices, yields, maturities and ratings), both as furnished by independent pricing services. Temporary cash investments that mature in 60 days or less at the time of purchase (“Short-Term Investments”) are valued using the amortized cost method of valuation, unless the use of such method would be inappropriate. The amortized cost method involves valuing a security at its cost on the date of purchase and thereafter assuming a constant amortization to maturity of the difference between such cost and the value on maturity date. Amortized cost approximates the current fair value of a security. Securities valued using the amortized cost method are not valued using quoted prices in an active market and are generally categorized as Level 2 in the hierarchy.
The information above is not intended to reflect an exhaustive list of the methodologies that may be used to value portfolio investments. The valuation procedures permit the use of a variety of valuation methodologies in connection with valuing portfolio investments. The methodology used for a specific type of investment may vary based on the market data available or other considerations. The methodologies summarized above may not represent the specific means by which portfolio investments are valued on any particular business day.
(B) Income Taxes. The Portfolio’s policy is to comply with the requirements of the Internal Revenue Code of 1986, as amended (the “Internal Revenue Code”), applicable to regulated investment companies and to distribute all of its taxable income to the shareholders of the Portfolio within the allowable time limits.
The Manager evaluates the Portfolio’s tax positions to determine if the tax positions taken meet the minimum recognition threshold in connection with accounting for uncertainties in income tax positions taken or expected to be taken for the purposes of measuring and recognizing tax liabilities in the financial statements. Recognition of tax benefits of an uncertain tax position is permitted only to the extent the position is “more likely than not” to be sustained assuming examination by taxing authorities. The Manager analyzed the Portfolio’s tax positions taken on federal, state and local income tax returns for all open tax years (for up to three tax years) and has concluded that no provisions for federal, state and local income tax are required in the Portfolio’s financial statements. The Portfolio’s federal, state and local income tax and federal excise tax returns for tax years for which the applicable statutes of limitations have not expired are subject to examination by the Internal Revenue Service and state and local departments of revenue.
(C) Foreign Taxes. The Portfolio may be subject to foreign taxes on income and other transaction-based taxes imposed by certain countries in which it invests. A portion of the taxes on gains on investments or currency purchases/repatriation may be reclaimable. The Portfolio
will accrue such taxes and reclaims as applicable, based upon its current interpretation of tax rules and regulations that exist in the markets in which it invests.
The Portfolio may be subject to taxation on realized capital gains, repatriation proceeds and other transaction-based taxes imposed by certain countries in which it invests. The Portfolio will accrue such taxes as applicable based upon its current interpretation of tax rules and regulations that exist in the market in which it invests. Capital gains taxes relating to positions still held are reflected as a liability in the Statement of Assets and Liabilities, as well as an adjustment to the Portfolio’s net unrealized appreciation (depreciation). Taxes related to capital gains realized, if any, are reflected as part of net realized gain (loss) in the Statement of Operations. Changes in tax liabilities related to capital gains taxes on unrealized investment gains, if any, are reflected as part of the change in net unrealized appreciation (depreciation) on investments in the Statement of Operations. Transaction-based charges are generally assessed as a percentage of the transaction amount.
(D) Dividends and Distributions to Shareholders. Dividends and distributions are recorded on the ex-dividend date. The Portfolio intends to declare and pay dividends from net investment income and distributions from net realized capital and currency gains, if any, at least annually. Unless a shareholder elects otherwise, all dividends and distributions are reinvested at NAV in the same class of shares of the Portfolio. Dividends and distributions to shareholders are determined in accordance with federal income tax regulations and may differ from determinations using GAAP.
(E) Security Transactions and Investment Income. The Portfolio records security transactions on the trade date. Realized gains and losses on security transactions are determined using the identified cost method. Dividend income is recognized on the ex-dividend date, net of any foreign tax withheld at the source, and interest income is accrued as earned using the effective interest rate method and includes any realized gains and losses from repayments of principal on mortgage-backed securities.
Investment income and realized and unrealized gains and losses on investments of the Portfolio are allocated pro rata to the separate classes of shares based upon their relative net assets on the date the income is earned or realized and unrealized gains and losses are incurred.
The Portfolio may place a debt security on non-accrual status and reduce related interest income by ceasing current accruals and writing off all or a portion of any interest receivables when the collection of all or a portion of such interest has become doubtful. A debt security is removed from non-accrual status when the issuer resumes interest payments or when collectability of interest is reasonably assured.
(F) Expenses. Expenses of the Fund are allocated to the individual Portfolios in proportion to the net assets of the respective Portfolios when the expenses are incurred, except where direct allocations of expenses can be made. Expenses (other than fees incurred under the distribution and service plans, further discussed in Note 3(B), which are charged directly to the Service Class shares) are allocated to separate classes of shares pro rata based upon their relative net assets on the date the expenses are incurred. The expenses borne by the Portfolio, including those of related parties to the Portfolio, are shown in the Statement of Operations.
| | |
| 22 | | MainStay VP T. Rowe Price Equity Income Portfolio |
Additionally, the Portfolio may invest in mutual funds, which are subject to management fees and other fees that may cause the costs of investing in mutual funds to be greater than the costs of owning the underlying securities directly. These indirect expenses of mutual funds are not included in the amounts shown as expenses in the Portfolio’s Statement of Operations or in the expense ratios included in the Financial Highlights.
(G) Use of Estimates. In preparing financial statements in conformity with GAAP, the Manager makes estimates and assumptions that affect the reported amounts and disclosures in the financial statements. Actual results could differ from those estimates.
(H) Repurchase Agreements. The Portfolio may enter into repurchase agreements (i.e., buy a security from another party with the agreement that it will be sold back in the future) to earn income. The Portfolio may enter into repurchase agreements only with counterparties, usually financial institutions, that are deemed by the Manager or the Subadvisor to be creditworthy, pursuant to guidelines established by the Board. During the term of any repurchase agreement, the Manager or the Subadvisor will continue to monitor the creditworthiness of the counterparty. Under the 1940 Act, repurchase agreements are considered to be collateralized loans by the Portfolio to the counterparty secured by the securities transferred to the Portfolio.
Repurchase agreements are subject to counterparty risk, meaning the Portfolio could lose money by the counterparty’s failure to perform under the terms of the agreement. The Portfolio mitigates this risk by ensuring the repurchase agreement is collateralized by cash, U.S. government securities, fixed income securities and/or other securities. The collateral is held by the Portfolio’s custodian and valued daily on a mark to market basis to determine if the value, including accrued interest, exceeds the repurchase price. In the event of the counterparty’s default on the obligation to repurchase, the Portfolio has the right to liquidate the collateral and apply the proceeds in satisfaction of the obligation. Under certain circumstances, such as in the event of default or bankruptcy by the counterparty, realization and/or retention of the collateral may be limited or subject to delay, to legal proceedings and possible realized loss to the Portfolio. As of June 30, 2020, the Portfolio did not hold any repurchase agreements.
(I) Foreign Currency Transactions. The Portfolio’s books and records are maintained in U.S. dollars. Prices of securities denominated in foreign currency amounts are translated into U.S. dollars at the mean between the buying and selling rates last quoted by any major U.S. bank at the following dates:
(i) market value of investment securities, other assets and liabilities — at the valuation date; and
(ii) purchases and sales of investment securities, income and expenses — at the date of such transactions.
The assets and liabilities that are denominated in foreign currency amounts are presented at the exchange rates and market values at the close of the period. The realized and unrealized changes in net assets arising from fluctuations in exchange rates and market prices of securities are not separately presented.
Net realized gain (loss) on foreign currency transactions represents net currency gains or losses realized as a result of differences between the amounts of securities sale proceeds or purchase cost, dividends,
interest and withholding taxes as recorded on the Portfolio’s books, and the U.S. dollar equivalent amount actually received or paid. Net currency gains or losses from valuing such foreign currency denominated assets and liabilities, other than investments at valuation date exchange rates, are reflected in unrealized foreign exchange gains or losses.
(J) Futures Contracts. A futures contract is an agreement to purchase or sell a specified quantity of an underlying instrument at a specified future date and price, or to make or receive a cash payment based on the value of a financial instrument (e.g., foreign currency, interest rate, security or securities index). The Portfolio is subject to risks such as market price risk and/or interest rate risk in the normal course of investing in these contracts. Upon entering into a futures contract, the Portfolio is required to pledge to the broker or futures commission merchant an amount of cash and/or U.S. government securities equal to a certain percentage of the collateral amount, known as the “initial margin.” During the period the futures contract is open, changes in the value of the contract are recognized as unrealized appreciation or depreciation by marking to market such contract on a daily basis to reflect the market value of the contract at the end of each day’s trading. The Portfolio agrees to receive from or pay to the broker or futures commission merchant an amount of cash equal to the daily fluctuation in the value of the contract. Such receipts or payments are known as “variation margin.” When the futures contract is closed, the Portfolio records a realized gain or loss equal to the difference between the proceeds from (or cost of) the closing transaction and the Portfolio’s basis in the contract.
The use of futures contracts involves, to varying degrees, elements of market risk in excess of the amount recognized in the Statement of Assets and Liabilities. The contract or notional amounts and variation margin reflect the extent of the Portfolio’s involvement in open futures positions. There are several risks associated with the use of futures contracts as hedging techniques. There can be no assurance that a liquid market will exist at the time when the Portfolio seeks to close out a futures contract. If no liquid market exists, the Portfolio would remain obligated to meet margin requirements until the position is closed. Futures contracts may involve a small initial investment relative to the risk assumed, which could result in losses greater than if the Portfolio did not invest in futures contracts. Futures contracts may be more volatile than direct investments in the instrument underlying the futures and may not correlate to the underlying instrument, causing a given hedge not to achieve its objectives. The Portfolio’s activities in futures contracts have minimal counterparty risk as they are conducted through regulated exchanges that guarantee the futures against default by the counterparty. In the event of a bankruptcy or insolvency of a futures commission merchant that holds margin on behalf of the Portfolio, the Portfolio may not be entitled to the return of the entire margin owed to the Portfolio, potentially resulting in a loss. The Portfolio’s investment in futures contracts and other derivatives may increase the volatility of the Portfolio’s NAVs and may result in a loss to the Portfolio. Open futures contracts as of June 30, 2020, are shown in the Portfolio of Investments.
(K) Securities Lending. In order to realize additional income, the Portfolio may engage in securities lending, subject to the limitations set forth in the 1940 Act and relevant guidance by the staff of the Securities and Exchange Commission (“SEC”). If the Portfolio engages in securities lending, the Portfolio will lend through its custodian, currently State
Notes to Financial Statements (continued)
Street Bank and Trust Company (“State Street”), acting as securities lending agent on behalf of the Portfolio. Under the current arrangement, State Street will manage the Portfolio’s collateral in accordance with the securities lending agency agreement between the Portfolio and State Street, and indemnify the Portfolio against counterparty risk. The loans will be collateralized by cash (which may be invested in a money market fund) and/or non-cash collateral (which may include U.S. Treasury securities and/or U.S. government agency securities issued or guaranteed by the United States government or its agencies or instrumentalities) at least equal at all times to the market value of the securities loaned. The Portfolio bears the risk of delay in recovery of, or loss of rights in, the securities loaned. The Portfolio may also record a realized gain or loss on securities deemed sold due to a borrower’s inability to return securities on loan. The Portfolio bears the risk of any loss on investment of cash collateral. The Portfolio will receive compensation for lending its securities in the form of fees or it will retain a portion of interest earned on the investment of any cash collateral. The Portfolio will also continue to receive interest and dividends on the securities loaned and any gain or loss in the market price of the securities loaned that may occur during the term of the loan will be for the account of the Portfolio. Income earned from securities lending activities, if any, is reflected in the Statement of Operations. As of June 30, 2020, the Portfolio had securities on loan with an aggregate market value of $78,902 and received non-cash collateral, in the form of U.S. Treasury securities, with a value of $83,306.
(L) Debt Securities Risk. The ability of issuers of debt securities held by the Portfolio to meet their obligations may be affected by, among other things, economic or political developments in a specific country, industry or region. Debt securities are also subject to the risks associated with changes in interest rates.
Convertible securities may be subordinate to other securities. In part, the total return for a convertible security depends upon the performance of the underlying stock into which it can be converted. Also, issuers of convertible securities are often not as strong financially as those issuing securities with higher credit ratings, are more likely to encounter financial difficulties and typically are more vulnerable to changes in the economy, such as a recession or a sustained period of rising interest rates, which could affect their ability to make interest and principal payments.
The Portfolio invests in foreign securities, which carry certain risks that are in addition to the usual risks inherent in domestic securities. These risks include those resulting from currency fluctuations, future adverse political or economic developments and possible imposition of currency exchange blockages or other foreign governmental laws or restrictions. These risks are likely to be greater in emerging markets than in developed markets. The ability of issuers of securities held by the Portfolio to meet their obligations may be affected by, among other things, economic or political developments in a specific country, industry or region.
(M) Indemnifications. Under the Fund’s organizational documents, its officers and trustees are indemnified against certain liabilities that may arise out of performance of their duties to the Fund. Additionally, in the normal course of business, the Portfolio enters into contracts with third-party service providers that contain a variety of representations and warranties and that may provide general indemnifications. The Portfolio’s maximum exposure under these arrangements is unknown,
as this would involve future claims that may be made against the Portfolio that have not yet occurred. The Manager believes that the risk of loss in connection with these potential indemnification obligations is remote. However, there can be no assurance that material liabilities related to such obligations will not arise in the future, which could adversely impact the Portfolio.
(N) Quantitative Disclosure of Derivative Holdings. The following tables show additional disclosures related to the Portfolio’s derivative and hedging activities, including how such activities are accounted for and their effect on the Portfolio’s financial positions, performance and cash flows. The Portfolio entered into futures contracts to help manage cash flows and be able to avoid making a market timing call by focusing on making bottom-up investment decisions without sacrificing liquidity. These derivatives are not accounted for as hedging instruments.
Fair value of derivative instruments as of June 30, 2020:
Asset Derivatives
| | | | | | | | | | |
| | | Statement of
Assets and
Liabilities
Location | | Equity
Contracts
Risk | | | Total | |
| | | |
Futures Contracts | | Net Assets—Net unrealized appreciation on investments and futures contracts (a) | | $ | 105,646 | | | $ | 105,646 | |
| | | | | | | | | | |
Total Fair Value | | | | $ | 105,646 | | | $ | 105,646 | |
| | | | | | | | | | |
| (a) | Includes cumulative appreciation (depreciation) of futures contracts as reported in the Portfolio of Investments. Only current day’s variation margin is reported within the Statement of Assets and Liabilities. |
The effect of derivative instruments on the Statement of Operations for the period ended June 30, 2020:
Change in Unrealized Appreciation (Depreciation)
| | | | | | | | | | |
| | | Statement of
Operations
Location | | Equity
Contracts
Risk | | | Total | |
| | | |
Futures Contracts | | Net change in unrealized appreciation (depreciation) on futures contracts | | $ | 105,646 | | | $ | 105,646 | |
| | | | | | | | | | |
Total Change in Unrealized Appreciation (Depreciation) | | | | $ | 105,646 | | | $ | 105,646 | |
| | | | | | | | | | |
Average Notional Amount
| | | | | | | | |
| | | Equity
Contracts
Risk | | | Total | |
| | |
Futures Contracts Long(a) | | $ | 4,635,300 | | | $ | 4,635,300 | |
| | | | | | | | |
| (a) | Positions were open less than one month during the reporting period. |
| | |
| 24 | | MainStay VP T. Rowe Price Equity Income Portfolio |
Note 3–Fees and Related Party Transactions
(A) Manager and Subadvisor. New York Life Investments, a registered investment adviser and an indirect, wholly-owned subsidiary of New York Life, serves as the Portfolio’s Manager pursuant to an Amended and Restated Management Agreement (“Management Agreement”). The Manager provides offices, conducts clerical, recordkeeping and bookkeeping services, and keeps most of the financial and accounting records required to be maintained by the Portfolio. Except for the portion of salaries and expenses that are the responsibility of the Portfolio, the Manager pays the salaries and expenses of all personnel affiliated with the Portfolio and certain operational expenses of the Portfolio. The Portfolio reimburses New York Life Investments in an amount equal to the portion of the compensation of the Chief Compliance Officer attributable to the Portfolio. T. Rowe Price Associates, Inc. (“T. Rowe” or “Subadvisor”), a registered investment adviser, serves as Subadvisor to the Portfolio and is responsible for the day-to-day portfolio management of the Portfolio. Pursuant to the terms of a Subadvisory Agreement (“Subadvisory Agreement”) between New York Life Investments and T. Rowe, New York Life Investments pays for the services of the Subadvisor.
The Fund, on behalf of the Portfolio, pays New York Life Investments in its capacity as the Portfolio’s investment manager and administrator, pursuant to the Management Agreement, a monthly fee for the services performed and facilities furnished at an annual percentage of the Portfolio’s average daily net assets as follows: 0.725% up to $500 million; 0.70% from $500 million to $1 billion; and 0.675% in excess of $1 billion.
During the six-month period ended June 30, 2020, New York Life Investments earned fees from the Portfolio in the amount of $2,207,162 and paid the Subadvisor in the amount of $904,740.
State Street provides sub-administration and sub-accounting services to the Portfolio pursuant to an agreement with New York Life Investments. These services include calculating the daily NAVs of the Portfolio, maintaining the general ledger and sub-ledger accounts for the calculation of the Portfolio’s NAVs and assisting New York Life Investments in conducting various aspects of the Portfolio’s administrative operations. For providing these services to the Portfolio, State Street is compensated by New York Life Investments.
Pursuant to an agreement between the Fund and New York Life Investments, New York Life Investments is responsible for providing or procuring certain regulatory reporting services for the Portfolio. The Portfolio will reimburse New York Life Investments for the actual costs incurred by New York Life Investments in connection with providing or procuring these services for the Portfolio.
(B) Distribution and Service Fees. The Fund, on behalf of the Portfolio, has entered into a distribution agreement with NYLIFE Distributors LLC (the “Distributor”), an indirect, wholly-owned subsidiary of New York Life. The Portfolio has adopted a distribution plan (the “Plan”) in accordance with the provisions of Rule 12b-1 under the 1940 Act. Under the Plan, the Distributor has agreed to provide, through its affiliates or independent third parties, various distribution-related, shareholder and administrative support services to the Service Class shareholders. For its services, the Distributor is entitled to a combined distribution and service fee accrued daily and paid monthly at an annual rate of 0.25% of the average daily net assets attributable to the Service Class shares of the Portfolio.
(C) Investments in Affiliates (in 000’s). During the six-month period ended June 30, 2020, purchases and sales transactions, income earned from investments and shares held of investment companies managed by New York Life Investments or its affiliates were as follows:
| | | | | | | | | | | | | | | | | | | | | | | | | | | | | | | | | | | | |
Affiliated Investment
Company | | Value,
Beginning
of Period | | | Purchases
at Cost | | | Proceeds
from Sales | | | Net Realized
Gain/(Loss)
on Sales | | | Change in
Unrealized
Appreciation/
(Depreciation) | | | Value, End
of Period | | | Dividend
Income | | | Other
Distributions | | | Shares
End of
Period | |
| | | | | | | | | |
MainStay U.S. Government Liquidity Fund | | $ | 10,457 | | | $ | 62,771 | | | $ | (57,438 | ) | | $ | — | | | $ | — | | | $ | 15,790 | | | $ | 28 | | | $ | — | | | | 15,790 | |
Note 4–Federal Income Tax
As of June 30, 2020, the cost and unrealized appreciation (depreciation) of the Portfolio’s investment portfolio, including applicable derivative contracts and other financial instruments, as determined on a federal income tax basis, was as follows:
| | | | | | | | | | | | | | | | |
| | | Federal Tax Cost | | | Gross
Unrealized
Appreciation | | | Gross
Unrealized
(Depreciation) | | | Net
Unrealized
Appreciation/
(Depreciation) | |
| | | | |
Investments in Securities | | $ | 572,425,922 | | | $ | 63,106,754 | | | $ | (68,923,532 | ) | | $ | (5,816,778 | ) |
During the year ended December 31, 2019, the tax character of distributions paid as reflected in the Statements of Changes in Net Assets was as follows:
| | |
|
| 2019 |
Tax-Based
Distributions from Ordinary
Income | | Tax-Based
Distributions from Long-Term
Gains |
| |
| $16,662,550 | | $53,781,412 |
Note 5–Custodian
State Street is the custodian of cash and securities held by the Portfolio. Custodial fees are charged to the Portfolio based on the Portfolio’s net assets and/or the market value of securities held by the Portfolio and the number of certain transactions incurred by the Portfolio.
Notes to Financial Statements (continued)
Note 6–Line of Credit
The Portfolio and certain other funds managed by New York Life Investments maintain a line of credit with a syndicate of banks in order to secure a source of funds for temporary purposes to meet unanticipated or excessive redemption requests.
Effective July 28, 2020, under the credit agreement (the “Credit Agreement”), the aggregate commitment amount is $600,000,000 with an additional uncommitted amount of $100,000,000. The commitment fee is an annual rate of 0.15% of the average commitment amount payable quarterly, regardless of usage, to JP Morgan Chase Bank NA, who serves as the agent to the syndicate. The commitment fee is allocated among the Portfolio and certain other funds managed by New York Life Investments based upon their respective net assets and other factors. Interest on any revolving credit loan is charged based upon the Federal Funds Rate or the one-month London Interbank Offered Rate (“LIBOR”), whichever is higher. The Credit Agreement expires on July 27, 2021, although the Portfolio, certain other funds managed by New York Life Investments and the syndicate of banks may renew the Credit Agreement for an additional year on the same or different terms or enter into a credit agreement with a different syndicate of banks. Prior to July 28, 2020, the aggregate commitment amount and the commitment fee were the same as those under the current Credit Agreement, but State Street served as agent to the syndicate. During the six-month period ended June 30, 2020, there were no borrowings made or outstanding with respect to the Portfolio under the Credit Agreement or the credit agreement for which State Street served as agent.
Note 7–Interfund Lending Program
Pursuant to an exemptive order issued by the SEC, the Portfolio, along with certain other funds managed by New York Life Investments, may participate in an interfund lending program. The interfund lending program provides an alternative credit facility that permits the Portfolio and certain other funds managed by New York Life Investments to lend or borrow money for temporary purposes directly to or from one another subject to the conditions of the exemptive order. During the six-month period ended June 30, 2020, there were no interfund loans made or outstanding with respect to the Portfolio.
Note 8–Purchases and Sales of Securities (in 000’s)
During the six-month period ended June 30, 2020, purchases and sales of securities, other than short-term securities, were $122,263 and $145,617, respectively.
Note 9–Capital Share Transactions
Transactions in capital shares for the six-month period ended June 30, 2020 and the year ended December 31, 2019, were as follows:
| | | | | | | | |
Initial Class | | Shares | | | Amount | |
| | |
Six-month period ended June 30, 2020: | | | | | | | | |
Shares sold | | | 3,011,889 | | | $ | 27,455,801 | |
Shares redeemed | | | (4,171,560 | ) | | | (43,659,019 | ) |
| | | | |
Net increase (decrease) | | | (1,159,671 | ) | | $ | (16,203,218 | ) |
| | | | |
| | |
Year ended December 31, 2019: | | | | | | | | |
Shares sold | | | 1,291,981 | | | $ | 16,219,640 | |
Shares issued to shareholders in reinvestment of distributions | | | 3,816,533 | | | | 44,741,064 | |
Shares redeemed | | | (7,002,642 | ) | | | (89,672,782 | ) |
| | | | |
Net increase (decrease) | | | (1,894,128 | ) | | $ | (28,712,078 | ) |
| | | | |
| | |
| | | | | | | | |
Service Class | | Shares | | | Amount | |
| | |
Six-month period ended June 30, 2020: | | | | | | | | |
Shares sold | | | 812,765 | | | $ | 7,823,737 | |
Shares redeemed | | | (1,762,486 | ) | | | (19,225,824 | ) |
| | | | |
Net increase (decrease) | | | (949,721 | ) | | $ | (11,402,087 | ) |
| | | | |
| | |
Year ended December 31, 2019: | | | | | | | | |
Shares sold | | | 187,553 | | | $ | 2,332,011 | |
Shares issued to shareholders in reinvestment of distributions | | | 2,200,234 | | | | 25,702,898 | |
Shares redeemed | | | (4,599,868 | ) | | | (58,276,843 | ) |
| | | | |
Net increase (decrease) | | | (2,212,081 | ) | | $ | (30,241,934 | ) |
| | | | |
Note 10–Recent Accounting Pronouncement
In March 2020, the Financial Accounting Standards Board (“FASB”) issued Accounting Standards Update 2020-04 (“ASU 2020-04”), which provides optional guidance to ease the potential accounting burden associated with transitioning away from LIBOR and other reference rates that are expected to be discontinued. ASU 2020-04 is effective immediately upon release of the update on March 12, 2020 through December 31, 2022. At this time, the Manager is evaluating the implications of certain other provisions of ASU 2020-04 related to new disclosure requirements and any impact on the financial statement disclosures has not yet been determined.
Note 11–Subsequent Events
In connection with the preparation of the financial statements of the Portfolio as of and for the six-month period ended June 30, 2020, events and transactions subsequent to June 30, 2020, through the date the financial statements were issued have been evaluated by the Manager, for possible adjustment and/or disclosure. No subsequent events requiring financial statement adjustment or disclosure have been identified.
Note 12–Other Matters
An outbreak of COVID-19, first detected in December 2019, has developed into a global pandemic and has resulted in travel restrictions, closure of international borders, certain businesses and securities markets, restrictions on securities trading activities, prolonged quarantines, supply chain disruptions, and lower consumer demand, as well as general concern and uncertainty. The continued impact of COVID-19 is uncertain and could further adversely affect the global economy, national economies, individual issuers and capital markets in unforeseeable ways and result in a substantial and extended economic downturn. Developments that disrupt global economies and financial markets, such as COVID-19, may magnify factors that affect the Portfolio’s performance.
| | |
| 26 | | MainStay VP T. Rowe Price Equity Income Portfolio |
Discussion of the Operation and Effectiveness of the Portfolio’s
Liquidity Risk Management Program (Unaudited)
In compliance with Rule 22e-4 under the Investment Company Act of 1940, as amended (the “Liquidity Rule”), the Portfolio has adopted and implemented a liquidity risk management program (the “Program”), which New York Life Investment Management LLC believes is reasonably designed to assess and manage the Portfolio’s liquidity risk. The Board designated New York Life Investment Management LLC as administrator of the Program (the “Administrator”). The Administrator has established a Liquidity Risk Management Committee to assist the Administrator in the implementation and day-to-day administration of the Program and to otherwise support the Administrator in fulfilling its responsibilities under the Program.
At a meeting of the Board held on March 11, 2020, the Administrator provided the Board with a written report addressing the Program’s operation, adequacy and effectiveness of implementation for the period from December 1, 2018 through December 31, 2019, as required under the Liquidity Rule. The report noted that the Administrator concluded that (i) the Program operated effectively to assess and manage the Portfolio’s liquidity risk, (ii) the Program has been adequately and effectively implemented to monitor and, as applicable, respond to the Portfolio’s liquidity developments and (iii) the Portfolio’s investment strategy continues to be appropriate for an open-end portfolio.
In accordance with the Program, the Portfolio’s liquidity risk is assessed no less frequently than annually taking into consideration certain factors, as applicable, such as (i) investment strategy and liquidity of portfolio investments, (ii) short-term and long-term cash flow projections and (iii) holdings of cash and cash equivalents and borrowing arrangements and other funding sources. Certain factors are considered under both normal and reasonably foreseeable stressed conditions.
Each Portfolio portfolio investment is classified into one of four liquidity categories. The classification is based on a determination of the number of days it is reasonably expected to take to convert the investment into cash, or sell or dispose of the investment, in current market conditions without significantly changing the market value of the investment. The Administrator has delegated liquidity classification determinations to the Portfolio’s subadvisor, subject to appropriate oversight by the Administrator, and classification determinations are made by taking into account the Portfolio’s reasonably anticipated trade size, various market, trading and investment-specific considerations, as well as market depth, and, in certain cases, third-party vendor data.
The Liquidity Rule requires portfolios that do not primarily hold assets that are highly liquid investments to adopt a minimum amount of net assets that must be invested in highly liquid investments that are assets (an “HLIM”). In addition, the Liquidity Rule limits a portfolio’s investments in illiquid investments. Specifically, the Liquidity Rule prohibits acquisition of illiquid investments if doing so would result in a portfolio holding more than 15% of its net assets in illiquid investments that are assets. The Program includes provisions reasonably designed to determine, periodically review and comply with the HLIM requirement, as applicable, and to comply with the 15% limit on illiquid investments.
Proxy Voting Policies and Procedures and Proxy Voting Record
A description of the policies and procedures that New York Life Investments uses to vote proxies related to the Portfolio’s securities is available free of charge upon request (i) by calling 800-598-2019; (ii) by visiting New York Life Investments’ website at https://www.nylinvestments.com/mainstay/products-and-performance/mainstay-vp-funds-trust; or (iii) by visiting the SEC’s website at www.sec.gov.
The Portfolio is required to file with the SEC its proxy voting record for the 12-month period ending June 30 on Form N-PX. The Portfolio’s most recent Form N-PX or proxy voting record is available free of charge upon request (i) by calling 800-598-2019; (ii) by visiting New York Life Investments’ website at https://www.nylinvestments.com/mainstay/products-and-performance/mainstay-vp-funds-trust; or (iii) by visiting the SEC’s website at www.sec.gov.
Shareholder Reports and Quarterly Portfolio Disclosure
The Portfolio is required to file its complete schedule of portfolio holdings with the SEC 60 days after its first and third fiscal quarter on Form N-PORT. The Portfolio’s holdings report is available free of charge upon request by calling 800-598-2019 or by visiting the SEC’s website at www.sec.gov.
| | |
| 28 | | MainStay VP T. Rowe Price Equity Income Portfolio |
MainStay VP Portfolios
MainStay VP offers a wide range of Portfolios. The full array of MainStay VP offerings is listed here, with information about the manager, subadvisors, legal counsel, and independent registered public accounting firm.
Equity Portfolios
MainStay VP Emerging Markets Equity Portfolio
MainStay VP Epoch U.S. Equity Yield Portfolio
MainStay VP Fidelity Institutional AM® Utilities Portfolio†
MainStay VP MacKay Common Stock Portfolio
MainStay VP MacKay Growth Portfolio
MainStay VP MacKay International Equity Portfolio
MainStay VP MacKay Mid Cap Core Portfolio
MainStay VP MacKay S&P 500 Index Portfolio
MainStay VP MacKay Small Cap Core Portfolio
MainStay VP Mellon Natural Resources Portfolio
MainStay VP Small Cap Growth Portfolio
MainStay VP T. Rowe Price Equity Income Portfolio
MainStay VP Winslow Large Cap Growth Portfolio
Mixed Asset Portfolios
MainStay VP Balanced Portfolio
MainStay VP Income Builder Portfolio
MainStay VP Janus Henderson Balanced Portfolio
MainStay VP MacKay Convertible Portfolio
Income Portfolios
MainStay VP Bond Portfolio
MainStay VP Floating Rate Portfolio
MainStay VP Indexed Bond Portfolio
MainStay VP MacKay Government Portfolio
MainStay VP MacKay High Yield Corporate Bond Portfolio
MainStay VP MacKay Unconstrained Bond Portfolio
MainStay VP PIMCO Real Return Portfolio
Money Market
MainStay VP U.S. Government Money Market Portfolio
Alternative
MainStay VP CBRE Global Infrastructure Portfolio
MainStay VP IQ Hedge Multi-Strategy Portfolio
Asset Allocation Portfolios
MainStay VP Conservative Allocation Portfolio
MainStay VP Growth Allocation Portfolio
MainStay VP Moderate Allocation Portfolio
MainStay VP Moderate Growth Allocation Portfolio
Manager
New York Life Investment Management LLC
New York, New York
Subadvisors
Brown Advisory LLC
Baltimore, Maryland
Candriam Belgium S.A.*
Brussels, Belgium
CBRE Clarion Securities LLC
Radnor, Pennsylvania
Epoch Investment Partners, Inc.
New York, New York
FIAM LLC
Smithfield, Rhode Island
IndexIQ Advisors LLC*
New York, New York
Janus Capital Management LLC
Denver, Colorado
MacKay Shields LLC*
New York, New York
Mellon Investments Corporation
Boston, Massachusetts
NYL Investors LLC*
New York, New York
Pacific Investment Management Company LLC
Newport Beach, California
Segall Bryant & Hamill, LLC
Chicago, Illinois
T. Rowe Price Associates, Inc.
Baltimore, Maryland
Winslow Capital Management, LLC
Minneapolis, Minnesota
Distributor
NYLIFE Distributors LLC*
Jersey City, New Jersey
Custodian
State Street Bank and Trust Company
Boston, Massachusetts
Independent Registered Public Accounting Firm
PricewaterhouseCoopers LLP
New York, New York
Legal Counsel
Dechert LLP
Washington, District of Columbia
Some Portfolios may not be available in all products.
| † | Fidelity Institutional AM is a registered trade mark of FMR LLC. Used with permission. |
| * | An affiliate of New York Life Investment Management LLC |
Not part of the Semiannual Report
2020 Semiannual Report
This report is for the general information of New York Life Variable Annuities and NYLIAC Variable Universal Life Insurance Products policyowners. It must be preceded or accompanied by the appropriate product(s) and funds prospectuses if it is given to anyone who is not an owner of a New York Life variable annuity policy or a NYLIAC Variable Universal Life Insurance Product. This report does not offer for sale or solicit orders to purchase securities.
The performance data quoted in this report represents past performance. Past performance is no guarantee of future results. Due to market volatility and other factors, current performance may be lower or higher than the figures shown. The most recent month-end performance summary for your variable annuity or variable life policy is available by calling 800-598-2019 and is updated periodically on www.newyorklife.com.
The New York Life Variable Annuities and NYLIAC Variable Universal Life Insurance Products are issued by New York Life Insurance and Annuity Corporation (a Delaware Corporation) and distributed by NYLIFE Distributors LLC (Member FINRA/SIPC).
New York Life Insurance Company
New York Life Insurance and Annuity Corporation
(NYLIAC) (A Delaware Corporation)
51 Madison Avenue, Room 551
New York, NY 10010
www.newyorklife.com
Printed on recycled paper
nylinvestments.com
NYLIFE Distributors LLC, 30 Hudson Street, Jersey City, NJ 07302
New York Life Investment Management LLC is the investment manager to the MainStay VP Funds Trust
©2020 by NYLIFE Distributors LLC. All rights reserved.
You may obtain copies of the Prospectus and the Statement of Additional Information free of charge, upon request, by calling toll-free 800-598-2019 or writing to New York Life Insurance and Annuity Corporation, 51 Madison Avenue, New York, NY 10010.
| | | | |
| Not FDIC Insured | | No Bank Guarantee | | May Lose Value |
| | | | |
| 1781643 | | | | MSVPTRPE10-08/20 (NYLIAC) NI531 |
MainStay VP U.S. Government Money Market Portfolio
Message from the President and Semiannual Report
Unaudited | June 30, 2020
Beginning on January 1, 2021, as permitted by regulations adopted by the Securities and Exchange Commission, paper copies of the MainStay VP Portfolio annual and semi-annual shareholder reports may no longer be sent by mail, unless you specifically request paper copies of the reports from the insurance company that offers your policy. Instead, the reports will be made available online, and you will be notified by mail each time a report is posted and provided with a website link to access the report. Instructions for requesting paper copies will be provided by your insurance company.
If you already elected to receive shareholder reports electronically, you will not be affected by this change and you need not take any action. At any time, you may elect to receive reports and other communications from the insurance company electronically by following the instructions provided by the insurance company.
You may elect to receive all future shareholder reports in paper form free of charge. You can inform the insurance company that you wish to receive paper copies of reports by following the instructions provided by the insurance company. Your election to receive reports in paper form will apply to all portfolio companies available under your contract.
| | | | | | | | |
| Not FDIC/NCUA Insured | | Not a Deposit | | May Lose Value | | No Bank Guarantee | | Not Insured by Any Government Agency |

This page intentionally left blank
Message from the President
High levels of volatility shook financial markets in response to the COVID-19 pandemic and an abrupt decline in global economic activity during the six months ended June 30, 2020.
Markets entered 2020 riding strong fourth quarter performance and an economic expansion of historic longevity. Most broad stock and bond indices began to dip in late February as growing numbers of COVID-19 cases were seen in hotspots around the world. On March 11, 2020, the World Health Organization acknowledged that the disease had reached pandemic proportions, with over 80,000 identified cases in China, thousands in Italy, South Korea and the United States, and more in dozens of additional countries. Governments and central banks pledged trillions of dollars to address the mounting economic and public health crisis; however, “stay-at-home” orders and other restrictions on non-essential activity caused global economic activity to slow. Most stocks and bonds lost significant ground in this challenging environment, with equities declining by roughly a third and the yield on high-yield credit indices shooting higher.
Policymakers responded with extraordinary speed to address the situation. In the United States, the Federal Reserve (“Fed”) cut interest rates to near zero and announced unlimited quantitative easing. With help from Treasury, the Fed later rolled out a series of lending facilities to directly support market functioning. In late March, the Federal government declared a national emergency; Congress passed, and the President signed, a $2 trillion CARES Act (The Coronavirus Aid, Relief, and Economic Security Act), with the promise of further assistance for consumers and businesses to come. This enormous wave of policy support helped fuel a rapid recovery in market pricing as stocks bounced back and credit spreads narrowed. Some states rushed to ease restrictions on travel and social gatherings, further fueling optimism that the effects of the pandemic might prove short lived. However, the final weeks of the reporting period saw infection rates beginning to rise in some of the first states to reopen, raising concerns that a second round of restrictive government policies might prove necessary, once again stifling economic activity.
Despite all the market volatility, the broadly based S&P 500® Index finished the first half of 2020 only slightly below its starting point and the technology-heavy NASDAQ Composite Index posted gains, closing in near record territory. Small-cap stocks tended to trail their large cap counterparts, as illustrated by the Russell 2000® Index’s loss of approximately 15%, while value-oriented stocks lagged growth-oriented issues. From a global perspective, U.S. stocks generally outperformed international equities, with emerging markets hit particularly hard by the flight from risk.
Fixed-income markets also experienced unusually high levels of volatility. Recognized safe havens, such as U.S. government bonds, attracted increased investment, driving yields lower and prices higher, positioning long-term Treasury bonds to deliver particularly strong gains. Investment-grade corporate bonds lost value in March before recovering in the closing months of the reporting period, while relatively speculative high-yield credit faced the brunt of risk-off sentiment. Emerging market debt underperformed most other bonds types as investors sought to minimize currency and sovereign risks.
Today, as we at New York Life Investments continue to track the ongoing health crisis and its financial ramifications, we are particularly mindful of the people at the heart of our enterprise—our colleagues and valued clients. By taking appropriate steps to minimize community spread of COVID-19 within our organization, we strive to safeguard the health of our investment professionals so they can continue to provide you, as a MainStay investor, with world class investment solutions in this rapidly evolving environment.
Sincerely,

Kirk C. Lehneis
President
The opinions expressed are as of the date of this report and are subject to change. There is no guarantee that any forecast made will come to pass. This material does not constitute investment advice and is not intended as an endorsement of any specific investment. Past performance is no guarantee of future results.
Not part of the Semiannual Report
Table of Contents
An investment in the Portfolio is not insured or guaranteed by the Federal Deposit Insurance Corporation or any other government agency. Although the Portfolio seeks to preserve the value of your investment at $1.00 per share, it cannot guarantee it will do so. You could lose money by investing in the Portfolio. The Portfolio’s sponsor has no legal obligation to provide financial support to the Portfolio, and you should not expect that the sponsor will provide financial support to the Portfolio at any time.
Investors should refer to the Portfolio’s Summary Prospectus and/or Prospectus and consider the Portfolio’s investment objectives, strategies, risks, charges and expenses carefully before investing. The Summary Prospectus and/or Prospectus contain this and other information about the Portfolio. You may obtain copies of the Portfolio’s Summary Prospectus and/or the Prospectus and the Statement of Additional Information free of charge, upon request, by calling toll-free 800-598-2019, by writing to New York Life Insurance and Annuity Corporation, 51 Madison Avenue, Room 251, New York, New York 10010 or by sending an email to MainStayShareholdersServices@nylim.com. These documents are also available at nylinvestments.com/vpdocuments. Please read the Summary Prospectus and/or Prospectus carefully before investing. MainStay VP Funds Trust portfolios are separate account options which are purchased through a variable insurance or variable annuity contract.
Investment and Performance Comparison1 (Unaudited)
Performance data quoted represents past performance. Past performance is no guarantee of future results. Because of market volatility and other factors, current performance may be lower or higher than the figures shown. Investment return and principal value will fluctuate, and as a result, when shares are redeemed, they may be worth more or less than their original cost. The performance table and graph do not reflect any deduction for separate account or policy fees or charges imposed under the variable annuity policies and variable universal life insurance policies for which the Portfolio is an investment option. Please refer to the Performance Summary appropriate for your policy. For performance information current to the most recent month-end, please call 800-598-2019 or visit www.newyorklife.com.
An investment in the Portfolio is not insured or guaranteed by the Federal Deposit Insurance Corporation or any other government agency. Although the Portfolio seeks to preserve the value of your investment at $1.00 per share, it is possible to lose money by investing in the Portfolio.
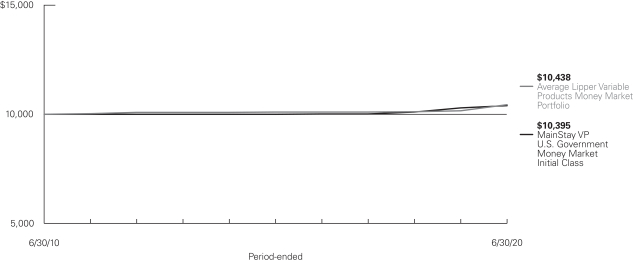
Average Annual Total Returns for the Period-Ended June 30, 2020
| | | | | | | | | | | | | | | | | | | | | | |
| Class | | Inception Date2 | | Six Months | | | One Year | | | Five Years | | | Ten Years | | | Gross Expense Ratio3 | |
| Initial Class Shares | | 1/29/1993 | | | 0.23 | % | | | 1.02 | % | | | 0.77 | % | | | 0.39 | % | | | 0.44 | % |
|
| 7-Day Current Yield = 0.01%; 7-Day Effective Yield = 0.01%.4 | |
| | | | | | | | | | | | | | | | |
| Benchmark Performance | | Six
Months | | | One
Year | | | Five
Years | | | Ten Years | |
| | | | |
Average Lipper Variable Products Money Market Portfolio5 | | | 0.33 | % | | | 1.17 | % | | | 0.85 | % | | | 0.43 | % |
Morningstar Prime Money Market Category Average6 | | | 0.37 | | | | 1.21 | | | | 0.94 | | | | 0.49 | |
| 1. | Performance figures may reflect certain fee waivers and/or expense limitations, without which total returns may have been lower. For information on current fee waivers and/or expense limitations (if any), please refer to the Notes to Financial Statements. |
| 2. | Effective August 26, 2016 and October 14, 2016, the Portfolio modified its principal investment strategies in connection with commencing operations as a “government money market fund.” Consequently the performance information may have been different if the current investment strategies had been in effect during the period prior to the Portfolio commencing operations as a “government money market fund.” |
| 3. | The gross expense ratios presented reflect the Portfolio’s “Total Annual Portfolio Operating Expenses” from the most recent Prospectus, as supplemented, and may differ from other expense ratios disclosed in this report. |
| 4. | As of June 30, 2020, MainStay VP U.S. Government Money Market Portfolio had an effective 7-day current yield = 0.01%; 7-day effective yield = 0.01%. The current yield is more reflective of the Portfolio’s earnings than the total return. |
| 5. | The Average Lipper Variable Products Money Market Portfolio is an equally weighted performance average adjusted for capital gains distributions and income dividends of all of the money market portfolios in the Lipper Universe. Lipper Inc., a wholly-owned subsidiary of Reuters Group PLC, is an independent monitor of mutual fund performance. Lipper averages are not class specific. Lipper returns are unaudited. Results are based on average total returns of similar portfolios with all dividend and capital gain distributions reinvested. |
| 6. | The Morningstar Prime Money Market Category Average is representative of funds that invest in short-term money market securities in order to provide a level of current income that is consistent with the preservation of capital. Results are based on average total returns of similar funds with all dividends and capital gain distributions reinvested. |
Cost in Dollars of a $1,000 Investment in MainStay VP U.S. Government Money Market Portfolio (Unaudited)
The example below is intended to describe the fees and expenses borne by shareholders during the six-month period from January 1, 2020, to June 30, 2020, and the impact of those costs on your investment.
Example
As a shareholder of the Portfolio you incur two types of costs: (1) transaction costs, including exchange fees and sales charges (loads) on purchases (as applicable), and (2) ongoing costs, including management fees, distribution and/or service (12b-1) fees, and other Portfolio expenses (as applicable). This example is intended to help you understand your ongoing costs (in dollars) of investing in the Portfolio and to compare these costs with the ongoing costs of investing in other mutual funds. The example is based on an investment of $1,000 made at the beginning of the six-month period and held for the entire period from January 1, 2020, to June 30, 2020. Shares are only sold in connection with variable life and annuity contracts and the example does not reflect any contract level or transactional fees or expenses. If these costs had been included, your costs would have been higher.
This example illustrates your Portfolio’s ongoing costs in two ways:
Actual Expenses
The second and third data columns in the table below provide information about actual account values and actual expenses. You may use the information in these columns, together with the amount you invested, to estimate the expenses that you paid during the six months
ended June 30, 2020. Simply divide your account value by $1,000 (for example, an $8,600 account value divided by $1,000 = 8.6), then multiply the result by the number under the heading entitled “Expenses Paid During Period” to estimate the expenses you paid on your account during this period.
Hypothetical Example for Comparison Purposes
The fourth and fifth data columns in the table below provide information about hypothetical account values and hypothetical expenses based on the Portfolio’s actual expense ratio and an assumed rate of return of 5% per year before expenses, which is not the Portfolio’s actual return. The hypothetical account values and expenses may not be used to estimate the actual ending account balances or expenses you paid for the six-month period shown. You may use this information to compare the ongoing costs of investing in the Portfolio with the ongoing costs of investing in other mutual funds. To do so, compare this 5% hypothetical example with the 5% hypothetical examples that appear in the shareholder reports of the other mutual funds.
Please note that the expenses shown in the table are meant to highlight your ongoing costs only and do not reflect any transactional costs, such as exchange fees or sales charges (loads). Therefore, the fourth and fifth data columns of the table are useful in comparing ongoing costs only and will not help you determine the relative total costs of owning different funds. In addition, if these transactional costs were included, your costs would have been higher.
| | | | | | | | | | | | | | | | | | | | | | |
| | | | | | | | | | | | | | | | | | |
| Share Class | | Beginning
Account
Value
1/1/20 | | | Ending Account
Value (Based
on Actual
Returns and
Expenses)
6/30/20 | | | Expenses
Paid
During
Period1 | | | Ending Account
Value (Based
on Hypothetical
5% Annualized
Return and
Actual Expenses)
6/30/20 | | | Expenses
Paid
During
Period1 | | | Net Expense
Ratio
During
Period2 |
| | | | | | |
| Initial Class Shares | | $ | 1,000.00 | | | $ | 1,002.30 | | | $ | 1.19 | | | $ | 1,023.67 | | | $ | 1.21 | | | 0.24% |
| 1 | Expenses are equal to the Portfolio’s annualized expense ratio of each class multiplied by the average account value over the period, divided by 366 and multiplied by 182 (to reflect the six-month period). The table above represents the actual expenses incurred during the six-month period. |
| 2 | Expenses are equal to the Portfolio’s annualized expense ratio to reflect the six-month period. |
| | |
| 6 | | MainStay VP U.S. Government Money Market Portfolio |
Portfolio Composition as of June 30, 2020 (Unaudited)
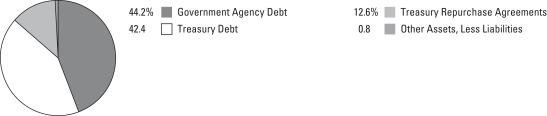
See Portfolio of Investments beginning on page 9 for specific holdings within these categories. The Portfolio’s holdings are subject to change.
Portfolio Management Discussion and Analysis (Unaudited)
Questions answered by NYL Investors LLC, the Portfolio’s Subadvisor.
How did MainStay VP U.S. Government Money Market Portfolio perform relative to its peers during the six months ended June 30, 2020?
For the six months ended June 30, 2020, Initial Class shares of MainStay VP U.S. Government Money Market Portfolio provided a 7-day current yield of 0.01% and a 7-day effective yield of 0.01%. For the six months ended June 30, 2020, Initial Class shares of MainStay VP U.S. Government Money Market Portfolio returned 0.23%. The Portfolio underperformed the 0.33% return of the Average Lipper Variable Products Money Market Portfolio and the 0.37% return of the Morningstar Prime Money Market Category Average for the six months ended June 30, 2020.1
During the reporting period, were there any liquidity events that materially impacted the Portfolio’s performance?
There were no liquidity events that impacted the Portfolio’s performance during the reporting period. The Portfolio saw significant cash inflows in response to the market upheaval prompted by the COVID-19 pandemic.
During the reporting period, were there any market events that materially impacted the Portfolio’s performance or liquidity?
During the reporting period, the Federal Reserve Board (“Fed”) lowered their interest-rate target 150 basis points over a relatively short period of time. (A basis point is one one-hundredth of a percentage point.) This action had a significant negative impact on the Portfolio’s performance.
What was the Portfolio’s duration2 strategy during the reporting period?
The Portfolio extended duration as the Fed was lowering interest rates. The Portfolio’s duration as of June 30, 2020 was 26 days, as compared with a duration of 15 days at the beginning of the reporting period.
What specific factors, risks or market forces prompted significant decisions for the Portfolio during the reporting period?
Oil price instability, the Fed’s rapid reduction of the interest-rate target to zero and the pandemic-related market upheaval all combined to prompt significant decisions for the Portfolio during the reporting period. All of these events occurred over a short period of time in March 2020, forcing a quick reassessment of the Portfolio’s liquidity position, followed by an attempt to remain competitive in a new market landscape.
During the reporting period, which market segments were the strongest contributors to the Portfolio’s performance and which market segments were particularly weak?
The strongest positive contributors to the Portfolio’s performance during the reporting period were 1-year floating-rate agencies and U.S. Treasury bills. (Contributions take weightings and total returns into account.) The weakest performing market segment during the reporting period was agency discount notes (“ADNs”).
Did the Portfolio make any significant purchases or sales during the reporting period?
The Portfolio shifted its holdings to favor U.S. Treasury bills over ADNs in response to the high volume of Treasury issuance to fund the pandemic-related stimulus, which helped keep Treasury bill yields elevated. At the same time, investors were willing to forego some yield in exchange for more flexible maturity dates. As a result, agency yields fell below Treasury bill yields.
How did the Portfolio’s sector weightings change during the reporting period?
The most significant shift in sector weightings came from an allocation out of pricier agencies and into U.S. Treasury bills, described above. Also worth mentioning was a decrease in repurchase agreement (“repo”) holdings in relative terms. However, this relative decrease was due to the Portfolio’s fixed-par allocation to repo at a time of increasing assets under management.
| 1. | See page 5 for more information on peer group returns. |
| 2. | Duration is a measure of the price sensitivity of a fixed-income investment to changes in interest rates. Duration is expressed as a number of years and is considered a more accurate sensitivity gauge than average maturity. |
The opinions expressed are those of the Subadvisor as of the date of this report and are subject to change. There is no guarantee that any forecasts will come to pass. This material does not constitute investment advice and is not intended as an endorsement of any specific investment.
Not all MainStay VP Portfolios and/or share classes are available under all policies.
| | |
| 8 | | MainStay VP U.S. Government Money Market Portfolio |
Portfolio of Investments June 30, 2020 (Unaudited)
| | | | | | | | |
| | | Principal
Amount | | | Amortized Cost | |
| Short-Term Investments 99.2%† | |
Government Agency Debt 44.2% | |
Federal Agricultural Mortgage Corp.
0.141%, due 9/30/20 (a) | | $ | 7,000,000 | | | $ | 6,992,922 | |
0.17% (SOFR + 0.09%), due 2/10/21 (b) | | | 25,000,000 | | | | 25,000,000 | |
Federal Farm Credit Banks
0.193% (1 Month LIBOR + 0.01%), due 7/2/20 (b) | | | 10,000,000 | | | | 10,000,000 | |
Federal Home Loan Banks
0.141%, due 9/8/20 (a) | | | 13,500,000 | | | | 13,494,049 | |
0.141%, due 9/11/20 (a) | | | 900,000 | | | | 899,640 | |
0.21% (SOFR + 0.13%),
due 10/16/20 (b) | | | 20,000,000 | | | | 20,000,000 | |
0.31% (SOFR + 0.23%),
due 4/13/21 (b) | | | 43,000,000 | | | | 43,000,000 | |
Federal Home Loan Mortgage Corp.
0.11% (SOFR + 0.03%),
due 2/24/21 (b) | | | 30,000,000 | | | | 30,000,000 | |
0.152%, due 8/6/20 (a) | | | 65,000,000 | | | | 64,986,450 | |
0.152%, due 8/24/20 (a) | | | 25,000,000 | | | | 24,994,937 | |
Federal National Mortgage Association (a)
0.121%, due 7/29/20 | | | 21,750,000 | | | | 21,748,477 | |
0.152%, due 8/14/20 | | | 15,000,000 | | | | 14,995,967 | |
0.152%, due 8/26/20 | | | 30,000,000 | | | | 29,993,700 | |
| | | | | | | | |
Total Government Agency Debt
(Cost $306,106,142) | | | | | | | 306,106,142 | |
| | | | | | | | |
|
Treasury Debt 42.4% (a) | |
United States Cash Management Bill
0.131%, due 9/8/20 | | | 3,000,000 | | | | 2,999,166 | |
United States Treasury Bills
0.12%, due 7/7/20 | | | 63,000,000 | | | | 62,998,950 | |
0.121%, due 8/6/20 | | | 216,000,000 | | | | 215,986,440 | |
0.134%, due 7/28/20 | | | 4,724,000 | | | | 4,723,632 | |
0.139%, due 8/18/20 | | | 7,366,000 | | | | 7,364,723 | |
| | | | | | | | |
Total Treasury Debt
(Cost $294,072,911) | | | | 294,072,911 | |
| | | | | | | | |
|
Treasury Repurchase Agreements 12.6% | |
Bank of America N.A.
0.07%, dated 6/30/20
due 7/1/20
Proceeds at Maturity $25,000,049 (Collateralized by a United States Treasury Note with a rate of 6.25% and maturity date of 5/15/30, with a Principal Amount of $16,453,000 and a Market Value of $25,500,085) | | | 25,000,000 | | | | 25,000,000 | |
| | | | | | | | |
| | | Principal
Amount | | | Amortized Cost | |
Treasury Repurchase Agreements (continued) | |
RBC Capital Markets
0.07%, dated 6/30/20
due 7/1/20
Proceeds at Maturity $37,551,073 (Collateralized by United States Treasury Notes with rates between 0.50% and 2.875% maturity dates between 7/31/25 and 4/30/27, with a Principal Amount of $34,221,400 and a Market Value of $38,302,100) | | $ | 37,551,000 | | | $ | 37,551,000 | |
Toronto Dominion Bank
0.07%, dated 6/30/20
due 7/1/20
Proceeds at Maturity $25,000,049 (Collateralized by United States Treasury Notes with rates between 0.25% and 2.875% maturity dates between 8/15/22 and 5/31/25, with a Principal Amount of $24,070,700 and a Market Value of $25,500,095) | | | 25,000,000 | | | | 25,000,000 | |
| | | | | | | | |
Total Treasury Repurchase Agreements
(Cost $87,551,000) | | | | 87,551,000 | |
| | | | | | | | |
Total Short-Term Investments
(Cost $687,730,053) | | | | 687,730,053 | |
| | | | | | | | |
Total Investments
(Cost $687,730,053) | | | 99.2 | % | | | 687,730,053 | |
Other Assets, Less Liabilities | | | 0.8 | | | | 5,684,642 | |
Net Assets | | | 100.0 | % | | $ | 693,414,695 | |
| † | Percentages indicated are based on Portfolio net assets. |
| (a) | Interest rate shown represents yield to maturity. |
| (b) | Floating rate—Rate shown was the rate in effect as of June 30, 2020. |
The following abbreviations are used in the preceding pages:
LIBOR—London Interbank Offered Rate
SOFR—Secured Overnight Financing Rate
| | | | | | |
The notes to the financial statements are an integral part of,
and should be read in conjunction with, the financial statements. | | | | | 9 | |
Portfolio of Investments June 30, 2020 (Unaudited) (continued)
The following is a summary of the fair valuations according to the inputs used as of June 30, 2020, for valuing the Portfolio’s assets:
| | | | | | | | | | | | | | | | |
Description | | Quoted
Prices in
Active
Markets for
Identical
Assets (Level 1) | | | Significant
Other
Observable
Inputs
(Level 2) | | | Significant
Unobservable
Inputs (Level 3) | | | Total | |
| | | | |
Asset Valuation Inputs | | | | | | | | | | | | | | | | |
| Investments in Securities (a) | | | | | | | | | | | | | | | | |
| Short-Term Investments | | | | | | | | | | | | | | | | |
Government Agency Debt | | $ | — | | | $ | 306,106,142 | | | $ | — | | | $ | 306,106,142 | |
Treasury Debt | | | — | | | | 294,072,911 | | | | — | | | | 294,072,911 | |
Treasury Repurchase Agreements | | | — | | | | 87,551,000 | | | | — | | | | 87,551,000 | |
| | | | | | | | | | | | | | | | |
| Total Investments in Securities | | $ | — | | | $ | 687,730,053 | | | $ | — | | | $ | 687,730,053 | |
| | | | | | | | | | | | | | | | |
| (a) | For a complete listing of investments and their industries, see the Portfolio of Investments. |
| | | | |
| 10 | | MainStay VP U.S. Government Money Market Portfolio | | The notes to the financial statements are an integral part of,
and should be read in conjunction with, the financial statements. |
Statement of Assets and Liabilities as of June 30, 2020 (Unaudited)
| | | | |
| Assets | | | | |
Investment in securities, at value
(amortized cost $600,179,053) | | $ | 600,179,053 | |
Repurchase agreements, at value
(amortized cost $87,551,000) | | | 87,551,000 | |
Cash | | | 192 | |
Receivables: | | | | |
Portfolio shares sold | | | 6,382,365 | |
Interest | | | 44,713 | |
Other assets | | | 4,331 | |
| | | | |
Total assets | | | 694,161,654 | |
| | | | |
| |
| Liabilities | | | | |
Payables: | | | | |
Portfolio shares redeemed | | | 660,415 | |
Manager (See Note 3) | | | 49,540 | |
Professional fees | | | 21,004 | |
Custodian | | | 10,200 | |
Shareholder communication | | | 4,937 | |
Trustees | | | 515 | |
Accrued expenses | | | 348 | |
| | | | |
Total liabilities | | | 746,959 | |
| | | | |
Net assets | | $ | 693,414,695 | |
| | | | |
| |
| Composition of Net Assets | | | | |
Shares of beneficial interest outstanding (par value of $.001 per share) unlimited number of shares authorized | | $ | 693,346 | |
Additional paid-in capital | | | 692,710,185 | |
| | | | |
| | | 693,403,531 | |
Total distributable earnings (loss) | | | 11,164 | |
| | | | |
Net assets applicable to outstanding shares | | $ | 693,414,695 | |
| | | | |
Shares of beneficial interest outstanding | | | 693,346,382 | |
| | | | |
Net asset value per share outstanding | | $ | 1.00 | |
| | | | |
| | | | | | |
The notes to the financial statements are an integral part of,
and should be read in conjunction with, the financial statements. | | | | | 11 | |
Statement of Operations for the six months ended June 30, 2020 (Unaudited)
| | | | |
| Investment Income (Loss) | | | | |
Income | | | | |
Interest | | $ | 1,679,893 | |
| | | | |
Expenses | | | | |
Manager (See Note 3) | | | 1,135,487 | |
Professional fees | | | 42,186 | |
Custodian | | | 20,070 | |
Shareholder communication | | | 18,304 | |
Trustees | | | 5,071 | |
Miscellaneous | | | 6,736 | |
| | | | |
Total expenses before waiver/reimbursement | | | 1,227,854 | |
Expense waiver/reimbursement from Manager (See Note 3) | | | (522,189 | ) |
| | | | |
Net expenses | | | 705,665 | |
| | | | |
Net investment income (loss) | | | 974,228 | |
| | | | |
| |
| Realized Gain (Loss) on Investments | | | | |
Net realized gain (loss) on investments | | | 6,744 | |
| | | | |
Net increase (decrease) in net assets resulting from operations | | $ | 980,972 | |
| | | | |
| | | | |
| 12 | | MainStay VP U.S. Government Money Market Portfolio | | The notes to the financial statements are an integral part of,
and should be read in conjunction with, the financial statements. |
Statements of Changes in Net Assets
for the six months ended June 30, 2020 (Unaudited) and the year ended December 31, 2019
| | | | | | | | |
| | | 2020 | | | 2019 | |
| Increase (Decrease) in Net Assets | |
Operations: | | | | | | | | |
Net investment income (loss) | | $ | 974,228 | | | $ | 7,726,350 | |
Net realized gain (loss) on investments | | | 6,744 | | | | 4,362 | |
| | | | |
Net increase (decrease) in net assets resulting from operations | | | 980,972 | | | | 7,730,712 | |
| | | | |
Distributions to shareholders | | | (974,231 | ) | | | (7,726,350 | ) |
| | | | |
Capital share transactions: | | | | | | | | |
Net proceeds from sale of shares | | | 561,572,773 | | | | 259,579,026 | |
Net asset value of shares issued to shareholders in reinvestment of distributions | | | 974,231 | | | | 7,725,806 | |
Cost of shares redeemed | | | (265,393,149 | ) | | | (383,545,027 | ) |
| | | | |
Increase (decrease) in net assets derived from capital share transactions | | | 297,153,855 | | | | (116,240,195 | ) |
| | | | |
Net increase (decrease) in net assets | | | 297,160,596 | | | | (116,235,833 | ) |
| | |
| Net Assets | | | | | | | | |
Beginning of period | | | 396,254,099 | | | | 512,489,932 | |
| | | | |
End of period | | $ | 693,414,695 | | | $ | 396,254,099 | |
| | | | |
| | | | | | |
The notes to the financial statements are an integral part of,
and should be read in conjunction with, the financial statements. | | | | | 13 | |
Financial Highlights selected per share data and ratios
| | | | | | | | | | | | | | | | | | | | | | | | |
| | |
| | | Six months
ended
June 30, | | | Year ended December 31, | |
| | | | | | |
| | | 2020* | | | 2019 | | | 2018 | | | 2017 | | | 2016 | | | 2015 | |
| | | | | | |
Net asset value at beginning of period | | $ | 1.00 | | | $ | 1.00 | | | $ | 1.00 | | | $ | 1.00 | | | $ | 1.00 | | | $ | 1.00 | |
| | | | | | | | | | | | | | | | | | | | | | | | |
| | | | | | |
Net investment income (loss) | | | 0.00 | ‡ | | | 0.02 | | | | 0.01 | | | | 0.00 | ‡ | | | 0.00 | ‡ | | | 0.00 | ‡ |
| | | | | | |
Net realized gain (loss) on investments | | | 0.00 | ‡ | | | 0.00 | ‡ | | | 0.00 | ‡ | | | 0.00 | ‡ | | | (0.00 | )‡ | | | 0.00 | ‡ |
| | | | | | | | | | | | | | | | | | | | | | | | |
| | | | | | |
Total from investment operations | | | 0.00 | ‡ | | | 0.02 | | | | 0.01 | | | | 0.00 | ‡ | | | 0.00 | ‡ | | | 0.00 | ‡ |
| | | | | | | | | | | | | | | | | | | | | | | | |
|
| Less distributions: | |
| | | | | | |
From net investment income | | | 0.00 | ‡ | | | (0.02 | ) | | | (0.01 | ) | | | (0.00 | )‡ | | | (0.00 | )‡ | | | (0.00 | )‡ |
| | | | | | | | | | | | | | | | | | | | | | | | |
| | | | | | |
Net asset value at end of period | | $ | 1.00 | | | $ | 1.00 | | | $ | 1.00 | | | $ | 1.00 | | | $ | 1.00 | | | $ | 1.00 | |
| | | | | | | | | | | | | | | | | | | | | | | | |
| | | | | | |
Total investment return (a) | | | 0.23 | % | | | 1.78 | % | | | 1.38 | % | | | 0.42 | % | | | 0.02 | % | | | 0.01 | % |
|
| Ratios (to average net assets)/Supplemental Data: | |
| | | | | | |
Net investment income (loss) | | | 0.33 | %†† | | | 1.78 | % | | | 1.37 | % | | | 0.41 | % | | | 0.02 | %(b) | | | 0.01 | % |
| | | | | | |
Net expenses | | | 0.24 | %†† | | | 0.44 | % | | | 0.44 | % | | | 0.44 | % | | | 0.39 | %(c) | | | 0.15 | % |
| | | | | | |
Expenses (before waiver/reimbursement) | | | 0.42 | %†† | | | 0.44 | % | | | 0.44 | % | | | 0.44 | % | | | 0.49 | % | | | 0.48 | % |
| | | | | | |
Net assets at end of period (in 000’s) | | $ | 693,415 | | | $ | 396,254 | | | $ | 512,490 | | | $ | 496,871 | | | $ | 657,487 | | | $ | 620,286 | |
| ‡ | Less than one cent per share. |
| (a) | Total return does not reflect any deduction of sales charges, mortality and expense charges, contract charges or administrative charges. For periods of less than one year, total return is not annualized. |
| (b) | Without the custody fee reimbursement, net investment income (loss) would have been 0.01%. |
| (c) | Without the custody fee reimbursement, net expenses would have been 0.40%. |
| | | | |
| 14 | | MainStay VP U.S. Government Money Market Portfolio | | The notes to the financial statements are an integral part of,
and should be read in conjunction with, the financial statements. |
Notes to Financial Statements (Unaudited)
Note 1–Organization and Business
MainStay VP Funds Trust (the “Fund”) was organized as a Delaware statutory trust on February 1, 2011. The Fund is registered under the Investment Company Act of 1940, as amended (the “1940 Act”), as an open-end management investment company. The Fund is comprised of thirty-one separate series (collectively referred to as the “Portfolios”). These financial statements and notes relate to the MainStay VP U.S. Government Money Market Portfolio (the “Portfolio”), a “diversified” portfolio, as that term is defined in the 1940 Act, as interpreted or modified by regulatory authorities having jurisdiction, from time to time.
Shares of the Portfolio are currently offered to certain separate accounts to fund variable annuity policies and variable universal life insurance policies issued by New York Life Insurance and Annuity Corporation (“NYLIAC”), a wholly-owned subsidiary of New York Life Insurance Company (“New York Life”) and may also be offered to fund variable annuity policies and variable universal life insurance policies issued by other insurance companies. NYLIAC allocates shares of the Portfolios to, among others, certain NYLIAC separate accounts. Shares of the Portfolio are also offered to the MainStay VP Conservative Allocation Portfolio, MainStay VP Moderate Allocation Portfolio, MainStay VP Moderate Growth Allocation Portfolio and MainStay VP Growth Allocation Portfolio, which operate as “funds-of-funds,” and other variable insurance funds.
The Portfolio currently offers one class of shares. Initial Class shares commenced operations on January 29, 1993. Shares of the Portfolio are offered and are redeemed at a price equal to their net asset value (“NAV”) per share. No sales or redemption charge is applicable to the purchase or redemption of the Portfolio’s shares.
The Portfolio’s investment objective is to seek a high level of current income while preserving capital and maintaining liquidity.
Note 2–Significant Accounting Policies
The Portfolio is an investment company and accordingly follows the investment company accounting and reporting guidance of the Financial Accounting Standards Board (“FASB”) Accounting Standard Codification Topic 946 Financial Services—Investment Companies. The Portfolio prepares its financial statements in accordance with generally accepted accounting principles (“GAAP”) in the United States of America and follows the significant accounting policies described below.
(A) Valuation of Shares. The Portfolio seeks to maintain a NAV of $1.00 per share, although there is no assurance that it will be able to do so. An investment in the Portfolio, is not insured or guaranteed by the Federal Deposit Insurance Corporation or any other government agency. The Portfolio’s sponsor has no legal obligation to provide financial support to the Portfolio, and you should not expect that the sponsor will provide financial support to the Portfolio at any time.
(B) Securities Valuation. Investments are usually valued as of the close of regular trading on the New York Stock Exchange (the “Exchange”) (generally 4:00 p.m. Eastern time) on each day the Portfolio is open for business (“valuation date”). Securities are valued using the amortized cost method of valuation, unless the use of such method would be inappropriate per the requirements of Rule 2a-7 under the 1940 Act. The amortized cost method involves valuing a security at its cost on the date of purchase and thereafter assuming a constant
amortization to maturity of the difference between such cost and the value on maturity date. Amortized cost approximates the current fair value of a security. Securities valued using the amortized cost method are not valued using quoted prices in an active market and are generally categorized as Level 2 in the hierarchy.
The Board of Trustees of the Fund (the “Board”) adopted procedures establishing methodologies for the valuation of the Portfolio’s securities and other assets and delegated the responsibility for valuation determinations under those procedures to the Valuation Committee of the Fund (the “Valuation Committee”). The procedures state that, subject to the oversight of the Board and unless otherwise noted, the responsibility for the day-to-day valuation of portfolio assets (including fair value measurements for the Portfolio’s assets and liabilities) rests with New York Life Investment Management LLC (“New York Life Investments” or the “Manager”), aided to whatever extent necessary by the Subadvisor (as defined in Note 3(A)). To assess the appropriateness of security valuations, the Manager, the Subadvisor or the Portfolio’s third-party service provider, who is subject to oversight by the Manager, regularly compares prior day prices, prices on comparable securities and the sale prices to the prior and current day prices and challenges prices with changes exceeding certain tolerance levels with third-party pricing services or broker sources.
The Board authorized the Valuation Committee to appoint a Valuation Subcommittee (the “Subcommittee”) to establish the prices of securities for which market quotations are not readily available or the prices of which are not otherwise readily determinable under the procedures. The Subcommittee meets (in person, via electronic mail or via teleconference) on an as-needed basis. The Valuation Committee meets to ensure that actions taken by the Subcommittee were appropriate.
For those securities valued through either a standardized fair valuation methodology or a fair valuation measurement, the Subcommittee deals with such valuation and the Valuation Committee reviews and affirms, if appropriate, the reasonableness of the valuation based on such methodologies and measurements on a regular basis after considering information that is reasonably available and deemed relevant by the Valuation Committee. Any action taken by the Subcommittee with respect to the valuation of a portfolio security or other asset is submitted for review and ratification (if appropriate) to the Valuation Committee and the Board at the next regularly scheduled meeting.
“Fair value” is defined as the price the Portfolio would reasonably expect to receive upon selling an asset or liability in an orderly transaction to an independent buyer in the principal or most advantageous market for the asset or liability. Fair value measurements are determined within a framework that establishes a three-tier hierarchy that maximizes the use of observable market data and minimizes the use of unobservable inputs to establish a classification of fair value measurements for disclosure purposes. “Inputs” refer broadly to the assumptions that market participants would use in pricing the asset or liability, including assumptions about risk, such as the risk inherent in a particular valuation technique used to measure fair value using a pricing model and/or the risk inherent in the inputs for the valuation technique. Inputs may be observable or unobservable. Observable inputs reflect the assumptions market participants would use in pricing the asset or liability based on market data obtained from sources independent of the Portfolio. Unobservable inputs reflect the Portfolio’s own assumptions about the
Notes to Financial Statements (Unaudited) (continued)
assumptions market participants would use in pricing the asset or liability based on the information available. The inputs or methodology used for valuing assets or liabilities may not be an indication of the risks associated with investing in those assets or liabilities. The three-tier hierarchy of inputs is summarized below.
| • | | Level 1—quoted prices in active markets for an identical asset or liability |
| • | | Level 2—other significant observable inputs (including quoted prices for a similar asset or liability in active markets, interest rates and yield curves, prepayment speeds, credit risk, etc.) |
| • | | Level 3—significant unobservable inputs (including the Portfolio’s own assumptions about the assumptions that market participants would use in measuring fair value of an asset or liability) |
Securities valued at amortized cost are not obtained from a quoted price in an active market and are generally categorized as Level 2 in the hierarchy. The level of an asset or liability within the fair value hierarchy is based on the lowest level of an input, both individually and in the aggregate, that is significant to the fair value measurement. As of June 30, 2020, the aggregate value by input level of the Portfolio’s assets and liabilities is included at the end of the Portfolio of Investments.
The Portfolio may use third-party vendor evaluations, whose prices may be derived from one or more of the following standard inputs, among others:
| | |
• Benchmark yields | | • Reported trades |
• Broker/dealer quotes | | • Issuer spreads |
• Two-sided markets | | • Benchmark securities |
• Bids/offers | | • Reference data (corporate actions or material event notices) |
• Industry and economic events | | • Comparable bonds |
• Monthly payment information | | |
An asset or liability for which market values cannot be measured using the methodologies described above is valued by methods deemed reasonable in good faith by the Valuation Committee, following the procedures established by the Board, to represent fair value. Under these procedures, the Portfolio may utilize some of the following fair value techniques: multi-dimensional relational pricing models and option adjusted spread pricing. During the six-month period ended June 30, 2020, there were no material changes to the fair value methodologies.
The information above is not intended to reflect an exhaustive list of the methodologies that may be used to value portfolio investments. The valuation procedures permit the use of a variety of valuation methodologies in connection with valuing portfolio investments. The methodology used for a specific type of investment may vary based on the market data available or other considerations. The methodologies summarized above may not represent the specific means by which portfolio investments are valued on any particular business day.
(C) Income Taxes. The Portfolio’s policy is to comply with the requirements of the Internal Revenue Code of 1986, as amended (the “Internal Revenue Code”), applicable to regulated investment companies and to distribute all of its taxable income to the shareholders of the Portfolio within the allowable time limits.
The Manager evaluates the Portfolio’s tax positions to determine if the tax positions taken meet the minimum recognition threshold in connection with accounting for uncertainties in income tax positions taken or expected to be taken for the purposes of measuring and recognizing tax liabilities in the financial statements. Recognition of tax benefits of an uncertain tax position is permitted only to the extent the position is “more likely than not” to be sustained assuming examination by taxing authorities. The Manager analyzed the Portfolio’s tax positions taken on federal, state and local income tax returns for all open tax years (for up to three tax years) and has concluded that no provisions for federal, state and local income tax are required in the Portfolio’s financial statements. The Portfolio’s federal, state and local income tax and federal excise tax returns for tax years for which the applicable statutes of limitations have not expired are subject to examination by the Internal Revenue Service and state and local departments of revenue.
(D) Dividends and Distributions to Shareholders. Dividends and distributions are recorded on the ex-dividend date. The Portfolio intends to declare dividends from net investment income, if any, daily and intends to pay them at least monthly and declares and pays distributions from net realized capital and currency gains, if any, at least annually. Unless a shareholder elects otherwise, all dividends and distributions are reinvested at NAV in the same class of shares of the Portfolio. Dividends and distributions to shareholders are determined in accordance with federal income tax regulations and may differ from determinations using GAAP.
(E) Security Transactions and Investment Income. The Portfolio records security transactions on the trade date. Realized gains and losses on security transactions are determined using the identified cost method. Dividend income is recognized on the ex-dividend date, net of any foreign tax withheld at the source, and interest income is accrued as earned using the effective interest rate method. Distributions received from real estate investment trusts may be classified as dividends, capital gains and/or return of capital.
(F) Expenses. Expenses of the Fund are allocated to the individual Portfolios in proportion to the net assets of the respective Portfolios when the expenses are incurred, except where direct allocations of expenses can be made. The expenses borne by the Portfolio, including those of related parties to the Portfolio, are shown in the Statement of Operations.
Additionally, the Portfolio may invest in mutual funds, which are subject to management fees and other fees that may cause the costs of investing in mutual funds to be greater than the costs of owning the underlying securities directly. These indirect expenses of mutual funds are not included in the amounts shown as expenses in the Portfolio’s Statement of Operations or in the expense ratios included in the Financial Highlights.
(G) Use of Estimates. In preparing financial statements in conformity with GAAP, the Manager makes estimates and assumptions that affect the reported amounts and disclosures in the financial statements. Actual results could differ from those estimates.
(H) Repurchase Agreements. The Portfolio may enter into repurchase agreements (i.e., buy a security from another party with the agreement that it will be sold back in the future) to earn income. The Portfolio may enter into repurchase agreements only with counterparties, usually financial institutions, that are deemed by the Manager or the
| | |
| 16 | | MainStay VP U.S. Government Money Market Portfolio |
Subadvisor to be creditworthy, pursuant to guidelines established by the Board. During the term of any repurchase agreement, the Manager or the Subadvisor will continue to monitor the creditworthiness of the counterparty. Under the 1940 Act, repurchase agreements are considered to be collateralized loans by the Portfolio to the counterparty secured by the securities transferred to the Portfolio.
Repurchase agreements are subject to counterparty risk, meaning the Portfolio could lose money by the counterparty’s failure to perform under the terms of the agreement. The Portfolio mitigates this risk by ensuring the repurchase agreement is collateralized by cash, U.S. government securities, fixed income securities and/or other securities. The collateral is held by the Portfolio’s custodian and valued daily on a mark to market basis to determine if the value, including accrued interest, exceeds the repurchase price. In the event of the counterparty’s default on the obligation to repurchase, the Portfolio has the right to liquidate the collateral and apply the proceeds in satisfaction of the obligation. Under certain circumstances, such as in the event of default or bankruptcy by the counterparty, realization and/or retention of the collateral may be limited or subject to delay, to legal proceedings and possible realized loss to the Portfolio. Repurchase agreements as of June 30, 2020, are shown in the Portfolio of Investments.
(I) Debt Securities Risk. The ability of issuers of debt securities held by the Portfolio to meet their obligations may be affected by economic or political developments in a specific country, industry or region. Debt securities are also subject to the risks associated with changes in interest rates.
Investments in the Portfolio are not guaranteed, even though some of the Portfolio’s underlying investments are guaranteed by the U.S. government or its agencies or instrumentalities. The principal risk of mortgage-related and asset-backed securities is that the underlying debt may be prepaid ahead of schedule, if interest rates fall, thereby reducing the value of the Portfolio’s investment. If interest rates rise, less of the debt may be prepaid and the Portfolio may lose money because the Portfolio may be unable to invest in higher yielding assets. The Portfolio is subject to interest-rate risk and can lose principal value when interest rates rise. Bonds are also subject to credit risk, in which the bond issuer may fail to pay interest and principal in a timely manner.
(J) LIBOR Replacement Risk. The Portfolio may invest in certain debt securities, derivatives or other financial instruments that utilize the London Interbank Offered Rate (“LIBOR”), as a “benchmark” or “reference rate” for various interest rate calculations. The United Kingdom Financial Conduct Authority, which regulates LIBOR, announced that after 2021 it will cease its active encouragement of banks to provide the quotations needed to sustain LIBOR. As a result, it is anticipated that LIBOR will be discontinued or will no longer be sufficiently robust to be representative of its underlying market around that time. Although financial regulators and industry working groups have suggested alternative reference rates, such as the European Interbank Offer Rate (“EURIBOR”), Sterling Overnight Interbank Average Rate (“SONIA”) and Secured Overnight Financing Rate (“SOFR”), there are challenges to converting certain contracts and transactions to a new benchmark and neither the full effects of the transition process nor its ultimate outcome is known.
The elimination of LIBOR or changes to other reference rates or any other changes or reforms to the determination or supervision of reference rates could have an adverse impact on the market for, or value of,
any securities or payments linked to those reference rates, which may adversely affect the Portfolio’s performance and/or net asset value. Uncertainty and risk also remain regarding the willingness and ability of issuers and lenders to include revised provisions in new and existing contracts or instruments. Consequently, the transition away from LIBOR to other reference rates may lead to increased volatility and illiquidity in markets that are tied to LIBOR, fluctuations in values of LIBOR-related investments or investments in issuers that utilize LIBOR, increased difficulty in borrowing or refinancing and diminished effectiveness of hedging strategies, adversely affecting the Portfolio’s performance. Furthermore, the risks associated with the expected discontinuation of LIBOR and transition may be exacerbated if the work necessary to effect an orderly transition to an alternative reference rate is not completed in a timely manner. Because the usefulness of LIBOR as a benchmark could deteriorate during the transition period, these effects could occur prior to the end of 2021.
(K) Indemnifications. Under the Fund’s organizational documents, its officers and trustees are indemnified against certain liabilities that may arise out of performance of their duties to the Fund. Additionally, in the normal course of business, the Portfolio enters into contracts with third-party service providers that contain a variety of representations and warranties and that may provide general indemnifications. The Portfolio’s maximum exposure under these arrangements is unknown, as this would involve future claims that may be made against the Portfolio that have not yet occurred. The Manager believes that the risk of loss in connection with these potential indemnification obligations is remote. However, there can be no assurance that material liabilities related to such obligations will not arise in the future, which could adversely impact the Portfolio.
Note 3–Fees and Related Party Transactions
(A) Manager and Subadvisor. New York Life Investments, a registered investment adviser and an indirect, wholly-owned subsidiary of New York Life, serves as the Portfolio’s Manager, pursuant to an Amended and Restated Management Agreement (“Management Agreement”). The Manager provides offices, conducts clerical, recordkeeping and bookkeeping services and keeps most of the financial and accounting records required to be maintained by the Portfolio. Except for the portion of salaries and expenses that are the responsibility of the Portfolio, the Manager pays the salaries and expenses of all personnel affiliated with the Portfolio and certain operational expenses of the Portfolio. The Portfolio reimburses New York Life Investments in an amount equal to the portion of the compensation of the Chief Compliance Officer attributable to the Portfolio. NYL Investors LLC (“NYL Investors” or the ‘‘Subadvisor’’), a registered investment adviser and a direct, wholly-owned subsidiary of New York Life, serves as Subadvisor to the Portfolio and is responsible for the day-to-day portfolio management of the Portfolio. Pursuant to the terms of a Subadvisory Agreement (“Subadvisory Agreement”) between New York Life Investments and NYL Investors, New York Life Investments pays for the services of the Subadvisor.
The Fund, on behalf of the Portfolio, pays New York Life Investments in its capacity as the Portfolio’s investment manager and administrator, pursuant to the Management Agreement, a monthly fee for the services performed and the facilities furnished at an annual percentage of the average daily net assets. The Fund, on behalf of the Portfolio, pays New York Life Investments at the rate of 0.40% up to $500 million; 0.35% from $500 million to $1 billion; and 0.30% in excess of $1 billion.
Notes to Financial Statements (Unaudited) (continued)
Effective May 1, 2020, New York Life Investments has contractually agreed to waive fees and/or reimburse expenses so that total annual operating expenses (excluding taxes, interest, litigation, extraordinary expenses, brokerage and other transaction expenses relating to the purchase or sale of portfolio investments and acquired (underlying) fund fees and expenses) of Initial Class shares do not exceed 0.28% of average daily net assets. This agreement will remain in effect until May 1, 2021 and shall renew automatically for one-year terms unless New York Life Investments provides written notice of termination prior to the start of the next term or upon approval of the Board. During the six-month period ended June 30, 2020, the effective management fee rate was 0.39%.
New York Life Investments may voluntarily waive fees or reimburse expenses of the Portfolio’s to the extent it deems appropriate to enhance the Portfolio’s yield during periods when expenses may have a significant impact on yield because of low interest rates. This expense limitation policy is voluntary and may be revised or terminated by the Manager at any time.
During the six-month period ended June 30, 2020, New York Life Investments earned fees from the Portfolio in the amount of $1,135,487 and paid the Subadvisor in the amount of $489,138.
State Street Bank and Trust Company (“State Street”) provides sub-administration and sub-accounting services to the Portfolio pursuant to an agreement with New York Life Investments. These services include calculating the daily NAV of the Portfolio, maintaining the general ledger and sub-ledger accounts for the calculation of the Portfolio’s NAV and assisting New York Life Investments in conducting various aspects of the Portfolio’s administrative operations. For providing these services to the Portfolio, State Street is compensated by New York Life Investments.
Pursuant to an agreement between the Fund and New York Life Investments, New York Life Investments is responsible for providing or procuring certain regulatory reporting services for the Portfolio. The Portfolio will reimburse New York Life Investments for the actual costs incurred by New York Life Investments in connection with providing or procuring these services for the Portfolio.
Note 4–Federal Income Tax
The amortized cost also represents the aggregate cost for federal income tax purposes.
The Portfolio utilized $337 of capital loss carryforwards during the year ended December 31, 2019.
During the year ended December 31, 2019, the tax character of distributions paid as reflected in the Statements of Changes in Net Assets was as follows:
| | |
|
| 2019 |
Tax-Based
Distributions
from Ordinary
Income | | Tax-Based
Distributions
from Long-Term
Gains |
| |
| $7,726,350 | | $— |
Note 5–Custodian
State Street is the custodian of cash and securities held by the Portfolio. Custodial fees are charged to the Portfolio based on the Portfolio’s net assets and/or the market value of securities held by the Portfolio and the number of certain transactions incurred by the Portfolio.
Note 6–Capital Share Transactions
Transactions in capital shares for the six-month period ended June 30, 2020 and the year ended December 31, 2019, were as follows:
| | | | |
Initial Class (at $1 per share) | | Shares | |
| |
Six-month period ended June 30, 2020: | | | | |
Shares sold | | | 561,521,040 | |
Shares issued to shareholders in reinvestment of distributions | | | 974,143 | |
Shares redeemed | | | (265,367,781 | ) |
| | | | |
Net increase (decrease) | | | 297,127,402 | |
| | | | |
Year ended December 31, 2019: | | | | |
Shares sold | | | 259,556,928 | |
Shares issued to shareholders in reinvestment of distributions | | | 7,725,188 | |
Shares redeemed | | | (383,512,974 | ) |
| | | | |
Net increase (decrease) | | | (116,230,858 | ) |
| | | | |
Note 7–Results of Shareholder Meeting
In March 2020, the Financial Accounting Standards Board (“FASB”) issued Accounting Standards Update 2020-04 (“ASU 2020-04”), which provides optional guidance to ease the potential accounting burden associated with transitioning away from LIBOR and other reference rates that are expected to be discontinued. ASU 2020-04 is effective immediately upon release of the update on March 12, 2020 through December 31, 2022. At this time, the Manager is evaluating the implications of certain other provisions of ASU 2020-04 related to new disclosure requirements and any impact on the financial statement disclosures has not yet been determined.
Note 8–Subsequent Events
In connection with the preparation of the financial statements of the Portfolio as of and for the six-month period ended June 30, 2020, events and transactions subsequent to June 30, 2020, through the date the financial statements were issued have been evaluated by the Manager, for possible adjustment and/or disclosure. No subsequent events requiring financial statement adjustment or disclosure have been identified.
Note 9–Other Matters
An outbreak of COVID-19, first detected in December 2019, has developed into a global pandemic and has resulted in travel restrictions, closure of international borders, certain businesses and securities markets, restrictions on securities trading activities, prolonged quarantines, supply chain disruptions, and lower consumer demand, as well as general concern and uncertainty. The continued impact of COVID-19 is uncertain and could further adversely affect the global economy, national economies, individual issuers and capital markets in unforeseeable ways and result in a substantial and extended economic downturn. Developments that disrupt global economies and financial markets, such as COVID-19, may magnify factors that affect the Portfolio’s performance.
| | |
| 18 | | MainStay VP U.S. Government Money Market Portfolio |
Proxy Voting Policies and Procedures and Proxy Voting Record
A description of the policies and procedures that New York Life Investments uses to vote proxies related to the Portfolio’s securities is available without charge, upon request, (i) by calling 800-598-2019; (ii) by visiting New York Life Investments website at https://www.nylinvestments.com/mainstay/products-and-performance/mainstay-vp-funds-trust; or (iii) by visiting the SEC’s website at www.sec.gov.
The Portfolio is required to file with the SEC its proxy voting record for the 12-month period ending June 30 on Form N-PX. The Portfolio’s most recent Form N-PX or proxy voting record is available free of charge upon request (i) by calling 800-598-2019; (ii) by visiting New York Life
Investments website at https://www.nylinvestments.com/mainstay/products-and-performance/mainstay-vp- funds-trust; or (iii) by visiting the SEC’s website at www.sec.gov.
Shareholder Reports and Quarterly Portfolio Disclosure
The Portfolio is required to file a Form N-MFP every month disclosing its portfolio holdings. The Portfolio’s Form N-MFP is available without charge, on the SEC’s website at www.sec.gov or by calling New York Life Investments at 800-624-6782.
MainStay VP Portfolios
MainStay VP offers a wide range of Portfolios. The full array of MainStay VP offerings is listed here, with information about the manager, subadvisors, legal counsel, and independent registered public accounting firm.
Equity Portfolios
MainStay VP Emerging Markets Equity Portfolio
MainStay VP Epoch U.S. Equity Yield Portfolio
MainStay VP Fidelity Institutional AM® Utilities Portfolio†
MainStay VP MacKay Common Stock Portfolio
MainStay VP MacKay Growth Portfolio
MainStay VP MacKay International Equity Portfolio
MainStay VP MacKay Mid Cap Core Portfolio
MainStay VP MacKay S&P 500 Index Portfolio
MainStay VP MacKay Small Cap Core Portfolio
MainStay VP Mellon Natural Resources Portfolio
MainStay VP Small Cap Growth Portfolio
MainStay VP T. Rowe Price Equity Income Portfolio
MainStay VP Winslow Large Cap Growth Portfolio
Mixed Asset Portfolios
MainStay VP Balanced Portfolio
MainStay VP Income Builder Portfolio
MainStay VP Janus Henderson Balanced Portfolio
MainStay VP MacKay Convertible Portfolio
Income Portfolios
MainStay VP Bond Portfolio
MainStay VP Floating Rate Portfolio
MainStay VP Indexed Bond Portfolio
MainStay VP MacKay Government Portfolio
MainStay VP MacKay High Yield Corporate Bond Portfolio
MainStay VP MacKay Unconstrained Bond Portfolio
MainStay VP PIMCO Real Return Portfolio
Money Market
MainStay VP U.S. Government Money Market Portfolio
Alternative
MainStay VP CBRE Global Infrastructure Portfolio
MainStay VP IQ Hedge Multi-Strategy Portfolio
Asset Allocation Portfolios
MainStay VP Conservative Allocation Portfolio
MainStay VP Growth Allocation Portfolio
MainStay VP Moderate Allocation Portfolio
MainStay VP Moderate Growth Allocation Portfolio
Manager
New York Life Investment Management LLC
New York, New York
Subadvisors
Brown Advisory LLC
Baltimore, Maryland
Candriam Belgium S.A.*
Brussels, Belgium
CBRE Clarion Securities LLC
Radnor, Pennsylvania
Epoch Investment Partners, Inc.
New York, New York
FIAM LLC
Smithfield, Rhode Island
IndexIQ Advisors LLC*
New York, New York
Janus Capital Management LLC
Denver, Colorado
MacKay Shields LLC*
New York, New York
Mellon Investments Corporation
Boston, Massachusetts
NYL Investors LLC*
New York, New York
Pacific Investment Management Company LLC
Newport Beach, California
Segall Bryant & Hamill, LLC
Chicago, Illinois
T. Rowe Price Associates, Inc.
Baltimore, Maryland
Winslow Capital Management, LLC
Minneapolis, Minnesota
Distributor
NYLIFE Distributors LLC*
Jersey City, New Jersey
Custodian
State Street Bank and Trust Company
Boston, Massachusetts
Independent Registered Public Accounting Firm
PricewaterhouseCoopers LLP
New York, New York
Legal Counsel
Dechert LLP
Washington, District of Columbia
Some Portfolios may not be available in all products.
| † | Fidelity Institutional AM is a registered trade mark of FMR LLC. Used with permission. |
| * | An affiliate of New York Life Investment Management LLC |
Not part of the Semiannual Report
2020 Semiannual Report
This report is for the general information of New York Life Variable Annuities and NYLIAC Variable Universal Life Insurance Products policyowners. It must be preceded or accompanied by the appropriate product(s) and funds prospectuses if it is given to anyone who is not an owner of a New York Life variable annuity policy or a NYLIAC Variable Universal Life Insurance Product. This report does not offer for sale or solicit orders to purchase securities.
The performance data quoted in this report represents past performance. Past performance is no guarantee of future results. Due to market volatility and other factors, current performance may be lower or higher than the figures shown. The most recent month-end performance summary for your variable annuity or variable life policy is available by calling 800-598-2019 and is updated periodically on www.newyorklife.com.
The New York Life Variable Annuities and NYLIAC Variable Universal Life Insurance Products are issued by New York Life Insurance and Annuity Corporation (a Delaware Corporation) and distributed by NYLIFE Distributors LLC (Member FINRA/SIPC).
New York Life Insurance Company
New York Life Insurance and Annuity Corporation
(NYLIAC) (A Delaware Corporation)
51 Madison Avenue, Room 551
New York, NY 10010
www.newyorklife.com
Printed on recycled paper
nylinvestments.com
NYLIFE Distributors LLC, 30 Hudson Street, Jersey City, NJ 07302
New York Life Investment Management LLC is the investment manager to the MainStay VP Funds Trust
©2020 by NYLIFE Distributors LLC. All rights reserved.
You may obtain copies of the Prospectus and the Statement of Additional Information free of charge, upon request, by calling toll-free 800-598-2019 or writing to New York Life Insurance and Annuity Corporation, 51 Madison Avenue, New York, NY 10010.
| | | | |
| Not FDIC Insured | | No Bank Guarantee | | May Lose Value |
| | | | |
| 1781646 | | | | MSVPUSGMM10-08/20 (NYLIAC) NI510 |
MainStay VP Mellon Natural Resources Portfolio
Message from the President and Semiannual Report
Unaudited | June 30, 2020
Beginning on January 1, 2021, as permitted by regulations adopted by the Securities and Exchange Commission, paper copies of the MainStay VP Portfolio annual and semi-annual shareholder reports may no longer be sent by mail, unless you specifically request paper copies of the reports from the insurance company that offers your policy. Instead, the reports will be made available online, and you will be notified by mail each time a report is posted and provided with a website link to access the report. Instructions for requesting paper copies will be provided by your insurance company.
If you already elected to receive shareholder reports electronically, you will not be affected by this change and you need not take any action. At any time, you may elect to receive reports and other communications from the insurance company electronically by following the instructions provided by the insurance company.
You may elect to receive all future shareholder reports in paper form free of charge. You can inform the insurance company that you wish to receive paper copies of reports by following the instructions provided by the insurance company. Your election to receive reports in paper form will apply to all portfolio companies available under your contract.
| | | | | | | | |
| Not FDIC/NCUA Insured | | Not a Deposit | | May Lose Value | | No Bank Guarantee | | Not Insured by Any Government Agency |

This page intentionally left blank
Message from the President
High levels of volatility shook financial markets in response to the COVID-19 pandemic and an abrupt decline in global economic activity during the six months ended June 30, 2020.
Markets entered 2020 riding strong fourth quarter performance and an economic expansion of historic longevity. Most broad stock and bond indices began to dip in late February as growing numbers of COVID-19 cases were seen in hotspots around the world. On March 11, 2020, the World Health Organization acknowledged that the disease had reached pandemic proportions, with over 80,000 identified cases in China, thousands in Italy, South Korea and the United States, and more in dozens of additional countries. Governments and central banks pledged trillions of dollars to address the mounting economic and public health crisis; however, “stay-at-home” orders and other restrictions on non-essential activity caused global economic activity to slow. Most stocks and bonds lost significant ground in this challenging environment, with equities declining by roughly a third and the yield on high-yield credit indices shooting higher.
Policymakers responded with extraordinary speed to address the situation. In the United States, the Federal Reserve (“Fed”) cut interest rates to near zero and announced unlimited quantitative easing. With help from Treasury, the Fed later rolled out a series of lending facilities to directly support market functioning. In late March, the Federal government declared a national emergency; Congress passed, and the President signed, a $2 trillion CARES Act (The Coronavirus Aid, Relief, and Economic Security Act), with the promise of further assistance for consumers and businesses to come. This enormous wave of policy support helped fuel a rapid recovery in market pricing as stocks bounced back and credit spreads narrowed. Some states rushed to ease restrictions on travel and social gatherings, further fueling optimism that the effects of the pandemic might prove short lived. However, the final weeks of the reporting period saw infection rates beginning to rise in some of the first states to reopen, raising concerns that a second round of restrictive government policies might prove necessary, once again stifling economic activity.
Despite all the market volatility, the broadly based S&P 500® Index finished the first half of 2020 only slightly below its starting point and the technology-heavy NASDAQ Composite Index posted gains, closing in near record territory. Small-cap stocks tended to trail their large cap counterparts, as illustrated by the Russell 2000® Index’s loss of approximately 15%, while value-oriented stocks lagged growth-oriented issues. From a global perspective, U.S. stocks generally outperformed international equities, with emerging markets hit particularly hard by the flight from risk.
Fixed-income markets also experienced unusually high levels of volatility. Recognized safe havens, such as U.S. government bonds, attracted increased investment, driving yields lower and prices higher, positioning long-term Treasury bonds to deliver particularly strong gains. Investment-grade corporate bonds lost value in March before recovering in the closing months of the reporting period, while relatively speculative high-yield credit faced the brunt of risk-off sentiment. Emerging market debt underperformed most other bonds types as investors sought to minimize currency and sovereign risks.
Today, as we at New York Life Investments continue to track the ongoing health crisis and its financial ramifications, we are particularly mindful of the people at the heart of our enterprise—our colleagues and valued clients. By taking appropriate steps to minimize community spread of COVID-19 within our organization, we strive to safeguard the health of our investment professionals so they can continue to provide you, as a MainStay investor, with world class investment solutions in this rapidly evolving environment.
Sincerely,

Kirk C. Lehneis
President
The opinions expressed are as of the date of this report and are subject to change. There is no guarantee that any forecast made will come to pass. This material does not constitute investment advice and is not intended as an endorsement of any specific investment. Past performance is no guarantee of future results.
Not part of the Semiannual Report
Table of Contents
Investors should refer to the Portfolio’s Summary Prospectus and/or Prospectus and consider the Portfolio’s investment objectives, strategies, risks, charges and expenses carefully before investing. The Summary Prospectus and/or Prospectus contain this and other information about the Portfolio. You may obtain copies of the Portfolio’s Summary Prospectus and/or the Prospectus and the Statement of Additional Information free of charge, upon request, by calling toll-free 800-598-2019, by writing to New York Life Insurance and Annuity Corporation, 51 Madison Avenue, Room 251, New York, New York 10010 or by sending an email to MainStayShareholdersServices@nylim.com. These documents are also available at nylinvestments.com/vpdocuments. Please read the Summary Prospectus and/or Prospectus carefully before investing. MainStay VP Funds Trust portfolios are separate account options which are purchased through a variable insurance or variable annuity contract.
Investment and Performance Comparison1 (Unaudited)
Performance data quoted represents past performance. Past performance is no guarantee of future results. Because of market volatility and other factors, current performance may be lower or higher than the figures shown. Investment return and principal value will fluctuate, and as a result, when shares are redeemed, they may be worth more or less than their original cost. The performance table and graph do not reflect any deduction of sales charges, mortality and expense charges, contract charges or administrative charges. Please refer to the Performance Summary appropriate for your policy. For performance information current to the most recent month-end, please call 800-598-2019 or visit www.newyorklife.com.
Average Annual Total Returns for the Period-Ended June 30, 2020
| | | | | | | | | | | | | | | | | | | | | | |
| Class | | Inception Date | | Six Months | | | One Year | | | Five Years | | | Since Inception2 | | | Gross
Expense
Ratio3 | |
| | | | | | |
| Initial Class Shares | | 2/17/2012 | | | –19.04 | % | | | –15.94 | % | | | –8.20 | % | | | –7.38 | % | | | 0.88 | % |
| | | | | | | | | | | | | | | | |
| Benchmark Performance | | Six
Months | | | One Year | | | Five
Years | | | Since Inception | |
| | | | |
S&P Global Natural Resources Sector Index4 | | | –19.14 | % | | | –16.76 | % | | | 0.94 | % | | | –1.14 | % |
S&P North American Natural Resources Sector Index5 | | | –26.33 | | | | –24.37 | | | | –6.47 | | | | –4.65 | |
Morningstar Natural Resources Category Average6 | | | –15.15 | | | | –12.78 | | | | –1.29 | | | | –3.11 | |
| 1. | Performance figures may reflect certain fee waivers and/or expense limitations, without which total returns may have been different. For information on current fee waivers and/or expense limitations (if any), please refer to the Notes to Financial Statements. |
| 2. | The Portfolio replaced its subadvisor, changed its investment objective and modified its principal investment strategies as of November 30, 2018. Therefore, the performance information shown in this report prior to November 30, 2018 reflects the Portfolio’s prior subadvisor, investment objective and principal investment strategies. |
| 3. | The gross expense ratios presented reflect the Portfolio’s “Total Annual Portfolio Operating Expenses” from the most recent Prospectus, as supplemented, and may differ from other expense ratios disclosed in this report. |
| 4. | The Portfolio has selected the S&P Global Natural Resources Sector Index as its primary benchmark. The S&P Global Natural Resources Sector Index includes 90 of the largest publicly-traded companies in natural resources and commodities businesses that meet specific investability requirements, offering investors diversified and investable equity exposure across 3 primary commodity-related sectors: agribusiness, energy, and metals & mining. Results assume reinvestment of all dividends and capital gains. An investment cannot be made directly in an index. |
| 5. | The S&P North American Natural Resources Sector Index is the Portfolio’s secondary benchmark. The S&P North American Natural Resources Sector Index represents U.S. traded securities that are classified under the GICS® energy and materials sector excluding the chemicals industry and steel sub-industry. The natural resource sector includes mining, energy, paper and forest products, and plantation-owning companies. Results assume reinvestment of all dividends and capital gains. An investment cannot be made directly in an index. widely regarded as the standard index for measuring large-cap U.S. stock market performance. Results assume reinvestment of all dividends and capital gains. An investment cannot be made directly in an index. |
| 6. | The Morningstar Natural Resources Category Average is representative of funds that invest primarily on commodity-based industries such as energy, chemicals, minerals, and forest products in the United States or outside of the United States. Some funds invest across this spectrum to offer broad natural-resources exposure. Others concentrate heavily or even exclusively in specific industries. Funds that concentrate primarily in energy-related industries are part of the equity energy category. Results are based on average total returns of similar funds with all dividends and capital gain distributions reinvested. |
Cost in Dollars of a $1,000 Investment in MainStay VP Mellon Natural Resources Portfolio (Unaudited)
The example below is intended to describe the fees and expenses borne by shareholders during the six-month period from January 1, 2020, to June 30, 2020, and the impact of those costs on your investment.
Example
As a shareholder of the Portfolio you incur two types of costs: (1) transaction costs, including exchange fees and sales charges (loads) on purchases (as applicable), and (2) ongoing costs, including management fees, distribution and/or service (12b-1) fees, and other Portfolio expenses (as applicable). This example is intended to help you understand your ongoing costs (in dollars) of investing in the Portfolio and to compare these costs with the ongoing costs of investing in other mutual funds. The example is based on an investment of $1,000 made at the beginning of the six-month period and held for the entire period from January 1, 2020, to June 30, 2020. Shares are only sold in connection with variable life and annuity contracts and the example does not reflect any contract level or transactional fees or expenses. If these costs had been included, your costs would have been higher.
This example illustrates your Portfolio’s ongoing costs in two ways:
Actual Expenses
The second and third data columns in the table below provide information about actual account values and actual expenses. You may use the information in these columns, together with the amount you invested, to estimate the expenses that you paid during the six months
ended June 30, 2020. Simply divide your account value by $1,000 (for example, an $8,600 account value divided by $1,000 = 8.6), then multiply the result by the number under the heading entitled “Expenses Paid During Period” to estimate the expenses you paid on your account during this period.
Hypothetical Example for Comparison Purposes
The fourth and fifth data columns in the table below provide information about hypothetical account values and hypothetical expenses based on the Portfolio’s actual expense ratio and an assumed rate of return of 5% per year before expenses, which is not the Portfolio’s actual return. The hypothetical account values and expenses may not be used to estimate the actual ending account balances or expenses you paid for the six-month period shown. You may use this information to compare the ongoing costs of investing in the Portfolio with the ongoing costs of investing in other mutual funds. To do so, compare this 5% hypothetical example with the 5% hypothetical examples that appear in the shareholder reports of the other mutual funds.
Please note that the expenses shown in the table are meant to highlight your ongoing costs only and do not reflect any transactional costs, such as exchange fees or sales charges (loads). Therefore, the fourth and fifth data columns of the table are useful in comparing ongoing costs only and will not help you determine the relative total costs of owning different funds. In addition, if these transactional costs were included, your costs would have been higher.
| | | | | | | | | | | | | | | | | | | | | | | | |
| Share Class | | Beginning Account Value
1/1/20 | | | Ending Account
Value (Based
on Actual
Returns and
Expenses)
6/30/20 | | | Expenses
Paid
During
Period1 | | | Ending Account
Value (Based
on Hypothetical
5% Annualized
Return and
Actual Expenses)
6/30/20 | | | Expenses
Paid
During
Period1 | | | Net
Expense
Ratio
During
Period2 | |
| | | | | | |
| Initial Class Shares | | $ | 1,000.00 | | | $ | 809.60 | | | $ | 4.00 | | | $ | 1,020.44 | | | $ | 4.47 | | | | 0.89 | % |
| 1 | Expenses are equal to the Portfolio’s annualized expense ratio of each class multiplied by the average account value over the period, divided by 366 and multiplied by 182 (to reflect the six-month period). The table above represents the actual expenses incurred during the six-month period. In addition to the fees and expenses which the Portfolio bears directly, it also indirectly bears a pro rata share of the fees and expenses of the underlying funds in which it invests. Such indirect expenses are not included in the above-reported expense figures. |
| 2 | Expenses are equal to the Portfolio’s annualized expense ratio to reflect the six-month period. |
| | |
| 6 | | MainStay VP Mellon Natural Resources Portfolio |
Country Composition as of June 30, 2020 (Unaudited)
| | | | |
| |
| United States | | | 59.7 | % |
| |
| Canada | | | 13.6 | |
| |
| South Africa | | | 6.1 | |
| |
| Norway | | | 5.9 | |
| |
| Denmark | | | 4.2 | |
| |
| United Kingdom | | | 3.6 | |
| |
| France | | | 2.7 | |
| | | | |
| |
| Brazil | | | 1.9 | |
| |
| Luxembourg | | | 1.9 | |
| |
| Peru | | | 0.7 | |
| |
| Zambia | | | 0.4 | |
| |
| Other Assets, Less Liabilities | | | -0.7 | |
| | | | |
| |
| | | 100.0 | % |
| | | | |
See Portfolio of Investments beginning on page 10 for specific holdings within these categories. The Portfolio’s holdings are subject to change.
Top Ten Holdings as of June 30, 2020 (excluding short-term investment) (Unaudited)
| 5. | Archer-Daniels-Midland Co. |
Portfolio Management Discussion and Analysis (Unaudited)
Answers to the questions reflect the views of portfolio manager Robin Wehbe, CFA, of Mellon Investments Corporation, the Portfolio’s Subadvisor.
How did MainStay VP Mellon Natural Resources Portfolio perform relative to its benchmarks and peers during the six months ended June 30, 2020?
For the six months ended June 30, 2020, MainStay VP Mellon Natural Resources Portfolio returned –19.04% for Initial Class shares. Over the same period, Initial Class shares of the Portfolio outperformed the –19.14% return of the S&P Global Natural Resources Sector Index, which is the Portfolio’s primary benchmark, and the –26.33% return of the S&P North American Natural Resources Sector Index, which is the Portfolio’s secondary benchmark. For the six months ended June 30, 2020, the Initial Class shares underperformed the –15.15% return of the Morningstar Natural Resources Category Average.1
During the reporting period, were there any market events that materially impacted the Portfolio’s performance or liquidity?
During the reporting period, the entire economy and global equity market experienced increased market volatility and uncertainty related to the COVID-19 pandemic. While the Portfolio saw its performance decline along with broader commodity markets, it then partially recovered. The Portfolio did not experience any holdings with additional challenges related to market or liquidity events, other than the broad portfolio and market level reaction as noted here.
What factors affected the Portfolio’s relative performance during the reporting period?
Most of the Portfolio’s outperformance relative to the S&P Global Natural Resources Sector Index over the last six months was related to investments in, and allocations to, integrated energy, precious metals and next generation energy.
Which market segments were the strongest positive contributors to the Portfolio’s relative performance, and which market segments were particularly weak?
The strongest positive contributions to the Portfolio’s returns relative to the S&P Global Natural Resources Index came from underweight positioning in the integrated energy segment, robust stock selections in precious metals and overweight exposure to next generation energy. (Contributions take weightings and total returns into account.) The weakest contributions to the Portfolio’s relative performance came from overweight positioning in the energy services, refining & chemicals and U.S./onshore upstream segments.
During the reporting period, which individual stocks made the strongest positive contributions to the Portfolio’s absolute performance and which stocks detracted the most?
The top contributors to the Portfolio’s absolute performance included gold miners Barrick Gold, Newmont and Kinross Gold. Gold stocks outperformed the broad market sell-off of risky assets, validating our favorable outlook for the commodity amid the current volatile and uncertain climate. In addition, Barrick Gold and Newmont saw new opportunities open after a recent
venture. Kinross Gold, an out-of-Index position added to the Portfolio late in the reporting period, saw shares rally with the rest of the gold space.
The most significant detractors from the Portfolio’s absolute performance during the same period included positions in integrated energy companies BP and Petroleo Brasileiro (“Petrobras”), and energy services provider Schlumberger. In our opinion, BP has a solid portfolio of assets with opportunities to create value but did not take strict enough measures to protect capital compared to its peers. Petrobras stock suffered along with much of the Brazilian market as Brazil was harder hit with pandemic-related shutdowns later than most other countries. Schlumberger was particularly stressed due to challenging energy sector conditions as its energy sector customers slashed budgets due to pandemic-related uncertainties.
Did the Portfolio make any significant purchases or sales during the reporting period?
The Portfolio purchased shares in agricultural nutrient producer Mosaic during the reporting period to take advantage of improved valuation and rotation within the industry. The Portfolio also added more gold exposure through the purchase of shares in Kinross Gold as pandemic fears continue to drive rising volatility. During the same period, the Portfolio exited is position in mining and energy company Teck Resources to focus on larger, more liquid miners and to reduce exposure to coal. Another significant sale involved the Portfolio’s entire position in oil & gas equipment & service company Saipem, reflecting our view that the energy services outlook remains significantly challenged and could take years to recover.
How did the Portfolio’s subsector and subindustry weightings change during the reporting period?
During the reporting period, the Portfolio increased its overweight exposure to next generation energy relative to the S&P Global Natural Resources Sector Index, and also increased its
| 1. | See page 5 for more information on benchmark and peer group returns. |
| | |
| 8 | | MainStay VP Mellon Natural Resources Portfolio |
exposure to agriculture and precious metals, moving from an underweight position to an overweight position in both sectors. Conversely, the Portfolio reduced its exposure to integrated energy, increasing the magnitude of its underweight exposure, and trimmed exposure to energy services and refining & chemicals, though both remained relatively overweight positions.
How was the Portfolio positioned at the end of the reporting period?
While the Portfolio would have benefited from more defensive positioning as the COVID-19 crisis unfolded, as of June 30, 2020 we are largely pleased with the Portfolio’s positioning. We are employing a dual strategy of quality commodity beta2 concurrent with defensive positioning.
The Portfolio’s holdings in energy and metals focus on the larger, more liquid, high-quality names that still exhibit solid
commodity beta characteristics as we believe the recovery has room to continue. We maintain exposure to next generation energy as those names have experienced comparatively limited fundamental impact and appear to be benefitting from increased investor attention. More defensively, gold has been a great diversifier, while packaging and waste provide asymmetry with resilient downside protection and modest cyclical benefits.
We expect the Portfolio’s trading pattern to remain fairly subdued, as we trim and add sparingly to the Portfolio’s positions on the margin, seeking to increase cyclical exposure to copper, which is leveraged to rising industrial activity, and opportunistically adding exposure to lumber products, an area that appears well positioned to benefit from a U.S. housing market recovery.
| 2. | Beta is a measure of volatility in relation to the market as a whole. A beta higher than 1 indicates that a security or portfolio will tend to exhibit higher volatility than the market. A beta lower than 1 indicates that a security or portfolio will tend to exhibit lower volatility than the market. |
The opinions expressed are those of the portfolio managers as of the date of this report and are subject to change. There is no guarantee that any forecasts will come to pass. This material does not constitute investment advice and is not intended as an endorsement of any specific investment.
Not all MainStay VP Portfolios and/or share classes are available under all policies.
Portfolio of Investments June 30, 2020 (Unaudited)
| | | | | | | | |
| | | Shares | | | Value | |
| | | | | | | | |
| Common Stocks 98.8% † | |
Brazil 1.9% | |
Petroleo Brasileiro S.A., Sponsored ADR (Oil, Gas & Consumable Fuels) (a) | | | 478,936 | | | $ | 3,817,120 | |
| | | | | | | | |
Canada 13.6% | |
Barrick Gold Corp. (Metals & Mining) | | | 535,499 | | | | 14,426,343 | |
Kinross Gold Corp. (Metals & Mining) (b) | | | 957,832 | | | | 6,914,226 | |
Lundin Mining Corp. (Metals & Mining) | | | 735,101 | | | | 3,941,909 | |
Norbord, Inc. (Paper & Forest Products) | | | 96,862 | | | | 2,211,074 | |
| | | | | | | | |
| | | | | | | 27,493,552 | |
| | | | | | | | |
Denmark 4.2% | |
Orsted A/S (Electric Utilities) (c) | | | 22,878 | | | | 2,638,515 | |
Vestas Wind Systems A/S (Electrical Equipment) | | | 57,334 | | | | 5,834,027 | |
| | | | | | | | |
| | | | | | | 8,472,542 | |
| | | | | | | | |
France 2.7% | |
Air Liquide S.A. (Chemicals) | | | 38,222 | | | | 5,507,364 | |
| | | | | | | | |
Luxembourg 1.9% | |
ArcelorMittal S.A. (Metals & Mining) (b) | | | 372,660 | | | | 3,912,988 | |
| | | | | | | | |
Norway 5.9% | |
Equinor ASA (Oil, Gas & Consumable Fuels) | | | 512,800 | | | | 7,292,662 | |
Yara International ASA (Chemicals) | | | 132,183 | | | | 4,592,495 | |
| | | | | | | | |
| | | | | | | 11,885,157 | |
| | | | | | | | |
Peru 0.7% | |
Southern Copper Corp. (Metals & Mining) | | | 36,341 | | | | 1,440,986 | |
| | | | | | | | |
South Africa 6.1% | |
Anglo American PLC (Metals & Mining) | | | 527,936 | | | | 12,203,233 | |
| | | | | | | | |
United Kingdom 3.6% | |
BP PLC (Oil, Gas & Consumable Fuels) | | | 1,895,313 | | | | 7,202,989 | |
| | | | | | | | |
United States 57.8% | |
Archer-Daniels-Midland Co. (Food Products) | | | 223,879 | | | | 8,932,772 | |
Ball Corp. (Containers & Packaging) | | | 61,812 | | | | 4,295,316 | |
Bunge, Ltd. (Food Products) | | | 144,152 | | | | 5,928,972 | |
Casella Waste Systems, Inc., Class A (Commercial Services & Supplies) (b) | | | 100,605 | | | | 5,243,533 | |
CF Industries Holdings, Inc. (Chemicals) | | | 139,931 | | | | 3,937,658 | |
Clean Harbors, Inc. (Commercial Services & Supplies) (b) | | | 48,472 | | | | 2,907,351 | |
Concho Resources, Inc. (Oil, Gas & Consumable Fuels) | | | 65,449 | | | | 3,370,623 | |
ConocoPhillips (Oil, Gas & Consumable Fuels) | | | 182,195 | | | | 7,655,834 | |
Covanta Holding Corp. (Commercial Services & Supplies) | | | 201,774 | | | | 1,935,013 | |
First Solar, Inc. (Semiconductors & Semiconductor Equipment) (b) | | | 78,180 | | | | 3,869,910 | |
FMC Corp. (Chemicals) | | | 61,113 | | | | 6,088,077 | |
Freeport-McMoRan, Inc. (Metals & Mining) | | | 904,978 | | | | 10,470,595 | |
Hess Corp. (Oil, Gas & Consumable Fuels) | | | 126,729 | | | | 6,565,829 | |
Itron, Inc. (Electronic Equipment, Instruments & Components) (b) | | | 31,846 | | | | 2,109,798 | |
| | | | | | | | |
| | | Shares | | | Value | |
| | | | | | | | |
Louisiana-Pacific Corp. (Paper & Forest Products) | | | 164,879 | | | $ | 4,229,146 | |
Marathon Petroleum Corp. (Oil, Gas & Consumable Fuels) | | | 163,221 | | | | 6,101,201 | |
Mosaic Co. (Chemicals) | | | 290,189 | | | | 3,630,264 | |
Newmont Corp. (Metals & Mining) | | | 194,081 | | | | 11,982,561 | |
NextEra Energy, Inc. (Electric Utilities) | | | 23,658 | | | | 5,681,942 | |
Pioneer Natural Resources Co. (Oil, Gas & Consumable Fuels) | | | 58,784 | | | | 5,743,197 | |
Schlumberger, Ltd. (Energy Equipment & Services) | | | 119,736 | | | | 2,201,945 | |
Steel Dynamics, Inc. (Metals & Mining) | | | 152,830 | | | | 3,987,335 | |
| | | | | | | | |
| | | | | | | 116,868,872 | |
| | | | | | | | |
Zambia 0.4% | |
First Quantum Minerals, Ltd. (Metals & Mining) | | | 107,225 | | | | 850,617 | |
| | | | | | | | |
Total Common Stocks
(Cost $215,069,527) | | | | | | | 199,655,420 | |
| | | | | |
|
| Short-Term Investment 1.9% | |
Unaffiliated Investment Company 1.9% | |
United States 1.9% | |
State Street Navigator Securities Lending Government Money Market Portfolio, 0.13% (d)(e) | | | 3,752,925 | | | | 3,752,925 | |
| | | | | | | | |
Total Short-Term Investment
(Cost $3,752,925) | | | | | | | 3,752,925 | |
| | | | | |
Total Investments
(Cost $218,822,452) | | | 100.7 | % | | | 203,408,345 | |
Other Assets, Less Liabilities | | | (0.7 | ) | | | (1,322,811 | ) |
| | | | | | | | |
Net Assets | | | 100.0 | % | | $ | 202,085,534 | |
| | | | | | | | |
| † | Percentages indicated are based on Portfolio net assets. |
| (a) | All or a portion of this security was held on loan. As of June 30, 2020, the aggregate market value of securities on loan was $3,625,553. The Portfolio received cash collateral with a value of $3,752,925 (See Note 2(J)). |
| (b) | Non-income producing security. |
| (c) | May be sold to institutional investors only under Rule 144A or securities offered pursuant to Section 4(a)(2) of the Securities Act of 1933, as amended. |
| (d) | Current yield as of June 30, 2020. |
| (e) | Represents a security purchased with cash collateral received for securities on loan. |
The following abbreviation is used in the preceding pages:
ADR—American Depositary Receipt
| | | | |
| 10 | | MainStay VP Mellon Natural Resources Portfolio | | The notes to the financial statements are an integral part of,
and should be read in conjunction with, the financial statements. |
Portfolio of Investments June 30, 2020 (Unaudited) (continued)
The following is a summary of the fair valuations according to the inputs used as of June 30, 2020, for valuing the Portfolio’s assets and liabilities:
| | | | | | | | | | | | | | | | |
Description | | Quoted
Prices in
Active
Markets for
Identical
Assets (Level 1) | | | Significant
Other
Observable
Inputs (Level 2) | | | Significant
Unobservable
Inputs (Level 3) | | | Total | |
|
Asset Valuation Inputs | |
| Investments in Securities (a) | | | | | | | | | | | | | | | | |
| Common Stocks | | | | | | | | | | | | | | | | |
Denmark | | $ | — | | | $ | 8,472,542 | | | $ | — | | | $ | 8,472,542 | |
France | | | — | | | | 5,507,364 | | | | — | | | | 5,507,364 | |
Luxembourg | | | — | | | | 3,912,988 | | | | — | | | | 3,912,988 | |
Norway | | | — | | | | 11,885,157 | | | | — | | | | 11,885,157 | |
South Africa | | | — | | | | 12,203,233 | | | | — | | | | 12,203,233 | |
United Kingdom | | | — | | | | 7,202,989 | | | | — | | | | 7,202,989 | |
All Other Countries | | | 150,471,147 | | | | — | | | | — | | | | 150,471,147 | |
| | | | | | | | | | | | | | | | |
| Total Common Stocks | | | 150,471,147 | | | | 49,184,273 | | | | — | | | | 199,655,420 | |
| | | | | | | | | | | | | | | | |
| Short-Term Investment | | | | | | | | | | | | | | | | |
Unaffiliated Investment Company | | | 3,752,925 | | | | — | | | | — | | | | 3,752,925 | |
| | | | | | | | | | | | | | | | |
| Total Investments in Securities | | $ | 154,224,072 | | | $ | 49,184,273 | | | $ | — | | | $ | 203,408,345 | |
| | | | | | | | | | | | | | | | |
| (a) | For a complete listing of investments and their industries, see the Portfolio of Investments. |
The table below sets forth the diversification of the Portfolio’s investments by industry.
Industry Diversification
| | | | | | | | |
| | | Value | | | Percent † | |
Chemicals | | $ | 23,755,858 | | | | 11.8 | % |
Commercial Services & Supplies | | | 10,085,897 | | | | 5.0 | |
Containers & Packaging | | | 4,295,316 | | | | 2.1 | |
Electric Utilities | | | 8,320,457 | | | | 4.1 | |
Electrical Equipment | | | 5,834,027 | | | | 2.9 | |
Electronic Equipment, Instruments & Components | | | 2,109,798 | | | | 1.0 | |
Energy Equipment & Services | | | 2,201,945 | | | | 1.1 | |
Food Products | | | 14,861,744 | | | | 7.4 | |
Metals & Mining | | | 70,130,793 | | | | 34.7 | |
Oil, Gas & Consumable Fuels | | | 47,749,455 | | | | 23.6 | |
Paper & Forest Products | | | 6,440,220 | | | | 3.2 | |
Semiconductors & Semiconductor Equipment | | | 3,869,910 | | | | 1.9 | |
| | | | | | | | |
| | | 199,655,420 | | | | 98.8 | |
Short-Term Investment | | | 3,752,925 | | | | 1.9 | |
Other Assets, Less Liabilities | | | (1,322,811 | ) | | | -0.7 | |
| | | | | | | | |
Net Assets | | $ | 202,085,534 | | | | 100.0 | % |
| | | | | | | | |
| † | Percentages indicated are based on Portfolio net assets. |
| | | | | | |
The notes to the financial statements are an integral part of,
and should be read in conjunction with, the financial statements. | | | | | 11 | |
Statement of Assets and Liabilities as of June 30, 2020 (Unaudited)
| | | | |
| Assets | |
Investment in securities, at value (identified cost $218,822,452) including securities on loan of $3,625,553 | | $ | 203,408,345 | |
Cash denominated in foreign currencies (identified cost $136,552) | | | 134,872 | |
Receivables: | |
Investment securities sold | | | 5,138,604 | |
Dividends | | | 332,229 | |
Portfolio shares sold | | | 67,402 | |
Securities lending | | | 584 | |
Other assets | | | 752 | |
| | | | |
Total assets | | | 209,082,788 | |
| | | | |
|
| Liabilities | |
Due to custodian | | | 52,165 | |
Cash collateral received for securities on loan | | | 3,752,925 | |
Payables: | |
Investment securities purchased | | | 2,792,445 | |
Portfolio shares redeemed | | | 169,589 | |
Manager (See Note 3) | | | 132,262 | |
Shareholder communication | | | 52,940 | |
Professional fees | | | 24,055 | |
Custodian | | | 14,445 | |
Trustees | | | 294 | |
Accrued expenses | | | 6,134 | |
| | | | |
Total liabilities | | | 6,997,254 | |
| | | | |
Net assets | | $ | 202,085,534 | |
| | | | |
|
| Composition of Net Assets | |
Shares of beneficial interest outstanding (par value of $.001 per share) unlimited number of shares authorized | | $ | 39,718 | |
Additional paid-in capital | | | 449,011,577 | |
| | | | |
| | | 449,051,295 | |
Total distributable earnings (loss) | | | (246,965,761 | ) |
| | | | |
Net assets | | $ | 202,085,534 | |
| | | | |
|
| Initial Class | |
Net assets applicable to outstanding shares | | $ | 202,085,534 | |
| | | | |
Shares of beneficial interest outstanding | | | 39,717,535 | |
| | | | |
Net asset value per share outstanding | | $ | 5.09 | |
| | | | |
| | | | |
| 12 | | MainStay VP Mellon Natural Resources Portfolio | | The notes to the financial statements are an integral part of,
and should be read in conjunction with, the financial statements. |
Statement of Operations for the six months ended June 30, 2020 (Unaudited)
| | | | |
| Investment Income (Loss) | |
Income | |
Dividends-unaffiliated (a) | | $ | 2,509,741 | |
Non-cash dividends | | | 429,274 | |
Securities lending | | | 41,724 | |
Dividends-affiliated | | | 6,128 | |
Other | | | 208,176 | |
| | | | |
Total income | | | 3,195,043 | |
| | | | |
Expenses | |
Manager (See Note 3) | | | 788,014 | |
Professional fees | | | 32,236 | |
Shareholder communication | | | 29,762 | |
Custodian | | | 25,072 | |
Trustees | | | 2,643 | |
Miscellaneous | | | 10,640 | |
| | | | |
Total expenses | | | 888,367 | |
| | | | |
Net investment income (loss) | | | 2,306,676 | |
| | | | |
|
| Realized and Unrealized Gain (Loss) on Investments and Foreign Currency Transactions | |
| |
Net realized gain (loss) on: | |
Unaffiliated investment transactions | | | (9,974,859 | ) |
Foreign currency transactions | | | (12,934 | ) |
| | | | |
Net realized gain (loss) on investments and foreign currency transactions | | | (9,987,793 | ) |
| | | | |
Net change in unrealized appreciation (depreciation) on: | |
Unaffiliated investments | | | (36,792,927 | ) |
Translation of other assets and liabilities in foreign currencies | | | (3,395 | ) |
| | | | |
Net change in unrealized appreciation (depreciation) on investments and foreign currencies | | | (36,796,322 | ) |
| | | | |
Net realized and unrealized gain (loss) on investments and foreign currency transactions | | | (46,784,115 | ) |
| | | | |
Net increase (decrease) in net assets resulting from operations | | $ | (44,477,439 | ) |
| | | | |
| (a) | Dividends recorded net of foreign withholding taxes in the amount of $153,026. |
| | | | | | |
The notes to the financial statements are an integral part of,
and should be read in conjunction with, the financial statements. | | | | | 13 | |
Statements of Changes in Net Assets
for the six months ended June 30, 2020 (Unaudited) and the year ended December 31, 2019
| | | | | | | | |
| | | 2020 | | | 2019 | |
| Increase (Decrease) in Net Assets | |
Operations: | |
Net investment income (loss) | | $ | 2,306,676 | | | $ | 5,438,551 | |
Net realized gain (loss) on investments and foreign currency transactions | | | (9,987,793 | ) | | | (9,285,380 | ) |
Net change in unrealized appreciation (depreciation) on investments and foreign currencies | | | (36,796,322 | ) | | | 42,045,341 | |
| | | | | | | | |
Net increase (decrease) in net assets resulting from operations | | | (44,477,439 | ) | | | 38,198,512 | |
| | | | | | | | |
Distributions to shareholders: | |
Initial Class | | | — | | | | (1,880,547 | ) |
| | | | | | | | |
Capital share transactions: | |
Net proceeds from sale of shares | | | 16,725,523 | | | | 18,704,335 | |
Net asset value of shares issued to shareholders in reinvestment of distributions | | | — | | | | 1,880,547 | |
Cost of shares redeemed | | | (19,438,165 | ) | | | (47,694,578 | ) |
| | | | | | | | |
Increase (decrease) in net assets derived from capital share transactions | | | (2,712,642 | ) | | | (27,109,696 | ) |
| | | | | | | | |
Net increase (decrease) in net assets | | | (47,190,081 | ) | | | 9,208,269 | |
|
| Net Assets | |
Beginning of period | | | 249,275,615 | | | | 240,067,346 | |
| | | | | | | | |
End of period | | $ | 202,085,534 | | | $ | 249,275,615 | |
| | | | | | | | |
| | | | |
| 14 | | MainStay VP Mellon Natural Resources Portfolio | | The notes to the financial statements are an integral part of,
and should be read in conjunction with, the financial statements. |
Financial Highlights selected per share data and ratios
| | | | | | | | | | | | | | | | | | | | | | | | |
| | |
| | | Six months
ended
June 30, | | | Year ended December 31, | |
| | | | | | |
| Initial Class | | 2020* | | | 2019 | | | 2018 | | | 2017 | | | 2016 | | | 2015 | |
| | | | | | |
Net asset value at beginning of period | | $ | 6.29 | | | $ | 5.43 | | | $ | 7.61 | | | $ | 7.67 | | | $ | 5.38 | | | $ | 8.06 | |
| | | | | | | | | | | | | | | | | | | | | | | | |
| | | | | | |
Net investment income (loss) | | | 0.06 | | | | 0.13 | (a) | | | 0.04 | | | | (0.01 | ) | | | (0.01 | ) | | | 0.04 | |
| | | | | | |
Net realized and unrealized gain (loss) on investments | | | (1.26 | ) | | | 0.78 | | | | (2.22 | ) | | | (0.05 | ) | | | 2.34 | | | | (2.69 | ) |
| | | | | | |
Net realized and unrealized gain (loss) on foreign currency transactions ‡ | | | (0.00 | ) | | | (0.00 | ) | | | 0.00 | | | | (0.00 | ) | | | (0.00 | ) | | | 0.00 | |
| | | | | | | | | | | | | | | | | | | | | | | | |
| | | | | | |
Total from investment operations | | | (1.20 | ) | | | 0.91 | | | | (2.18 | ) | | | (0.06 | ) | | | 2.33 | | | | (2.65 | ) |
| | | | | | | | | | | | | | | | | | | | | | | | |
| | | | | | |
| Less distributions: | | | | | | | | | | | | | | | | | | | | | | | | |
| | | | | | |
From net investment income | | | — | | | | (0.05 | ) | | | — | | | | — | | | | (0.04 | ) | | | (0.03 | ) |
| | | | | | | | | | | | | | | | | | | | | | | | |
| | | | | | |
Net asset value at end of period | | $ | 5.09 | | | $ | 6.29 | | | $ | 5.43 | | | $ | 7.61 | | | $ | 7.67 | | | $ | 5.38 | |
| | | | | | | | | | | | | | | | | | | | | | | | |
| | | | | | |
Total investment return (b) | | | (19.08 | %)(c) | | | 16.62 | % | | | (28.65 | %)(c) | | | (0.78 | %)(c) | | | 43.33 | % | | | (32.96 | %) |
| | | | | | |
Ratios (to average net assets)/Supplemental Data: | | | | | | | | | | | | | | | | | | | | | | | | |
| | | | | | |
Net investment income (loss) | | | 2.31 | % †† | | | 2.17 | % | | | 0.59 | % | | | (0.10 | %) | | | (0.12 | %)(d) | | | 0.57 | % |
| | | | | | |
Net expenses (e) | | | 0.89 | % †† | | | 0.96 | % | | | 0.94 | % | | | 0.94 | % | | | 0.93 | % (f) | | | 0.93 | % |
| | | | | | |
Portfolio turnover rate | | | 21 | % | | | 87 | % | | | 78 | % | | | 17 | % | | | 40 | % | | | 21 | % |
| | | | | | |
Net assets at end of period (in 000’s) | | $ | 202,086 | | | $ | 249,276 | | | $ | 240,067 | | | $ | 379,253 | | | $ | 432,891 | | | $ | 332,823 | |
| ‡ | Less than one cent per share. |
| (a) | Per share data based on average shares outstanding during the period. |
| (b) | Total return does not reflect any deduction of sales charges, mortality and expense charges, contract charges or administrative charges. For periods of less than one year, total return is not annualized. |
| (c) | Total investment return may reflect adjustments to conform to generally accepted accounting principles. |
| (d) | Without the custody fee reimbursement, net investment income (loss) would have been (0.13)%. |
| (e) | In addition to the fees and expenses which the Portfolio bears directly, it also indirectly bears a pro-rata share of the fees and expenses of the underlying funds in which it invests. Such indirect expenses are not included in the above expense ratios. |
| (f) | Without the custody fee reimbursement, net expenses would have been 0.94%. |
| | | | | | |
The notes to the financial statements are an integral part of,
and should be read in conjunction with, the financial statements. | | | | | 15 | |
Notes to Financial Statements (Unaudited)
Note 1—Organization and Business
MainStay VP Funds Trust (the “Fund”) was organized as a Delaware statutory trust on February 1, 2011. The Fund is registered under the Investment Company Act of 1940, as amended (the “1940 Act”), as an open-end management investment company. The Fund is comprised of thirty-one separate series (collectively referred to as the “Portfolios”). These financial statements and notes relate to the MainStay VP Mellon Natural Resources Portfolio (the “Portfolio”), a “non-diversified” portfolio, as that term is defined in the 1940 Act, as interpreted or modified by regulatory authorities having jurisdiction, from time to time. Since the Portfolio has historically operated as a “diversified” portfolio, it will not operate as “non-diversified” without first obtaining shareholder approval.
Shares of the Portfolio are currently offered to certain separate accounts to fund variable annuity policies and variable universal life insurance policies issued by New York Life Insurance and Annuity Corporation (“NYLIAC”), a wholly-owned subsidiary of New York Life Insurance Company (“New York Life”) and may also be offered to fund variable annuity policies and variable universal life insurance policies issued by other insurance companies. NYLIAC allocates shares of the Portfolios to, among others, certain NYLIAC separate accounts. Shares of the Portfolio are also offered to the MainStay VP Conservative Allocation Portfolio, MainStay VP Moderate Allocation Portfolio, MainStay VP Moderate Growth Allocation Portfolio and MainStay VP Growth Allocation Portfolio, which operate as “funds-of-funds,” and other variable insurance funds.
The Portfolio currently offers one class of shares. Initial Class shares commenced operations on February 17, 2012. Shares of the Portfolio are offered and are redeemed at a price equal to their net asset value (“NAV”) per share. No sales or redemption charge is applicable to the purchase or redemption of the Portfolio’s shares.
The Portfolio’s investment objective is to seek long-term capital appreciation.
Note 2—Significant Accounting Policies
The Portfolio is an investment company and accordingly follows the investment company accounting and reporting guidance of the Financial Accounting Standards Board (“FASB”) Accounting Standard Codification Topic 946 Financial Services – Investment Companies. The Portfolio prepares its financial statements in accordance with generally accepted accounting principles (“GAAP”) in the United States of America and follows the significant accounting policies described below.
(A) Securities Valuation. Investments are usually valued as of the close of regular trading on the New York Stock Exchange (the “Exchange”) (usually 4:00 p.m. Eastern time) on each day the Portfolio is open for business (“valuation date”).
The Board of Trustees of the Fund (the “Board”) adopted procedures establishing methodologies for the valuation of the Portfolio’s securities and other assets and delegated the responsibility for valuation determinations under those procedures to the Valuation Committee of the Fund (the “Valuation Committee”). The procedures state that, subject to the oversight of the Board and unless otherwise noted, the responsibility for the day-to-day valuation of portfolio assets (including fair value measurements for the Portfolio’s assets and liabilities) rests with
New York Life Investment Management LLC (“New York Life Investments” or the “Manager”), aided to whatever extent necessary by the Subadvisor (as defined in Note 3(A)). To assess the appropriateness of security valuations, the Manager, the Subadvisor or the Portfolio’s third-party service provider, who is subject to oversight by the Manager, regularly compares prior day prices, prices on comparable securities and the sale prices to the prior and current day prices and challenges prices with changes exceeding certain tolerance levels with third-party pricing services or broker sources.
The Board authorized the Valuation Committee to appoint a Valuation Subcommittee (the “Subcommittee”) to establish the prices of securities for which market quotations are not readily available or the prices of which are not otherwise readily determinable under the procedures. The Subcommittee meets (in person, via electronic mail or via teleconference) on an as-needed basis. The Valuation Committee meets to ensure that actions taken by the Subcommittee were appropriate.
For those securities valued through either a standardized fair valuation methodology or a fair valuation measurement, the Subcommittee deals with such valuation and the Valuation Committee reviews and affirms, if appropriate, the reasonableness of the valuation based on such methodologies and measurements on a regular basis after considering information that is reasonably available and deemed relevant by the Valuation Committee. Any action taken by the Subcommittee with respect to the valuation of a portfolio security or other asset is submitted for review and ratification (if appropriate) to the Valuation Committee and the Board at the next regularly scheduled meeting.
“Fair value” is defined as the price the Portfolio would reasonably expect to receive upon selling an asset or liability in an orderly transaction to an independent buyer in the principal or most advantageous market for the asset or liability. Fair value measurements are determined within a framework that establishes a three-tier hierarchy that maximizes the use of observable market data and minimizes the use of unobservable inputs to establish a classification of fair value measurements for disclosure purposes. “Inputs” refer broadly to the assumptions that market participants would use in pricing the asset or liability, including assumptions about risk, such as the risk inherent in a particular valuation technique used to measure fair value using a pricing model and/or the risk inherent in the inputs for the valuation technique. Inputs may be observable or unobservable. Observable inputs reflect the assumptions market participants would use in pricing the asset or liability based on market data obtained from sources independent of the Portfolio. Unobservable inputs reflect the Portfolio’s own assumptions about the assumptions market participants would use in pricing the asset or liability based on the information available. The inputs or methodology used for valuing assets or liabilities may not be an indication of the risks associated with investing in those assets or liabilities. The three-tier hierarchy of inputs is summarized below.
| • | | Level 1—quoted prices in active markets for an identical asset or liability |
| • | | Level 2—other significant observable inputs (including quoted prices for a similar asset or liability in active markets, interest rates and yield curves, prepayment speeds, credit risk, etc.) |
| • | | Level 3—significant unobservable inputs (including the Portfolio’s own assumptions about the assumptions that market participants would use in measuring fair value of an asset or liability) |
| | |
| 16 | | MainStay VP Mellon Natural Resources Portfolio |
The level of an asset or liability within the fair value hierarchy is based on the lowest level of an input, both individually and in the aggregate, that is significant to the fair value measurement. The aggregate value by input level of the Portfolio’s assets and liabilities as of June 30, 2020 is included at the end of the Portfolio of Investments.
The Portfolio may use third-party vendor evaluations, whose prices may be derived from one or more of the following standard inputs, among others:
| | |
• Broker/dealer quotes | | • Benchmark securities |
• Two-sided markets | | • Reference data (corporate actions or material event notices) |
• Bids/offers | | • Monthly payment information |
• Industry and economic events | | • Reported trades |
An asset or liability for which market values cannot be measured using the methodologies described above is valued by methods deemed reasonable in good faith by the Valuation Committee, following the procedures established by the Board, to represent fair value. Under these procedures, the Portfolio generally uses a market-based approach which may use related or comparable assets or liabilities, recent transactions, market multiples, book values and other relevant information. The Portfolio may also use an income-based valuation approach in which the anticipated future cash flows of the asset or liability are discounted to calculate fair value. Discounts may also be applied due to the nature and/or duration of any restrictions on the disposition of the asset or liability. Fair value represents a good faith approximation of the value of a security. Fair value determinations involve the consideration of a number of subjective factors, an analysis of applicable facts and circumstances and the exercise of judgment. As a result, it is possible that the fair value for a security determined in good faith in accordance with the Portfolio’s valuation procedures may differ from valuations for the same security determined by other funds using their own valuation procedures. Although the Portfolio’s valuation procedures are designed to value a security at the price the Portfolio may reasonably expect to receive upon the security’s sale in an orderly transaction, there can be no assurance that any fair value determination thereunder would, in fact, approximate the amount that the Portfolio would actually realize upon the sale of the security or the price at which the security would trade if a reliable market price were readily available. During the six-month period ended June 30, 2020, there were no material changes to the fair value methodologies.
Securities which may be valued in this manner include, but are not limited to: (i) a security for which trading has been halted or suspended; (ii) a debt security that has recently gone into default and for which there is not a current market quotation; (iii) a security of an issuer that has entered into a restructuring; (iv) a security that has been delisted from a national exchange; (v) a security for which the market price is not readily available from a third-party pricing source or, if so provided, does not, in the opinion of the Manager or the Subadvisor, reflect the security’s market value; (vi) a security subject to trading collars for which no or limited trading takes place; and (vii) a security whose principal market has been temporarily closed at a time when, under normal conditions, it would be open. Securities valued in this manner are generally categorized as Level 3 in the hierarchy. As of June 30, 2020, no securities held by the Portfolio were fair valued in such a manner.
Certain securities held by the Portfolio may principally trade in foreign markets. Events may occur between the time the foreign markets close and the time at which the Portfolio’s NAV is calculated. These events may include, but are not limited to, situations relating to a single issuer in a market sector, significant fluctuations in U.S. or foreign markets, natural disasters, armed conflicts, governmental actions or other developments not tied directly to the securities markets. Should the Manager or the Subadvisor conclude that such events may have affected the accuracy of the last price of such securities reported on the local foreign market, the Subcommittee may, pursuant to procedures adopted by the Board, adjust the value of the local price to reflect the estimated impact on the price of such securities as a result of such events. In this instance, securities are generally categorized as Level 3 in the hierarchy. Additionally, certain foreign equity securities are also fair valued whenever the movement of a particular index exceeds certain thresholds. In such cases, the securities are fair valued by applying factors provided by a third-party vendor in accordance with valuation procedures adopted by the Board and are generally categorized as Level 2 in the hierarchy. As of June 30, 2020, securities that were fair valued in such a manner are shown in the Portfolio of Investments.
Equity securities are valued at the last quoted sales prices as of the close of regular trading on the relevant exchange on each valuation date. Securities that are not traded on the valuation date are valued at the mean of the last quoted bid and ask prices. Prices are normally taken from the principal market in which each security trades. These securities are generally categorized as Level 1 in the hierarchy.
Investments in mutual funds, including money market funds, are valued at their respective NAVs as of the close of the Exchange on the valuation date. These securities are generally categorized as Level 1 in the hierarchy.
Temporary cash investments acquired in excess of 60 days to maturity at the time of purchase are valued using the latest bid prices or using valuations based on a matrix system (which considers such factors as security prices, yields, maturities and ratings), both as furnished by independent pricing services. Temporary cash investments that mature in 60 days or less at the time of purchase (“Short-Term Investments”) are valued using the amortized cost method of valuation, unless the use of such method would be inappropriate. The amortized cost method involves valuing a security at its cost on the date of purchase and thereafter assuming a constant amortization to maturity of the difference between such cost and the value on maturity date. Amortized cost approximates the current fair value of a security. Securities valued using the amortized cost method are not valued using quoted prices in an active market and are generally categorized as Level 2 in the hierarchy.
The information above is not intended to reflect an exhaustive list of the methodologies that may be used to value portfolio investments. The valuation procedures permit the use of a variety of valuation methodologies in connection with valuing portfolio investments. The methodology used for a specific type of investment may vary based on the market data available or other considerations. The methodologies summarized above may not represent the specific means by which portfolio investments are valued on any particular business day.
(B) Income Taxes. The Portfolio’s policy is to comply with the requirements of the Internal Revenue Code of 1986, as amended (the
Notes to Financial Statements (Unaudited) (continued)
“Internal Revenue Code”), applicable to regulated investment companies and to distribute all of its taxable income to the shareholders of the Portfolio within the allowable time limits.
The Manager evaluates the Portfolio’s tax positions to determine if the tax positions taken meet the minimum recognition threshold in connection with accounting for uncertainties in income tax positions taken or expected to be taken for the purposes of measuring and recognizing tax liabilities in the financial statements. Recognition of tax benefits of an uncertain tax position is permitted only to the extent the position is “more likely than not” to be sustained assuming examination by taxing authorities. The Manager analyzed the Portfolio’s tax positions taken on federal, state and local income tax returns for all open tax years (for up to three tax years) and has concluded that no provisions for federal, state and local income tax are required in the Portfolio’s financial statements. The Portfolio’s federal, state and local income tax and federal excise tax returns for tax years for which the applicable statutes of limitations have not expired are subject to examination by the Internal Revenue Service and state and local departments of revenue.
(C) Foreign Taxes. The Portfolio may be subject to foreign taxes on income and other transaction-based taxes imposed by certain countries in which it invests. A portion of the taxes on gains on investments or currency purchases/repatriation may be reclaimable. The Portfolio will accrue such taxes and reclaims as applicable, based upon its current interpretation of tax rules and regulations that exist in the markets in which it invests.
The Portfolio may be subject to taxation on realized capital gains, repatriation proceeds and other transaction-based taxes imposed by certain countries in which it invests. The Portfolio will accrue such taxes as applicable based upon its current interpretation of tax rules and regulations that exist in the market in which it invests. Capital gains taxes relating to positions still held are reflected as a liability in the Statement of Assets and Liabilities, as well as an adjustment to the Portfolio’s net unrealized appreciation (depreciation). Taxes related to capital gains realized, if any, are reflected as part of net realized gain (loss) in the Statement of Operations. Changes in tax liabilities related to capital gains taxes on unrealized investment gains, if any, are reflected as part of the change in net unrealized appreciation (depreciation) on investments in the Statement of Operations. Transaction-based charges are generally assessed as a percentage of the transaction amount.
(D) Dividends and Distributions to Shareholders. Dividends and distributions are recorded on the ex-dividend date. The Portfolio intends to declare and pay dividends from net investment income and distributions from net realized capital and currency gains, if any, at least annually. Unless a shareholder elects otherwise, all dividends and distributions are reinvested at NAV in the same class of shares of the Portfolio. Dividends and distributions to shareholders are determined in accordance with federal income tax regulations and may differ from determinations using GAAP.
(E) Security Transactions and Investment Income. The Portfolio records security transactions on the trade date. Realized gains and losses on security transactions are determined using the identified cost method. Dividend income is recognized on the ex-dividend date, net of any foreign tax withheld at the source, and interest income is accrued as earned using the effective interest rate method. Distributions
received from real estate investment trusts may be classified as dividends, capital gains and/or return of capital. Discounts and premiums on securities purchased for the Portfolio are accreted and amortized, respectively, on the effective interest rate method.
(F) Expenses. Expenses of the Fund are allocated to the individual Portfolios in proportion to the net assets of the respective Portfolios when the expenses are incurred, except where direct allocations of expenses can be made. The expenses borne by the Portfolio, including those of related parties to the Portfolio, are shown in the Statement of Operations.
Additionally, the Portfolio may invest in mutual funds, which are subject to management fees and other fees that may cause the costs of investing in mutual funds to be greater than the costs of owning the underlying securities directly. These indirect expenses of mutual funds are not included in the amounts shown as expenses in the Portfolio’s Statement of Operations or in the expense ratios included in the Financial Highlights.
(G) Use of Estimates. In preparing financial statements in conformity with GAAP, the Manager makes estimates and assumptions that affect the reported amounts and disclosures in the financial statements. Actual results could differ from those estimates.
(H) Repurchase Agreements. The Portfolio may enter into repurchase agreements (i.e., buy a security from another party with the agreement that it will be sold back in the future) to earn income. The Portfolio may enter into repurchase agreements only with counterparties, usually financial institutions, that are deemed by the Manager or the Subadvisor to be creditworthy, pursuant to guidelines established by the Board. During the term of any repurchase agreement, the Manager or the Subadvisor will continue to monitor the creditworthiness of the counterparty. Under the 1940 Act, repurchase agreements are considered to be collateralized loans by the Portfolio to the counterparty secured by the securities transferred to the Portfolio.
Repurchase agreements are subject to counterparty risk, meaning the Portfolio could lose money by the counterparty’s failure to perform under the terms of the agreement. The Portfolio mitigates this risk by ensuring the repurchase agreement is collateralized by cash, U.S. government securities, fixed income securities and/or other securities. The collateral is held by the Portfolio’s custodian and valued daily on a mark to market basis to determine if the value, including accrued interest, exceeds the repurchase price. In the event of the counterparty’s default on the obligation to repurchase, the Portfolio has the right to liquidate the collateral and apply the proceeds in satisfaction of the obligation. Under certain circumstances, such as in the event of default or bankruptcy by the counterparty, realization and/or retention of the collateral may be limited or subject to delay, to legal proceedings and possible realized loss to the Portfolio. As of June 30, 2020, the Portfolio did not hold any repurchase agreements.
(I) Foreign Currency Transactions. The Portfolio’s books and records are maintained in U.S. dollars. Prices of securities denominated in foreign currency amounts are translated into U.S. dollars at the mean between the buying and selling rates last quoted by any major U.S. bank at the following dates:
(i) market value of investment securities, other assets and liabilities — at the valuation date; and
| | |
| 18 | | MainStay VP Mellon Natural Resources Portfolio |
(ii) purchases and sales of investment securities, income and expenses — at the date of such transactions.
The assets and liabilities that are denominated in foreign currency amounts are presented at the exchange rates and market values at the close of the period. The realized and unrealized changes in net assets arising from fluctuations in exchange rates and market prices of securities are not separately presented.
Net realized gain (loss) on foreign currency transactions represents net currency gains or losses realized as a result of differences between the amounts of securities sale proceeds or purchase cost, dividends, interest and withholding taxes as recorded on the Portfolio’s books, and the U.S. dollar equivalent amount actually received or paid. Net currency gains or losses from valuing such foreign currency denominated assets and liabilities, other than investments at valuation date exchange rates, are reflected in unrealized foreign exchange gains or losses.
(J) Securities Lending. In order to realize additional income, the Portfolio may engage in securities lending, subject to the limitations set forth in the 1940 Act and relevant guidance by the staff of the Securities and Exchange Commission (“SEC”). If the Portfolio engages in securities lending, the Portfolio will lend through its custodian, currently State Street Bank and Trust Company (“State Street”), acting as securities lending agent on behalf of the Portfolio. Under the current arrangement, State Street will manage the Portfolio’s collateral in accordance with the securities lending agency agreement between the Portfolio and State Street, and indemnify the Portfolio against counterparty risk. The loans will be collateralized by cash (which may be invested in a money market fund) and/or non-cash collateral (which may include U.S. Treasury securities and/or U.S. government agency securities issued or guaranteed by the United States government or its agencies or instrumentalities) at least equal at all times to the market value of the securities loaned. The Portfolio bears the risk of delay in recovery of, or loss of rights in, the securities loaned. The Portfolio may also record a realized gain or loss on securities deemed sold due to a borrower’s inability to return securities on loan. The Portfolio bears the risk of any loss on investment of cash collateral. The Portfolio will receive compensation for lending its securities in the form of fees or it will retain a portion of interest earned on the investment of any cash collateral. The Portfolio will also continue to receive interest and dividends on the securities loaned and any gain or loss in the market price of the securities loaned that may occur during the term of the loan will be for the account of the Portfolio. Income earned from securities lending activities, if any, is reflected in the Statement of Operations. As of June 30, 2020, the Portfolio had securities on loan with an aggregate market value of $3,625,553 and received cash collateral, which was invested into the State Street Navigator Securities Lending Government Money Market Portfolio, with a value of $3,752,925.
(K) Foreign Securities Risk. The Portfolio may invest in foreign securities, which carry certain risks that are in addition to the usual risks inherent in domestic securities. These risks include those resulting from currency fluctuations, future adverse political or economic developments and possible imposition of currency exchange blockages or other foreign governmental laws or restrictions. These risks are likely to be greater in emerging markets than in developed markets. The ability of issuers of securities held by the Portfolio to meet their obligations may be affected
by, among other things, economic or political developments in a specific country, industry or region.
(L) Indemnifications. Under the Fund’s organizational documents, its officers and trustees are indemnified against certain liabilities that may arise out of performance of their duties to the Fund. Additionally, in the normal course of business, the Portfolio enters into contracts with third-party service providers that contain a variety of representations and warranties and that may provide general indemnifications. The Portfolio’s maximum exposure under these arrangements is unknown, as this would involve future claims that may be made against the Portfolio that have not yet occurred. The Manager believes that the risk of loss in connection with these potential indemnification obligations is remote. However, there can be no assurance that material liabilities related to such obligations will not arise in the future, which could adversely impact the Portfolio.
Note 3—Fees and Related Party Transactions
(A) Manager and Subadvisor. New York Life Investments, a registered investment adviser and an indirect, wholly-owned subsidiary of New York Life, serves as the Portfolio’s Manager, pursuant to an Amended and Restated Management Agreement (“Management Agreement”). The Manager provides offices, conducts clerical, recordkeeping and bookkeeping services, and keeps most of the financial and accounting records required to be maintained by the Portfolio. Except for the portion of salaries and expenses that are the responsibility of the Portfolio, the Manager pays the salaries and expenses of all personnel affiliated with the Portfolio and certain operational expenses of the Portfolio. The Portfolio reimburses New York Life Investments in an amount equal to the portion of the compensation of the Chief Compliance Officer attributable to the Portfolio. Mellon Investments Corporation (“Mellon” or the “Subadvisor”), a registered investment adviser, serves as Subadvisor to the Portfolio and is responsible for the day-to-day portfolio management of the Portfolio. Pursuant to the terms of a Subadvisory Agreement (“Subadvisory Agreement”) between New York Life Investments and Mellon, New York Life Investments pays for the services of the Subadvisor.
The Fund, on behalf of the Portfolio, pays New York Life Investments in its capacity as the Portfolio’s investment manager and administrator, pursuant to the Management Agreement, a monthly fee for the services performed and the facilities furnished at an annual rate of the Portfolio’s average daily net assets as follows: 0.79% up to $1 billion; and 0.78% in excess of $1 billion. During the six-month period ended June 30, 2020, the effective management fee rate was 0.79%.
During the six-month period ended June 30, 2020, New York Life Investments earned fees from the Portfolio in the amount of $788,014 and paid the Subadvisor in the amount of $386,415.
State Street provides sub-administration and sub-accounting services to the Portfolio pursuant to an agreement with New York Life Investments. These services include calculating the daily NAV of the Portfolio, maintaining the general ledger and sub-ledger accounts for the calculation of the Portfolio’s NAV and assisting New York Life Investments in conducting various aspects of the Portfolio’s administrative operations. For providing these services to the Portfolio, State Street is compensated by New York Life Investments.
Notes to Financial Statements (Unaudited) (continued)
Pursuant to an agreement between the Fund and New York Life Investments, New York Life Investments is responsible for providing or procuring certain regulatory reporting services for the Portfolio. The
Portfolio will reimburse New York Life Investments for the actual costs incurred by New York Life Investments in connection with providing or procuring these services for the Portfolio.
(B) Investments in Affiliates (in 000’s). During the six-month period ended June 30, 2020, purchases and sales transactions, income earned from investments and shares held of investment companies managed by New York Life Investments or its affiliates were as follows:
| | | | | | | | | | | | | | | | | | |
Affiliated Investment
Company | | Value,
Beginning
of Period | | Purchases
at Cost | | Proceeds
from
Sales | | Net Realized
Gain/(Loss)
on Sales | | Change in
Unrealized
Appreciation/
(Depreciation) | | Value,
End of
Period | | Dividend
Income | | Other
Distributions | | Shares
End of
Period |
| | | | | | | | | |
MainStay U.S. Government Liquidity Fund | | $1,791 | | $23,390 | | $(25,181) | | $— | | $— | | $— | | $6 | | $— | | — |
Note 4—Federal Income Tax
As of June 30, 2020, the cost and unrealized appreciation (depreciation) of the Portfolio’s investment portfolio, including applicable derivative contracts and other financial instruments, as determined on a federal income tax basis, was as follows:
| | | | | | | | | | | | | | | | |
| | | Federal Tax
Cost | | | Gross
Unrealized
Appreciation | | | Gross
Unrealized
(Depreciation) | | | Net
Unrealized
Appreciation/
(Depreciation) | |
| | | | |
Investments in
Securities | | $ | 218,982,154 | | | $ | 21,804,044 | | | $ | (37,377,853 | ) | | $ | (15,573,809 | ) |
As of December 31, 2019, for federal income tax purposes, capital loss carryforwards of $229,081,157, as shown in the table below, were available to the extent provided by the regulations to offset future realized gains of the Portfolio through the years indicated. Accordingly, no capital gains distributions are expected to be paid to shareholders until net gains have been realized in excess of such amounts.
| | | | |
Capital Loss
Available Through | | Short-Term
Capital Loss
Amounts (000’s) | | Long-Term
Capital Loss
Amounts (000’s) |
| | |
| Unlimited | | $31,324 | | $197,757 |
During the year ended December 31, 2019, the tax character of distributions paid as reflected in the Statements of Changes in Net Assets was as follows:
| | |
2019 |
Tax-Based
Distributions from Ordinary
Income | | Tax-Based
Distributions from Long-Term
Gains |
| |
| $1,880,547 | | $— |
Note 5—Custodian
State Street is the custodian of cash and securities held by the Portfolio. Custodial fees are charged to the Portfolio based on the Portfolio’s net assets and/or the market value of securities held by the Portfolio and the number of certain transactions incurred by the Portfolio.
Note 6—Line of Credit
The Portfolio and certain other funds managed by New York Life Investments maintain a line of credit with a syndicate of banks in order to secure a source of funds for temporary purposes to meet unanticipated or excessive redemption requests.
Effective July 28, 2020, under the credit agreement (the “Credit Agreement”), the aggregate commitment amount is $600,000,000 with an additional uncommitted amount of $100,000,000. The commitment fee is an annual rate of 0.15% of the average commitment amount payable quarterly, regardless of usage, to JP Morgan Chase Bank NA, who serves as the agent to the syndicate. The commitment fee is allocated among the Portfolio and certain other funds managed by New York Life Investments based upon their respective net assets and other factors. Interest on any revolving credit loan is charged based upon the Federal Funds Rate or the one-month London Interbank Offered Rate (“LIBOR”), whichever is higher. The Credit Agreement expires on July 27, 2021, although the Portfolio, certain other funds managed by New York Life Investments and the syndicate of banks may renew the Credit Agreement for an additional year on the same or different terms or enter into a credit agreement with a different syndicate of banks. Prior to July 28, 2020, the aggregate commitment amount and the commitment fee were the same as those under the current Credit Agreement, but State Street served as agent to the syndicate. During the six-month period ended June 30, 2020, there were no borrowings made or outstanding with respect to the Portfolio under the Credit Agreement or the credit agreement for which State Street served as agent.
Note 7—Interfund Lending Program
Pursuant to an exemptive order issued by the SEC, the Portfolio, along with certain other funds managed by New York Life Investments, may participate in an interfund lending program. The interfund lending program provides an alternative credit facility that permits the Portfolio and certain other funds managed by New York Life Investments to lend or borrow money for temporary purposes directly to or from one another subject to the conditions of the exemptive order. During the six-month period ended June 30, 2020, there were no interfund loans made or outstanding with respect to the Portfolio.
| | |
| 20 | | MainStay VP Mellon Natural Resources Portfolio |
Note 8—Purchases and Sales of Securities (in 000’s)
During the six-month period ended June 30, 2020, purchases and sales of securities, other than short-term securities, were $41,331 and $42,122, respectively.
Note 9—Capital Share Transactions
Transactions in capital shares for the six-month period ended June 30, 2020 and the year ended December 31, 2019, were as follows:
| | | | | | | | |
Initial Class | | Shares | | | Amount | |
Six-month period ended June 30, 2020: | | | | | | | | |
| | |
Shares sold | | | 3,825,207 | | | $ | 16,725,523 | |
| | |
Shares redeemed | | | (3,756,534 | ) | | | (19,438,165 | ) |
| | | | | | | | |
| | |
Net increase (decrease) | | | 68,673 | | | $ | (2,712,642 | ) |
| | | | | | | | |
Year ended December 31, 2019: | | | | | | | | |
| | |
Shares sold | | | 3,224,691 | | | $ | 18,704,335 | |
| | |
Shares issued to shareholders in reinvestment of distributions | | | 333,519 | | | | 1,880,547 | |
| | |
Shares redeemed | | | (8,080,002 | ) | | | (47,694,578 | ) |
| | | | | | | | |
| | |
Net increase (decrease) | | | (4,521,792 | ) | | $ | (27,109,696 | ) |
| | | | | | | | |
Note 10—Recent Accounting Pronouncement
In March 2020, the Financial Accounting Standards Board (“FASB”) issued Accounting Standards Update 2020-04 (“ASU 2020-04”), which provides optional guidance to ease the potential accounting burden associated with transitioning away from LIBOR and other reference rates that are expected to be discontinued. ASU 2020-04 is effective immediately upon release of the update on March 12, 2020 through December 31, 2022. At this time, the Manager is evaluating the implications of certain other provisions of ASU 2020-04 related to new disclosure requirements and any impact on the financial statement disclosures has not yet been determined.
Note 11—Subsequent Events
In connection with the preparation of the financial statements of the Portfolio as of and for the six-month period ended June 30, 2020, events and transactions subsequent to June 30, 2020, through the date the financial statements were issued have been evaluated by the Manager, for possible adjustment and/or disclosure. No subsequent events requiring financial statement adjustment or disclosure have been identified.
Note 12—Other Matters
An outbreak of COVID-19, first detected in December 2019, has developed into a global pandemic and has resulted in travel restrictions, closure of international borders, certain businesses and securities markets, restrictions on securities trading activities, prolonged quarantines, supply chain disruptions, and lower consumer demand, as well as general concern and uncertainty. The continued impact of COVID-19 is uncertain and could further adversely affect the global economy, national economies, individual issuers and capital markets in unforeseeable ways and result in a substantial and extended economic downturn. Developments that disrupt global economies and financial markets, such as COVID-19, may magnify factors that affect the Portfolio’s performance.
Discussion of the Operation and Effectiveness of the Portfolio’s
Liquidity Risk Management Program (Unaudited)
In compliance with Rule 22e-4 under the Investment Company Act of 1940, as amended (the “Liquidity Rule”), the Portfolio has adopted and implemented a liquidity risk management program (the “Program”), which New York Life Investment Management LLC believes is reasonably designed to assess and manage the Portfolio’s liquidity risk. The Board designated New York Life Investment Management LLC as administrator of the Program (the “Administrator”). The Administrator has established a Liquidity Risk Management Committee to assist the Administrator in the implementation and day-to-day administration of the Program and to otherwise support the Administrator in fulfilling its responsibilities under the Program.
At a meeting of the Board held on March 11, 2020, the Administrator provided the Board with a written report addressing the Program’s operation, adequacy and effectiveness of implementation for the period from December 1, 2018 through December 31, 2019, as required under the Liquidity Rule. The report noted that the Administrator concluded that (i) the Program operated effectively to assess and manage the Portfolio’s liquidity risk, (ii) the Program has been adequately and effectively implemented to monitor and, as applicable, respond to the Portfolio’s liquidity developments and (iii) the Portfolio’s investment strategy continues to be appropriate for an open-end portfolio.
In accordance with the Program, the Portfolio’s liquidity risk is assessed no less frequently than annually taking into consideration certain factors, as applicable, such as (i) investment strategy and liquidity of portfolio investments, (ii) short-term and long-term cash flow projections and (iii) holdings of cash and cash equivalents and borrowing arrangements and other funding sources. Certain factors are considered under both normal and reasonably foreseeable stressed conditions.
Each Portfolio portfolio investment is classified into one of four liquidity categories. The classification is based on a determination of the number of days it is reasonably expected to take to convert the investment into cash, or sell or dispose of the investment, in current market conditions without significantly changing the market value of the investment. The Administrator has delegated liquidity classification determinations to the Portfolio’s subadvisor, subject to appropriate oversight by the Administrator, and classification determinations are made by taking into account the Portfolio’s reasonably anticipated trade size, various market, trading and investment-specific considerations, as well as market depth, and, in certain cases, third-party vendor data.
The Liquidity Rule requires portfolios that do not primarily hold assets that are highly liquid investments to adopt a minimum amount of net assets that must be invested in highly liquid investments that are assets (an “HLIM”). In addition, the Liquidity Rule limits a portfolio’s investments in illiquid investments. Specifically, the Liquidity Rule prohibits acquisition of illiquid investments if doing so would result in a portfolio holding more than 15% of its net assets in illiquid investments that are assets. The Program includes provisions reasonably designed to determine, periodically review and comply with the HLIM requirement, as applicable, and to comply with the 15% limit on illiquid investments.
| | |
| 22 | | MainStay VP Mellon Natural Resources Portfolio |
Proxy Voting Policies and Procedures
and Proxy Voting Record
A description of the policies and procedures that New York Life Investments uses to vote proxies related to the Portfolio’s securities is available free of charge upon request (i) by calling 800-598-2019; (ii) by visiting New York Life Investments’ website at https://www.nylinvestments.com/mainstay/products-and-performance/mainstay-vp-funds-trust; or (iii) by visiting the SEC’s website at www.sec.gov.
The Portfolio is required to file with the SEC its proxy voting record for the 12-month period ending June 30 on Form N-PX. The Portfolio’s most recent Form N-PX or proxy voting record is available free of charge upon request (i) by calling 800-598-2019; (ii) by visiting New York Life Investments’ website at https://www.nylinvestments.com/mainstay/products-and-performance/mainstay-vp-funds-trust; or (iii) by visiting the SEC’s website at www.sec.gov.
Shareholder Reports and Quarterly
Portfolio Disclosure
The Portfolio is required to file its complete schedule of portfolio holdings with the SEC 60 days after its first and third fiscal quarter on Form N-PORT. The Portfolio’s holdings report is available free of charge upon request by calling 800-598-2019 or by visiting the SEC’s website at www.sec.gov.
MainStay VP Portfolios
MainStay VP offers a wide range of Portfolios. The full array of MainStay VP offerings is listed here, with information about the manager, subadvisors, legal counsel, and independent registered public accounting firm.
Equity Portfolios
MainStay VP Emerging Markets Equity Portfolio
MainStay VP Epoch U.S. Equity Yield Portfolio
MainStay VP Fidelity Institutional AM® Utilities Portfolio†
MainStay VP MacKay Common Stock Portfolio
MainStay VP MacKay Growth Portfolio
MainStay VP MacKay International Equity Portfolio
MainStay VP MacKay Mid Cap Core Portfolio
MainStay VP MacKay S&P 500 Index Portfolio
MainStay VP MacKay Small Cap Core Portfolio
MainStay VP Mellon Natural Resources Portfolio
MainStay VP Small Cap Growth Portfolio
MainStay VP T. Rowe Price Equity Income Portfolio
MainStay VP Winslow Large Cap Growth Portfolio
Mixed Asset Portfolios
MainStay VP Balanced Portfolio
MainStay VP Income Builder Portfolio
MainStay VP Janus Henderson Balanced Portfolio
MainStay VP MacKay Convertible Portfolio
Income Portfolios
MainStay VP Bond Portfolio
MainStay VP Floating Rate Portfolio
MainStay VP Indexed Bond Portfolio
MainStay VP MacKay Government Portfolio
MainStay VP MacKay High Yield Corporate Bond Portfolio
MainStay VP MacKay Unconstrained Bond Portfolio
MainStay VP PIMCO Real Return Portfolio
Money Market
MainStay VP U.S. Government Money Market Portfolio
Alternative
MainStay VP CBRE Global Infrastructure Portfolio
MainStay VP IQ Hedge Multi-Strategy Portfolio
Asset Allocation Portfolios
MainStay VP Conservative Allocation Portfolio
MainStay VP Growth Allocation Portfolio
MainStay VP Moderate Allocation Portfolio
MainStay VP Moderate Growth Allocation Portfolio
Manager
New York Life Investment Management LLC
New York, New York
Subadvisors
Brown Advisory LLC
Baltimore, Maryland
Candriam Belgium S.A.*
Brussels, Belgium
CBRE Clarion Securities LLC
Radnor, Pennsylvania
Epoch Investment Partners, Inc.
New York, New York
FIAM LLC
Smithfield, Rhode Island
IndexIQ Advisors LLC*
New York, New York
Janus Capital Management LLC
Denver, Colorado
MacKay Shields LLC*
New York, New York
Mellon Investments Corporation
Boston, Massachusetts
NYL Investors LLC*
New York, New York
Pacific Investment Management Company LLC
Newport Beach, California
Segall Bryant & Hamill, LLC
Chicago, Illinois
T. Rowe Price Associates, Inc.
Baltimore, Maryland
Winslow Capital Management, LLC
Minneapolis, Minnesota
Distributor
NYLIFE Distributors LLC*
Jersey City, New Jersey
Custodian
State Street Bank and Trust Company
Boston, Massachusetts
Independent Registered Public Accounting Firm
PricewaterhouseCoopers LLP
New York, New York
Legal Counsel
Dechert LLP
Washington, District of Columbia
Some Portfolios may not be available in all products.
| † | Fidelity Institutional AM is a registered trade mark of FMR LLC. Used with permission. |
| * | An affiliate of New York Life Investment Management LLC |
Not part of the Semiannual Report
2020 Semiannual Report
This report is for the general information of New York Life Variable Annuities and NYLIAC Variable Universal Life Insurance Products policyowners. It must be preceded or accompanied by the appropriate product(s) and funds prospectuses if it is given to anyone who is not an owner of a New York Life variable annuity policy or a NYLIAC Variable Universal Life Insurance Product. This report does not offer for sale or solicit orders to purchase securities.
The performance data quoted in this report represents past performance. Past performance is no guarantee of future results. Due to market volatility and other factors, current performance may be lower or higher than the figures shown. The most recent month-end performance summary for your variable annuity or variable life policy is available by calling 800-598-2019 and is updated periodically on www.newyorklife.com.
The New York Life Variable Annuities and NYLIAC Variable Universal Life Insurance Products are issued by New York Life Insurance and Annuity Corporation (a Delaware Corporation) and distributed by NYLIFE Distributors LLC (Member FINRA/SIPC).
New York Life Insurance Company
New York Life Insurance and Annuity Corporation (NYLIAC) (A Delaware Corporation)
51 Madison Avenue, Room 551
New York, NY 10010
www.newyorklife.com
Printed on recycled paper
nylinvestments.com
NYLIFE Distributors LLC, 30 Hudson Street, Jersey City, NJ 07302
New York Life Investment Management LLC is the investment manager to the MainStay VP Funds Trust
©2020 by NYLIFE Distributors LLC. All rights reserved.
You may obtain copies of the Prospectus and the Statement of Additional Information free of charge, upon request, by calling toll-free 800-598-2019 or writing to New York Life Insurance and Annuity Corporation, 51 Madison Avenue, New York, NY 10010.
| | | | |
| Not FDIC Insured | | No Bank Guarantee | | May Lose Value |
| | | | |
| 1781648 | | | | MSVPVEG10-08/20 (NYLIAC) NI533 |
MainStay VP Allocation Portfolios
Message from the President and Semiannual Report
Unaudited | June 30, 2020
MainStay VP Conservative Allocation Portfolio
MainStay VP Moderate Allocation Portfolio
MainStay VP Moderate Growth Allocation Portfolio
MainStay VP Growth Allocation Portfolio
Beginning on January 1, 2021, as permitted by regulations adopted by the Securities and Exchange Commission, paper copies of the MainStay VP Portfolio annual and semi-annual shareholder reports may no longer be sent by mail, unless you specifically request paper copies of the reports from the insurance company that offers your policy. Instead, the reports will be made available online, and you will be notified by mail each time a report is posted and provided with a website link to access the report. Instructions for requesting paper copies will be provided by your insurance company.
If you already elected to receive shareholder reports electronically, you will not be affected by this change and you need not take any action. At any time, you may elect to receive reports and other communications from the insurance company electronically by following the instructions provided by the insurance company.
You may elect to receive all future shareholder reports in paper form free of charge. You can inform the insurance company that you wish to receive paper copies of reports by following the instructions provided by the insurance company. Your election to receive reports in paper form will apply to all portfolio companies available under your contract.
| | | | | | | | |
| Not FDIC/NCUA Insured | | Not a Deposit | | May Lose Value | | No Bank Guarantee | | Not Insured by Any Government Agency |

This page intentionally left blank
Message from the President
High levels of volatility shook financial markets in response to the COVID-19 pandemic and an abrupt decline in global economic activity during the six months ended June 30, 2020.
Markets entered 2020 riding strong fourth quarter performance and an economic expansion of historic longevity. Most broad stock and bond indices began to dip in late February as growing numbers of COVID-19 cases were seen in hotspots around the world. On March 11, 2020, the World Health Organization acknowledged that the disease had reached pandemic proportions, with over 80,000 identified cases in China, thousands in Italy, South Korea and the United States, and more in dozens of additional countries. Governments and central banks pledged trillions of dollars to address the mounting economic and public health crisis; however, “stay-at-home” orders and other restrictions on non-essential activity caused global economic activity to slow. Most stocks and bonds lost significant ground in this challenging environment, with equities declining by roughly a third and the yield on high-yield credit indices shooting higher.
Policymakers responded with extraordinary speed to address the situation. In the United States, the Federal Reserve (“Fed”) cut interest rates to near zero and announced unlimited quantitative easing. With help from Treasury, the Fed later rolled out a series of lending facilities to directly support market functioning. In late March, the Federal government declared a national emergency; Congress passed, and the President signed, a $2 trillion CARES Act (The Coronavirus Aid, Relief, and Economic Security Act), with the promise of further assistance for consumers and businesses to come. This enormous wave of policy support helped fuel a rapid recovery in market pricing as stocks bounced back and credit spreads narrowed. Some states rushed to ease restrictions on travel and social gatherings, further fueling optimism that the effects of the pandemic might prove short lived. However, the final weeks of the reporting period saw infection rates beginning to rise in some of the first states to reopen, raising concerns that a second round of restrictive government policies might prove necessary, once again stifling economic activity.
Despite all the market volatility, the broadly based S&P 500® Index finished the first half of 2020 only slightly below its starting point and the technology-heavy NASDAQ Composite Index posted gains, closing in near record territory. Small-cap stocks tended to trail their large cap counterparts, as illustrated by the Russell 2000® Index’s loss of approximately 15%, while value-oriented stocks lagged growth-oriented issues. From a global perspective, U.S. stocks generally outperformed international equities, with emerging markets hit particularly hard by the flight from risk.
Fixed-income markets also experienced unusually high levels of volatility. Recognized safe havens, such as U.S. government bonds, attracted increased investment, driving yields lower and prices higher, positioning long-term Treasury bonds to deliver particularly strong gains. Investment-grade corporate bonds lost value in March before recovering in the closing months of the reporting period, while relatively speculative high-yield credit faced the brunt of risk-off sentiment. Emerging market debt underperformed most other bonds types as investors sought to minimize currency and sovereign risks.
Today, as we at New York Life Investments continue to track the ongoing health crisis and its financial ramifications, we are particularly mindful of the people at the heart of our enterprise—our colleagues and valued clients. By taking appropriate steps to minimize community spread of COVID-19 within our organization, we strive to safeguard the health of our investment professionals so they can continue to provide you, as a MainStay investor, with world class investment solutions in this rapidly evolving environment.
Sincerely,

Kirk C. Lehneis
President
The opinions expressed are as of the date of this report and are subject to change. There is no guarantee that any forecast made will come to pass. This material does not constitute investment advice and is not intended as an endorsement of any specific investment. Past performance is no guarantee of future results.
Not part of the Semiannual Report
Table of Contents
Investors should refer to the Portfolio’s Summary Prospectus and/or Prospectus and consider the Portfolio’s investment objectives, strategies, risks, charges and expenses carefully before investing. The Summary Prospectus and/or Prospectus contain this and other information about the Portfolio. You may obtain copies of the Portfolio’s Summary Prospectus and/or the Prospectus and the Statement of Additional Information free of charge, upon request, by calling toll-free 800-598-2019, by writing to New York Life Insurance and Annuity Corporation, 51 Madison Avenue, Room 251, New York, New York 10010 or by sending an email to MainStayShareholdersServices@nylim.com. These documents are also available at nylinvestments.com/vpdocuments. Please read the Summary Prospectus and/or Prospectus carefully before investing. MainStay VP Funds Trust portfolios are separate account options which are purchased through a variable insurance or variable annuity contract.
MainStay VP Conservative Allocation Portfolio
Investment and Performance Comparison1 (Unaudited)
Performance data quoted represents past performance. Past performance is no guarantee of future results. Because of market volatility and other factors, current performance may be lower or higher than the figures shown. Investment return and principal value will fluctuate, and as a result, when shares are redeemed, they may be worth more or less than their original cost. The performance table and graph do not reflect any deduction of sales charges, mortality and expense charges, contract charges, or administrative charges. Please refer to the Performance Summary appropriate for your policy. For performance information current to the most recent month-end, please call 800-598-2019 or visit www.newyorklife.com.
Average Annual Total Returns for the Period-Ended June 30, 2020
| | | | | | | | | | | | | | | | | | | | | | |
| Class | | Inception
Date | | Six Months | | | One Year | | | Five Years | | | Ten Years | | | Gross
Expense
Ratio2 | |
| | | | | | |
| Initial Class Shares | | 2/13/2006 | | | 0.72 | % | | | 5.11 | % | | | 4.38 | % | | | 6.56 | % | | | 0.62 | % |
| Service Class Shares | | 2/13/2006 | | | 0.59 | | | | 4.85 | | | | 4.13 | | | | 6.30 | | | | 0.87 | |
| | | | | | | | | | | | | | | | |
| Benchmark Performance | | Six
Months | | | One
Year | | | Five
Years | | | Ten
Years | |
| | | | |
S&P 500® Index3 | | | –3.08 | % | | | 7.51 | % | | | 10.73 | % | | | 13.99 | % |
MSCI EAFE® Index4 | | | –11.34 | | | | –5.13 | | | | 2.05 | | | | 5.73 | |
Bloomberg Barclays U.S. Aggregate Bond Index5 | | | 6.14 | | | | 8.74 | | | | 4.30 | | | | 3.82 | |
Conservative Allocation Composite Index6 | | | 1.92 | | | | 7.48 | | | | 6.26 | | | | 7.35 | |
Morningstar Allocation—30% to 50% Equity Category Average7 | | | –2.66 | | | | 1.77 | | | | 3.96 | | | | 6.00 | |
| 1. | Performance figures may reflect certain fee waivers and/or expense limitations, without which total returns may have been different. For information on current fee waivers and/or expense limitations (if any), please refer to the Notes to Financial Statements. |
| 2. | The gross expense ratios presented reflect the Portfolio’s “Total Annual Portfolio Operating Expenses” from the most recent Prospectus, as supplemented, and may differ from other expense ratios disclosed in this report. |
| 3. | The S&P 500® Index is the Portfolio’s primary broad-based securities market index for comparison purposes. “S&P 500®” is a trademark of The McGraw-Hill Companies, Inc. The S&P 500® Index is widely regarded as the standard index for measuring large-cap U.S. stock market performance. Results assume reinvestment of all dividends and capital gains. An investment cannot be made directly in an index. |
| 4. | The MSCI EAFE® Index is the Portfolio’s secondary benchmark. The MSCI EAFE® Index consists of international stocks representing the developed world outside of North America. Results assume reinvestment of all dividends and capital gains. An investment cannot be made directly in an index. |
| 5. | The Portfolio has selected the Bloomberg Barclays U.S. Aggregate Bond Index as an additional benchmark. The Bloomberg Barclays U.S. Aggregate |
| | Bond Index is a broad-based benchmark that measures performance of the investment-grade, U.S. dollar-denominated, fixed-rate taxable bond market, including Treasurys, government-related and corporate securities, mortgage-backed securities (agency fixed-rate and hybrid adjustable-rate mortgage pass-throughs), asset-backed securities and commercial mortgage-backed securities. Results assume reinvestment of all dividends and capital gains. An investment cannot be made directly in an index. |
| 6. | The Portfolio has selected the Conservative Allocation Composite Index as an additional benchmark. The Conservative Allocation Composite Index consists of the S&P 500® Index, the MSCI EAFE® Index and the Bloomberg Barclays U.S. Aggregate Bond Index weighted 30%, 10% and 60%, respectively. Results assume reinvestment of all dividends and capital gains. An investment cannot be made directly in an index. |
| 7. | The Morningstar Allocation—30% to 50% Equity Category Average is representative of funds that seek to provide both income and capital appreciation by investing in multiple asset classes, including stocks, bonds, and cash. These funds are dominated by domestic holdings and have equity exposures between 30% and 50%. Results are based on average total returns of similar funds with all dividends and capital gain distributions reinvested. |
Cost in Dollars of a $1,000 Investment in MainStay VP Conservative Allocation Portfolio (Unaudited)
The example below is intended to describe the fees and expenses borne by shareholders during the six-month period from January 1, 2020, to June 30, 2020, and the impact of those costs on your investment.
Example
As a shareholder of the Portfolio you incur two types of costs: (1) transaction costs, including exchange fees and sales charges (loads) on purchases (as applicable), and (2) ongoing costs, including management fees, distribution and/or service (12b-1) fees, and other Portfolio expenses (as applicable). This example is intended to help you understand your ongoing costs (in dollars) of investing in the Portfolio and to compare these costs with the ongoing costs of investing in other mutual funds. The example is based on an investment of $1,000 made at the beginning of the six-month period and held for the entire period from January 1, 2020, to June 30, 2020. Shares are only sold in connection with variable life and annuity contracts and the example does not reflect any contract level or transactional fees or expenses. If these costs had been included, your costs would have been higher.
This example illustrates your Portfolio’s ongoing costs in two ways:
Actual Expenses
The second and third data columns in the table below provide information about actual account values and actual expenses. You may use the information in these columns, together with the amount you invested, to estimate the expenses that you paid during the six months
ended June 30, 2020. Simply divide your account value by $1,000 (for example, an $8,600 account value divided by $1,000 = 8.6), then multiply the result by the number under the heading entitled “Expenses Paid During Period” to estimate the expenses you paid on your account during this period.
Hypothetical Example for Comparison Purposes
The fourth and fifth data columns in the table below provide information about hypothetical account values and hypothetical expenses based on the Portfolio’s actual expense ratio and an assumed rate of return of 5% per year before expenses, which is not the Portfolio’s actual return. The hypothetical account values and expenses may not be used to estimate the actual ending account balances or expenses you paid for the six-month period shown. You may use this information to compare the ongoing costs of investing in the Portfolio with the ongoing costs of investing in other mutual funds. To do so, compare this 5% hypothetical example with the 5% hypothetical examples that appear in the shareholder reports of the other mutual funds.
Please note that the expenses shown in the table are meant to highlight your ongoing costs only and do not reflect any transactional costs, such as exchange fees or sales charges (loads). Therefore, the fourth and fifth data columns of the table are useful in comparing ongoing costs only and will not help you determine the relative total costs of owning different funds. In addition, if these transactional costs were included, your costs would have been higher.
| | | | | | | | | | | | | | | | | | | | | | |
| | | | | | | | | | | | | | | | | | |
| Share Class | | Beginning
Account
Value
1/1/20 | | | Ending Account
Value (Based
on Actual
Returns and
Expenses)
6/30/20 | | | Expenses
Paid
During
Period1 | | | Ending Account
Value (Based
on Hypothetical
5% Annualized
Return and
Actual Expenses)
6/30/20 | | | Expenses
Paid
During
Period1 | | | Net Expense
Ratio
During
Period2 |
| | | | | | |
| Initial Class Shares | | $ | 1,000.00 | | | $ | 1,007.20 | | | $ | 0.15 | | | $ | 1,024.71 | | | $ | 0.15 | | | 0.03% |
| | | | | | |
| Service Class Shares | | $ | 1,000.00 | | | $ | 1,005.90 | | | $ | 1.40 | | | $ | 1,023.47 | | | $ | 1.41 | | | 0.28% |
| 1. | Expenses are equal to the Portfolio’s annualized expense ratio of each class multiplied by the average account value over the period, divided by 366 and multiplied by 182 (to reflect the six-month period). The table above represents the actual expenses incurred during the six-month period. In addition to the fees and expenses which the Portfolio bears directly, it also indirectly bears a pro rata share of the fees and expenses of the Underlying Portfolios/Funds in which it invests. Such indirect expenses are not included in the above-reported expense figures. |
| 2. | Expenses are equal to the Portfolio’s annualized expense ratio to reflect the six-month period. |
| | |
| 6 | | MainStay VP Conservative Allocation Portfolio |
Investment Objectives of Underlying Portfolios/Funds as of June 30, 2020 (Unaudited)

See Portfolio of Investments beginning on page 10 for specific holdings within these categories. The Portfolio’s holdings are subject to change.
Portfolio Management Discussion and Analysis (Unaudited)
Answers to the questions reflect the views of portfolio managers Jae S. Yoon, CFA, Jonathan Swaney, Poul Kristensen, CFA, and Amit Soni, CFA, of New York Life Investments,1 the Portfolio’s Manager.
How did MainStay VP Conservative Allocation Portfolio perform relative to its benchmarks and peers during the six months ended June 30, 2020?
For the six months ended June 30, 2020, MainStay VP Conservative Allocation Portfolio returned 0.72% for Initial Class shares and 0.59% for Service Class shares. Over the same period, both share classes outperformed the –3.08% return of the S&P 500® Index, which is the Portfolio’s primary benchmark, and the –11.34% return of the MSCI EAFE® Index, which is a secondary benchmark of the Portfolio. For the six months ended June 30, 2020, both share classes underperformed the 6.14% return of the Bloomberg Barclays U.S. Aggregate Bond Index and the 1.92% return of the Conservative Allocation Composite Index, which are additional benchmarks of the Portfolio. Over the same period, both share classes outperformed the –2.66% return of the Morningstar Allocation— 30% to 50% Equity Category Average.2
What factors affected the Portfolio’s relative performance during the reporting period?
The Portfolio is a “fund of funds,” meaning that it seeks to achieve its investment objective by investing primarily in mutual funds and exchange-traded funds (“ETFs”) managed by New York Life Investments or its affiliates (the “Underlying Portfolios/Funds”). The Underlying Portfolios/Funds may invest in U.S. equities, international equities and fixed-income instruments, making comparisons to any single index generally less suitable than a weighted combination of indices, which is a more useful yardstick by which to measure performance. The most influential factor affecting relative performance for the Portfolio versus the performance of a weighted combination of indices is the net performance of the Underlying Portfolios/Funds relative to their respective benchmarks.
During the reporting period, the Portfolio’s asset class policy drove excess returns. Broadly, the Portfolio benefited from a posture that was aggressively risk-off when the market was in decline and less so as the market rebounded in late March, April and May 2020. Conversely, the performance of the Underlying Portfolio/Fund holdings in aggregate with respect to the Portfolio’s desired mix of asset class exposures detracted from relative performance. A few of the vehicles that struggled to achieve their objective include the MainStay Epoch U.S. All Cap Fund, MainStay VP T. Rowe Price Equity Income Portfolio and IQ 500 International ETF.
During the reporting period, how was the Portfolio’s performance materially affected by investments in derivatives?
Total return swaps were used to express most of the Portfolio’s asset class policy views and can be seen as contributing positively to active return. They were also used to curb larger systematic risk observable within the pool of Underlying Portfolios/Funds. In addition, derivatives enhanced the Portfolio’s returns to a small degree by helping rein in exposure to the underperforming value risk factor.
How did you allocate the Portfolio’s assets during the reporting period and why?
Eleven-plus years into an expansion, the U.S. economy entered the reporting period showing signs of strain. That, coupled with what we believed to be rather ambitious valuations, led us to skew the Portfolio away from risk assets. When the SARS-CoV-2 virus arrived, the Portfolio was tilted away from both equities and credit. That posture paid off handsomely as the market declined through late March 2020. We gradually reallocated back into equities, reducing the Portfolio’s underweight exposure, although never quite getting all the way back to neutral. We then reversed course, selling Underlying Equity Funds amid a strongly rallying market through April and May 2020. By June 30, 2020, we had gone round trip, underweight both equity and credit on a scale similar to the Portfolio’s position in mid-February 2020.
Within equities, results were mixed. The Portfolio generally tilted to favor large-cap stocks, reflecting our view that small companies were likely to be more vulnerable to lockdown-induced damage than larger firms with better access to capital markets and stronger balance sheets to fall back upon. While that bias was well rewarded, it was offset by the Portfolio’s bias toward value stocks. Concerned with an excessive valuation gap and anticipating mounting regulatory pressure on technology firms, we were somewhat pessimistic about the prospects for growth names. But then the work-from-home, play-from-home lockdowns provided a lift to many large-cap technology companies, detracting from Portfolio returns.
Several positioning decisions bolstered the performance of the fixed-income portion of the Portfolio. The most significant was a reallocation away from leveraged loans, which fell sharply along with equities in March, without fully recouping those losses during the spring. Also helpful was active exposure to long-maturity Treasury bonds and taxable municipal bonds.
| 1. | “New York Life Investments” is a service mark used by New York Life Investment Management Holdings LLC and its subsidiary New York Life Investment Management LLC. |
| 2. | See page 5 for more information on benchmark and peer group returns. |
| | |
| 8 | | MainStay VP Conservative Allocation Portfolio |
How did the Portfolio’s allocations change over the course of the reporting period?
Several significant shifts occurred among the Portfolio’s allocations during the reporting period. Among the largest was a move away from acquiring exposure to investment-grade bonds by using a total return swap, investing instead directly in the MainStay VP Indexed Bond Portfolio. Another significant change involved a shift away from MainStay MacKay U.S. Equity Opportunities Fund and MainStay VP MacKay Common Stock Portfolio into MainStay VP MacKay S&P 500 Index Portfolio. We based this adjustment on our judgment that the Portfolio’s aggregate exposure to active quantitative strategies was larger than might be helpful, and that a pivot to a passive implementation could be beneficial within the prevailing environment.
Several new positions were introduced during the reporting period, including swap exposure to iShares 20+ Year Treasury Bond ETF, a direct position in IQ Candriam ESG International ETF and swap exposure to VanEck Vectors Gold Miners ETF. Likewise, several positions were closed, including IQ Global Resources ETF, MainStay High Yield Municipal Bond Fund, MainStay VP Convertible Portfolio and MainStay VP Unconstrained Bond Portfolio.
Which Underlying Equity Portfolios/Funds had the highest total returns during the reporting period, and which Underlying Equity Portfolios/Funds had the lowest total returns?
Of the Underlying Equity Portfolios/Funds held during the reporting period, the highest total returns came from the technology-heavy MainStay VP Large Cap Growth Portfolio and MainStay VP MacKay Growth Portfolio. The MainStay Epoch Capital Growth Fund, a global equity product, also delivered positive returns. The most significant losses were posted by IQ Chaikin U.S. Small Cap ETF, MainStay VP T. Rowe Price Equity Income Portfolio and MainStay VP MacKay Small Cap Core Portfolio.
Which Underlying Equity Portfolios/Funds made the strongest positive contributions to the Portfolio’s overall performance, and which Underlying Equity Portfolios/Funds were the greatest detractors?
Among the Underlying Equity Portfolios/Funds making the most significant positive contributions to the Portfolio’s equity returns were MainStay VP Large Cap Growth Portfolio, MainStay VP MacKay S&P 500 Index Portfolio and MainStay VP MacKay Growth Portfolio. (Contributions take weightings and total returns into account.) The greatest detractions came from MainStay VP T. Rowe Price Equity Income Portfolio, MainStay VP Epoch U.S. Equity Yield Portfolio and IQ 500 International ETF.
What factors and risks affected the Portfolio’s Underlying Fixed-Income Portfolio/Fund investments during the reporting period?
To combat the economic impact of the growing pandemic, the U.S. Federal Reserve engaged in a battery of extraordinary measures, driving yields down (and prices up) across the maturity spectrum for high-grade bonds. At the same time, solvency concerns resulted in a moderate widening of credit spreads.3 These two dynamics dictated, to a large degree, the winners and losers within fixed-income markets over the past six months. High-grade, long-duration4 bonds with significant sensitivity to interest rates fared very well (the longest maturity Treasury bonds, for example, posted large positive returns), whereas lower credit quality instruments, such as high-yield bonds and bank loans, lagged significantly.
Which Underlying Fixed-Income Portfolios/Funds made the strongest positive contributions to the Portfolio’s performance, and which Underlying Fixed-Income Portfolios/Funds were the greatest detractors?
The Underlying Fixed-Income Portfolios/Funds that made the strongest positive contributions to return included MainStay VP Indexed Bond Portfolio and MainStay VP Bond Portfolio. The most significant detractors were MainStay Short Duration High Yield Fund and MainStay VP Floating Rate Portfolio.
| 3. | The terms “spread” and “yield spread” may refer to the difference in yield between a security or type of security and comparable U.S. Treasury issues. The terms may also refer to the difference in yield between two specific securities or types of securities at a given time. The term “credit spread” typically refers to the difference in yield between corporate or municipal bonds (or a specific category of these bonds) and comparable U.S. Treasury issues. |
| 4. | Duration is a measure of the price sensitivity of a fixed-income investment to changes in interest rates. Duration is expressed as a number of years and is considered a more accurate sensitivity gauge than average maturity. |
The opinions expressed are those of the portfolio managers as of the date of this report and are subject to change. There is no guarantee that any forecasts will come to pass. This material does not constitute investment advice and is not intended as an endorsement of any specific investment.
Not all MainStay VP Portfolios and/or share classes are available under all policies.
Portfolio of Investments June 30, 2020 (Unaudited)
| | | | | | | | |
| | |
| | | Shares | | | Value | |
| | | | | | | | |
| Affiliated Investment Companies 95.5%† | |
Equity Funds 36.0% | |
IQ 50 Percent Hedged FTSE International ETF (a) | | | 684,857 | | | $ | 13,256,845 | |
IQ 500 International ETF (a) | | | 545,758 | | | | 12,912,143 | |
IQ Candriam ESG International Equity ETF (a) | | | 312,208 | | | | 7,149,501 | |
IQ Candriam ESG U.S. Equity ETF | | | 42,695 | | | | 1,120,513 | |
IQ Chaikin U.S. Large Cap ETF | | | 417,671 | | | | 9,704,085 | |
IQ Chaikin U.S. Small Cap ETF | | | 87,264 | | | | 1,887,643 | |
MainStay Epoch Capital Growth Fund Class I | | | 157,673 | | | | 2,134,891 | |
MainStay Epoch International Choice Fund Class I | | | 263,506 | | | | 8,714,156 | |
MainStay Epoch U.S. All Cap Fund Class R6 | | | 441,502 | | | | 10,702,004 | |
MainStay MacKay International Opportunities Fund Class I | | | 1,190,424 | | | | 7,559,195 | |
MainStay MAP Equity Fund Class I | | | 452,672 | | | | 17,590,816 | |
MainStay VP Emerging Markets Equity Portfolio Initial Class (a) | | | 1,288,566 | | | | 11,446,592 | |
MainStay VP Epoch U.S. Equity Yield Portfolio Initial Class | | | 1,387,882 | | | | 19,120,848 | |
MainStay VP MacKay Common Stock Portfolio Initial Class | | | 184,173 | | | | 4,736,774 | |
MainStay VP MacKay Growth Portfolio Initial Class | | | 446,165 | | | | 15,543,792 | |
MainStay VP MacKay International Equity Portfolio Initial Class | | | 311,490 | | | | 4,841,711 | |
MainStay VP MacKay Mid Cap Core Portfolio Initial Class | | | 899,404 | | | | 10,730,786 | |
MainStay VP MacKay S&P 500 Index Portfolio Initial Class | | | 376,970 | | | | 22,530,478 | |
MainStay VP MacKay Small Cap Core Portfolio Initial Class | | | 637,262 | | | | 5,609,947 | |
MainStay VP Small Cap Growth Portfolio Initial Class | | | 1,111,937 | | | | 14,843,356 | |
MainStay VP T. Rowe Price Equity Income Portfolio Initial Class (a) | | | 1,743,604 | | | | 18,181,080 | |
MainStay VP Winslow Large Cap Growth Portfolio Initial Class | | | 758,911 | | | | 21,701,302 | |
| | | | | | | | |
Total Equity Funds
(Cost $244,542,429) | | | | | | | 242,018,458 | |
| | | | | | | | |
|
Fixed Income Funds 59.5% | |
IQ S&P High Yield Low Volatility Bond ETF (a) | | | 273,083 | | | | 6,619,532 | |
MainStay MacKay Infrastructure Bond Fund Class R6 (a) | | | 1,314,931 | | | | 11,610,837 | |
MainStay MacKay Short Duration High Yield Fund Class I | | | 5,292,157 | | | | 49,217,058 | |
MainStay Short Term Bond Class I (a) | | | 692,458 | | | | 7,388,524 | |
MainStay VP Bond Portfolio Initial Class (a) | | | 2,886,292 | | | | 44,359,714 | |
MainStay VP Floating Rate Portfolio Initial Class (a) | | | 2,357,014 | | | | 19,712,419 | |
| | | | | | | | |
| | |
| | | Shares | | | Value | |
| | | | | | | | |
Fixed Income Funds (continued) | |
MainStay VP Indexed Bond Portfolio Initial Class (a) | | | 22,381,952 | | | $ | 253,014,540 | |
MainStay VP PIMCO Real Return Portfolio Initial Class (a) | | | 851,704 | | | | 7,801,778 | |
| | | | | | | | |
Total Fixed Income Funds
(Cost $372,898,360) | | | | | | | 399,724,402 | |
| | | | | | | | |
Total Affiliated Investment Companies
(Cost $617,440,789) | | | | | | | 641,742,860 | |
| | | | | | | | |
| |
| Short-Term Investment 4.6% | | | | | |
Affiliated Investment Company 4.6% | | | | | | | | |
MainStay U.S. Government Liquidity Fund, 0.05% (b) | | | 31,312,015 | | | | 31,312,015 | |
| | | | | | | | |
Total Short-Term Investment
(Cost $31,312,015) | | | | | | | 31,312,015 | |
| | | | | | | | |
Total Investments
(Cost $648,752,804) | | | 100.1 | % | | | 673,054,875 | |
Other Assets, Less Liabilities | | | (0.1 | ) | | | (992,740 | ) |
Net Assets | | | 100.0 | % | | $ | 672,062,135 | |
| † | Percentages indicated are based on Portfolio net assets. |
| (a) | As of June 30, 2020, the Portfolio’s ownership exceeds 5% of the outstanding shares of the Underlying Portfolio’s/Fund’s share class. |
| (b) | Current yield as of June 30, 2020. |
| | | | |
| 10 | | MainStay VP Conservative Allocation Portfolio | | The notes to the financial statements are an integral part of,
and should be read in conjunction with, the financial statements. |
Swap Contracts
Open OTC total return swap contracts as of June 30, 2020 were as follows1:
| | | | | | | | | | | | | | | | | | | | |
Swap Counterparty | | Reference Obligation | | Floating Rate2 | | Termination
Date(s) | | | Payment
Frequency
Paid/
Received | | | Notional
Amount
Long/
(Short)
(000)* | | | Unrealized
Appreciation3 | |
Citigroup | | iShares 20+ Year Treasury Bond ETF | | 1 month LIBOR BBA plus 0.40% | | | 12/01/2020 | | | | Monthly | | | $ | 10,422 | | | $ | — | |
Citigroup | | iShares MSCI EAFE ETF | | 1 month LIBOR BBA minus 0.40% | | | 12/01/2020 | | | | Monthly | | | | (3,211 | ) | | | — | |
Citigroup | | iShares MSCI Emerging Markets ETF | | 1 month LIBOR BBA minus 0.65% | | | 12/01/2020 | | | | Monthly | | | | (3,166 | ) | | | — | |
Citigroup | | Russell 1000 Value Total Return Index | | 1 month LIBOR BBA plus 0.349% | | | 12/07/2020 | | | | Monthly | | | | 16,892 | | | | — | |
Citigroup | | Russell 2000 Total Return Index | | 1 month LIBOR BBA minus 0.015% | | | 12/07/2020 | | | | Monthly | | | | (11,965 | ) | | | — | |
Citigroup | | Russell Midcap Total Return Index | | 1 month LIBOR BBA minus 0.214% | | | 12/07/2020 | | | | Monthly | | | | (11,926 | ) | | | — | |
Citigroup | | S&P 500 Total Return Index | | 1 month LIBOR BBA plus 0.25% | | | 10/26/2020 | | | | Monthly | | | | 14,330 | | | | — | |
Citigroup | | VanEck Vectors Gold Miners ETF | | 1 month LIBOR BBA plus 0.50% | | | 12/01/2020 | | | | Monthly | | | | 3,544 | | | | — | |
| 1. | As of June 30, 2020, cash in the amount of $488,311 was pledged from brokers for OTC swap contracts. |
| 2. | Fund pays the floating rate and receives the total return of the reference entity. |
| 3. | Reflects the value at reset date as of June 30, 2020. |
| * | Notional amounts reflected as a positive value indicate a long position held by the Portfolio or Index and a negative value indicates a short position. |
The following abbreviations are used in the preceding pages:
BBA—British Bankers’ Association
ETF—Exchange-Traded Fund
FTSE—Financial Times Stock Exchange
LIBOR—London Interbank Offered Rate
The following is a summary of the fair valuations according to the inputs used as of June 30, 2020, for valuing the Portfolio’s assets:
| | | | | | | | | | | | | | | | |
Description | | Quoted
Prices in
Active
Markets for
Identical
Assets
(Level 1) | | | Significant
Other
Observable
Inputs
(Level 2) | | | Significant
Unobservable
Inputs
(Level 3) | | | Total | |
| | | | |
Asset Valuation Inputs | | | | | | | | | | | | | | | | |
| Investments (a) | | | | | | | | | | | | | | | | |
| Affiliated Investment Companies | | | | | | | | | | | | | | | | |
Equity Funds | | $ | 242,018,458 | | | $ | — | | | $ | — | | | $ | 242,018,458 | |
Fixed Income Funds | | | 399,724,402 | | | | — | | | | — | | | | 399,724,402 | |
Short-Term Investment | | | 31,312,015 | | | | — | | | | — | | | | 31,312,015 | |
| | | | | | | | | | | | | | | | |
| Total Investments in Securities | | $ | 673,054,875 | | | $ | — | | | $ | — | | | $ | 673,054,875 | |
| | | | | | | | | | | | | | | | |
| (a) | For a complete listing of investments, see the Portfolio of Investments. |
| | | | | | |
The notes to the financial statements are an integral part of,
and should be read in conjunction with, the financial statements. | | | | | 11 | |
Statement of Assets and Liabilities as of June 30, 2020 (Unaudited)
| | | | |
| Assets | | | | |
Investment in affiliated investment companies, at value (identified cost $648,752,804) | | $ | 673,054,875 | |
Cash collateral on deposit at broker for swap contracts | | | 488,311 | |
Receivables: | | | | |
Dividends and Interest | | | 273,530 | |
Portfolio shares sold | | | 65,724 | |
Other assets | | | 3,444 | |
| | | | |
Total assets | | | 673,885,884 | |
| | | | |
| |
| Liabilities | | | | |
Payables: | | | | |
Portfolio shares redeemed | | | 850,192 | |
Dividends and interest on OTC swaps contracts | | | 518,988 | |
Investment securities purchased | | | 272,578 | |
NYLIFE Distributors (See Note 3) | | | 135,214 | |
Shareholder communication | | | 25,006 | |
Professional fees | | | 14,604 | |
Custodian | | | 3,231 | |
Trustees | | | 887 | |
Accrued expenses | | | 3,049 | |
| | | | |
Total liabilities | | | 1,823,749 | |
| | | | |
Net assets | | $ | 672,062,135 | |
| | | | |
| |
| Composition of Net Assets | | | | |
Shares of beneficial interest outstanding (par value of $.001 per share) unlimited number of shares authorized | | $ | 57,725 | |
Additional paid-in capital | | | 645,888,011 | |
| | | | |
| | | 645,945,736 | |
Total distributable earnings (loss) | | | 26,116,399 | |
| | | | |
Net assets | | $ | 672,062,135 | |
| | | | |
| | | | |
Initial Class | | | | |
Net assets applicable to outstanding shares | | $ | 15,217,519 | |
| | | | |
Shares of beneficial interest outstanding | | | 1,291,645 | |
| | | | |
Net asset value per share outstanding | | $ | 11.78 | |
| | | | |
Service Class | | | | |
Net assets applicable to outstanding shares | | $ | 656,844,616 | |
| | | | |
Shares of beneficial interest outstanding | | | 56,433,474 | |
| | | | |
Net asset value per share outstanding | | $ | 11.64 | |
| | | | |
| | | | |
| 12 | | MainStay VP Conservative Allocation Portfolio | | The notes to the financial statements are an integral part of,
and should be read in conjunction with, the financial statements. |
Statement of Operations for the six months ended June 30, 2020 (Unaudited)
| | | | |
| Investment Income (Loss) | | | | |
Income | | | | |
Dividend distributions from affiliated investment companies | | $ | 2,803,291 | |
Interest | | | 209 | |
| | | | |
Total income | | | 2,803,500 | |
| | | | |
Expenses | | | | |
Distribution/Service—Service Class (See Note 3) | | | 832,462 | |
Professional fees | | | 40,907 | |
Shareholder communication | | | 31,610 | |
Trustees | | | 8,520 | |
Custodian | | | 7,440 | |
Miscellaneous | | | 11,210 | |
| | | | |
Total expenses | | | 932,149 | |
| | | | |
Net investment income (loss) | | | 1,871,351 | |
| | | | |
|
| Realized and Unrealized Gain (Loss) on Investments and Swap Contracts | |
Net realized gain (loss) on: | | | | |
Affiliated investment company transactions | | | 2,543,226 | |
Swap transactions | | | 1,370,298 | |
| | | | |
Net realized gain (loss) on investments from affiliated investment companies and swap transactions | | | 3,913,524 | |
| | | | |
Net change in unrealized appreciation (depreciation) on investments in affiliated investment companies and swap contacts | | | (5,530,655 | ) |
| | | | |
Net realized and unrealized gain (loss) on investments and swap transactions | | | (1,617,131 | ) |
| | | | |
Net increase (decrease) in net assets resulting from operations | | $ | 254,220 | |
| | | | |
| | | | | | |
The notes to the financial statements are an integral part of,
and should be read in conjunction with, the financial statements. | | | | | 13 | |
Statements of Changes in Net Assets
for the six months ended June 30, 2020 (Unaudited) and the year ended December 31, 2019
| | | | | | | | |
| | | 2020 | | | 2019 | |
| Increase (Decrease) in Net Assets | |
Operations: | | | | | | | | |
Net investment income (loss) | | $ | 1,871,351 | | | $ | 10,902,689 | |
Net realized gain (loss) on investments and investments from affiliated investment companies and swap transactions | | | 3,913,524 | | | | 16,311,798 | |
Net change in unrealized appreciation (depreciation) on investments in affiliated investment companies and swap contracts | | | (5,530,655 | ) | | | 73,341,547 | |
| | | | |
Net increase (decrease) in net assets resulting from operations | | | 254,220 | | | | 100,556,034 | |
| | | | |
Distributions to shareholders: | | | | | | | | |
Initial Class | | | — | | | | (787,124 | ) |
Service Class | | | — | | | | (36,881,033 | ) |
| | | | |
Total distributions to shareholders | | | — | | | | (37,668,157 | ) |
| | | | |
Capital share transactions: | | | | | | | | |
Net proceeds from sale of shares | | | 41,263,368 | | | | 59,412,891 | |
Net asset value of shares issued to shareholders in reinvestment of distributions | | | — | | | | 37,668,157 | |
Cost of shares redeemed | | | (101,859,368 | ) | | | (156,901,437 | ) |
Increase (decrease) in net assets derived from capital share transactions | | | (60,596,000 | ) | | | (59,820,389 | ) |
| | | | |
Net increase (decrease) in net assets | | | (60,341,780 | ) | | | 3,067,488 | |
| | |
| Net Assets | | | | | | | | |
Beginning of period | | | 732,403,915 | | | | 729,336,427 | |
| | | | |
End of period | | $ | 672,062,135 | | | $ | 732,403,915 | |
| | | | |
| | | | |
| 14 | | MainStay VP Conservative Allocation Portfolio | | The notes to the financial statements are an integral part of,
and should be read in conjunction with, the financial statements. |
Financial Highlights selected per share data and ratios
| | | | | | | | | | | | | | | | | | | | | | | | | | | | |
| | | |
| | | Six months
ended
June 30, | | | | | | Year ended December 31, | |
| | | | | | | |
| Initial Class | | 2020* | | | | | | 2019 | | | 2018 | | | 2017 | | | 2016 | | | 2015 | |
| | | | | | | |
Net asset value at beginning of period | | $ | 11.70 | | | | | | | $ | 10.77 | | | $ | 11.80 | | | $ | 10.87 | | | $ | 10.71 | | | $ | 11.85 | |
| | | | | | | | | | | | | | | | | | | | | | | | | | | | |
| | | | | | | |
Net investment income (loss) (a) | | | 0.05 | | | | | | | | 0.20 | | | | 0.23 | | | | 0.22 | | | | 0.22 | | | | 0.24 | |
| | | | | | | |
Net realized and unrealized gain (loss) on investments | | | 0.03 | | | | | | | | 1.38 | | | | (0.98 | ) | | | 0.95 | | | | 0.46 | | | | (0.41 | ) |
| | | | | | | | | | | | | | | | | | | | | | | | | | | | |
| | | | | | | |
Total from investment operations | | | 0.08 | | | | | | | | 1.58 | | | | (0.75 | ) | | | 1.17 | | | | 0.68 | | | | (0.17 | ) |
| | | | | | | | | | | | | | | | | | | | | | | | | | | | |
| | | | | | | |
| Less distributions: | | | | | | | | | | | | | | | | | | | | | | | | | | | | |
| | | | | | | |
From net investment income | | | — | | | | | | | | (0.34 | ) | | | (0.28 | ) | | | (0.24 | ) | | | (0.29 | ) | | | (0.28 | ) |
| | | | | | | |
From net realized gain on investments | | | — | | | | | | | | (0.31 | ) | | | — | | | | — | | | | (0.23 | ) | | | (0.69 | ) |
| | | | | | | | | | | | | | | | | | | | | | | | | | | | |
| | | | | | | |
Total distributions | | | — | | | | | | | | (0.65 | ) | | | (0.28 | ) | | | (0.24 | ) | | | (0.52 | ) | | | (0.97 | ) |
| | | | | | | | | | | | | | | | | | | | | | | | | | | | |
| | | | | | | |
Net asset value at end of period | | $ | 11.78 | | | | | | | $ | 11.70 | | | $ | 10.77 | | | $ | 11.80 | | | $ | 10.87 | | | $ | 10.71 | |
| | | | | | | | | | | | | | | | | | | | | | | | | | | | |
| | | | | | | |
Total investment return (b) | | | 0.68 | %(c) | | | | | | | 14.83 | % | | | (6.47 | %) | | | 10.80 | % | | | 6.36 | % | | | (1.41 | %) |
| | | | | | | |
| Ratios (to average net assets)/Supplemental Data: | | | | | | | | | | | | | | | | | | | | | | | | | | | | |
| | | | | | | |
Net investment income (loss) | | | 0.79 | %†† | | | | | | | 1.75 | % | | | 2.02 | % | | | 1.89 | % | | | 2.02 | % | | | 2.01 | % |
| | | | | | | |
Net expenses (d) | | | 0.03 | %†† | | | | | | | 0.03 | % | | | 0.03 | % | | | 0.02 | % | | | 0.03 | % | | | 0.03 | % |
| | | | | | | |
Portfolio turnover rate | | | 15 | % | | | | | | | 42 | % | | | 58 | % | | | 44 | % | | | 44 | % | | | 40 | % |
| | | | | | | |
Net assets at end of period (in 000’s) | | $ | 15,218 | | | | | | | $ | 16,327 | | | $ | 14,616 | | | $ | 16,481 | | | $ | 16,599 | | | $ | 16,171 | |
| (a) | Per share data based on average shares outstanding during the period. |
| (b) | Total return does not reflect any deduction of sales charges, mortality and expense charges, contract charges or administrative charges. For periods of less than one year, total return is not annualized. |
| (c) | Total investment return may reflect adjustments to conform to generally accepted accounting principles. |
| (d) | In addition to the fees and expenses which the Portfolio bears directly, it also indirectly bears a pro-rata share of the fees and expenses of the underlying funds in which it invests. Such indirect expenses are not included in the above expense ratios. |
| | | | | | | | | | | | | | | | | | | | | | | | | | | | |
| | | |
| | | Six months
ended
June 30, | | | | | | Year ended December 31, | |
| | | | | | | |
| Service Class | | 2020* | | | | | | 2019 | | | 2018 | | | 2017 | | | 2016 | | | 2015 | |
| | | | | | | |
Net asset value at beginning of period | | $ | 11.57 | | | | | | | $ | 10.66 | | | $ | 11.67 | | | $ | 10.75 | | | $ | 10.60 | | | $ | 11.73 | |
| | | | | | | | | | | | | | | | | | | | | | | | | | | | |
| | | | | | | |
Net investment income (loss) (a) | | | 0.03 | | | | | | | | 0.17 | | | | 0.20 | | | | 0.19 | | | | 0.19 | | | | 0.21 | |
| | | | | | | |
Net realized and unrealized gain (loss) on investments | | | 0.04 | | | | | | | | 1.35 | | | | (0.96 | ) | | | 0.94 | | | | 0.45 | | | | (0.40 | ) |
| | | | | | | | | | | | | | | | | | | | | | | | | | | | |
| | | | | | | |
Total from investment operations | | | 0.07 | | | | | | | | 1.52 | | | | (0.76 | ) | | | 1.13 | | | | 0.64 | | | | (0.19 | ) |
| | | | | | | | | | | | | | | | | | | | | | | | | | | | |
| | | | | | | |
| Less distributions: | | | | | | | | | | | | | | | | | | | | | | | | | | | | |
| | | | | | | |
From net investment income | | | — | | | | | | | | (0.30 | ) | | | (0.25 | ) | | | (0.21 | ) | | | (0.26 | ) | | | (0.25 | ) |
| | | | | | | |
From net realized gain on investments | | | — | | | | | | | | (0.31 | ) | | | — | | | | — | | | | (0.23 | ) | | | (0.69 | ) |
| | | | | | | | | | | | | | | | | | | | | | | | | | | | |
| | | | | | | |
Total distributions | | | — | | | | | | | | (0.61 | ) | | | (0.25 | ) | | | (0.21 | ) | | | (0.49 | ) | | | (0.94 | ) |
| | | | | | | | | | | | | | | | | | | | | | | | | | | | |
| | | | | | | |
Net asset value at end of period | | $ | 11.64 | | | | | | | $ | 11.57 | | | $ | 10.66 | | | $ | 11.67 | | | $ | 10.75 | | | $ | 10.60 | |
| | | | | | | | | | | | | | | | | | | | | | | | | | | | |
| | | | | | | |
Total investment return (b) | | | 0.61 | %(c) | | | | | | | 14.55 | % | | | (6.68 | %) | | | 10.52 | % | | | 6.10 | % | | | (1.65 | %) |
| | | | | | | |
| Ratios (to average net assets)/Supplemental Data: | | | | | | | | | | | | | | | | | | | | | | | | | | | | |
| | | | | | | |
Net investment income (loss) | | | 0.54 | %†† | | | | | | | 1.47 | % | | | 1.70 | % | | | 1.66 | % | | | 1.74 | % | | | 1.84 | % |
| | | | | | | |
Net expenses (d) | | | 0.28 | %†† | | | | | | | 0.28 | % | | | 0.28 | % | | | 0.27 | % | | | 0.28 | % | | | 0.28 | % |
| | | | | | | |
Portfolio turnover rate | | | 15 | % | | | | | | | 42 | % | | | 58 | % | | | 44 | % | | | 44 | % | | | 40 | % |
| | | | | | | |
Net assets at end of period (in 000’s) | | $ | 656,845 | | | | | | | $ | 716,077 | | | $ | 714,720 | | | $ | 865,873 | | | $ | 850,124 | | | $ | 900,093 | |
| (a) | Per share data based on average shares outstanding during the period. |
| (b) | Total return does not reflect any deduction of sales charges, mortality and expense charges, contract charges or administrative charges. For periods of less than one year, total return is not annualized. |
| (c) | Total investment return may reflect adjustments to conform to generally accepted accounting principles. |
| (d) | In addition to the fees and expenses which the Portfolio bears directly, it also indirectly bears a pro-rata share of the fees and expenses of the underlying funds in which it invests. Such indirect expenses are not included in the above expense ratios. |
| | | | | | |
The notes to the financial statements are an integral part of,
and should be read in conjunction with, the financial statements. | | | | | 15 | |
MainStay VP Moderate Allocation Portfolio
Investment and Performance Comparison1 (Unaudited)
Performance data quoted represents past performance. Past performance is no guarantee of future results. Because of market volatility and other factors, current performance may be lower or higher than the figures shown. Investment return and principal value will fluctuate, and as a result, when shares are redeemed, they may be worth more or less than their original cost. The performance table and graph do not reflect any deduction of sales charges, mortality and expense charges, contract charges or administrative charges. Please refer to the Performance Summary appropriate for your policy. For performance information current to the most recent month-end, please call 800-598-2019 or visit www.newyorklife.com.
Average Annual Total Returns for the Period-Ended June 30, 2020
| | | | | | | | | | | | | | | | | | | | | | |
| Class | | Inception
Date | | Six Months | | | One Year | | | Five Years | | | Ten Years | | | Gross
Expense
Ratio2 | |
| | | | | | |
| Initial Class Shares | | 2/13/2006 | | | –1.66 | % | | | 3.86 | % | | | 4.71 | % | | | 7.72 | % | | | 0.72 | % |
| Service Class Shares | | 2/13/2006 | | | 1.78 | | | | 3.60 | | | | 4.45 | | | | 7.45 | | | | 0.97 | |
| | | | | | | | | | | | | | | | |
| Benchmark Performance | | Six
Months | | | One
Year | | | Five
Years | | | Ten
Years | |
| | | | |
S&P 500® Index3 | | | –3.08 | % | | | 7.51 | % | | | 10.73 | % | | | 13.99 | % |
MSCI EAFE® Index4 | | | –11.34 | | | | –5.13 | | | | 2.05 | | | | 5.73 | |
Bloomberg Barclays U.S. Aggregate Bond Index5 | | | 6.14 | | | | 8.74 | | | | 4.30 | | | | 3.82 | |
Moderate Allocation Composite Index6 | | | –0.35 | | | | 6.58 | | | | 7.11 | | | | 8.98 | |
Morningstar Allocation—50% to 70% Equity Category Average7 | | | –3.58 | | | | 2.30 | | | | 5.22 | | | | 7.88 | |
| 1. | Performance figures may reflect certain fee waivers and/or expense limitations, without which total returns may have been different. For information on current fee waivers and/or expense limitations (if any), please refer to the Notes to Financial Statements. |
| 2. | The gross expense ratios presented reflect the Portfolio’s “Total Annual Portfolio Operating Expenses” from the most recent Prospectus, as supplemented, and may differ from other expense ratios disclosed in this report. |
| 3. | The S&P 500® Index is the Portfolio’s primary broad-based securities market index for comparison purposes. “S&P 500®” is a trademark of The McGraw-Hill Companies, Inc. The S&P 500® Index is widely regarded as the standard index for measuring large-cap U.S. stock market performance. Results assume reinvestment of all dividends and capital gains. An investment cannot be made directly in an index. |
| 4. | The MSCI EAFE® Index is the Portfolio’s secondary benchmark. The MSCI EAFE® Index consists of international stocks representing the developed world outside of North America. Results assume reinvestment of all dividends and capital gains. An investment cannot be made directly in an index. |
| 5. | The Portfolio has selected the Bloomberg Barclays U.S. Aggregate Bond Index as an additional benchmark. The Bloomberg Barclays U.S. Aggregate |
| | Bond Index is a broad-based benchmark that measures performance of the investment-grade, U.S. dollar-denominated, fixed-rate taxable bond market, including Treasurys, government-related and corporate securities, mortgage-backed securities (agency fixed-rate and hybrid adjustable-rate mortgage pass-throughs), asset-backed securities and commercial mortgage-backed securities. Results assume reinvestment of all dividends and capital gains. An investment cannot be made directly in an index. |
| 6. | The Portfolio has selected the Moderate Allocation Composite Index as an additional benchmark. The Moderate Allocation Composite Index consists of the S&P 500® Index, the MSCI EAFE® Index and the Bloomberg Barclays U.S. Aggregate Bond Index weighted 45%, 15% and 40%, respectively. Results assume reinvestment of all dividends and capital gains. An investment cannot be made directly in an index. |
| 7. | The Morningstar Allocation—50% to 70% Equity Category Average is representative of funds that seek to provide both income and capital appreciation by investing in multiple asset classes, including stocks, bonds, and cash. These funds are dominated by domestic holdings and have equity exposures between 50% and 70%. Results are based on average total returns of similar funds with all dividends and capital gain distributions reinvested. |
| | |
| 16 | | MainStay VP Moderate Allocation Portfolio |
Cost in Dollars of a $1,000 Investment in MainStay VP Moderate Allocation Portfolio (Unaudited)
The example below is intended to describe the fees and expenses borne by shareholders during the six-month period from January 1, 2020, to June 30, 2020, and the impact of those costs on your investment.
Example
As a shareholder of the Portfolio you incur two types of costs: (1) transaction costs, including exchange fees and sales charges (loads) on purchases (as applicable), and (2) ongoing costs, including management fees, distribution and/or service (12b-1) fees, and other Portfolio expenses (as applicable). This example is intended to help you understand your ongoing costs (in dollars) of investing in the Portfolio and to compare these costs with the ongoing costs of investing in other mutual funds. The example is based on an investment of $1,000 made at the beginning of the six-month period and held for the entire period from January 1, 2020, to June 30, 2020. Shares are only sold in connection with variable life and annuity contracts and the example does not reflect any contract level or transactional fees or expenses. If these costs had been included, your costs would have been higher.
This example illustrates your Portfolio’s ongoing costs in two ways:
Actual Expenses
The second and third data columns in the table below provide information about actual account values and actual expenses. You may use the information in these columns, together with the amount you invested, to estimate the expenses that you paid during the six months
ended June 30, 2020. Simply divide your account value by $1,000 (for example, an $8,600 account value divided by $1,000 = 8.6), then multiply the result by the number under the heading entitled “Expenses Paid During Period” to estimate the expenses you paid on your account during this period.
Hypothetical Example for Comparison Purposes
The fourth and fifth data columns in the table below provide information about hypothetical account values and hypothetical expenses based on the Portfolio’s actual expense ratio and an assumed rate of return of 5% per year before expenses, which is not the Portfolio’s actual return. The hypothetical account values and expenses may not be used to estimate the actual ending account balances or expenses you paid for the six-month period shown. You may use this information to compare the ongoing costs of investing in the Portfolio with the ongoing costs of investing in other mutual funds. To do so, compare this 5% hypothetical example with the 5% hypothetical examples that appear in the shareholder reports of the other mutual funds.
Please note that the expenses shown in the table are meant to highlight your ongoing costs only and do not reflect any transactional costs, such as exchange fees or sales charges (loads). Therefore, the fourth and fifth data columns of the table are useful in comparing ongoing costs only and will not help you determine the relative total costs of owning different funds. In addition, if these transactional costs were included, your costs would have been higher.
| | | | | | | | | | | | | | | | | | | | | | |
| | | | | | | | | | | | | | | | | | |
| Share Class | | Beginning
Account
Value
1/1/20 | | | Ending Account
Value (Based
on Actual
Returns and
Expenses)
6/30/20 | | | Expenses
Paid
During
Period1 | | | Ending Account
Value (Based
on Hypothetical
5% Annualized
Return and
Actual Expenses)
6/30/20 | | | Expenses
Paid
During
Period1 | | | Net Expense
Ratio
During
Period2 |
| | | | | | |
| Initial Class Shares | | $ | 1,000.00 | | | $ | 983.40 | | | $ | 0.15 | | | $ | 1,024.71 | | | $ | 0.15 | | | 0.03% |
| | | | | | |
| Service Class Shares | | $ | 1,000.00 | | | $ | 982.20 | | | $ | 1.38 | | | $ | 1,023.47 | | | $ | 1.41 | | | 0.28% |
| 1. | Expenses are equal to the Portfolio’s annualized expense ratio of each class multiplied by the average account value over the period, divided by 366 and multiplied by 182 (to reflect the six-month period). The table above represents the actual expenses incurred during the six-month period. In addition to the fees and expenses which the Portfolio bears directly, it also indirectly bears a pro rata share of the fees and expenses of the Underlying Portfolios/Funds in which it invests. Such indirect expenses are not included in the above-reported expense figures. |
| 2. | Expenses are equal to the Portfolio’s annualized expense ratio to reflect the six-month period. |
Investment Objectives of Underlying Portfolios/Funds as of June 30, 2020 (Unaudited)

See Portfolio of Investments beginning on page 21 for specific holdings within these categories. The Portfolio’s holdings are subject to change.
| ‡ | Less than one-tenth of a percent. |
| | |
| 18 | | MainStay VP Moderate Allocation Portfolio |
Portfolio Management Discussion and Analysis (Unaudited)
Answers to the questions reflect the views of portfolio managers Jae S. Yoon, CFA, Jonathan Swaney, Poul Kristensen, CFA, and Amit Soni, CFA, of New York Life Investments,1 the Portfolio’s Manager.
How did MainStay VP Moderate Allocation Portfolio perform relative to its benchmarks and peers during the six months ended June 30, 2020?
For the six months ended June 30, 2020, MainStay VP Moderate Allocation Portfolio returned –1.66% for Initial Class shares and –1.78% for Service Class shares. Over the same period, both share classes outperformed the –3.08% return of the S&P 500® Index, which is the Portfolio’s primary benchmark, and the –11.34% return of the MSCI EAFE® Index, which is a secondary benchmark of the Portfolio. For the six months ended June 30, 2020, both share classes underperformed the 6.14% return of the Bloomberg Barclays U.S. Aggregate Bond Index and the –0.35% return of the Moderate Allocation Composite Index, which are additional benchmarks of the Portfolio. Over the same period, both share classes outperformed the –3.58% return of the Morningstar Allocation—50% to 70% Equity Category Average.2
What factors affected the Portfolio’s relative performance during the reporting period?
The Portfolio is a “fund of funds,” meaning that it seeks to achieve its investment objective by investing primarily in mutual funds and exchange-traded funds (“ETFs”) managed by New York Life Investments or its affiliates (the “Underlying Portfolios/Funds”). The Underlying Portfolios/Funds may invest in U.S. equities, international equities and fixed-income instruments, making comparisons to any single index generally less suitable than a weighted combination of indices, which is a more useful yardstick by which to measure performance. The most influential factor affecting relative performance for the Portfolio versus the performance of a weighted combination of indices is the net performance of the Underlying Portfolios/Funds relative to their respective benchmarks.
During the reporting period, the Portfolio’s asset class policy drove excess returns. Broadly, the Portfolio benefited from a posture that was aggressively risk-off when the market was in decline and less so as the market rebounded in late March, April and May 2020. Conversely, the performance of the Underlying Portfolio/Fund holdings in aggregate with respect to the Portfolio’s desired mix of asset class exposures detracted from relative performance. A few of the vehicles that struggled to achieve their objective include the MainStay Epoch U.S. All Cap Fund, MainStay VP T. Rowe Price Equity Income Portfolio and IQ 500 International ETF.
During the reporting period, how was the Portfolio’s performance materially affected by investments in derivatives?
Total return swaps were used to express most of the Portfolio’s asset class policy views and can be seen as contributing positively to active return. They were also used to curb larger systematic risk observable within the pool of Underlying Portfolios/Funds. In addition, derivatives enhanced the Portfolio’s returns to a small degree by helping rein in exposure to the underperforming value risk factor.
How did you allocate the Portfolio’s assets during the reporting period and why?
Eleven-plus years into an expansion, the U.S. economy entered the reporting period showing signs of strain. That, coupled with what we believed to be rather ambitious valuations, led us to skew the Portfolio away from risk assets. When the SARS-CoV-2 virus arrived, the Portfolio was tilted away from both equities and credit. That posture paid off handsomely as the market declined through late March 2020. We gradually reallocated back into equities, reducing the Portfolio’s underweight exposure, although never quite getting all the way back to neutral. We then reversed course, selling Underlying Equity Funds amid a strongly rallying market through April and May 2020. By June 30, 2020, we had gone round trip, underweight both equity and credit on a scale similar to the Portfolio’s position in mid-February 2020.
Within equities, results were mixed. The Portfolio generally tilted to favor large-cap stocks, reflecting our view that small companies were likely to be more vulnerable to lockdown-induced damage than larger firms with better access to capital markets and stronger balance sheets to fall back upon. While that bias was well rewarded, it was offset by the Portfolio’s bias toward value stocks. Concerned with an excessive valuation gap and anticipating mounting regulatory pressure on technology firms, we were somewhat pessimistic about the prospects for growth names. But then the work-from-home, play-from-home lockdowns provided a lift to many large-cap technology companies, detracting from Portfolio returns.
Several positioning decisions bolstered the performance of the fixed-income portion of the Portfolio. The most significant was a reallocation away from leveraged loans, which fell sharply along with equities in March, without fully recouping those losses
| 1. | “New York Life Investments” is a service mark used by New York Life Investment Management Holdings LLC and its subsidiary New York Life Investment Management LLC. |
| 2. | See page 16 for more information on benchmark and peer group returns. |
during the spring. Also helpful was active exposure to long-maturity Treasury bonds and taxable municipal bonds.
How did the Portfolio’s allocations change over the course of the reporting period?
Several significant shifts occurred among the Portfolio’s allocations during the reporting period. Among the largest was a move away from acquiring exposure to investment-grade bonds by using a total return swap, investing instead directly in the MainStay VP Indexed Bond Portfolio. Another significant change involved a shift away from MainStay MacKay U.S. Equity Opportunities Fund and MainStay VP MacKay Common Stock Portfolio into MainStay VP MacKay S&P 500 Index Portfolio. We based this adjustment on our judgment that the Portfolio’s aggregate exposure to active quantitative strategies was larger than might be helpful, and that a pivot to a passive implementation could be beneficial within the prevailing environment.
Several new positions were introduced during the reporting period, including swap exposure to iShares 20+ Year Treasury Bond ETF, a direct position in IQ Candriam ESG International ETF and swap exposure to VanEck Vectors Gold Miners ETF. Likewise, several positions were closed, including IQ Global Resources ETF, MainStay High Yield Municipal Bond Fund, MainStay VP Convertible Portfolio and MainStay VP Unconstrained Bond Portfolio.
Which Underlying Equity Portfolios/Funds had the highest total returns during the reporting period, and which Underlying Equity Portfolios/Funds had the lowest total returns?
Of the Underlying Equity Portfolios/Funds held during the reporting period, the highest total returns came from the technology-heavy MainStay VP Large Cap Growth Portfolio and MainStay VP MacKay Growth Portfolio. The MainStay Epoch Capital Growth Fund, a global equity product, also delivered positive returns. The most significant losses were posted by IQ Chaikin U.S. Small Cap ETF, MainStay VP T. Rowe Price Equity Income Portfolio and MainStay VP MacKay Small Cap Core Portfolio.
Which Underlying Equity Portfolios/Funds made the strongest positive contributions to the Portfolio’s overall performance, and which Underlying Equity Portfolios/Funds were the greatest detractors?
Among the Underlying Equity Portfolios/Funds making the most significant positive contributions to the Portfolio’s equity returns were MainStay VP Large Cap Growth Portfolio, MainStay VP MacKay S&P 500 Index Portfolio and MainStay VP MacKay Growth Portfolio. (Contributions take weightings and total returns into account.) The greatest detractions came from MainStay VP T. Rowe Price Equity Income Portfolio, MainStay VP Epoch U.S. Equity Yield Portfolio and IQ 500 International ETF.
What factors and risks affected the Portfolio’s Underlying Fixed-Income Portfolio/Fund investments during the reporting period?
To combat the economic impact of the growing pandemic, the U.S. Federal Reserve engaged in a battery of extraordinary measures, driving yields down (and prices up) across the maturity spectrum for high-grade bonds. At the same time, solvency concerns resulted in a moderate widening of credit spreads.3 These two dynamics dictated, to a large degree, the winners and losers within fixed-income markets over the past six months. High-grade, long-duration4 bonds with significant sensitivity to interest rates fared very well (the longest maturity Treasury bonds, for example, posted large positive returns), whereas lower credit quality instruments, such as high-yield bonds and bank loans, lagged significantly.
Which Underlying Fixed-Income Portfolios/Funds made the strongest positive contributions to the Portfolio’s performance, and which Underlying Fixed-Income Portfolios/Funds were the greatest detractors?
The Underlying Fixed-Income Portfolios/Funds that made the strongest positive contributions to return included MainStay VP Indexed Bond Portfolio and MainStay VP Bond Portfolio. The most significant detractors were MainStay Short Duration High Yield Fund and MainStay VP Floating Rate Portfolio.
| 3. | The terms “spread” and “yield spread” may refer to the difference in yield between a security or type of security and comparable U.S. Treasury issues. The terms may also refer to the difference in yield between two specific securities or types of securities at a given time. The term “credit spread” typically refers to the difference in yield between corporate or municipal bonds (or a specific category of these bonds) and comparable U.S. Treasury issues. |
| 4. | Duration is a measure of the price sensitivity of a fixed-income investment to changes in interest rates. Duration is expressed as a number of years and is considered a more accurate sensitivity gauge than average maturity. |
The opinions expressed are those of the portfolio managers as of the date of this report and are subject to change. There is no guarantee that any forecasts will come to pass. This material does not constitute investment advice and is not intended as an endorsement of any specific investment.
Not all MainStay VP Portfolios and/or share classes are available under all policies.
| | |
| 20 | | MainStay VP Moderate Allocation Portfolio |
Portfolio of Investments June 30, 2020 (Unaudited)
| | | | | | | | |
| | |
Shares | | | Value | |
| | | | | | | | |
| Affiliated Investment Companies 96.2%† | |
Equity Funds 56.2% | |
IQ 50 Percent Hedged FTSE International ETF (a) | | | 1,097,441 | | | $ | 21,243,275 | |
IQ 500 International ETF (a) | | | 1,093,758 | | | | 25,877,330 | |
IQ Candriam ESG International Equity ETF (a) | | | 713,751 | | | | 16,344,755 | |
IQ Candriam ESG U.S. Equity ETF | | | 83,953 | | | | 2,203,313 | |
IQ Chaikin U.S. Large Cap ETF (a) | | | 1,241,346 | | | | 28,841,185 | |
IQ Chaikin U.S. Small Cap ETF | | | 195,044 | | | | 4,219,075 | |
MainStay Epoch Capital Growth Fund Class I (a) | | | 568,738 | | | | 7,700,707 | |
MainStay Epoch International Choice Fund Class I (a) | | | 833,327 | | | | 27,558,135 | |
MainStay Epoch U.S. All Cap Fund Class R6 (a) | | | 1,355,208 | | | | 32,850,242 | |
MainStay MacKay International Opportunities Fund Class I (a) | | | 3,737,369 | | | | 23,732,295 | |
MainStay MAP Equity Fund Class I (a) | | | 1,211,386 | | | | 47,074,450 | |
MainStay VP Emerging Markets Equity Portfolio Initial Class (a) | | | 3,342,772 | | | | 29,694,514 | |
MainStay VP Epoch U.S. Equity Yield Portfolio Initial Class (a) | | | 3,117,172 | | | | 42,945,272 | |
MainStay VP MacKay Common Stock Portfolio Initial Class | | | 502,281 | | | | 12,918,267 | |
MainStay VP MacKay Growth Portfolio Initial Class (a) | | | 1,161,423 | | | | 40,462,482 | |
MainStay VP MacKay International Equity Portfolio Initial Class (a) | | | 521,389 | | | | 8,104,318 | |
MainStay VP MacKay Mid Cap Core Portfolio Initial Class (a) | | | 2,201,535 | | | | 26,266,516 | |
MainStay VP MacKay S&P 500 Index Portfolio Initial Class | | | 857,626 | | | | 51,258,012 | |
MainStay VP MacKay Small Cap Core Portfolio Initial Class (a) | | | 1,310,392 | | | | 11,535,647 | |
MainStay VP Small Cap Growth Portfolio Initial Class (a) | | | 1,588,699 | | | | 21,207,704 | |
MainStay VP T. Rowe Price Equity Income Portfolio Initial Class (a) | | | 4,470,297 | | | | 46,613,124 | |
MainStay VP Winslow Large Cap Growth Portfolio Initial Class (a) | | | 1,970,380 | | | | 56,343,593 | |
| | | | | | | | |
| | | | | | | 584,994,211 | |
| | | | | | | | |
Fixed Income Funds 40.0% | |
IQ S&P High Yield Low Volatility Bond ETF (a) | | | 424,100 | | | | 10,280,184 | |
MainStay MacKay Infrastructure Bond Fund Class R6 (a) | | | 2,144,520 | | | | 18,936,115 | |
MainStay MacKay Short Duration High Yield Fund Class I (a) | | | 5,753,589 | | | | 53,508,379 | |
MainStay Short Term Bond Class I (a) | | | 1,087,985 | | | | 11,608,801 | |
MainStay VP Bond Portfolio Initial Class (a) | | | 4,423,319 | | | | 67,982,439 | |
| | | | | | | | |
| | |
Shares | | | Value | |
| | | | | | | | |
Fixed Income Funds (continued) | |
MainStay VP Floating Rate Portfolio Initial Class | | | 630,382 | | | $ | 5,272,075 | |
MainStay VP Indexed Bond Portfolio Initial Class (a) | | | 20,922,165 | | | | 236,512,527 | |
MainStay VP PIMCO Real Return Portfolio Initial Class (a) | | | 1,276,236 | | | | 11,690,575 | |
| | | | | | | | |
| | | | | | | 415,791,095 | |
| | | | | | | | |
Total Affiliated Investment Companies
(Cost $989,995,640) | | | | | | | 1,000,785,306 | |
| | | | | | | | |
| | |
| Short-Term Investment 3.8% | | | | | | | | |
Affiliated Investment Company 3.8% | | | | | | | | |
MainStay U.S. Government Liquidity Fund, 0.05% (b) | | | 39,291,679 | | | | 39,291,679 | |
| | | | | | | | |
Total Short-Term Investment
(Cost $39,291,679) | | | | | | | 39,291,679 | |
| | | | | | | | |
Total Investments
(Cost $1,029,287,319) | | | 100.0 | % | | | 1,040,076,985 | |
Other Assets, Less Liabilities | | | 0.0 | ‡ | | | 100,672 | |
Net Assets | | | 100.0 | % | | $ | 1,040,177,657 | |
| † | Percentages indicated are based on Portfolio net assets. |
| ‡ | Less than one-tenth of a percent. |
| (a) | As of June 30, 2020, the Portfolio’s ownership exceeded 5% of the outstanding shares of the Underlying Portfolio’s/Fund’s share class. |
| (b) | Non-income producing Underlying Portfolio/Fund. |
| | | | | | |
The notes to the financial statements are an integral part of,
and should be read in conjunction with, the financial statements. | | | | | 21 | |
Portfolio of Investments June 30, 2020 (Unaudited) (continued)
Swap Contracts
Open OTC total return swap contracts as of June 30, 2020 were as follows1:
| | | | | | | | | | | | | | | | | | | | |
Swap Counterparty | | Reference Obligation | | Floating Rate2 | | Termination
Date(s) | | | Payment
Frequency
Paid/ Received | | | Notional
Amount
Long/
(Short)
(000)* | | | Unrealized
Appreciation3 | |
Citigroup | | iShares 20+ Year Treasury Bond ETF | | 1 month LIBOR BBA plus 0.40% | | | 12/01/2020 | | | | Monthly | | | $ | 16,183 | | | $ | — | |
Citigroup | | iShares MSCI EAFE ETF | | 1 month LIBOR BBA minus 0.40% | | | 12/01/2020 | | | | Monthly | | | | (4,987 | ) | | | — | |
Citigroup | | iShares MSCI Emerging Markets ETF | | 1 month LIBOR BBA minus 0.65% | | | 12/01/2020 | | | | Monthly | | | | (4,916 | ) | | | — | |
Citigroup | | Russell 1000 Value Total Return Index | | 1 month LIBOR BBA plus 0.352% | | | 12/07/2020 | | | | Monthly | | | | 25,728 | | | | — | |
Citigroup | | Russell 2000 Total Return Index | | 1 month LIBOR BBA 0.00% | | | 12/07/2020 | | | | Monthly | | | | (20,816 | ) | | | — | |
Citigroup | | Russell Midcap Total Return Index | | 1 month LIBOR BBA minus 0.138% | | | 12/07/2020 | | | | Monthly | | | | (16,263 | ) | | | — | |
Citigroup | | S&P 500 Total Return Index | | 1 month LIBOR BBA plus 0.25% | | | 10/26/2020 | | | | Monthly | | | | 22,052 | | | | — | |
Citigroup | | VanEck Vectors Gold Miners ETF | | 1 month LIBOR BBA plus 0.50% | | | 12/01/2020 | | | | Monthly | | | | 5,504 | | | | — | |
| 1 | As of June 30, 2020, cash in the amount of $900,269 was pledged from brokers for OTC swap contracts. |
| 2 | Fund pays the floating rate and receives the total return of the reference entity. |
| 3. | Reflects the value at reset date as of June 30, 2020. |
| * | Notional amounts reflected as a positive value indicate a long position held by the Portfolio or Index and a negative value indicates a short position. |
The following abbreviations are used in the preceding pages:
BBA—British Bankers’ Association
ETF—Exchange-Traded Fund
FTSE—Financial Times Stock Exchange
LIBOR—London Interbank Offered Rate
The following is a summary of the fair valuations according to the inputs used as of June 30, 2020, for valuing the Portfolio’s assets:
| | | | | | | | | | | | | | | | |
Description | | Quoted
Prices in
Active
Markets for
Identical
Assets
(Level 1) | | | Significant
Other
Observable
Inputs
(Level 2) | | | Significant
Unobservable
Inputs
(Level 3) | | | Total | |
| | | | |
Asset Valuation Inputs | | | | | | | | | | | | | | | | |
| Investments (a) | | | | | | | | | | | | | | | | |
| Affiliated Investment Companies | | | | | | | | | | | | | | | | |
Equity Funds | | $ | 584,994,211 | | | $ | — | | | $ | — | | | $ | 584,994,211 | |
Fixed Income Funds | | | 415,791,095 | | | | — | | | | — | | | | 415,791,095 | |
Short-Term Investment | | | 39,291,679 | | | | — | | | | — | | | | 39,291,679 | |
| | | | | | | | | | | | | | | | |
| Total Investments in Securities | | $ | 1,040,076,985 | | | $ | — | | | $ | — | | | $ | 1,040,076,985 | |
| | | | | | | | | | | | | | | | |
| (a) | For a complete listing of investments, see the Portfolio of Investments. |
| | | | |
| 22 | | MainStay VP Moderate Allocation Portfolio | | The notes to the financial statements are an integral part of,
and should be read in conjunction with, the financial statements. |
Statement of Assets and Liabilities as of June 30, 2020 (Unaudited)
| | | | |
| Assets | | | | |
Investment in affiliated investment companies, at value (identified cost $1,029,287,319) | | $ | 1,040,076,985 | |
Cash collateral on deposit at broker for swap contracts | | | 900,269 | |
Receivables: | | | | |
Portfolio shares sold | | | 926,564 | |
Dividends and Interest | | | 269,232 | |
Other assets | | | 5,114 | |
| | | | |
Total assets | | | 1,042,178,164 | |
| | | | |
| |
| Liabilities | | | | |
Due to custodian | | | 268,068 | |
Payables: | | | | |
Dividends and interest on OTC swaps contracts | | | 753,007 | |
Portfolio shares redeemed | | | 444,342 | |
Investment securities purchased | | | 267,981 | |
NYLIFE Distributors (See Note 3) | | | 205,635 | |
Shareholder communication | | | 40,505 | |
Professional fees | | | 12,837 | |
Custodian | | | 2,288 | |
Trustees | | | 1,397 | |
Accrued expenses | | | 4,447 | |
| | | | |
Total liabilities | | | 2,000,507 | |
| | | | |
Net assets | | $ | 1,040,177,657 | |
| | | | |
| |
| Composition of Net Assets | | | | |
Shares of beneficial interest outstanding (par value of $.001 per share) unlimited number of shares authorized | | $ | 94,355 | |
Additional paid-in capital | | | 1,020,830,275 | |
| | | | |
| | | 1,020,924,630 | |
Total distributable earnings (loss) | | | 19,253,027 | |
| | | | |
Net assets | | $ | 1,040,177,657 | |
| | | | |
| | | | |
Initial Class | | | | |
Net assets applicable to outstanding shares | | $ | 42,438,604 | |
| | | | |
Shares of beneficial interest outstanding | | | 3,811,301 | |
| | | | |
Net asset value per share outstanding | | $ | 11.13 | |
| | | | |
Service Class | | | | |
Net assets applicable to outstanding shares | | $ | 997,739,053 | |
| | | | |
Shares of beneficial interest outstanding | | | 90,543,527 | |
| | | | |
Net asset value per share outstanding | | $ | 11.02 | |
| | | | |
| | | | | | |
The notes to the financial statements are an integral part of,
and should be read in conjunction with, the financial statements. | | | | | 23 | |
Statement of Operations for the six months ended June 30, 2020 (Unaudited)
| | | | |
| Investment Income (Loss) | | | | |
Income | | | | |
Dividend distributions from affiliated investment companies | | $ | 3,623,443 | |
Interest | | | 923 | |
| | | | |
Total income | | | 3,624,366 | |
| | | | |
Expenses | | | | |
Distribution/Service—Service Class (See Note 3) | | | 1,254,575 | |
Professional fees | | | 52,771 | |
Shareholder communication | | | 49,685 | |
Trustees | | | 13,193 | |
Custodian | | | 6,993 | |
Miscellaneous | | | 16,472 | |
| | | | |
Total expenses | | | 1,393,689 | |
| | | | |
Net investment income (loss) | | | 2,230,677 | |
| | | | |
|
| Realized and Unrealized Gain (Loss) on Investments and Swap Contracts | |
Net realized gain (loss) on: | | | | |
Affiliated investment company transactions | | | 1,521,050 | |
Swap transactions | | | 1,555,885 | |
| | | | |
Net realized gain (loss) on investments from affiliated investment companies and swap transactions | | | 3,076,935 | |
| | | | |
Net change in unrealized appreciation (depreciation) on investments in affiliated investment companies and swap contacts | | | (29,933,921 | ) |
| | | | |
Net realized and unrealized gain (loss) on investments and swap transactions | | | (26,856,986 | ) |
| | | | |
Net increase (decrease) in net assets resulting from operations | | $ | (24,626,309 | ) |
| | | | |
| | | | |
| 24 | | MainStay VP Moderate Allocation Portfolio | | The notes to the financial statements are an integral part of,
and should be read in conjunction with, the financial statements. |
Statements of Changes in Net Assets
for the six months ended June 30, 2020 (Unaudited) and the year ended December 31, 2019
| | | | | | | | |
| | | 2020 | | | 2019 | |
| Increase (Decrease) in Net Assets | |
Operations: | | | | | | | | |
Net investment income (loss) | | $ | 2,230,677 | | | $ | 20,624,923 | |
Net realized gain (loss) on investments and investments from affiliated investment companies and swap transactions | | | 3,076,935 | | | | 32,469,224 | |
Net change in unrealized appreciation (depreciation) on investments in affiliated investment companies and swap contracts | | | (29,933,921 | ) | | | 140,351,475 | |
| | | | |
Net increase (decrease) in net assets resulting from operations | | | (24,626,309 | ) | | | 193,445,622 | |
| | | | |
Distributions to shareholders: | | | | | | | | |
Initial Class | | | — | | | | (3,140,712 | ) |
Service Class | | | — | | | | (76,514,893 | ) |
| | | | |
Total distributions to shareholders | | | — | | | | (79,655,605 | ) |
| | | | |
Capital share transactions: | | | | | | | | |
Net proceeds from sale of shares | | | 25,389,807 | | | | 41,200,942 | |
Net asset value of shares issued to shareholders in reinvestment of distributions | | | — | | | | 79,655,605 | |
Cost of shares redeemed | | | (108,017,416 | ) | | | (233,611,591 | ) |
| | | | |
Increase (decrease) in net assets derived from capital share transactions | | | (82,627,609 | ) | | | (112,755,044 | ) |
| | | | |
Net increase (decrease) in net assets | | | (107,253,918 | ) | | | 1,034,973 | |
| | |
| Net Assets | | | | | | | | |
Beginning of period | | | 1,147,431,575 | | | | 1,146,396,602 | |
| | | | |
End of period | | $ | 1,040,177,657 | | | $ | 1,147,431,575 | |
| | | | |
| | | | | | |
The notes to the financial statements are an integral part of,
and should be read in conjunction with, the financial statements. | | | | | 25 | |
Financial Highlights selected per share data and ratios
| | | | | | | | | | | | | | | | | | | | | | | | | | | | |
| | | |
| | | Six months
ended
June 30, | | | | | | Year ended December 31, | |
| | | | | | | |
| Initial Class | | 2020* | | | | | | 2019 | | | 2018 | | | 2017 | | | 2016 | | | 2015 | |
| | | | | | | |
Net asset value at beginning of period | | $ | 11.32 | | | | | | | $ | 10.33 | | | $ | 11.89 | | | $ | 10.57 | | | $ | 10.59 | | | $ | 12.03 | |
| | | | | | | | | | | | | | | | | | | | | | | | | | | | |
| | | | | | | |
Net investment income (loss) (a) | | | 0.04 | | | | | | | | 0.23 | | | | 0.23 | | | | 0.20 | | | | 0.19 | | | | 0.20 | |
| | | | | | | |
Net realized and unrealized gain (loss) on investments | | | (0.23 | ) | | | | | | | 1.60 | | | | (1.16 | ) | | | 1.36 | | | | 0.48 | | | | (0.39 | ) |
| | | | | | | | | | | | | | | | | | | | | | | | | | | | |
| | | | | | | |
Total from investment operations | | | (0.19 | ) | | | | | | | 1.83 | | | | (0.93 | ) | | | 1.56 | | | | 0.67 | | | | (0.19 | ) |
| | | | | | | | | | | | | | | | | | | | | | | | | | | | |
| | | | | | | |
| Less distributions: | | | | | | | | | | | | | | | | | | | | | | | | | | | | |
| | | | | | | |
From net investment income | | | — | | | | | | | | (0.36 | ) | | | (0.27 | ) | | | (0.19 | ) | | | (0.24 | ) | | | (0.30 | ) |
| | | | | | | |
From net realized gain on investments | | | — | | | | | | | | (0.48 | ) | | | (0.36 | ) | | | (0.05 | ) | | | (0.45 | ) | | | (0.95 | ) |
| | | | | | | | | | | | | | | | | | | | | | | | | | | | |
| | | | | | | |
Total distributions | | | — | | | | | | | | (0.84 | ) | | | (0.63 | ) | | | (0.24 | ) | | | (0.69 | ) | | | (1.25 | ) |
| | | | | | | | | | | | | | | | | | | | | | | | | | | | |
| | | | | | | |
Net asset value at end of period | | $ | 11.13 | | | | | | | $ | 11.32 | | | $ | 10.33 | | | $ | 11.89 | | | $ | 10.57 | | | $ | 10.59 | |
| | | | | | | | | | | | | | | | | | | | | | | | | | | | |
| | | | | | | |
Total investment return (b) | | | (1.68 | %)(c) | | | | | | | 18.29 | % | | | (8.40 | %) | | | 14.97 | % | | | 6.41 | % | | | (1.61 | %) |
| | | | | | | |
| Ratios (to average net assets)/Supplemental Data: | | | | | | | | | | | | | | | | | | | | | | | | | | | | |
| | | | | | | |
Net investment income (loss) | | | 0.67 | % †† | | | | | | | 2.04 | % | | | 1.99 | % | | | 1.79 | % | | | 1.76 | % | | | 1.69 | % |
| | | | | | | |
Net expenses (d) | | | 0.03 | % †† | | | | | | | 0.03 | % | | | 0.02 | % | | | 0.02 | % | | | 0.03 | % | | | 0.02 | % |
| | | | | | | |
Portfolio turnover rate | | | 17 | % | | | | | | | 40 | % | | | 52 | % | | | 33 | % | | | 40 | % | | | 36 | % |
| | | | | | | |
Net assets at end of period (in 000’s) | | $ | 42,439 | | | | | | | $ | 45,283 | | | $ | 43,161 | | | $ | 49,419 | | | $ | 43,873 | | | $ | 41,551 | |
| (a) | Per share data based on average shares outstanding during the period. |
| (b) | Total return does not reflect any deduction of sales charges, mortality and expense charges, contract charges or administrative charges. For periods of less than one year, total return is not annualized. |
| (c) | Total investment return may reflect adjustments to conform to generally accepted accounting principles. |
| (d) | In addition to the fees and expenses which the Portfolio bears directly, it also indirectly bears a pro-rata share of the fees and expenses of the underlying funds in which it invests. Such indirect expenses are not included in the above expense ratios. |
| | | | | | | | | | | | | | | | | | | | | | | | | | | | |
| | | |
| | | Six months
ended
June 30, | | | | | | Year ended December 31, | |
| | | | | | | |
| Service Class | | 2020* | | | | | | 2019 | | | 2018 | | | 2017 | | | 2016 | | | 2015 | |
| | | | | | | |
Net asset value at beginning of period | | $ | 11.22 | | | | | | | $ | 10.23 | | | $ | 11.79 | | | $ | 10.48 | | | $ | 10.51 | | | $ | 11.95 | |
| | | | | | | | | | | | | | | | | | | | | | | | | | | | |
| | | | | | | |
Net investment income (loss) (a) | | | 0.02 | | | | | | | | 0.20 | | | | 0.20 | | | | 0.17 | | | | 0.16 | | | | 0.17 | |
| | | | | | | |
Net realized and unrealized gain (loss) on investments | | | (0.22 | ) | | | | | | | 1.60 | | | | (1.16 | ) | | | 1.36 | | | | 0.47 | | | | (0.39 | ) |
| | | | | | | | | | | | | | | | | | | | | | | | | | | | |
| | | | | | | |
Total from investment operations | | | (0.20 | ) | | | | | | | 1.80 | | | | (0.96 | ) | | | 1.53 | | | | 0.63 | | | | (0.22 | ) |
| | | | | | | | | | | | | | | | | | | | | | | | | | | | |
| | | | | | | |
| Less distributions: | | | | | | | | | | | | | | | | | | | | | | | | | | | | |
| | | | | | | |
From net investment income | | | — | | | | | | | | (0.33 | ) | | | (0.24 | ) | | | (0.17 | ) | | | (0.21 | ) | | | (0.27 | ) |
| | | | | | | |
From net realized gain on investments | | | — | | | | | | | | (0.48 | ) | | | (0.36 | ) | | | (0.05 | ) | | | (0.45 | ) | | | (0.95 | ) |
| | | | | | | | | | | | | | | | | | | | | | | | | | | | |
| | | | | | | |
Total distributions | | | — | | | | | | | | (0.81 | ) | | | (0.60 | ) | | | (0.22 | ) | | | (0.66 | ) | | | (1.22 | ) |
| | | | | | | | | | | | | | | | | | | | | | | | | | | | |
| | | | | | | |
Net asset value at end of period | | $ | 11.02 | | | | | | | $ | 11.22 | | | $ | 10.23 | | | $ | 11.79 | | | $ | 10.48 | | | $ | 10.51 | |
| | | | | | | | | | | | | | | | | | | | | | | | | | | | |
| | | | | | | |
Total investment return (b) | | | (1.78 | %) | | | | | | | 18.00 | % | | | (8.63 | %) | | | 14.68 | % | | | 6.14 | % | | | (1.86 | %) |
| | | | | | | |
| Ratios (to average net assets)/Supplemental Data: | | | | | | | | | | | | | | | | | | | | | | | | | | | | |
| | | | | | | |
Net investment income (loss) | | | 0.42 | % †† | | | | | | | 1.76 | % | | | 1.73 | % | | | 1.53 | % | | | 1.52 | % | | | 1.44 | % |
| | | | | | | |
Net expenses (c) | | | 0.28 | % †† | | | | | | | 0.27 | % | | | 0.27 | % | | | 0.27 | % | | | 0.28 | % | | | 0.27 | % |
| | | | | | | |
Portfolio turnover rate | | | 17 | % | | | | | | | 40 | % | | | 52 | % | | | 33 | % | | | 40 | % | | | 36 | % |
| | | | | | | |
Net assets at end of period (in 000’s) | | $ | 997,739 | | | | | | | $ | 1,102,149 | | | $ | 1,103,235 | | | $ | 1,288,895 | | | $ | 1,171,213 | | | $ | 1,137,619 | |
| (a) | Per share data based on average shares outstanding during the period. |
| (b) | Total return does not reflect any deduction of sales charges, mortality and expense charges, contract charges or administrative charges. For periods of less than one year, total return is not annualized. |
| (c) | In addition to the fees and expenses which the Portfolio bears directly, it also indirectly bears a pro-rata share of the fees and expenses of the underlying funds in which it invests. Such indirect expenses are not included in the above expense ratios. |
| | | | |
| 26 | | MainStay VP Moderate Allocation Portfolio | | The notes to the financial statements are an integral part of,
and should be read in conjunction with, the financial statements. |
MainStay VP Moderate Growth Allocation Portfolio
Investment and Performance Comparison1 (Unaudited)
Performance data quoted represents past performance. Past performance is no guarantee of future results. Because of market volatility and other factors, current performance may be lower or higher than the figures shown. Investment return and principal value will fluctuate, and as a result, when shares are redeemed, they may be worth more or less than their original cost. The performance table and graph do not reflect any deduction of sales charges mortality and expense charges, contract charges, or administrative charges. Please refer to the Performance Summary appropriate for your policy. For performance information current to the most recent month-end, please call 800-598-2019 or visit www.newyorklife.com.

Average Annual Total Returns for the Period-Ended June 30, 2020
| | | | | | | | | | | | | | | | | | | | | | |
| Class | | Inception
Date | | Six Months | | | One Year | | | Five Years | | | Ten Years | | | Gross
Expense
Ratio2 | |
| | | | | | |
| Initial Class Shares | | 2/13/2006 | | | –5.34 | % | | | 0.95 | % | | | 4.49 | % | | | 8.68 | % | | | 0.80 | % |
| Service Class Shares | | 2/13/2006 | | | –5.46 | | | | 0.70 | | | | 4.23 | | | | 8.41 | | | | 1.05 | |
| | | | | | | | | | | | | | | | |
| Benchmark Performance | | Six
Months | | | One
Year | | | Five
Years | | | Ten
Years | |
| | | | |
S&P 500® Index3 | | | –3.08 | % | | | 7.51 | % | | | 10.73 | % | | | 13.99 | % |
MSCI EAFE® Index4 | | | –11.34 | | | | –5.13 | | | | 2.05 | | | | 5.73 | |
Bloomberg Barclays U.S. Aggregate Bond Index5 | | | 6.14 | | | | 8.74 | | | | 4.30 | | | | 3.82 | |
Moderate Growth Allocation Composite Index6 | | | –2.72 | | | | 5.50 | | | | 7.88 | | | | 10.54 | |
Morningstar Allocation—70% to 85% Equity Category Average7 | | | –6.66 | | | | –0.53 | | | | 4.87 | | | | 8.41 | |
| 1. | Performance figures may reflect certain fee waivers and/or expense limitations, without which total returns may have been different. For information on current fee waivers and/or expense limitations (if any), please refer to the Notes to Financial Statements. |
| 2. | The gross expense ratios presented reflect the Portfolio’s “Total Annual Portfolio Operating Expenses” from the most recent Prospectus, as supplemented, and may differ from other expense ratios disclosed in this report. |
| 3. | The S&P 500® Index is the Portfolio’s primary broad-based securities market index for comparison purposes. “S&P 500®” is a trademark of The McGraw-Hill Companies, Inc. The S&P 500® Index is widely regarded as the standard index for measuring large-cap U.S. stock market performance. Results assume reinvestment of all dividends and capital gains. An investment cannot be made directly in an index. |
| 4. | The MSCI EAFE® Index is the Portfolio’s secondary benchmark. The MSCI EAFE® Index consists of international stocks representing the developed world outside of North America. Results assume reinvestment of all dividends and capital gains. An investment cannot be made directly in an index. |
| 5. | The Portfolio has selected the Bloomberg Barclays U.S. Aggregate Bond Index as an additional benchmark. The Bloomberg Barclays U.S. Aggregate |
| | Bond Index is a broad-based benchmark that measures performance of the investment-grade, U.S. dollar-denominated, fixed-rate taxable bond market, including Treasurys, government-related and corporate securities, mortgage-backed securities (agency fixed-rate and hybrid adjustable-rate mortgage pass-throughs), asset-backed securities and commercial mortgage-backed securities. Results assume reinvestment of all dividends and capital gains. An investment cannot be made directly in an index. |
| 6. | The Portfolio has selected the Moderate Growth Allocation Composite Index as an additional benchmark. The Moderate Growth Allocation Composite Index consists of the S&P 500® Index, the MSCI EAFE® Index and the Bloomberg Barclays U.S. Aggregate Bond Index weighted 60%, 20% and 20%, respectively. Results assume reinvestment of all dividends and capital gains. An investment cannot be made directly in an index. |
| 7. | The Morningstar Allocation—70% to 85% Equity Category Average is representative of funds that seek to provide both income and capital appreciation by investing in multiple asset classes, including stocks, bonds, and cash. These funds are dominated by domestic holdings and have equity exposures between 70% and 85%. Results are based on average total returns of similar funds with all dividends and capital gain distributions reinvested. |
Cost in Dollars of a $1,000 Investment in MainStay VP Moderate Growth Allocation Portfolio (Unaudited)
The example below is intended to describe the fees and expenses borne by shareholders during the six-month period from January 1, 2020, to June 30, 2020, and the impact of those costs on your investment.
Example
As a shareholder of the Portfolio you incur two types of costs: (1) transaction costs, including exchange fees and sales charges (loads) on purchases (as applicable), and (2) ongoing costs, including management fees, distribution and/or service (12b-1) fees, and other Portfolio expenses (as applicable). This example is intended to help you understand your ongoing costs (in dollars) of investing in the Portfolio and to compare these costs with the ongoing costs of investing in other mutual funds. The example is based on an investment of $1,000 made at the beginning of the six-month period and held for the entire period from January 1, 2020, to June 30, 2020. Shares are only sold in connection with variable life and annuity contracts and the example does not reflect any contract level or transactional fees or expenses. If these costs had been included, your costs would have been higher.
This example illustrates your Portfolio’s ongoing costs in two ways:
Actual Expenses
The second and third data columns in the table below provide information about actual account values and actual expenses. You may use the information in these columns, together with the amount you invested, to estimate the expenses that you paid during the six months ended June 30, 2020. Simply divide your account value by $1,000
(for example, an $8,600 account value divided by $1,000 = 8.6), then multiply the result by the number under the heading entitled “Expenses Paid During Period” to estimate the expenses you paid on your account during this period.
Hypothetical Example for Comparison Purposes
The fourth and fifth data columns in the table below provide information about hypothetical account values and hypothetical expenses based on the Portfolio’s actual expense ratio and an assumed rate of return of 5% per year before expenses, which is not the Portfolio’s actual return. The hypothetical account values and expenses may not be used to estimate the actual ending account balances or expenses you paid for the six-month period shown. You may use this information to compare the ongoing costs of investing in the Portfolio with the ongoing costs of investing in other mutual funds. To do so, compare this 5% hypothetical example with the 5% hypothetical examples that appear in the shareholder reports of the other mutual funds.
Please note that the expenses shown in the table are meant to highlight your ongoing costs only and do not reflect any transactional costs, such as exchange fees or sales charges (loads). Therefore, the fourth and fifth data columns of the table are useful in comparing ongoing costs only and will not help you determine the relative total costs of owning different funds. In addition, if these transactional costs were included, your costs would have been higher.
| | | | | | | | | | | | | | | | | | | | | | |
| | | | | | | | | | | | | | | | | | |
| Share Class | | Beginning
Account
Value
1/1/20 | | | Ending Account
Value (Based
on Actual
Returns and
Expenses)
6/30/20 | | | Expenses
Paid
During
Period1 | | | Ending Account
Value (Based on
Hypothetical
5% Annualized
Return and
Actual Expenses)
6/30/20 | | | Expenses
Paid
During
Period1 | | | Net Expense
Ratio
During
Period2 |
| | | | | | |
| Initial Class Shares | | $ | 1,000.00 | | | $ | 946.60 | | | $ | 0.15 | | | $ | 1,024.71 | | | $ | 0.15 | | | 0.03% |
| | | | | | |
| Service Class Shares | | $ | 1,000.00 | | | $ | 945.40 | | | $ | 1.35 | | | $ | 1,023.47 | | | $ | 1.41 | | | 0.28% |
| 1. | Expenses are equal to the Portfolio’s annualized expense ratio of each class multiplied by the average account value over the period, divided by 366 and multiplied by 182 (to reflect the six-month period). The table above represents the actual expenses incurred during the six-month period. In addition to the fees and expenses which the Portfolio bears directly, it also indirectly bears a pro rata share of the fees and expenses of the Underlying Portfolios/Funds in which it invests. Such indirect expenses are not included in the above-reported expense figures. |
| 2. | Expenses are equal to the Portfolio’s annualized expense ratio to reflect the six-month period. |
| | |
| 28 | | MainStay VP Moderate Growth Allocation Portfolio |
Investment Objectives of Underlying Portfolios/Funds as of June 30, 2020 (Unaudited)

See Portfolio of Investments beginning on page 32 for specific holdings within these categories. The Portfolio’s holdings are subject to change.
Portfolio Management Discussion and Analysis (Unaudited)
Answers to the questions reflect the views of portfolio managers Jae S. Yoon, CFA, Jonathan Swaney, Poul Kristensen, CFA, and Amit Soni, CFA, of New York Life Investments,1 the Portfolio’s Manager.
How did MainStay VP Moderate Growth Allocation Portfolio perform relative to its benchmarks and peers during the six months ended June 30, 2020?
For the six months ended June 30, 2020, MainStay VP Moderate Growth Allocation Portfolio returned –5.34% for Initial Class shares and –5.46% for Service Class shares. Over the same period, both share classes underperformed the –3.08% return of the S&P 500® Index, which is the Portfolio’s primary benchmark, and outperformed the –11.34% return of the MSCI EAFE® Index, which is a secondary benchmark of the Portfolio. For the six months ended June 30, 2020, both share classes underperformed the 6.14% return of the Bloomberg Barclays U.S. Aggregate Bond Index and the –2.72% return of the Moderate Growth Allocation Composite Index, which are additional benchmarks of the Portfolio. Over the same period, both share classes outperformed the –6.66% return of the Morningstar Allocation—70% to 85% Equity Category Average.2
What factors affected the Portfolio’s relative performance during the reporting period?
The Portfolio is a “fund of funds,” meaning that it seeks to achieve its investment objective by investing primarily in mutual funds and exchange-traded funds (“ETFs”) managed by New York Life Investments or its affiliates (the “Underlying Portfolios/Funds”). The Underlying Portfolios/Funds may invest in U.S. equities, international equities and fixed-income instruments, making comparisons to any single index generally less suitable than a weighted combination of indices, which is a more useful yardstick by which to measure performance. The most influential factor affecting relative performance for the Portfolio versus the performance of a weighted combination of indices is the net performance of the Underlying Portfolios/Funds relative to their respective benchmarks.
During the reporting period, the Portfolio’s asset class policy drove excess returns. Broadly, the Portfolio benefited from a posture that was aggressively risk-off when the market was in decline and less so as the market rebounded in late March, April and May 2020. Conversely, the performance of the Underlying Portfolio/Fund holdings in aggregate with respect to the Portfolio’s desired mix of asset class exposures detracted from relative performance. A few of the vehicles that struggled to achieve their objective include the MainStay Epoch U.S. All Cap Fund, MainStay VP T. Rowe Price Equity Income Portfolio and IQ 500 International ETF.
During the reporting period, how was the Portfolio’s performance materially affected by investments in derivatives?
Total return swaps were used to express most of the Portfolio’s asset class policy views and can be seen as contributing positively
to active return. They were also used to curb larger systematic risk observable within the pool of Underlying Portfolios/Funds. In addition, derivatives enhanced the Portfolio’s returns to a small degree by helping rein in exposure to the underperforming value risk factor.
How did you allocate the Portfolio’s assets during the reporting period and why?
Eleven-plus years into an expansion, the U.S. economy entered the reporting period showing signs of strain. That, coupled with what we believed to be rather ambitious valuations, led us to skew the Portfolio away from risk assets. When the SARS-CoV-2 virus arrived, the Portfolio was tilted away from both equities and credit. That posture paid off handsomely as the market declined through late March 2020. We gradually reallocated back into equities, reducing the Portfolio’s underweight exposure, although never quite getting all the way back to neutral. We then reversed course, selling Underlying Equity Funds amid a strongly rallying market through April and May 2020. By June 30, 2020, we had gone round trip, underweight both equity and credit on a scale similar to the Portfolio’s position in mid-February 2020.
Within equities, results were mixed. The Portfolio generally tilted to favor large-cap stocks, reflecting our view that small companies were likely to be more vulnerable to lockdown-induced damage than larger firms with better access to capital markets and stronger balance sheets to fall back upon. While that bias was well rewarded, it was offset by the Portfolio’s bias toward value stocks. Concerned with an excessive valuation gap and anticipating mounting regulatory pressure on technology firms, we were somewhat pessimistic about the prospects for growth names. But then the work-from-home, play-from-home lockdowns provided a lift to many large-cap technology companies, detracting from Portfolio returns.
Several positioning decisions bolstered the performance of the fixed-income portion of the Portfolio. The most significant was a reallocation away from leveraged loans, which fell sharply along with equities in March, without fully recouping those losses during the spring. Also helpful was active exposure to long-maturity Treasury bonds and taxable municipal bonds.
How did the Portfolio’s allocations change over the course of the reporting period?
Several significant shifts occurred among the Portfolio’s allocations during the reporting period. Among the largest was a move away from acquiring exposure to investment-grade bonds by using a total return swap, investing instead directly in the MainStay VP Indexed Bond Portfolio. Another significant change involved a shift away from MainStay MacKay U.S. Equity Opportunities Fund and MainStay VP MacKay Common Stock Portfolio
| 1. | “New York Life Investments” is a service mark used by New York Life Investment Management Holdings LLC and its subsidiary New York Life Investment Management LLC. |
| 2. | See page 27 for more information on benchmark and peer group returns. |
| | |
| 30 | | MainStay VP Moderate Growth Allocation Portfolio |
into MainStay VP MacKay S&P 500 Index Portfolio. We based this adjustment on our judgment that the Portfolio’s aggregate exposure to active quantitative strategies was larger than might be helpful, and that a pivot to a passive implementation could be beneficial within the prevailing environment.
Several new positions were introduced during the reporting period, including swap exposure to iShares 20+ Year Treasury Bond ETF, a direct position in IQ Candriam ESG International ETF and swap exposure to VanEck Vectors Gold Miners ETF. Likewise, several positions were closed, including IQ Global Resources ETF, MainStay High Yield Municipal Bond Fund, MainStay VP Convertible Portfolio and MainStay VP Unconstrained Bond Portfolio.
Which Underlying Equity Portfolios/Funds had the highest total returns during the reporting period, and which Underlying Equity Portfolios/Funds had the lowest total returns?
Of the Underlying Equity Portfolios/Funds held during the reporting period, the highest total returns came from the technology-heavy MainStay VP Large Cap Growth Portfolio and MainStay VP MacKay Growth Portfolio. The MainStay Epoch Capital Growth Fund, a global equity product, also delivered positive returns. The most significant losses were posted by IQ Chaikin U.S. Small Cap ETF, MainStay VP T. Rowe Price Equity Income Portfolio and MainStay VP MacKay Small Cap Core Portfolio.
Which Underlying Equity Portfolios/Funds made the strongest positive contributions to the Portfolio’s overall performance, and which Underlying Equity Portfolios/Funds were the greatest detractors?
Among the Underlying Equity Portfolios/Funds making the most significant positive contributions to the Portfolio’s equity returns
were MainStay VP Large Cap Growth Portfolio, MainStay VP MacKay S&P 500 Index Portfolio and MainStay VP MacKay Growth Portfolio. (Contributions take weightings and total returns into account.) The greatest detractions came from MainStay VP T. Rowe Price Equity Income Portfolio, MainStay VP Epoch U.S. Equity Yield Portfolio and IQ 500 International ETF.
What factors and risks affected the Portfolio’s Underlying Fixed-Income Portfolio/Fund investments during the reporting period?
To combat the economic impact of the growing pandemic, the U.S. Federal Reserve engaged in a battery of extraordinary measures, driving yields down (and prices up) across the maturity spectrum for high-grade bonds. At the same time, solvency concerns resulted in a moderate widening of credit spreads.3 These two dynamics dictated, to a large degree, the winners and losers within fixed-income markets over the past six months. High-grade, long-duration4 bonds with significant sensitivity to interest rates fared very well (the longest maturity Treasury bonds, for example, posted large positive returns), whereas lower credit quality instruments, such as high-yield bonds and bank loans, lagged significantly.
Which Underlying Fixed-Income Portfolios/Funds made the strongest positive contributions to the Portfolio’s performance, and which Underlying Fixed-Income Portfolios/Funds were the greatest detractors?
The Underlying Fixed-Income Portfolios/Funds that made the strongest positive contributions to return included MainStay VP Indexed Bond Portfolio and MainStay VP Bond Portfolio. The most significant detractors were MainStay Short Duration High Yield Fund and MainStay VP Floating Rate Portfolio.
| 3. | The terms “spread” and “yield spread” may refer to the difference in yield between a security or type of security and comparable U.S. Treasury issues. The terms may also refer to the difference in yield between two specific securities or types of securities at a given time. The term “credit spread” typically refers to the difference in yield between corporate or municipal bonds (or a specific category of these bonds) and comparable U.S. Treasury issues. |
| 4. | Duration is a measure of the price sensitivity of a fixed-income investment to changes in interest rates. Duration is expressed as a number of years and is considered a more accurate sensitivity gauge than average maturity. |
The opinions expressed are those of the portfolio managers as of the date of this report and are subject to change. There is no guarantee that any forecasts will come to pass. This material does not constitute investment advice and is not intended as an endorsement of any specific investment.
Not all MainStay VP Portfolios and/or share classes are available under all policies.
Portfolio of Investments June 30, 2020 (Unaudited)
| | | | | | | | |
| | |
Shares | | | Value | |
| | | | | | | | |
| Affiliated Investment Companies 96.9%† | |
Equity Funds 77.1% | |
IQ 50 Percent Hedged FTSE International ETF (a) | | | 1,861,124 | | | $ | 36,025,963 | |
IQ 500 International ETF (a) | | | 2,661,128 | | | | 62,959,894 | |
IQ Candriam ESG International Equity ETF (a) | | | 813,402 | | | | 18,626,743 | |
IQ Candriam ESG U.S. Equity ETF | | | 31,167 | | | | 817,965 | |
IQ Chaikin U.S. Large Cap ETF (a) | | | 2,573,370 | | | | 59,789,164 | |
IQ Chaikin U.S. Small Cap ETF (a) | | | 583,166 | | | | 12,614,697 | |
MainStay Epoch Capital Growth Fund Class I (a) | | | 1,339,232 | | | | 18,133,204 | |
MainStay Epoch International Choice Fund Class I (a) | | | 2,059,736 | | | | 68,115,475 | |
MainStay Epoch U.S. All Cap Fund Class R6 (a) | | | 2,344,182 | | | | 56,822,967 | |
MainStay MacKay International Opportunities Fund Class I (a) | | | 9,348,285 | | | | 59,361,609 | |
MainStay MAP Equity Fund Class I (a) | | | 2,455,552 | | | | 95,422,770 | |
MainStay VP Emerging Markets Equity Portfolio Initial Class (a) | | | 7,505,035 | | | | 66,668,729 | |
MainStay VP Epoch U.S. Equity Yield Portfolio Initial Class (a) | | | 7,900,242 | | | | 108,841,635 | |
MainStay VP MacKay Common Stock Portfolio Initial Class (a) | | | 939,758 | | | | 24,169,831 | |
MainStay VP MacKay Growth Portfolio Initial Class (a) | | | 2,270,306 | | | | 79,094,507 | |
MainStay VP MacKay International Equity Portfolio Initial Class (a) | | | 1,499,869 | | | | 23,313,511 | |
MainStay VP MacKay Mid Cap Core Portfolio Initial Class (a) | | | 6,368,410 | | | | 75,981,500 | |
MainStay VP MacKay S&P 500 Index Portfolio Initial Class (a) | | | 1,338,506 | | | | 79,998,910 | |
MainStay VP MacKay Small Cap Core Portfolio Initial Class (a) | | | 5,156,583 | | | | 45,394,430 | |
MainStay VP Small Cap Growth Portfolio Initial Class (a) | | | 7,638,690 | | | | 101,969,641 | |
MainStay VP T. Rowe Price Equity Income Portfolio Initial Class (a) | | | 10,198,013 | | | | 106,337,739 | |
MainStay VP Winslow Large Cap Growth Portfolio Initial Class (a) | | | 3,791,270 | | | | 108,412,492 | |
| | | | | | | | |
Total Equity Funds
(Cost $1,364,471,295) | | | | | | | 1,308,873,376 | |
| | | | | | | | |
|
Fixed Income Funds 19.8% | |
IQ S&P High Yield Low Volatility Bond ETF (a) | | | 700,200 | | | | 16,972,848 | |
MainStay MacKay Infrastructure Bond Fund Class R6 (a) | | | 3,802,496 | | | | 33,576,037 | |
MainStay MacKay Short Duration High Yield Fund Class I (a) | | | 9,320,167 | | | | 86,677,552 | |
| | | | | | | | |
| | |
Shares | | | Value | |
| | | | | | | | |
Fixed Income Funds (continued) | |
MainStay Short Term Bond Class I (a) | | | 1,846,633 | | | $ | 19,703,571 | |
MainStay VP Bond Portfolio Initial Class (a) | | | 2,464,391 | | | | 37,875,478 | |
MainStay VP Floating Rate Portfolio Initial Class (a) | | | 1,039,689 | | | | 8,695,230 | |
MainStay VP Indexed Bond Portfolio Initial Class (a) | | | 10,102,254 | | | | 114,199,924 | |
MainStay VP PIMCO Real Return Portfolio Initial Class (a) | | | 2,057,570 | | | | 18,847,748 | |
| | | | | | | | |
Total Fixed Income Funds
(Cost $336,313,314) | | | | | | | 336,548,388 | |
| | | | | | | | |
Total Affiliated Investment Companies
(Cost $1,700,784,609) | | | | | | | 1,645,421,764 | |
| | | | | | | | |
| | |
| Short-Term Investment 3.2% | | | | | | | | |
Affiliated Investment Company 3.2% | | | | | | | | |
MainStay U.S. Government Liquidity Fund, 0.05% (a)(b) | | | 55,031,824 | | | | 55,031,824 | |
| | | | | | | | |
Total Short-Term Investment
(Cost $55,031,824) | | | | | | | 55,031,824 | |
| | | | | | | | |
Total Investments
(Cost $1,755,816,433) | | | 100.1 | % | | | 1,700,453,588 | |
Other Assets, Less Liabilities | | | (0.1 | ) | | | (2,391,626 | ) |
Net Assets | | | 100.0 | % | | $ | 1,698,061,962 | |
| † | Percentages indicated are based on Portfolio net assets. |
| (a) | As of June 30, 2020, the Portfolio’s ownership exceeds 5% of the outstanding shares of the Underlying Portfolio’s/Fund’s share class. |
| (b) | Current yield as of June 30, 2020. |
| | | | |
| 32 | | MainStay VP Moderate Growth Allocation Portfolio | | The notes to the financial statements are an integral part of,
and should be read in conjunction with, the financial statements. |
Swap Contracts
Open OTC total return swap contracts as of June 30, 2020 were as follows1:
| | | | | | | | | | | | | | | | | | | | |
Swap
Counterparty | | Reference Obligation | | Floating Rate2 | | Termination
Date(s) | | | Payment
Frequency
Paid/ Received | | | Notional
Amount
Long/
(Short)
(000)* | | | Unrealized
Appreciation3 | |
| | | | | | |
Citigroup | | iShares 20+ Year Treasury Bond ETF | | 1 month LIBOR BBA plus 0.40% | | | 12/01/2020 | | | | Monthly | | | | 26,712 | | | $ | — | |
Citigroup | | iShares MSCI EAFE ETF | | 1 month LIBOR BBA minus 0.40% | | | 12/01/2020 | | | | Monthly | | | | (8,235 | ) | | | — | |
Citigroup | | iShares MSCI Emerging Markets ETF | | 1 month LIBOR BBA minus 0.65% | | | 12/01/2020 | | | | Monthly | | | | (8,116 | ) | | | — | |
Citigroup | | Russell 1000 Value Total Return Index | | 1 month LIBOR BBA plus 0.36% | | | 12/07/2020 | | | | Monthly | | | | 41,400 | | | | — | |
Citigroup | | Russell 2000 Total Return Index | | 1 month LIBOR BBA minus 0.01% | | | 12/07/2020 | | | | Monthly | | | | (30,617 | ) | | | — | |
Citigroup | | Russell Midcap Total Return Index | | 1 month LIBOR BBA minus 0.181% | | | 12/07/2020 | | | | Monthly | | | | (24,980 | ) | | | — | |
Citigroup | | S&P 500 Total Return Index | | 1 month LIBOR BBA plus 0.25% | | | 10/26/2020 | | | | Monthly | | | | 24,063 | | | | — | |
Citigroup | | VanEck Vectors Gold Miners ETF | | 1 month LIBOR BBA plus 0.50% | | | 12/01/2020 | | | | Monthly | | | | 9,087 | | | | — | |
| 1 | As of June 30, 2020, cash in the amount of $1,357,819 was pledged from brokers for OTC swap contracts. |
| 2 | Fund pays the floating rate and receives the total return of the reference entity. |
| 3. | Reflects the value at reset date as of June 30, 2020. |
| * | Notional amounts reflected as a positive value indicate a long position held by the Portfolio or Index and a negative value indicates a short position. |
The following abbreviations are used in the preceding pages:
BBA—British Bankers’ Association
ETF—Exchange-Traded Fund
FTSE—Financial Times Stock Exchange
LIBOR—London Interbank Offered Rate
The following is a summary of the fair valuations according to the inputs used as of June 30, 2020, for valuing the Portfolio’s assets:
| | | | | | | | | | | | | | | | |
Description | | Quoted
Prices in
Active
Markets for
Identical
Assets
(Level 1) | | | Significant
Other
Observable
Inputs
(Level 2) | | | Significant
Unobservable
Inputs
(Level 3) | | | Total | |
| | | | |
Asset Valuation Inputs | | | | | | | | | | | | | | | | |
| Investments (a) | | | | | | | | | | | | | | | | |
| Affiliated Investment Companies | | | | | | | | | | | | | | | | |
Equity Funds | | $ | 1,308,873,376 | | | $ | — | | | $ | — | | | $ | 1,308,873,376 | |
Fixed Income Funds | | | 336,548,388 | | | | — | | | | — | | | | 336,548,388 | |
Short-Term Investment | | | 55,031,824 | | | | — | | | | — | | | | 55,031,824 | |
| | | | | | | | | | | | | | | | |
| Total Investments in Securities | | $ | 1,700,453,588 | | | $ | — | | | $ | — | | | $ | 1,700,453,588 | |
| | | | | | | | | | | | | | | | |
| (a) | For a complete listing of investments, see the Portfolio of Investments. |
| | | | | | |
The notes to the financial statements are an integral part of,
and should be read in conjunction with, the financial statements. | | | | | 33 | |
Statement of Assets and Liabilities as of June 30, 2020 (Unaudited)
| | | | |
| Assets | | | | |
Investment in affiliated investment companies, at value (identified cost $1,755,816,433) | | $ | 1,700,453,588 | |
Cash collateral on deposit at broker for swap contracts | | | 1,357,819 | |
Receivables: | | | | |
Dividends and Interest | | | 442,337 | |
Portfolio shares sold | | | 46,980 | |
Other assets | | | 9,488 | |
| | | | |
Total assets | | | 1,702,310,212 | |
| | | | |
| |
| Liabilities | | | | |
Due to custodian | | | 626,456 | |
Payables: | | | | |
Portfolio shares redeemed | | | 1,487,394 | |
Dividends and interest on OTC swaps contracts | | | 1,272,652 | |
Investment securities purchased | | | 440,451 | |
NYLIFE Distributors (See Note 3) | | | 334,343 | |
Shareholder communication | | | 70,633 | |
Professional fees | | | 7,000 | |
Trustees | | | 2,384 | |
Accrued expenses | | | 6,937 | |
| | | | |
Total liabilities | | | 4,248,250 | |
| | | | |
Net assets | | $ | 1,698,061,962 | |
| | | | |
| |
| Composition of Net Assets | | | | |
Shares of beneficial interest outstanding (par value of $.001 per share) unlimited number of shares authorized | | $ | 157,697 | |
Additional paid-in capital | | | 1,727,191,715 | |
| | | | |
| | | 1,727,349,412 | |
Total distributable earnings (loss) | | | (29,287,450 | ) |
| | | | |
Net assets | | $ | 1,698,061,962 | |
| | | | |
| | | | |
Initial Class | | | | |
Net assets applicable to outstanding shares | | $ | 84,694,992 | |
| | | | |
Shares of beneficial interest outstanding | | | 7,774,806 | |
| | | | |
Net asset value per share outstanding | | $ | 10.89 | |
| | | | |
Service Class | | | | |
Net assets applicable to outstanding shares | | $ | 1,613,366,970 | |
| | | | |
Shares of beneficial interest outstanding | | | 149,922,121 | |
| | | | |
Net asset value per share outstanding | | $ | 10.76 | |
| | | | |
| | | | |
| 34 | | MainStay VP Moderate Growth Allocation Portfolio | | The notes to the financial statements are an integral part of,
and should be read in conjunction with, the financial statements. |
Statement of Operations for the six months ended June 30, 2020 (Unaudited)
| | | | |
| Investment Income (Loss) | |
Income | | | | |
Dividend distributions from affiliated investment companies | | $ | 6,406,436 | |
Interest | | | 2,354 | |
| | | | |
Total income | | | 6,408,790 | |
| | | | |
Expenses | | | | |
Distribution/Service—Service Class (See Note 3) | | | 2,044,880 | |
Shareholder communication | | | 84,656 | |
Professional fees | | | 72,021 | |
Trustees | | | 22,096 | |
Custodian | | | 8,111 | |
Miscellaneous | | | 26,373 | |
| | | | |
Total expenses | | | 2,258,137 | |
| | | | |
Net investment income (loss) | | | 4,150,653 | |
| | | | |
|
| Realized and Unrealized Gain (Loss) on Investments and Swap Contracts | |
Net realized gain (loss) on: | | | | |
Affiliated investment company transactions | | | (11,708,806 | ) |
Swap transactions | | | (255,064 | ) |
| | | | |
Net realized gain (loss) on investments from affiliated investment companies and swap transactions | | | (11,963,870 | ) |
| | | | |
Net change in unrealized appreciation (depreciation) on investments in affiliated investment companies and swap contacts | | | (101,309,529 | ) |
| | | | |
Net realized and unrealized gain (loss) on investments and swap transactions | | | (113,273,399 | ) |
| | | | |
Net increase (decrease) in net assets resulting from operations | | $ | (109,122,746 | ) |
| | | | |
| | | | | | |
The notes to the financial statements are an integral part of,
and should be read in conjunction with, the financial statements. | | | | | 35 | |
Statements of Changes in Net Assets
for the six months ended June 30, 2020 (Unaudited) and the year ended December 31, 2019
| | | | | | | | |
| | | 2020 | | | 2019 | |
| Increase (Decrease) in Net Assets | |
Operations: | | | | | | | | |
Net investment income (loss) | | $ | 4,150,653 | | | $ | 38,255,096 | |
Net realized gain (loss) on investments and investments from affiliated investment companies and swap transactions | | | (11,963,870 | ) | | | 66,624,041 | |
Net change in unrealized appreciation (depreciation) on investments in affiliated investment companies and swap contracts | | | (101,309,529 | ) | | | 277,110,351 | |
| | | | |
Net increase (decrease) in net assets resulting from operations | | | (109,122,746 | ) | | | 381,989,488 | |
| | | | |
Distributions to shareholders: | | | | | | | | |
Initial Class | | | — | | | | (9,016,002 | ) |
Service Class | | | — | | | | (184,374,621 | ) |
| | | | |
Total distributions to shareholders | | | — | | | | (193,390,623 | ) |
| | | | |
Capital share transactions: | | | | | | | | |
Net proceeds from sale of shares | | | 21,387,888 | | | | 25,257,054 | |
Net asset value of shares issued to shareholders in reinvestment of distributions | | | — | | | | 193,390,623 | |
Cost of shares redeemed | | | (174,452,715 | ) | | | (377,103,948 | ) |
| | | | |
Increase (decrease) in net assets derived from capital share transactions | | | (153,064,827 | ) | | | (158,456,271 | ) |
| | | | |
Net increase (decrease) in net assets | | | (262,187,573 | ) | | | 30,142,594 | |
|
| Net Assets | |
Beginning of period | | | 1,960,249,535 | | | | 1,930,106,941 | |
| | | | |
End of period | | $ | 1,698,061,962 | | | $ | 1,960,249,535 | |
| | | | |
| | | | |
| 36 | | MainStay VP Moderate Growth Allocation Portfolio | | The notes to the financial statements are an integral part of,
and should be read in conjunction with, the financial statements. |
Financial Highlights selected per share data and ratios
| | | | | | | | | | | | | | | | | | | | | | | | | | | | |
| | | |
| | | Six months
ended
June 30, | | | | | | Year ended December 31, | |
| | | | | | | |
| Initial Class | | 2020* | | | | | | 2019 | | | 2018 | | | 2017 | | | 2016 | | | 2015 | |
| | | | | | | |
Net asset value at beginning of period | | $ | 11.51 | | | | | | | $ | 10.57 | | | $ | 12.61 | | | $ | 11.00 | | | $ | 11.08 | | | $ | 12.78 | |
| | | | | | | | | | | | | | | | | | | | | | | | | | | | |
| | | | | | | |
Net investment income (loss) (a) | | | 0.04 | | | | | | | | 0.26 | | | | 0.21 | | | | 0.17 | | | | 0.18 | | | | 0.17 | |
| | | | | | | |
Net realized and unrealized gain (loss) on investments | | | (0.66 | ) | | | | | | | 1.91 | | | | (1.47 | ) | | | 1.86 | | | | 0.64 | | | | (0.49 | ) |
| | | | | | | | | | | | | | | | | | | | | | | | | | | | |
| | | | | | | |
Total from investment operations | | | (0.62 | ) | | | | | | | 2.17 | | | | (1.26 | ) | | | 2.03 | | | | 0.82 | | | | (0.32 | ) |
| | | | | | | | | | | | | | | | | | | | | | | | | | | | |
| | | | | | | |
| Less distributions: | | | | | | | | | | | | | | | | | | | | | | | | | | | | |
| | | | | | | |
From net investment income | | | — | | | | | | | | (0.39 | ) | | | (0.24 | ) | | | (0.18 | ) | | | (0.24 | ) | | | (0.30 | ) |
| | | | | | | |
From net realized gain on investments | | | — | | | | | | | | (0.84 | ) | | | (0.54 | ) | | | (0.24 | ) | | | (0.66 | ) | | | (1.08 | ) |
| | | | | | | | | | | | | | | | | | | | | | | | | | | | |
| | | | | | | |
Total distributions | | | — | | | | | | | | (1.23 | ) | | | (0.78 | ) | | | (0.42 | ) | | | (0.90 | ) | | | (1.38 | ) |
| | | | | | | | | | | | | | | | | | | | | | | | | | | | |
| | | | | | | |
Net asset value at end of period | | $ | 10.89 | | | | | | | $ | 11.51 | | | $ | 10.57 | | | $ | 12.61 | | | $ | 11.00 | | | $ | 11.08 | |
| | | | | | | | | | | | | | | | | | | | | | | | | | | | |
| | | | | | | |
Total investment return (b) | | | (5.39 | %)(c) | | | | | | | 21.42 | % | | | (10.73 | %) | | | 18.62 | % | | | 7.56 | % | | | (2.35 | %) |
| | | | | | | |
| Ratios (to average net assets)/Supplemental Data: | | | | | | | | | | | | | | | | | | | | | | | | | | | | |
| | | | | | | |
Net investment income (loss) | | | 0.73 | % †† | | | | | | | 2.22 | % | | | 1.71 | % | | | 1.43 | % | | | 1.60 | % | | | 1.38 | % |
| | | | | | | |
Net expenses (d) | | | 0.03 | % †† | | | | | | | 0.02 | % | | | 0.02 | % | | | 0.02 | % | | | 0.03 | % | | | 0.02 | % |
| | | | | | | |
Portfolio turnover rate | | | 16 | % | | | | | | | 41 | % | | | 44 | % | | | 31 | % | | | 33 | % | | | 34 | % |
| | | | | | | |
Net assets at end of period (in 000’s) | | $ | 84,695 | | | | | | | $ | 91,615 | | | $ | 80,133 | | | $ | 90,089 | | | $ | 76,025 | | | $ | 68,000 | |
| (a) | Per share data based on average shares outstanding during the period. |
| (b) | Total return does not reflect any deduction of sales charges, mortality and expense charges, contract charges or administrative charges. For periods of less than one year, total return is not annualized. |
| (c) | Total investment return may reflect adjustments to conform to generally accepted accounting principles. |
| (d) | In addition to the fees and expenses which the Portfolio bears directly, it also indirectly bears a pro-rata share of the fees and expenses of the underlying funds in which it invests. Such indirect expenses are not included in the above expense ratios. |
| | | | | | | | | | | | | | | | | | | | | | | | | | | | |
| | | |
| | | Six months
ended
June 30, | | | | | | Year ended December 31, | |
| | | | | | | |
| Service Class | | 2020* | | | | | | 2019 | | | 2018 | | | 2017 | | | 2016 | | | 2015 | |
| | | | | | | |
Net asset value at beginning of period | | $ | 11.38 | | | | | | | $ | 10.47 | | | $ | 12.49 | | | $ | 10.90 | | | $ | 10.99 | | | $ | 12.68 | |
| | | | | | | | | | | | | | | | | | | | | | | | | | | | |
| | | | | | | |
Net investment income (loss) (a) | | | 0.02 | | | | | | | | 0.22 | | | | 0.17 | | | | 0.14 | | | | 0.14 | | | | 0.14 | |
| | | | | | | |
Net realized and unrealized gain (loss) on investments | | | (0.64 | ) | | | | | | | 1.88 | | | | (1.44 | ) | | | 1.84 | | | | 0.64 | | | | (0.47 | ) |
| | | | | | | | | | | | | | | | | | | | | | | | | | | | |
| | | | | | | |
Total from investment operations | | | (0.62 | ) | | | | | | | 2.10 | | | | (1.27 | ) | | | 1.98 | | | | 0.78 | | | | (0.33 | ) |
| | | | | | | | | | | | | | | | | | | | | | | | | | | | |
| | | | | | | |
| Less distributions: | | | | | | | | | | | | | | | | | | | | | | | | | | | | |
| | | | | | | |
From net investment income | | | — | | | | | | | | (0.35 | ) | | | (0.21 | ) | | | (0.15 | ) | | | (0.21 | ) | | | (0.28 | ) |
| | | | | | | |
From net realized gain on investments | | | — | | | | | | | | (0.84 | ) | | | (0.54 | ) | | | (0.24 | ) | | | (0.66 | ) | | | (1.08 | ) |
| | | | | | | | | | | | | | | | | | | | | | | | | | | | |
| | | | | | | |
Total distributions | | | — | | | | | | | | (1.19 | ) | | | (0.75 | ) | | | (0.39 | ) | | | (0.87 | ) | | | (1.36 | ) |
| | | | | | | | | | | | | | | | | | | | | | | | | | | | |
| | | | | | | |
Net asset value at end of period | | $ | 10.76 | | | | | | | $ | 11.38 | | | $ | 10.47 | | | $ | 12.49 | | | $ | 10.90 | | | $ | 10.99 | |
| | | | | | | | | | | | | | | | | | | | | | | | | | | | |
| | | | | | | |
Total investment return (b) | | | (5.45 | %)(c) | | | | | | | 21.12 | % | | | (10.95 | %) | | | 18.32 | % | | | 7.30 | % | | | (2.59 | %) |
| | | | | | | |
| Ratios (to average net assets)/Supplemental Data: | | | | | | | | | | | | | | | | | | | | | | | | | | | | |
| | | | | | | |
Net investment income (loss) | | | 0.47 | % †† | | | | | | | 1.90 | % | | | 1.42 | % | | | 1.17 | % | | | 1.32 | % | | | 1.13 | % |
| | | | | | | |
Net expenses (d) | | | 0.28 | % †† | | | | | | | 0.27 | % | | | 0.27 | % | | | 0.27 | % | | | 0.28 | % | | | 0.27 | % |
| | | | | | | |
Portfolio turnover rate | | | 16 | % | | | | | | | 41 | % | | | 44 | % | | | 31 | % | | | 33 | % | | | 34 | % |
| | | | | | | |
Net assets at end of period (in 000’s) | | $ | 1,613,367 | | | | | | | $ | 1,868,634 | | | $ | 1,849,974 | | | $ | 2,263,952 | | | $ | 1,990,699 | | | $ | 1,869,969 | |
| (a) | Per share data based on average shares outstanding during the period. |
| (b) | Total return does not reflect any deduction of sales charges, mortality and expense charges, contract charges or administrative charges. For periods of less than one year, total return is not annualized. |
| (c) | Total investment return may reflect adjustments to conform to generally accepted accounting principles. |
| (d) | In addition to the fees and expenses which the Portfolio bears directly, it also indirectly bears a pro-rata share of the fees and expenses of the underlying funds in which it invests. Such indirect expenses are not included in the above expense ratios. |
| | | | | | |
The notes to the financial statements are an integral part of,
and should be read in conjunction with, the financial statements. | | | | | 37 | |
MainStay VP Growth Allocation Portfolio
Investment and Performance Comparison1 (Unaudited)
Performance data quoted represents past performance. Past performance is no guarantee of future results. Because of market volatility and other factors, current performance may be lower or higher than the figures shown. Investment return and principal value will fluctuate, and as a result, when shares are redeemed, they may be worth more or less than their original cost. The performance table and graph do not reflect any deduction of sales charges, mortality and expense charges, contract charges or administrative charges. Please refer to the Performance Summary appropriate for your policy. For performance information current to the most recent month-end, please call 800-598-2019 or visit www.newyorklife.com.
Average Annual Total Returns for the Period-Ended June 30, 2020
| | | | | | | | | | | | | | | | | | | | | | |
| Class | | Inception
Date | | Six Months | | | One Year | | | Five Years | | | Ten Years | | | Gross
Expense
Ratio2 | |
| | | | | | |
| Initial Class Shares | | 2/13/2006 | | | –7.26 | % | | | –0.07 | % | | | 4.60 | % | | | 9.47 | % | | | 0.82 | % |
| Service Class Shares | | 2/13/2006 | | | –7.38 | | | | –0.32 | | | | 4.34 | | | | 9.20 | | | | 1.07 | |
| | | | | | | | | | | | | | | | |
| Benchmark Performance | | Six
Months | | | One
Year | | | Five
Years | | | Ten
Years | |
| | | | |
S&P 500® Index3 | | | –3.08 | % | | | 7.51 | % | | | 10.73 | % | | | 13.99 | % |
MSCI EAFE® Index4 | | | –11.34 | | | | –5.13 | | | | 2.05 | | | | 5.73 | |
Growth Allocation Composite Index5 | | | –5.18 | | | | 4.25 | | | | 8.55 | | | | 12.04 | |
Morningstar Allocation—85%+ Equity Category Average6 | | | –8.39 | | | | –1.38 | | | | 4.85 | | | | 9.37 | |
| 1. | Performance figures may reflect certain fee waivers and/or expense limitations, without which total returns may have been different. For information on current fee waivers and/or expense limitations (if any), please refer to the Notes to Financial Statements. |
| 2. | The gross expense ratios presented reflect the Portfolio’s “Total Annual Portfolio Operating Expenses” from the most recent Prospectus , as supplemented, and may differ from other expense ratios disclosed in this report. |
| 3. | The S&P 500® Index is the Portfolio’s primary broad-based securities market index for comparison purposes. “S&P 500®” is a trademark of The McGraw-Hill Companies, Inc. The S&P 500® Index is widely regarded as the standard index for measuring large-cap U.S. stock market performance. Results assume reinvestment of all dividends and capital gains. An investment cannot be made directly in an index. |
| 4. | The MSCI EAFE® Index is the Portfolio’s secondary benchmark. The MSCI EAFE® Index consists of international stocks representing the developed world outside of North America. Results assume reinvestment of all |
| | dividends and capital gains. An investment cannot be made directly in an index. |
| 5. | The Portfolio has selected the Growth Allocation Composite Index as an additional benchmark. The Growth Allocation Composite Index consists of the S&P 500® Index and the MSCI EAFE® Index weighted 75% and 25%, respectively. Results assume reinvestment of all dividends and capital gains. An investment cannot be made directly in an index. |
| 6. | The Morningstar Allocation—85%+ Equity Category Average is representative of funds that seek to provide both income and capital appreciation by investing in multiple asset classes, including stocks, bonds, and cash. These funds are dominated by domestic holdings and have equity exposures of over 85%. These funds typically allocate at least 10% to equities of foreign companies and do not exclusively allocate between cash and equities. Results are based on average total returns of similar funds with all dividends and capital gain distributions reinvested. |
| | |
| 38 | | MainStay VP Growth Allocation Portfolio |
Cost in Dollars of a $1,000 Investment in MainStay VP Growth Allocation Portfolio (Unaudited)
The example below is intended to describe the fees and expenses borne by shareholders during the six-month period from January 1, 2020, to June 30, 2020, and the impact of those costs on your investment.
Example
As a shareholder of the Portfolio you incur two types of costs: (1) transaction costs, including exchange fees and sales charges (loads) on purchases (as applicable), and (2) ongoing costs, including management fees, distribution and/or service (12b-1) fees, and other Portfolio expenses (as applicable). This example is intended to help you understand your ongoing costs (in dollars) of investing in the Portfolio and to compare these costs with the ongoing costs of investing in other mutual funds. The example is based on an investment of $1,000 made at the beginning of the six-month period and held for the entire period from January 1, 2020, to June 30, 2020. Shares are only sold in connection with variable life and annuity contracts and the example does not reflect any contract level or transactional fees or expenses. If these costs had been included, your costs would have been higher.
This example illustrates your Portfolio’s ongoing costs in two ways:
Actual Expenses
The second and third data columns in the table below provide information about actual account values and actual expenses. You may use the information in these columns, together with the amount you invested, to estimate the expenses that you paid during the six months ended June 30, 2020. Simply divide your account value by $1,000
(for example, an $8,600 account value divided by $1,000 = 8.6), then multiply the result by the number under the heading entitled “Expenses Paid During Period” to estimate the expenses you paid on your account during this period.
Hypothetical Example for Comparison Purposes
The fourth and fifth data columns in the table below provide information about hypothetical account values and hypothetical expenses based on the Portfolio’s actual expense ratio and an assumed rate of return of 5% per year before expenses, which is not the Portfolio’s actual return. The hypothetical account values and expenses may not be used to estimate the actual ending account balances or expenses you paid for the six-month period shown. You may use this information to compare the ongoing costs of investing in the Portfolio with the ongoing costs of investing in other mutual funds. To do so, compare this 5% hypothetical example with the 5% hypothetical examples that appear in the shareholder reports of the other mutual funds.
Please note that the expenses shown in the table are meant to highlight your ongoing costs only and do not reflect any transactional costs, such as exchange fees or sales charges (loads). Therefore, the fourth and fifth data columns of the table are useful in comparing ongoing costs only and will not help you determine the relative total costs of owning different funds. In addition, if these transactional costs were included, your costs would have been higher.
| | | | | | | | | | | | | | | | | | | | | | |
| | | | | | | | | | | | | | | | | | |
| Share Class | | Beginning
Account
Value
1/1/20 | | | Ending Account
Value (Based
on Actual
Returns and
Expenses)
6/30/20 | | | Expenses
Paid
During
Period1 | | | Ending Account
Value (Based
on Hypothetical
5% Annualized
Return and
Actual Expenses)
6/30/20 | | | Expenses
Paid
During
Period1 | | | Net Expense
Ratio
During
Period2 |
| | | | | | |
| Initial Class Shares | | $ | 1,000.00 | | | $ | 927.40 | | | $ | 0.14 | | | $ | 1,024.71 | | | $ | 0.15 | | | 0.03% |
| | | | | | |
| Service Class Shares | | $ | 1,000.00 | | | $ | 926.20 | | | $ | 1.34 | | | $ | 1,023.47 | | | $ | 1.41 | | | 0.28% |
| 1. | Expenses are equal to the Portfolio’s annualized expense ratio of each class multiplied by the average account value over the period, divided by 366 and multiplied by 182 (to reflect the six-month period). The table above represents the actual expenses incurred during the six-month period. In addition to the fees and expenses which the Portfolio bears directly, it also indirectly bears a pro rata share of the fees and expenses of the Underlying Portfolios/Funds in which it invests. Such indirect expenses are not included in the above-reported expense figures. |
| 2. | Expenses are equal to the Portfolio’s annualized expense ratio to reflect the six-month period. |
Investment Objectives of Underlying Portfolios/Funds as of June 30, 2020 (Unaudited)

See Portfolio of Investments beginning on page 43 for specific holdings within these categories. The Portfolio’s holdings are subject to change.
| ‡ | Less than one-tenth of a percent. |
| | |
| 40 | | MainStay VP Growth Allocation Portfolio |
Portfolio Management Discussion and Analysis (Unaudited)
Answers to the questions reflect the views of portfolio managers Jae S. Yoon, CFA, Jonathan Swaney, Poul Kristensen, CFA, and Amit Soni, CFA, of New York Life Investments,1 the Portfolio’s Manager.
How did MainStay VP Growth Allocation Portfolio perform relative to its benchmarks and peers during the six months ended June 30, 2020?
For the six months ended June 30, 2020, MainStay VP Growth Allocation Portfolio returned –7.26% for Initial Class shares and –7.38% for Service Class shares. Over the same period, both share classes underperformed the –3.08% return of the S&P 500® Index, which is the Portfolio’s primary benchmark, and outperformed the –11.34% return of the MSCI EAFE® Index, which is a secondary benchmark of the Portfolio. For the six months ended June 30, 2020, both share classes underperformed the –5.18% return of the Growth Allocation Composite Index, which is an additional benchmark of the Portfolio, and outperformed the –8.39% return of the Morningstar Allocation—85%+ Equity Category Average.2
What factors affected the Portfolio’s relative performance during the reporting period?
The Portfolio is a “fund of funds,” meaning that it seeks to achieve its investment objective by investing primarily in mutual funds and exchange-traded funds (“ETFs”) managed by New York Life Investments or its affiliates (the “Underlying Portfolios/Funds”). The Underlying Portfolios/Funds may invest in U.S. equities and international equities, making comparisons to any single index generally less suitable than a weighted combination of indices, which is a more useful yardstick by which to measure performance. The most influential factor affecting relative performance for the Portfolio versus the performance of a weighted combination of indices is the net performance of the Underlying Portfolios/Funds relative to their respective benchmarks.
During the reporting period, the Portfolio’s asset class policy drove excess returns. Broadly, the Portfolio benefited from a posture that was aggressively risk-off when the market was in decline and less so as the market rebounded in late March, April and May 2020. Conversely, the performance of the Underlying Portfolio/Fund holdings in aggregate with respect to the Portfolio’s desired mix of asset class exposures detracted from relative performance. A few of the vehicles that struggled to achieve their objective include the MainStay Epoch U.S. All Cap Fund, MainStay VP T. Rowe Price Equity Income Portfolio and IQ 500 International ETF.
During the reporting period, how was the Portfolio’s performance materially affected by investments in derivatives?
Total return swaps were used to express most of the Portfolio’s asset class policy views and can be seen as contributing positively
to active return. They were also used to curb larger systematic risk observable within the pool of Underlying Portfolios/Funds. In addition, derivatives enhanced the Portfolio’s returns to a small degree by helping rein in exposure to the underperforming value risk factor.
How did you allocate the Portfolio’s assets during the reporting period and why?
Eleven-plus years into an expansion, the U.S. economy entered the reporting period showing signs of strain. That, coupled with what we believed to be rather ambitious valuations, led us to skew the Portfolio away from risk assets. When the SARS-CoV-2 virus arrived, the Portfolio was tilted away from equities, choosing to maintain a cash balance. That posture paid off handsomely as the market declined through late March 2020. We gradually reallocated back into equities, reducing the Portfolio’s underweight exposure, although never quite getting all the way back to neutral. We then reversed course, selling Underlying Funds amid a strongly rallying market through April and May 2020. By June 30, 2020, we had gone round trip, underweight equity on a scale similar to the Portfolio’s position in mid-February 2020.
Within equities, results were mixed. The Portfolio generally tilted in favor of large-cap stocks, reflecting our view that small companies were likely to be more vulnerable to lockdown-induced damage than larger firms with better access to capital markets and stronger balance sheets to fall back upon. While that bias was well rewarded, it was offset by the Portfolio’s bias toward value stocks. Concerned with an excessive valuation gap and anticipating mounting regulatory pressure on technology firms, we were somewhat pessimistic about the prospects for growth names. But then the work-from-home, play-from-home lockdowns provided a lift to many large-cap technology companies, detracting from Portfolio returns.
How did the Portfolio’s allocations change over the course of the reporting period?
Several significant shifts occurred among the Portfolio’s allocations during the reporting period. Among the largest was a move away from MainStay MacKay U.S. Equity Opportunities Fund and MainStay VP MacKay Common Stock Portfolio into MainStay VP MacKay S&P 500 Index Portfolio. We based this adjustment on our judgment that the Portfolio’s aggregate exposure to active quantitative strategies was larger than might be helpful, and that a pivot to a passive implementation could be beneficial within the prevailing environment.
Several new positions were introduced during the reporting period, including IQ Candriam ESG International ETF and swap
| 1. | “New York Life Investments” is a service mark used by New York Life Investment Management Holdings LLC and its subsidiary New York Life Investment Management LLC. |
| 2. | See page 38 for more information on benchmark and peer group returns. |
exposure to VanEck Vectors Gold Miners ETF. Likewise, a position in IQ Global Resources ETF was closed.
Which Underlying Equity Portfolios/Funds had the highest total returns during the reporting period, and which Underlying Portfolios/Funds had the lowest total returns?
Of the Underlying Equity Portfolios/Funds held during the reporting period, the highest total returns came from the technology-heavy MainStay VP Large Cap Growth Portfolio and MainStay VP MacKay Growth Portfolio. The MainStay Epoch Capital Growth Fund, a global equity product, also delivered positive returns. The most significant losses were posted by IQ Chaikin U.S. Small Cap ETF, MainStay VP T. Rowe Price Equity Income Portfolio and MainStay VP MacKay Small Cap Core Portfolio.
Which Underlying Equity Portfolios/Funds made the strongest positive contributions to the Portfolio’s overall performance, and which Underlying Equity Portfolios/Funds were the greatest detractors?
Among the Underlying Equity Portfolios/Funds making the most significant positive contributions to the Portfolio’s returns were MainStay VP Large Cap Growth Portfolio, MainStay VP MacKay S&P 500 Index Portfolio and MainStay VP MacKay Growth Portfolio. (Contributions take weightings and total returns into account.) The greatest detractions came from MainStay VP T. Rowe Price Equity Income Portfolio, MainStay VP Epoch U.S. Equity Yield Portfolio and IQ 500 International ETF.
The opinions expressed are those of the portfolio managers as of the date of this report and are subject to change. There is no guarantee that any forecasts will come to pass. This material does not constitute investment advice and is not intended as an endorsement of any specific investment.
Not all MainStay VP Portfolios and/or share classes are available under all policies.
| | |
| 42 | | MainStay VP Growth Allocation Portfolio |
Portfolio of Investments June 30, 2020 (Unaudited)
| | | | | | | | |
| | |
Shares | | | Value | |
| | | | | | | | |
| Affiliated Investment Companies 97.3%† | |
Equity Funds 97.3% | |
IQ 50 Percent Hedged FTSE International ETF (a) | | | 1,034,345 | | | $ | 20,021,920 | |
IQ 500 International ETF (a) | | | 2,114,834 | | | | 50,035,069 | |
IQ Candriam ESG International Equity ETF (a) | | | 419,319 | | | | 9,602,321 | |
IQ Candriam ESG U.S. Equity ETF (a) | | | 1,042,288 | | | | 27,354,432 | |
IQ Chaikin U.S. Large Cap ETF (a) | | | 1,588,177 | | | | 36,899,387 | |
IQ Chaikin U.S. Small Cap ETF | | | 231,055 | | | | 4,998,043 | |
MainStay Epoch Capital Growth Fund Class I (a) | | | 771,532 | | | | 10,446,549 | |
MainStay Epoch International Choice Fund Class I (a) | | | 1,484,715 | | | | 49,099,535 | |
MainStay Epoch U.S. All Cap Fund Class R6 (a) | | | 1,445,030 | | | | 35,027,534 | |
MainStay MacKay International Opportunities Fund Class I (a) | | | 6,090,836 | | | | 38,676,810 | |
MainStay MAP Equity Fund Class I (a) | | | 1,881,743 | | | | 73,124,523 | |
MainStay VP Emerging Markets Equity Portfolio Initial Class (a) | | | 6,000,078 | | | | 53,299,890 | |
MainStay VP Epoch U.S. Equity Yield Portfolio Initial Class (a) | | | 6,175,249 | | | | 85,076,406 | |
MainStay VP MacKay Common Stock Portfolio Initial Class | | | 700,213 | | | | 18,008,927 | |
MainStay VP MacKay Growth Portfolio Initial Class (a) | | | 1,743,006 | | | | 60,724,069 | |
MainStay VP MacKay International Equity Portfolio Initial Class (a) | | | 1,936,017 | | | | 30,092,861 | |
MainStay VP MacKay Mid Cap Core Portfolio Initial Class (a) | | | 4,203,696 | | | | 50,154,296 | |
MainStay VP MacKay S&P 500 Index Portfolio Initial Class | | | 914,001 | | | | 54,627,400 | |
| | | | | | | | |
| | |
Shares | | | Value | |
| | | | | | | | |
Equity Funds (continued) | |
MainStay VP MacKay Small Cap Core Portfolio Initial Class (a) | | | 3,417,668 | | | $ | 30,086,418 | |
MainStay VP Small Cap Growth Portfolio Initial Class (a) | | | 6,065,824 | | | | 80,973,288 | |
MainStay VP T. Rowe Price Equity Income Portfolio Initial Class (a) | | | 7,841,513 | | | | 81,765,807 | |
MainStay VP Winslow Large Cap Growth Portfolio Initial Class (a) | | | 2,917,703 | | | | 83,432,601 | |
| | | | | | | | |
Total Affiliated Investment Companies
(Cost $1,034,805,536) | | | | | | | 983,528,086 | |
| | | | | | | | |
|
| Short-Term Investment 2.7% | |
Affiliated Investment Company 2.7% | |
MainStay U.S. Government Liquidity Fund, 0.05% (b) | | | 27,635,983 | | | | 27,635,983 | |
| | | | | | | | |
Total Short-Term Investment
(Cost $27,635,983) | | | | | | | 27,635,983 | |
| | | | | | | | |
Total Investments
(Cost $1,062,441,519) | | | 100.0 | % | | | 1,011,164,069 | |
Other Assets, Less Liabilities | | | (0.0 | )‡ | | | (492,906 | ) |
Net Assets | | | 100.0 | % | | $ | 1,010,671,163 | |
| † | Percentages indicated are based on Portfolio net assets. |
| ‡ | Less than one-tenth of a percent. |
| (a) | As of June 30, 2020, the Portfolio’s ownership exceeds 5% of the outstanding shares of the Underlying Portfolio’s/Fund’s share class. |
| (b) | Current yield as of June 30, 2020. |
Swap Contracts
Open OTC total return swap contracts as of June 30, 2020 were as follows1:
| | | | | | | | | | | | | | | | | | | | |
Swap
Counterparty | | Reference Obligation | | Floating Rate2 | | Termination
Date(s) | | | Payment
Frequency
Paid/ Received | | | Notional
Amount
Long/
(Short)
(000)* | | | Unrealized
Appreciation3 | |
Citigroup | | iShares MSCI EAFE ETF | | 1 month LIBOR BBA minus 0.40% | | | 12/01/2020 | | | | Monthly | | | | (4,898 | ) | | $ | — | |
Citigroup | | iShares MSCI Emerging Markets ETF | | 1 month LIBOR BBA minus 0.65% | | | 12/01/2020 | | | | Monthly | | | | (4,827 | ) | | | — | |
Citigroup | | Russell 1000 Value Total Return Index | | 1 month LIBOR BBA plus 0.359% | | | 12/07/2020 | | | | Monthly | | | | 23,885 | | | | — | |
Citigroup | | Russell 2000 Total Return Index | | 1 month LIBOR BBA minus 0.109% | | | 12/07/2020 | | | | Monthly | | | | (16,894 | ) | | | — | |
Citigroup | | Russell Midcap Total Return Index | | 1 month LIBOR BBA minus 0.134% | | | 12/07/2020 | | | | Monthly | | | | 16,830 | | | | — | |
Citigroup | | S&P 500 Total Return Index | | 1 month LIBOR BBA plus 0.18% | | | 10/26/2020 | | | | Monthly | | | | 8,887 | | | | — | |
Citigroup | | VanEck Vectors Gold Miners ETF | | 1 month LIBOR BBA plus 0.50% | | | 12/01/2020 | | | | Monthly | | | | 5,406 | | | | — | |
| 1 | As of June 30, 2020, cash in the amount of $934,362 was pledged from brokers for OTC swap contracts. |
| 2 | Fund pays the floating rate and receives the total return of the reference entity. |
| 3. | Reflects the value at reset date as of June 30, 2020. |
| * | Notional amounts reflected as a positive value indicate a long position held by the Portfolio or Index and a negative value indicates a short position. |
| | | | | | |
The notes to the financial statements are an integral part of,
and should be read in conjunction with, the financial statements. | | | | | 43 | |
Portfolio of Investments June 30, 2020 (Unaudited) (continued)
The following abbreviations are used in the preceding pages:
BBA—British Bankers’ Association
ETF—Exchange-Traded Fund
FTSE—Financial Times Stock Exchange
LIBOR—London Interbank Offered Rate
The following is a summary of the fair valuations according to the inputs used as of June 30, 2020, for valuing the Portfolio’s assets:
| | | | | | | | | | | | | | | | |
Description | | Quoted
Prices in
Active
Markets for
Identical
Assets
(Level 1) | | | Significant
Other
Observable
Inputs
(Level 2) | | | Significant
Unobservable
Inputs
(Level 3) | | | Total | |
| | | | |
Asset Valuation Inputs | | | | | | | | | | | | | | | | |
| Investments (a) | | | | | | | | | | | | | | | | |
| Affiliated Investment Companies | | | | | | | | | | | | | | | | |
Equity Funds | | $ | 983,528,086 | | | $ | — | | | $ | — | | | $ | 983,528,086 | |
Short-Term Investment | | | 27,635,983 | | | | — | | | | — | | | | 27,635,983 | |
| | | | | | | | | | | | | | | | |
| Total Investments in Securities | | $ | 1,011,164,069 | | | $ | — | | | $ | — | | | $ | 1,011,164,069 | |
| | | | | | | | | | | | | | | | |
| (a) | For a complete listing of investments, see the Portfolio of Investments. |
| | | | |
| 44 | | MainStay VP Growth Allocation Portfolio | | The notes to the financial statements are an integral part of,
and should be read in conjunction with, the financial statements. |
Statement of Assets and Liabilities as of June 30, 2020 (Unaudited)
| | | | |
| Assets | | | | |
Investment in affiliated investment companies, at value (identified cost $1,062,441,519) | | $ | 1,011,164,069 | |
Cash collateral on deposit at broker for swap contracts | | | 934,362 | |
Receivables: | | | | |
Portfolio shares sold | | | 231,759 | |
Dividends and Interest | | | 972 | |
Other assets | | | 4,679 | |
| | | | |
Total assets | | | 1,012,335,841 | |
| | | | |
| |
| Liabilities | | | | |
Payables: | | | | |
Dividends and interest on OTC swaps contracts | | | 1,018,594 | |
Portfolio shares redeemed | | | 400,063 | |
NYLIFE Distributors (See Note 3) | | | 193,107 | |
Shareholder communication | | | 33,416 | |
Professional fees | | | 11,637 | |
Custodian | | | 2,646 | |
Trustees | | | 1,333 | |
Accrued expenses | | | 3,882 | |
| | | | |
Total liabilities | | | 1,664,678 | |
| | | | |
Net assets | | $ | 1,010,671,163 | |
| | | | |
| |
| Composition of Net Assets | | | | |
Shares of beneficial interest outstanding (par value of $.001 per share) unlimited number of shares authorized | | $ | 93,436 | |
Additional paid-in capital | | | 1,022,090,026 | |
| | | | |
| | | 1,022,183,462 | |
Total distributable earnings (loss) | | | (11,512,299 | ) |
| | | | |
Net assets | | $ | 1,010,671,163 | |
| | | | |
| | | | |
Initial Class | | | | |
Net assets applicable to outstanding shares | | $ | 76,364,405 | |
| | | | |
Shares of beneficial interest outstanding | | | 6,980,457 | |
| | | | |
Net asset value per share outstanding | | $ | 10.94 | |
| | | | |
Service Class | | | | |
Net assets applicable to outstanding shares | | $ | 934,306,758 | |
| | | | |
Shares of beneficial interest outstanding | | | 86,455,438 | |
| | | | |
Net asset value per share outstanding | | $ | 10.81 | |
| | | | |
| | | | | | |
The notes to the financial statements are an integral part of,
and should be read in conjunction with, the financial statements. | | | | | 45 | |
Statement of Operations for the six months ended June 30, 2020 (Unaudited)
| | | | |
| Investment Income (Loss) | |
Income | | | | |
Dividend distributions from affiliated investment companies | | $ | 1,600,859 | |
Interest | | | 9,263 | |
| | | | |
Total income | | | 1,610,122 | |
| | | | |
Expenses | | | | |
Distribution/Service—Service Class (See Note 3) | | | 1,142,080 | |
Professional fees | | | 49,234 | |
Shareholder communication | | | 45,302 | |
Trustees | | | 12,424 | |
Custodian | | | 7,507 | |
Miscellaneous | | | 15,021 | |
| | | | |
Total expenses | | | 1,271,568 | |
| | | | |
Net investment income (loss) | | | 338,554 | |
| | | | |
|
| Realized and Unrealized Gain (Loss) on Investments and Swap Contracts | |
Net realized gain (loss) on: | | | | |
Affiliated investment company transactions | | | 3,637,409 | |
Swap transactions | | | 5,086,525 | |
| | | | |
Net realized gain (loss) on investments from affiliated investment companies and swap transactions | | | 8,723,934 | |
| | | | |
Net change in unrealized appreciation (depreciation) on investments in affiliated investment companies and swap contacts | | | (85,525,104 | ) |
| | | | |
Net realized and unrealized gain (loss) on investments and swap transactions | | | (76,801,170 | ) |
| | | | |
Net increase (decrease) in net assets resulting from operations | | $ | (76,462,616 | ) |
| | | | |
| | | | |
| 46 | | MainStay VP Growth Allocation Portfolio | | The notes to the financial statements are an integral part of,
and should be read in conjunction with, the financial statements. |
Statements of Changes in Net Assets
for the six months ended June 30, 2020 (Unaudited) and the year ended December 31, 2019
| | | | | | | | |
| | | 2020 | | | 2019 | |
| Increase (Decrease) in Net Assets | |
Operations: | | | | | | | | |
Net investment income (loss) | | $ | 338,554 | | | $ | 16,375,733 | |
Net realized gain (loss) on investments and investments from affiliated investment companies and swap transactions | | | 8,723,934 | | | | 56,437,075 | |
Net change in unrealized appreciation (depreciation) on investments in affiliated investment companies and swap contracts | | | (85,525,104 | ) | | | 160,475,543 | |
| | | | |
Net increase (decrease) in net assets resulting from operations | | | (76,462,616 | ) | | | 233,288,351 | |
| | | | |
Distributions to shareholders: | | | | | | | | |
Initial Class | | | — | | | | (7,410,845 | ) |
Service Class | | | — | | | | (93,386,237 | ) |
| | | | |
Total distributions to shareholders | | | — | | | | (100,797,082 | ) |
| | | | |
Capital share transactions: | | | | | | | | |
Net proceeds from sale of shares | | | 39,747,850 | | | | 22,560,505 | |
Net asset value of shares issued to shareholders in reinvestment of distributions | | | — | | | | 100,797,082 | |
Cost of shares redeemed | | | (69,570,588 | ) | | | (134,448,635 | ) |
| | | | |
Increase (decrease) in net assets derived from capital share transactions | | | (29,822,738 | ) | | | (11,091,048 | ) |
| | | | |
Net increase (decrease) in net assets | | | (106,285,354 | ) | | | 121,400,221 | |
|
| Net Assets | |
Beginning of period | | | 1,116,956,517 | | | | 995,556,296 | |
| | | | |
End of period | | $ | 1,010,671,163 | | | $ | 1,116,956,517 | |
| | | | |
| | | | | | |
The notes to the financial statements are an integral part of,
and should be read in conjunction with, the financial statements. | | | | | 47 | |
Financial Highlights selected per share data and ratios
| | | | | | | | | | | | | | | | | | | | | | | | | | | | |
| | | |
| | | Six months
ended
June 30, | | | | | | Year ended December 31, | |
| | | | | | | |
| Initial Class | | 2020* | | | | | | 2019 | | | 2018 | | | 2017 | | | 2016 | | | 2015 | |
| | | | | | | |
Net asset value at beginning of period | | $ | 11.80 | | | | | | | $ | 10.50 | | | $ | 12.65 | | | $ | 10.60 | | | $ | 10.63 | | | $ | 12.12 | |
| | | | | | | | | | | | | | | | | | | | | | | | | | | | |
| | | | | | | |
Net investment income (loss) (a) | | | 0.02 | | | | | | | | 0.21 | | | | 0.18 | | | | 0.12 | | | | 0.12 | | | | 0.10 | |
| | | | | | | |
Net realized and unrealized gain (loss) on investments | | | (0.88 | ) | | | | | | | 2.25 | | | | (1.67 | ) | | | 2.26 | | | | 0.68 | | | | (0.49 | ) |
| | | | | | | | | | | | | | | | | | | | | | | | | | | | |
| | | | | | | |
Total from investment operations | | | (0.86 | ) | | | | | | | 2.46 | | | | (1.49 | ) | | | 2.38 | | | | 0.80 | | | | (0.39 | ) |
| | | | | | | | | | | | | | | | | | | | | | | | | | | | |
| | | | | | | |
| Less distributions: | | | | | | | | | | | | | | | | | | | | | | | | | | | | |
| | | | | | | |
From net investment income | | | — | | | | | | | | (0.36 | ) | | | (0.19 | ) | | | (0.12 | ) | | | (0.17 | ) | | | (0.22 | ) |
| | | | | | | |
From net realized gain on investments | | | — | | | | | | | | (0.80 | ) | | | (0.47 | ) | | | (0.21 | ) | | | (0.66 | ) | | | (0.88 | ) |
| | | | | | | | | | | | | | | | | | | | | | | | | | | | |
| | | | | | | |
Total distributions | | | — | | | | | | | | (1.16 | ) | | | (0.66 | ) | | | (0.33 | ) | | | (0.83 | ) | | | (1.10 | ) |
| | | | | | | | | | | | | | | | | | | | | | | | | | | | |
| | | | | | | |
Net asset value at end of period | | $ | 10.94 | | | | | | | $ | 11.80 | | | $ | 10.50 | | | $ | 12.65 | | | $ | 10.60 | | | $ | 10.63 | |
| | | | | | | | | | | | | | | | | | | | | | | | | | | | |
| | | | | | | |
Total investment return (b) | | | (7.29 | %)(c) | | | | | | | 24.58 | % | | | (12.78 | %) | | | 22.67 | % | | | 7.59 | % | | | (3.13 | %) |
| | | | | | | |
| Ratios (to average net assets)/Supplemental Data: | | | | | | | | | | | | | | | | | | | | | | | | | | | | |
| | | | | | | |
Net investment income (loss) | | | 0.28 | % †† | | | | | | | 1.80 | % | | | 1.42 | % | | | 1.05 | % | | | 1.19 | % | | | 0.85 | % |
| | | | | | | |
Net expenses (d) | | | 0.03 | % †† | | | | | | | 0.03 | % | | | 0.02 | % | | | 0.02 | % | | | 0.03 | % | | | 0.03 | % |
| | | | | | | |
Portfolio turnover rate | | | 11 | % | | | | | | | 38 | % | | | 28 | % | | | 26 | % | | | 21 | % | | | 29 | % |
| | | | | | | |
Net assets at end of period (in 000’s) | | $ | 76,364 | | | | | | | $ | 83,143 | | | $ | 66,326 | | | $ | 76,504 | | | $ | 60,070 | | | $ | 51,447 | |
| (a) | Per share data based on average shares outstanding during the period. |
| (b) | Total return does not reflect any deduction of sales charges, mortality and expense charges, contract charges or administrative charges. For periods of less than one year, total return is not annualized. |
| (c) | Total investment return may reflect adjustments to conform to generally accepted accounting principles. |
| (d) | In addition to the fees and expenses which the Portfolio bears directly, it also indirectly bears a pro-rata share of the fees and expenses of the underlying funds in which it invests. Such indirect expenses are not included in the above expense ratios. |
| | | | | | | | | | | | | | | | | | | | | | | | | | | | |
| | | |
| | | Six months
ended
June 30, | | | | | | Year ended December 31, | |
| | | | | | | |
| Service Class | | 2020* | | | | | | 2019 | | | 2018 | | | 2017 | | | 2016 | | | 2015 | |
| | | | | | | |
Net asset value at beginning of period | | $ | 11.67 | | | | | | | $ | 10.39 | | | $ | 12.53 | | | $ | 10.51 | | | $ | 10.55 | | | $ | 12.05 | |
| | | | | | | | | | | | | | | | | | | | | | | | | | | | |
| | | | | | | |
Net investment income (loss) (a) | | | 0.00 | | | | | | | | 0.17 | | | | 0.14 | | | | 0.09 | | | | 0.10 | | | | 0.08 | |
| | | | | | | |
Net realized and unrealized gain (loss) on investments | | | (0.86 | ) | | | | | | | 2.24 | | | | (1.65 | ) | | | 2.24 | | | | 0.66 | | | | (0.50 | ) |
| | | | | | | | | | | | | | | | | | | | | | | | | | | | |
| | | | | | | |
Total from investment operations | | | (0.86 | ) | | | | | | | 2.41 | | | | (1.51 | ) | | | 2.33 | | | | 0.76 | | | | (0.42 | ) |
| | | | | | | | | | | | | | | | | | | | | | | | | | | | |
| | | | | | | |
| Less distributions: | | | | | | | | | | | | | | | | | | | | | | | | | | | | |
| | | | | | | |
From net investment income | | | — | | | | | | | | (0.33 | ) | | | (0.16 | ) | | | (0.10 | ) | | | (0.14 | ) | | | (0.20 | ) |
| | | | | | | |
From net realized gain on investments | | | — | | | | | | | | (0.80 | ) | | | (0.47 | ) | | | (0.21 | ) | | | (0.66 | ) | | | (0.88 | ) |
| | | | | | | | | | | | | | | | | | | | | | | | | | | | |
| | | | | | | |
Total distributions | | | — | | | | | | | | (1.13 | ) | | | (0.63 | ) | | | (0.31 | ) | | | (0.80 | ) | | | (1.08 | ) |
| | | | | | | | | | | | | | | | | | | | | | | | | | | | |
| | | | | | | |
Net asset value at end of period | | $ | 10.81 | | | | | | | $ | 11.67 | | | $ | 10.39 | | | $ | 12.53 | | | $ | 10.51 | | | $ | 10.55 | |
| | | | | | | | | | | | | | | | | | | | | | | | | | | | |
| | | | | | | |
Total investment return (b) | | | (7.37 | %)(c) | | | | | | | 24.27 | % | | | (12.99 | %) | | | 22.36 | % | | | 7.32 | % | | | (3.37 | %) |
| | | | | | | |
| Ratios (to average net assets)/Supplemental Data: | | | | | | | | | | | | | | | | | | | | | | | | | | | | |
| | | | | | | |
Net investment income (loss) | | | 0.03 | % †† | | | | | | | 1.49 | % | | | 1.16 | % | | | 0.81 | % | | | 0.95 | % | | | 0.65 | % |
| | | | | | | |
Net expenses (d) | | | 0.28 | % †† | | | | | | | 0.28 | % | | | 0.27 | % | | | 0.27 | % | | | 0.28 | % | | | 0.28 | % |
| | | | | | | |
Portfolio turnover rate | | | 11 | % | | | | | | | 38 | % | | | 28 | % | | | 26 | % | | | 21 | % | | | 29 | % |
| | | | | | | |
Net assets at end of period (in 000’s) | | $ | 934,307 | | | | | | | $ | 1,033,813 | | | $ | 929,230 | | | $ | 1,074,280 | | | $ | 829,780 | | | $ | 684,824 | |
| (a) | Per share data based on average shares outstanding during the period. |
| (b) | Total return does not reflect any deduction of sales charges, mortality and expense charges, contract charges or administrative charges. For periods of less than one year, total return is not annualized. |
| (c) | Total investment return may reflect adjustments to conform to generally accepted accounting principles. |
| (d) | In addition to the fees and expenses which the Portfolio bears directly, it also indirectly bears a pro-rata share of the fees and expenses of the underlying funds in which it invests. Such indirect expenses are not included in the above expense ratios. |
| | | | |
| 48 | | MainStay VP Growth Allocation Portfolio | | The notes to the financial statements are an integral part of,
and should be read in conjunction with, the financial statements. |
Notes to Financial Statements (Unaudited)
Note 1–Organization and Business
MainStay VP Funds Trust (the “Fund”) was organized as a Delaware statutory trust on February 1, 2011. The Fund is registered under the Investment Company Act of 1940, as amended (the “1940 Act”), as an open-end management investment company. The Fund is comprised of thirty-one separate series (collectively referred to as the “Portfolios” and each individually referred to as a “Portfolio”). These financial statements and notes relate to the MainStay VP Conservative Allocation Portfolio, MainStay VP Moderate Allocation Portfolio, MainStay VP Moderate Growth Allocation Portfolio and MainStay VP Growth Allocation Portfolio (collectively referred to as the “Allocation Portfolios” and each individually referred to as an “Allocation Portfolio”). Each is a “diversified” portfolio, as that term is defined in the 1940 Act, as interpreted or modified by regulatory authorities having jurisdiction, from time to time.
Shares of the Allocation Portfolios are currently offered to certain separate accounts to fund variable annuity policies and variable universal life insurance policies issued by New York Life Insurance and Annuity Corporation (“NYLIAC”), a wholly-owned subsidiary of New York Life Insurance Company (“New York Life”). NYLIAC allocates shares of the Allocation Portfolios to, among others, certain NYLIAC separate accounts. The separate accounts are used to fund flexible premium deferred variable annuity contracts and variable life insurance policies.
Each Allocation Portfolio currently offers two classes of shares. Initial Class and Service Class shares commenced operations on February 13, 2006. Shares of the Allocation Portfolios are offered and are redeemed at a price equal to their respective net asset value (“NAVs”) per share. No sales or redemption charge is applicable to the purchase or redemption of the Allocation Portfolios’ shares. Under the terms of the Fund’s multiple class plan adopted pursuant to Rule 18f-3 under the 1940 Act, the classes differ in that, among other things, Service Class shares of the Allocation Portfolios pay a combined distribution and service fee of 0.25% of average daily net assets attributable to Service Class shares of the respective Allocation Portfolios to the Distributor (as defined in Note 3(B)), pursuant to a plan adopted in accordance with Rule 12b-1 under the 1940 Act. Contract owners of variable annuity contracts purchased after June 2, 2003, are permitted to invest only in the Service Class shares.
The investment objective for each Allocation Portfolio is as follows:
The MainStay VP Conservative Allocation Portfolio seeks current income and, secondarily, long-term growth of capital.
The MainStay VP Moderate Allocation Portfolio seeks long-term growth of capital and, secondarily, current income.
The MainStay VP Moderate Growth Allocation Portfolio seeks long-term growth of capital and, secondarily, current income.
The MainStay VP Growth Allocation Portfolio seeks long-term growth of capital.
Each Allocation Portfolio is a “fund-of-funds”, that seeks to achieve its investment objectives by investing primarily in mutual funds and exchange-traded funds (“ETFs”) managed by New York Life Investment Management LLC (“New York Life Investments” or “Manager”) or its affiliates (the “Underlying Portfolios/Funds”).
Note 2–Significant Accounting Policies
The Allocation Portfolios are investment companies and accordingly follow the investment company accounting and reporting guidance of the Financial Accounting Standards Board (“FASB”) Accounting Standard Codification Topic 946 Financial Services—Investment Companies. The Allocation Portfolios prepare their financial statements in accordance with generally accepted accounting principles (“GAAP”) in the United States of America and follow the significant accounting policies described below.
(A) Securities Valuation. Investments are usually valued as of the close of regular trading on the New York Stock Exchange (the “Exchange”) (usually 4:00 p.m. Eastern time) on each day the Allocation Portfolios are open for business (“valuation date”).
The Board of Trustees of the Fund (the “Board”) adopted procedures establishing methodologies for the valuation of each Allocation Portfolio’s securities and other assets and delegated the responsibility for valuation determinations under those procedures to the Valuation Committee of the Fund (the “Valuation Committee”). The procedures state that, subject to the oversight of the Board and unless otherwise noted, the responsibility for the day-to-day valuation of portfolio assets (including fair value measurements for the Allocation Portfolios’ assets and liabilities) rests with New York Life Investments. To assess the appropriateness of security valuations, the Manager or the Allocation Portfolios’ third-party service provider, who is subject to oversight by the Manager, regularly compares prior day prices, prices on comparable securities and the sale prices to the prior and current day prices and challenges prices with changes exceeding certain tolerance levels with third-party pricing services or broker sources.
The Board authorized the Valuation Committee to appoint a Valuation Subcommittee (the “Subcommittee”) to establish the prices of securities for which market quotations are not readily available or the prices of which are not otherwise readily determinable under the procedures. The Subcommittee meets (in person, via electronic mail or via teleconference) on an as-needed basis. The Valuation Committee meets to ensure that actions taken by the Subcommittee were appropriate.
For those securities valued through either a standardized fair valuation methodology or a fair valuation measurement, the Subcommittee deals with such valuation and the Valuation Committee reviews and affirms, if appropriate, the reasonableness of the valuation based on such methodologies and measurements on a regular basis after considering information that is reasonably available and deemed relevant by the Valuation Committee. Any action taken by the Subcommittee with respect to the valuation of a portfolio security or other asset is submitted for review and ratification (if appropriate) to the Valuation Committee and the Board at the next regularly scheduled meeting.
“Fair value” is defined as the price an Allocation Portfolio would reasonably expect to receive upon selling an asset or liability in an orderly transaction to an independent buyer in the principal or most advantageous market for the asset or liability. Fair value measurements are determined within a framework that establishes a three-tier hierarchy that maximizes the use of observable market data and minimizes the use of unobservable inputs to establish a classification of fair value measurements for disclosure purposes. “Inputs” refer broadly to the assumptions that market participants would use in pricing the asset or
Notes to Financial Statements (Unaudited) (continued)
liability, including assumptions about risk, such as the risk inherent in a particular valuation technique used to measure fair value using a pricing model and/or the risk inherent in the inputs for the valuation technique. Inputs may be observable or unobservable. Observable inputs reflect the assumptions market participants would use in pricing the asset or liability based on market data obtained from sources independent of the Allocation Portfolios. Unobservable inputs reflect each Allocation Portfolio’s own assumptions about the assumptions market participants would use in pricing the asset or liability based on the information available. The inputs or methodology used for valuing assets or liabilities may not be an indication of the risks associated with investing in those assets or liabilities. The three-tier hierarchy of inputs is summarized below.
| • | | Level 1—quoted prices in active markets for an identical asset or liability |
| • | | Level 2—other significant observable inputs (including quoted prices for a similar asset or liability in active markets, interest rates and yield curves, prepayment speeds, credit risk, etc.) |
| • | | Level 3—significant unobservable inputs (including each Allocation Portfolio’s own assumptions about the assumptions that market participants would use in measuring fair value of an asset or liability) |
The level of an asset or liability within the fair value hierarchy is based on the lowest level of an input, both individually and in the aggregate, that is significant to the fair value measurement. The aggregate value by input level of each Allocation Portfolio’s assets and liabilities as of June 30, 2020, is included at the end of each Allocation Portfolio’s Portfolio of Investments.
Investments in Underlying Portfolios/Funds are valued at their respective NAVs at the close of business each day, except for investment in ETFs. Investments in ETFs are valued at the last quoted sales price as of the close of regular trading on the relevant exchange on each valuation date. These securities are generally categorized as Level 1 in the hierarchy.
Securities held by the Underlying Portfolios/Funds are valued using policies consistent with those used by the Underlying Portfolios/Funds. Equity securities, including shares of ETFs, are generally valued at the last quoted sales price as of the close of regular trading on the relevant exchange on each valuation date.
Debt securities are generally valued at the evaluated bid prices supplied by a pricing agent or broker selected by the Underlying Portfolio’s/Fund’s manager.
Total return swap contracts, which are arrangements to exchange a market-linked return for a periodic payment, are based on a notional principal amount. To the extent that the total return of the security, index or other financial measure underlying the transaction exceeds or falls short of the offsetting interest rate obligation, the Allocation Portfolios will receive a payment from or make a payment to the counterparty. Total return swap contracts are marked to market daily based upon quotations from market makers and these securities are generally categorized as Level 2 in the hierarchy.
The information above is not intended to reflect an exhaustive list of the methodologies that may be used to value portfolio investments. The valuation procedures permit the use of a variety of valuation
methodologies in connection with valuing portfolio investments. The methodology used for a specific type of investment may vary based on the market data available or other considerations. The methodologies summarized above may not represent the specific means by which portfolio investments are valued on any particular business day.
(B) Income Taxes. The Allocation Portfolios’ policy is to comply with the requirements of the Internal Revenue Code of 1986, as amended (the “Internal Revenue Code”), applicable to regulated investment companies and to distribute all of its taxable income to the shareholders of each Allocation Portfolio within the allowable time limits.
The Manager evaluates each Allocation Portfolio’s tax positions to determine if the tax positions taken meet the minimum recognition threshold in connection with accounting for uncertainties in income tax positions taken or expected to be taken for the purposes of measuring and recognizing tax liabilities in the financial statements. Recognition of tax benefits of an uncertain tax position is permitted only to the extent the position is “more likely than not” to be sustained assuming examination by taxing authorities. The Manager analyzed the Allocation Portfolios’ tax positions taken on federal, state and local income tax returns for all open tax years (for up to three tax years) and has concluded that no provisions for federal, state and local income tax are required in the Allocation Portfolios’ financial statements. The Allocation Portfolios’ federal, state and local income tax and federal excise tax returns for tax years for which the applicable statutes of limitations have not expired are subject to examination by the Internal Revenue Service and state and local departments of revenue.
(C) Dividends and Distributions to Shareholders. Dividends and distributions are recorded on the ex-dividend date. The Allocation Portfolios intend to declare and pay dividends from net investment income and distributions from net realized capital gains, if any, at least annually. Unless a shareholder elects otherwise, all dividends and distributions are reinvested at NAV in the same class of shares of the respective Allocation Portfolio. Dividends and distributions to shareholders are determined in accordance with federal income tax regulations and may differ from determinations using GAAP.
(D) Security Transactions and Investment Income. The Allocation Portfolios record security transactions on the trade date. Realized gains and losses on security transactions are determined using the identified cost method. Dividends and distributions received by the Allocation Portfolios from the Underlying Portfolios/Funds are recorded on the ex-dividend date. Distributions received from real estate investment trusts may be classified as dividends, capital gains and/or return of capital.
Investment income and realized and unrealized gains and losses on investments of the Allocation Portfolios are allocated pro rata to the separate classes of shares based upon their relative net assets on the date the income is earned or realized and unrealized gains and losses are incurred.
(E) Expenses. Expenses of the Fund are allocated to the individual Portfolios in proportion to the net assets of the respective Portfolios when the expenses are incurred, except where direct allocations of expenses can be made. Expenses (other than fees incurred under the distribution and service plans, further discussed in Note 3(B), which are charged directly to the Service Class shares) are allocated to separate
| | |
| 50 | | MainStay VP Allocation Portfolios |
classes of shares pro rata based upon their relative net assets on the date the expenses are incurred. The expenses borne by the Allocation Portfolios, including those of related parties to the Allocation Portfolios, are shown in the Statement of Operations.
Additionally, the Allocation Portfolios may invest in shares of ETFs and mutual funds, which are subject to management fees and other fees that may cause the costs of investing in ETFs and mutual funds to be greater than the costs of owning the underlying securities directly. These indirect expenses of ETFs and mutual funds are not included in the amounts shown as expenses in each Allocation Portfolio’s Statement of Operations or in the expense ratios included in the financial highlights. In addition, the Allocation Portfolios bear a pro rata share of the fees and expenses of the Underlying Portfolios/Funds in which they invest. Because the Underlying Portfolios/Funds have varied expense and fee levels and the Allocation Portfolios may own different proportions of the Underlying Portfolios/Funds at different times, the amount of fees and expenses incurred indirectly by each Allocation Portfolio may vary.
(F) Use of Estimates. In preparing financial statements in conformity with GAAP, the Manager makes estimates and assumptions that affect the reported amounts and disclosures in the financial statements. Actual results could differ from those estimates.
(G) Repurchase Agreements. The Allocation Portfolios may enter into repurchase agreements (i.e., buy a security from another party with the agreement that it will be sold back in the future) to earn income. The Allocation Portfolios may enter into repurchase agreements only with counterparties, usually financial institutions, that are deemed by the Manager to be creditworthy, pursuant to guidelines established by the Board. During the term of any repurchase agreement, the Manager will continue to monitor the creditworthiness of the counterparty. Under the 1940 Act, repurchase agreements are considered to be collateralized loans by the Allocation Portfolio to the counterparty secured by the securities transferred to the respective Allocation Portfolio.
Repurchase agreements are subject to counterparty risk, meaning an Allocation Portfolio could lose money by the counterparty’s failure to perform under the terms of the agreement. The Allocation Portfolios mitigate this risk by ensuring the repurchase agreement is collateralized by cash, U.S. government securities, fixed income securities and/or other securities. The collateral is held by the Allocation Portfolios’ custodian and valued daily on a mark to market basis to determine if the value, including accrued interest, exceeds the repurchase price. In the event of the counterparty’s default on the obligation to repurchase, the Allocation Portfolios have the right to liquidate the collateral and apply the proceeds in satisfaction of the obligation. Under certain circumstances, such as in the event of default or bankruptcy by the counterparty, realization and/or retention of the collateral may be limited or subject to delay, to legal proceedings and possible realized loss to the respective Allocation Portfolio. As of June 30, 2020, the Allocation Portfolios did not hold any repurchase agreements.
(H) LIBOR Replacement Risk. The Allocation Portfolios may invest in certain debt securities, derivatives or other financial instruments that utilize the London Interbank Offered Rate (“LIBOR”) as a “benchmark” or “reference rate” for various interest rate calculations. The United Kingdom Financial Conduct Authority, which regulates LIBOR,
announced that after 2021 it will cease its active encouragement of banks to provide the quotations needed to sustain LIBOR. As a result, it is anticipated that LIBOR will be discontinued or will no longer be sufficiently robust to be representative of its underlying market around that time. Although financial regulators and industry working groups have suggested alternative reference rates, such as the European Interbank Offer Rate (“EURIBOR”), Sterling Overnight Interbank Average Rate (“SONIA”) and Secured Overnight Financing Rate (“SOFR”), there are challenges to converting certain contracts and transactions to a new benchmark and neither the full effects of the transition process nor its ultimate outcome is known.
The elimination of LIBOR or changes to other reference rates or any other changes or reforms to the determination or supervision of reference rates could have an adverse impact on the market for, or value of, any securities or payments linked to those reference rates, which may adversely affect the Allocation Portfolios’ performance and/or net asset value. Uncertainty and risk also remain regarding the willingness and ability of issuers and lenders to include revised provisions in new and existing contracts or instruments. Consequently, the transition away from LIBOR to other reference rates may lead to increased volatility and illiquidity in markets that are tied to LIBOR, fluctuations in values of LIBOR-related investments or investments in issuers that utilize LIBOR, increased difficulty in borrowing or refinancing and diminished effectiveness of hedging strategies, adversely affecting the Allocation Portfolios’ performance. Furthermore, the risks associated with the expected discontinuation of LIBOR and transition may be exacerbated if the work necessary to effect an orderly transition to an alternative reference rate is not completed in a timely manner. Because the usefulness of LIBOR as a benchmark could deteriorate during the transition period, these effects could occur prior to the end of 2021.
(I) Swap Contracts. The Allocation Portfolios may enter into credit default, interest rate, equity, index and currency exchange rate swap contracts (“swaps”). In a typical swap transaction, two parties agree to exchange the future returns (or differentials in rates of future returns) earned or realized at periodic intervals on a particular investment or instrument based on a notional principal amount. Generally, the Allocation Portfolios will enter into a swap on a net basis, which means that the two payment streams under the swap are netted, with the Allocation Portfolios receiving or paying (as the case may be) only the net amount of the two payment streams. Therefore, the Allocation Portfolios’ current obligation under a swap generally will be equal to the net amount to be paid or received under the swap, based on the relative value of notional positions attributable to each counterparty to the swap. The payments may be adjusted for transaction costs, interest payments, the amount of interest paid on the investment or instrument or other factors. Collateral, in the form of cash or securities, may be required to be held in segregated accounts with the custodian bank or broker in accordance with the terms of the swap. Swap agreements are privately negotiated in the over the counter (“OTC”) market and may be executed in a multilateral or other trade facilities platform, such as a registered commodities exchange (“centrally cleared swaps”).
Certain standardized swaps, including certain credit default and interest rate swaps, are subject to mandatory clearing and exchange-trading, and more types of standardized swaps are expected to be subject to mandatory clearing and exchange-trading in the future. The counterparty risk for exchange-traded and cleared derivatives is expected to be
Notes to Financial Statements (Unaudited) (continued)
generally lower than for uncleared derivatives, but cleared contracts are not risk-free. In a cleared derivative transaction, the Portfolio typically enters into the transaction with a financial institution counterparty, and performance of the transaction is effectively guaranteed by a central clearinghouse, thereby reducing or eliminating the Allocation Portfolios’ exposure to the credit risk of its original counterparty. The Allocation Portfolios will be required to post specified levels of margin with the clearinghouse or at the instruction of the clearinghouse; the margin required by a clearinghouse may be greater than the margin the Portfolio would be required to post in an uncleared transaction. As of June 30, 2020, all swap positions are shown in the Portfolio of Investments.
Swaps are marked to market daily based upon quotations from pricing agents, brokers, or market makers and the change in value, if any, is recorded as unrealized appreciation or depreciation. Any payments made or received upon entering into a swap would be amortized or accreted over the life of the swap and recorded as a realized gain or loss. Early termination of a swap is recorded as a realized gain or loss. Daily changes in valuation of centrally cleared swaps, if any, are recorded as a receivable or payable for the change in value as appropriate on the Statement of Assets and Liabilities.
The Allocation Portfolios bears the risk of loss of the amount expected to be received under a swap in the event of the default or bankruptcy of the swap counterparty. The Allocation Portfolios may be able to eliminate its exposure under a swap either by assignment or other disposition, or by entering into an offsetting swap with the same party or a similar credit-worthy party. Swaps are not actively traded on financial markets. Entering into swaps involves elements of credit, market, and documentation risk in excess of the amounts recognized on the Statement of Assets and Liabilities. Such risks involve the possibilities that there will be no liquid market for these swaps, that the counterparty to the swaps may default on its obligation to perform or disagree as to the meaning of the contractual terms in the swaps and that there may be unfavorable changes in interest rates, the price of the index or the security underlying these transactions.
Equity Swaps (Total Return Swaps): Total return swap contracts are agreements between counterparties to exchange cash flow, one based on a market-linked return of an individual asset or group of assets (such as an index), and the other on a fixed or floating rate. As a total return swap, an equity swap may be structured in different ways. For example, when the Allocation Portfolios enter into a “long” equity swap, the counterparty may agree to pay the Allocation Portfolios the amount, if any, by which the notional amount of the equity swap would have increased in value had it been invested in a particular referenced security or securities, plus the dividends that would have been received on those securities. In return, the Allocation Portfolios will generally agree to pay the counterparty interest on the notional amount of the equity swap plus the amount, if any, by which that notional amount would have decreased in value had it been invested in such referenced security or securities, plus, in certain instances, commissions or trading spreads on the notional amounts. Therefore, the Allocation Portfolios’ return on the equity swap generally should equal the gain or loss on the notional amount, plus dividends on the referenced security or securities less the interest paid by the Allocation Portfolios on the notional amount. Alternatively, when the Allocation Portfolios enter into a “short” equity swap,
the counterparty will generally agree to pay the Allocation Portfolios the amount, if any, by which the notional amount of the equity swap would have decreased in value had the Allocation Portfolios sold a particular referenced security or securities short, less the dividend expense that the Allocation Portfolios would have incurred on the referenced security or securities, as adjusted for interest payments or other economic factors. In this situation, the Allocation Portfolios will generally be obligated to pay the amount, if any, by which the notional amount of the swap would have increased in value had it been invested directly in the referenced security or securities.
Equity swaps generally do not involve the delivery of securities or other referenced assets. Accordingly, the risk of loss with respect to equity swaps is normally limited to the net amount of payments that the Allocation Portfolios are contractually obligated to make. If the other party to an equity swap defaults, the Allocation Portfolios’ risk of loss consists of the net amount of payments that the Allocation Portfolios are contractually entitled to receive, if any. The Allocation Portfolios will segregate cash or liquid assets, enter into offsetting transactions or use other measures permitted by applicable law to “cover” the Allocation Portfolios’ current obligations. The Allocation Portfolios and New York Life Investments, however, believe these transactions do not constitute senior securities under the 1940 Act and, accordingly, will not treat them as being subject to the Allocation Portfolios’ borrowing restrictions.
Equity swaps are derivatives and their value can be very volatile. The Allocation Portfolios may engage in total return swaps to gain exposure to securities, along with offsetting long total return swap positions to maintain appropriate currency balances and risk exposures across all swap positions. To the extent that the Manager, or Subadvisor does not accurately analyze and predict future market trends, the values or assets or economic factors, the Allocation Portfolios may suffer a loss, which may be substantial. As of June 30, 2020, open swap agreements are shown in the Portfolio of Investments.
(J) Indemnifications. Under the Fund’s organizational documents, its officers and trustees are indemnified against certain liabilities that may arise out of performance of their duties to the Fund. Additionally, in the normal course of business, the Allocation Portfolios enter into contracts with third-party service providers that contain a variety of representations and warranties and that may provide general indemnifications. The Allocation Portfolios’ maximum exposure under these arrangements is unknown, as this would involve future claims that may be made against the Allocation Portfolios that have not yet occurred. The Manager believes that the risk of loss in connection with these potential indemnification obligations is remote. However, there can be no assurance that material liabilities related to such obligations will not arise in the future, which could adversely impact the Allocation Portfolios.
(K) Quantitative Disclosure of Derivative Holdings. The following tables show additional disclosures related to the Allocation Portfolios’ derivative and hedging activities, including how such activities are accounted for and their effect on the Allocation Portfolios’ financial positions, performance and cash flows. The Allocation Portfolios entered into total return swap contracts to seek to enhance returns or reduce the risk of loss by hedging certain of the Allocation Portfolios’ holdings. These derivatives are not accounted for as hedging instruments.
| | |
| 52 | | MainStay VP Allocation Portfolios |
MainStay VP Conservative Allocation Portfolio
The effect of derivative instruments on the Statement of Operations for the period ended June 30, 2020:
Realized Gain (Loss)
| | | | | | | | | | |
| | | Statement of
Operations
Location | | Equity
Contracts
Risk | | | Total | |
| | | |
Swap Contracts | | Net realized gain (loss) on swap transactions | | $ | 1,370,298 | | | $ | 1,370,298 | |
| | | | | | |
Total Realized Gain (Loss) | | | | $ | 1,370,298 | | | $ | 1,370,298 | |
| | | | | | |
Average Notional Amount
| | | | | | | | |
| | | Equity
Contracts
Risk | | | Total | |
| | |
Swap Contracts Long | | $ | 44,797,409 | | | $ | 44,797,409 | |
Swap Contracts Short | | $ | (25,947,050 | ) | | $ | (25,947,050 | ) |
| | | | |
MainStay VP Moderate Allocation Portfolio
The effect of derivative instruments on the Statement of Operations for the period ended June 30, 2020:
Realized Gain (Loss)
| | | | | | | | | | |
| | | Statement of
Operations
Location | | Equity
Contracts
Risk | | | Total | |
| | | |
Swap Contracts | | Net realized gain (loss) on swap transactions | | $ | 1,555,885 | | | $ | 1,555,885 | |
| | | | | | |
Total Realized Gain (Loss) | | | | $ | 1,555,885 | | | $ | 1,555,885 | |
| | | | | | |
Average Notional Amount
| | | | | | | | |
| | | Equity
Contracts
Risk | | | Total | |
| | |
Swap Contracts Long | | $ | 65,897,896 | | | $ | 65,897,896 | |
Swap Contracts Short | | $ | (40,061,661 | ) | | $ | (40,061,661 | ) |
| | | | |
MainStay VP Moderate Growth Allocation Portfolio
The effect of derivative instruments on the Statement of Operations for the period ended June 30, 2020:
Realized Gain (Loss)
| | | | | | | | | | |
| | | Statement of
Operations
Location | | Equity
Contracts
Risk | | | Total | |
| | | |
Swap Contracts | | Net realized gain (loss) on swap transactions | | $ | (255,064 | ) | | $ | (255,064 | ) |
| | | | | | |
Total Realized Gain (Loss) | | | | $ | (255,064 | ) | | $ | (255,064 | ) |
| | | | | | |
Average Notional Amount
| | | | | | | | |
| | | Equity
Contracts
Risk | | | Total | |
| | |
Swap Contracts Long | | $ | 109,358,704 | | | $ | 109,358,704 | |
Swap Contracts Short | | $ | (70,845,984 | ) | | $ | (70,845,984 | ) |
| | | | |
MainStay VP Growth Allocation Portfolio
The effect of derivative instruments on the Statement of Operations for the period ended June 30, 2020:
Realized Gain (Loss)
| | | | | | | | | | |
| | | Statement of
Operations
Location | | Equity
Contracts
Risk | | | Total | |
| | | |
Swap Contracts | | Net realized gain (loss) on swap transactions | | $ | 5,086,525 | | | $ | 5,086,525 | |
| | | | | | |
Total Realized Gain (Loss) | | | | $ | 5,086,525 | | | $ | 5,086,525 | |
| | | | | | |
Average Notional Amount
| | | | | | | | |
| | | Equity
Contracts
Risk | | | Total | |
| | |
Swap Contracts Long | | $ | 36,239,583 | | | $ | 36,239,583 | |
Swap Contracts Short | | $ | (34,297,929 | ) | | $ | (34,297,929 | ) |
| | | | |
Note 3–Fees and Related Party Transactions
(A) Manager. New York Life Investments, a registered investment adviser and an indirect, wholly-owned subsidiary of New York Life, serves as the Allocation Portfolios’ Manager pursuant to an Amended and Restated Management Agreement (“Management Agreement”) and is responsible for the day-to-day portfolio management of the Allocation Portfolios. The Manager provides offices, conducts clerical, recordkeeping and bookkeeping services, and keeps most of the financial and accounting records required to be maintained by the Allocation Portfolios. Except for the portion of salaries and expenses that are the responsibility of the Allocation Portfolios, the Manager pays the salaries and expenses of all personnel affiliated with the Allocation Portfolios and certain operational expenses of the Allocation Portfolios. The Allocation Portfolios reimburse New York Life Investments in an amount equal to the portion of the compensation of the Chief Compliance Officer attributable to the Allocation Portfolios.
The Allocation Portfolios do not pay any fees to the Manager in return for the services performed under the Management Agreement. The Allocation Portfolios do, however, indirectly pay a proportionate share of the management fees paid to the managers of the Underlying Portfolios/Funds in which the Allocation Portfolios invest.
State Street Bank and Trust Company (“State Street”) provides sub-administration and sub-accounting services to the Allocation Portfolios pursuant to an agreement with New York Life Investments. These services include calculating the daily NAVs of the Allocation Portfolios,
Notes to Financial Statements (Unaudited) (continued)
maintaining the general ledger and sub-ledger accounts for the calculation of the Allocation Portfolios’ respective NAVs, and assisting New York Life Investments in conducting various aspects of the Allocation Portfolios’ administrative operations. For providing these services to the Allocation Portfolios, State Street is compensated by New York Life Investments.
Pursuant to an agreement between the Trust and New York Life Investments, New York Life Investments is responsible for providing or procuring certain regulatory reporting services for the Allocation Portfolios. The Allocation Portfolios will reimburse New York Life Investments for the actual costs incurred by New York Life Investments in connection with providing or procuring these services for the Allocation Portfolios.
(B) Distribution and Service Fees. The Fund, on behalf of the Allocation Portfolios, has entered into a distribution agreement with NYLIFE Distributors LLC (the “Distributor”), an indirect, wholly-owned subsidiary of New York Life. The Allocation Portfolios have adopted a distribution plan (the “Plan”) in accordance with the provisions of Rule 12b-1 under the 1940 Act. Under the Plan, the Distributor has agreed to provide, through its affiliates or independent third parties, various distribution-related, shareholder and administrative support services to the Service Class shareholders. For its services, the Distributor is entitled to a combined distribution and service fee accrued daily and paid monthly at an annual rate of 0.25% of the average daily net assets attributable to the Service Class shares of each Allocation Portfolio.
(C) Investments in Affiliates (in 000’s). During the six-month period ended June 30, 2020, purchases and sales transactions, income earned from investments and shares held of investment companies managed by New York Life Investments or its affiliates were as follows:
MainStay VP Conservative Allocation Portfolio
| | | | | | | | | | | | | | | | | | | | | | | | | | | | | | | | | | | | |
Affiliated Investment Companies | | Value,
Beginning
of Period | | | Purchases
at Cost | | | Proceeds
from
Sales | | | Net
Realized
Gain/ (Loss)
on Sales | | | Change in
Unrealized
Appreciation/
(Depreciation) | | | Value,
End of
Period | | | Dividend
Income | | | Other
Distributions | | | Shares
End of
Period | |
IQ 50 Percent Hedged FTSE International ETF | | $ | 14,890 | | | $ | 14 | | | $ | (29 | ) | | $ | 0 | (a) | | $ | (1,618 | ) | | $ | 13,257 | | | $ | 170 | | | $ | — | | | | 685 | |
IQ 500 International ETF | | | 16,651 | | | | 12 | | | | (980 | ) | | | (55 | ) | | | (2,716 | ) | | | 12,912 | | | | 190 | | | | — | | | | 546 | |
IQ Candriam ESG International Equity ETF | | | — | | | | 6,457 | | | | — | | | | — | | | | 693 | | | | 7,150 | | | | 33 | | | | — | | | | 312 | |
IQ Candriam ESG U.S. Equity ETF | | | — | | | | 1,141 | | | | — | | | | — | | | | (20 | ) | | | 1,121 | | | | 2 | | | | — | | | | 43 | |
IQ Chaikin U.S. Large Cap ETF | | | 10,591 | | | | 458 | | | | (66 | ) | | | 4 | | | | (1,283 | ) | | | 9,704 | | | | 105 | | | | — | | | | 418 | |
IQ Chaikin U.S. Small Cap ETF | | | 4,988 | | | | — | | | | (2,594 | ) | | | (16 | ) | | | (490 | ) | | | 1,888 | | | | 7 | | | | — | | | | 87 | |
IQ S&P High Yield Low Volatility Bond ETF | | | 4,876 | | | | 6,770 | | | | (4,654 | ) | | | (191 | ) | | | (181 | ) | | | 6,620 | | | | 28 | | | | — | | | | 273 | |
MainStay Epoch Capital Growth Fund Class I | | | 7,986 | | | | — | | | | (6,226 | ) | | | 1,467 | | | | (1,093 | ) | | | 2,134 | | | | — | | | | — | | | | 158 | |
MainStay Epoch International Choice Fund Class I | | | 11,434 | | | | — | | | | (1,627 | ) | | | (39 | ) | | | (1,054 | ) | | | 8,714 | | | | — | | | | — | | | | 264 | |
MainStay Epoch U.S. All Cap Fund Class R6 | | | 14,049 | | | | 242 | | | | (2,299 | ) | | | 472 | | | | (1,762 | ) | | | 10,702 | | | | — | | | | — | | | | 442 | |
MainStay MacKay High Yield Municipal Bond Fund Class R6 | | | 12,373 | | | | 80 | | | | (12,320 | ) | | | 311 | | | | (444 | ) | | | — | | | | 84 | | | | — | | | | — | |
MainStay MacKay Infrastructure Bond Fund Class R6 | | | 17,952 | | | | 178 | | | | (7,141 | ) | | | 266 | | | | 356 | | | | 11,611 | | | | 166 | | | | — | | | | 1,315 | |
MainStay MacKay International Opportunities Fund Class I | | | 8,552 | | | | 276 | | | | (27 | ) | | | (14 | ) | | | (1,228 | ) | | | 7,559 | | | | — | | | | — | | | | 1,190 | |
MainStay MacKay Short Duration High Yield Fund Class I | | | 67,801 | | | | 3,395 | | | | (18,222 | ) | | | (534 | ) | | | (3,223 | ) | | | 49,217 | | | | 1,303 | | | | — | | | | 5,292 | |
MainStay MacKay U.S. Equity Opportunities Fund Class I | | | 8,281 | | | | — | | | | (8,029 | ) | | | (790 | ) | | | 538 | | | | — | | | | — | | | | — | | | | — | |
MainStay MAP Equity Fund Class I | | | 22,230 | | | | 1,784 | | | | (4,955 | ) | | | 46 | | | | (1,514 | ) | | | 17,591 | | | | — | | | | — | | | | 453 | |
MainStay Short Term Bond Class I | | | 7,289 | | | | 76 | | | | (5 | ) | | | (0 | )(a) | | | 28 | | | | 7,388 | | | | 67 | | | | — | | | | 692 | |
MainStay U.S. Government Liquidity Fund | | | 26,803 | | | | 96,976 | | | | (92,467 | ) | | | — | | | | — | | | | 31,312 | | | | 83 | | | | — | | | | 31,312 | |
MainStay VP Bond Portfolio Initial Class | | | 45,853 | | | | 2,480 | | | | (6,226 | ) | | | 480 | | | | 1,773 | | | | 44,360 | | | | — | | | | — | | | | 2,886 | |
MainStay VP Emerging Markets Equity Portfolio Initial Class | | | 15,305 | | | | — | | | | (3,043 | ) | | | (250 | ) | | | (565 | ) | | | 11,447 | | | | — | | | | — | | | | 1,289 | |
MainStay VP Epoch U.S. Equity Yield Portfolio Initial Class | | | 21,036 | | | | 2,037 | | | | (608 | ) | | | 5 | | | | (3,349 | ) | | | 19,121 | | | | — | | | | — | | | | 1,388 | |
MainStay VP Floating Rate Portfolio Initial Class | | | 29,458 | | | | 2,246 | | | | (9,748 | ) | | | (1,213 | ) | | | (1,031 | ) | | | 19,712 | | | | 518 | | | | — | | | | 2,357 | |
MainStay VP Indexed Bond Portfolio Initial Class | | | 228,724 | | | | 30,772 | | | | (21,269 | ) | | | 2,074 | | | | 12,714 | | | | 253,015 | | | | — | | | | — | | | | 22,382 | |
MainStay VP MacKay Common Stock Portfolio Initial Class | | | 10,301 | | | | 976 | | | | (6,015 | ) | | | (737 | ) | | | 212 | | | | 4,737 | | | | — | | | | — | | | | 184 | |
| | |
| 54 | | MainStay VP Allocation Portfolios |
MainStay VP Conservative Allocation Portfolio (continued)
| | | | | | | | | | | | | | | | | | | | | | | | | | | | | | | | | | | | |
Affiliated Investment Companies | | Value,
Beginning
of Period | | | Purchases
at Cost | | | Proceeds
from
Sales | | | Net
Realized
Gain/ (Loss)
on Sales | | | Change in
Unrealized
Appreciation/
(Depreciation) | | | Value,
End of
Period | | | Dividend
Income | | | Other
Distributions | | | Shares
End of
Period | |
MainStay VP MacKay Convertible Portfolio Initial Class | | $ | 8,346 | | | $ | 23 | | | $ | (7,958 | ) | | $ | 54 | | | $ | (465 | ) | | $ | — | | | $ | 23 | | | $ | — | | | | — | |
MainStay VP MacKay Growth Portfolio Initial Class | | | 16,611 | | | | 1,570 | | | | (4,404 | ) | | | 1,059 | | | | 708 | | | | 15,544 | | | | — | | | | — | | | | 446 | |
MainStay VP MacKay International Equity Portfolio Initial Class | | | 4,718 | | | | 333 | | | | — | | | | — | | | | (209 | ) | | | 4,842 | | | | — | | | | — | | | | 311 | |
MainStay VP MacKay Mid Cap Core Portfolio Initial Class | | | 16,287 | | | | 2 | | | | (4,145 | ) | | | 407 | | | | (1,820 | ) | | | 10,731 | | | | — | | | | — | | | | 899 | |
MainStay VP MacKay S&P 500 Index Portfolio Initial Class | | | 3,176 | | | | 23,928 | | | | (7,666 | ) | | | 231 | | | | 2,861 | | | | 22,530 | | | | — | | | | — | | | | 377 | |
MainStay VP MacKay Small Cap Core Portfolio Initial Class | | | 8,920 | | | | 4 | | | | (2,133 | ) | | | (406 | ) | | | (775 | ) | | | 5,610 | | | | — | | | | — | | | | 637 | |
MainStay VP MacKay Unconstrained Bond Portfolio Initial Class | | | 4,676 | | | | 24 | | | | (4,569 | ) | | | (92 | ) | | | (39 | ) | | | — | | | | 24 | | | | — | | | | — | |
MainStay VP PIMCO Real Return Portfolio Initial Class | | | 7,669 | | | | — | | | | (326 | ) | | | 3 | | | | 455 | | | | 7,801 | | | | — | | | | — | | | | 852 | |
MainStay VP Small Cap Growth Portfolio Initial Class (b) | | | 10,042 | | | | 4,983 | | | | (101 | ) | | | 12 | | | | (93 | ) | | | 14,843 | | | | — | | | | — | | | | 1,112 | |
MainStay VP T. Rowe Price Equity Income Portfolio Initial Class | | | 22,894 | | | | 4,801 | | | | (5,611 | ) | | | (995 | ) | | | (2,908 | ) | | | 18,181 | | | | — | | | | — | | | | 1,744 | |
MainStay VP Winslow Large Cap Growth Portfolio Initial Class (c) | | | 21,592 | | | | 1,128 | | | | (4,014 | ) | | | 984 | | | | 2,011 | | | | 21,701 | | | | — | | | | — | | | | 759 | |
| | | | | | | | |
| | $ | 732,354 | | | $ | 193,166 | | | $ | (249,477 | ) | | $ | 2,543 | | | $ | (5,531 | ) | | $ | 673,055 | | | $ | 2,803 | | | | | | | | | |
| | | | | | | | |
MainStay VP Moderate Allocation Portfolio
| | | | | | | | | | | | | | | | | | | | | | | | | | | | | | | | | | | | |
Affiliated Investment Companies | | Value,
Beginning
of Period | | | Purchases
at Cost | | | Proceeds
from
Sales | | | Net
Realized
Gain/ (Loss)
on Sales | | | Change in
Unrealized
Appreciation/
(Depreciation) | | | Value,
End of
Period | | | Dividend
Income | | | Other
Distributions | | | Shares
End of
Period | |
IQ 50 Percent Hedged FTSE International ETF | | $ | 23,862 | | | $ | 19 | | | $ | (45 | ) | | $ | (1 | ) | | $ | (2,592 | ) | | $ | 21,243 | | | $ | 272 | | | $ | — | | | | 1,097 | |
IQ 500 International ETF | | | 31,097 | | | | 78 | | | | — | | | | — | | | | (5,298 | ) | | | 25,877 | | | | 380 | | | | — | | | | 1,094 | |
IQ Candriam ESG International Equity ETF | | | — | | | | 14,596 | | | | — | | | | — | | | | 1,749 | | | | 16,345 | | | | 76 | | | | — | | | | 714 | |
IQ Candriam ESG U.S. Equity ETF | | | — | | | | 2,036 | | | | — | | | | — | | | | 167 | | | | 2,203 | | | | 4 | | | | — | | | | 84 | |
IQ Chaikin U.S. Large Cap ETF | | | 31,904 | | | | 1,080 | | | | (158 | ) | | | 9 | | | | (3,994 | ) | | | 28,841 | | | | 311 | | | | — | | | | 1,241 | |
IQ Chaikin U.S. Small Cap ETF | | | 10,697 | | | | — | | | | (5,358 | ) | | | (244 | ) | | | (876 | ) | | | 4,219 | | | | 16 | | | | — | | | | 195 | |
IQ S&P High Yield Low Volatility Bond ETF | | | 4,538 | | | | 10,514 | | | | (4,234 | ) | | | (304 | ) | | | (234 | ) | | | 10,280 | | | | 31 | | | | — | | | | 424 | |
MainStay Epoch Capital Growth Fund Class I | | | 12,322 | | | | — | | | | (5,143 | ) | | | 1,248 | | | | (726 | ) | | | 7,701 | | | | — | | | | — | | | | 569 | |
MainStay Epoch International Choice Fund Class I | | | 39,810 | | | | — | | | | (8,682 | ) | | | 1,096 | | | | (4,666 | ) | | | 27,558 | | | | — | | | | — | | | | 833 | |
MainStay Epoch U.S. All Cap Fund Class R6 | | | 40,224 | | | | 617 | | | | (3,865 | ) | | | 40 | | | | (4,166 | ) | | | 32,850 | | | | — | | | | — | | | | 1,355 | |
MainStay MacKay High Yield Municipal Bond Fund Class R6 | | | 18,614 | | | | 134 | | | | (18,369 | ) | | | 278 | | | | (657 | ) | | | — | | | | 143 | | | | — | | | | — | |
MainStay MacKay Infrastructure Bond Fund Class R6 | | | 28,241 | | | | 706 | | | | (10,985 | ) | | | 408 | | | | 566 | | | | 18,936 | | | | 268 | | | | — | | | | 2,145 | |
MainStay MacKay International Opportunities Fund Class I | | | 27,640 | | | | 32 | | | | (46 | ) | | | (20 | ) | | | (3,874 | ) | | | 23,732 | | | | — | | | | — | | | | 3,737 | |
Notes to Financial Statements (Unaudited) (continued)
MainStay VP Moderate Allocation Portfolio (continued)
| | | | | | | | | | | | | | | | | | | | | | | | | | | | | | | | | | | | |
Affiliated Investment Companies | | Value,
Beginning
of Period | | | Purchases
at Cost | | | Proceeds
from
Sales | | | Net
Realized
Gain/ (Loss)
on Sales | | | Change in
Unrealized
Appreciation/
(Depreciation) | | | Value,
End of
Period | | | Dividend
Income | | | Other
Distributions | | | Shares
End of
Period | |
MainStay MacKay Short Duration High Yield Fund Class I | | $ | 82,707 | | | $ | 1,514 | | | $ | (26,390 | ) | | $ | (587 | ) | | $ | (3,736 | ) | | $ | 53,508 | | | $ | 1,515 | | | $ | — | | | | 5,754 | |
MainStay MacKay U.S. Equity Opportunities Fund Class I | | | 21,795 | | | | — | | | | (20,605 | ) | | | (2,723 | ) | | | 1,533 | | | | — | | | | — | | | | — | | | | — | |
MainStay MAP Equity Fund Class I | | | 53,923 | | | | 3,312 | | | | (6,607 | ) | | | 5 | | | | (3,559 | ) | | | 47,074 | | | | — | | | | — | | | | 1,211 | |
MainStay Short Term Bond Class I | | | 11,429 | | | | 168 | | | | (32 | ) | | | (1 | ) | | | 45 | | | | 11,609 | | | | 105 | | | | — | | | | 1,088 | |
MainStay U.S. Government Liquidity Fund | | | 46,852 | | | | 128,941 | | | | (136,501 | ) | | | — | | | | — | | | | 39,292 | | | | 131 | | | | — | | | | 39,292 | |
MainStay VP Bond Portfolio Initial Class | | | 75,822 | | | | — | | | | (11,469 | ) | | | 15 | | | | 3,614 | | | | 67,982 | | | | — | | | | — | | | | 4,423 | |
MainStay VP Emerging Markets Equity Portfolio Initial Class | | | 43,154 | | | | — | | | | (10,509 | ) | | | (475 | ) | | | (2,475 | ) | | | 29,695 | | | | — | | | | — | | | | 3,343 | |
MainStay VP Epoch U.S. Equity Yield Portfolio Initial Class | | | 50,383 | | | | 8 | | | | (142 | ) | | | 15 | | | | (7,319 | ) | | | 42,945 | | | | — | | | | — | | | | 3,117 | |
MainStay VP Floating Rate Portfolio Initial Class | | | 17,319 | | | | 278 | | | | (10,891 | ) | | | (1,133 | ) | | | (301 | ) | | | 5,272 | | | | 278 | | | | — | | | | 630 | |
MainStay VP Indexed Bond Portfolio Initial Class | | | 164,486 | | | | 81,789 | | | | (21,561 | ) | | | 1,872 | | | | 9,927 | | | | 236,513 | | | | — | | | | — | | | | 20,922 | |
MainStay VP MacKay Common Stock Portfolio Initial Class | | | 29,337 | | | | 1,206 | | | | (15,626 | ) | | | (1,791 | ) | | | (208 | ) | | | 12,918 | | | | — | | | | — | | | | 502 | |
MainStay VP MacKay Convertible Portfolio Initial Class | | | 16,222 | | | | 45 | | | | (15,474 | ) | | | 137 | | | | (930 | ) | | | — | | | | 45 | | | | — | | | | — | |
MainStay VP MacKay Growth Portfolio Initial Class | | | 48,632 | | | | 2,231 | | | | (13,748 | ) | | | 1,991 | | | | 1,356 | | | | 40,462 | | | | — | | | | — | | | | 1,161 | |
MainStay VP MacKay International Equity Portfolio Initial Class | | | 6,450 | | | | 2,002 | | | | — | | | | — | | | | (348 | ) | | | 8,104 | | | | — | | | | — | | | | 521 | |
MainStay VP MacKay Mid Cap Core Portfolio Initial Class | | | 34,677 | | | | — | | | | (4,878 | ) | | | 270 | | | | (3,802 | ) | | | 26,267 | | | | — | | | | — | | | | 2,202 | |
MainStay VP MacKay S&P 500 Index Portfolio Initial Class | | | 4,126 | | | | 40,447 | | | | (213 | ) | | | 32 | | | | 6,866 | | | | 51,258 | | | | — | | | | — | | | | 858 | |
MainStay VP MacKay Small Cap Core Portfolio Initial Class | | | 14,919 | | | | 8 | | | | (968 | ) | | | (306 | ) | | | (2,117 | ) | | | 11,536 | | | | — | | | | — | | | | 1,310 | |
MainStay VP MacKay Unconstrained Bond Portfolio Initial Class | | | 9,622 | | | | 48 | | | | (9,405 | ) | | | (186 | ) | | | (79 | ) | | | — | | | | 48 | | | | — | | | | — | |
MainStay VP PIMCO Real Return Portfolio Initial Class | | | 11,400 | | | | 63 | | | | (457 | ) | | | 5 | | | | 681 | | | | 11,692 | | | | — | | | | — | | | | 1,276 | |
MainStay VP Small Cap Growth Portfolio Initial Class (b) | | | 16,945 | | | | 4,303 | | | | — | | | | — | | | | (40 | ) | | | 21,208 | | | | — | | | | — | | | | 1,589 | |
MainStay VP T. Rowe Price Equity Income Portfolio Initial Class | | | 57,471 | | | | 4,450 | | | | (5,947 | ) | | | (1,438 | ) | | | (7,923 | ) | | | 46,613 | | | | — | | | | — | | | | 4,470 | |
MainStay VP Winslow Large Cap Growth Portfolio Initial Class (c) | | | 60,519 | | | | 16 | | | | (10,982 | ) | | | 3,309 | | | | 3,482 | | | | 56,344 | | | | — | | | | — | | | | 1,970 | |
| | | | | | | | |
| | $ | 1,147,139 | | | $ | 300,641 | | | $ | (379,290 | ) | | $ | 1,521 | | | $ | (29,934 | ) | | $ | 1,040,077 | | | $ | 3,623 | | | | | | | | | |
| | | | | | | | |
| | |
| 56 | | MainStay VP Allocation Portfolios |
MainStay VP Moderate Growth Allocation Portfolio
| | | | | | | | | | | | | | | | | | | | | | | | | | | | | | | | | | | | |
Affiliated Investment Companies | | Value,
Beginning
of Period | | | Purchases
at Cost | | | Proceeds
from
Sales | | | Net
Realized
Gain/ (Loss)
on Sales | | | Change in
Unrealized
Appreciation/
(Depreciation) | | | Value,
End of
Period | | | Dividend
Income | | | Other
Distributions | | | Shares
End of
Period | |
IQ 50 Percent Hedged FTSE International ETF | | $ | 40,494 | | | $ | — | | | $ | (64 | ) | | $ | (4 | ) | | $ | (4,400 | ) | | $ | 36,026 | | | $ | 461 | | | $ | — | | | | 1,861 | |
IQ 500 International ETF | | | 76,074 | | | | 35 | | | | (214 | ) | | | (12 | ) | | | (12,923 | ) | | | 62,960 | | | | 925 | | | | — | | | | 2,661 | |
IQ Candriam ESG International Equity ETF | | | — | | | | 16,385 | | | | — | | | | — | | | | 2,241 | | | | 18,626 | | | | 87 | | | | — | | | | 813 | |
IQ Candriam ESG U.S. Equity ETF | | | — | | | | 822 | | | | — | | | | — | | | | (4 | ) | | | 818 | | | | 1 | | | | — | | | | 31 | |
IQ Chaikin U.S. Large Cap ETF | | | 79,542 | | | | — | | | | (10,112 | ) | | | 1,254 | | | | (10,895 | ) | | | 59,789 | | | | 647 | | | | — | | | | 2,573 | |
IQ Chaikin U.S. Small Cap ETF | | | 26,623 | | | | 10 | | | | (10,732 | ) | | | (440 | ) | | | (2,846 | ) | | | 12,615 | | | | 47 | | | | — | | | | 583 | |
IQ S&P High Yield Low Volatility Bond ETF | | | 2,221 | | | | 17,358 | | | | (2,072 | ) | | | (138 | ) | | | (396 | ) | | | 16,973 | | | | 15 | | | | — | | | | 700 | |
MainStay Epoch Capital Growth Fund Class I | | | 21,489 | | | | — | | | | (4,201 | ) | | | 1,032 | | | | (187 | ) | | | 18,133 | | | | — | | | | — | | | | 1,339 | |
MainStay Epoch International Choice Fund Class I | | | 91,445 | | | | — | | | | (15,059 | ) | | | 637 | | | | (8,908 | ) | | | 68,115 | | | | — | | | | — | | | | 2,060 | |
MainStay Epoch U.S. All Cap Fund Class R6 | | | 85,722 | | | | — | | | | (21,559 | ) | | | 2,863 | | | | (10,203 | ) | | | 56,823 | | | | — | | | | — | | | | 2,344 | |
MainStay MacKay High Yield Municipal Bond Fund Class R6 | | | 31,588 | | | | 304 | | | | (30,532 | ) | | | (305 | ) | | | (1,055 | ) | | | — | | | | 311 | | | | — | | | | — | |
MainStay MacKay Infrastructure Bond Fund Class R6 | | | 49,549 | | | | 469 | | | | (18,105 | ) | | | 673 | | | | 990 | | | | 33,576 | | | | 469 | | | | — | | | | 3,802 | |
MainStay MacKay International Opportunities Fund Class I | | | 69,135 | | | | 27 | | | | (68 | ) | | | (26 | ) | | | (9,706 | ) | | | 59,362 | | | | — | | | | — | | | | 9,348 | |
MainStay MacKay Short Duration High Yield Fund Class I | | | 134,459 | | | | 2,475 | | | | (43,243 | ) | | | (721 | ) | | | (6,292 | ) | | | 86,678 | | | | 2,458 | | | | — | | | | 9,320 | |
MainStay MacKay U.S. Equity Opportunities Fund Class I | | | 38,699 | | | | — | | | | (36,885 | ) | | | (4,740 | ) | | | 2,926 | | | | — | | | | — | | | | — | | | | — | |
MainStay MAP Equity Fund Class I | | | 104,749 | | | | 7,970 | | | | (11,062 | ) | | | (1,487 | ) | | | (4,747 | ) | | | 95,423 | | | | — | | | | — | | | | 2,456 | |
MainStay Short Term Bond Class I | | | 19,464 | | | | 195 | | | | (31 | ) | | | (1 | ) | | | 76 | | | | 19,703 | | | | 179 | | | | — | | | | 1,847 | |
MainStay U.S. Government Liquidity Fund | | | 44,601 | | | | 219,873 | | | | (209,442 | ) | | | — | | | | — | | | | 55,032 | | | | 184 | | | | — | | | | 55,032 | |
MainStay VP Bond Portfolio Initial Class | | | 36,345 | | | | 23 | | | | (476 | ) | | | 25 | | | | 1,958 | | | | 37,875 | | | | — | | | | — | | | | 2,464 | |
MainStay VP Emerging Markets Equity Portfolio Initial Class | | | 92,629 | | | | — | | | | (19,218 | ) | | | (1,204 | ) | | | (5,538 | ) | | | 66,669 | | | | — | | | | — | | | | 7,505 | |
MainStay VP Epoch U.S. Equity Yield Portfolio Initial Class | | | 127,750 | | | | 12 | | | | (387 | ) | | | 13 | | | | (18,546 | ) | | | 108,842 | | | | — | | | | — | | | | 7,900 | |
MainStay VP Floating Rate Portfolio Initial Class | | | 29,498 | | | | 473 | | | | (18,809 | ) | | | (1,883 | ) | | | (584 | ) | | | 8,695 | | | | 473 | | | | — | | | | 1,040 | |
MainStay VP Indexed Bond Portfolio Initial Class | | | 27,165 | | | | 118,468 | | | | (33,491 | ) | | | 555 | | | | 1,503 | | | | 114,200 | | | | — | | | | — | | | | 10,102 | |
MainStay VP MacKay Common Stock Portfolio Initial Class | | | 52,487 | | | | 2,069 | | | | (26,889 | ) | | | (8,650 | ) | | | 5,153 | | | | 24,170 | | | | — | | | | — | | | | 940 | |
MainStay VP MacKay Convertible Portfolio Initial Class | | | 26,977 | | | | 75 | | | | (25,720 | ) | | | 192 | | | | (1,524 | ) | | | — | | | | 75 | | | | — | | | | — | |
MainStay VP MacKay Growth Portfolio Initial Class | | | 99,198 | | | | 47 | | | | (24,480 | ) | | | 2,895 | | | | 1,435 | | | | 79,095 | | | | — | | | | — | | | | 2,270 | |
MainStay VP MacKay International Equity Portfolio Initial Class | | | 24,059 | | | | 253 | | | | — | | | | — | | | | (999 | ) | | | 23,313 | | | | — | | | | — | | | | 1,500 | |
MainStay VP MacKay Mid Cap Core Portfolio Initial Class | | | 100,018 | | | | — | | | | (13,800 | ) | | | (858 | ) | | | (9,378 | ) | | | 75,982 | | | | — | | | | — | | | | 6,368 | |
MainStay VP MacKay S&P 500 Index Portfolio Initial Class | | | 5,182 | | | | 64,112 | | | | (66 | ) | | | 10 | | | | 10,761 | | | | 79,999 | | | | — | | | | — | | | | 1,339 | |
MainStay VP MacKay Small Cap Core Portfolio Initial Class | | | 54,887 | | | | 32 | | | | — | | | | — | | | | (9,525 | ) | | | 45,394 | | | | — | | | | — | | | | 5,157 | |
Notes to Financial Statements (Unaudited) (continued)
MainStay VP Moderate Growth Allocation Portfolio (continued)
| | | | | | | | | | | | | | | | | | | | | | | | | | | | | | | | | | | | |
Affiliated Investment Companies | | Value,
Beginning
of Period | | | Purchases
at Cost | | | Proceeds
from
Sales | | | Net
Realized
Gain/ (Loss)
on Sales | | | Change in
Unrealized
Appreciation/
(Depreciation) | | | Value,
End of
Period | | | Dividend
Income | | | Other
Distributions | | | Shares
End of
Period | |
MainStay VP MacKay Unconstrained Bond Portfolio Initial Class | | $ | 13,884 | | | $ | 74 | | | $ | (13,545 | ) | | $ | (330 | ) | | $ | (83 | ) | | $ | — | | | $ | 74 | | | $ | — | | | | — | |
MainStay VP PIMCO Real Return Portfolio Initial Class | | | 19,351 | | | | 17 | | | | (1,672 | ) | | | 154 | | | | 998 | | | | 18,848 | | | | — | | | | — | | | | 2,058 | |
MainStay VP Small Cap Growth Portfolio Initial Class (b) | | | 78,193 | | | | 24,458 | | | | (386 | ) | | | (19 | ) | | | (276 | ) | | | 101,970 | | | | — | | | | — | | | | 7,639 | |
MainStay VP T. Rowe Price Equity Income Portfolio Initial Class | | | 142,275 | | | | 10,070 | | | | (21,609 | ) | | | (6,686 | ) | | | (17,712 | ) | | | 106,338 | | | | — | | | | — | | | | 10,198 | |
MainStay VP Winslow Large Cap Growth Portfolio Initial Class (c) | | | 113,686 | | | | 11 | | | | (18,153 | ) | | | 5,492 | | | | 7,376 | | | | 108,412 | | | | — | | | | — | | | | 3,791 | |
| | | | | | | | |
| | $ | 1,959,438 | | | $ | 486,117 | | | $ | (632,082 | ) | | $ | (11,709 | ) | | $ | (101,310 | ) | | $ | 1,700,454 | | | $ | 6,406 | | | | | | | | | |
| | | | | | | | |
MainStay VP Growth Allocation Portfolio
| | | | | | | | | | | | | | | | | | | | | | | | | | | | | | | | | | | | |
Affiliated Investment Companies | | Value,
Beginning
of Period | | | Purchases
at Cost | | | Proceeds
from
Sales | | | Net
Realized
Gain/ (Loss)
on Sales | | | Change in
Unrealized
Appreciation/
(Depreciation) | | | Value,
End of
Period | | | Dividend
Income | | | Other
Distributions | | | Shares
End of
Period | |
IQ 50 Percent Hedged FTSE International ETF | | $ | 22,445 | | | $ | 35 | | | $ | (19 | ) | | $ | 1 | | | $ | (2,440 | ) | | $ | 20,022 | | | $ | 256 | | | $ | — | | | | 1,034 | |
IQ 500 International ETF | | | 60,441 | | | | — | | | | (132 | ) | | | (6 | ) | | | (10,268 | ) | | | 50,035 | | | | 734 | | | | — | | | | 2,115 | |
IQ Candriam ESG International Equity ETF | | | — | | | | 8,563 | | | | — | | | | — | | | | 1,039 | | | | 9,602 | | | | 45 | | | | — | | | | 419 | |
IQ Candriam ESG U.S. Equity ETF | | | — | | | | 26,318 | | | | — | | | | — | | | | 1,036 | | | | 27,354 | | | | 47 | | | | — | | | | 1,042 | |
IQ Chaikin U.S. Large Cap ETF | | | 59,605 | | | | — | | | | (16,833 | ) | | | 1,067 | | | | (6,940 | ) | | | 36,899 | | | | 398 | | | | — | | | | 1,588 | |
IQ Chaikin U.S. Small Cap ETF | | | 6,669 | | | | 28 | | | | (390 | ) | | | (1 | ) | | | (1,308 | ) | | | 4,998 | | | | 19 | | | | — | | | | 231 | |
MainStay Epoch Capital Growth Fund Class I | | | 11,231 | | | | — | | | | (1,199 | ) | | | 284 | | | | 131 | | | | 10,447 | | | | — | | | | — | | | | 772 | |
MainStay Epoch International Choice Fund Class I | | | 59,575 | | | | — | | | | (5,005 | ) | | | 608 | | | | (6,078 | ) | | | 49,100 | | | | — | | | | — | | | | 1,485 | |
MainStay Epoch U.S. All Cap Fund Class R6 | | | 50,284 | | | | 27 | | | | (10,756 | ) | | | 1,411 | | | | (5,938 | ) | | | 35,028 | | | | — | | | | — | | | | 1,445 | |
MainStay MacKay International Opportunities Fund Class I | | | 44,812 | | | | 278 | | | | (65 | ) | | | (21 | ) | | | (6,327 | ) | | | 38,677 | | | | — | | | | — | | | | 6,091 | |
MainStay MacKay U.S. Equity Opportunities Fund Class I | | | 14,771 | | | | — | | | | (14,061 | ) | | | (948 | ) | | | 238 | | | | — | | | | — | | | | — | | | | — | |
MainStay MAP Equity Fund Class I | | | 81,930 | | | | 8 | | | | (1,222 | ) | | | (138 | ) | | | (7,453 | ) | | | 73,125 | | | | — | | | | — | | | | 1,882 | |
MainStay U.S. Government Liquidity Fund | | | 31,130 | | | | 79,894 | | | | (83,388 | ) | | | — | | | | — | | | | 27,636 | | | | 102 | | | | — | | | | 27,636 | |
MainStay VP Emerging Markets Equity Portfolio Initial Class | | | 61,663 | | | | — | | | | (4,175 | ) | | | 246 | | | | (4,434 | ) | | | 53,300 | | | | — | | | | — | | | | 6,000 | |
MainStay VP Epoch U.S. Equity Yield Portfolio Initial Class | | | 100,011 | | | | 21 | | | | (451 | ) | | | 4 | | | | (14,509 | ) | | | 85,076 | | | | — | | | | — | | | | 6,175 | |
MainStay VP MacKay Common Stock Portfolio Initial Class | | | 45,944 | | | | — | | | | (23,866 | ) | | | (5,766 | ) | | | 1,697 | | | | 18,009 | | | | — | | | | — | | | | 700 | |
MainStay VP MacKay Growth Portfolio Initial Class | | | 81,723 | | | | — | | | | (24,172 | ) | | | 2,714 | | | | 459 | | | | 60,724 | | | | — | | | | — | | | | 1,743 | |
MainStay VP MacKay International Equity Portfolio Initial Class | | | 30,522 | | | | 869 | | | | — | | | | — | | | | (1,298 | ) | | | 30,093 | | | | — | | | | — | | | | 1,936 | |
MainStay VP MacKay Mid Cap Core Portfolio Initial Class | | | 57,749 | | | | — | | | | (725 | ) | | | 30 | | | | (6,900 | ) | | | 50,154 | | | | — | | | | — | | | | 4,204 | |
MainStay VP MacKay S&P 500 Index Portfolio Initial Class | | | 778 | | | | 50,195 | | | | (22 | ) | | | 3 | | | | 3,673 | | | | 54,627 | | | | — | | | | — | | | | 914 | |
| | |
| 58 | | MainStay VP Allocation Portfolios |
MainStay VP Growth Allocation Portfolio (continued)
| | | | | | | | | | | | | | | | | | | | | | | | | | | | | | | | | | | | |
Affiliated Investment Companies | | Value,
Beginning
of Period | | | Purchases
at Cost | | | Proceeds
from
Sales | | | Net
Realized
Gain/ (Loss)
on Sales | | | Change in
Unrealized
Appreciation/
(Depreciation) | | | Value,
End of
Period | | | Dividend
Income | | | Other
Distributions | | | Shares
End of
Period | |
MainStay VP MacKay Small Cap Core Portfolio Initial Class | | $ | 36,340 | | | $ | 51 | | | $ | — | | | $ | — | | | $ | (6,305 | ) | | $ | 30,086 | | | $ | — | | | $ | — | | | | 3,418 | |
MainStay VP Small Cap Growth Portfolio Initial Class (b) | | | 72,528 | | | | 9,267 | | | | (790 | ) | | | 50 | | | | (82 | ) | | | 80,973 | | | | — | | | | — | | | | 6,066 | |
MainStay VP T. Rowe Price Equity Income Portfolio Initial Class | | | 97,391 | | | | 6,767 | | | | (2,626 | ) | | | (689 | ) | | | (19,077 | ) | | | 81,766 | | | | — | | | | — | | | | 7,842 | |
MainStay VP Winslow Large Cap Growth Portfolio Initial Class (c) | | | 89,209 | | | | — | | | | (16,123 | ) | | | 4,788 | | | | 5,559 | | | | 83,433 | | | | — | | | | — | | | | 2,918 | |
| | | | | | | | |
| | $ | 1,116,751 | | | $ | 182,321 | | | $ | (206,020 | ) | | $ | 3,637 | | | $ | (85,525 | ) | | $ | 1,011,164 | | | $ | 1,601 | | | | | | | | | |
| | | | | | | | |
| (b) | Prior to May 1, 2020, known as MainStay VP Eagle Small Cap Growth Portfolio Initial Class. |
| (c) | Prior to May 1, 2020, known as MainStay VP Large Cap Growth Portfolio Initial Class. |
Note 4–Federal Income Tax
As of June 30, 2020, the cost and unrealized appreciation (depreciation) of the each Allocation Portfolio’s investment portfolio, including applicable derivative contracts and other financial instruments, as determined on a federal income tax basis, were as follows:
| | | | | | | | | | | | | | | | |
| | | Federal Tax
Cost | | | Gross
Unrealized
Appreciation | | | Gross
Unrealized
(Depreciation) | | | Net
Unrealized
Appreciation/
(Depreciation) | |
| | | | |
Investments in Affiliates | | $ | 652,966,511 | | | $ | 43,114,102 | | | $ | (23,025,738 | ) | | $ | 20,088,364 | |
| | | | | | | | | | | | | | | | |
| | | Federal Tax
Cost | | | Gross
Unrealized
Appreciation | | | Gross
Unrealized
(Depreciation) | | | Net
Unrealized
Appreciation/
(Depreciation) | |
| | | | |
Investments in Affiliates | | $ | 1,036,431,576 | | | $ | 53,853,191 | | | $ | (50,207,782 | ) | | $ | 3,645,409 | |
| | | | | | | | | | | | | | | | |
| | | Federal Tax
Cost | | | Gross
Unrealized
Appreciation | | | Gross
Unrealized
(Depreciation) | | | Net
Unrealized
Appreciation/
(Depreciation) | |
| | | | |
Investments in Affiliates | | $ | 1,772,405,420 | | | $ | 60,876,623 | | | $ | (132,828,455 | ) | | $ | (71,951,832 | ) |
| | | | | | | | | | | | | | | | |
| | | Federal Tax
Cost | | | Gross
Unrealized
Appreciation | | | Gross
Unrealized
(Depreciation) | | | Net
Unrealized
Appreciation/
(Depreciation) | |
| | | | |
Investments in Affiliates | | $ | 1,071,302,859 | | | $ | 28,825,919 | | | $ | (88,964,709 | ) | | $ | (60,138,790 | ) |
During the year ended December 31, 2019, the tax character of distributions paid as reflected in the Statements of Changes in Net Assets was as follows:
| | | | | | | | | | | | |
| |
| | | 2019 | |
| | | Tax Based
Distributions
from Ordinary
Income | | | Tax Based
Distributions
from Long-Term
Capital Gains | | | Total | |
| | | |
MainStay VP Conservative Allocation Portfolio | | $ | 18,556,369 | | | $ | 19,111,788 | | | $ | 37,668,157 | |
MainStay VP Moderate Allocation Portfolio | | | 34,229,729 | | | | 45,425,876 | | | | 79,655,605 | |
MainStay VP Moderate Growth Allocation Portfolio | | | 59,390,777 | | | | 133,999,846 | | | | 193,390,623 | |
MainStay VP Growth Allocation Portfolio | | | 29,324,488 | | | | 71,472,594 | | | | 100,797,082 | |
Note 5–Custodian
State Street is the custodian of cash and securities held by the Allocation Portfolios. Custodial fees are charged to each Allocation Portfolio based on the Allocation Portfolios’ net assets and/or the market value of securities held by the Allocation Portfolio and the number of certain transactions incurred by the Allocation Portfolio.
Note 6–Line of Credit
The Allocation Portfolios and certain other funds managed by New York Life Investments maintain a line of credit with a syndicate of banks in order to secure a source of funds for temporary purposes to meet unanticipated or excessive redemption requests.
Effective July 28, 2020, under a credit agreement (the “Credit Agreement”), the aggregate commitment amount is $600,000,000 with
Notes to Financial Statements (Unaudited) (continued)
an additional uncommitted amount of $100,000,000. The commitment fee is an annual rate of 0.15% of the average commitment amount payable quarterly, regardless of usage, to JP Morgan Chase Bank NA, who serves as the agent to the syndicate. The commitment fee is allocated among the Allocation Portfolios and certain other funds managed by New York Life Investments based upon their respective net assets and other factors. Interest on any revolving credit loan is charged based upon the Federal Funds Rate or the one-month LIBOR, whichever is higher. The Credit Agreement expires on July 27, 2021, although the Allocation Portfolios, certain other funds managed by New York Life Investments and the syndicate of banks may renew the Credit Agreement for an additional year on the same or different terms or enter into a credit agreement with a different syndicate of banks. Prior to July 28, 2020, the aggregate commitment amount and the commitment fee were the same as those under the current Credit Agreement, but State Street served as agent to the syndicate. As of June 30, 2020, there were no borrowings outstanding with respect to the Allocation Portfolios under the Credit Agreement or the credit agreement for which State Street served as agent.
Note 7–Interfund Lending Program
Pursuant to an exemptive order issued by the SEC, the Allocation Portfolios, along with certain other funds managed by New York Life Investments, may participate in an interfund lending program. The interfund lending program provides an alternative credit facility that permits the Allocation Portfolios and certain other funds managed by New York Life Investments to lend or borrow money for temporary purposes directly to or from one another, subject to the conditions of the exemptive order. During the six-month period ended June 30, 2020, there were no interfund loans made or outstanding with respect to the Allocation Portfolios.
Note 8–Purchases and Sales of Securities (in 000’s)
During the six-month period ended June 30, 2020, purchases and sales of securities were as follows:
| | | | | | | | |
Portfolio | | Purchases | | | Sales | |
MainStay VP Conservative Allocation Portfolio | | $ | 96,190 | | | $ | 157,010 | |
MainStay VP Moderate Allocation Portfolio | | | 171,701 | | | | 242,790 | |
MainStay VP Moderate Growth Allocation Portfolio | | | 266,245 | | | | 422,642 | |
MainStay VP Growth Allocation Portfolio | | | 102,428 | | | | 122,632 | |
Note 9–Capital Share Transactions
Transactions in capital shares for the six-month period ended June 30, 2020 and the year ended December 31, 2019, were as follows:
MainStay VP Conservative Allocation Portfolio
| | | | | | | | |
Initial Class | | Shares | | | Amount | |
| | |
Six-month period ended June 30, 2020: | | | | | | | | |
Shares sold | | | 57,023 | | | $ | 644,235 | |
Shares redeemed | | | (161,177 | ) | | | (1,820,668 | ) |
| | | | | | | | |
Net increase (decrease) | | | (104,154 | ) | | $ | (1,176,433 | ) |
| | | | | | | | |
Year ended December 31, 2019: | | | | | | | | |
Shares sold | | | 267,485 | | | $ | 3,102,561 | |
Shares issued to shareholders in reinvestment of distributions | | | 69,931 | | | | 787,124 | |
Shares redeemed | | | (298,563 | ) | | | (3,469,016 | ) |
| | | | | | | | |
Net increase (decrease) | | | 38,853 | | | $ | 420,669 | |
| | | | | | | | |
| | |
| | | | | | | | |
Service Class | | Shares | | | Amount | |
| | |
Six-month period ended June 30, 2020: | | | | | | | | |
Shares sold | | | 3,622,411 | | | $ | 40,619,133 | |
Shares redeemed | | | (9,076,534 | ) | | | (100,038,700 | ) |
| | | | | | | | |
Net increase (decrease) | | | (5,454,123 | ) | | $ | (59,419,567 | ) |
| | | | | | | | |
Year ended December 31, 2019: | | | | | | | | |
Shares sold | | | 4,908,894 | | | $ | 56,310,330 | |
Shares issued to shareholders in reinvestment of distributions | | | 3,310,551 | | | | 36,881,033 | |
Shares redeemed | | | (13,400,462 | ) | | | (153,432,421 | ) |
| | | | | | | | |
Net increase (decrease) | | | (5,181,017 | ) | | $ | (60,241,058 | ) |
| | | | | | | | |
MainStay VP Moderate Allocation Portfolio
| | | | | | | | |
Initial Class | | Shares | | | Amount | |
| | |
Six-month period ended June 30, 2020: | | | | | | | | |
Shares sold | | | 73,896 | | | $ | 804,659 | |
Shares redeemed | | | (261,846 | ) | | | (2,777,326 | ) |
| | | | | | | | |
Net increase (decrease) | | | (187,950 | ) | | $ | (1,972,667 | ) |
| | | | | | | | |
Year ended December 31, 2019: | | | | | | | | |
Shares sold | | | 225,312 | | | $ | 2,561,447 | |
Shares issued to shareholders in reinvestment of distributions | | | 294,356 | | | | 3,140,712 | |
Shares redeemed | | | (700,429 | ) | | | (7,859,416 | ) |
| | | | | | | | |
Net increase (decrease) | | | (180,761 | ) | | $ | (2,157,257 | ) |
| | | | | | | | |
| | |
| | | | | | | | |
Service Class | | Shares | | | Amount | |
| | |
Six-month period ended June 30, 2020: | | | | | | | | |
Shares sold | | | 2,282,588 | | | $ | 24,585,148 | |
Shares redeemed | | | (9,975,814 | ) | | | (105,240,090 | ) |
| | | | | | | | |
Net increase (decrease) | | | (7,693,226 | ) | | $ | (80,654,942 | ) |
| | | | | | | | |
Year ended December 31, 2019: | | | | | | | | |
Shares sold | | | 3,472,000 | | | $ | 38,639,495 | |
Shares issued to shareholders in reinvestment of distributions | | | 7,232,928 | | | | 76,514,893 | |
Shares redeemed | | | (20,271,727 | ) | | | (225,752,175 | ) |
| | | | | | | | |
Net increase (decrease) | | | (9,566,799 | ) | | $ | (110,597,787 | ) |
| | | | | | | | |
| | |
| 60 | | MainStay VP Allocation Portfolios |
MainStay VP Moderate Growth Allocation Portfolio
| | | | | | | | |
Initial Class | | Shares | | | Amount | |
| | |
Six-month period ended June 30, 2020: | | | | | | | | |
Shares sold | | | 173,467 | | | $ | 1,815,402 | |
Shares redeemed | | | (359,385 | ) | | | (3,829,042 | ) |
| | | | |
Net increase (decrease) | | | (185,918 | ) | | $ | (2,013,640 | ) |
| | | | | | | | |
Year ended December 31, 2019: | | | | | | | | |
Shares sold | | | 270,206 | | | $ | 3,127,939 | |
Shares issued to shareholders in reinvestment of distributions | | | 848,898 | | | | 9,016,002 | |
Shares redeemed | | | (736,268 | ) | | | (8,538,185 | ) |
| | | | | | | | |
Net increase (decrease) | | | 382,836 | | | $ | 3,605,756 | |
| | | | | | | | |
| | |
| | | | | | | | |
Service Class | | Shares | | | Amount | |
| | |
Six-month period ended June 30, 2020: | | | | | | | | |
Shares sold | | | 1,964,964 | | | $ | 19,572,486 | |
Shares redeemed | | | (16,203,450 | ) | | | (170,623,673 | ) |
| | | | | | | | |
Net increase (decrease) | | | (14,238,486 | ) | | $ | (151,051,187 | ) |
| | | | | | | | |
Year ended December 31, 2019: | | | | | | | | |
Shares sold | | | 1,940,966 | | | $ | 22,129,115 | |
Shares issued to shareholders in reinvestment of distributions | | | 17,540,354 | | | | 184,374,621 | |
Shares redeemed | | | (32,094,034 | ) | | | (368,565,763 | ) |
| | | | | | | | |
Net increase (decrease) | | | (12,612,714 | ) | | $ | (162,062,027 | ) |
| | | | | | | | |
MainStay VP Growth Allocation Portfolio
| | | | | | | | |
Initial Class | | Shares | | | Amount | |
| | |
Six-month period ended June 30, 2020: | | | | | | | | |
Shares sold | | | 292,305 | | | $ | 2,961,151 | |
Shares redeemed | | | (359,949 | ) | | | (3,865,663 | ) |
| | | | | | | | |
Net increase (decrease) | | | (67,644 | ) | | $ | (904,512 | ) |
| | | | | | | | |
Year ended December 31, 2019: | | | | | | | | |
Shares sold | | | 475,253 | | | $ | 5,543,456 | |
Shares issued to shareholders in reinvestment of distributions | | | 692,897 | | | | 7,410,845 | |
Shares redeemed | | | (439,853 | ) | | | (5,103,481 | ) |
| | | | | | | | |
Net increase (decrease) | | | 728,297 | | | $ | 7,850,820 | |
| | | | | | | | |
| | |
| | | | | | | | |
Service Class | | Shares | | | Amount | |
| | |
Six-month period ended June 30, 2020: | | | | | | | | |
Shares sold | | | 3,918,999 | | | $ | 36,786,699 | |
Shares redeemed | | | (6,068,033 | ) | | | (65,704,925 | ) |
| | | | | | | | |
Net increase (decrease) | | | (2,149,034 | ) | | $ | (28,918,226 | ) |
| | | | | | | | |
Year ended December 31, 2019: | | | | | | | | |
Shares sold | | | 1,484,664 | | | $ | 17,017,049 | |
Shares issued to shareholders in reinvestment of distributions | | | 8,822,439 | | | | 93,386,237 | |
Shares redeemed | | | (11,151,394 | ) | | | (129,345,154 | ) |
| | | | | | | | |
Net increase (decrease) | | | (844,291 | ) | | $ | (18,941,868 | ) |
| | | | | | | | |
Note 10–Recent Accounting Pronouncement
In March 2020, the Financial Accounting Standards Board (“FASB”) issued Accounting Standards Update 2020-04 (“ASU 2020-04”), which provides optional guidance to ease the potential accounting burden associated with transitioning away from LIBOR and other reference rates that are expected to be discontinued. ASU 2020-04 is effective immediately upon release of the update on March 12, 2020 through December 31, 2022. At this time, the Manager is evaluating the implications of certain other provisions of ASU 2020-04 related to new disclosure requirements and any impact on the financial statement disclosures has not yet been determined.
Note 11–Subsequent Events
In connection with the preparation of the financial statements of the Allocation Portfolios as of and for the six-month period ended June 30, 2020, events and transactions subsequent to June 30, 2020, through the date the financial statements were issued have been evaluated by the Manager for possible adjustment and/or disclosure. No subsequent events requiring financial statement adjustment or disclosure have been identified.
Note 12–Other Matters
An outbreak of COVID-19, first detected in December 2019, has developed into a global pandemic and has resulted in travel restrictions, closure of international borders, certain businesses and securities markets, restrictions on securities trading activities, prolonged quarantines, supply chain disruptions, and lower consumer demand, as well as general concern and uncertainty. The continued impact of COVID-19 is uncertain and could further adversely affect the global economy, national economies, individual issuers and capital markets in unforeseeable ways and result in a substantial and extended economic downturn. Developments that disrupt global economies and financial markets, such as COVID-19, may magnify factors that affect the Portfolio’s performance.
Discussion of the Operation and Effectiveness of the Portfolios’
Liquidity Risk Management Program (Unaudited)
In compliance with Rule 22e-4 under the Investment Company Act of 1940, as amended (the “Liquidity Rule”), the Portfolios have adopted and implemented a liquidity risk management program (the “Program”), which New York Life Investment Management LLC believes is reasonably designed to assess and manage the Portfolios’ liquidity risk. The Board designated New York Life Investment Management LLC as administrator of the Program (the “Administrator”). The Administrator has established a Liquidity Risk Management Committee to assist the Administrator in the implementation and day-to-day administration of the Program and to otherwise support the Administrator in fulfilling its responsibilities under the Program.
At a meeting of the Board held on March 11, 2020, the Administrator provided the Board with a written report addressing the Program’s operation, adequacy and effectiveness of implementation for the period from December 1, 2018 through December 31, 2019, as required under the Liquidity Rule. The report noted that the Administrator concluded that (i) the Program operated effectively to assess and manage the Portfolios’ liquidity risk, (ii) the Program has been adequately and effectively implemented to monitor and, as applicable, respond to the Portfolios’ liquidity developments and (iii) the Portfolios’ investment strategy continues to be appropriate for an open-end portfolio.
In accordance with the Program, the Portfolios’ liquidity risk is assessed no less frequently than annually taking into consideration certain factors, as applicable, such as (i) investment strategy and liquidity of portfolio investments, (ii) short-term and long-term cash flow projections and (iii) holdings of cash and cash equivalents and borrowing arrangements and other funding sources. Certain factors are considered under both normal and reasonably foreseeable stressed conditions.
Each Portfolio’s portfolio investment is classified into one of four liquidity categories. The classification is based on a determination of the number of days it is reasonably expected to take to convert the investment into cash, or sell or dispose of the investment, in current market conditions without significantly changing the market value of the investment. The Administrator’s liquidity classification determinations are made by taking into account the Portfolios’ reasonably anticipated trade size, various market, trading and investment-specific considerations, as well as market depth, and, in certain cases, third-party vendor data.
The Liquidity Rule requires portfolios that do not primarily hold assets that are highly liquid investments to adopt a minimum amount of net assets that must be invested in highly liquid investments that are assets (an “HLIM”). In addition, the Liquidity Rule limits a portfolios’ investments in illiquid investments. Specifically, the Liquidity Rule prohibits acquisition of illiquid investments if doing so would result in a portfolio holding more than 15% of its net assets in illiquid investments that are assets. The Program includes provisions reasonably designed to determine, periodically review and comply with the HLIM requirement, as applicable, and to comply with the 15% limit on illiquid investments.
| | |
| 62 | | MainStay VP Allocation Portfolios |
Proxy Voting Policies and Procedures and Proxy Voting Record
A description of the policies and procedures that New York Life Investments uses to vote proxies related to the Portfolio’s securities is available free of charge upon request (i) by calling 800-598-2019; (ii) by visiting New York Life Investments’ website at https://www.nylinvestments.com/mainstay/products-and-performance/mainstay-vp-funds-trust; or (iii) by visiting the SEC’s website at www.sec.gov.
Each Portfolio is required to file with the SEC its proxy voting record for the 12-month period ending June 30 on Form N-PX. Each Portfolio’s most recent Form N-PX or proxy voting record is available free of charge upon request (i) by calling 800-598-2019; (ii) by visiting New York Life Investments’ website at https://www.nylinvestments.com/mainstay/products-and-performance/mainstay-vp-funds-trust; or (iii) by visiting the SEC’s website at www.sec.gov.
Shareholder Reports and Quarterly Portfolio Disclosure
Each Portfolio is required to file its complete schedule of portfolio holdings with the SEC 60 days after its first and third fiscal quarter on Form N-PORT. Each Portfolio’s holdings report is available free of charge upon request by calling 800-598-2019 or by visiting the SEC’s website at www.sec.gov.
MainStay VP Portfolios
MainStay VP offers a wide range of Portfolios. The full array of MainStay VP offerings is listed here, with information about the manager, subadvisors, legal counsel, and independent registered public accounting firm.
Equity Portfolios
MainStay VP Emerging Markets Equity Portfolio
MainStay VP Epoch U.S. Equity Yield Portfolio
MainStay VP Fidelity Institutional AM® Utilities Portfolio†
MainStay VP MacKay Common Stock Portfolio
MainStay VP MacKay Growth Portfolio
MainStay VP MacKay International Equity Portfolio
MainStay VP MacKay Mid Cap Core Portfolio
MainStay VP MacKay S&P 500 Index Portfolio
MainStay VP MacKay Small Cap Core Portfolio
MainStay VP Mellon Natural Resources Portfolio
MainStay VP Small Cap Growth Portfolio
MainStay VP T. Rowe Price Equity Income Portfolio
MainStay VP Winslow Large Cap Growth Portfolio
Mixed Asset Portfolios
MainStay VP Balanced Portfolio
MainStay VP Income Builder Portfolio
MainStay VP Janus Henderson Balanced Portfolio
MainStay VP MacKay Convertible Portfolio
Income Portfolios
MainStay VP Bond Portfolio
MainStay VP Floating Rate Portfolio
MainStay VP Indexed Bond Portfolio
MainStay VP MacKay Government Portfolio
MainStay VP MacKay High Yield Corporate Bond Portfolio
MainStay VP MacKay Unconstrained Bond Portfolio
MainStay VP PIMCO Real Return Portfolio
Money Market
MainStay VP U.S. Government Money Market Portfolio
Alternative
MainStay VP CBRE Global Infrastructure Portfolio
MainStay VP IQ Hedge Multi-Strategy Portfolio
Asset Allocation Portfolios
MainStay VP Conservative Allocation Portfolio
MainStay VP Growth Allocation Portfolio
MainStay VP Moderate Allocation Portfolio
MainStay VP Moderate Growth Allocation Portfolio
Manager
New York Life Investment Management LLC
New York, New York
Subadvisors
Brown Advisory LLC
Baltimore, Maryland
Candriam Belgium S.A.*
Brussels, Belgium
CBRE Clarion Securities LLC
Radnor, Pennsylvania
Epoch Investment Partners, Inc.
New York, New York
FIAM LLC
Smithfield, Rhode Island
IndexIQ Advisors LLC*
New York, New York
Janus Capital Management LLC
Denver, Colorado
MacKay Shields LLC*
New York, New York
Mellon Investments Corporation
Boston, Massachusetts
NYL Investors LLC*
New York, New York
Pacific Investment Management Company LLC
Newport Beach, California
Segall Bryant & Hamill, LLC
Chicago, Illinois
T. Rowe Price Associates, Inc.
Baltimore, Maryland
Winslow Capital Management, LLC
Minneapolis, Minnesota
Distributor
NYLIFE Distributors LLC*
Jersey City, New Jersey
Custodian
State Street Bank and Trust Company
Boston, Massachusetts
Independent Registered Public Accounting Firm
PricewaterhouseCoopers LLP
New York, New York
Legal Counsel
Dechert LLP
Washington, District of Columbia
Some Portfolios may not be available in all products.
| † | Fidelity Institutional AM is a registered trade mark of FMR LLC. Used with permission. |
| * | An affiliate of New York Life Investment Management LLC |
Not part of the Semiannual Report
2020 Semiannual Report
This report is for the general information of New York Life Variable Annuities and NYLIAC Variable Universal Life Insurance Products policyowners. It must be preceded or accompanied by the appropriate product(s) and funds prospectuses if it is given to anyone who is not an owner of a New York Life variable annuity policy or a NYLIAC Variable Universal Life Insurance Product. This report does not offer for sale or solicit orders to purchase securities.
The performance data quoted in this report represents past performance. Past performance is no guarantee of future results. Due to market volatility and other factors, current performance may be lower or higher than the figures shown. The most recent month-end performance summary for your variable annuity or variable life policy is available by calling 800-598-2019 and is updated periodically on www.newyorklife.com.
The New York Life Variable Annuities and NYLIAC Variable Universal Life Insurance Products are issued by New York Life Insurance and Annuity Corporation (a Delaware Corporation) and distributed by NYLIFE Distributors LLC (Member FINRA/SIPC).
New York Life Insurance Company
New York Life Insurance and Annuity Corporation
(NYLIAC) (A Delaware Corporation)
51 Madison Avenue, Room 551
New York, NY 10010
www.newyorklife.com
Printed on recycled paper
nylinvestments.com
NYLIFE Distributors LLC, 30 Hudson Street, Jersey City, NJ 07302
New York Life Investment Management LLC is the investment manager to the MainStay VP Funds Trust
©2020 by NYLIFE Distributors LLC. All rights reserved.
You may obtain copies of the Prospectus and the Statement of Additional Information free of charge, upon request, by calling toll-free 800-598-2019 or writing to New York Life Insurance and Annuity Corporation,
51 Madison Avenue, New York, NY 10010.
| | | | |
| Not FDIC Insured | | No Bank Guarantee | | May Lose Value |
| | | | |
| 1781600 | | | | MSVPAA10-08/20 (NYLIAC) NI507 |
MainStay VP Bond Portfolio
Message from the President and Semiannual Report
Unaudited | June 30, 2020
Beginning on January 1, 2021, as permitted by regulations adopted by the Securities and Exchange Commission, paper copies of the MainStay VP Portfolio annual and semi-annual shareholder reports may no longer be sent by mail, unless you specifically request paper copies of the reports from the insurance company that offers your policy. Instead, the reports will be made available online, and you will be notified by mail each time a report is posted and provided with a website link to access the report. Instructions for requesting paper copies will be provided by your insurance company.
If you already elected to receive shareholder reports electronically, you will not be affected by this change and you need not take any action. At any time, you may elect to receive reports and other communications from the insurance company electronically by following the instructions provided by the insurance company.
You may elect to receive all future shareholder reports in paper form free of charge. You can inform the insurance company that you wish to receive paper copies of reports by following the instructions provided by the insurance company. Your election to receive reports in paper form will apply to all portfolio companies available under your contract.
| | | | | | | | |
| Not FDIC/NCUA Insured | | Not a Deposit | | May Lose Value | | No Bank Guarantee | | Not Insured by Any Government Agency |

This page intentionally left blank
Message from the President
High levels of volatility shook financial markets in response to the COVID-19 pandemic and an abrupt decline in global economic activity during the six months ended June 30, 2020.
Markets entered 2020 riding strong fourth quarter performance and an economic expansion of historic longevity. Most broad stock and bond indices began to dip in late February as growing numbers of COVID-19 cases were seen in hotspots around the world. On March 11, 2020, the World Health Organization acknowledged that the disease had reached pandemic proportions, with over 80,000 identified cases in China, thousands in Italy, South Korea and the United States, and more in dozens of additional countries. Governments and central banks pledged trillions of dollars to address the mounting economic and public health crisis; however, “stay-at-home” orders and other restrictions on non-essential activity caused global economic activity to slow. Most stocks and bonds lost significant ground in this challenging environment, with equities declining by roughly a third and the yield on high-yield credit indices shooting higher.
Policymakers responded with extraordinary speed to address the situation. In the United States, the Federal Reserve (“Fed”) cut interest rates to near zero and announced unlimited quantitative easing. With help from Treasury, the Fed later rolled out a series of lending facilities to directly support market functioning. In late March, the Federal government declared a national emergency; Congress passed, and the President signed, a $2 trillion CARES Act (The Coronavirus Aid, Relief, and Economic Security Act), with the promise of further assistance for consumers and businesses to come. This enormous wave of policy support helped fuel a rapid recovery in market pricing as stocks bounced back and credit spreads narrowed. Some states rushed to ease restrictions on travel and social gatherings, further fueling optimism that the effects of the pandemic might prove short lived. However, the final weeks of the reporting period saw infection rates beginning to rise in some of the first states to reopen, raising concerns that a second round of restrictive government policies might prove necessary, once again stifling economic activity.
Despite all the market volatility, the broadly based S&P 500® Index finished the first half of 2020 only slightly below its starting point and the technology-heavy NASDAQ Composite Index posted gains, closing in near record territory. Small-cap stocks tended to trail their large cap counterparts, as illustrated by the Russell 2000® Index’s loss of approximately 15%, while value-oriented stocks lagged growth-oriented issues. From a global perspective, U.S. stocks generally outperformed international equities, with emerging markets hit particularly hard by the flight from risk.
Fixed-income markets also experienced unusually high levels of volatility. Recognized safe havens, such as U.S. government bonds, attracted increased investment, driving yields lower and prices higher, positioning long-term Treasury bonds to deliver particularly strong gains. Investment-grade corporate bonds lost value in March before recovering in the closing months of the reporting period, while relatively speculative high-yield credit faced the brunt of risk-off sentiment. Emerging market debt underperformed most other bonds types as investors sought to minimize currency and sovereign risks.
Today, as we at New York Life Investments continue to track the ongoing health crisis and its financial ramifications, we are particularly mindful of the people at the heart of our enterprise—our colleagues and valued clients. By taking appropriate steps to minimize community spread of COVID-19 within our organization, we strive to safeguard the health of our investment professionals so they can continue to provide you, as a MainStay investor, with world class investment solutions in this rapidly evolving environment.
Sincerely,

Kirk C. Lehneis
President
The opinions expressed are as of the date of this report and are subject to change. There is no guarantee that any forecast made will come to pass. This material does not constitute investment advice and is not intended as an endorsement of any specific investment. Past performance is no guarantee of future results.
Not part of the Semiannual Report
Table of Contents
Investors should refer to the Portfolio’s Summary Prospectus and/or Prospectus and consider the Portfolio’s investment objectives, strategies, risks, charges and expenses carefully before investing. The Summary Prospectus and/or Prospectus contain this and other information about the Portfolio. You may obtain copies of the Portfolio’s Summary Prospectus and/or the Prospectus and the Statement of Additional Information free of charge, upon request, by calling toll-free 800-598-2019, by writing to New York Life Insurance and Annuity Corporation, 51 Madison Avenue, Room 251, New York, New York 10010 or by sending an email to MainStayShareholdersServices@nylim.com. These documents are also available at nylinvestments.com/vpdocuments. Please read the Summary Prospectus and/or Prospectus carefully before investing. MainStay VP Funds Trust portfolios are separate account options which are purchased through a variable insurance or variable annuity contract.
Investment and Performance Comparison1 (Unaudited)
Performance data quoted represents past performance. Past performance is no guarantee of future results. Because of market volatility and other factors, current performance may be lower or higher than the figures shown. Investment return and principal value will fluctuate, and as a result, when shares are redeemed, they may be worth more or less than their original cost. The performance table and graph do not reflect any deduction of sales charges, mortality and expense charges, contract charges or administrative charges. Please refer to the Performance Summary appropriate for your policy. For performance information current to the most recent month-end, please call 800-598-2019 or visit www.newyorklife.com.
Average Annual Total Returns for the Period-Ended June 30, 2020
| | | | | | | | | | | | | | | | | | | | | | |
| Class | | Inception
Date | | Six Months | | | One Year | | | Five Years | | | Ten Years | | | Gross
Expense
Ratio2 | |
| | | | | | |
| Initial Class Shares | | 1/23/1984 | | | 5.50 | % | | | 8.01 | % | | | 4.23 | % | | | 3.82 | % | | | 0.54 | % |
| Service Class Shares | | 6/4/2003 | | | 5.37 | | | | 7.74 | | | | 3.97 | | | | 3.56 | | | | 0.79 | |
| | | | | | | | | | | | | | | | |
| Benchmark Performance | | Six
Months | | | One
Year | | | Five
Years | | | Ten
Years | |
| | | | |
Bloomberg Barclays U.S. Aggregate Bond Index3 | | | 6.14 | % | | | 8.74 | % | | | 4.30 | % | | | 3.82 | % |
Morningstar Intermediate Core Bond Category Average4 | | | 5.56 | | | | 7.89 | | | | 3.90 | | | | 3.66 | |
| 1. | Performance figures may reflect certain fee waivers and/or expense limitations, without which total returns may have been different. For information on current fee waivers and/or expense limitations (if any), please refer to the Notes to Financial Statements. |
| 2. | The gross expense ratios presented reflect the Portfolio’s “Total Annual Portfolio Operating Expenses” from the most recent Prospectus, as supplemented, and may differ from other expense ratios disclosed in this report. |
| 3. | The Bloomberg Barclays U.S. Aggregate Bond Index is the Portfolio’s primary broad-based securities market index for comparison purposes. The Bloomberg Barclays U.S. Aggregate Bond Index measures performance of the investment-grade, U.S. dollar denominated, fixed-rate taxable bond market, including Treasurys, government-related and corporate securities, |
| | mortgage-backed securities (agency fixed-rate and hybrid adjustable-rate mortgage pass-throughs), asset-backed securities and commercial mortgage-backed securities. Results assume reinvestment of all dividends and capital gains. An investment cannot be made directly in an index. |
| 4. | The Morningstar Intermediate Core Bond is representative of funds that invest primarily in investment-grade U.S. fixed-income issues including government, corporate, and securitized debt, and hold less than 5% in below-investment-grade exposures. Their durations (a measure of interest-rate sensitivity) typically range between 75% and 125% of the three-year average of the effective duration of the Morningstar Core Bond Index. Results are based on average total returns of similar funds with all dividends and capital gain distributions reinvested. |
Cost in Dollars of a $1,000 Investment in MainStay VP Bond Portfolio (Unaudited)
The example below is intended to describe the fees and expenses borne by shareholders during the six-month period from January 1, 2020, to June 30, 2020, and the impact of those costs on your investment.
Example
As a shareholder of the Portfolio you incur two types of costs: (1) transaction costs, including exchange fees and sales charges (loads) on purchases (as applicable), and (2) ongoing costs, including management fees, distribution and/or service (12b-1) fees, and other Portfolio expenses (as applicable). This example is intended to help you understand your ongoing costs (in dollars) of investing in the Portfolio and to compare these costs with the ongoing costs of investing in other mutual funds. The example is based on an investment of $1,000 made at the beginning of the six-month period and held for the entire period from January 1, 2020, to June 30, 2020. Shares are only sold in connection with variable life and annuity contracts and the example does not reflect any contract level or transactional fees or expenses. If these costs had been included, your costs would have been higher.
This example illustrates your Portfolio’s ongoing costs in two ways:
Actual Expenses
The second and third data columns in the table below provide information about actual account values and actual expenses. You may use the information in these columns, together with the amount you invested, to estimate the expenses that you paid during the six months ended June 30, 2020. Simply divide your account value by $1,000
(for example, an $8,600 account value divided by $1,000 = 8.6), then multiply the result by the number under the heading entitled “Expenses Paid During Period” to estimate the expenses you paid on your account during this period.
Hypothetical Example for Comparison Purposes
The fourth and fifth data columns in the table below provide information about hypothetical account values and hypothetical expenses based on the Portfolio’s actual expense ratio and an assumed rate of return of 5% per year before expenses, which is not the Portfolio’s actual return. The hypothetical account values and expenses may not be used to estimate the actual ending account balances or expenses you paid for the six-month period shown. You may use this information to compare the ongoing costs of investing in the Portfolio with the ongoing costs of investing in other mutual funds. To do so, compare this 5% hypothetical example with the 5% hypothetical examples that appear in the shareholder reports of the other mutual funds.
Please note that the expenses shown in the table are meant to highlight your ongoing costs only and do not reflect any transactional costs, such as exchange fees or sales charges (loads). Therefore, the fourth and fifth data columns of the table are useful in comparing ongoing costs only and will not help you determine the relative total costs of owning different funds. In addition, if these transactional costs were included, your costs would have been higher.
| | | | | | | | | | | | | | | | | | | | | | |
| | | | | | | | | | | | | | | | | | |
| Share Class | | Beginning
Account
Value
1/1/20 | | | Ending Account
Value (Based
on Actual
Returns and
Expenses)
6/30/20 | | | Expenses
Paid
During
Period1 | | | Ending Account
Value (Based
on Hypothetical
5% Annualized
Return and
Actual Expenses)
6/30/20 | | | Expenses
Paid
During
Period1 | | | Net Expense
Ratio
During
Period2 |
| | | | | | |
| Initial Class Shares | | $ | 1,000.00 | | | $ | 1,055.00 | | | $ | 2.71 | | | $ | 1,022.23 | | | $ | 2.66 | | | 0.53% |
| | | | | | |
| Service Class Shares | | $ | 1,000.00 | | | $ | 1,053.70 | | | $ | 3.98 | | | $ | 1,020.98 | | | $ | 3.92 | | | 0.78% |
| 1. | Expenses are equal to the Portfolio’s annualized expense ratio of each class multiplied by the average account value over the period, divided by 366 and multiplied by 182 (to reflect the six-month period). The table above represents the actual expenses incurred during the six-month period. In addition to the fees and expenses which the Portfolio bears directly, it also indirectly bears a pro rata share of the fees and expenses of the underlying funds in which it invests. Such indirect expenses are not included in the above-reported expense figures. |
| 2. | Expenses are equal to the Portfolio’s annualized expense ratio to reflect the six-month period. |
| | |
| 6 | | MainStay VP Bond Portfolio |
Portfolio Composition as of June 30, 2020 (Unaudited)
See Portfolio of Investments beginning on page 10 for specific holdings within these categories. The Portfolio’s holdings are subject to change.
Top Ten Issuers Held as of June 30, 2020 (excluding short-term investments) (Unaudited)
| 1. | Federal National Mortgage Association (Mortgage Pass-Through Securities), 2.00%–7.50%, due 1/1/21–5/1/50 |
| 2. | United States Treasury Notes, 0.125%–1.75%, due 6/30/22–5/15/30 |
| 3. | United States Treasury Bonds, 2.00%–4.25%, due 5/15/39–2/15/50 |
| 4. | Federal Home Loan Bank, 2.50%–3.25%, due 9/13/24–11/16/28 |
| 5. | Federal Farm Credit Bank, 0.71%–2.44%, due 6/17/24–7/1/30 |
| 6. | Federal Home Loan Mortgage Corporation (Mortgage Pass-Through Securities), 3.00%–6.50%, due 7/1/21–5/1/50 |
| 7. | Government National Mortgage Association (Mortgage Pass-Through Securities), 2.50%–4.50%, due 6/15/39–12/1/49 |
| 8. | Federal National Mortgage Association, 0.50%–6.25%, due 7/2/24–5/15/29 |
| 9. | Mizuho Financial Group, Inc., 0.99%–1.163%, due 9/13/23–5/25/24 |
| 10. | Seasoned Credit Risk Transfer Trust, 3.50%–4.50%, due 6/25/57–2/25/59 |
Portfolio Management Discussion and Analysis (Unaudited)
Answers to the questions reflect the views of Kenneth Sommer and AJ Rzad, CFA, of NYL Investors LLC, the Portfolio’s Subadvisor.
How did MainStay VP Bond Portfolio perform relative to its benchmark and peers during the six months ended June 30, 2020?
For the six months ended June 30, 2020, MainStay VP Bond Portfolio returned 5.50% for Initial Class shares and 5.37% for Service Class shares. Over the same period, both share classes underperformed the 6.14% return of the Bloomberg Barclays U.S. Aggregate Bond Index, which is the Portfolio’s broad-based securities-market index, and the 5.56% return of the Morningstar Intermediate Core Bond Category Average.1
During the reporting period, were there any market events that materially impacted the Portfolio’s performance or liquidity?
During the reporting period, the Portfolio’s performance was materially impacted by the coronavirus pandemic. During the month of March, option-adjusted spreads2 on risk assets moved sharply wider as the virus spread throughout the United States, undermining the relative performance of the Portfolio’s overweight positions in corporates, commercial mortgage-backed securities and mortgage-backed securities compared to matched-duration U.S. Treasury bonds. The Portfolio’s overweight position in asset-backed securities also detracted from performance during the reporting period.
From a liquidity perspective, the first three months of the reporting period proved to be a challenging environment for all fixed-income investors. As investors flocked to the relative safety of cash and/or U.S. Treasury holdings, portfolio redemptions resulted in forced selling across the corporate landscape. This led to wider bid-ask spreads and a more difficult environment in which to transact. While the U.S. Federal Reserve’s heavy-handed response opened the primary market, secondary liquidity remained challenging until investors became more confident in the stability of the market.
What factors affected the Portfolio’s relative performance during the reporting period?
Relative to the Bloomberg Barclays U.S. Aggregate Bond Index, the Portfolio held overweight positions in the corporate, asset-backed securities, commercial mortgage-backed securities and U.S. government agency sectors throughout the reporting period. During the same period, the Portfolio held relatively underweight exposure in mortgage-backed securities and in the sovereign subsector.
Corporate sector holdings made the strongest contributions to the Portfolio’s relative performance during the reporting period. (Contributions take weightings and total returns into account.) Within the corporate sector, the Portfolio’s allocation to industrials, most specifically the transportation subsector, was most accretive to returns. Within the non-corporate sector, the Portfolio’s underweight positioning relative to the benchmark in the sovereign subsector also enhanced relative performance. Conversely, the Portfolio’s overweight position in commercial mortgage-backed securities, specifically the AAA non-agency sub-component, detracted most from performance compared to the benchmark. Also, the Portfolio’s allocation to collateralized loan obligations and to the fixed-rate subsector within the asset-backed securities sector detracted from relative performance.
During the reporting period, how was the Portfolio’s performance materially affected by investments in derivatives?
During the reporting period, the Portfolio’s use of derivatives was limited to interest rate derivatives used to keep the duration of the Portfolio in line with our target. The interest rate derivatives had a positive impact on performance during the reporting period.
What was the Portfolio’s duration3 strategy during the reporting period?
The Portfolio maintained a duration close to that of the Bloomberg Barclays U.S. Aggregate Bond Index during the reporting period. During the first half of the reporting period, the Portfolio initiated a short duration position relative to its benchmark, which had a negative impact on performance. During the second half of the reporting period, the Portfolio initiated a long duration position relative to its benchmark, a strategy that proved accretive to performance. Overall, the Portfolio’s duration strategy during the reporting period detracted from performance relative to its benchmark. As of June 30, 2020, both the Portfolio and the Bloomberg Barclays U.S. Aggregate Bond Index had durations of approximately 6.00 years.
What specific factors, risks or market forces prompted significant decisions for the Portfolio during the reporting period?
As mentioned above, the Portfolio maintained overweight positions relative to the Bloomberg Barclays U.S. Aggregate Bond Index in corporate bonds, commercial mortgage-backed securities, asset-backed securities and U.S. government agencies. Toward the middle of the reporting period, option-adjusted
| 1. | See page 5 for more information on benchmark and peer group returns. |
| 2. | The terms “spread” and “yield spread” may refer to the difference in yield between a security or type of security and comparable U.S. Treasury issues. The terms may also refer to the difference in yield between two specific securities or types of securities at a given time. |
| 3. | Duration is a measure of the price sensitivity of a fixed-income investment to changes in interest rates. Duration is expressed as a number of years and is considered a more accurate sensitivity gauge than average maturity. |
| | |
| 8 | | MainStay VP Bond Portfolio |
spreads on corporate bonds moved markedly higher as the coronavirus pandemic intensified. In response to the increase in valuation, we increased the Portfolio’s exposure to the corporate sector, a decision that bolstered performance. Toward the end of the reporting period, coronavirus cases began to once again spike after a short period of relative tranquility. In response to the pick-up in volatility, we decreased the Portfolio’s allocation to the corporate bond sector, detracting slightly from performance. During the first half of the reporting period, we increased the Portfolio’s allocation to U.S. government callable agency securities. Spreads on U.S. government callable agency securities moved wider, creating an attractive opportunity to add to the Portfolio’s overweight within the sector. This decision was slightly accretive to performance.
During the reporting period, which market segments were the strongest positive contributors to the Portfolio’s absolute performance and which market segments were particularly weak?
The corporate sector was the strongest positive contributor to the Portfolio’s absolute performance during the reporting period. Within the corporate sector, positioning in the financials, industrials and utilities subsectors made the largest positive contributions to the Portfolio’s absolute performance. Overweight positions in bonds from United Parcel Service, Bank of America, CVS Health and Morgan Stanley all enhanced absolute returns. Positioning among the U.S. Treasury, U.S. government agencies and mortgage-backed securities sectors were also accretive to absolute performance during the reporting period.
During the same period, the commercial mortgage-backed securities sector was the weakest contributor to the Portfolio’s absolute performance. Within the commercial mortgage-backed securities sector, positioning among credits rated AA and AAA proved particularly weak.4 The Portfolio’s allocation to asset-backed securities was also a relatively weak contributor to absolute performance.
Did the Portfolio make any significant purchases or sales during the reporting period?
The Portfolio generally sought to purchase corporate bonds during the periods of market weakness. As the market stabilized, the Portfolio sold corporate bonds to reduce its overweight
in the sector relative to the Bloomberg Barclays U.S. Aggregate Bond Index. During the reporting period, the largest purchases by issuer were positions in Mizuho Financial Group, Carrier Global, and Boeing. The largest sales were positions in HSBC Holdings, Occidental Petroleum Corporation, and Entergy Corporation.
How did the Portfolio’s sector weightings change during the reporting period?
We reduced the Portfolio’s allocation to commercial mortgage-backed securities by approximately 250 basis points during the first six months of 2020, primarily at the beginning of March and in the second half of April. (A basis point is one one-hundredth of a percentage point.) This shift reflected our cautious attitude regarding commercial real estate fundamentals; in each instance in which exposure was reduced we saw more attractive opportunities to allocate capital in investment-grade credit. We also reduced the Portfolio’s allocation to asset-backed securities by approximately 250 basis points during the same period, primarily in the first quarter of 2020, selling shorter-duration, higher-quality, low-yielding securities to purchase investment-grade credit.
How was the Portfolio positioned at the end of the reporting period?
As of June 30, 2020, the Portfolio held overweight exposure relative to the Bloomberg Barclays U.S. Aggregate Bond Index in corporate bonds. Within the corporate sector, the Portfolio was overweight in financials, industrials and utilities. The Portfolio also held overweight positions in asset-backed securities, commercial mortgage-backed securities and U.S. government agencies. The largest overweight allocation among spread assets was within the asset-backed securities sector.
As of the same date, the Portfolio held relatively underweight exposure to the non-corporate sector, most notably the supranational and sovereign subsectors. In addition, the Portfolio maintained an underweight position in the mortgage-backed securities sector.
As of June 30, 2020, the Portfolio maintained a duration that was equal to the duration of the Bloomberg Barclays U.S. Aggregate Bond Index.
| 4. | An obligation rated ‘AAA’ has the highest rating assigned by Standard & Poor’s (“S&P”), and in the opinion of S&P, the obligor’s capacity to meet its financial commitment on the obligation is extremely strong. An obligation rated ‘AA’ by S&P is deemed by S&P to differ from the highest-rated obligations only to a small degree. In the opinion of S&P, the obligor’s capacity to meet its financial commitment on the obligation is very strong. When applied to Portfolio holdings, ratings are based solely on the creditworthiness of the bonds in the Portfolio and are not meant to represent the security or safety of the Portfolio. |
The opinions expressed are those of the portfolio managers as of the date of this report and are subject to change. There is no guarantee that any forecasts will come to pass. This material does not constitute investment advice and is not intended as an endorsement of any specific investment.
Not all MainStay VP Portfolios and/or share classes are available under all policies.
Portfolio of Investments June 30, 2020 (Unaudited)
| | | | | | | | |
| | | Principal
Amount | | | Value | |
Long-Term Bonds 99.2%† Asset-Backed Securities 13.7% | |
Automobile Asset-Backed Securities 0.4% | |
Toyota Auto Loan Extended Note Trust
Series 2020-1A, Class A
1.35%, due 5/25/33 (a) | | $ | 3,250,000 | | | $ | 3,298,707 | |
| | | | | | | | |
|
Home Equity 0.1% | |
Chase Funding Trust
Series 2002-2, Class 1A5
6.333%, due 4/25/32 (b) | | | 74,787 | | | | 76,134 | |
Morgan Stanley Mortgage Loan Trust
Series 2006-17XS, Class A3A
5.651%, due 10/25/46 (b) | | | 932,981 | | | | 394,931 | |
| | | | | | | | |
| | | | | | | 471,065 | |
| | | | | | | | |
Other Asset-Backed Securities 13.2% | |
AIMCO CLO
Series 2015-AA, Class BR
2.519% (3 Month LIBOR + 1.30%), due 1/15/28 (a)(c) | | | 2,000,000 | | | | 1,932,884 | |
Apidos CLO XXV
Series 2016-25A, Class A1R
2.305% (3 Month LIBOR + 1.17%), due 10/20/31 (a)(c) | | | 1,300,000 | | | | 1,275,652 | |
Apidos CLO XXXII
Series 2019-32A, Class A1
3.003% (3 Month LIBOR + 1.32%), due 1/20/33 (a)(c) | | | 2,200,000 | | | | 2,159,082 | |
Ares CLO, Ltd.
Series 2015-38A, Class BR
2.535% (3 Month LIBOR + 1.40%), due 4/20/30 (a)(c) | | | 1,500,000 | | | | 1,428,071 | |
Ares XLI CLO, Ltd.
Series 2016-41A, Class AR
2.419% (3 Month LIBOR + 1.20%), due 1/15/29 (a)(c) | | | 2,500,000 | | | | 2,469,027 | |
Ares XXXIV CLO, Ltd.
Series 2015-2A, Class AR2
2.026% (3 Month LIBOR + 1.25%), due 4/17/33 (a)(c) | | | 2,000,000 | | | | 1,947,900 | |
Bain Capital Credit CLO, Ltd. (a)(c) | | | | | | | | |
Series 2016-2A, Class AR
2.359% (3 Month LIBOR + 1.14%), due 1/15/29 | | | 1,600,000 | | | | 1,585,214 | |
Series 2017-IA, Class A1
2.385% (3 Month LIBOR + 1.25%), due 7/20/30 | | | 2,750,000 | | | | 2,708,120 | |
Benefit Street Partners CLO IV, Ltd.
Series 2014-IVA, Class A1RR
2.385% (3 Month LIBOR + 1.25%), due 1/20/29 (a)(c) | | | 1,600,000 | | | | 1,583,149 | |
| | | | | | | | |
| | | Principal
Amount | | | Value | |
Other Asset-Backed Securities (continued) | |
Benefit Street Partners CLO XVIII, Ltd.
Series 2019-18A, Class A
2.559% (3 Month LIBOR + 1.34%), due 10/15/32 (a)(c) | | $ | 1,000,000 | | | $ | 977,813 | |
Capital Automotive REIT (a) | | | | | | | | |
Series 2020-1A, Class A1
2.69%, due 2/15/50 | | | 982,474 | | | | 988,460 | |
Series 2017-1A, Class A1
3.87%, due 4/15/47 | | | 2,070,283 | | | | 2,072,100 | |
Cedar Funding IV CLO, Ltd.
Series 2014-4A, Class AR
2.273% (3 Month LIBOR + 1.23%), due 7/23/30 (a)(c) | | | 2,600,000 | | | | 2,564,468 | |
Cedar Funding VIII CLO, Ltd.
Series 2017-8A, Class A1
2.385% (3 Month LIBOR + 1.25%), due 10/17/30 (a)(c) | | | 1,250,000 | | | | 1,227,498 | |
DB Master Finance LLC
Series 2019-1A, Class A2I
3.787%, due 5/20/49 (a) | | | 2,605,313 | | | | 2,688,656 | |
Dell Equipment Finance Trust
Series 2020-1, Class A2
2.26%, due 6/22/22 (a) | | | 1,900,000 | | | | 1,932,508 | |
Driven Brands Funding LLC
Series 2019-1A, Class A2
4.641%, due 4/20/49 (a) | | | 2,962,500 | | | | 3,134,266 | |
Dryden 57 CLO, Ltd.
Series 2018-57A, Class A
1.402% (3 Month LIBOR + 1.01%), due 5/15/31 (a)(c) | | | 2,000,000 | | | | 1,944,114 | |
Dryden CLO, Ltd.
Series 2019-76A, Class A1
2.465% (3 Month LIBOR + 1.33%), due 10/20/32 (a)(c) | | | 1,875,000 | | | | 1,846,896 | |
Elara HGV Timeshare Issuer LLC
Series 2017-A, Class A
2.69%, due 3/25/30 (a) | | | 427,287 | | | | 427,016 | |
ELFI Graduate Loan Program LLC (a) | | | | | | | | |
Series 2020-A, Class A
1.73%, due 8/25/45 | | | 3,000,000 | | | | 3,010,320 | |
Series 2019-A, Class A
2.54%, due 3/25/44 | | | 2,061,062 | | | | 2,112,338 | |
FOCUS Brands Funding LLC
Series 2017-1A, Class A2I
3.857%, due 4/30/47 (a) | | | 485,000 | | | | 457,767 | |
Galaxy XV CLO, Ltd.
Series 2013-15A, Class AR
2.419% (3 Month LIBOR + 1.20%), due 10/15/30 (a)(c) | | | 1,750,000 | | | | 1,711,668 | |
| | | | |
| 10 | | MainStay VP Bond Portfolio | | The notes to the financial statements are an integral part of,
and should be read in conjunction with, the financial statements. |
| | | | | | | | |
| | | Principal
Amount | | | Value | |
| Asset-Backed Securities (continued) | |
Other Asset-Backed Securities (continued) | |
Galaxy XXII CLO, Ltd.
Series 2016-22A, Class A1R
2.176% (3 Month LIBOR + 1.00%), due 7/16/28 (a)(c) | | $ | 1,500,000 | | | $ | 1,478,887 | |
Galaxy XXVI CLO, Ltd.
Series 2018-26A, Class A
1.558% (3 Month LIBOR + 1.20%), due 11/22/31 (a)(c) | | | 1,500,000 | | | | 1,461,979 | |
Grippen Park CLO, Ltd.
Series 2017-1A, Class B
2.785% (3 Month LIBOR + 1.65%), due 1/20/30 (a)(c) | | | 750,000 | | | | 729,449 | |
Highbridge Loan Management, Ltd.
Series 2010A-16, Class A1R
2.275% (3 Month LIBOR + 1.14%), due 1/20/28 (a)(c) | | | 1,000,000 | | | | 984,328 | |
Hilton Grand Vacations Trust
Series 2018-AA, Class A
3.54%, due 2/25/32 (a) | | | 1,265,565 | | | | 1,289,144 | |
JP Morgan Mortgage Acquisition Trust
Series 2007-CH2, Class AF3
4.635%, due 10/25/30 (b) | | | 594,089 | | | | 421,417 | |
Magnetite VII, Ltd.
Series 2012-7A, Class A1R2
2.019% (3 Month LIBOR + 0.80%), due 1/15/28 (a)(c) | | | 470,000 | | | | 460,973 | |
Magnetite XVIII, Ltd. (a)(c) | | | | | | | | |
Series 2016-18A, Class AR
1.472% (3 Month LIBOR + 1.08%), due 11/15/28 | | | 1,900,000 | | | | 1,872,059 | |
Series 2019-23A, Class A
2.291% (3 Month LIBOR + 1.30%), due 10/25/32 | | | 1,000,000 | | | | 980,763 | |
MVW Owner Trust (a) | | | | | | | | |
Series 2014-1A, Class A
2.25%, due 9/22/31 | | | 182,662 | | | | 181,275 | |
Series 2019-1A, Class A
2.89%, due 11/20/36 | | | 992,480 | | | | 1,009,554 | |
Navient Private Education Refi Loan Trust
Series 2019-CA, Class A2
3.13%, due 2/15/68 (a) | | | 1,600,000 | | | | 1,650,597 | |
Neuberger Berman CLO XIV, Ltd. (a)(c) | | | | | | | | |
Series 2013-14A, Class AR2
1.917% (3 Month LIBOR + 1.03%), due 1/28/30 | | | 1,500,000 | | | | 1,473,091 | |
Series 2013-14A, Class BR2
2.387% (3 Month LIBOR + 1.50%), due 1/28/30 | | | 1,000,000 | | | | 968,063 | |
| | | | | | | | |
| | | Principal
Amount | | | Value | |
Other Asset-Backed Securities (continued) | |
Neuberger Berman Loan Advisers CLO 24, Ltd.
Series 2017-24A, Class BR
2.635% (3 Month LIBOR + 1.50%), due 4/19/30 (a)(c) | | $ | 1,000,000 | | | $ | 972,452 | |
Neuberger Berman Loan Advisers CLO 32, Ltd.
Series 2019-32A, Class B
2.985% (3 Month LIBOR + 1.85%), due 1/19/32 (a)(c) | | | 2,000,000 | | | | 1,961,202 | |
Neuberger Berman Loan Advisers CLO 37, Ltd.
Series 2020-37A, Class A1
1.919% (3 Month LIBOR + 1.75%), due 7/20/31 (a)(c) | | | 2,000,000 | | | | 2,000,000 | |
Oaktree CLO, Ltd.
Series 2020-1A, Class B
2.935% (3 Month LIBOR + 2.59%), due 7/15/29 (a)(c) | | | 3,000,000 | | | | 2,999,958 | |
Octagon Investment Partners 29, Ltd.
Series 2016-1A, Class AR
2.20% (3 Month LIBOR + 1.18%), due 1/24/33 (a)(c) | | | 1,200,000 | | | | 1,159,374 | |
Octagon Investment Partners 31 LLC
Series 2017-1A, Class B1
2.835% (3 Month LIBOR + 1.70%), due 7/20/30 (a)(c) | | | 1,200,000 | | | | 1,161,683 | |
Palmer Square CLO, Ltd. (a)(c) | | | | | | | | |
Series 2015-1A, Class A1R2
1.594% (3 Month LIBOR + 1.22%), due 5/21/29 | | | 2,200,000 | | | | 2,180,356 | |
Series 2015-1A, Class A2R2
2.024% (3 Month LIBOR + 1.65%), due 5/21/29 | | | 875,000 | | | | 860,962 | |
Series 2015-2A, Class A1R2
2.235% (3 Month LIBOR + 1.10%), due 7/20/30 | | | 300,000 | | | | 293,938 | |
Series 2014-1A, Class A1R2
2.265% (3 Month LIBOR + 1.13%), due 1/17/31 | | | 750,000 | | | | 737,663 | |
Series-2015-2A, Class A2R2
2.685% (3 Month LIBOR + 1.55%), due 7/20/30 | | | 2,000,000 | | | | 1,942,818 | |
Palmer Square Loan Funding, Ltd.
Series 2019-3A, Class A2
1.977% (3 Month LIBOR + 1.60%), due 8/20/27 (a)(c) | | | 3,000,000 | | | | 2,941,065 | |
Regatta VI Funding, Ltd.
Series 2016-1A, Class AR
2.215% (3 Month LIBOR + 1.08%), due 7/20/28 (a)(c) | | | 2,800,000 | | | | 2,766,168 | |
| | | | | | |
The notes to the financial statements are an integral part of,
and should be read in conjunction with, the financial statements. | | | | | 11 | |
Portfolio of Investments June 30, 2020 (Unaudited) (continued)
| | | | | | | | |
| | | Principal
Amount | | | Value | |
| Asset-Backed Securities (continued) | |
Other Asset-Backed Securities (continued) | |
Shackleton CLO, Ltd. (a)(c) | | | | | | | | |
Series 2019-14A, Class A1
2.365% (3 Month LIBOR + 1.23%), due 7/20/30 | | $ | 2,000,000 | | | $ | 1,955,410 | |
Series 2019-15A, Class B
3.903% (3 Month LIBOR + 2.00%), due 1/15/30 | | | 1,500,000 | | | | 1,475,238 | |
Sierra Timeshare Receivables Funding LLC (a) | | | | | | | | |
Series 2019-1A, Class A
3.20%, due 1/20/36 | | | 418,236 | | | | 426,358 | |
Series 2018-2A, Class A
3.50%, due 6/20/35 | | | 508,071 | | | | 516,318 | |
Series 2018-3A, Class A
3.69%, due 9/20/35 | | | 251,085 | | | | 256,427 | |
SMB Private Education Loan Trust
Series 2019-B, Class A2A
2.84%, due 6/15/37 (a) | | | 3,000,000 | | | | 3,098,444 | |
SoFi Professional Loan Program LLC (a) | | | | | | | | |
Series 2019-C, Class A2FX
2.37%, due 11/16/48 | | | 1,250,000 | | | | 1,276,000 | |
Series 2019-A, Class A1FX
3.18%, due 6/15/48 | | | 448,984 | | | | 451,911 | |
SoFi Professional Loan Program Trust (a) | | | | | | | | |
Series 2020-A, Class A2FX
2.54%, due 5/15/46 | | | 800,000 | | | | 828,999 | |
Series 2018-D, Class A1FX
3.12%, due 2/25/48 | | | 168,381 | | | | 169,539 | |
Taco Bell Funding, LLC
Series 2018-1A, Class A2I
4.318%, due 11/25/48 (a) | | | 1,970,000 | | | | 2,011,922 | |
THL Credit Wind River CLO, Ltd.
Series 2017-4A, Class A
1.527% (3 Month LIBOR + 1.15%), due 11/20/30 (a)(c) | | | 2,243,000 | | | | 2,195,493 | |
TIAA CLO III, Ltd.
Series 2017-2A, Class A
2.326% (3 Month LIBOR + 1.15%), due 1/16/31 (a)(c) | | | 2,400,000 | | | | 2,310,180 | |
TICP CLO XIII, Ltd.
Series 2019 13A, Class A
2.519% (3 Month LIBOR + 1.30%), due 7/15/32 (a)(c) | | | 3,500,000 | | | | 3,458,175 | |
TICP CLO XV, Ltd.
Series 2020-15A, Class A
2.915% (3 Month LIBOR + 1.28%), due 4/20/33 (a)(c) | | | 2,000,000 | | | | 1,957,698 | |
Treman Park CLO, Ltd.
Series 2015-1A, Class ARR
2.205% (3 Month LIBOR + 1.07%), due 10/20/28 (a)(c) | | | 1,245,000 | | | | 1,230,280 | |
| | | | | | | | |
| | | Principal
Amount | | | Value | |
Other Asset-Backed Securities (continued) | |
Voya CLO, Ltd. (a)(c) | | | | | | | | |
Series 2019-1A, Class AR
2.279% (3 Month LIBOR + 1.06%), due 4/15/31 | | $ | 1,500,000 | | | $ | 1,454,418 | |
Series 2019-1A, Class BR
2.769% (3 Month LIBOR + 1.55%), due 4/15/31 | | | 2,000,000 | | | | 1,880,384 | |
VSE VOI Mortgage LLC
Series 2016-A, Class A
2.54%, due 7/20/33 (a) | | | 1,117,230 | | | | 1,104,905 | |
Westcott Park CLO, Ltd.
Series 2016 1A, Class AR
2.345% (3 Month LIBOR + 1.21%), due 7/20/28 (a)(c) | | | 1,850,000 | | | | 1,829,428 | |
| | | | | | | | |
| | | | | | | 111,011,732 | |
| | | | | | | | |
Total Asset-Backed Securities
(Cost $115,435,662) | | | | | | | 114,781,504 | |
| | | | | | | | |
|
| Corporate Bonds 38.4% | |
Aerospace & Defense 1.0% | |
Boeing Co. | | | | | | | | |
2.70%, due 2/1/27 | | | 1,825,000 | | | | 1,782,602 | |
2.95%, due 2/1/30 | | | 2,500,000 | | | | 2,463,893 | |
3.10%, due 5/1/26 | | | 1,925,000 | | | | 1,961,542 | |
5.15%, due 5/1/30 | | | 1,975,000 | | | | 2,202,184 | |
| | | | | | | | |
| | | | | | | 8,410,221 | |
| | | | | | | | |
Apparel 0.3% | |
NIKE, Inc.
3.25%, due 3/27/40 | | | 1,500,000 | | | | 1,678,841 | |
Ralph Lauren Corp.
1.70%, due 6/15/22 | | | 925,000 | | | | 940,320 | |
| | | | | | | | |
| | | | | | | 2,619,161 | |
| | | | | | | | |
Auto Manufacturers 2.4% | |
Daimler Finance North America LLC
1.292% (3 Month LIBOR + 0.90%), due 2/15/22 (a)(c) | | | 3,000,000 | | | | 2,964,375 | |
Ford Motor Credit Co. LLC | | | | | | | | |
3.087%, due 1/9/23 | | | 825,000 | | | | 785,812 | |
3.664%, due 9/8/24 | | | 1,800,000 | | | | 1,696,878 | |
General Motors Co.
5.15%, due 4/1/38 | | | 1,500,000 | | | | 1,437,713 | |
General Motors Financial Co., Inc.
5.20%, due 3/20/23 | | | 2,750,000 | | | | 2,938,970 | |
Toyota Motor Credit Corp.
1.80%, due 2/13/25 | | | 3,765,000 | | | | 3,902,540 | |
Volkswagen Group of America Finance LLC (a) | | | | | | | | |
1.157% (3 Month LIBOR + 0.86%), due 9/24/21 (c) | | | 1,975,000 | | | | 1,967,986 | |
3.35%, due 5/13/25 | | | 4,225,000 | | | | 4,509,071 | |
| | | | | | | | |
| | | | | | | 20,203,345 | |
| | | | | | | | |
| | | | |
| 12 | | MainStay VP Bond Portfolio | | The notes to the financial statements are an integral part of,
and should be read in conjunction with, the financial statements. |
| | | | | | | | |
| | | Principal
Amount | | | Value | |
| Corporate Bonds (continued) | |
Banks 8.7% | |
Banco del Estado de Chile
2.704%, due 1/9/25 (a) | | $ | 1,275,000 | | | $ | 1,308,788 | |
Banco Santander S.A.
2.746%, due 5/28/25 | | | 1,800,000 | | | | 1,865,367 | |
Bank of America Corp. | | | | | | | | |
1.319%, due 6/19/26 (d) | | | 3,750,000 | | | | 3,759,758 | |
4.083%, due 3/20/51 (d) | | | 2,890,000 | | | | 3,621,347 | |
4.45%, due 3/3/26 | | | 1,570,000 | | | | 1,807,454 | |
BNP Paribas S.A. (a)(d) | | | | | | | | |
2.219%, due 6/9/26 | | | 1,475,000 | | | | 1,510,424 | |
3.052%, due 1/13/31 | | | 1,700,000 | | | | 1,790,598 | |
Citigroup, Inc. | | | | | | | | |
4.60%, due 3/9/26 | | | 1,500,000 | | | | 1,713,070 | |
4.75%, due 5/18/46 | | | 1,975,000 | | | | 2,512,213 | |
Credit Suisse A.G.
2.95%, due 4/9/25 | | | 3,000,000 | | | | 3,257,297 | |
Credit Suisse Group A.G.
2.193%, due 6/5/26 (a)(d) | | | 4,000,000 | | | | 4,051,192 | |
Fifth Third Bancorp
4.30%, due 1/16/24 | | | 3,875,000 | | | | 4,273,735 | |
Goldman Sachs Group, Inc. | | | | | | | | |
2.60%, due 2/7/30 | | | 2,425,000 | | | | 2,542,844 | |
5.15%, due 5/22/45 | | | 975,000 | | | | 1,283,599 | |
JPMorgan Chase & Co. | | | | | | | | |
2.083%, due 4/22/26 (d) | | | 2,875,000 | | | | 2,986,028 | |
2.956%, due 5/13/31 (d) | | | 925,000 | | | | 981,040 | |
5.40%, due 1/6/42 | | | 1,925,000 | | | | 2,711,920 | |
Lloyds Bank PLC
6.50%, due 9/14/20 (a) | | | 8,150,000 | | | | 8,230,200 | |
Mizuho Financial Group, Inc. (c) | | | | | | | | |
0.99% (3 Month LIBOR + 0.63%), due 5/25/24 | | | 8,270,000 | | | | 8,104,646 | |
1.163% (3 Month LIBOR + 0.85%), due 9/13/23 | | | 1,375,000 | | | | 1,367,065 | |
Morgan Stanley | | | | | | | | |
2.188%, due 4/28/26 (d) | | | 2,075,000 | | | | 2,160,509 | |
3.622%, due 4/1/31 (d) | | | 2,675,000 | | | | 3,055,850 | |
4.35%, due 9/8/26 | | | 1,556,000 | | | | 1,794,193 | |
Sumitomo Mitsui Banking Corp.
3.20%, due 7/18/22 | | | 2,500,000 | | | | 2,609,706 | |
Truist Bank
1.50%, due 3/10/25 | | | 3,225,000 | | | | 3,310,063 | |
| | | | | | | | |
| | | | | | | 72,608,906 | |
| | | | | | | | |
Beverages 0.7% | |
Anheuser-Busch InBev Worldwide, Inc.
4.75%, due 1/23/29 | | | 3,750,000 | | | | 4,531,102 | |
Diageo Capital PLC
2.125%, due 4/29/32 | | | 1,150,000 | | | | 1,192,418 | |
| | | | | | | | |
| | | | | | | 5,723,520 | |
| | | | | | | | |
| | | | | | | | |
| | | Principal
Amount | | | Value | |
Building Materials 1.7% | |
Carrier Global Corp. (a) | | | | | | | | |
2.722%, due 2/15/30 | | $ | 3,275,000 | | | $ | 3,289,222 | |
3.577%, due 4/5/50 | | | 3,575,000 | | | | 3,518,914 | |
Masco Corp.
4.50%, due 5/15/47 | | | 3,000,000 | | | | 3,147,751 | |
Owens Corning
3.95%, due 8/15/29 | | | 3,378,000 | | | | 3,680,089 | |
Vulcan Materials Co.
3.50%, due 6/1/30 | | | 800,000 | | | | 871,463 | |
| | | | | | | | |
| | | | | | | 14,507,439 | |
| | | | | | | | |
Chemicals 1.4% | |
Air Products & Chemicals, Inc.
2.05%, due 5/15/30 | | | 1,750,000 | | | | 1,836,804 | |
Albemarle Corp.
1.442% (3 Month LIBOR + 1.05%), due 11/15/22 (a)(c) | | | 2,500,000 | | | | 2,402,375 | |
E.I. du Pont de Nemours & Co.
1.70%, due 7/15/25 | | | 950,000 | | | | 980,837 | |
NewMarket Corp.
4.10%, due 12/15/22 | | | 5,536,000 | | | | 5,885,549 | |
Nutrien, Ltd.
3.625%, due 3/15/24 | | | 825,000 | | | | 891,539 | |
| | | | | | | | |
| | | | | | | 11,997,104 | |
| | | | | | | | |
Commercial Services 0.3% | |
Equifax, Inc.
2.60%, due 12/15/25 | | | 2,175,000 | | | | 2,316,862 | |
| | | | | | | | |
|
Computers 0.2% | |
DXC Technology Co.
4.00%, due 4/15/23 | | | 750,000 | | | | 787,139 | |
NetApp, Inc.
1.875%, due 6/22/25 | | | 875,000 | | | | 887,469 | |
| | | | | | | | |
| | | | | | | 1,674,608 | |
| | | | | | | | |
Diversified Financial Services 1.1% | |
GE Capital International Funding Co.
4.418%, due 11/15/35 | | | 6,160,000 | | | | 6,263,200 | |
Intercontinental Exchange, Inc.
2.10%, due 6/15/30 | | | 2,600,000 | | | | 2,641,868 | |
| | | | | | | | |
| | | | | | | 8,905,068 | |
| | | | | | | | |
Electric 4.0% | |
Appalachian Power Co.
6.375%, due 4/1/36 | | | 1,750,000 | | | | 2,274,780 | |
Arizona Public Service Co.
5.50%, due 9/1/35 | | | 1,275,000 | | | | 1,625,706 | |
Dayton Power & Light Co.
3.95%, due 6/15/49 | | | 1,025,000 | | | | 1,101,115 | |
Electricite de France S.A.
5.00%, due 9/21/48 (a) | | | 3,420,000 | | | | 4,341,000 | |
| | | | | | |
The notes to the financial statements are an integral part of,
and should be read in conjunction with, the financial statements. | | | | | 13 | |
Portfolio of Investments June 30, 2020 (Unaudited) (continued)
| | | | | | | | |
| | | Principal
Amount | | | Value | |
| Corporate Bonds (continued) | |
Electric (continued) | |
Entergy Mississippi LLC
3.85%, due 6/1/49 | | $ | 2,500,000 | | | $ | 2,978,840 | |
Evergy, Inc.
4.85%, due 6/1/21 | | | 385,000 | | | | 395,581 | |
Exelon Corp. | | | | | | | | |
3.497%, due 6/1/22 | | | 2,750,000 | | | | 2,878,036 | |
4.05%, due 4/15/30 | | | 1,200,000 | | | | 1,385,641 | |
FirstEnergy Transmission LLC
4.35%, due 1/15/25 (a) | | | 3,455,000 | | | | 3,907,492 | |
NextEra Energy Capital Holdings, Inc.
3.25%, due 4/1/26 | | | 1,800,000 | | | | 2,014,885 | |
Niagara Mohawk Power Corp.
3.025%, due 6/27/50 (a) | | | 1,850,000 | | | | 1,904,583 | |
Ohio Edison Co.
6.875%, due 7/15/36 | | | 2,500,000 | | | | 3,525,264 | |
PacifiCorp
2.70%, due 9/15/30 | | | 1,975,000 | | | | 2,151,617 | |
Pinnacle West Capital Corp.
1.30%, due 6/15/25 | | | 3,100,000 | | | | 3,138,086 | |
| | | | | | | | |
| | | | | | | 33,622,626 | |
| | | | | | | | |
Electrical Components & Equipment 0.2% | |
Emerson Electric Co.
1.80%, due 10/15/27 | | | 1,600,000 | | | | 1,655,099 | |
| | | | | | | | |
|
Food 0.7% | |
Conagra Brands, Inc.
4.85%, due 11/1/28 | | | 2,300,000 | | | | 2,761,400 | |
Ingredion, Inc.
4.625%, due 11/1/20 | | | 1,475,000 | | | | 1,491,384 | |
Kroger Co.
7.70%, due 6/1/29 | | | 1,000,000 | | | | 1,410,594 | |
| | | | | | | | |
| | | | | | | 5,663,378 | |
| | | | | | | | |
Gas 0.2% | |
NiSource, Inc.
5.65%, due 2/1/45 | | | 1,125,000 | | | | 1,526,110 | |
| | | | | | | | |
|
Health Care—Products 0.3% | |
Boston Scientific Corp.
1.90%, due 6/1/25 | | | 875,000 | | | | 906,817 | |
Stryker Corp. | | | | | | | | |
1.95%, due 6/15/30 | | | 970,000 | | | | 976,471 | |
2.90%, due 6/15/50 | | | 850,000 | | | | 852,285 | |
| | | | | | | | |
| | | | | | | 2,735,573 | |
| | | | | | | | |
Insurance 0.4% | |
MET Tower Global Funding
0.608% (SOFR + 0.55%), due 1/17/23 (a)(c) | | | 3,375,000 | | | | 3,349,243 | |
| | | | | | | | |
| | | | | | | | |
| | | Principal
Amount | | | Value | |
Iron & Steel 1.1% | |
Carpenter Technology Corp.
4.45%, due 3/1/23 | | $ | 1,825,000 | | | $ | 1,806,476 | |
Nucor Corp.
2.00%, due 6/1/25 | | | 1,575,000 | | | | 1,631,010 | |
Reliance Steel & Aluminum Co.
4.50%, due 4/15/23 | | | 3,550,000 | | | | 3,807,389 | |
Steel Dynamics, Inc. | | | | | | | | |
2.40%, due 6/15/25 | | | 875,000 | | | | 901,162 | |
3.25%, due 1/15/31 | | | 800,000 | | | | 815,957 | |
| | | | | | | | |
| | | | | | | 8,961,994 | |
| | | | | | | | |
Machinery—Diversified 0.2% | |
CNH Industrial Capital LLC
1.95%, due 7/2/23 | | | 1,575,000 | | | | 1,585,336 | |
| | | | | | | | |
|
Media 1.0% | |
Charter Communications Operating LLC / Charter Communications Operating Capital
4.908%, due 7/23/25 | | | 1,700,000 | | | | 1,948,341 | |
Comcast Corp.
4.60%, due 10/15/38 | | | 3,000,000 | | | | 3,814,937 | |
Discovery Communications LLC
3.625%, due 5/15/30 | | | 800,000 | | | | 874,241 | |
Fox Corp.
5.576%, due 1/25/49 | | | 1,250,000 | | | | 1,739,335 | |
| | | | | | | | |
| | | | | | | 8,376,854 | |
| | | | | | | | |
Mining 0.3% | |
Anglo American Capital PLC
5.625%, due 4/1/30 (a) | | | 1,875,000 | | | | 2,264,863 | |
| | | | | | | | |
|
Oil & Gas 0.8% | |
Chevron Corp.
2.236%, due 5/11/30 | | | 2,425,000 | | | | 2,539,601 | |
Equinor ASA
1.75%, due 1/22/26 | | | 1,250,000 | | | | 1,280,369 | |
Occidental Petroleum Corp.
1.842% (3 Month LIBOR + 1.45%), due 8/15/22 (c) | | | 3,600,000 | | | | 3,312,697 | |
| | | | | | | | |
| | | | | | | 7,132,667 | |
| | | | | | | | |
Oil & Gas Services 0.6% | |
Schlumberger Holdings Corp.
3.75%, due 5/1/24 (a) | | | 4,725,000 | | | | 5,085,983 | |
| | | | | | | | |
|
Packaging & Containers 0.5% | |
Packaging Corp. of America
4.05%, due 12/15/49 | | | 1,525,000 | | | | 1,820,057 | |
WRKCo., Inc.
3.75%, due 3/15/25 | | | 1,825,000 | | | | 2,017,450 | |
| | | | | | | | |
| | | | | | | 3,837,507 | |
| | | | | | | | |
| | | | |
| 14 | | MainStay VP Bond Portfolio | | The notes to the financial statements are an integral part of,
and should be read in conjunction with, the financial statements. |
| | | | | | | | |
| | | Principal
Amount | | | Value | |
| Corporate Bonds (continued) | |
Pharmaceuticals 1.9% | |
AbbVie, Inc. (a) | | | | | | | | |
2.95%, due 11/21/26 | | $ | 2,575,000 | | | $ | 2,800,694 | |
4.25%, due 11/21/49 | | | 1,600,000 | | | | 1,939,471 | |
Bayer U.S. Finance II LLC
4.375%, due 12/15/28 (a) | | | 2,825,000 | | | | 3,301,469 | |
Becton Dickinson & Co.
2.894%, due 6/6/22 | | | 2,500,000 | | | | 2,588,942 | |
CVS Health Corp. | | | | | | | | |
3.75%, due 4/1/30 | | | 2,450,000 | | | | 2,822,660 | |
4.25%, due 4/1/50 | | | 2,325,000 | | | | 2,778,251 | |
| | | | | | | | |
| | | | | | | 16,231,487 | |
| | | | | | | | |
Pipelines 2.5% | |
Energy Transfer Operating, L.P.
6.05%, due 6/1/41 | | | 1,300,000 | | | | 1,342,037 | |
Energy Transfer Partners, L.P. / Regency Energy Finance Corp.
5.875%, due 3/1/22 | | | 4,800,000 | | | | 5,064,834 | |
Enterprise Products Operating LLC
5.10%, due 2/15/45 | | | 2,600,000 | | | | 3,097,646 | |
Kinder Morgan Energy Partners, L.P.
6.375%, due 3/1/41 | | | 400,000 | | | | 491,547 | |
Kinder Morgan, Inc.
5.00%, due 2/15/21 (a) | | | 4,500,000 | | | | 4,596,726 | |
MPLX, L.P.
1.213% (3 Month LIBOR + 0.90%), due 9/9/21 (c) | | | 1,750,000 | | | | 1,736,127 | |
Tennessee Gas Pipeline Co. LLC
2.90%, due 3/1/30 (a) | | | 2,275,000 | | | | 2,331,519 | |
Texas Eastern Transmission, L.P.
2.80%, due 10/15/22 (a) | | | 2,350,000 | | | | 2,391,745 | |
| | | | | | | | |
| | | | | | | 21,052,181 | |
| | | | | | | | |
Real Estate Investment Trusts 2.4% | |
American Campus Communities Operating Partnership, L.P.
3.30%, due 7/15/26 | | | 3,000,000 | | | | 3,076,496 | |
CyrusOne L.P. / CyrusOne Finance Corp.
3.45%, due 11/15/29 | | | 1,275,000 | | | | 1,327,211 | |
Healthpeak Properties, Inc.
3.25%, due 7/15/26 | | | 2,050,000 | | | | 2,240,369 | |
Highwoods Realty, L.P. | | | | | | | | |
3.05%, due 2/15/30 | | | 1,410,000 | | | | 1,403,585 | |
3.875%, due 3/1/27 | | | 3,590,000 | | | | 3,792,642 | |
Kimco Realty Corp.
3.80%, due 4/1/27 | | | 975,000 | | | | 1,041,323 | |
SBA Tower Trust
2.836%, due 1/17/50 (a) | | | 2,000,000 | | | | 2,062,061 | |
VEREIT Operating Partnership, L.P.
3.95%, due 8/15/27 | | | 4,870,000 | | | | 5,068,155 | |
| | | | | | | | |
| | | | | | | 20,011,842 | |
| | | | | | | | |
| | | | | | | | |
| | | Principal
Amount | | | Value | |
Semiconductors 0.2% | |
Broadcom, Inc.
2.25%, due 11/15/23 (a) | | $ | 1,700,000 | | | $ | 1,756,461 | |
| | | | | | | | |
|
Software 0.5% | |
Fiserv, Inc.
2.25%, due 6/1/27 | | | 2,960,000 | | | | 3,095,255 | |
Infor, Inc.
1.75%, due 7/15/25 (a) | | | 1,225,000 | | | | 1,230,118 | |
| | | | | | | | |
| | | | | | | 4,325,373 | |
| | | | | | | | |
Telecommunications 1.8% | |
AT&T, Inc.
4.85%, due 3/1/39 | | | 2,000,000 | | | | 2,412,246 | |
Orange S.A.
5.375%, due 1/13/42 | | | 895,000 | | | | 1,253,512 | |
T-Mobile USA, Inc.
2.55%, due 2/15/31 (a) | | | 6,540,000 | | | | 6,563,021 | |
Telefonica Emisiones S.A.
5.213%, due 3/8/47 | | | 750,000 | | | | 934,145 | |
Verizon Communications, Inc.
4.272%, due 1/15/36 | | | 3,250,000 | | | | 4,019,240 | |
| | | | | | | | |
| | | | | | | 15,182,164 | |
| | | | | | | | |
Textiles 0.3% | |
Mohawk Industries, Inc.
3.625%, due 5/15/30 | | | 2,400,000 | | | | 2,614,403 | |
| | | | | | | | |
|
Transportation 0.7% | |
Norfolk Southern Corp.
5.64%, due 5/17/29 | | | 1,400,000 | | | | 1,793,971 | |
Union Pacific Corp.
3.25%, due 2/5/50 | | | 775,000 | | | | 849,089 | |
United Parcel Service, Inc.
5.30%, due 4/1/50 | | | 2,000,000 | | | | 2,878,229 | |
| | | | | | | | |
| | | | | | | 5,521,289 | |
| | | | | | | | |
Total Corporate Bonds
(Cost $299,948,871) | | | | | | | 321,458,667 | |
| | | | | | | | |
|
| Foreign Government Bonds 0.3% | |
Mexico 0.2% | |
Mexico Government International Bond
3.75%, due 1/11/28 | | | 1,850,000 | | | | 1,924,647 | |
| | | | | | | | |
|
Poland 0.1% | |
Republic of Poland Government International Bond
5.00%, due 3/23/22 | | | 350,000 | | | | 375,375 | |
| | | | | | | | |
Total Foreign Government Bonds
(Cost $2,192,756) | | | | | | | 2,300,022 | |
| | | | | | | | |
| | | | | | |
The notes to the financial statements are an integral part of,
and should be read in conjunction with, the financial statements. | | | | | 15 | |
Portfolio of Investments June 30, 2020 (Unaudited) (continued)
| | | | | | | | |
| | | Principal
Amount | | | Value | |
| Mortgage-Backed Securities 7.7% | |
Agency (Collateralized Mortgage Obligations) 0.9% | |
Federal Home Loan Mortgage Corporation
Series 4798, Class GZ
4.00%, due 6/15/48 | | $ | 2,173,507 | | | $ | 2,519,086 | |
Government National Mortgage Association
Series 2014-62, Class Z
3.00%, due 4/20/44 | | | 4,450,881 | | | | 4,822,016 | |
| | | | | | | | |
| | | | | | | 7,341,102 | |
| | | | | | | | |
Commercial Mortgage Loans
(Collateralized Mortgage Obligations) 2.6% | |
BX Commercial Mortgage Trust (a)(c) | | | | | | | | |
Series 2019-XL, Class A
1.105% (1 Month LIBOR + 0.92%), due 10/15/36 | | | 2,388,501 | | | | 2,370,321 | |
Series 2019-IMC, Class A
1.185% (1 Month LIBOR + 1.00%), due 4/15/34 | | | 800,000 | | | | 768,280 | |
Citigroup Commercial Mortgage Trust
Series 2020-GC46, Class A5
2.717%, due 2/15/53 | | | 3,750,000 | | | | 4,044,927 | |
Colony Mortgage Capital, Ltd.
Series 2019-IKPR, Class B
1.663% (1 Month LIBOR + 1.478%), due 11/15/38 (a)(c) | | | 6,000,000 | | | | 5,248,849 | |
Credit Suisse Mortgage Trust
Series 2020-WEST, Class A
3.04%, due 2/15/35 (a) | | | 5,000,000 | | | | 4,655,431 | |
GS Mortgage Securities Trust
Series 2015-GC32, Class AS
4.018%, due 7/10/48 (e) | | | 3,000,000 | | | | 3,202,792 | |
Morgan Stanley Bank of America Merrill Lynch Trust
Series 2015-C21, Class AS
3.652%, due 3/15/48 | | | 1,000,000 | | | | 1,053,744 | |
| | | | | | | | |
| | | | | | | 21,344,344 | |
| | | | | | | | |
Whole Loan (Collateralized Mortgage Obligations) 4.2% | |
COLT Mortgage Loan Trust (a)(e) | | | | | | | | |
Series 2020-2, Class A1
1.853%, due 3/25/65 | | | 741,583 | | | | 742,303 | |
Series 2019-4, Class A1
2.579%, due 11/25/49 | | | 2,299,199 | | | | 2,321,676 | |
Series 2019-3, Class A1
2.764%, due 8/25/49 | | | 778,893 | | | | 788,179 | |
JP Morgan Mortgage Trust (a) | | | | | | | | |
Series 2019-1, Class A11
1.135% (1 Month LIBOR + 0.95%), due 5/25/49 (c) | | | 1,108,677 | | | | 1,105,958 | |
Series 2014-2, Class 1A1
3.00%, due 6/25/29 (e) | | | 1,386,993 | | | | 1,423,274 | |
| | | | | | | | |
| | | Principal
Amount | | | Value | |
Whole Loan (Collateralized Mortgage Obligations) (continued) | |
New Residential Mortgage Loan Trust
Series 2020-NQM1, Class A1
2.464%, due 1/26/60 (a)(e) | | $ | 1,129,876 | | | $ | 1,149,002 | |
PSMC Trust (a)(e) | | | | | | | | |
Series 2019-2, Class A1
3.50%, due 10/25/49 | | | 1,141,633 | | | | 1,174,853 | |
Series 2019-3, Class A1
3.50%, due 11/25/49 | | | 1,245,704 | | | | 1,275,915 | |
Series 2018-3, Class A12
4.00%, due 8/25/48 | | | 2,200,000 | | | | 2,279,973 | |
Seasoned Credit Risk Transfer Trust | | | | | | | | |
Series 2019-2, Class MA
3.50%, due 8/25/58 | | | 3,141,225 | | | | 3,423,096 | |
Series 2019-2, Class M55D
4.00%, due 8/25/58 | | | 2,200,353 | | | | 2,446,096 | |
Series 2019-4, Class M55D
4.00%, due 2/25/59 | | | 2,066,775 | | | | 2,300,348 | |
Series 2017-4, Class M45T
4.50%, due 6/25/57 | | | 1,123,968 | | | | 1,262,508 | |
Seasoned Loans Structured Transaction Trust
Series 2019-1, Class A1
3.50%, due 5/25/29 | | | 3,744,577 | | | | 4,074,104 | |
Sequoia Mortgage Trust (a)(e) | | | | | | | | |
Series 2020-3, Class A1
3.00%, due 4/25/50 | | | 3,382,867 | | | | 3,516,850 | |
Series 2020-1, Class A1
3.50%, due 2/25/50 | | | 1,137,024 | | | | 1,168,441 | |
Series 2020-2, Class A1
3.50%, due 3/25/50 | | | 4,258,863 | | | | 4,378,803 | |
TIAA Bank Mortgage Loan Trust
Series 2018-2, Class A1
3.50%, due 7/25/48 (a)(e) | | | 630,696 | | | | 647,958 | |
| | | | | | | | |
| | | | | | | 35,479,337 | |
| | | | | | | | |
Total Mortgage-Backed Securities
(Cost $63,973,166) | | | | | | | 64,164,783 | |
| | | | | | | | |
|
| Municipal Bonds 0.6% | |
Texas 0.6% | |
San Antonio Water System, Revenue Bonds
5.502%, due 5/15/29 | | | 2,000,000 | | | | 2,418,560 | |
Texas Transportation Commission State Highway Fund, Revenue Bonds
5.178%, due 4/1/30 | | | 2,150,000 | | | | 2,758,600 | |
| | | | | | | | |
Total Municipal Bonds
(Cost $4,640,520) | | | | | | | 5,177,160 | |
| | | | | | | | |
| | | | |
| 16 | | MainStay VP Bond Portfolio | | The notes to the financial statements are an integral part of,
and should be read in conjunction with, the financial statements. |
| | | | | | | | |
| | | Principal
Amount | | | Value | |
| U.S. Government & Federal Agencies 38.5% | |
Federal Farm Credit Bank 4.4% | | | | | | | | |
0.71%, due 6/17/24 | | $ | 4,100,000 | | | $ | 4,098,816 | |
1.05%, due 6/22/28 | | | 3,300,000 | | | | 3,289,411 | |
1.09%, due 6/4/27 | | | 4,000,000 | | | | 4,000,442 | |
1.25%, due 10/30/26 | | | 4,000,000 | | | | 4,000,593 | |
1.33%, due 7/1/30 | | | 5,000,000 | | | | 4,985,685 | |
1.35%, due 11/27/28 | | | 2,525,000 | | | | 2,525,340 | |
1.37%, due 6/1/29 | | | 4,000,000 | | | | 4,002,069 | |
1.57%, due 5/28/30 | | | 3,250,000 | | | | 3,250,498 | |
2.03%, due 1/21/28 | | | 3,800,000 | | | | 4,152,346 | |
2.44%, due 10/16/28 | | | 2,300,000 | | | | 2,315,192 | |
| | | | | | | | |
| | | | | | | 36,620,392 | |
| | | | | | | | |
Federal Home Loan Bank 4.4% | |
2.50%, due 12/10/27 | | | 3,000,000 | | | | 3,362,428 | |
2.875%, due 9/13/24 | | | 3,500,000 | | | | 3,864,543 | |
3.00%, due 3/10/28 | | | 1,900,000 | | | | 2,208,564 | |
3.125%, due 9/12/25 | | | 3,100,000 | | | | 3,516,164 | |
3.125%, due 12/12/25 | | | 4,000,000 | | | | 4,605,715 | |
3.25%, due 6/9/28 | | | 4,000,000 | | | | 4,732,817 | |
3.25%, due 11/16/28 | | | 12,550,000 | | | | 14,956,157 | |
| | | | | | | | |
| | | | | | | 37,246,388 | |
| | | | | | | | |
Federal Home Loan Mortgage Corporation 0.7% | |
0.90%, due 6/30/25 | | | 3,325,000 | | | | 3,325,172 | |
6.25%, due 7/15/32 | | | 1,600,000 | | | | 2,515,262 | |
| | | | | | | | |
| | | | | | | 5,840,434 | |
| | | | | | | | |
Federal Home Loan Mortgage Corporation
(Mortgage Pass-Through Securities) 4.2% | |
3.00%, due 4/1/50 | | | 4,928,240 | | | | 5,236,530 | |
3.00%, due 5/1/50 | | | 2,196,344 | | | | 2,367,432 | |
3.50%, due 1/1/47 | | | 2,777,773 | | | | 2,975,851 | |
3.50%, due 10/1/47 | | | 2,198,894 | | | | 2,362,482 | |
3.50%, due 5/1/49 | | | 3,471,770 | | | | 3,696,303 | |
3.50%, due 11/1/49 | | | 3,776,168 | | | | 4,033,596 | |
3.50%, due 3/1/50 | | | 2,382,816 | | | | 2,605,488 | |
3.50%, due 4/1/50 | | | 4,094,168 | | | | 4,442,365 | |
4.00%, due 4/1/48 | | | 292,419 | | | | 311,540 | |
4.00%, due 4/1/50 | | | 4,417,791 | | | | 4,737,796 | |
4.50%, due 4/1/22 | | | 3,287 | | | | 3,462 | |
4.50%, due 4/1/23 | | | 3,526 | | | | 3,723 | |
4.50%, due 11/1/39 | | | 705,837 | | | | 784,611 | |
4.50%, due 8/1/40 | | | 105,371 | | | | 117,102 | |
4.50%, due 9/1/40 | | | 579,113 | | | | 640,892 | |
4.50%, due 9/1/40 | | | 100,933 | | | | 112,252 | |
4.50%, due 11/1/40 | | | 332,389 | | | | 361,361 | |
4.50%, due 7/1/41 | | | 157,577 | | | | 175,170 | |
4.50%, due 2/1/47 | | | 197,482 | | | | 214,612 | |
4.50%, due 10/1/47 | | | 212,510 | | | | 229,684 | |
5.00%, due 3/1/25 | | | 44,131 | | | | 46,413 | |
5.50%, due 9/1/21 | | | 9,308 | | | | 9,415 | |
| | | | | | | | |
| | | Principal
Amount | | | Value | |
Federal Home Loan Mortgage Corporation
(Mortgage Pass-Through Securities) (continued) | |
6.00%, due 7/1/21 | | $ | 17,879 | | | $ | 18,075 | |
6.50%, due 11/1/35 | | | 4,291 | | | | 4,775 | |
6.50%, due 8/1/37 | | | 25,977 | | | | 31,647 | |
| | | | | | | | |
| | | | | | | 35,522,577 | |
| | | | | | | | |
Federal National Mortgage Association 2.3% | |
0.50%, due 6/17/25 | | | 3,200,000 | | | | 3,201,221 | |
0.625%, due 4/22/25 | | | 5,600,000 | | | | 5,645,362 | |
1.625%, due 1/7/25 | | | 625,000 | | | | 658,458 | |
1.75%, due 7/2/24 | | | 2,525,000 | | | | 2,665,736 | |
2.00%, due 1/24/25 | | | 2,650,000 | | | | 2,652,187 | |
6.25%, due 5/15/29 | | | 3,000,000 | | | | 4,347,964 | |
| | | | | | | | |
| | | | | | | 19,170,928 | |
| | | | | | | | |
Federal National Mortgage Association
(Mortgage Pass-Through Securities) 8.9% | |
2.00%, due 3/1/50 TBA (f) | | | 4,000,000 | | | | 4,093,438 | |
2.50%, due 5/1/43 | | | 484,018 | | | | 512,636 | |
2.50%, due 5/1/50 | | | 3,191,001 | | | | 3,329,437 | |
3.00%, due 2/1/47 | | | 2,170,425 | | | | 2,295,716 | |
3.00%, due 7/1/47 | | | 1,160,983 | | | | 1,228,184 | |
3.00%, due 5/1/48 | | | 3,814,213 | | | | 4,046,320 | |
3.00%, due 7/1/48 | | | 1,378,592 | | | | 1,458,520 | |
3.00%, due 9/1/49 | | | 2,364,447 | | | | 2,503,253 | |
3.00%, due 3/1/50 | | | 3,782,310 | | | | 3,986,265 | |
3.00%, due 3/1/50 | | | 2,474,538 | | | | 2,608,824 | |
3.00%, due 3/1/50 | | | 4,035,546 | | | | 4,269,260 | |
3.00%, due 5/1/50 | | | 2,595,953 | | | | 2,736,831 | |
3.50%, due 10/1/47 | | | 1,596,146 | | | | 1,690,692 | |
3.50%, due 8/1/49 | | | 5,330,246 | | | | 5,822,307 | |
3.50%, due 3/1/50 | | | 7,300,267 | | | | 7,949,043 | |
4.00%, due 2/1/45 | | | 1,215,239 | | | | 1,336,073 | |
4.00%, due 6/1/46 | | | 1,893,248 | | | | 2,076,431 | |
4.00%, due 11/1/46 | | | 6,104,404 | | | | 6,718,212 | |
4.00%, due 4/1/47 | | | 6,505,188 | | | | 7,082,905 | |
4.00%, due 6/1/47 | | | 83,384 | | | | 89,004 | |
4.00%, due 1/1/48 | | | 885,474 | | | | 966,545 | |
4.00%, due 3/1/48 | | | 149,993 | | | | 159,834 | |
4.00%, due 7/1/48 | | | 2,357,990 | | | | 2,558,213 | |
4.50%, due 5/1/24 | | | 141,085 | | | | 150,224 | |
4.50%, due 11/1/35 | | | 140,065 | | | | 152,975 | |
4.50%, due 4/1/41 | | | 367,097 | | | | 406,287 | |
4.50%, due 5/1/41 | | | 550,769 | | | | 612,738 | |
4.50%, due 7/1/41 | | | 451,412 | | | | 502,516 | |
4.50%, due 9/1/41 | | | 140,413 | | | | 153,882 | |
4.50%, due 3/1/44 | | | 217,329 | | | | 241,876 | |
4.50%, due 8/1/44 | | | 1,039,548 | | | | 1,156,955 | |
4.50%, due 11/1/44 | | | 181,858 | | | | 197,445 | |
4.50%, due 3/1/46 | | | 89,321 | | | | 96,665 | |
4.50%, due 12/1/46 | | | 237,148 | | | | 258,206 | |
4.50%, due 2/1/47 | | | 65,315 | | | | 70,402 | |
| | | | | | |
The notes to the financial statements are an integral part of,
and should be read in conjunction with, the financial statements. | | | | | 17 | |
Portfolio of Investments June 30, 2020 (Unaudited) (continued)
| | | | | | | | |
| | | Principal
Amount | | | Value | |
| U.S. Government & Federal Agencies (continued) | |
Federal National Mortgage Association
(Mortgage Pass-Through Securities) (continued) | |
4.50%, due 7/1/47 | | $ | 269,783 | | | $ | 292,121 | |
4.50%, due 2/1/48 | | | 173,241 | | | | 186,628 | |
5.00%, due 12/1/23 | | | 63,440 | | | | 66,661 | |
5.00%, due 12/1/23 | | | 15,624 | | | | 16,430 | |
5.50%, due 1/1/21 | | | 235 | | | | 237 | |
5.50%, due 12/1/21 | | | 1,581 | | | | 1,616 | |
5.50%, due 1/1/22 | | | 6,283 | | | | 6,419 | |
5.50%, due 2/1/22 | | | 393 | | | | 401 | |
6.50%, due 10/1/36 | | | 17,423 | | | | 21,002 | |
6.50%, due 10/1/36 | | | 12,553 | | | | 14,226 | |
6.50%, due 8/1/37 | | | 4,759 | | | | 5,455 | |
7.00%, due 9/1/37 | | | 42,265 | | | | 51,076 | |
7.00%, due 10/1/37 | | | 548 | | | | 637 | |
7.00%, due 11/1/37 | | | 6,151 | | | | 7,334 | |
7.50%, due 7/1/28 | | | 10,865 | | | | 12,082 | |
| | | | | | | | |
| | | | | | | 74,200,439 | |
| | | | | | | | |
Government National Mortgage Association
(Mortgage Pass-Through Securities) 2.8% | |
2.50%, due 12/1/49 TBA (f) | | | 2,000,000 | | | | 2,105,312 | |
3.00%, due 12/1/49 TBA (f) | | | 6,250,000 | | | | 6,621,826 | |
3.50%, due 6/20/42 | | | 716,638 | | | | 779,149 | |
3.50%, due 8/20/43 | | | 968,975 | | | | 1,050,918 | |
3.50%, due 11/20/43 | | | 940,414 | | | | 1,016,693 | |
3.50%, due 4/20/45 | | | 664,507 | | | | 711,340 | |
3.50%, due 12/20/45 | | | 1,096,019 | | | | 1,173,580 | |
3.50%, due 2/20/46 | | | 513,151 | | | | 553,217 | |
3.50%, due 10/20/46 | | | 738,948 | | | | 791,767 | |
3.50%, due 11/20/46 | | | 859,337 | | | | 919,074 | |
3.50%, due 1/20/47 | | | 735,854 | | | | 782,593 | |
3.50%, due 5/20/47 | | | 1,093,989 | | | | 1,166,755 | |
4.00%, due 1/20/42 | | | 851,707 | | | | 938,925 | |
4.00%, due 2/20/42 | | | 331,776 | | | | 365,688 | |
4.00%, due 8/20/43 | | | 1,103,471 | | | | 1,214,807 | |
4.00%, due 10/20/43 | | | 317,184 | | | | 347,743 | |
4.00%, due 3/15/44 | | | 41,503 | | | | 45,127 | |
4.00%, due 6/20/44 | | | 303,878 | | | | 331,386 | |
4.00%, due 7/15/44 | | | 280,428 | | | | 303,495 | |
4.00%, due 8/20/44 | | | 271,796 | | | | 296,231 | |
4.00%, due 9/20/44 | | | 280,709 | | | | 305,872 | |
4.00%, due 12/20/44 | | | 189,249 | | | | 206,059 | |
4.00%, due 1/20/45 | | | 147,435 | | | | 160,540 | |
4.00%, due 4/20/45 | | | 191,918 | | | | 208,900 | |
4.00%, due 7/15/45 | | | 174,354 | | | | 188,835 | |
4.00%, due 9/20/45 | | | 94,037 | | | | 101,853 | |
4.50%, due 6/15/39 | | | 777,161 | | | | 866,562 | |
4.50%, due 6/15/40 | | | 236,775 | | | | 264,036 | |
| | | | | | | | |
| | | | | | | 23,818,283 | |
| | | | | | | | |
| | | | | | | | |
| | | Principal
Amount | | | Value | |
Tennessee Valley Authority 0.4% | |
5.25%, due 9/15/39 | | $ | 2,000,000 | | | $ | 3,081,720 | |
| | | | | | | | |
|
United States Treasury Bonds 4.9% | |
2.00%, due 2/15/50 | | | 35,590,000 | | | | 40,758,891 | |
4.25%, due 5/15/39 | | | 350,000 | | | | 540,764 | |
| | | | | | | | |
| | | | | | | 41,299,655 | |
| | | | | | | | |
United States Treasury Notes 5.5% | |
0.125%, due 6/30/22 | | | 5,425,000 | | | | 5,421,609 | |
0.25%, due 6/15/23 | | | 1,925,000 | | | | 1,929,061 | |
0.25%, due 6/30/25 | | | 5,250,000 | | | | 5,239,746 | |
0.50%, due 6/30/27 | | | 5,095,000 | | | | 5,099,179 | |
0.625%, due 5/15/30 | | | 14,683,000 | | | | 14,642,278 | |
1.75%, due 7/15/22 | | | 12,925,000 | | | | 13,340,519 | |
| | | | | | | | |
| | | | | | | 45,672,392 | |
| | | | | | | | |
Total U.S. Government & Federal Agencies
(Cost $313,829,696) | | | | | | | 322,473,208 | |
| | | | | | | | |
Total Long-Term Bonds
(Cost $800,020,671) | | | | | | | 830,355,344 | |
| | | | | | | | |
|
| Short-Term Investments 2.6% | |
Commercial Paper 1.4% | |
NSTAR Electric Co.
0.051%, due 7/1/20 (g) | | | 12,000,000 | | | | 12,000,000 | |
| | | | | | | | |
Total Commercial Paper
(Cost $12,000,000) | | | | | | | 12,000,000 | |
| | | | | | | | |
|
Repurchase Agreement 0.3% | |
RBC Capital Markets
0.07%, dated 6/30/20
due 7/1/20
Proceeds at Maturity $2,472,005 (Collateralized by United States Treasury Note with rates between 0.50% and 4.375% and maturity dates between 10/31/26 and 11/15/39, with a Principal Amount of $2,191,600 and a Market Value of $2,521,492) | | | 2,472,000 | | | | 2,472,000 | |
| | | | | | | | |
Total Repurchase Agreement
(Cost $2,472,000) | | | | | | | 2,472,000 | |
| | | | | | | | |
| | | | |
| 18 | | MainStay VP Bond Portfolio | | The notes to the financial statements are an integral part of,
and should be read in conjunction with, the financial statements. |
| | | | | | | | |
| | | Principal
Amount | | | Value | |
| Short-Term Investments (continued) | |
U.S. Government & Federal Agencies 0.9% | |
United States Treasury Bills
0.035%, due 7/2/20 (g) | | $ | 8,000,000 | | | $ | 7,999,985 | |
| | | | | | | | |
Total U.S. Government & Federal Agencies
(Cost $7,999,985) | | | | | | | 7,999,985 | |
| | | | | | | | |
Total Short-Term Investments
(Cost $22,471,985) | | | | | | | 22,471,985 | |
| | | | | | | | |
Total Investments
(Cost $822,492,656) | | | 101.8 | % | | | 852,827,329 | |
Other Assets, Less Liabilities | | | (1.8 | ) | | | (14,923,983 | ) |
Net Assets | | | 100.0 | % | | $ | 837,903,346 | |
| † | Percentages indicated are based on Portfolio net assets. |
| (a) | May be sold to institutional investors only under Rule 144A or securities offered pursuant to Section 4(a)(2) of the Securities Act of 1933, as amended. |
| (b) | Step coupon—Rate shown was the rate in effect as of June 30, 2020. |
| (c) | Floating rate—Rate shown was the rate in effect as of June 30, 2020. |
| (d) | Fixed to floating rate—Rate shown was the rate in effect as of June 30, 2020. |
| (e) | Coupon rate may change based on changes of the underlying collateral or prepayments of principal. Rate shown was the rate in effect as of June 30, 2020. |
| (f) | TBA—Securities purchased on a forward commitment basis with an approximate principal amount and maturity date. The actual principal amount and maturity date will be determined upon settlement. As of June 30, 2020, the total net market value of these securities was $12,820,576, which represented 1.5% of the Portfolio’s net assets. All or a portion of these securities are a part of a mortgage dollar roll agreement. |
| (g) | Interest rate shown represents yield to maturity. |
Futures Contracts
As of June 30, 2020, the Portfolio held the following futures contracts1:
| | | | | | | | | | | | | | | | | | | | |
Type | | Number of
Contracts | | | Expiration
Date | | | Value at
Trade Date | | | Current
Notional
Amount | | | Unrealized Appreciation
(Depreciation)2 | |
| | | | | |
Long Contracts | | | | | | | | | | | | | | | | | | | | |
| 2-Year United States Treasury Note | | | 237 | | | | September 2020 | | | $ | 52,328,290 | | | $ | 52,336,266 | | | $ | 7,976 | |
| 5-Year United States Treasury Note | | | 287 | | | | September 2020 | | | | 36,021,221 | | | | 36,088,008 | | | | 66,787 | |
| 10-Year United States Treasury Note | | | 44 | | | | September 2020 | | | | 6,120,890 | | | | 6,123,562 | | | | 2,672 | |
| United States Treasury Ultra Bond | | | 90 | | | | September 2020 | | | | 19,788,977 | | | | 19,634,063 | | | | (154,914 | ) |
| | | | | | | | | | | | | | | | | | | | |
| Total Long Contracts | | | | | | | | | | | | | | | | | | | (77,479 | ) |
| | | | | | | | | | | | | | | | | | | | |
| | | | | |
Short Contracts | | | | | | | | | | | | | | | | | | | | |
| 10-Year United States Treasury Ultra Note | | | (269 | ) | | | September 2020 | | | | (42,167,628 | ) | | | (42,363,297 | ) | | | (195,669 | ) |
| | | | | | | | | | | | | | | | | | | | |
| Total Short Contracts | | | | | | | | | | | | | | | | | | | (195,669 | ) |
| | | | | | | | | | | | | | | | | | | | |
| Net Unrealized Depreciation | | | | | | | | | | | | | | | | | | $ | (273,148 | ) |
| | | | | | | | | | | | | | | | | | | | |
| 1. | As of June 30, 2020, cash in the amount of $775,740 was on deposit with a broker or futures commission merchant for futures transactions. |
| 2. | Represents the difference between the value of the contracts at the time they were opened and the value as of June 30, 2020. |
The following abbreviations are used in the preceding pages:
LIBOR—London Interbank Offered Rate
REIT—Real Estate Investment Trust
SOFR—Secured Overnight Financing Rate
TBA—To Be Announced
| | | | | | |
The notes to the financial statements are an integral part of,
and should be read in conjunction with, the financial statements. | | | | | 19 | |
Portfolio of Investments June 30, 2020 (Unaudited) (continued)
The following is a summary of the fair valuations according to the inputs used as of June 30, 2020, for valuing the Portfolio’s assets and liabilities:
| | | | | | | | | | | | | | | | |
Description | | Quoted
Prices in
Active
Markets for
Identical
Assets
(Level 1) | | | Significant
Other
Observable
Inputs
(Level 2) | | | Significant
Unobservable
Inputs
(Level 3) | | | Total | |
| | | | |
Asset Valuation Inputs | | | | | | | | | | | | | | | | |
| Investments in Securities (a) | | | | | | | | | | | | | | | | |
| Long-Term Bonds | | | | | | | | | | | | | | | | |
Asset-Backed Securities | | $ | — | | | $ | 114,781,504 | | | $ | — | | | $ | 114,781,504 | |
Corporate Bonds | | | — | | | | 321,458,667 | | | | — | | | | 321,458,667 | |
Foreign Government Bonds | | | — | | | | 2,300,022 | | | | — | | | | 2,300,022 | |
Mortgage-Backed Securities | | | — | | | | 64,164,783 | | | | — | | | | 64,164,783 | |
Municipal Bonds | | | — | | | | 5,177,160 | | | | — | | | | 5,177,160 | |
U.S. Government & Federal Agencies | | | — | | | | 322,473,208 | | | | — | | | | 322,473,208 | |
| | | | | | | | | | | | | | | | |
| Total Long-Term Bonds | | | — | | | | 830,355,344 | | | | — | | | | 830,355,344 | |
| | | | | | | | | | | | | | | | |
| Short-Term Investments | | | | | | | | | | | | | | | | |
Commercial Paper | | | — | | | | 12,000,000 | | | | — | | | | 12,000,000 | |
Repurchase Agreement | | | — | | | | 2,472,000 | | | | — | | | | 2,472,000 | |
U.S. Government & Federal Agencies | | | — | | | | 7,999,985 | | | | — | | | | 7,999,985 | |
| | | | | | | | | | | | | | | | |
| Total Short-Term Investments | | | — | | | | 22,471,985 | | | | — | | | | 22,471,985 | |
| | | | | | | | | | | | | | | | |
| Total Investments in Securities | | | — | | | | 852,827,329 | | | | — | | | | 852,827,329 | |
| Other Financial Instruments | | | | | | | | | | | | | | | | |
Futures Contracts (b) | | | 77,435 | | | | — | | | | — | | | | 77,435 | |
| | | | | | | | | | | | | | | | |
| Total Investments in Securities and Other Financial Instruments | | $ | 77,435 | | | $ | 852,827,329 | | | $ | — | | | $ | 852,904,764 | |
| | | | | | | | | | | | | | | | |
| | | | |
Liability Valuation Inputs | | | | | | | | | | | | | | | | |
| Other Financial Instruments | | | | | | | | | | | | | | | | |
Futures Contracts (b) | | $ | (350,583 | ) | | $ | — | | | $ | — | | | $ | (350,583 | ) |
| | | | | | | | | | | | | | | | |
| Total Investments in Securities Sold Short and Other Financial Instruments | | $ | (350,583 | ) | | $ | — | | | $ | — | | | $ | (350,583 | ) |
| | | | | | | | | | | | | | | | |
| (a) | For a complete listing of investments and their industries, see the Portfolio of Investments. |
| (b) | The value listed for these securities reflects unrealized appreciation (depreciation) as shown on the Portfolio of Investments. |
| | | | |
| 20 | | MainStay VP Bond Portfolio | | The notes to the financial statements are an integral part of,
and should be read in conjunction with, the financial statements. |
Statement of Assets and Liabilities as of June 30, 2020 (Unaudited)
| | | | |
| Assets | | | | |
Investment in securities, at value
(identified cost $822,492,656) | | $ | 852,827,329 | |
Cash collateral on deposit at broker for futures contracts | | | 775,740 | |
Cash | | | 10,063 | |
Receivables: | | | | |
Investment securities sold | | | 29,887,447 | |
Interest | | | 4,404,294 | |
Portfolio shares sold | | | 1,384,552 | |
Other assets | | | 4,857 | |
| | | | |
Total assets | | | 889,294,282 | |
| | | | |
| |
| Liabilities | | | | |
Payables: | | | | |
Investment securities purchased | | | 50,441,955 | |
Manager (See Note 3) | | | 330,383 | |
Portfolio shares redeemed | | | 253,660 | |
Variation margin on futures contracts | | | 172,543 | |
NYLIFE Distributors (See Note 3) | | | 97,080 | |
Shareholder communication | | | 41,278 | |
Professional fees | | | 32,609 | |
Custodian | | | 15,056 | |
Interest on investments sold short | | | 1,733 | |
Trustees | | | 908 | |
Accrued expenses | | | 3,731 | |
| | | | |
Total liabilities | | | 51,390,936 | |
| | | | |
Net assets | | $ | 837,903,346 | |
| | | | |
| |
| Composition of Net Assets | | | | |
Shares of beneficial interest outstanding (par value of $.001 per share) unlimited number of shares authorized | | $ | 54,899 | |
Additional paid-in capital | | | 758,478,636 | |
| | | | |
| | | 758,533,535 | |
Total distributable earnings (loss) | | | 79,369,811 | |
| | | | |
Net assets | | $ | 837,903,346 | |
| | | | |
| | | | |
Initial Class | | | | |
Net assets applicable to outstanding shares | | $ | 355,854,614 | |
| | | | |
Shares of beneficial interest outstanding | | | 23,153,835 | |
| | | | |
Net asset value per share outstanding | | $ | 15.37 | |
| | | | |
Service Class | | | | |
Net assets applicable to outstanding shares | | $ | 482,048,732 | |
| | | | |
Shares of beneficial interest outstanding | | | 31,744,921 | |
| | | | |
Net asset value per share outstanding | | $ | 15.19 | |
| | | | |
| | | | | | |
The notes to the financial statements are an integral part of,
and should be read in conjunction with, the financial statements. | | | | | 21 | |
Statement of Operations for the six months ended June 30, 2020 (Unaudited)
| | | | |
| Investment Income (Loss) | | | | |
Income | | | | |
Interest | | $ | 10,552,948 | |
Dividends | | | 130,742 | |
Securities lending | | | 4,186 | |
Other | | | 3,477 | |
| | | | |
Total income | | | 10,691,353 | |
| | | | |
Expenses | | | | |
Manager (See Note 3) | | | 1,959,664 | |
Distribution/Service—Service Class (See Note 3) | | | 571,723 | |
Professional fees | | | 61,933 | |
Shareholder communication | | | 44,485 | |
Custodian | | | 23,835 | |
Trustees | | | 9,398 | |
Miscellaneous | | | 14,511 | |
| | | | |
Total expenses | | | 2,685,549 | |
| | | | |
Net investment income (loss) | | | 8,005,804 | |
| | | | |
| |
| Realized and Unrealized Gain (Loss) on Investments and Futures Contracts | | | | |
Net realized gain (loss) on: | | | | |
Investment transactions | | | 18,427,839 | |
Futures transactions | | | 3,076,114 | |
| | | | |
Net realized gain (loss) on investments and futures transactions | | | 21,503,953 | |
| | | | |
Net change in unrealized appreciation (depreciation) on: | | | | |
Investments | | | 11,225,810 | |
Futures contracts | | | 377,248 | |
| | | | |
Net change in unrealized appreciation (depreciation) on investments and futures contracts | | | 11,603,058 | |
| | | | |
Net realized and unrealized gain (loss) on investments and futures transactions | | | 33,107,011 | |
| | | | |
Net increase (decrease) in net assets resulting from operations | | $ | 41,112,815 | |
| | | | |
| | | | |
| 22 | | MainStay VP Bond Portfolio | | The notes to the financial statements are an integral part of,
and should be read in conjunction with, the financial statements. |
Statements of Changes in Net Assets
for the six months ended June 30, 2020 (Unaudited) and the year ended December 31, 2019
| | | | | | | | |
| | | 2020 | | | 2019 | |
| Increase (Decrease) in Net Assets | | | | | |
Operations: | | | | | | | | |
Net investment income (loss) | | $ | 8,005,804 | | | $ | 17,203,511 | |
Net realized gain (loss) on investments and futures transactions | | | 21,503,953 | | | | 14,221,327 | |
Net change in unrealized appreciation (depreciation) on investments and futures contracts | | | 11,603,058 | | | | 27,013,093 | |
| | | | |
Net increase (decrease) in net assets resulting from operations | | | 41,112,815 | | | | 58,437,931 | |
| | | | |
Distributions to shareholders: | | | | | | | | |
Initial Class | | | — | | | | (9,276,310 | ) |
Service Class | | | — | | | | (10,153,516 | ) |
| | | | |
Total distributions to shareholders | | | — | | | | (19,429,826 | ) |
| | | | |
Capital share transactions: | | | | | | | | |
Net proceeds from sale of shares | | | 121,545,491 | | | | 183,440,197 | |
Net asset value of shares issued to shareholders in reinvestment of distributions | | | — | | | | 19,429,826 | |
Cost of shares redeemed | | | (93,501,424 | ) | | | (103,913,368 | ) |
| | | | |
Increase (decrease) in net assets derived from capital share transactions | | | 28,044,067 | | | | 98,956,655 | |
| | | | |
Net increase (decrease) in net assets | | | 69,156,882 | | | | 137,964,760 | |
| | |
| Net Assets | | | | | | | | |
Beginning of period | | | 768,746,464 | | | | 630,781,704 | |
| | | | |
End of period | | $ | 837,903,346 | | | $ | 768,746,464 | |
| | | | |
| | | | | | |
The notes to the financial statements are an integral part of,
and should be read in conjunction with, the financial statements. | | | | | 23 | |
Financial Highlights selected per share data and ratios
| | | | | | | | | | | | | | | | | | | | | | | | | | | | |
| | | |
| | | Six months
ended
June 30, | | | | | | Year ended December 31, | |
| | | | | | | |
| Initial Class | | 2020* | | | | | | 2019 | | | 2018 | | | 2017 | | | 2016 | | | 2015 | |
| | | | | | | |
Net asset value at beginning of period | | $ | 14.57 | | | | | | | $ | 13.72 | | | $ | 14.31 | | | $ | 14.26 | | | $ | 14.19 | | | $ | 14.52 | |
| | | | | | | | | | | | | | | | | | | | | | | | | | | | |
| | | | | | | |
Net investment income (loss) (a) | | | 0.16 | | | | | | | | 0.37 | | | | 0.38 | | | | 0.32 | | | | 0.32 | | | | 0.31 | |
| | | | | | | |
Net realized and unrealized gain (loss) on investments | | | 0.64 | | | | | | | | 0.88 | | | | (0.53 | ) | | | 0.23 | | | | 0.20 | | | | (0.27 | ) |
| | | | | | | | | | | | | | | | | | | | | | | | | | | | |
| | | | | | | |
Total from investment operations | | | 0.80 | | | | | | | | 1.25 | | | | (0.15 | ) | | | 0.55 | | | | 0.52 | | | | 0.04 | |
| | | | | | | | | | | | | | | | | | | | | | | | | | | | |
| | | | | | | |
| Less distributions: | | | | | | | | | | | | | | | | | | | | | | | | | | | | |
| | | | | | | |
From net investment income | | | — | | | | | | | | (0.40 | ) | | | (0.40 | ) | | | (0.37 | ) | | | (0.39 | ) | | | (0.36 | ) |
| | | | | | | |
From net realized gain on investments | | | — | | | | | | | | — | | | | (0.04 | ) | | | (0.13 | ) | | | (0.06 | ) | | | (0.01 | ) |
| | | | | | | | | | | | | | | | | | | | | | | | | | | | |
| | | | | | | |
Total distributions | | | — | | | | | | | | (0.40 | ) | | | (0.44 | ) | | | (0.50 | ) | | | (0.45 | ) | | | (0.37 | ) |
| | | | | | | | | | | | | | | | | | | | | | | | | | | | |
| | | | | | | |
Net asset value at end of period | | $ | 15.37 | | | | | | | $ | 14.57 | | | $ | 13.72 | | | $ | 14.31 | | | $ | 14.26 | | | $ | 14.19 | |
| | | | | | | | | | | | | | | | | | | | | | | | | | | | |
| | | | | | | |
Total investment return (b) | | | 5.49 | %(c) | | | | | | | 9.12 | % | | | (1.00 | %) | | | 3.85 | % | | | 3.53 | % | | | 0.22 | % |
| | | | | | | |
| Ratios (to average net assets)/Supplemental Data: | | | | | | | | | | | | | | | | | | | | | | | | | | | | |
| | | | | | | |
Net investment income (loss) | | | 2.15 | %†† | | | | | | | 2.60 | % | | | 2.76 | % | | | 2.23 | % | | | 2.16 | %(d) | | | 2.14 | % |
| | | | | | | |
Net expenses (e) | | | 0.53 | %†† | | | | | | | 0.54 | % | | | 0.53 | % | | | 0.52 | % | | | 0.51 | %(f) | | | 0.52 | % |
| | | | | | | |
Expenses (before waiver/reimbursement) (e) | | | 0.53 | %†† | | | | | | | 0.54 | % | | | 0.53 | % | | | 0.52 | % | | | 0.53 | % | | | 0.52 | % |
| | | | | | | |
Portfolio turnover rate (g) | | | 151 | % | | | | | | | 204 | % | | | 148 | % | | | 209 | % | | | 258 | % | | | 326 | % |
| | | | | | | |
Net assets at end of period (in 000’s) | | $ | 355,855 | | | | | | | $ | 341,408 | | | $ | 307,682 | | | $ | 517,067 | | | $ | 538,979 | | | $ | 707,265 | |
| (a) | Per share data based on average shares outstanding during the period. |
| (b) | Total return does not reflect any deduction of sales charges, mortality and expense charges, contract charges or administrative charges. For periods of less than one year, total return is not annualized. |
| (c) | Total investment return may reflect adjustments to conform to generally accepted accounting principles. |
| (d) | Without the custody fee reimbursement, net investment income (loss) would have been 2.14%. |
| (e) | In addition to the fees and expenses which the Portfolio bears directly, it also indirectly bears a pro-rata share of the fees and expenses of the underlying funds in which it invests. Such indirect expenses are not included in the above expense ratios. |
| (f) | Without the custody fee reimbursement, net expenses would have been 0.53%. |
| (g) | The portfolio turnover rates not including mortgage dollar rolls were 149%, 197%, 133%, 190%, 223% and 191% for the six months ended June 30, 2020 and for the years ended December 31, 2019, 2018, 2017, 2016 and 2015, respectively. |
| | | | |
| 24 | | MainStay VP Bond Portfolio | | The notes to the financial statements are an integral part of,
and should be read in conjunction with, the financial statements. |
Financial Highlights selected per share data and ratios
| | | | | | | | | | | | | | | | | | | | | | | | | | | | |
| | | |
| | | Six months
ended
June 30, | | | | | | Year ended December 31, | |
| | | | | | | |
| Service Class | | 2020* | | | | | | 2019 | | | 2018 | | | 2017 | | | 2016 | | | 2015 | |
| | | | | | | |
Net asset value at beginning of period | | $ | 14.41 | | | | | | | $ | 13.58 | | | $ | 14.16 | | | $ | 14.12 | | | $ | 14.06 | | | $ | 14.39 | |
| | | | | | | | | | | | | | | | | | | | | | | | | | | | |
| | | | | | | |
Net investment income (loss) (a) | | | 0.14 | | | | | | | | 0.33 | | | | 0.35 | | | | 0.28 | | | | 0.28 | | | | 0.27 | |
| | | | | | | |
Net realized and unrealized gain (loss) on investments | | | 0.64 | | | | | | | | 0.87 | | | | (0.53 | ) | | | 0.22 | | | | 0.19 | | | | (0.27 | ) |
| | | | | | | | | | | | | | | | | | | | | | | | | | | | |
| | | | | | | |
Total from investment operations | | | 0.78 | | | | | | | | 1.20 | | | | (0.18 | ) | | | 0.50 | | | | 0.47 | | | | (0.00 | )‡ |
| | | | | | | | | | | | | | | | | | | | | | | | | | | | |
| | | | | | | |
| Less distributions: | | | | | | | | | | | | | | | | | | | | | | | | | | | | |
| | | | | | | |
From net investment income | | | — | | | | | | | | (0.37 | ) | | | (0.36 | ) | | | (0.33 | ) | | | (0.35 | ) | | | (0.32 | ) |
| | | | | | | |
From net realized gain on investments | | | — | | | | | | | | — | | | | (0.04 | ) | | | (0.13 | ) | | | (0.06 | ) | | | (0.01 | ) |
| | | | | | | | | | | | | | | | | | | | | | | | | | | | |
| | | | | | | |
Total distributions | | | — | | | | | | | | (0.37 | ) | | | (0.40 | ) | | | (0.46 | ) | | | (0.41 | ) | | | (0.33 | ) |
| | | | | | | | | | | | | | | | | | | | | | | | | | | | |
| | | | | | | |
Net asset value at end of period | | $ | 15.19 | | | | | | | $ | 14.41 | | | $ | 13.58 | | | $ | 14.16 | | | $ | 14.12 | | | $ | 14.06 | |
| | | | | | | | | | | | | | | | | | | | | | | | | | | | |
| | | | | | | |
Total investment return (b) | | | 5.41 | %(c) | | | | | | | 8.85 | % | | | (1.25 | %) | | | 3.59 | % | | | 3.27 | % | | | (0.03 | %) |
| | | | | | | |
| Ratios (to average net assets)/Supplemental Data: | | | | | | | | | | | | | | | | | | | | | | | | | | | | |
| | | | | | | |
Net investment income (loss) | | | 1.90 | %†† | | | | | | | 2.34 | % | | | 2.53 | % | | | 1.98 | % | | | 1.90 | %(d) | | | 1.89 | % |
| | | | | | | |
Net expenses (e) | | | 0.78 | %†† | | | | | | | 0.79 | % | | | 0.78 | % | | | 0.77 | % | | | 0.76 | %(f) | | | 0.77 | % |
| | | | | | | |
Expenses (before waiver/reimbursement) (e) | | | 0.78 | %†† | | | | | | | 0.79 | % | | | 0.78 | % | | | 0.77 | % | | | 0.78 | % | | | 0.77 | % |
| | | | | | | |
Portfolio turnover rate (g) | | | 151 | % | | | | | | | 204 | % | | | 148 | % | | | 209 | % | | | 258 | % | | | 326 | % |
| | | | | | | |
Net assets at end of period (in 000’s) | | $ | 482,048 | | | | | | | $ | 427,338 | | | $ | 323,100 | | | $ | 333,530 | | | $ | 351,848 | | | $ | 339,529 | |
| ‡ | Less than one cent per share. |
| (a) | Per share data based on average shares outstanding during the period. |
| (b) | Total return does not reflect any deduction of sales charges, mortality and expense charges, contract charges or administrative charges. For periods of less than one year, total return is not annualized. |
| (c) | Total investment return may reflect adjustments to conform to generally accepted accounting principles. |
| (d) | Without the custody fee reimbursement, net investment income (loss) would have been 1.88%. |
| (e) | In addition to the fees and expenses which the Portfolio bears directly, it also indirectly bears a pro-rata share of the fees and expenses of the underlying funds in which it invests. Such indirect expenses are not included in the above expense ratios. |
| (f) | Without the custody fee reimbursement, net expenses would have been 0.78%. |
| (g) | The portfolio turnover rates not including mortgage dollar rolls were 149%, 197%, 133%, 190%, 223% and 191% for the six months ended June 30, 2020 and for the years ended December 31, 2019, 2018, 2017, 2016 and 2015, respectively. |
| | | | | | |
The notes to the financial statements are an integral part of,
and should be read in conjunction with, the financial statements. | | | | | 25 | |
Notes to Financial Statements (Unaudited)
Note 1–Organization and Business
MainStay VP Funds Trust (the “Fund”) was organized as a Delaware statutory trust on February 1, 2011. The Fund is registered under the Investment Company Act of 1940, as amended (the “1940 Act”), as an open-end management investment company. The Fund is comprised of thirty-one separate series (collectively referred to as the “Portfolios”). These financial statements and notes relate to the MainStay VP Bond Portfolio (the “Portfolio”), a “diversified” portfolio, as that term is defined in the 1940 Act, as interpreted or modified by regulatory authorities having jurisdiction, from time to time.
Shares of the Portfolio are currently offered to certain separate accounts to fund variable annuity policies and variable universal life insurance policies issued by New York Life Insurance and Annuity Corporation (“NYLIAC”), a wholly-owned subsidiary of New York Life Insurance Company (“New York Life”) and may also be offered to fund variable annuity policies and variable universal life insurance policies issued by other insurance companies. NYLIAC allocates shares of the Portfolios to, among others, certain NYLIAC separate accounts. Shares of the Portfolio are also offered to the MainStay VP Conservative Allocation Portfolio, MainStay VP Moderate Allocation Portfolio, MainStay VP Moderate Growth Allocation Portfolio and MainStay VP Growth Allocation Portfolio, which operate as “funds-of-funds,” and other variable insurance funds.
The Portfolio currently offers two classes of shares. Initial Class shares commenced operations on January 23, 1984. Service Class shares commenced operations on June 4, 2003. Shares of the Portfolio are offered and are redeemed at a price equal to their respective net asset value (“NAV”) per share. No sales or redemption charge is applicable to the purchase or redemption of the Portfolio’s shares. Under the terms of the Fund’s multiple class plan, adopted pursuant to Rule 18f-3 under the 1940 Act, the classes differ in that, among other things, Service Class shares of the Portfolio pay a combined distribution and service fee of 0.25% of average daily net assets attributable to Service Class shares of the Portfolio to the Distributor (as defined in Note 3(B)) pursuant to a plan adopted in accordance with Rule 12b-1 under the 1940 Act. Contract owners of variable annuity contracts purchased after June 2, 2003, are permitted to invest only in the Service Class shares.
The Portfolio’s investment objective is to seek total return.
Note 2–Significant Accounting Policies
The Portfolio is an investment company and accordingly follows the investment company accounting and reporting guidance of the Financial Accounting Standards Board (“FASB”) Accounting Standard Codification Topic 946 Financial Services—Investment Companies. The Portfolio prepares its financial statements in accordance with generally accepted accounting principles (“GAAP”) in the United States of America and follows the significant accounting policies described below.
(A) Securities Valuation. Investments are usually valued as of the close of regular trading on the New York Stock Exchange (the “Exchange”) (usually 4:00 p.m. Eastern time) on each day the Portfolio is open for business (“valuation date”).
The Board of Trustees of the Fund (the “Board”) adopted procedures establishing methodologies for the valuation of the Portfolio’s securities
and other assets and delegated the responsibility for valuation determinations under those procedures to the Valuation Committee of the Fund (the “Valuation Committee”). The procedures state that, subject to the oversight of the Board and unless otherwise noted, the responsibility for the day-to-day valuation of portfolio assets (including fair value measurements for the Portfolio’s assets and liabilities) rests with New York Life Investment Management LLC (“New York Life Investments” or the “Manager”), aided to whatever extent necessary by the Subadvisor (as defined in Note 3(A)). To assess the appropriateness of security valuations, the Manager, the Subadvisor or the Portfolio’s third-party service provider, who is subject to oversight by the Manager, regularly compares prior day prices, prices on comparable securities and the sale prices to the prior and current day prices and challenges prices with changes exceeding certain tolerance levels with third-party pricing services or broker sources.
The Board authorized the Valuation Committee to appoint a Valuation Subcommittee (the “Subcommittee”) to establish the prices of securities for which market quotations are not readily available or the prices of which are not otherwise readily determinable under the procedures. The Subcommittee meets (in person, via electronic mail or via teleconference) on an as-needed basis. The Valuation Committee meets to ensure that actions taken by the Subcommittee were appropriate.
For those securities valued through either a standardized fair valuation methodology or a fair valuation measurement, the Subcommittee deals with such valuation and the Valuation Committee reviews and affirms, if appropriate, the reasonableness of the valuation based on such methodologies and measurements on a regular basis after considering information that is reasonably available and deemed relevant by the Valuation Committee. Any action taken by the Subcommittee with respect to the valuation of a portfolio security or other asset is submitted for review and ratification (if appropriate) to the Valuation Committee and the Board at the next regularly scheduled meeting.
“Fair value” is defined as the price the Portfolio would reasonably expect to receive upon selling an asset or liability in an orderly transaction to an independent buyer in the principal or most advantageous market for the asset or liability. Fair value measurements are determined within a framework that establishes a three-tier hierarchy that maximizes the use of observable market data and minimizes the use of unobservable inputs to establish a classification of fair value measurements for disclosure purposes. “Inputs” refer broadly to the assumptions that market participants would use in pricing the asset or liability, including assumptions about risk, such as the risk inherent in a particular valuation technique used to measure fair value using a pricing model and/or the risk inherent in the inputs for the valuation technique. Inputs may be observable or unobservable. Observable inputs reflect the assumptions market participants would use in pricing the asset or liability based on market data obtained from sources independent of the Portfolio. Unobservable inputs reflect the Portfolio’s own assumptions about the assumptions market participants would use in pricing the asset or liability based on the information available. The inputs or methodology used for valuing assets or liabilities may not be an indication of the risks associated with investing in those assets or liabilities. The three-tier hierarchy of inputs is summarized below.
| • | | Level 1—quoted prices in active markets for an identical asset or liability |
| | |
| 26 | | MainStay VP Bond Portfolio |
| • | | Level 2—other significant observable inputs (including quoted prices for a similar asset or liability in active markets, interest rates and yield curves, prepayment speeds, credit risk, etc.) |
| • | | Level 3—significant unobservable inputs (including the Portfolio’s own assumptions about the assumptions that market participants would use in measuring fair value of an asset or liability) |
The level of an asset or liability within the fair value hierarchy is based on the lowest level of an input, both individually and in the aggregate, that is significant to the fair value measurement. The aggregate value by input level of the Portfolio’s assets and liabilities as of June 30, 2020 is included at the end of the Portfolio of Investments.
The Portfolio may use third-party vendor evaluations, whose prices may be derived from one or more of the following standard inputs, among others:
| | |
• Benchmark yields | | • Reported trades |
• Broker/dealer quotes | | • Issuer spreads |
• Two-sided markets | | • Benchmark securities |
• Bids/offers | | • Reference data (corporate actions or material event notices) |
• Industry and economic events | | • Comparable bonds |
• Monthly payment information | | |
An asset or liability for which market values cannot be measured using the methodologies described above is valued by methods deemed reasonable in good faith by the Valuation Committee, following the procedures established by the Board, to represent fair value. Under these procedures, the Portfolio generally uses a market-based approach which may use related or comparable assets or liabilities, recent transactions, market multiples, book values and other relevant information. The Portfolio may also use an income-based valuation approach in which the anticipated future cash flows of the asset or liability are discounted to calculate fair value. Discounts may also be applied due to the nature and/or duration of any restrictions on the disposition of the asset or liability. Fair value represents a good faith approximation of the value of a security. Fair value determinations involve the consideration of a number of subjective factors, an analysis of applicable facts and circumstances and the exercise of judgment. As a result, it is possible that the fair value for a security determined in good faith in accordance with the Portfolio’s valuation procedures may differ from valuations for the same security determined by other funds using their own valuation procedures. Although the Portfolio’s valuation procedures are designed to value a security at the price the Portfolio may reasonably expect to receive upon the security’s sale in an orderly transaction, there can be no assurance that any fair value determination thereunder would, in fact, approximate the amount that the Portfolio would actually realize upon the sale of the security or the price at which the security would trade if a reliable market price were readily available. During the six-month period ended June 30, 2020, there were no material changes to the fair value methodologies.
Securities which may be valued in this manner include, but are not limited to: (i) a security for which trading has been halted or suspended; (ii) a debt security that has recently gone into default and for which there is not a current market quotation; (iii) a security of an issuer that has entered into a restructuring; (iv) a security that has been delisted
from a national exchange; (v) a security for which the market price is not readily available from a third-party pricing source or, if so provided, does not, in the opinion of the Manager or the Subadvisor, reflect the security’s market value; (vi) a security subject to trading collars for which no or limited trading takes place; and (vii) a security whose principal market has been temporarily closed at a time when, under normal conditions, it would be open. Securities valued in this manner are generally categorized as Level 3 in the hierarchy. As of June 30, 2020, no securities held by the portfolio were fair valued in such a manner.
Equity securities, including exchange-traded funds (“ETFs”), are valued at the last quoted sales prices as of the close of regular trading on the relevant exchange on each valuation date. Securities that are not traded on the valuation date are valued at the mean of the last quoted bid and ask prices. Prices are normally taken from the principal market in which each security trades. Futures contracts are valued at the last posted settlement price on the market where such futures are primarily traded. These securities are generally categorized as Level 1 in the hierarchy.
Investments in mutual funds, including money market funds, are valued at their respective NAVs as of the close of the Exchange on the valuation date. These securities are generally categorized as Level 1 in the hierarchy.
Debt securities (other than convertible and municipal bonds) are valued at the evaluated bid prices (evaluated mean prices in the case of convertible and municipal bonds) supplied by a pricing agent or broker selected by the Manager, in consultation with the Subadvisor. The evaluations are market-based measurements processed through a pricing application and represents the pricing agent’s good faith determination as to what a holder may receive in an orderly transaction under market conditions. The rules based logic utilizes valuation techniques that reflect participants’ assumptions and vary by asset class and per methodology, maximizing the use of relevant observable data including quoted prices for similar assets, benchmark yield curves and market corroborated inputs. The evaluated bid or mean prices are deemed by the Manager, in consultation with the Subadvisor, to be representative of market values at the regular close of trading of the Exchange on each valuation date. Debt securities purchased on a delayed delivery basis are marked to market daily until settlement at the forward settlement date. Debt securities, including corporate bonds, U.S. government and federal agency bonds, municipal bonds, foreign bonds, convertible bonds, asset-backed securities and mortgage-backed securities are generally categorized as Level 2 in the hierarchy.
Temporary cash investments acquired in excess of 60 days to maturity at the time of purchase are valued using the latest bid prices or using valuations based on a matrix system (which considers such factors as security prices, yields, maturities and ratings), both as furnished by independent pricing services. Temporary cash investments that mature in 60 days or less at the time of purchase (“Short-Term Investments”) are valued using the amortized cost method of valuation, unless the use of such method would be inappropriate. The amortized cost method involves valuing a security at its cost on the date of purchase and thereafter assuming a constant amortization to maturity of the difference between such cost and the value on maturity date. Amortized cost approximates the current fair value of a security. Securities valued using the amortized cost method are not valued using quoted prices in an active market and are generally categorized as Level 2 in the hierarchy.
Notes to Financial Statements (Unaudited) (continued)
The information above is not intended to reflect an exhaustive list of the methodologies that may be used to value portfolio investments. The valuation procedures permit the use of a variety of valuation methodologies in connection with valuing portfolio investments. The methodology used for a specific type of investment may vary based on the market data available or other considerations. The methodologies summarized above may not represent the specific means by which portfolio investments are valued on any particular business day.
(B) Income Taxes. The Portfolio’s policy is to comply with the requirements of the Internal Revenue Code of 1986, as amended (the “Internal Revenue Code”), applicable to regulated investment companies and to distribute all of its taxable income to the shareholders of the Portfolio within the allowable time limits.
The Manager evaluates the Portfolio’s tax positions to determine if the tax positions taken meet the minimum recognition threshold in connection with accounting for uncertainties in income tax positions taken or expected to be taken for the purposes of measuring and recognizing tax liabilities in the financial statements. Recognition of tax benefits of an uncertain tax position is permitted only to the extent the position is “more likely than not” to be sustained assuming examination by taxing authorities. The Manager analyzed the Portfolio’s tax positions taken on federal, state and local income tax returns for all open tax years (for up to three tax years) and has concluded that no provisions for federal, state and local income tax are required in the Portfolio’s financial statements. The Portfolio’s federal, state and local income tax and federal excise tax returns for tax years for which the applicable statutes of limitations have not expired are subject to examination by the Internal Revenue Service and state and local departments of revenue.
(C) Dividends and Distributions to Shareholders. Dividends and distributions are recorded on the ex-dividend date. The Portfolio intends to declare and pay dividends from net investment income and distributions from net realized capital and currency gains, if any, at least annually. Unless a shareholder elects otherwise, all dividends and distributions are reinvested at NAV in the same class of shares of the Portfolio. Dividends and distributions to shareholders are determined in accordance with federal income tax regulations and may differ from determinations using GAAP.
(D) Security Transactions and Investment Income. The Portfolio records security transactions on the trade date. Realized gains and losses on security transactions are determined using the identified cost method. Dividend income is recognized on the ex-dividend date, net of any foreign tax withheld at the source, and interest income is accrued as earned using the effective interest rate method and includes any realized gains and losses from repayments of principal on mortgage-backed securities. Distributions received from real estate investment trusts may be classified as dividends, capital gains and/or return of capital. Discounts and premiums on securities purchased for the Portfolio are accreted and amortized, respectively, on the effective interest rate method.
Investment income and realized and unrealized gains and losses on investments of the Portfolio are allocated pro rata to the separate classes of shares based upon their relative net assets on the date the income is earned or realized and unrealized gains and losses are incurred.
The Portfolio may place a debt security on non-accrual status and reduce related interest income by ceasing current accruals and writing off all or a portion of any interest receivables when the collection of all or a portion of such interest has become doubtful. A debt security is removed from non-accrual status when the issuer resumes interest payments or when collectability of interest is reasonably assured.
(E) Expenses. Expenses of the Fund are allocated to the individual Portfolios in proportion to the net assets of the respective Portfolios when the expenses are incurred, except where direct allocations of expenses can be made. Expenses (other than fees incurred under the distribution and service plans, further discussed in Note 3(B), which are charged directly to the Service Class shares) are allocated to separate classes of shares pro rata based upon their relative net assets on the date the expenses are incurred. The expenses borne by the Portfolio, including those of related parties to the Portfolio, are shown in the Statement of Operations.
Additionally, the Portfolio may invest in mutual funds, which are subject to management fees and other fees that may cause the costs of investing in mutual funds to be greater than the costs of owning the underlying securities directly. These indirect expenses of mutual funds are not included in the amounts shown as expenses in the Portfolio’s Statement of Operations or in the expense ratios included in the Financial Highlights.
(F) Use of Estimates. In preparing financial statements in conformity with GAAP, the Manager makes estimates and assumptions that affect the reported amounts and disclosures in the financial statements. Actual results could differ from those estimates.
(G) Repurchase Agreements. The Portfolio may enter into repurchase agreements (i.e., buy a security from another party with the agreement that it will be sold back in the future) to earn income. The Portfolio may enter into repurchase agreements only with counterparties, usually financial institutions, that are deemed by the Manager or the Subadvisor to be creditworthy, pursuant to guidelines established by the Board. During the term of any repurchase agreement, the Manager or the Subadvisor will continue to monitor the creditworthiness of the counterparty. Under the 1940 Act, repurchase agreements are considered to be collateralized loans by the Portfolio to the counterparty secured by the securities transferred to the Portfolio.
Repurchase agreements are subject to counterparty risk, meaning the Portfolio could lose money by the counterparty’s failure to perform under the terms of the agreement. The Portfolio mitigates this risk by ensuring the repurchase agreement is collateralized by cash, U.S. government securities, fixed income securities and/or other securities. The collateral is held by the Portfolio’s custodian and valued daily on a mark to market basis to determine if the value, including accrued interest, exceeds the repurchase price. In the event of the counterparty’s default on the obligation to repurchase, the Portfolio has the right to liquidate the collateral and apply the proceeds in satisfaction of the obligation. Under certain circumstances, such as in the event of default or bankruptcy by the counterparty, realization and/or retention of the collateral may be limited or subject to delay, to legal proceedings and possible realized loss to the Portfolio. Repurchase agreements as of June 30, 2020, are shown in the Portfolio of Investments.
| | |
| 28 | | MainStay VP Bond Portfolio |
(H) Futures Contracts. A futures contract is an agreement to purchase or sell a specified quantity of an underlying instrument at a specified future date and price, or to make or receive a cash payment based on the value of a financial instrument (e.g., foreign currency, interest rate, security, or securities index). The Portfolio is subject to risks such as market price risk and/or interest rate risk in the normal course of investing in these contracts. Upon entering into a futures contract, the Portfolio is required to pledge to the broker or futures commission merchant an amount of cash and/or U.S. government securities equal to a certain percentage of the collateral amount, known as the “initial margin.” During the period the futures contract is open, changes in the value of the contract are recognized as unrealized appreciation or depreciation by marking to market such contract on a daily basis to reflect the market value of the contract at the end of each day’s trading. The Portfolio agrees to receive from or pay to the broker or futures commission merchant an amount of cash equal to the daily fluctuation in the value of the contract. Such receipts or payments are known as “variation margin.” When the futures contract is closed, the Portfolio records a realized gain or loss equal to the difference between the proceeds from (or cost of) the closing transaction and the Portfolio’s basis in the contract.
The use of futures contracts involves, to varying degrees, elements of market risk in excess of the amount recognized in the Statement of Assets and Liabilities. The contract or notional amounts and variation margin reflect the extent of the Portfolio’s involvement in open futures positions. There are several risks associated with the use of futures contracts as hedging techniques. There can be no assurance that a liquid market will exist at the time when the Portfolio seeks to close out a futures contract. If no liquid market exists, the Portfolio would remain obligated to meet margin requirements until the position is closed. Futures contracts may involve a small initial investment relative to the risk assumed, which could result in losses greater than if the Portfolio did not invest in futures contracts. Futures contracts may be more volatile than direct investments in the instrument underlying the futures and may not correlate to the underlying instrument, causing a given hedge not to achieve its objectives. The Portfolio’s activities in futures contracts have minimal counterparty risk as they are conducted through regulated exchanges that guarantee the futures against default by the counterparty. In the event of a bankruptcy or insolvency of a futures commission merchant that holds margin on behalf of the Portfolio, the Portfolio may not be entitled to the return of the entire margin owed to the Portfolio, potentially resulting in a loss. The Portfolio’s investment in futures contracts and other derivatives may increase the volatility of the Portfolio’s NAVs and may result in a loss to the Portfolio. Open futures contracts held as of June 30, 2020, are shown in the Portfolio of Investments.
(I) Dollar Rolls. The Portfolio may enter into dollar roll transactions in which it sells mortgage-backed securities (“MBS”) from its portfolio to a counterparty from whom it simultaneously agrees to buy a similar security on a delayed delivery basis. The Portfolio generally transfers MBS where the MBS are “to be announced,” therefore, the Portfolio accounts for these transactions as purchases and sales.
When accounted for as purchase and sales, the securities sold in connection with the dollar rolls are removed from the portfolio and a realized gain or loss is recognized. The securities the Portfolio has
agreed to acquire are included at market value in the Portfolio of Investments and liabilities for such purchase commitments are included as payables for investments purchased. During the roll period, the Portfolio foregoes principal and interest paid on the securities. The Portfolio is compensated by the difference between the current sales price and the forward price for the future as well as by the earnings on the cash proceeds of the initial sale. Dollar rolls may be renewed without physical delivery of the securities subject to the contract. The Portfolio maintains liquid assets from its portfolio having a value not less than the repurchase price, including accrued interest. Dollar roll transactions involve certain risks, including the risk that the securities returned to the Portfolio at the end of the roll period, while substantially similar, could be inferior to what was initially sold to the counterparty.
The Portfolio accounts for a dollar roll transaction as a purchase and sale whereby the difference in the sales price and purchase price of the security sold is recorded as a realized gain (loss).
(J) Securities Lending. In order to realize additional income, the Portfolio may engage in securities lending, subject to the limitations set forth in the 1940 Act and relevant guidance by the staff of the Securities and Exchange Commission (“SEC”). If the Portfolio engages in securities lending, the Portfolio will lend through its custodian, currently State Street Bank and Trust Company (“State Street”), acting as securities lending agent on behalf of the Portfolio. Under the current arrangement, State Street will manage the Portfolio’s collateral in accordance with the securities lending agency agreement between the Portfolio and State Street, and indemnify the Portfolio against counterparty risk. The loans will be collateralized by cash (which may be invested in a money market fund) and/or non-cash collateral (which may include U.S. Treasury securities and/or U.S. government agency securities issued or guaranteed by the United States government or its agencies or instrumentalities) at least equal at all times to the market value of the securities loaned. The Portfolio bears the risk of delay in recovery of, or loss of rights in, the securities loaned. The Portfolio may also record a realized gain or loss on securities deemed sold due to a borrower’s inability to return securities on loan. The Portfolio bears the risk of any loss on investment of cash collateral. The Portfolio will receive compensation for lending its securities in the form of fees or it will retain a portion of interest earned on the investment of any cash collateral. The Portfolio will also continue to receive interest and dividends on the securities loaned and any gain or loss in the market price of the securities loaned that may occur during the term of the loan will be for the account of the Portfolio. Income earned from securities lending activities, if any, is reflected in the Statement of Operations. As of June 30, 2020, the Portfolio did not have any portfolio securities on loan.
(K) Debt Securities Risk. The ability of issuers of debt securities held by the Portfolio to meet their obligations may be affected by, among other things, economic or political developments in a specific country, industry or region. Debt securities are also subject to the risks associated with changes in interest rates.
Investments in the Portfolio are not guaranteed, even though some of the Portfolio’s underlying investments are guaranteed by the U.S. government or its agencies or instrumentalities. The principal risk of mortgage-related and asset-backed securities is that the underlying debt may be prepaid ahead of schedule, if interest rates fall, thereby reducing the value of the Portfolio’s investment. If interest rates rise,
Notes to Financial Statements (Unaudited) (continued)
less of the debt may be prepaid and the Portfolio may lose money because the Portfolio may be unable to invest in higher yielding assets. The Portfolio is subject to interest-rate risk and can lose principal value when interest rates rise. Bonds are also subject to credit risk, in which the bond issuer may fail to pay interest and principal in a timely manner.
The Portfolio may invest in foreign debt securities, which carry certain risks that are in addition to the usual risks inherent in domestic debt securities. These risks include those resulting from currency fluctuations, future adverse political or economic developments and possible imposition of currency exchange blockages or other foreign governmental laws or restrictions. These risks are likely to be greater in emerging markets than in developed markets.
(L) LIBOR Replacement Risk. The Portfolio may invest in certain debt securities, derivatives or other financial instruments that utilize the London Interbank Offered Rate (“LIBOR”), as a “benchmark�� or “reference rate” for various interest rate calculations. The United Kingdom Financial Conduct Authority, which regulates LIBOR, announced that after 2021 it will cease its active encouragement of banks to provide the quotations needed to sustain LIBOR. As a result, it is anticipated that LIBOR will be discontinued or will no longer be sufficiently robust to be representative of its underlying market around that time. Although financial regulators and industry working groups have suggested alternative reference rates, such as the European Interbank Offer Rate (“EURIBOR”), Sterling Overnight Interbank Average Rate (“SONIA”) and Secured Overnight Financing Rate (“SOFR”), there are challenges to converting certain contracts and transactions to a new benchmark and neither the full effects of the transition process nor its ultimate outcome is known.
The elimination of LIBOR or changes to other reference rates or any other changes or reforms to the determination or supervision of reference rates could have an adverse impact on the market for, or value of, any securities or payments linked to those reference rates, which may adversely affect the Portfolio’s performance and/or net asset value. Uncertainty and risk also remain regarding the willingness and ability of issuers and lenders to include revised provisions in new and existing contracts or instruments. Consequently, the transition away from LIBOR to other reference rates may lead to increased volatility and illiquidity in markets that are tied to LIBOR, fluctuations in values of LIBOR-related investments or investments in issuers that utilize LIBOR, increased difficulty in borrowing or refinancing and diminished effectiveness of hedging strategies, adversely affecting the Portfolio’s performance. Furthermore, the risks associated with the expected discontinuation of LIBOR and transition may be exacerbated if the work necessary to effect an orderly transition to an alternative reference rate is not completed in a timely manner. Because the usefulness of LIBOR as a benchmark could deteriorate during the transition period, these effects could occur prior to the end of 2021.
(M) Indemnifications. Under the Fund’s organizational documents, its officers and trustees are indemnified against certain liabilities that may arise out of performance of their duties to the Fund. Additionally, in the normal course of business, the Portfolio enters into contracts with third-party service providers that contain a variety of representations and warranties and that may provide general indemnifications. The Portfolio’s maximum exposure under these arrangements is unknown, as this would involve future claims that may be made against the
Portfolio that have not yet occurred. The Manager believes that the risk of loss in connection with these potential indemnification obligations is remote. However, there can be no assurance that material liabilities related to such obligations will not arise in the future, which could adversely impact the Portfolio.
(N) Quantitative Disclosure of Derivative Holdings. The following tables show additional disclosures related to the Portfolio’s derivative and hedging activities, including how such activities are accounted for and their effect on the Portfolio’s financial positions, performance and cash flows. The Portfolio entered into futures contracts in order to hedge against anticipated changes in interest rates that might otherwise have an adverse effect upon the value of the Portfolio’s securities as well as help manage the duration and yield curve positioning of the portfolio. These derivatives are not accounted for as hedging instruments.
Fair value of derivative instruments as of June 30, 2020:
Asset Derivatives
| | | | | | | | | | |
| | | Statement of
Assets and
Liabilities
Location | | Interest
Rate
Contracts
Risk | | | Total | |
| | | |
Futures Contracts | | Net Assets—Net unrealized appreciation on investments and futures contracts (a) | | $ | 77,435 | | | $ | 77,435 | |
| | | | | | |
Total Fair Value | | | | $ | 77,435 | | | $ | 77,435 | |
| | | | | | |
Liability Derivatives
| | | | | | | | | | |
| | | Statement of Assets
and Liabilities
Location | | Interest
Rate
Contracts
Risk | | | Total | |
| | | |
Futures Contracts | | Net Assets—Net unrealized depreciation on investments and futures contracts (a) | | $ | (350,583 | ) | | $ | (350,583 | ) |
| | | | | | |
Total Fair Value | | | | $ | (350,583 | ) | | $ | (350,583 | ) |
| | | | | | |
| (a) | Includes cumulative appreciation (depreciation) of futures contracts as reported in the Portfolio of Investments. Only current day’s variation margin is reported within the Statement of Assets and Liabilities. |
The effect of derivative instruments on the Statement of Operations for the period ended June 30, 2020:
Realized Gain (Loss)
| | | | | | | | | | |
| | | Statement of
Operations
Location | | Interest
Rate
Contracts
Risk | | | Total | |
| | | |
Futures Contracts | | Net realized gain (loss) on futures transactions | | $ | 3,076,114 | | | $ | 3,076,114 | |
| | | | | | |
Total Realized Gain (Loss) | | | | $ | 3,076,114 | | | $ | 3,076,114 | |
| | | | | | |
| | |
| 30 | | MainStay VP Bond Portfolio |
Change in Unrealized Appreciation (Depreciation)
| | | | | | | | | | |
| | | Statement of
Operations
Location | | Interest
Rate
Contracts
Risk | | | Total | |
| | | |
Futures Contracts | | Net change in unrealized appreciation (depreciation) on futures contracts | | $ | 377,248 | | | $ | 377,248 | |
| | | | | | |
Total Change in Unrealized
Appreciation (Depreciation) | | $ | 377,248 | | | $ | 377,248 | |
| | | | | | |
Average Notional Amount
| | | | | | | | |
| | | Interest
Rate
Contracts
Risk | | | Total | |
| | |
Futures Contracts Long | | $ | 113,080,293 | | | $ | 113,080,293 | |
Futures Contracts Short | | $ | (35,087,036 | ) | | $ | (35,087,036 | ) |
| | | | |
Note 3–Fees and Related Party Transactions
(A) Manager and Subadvisor. New York Life Investments, a registered investment adviser and an indirect, wholly-owned subsidiary of New York Life, serves as the Portfolio’s Manager, pursuant to an Amended and Restated Management Agreement (“Management Agreement”). The Manager provides offices, conducts clerical, recordkeeping and bookkeeping services and keeps most of the financial and accounting records required to be maintained by the Portfolio. Except for the portion of salaries and expenses that are the responsibility of the Portfolio, the Manager pays the salaries and expenses of all personnel affiliated with the Portfolio and certain operational expenses of the Portfolio. The Portfolio reimburses New York Life Investments in an amount equal to the portion of the compensation of the Chief Compliance Officer attributable to the Portfolio. NYL Investors LLC (“NYL Investors” or the “Subadvisor”), a registered investment adviser and a direct, wholly-owned subsidiary of New York Life, serves as Subadvisor to the Portfolio and is responsible for the day-to-day portfolio management of the Portfolio. Pursuant to the terms of a Subadvisory Agreement (“Subadvisory Agreement”) between New York Life Investments and NYL Investors, New York Life Investments pays for the services of the Subadvisor.
The Fund, on behalf of the Portfolio, pays New York Life Investments in its capacity as the Portfolio’s investment manager and administrator, pursuant to the Management Agreement, a monthly fee for the services performed and the facilities furnished at an annual rate of the Portfolio’s average daily net assets as follows: 0.50% up to $500 million; 0.475% from $500 million to $1 billion; 0.45% from $1 billion to $3 billion; and 0.44% in excess of $3 billion. During the six-month period ended June 30, 2020, the effective management fee rate was 0.49%.
During the six-month period ended June 30, 2020, New York Life Investments earned fees from the Portfolio in the amount of $1,959,664 and paid the Subadvisor in the amount of $979,832.
State Street provides sub-administration and sub-accounting services to the Portfolio pursuant to an agreement with New York Life Investments. These services include calculating the daily NAVs of the Portfolio, maintaining the general ledger and sub-ledger accounts for the calculation of the Portfolio’s NAVs and assisting New York Life Investments in conducting various aspects of the Portfolio’s administrative operations. For providing these services to the Portfolio, State Street is compensated by New York Life Investments.
Pursuant to an agreement between the Fund and New York Life Investments, New York Life Investments is responsible for providing or procuring certain regulatory reporting services for the Portfolio. The Portfolio will reimburse New York Life Investments for the actual costs incurred by New York Life Investments in connection with providing or procuring these services for the Portfolio.
(B) Distribution and Service Fees. The Fund, on behalf of the Portfolio, has entered into a distribution agreement with NYLIFE Distributors LLC (the “Distributor”), an indirect, wholly-owned subsidiary of New York Life. The Portfolio has adopted a distribution plan (the “Plan”) in accordance with the provisions of Rule 12b-1 under the 1940 Act. Under the Plan, the Distributor has agreed to provide, through its affiliates or independent third parties, various distribution-related, shareholder and administrative support services to the Service Class shareholders. For its services, the Distributor is entitled to a combined distribution and service fee accrued daily and paid monthly at an annual rate of 0.25% of the average daily net assets attributable to the Service Class shares of the Portfolio.
Note 4–Federal Income Tax
As of June 30, 2020, the cost and unrealized appreciation (depreciation) of the Portfolio’s investment portfolio, including applicable derivative contracts and other financial instruments, as determined on a federal income tax basis, was as follows:
| | | | | | | | | | | | | | | | |
| | | Federal Tax
Cost | | | Gross
Unrealized
Appreciation | | | Gross
Unrealized
(Depreciation) | | | Net
Unrealized
Appreciation/
(Depreciation) | |
| | | | |
Investments in Securities | | $ | 824,102,235 | | | $ | 33,699,051 | | | $ | (4,973,957 | ) | | $ | 28,725,094 | |
During the year ended December 31, 2019, the tax character of distributions paid as reflected in the Statements of Changes in Net Assets was as follows:
| | |
|
| 2019 |
Tax-Based
Distributions
from Ordinary
Income | | Tax-Based
Distributions
from Long-Term
Gains |
| |
| $19,429,826 | | $— |
Note 5–Custodian
State Street is the custodian of cash and securities held by the Portfolio. Custodial fees are charged to the Portfolio based on the Portfolio’s net assets and/or the market value of securities held by the Portfolio and the number of certain transactions incurred by the Portfolio.
Notes to Financial Statements (Unaudited) (continued)
Note 6–Line of Credit
The Portfolio and certain other funds managed by New York Life Investments maintain a line of credit with a syndicate of banks in order to secure a source of funds for temporary purposes to meet unanticipated or excessive redemption requests.
Effective July 28, 2020, under the credit agreement (the “Credit Agreement”), the aggregate commitment amount is $600,000,000 with an additional uncommitted amount of $100,000,000. The commitment fee is an annual rate of 0.15% of the average commitment amount payable quarterly, regardless of usage, to JP Morgan Chase Bank NA, who serves as the agent to the syndicate. The commitment fee is allocated among the Portfolio and certain other funds managed by New York Life Investments based upon their respective net assets and other factors. Interest on any revolving credit loan is charged based upon the Federal Funds Rate or the one-month LIBOR, whichever is higher. The Credit Agreement expires on July 27, 2021, although the Portfolio, certain other funds managed by New York Life Investments and the syndicate of banks may renew the Credit Agreement for an additional year on the same or different terms or enter into a credit agreement with a different syndicate of banks. Prior to July 28, 2020, the aggregate commitment amount and the commitment fee were the same as those under the current Credit Agreement, but State Street served as agent to the syndicate. As of June 30, 2020, there were no borrowings outstanding with respect to the Portfolio under the Credit Agreement or the credit agreement for which State Street served as agent.
Note 7–Interfund Lending Program
Pursuant to an exemptive order issued by the SEC, the Portfolio, along with certain other funds managed by New York Life Investments, may participate in an interfund lending program. The interfund lending program provides an alternative credit facility that permits the Portfolio and certain other funds managed by New York Life Investments to lend or borrow money for temporary purposes directly to or from one another subject to the conditions of the exemptive order. During the six-month period ended June 30, 2020, there were no interfund loans made or outstanding with respect to the Portfolio.
Note 8–Purchases and Sales of Securities (in 000’s)
During the six-month period ended June 30, 2020, purchases and sales of U.S. government securities were $866,926 and $904,897, respectively. Purchases and sales of securities, other than U.S. government securities and short-term securities, were $381,984 and $302,204, respectively.
Note 9–Capital Share Transactions
Transactions in capital shares for the six-month period ended June 30, 2020 and the year ended December 31, 2019, were as follows:
| | | | | | | | |
Initial Class | | Shares | | | Amount | |
| | |
Six-month period ended June 30, 2020: | | | | | | | | |
Shares sold | | | 2,313,117 | | | $ | 34,762,523 | |
Shares redeemed | | | (2,594,610 | ) | | | (38,284,919 | ) |
| | | | |
Net increase (decrease) | | | (281,493 | ) | | $ | (3,522,396 | ) |
| | | | |
Year ended December 31, 2019: | | | | | | | | |
Shares sold | | | 4,320,395 | | | $ | 62,109,464 | |
Shares issued to shareholders in reinvestment of distributions | | | 633,433 | | | | 9,276,310 | |
Shares redeemed | | | (3,951,449 | ) | | | (56,528,617 | ) |
| | | | |
Net increase (decrease) | | | 1,002,379 | | | $ | 14,857,157 | |
| | | | |
| | |
| | | | | | | | |
Service Class | | Shares | | | Amount | |
Six-month period ended June 30, 2020: | | | | | | | | |
Shares sold | | | 5,865,287 | | | $ | 86,782,968 | |
Shares redeemed | | | (3,772,932 | ) | | | (55,216,505 | ) |
| | | | |
Net increase (decrease) | | | 2,092,355 | | | $ | 31,566,463 | |
| | | | |
Year ended December 31, 2019: | | | | | | | | |
Shares sold | | | 8,493,043 | | | $ | 121,330,733 | |
Shares issued to shareholders in reinvestment of distributions | | | 700,439 | | | | 10,153,516 | |
Shares redeemed | | | (3,334,407 | ) | | | (47,384,751 | ) |
| | | | |
Net increase (decrease) | | | 5,859,075 | | | $ | 84,099,498 | |
| | | | |
Note 10–Recent Accounting Pronouncement
In March 2020, the Financial Accounting Standards Board (“FASB”) issued Accounting Standards Update 2020-04 (“ASU 2020-04”), which provides optional guidance to ease the potential accounting burden associated with transitioning away from LIBOR and other reference rates that are expected to be discontinued. ASU 2020-04 is effective immediately upon release of the update on March 12, 2020 through December 31, 2022. At this time, the Manager is evaluating the implications of certain other provisions of ASU 2020-04 related to new disclosure requirements and any impact on the financial statement disclosures has not yet been determined.
Note 11–Subsequent Events
In connection with the preparation of the financial statements of the Portfolio as of and for the six-month period ended June 30, 2020, events and transactions subsequent to June 30, 2020, through the date the financial statements were issued have been evaluated by the Manager, for possible adjustment and/or disclosure. No subsequent events requiring financial statement adjustment or disclosure have been identified.
Note 12–Other Matters
An outbreak of COVID-19, first detected in December 2019, has developed into a global pandemic and has resulted in travel restrictions, closure of international borders, certain businesses and securities markets, restrictions on securities trading activities, prolonged quarantines, supply chain disruptions, and lower consumer demand, as well
| | |
| 32 | | MainStay VP Bond Portfolio |
as general concern and uncertainty. The continued impact of COVID-19 is uncertain and could further adversely affect the global economy, national economies, individual issuers and capital markets in unforeseeable ways and result in a substantial and extended economic downturn. Developments that disrupt global economies and financial markets, such as COVID-19, may magnify factors that affect the Portfolio’s performance.
Discussion of the Operation and Effectiveness of the Portfolio’s
Liquidity Risk Management Program (Unaudited)
In compliance with Rule 22e-4 under the Investment Company Act of 1940, as amended (the “Liquidity Rule”), the Portfolio has adopted and implemented a liquidity risk management program (the “Program”), which New York Life Investment Management LLC believes is reasonably designed to assess and manage the Portfolio’s liquidity risk. The Board designated New York Life Investment Management LLC as administrator of the Program (the “Administrator”). The Administrator has established a Liquidity Risk Management Committee to assist the Administrator in the implementation and day-to-day administration of the Program and to otherwise support the Administrator in fulfilling its responsibilities under the Program.
At a meeting of the Board held on March 11, 2020, the Administrator provided the Board with a written report addressing the Program’s operation, adequacy and effectiveness of implementation for the period from December 1, 2018 through December 31, 2019, as required under the Liquidity Rule. The report noted that the Administrator concluded that (i) the Program operated effectively to assess and manage the Portfolio’s liquidity risk, (ii) the Program has been adequately and effectively implemented to monitor and, as applicable, respond to the Portfolio’s liquidity developments and (iii) the Portfolio’s investment strategy continues to be appropriate for an open-end portfolio.
In accordance with the Program, the Portfolio’s liquidity risk is assessed no less frequently than annually taking into consideration certain factors, as applicable, such as (i) investment strategy and liquidity of portfolio investments, (ii) short-term and long-term cash flow projections and (iii) holdings of cash and cash equivalents and borrowing arrangements and other funding sources. Certain factors are considered under both normal and reasonably foreseeable stressed conditions.
Each Portfolio portfolio investment is classified into one of four liquidity categories. The classification is based on a determination of the number of days it is reasonably expected to take to convert the investment into cash, or sell or dispose of the investment, in current market conditions without significantly changing the market value of the investment. The Administrator has delegated liquidity classification determinations to the Portfolio’s subadvisor, subject to appropriate oversight by the Administrator, and classification determinations are made by taking into account the Portfolio’s reasonably anticipated trade size, various market, trading and investment-specific considerations, as well as market depth, and, in certain cases, third-party vendor data.
The Liquidity Rule requires portfolios that do not primarily hold assets that are highly liquid investments to adopt a minimum amount of net assets that must be invested in highly liquid investments that are assets (an “HLIM”). In addition, the Liquidity Rule limits a portfolio’s investments in illiquid investments. Specifically, the Liquidity Rule prohibits acquisition of illiquid investments if doing so would result in a portfolio holding more than 15% of its net assets in illiquid investments that are assets. The Program includes provisions reasonably designed to determine, periodically review and comply with the HLIM requirement, as applicable, and to comply with the 15% limit on illiquid investments.
| | |
| 34 | | MainStay VP Bond Portfolio |
Proxy Voting Policies and Procedures and Proxy Voting Record
A description of the policies and procedures that New York Life Investments uses to vote proxies related to the Portfolio’s securities is available free of charge upon request (i) by calling 800-598-2019; (ii) by visiting New York Life Investments’ website at https://www.nylinvestments.com/mainstay/products-and-performance/mainstay-vp-funds-trust; or (iii) by visiting the SEC’s website at www.sec.gov.
The Portfolio is required to file with the SEC its proxy voting record for the 12-month period ending June 30 on Form N-PX. The Portfolio’s most recent Form N-PX or proxy voting record is available free of charge upon request (i) by calling 800-598-2019; (ii) by visiting New York Life Investments’ website at https://www.nylinvestments.com/mainstay/products-and-performance/mainstay-vp-funds-trust; or (iii) by visiting the SEC’s website at www.sec.gov.
Shareholder Reports and Quarterly Portfolio Disclosure
The Portfolio is required to file its complete schedule of portfolio holdings with the SEC 60 days after its first and third fiscal quarter on Form N-PORT. The Portfolio’s holdings report is available free of charge upon request by calling 800-598-2019 or by visiting the SEC’s website at www.sec.gov.
MainStay VP Portfolios
MainStay VP offers a wide range of Portfolios. The full array of MainStay VP offerings is listed here, with information about the manager, subadvisors, legal counsel, and independent registered public accounting firm.
Equity Portfolios
MainStay VP Emerging Markets Equity Portfolio
MainStay VP Epoch U.S. Equity Yield Portfolio
MainStay VP Fidelity Institutional AM® Utilities Portfolio†
MainStay VP MacKay Common Stock Portfolio
MainStay VP MacKay Growth Portfolio
MainStay VP MacKay International Equity Portfolio
MainStay VP MacKay Mid Cap Core Portfolio
MainStay VP MacKay S&P 500 Index Portfolio
MainStay VP MacKay Small Cap Core Portfolio
MainStay VP Mellon Natural Resources Portfolio
MainStay VP Small Cap Growth Portfolio
MainStay VP T. Rowe Price Equity Income Portfolio
MainStay VP Winslow Large Cap Growth Portfolio
Mixed Asset Portfolios
MainStay VP Balanced Portfolio
MainStay VP Income Builder Portfolio
MainStay VP Janus Henderson Balanced Portfolio
MainStay VP MacKay Convertible Portfolio
Income Portfolios
MainStay VP Bond Portfolio
MainStay VP Floating Rate Portfolio
MainStay VP Indexed Bond Portfolio
MainStay VP MacKay Government Portfolio
MainStay VP MacKay High Yield Corporate Bond Portfolio
MainStay VP MacKay Unconstrained Bond Portfolio
MainStay VP PIMCO Real Return Portfolio
Money Market
MainStay VP U.S. Government Money Market Portfolio
Alternative
MainStay VP CBRE Global Infrastructure Portfolio
MainStay VP IQ Hedge Multi-Strategy Portfolio
Asset Allocation Portfolios
MainStay VP Conservative Allocation Portfolio
MainStay VP Growth Allocation Portfolio
MainStay VP Moderate Allocation Portfolio
MainStay VP Moderate Growth Allocation Portfolio
Manager
New York Life Investment Management LLC
New York, New York
Subadvisors
Brown Advisory LLC
Baltimore, Maryland
Candriam Belgium S.A.*
Brussels, Belgium
CBRE Clarion Securities LLC
Radnor, Pennsylvania
Epoch Investment Partners, Inc.
New York, New York
FIAM LLC
Smithfield, Rhode Island
IndexIQ Advisors LLC*
New York, New York
Janus Capital Management LLC
Denver, Colorado
MacKay Shields LLC*
New York, New York
Mellon Investments Corporation
Boston, Massachusetts
NYL Investors LLC*
New York, New York
Pacific Investment Management Company LLC
Newport Beach, California
Segall Bryant & Hamill, LLC
Chicago, Illinois
T. Rowe Price Associates, Inc.
Baltimore, Maryland
Winslow Capital Management, LLC
Minneapolis, Minnesota
Distributor
NYLIFE Distributors LLC*
Jersey City, New Jersey
Custodian
State Street Bank and Trust Company
Boston, Massachusetts
Independent Registered Public Accounting Firm
PricewaterhouseCoopers LLP
New York, New York
Legal Counsel
Dechert LLP
Washington, District of Columbia
Some Portfolios may not be available in all products.
| † | Fidelity Institutional AM is a registered trade mark of FMR LLC. Used with permission. |
| * | An affiliate of New York Life Investment Management LLC |
Not part of the Semiannual Report
2020 Semiannual Report
This report is for the general information of New York Life Variable Annuities and NYLIAC Variable Universal Life Insurance Products policyowners. It must be preceded or accompanied by the appropriate product(s) and funds prospectuses if it is given to anyone who is not an owner of a New York Life variable annuity policy or a NYLIAC Variable Universal Life Insurance Product. This report does not offer for sale or solicit orders to purchase securities.
The performance data quoted in this report represents past performance. Past performance is no guarantee of future results. Due to market volatility and other factors, current performance may be lower or higher than the figures shown. The most recent month-end performance summary for your variable annuity or variable life policy is available by calling 800-598-2019 and is updated periodically on www.newyorklife.com.
The New York Life Variable Annuities and NYLIAC Variable Universal Life Insurance Products are issued by New York Life Insurance and Annuity Corporation (a Delaware Corporation) and distributed by NYLIFE Distributors LLC (Member FINRA/SIPC).
New York Life Insurance Company
New York Life Insurance and Annuity Corporation (NYLIAC) (A Delaware Corporation)
51 Madison Avenue, Room 551
New York, NY 10010
www.newyorklife.com
Printed on recycled paper
nylinvestments.com
NYLIFE Distributors LLC, 30 Hudson Street, Jersey City, NJ 07302
New York Life Investment Management LLC is the investment manager to the MainStay VP Funds Trust
©2020 by NYLIFE Distributors LLC. All rights reserved.
You may obtain copies of the Prospectus and the Statement of Additional Information free of charge, upon request, by calling toll-free 800-598-2019 or writing to New York Life Insurance and Annuity Corporation, 51 Madison Avenue, New York, NY 10010.
| | | | |
| Not FDIC Insured | | No Bank Guarantee | | May Lose Value |
| | | | |
| 1781605 | | | | MSVPB10-08/20 (NYLIAC) NI509 |
MainStay VP Emerging Markets Equity Portfolio
Message from the President and Semiannual Report
Unaudited | June 30, 2020
Beginning on January 1, 2021, as permitted by regulations adopted by the Securities and Exchange Commission, paper copies of the MainStay VP Portfolio annual and semi-annual shareholder reports may no longer be sent by mail, unless you specifically request paper copies of the reports from the insurance company that offers your policy. Instead, the reports will be made available online, and you will be notified by mail each time a report is posted and provided with a website link to access the report. Instructions for requesting paper copies will be provided by your insurance company.
If you already elected to receive shareholder reports electronically, you will not be affected by this change and you need not take any action. At any time, you may elect to receive reports and other communications from the insurance company electronically by following the instructions provided by the insurance company.
You may elect to receive all future shareholder reports in paper form free of charge. You can inform the insurance company that you wish to receive paper copies of reports by following the instructions provided by the insurance company. Your election to receive reports in paper form will apply to all portfolio companies available under your contract.
| | | | | | | | |
| Not FDIC/NCUA Insured | | Not a Deposit | | May Lose Value | | No Bank Guarantee | | Not Insured by Any Government Agency |

This page intentionally left blank
Message from the President
High levels of volatility shook financial markets in response to the COVID-19 pandemic and an abrupt decline in global economic activity during the six months ended June 30, 2020.
Markets entered 2020 riding strong fourth quarter performance and an economic expansion of historic longevity. Most broad stock and bond indices began to dip in late February as growing numbers of COVID-19 cases were seen in hotspots around the world. On March 11, 2020, the World Health Organization acknowledged that the disease had reached pandemic proportions, with over 80,000 identified cases in China, thousands in Italy, South Korea and the United States, and more in dozens of additional countries. Governments and central banks pledged trillions of dollars to address the mounting economic and public health crisis; however, “stay-at-home” orders and other restrictions on non-essential activity caused global economic activity to slow. Most stocks and bonds lost significant ground in this challenging environment, with equities declining by roughly a third and the yield on high-yield credit indices shooting higher.
Policymakers responded with extraordinary speed to address the situation. In the United States, the Federal Reserve (“Fed”) cut interest rates to near zero and announced unlimited quantitative easing. With help from Treasury, the Fed later rolled out a series of lending facilities to directly support market functioning. In late March, the Federal government declared a national emergency; Congress passed, and the President signed, a $2 trillion CARES Act (The Coronavirus Aid, Relief, and Economic Security Act), with the promise of further assistance for consumers and businesses to come. This enormous wave of policy support helped fuel a rapid recovery in market pricing as stocks bounced back and credit spreads narrowed. Some states rushed to ease restrictions on travel and social gatherings, further fueling optimism that the effects of the pandemic might prove short lived. However, the final weeks of the reporting period saw infection rates beginning to rise in some of the first states to reopen, raising concerns that a second round of restrictive government policies might prove necessary, once again stifling economic activity.
Despite all the market volatility, the broadly based S&P 500® Index finished the first half of 2020 only slightly below its starting point and the technology-heavy NASDAQ Composite Index posted gains, closing in near record territory. Small-cap stocks tended to trail their large cap counterparts, as illustrated by the Russell 2000® Index’s loss of approximately 15%, while value-oriented stocks lagged growth-oriented issues. From a global perspective, U.S. stocks generally outperformed international equities, with emerging markets hit particularly hard by the flight from risk.
Fixed-income markets also experienced unusually high levels of volatility. Recognized safe havens, such as U.S. government bonds, attracted increased investment, driving yields lower and prices higher, positioning long-term Treasury bonds to deliver particularly strong gains. Investment-grade corporate bonds lost value in March before recovering in the closing months of the reporting period, while relatively speculative high-yield credit faced the brunt of risk-off sentiment. Emerging market debt underperformed most other bonds types as investors sought to minimize currency and sovereign risks.
Today, as we at New York Life Investments continue to track the ongoing health crisis and its financial ramifications, we are particularly mindful of the people at the heart of our enterprise—our colleagues and valued clients. By taking appropriate steps to minimize community spread of COVID-19 within our organization, we strive to safeguard the health of our investment professionals so they can continue to provide you, as a MainStay investor, with world class investment solutions in this rapidly evolving environment.
Sincerely,

Kirk C. Lehneis
President
The opinions expressed are as of the date of this report and are subject to change. There is no guarantee that any forecast made will come to pass. This material does not constitute investment advice and is not intended as an endorsement of any specific investment. Past performance is no guarantee of future results.
Not part of the Semiannual Report
Table of Contents
Investors should refer to the Portfolio’s Summary Prospectus and/or Prospectus and consider the Portfolio’s investment objectives, strategies, risks, charges and expenses carefully before investing. The Summary Prospectus and/or Prospectus contain this and other information about the Portfolio. You may obtain copies of the Portfolio’s Summary Prospectus and/or the Prospectus and the Statement of Additional Information free of charge, upon request, by calling toll-free 800-598-2019, by writing to New York Life Insurance and Annuity Corporation, 51 Madison Avenue, Room 251, New York, New York 10010 or by sending an email to MainStayShareholdersServices@nylim.com. These documents are also available at nylinvestments.com/vpdocuments. Please read the Summary Prospectus and/or Prospectus carefully before investing. MainStay VP Funds Trust portfolios are separate account options which are purchased through a variable insurance or variable annuity contract.
Investment and Performance Comparison1 (Unaudited)
Performance data quoted represents past performance. Past performance is no guarantee of future results. Because of market volatility and other factors, current performance may be lower or higher than the figures shown. Investment return and principal value will fluctuate, and as a result, when shares are redeemed, they may be worth more or less than their original cost. The performance table and graph do not reflect any deduction of sales charges, mortality and expense charges, contract charges or administrative charges. Please refer to the Performance Summary appropriate for your policy. For performance information current to the most recent month-end, please call 800-598-2019 or visit www.newyorklife.com.
Average Annual Total Returns for the Period-Ended June 30, 2020
| | | | | | | | | | | | | | | | | | | | |
| Class | | Inception Date | | Six Months | | | One Year | | Five Years | | | Since Inception2 | | | Gross
Expense
Ratio3 | |
| | | | | | |
| Initial Class Shares | | 2/17/2012 | | | -6.05 | % | | 0.57% | | | 2.32 | % | | | -0.46 | % | | | 1.17 | % |
| | | | | | |
| Service Class Shares | | 2/17/2012 | | | -6.17 | | | 0.32 | | | 2.06 | | | | -0.71 | | | | 1.42 | |
| | | | | | | | | | | | | | | | |
| Benchmark Performance | | Six
Months | | | One
Year | | | Five
Years | | | Since Inception | |
| | | | |
MSCI Emerging Markets Index4 | | | -9.78 | % | | | -3.39 | % | | | 2.86 | % | | | 1.68 | % |
Morningstar Diversified Emerging Markets Category Average5 | | | -9.77 | | | | -3.66 | | | | 2.46 | | | | 1.39 | |
| 1. | Performance figures may reflect certain fee waivers and/or expense limitations, without which total returns may have been different. For information on current fee waivers and/or expense limitations (if any), please refer to the Notes to Financial Statements. |
| 2. | Effective January 13, 2015, the Portfolio changed its subadvisors and revised its principal investment strategies. The performance in the bar chart and table prior to that date reflects the Portfolio’s prior subadvisors and principal investment strategies. |
| 3. | The gross expense ratios presented reflect the Portfolio’s “Total Annual Portfolio Operating Expenses” from the most recent Prospectus, as supplemented, and may differ from other expense ratios disclosed in this report. |
| 4. | The MSCI Emerging Markets Index is the Portfolio’s primary broad-based securities market index for comparison purposes. The MSCI Emerging |
| | Markets Index is a free float-adjusted market-capitalization index that is designed to measure equity market performance in the global emerging markets. Results assume reinvestment of all dividends and capital gains. An investment cannot be made directly in an index. |
| 5. | The Morningstar Diversified Emerging Markets Category Average is representative of funds that tend to divide their assets among 20 or more nations, although they tend to focus on the emerging markets of Asia and Latin America rather than on those of the Middle East, Africa, or Europe. These funds invest predominantly in emerging market equities, but some funds also invest in both equities and fixed income investments from emerging markets. Results are based on average total returns of similar funds with all dividends and capital gain distributions reinvested. |
Cost in Dollars of a $1,000 Investment in MainStay VP Emerging Markets Equity Portfolio (Unaudited)
The example below is intended to describe the fees and expenses borne by shareholders during the six-month period from January 1, 2020, to June 30, 2020, and the impact of those costs on your investment.
Example
As a shareholder of the Portfolio you incur two types of costs: (1) transaction costs, including exchange fees and sales charges (loads) on purchases (as applicable), and (2) ongoing costs, including management fees, distribution and/or service (12b-1) fees, and other Portfolio expenses (as applicable). This example is intended to help you understand your ongoing costs (in dollars) of investing in the Portfolio and to compare these costs with the ongoing costs of investing in other mutual funds. The example is based on an investment of $1,000 made at the beginning of the six-month period and held for the entire period from January 1, 2020, to June 30, 2020. Shares are only sold in connection with variable life and annuity contracts and the example does not reflect any contract level or transactional fees or expenses. If these costs had been included, your costs would have been higher.
This example illustrates your Portfolio’s ongoing costs in two ways:
Actual Expenses
The second and third data columns in the table below provide information about actual account values and actual expenses. You may use the information in these columns, together with the amount you invested, to estimate the expenses that you paid during the six months
ended June 30, 2020. Simply divide your account value by $1,000 (for example, an $8,600 account value divided by $1,000 = 8.6), then multiply the result by the number under the heading entitled “Expenses Paid During Period” to estimate the expenses you paid on your account during this period.
Hypothetical Example for Comparison Purposes
The fourth and fifth data columns in the table below provide information about hypothetical account values and hypothetical expenses based on the Portfolio’s actual expense ratio and an assumed rate of return of 5% per year before expenses, which is not the Portfolio’s actual return. The hypothetical account values and expenses may not be used to estimate the actual ending account balances or expenses you paid for the six-month period shown. You may use this information to compare the ongoing costs of investing in the Portfolio with the ongoing costs of investing in other mutual funds. To do so, compare this 5% hypothetical example with the 5% hypothetical examples that appear in the shareholder reports of the other mutual funds.
Please note that the expenses shown in the table are meant to highlight your ongoing costs only and do not reflect any transactional costs, such as exchange fees or sales charges (loads). Therefore, the fourth and fifth data columns of the table are useful in comparing ongoing costs only and will not help you determine the relative total costs of owning different funds. In addition, if these transactional costs were included, your costs would have been higher.
| | | | | | | | | | | | | | | | | | | | | | |
| | | | | | | | | | | | | | | | | | |
| Share Class | | Beginning
Account
Value
1/1/20 | | | Ending Account
Value (Based
on Actual
Returns and
Expenses)
6/30/20 | | | Expenses
Paid
During
Period1 | | | Ending Account
Value (Based
on Hypothetical
5% Annualized
Return and
Actual Expenses)
6/30/20 | | | Expenses
Paid
During
Period1 | | | Net Expense
Ratio
During
Period2 |
| | | | | | |
| Initial Class Shares | | $ | 1,000.00 | | | $ | 939.50 | | | $ | 5.79 | | | $ | 1,018.90 | | | $ | 6.02 | | | 1.20% |
| | | | | | |
| Service Class Shares | | $ | 1,000.00 | | | $ | 938.30 | | | $ | 6.99 | | | $ | 1,017.65 | | | $ | 7.27 | | | 1.45% |
| 1 | Expenses are equal to the Portfolio’s annualized expense ratio of each class multiplied by the average account value over the period, divided by 366 and multiplied by 182 (to reflect the six-month period). The table above represents the actual expenses incurred during the six-month period. In addition to the fees and expenses which the Portfolio bears directly, it also indirectly bears a pro rata share of the fees and expenses of the underlying funds in which it invests. Such indirect expenses are not included in the above-reported expense figures. |
| 2 | Expenses are equal to the Portfolio’s annualized expense ratio to reflect the six-month period. |
| | |
| 6 | | MainStay VP Emerging Markets Equity Portfolio |
Country Composition as of June 30, 2020 (Unaudited)
| | | | |
| |
| China | | | 40.1 | % |
| |
| Republic of Korea | | | 13.0 | |
| |
| Taiwan | | | 11.6 | |
| |
| India | | | 7.1 | |
| |
| Brazil | | | 5.8 | |
| |
| South Africa | | | 4.3 | |
| |
| Russia | | | 3.8 | |
| |
| United States | | | 2.6 | |
| |
| Malaysia | | | 1.5 | |
| |
| Poland | | | 1.4 | |
| |
| Indonesia | | | 1.2 | |
| |
| Hong Kong | | | 1.1 | |
| |
| Mexico | | | 1.1 | |
| |
| Thailand | | | 1.1 | |
| | | | |
| |
| Peru | | | 0.9 | |
| |
| Chile | | | 0.6 | |
| |
| Turkey | | | 0.6 | |
| |
| Canada | | | 0.5 | |
| |
| Argentina | | | 0.4 | |
| |
| Colombia | | | 0.4 | |
| |
| Philippines | | | 0.4 | |
| |
| Greece | | | 0.2 | |
| |
| Luxembourg | | | 0.1 | |
| |
| Egypt | | | 0.0 | ‡ |
| |
| Spain | | | 0.0 | ‡ |
| |
| Other Assets, Less Liabilities | | | 0.2 | |
| | | | |
| | | 100.0 | % |
| | | | |
See Portfolio of Investments beginning on page 11 for specific holdings within these categories. The Portfolio’s holdings are subject to change.
| ‡ | Less than one-tenth of a percent. |
Top Ten Holdings as of June 30, 2020 (excluding short-term investments) (Unaudited)
| 2. | Alibaba Group Holding, Ltd. |
| 3. | Taiwan Semiconductor Manufacturing Co., Ltd. |
| 4. | Samsung Electronics Co., Ltd. |
| 6. | China Construction Bank Corp. |
| 7. | Reliance Industries, Ltd. |
| 9. | Ping An Insurance Group Co. of China, Ltd. |
Portfolio Management Discussion and Analysis (Unaudited)
Answers to the questions reflect the views of portfolio managers Ping Wang, PhD, and Rui Tang, CFA, of MacKay Shields LLC (“MacKay Shields”), a Subadvisor of the Portfolio, and portfolio managers Jan Boudewijns, Philip Screve and Lamine Saidi of Candriam Belgium S.A. (“Candriam”), a Subadvisor of the Portfolio.
How did MainStay VP Emerging Markets Equity Portfolio perform relative to its benchmark and peers during the six months ended June 30, 2020?
For the six months ended June 30, 2020, MainStay VP Emerging Markets Equity Portfolio returned –6.05% for Initial Class shares and –6.17% for Service Class shares. Over the same period, both share classes outperformed the –9.78% return of the MSCI Emerging Markets Index, which is the Portfolio’s benchmark, and the –9.77% return of the Morningstar Diversified Emerging Markets Category Average.1
What factors affected the Portfolio’s relative performance during the reporting period?
Candriam
The portion of the Portfolio subadvised by Candriam outperformed the MSCI Emerging Markets Index during the reporting period largely due to our investment process, which focuses on the bottom-up selection of reasonably priced stocks of quality companies delivering strong and sustainable profitability. During the reporting period, our process resulted in a structural tilt toward quality and growth stocks in the Portfolio, which bolstered performance as investors preferred visibility in volatile times.
Several factors enhanced the Portfolio’s outperformance, prominent among them overweight exposure to China and overweight exposure to technology stocks. Another factor supporting the Portfolio’s strong relative performance was its timely shift toward investment areas less sensitive to—or even benefiting from—the quickly developing global pandemic, such as health care and industrials, the former leveraged to mounting global health concerns and the latter supported by increased infrastructure spending. The rise in pandemic-related social distancing practices also supported Portfolio investment themes focusing on e-commerce, social media and gaming. Reduced allocations to financials in some of the more exposed emerging markets helped limit losses in one of the worst-performing market segments. Unprecedented monetary stimulus buoyed the Portfolio’s investments in a number of precious metals miners.
It is worth emphasizing that while allocation played a contributing role in the Portfolio’s relatively strong performance, our bottom-up driven approach and stock selection process were the primary drivers of outperformance during the reporting period.
MacKay Shields
The portion of the Portfolio subadvised by MacKay Shields underperformed the MSCI Emerging Markets Index during the
reporting period, primarily due to disappointing stock selection. Risk rotations occurred frequently during the reporting period, with rapid shifts from risk-off to risk-on sentiment and back again. Style volatility stood at multi-year highs in emerging as well as developed markets. As investors became fixated on macroeconomic themes, they did not appear to pay attention to company fundamentals. As a result, the Portfolio’s valuation signals, which seek to evaluate companies across sales- and cash-based measures on a peer-relative basis, were not rewarded. The Portfolio’s momentum and sentiment composite generated positive results, but these were not strong enough to offset the underperformance of value.
Which sectors were the strongest positive contributors to the Portfolio’s relative performance, and which sectors were particularly weak?
Candriam
In the portion of the Portfolio subadvised by Candriam, the consumer discretionary, industrials and communication services sectors made the strongest positive sector contributions to the Portfolio’s performance relative to the MSCI Emerging Markets Index during the reporting period. (Contributions take weightings and total returns into account.) During the same period, the energy, real estate and financials sectors made the weakest contributions to the relative performance of the Candriam portion of the Portfolio, with underweight allocations in all three sectors.
MacKay Shields
In the portion of the Portfolio subadvised by MacKay Shields, the sectors that made the most substantial positive contributions to the Portfolio’s performance relative to the MSCI Emerging Markets Index during the reporting period included utilities, communication services and materials. During the same period, the sectors that detracted the most from the relative performance of the MacKay Shields portion of the Portfolio were consumer discretionary, financials and industrials.
During the reporting period, which individual stocks made the strongest positive contributions to the Portfolio’s absolute performance and which stocks detracted the most?
Candriam
In the Candriam portion of the Portfolio, the strongest positive contributions to absolute performance came from Chinese Internet and telecommunication services provider Tencent, Chinese e-commerce company JD.com and China’s third-largest e-commerce platform by user base Pinduoduo. Tencent benefited from increased social distancing, which generated
| 1 | See page 5 for more information on benchmark and peer group returns. |
| | |
| 8 | | MainStay VP Emerging Markets Equity Portfolio |
strong demand for online gaming and e-commerce. JD.com and Pinduoduo benefited from the surge in e-commerce demand due to the pandemic, which accelerated the shift to online purchases.
During the reporting period, the most substantial detractors from absolute performance in the Candriam portion of the Portfolio included shares in Brazilian oil and gas producer Petroleo Brasileiro, Indian financial company Bajaj Finance and Chinese coffeehouse chain Luckin Coffee. All showed negative total returns. Petroleo Brasileiro performed poorly due to low oil prices and a weak Brazilian market. Bajaj Finance shares declined in the face of growing asset-quality fears in a hard-hit Indian market. Luckin Coffee dropped sharply on fraud allegations concerning large fabricated transactions. The Portfolio’s position in Petroleo Brasileiro was reduced. Positions in both Bajaj Finance and Luckin Coffee were fully divested.
MacKay Shields
The stocks that made the most substantial positive contributions to the absolute performance of the MacKay Shields portion of the Portfolio during the reporting period included Chinese interactive media & online services provider Tencent, Chinese Internet & direct marketing retailer JD.com and Malaysian health care supplies company Top Glove. Over the same period, the stocks that detracted the most from the absolute performance of the MacKay Shields portion of the Portfolio were reinsurer IRB Brasil Resseguros, automotive retailer Petrobras Distribuidora and managed health care provider Notre Dame Intermedica Participacoes, all based in Brazil.
Did the Portfolio make any significant purchases or sales during the reporting period?
Candriam
The most significant purchase in the Candriam portion of the Portfolio during the reporting period was in shares of Brazilian bank Banco BTG Pactual. Banco BTG Pactual stock was one of the most substantial losers in Brazil’s pandemic-related market sell-off. The Portfolio started buying a position in mid-April as the stock bottomed, reflecting our opinion that the company is a high-beta,2 high-quality name, well positioned for Brazil’s eventual post-pandemic reopening. The Portfolio also added a position in Hong Kong-listed shares of Chinese information technology and e-commerce company Alibaba, while selling a similarly proportioned position in Alibaba’s China stock U.S. ADRs (American depository receipts) to limit the Portfolio’s China stock U.S. ADR exposure.
During the reporting period, significant sales in the Candriam portion of the Portfolio included partial positions in Alibaba U.S. ADRs (described above), Tencent (mentioned earlier) and
Chinese property development and investment company China Overseas Land & Investment. The Portfolio’s position in Tencent stock is capped at 5% for risk diversification purposes, which resulted in some profit taking following the stock’s strong performance. The Portfolio sold its position in China Overseas Land & Investment on disappointing performance and slower growth compared to the company’s mid-cap peers.
MacKay Shields
The most substantial position initiated in the MacKay Shields portion of the Portfolio during the reporting period was in South Korean online game company NCSOFT, while the largest increased position size was in Chinese Internet value-added service provider Tencent. During the same period, the most substantial position that the MacKay Shields portion of the Portfolio exited entirely was in Chinese real estate developer Sunac China Holdings, while the most significantly decreased position size was in Hong Kong-based oil & gas exploration & production company CNOOC.
How did the Portfolio’s sector weightings change during the reporting period?
Candriam
During the reporting period, the Candriam portion of the Portfolio saw its most substantial weighting increase relative to the MSCI Emerging Markets Index in the health care sector, with smaller increases in relative sector weighting in the industrials and consumer discretionary sectors. During the same period, the Candriam portion of the Portfolio saw a large decrease in its sector weightings relative to the benchmark in communication services, with smaller weighting reductions in financials and consumer staples.
MacKay Shields
In the MacKay Shields portion of the Portfolio, the most substantial increases in sector weightings relative to the MSCI Emerging Markets Index during the reporting period were in consumer staples and communication services. Over the same period, the MacKay Shields portion of the Portfolio saw its most substantial decreases in sector weightings relative to the benchmark in consumer discretionary and industrials.
How was the Portfolio positioned at the end of the reporting period?
Candriam
As of June 30, 2020, the sectors that were most substantially overweight relative to the MSCI Emerging Markets Index in the Candriam portion of the Portfolio were industrials, materials and
| 2 | Beta is a measure of volatility in relation to the market as a whole. A beta higher than 1 indicates that a security or portfolio will tend to exhibit higher volatility than the market. A beta lower than 1 indicates that a security or portfolio will tend to exhibit lower volatility than the market. |
information technology. As of the same date, the sectors that were most substantially underweight relative to the Index in the Candriam portion of the Portfolio were consumer staples and communication services.
MacKay Shields
As of June 30, 2020, the sectors in the MacKay Shields portion of the Portfolio that were most substantially overweight relative to the MSCI Emerging Markets Index were information
technology and consumer staples. As of the same date, the sectors in the MacKay Shields portion of the Portfolio that were most substantially underweight relative to the Index were consumer discretionary and industrials.
The opinions expressed are those of the portfolio managers as of the date of this report and are subject to change. There is no guarantee that any forecasts will come to pass. This material does not constitute investment advice and is not intended as an endorsement of any specific investment.
Not all MainStay VP Portfolios and/or share classes are available under all policies.
| | |
| 10 | | MainStay VP Emerging Markets Equity Portfolio |
Portfolio of Investments June 30, 2020 (Unaudited)
| | | | | | | | |
| | |
| | | Shares | | | Value | |
| Common Stocks 95.7%† | |
Argentina 0.4% | |
Banco Macro S.A., ADR (Banks) | | | 1,200 | | | $ | 22,260 | |
MercadoLibre, Inc. (Internet & Direct Marketing Retail) (a) | | | 1,320 | | | | 1,301,216 | |
| | | | | | | | |
| | | | | | | 1,323,476 | |
| | | | | | | | |
|
Brazil 5.3% | |
AES Tiete Energia S.A. (Independent Power & Renewable Electricity Producers) | | | 114,200 | | | | 329,490 | |
Afya, Ltd., Class A (Diversified Consumer Services) (a) | | | 29,000 | | | | 679,760 | |
B2W Cia Digital (Internet & Direct Marketing Retail) (a) | | | 14,100 | | | | 277,561 | |
B3 S.A.—Brasil Bolsa Balcao (Capital Markets) | | | 63,700 | | | | 645,305 | |
Banco BTG Pactual S.A. (Capital Markets) | | | 140,000 | | | | 1,969,438 | |
Banco do Brasil S.A. (Banks) | | | 134,600 | | | | 795,754 | |
Banco Santander Brasil S.A. (Banks) | | | 9,800 | | | | 50,495 | |
BB Seguridade Participacoes S.A. (Insurance) | | | 25,200 | | | | 126,368 | |
Camil Alimentos S.A. (Food Products) | | | 99,600 | | | | 205,497 | |
Centrais Eletricas Brasileiras S.A. (Electric Utilities) (a) | | | 3,800 | | | | 21,662 | |
Cia Brasileira de Distribuicao (Food & Staples Retailing) | | | 20,800 | | | | 271,489 | |
Cogna Educacao (Diversified Consumer Services) | | | 42,400 | | | | 51,537 | |
Cosan S.A. (Oil, Gas & Consumable Fuels) | | | 94,000 | | | | 1,225,884 | |
Enauta Participacoes S.A. (Oil, Gas & Consumable Fuels) | | | 193,900 | | | | 368,681 | |
Hapvida Participacoes e Investimentos S.A. (Health Care Providers & Services) (b) | | | 5,300 | | | | 60,591 | |
Hypera S.A. (Pharmaceuticals) | | | 9,000 | | | | 55,111 | |
Iochpe Maxion S.A. (Machinery) | | | 144,700 | | | | 359,748 | |
IRB Brasil Resseguros S.A. (Insurance) | | | 135,000 | | | | 273,073 | |
Localiza Rent a Car S.A. (Road & Rail) | | | 104,000 | | | | 782,376 | |
Lojas Renner S.A. (Multiline Retail) | | | 18,900 | | | | 145,275 | |
Magazine Luiza S.A. (Multiline Retail) | | | 125,400 | | | | 1,652,215 | |
Marfrig Global Foods S.A. (Food Products) (a) | | | 152,200 | | | | 352,925 | |
Notre Dame Intermedica Participacoes S.A. (Health Care Providers & Services) | | | 87,500 | | | | 1,094,293 | |
Petrobras Distribuidora S.A. (Specialty Retail) | | | 16,600 | | | | 65,782 | |
Petroleo Brasileiro S.A. (Oil, Gas & Consumable Fuels) | | | 171,500 | | | | 704,531 | |
SLC Agricola S.A. (Food Products) | | | 55,700 | | | | 241,724 | |
Suzano S.A. (Paper & Forest Products) (a) | | | 80,000 | | | | 541,219 | |
Vale S.A. (Metals & Mining) | | | 122,875 | | | | 1,263,524 | |
WEG S.A. (Electrical Equipment) | | | 78,000 | | | | 725,912 | |
XP, Inc, Class A (Capital Markets) (a) | | | 39,000 | | | | 1,638,390 | |
| | | | | | | | |
| | | | | | | 16,975,610 | |
| | | | | | | | |
| | | | | | | | |
| | |
| | | Shares | | | Value | |
|
Canada 0.5% | |
Atlas Corp (Marine) | | | 41,900 | | | $ | 318,440 | |
Pan American Silver Corp. (Metals & Mining) | | | 34,000 | | | | 1,033,260 | |
Suven Pharmaceuticals, Ltd. (Pharmaceuticals) (a) | | | 13,588 | | | | 85,353 | |
| | | | | | | | |
| | | | | | | 1,437,053 | |
| | | | | | | | |
|
Chile 0.6% | |
Enel Americas S.A. (Electric Utilities) | | | 6,255,610 | | | | 944,358 | |
Sociedad Quimica y Minera de Chile S.A., Sponsored ADR (Chemicals) | | | 36,000 | | | | 938,520 | |
| | | | | | | | |
| | | | | | | 1,882,878 | |
| | | | | | | | |
|
China 40.1% | |
21Vianet Group, Inc., ADR (IT Services) (a) | | | 22,200 | | | | 529,692 | |
360 Finance, Inc., ADR (Consumer Finance) (a) | | | 41,300 | | | | 442,323 | |
A-Living Services Co., Ltd., Class H (Commercial Services & Supplies) (b) | | | 148,000 | | | | 746,817 | |
Agricultural Bank of China, Ltd., Class H (Banks) | | | 433,000 | | | | 174,494 | |
Aier Eye Hospital Group Co., Ltd., Class A (Health Care Providers & Services) | | | 187,170 | | | | 1,154,307 | |
Alibaba Group Holding, Ltd. (Internet & Direct Marketing Retail) (a) | | | 116,000 | | | | 3,134,640 | |
Alibaba Group Holding, Ltd., Sponsored ADR (Internet & Direct Marketing Retail) (a) | | | 66,519 | | | | 14,348,148 | |
Alibaba Health Information Technology, Ltd. (Health Care Technology) (a) | | | 440,000 | | | | 1,285,139 | |
Anhui Conch Cement Co., Ltd., Class H (Construction Materials) | | | 232,500 | | | | 1,563,797 | |
ANTA Sports Products, Ltd. (Textiles, Apparel & Luxury Goods) | | | 42,000 | | | | 374,598 | |
BAIC Motor Corp., Ltd., Class H (Automobiles) (b) | | | 1,678,000 | | | | 730,509 | |
Baidu, Inc., Sponsored ADR (Interactive Media & Services) (a) | | | 6,600 | | | | 791,274 | |
Bank of China, Ltd., Class H (Banks) | | | 4,298,000 | | | | 1,589,551 | |
Bank of Ningbo Co., Ltd., Class A (Banks) | | | 269,916 | | | | 1,003,095 | |
Baozun, Inc., Sponsored ADR (Internet & Direct Marketing Retail) (a)(c) | | | 29,000 | | | | 1,115,050 | |
Bilibili, Inc., Sponsored ADR (Entertainment) (a) | | | 14,000 | | | | 648,480 | |
BYD Electronic International Co., Ltd. (Communications Equipment) (c) | | | 104,500 | | | | 239,497 | |
Central China Real Estate, Ltd. (Real Estate) | | | 397,000 | | | | 185,061 | |
China Aoyuan Group, Ltd. (Real Estate Management & Development) | | | 766,000 | | | | 927,483 | |
China CITIC Bank Corp., Ltd., Class H (Banks) | | | 1,203,000 | | | | 525,071 | |
China Construction Bank Corp., Class H (Banks) | | | 7,025,000 | | | | 5,676,759 | |
| | | | | | |
The notes to the financial statements are an integral part of,
and should be read in conjunction with, the financial statements. | | | | | 11 | |
Portfolio of Investments June 30, 2020 (Unaudited) (continued)
| | | | | | | | |
| | |
| | | Shares | | | Value | |
| Common Stocks (continued) | |
China (continued) | |
China Everbright Bank Co., Ltd., Class H (Banks) | | | 853,000 | | | $ | 320,486 | |
China Galaxy Securities Co., Ltd., Class H (Capital Markets) | | | 396,000 | | | | 214,300 | |
China Lesso Group Holdings, Ltd. (Building Products) | | | 320,000 | | | | 415,445 | |
China Life Insurance Co., Ltd., Class H (Insurance) | | | 270,000 | | | | 542,255 | |
China Lumena New Materials Corp. (Chemicals) (a)(c)(d)(e)(f) | | | 6,500 | | | | 0 | |
China Medical System Holdings, Ltd. (Pharmaceuticals) | | | 311,000 | | | | 366,709 | |
China Merchants Bank Co., Ltd., Class H (Banks) | | | 470,000 | | | | 2,164,710 | |
China Minsheng Banking Corp., Ltd., Class H (Banks) | | | 1,137,500 | | | | 781,386 | |
China Mobile, Ltd. (Wireless Telecommunication Services) | | | 127,000 | | | | 858,148 | |
China National Building Material Co., Ltd., Class H (Construction Materials) | | | 1,782,000 | | | | 1,899,524 | |
China Overseas Grand Oceans Group, Ltd. (Real Estate Management & Development) | | | 365,000 | | | | 206,077 | |
China Railway Group, Ltd., Class H (Construction & Engineering) | | | 1,040,000 | | | | 537,115 | |
China Shineway Pharmaceutical Group, Ltd. (Pharmaceuticals) | | | 119,000 | | | | 78,878 | |
China Tourism Group Duty Free Corp., Ltd., Class A (Specialty Retail) | | | 26,000 | | | | 569,490 | |
China Tower Corp., Ltd., Class H (Diversified Telecommunication Services) (b) | | | 1,400,000 | | | | 247,781 | |
China Traditional Chinese Medicine Holdings Co., Ltd. (Pharmaceuticals) | | | 1,410,000 | | | | 679,634 | |
Chlitina Holding, Ltd. (Personal Products) | | | 57,000 | | | | 418,289 | |
CIFI Holdings Group Co., Ltd. (Real Estate) | | | 600,000 | | | | 468,243 | |
CITIC, Ltd. (Industrial Conglomerates) | | | 749,000 | | | | 704,693 | |
CNOOC, Ltd. (Oil, Gas & Consumable Fuels) | | | 1,370,000 | | | | 1,538,644 | |
Consun Pharmaceutical Group, Ltd. (Pharmaceuticals) | | | 147,000 | | | | 60,614 | |
Contemporary Amperex Technology Co., Ltd., Class A (Electrical Equipment) | | | 45,906 | | | | 1,132,900 | |
Country Garden Services Holdings Co., Ltd. (Commercial Services & Supplies) | | | 194,000 | | | | 902,124 | |
ENN Energy Holdings, Ltd. (Gas Utilities) | | | 105,000 | | | | 1,179,272 | |
Far East Horizon, Ltd. (Diversified Financial Services) | | | 339,000 | | | | 288,038 | |
Geely Automobile Holdings, Ltd. (Automobiles) | | | 119,930 | | | | 188,303 | |
Great Wall Motor Co., Ltd., Class H (Automobiles) | | | 329,000 | | | | 206,272 | |
Hangzhou Tigermed Consulting Co., Ltd., Class A (Life Sciences Tools & Services) | | | 77,919 | | | | 1,123,178 | |
Hengli Petrochemical Co., Ltd., Class A (Chemicals) | | | 419,936 | | | | 831,753 | |
Hundsun Technologies, Inc., Class A (Software) | | | 108,904 | | | | 1,659,830 | |
Industrial & Commercial Bank of China, Ltd., Class H (Banks) | | | 2,184,000 | | | | 1,322,853 | |
| | | | | | | | |
| | |
| | | Shares | | | Value | |
China (continued) | |
Innovent Biologics, Inc. (Biotechnology) (a)(b) | | | 43,000 | | | $ | 319,380 | |
JD.com, Inc., ADR (Internet & Direct Marketing Retail) (a) | | | 86,252 | | | | 5,190,645 | |
Kaisa Group Holdings, Ltd. (Real Estate Management & Development) (a) | | | 883,000 | | | | 333,172 | |
Kingsoft Corp., Ltd. (Software) (c) | | | 38,000 | | | | 176,982 | |
KWG Group Holdings, Ltd. (Real Estate Management & Development) (a) | | | 372,500 | | | | 624,655 | |
Lepu Medical Technology Beijing Co., Ltd., Class A (Health Care Equipment & Supplies) | | | 59,997 | | | | 309,950 | |
Li Ning Co., Ltd. (Textiles, Apparel & Luxury Goods) | | | 210,000 | | | | 667,542 | |
Longfor Group Holdings, Ltd. (Real Estate Management & Development) (b) | | | 230,000 | | | | 1,095,505 | |
Luxshare Precision Industry Co., Ltd., Class A (Electronic Equipment, Instruments & Components) | | | 220,904 | | | | 1,605,734 | |
Luye Pharma Group, Ltd. (Pharmaceuticals) (b)(c) | | | 83,500 | | | | 51,118 | |
Meituan Dianping, Class B (Internet & Direct Marketing Retail) (a) | | | 171,350 | | | | 3,806,250 | |
NetEase, Inc., ADR (Entertainment) | | | 6,820 | | | | 2,928,372 | |
New Oriental Education & Technology Group, Inc., Sponsored ADR (Diversified Consumer Services) (a) | | | 10,600 | | | | 1,380,438 | |
Offcn Education Technology Co., Ltd., Class A (Diversified Consumer Services) | | | 164,000 | | | | 643,739 | |
PICC Property & Casualty Co., Ltd., Class H (Insurance) | | | 176,000 | | | | 144,793 | |
Pinduoduo, Inc., ADR (Internet & Direct Marketing Retail) (a) | | | 29,000 | | | | 2,489,360 | |
Ping An Insurance Group Co. of China, Ltd., Class H (Insurance) | | | 485,000 | | | | 4,843,722 | |
Postal Savings Bank of China Co., Ltd., Class H (Banks) (b) | | | 1,320,000 | | | | 758,718 | |
Powerlong Real Estate Holdings, Ltd. (Real Estate) | | | 644,000 | | | | 361,075 | |
Ronshine China Holdings, Ltd. (Real Estate) (a) | | | 11,000 | | | | 9,691 | |
Sany Heavy Industry Co., Ltd., Class A (Machinery) | | | 410,906 | | | | 1,090,725 | |
Seazen Group, Ltd. (Real Estate Management & Development) (a) | | | 498,000 | | | | 433,020 | |
Semiconductor Manufacturing International Corp. (Semiconductors & Semiconductor Equipment) (a)(c) | | | 169,500 | | | | 591,282 | |
Shandong Linglong Tyre Co., Ltd., Class A (Auto Components) | | | 269,900 | | | | 771,218 | |
Shandong Weigao Group Medical Polymer Co., Ltd., Class H (Health Care Equipment & Supplies) | | | 128,000 | | | | 284,405 | |
Shandong Xinhua Pharmaceutical Co., Ltd., Class H (Pharmaceuticals) | | | 56,000 | | | | 30,402 | |
| | | | |
| 12 | | MainStay VP Emerging Markets Equity Portfolio | | The notes to the financial statements are an integral part of,
and should be read in conjunction with, the financial statements. |
| | | | | | | | |
| | |
| | | Shares | | | Value | |
| Common Stocks (continued) | |
China (continued) | |
Shenzhen Inovance Technology Co., Ltd., Class A (Machinery) | | | 170,000 | | | $ | 913,518 | |
Shenzhen Mindray Bio-Medical Electronics Co., Ltd., Class A (Health Care Equipment & Supplies) | | | 12,000 | | | | 518,924 | |
Shimao Group Holdings, Ltd. (Real Estate) | | | 455,500 | | | | 1,930,308 | |
Sihuan Pharmaceutical Holdings Group, Ltd. (Pharmaceuticals) | | | 1,506,000 | | | | 143,676 | |
Silergy Corp. (Semiconductors & Semiconductor Equipment) | | | 28,800 | | | | 1,869,045 | |
Sinopec Engineering Group Co., Ltd., Class H (Construction & Engineering) | | | 129,500 | | | | 55,266 | |
Sinopharm Group Co., Ltd., Class H (Health Care Providers & Services) | | | 142,400 | | | | 364,937 | |
Sunny Optical Technology Group Co., Ltd. (Electronic Equipment, Instruments & Components) | | | 37,800 | | | | 603,239 | |
TAL Education Group, ADR (Diversified Consumer Services) (a) | | | 9,200 | | | | 629,096 | |
Tencent Holdings, Ltd. (Interactive Media & Services) | | | 273,600 | | | | 17,574,369 | |
Vipshop Holdings, Ltd., ADR (Internet & Direct Marketing Retail) (a) | | | 105,300 | | | | 2,096,523 | |
Weichai Power Co., Ltd., Class H (Machinery) | | | 120,000 | | | | 223,871 | |
Weiqiao Textile Co., Ltd., Class H (Textiles, Apparel & Luxury Goods) | | | 181,500 | | | | 32,277 | |
Wuxi Biologics Cayman, Inc. (Life Sciences Tools & Services) (a)(b) | | | 53,000 | | | | 971,116 | |
Xiaomi Corp., Class B (Technology Hardware, Storage & Peripherals) (a)(b) | | | 290,000 | | | | 481,128 | |
Xinyi Solar Holdings, Ltd. (Semiconductors & Semiconductor Equipment) | | | 1,130,000 | | | | 1,075,231 | |
Yantai Jereh Oilfield Services Group Co., Ltd., Class A (Energy Equipment & Services) | | | 185,948 | | | | 815,946 | |
Yealink Network Technology Corp., Ltd., Class A (Communications Equipment) | | | 72,000 | | | | 695,359 | |
YiChang HEC ChangJiang Pharmaceutical Co., Ltd., Class H (Pharmaceuticals) (b)(c) | | | 202,800 | | | | 413,977 | |
Yihai International Holding, Ltd. (Food Products) (a) | | | 128,000 | | | | 1,313,706 | |
Yonyou Network Technology Co., Ltd., Class A (Software) | | | 180,215 | | | | 1,118,392 | |
Yuexiu Property Co., Ltd. (Real Estate Management & Development) | | | 1,886,000 | | | | 336,100 | |
Yum China Holdings, Inc. (Hotels, Restaurants & Leisure) | | | 8,500 | | | | 408,595 | |
Zhejiang Dingli Machinery Co., Ltd., Class A (Machinery) | | | 111,994 | | | | 1,200,560 | |
Zhongsheng Group Holdings, Ltd. (Specialty Retail) | | | 220,000 | | | | 1,227,574 | |
| | | | | | | | |
| | |
| | | Shares | | | Value | |
China (continued) | |
ZTO Express Cayman, Inc., ADR (Air Freight & Logistics) | | | 31,000 | | | $ | 1,138,010 | |
| | | | | | | | |
| | | | | | | 128,185,365 | |
| | | | | | | | |
|
Colombia 0.4% | |
Bancolombia S.A., Sponsored ADR (Banks) | | | 31,000 | | | | 815,610 | |
Corp. Financiera Colombiana S.A. (Diversified Financial Services) (a) | | | 9,604 | | | | 70,995 | |
Grupo Argos S.A. (Construction Materials) | | | 22,401 | | | | 59,013 | |
Interconexion Electrica S.A. E.S.P. (Electric Utilities) | | | 72,642 | | | | 363,403 | |
| | | | | | | | |
| | | | | | | 1,309,021 | |
| | | | | | | | |
Egypt 0.0% ‡ | |
Commercial International Bank Egypt S.A.E., GDR (Banks) | | | 9,497 | | | | 36,658 | |
| | | | | | | | |
Greece 0.2% | |
FF Group (Textiles, Apparel & Luxury Goods) (a)(d)(e)(f) | | | 19,000 | | | | 51,232 | |
Public Power Corp. S.A. (Electric Utilities) (a) | | | 109,213 | | | | 425,901 | |
| | | | | | | | |
| | | | | | | 477,133 | |
| | | | | | | | |
Hong Kong 1.1% | |
China Metal Recycling Holdings, Ltd. (Metals & Mining) (a)(d)(e)(f) | | | 75,000 | | | | 0 | |
China Resources Cement Holdings, Ltd. (Construction Materials) | | | 236,000 | | | | 291,288 | |
Hong Kong Exchanges & Clearing, Ltd. (Capital Markets) | | | 7,000 | | | | 298,331 | |
Kingboard Laminates Holdings, Ltd. (Electronic Equipment, Instruments & Components) | | | 656,500 | | | | 658,763 | |
NetDragon Websoft Holdings, Ltd. (Entertainment) | | | 135,000 | | | | 379,395 | |
Nine Dragons Paper Holdings, Ltd. (Paper & Forest Products) | | | 700,000 | | | | 636,044 | |
Techtronic Industries Co., Ltd. (Machinery) | | | 62,000 | | | | 604,855 | |
Xinyi Glass Holdings, Ltd. (Auto Components) | | | 640,000 | | | | 787,176 | |
| | | | | | | | |
| | | | | | | 3,655,852 | |
| | | | | | | | |
India 7.1% | |
Alkem Laboratories, Ltd. (Pharmaceuticals) | | | 7,110 | | | | 223,648 | |
Asian Paints, Ltd. (Chemicals) | | | 27,000 | | | | 607,010 | |
Aurobindo Pharma, Ltd. (Pharmaceuticals) | | | 34,849 | | | | 356,177 | |
Avanti Feeds, Ltd. (Food Products) | | | 46,335 | | | | 312,329 | |
Avenue Supermarts, Ltd. (Food & Staples Retailing) (a)(b) | | | 13,175 | | | | 400,778 | |
Bharat Petroleum Corp., Ltd. (Oil, Gas & Consumable Fuels) | | | 7,431 | | | | 36,962 | |
Bharti Airtel, Ltd. (Wireless Telecommunication Services) (a) | | | 58,544 | | | | 434,058 | |
Bharti Infratel, Ltd. (Diversified Telecommunication Services) | | | 36,421 | | | | 106,849 | |
| | | | | | |
The notes to the financial statements are an integral part of,
and should be read in conjunction with, the financial statements. | | | | | 13 | |
Portfolio of Investments June 30, 2020 (Unaudited) (continued)
| | | | | | | | |
| | |
| | | Shares | | | Value | |
| Common Stocks (continued) | |
India (continued) | |
Biocon, Ltd. (Biotechnology) | | | 192,000 | | | $ | 994,911 | |
Cipla, Ltd. (Pharmaceuticals) | | | 3,783 | | | | 32,244 | |
Divi’s Laboratories, Ltd. (Life Sciences Tools & Services) | | | 4,574 | | | | 138,376 | |
Dr. Reddy’s Laboratories, Ltd. (Pharmaceuticals) | | | 18,749 | | | | 986,227 | |
GAIL India, Ltd. (Gas Utilities) | | | 301,039 | | | | 408,639 | |
HCL Technologies, Ltd. (IT Services) | | | 23,568 | | | | 174,676 | |
HDFC Bank, Ltd. (Banks) | | | 88,000 | | | | 1,255,111 | |
Hindustan Petroleum Corp., Ltd. (Oil, Gas & Consumable Fuels) | | | 117,246 | | | | 337,481 | |
Hindustan Unilever, Ltd. (Household Products) | | | 34,609 | | | | 998,982 | |
Housing Development Finance Corp., Ltd. (Thrifts & Mortgage Finance) | | | 43,556 | | | | 1,025,349 | |
ICICI Bank, Ltd. (Banks) | | | 229,720 | | | | 1,066,526 | |
ICICI Lombard General Insurance Co., Ltd. (Insurance) (b) | | | 42,000 | | | | 710,274 | |
ICICI Securities, Ltd. (Capital Markets) (b) | | | 2,662 | | | | 16,698 | |
Indiabulls Ventures, Ltd. (Capital Markets) | | | 58,021 | | | | 90,207 | |
Info Edge India, Ltd. (Interactive Media & Services) | | | 26,000 | | | | 951,252 | |
Infosys, Ltd. (IT Services) | | | 67,397 | | | | 655,715 | |
Ipca Laboratories, Ltd. (Pharmaceuticals) | | | 6,435 | | | | 142,584 | |
JSW Steel, Ltd. (Metals & Mining) | | | 200,000 | | | | 504,207 | |
Jubilant Foodworks, Ltd. (Hotels, Restaurants & Leisure) | | | 38,000 | | | | 872,432 | |
Max Financial Services, Ltd. (Insurance) (a) | | | 17,310 | | | | 123,000 | |
Nestle India, Ltd. (Food Products) | | | 1,183 | | | | 268,909 | |
Petronet LNG, Ltd. (Oil, Gas & Consumable Fuels) | | | 360,000 | | | | 1,245,183 | |
Piramal Enterprises, Ltd. (Pharmaceuticals) | | | 2,410 | | | | 43,984 | |
Power Grid Corp. of India, Ltd. (Electric Utilities) | | | 22,979 | | | | 53,476 | |
REC, Ltd. (Diversified Financial Services) | | | 295,110 | | | | 422,743 | |
Reliance Industries, Ltd. (Oil, Gas & Consumable Fuels) | | | 242,273 | | | | 5,486,575 | |
Reliance Industries, Ltd. (Oil, Gas & Consumable Fuels) (a) | | | 10,933 | | | | 115,826 | |
State Bank of India (Banks) (a) | | | 165,142 | | | | 392,247 | |
Tata Consultancy Services, Ltd. (IT Services) | | | 8,757 | | | | 242,736 | |
Tata Consumer Products, Ltd. (Food Products) | | | 82,000 | | | | 422,445 | |
UPL, Ltd. (Chemicals) | | | 28,703 | | | | 162,709 | |
| | | | | | | | |
| | | | | | | 22,819,535 | |
| | | | | | | | |
Indonesia 1.2% | |
PT Adaro Energy Tbk (Oil, Gas & Consumable Fuels) | | | 8,248,900 | | | | 575,266 | |
PT Bank Central Asia Tbk (Banks) | | | 560,000 | | | | 1,116,786 | |
PT Gudang Garam Tbk (Tobacco) | | | 256,300 | | | | 846,580 | |
PT Indah Kiat Pulp & Paper Corp. Tbk (Paper & Forest Products) | | | 1,400,000 | | | | 586,256 | |
PT Indofood Sukses Makmur Tbk (Food Products) | | | 1,168,800 | | | | 534,220 | |
PT United Tractors Tbk (Oil, Gas & Consumable Fuels) | | | 236,600 | | | | 274,304 | |
| | | | | | | | |
| | | | | | | 3,933,412 | |
| | | | | | | | |
| | | | | | | | |
| | |
| | | Shares | | | Value | |
Luxembourg 0.1% | |
Reinet Investments SCA (Capital Markets) | | | 23,152 | | | $ | 406,282 | |
| | | | | | | | |
Malaysia 1.5% | |
AMMB Holdings BHD (Banks) | | | 506,200 | | | | 368,738 | |
Dialog Group BHD (Energy Equipment & Services) | | | 1,300,000 | | | | 1,101,466 | |
Hartalega Holdings BHD (Health Care Equipment & Supplies) | | | 546,200 | | | | 1,668,144 | |
Kuala Lumpur Kepong BHD (Food Products) | | | 10,900 | | | | 56,585 | |
MISC BHD (Marine) | | | 319,100 | | | | 571,166 | |
Telekom Malaysia BHD (Diversified Telecommunication Services) | | | 145,600 | | | | 141,651 | |
Top Glove Corp. BHD (Health Care Equipment & Supplies) | | | 210,300 | | | | 795,133 | |
| | | | | | | | |
| | | | | | | 4,702,883 | |
| | | | | | | | |
Mexico 1.1% | |
Aleatica, S.A.B. de C.V. (Transportation Infrastructure) | | | 44,500 | | | | 38,702 | |
Alsea S.A.B. de C.V. (Hotels, Restaurants & Leisure) (a) | | | 790,000 | | | | 777,128 | |
America Movil S.A.B. de C.V., Series L (Wireless Telecommunication Services) | | | 378,300 | | | | 243,098 | |
Gruma S.A.B. de C.V., Class B (Food Products) | | | 66,885 | | | | 724,999 | |
Grupo Comercial Chedraui S.A. de C.V. (Food & Staples Retailing) | | | 45,200 | | | | 53,431 | |
Grupo Mexico S.A.B. de C.V., Series B (Metals & Mining) | | | 363,400 | | | | 844,289 | |
Industrias Bachoco S.A.B. de C.V., Series B (Food Products) | | | 12,700 | | | | 37,032 | |
Infraestructura Energetica Nova S.A.B. de C.V. (Gas Utilities) | | | 107,300 | | | | 308,626 | |
Wal-Mart de Mexico S.A.B. de C.V. (Food & Staples Retailing) | | | 179,500 | | | | 429,294 | |
| | | | | | | | |
| | | | | | | 3,456,599 | |
| | | | | | | | |
Peru 0.9% | |
Credicorp, Ltd. (Banks) | | | 6,200 | | | | 828,754 | |
Southern Copper Corp. (Metals & Mining) | | | 48,000 | | | | 1,908,960 | |
| | | | | | | | |
| | | | | | | 2,737,714 | |
| | | | | | | | |
Philippines 0.4% | |
Cebu Air, Inc. (Airlines) | | | 7,160 | | | | 5,686 | |
First Gen Corp. (Independent Power & Renewable Electricity Producers) | | | 61,400 | | | | 30,158 | |
Globe Telecom, Inc. (Wireless Telecommunication Services) | | | 10,091 | | | | 417,101 | |
Metro Pacific Investments Corp. (Diversified Financial Services) | | | 4,035,000 | | | | 301,547 | |
PLDT, Inc. (Wireless Telecommunication Services) | | | 22,455 | | | | 560,291 | |
| | | | | | | | |
| | | | | | | 1,314,783 | |
| | | | | | | | |
| | | | |
| 14 | | MainStay VP Emerging Markets Equity Portfolio | | The notes to the financial statements are an integral part of,
and should be read in conjunction with, the financial statements. |
| | | | | | | | |
| | |
| | | Shares | | | Value | |
| Common Stocks (continued) | |
Poland 1.4% | |
Asseco Poland S.A. (Software) | | | 22,497 | | | $ | 375,183 | |
CCC S.A. (Textiles, Apparel & Luxury Goods) | | | 48,000 | | | | 723,422 | |
CD Projekt S.A. (Entertainment) | | | 13,754 | | | | 1,371,845 | |
Dino Polska S.A. (Food & Staples Retailing) (a)(b) | | | 20,000 | | | | 1,013,502 | |
Enea S.A. (Electric Utilities) (a) | | | 156,185 | | | | 282,539 | |
Eurocash S.A. (Food & Staples Retailing) | | | 54,437 | | | | 238,232 | |
PLAY Communications S.A. (Wireless Telecommunication Services) (b) | | | 51,845 | | | | 397,619 | |
Polski Koncern Naftowy ORLEN S.A. (Oil, Gas & Consumable Fuels) | | | 11,632 | | | | 183,988 | |
| | | | | | | | |
| | | | | | | 4,586,330 | |
| | | | | | | | |
Republic of Korea 11.7% | |
BNK Financial Group, Inc. (Banks) | | | 14,334 | | | | 59,562 | |
Celltrion, Inc. (Biotechnology) (a) | | | 4,800 | | | | 1,229,972 | |
CJ CheilJedang Corp. (Food Products) | | | 3,550 | | | | 970,916 | |
Daelim Industrial Co., Ltd. (Construction & Engineering) | | | 10,559 | | | | 729,198 | |
E-MART, Inc. (Food & Staples Retailing) | | | 286 | | | | 25,292 | |
GS Engineering & Construction Corp. (Construction & Engineering) | | | 27,086 | | | | 559,786 | |
GS Holdings Corp. (Oil, Gas & Consumable Fuels) | | | 2,270 | | | | 68,388 | |
Hana Financial Group, Inc. (Banks) | | | 44,566 | | | | 1,014,454 | |
Hyundai Marine & Fire Insurance Co., Ltd. (Insurance) | | | 60,000 | | | | 1,142,043 | |
Industrial Bank of Korea (Banks) | | | 56,530 | | | | 383,917 | |
Kakao Corp. (Interactive Media & Services) | | | 6,200 | | | | 1,392,089 | |
KB Financial Group, Inc. (Banks) | | | 94,166 | | | | 2,692,445 | |
Kia Motors Corp. (Automobiles) | | | 7,571 | | | | 204,157 | |
Korea Investment Holdings Co., Ltd. (Capital Markets) | | | 25,484 | | | | 942,311 | |
LG Chem, Ltd. (Chemicals) | | | 1,700 | | | | 702,370 | |
LG Household & Health Care, Ltd. (Personal Products) | | | 500 | | | | 559,387 | |
MegaStudyEdu Co., Ltd. (Diversified Consumer Services) | | | 727 | | | | 21,646 | |
Meritz Securities Co., Ltd. (Capital Markets) | | | 143,177 | | | | 364,689 | |
Mirae Asset Life Insurance Co., Ltd. (Insurance) | | | 7,280 | | | | 16,158 | |
NAVER Corp. (Interactive Media & Services) | | | 6,300 | | | | 1,412,883 | |
NCSoft Corp. (Entertainment) | | | 3,374 | | | | 2,516,947 | |
Orion Corp. (Food Products) | | | 5,600 | | | | 628,572 | |
POSCO (Metals & Mining) | | | 3,607 | | | | 521,604 | |
Samsung Biologics Co., Ltd. (Life Sciences Tools & Services) (a)(b) | | | 1,700 | | | | 1,103,488 | |
Samsung C&T Corp. (Industrial Conglomerates) | | | 9,000 | | | | 876,990 | |
Samsung Electro-Mechanics Co., Ltd. (Electronic Equipment, Instruments & Components) | | | 6,200 | | | | 672,761 | |
Samsung Electronics Co., Ltd. (Technology Hardware, Storage & Peripherals) | | | 260,023 | | | | 11,526,594 | |
Samsung Engineering Co., Ltd. (Construction & Engineering) (a) | | | 56,000 | | | | 578,744 | |
| | | | | | | | |
| | |
| | | Shares | | | Value | |
Republic of Korea (continued) | |
Samsung SDI Co., Ltd. (Electronic Equipment, Instruments & Components) | | | 4,908 | | | $ | 1,501,015 | |
SK Gas, Ltd. (Oil, Gas & Consumable Fuels) | | | 909 | | | | 56,319 | |
SK Hynix, Inc. (Semiconductors & Semiconductor Equipment) | | | 36,400 | | | | 2,603,926 | |
Tongyang Life Insurance Co., Ltd. (Insurance) | | | 38,341 | | | | 92,566 | |
Woori Financial Group, Inc. (Banks) | | | 24,399 | | | | 180,768 | |
| | | | | | | | |
| | | | | | | 37,351,957 | |
| | | | | | | | |
Russia 3.8% | |
Gazprom PJSC, Sponsored ADR (Oil, Gas & Consumable Fuels) | | | 272,044 | | | | 1,474,479 | |
LUKOIL PJSC, Sponsored ADR (Oil, Gas & Consumable Fuels) | | | 1,279 | | | | 94,927 | |
MMC Norilsk Nickel PJSC (Metals & Mining) | | | 3,600 | | | | 949,580 | |
MMC Norilsk Nickel PJSC ADR (Metals & Mining) | | | 23,611 | | | | 621,678 | |
Novatek PJSC, Sponsored GDR (Oil, Gas & Consumable Fuels) | | | 442 | | | | 62,852 | |
Polymetal International PLC (Metals & Mining) | | | 83,138 | | | | 1,665,392 | |
Polyus PJSC (Metals & Mining) (a) | | | 7,600 | | | | 1,285,061 | |
QIWI PLC, Sponsored ADR (IT Services) | | | 31,000 | | | | 536,920 | |
Sberbank of Russia PJSC, Sponsored ADR (Banks) | | | 123,813 | | | | 1,404,039 | |
Surgutneftegas PJSC, Sponsored ADR (Oil, Gas & Consumable Fuels) | | | 174,857 | | | | 934,611 | |
Tatneft PJSC (Oil, Gas & Consumable Fuels) | | | 86,000 | | | | 671,759 | |
TCS Group Holding PLC (Banks) | | | 54,000 | | | | 1,096,200 | |
Yandex N.V., Class A (Interactive Media & Services) (a) | | | 26,000 | | | | 1,300,520 | |
| | | | | | | | |
| | | | | | | 12,098,018 | |
| | | | | | | | |
South Africa 4.3% | |
AngloGold Ashanti, Ltd. (Metals & Mining) | | | 57,205 | | | | 1,679,691 | |
Astral Foods, Ltd. (Food Products) | | | 35,461 | | | | 298,235 | |
Capitec Bank Holdings, Ltd. (Banks) | | | 10,000 | | | | 494,618 | |
DataTec, Ltd. (Electronic Equipment, Instruments & Components) | | | 154,298 | | | | 236,383 | |
DRDGOLD, Ltd. (Metals & Mining) | | | 122,724 | | | | 191,401 | |
Gold Fields, Ltd. (Metals & Mining) | | | 38,473 | | | | 363,724 | |
Impala Platinum Holdings, Ltd. (Metals & Mining) | | | 160,382 | | | | 1,071,296 | |
Kumba Iron Ore, Ltd. (Metals & Mining) | | | 37,536 | | | | 1,002,463 | |
MTN Group, Ltd. (Wireless Telecommunication Services) (c) | | | 202,994 | | | | 617,547 | |
Naspers, Ltd. (Internet & Direct Marketing Retail) | | | 36,772 | | | | 6,708,326 | |
Old Mutual, Ltd. (Insurance) | | | 611,169 | | | | 423,833 | |
Sibanye Stillwater, Ltd. (Metals & Mining) (a) | | | 227,911 | | | | 495,984 | |
Vodacom Group, Ltd. (Wireless Telecommunication Services) (c) | | | 35,303 | | | | 250,045 | |
Wilson Bayly Holmes-Ovcon, Ltd. (Construction & Engineering) | | | 9,020 | | | | 52,488 | |
| | | | | | | | |
| | | | | | | 13,886,034 | |
| | | | | | | | |
| | | | | | |
The notes to the financial statements are an integral part of,
and should be read in conjunction with, the financial statements. | | | | | 15 | |
Portfolio of Investments June 30, 2020 (Unaudited) (continued)
| | | | | | | | |
| | |
| | | Shares | | | Value | |
| Common Stocks (continued) | |
Spain 0.0% ‡ | |
Banco Santander S.A. (Banks) (a) | | | 18,499 | | | $ | 45,667 | |
| | | | | | | | |
Taiwan 11.6% | |
Accton Technology Corp. (Communications Equipment) | | | 126,000 | | | | 971,534 | |
Airtac International Group (Machinery) | | | 105,000 | | | | 1,851,924 | |
Asia Cement Corp. (Construction Materials) | | | 226,000 | | | | 333,383 | |
ASPEED Technology, Inc. (Semiconductors & Semiconductor Equipment) | | | 18,800 | | | | 788,767 | |
Asustek Computer, Inc. (Technology Hardware, Storage & Peripherals) | | | 133,000 | | | | 972,467 | |
Cathay Financial Holding Co., Ltd. (Insurance) | | | 370,000 | | | | 524,068 | |
Chailease Holding Co., Ltd. (Diversified Financial Services) | | | 436,800 | | | | 1,844,334 | |
ChipMOS Technologies, Inc. (Semiconductors & Semiconductor Equipment) | | | 65,000 | | | | 74,326 | |
CTBC Financial Holding Co., Ltd. (Banks) | | | 1,418,000 | | | | 975,817 | |
E.Sun Financial Holding Co., Ltd. (Banks) | | | 1,800,000 | | | | 1,691,413 | |
Fubon Financial Holding Co., Ltd. (Insurance) | | | 193,000 | | | | 286,587 | |
Globalwafers Co., Ltd. (Semiconductors & Semiconductor Equipment) | | | 35,000 | | | | 476,863 | |
Hon Hai Precision Industry Co., Ltd. (Electronic Equipment, Instruments & Components) | | | 155,892 | | | | 455,014 | |
International Games System Co., Ltd. (Entertainment) | | | 21,000 | | | | 524,858 | |
Largan Precision Co., Ltd. (Electronic Equipment, Instruments & Components) | | | 2,000 | | | | 275,997 | |
MediaTek, Inc. (Semiconductors & Semiconductor Equipment) | | | 91,000 | | | | 1,780,490 | |
Pegatron Corp. (Technology Hardware, Storage & Peripherals) | | | 252,000 | | | | 545,436 | |
Powertech Technology, Inc. (Semiconductors & Semiconductor Equipment) | | | 359,000 | | | | 1,298,727 | |
Realtek Semiconductor Corp. (Semiconductors & Semiconductor Equipment) | | | 86,000 | | | | 868,932 | |
Ruentex Industries, Ltd. (Textiles, Apparel & Luxury Goods) | | | 251,000 | | | | 601,477 | |
Sino-American Silicon Products, Inc. (Semiconductors & Semiconductor Equipment) | | | 125,000 | | | | 404,924 | |
Standard Foods Corp. (Food Products) | | | 75,000 | | | | 159,955 | |
TaiDoc Technology Corp. (Health Care Equipment & Supplies) (a) | | | 43,000 | | | | 399,094 | |
Taiwan Semiconductor Manufacturing Co., Ltd. (Semiconductors & Semiconductor Equipment) | | | 1,471,000 | | | | 15,566,181 | |
United Microelectronics Corp. (Semiconductors & Semiconductor Equipment) | | | 1,819,000 | | | | 978,575 | |
Wistron Corp. (Technology Hardware, Storage & Peripherals) | | | 427,000 | | | | 516,601 | |
| | | | | | | | |
| | |
| | | Shares | | | Value | |
Taiwan (continued) | |
Wiwynn Corp. (Technology Hardware, Storage & Peripherals) | | | 33,600 | | | $ | 911,242 | |
Yageo Corp. (Electronic Equipment, Instruments & Components) | | | 71,000 | | | | 913,795 | |
Yuanta Financial Holding Co., Ltd. (Diversified Financial Services) | | | 264,000 | | | | 155,690 | |
| | | | | | | | |
| | | | | | | 37,148,471 | |
| | | | | | | | |
Thailand 1.1% | |
Airports of Thailand PCL, NVDR (Transportation Infrastructure) | | | 340,000 | | | | 666,819 | |
Berli Jucker PCL, NVDR (Food & Staples Retailing) | | | 128,100 | | | | 163,812 | |
Carabao Group PCL, NVDR (Beverages) | | | 118,700 | | | | 399,685 | |
Charoen Pokphand Foods PCL, NVDR (Food Products) | | | 979,000 | | | | 1,007,162 | |
Krung Thai Bank PCL, NVDR (Banks) | | | 1,091,800 | | | | 364,170 | |
PTT PCL, NVDR (Oil, Gas & Consumable Fuels) | | | 205,900 | | | | 252,003 | |
Srisawad Corp. PCL, NVDR (Consumer Finance) (a) | | | 480,000 | | | | 811,395 | |
| | | | | | | | |
| | | | | | | 3,665,046 | |
| | | | | | | | |
Turkey 0.6% | |
BIM Birlesik Magazalar A/S (Food & Staples Retailing) | | | 12,416 | | | | 123,163 | |
Enerjisa Enerji A/S (Electric Utilities) (b) | | | 314,244 | | | | 394,158 | |
Eregli Demir ve Celik Fabrikalari TAS (Metals & Mining) | | | 126,207 | | | | 157,936 | |
Haci Omer Sabanci Holding A/S (Diversified Financial Services) | | | 421,536 | | | | 568,075 | |
Turk Hava Yollari AO (Airlines) (a) | | | 300,000 | | | | 547,748 | |
| | | | | | | | |
| | | | | | | 1,791,080 | |
| | | | | | | | |
United States 0.3% | |
EPAM Systems, Inc. (IT Services) (a) | | | 2,800 | | | | 705,628 | |
Trip.com Group, Ltd., ADR (Internet & Direct Marketing Retail) (a) | | | 11,200 | | | | 290,304 | |
| | | | | | | | |
| | | | | | | 995,932 | |
| | | | | | | | |
Total Common Stocks
(Cost $270,674,581) | | | | 306,222,789 | |
| | | | | | | | |
|
| Exchange-Traded Funds 1.4% | |
United States 1.4% | |
iShares MSCI Saudi Arabia ETF (Capital Markets) | | | 59,696 | | | | 1,571,199 | |
Xtrackers Harvest CSI 300 China A-Shares ETF (Capital Markets) (c) | | | 104,799 | | | | 3,113,578 | |
| | | | | | | | |
Total Exchange-Traded Funds
(Cost $4,790,544) | | | | 4,684,777 | |
| | | | | | | | |
| | | | |
| 16 | | MainStay VP Emerging Markets Equity Portfolio | | The notes to the financial statements are an integral part of,
and should be read in conjunction with, the financial statements. |
| | | | | | | | |
| | |
| | | Shares | | | Value | |
|
| Preferred Stocks 1.8% | |
Brazil 0.5% | |
Lojas Americanas S.A.
0.51% (Multiline Retail) | | | 17,900 | | | $ | 105,924 | |
Petroleo Brasileiro S.A. 3.09% (Oil, Gas & Consumable Fuels) | | | 351,200 | | | | 1,391,729 | |
| | | | | | | | |
| | | | | | | 1,497,653 | |
| | | | | | | | |
Colombia 0.0% ‡ | |
Grupo Aval Acciones y Valores S.A.
3.97% (Banks) | | | 135,907 | | | | 30,016 | |
| | | | | | | | |
Republic of Korea 1.3% | |
Amorepacific Corp.
1.21% (Personal Products) | | | 895 | | | | 53,297 | |
Hyundai Motor Co.
1.30% (Automobiles) | | | 7,650 | | | | 365,361 | |
Hyundai Motor Co.
1.43% (Automobiles) | | | 12,620 | | | | 583,818 | |
LG Household & Health Care, Ltd.
1.18% (Personal Products) | | | 644 | | | | 390,274 | |
Samsung Electronics Co., Ltd. 2.19% (Technology Hardware, Storage & Peripherals) | | | 73,500 | | | | 2,870,336 | |
| | | | | | | | |
| | | | | | | 4,263,086 | |
| | | | | | | | |
Total Preferred Stocks
(Cost $6,904,565) | | | | 5,790,755 | |
| | | | | | | | |
| | | | | | | | | | | | |
| Short-Term Investments 0.9% | |
Affiliated Investment Company 0.1% | |
MainStay U.S. Government Liquidity Fund, 0.05% (g) | | | 173,638 | | | | 173,638 | |
| | | | | | | | | | | | |
Unaffiliated Investment Company 0.8% | |
State Street Navigator Securities Lending Government Money Market Portfolio, 0.13% (g)(h) | | | 2,608,358 | | | | 2,608,358 | |
| | | | | | | | | | | | |
Total Short-Term Investments
(Cost $2,781,996) | | | | 2,781,996 | |
| | | | | | | | | | | | |
Total Investments
(Cost $285,151,686) | | | 99.8 | % | | | 319,480,317 | |
Other Assets, Less Liabilities | | | 0.2 | | | | 490,462 | |
Net Assets | | | 100.0 | % | | $ | 319,970,779 | |
| † | Percentages indicated are based on Portfolio net assets. |
| ‡ | Less than one-tenth of a percent. |
| (a) | Non-income producing security. |
| (b) | May be sold to institutional investors only under Rule 144A or securities offered pursuant to Section 4(a)(2) of the Securities Act of 1933, as amended. |
| (c) | All or a portion of this security was held on loan. As of June 30, 2020, the aggregate market value of securities on loan was $5,636,646; the total market value of collateral held by the Portfolio was $5,799,543. The market value of the collateral held included non-cash collateral in the form of U.S. Treasury securities with a value of $3,191,185 (See Note 2(N)). |
| (d) | Fair valued security—Represents fair value as measured in good faith under procedures approved by the Board of Trustees. As of June 30, 2020, the total market value of fair valued securities was $51,232, which represented less than one-tenth of a percent of the Portfolio’s net assets. |
| (e) | Security in which significant unobservable inputs (Level 3) were used in determining fair value. |
| (f) | Illiquid security—As of June 30, 2020, the total market value of these securities deemed illiquid under procedures approved by the Board of Trustees was $51,232, which represented less than one-tenth of a percent of the Portfolio’s net assets. |
| (g) | Current yield as of June 30, 2020. |
| (h) | Represents a security purchased with cash collateral received for securities on loan. |
The following abbreviations are used in the preceding pages:
ADR—American Depositary Receipt
ETF—Exchange-Traded Fund
GDR—Global Depositary Receipt
NVDR—Non-Voting Depositary Receipt
PCL—Provision for Credit Losses
| | | | | | |
The notes to the financial statements are an integral part of,
and should be read in conjunction with, the financial statements. | | | | | 17 | |
Portfolio of Investments June 30, 2020 (Unaudited) (continued)
The following is a summary of the fair valuations according to the inputs used as of June 30, 2020, for valuing the Portfolio’s assets:
| | | | | | | | | | | | | | | | |
Description | | Quoted
Prices in
Active
Markets for
Identical
Assets (Level 1) | | | Significant
Other
Observable
Inputs (Level 2) | | | Significant
Unobservable
Inputs (Level 3) | | | Total | |
|
Asset Valuation Inputs | |
| Investments in Securities (a) | | | | | |
| Common Stocks: (b) | | | | | |
| China | | $ | 36,905,818 | | | $ | 91,279,547 | | | $ | — | | | $ | 128,185,365 | |
| Greece | | | — | | | | 425,901 | | | | 51,232 | | | | 477,133 | |
| Hong Kong | | | — | | | | 3,655,852 | | | | — | | | | 3,655,852 | |
| India | | | 1,102,053 | | | | 21,717,482 | | | | — | | | | 22,819,535 | |
| Indonesia | | | — | | | | 3,933,412 | | | | — | | | | 3,933,412 | |
| Luxembourg | | | — | | | | 406,282 | | | | — | | | | 406,282 | |
| Malaysia | | | — | | | | 4,702,883 | | | | — | | | | 4,702,883 | |
| Philippines | | | — | | | | 1,314,783 | | | | — | | | | 1,314,783 | |
| Poland | | | — | | | | 4,586,330 | | | | — | | | | 4,586,330 | |
| Republic of Korea | | | 25,292 | | | | 37,326,665 | | | | — | | | | 37,351,957 | |
| Russia | | | 10,432,626 | | | | 1,665,392 | | | | — | | | | 12,098,018 | |
| South Africa | | | 363,724 | | | | 13,522,310 | | | | — | | | | 13,886,034 | |
| Taiwan | | | 2,271,195 | | | | 34,877,276 | | | | — | | | | 37,148,471 | |
| Thailand | | | — | | | | 3,665,046 | | | | — | | | | 3,665,046 | |
| Turkey | | | — | | | | 1,791,080 | | | | — | | | | 1,791,080 | |
| All Other Countries | | | 30,200,608 | | | | — | | | | — | | | | 30,200,608 | |
| | | | | | | | | | | | | | | | |
| Total Common Stocks (b) | | | 81,301,316 | | | | 224,870,241 | | | | 51,232 | | | | 306,222,789 | |
| | | | | | | | | | | | | | | | |
| Exchange-Traded Funds | | | 4,684,777 | | | | — | | | | — | | | | 4,684,777 | |
| Preferred Stocks | | | 1,527,669 | | | | 4,263,086 | | | | — | | | | 5,790,755 | |
| Short-Term Investments | | | | | | | | | |
| Affiliated Investment Company | | | 173,638 | | | | — | | | | — | | | | 173,638 | |
| Unaffiliated Investment Company | | | 2,608,358 | | | | — | | | | — | | | | 2,608,358 | |
| | | | | | | | | | | | | | | | |
| Total Short-Term Investments | | | 2,781,996 | | | | — | | | | — | | | | 2,781,996 | |
| | | | | | | | | | | | | | | | |
| Total Investments in Securities | | $ | 90,295,758 | | | $ | 229,133,327 | | | $ | 51,232 | | | $ | 319,480,317 | |
| | | | | | | | | | | | | | | | |
| (a) | For a complete listing of investments and their industries, see the Portfolio of Investments. |
| (b) | The Level 3 securities valued at $0, $51,232 and $0 is held in China, Greece and Hong Kong, respectively, within the Common Stocks section of the Portfolio of Investments. |
| | | | |
| 18 | | MainStay VP Emerging Markets Equity Portfolio | | The notes to the financial statements are an integral part of,
and should be read in conjunction with, the financial statements. |
The table below sets forth the diversification of the Portfolio’s investments by industry.
Industry Diversification (unaudited)
| | | | | | | | |
| | | Value | | | Percent † | |
Air Freight & Logistics | | $ | 1,138,010 | | | | 0.4 | % |
Airlines | | | 553,434 | | | | 0.2 | |
Auto Components | | | 1,558,394 | | | | 0.5 | |
Automobiles | | | 2,278,420 | | | | 0.7 | |
Banks | | | 31,499,148 | | | | 9.8 | |
Beverages | | | 399,685 | | | | 0.1 | |
Biotechnology | | | 2,544,263 | | | | 0.8 | |
Building Products | | | 415,445 | | | | 0.1 | |
Capital Markets | | | 11,270,728 | | | | 3.5 | |
Chemicals | | | 3,242,362 | | | | 1.0 | |
Commercial Services & Supplies | | | 1,648,941 | | | | 0.5 | |
Communications Equipment | | | 1,906,390 | | | | 0.6 | |
Construction & Engineering | | | 2,512,597 | | | | 0.8 | |
Construction Materials | | | 4,147,005 | | | | 1.3 | |
Consumer Finance | | | 1,253,718 | | | | 0.4 | |
Diversified Consumer Services | | | 3,406,216 | | | | 1.1 | |
Diversified Financial Services | | | 3,651,422 | | | | 1.1 | |
Diversified Telecommunication Services | | | 496,281 | | | | 0.2 | |
Electric Utilities | | | 2,485,497 | | | | 0.8 | |
Electrical Equipment | | | 1,858,812 | | | | 0.6 | |
Electronic Equipment, Instruments & Components | | | 6,922,701 | | | | 2.2 | |
Energy Equipment & Services | | | 1,917,412 | | | | 0.6 | |
Entertainment | | | 8,369,897 | | | | 2.6 | |
Food & Staples Retailing | | | 2,718,993 | | | | 0.8 | |
Food Products | | | 7,535,211 | | | | 2.4 | |
Gas Utilities | | | 1,896,537 | | | | 0.6 | |
Health Care Equipment & Supplies | | | 3,975,650 | | | | 1.2 | |
Health Care Providers & Services | | | 2,674,128 | | | | 0.8 | |
Health Care Technology | | | 1,285,139 | | | | 0.4 | |
Hotels, Restaurants & Leisure | | | 2,058,155 | | | | 0.6 | |
Household Products | | | 998,982 | | | | 0.3 | |
Independent Power & Renewable Electricity Producers | | | 359,648 | | | | 0.1 | |
Industrial Conglomerates | | | 1,581,683 | | | | 0.5 | |
Insurance | | | 9,248,740 | | | | 2.9 | |
Interactive Media & Services | | | 23,422,387 | | | | 7.3 | |
Internet & Direct Marketing Retail | | | 40,758,023 | | | | 12.7 | |
IT Services | | | 2,845,367 | | | | 0.9 | |
Life Sciences Tools & Services | | | 3,336,158 | | | | 1.0 | |
Machinery | | | 6,245,201 | | | | 2.0 | |
Marine | | | 889,606 | | | | 0.3 | |
Metals & Mining | | | 15,560,050 | | | | 4.9 | |
Multiline Retail | | | 1,903,414 | | | | 0.6 | |
Oil, Gas & Consumable Fuels | | | 17,100,392 | | | | 5.3 | |
Paper & Forest Products | | | 1,763,519 | | | | 0.6 | |
Personal Products | | | 1,421,247 | | | | 0.4 | |
Pharmaceuticals | | | 3,750,336 | | | | 1.2 | |
Real Estate | | | 2,954,378 | | | | 0.9 | |
| | | | | | | | |
| | | Value | | | Percent † | |
Real Estate Management & Development | | | 3,956,012 | | | | 1.2 | |
Road & Rail | | | 782,376 | | | | 0.2 | |
Semiconductors & Semiconductor Equipment | | | 28,377,269 | | | | 8.9 | |
Software | | | 3,330,387 | | | | 1.0 | |
Specialty Retail | | | 1,862,846 | | | | 0.6 | |
Technology Hardware, Storage & Peripherals | | | 17,823,804 | | | | 5.6 | |
Textiles, Apparel & Luxury Goods | | | 2,450,548 | | | | 0.8 | |
Thrifts & Mortgage Finance | | | 1,025,349 | | | | 0.3 | |
Tobacco | | | 846,580 | | | | 0.3 | |
Transportation Infrastructure | | | 705,521 | | | | 0.2 | |
Wireless Telecommunication Services | | | 3,777,907 | | | | 1.2 | |
| | | | | | | | |
| | | 316,698,321 | | | | 98.9 | |
Short-Term Investments | | | 2,781,996 | | | | 0.9 | |
Other Assets, Less Liabilities | | | 490,462 | | | | 0.2 | |
| | | | | | | | |
Net Assets | | $ | 319,970,779 | | | | 100.0 | % |
| | | | | | | | |
| † | Percentages indicated are based on Portfolio net assets. |
| | | | | | |
The notes to the financial statements are an integral part of,
and should be read in conjunction with, the financial statements. | | | | | 19 | |
Statement of Assets and Liabilities as of June 30, 2020 (Unaudited)
| | | | |
| Assets | |
Investment in unaffiliated securities, at value (identified cost $284,978,048) including securities on loan of $5,636,646 | | $ | 319,306,679 | |
Investment in affiliated investment company, at value (identified cost $173,638) | | | 173,638 | |
Cash denominated in foreign currencies (identified cost $1,234,620) | | | 1,233,461 | |
Receivables: | | | | |
Investment securities sold | | | 2,170,789 | |
Dividends | | | 1,252,191 | |
Securities lending | | | 18,091 | |
Portfolio shares sold | | | 5,981 | |
Other assets | | | 1,215 | |
| | | | |
Total assets | | | 324,162,045 | |
| | | | |
|
| Liabilities | |
Due to custodian | | | 308,207 | |
Cash collateral received for securities on loan | | | 2,608,358 | |
Payables: | |
Investment securities purchased | | | 655,762 | |
Manager (See Note 3) | | | 259,209 | |
Portfolio shares redeemed | | | 129,255 | |
Custodian | | | 117,094 | |
Shareholder communication | | | 42,832 | |
Foreign capital gains tax (See Note 2(C)) | | | 28,569 | |
NYLIFE Distributors (See Note 3) | | | 21,492 | |
Professional fees | | | 11,962 | |
Trustees | | | 466 | |
Accrued expenses | | | 8,060 | |
| | | | |
Total liabilities | | | 4,191,266 | |
| | | | |
Net assets | | $ | 319,970,779 | |
| | | | |
|
| Composition of Net Assets | |
Shares of beneficial interest outstanding (par value of $.001 per share) unlimited number of shares authorized | | $ | 36,037 | |
Additional paid-in capital | | | 344,166,421 | |
| | | | |
| | | 344,202,458 | |
Total distributable earnings (loss) | | | (24,231,679 | ) |
| | | | |
Net assets | | $ | 319,970,779 | |
| | | | |
| | | | |
Initial Class | |
Net assets applicable to outstanding shares | | $ | 214,646,066 | |
| | | | |
Shares of beneficial interest outstanding | | | 24,163,346 | |
| | | | |
Net asset value per share outstanding | | $ | 8.88 | |
| | | | |
Service Class | |
Net assets applicable to outstanding shares | | $ | 105,324,713 | |
| | | | |
Shares of beneficial interest outstanding | | | 11,873,634 | |
| | | | |
Net asset value per share outstanding | | $ | 8.87 | |
| | | | |
| | | | |
| 20 | | MainStay VP Emerging Markets Equity Portfolio | | The notes to the financial statements are an integral part of,
and should be read in conjunction with, the financial statements. |
Statement of Operations for the six months ended June 30, 2020 (Unaudited)
| | | | |
| Investment Income (Loss) | |
Income | |
Dividends (a) | | $ | 3,776,051 | |
Securities lending | | | 48,420 | |
| | | | |
Total income | | | 3,824,471 | |
| | | | |
Expenses | |
Manager (See Note 3) | | | 1,631,122 | |
Custodian | | | 213,964 | |
Distribution/Service—Service Class (See Note 3) | | | 132,603 | |
Professional fees | | | 63,898 | |
Shareholder communication | | | 30,674 | |
Trustees | | | 4,275 | |
Interest expense | | | 3,155 | |
Miscellaneous | | | 13,950 | |
| | | | |
Total expenses | | | 2,093,641 | |
| | | | |
Net investment income (loss) | | | 1,730,830 | |
| | | | |
|
| Realized and Unrealized Gain (Loss) on Investments and Foreign Currency Transactions | |
| |
Net realized gain (loss) on: | |
Unaffiliated investment transactions (b) | | | (15,993,233 | ) |
Foreign currency forward transactions | | | 3,805 | |
Foreign currency transactions | | | (378,702 | ) |
| | | | |
Net realized gain (loss) on investments and foreign currency transactions | | | (16,368,130 | ) |
| | | | |
Net change in unrealized appreciation (depreciation) on: | |
Unaffiliated investments (c) | | | (12,023,394 | ) |
Translation of other assets and liabilities in foreign currencies | | | (54,237 | ) |
| | | | |
Net change in unrealized appreciation (depreciation) on investments and foreign currencies | | | (12,077,631 | ) |
| | | | |
Net realized and unrealized gain (loss) on investments and foreign currency transactions | | | (28,445,761 | ) |
| | | | |
Net increase (decrease) in net assets resulting from operations | | $ | (26,714,931 | ) |
| | | | |
| (a) | Dividends recorded net of foreign withholding taxes in the amount of $486,592. |
| (b) | Realized gain (loss) on security transactions recorded net of foreign capital gains tax in the amount of $39,461. |
| (c) | Net change in unrealized appreciation (depreciation) on investments recorded net of foreign capital gains tax in the amount of $64,540. |
| | | | | | |
The notes to the financial statements are an integral part of,
and should be read in conjunction with, the financial statements. | | | | | 21 | |
Statements of Changes in Net Assets
for the six months ended June 30, 2020 (Unaudited) and the year ended December 31, 2019
| | | | | | | | |
| | | 2020 | | | 2019 | |
| Increase (Decrease) in Net Assets | |
Operations: | |
Net investment income (loss) | | $ | 1,730,830 | | | $ | 9,785,430 | |
Net realized gain (loss) on investments and foreign currency transactions | | | (16,368,130 | ) | | | 2,230,170 | |
Net change in unrealized appreciation (depreciation) on investments and foreign currencies | | | (12,077,631 | ) | | | 69,303,284 | |
| | | | |
Net increase (decrease) in net assets resulting from operations | | | (26,714,931 | ) | | | 81,318,884 | |
| | | | |
Distributions to shareholders: | |
Initial Class | | | — | | | | (3,920,323 | ) |
Service Class | | | — | | | | (1,358,927 | ) |
| | | | |
Total distributions to shareholders | | | — | | | | (5,279,250 | ) |
| | | | |
Capital share transactions: | |
Net proceeds from sale of shares | | | 1,635,337 | | | | 6,085,713 | |
Net asset value of shares issued to shareholders in reinvestment of distributions | | | — | | | | 5,279,250 | |
Cost of shares redeemed | | | (55,032,822 | ) | | | (190,653,638 | ) |
| | | | |
Increase (decrease) in net assets derived from capital share transactions | | | (53,397,485 | ) | | | (179,288,675 | ) |
| | | | |
Net increase (decrease) in net assets | | | (80,112,416 | ) | | | (103,249,041 | ) |
|
| Net Assets | |
Beginning of period | | | 400,083,195 | | | | 503,332,236 | |
| | | | |
End of period | | $ | 319,970,779 | | | $ | 400,083,195 | |
| | | | |
| | | | |
| 22 | | MainStay VP Emerging Markets Equity Portfolio | | The notes to the financial statements are an integral part of,
and should be read in conjunction with, the financial statements. |
Financial Highlights selected per share data and ratios
| | | | | | | | | | | | | | | | | | | | | | | | | | | | |
| | | Six months
ended
June 30, | | | | | | Year ended December 31, | |
| | | | | | | |
| Initial Class | | 2020* | | | | | | 2019 | | | 2018 | | | 2017 | | | 2016 | | | 2015 | |
| | | | | | | |
Net asset value at beginning of period | | $ | 9.46 | | | | | | | $ | 7.99 | | | $ | 10.22 | | | $ | 7.22 | | | $ | 6.83 | | | $ | 8.27 | |
| | | | | | | | | | | | | | | | | | | | | | | | | | | | |
| | | | | | | |
Net investment income (loss) (a) | | | 0.05 | | | | | | | | 0.19 | | | | 0.12 | | | | 0.09 | | | | 0.06 | | | | 0.06 | |
| | | | | | | |
Net realized and unrealized gain (loss) on investments | | | (0.62 | ) | | | | | | | 1.42 | | | | (2.19 | ) | | | 3.03 | | | | 0.37 | | | | (1.38 | ) |
| | | | | | | |
Net realized and unrealized gain (loss) on foreign currency transactions | | | (0.01 | ) | | | | | | | (0.01 | ) | | | (0.02 | ) | | | (0.01 | ) | | | (0.01 | ) | | | (0.02 | ) |
| | | | | | | | | | | | | | | | | | | | | | | | | | | | |
| | | | | | | |
Total from investment operations | | | (0.58 | ) | | | | | | | 1.60 | | | | (2.09 | ) | | | 3.11 | | | | 0.42 | | | | (1.34 | ) |
| | | | | | | | | | | | | | | | | | | | | | | | | | | | |
|
| Less distributions: | |
| | | | | | | |
From net investment income | | | — | | | | | | | | (0.13 | ) | | | (0.14 | ) | | | (0.11 | ) | | | (0.03 | ) | | | (0.10 | ) |
| | | | | | | | | | | | | | | | | | | | | | | | | | | | |
| | | | | | | |
Net asset value at end of period | | $ | 8.88 | | | | | | | $ | 9.46 | | | $ | 7.99 | | | $ | 10.22 | | | $ | 7.22 | | | $ | 6.83 | |
| | | | | | | | | | | | | | | | | | | | | | | | | | | | |
| | | | | | | |
Total investment return (b) | | | (6.13 | %)(c) | | | | | | | 20.08 | % | | | (20.55 | %) | | | 43.12 | % | | | 6.23 | % | | | (16.20 | %) |
|
| Ratios (to average net assets)/Supplemental Data: | |
| | | | | | | |
Net investment income (loss) | | | 1.13 | % †† | | | | | | | 2.18 | % | | | 1.27 | % | | | 0.94 | % | | | 0.91 | %(d) | | | 0.77 | % |
| | | | | | | |
Net expenses (e)(f) | | | 1.20 | % †† | | | | | | | 1.17 | % | | | 1.16 | % | | | 1.24 | % | | | 1.29 | % | | | 1.40 | % |
| | | | | | | |
Portfolio turnover rate | | | 62 | % | | | | | | | 121 | % | | | 135 | % | | | 149 | % | | | 123 | % | | | 207 | % |
| | | | | | | |
Net assets at end of period (in 000’s) | | $ | 214,646 | | | | | | | $ | 273,042 | | | $ | 371,834 | | | $ | 497,861 | | | $ | 257,593 | | | $ | 204,138 | |
| (a) | Per share data based on average shares outstanding during the period. |
| (b) | Total return does not reflect any deduction of sales charges, mortality and expense charges, contract charges or administrative charges. For periods of less than one year, total return is not annualized. |
| (c) | Total investment return may reflect adjustments to conform to generally accepted accounting principles. |
| (d) | Without the custody fee reimbursement, net investment income (loss) would have been 0.83%. |
| (e) | In addition to the fees and expenses which the Portfolio bears directly, it also indirectly bears a pro-rata share of the fees and expenses of the underlying funds in which it invests. Such indirect expenses are not included in the above expense ratios. |
| (f) | The expense ratios presented below show the impact of short sales expense: |
| | | | | | | | |
| Period Ended | | Net Expenses
(excluding
short sale
expenses) | | | Short Sale
Expenses | |
| June 30, 2020* | | | 1.20 | % †† | | | — | |
| December 31, 2019 | | | 1.17 | % | | | — | |
| December 31, 2018 | | | 1.16 | % | | | — | |
| December 31, 2017 | | | 1.24 | % | | | 0.00 | % (g) |
| December 31, 2016 | | | 1.29 | % (h) | | | 0.00 | % (g) |
| December 31, 2015 | | | 1.40 | % | | | 0.00 | % (g) |
| (h) | Without the custody fee reimbursement, net expenses would have been 1.37%. |
| | | | | | |
The notes to the financial statements are an integral part of,
and should be read in conjunction with, the financial statements. | | | | | 23 | |
Financial Highlights selected per share data and ratios
| | | | | | | | | | | | | | | | | | | | | | | | | | | | |
| | | |
| | | Six months
ended
June 30, | | | | | | Year ended December 31, | |
| | | | | | | |
| Service Class | | 2020* | | | | | | 2019 | | | 2018 | | | 2017 | | | 2016 | | | 2015 | |
| | | | | | | |
Net asset value at beginning of period | | $ | 9.45 | | | | | | | $ | 7.98 | | | $ | 10.20 | | | $ | 7.21 | | | $ | 6.82 | | | $ | 8.25 | |
| | | | | | | | | | | | | | | | | | | | | | | | | | | | |
| | | | | | | |
Net investment income (loss) (a) | | | 0.04 | | | | | | | | 0.17 | | | | 0.10 | | | | 0.07 | | | | 0.05 | | | | 0.04 | |
| | | | | | | |
Net realized and unrealized gain (loss) on investments | | | (0.61 | ) | | | | | | | 1.41 | | | | (2.19 | ) | | | 3.02 | | | | 0.36 | | | | (1.37 | ) |
| | | | | | | |
Net realized and unrealized gain (loss) on foreign currency transactions | | | (0.01 | ) | | | | | | | (0.01 | ) | | | (0.02 | ) | | | (0.01 | ) | | | (0.01 | ) | | | (0.02 | ) |
| | | | | | | | | | | | | | | | | | | | | | | | | | | | |
| | | | | | | |
Total from investment operations | | | (0.58 | ) | | | | | | | 1.57 | | | | (2.11 | ) | | | 3.08 | | | | 0.40 | | | | (1.35 | ) |
| | | | | | | | | | | | | | | | | | | | | | | | | | | | |
|
| Less distributions: | |
| | | | | | | |
From net investment income | | | — | | | | | | | | (0.10 | ) | | | (0.11 | ) | | | (0.09 | ) | | | (0.01 | ) | | | (0.08 | ) |
| | | | | | | | | | | | | | | | | | | | | | | | | | | | |
| | | | | | | |
Net asset value at end of period | | $ | 8.87 | | | | | | | $ | 9.45 | | | $ | 7.98 | | | $ | 10.20 | | | $ | 7.21 | | | $ | 6.82 | |
| | | | | | | | | | | | | | | | | | | | | | | | | | | | |
| | | | | | | |
Total investment return (b) | | | (6.14 | %)(c) | | | | | | | 19.78 | % | | | (20.74 | %) | | | 42.77 | % | | | 5.96 | % | | | (16.42 | %) |
|
| Ratios (to average net assets)/Supplemental Data: | |
| | | | | | | |
Net investment income (loss) | | | 0.91 | % †† | | | | | | | 2.00 | % | | | 1.07 | % | | | 0.73 | % | | | 0.69 | %(d) | | | 0.52 | % |
| | | | | | | |
Net expenses (e)(f) | | | 1.45 | % †† | | | | | | | 1.42 | % | | | 1.41 | % | | | 1.49 | % | | | 1.55 | % | | | 1.65 | % |
| | | | | | | |
Portfolio turnover rate | | | 62 | % | | | | | | | 121 | % | | | 135 | % | | | 149 | % | | | 123 | % | | | 207 | % |
| | | | | | | |
Net assets at end of period (in 000’s) | | $ | 105,325 | | | | | | | $ | 127,042 | | | $ | 131,498 | | | $ | 208,590 | | | $ | 155,777 | | | $ | 163,884 | |
| (a) | Per share data based on average shares outstanding during the period. |
| (b) | Total return does not reflect any deduction of sales charges, mortality and expense charges, contract charges or administrative charges. For periods of less than one year, total return is not annualized. |
| (c) | Total investment return may reflect adjustments to conform to generally accepted accounting principles. |
| (d) | Without the custody fee reimbursement, net investment income (loss) would have been 0.62%. |
| (e) | In addition to the fees and expenses which the Portfolio bears directly, it also indirectly bears a pro-rata share of the fees and expenses of the underlying funds in which it invests. Such indirect expenses are not included in the above expense ratios. |
| (f) | The expense ratios presented below show the impact of short sales expense: |
| | | | | | | | | | |
| Period Ended | | Net Expenses
(excluding
short sale
expenses) | | Short Sale
Expenses |
June 30, 2020* | | | | 1.45 | % †† | | | | — | |
December 31, 2019 | | | | 1.42 | % | | | | — | |
December 31, 2018 | | | | 1.41 | % | | | | — | |
December 31, 2017 | | | | 1.49 | % | | | | 0.00 | % (g) |
December 31, 2016 | | | | 1.55 | % (h) | | | | 0.00 | % (g) |
December 31, 2015 | | | | 1.65 | % | | | | 0.00 | % (g) |
| (h) | Without the custody fee reimbursement, net expenses would have been 0.78%. |
| | | | |
| 24 | | MainStay VP Emerging Markets Equity Portfolio | | The notes to the financial statements are an integral part of,
and should be read in conjunction with, the financial statements. |
Notes to Financial Statements (Unaudited)
Note 1–Organization and Business
MainStay VP Funds Trust (the “Fund”) was organized as a Delaware statutory trust on February 1, 2011. The Fund is registered under the Investment Company Act of 1940, as amended (the “1940 Act”), as an open-end management investment company. The Fund is comprised of thirty-one separate series (collectively referred to as the “Portfolios”). These financial statements and notes relate to the MainStay VP Emerging Markets Equity Portfolio (the “Portfolio”), a “diversified” portfolio, as that term is defined in the 1940 Act, as interpreted or modified by regulatory authorities having jurisdiction, from time to time.
Shares of the Portfolio are currently offered to certain separate accounts to fund variable annuity policies and variable universal life insurance policies issued by New York Life Insurance and Annuity Corporation (“NYLIAC”), a wholly-owned subsidiary of New York Life Insurance Company (“New York Life”) and may also be offered to fund variable annuity policies and variable universal life insurance policies issued by other insurance companies. NYLIAC allocates shares of the Portfolios to, among others, certain NYLIAC separate accounts. Shares of the Portfolio are also offered to the MainStay VP Conservative Allocation Portfolio, MainStay VP Moderate Allocation Portfolio, MainStay VP Moderate Growth Allocation Portfolio and MainStay VP Growth Allocation Portfolio, which operate as “funds-of-funds,” and other variable insurance funds.
The Portfolio currently offers two classes of shares. Initial Class and Service Class shares commenced operations on February 17, 2012. Shares of the Portfolio are offered and are redeemed at a price equal to their respective net asset value (“NAV”) per share. No sales or redemption charge is applicable to the purchase or redemption of the Portfolio’s shares. Under the terms of the Fund’s multiple class plan adopted pursuant to Rule 18f-3 under the 1940 Act, the classes differ in that, among other things, Service Class shares of the Portfolio pay a combined distribution and service fee of 0.25% of average daily net assets attributable to Service Class shares of the Portfolio to the Distributor (as defined in Note 3(B)) pursuant to a plan adopted in accordance with Rule 12b-1 under the 1940 Act. Contract owners of variable annuity contracts purchased after June 2, 2003, are permitted to invest only in the Service Class shares.
The Portfolio’s investment objective is to seek long-term capital appreciation.
Note 2–Significant Accounting Policies
The Portfolio is an investment company and accordingly follows the investment company accounting and reporting guidance of the Financial Accounting Standards Board (“FASB”) Accounting Standard Codification Topic 946 Financial Services—Investment Companies. The Portfolio prepares its financial statements in accordance with generally accepted accounting principles (“GAAP”) in the United States of America and follows the significant accounting policies described below.
(A) Securities Valuation. Investments are usually valued as of the close of regular trading on the New York Stock Exchange (the “Exchange”) (usually 4:00 p.m. Eastern time) on each day the Portfolio is open for business (“valuation date”).
The Board of Trustees of the Fund (the “Board”) adopted procedures establishing methodologies for the valuation of the Portfolio’s securities and other
assets and delegated the responsibility for valuation determinations under those procedures to the Valuation Committee of the Fund (the “Valuation Committee”). The procedures state that, subject to the oversight of the Board and unless otherwise noted, the responsibility for the day-to-day valuation of portfolio assets (including fair value measurements for the Portfolio’s assets and liabilities) rests with New York Life Investment Management LLC (“New York Life Investments” or the “Manager”), aided to whatever extent necessary by the Subadvisor (as defined in Note 3(A)). To assess the appropriateness of security valuations, the Manager, the Subadvisor or the Portfolio’s third-party service provider, who is subject to oversight by the Manager, regularly compares prior day prices, prices on comparable securities and the sale prices to the prior and current day prices and challenges prices with changes exceeding certain tolerance levels with third-party pricing services or broker sources.
The Board authorized the Valuation Committee to appoint a Valuation Subcommittee (the “Subcommittee”) to establish the prices of securities for which market quotations are not readily available or the prices of which are not otherwise readily determinable under the procedures. The Subcommittee meets (in person, via electronic mail or via teleconference) on an as-needed basis. The Valuation Committee meets to ensure that actions taken by the Subcommittee were appropriate.
For those securities valued through either a standardized fair valuation methodology or a fair valuation measurement, the Subcommittee deals with such valuation and the Valuation Committee reviews and affirms, if appropriate, the reasonableness of the valuation based on such methodologies and measurements on a regular basis after considering information that is reasonably available and deemed relevant by the Valuation Committee. Any action taken by the Subcommittee with respect to the valuation of a portfolio security or other asset is submitted for review and ratification (if appropriate) to the Valuation Committee and the Board at the next regularly scheduled meeting.
“Fair value” is defined as the price the Portfolio would reasonably expect to receive upon selling an asset or liability in an orderly transaction to an independent buyer in the principal or most advantageous market for the asset or liability. Fair value measurements are determined within a framework that establishes a three-tier hierarchy that maximizes the use of observable market data and minimizes the use of unobservable inputs to establish a classification of fair value measurements for disclosure purposes. “Inputs” refer broadly to the assumptions that market participants would use in pricing the asset or liability, including assumptions about risk, such as the risk inherent in a particular valuation technique used to measure fair value using a pricing model and/or the risk inherent in the inputs for the valuation technique. Inputs may be observable or unobservable. Observable inputs reflect the assumptions market participants would use in pricing the asset or liability based on market data obtained from sources independent of the Portfolio. Unobservable inputs reflect the Portfolio’s own assumptions about the assumptions market participants would use in pricing the asset or liability based on the information available. The inputs or methodology used for valuing assets or liabilities may not be an indication of the risks associated with investing in those assets or liabilities. The three-tier hierarchy of inputs is summarized below.
| • | | Level 1—quoted prices in active markets for an identical asset or liability |
Notes to Financial Statements (Unaudited) (continued)
| • | | Level 2—other significant observable inputs (including quoted prices for a similar asset or liability in active markets, interest rates and yield curves, prepayment speeds, credit risk, etc.) |
| • | | Level 3—significant unobservable inputs (including the Portfolio’s own assumptions about the assumptions that market participants would use in measuring fair value of an asset or liability) |
The level of an asset or liability within the fair value hierarchy is based on the lowest level of an input, both individually and in the aggregate, that is significant to the fair value measurement. The aggregate value by input level of the Portfolio’s assets and liabilities as of June 30, 2020 is included at the end of the Portfolio of Investments.
The Portfolio may use third-party vendor evaluations, whose prices may be derived from one or more of the following standard inputs, among others:
| | |
• Broker/dealer quotes | | • Benchmark securities |
• Two-sided markets | | • Reference data (corporate actions or material event notices) |
• Bids/offers | | • Monthly payment information |
• Industry and economic events | | • Reported trades |
An asset or liability for which market values cannot be measured using the methodologies described above is valued by methods deemed reasonable in good faith by the Valuation Committee, following the procedures established by the Board, to represent fair value. Under these procedures, the Portfolio generally uses a market-based approach which may use related or comparable assets or liabilities, recent transactions, market multiples, book values and other relevant information. The Portfolio may also use an income-based valuation approach in which the anticipated future cash flows of the asset or liability are discounted to calculate fair value. Discounts may also be applied due to the nature and/or duration of any restrictions on the disposition of the asset or liability. Fair value represents a good faith approximation of the value of a security. Fair value determinations involve the consideration of a number of subjective factors, an analysis of applicable facts and circumstances and the exercise of judgment. As a result, it is possible that the fair value for a security determined in good faith in accordance with the Portfolio’s valuation procedures may differ from valuations for the same security determined by other funds using their own valuation procedures. Although the Portfolio’s valuation procedures are designed to value a security at the price the Portfolio may reasonably expect to receive upon the security’s sale in an orderly transaction, there can be no assurance that any fair value determination thereunder would, in fact, approximate the amount that the Portfolio would actually realize upon the sale of the security or the price at which the security would trade if a reliable market price were readily available. During the six-month period ended June 30, 2020, there were no material changes to the fair value methodologies.
Securities which may be valued in this manner include, but are not limited to: (i) a security for which trading has been halted or suspended; (ii) a debt security that has recently gone into default and for which there is not a current market quotation; (iii) a security of an issuer that has entered into a restructuring; (iv) a security that has been delisted from a national exchange; (v) a security for which the market price is not
readily available from a third-party pricing source or, if so provided, does not, in the opinion of the Manager or the Subadvisors, reflect the security’s market value; (vi) a security subject to trading collars for which no or limited trading takes place; and (vii) a security whose principal market has been temporarily closed at a time when, under normal conditions, it would be open. Securities valued in this manner are generally categorized as Level 3 in the hierarchy. As of June 30, 2020, securities that were fair valued in such a manner are shown in the Portfolio of Investments.
Certain securities held by the Portfolio may principally trade in foreign markets. Events may occur between the time the foreign markets close and the time at which the Portfolio’s NAVs are calculated. These events may include, but are not limited to, situations relating to a single issuer in a market sector, significant fluctuations in U.S. or foreign markets, natural disasters, armed conflicts, governmental actions or other developments not tied directly to the securities markets. Should the Manager or the Subadvisors conclude that such events may have affected the accuracy of the last price of such securities reported on the local foreign market, the Subcommittee may, pursuant to procedures adopted by the Board, adjust the value of the local price to reflect the estimated impact on the price of such securities as a result of such events. In this instance, securities are generally categorized as Level 3 in the hierarchy. Additionally, certain foreign equity securities are also fair valued whenever the movement of a particular index exceeds certain thresholds. In such cases, the securities are fair valued by applying factors provided by a third-party vendor in accordance with valuation procedures adopted by the Board and are generally categorized as Level 2 in the hierarchy. As of June 30, 2020, no foreign equity securities held by the Portfolio were fair valued in such a manner.
Equity securities, including exchange-traded funds (“ETFs”), are valued at the last quoted sales prices as of the close of regular trading on the relevant exchange on each valuation date. Securities that are not traded on the valuation date are valued at the mean of the last quoted bid and ask prices. Prices are normally taken from the principal market in which each security trades. These securities are generally categorized as Level 1 in the hierarchy.
Investments in mutual funds, including money market funds, are valued at their respective NAVs as of the close of the Exchange on the valuation date. These securities are generally categorized as Level 1 in the hierarchy.
Temporary cash investments acquired in excess of 60 days to maturity at the time of purchase are valued using the latest bid prices or using valuations based on a matrix system (which considers such factors as security prices, yields, maturities and ratings), both as furnished by independent pricing services. Temporary cash investments that mature in 60 days or less at the time of purchase (“Short-Term Investments”) are valued using the amortized cost method of valuation, unless the use of such method would be inappropriate. The amortized cost method involves valuing a security at its cost on the date of purchase and thereafter assuming a constant amortization to maturity of the difference between such cost and the value on maturity date. Amortized cost approximates the current fair value of a security. Securities valued using the amortized cost method are not valued using quoted prices in an active market and are generally categorized as Level 2 in the hierarchy.
| | |
| 26 | | MainStay VP Emerging Markets Equity Portfolio |
The information above is not intended to reflect an exhaustive list of the methodologies that may be used to value portfolio investments. The valuation procedures permit the use of a variety of valuation methodologies in connection with valuing portfolio investments. The methodology used for a specific type of investment may vary based on the market data available or other considerations. The methodologies summarized above may not represent the specific means by which portfolio investments are valued on any particular business day.
A portfolio investment may be classified as an illiquid investment under the Portfolio’s written liquidity risk management program and related procedures (“Liquidity Program”). Illiquidity of an investment might prevent the sale of such investment at a time when the Manager or the Subadvisors might wish to sell, and these investments could have the effect of decreasing the overall level of the Portfolio’s liquidity. Further, the lack of an established secondary market may make it more difficult to value illiquid investments, requiring the Portfolio to rely on judgments that may be somewhat subjective in measuring value, which could vary materially from the amount that the Portfolio could realize upon disposition. Difficulty in selling illiquid investments may result in a loss or may be costly to the Portfolio. An illiquid investment is any investment that the Manager or Subadvisors reasonably expects cannot be sold or disposed of in current market conditions in seven calendar days or less without the sale or disposition significantly changing the market value of the investment. The liquidity classification of each investment will be made using information obtained after reasonable inquiry and taking into account, among other things, relevant market, trading and investment-specific considerations in accordance with the Liquidity Program. Illiquid investments are often valued in accordance with methods deemed by the Board in good faith to be reasonable and appropriate to accurately reflect their fair value. The liquidity of the Portfolio’s investments, as shown in the Portfolio of Investments, was determined as of June 30, 2020, and can change at any time. Illiquid investments as of June 30, 2020, are shown in the Portfolio of Investments.
(B) Income Taxes. The Portfolio’s policy is to comply with the requirements of the Internal Revenue Code of 1986, as amended (the “Internal Revenue Code”), applicable to regulated investment companies and to distribute all of its taxable income to the shareholders of the Portfolio within the allowable time limits.
The Manager evaluates the Portfolio’s tax positions to determine if the tax positions taken meet the minimum recognition threshold in connection with accounting for uncertainties in income tax positions taken or expected to be taken for the purposes of measuring and recognizing tax liabilities in the financial statements. Recognition of tax benefits of an uncertain tax position is permitted only to the extent the position is “more likely than not” to be sustained assuming examination by taxing authorities. The Manager analyzed the Portfolio’s tax positions taken on federal, state and local income tax returns for all open tax years (for up to three tax years) and has concluded that no provisions for federal, state and local income tax are required in the Portfolio’s financial statements. The Portfolio’s federal, state and local income tax and federal excise tax returns for tax years for which the applicable statutes of limitations have not expired are subject to examination by the Internal Revenue Service and state and local departments of revenue. The Portfolio’s federal, state and local income tax and federal excise tax
returns for tax years for which the applicable statutes of limitations have not expired are subject to examination by the Internal Revenue Service and local departments of revenue.
(C) Foreign Taxes. The Portfolio may be subject to foreign taxes on income and other transaction-based taxes imposed by certain countries in which it invests. A portion of the taxes on gains on investments or currency purchases/repatriation may be reclaimable. The Portfolio will accrue such taxes and reclaims as applicable, based upon its current interpretation of tax rules and regulations that exist in the markets in which it invests.
The Portfolio may be subject to taxation on realized capital gains, repatriation proceeds and other transaction-based taxes imposed by certain countries in which it invests. The Portfolio will accrue such taxes as applicable based upon its current interpretation of tax rules and regulations that exist in the market in which it invests. Capital gains taxes relating to positions still held are reflected as a liability in the Statement of Assets and Liabilities, as well as an adjustment to the Portfolio’s net unrealized appreciation (depreciation). Taxes related to capital gains realized, if any, are reflected as part of net realized gain (loss) in the Statement of Operations. Changes in tax liabilities related to capital gains taxes on unrealized investment gains, if any, are reflected as part of the change in net unrealized appreciation (depreciation) on investments in the Statement of Operations. Transaction-based charges are generally assessed as a percentage of the transaction amount.
(D) Dividends and Distributions to Shareholders. Dividends and distributions are recorded on the ex-dividend date. The Portfolio intends to declare and pay dividends from net investment income and distributions from net realized capital and currency gains, if any, at least annually. Unless a shareholder elects otherwise, all dividends and distributions are reinvested at NAV in the same class of shares of the Portfolio. Dividends and distributions to shareholders are determined in accordance with federal income tax regulations and may differ from determinations using GAAP.
(E) Security Transactions and Investment Income. The Portfolio records security transactions on the trade date. Realized gains and losses on security transactions are determined using the identified cost method. Dividend income is recognized on the ex-dividend date, net of any foreign tax withheld at the source, and interest income is accrued as earned using the effective interest rate method. Distributions received from real estate investment trusts may be classified as dividends, capital gains and/or return of capital.
Investment income and realized and unrealized gains and losses on investments of the Portfolio are allocated pro rata to the separate classes of shares based upon their relative net assets on the date the income is earned or realized and unrealized gains and losses are incurred.
(F) Expenses. Expenses of the Fund are allocated to the individual Portfolios in proportion to the net assets of the respective Portfolios when the expenses are incurred, except where direct allocations of expenses can be made. Expenses (other than fees incurred under the distribution and service plans, further discussed in Note 3(B), which are charged directly to the Service Class shares) are allocated to separate classes of shares pro rata based upon their relative net assets on the date the expenses are incurred. The expenses borne by the Portfolio,
Notes to Financial Statements (Unaudited) (continued)
including those of related parties to the Portfolio, are shown in the Statement of Operations.
Additionally, the Portfolio may invest in ETFs and mutual funds, which are subject to management fees and other fees that may cause the costs of investing in ETFs and mutual funds to be greater than the costs of owning the underlying securities directly. These indirect expenses of ETFs and mutual funds are not included in the amounts shown as expenses in the Portfolio’s Statement of Operations or in the expense ratios included in the Financial Highlights.
(G) Use of Estimates. In preparing financial statements in conformity with GAAP, the Manager makes estimates and assumptions that affect the reported amounts and disclosures in the financial statements. Actual results could differ from those estimates.
(H) Repurchase Agreements. The Portfolio may enter into repurchase agreements (i.e., buy a security from another party with the agreement that it will be sold back in the future) to earn income. The Portfolio may enter into repurchase agreements only with counterparties, usually financial institutions, that are deemed by the Manager or the Subadvisors to be creditworthy, pursuant to guidelines established by the Board. During the term of any repurchase agreement, the Manager or the Subadvisors will continue to monitor the creditworthiness of the counterparty. Under the 1940 Act, repurchase agreements are considered to be collateralized loans by the Portfolio to the counterparty secured by the securities transferred to the Portfolio.
Repurchase agreements are subject to counterparty risk, meaning the Portfolio could lose money by the counterparty’s failure to perform under the terms of the agreement. The Portfolio mitigates this risk by ensuring the repurchase agreement is collateralized by cash, U.S. government securities, fixed income securities and/or other securities. The collateral is held by the Portfolio’s custodian and valued daily on a mark to market basis to determine if the value, including accrued interest, exceeds the repurchase price. In the event of the counterparty’s default on the obligation to repurchase, the Portfolio has the right to liquidate the collateral and apply the proceeds in satisfaction of the obligation. Under certain circumstances, such as in the event of default or bankruptcy by the counterparty, realization and/or retention of the collateral may be limited or subject to delay, to legal proceedings and possible realized loss to the Portfolio. As of June 30, 2020, the Portfolio did not hold any repurchase agreements.
(I) Futures Contracts. A futures contract is an agreement to purchase or sell a specified quantity of an underlying instrument at a specified future date and price, or to make or receive a cash payment based on the value of a financial instrument (e.g., foreign currency, interest rate, security, or securities index). The Portfolio is subject to risks such as market price risk and/or interest rate risk in the normal course of investing in these contracts. Upon entering into a futures contract, the Portfolio is required to pledge to the broker or futures commission merchant an amount of cash and/or U.S. government securities equal to a certain percentage of the collateral amount, known as the “initial margin.” During the period the futures contract is open, changes in the value of the contract are recognized as unrealized appreciation or depreciation by marking to market such contract on a daily basis to reflect the market value of the contract at the end of each day’s trading. The Portfolio agrees to receive from or pay to the broker or futures
commission merchant an amount of cash equal to the daily fluctuation in the value of the contract. Such receipts or payments are known as “variation margin.” When the futures contract is closed, the Portfolio records a realized gain or loss equal to the difference between the proceeds from (or cost of) the closing transaction and the Portfolio’s basis in the contract.
The use of futures contracts involves, to varying degrees, elements of market risk in excess of the amount recognized in the Statement of Assets and Liabilities. The contract or notional amounts and variation margin reflect the extent of the Portfolio’s involvement in open futures positions. There are several risks associated with the use of futures contracts as hedging techniques. There can be no assurance that a liquid market will exist at the time when the Portfolio seeks to close out a futures contract. If no liquid market exists, the Portfolio would remain obligated to meet margin requirements until the position is closed. Futures contracts may involve a small initial investment relative to the risk assumed, which could result in losses greater than if the Portfolio did not invest in futures contracts. Futures contracts may be more volatile than direct investments in the instrument underlying the futures and may not correlate to the underlying instrument, causing a given hedge not to achieve its objectives. The Portfolio’s activities in futures contracts have minimal counterparty risk as they are conducted through regulated exchanges that guarantee the futures against default by the counterparty. In the event of a bankruptcy or insolvency of a futures commission merchant that holds margin on behalf of the Portfolio, the Portfolio may not be entitled to the return of the entire margin owed to the Portfolio, potentially resulting in a loss. The Portfolio’s investment in futures contracts and other derivatives may increase the volatility of the Portfolio’s NAVs and may result in a loss to the Portfolio. As of June 30, 2020, the Portfolio did not hold any futures contracts.
(J) Foreign Currency Forward Contracts. The Portfolio may enter into foreign currency forward contracts, which are agreements to buy or sell foreign currencies on a specified future date at a specified rate. The Portfolio is subject to foreign currency exchange rate risk in the normal course of investing in these transactions. During the period the forward contract is open, changes in the value of the contract are recognized as unrealized appreciation or depreciation by marking to market such contract on a daily basis to reflect the market value of the contract at the end of each day’s trading. Cash movement occurs on settlement date. When the forward contract is closed, the Portfolio records a realized gain or loss equal to the difference between the proceeds from (or cost of) the closing transaction and the Portfolio’s basis in the contract. The Portfolio may purchase and sell foreign currency forward contracts for purposes of seeking to enhance portfolio returns and manage portfolio risk more efficiently. Foreign currency forward contracts may also be used to gain exposure to a particular currency or to hedge against the risk of loss due to changing currency exchange rates. Foreign currency forward contracts to purchase or sell a foreign currency may also be used in anticipation of future purchases or sales of securities denominated in foreign currency, even if the specific investments have not yet been selected.
The use of foreign currency forward contracts involves, to varying degrees, elements of risk in excess of the amount recognized in the Statement of Assets and Liabilities, including counterparty risk, market risk and illiquidity risk. Counterparty risk is heightened for these instruments because foreign currency forward contracts are not exchange-
| | |
| 28 | | MainStay VP Emerging Markets Equity Portfolio |
traded and therefore no clearinghouse or exchange stands ready to meet the obligations under such contracts. Thus, the Portfolio faces the risk that its counterparties under such contracts may not perform their obligations. Market risk is the risk that the value of a foreign currency forward contract will depreciate due to unfavorable changes in exchange rates. Illiquidity risk arises because the secondary market for foreign currency forward contracts may have less liquidity relative to markets for other securities and financial instruments. Risks also arise from the possible movements in the foreign exchange rates underlying these instruments. While the Portfolio may enter into forward contracts to reduce currency exchange risks, changes in currency exchange rates may result in poorer overall performance for the Portfolio than if it had not engaged in such transactions. Exchange rate movements can be large, depending on the currency, and can last for extended periods of time, affecting the value of the Portfolio’s assets. Moreover, there may be an imperfect correlation between the Portfolio’s holdings of securities denominated in a particular currency and forward contracts entered into by the Portfolio. Such imperfect correlation may prevent the Portfolio from achieving the intended hedge or expose the Portfolio to the risk of currency exchange loss. The unrealized appreciation (depreciation) on forward contracts also reflects the Portfolio’s exposure at the valuation date to credit loss in the event of a counterparty’s failure to perform its obligations. As of June 30, 2020, the Portfolio did not hold any foreign currency forward contracts.
(K) Securities Sold Short. The Portfolio may engage in sales of securities it does not own (“short sales”) as part of its investment strategies. When the Portfolio enters into a short sale, it must segregate or maintain with a broker the cash proceeds from the security sold short or other securities as collateral for its obligation to deliver the security upon conclusion of the sale. During the period a short position is open, depending on the nature and type of security, a short position is reflected as a liability and is marked to market in accordance with the valuation methodologies previously detailed (See Note 2(A)). Liabilities for securities sold short are closed out by purchasing the applicable securities for delivery to the counterparty broker. A gain, limited to the price at which the Portfolio sold the security short, or a loss, unlimited as to dollar amount, will be recognized upon termination of a short sale if the market price on the date the short position is closed out is less or greater, respectively, than the proceeds originally received. Any such gain or loss may be offset, completely or in part, by the change in the value of the hedged investments. Interest on short positions held is accrued daily, while dividends declared on short positions existing on the record date are recorded on the ex-dividend date as a dividend expense in the Statement of Operations. Broker fees and other expenses related to securities sold short are disclosed in the Statement of Operations. Short sales involve risk of loss in excess of the related amounts reflected in the Statement of Assets and Liabilities. During the six-month period ended June 30, 2020, the Portfolio did not engage in short sales as part of its investment strategies.
(L) Foreign Currency Transactions. The Portfolio’s books and records are maintained in U.S. dollars. Prices of securities denominated in foreign currency amounts are translated into U.S. dollars at the mean between the buying and selling rates last quoted by any major U.S. bank at the following dates:
| (i) | market value of investment securities, other assets and liabilities–at the valuation date; and |
| (ii) | purchases and sales of investment securities, income and expenses–at the date of such transactions. |
The assets and liabilities that are denominated in foreign currency amounts are presented at the exchange rates and market values at the close of the period. The realized and unrealized changes in net assets arising from fluctuations in exchange rates and market prices of securities are not separately presented.
Net realized gain (loss) on foreign currency transactions represents net currency gains or losses realized as a result of differences between the amounts of securities sale proceeds or purchase cost, dividends, interest and withholding taxes as recorded on the Portfolio’s books, and the U.S. dollar equivalent amount actually received or paid. Net currency gains or losses from valuing such foreign currency denominated assets and liabilities, other than investments at valuation date exchange rates, are reflected in unrealized foreign exchange gains or losses.
(M) Rights and Warrants. Rights are certificates that permit the holder to purchase a certain number of shares, or a fractional share, of a new stock from the issuer at a specific price. Warrants are instruments that entitle the holder to buy an equity security at a specific price for a specific period of time. These investments can provide a greater potential for profit or loss than an equivalent investment in the underlying security. Prices of these investments do not necessarily move in tandem with the prices of the underlying securities.
There is risk involved in the purchase of rights and warrants in that these investments are speculative investments. The Portfolio could also lose the entire value of its investment in warrants if such warrants are not exercised by the date of its expiration. The Portfolio is exposed to risk until the sale or exercise of each right or warrant is completed. As of June 30, 2020, the Portfolio did not hold any rights or warrants.
(N) Securities Lending. In order to realize additional income, the Portfolio may engage in securities lending, subject to the limitations set forth in the 1940 Act and relevant guidance by the staff of the Securities and Exchange Commission (“SEC”). If the Portfolio engages in securities lending, the Portfolio will lend through its custodian, currently State Street Bank and Trust Company (“State Street”), acting as securities lending agent on behalf of the Portfolio. Under the current arrangement, State Street will manage the Portfolio’s collateral in accordance with the securities lending agency agreement between the Portfolio and State Street, and indemnify the Portfolio against counterparty risk. The loans will be collateralized by cash (which may be invested in a money market fund) and/or non-cash collateral (which may include U.S. Treasury securities and/or U.S. government agency securities issued or guaranteed by the United States government or its agencies or instrumentalities) at least equal at all times to the market value of the securities loaned. The Portfolio bears the risk of delay in recovery of, or loss of rights in, the securities loaned. The Portfolio may also record a realized gain or loss on securities deemed sold due to a borrower’s inability to return securities on loan. The Portfolio bears the risk of any loss on investment of cash collateral. The Portfolio will receive compensation for lending its securities in the form of fees or it will retain a portion of interest earned on the investment of any cash collateral. The Portfolio will also continue to receive interest and dividends on the securities loaned and any gain or loss in the market price of the securities loaned that may occur during the term of the loan will be for the
Notes to Financial Statements (Unaudited) (continued)
account of the Portfolio. Income earned from securities lending activities, if any, is reflected in the Statement of Operations. As of June 30, 2020, the Portfolio had securities on loan with an aggregate market value of $5,636,646; the total market value of collateral held by the Portfolio was $5,799,543. The market value of the collateral held included non-cash collateral, in the form of U.S. Treasury securities, with a value of $3,191,185 and cash collateral, which was invested into the State Street Navigator Securities Lending Government Money Market Portfolio, with a value of $2,608,358.
(O) Foreign Securities Risk. The Portfolio invests in foreign securities, which carry certain risks that are in addition to the usual risks inherent in domestic securities. These risks include those resulting from currency fluctuations, future adverse political or economic developments and possible imposition of currency exchange blockages or other foreign governmental laws or restrictions. These risks are likely to be greater in emerging markets than in developed markets. The ability of issuers of securities held by the Portfolio to meet their obligations may be affected by economic or political developments in a specific country, industry or region.
For example, the Portfolio has significant investments in the Asia-Pacific region. The development and stability of the Asia-Pacific region can be adversely affected by, among other regional and global developments, trade barriers, exchange controls and other measures imposed or negotiated by the countries with which they trade. Some Asia-Pacific countries can be characterized as emerging markets or newly industrialized and may experience more volatile economic cycles and less liquid markets than developed countries.
(P) Counterparty Credit Risk. In order to better define its contractual rights and to secure rights that will help the Portfolio mitigate its counterparty risk, the Portfolio may enter into an International Swaps and Derivatives Association, Inc. Master Agreement (“ISDA Master Agreement”) or similar agreement with its counterparties. An ISDA Master Agreement is a bilateral agreement between the Portfolio and a counterparty that governs certain OTC derivatives and typically contains collateral posting terms and netting provisions. Under an ISDA Master Agreement, the Portfolio may, under certain circumstances, offset with the counterparty certain derivative financial instruments’ payables and/or receivables with collateral held and/or posted and create one single net payment. The provisions of the ISDA Master Agreement typically permit a single net payment in the event of default including the bankruptcy or insolvency of the counterparty. Bankruptcy or insolvency laws of a particular jurisdiction may restrict or prohibit the right of offset in bankruptcy, insolvency or other events. In addition, certain ISDA Master Agreements may contain provisions for early termination of OTC derivative transactions in the event the net assets of the Portfolio decline below specific levels or if the Portfolio fails to meet the terms of its ISDA Master Agreements. The result would cause the Portfolio to accelerate payment of any net liability owed to the counterparty.
For financial reporting purposes, the Portfolio does not offset derivative assets and derivative liabilities that are subject to netting arrangements, if any, in the Statement of Assets and Liabilities.
(Q) Indemnifications. Under the Fund’s organizational documents, its officers and trustees are indemnified against certain liabilities that may arise out of performance of their duties to the Fund. Additionally, in the normal course of business, the Portfolio enters into contracts with
third-party service providers that contain a variety of representations and warranties and that may provide general indemnifications. The Portfolio’s maximum exposure under these arrangements is unknown, as this would involve future claims that may be made against the Portfolio that have not yet occurred. The Manager believes that the risk of loss in connection with these potential indemnification obligations is remote. However, there can be no assurance that material liabilities related to such obligations will not arise in the future, which could adversely impact the Portfolio.
(R) Quantitative Disclosure of Derivative Holdings. The following tables show additional disclosures related to the Portfolio’s derivative and hedging activities, including how such activities are accounted for and their effect on the Portfolio’s financial positions, performance and cash flows. Foreign currency forward contracts were used to hedge against the risk of loss due to changing currency exchange rates. These derivatives are not accounted for as hedging instruments.
The effect of derivative instruments on the Statement of Operations for the period ended June 30, 2020:
Realized Gain (Loss)
| | | | | | | | | | |
| | | Statement of
Operations
Location | | Foreign
Exchange
Contracts
Risk | | | Total | |
Forward Contracts | | Net realized gain (loss) on foreign currency forward transactions | | $ | 3,805 | | | $ | 3,805 | |
| | | | | | | | | | |
Total Realized Gain (Loss) | | | | $ | 3,805 | | | $ | 3,805 | |
| | | | | | | | | | |
|
Average Notional Amount | |
| | | | | Foreign
Exchange
Contracts
Risk | | | Total | |
Forward Contracts Long (a) | | | | $ | 284,256 | | | $ | 284,256 | |
Forward Contracts Short (a) | | | | $ | (101,979 | ) | | $ | (101,979 | ) |
| | | | | | | | | | |
| (a) Positions were open two months during the reporting period. | |
Note 3–Fees and Related Party Transactions
(A) Manager and Subadvisors. New York Life Investments, a registered investment adviser and an indirect, wholly-owned subsidiary of New York Life, serves as the Portfolio’s Manager, pursuant to an Amended and Restated Management Agreement (“Management Agreement”). The Manager provides offices, conducts clerical, recordkeeping and bookkeeping services, and keeps most of the financial and accounting records required to be maintained by the Portfolio. Except for the portion of salaries and expenses that are the responsibility of the Portfolio, the Manager pays the salaries and expenses of all personnel affiliated with the Portfolio and certain operational expenses of the Portfolio. The Portfolio reimburses New York Life Investments in an amount equal to the portion of the compensation of the Chief Compliance Officer attributable to the Portfolio. MacKay Shields LLC
| | |
| 30 | | MainStay VP Emerging Markets Equity Portfolio |
(“MacKay Shields” or “Subadvisor”), a registered investment adviser and an indirect, wholly-owned subsidiary of New York Life, serves as a Subadvisor to the Portfolio, pursuant to the terms of an Amended and Restated Subadvisory Agreement (“Subadvisory Agreement”) between New York Life Investments and MacKay Shields. Candriam Belgium (“Candriam Belgium” or “Subadvisor,” and, together with MacKay Shields, the “Subadvisors”), a registered investment adviser and a direct, wholly-owned subsidiary of New York Life, serves as a Subadvisor to the Portfolio, pursuant to the terms of an Amended and Restated Subadvisory Agreement between New York Life Investments and Candriam Belgium. Each Subadvisor is responsible for managing a portion of the Portfolio’s assets, as designated by the Manager from time to time. New York Life Investments pays for the services of the Subadvisors.
The Fund, on behalf of the Portfolio, pays New York Life Investments in its capacity as the Portfolio’s investment manager and administrator, pursuant to the Management Agreement, a monthly fee for the services performed and the facilities furnished at an annual rate of Portfolio’s average daily net assets as follows: 1.00% up to $1 billion and 0.975% in excess of $1 billion. During the six-month period ended June 30, 2020, the effective management fee rate was 1.00%.
During the six-month period ended June 30, 2020, New York Life Investments earned fees from the Portfolio in the amount of $1,631,122 and paid MacKay Shields and Candriam Belgium $358,622 and $456,939, respectively.
State Street provides sub-administration and sub-accounting services to the Portfolio pursuant to an agreement with New York Life Investments. These services include calculating the daily NAVs of the Portfolio, maintaining the general ledger and sub-ledger accounts for the calculation of the Portfolio’s NAVs and assisting New York Life Investments in conducting various aspects of the Portfolio’s administrative operations. For providing these services to the Portfolio, State Street is compensated by New York Life Investments.
Pursuant to an agreement between the Fund and New York Life Investments, New York Life Investments is responsible for providing or procuring certain regulatory reporting services for the Portfolio. The Portfolio will reimburse New York Life Investments for the actual costs incurred by New York Life Investments in connection with providing or procuring these services for the Portfolio.
(B) Distribution and Service Fees. The Fund, on behalf of the Portfolio, has entered into a distribution agreement with NYLIFE Distributors LLC (the “Distributor”), an indirect, wholly-owned subsidiary of New York Life. The Portfolio has adopted a distribution plan (the “Plan”) in accordance with the provisions of Rule 12b-1 under the 1940 Act. Under the Plan, the Distributor has agreed to provide, through its affiliates or independent third parties, various distribution-related, shareholder and administrative support services to the Service Class shareholders. For its services, the Distributor is entitled to a combined distribution and service fee accrued daily and paid monthly at an annual rate of 0.25% of the average daily net assets attributable to the Service Class shares of the Portfolio.
(C) Investments in Affiliates (in 000’s). During the six-month period ended June 30, 2020, purchases and sales transactions, income earned from investments and shares held of investment companies managed by New York Life Investments or its affiliates were as follows:
| | | | | | | | | | | | | | | | | | | | | | | | | | | | | | | | | | | | |
Affiliated Investment Company | | Value,
Beginning of
Period | | | Purchases
at Cost | | | Proceeds
from Sales | | | Net Realized
Gain/(Loss)
on Sales | | | Change in
Unrealized
Appreciation/
(Depreciation) | | | Value,
End of
Period | | | Dividend
Income | | | Other
Distributions | | | Shares
End of
Period | |
| | | | | | | | | |
MainStay U.S. Government Liquidity Fund | | $ | 609 | | | $ | 45,131 | | | $ | (45,566 | ) | | $ | — | | | $ | — | | | $ | 174 | | | $ | — | | | $ | — | | | | 174 | |
Note 4–Federal Income Tax
As of June 30, 2020, the cost and unrealized appreciation (depreciation) of the Portfolio’s investment portfolio, including applicable derivative contracts and other financial instruments, as determined on a federal income tax basis, was as follows:
| | | | | | | | | | | | | | | | |
| | | Federal Tax
Cost | | | Gross
Unrealized
Appreciation | | | Gross
Unrealized
(Depreciation) | | | Net
Unrealized
Appreciation/
(Depreciation) | |
| | | | |
Investments in Securities | | $ | 290,737,670 | | | $ | 48,714,855 | | | $ | (19,972,208 | ) | | $ | 28,742,647 | |
As of December 31, 2019, for federal income tax purposes, capital loss carryforwards of $48,799,435, as shown in the table below, were available to the extent provided by the regulations to offset future realized gains of the Portfolio through the years indicated. Accordingly, no capital gains distributions are expected to be paid to shareholders until net gains have been realized in excess of such amounts.
| | | | |
Capital Loss
Available Through | | Short-Term Capital
LossAmounts (000’s) | | Long-Term Capital
LossAmounts (000’s) |
| | |
| Unlimited | | $48,779 | | $ — |
During the year ended December 31, 2019, the tax character of distributions paid as reflected in the Statements of Changes in Net Assets was as follows:
| | |
|
| 2019 |
Tax-Based
Distributions from Ordinary
Income | | Tax-Based
Distributions from Long-Term
Gains |
| |
| $5,279,250 | | $— |
Notes to Financial Statements (Unaudited) (continued)
Note 5–Custodian
State Street is the custodian of cash and securities held by the Portfolio. Custodial fees are charged to the Portfolio based on the Portfolio’s net assets and/or the market value of securities held by the Portfolio and the number of certain transactions incurred by the Portfolio.
Note 6–Line of Credit
The Portfolio and certain other funds managed by New York Life Investments maintain a line of credit with a syndicate of banks in order to secure a source of funds for temporary purposes to meet unanticipated or excessive redemption requests.
Effective July 28, 2020, under the credit agreement (the “Credit Agreement”), the aggregate commitment amount is $600,000,000 with an additional uncommitted amount of $100,000,000. The commitment fee is an annual rate of 0.15% of the average commitment amount payable quarterly, regardless of usage, to JP Morgan Chase Bank NA, who serves as the agent to the syndicate. The commitment fee is allocated among the Portfolio and certain other funds managed by New York Life Investments based upon their respective net assets and other factors. Interest on any revolving credit loan is charged based upon the Federal Funds Rate or the one-month London Interbank Offered Rate (“LIBOR”), whichever is higher. The Credit Agreement expires on July 27, 2021, although the Portfolio, certain other funds managed by New York Life Investments and the syndicate of banks may renew the Credit Agreement for an additional year on the same or different terms or enter into a credit agreement with a different syndicate of banks. Prior to July 28, 2020, the aggregate commitment amount and the commitment fee were the same as those under the current Credit Agreement.
During the six-month period ended June 30, 2020, the Portfolio utilized the line of credit for 7 days, maintained a balance of $6,475,429 at a rate of 2.51% and incurred interest expense in the amount of $3,155. As of June 30, 2020, there were no borrowings outstanding with respect to the Portfolio under the Credit Agreement.
Note 7–Interfund Lending Program
Pursuant to an exemptive order issued by the SEC, the Portfolio, along with certain other funds managed by New York Life Investments, may participate in an interfund lending program. The interfund lending program provides an alternative credit facility that permits the Portfolio and certain other funds managed by New York Life Investments to lend or borrow money for temporary purposes directly to or from one another subject to the conditions of the exemptive order. During the six-month period ended June 30, 2020, there were no interfund loans made or outstanding with respect to the Portfolio.
Note 8–Purchases and Sales of Securities (in 000’s)
During the six-month period ended June 30, 2020, purchases and sales of securities, other than short-term securities, were $200,155 and $253,397, respectively.
Note 9–Capital Share Transactions
Transactions in capital shares for the six-month period ended June 30, 2020 and the year ended December 31, 2019, were as follows:
| | | | | | | | |
Initial Class | | Shares | | | Amount | |
| | |
Six-month period ended June 30, 2020: | | | | | | | | |
| | |
Shares sold | | | 78,648 | | | $ | 650,152 | |
Shares redeemed | | | (4,791,182 | ) | | | (40,649,002 | ) |
| | | | | | | | |
Net increase (decrease) | | | (4,712,534 | ) | | $ | (39,998,850 | ) |
| | | | | | | | |
| | |
Year ended December 31, 2019: | | | | | | | | |
| | |
Shares sold | | | 463,656 | | | $ | 3,912,418 | |
| | |
Shares issued to shareholders in reinvestment of distributions | | | 467,198 | | | | 3,920,323 | |
| | |
Shares redeemed | | | (18,574,183 | ) | | | (160,566,943 | ) |
| | | | | | | | |
Net increase (decrease) | | | (17,643,329 | ) | | $ | (152,734,202 | ) |
| | | | | | | | |
| | |
| | | | | | | | |
Service Class | | Shares | | | Amount | |
| | |
Six-month period ended June 30, 2020: | | | | | | | | |
| | |
Shares sold | | | 125,732 | | | $ | 985,185 | |
Shares redeemed | | | (1,689,946 | ) | | | (14,383,820 | ) |
| | | | |
Net increase (decrease) | | | (1,564,214 | ) | | $ | (13,398,635 | ) |
| | | | |
| | |
Year ended December 31, 2019: | | | | | | | | |
| | |
Shares sold | | | 252,320 | | | $ | 2,173,295 | |
| | |
Shares issued to shareholders in reinvestment of distributions | | | 161,878 | | | | 1,358,927 | |
Shares redeemed | | | (3,448,546 | ) | | | (30,086,695 | ) |
| | | | |
Net increase (decrease) | | | (3,034,348 | ) | | $ | (26,554,473 | ) |
| | | | | | | | |
Note 10–Recent Accounting Pronouncement
In March 2020, the Financial Accounting Standards Board (“FASB”) issued Accounting Standards Update 2020-04 (“ASU 2020-04”), which provides optional guidance to ease the potential accounting burden associated with transitioning away from LIBOR and other reference rates that are expected to be discontinued. ASU 2020-04 is effective immediately upon release of the update on March 12, 2020 through December 31, 2022. At this time, the Manager is evaluating the implications of certain other provisions of ASU 2020-04 related to new disclosure requirements and any impact on the financial statement disclosures has not yet been determined.
Note 11–Subsequent Events
In connection with the preparation of the financial statements of the Portfolio as of and for the six-month period ended June 30, 2020, events and transactions subsequent to June 30, 2020, through the date the financial statements were issued have been evaluated by the Manager, for possible adjustment and/or disclosure. No subsequent events requiring financial statement adjustment or disclosure have been identified.
Note 12–Other Matters
An outbreak of COVID-19, first detected in December 2019, has developed into a global pandemic and has resulted in travel restrictions, closure of international borders, certain businesses and securities markets, restrictions on securities trading activities, prolonged quarantines, supply chain disruptions, and lower consumer demand, as well as general concern and uncertainty. The continued impact of COVID-19 is uncertain and could further adversely affect the global economy, national economies, individual issuers and capital markets in unforeseeable ways and result in a substantial and extended economic downturn. Developments that disrupt global economies and financial markets, such as COVID-19, may magnify factors that affect the Portfolio’s performance.
| | |
| 32 | | MainStay VP Emerging Markets Equity Portfolio |
Discussion of the Operation and Effectiveness of the Portfolio’s
Liquidity Risk Management Program (Unaudited)
In compliance with Rule 22e-4 under the Investment Company Act of 1940, as amended (the “Liquidity Rule”), the Portfolio has adopted and implemented a liquidity risk management program (the “Program”), which New York Life Investment Management LLC believes is reasonably designed to assess and manage the Portfolio’s liquidity risk. The Board designated New York Life Investment Management LLC as administrator of the Program (the “Administrator”). The Administrator has established a Liquidity Risk Management Committee to assist the Administrator in the implementation and day-to-day administration of the Program and to otherwise support the Administrator in fulfilling its responsibilities under the Program.
At a meeting of the Board held on March 11, 2020, the Administrator provided the Board with a written report addressing the Program’s operation, adequacy and effectiveness of implementation for the period from December 1, 2018 through December 31, 2019, as required under the Liquidity Rule. The report noted that the Administrator concluded that (i) the Program operated effectively to assess and manage the Portfolio’s liquidity risk, (ii) the Program has been adequately and effectively implemented to monitor and, as applicable, respond to the Portfolio’s liquidity developments and (iii) the Portfolio’s investment strategy continues to be appropriate for an open-end portfolio.
In accordance with the Program, the Portfolio’s liquidity risk is assessed no less frequently than annually taking into consideration certain factors, as applicable, such as (i) investment strategy and liquidity of portfolio investments, (ii) short-term and long-term cash flow projections and (iii) holdings of cash and cash equivalents and borrowing arrangements and other funding sources. Certain factors are considered under both normal and reasonably foreseeable stressed conditions.
Each Portfolio portfolio investment is classified into one of four liquidity categories. The classification is based on a determination of the number of days it is reasonably expected to take to convert the investment into cash, or sell or dispose of the investment, in current market conditions without significantly changing the market value of the investment. The Administrator has delegated liquidity classification determinations to the Portfolio’s subadvisors, subject to appropriate oversight by the Administrator, and classification determinations are made by taking into account the Portfolio’s reasonably anticipated trade size, various market, trading and investment-specific considerations, as well as market depth, and, in certain cases, third-party vendor data.
The Liquidity Rule requires portfolios that do not primarily hold assets that are highly liquid investments to adopt a minimum amount of net assets that must be invested in highly liquid investments that are assets (an “HLIM”). In addition, the Liquidity Rule limits a portfolio’s investments in illiquid investments. Specifically, the Liquidity Rule prohibits acquisition of illiquid investments if doing so would result in a portfolio holding more than 15% of its net assets in illiquid investments that are assets. The Program includes provisions reasonably designed to determine, periodically review and comply with the HLIM requirement, as applicable, and to comply with the 15% limit on illiquid investments.
Proxy Voting Policies and Procedures and Proxy Voting Record
A description of the policies and procedures that New York Life Investments uses to vote proxies related to the Portfolio’s securities is available free of charge upon request (i) by calling 800-598-2019; (ii) by visiting New York Life Investments’ website at https://www.nylinvestments.com/mainstay/products-and-performance/mainstay-vp-funds-trust; or (iii) by visiting the SEC’s website at www.sec.gov.
The Portfolio is required to file with the SEC its proxy voting record for the 12-month period ending June 30 on Form N-PX. The Portfolio’s most recent Form N-PX or proxy voting record is available free of charge upon request (i) by calling 800-598-2019; (ii) by visiting New York Life Investments’ website at https://www.nylinvestments.com/mainstay/products-and-performance/mainstay-vp-funds-trust ; or (iii) by visiting the SEC’s website at www.sec.gov.
Shareholder Reports and Quarterly Portfolio Disclosure
The Portfolio is required to file its complete schedule of portfolio holdings with the SEC 60 days after its first and third fiscal quarter on Form N-PORT. The Portfolio’s holdings report is available free of charge upon request by calling 800-598-2019 or by visiting the SEC’s website at www.sec.gov.
| | |
| 34 | | MainStay VP Emerging Markets Equity Portfolio |
MainStay VP Portfolios
MainStay VP offers a wide range of Portfolios. The full array of MainStay VP offerings is listed here, with information about the manager, subadvisors, legal counsel, and independent registered public accounting firm.
Equity Portfolios
MainStay VP Emerging Markets Equity Portfolio
MainStay VP Epoch U.S. Equity Yield Portfolio
MainStay VP Fidelity Institutional AM® Utilities Portfolio†
MainStay VP MacKay Common Stock Portfolio
MainStay VP MacKay Growth Portfolio
MainStay VP MacKay International Equity Portfolio
MainStay VP MacKay Mid Cap Core Portfolio
MainStay VP MacKay S&P 500 Index Portfolio
MainStay VP MacKay Small Cap Core Portfolio
MainStay VP Mellon Natural Resources Portfolio
MainStay VP Small Cap Growth Portfolio
MainStay VP T. Rowe Price Equity Income Portfolio
MainStay VP Winslow Large Cap Growth Portfolio
Mixed Asset Portfolios
MainStay VP Balanced Portfolio
MainStay VP Income Builder Portfolio
MainStay VP Janus Henderson Balanced Portfolio
MainStay VP MacKay Convertible Portfolio
Income Portfolios
MainStay VP Bond Portfolio
MainStay VP Floating Rate Portfolio
MainStay VP Indexed Bond Portfolio
MainStay VP MacKay Government Portfolio
MainStay VP MacKay High Yield Corporate Bond Portfolio
MainStay VP MacKay Unconstrained Bond Portfolio
MainStay VP PIMCO Real Return Portfolio
Money Market
MainStay VP U.S. Government Money Market Portfolio
Alternative
MainStay VP CBRE Global Infrastructure Portfolio
MainStay VP IQ Hedge Multi-Strategy Portfolio
Asset Allocation Portfolios
MainStay VP Conservative Allocation Portfolio
MainStay VP Growth Allocation Portfolio
MainStay VP Moderate Allocation Portfolio
MainStay VP Moderate Growth Allocation Portfolio
Manager
New York Life Investment Management LLC
New York, New York
Subadvisors
Brown Advisory LLC
Baltimore, Maryland
Candriam Belgium S.A.*
Brussels, Belgium
CBRE Clarion Securities LLC
Radnor, Pennsylvania
Epoch Investment Partners, Inc.
New York, New York
FIAM LLC
Smithfield, Rhode Island
IndexIQ Advisors LLC*
New York, New York
Janus Capital Management LLC
Denver, Colorado
MacKay Shields LLC*
New York, New York
Mellon Investments Corporation
Boston, Massachusetts
NYL Investors LLC*
New York, New York
Pacific Investment Management Company LLC
Newport Beach, California
Segall Bryant & Hamill, LLC
Chicago, Illinois
T. Rowe Price Associates, Inc.
Baltimore, Maryland
Winslow Capital Management, LLC
Minneapolis, Minnesota
Distributor
NYLIFE Distributors LLC*
Jersey City, New Jersey
Custodian
State Street Bank and Trust Company
Boston, Massachusetts
Independent Registered Public Accounting Firm
PricewaterhouseCoopers LLP
New York, New York
Legal Counsel
Dechert LLP
Washington, District of Columbia
Some Portfolios may not be available in all products.
| † | Fidelity Institutional AM is a registered trade mark of FMR LLC. Used with permission. |
| * | An affiliate of New York Life Investment Management LLC |
Not part of the Semiannual Report
2020 Semiannual Report
This report is for the general information of New York Life Variable Annuities and NYLIAC Variable Universal Life Insurance Products policyowners. It must be preceded or accompanied by the appropriate product(s) and funds prospectuses if it is given to anyone who is not an owner of a New York Life variable annuity policy or a NYLIAC Variable Universal Life Insurance Product. This report does not offer for sale or solicit orders to purchase securities.
The performance data quoted in this report represents past performance. Past performance is no guarantee of future results. Due to market volatility and other factors, current performance may be lower or higher than the figures shown. The most recent month-end performance summary for your variable annuity or variable life policy is available by calling 800-598-2019 and is updated periodically on www.newyorklife.com.
The New York Life Variable Annuities and NYLIAC Variable Universal Life Insurance Products are issued by New York Life Insurance and Annuity Corporation (a Delaware Corporation) and distributed by NYLIFE Distributors LLC (Member FINRA/SIPC).
New York Life Insurance Company
New York Life Insurance and Annuity Corporation (NYLIAC) (A Delaware Corporation)
51 Madison Avenue, Room 551
New York, NY 10010
www.newyorklife.com
Printed on recycled paper
nylinvestments.com
NYLIFE Distributors LLC, 30 Hudson Street, Jersey City, NJ 07302
New York Life Investment Management LLC is the investment manager to the MainStay VP Funds Trust
©2020 by NYLIFE Distributors LLC. All rights reserved.
You may obtain copies of the Prospectus and the Statement of Additional Information free of charge, upon request, by calling toll-free 800-598-2019 or writing to New York Life Insurance and Annuity Corporation, 51 Madison Avenue, New York, NY 10010.
| | | | |
| Not FDIC Insured | | No Bank Guarantee | | May Lose Value |
| | | | |
| 1781615 | | | | MSVPEME10-08/20 (NYLIAC) NI516 |
MainStay VP Floating Rate Portfolio
Message from the President and Semiannual Report
Unaudited | June 30, 2020
Beginning on January 1, 2021, as permitted by regulations adopted by the Securities and Exchange Commission, paper copies of the MainStay VP Portfolio annual and semi-annual shareholder reports may no longer be sent by mail, unless you specifically request paper copies of the reports from the insurance company that offers your policy. Instead, the reports will be made available online, and you will be notified by mail each time a report is posted and provided with a website link to access the report. Instructions for requesting paper copies will be provided by your insurance company.
If you already elected to receive shareholder reports electronically, you will not be affected by this change and you need not take any action. At any time, you may elect to receive reports and other communications from the insurance company electronically by following the instructions provided by the insurance company.
You may elect to receive all future shareholder reports in paper form free of charge. You can inform the insurance company that you wish to receive paper copies of reports by following the instructions provided by the insurance company. Your election to receive reports in paper form will apply to all portfolio companies available under your contract.
| | | | | | | | |
| Not FDIC/NCUA Insured | | Not a Deposit | | May Lose Value | | No Bank Guarantee | | Not Insured by Any Government Agency |

This page intentionally left blank
Message from the President
High levels of volatility shook financial markets in response to the COVID-19 pandemic and an abrupt decline in global economic activity during the six months ended June 30, 2020.
Markets entered 2020 riding strong fourth quarter performance and an economic expansion of historic longevity. Most broad stock and bond indices began to dip in late February as growing numbers of COVID-19 cases were seen in hotspots around the world. On March 11, 2020, the World Health Organization acknowledged that the disease had reached pandemic proportions, with over 80,000 identified cases in China, thousands in Italy, South Korea and the United States, and more in dozens of additional countries. Governments and central banks pledged trillions of dollars to address the mounting economic and public health crisis; however, “stay-at-home” orders and other restrictions on non-essential activity caused global economic activity to slow. Most stocks and bonds lost significant ground in this challenging environment, with equities declining by roughly a third and the yield on high-yield credit indices shooting higher.
Policymakers responded with extraordinary speed to address the situation. In the United States, the Federal Reserve (“Fed”) cut interest rates to near zero and announced unlimited quantitative easing. With help from Treasury, the Fed later rolled out a series of lending facilities to directly support market functioning. In late March, the Federal government declared a national emergency; Congress passed, and the President signed, a $2 trillion CARES Act (The Coronavirus Aid, Relief, and Economic Security Act), with the promise of further assistance for consumers and businesses to come. This enormous wave of policy support helped fuel a rapid recovery in market pricing as stocks bounced back and credit spreads narrowed. Some states rushed to ease restrictions on travel and social gatherings, further fueling optimism that the effects of the pandemic might prove short lived. However, the final weeks of the reporting period saw infection rates beginning to rise in some of the first states to reopen, raising concerns that a second round of restrictive government policies might prove necessary, once again stifling economic activity.
Despite all the market volatility, the broadly based S&P 500® Index finished the first half of 2020 only slightly below its starting point and the technology-heavy NASDAQ Composite Index posted gains, closing in near record territory. Small-cap stocks tended to trail their large cap counterparts, as illustrated by the Russell 2000® Index’s loss of approximately 15%, while value-oriented stocks lagged growth-oriented issues. From a global perspective, U.S. stocks generally outperformed international equities, with emerging markets hit particularly hard by the flight from risk.
Fixed-income markets also experienced unusually high levels of volatility. Recognized safe havens, such as U.S. government bonds, attracted increased investment, driving yields lower and prices higher, positioning long-term Treasury bonds to deliver particularly strong gains. Investment-grade corporate bonds lost value in March before recovering in the closing months of the reporting period, while relatively speculative high-yield credit faced the brunt of risk-off sentiment. Emerging market debt underperformed most other bonds types as investors sought to minimize currency and sovereign risks.
Today, as we at New York Life Investments continue to track the ongoing health crisis and its financial ramifications, we are particularly mindful of the people at the heart of our enterprise—our colleagues and valued clients. By taking appropriate steps to minimize community spread of COVID-19 within our organization, we strive to safeguard the health of our investment professionals so they can continue to provide you, as a MainStay investor, with world class investment solutions in this rapidly evolving environment.
Sincerely,

Kirk C. Lehneis
President
The opinions expressed are as of the date of this report and are subject to change. There is no guarantee that any forecast made will come to pass. This material does not constitute investment advice and is not intended as an endorsement of any specific investment. Past performance is no guarantee of future results.
Not part of the Semiannual Report
Table of Contents
Investors should refer to the Portfolio’s Summary Prospectus and/or Prospectus and consider the Portfolio’s investment objectives, strategies, risks, charges and expenses carefully before investing. The Summary Prospectus and/or Prospectus contain this and other information about the Portfolio. You may obtain copies of the Portfolio’s Summary Prospectus and/or the Prospectus and the Statement of Additional Information free of charge, upon request, by calling toll-free 800-598-2019, by writing to New York Life Insurance and Annuity Corporation, 51 Madison Avenue, Room 251, New York, New York 10010 or by sending an email to MainStayShareholdersServices@nylim.com. These documents are also available at nylinvestments.com/vpdocuments. Please read the Summary Prospectus and/or Prospectus carefully before investing. MainStay VP Funds Trust portfolios are separate account options which are purchased through a variable insurance or variable annuity contract.
Investment and Performance Comparison1 (Unaudited)
Performance data quoted represents past performance. Past performance is no guarantee of future results. Because of market volatility and other factors, current performance may be lower or higher than the figures shown. Investment return and principal value will fluctuate, and as a result, when shares are redeemed, they may be worth more or less than their original cost. The performance table and graph do not reflect any deduction of sales charges, mortality and expense charges, contract charges or administrative charges. Please refer to the Performance Summary appropriate for your policy. For performance information current to the most recent month-end, please call 800-598-2019 or visit www.newyorklife.com.
Average Annual Total Returns for the Period-Ended June 30, 2020
| | | | | | | | | | | | | | | | | | |
| Class | | Inception
Date | | Six Months | | One Year | | Five Years | | | Ten Years | | | Gross
Expense
Ratio2 | |
| | | | | | |
| Initial Class Shares | | 5/2/2005 | | –4.39% | | –1.62% | | | 2.67 | % | | | 3.63 | % | | | 0.65 | % |
| Service Class Shares | | 5/2/2005 | | –4.51 | | –1.89 | | | 2.41 | | | | 3.37 | | | | 0.90 | |
| | | | | | | | | | | | | | | | |
| Benchmark Performance | | Six
Months | | | One
Year | | | Five
Years | | | Ten
Years | |
| | | | |
S&P/LSTA Leveraged Loan Index3 | | | –4.61 | % | | | –1.99 | % | | | 2.89 | % | | | 4.17 | % |
Credit Suisse Leveraged Loan Index4 | | | –4.76 | | | | –2.27 | | | | 2.94 | | | | 4.34 | |
Morningstar Bank Loan Category Average5 | | | –5.50 | | | | –3.30 | | | | 1.93 | | | | 3.30 | |
| 1. | Performance figures may reflect certain fee waivers and/or expense limitations, without which total returns may have been different. For information on current fee waivers and/or expense limitations (if any), please refer to the Notes to Financial Statements. |
| 2. | The gross expense ratios presented reflect the Portfolio’s “Total Annual Portfolio Operating Expenses” from the most recent Prospectus, as supplemented, and may differ from other expense ratios disclosed in this report. |
| 3. | The S&P/LSTA Leveraged Loan Index is the Portfolio’s primary broad-based securities market index for comparison purposes. The S&P/LSTA Leveraged Loan Index is designed to reflect the performance of U.S. dollar facilities in the leveraged loan market. Results assume reinvestment of all dividends and capital gains. An investment cannot be made directly in an index. |
| 4. | The Credit Suisse Leveraged Loan Index is the Portfolio’s secondary benchmark. The Credit Suisse Leveraged Loan Index represents tradable, senior-secured, U.S. dollar denominated non-investment-grade loans. Results assume reinvestment of all dividends and capital gains. An investment cannot be made directly in an index. |
| 5. | The Morningstar Bank Loan Category Average is representative of funds that invest in floating-rate bank loans instead of bonds. In exchange for their credit risk, these loans offer high interest payments that typically float above a common short-term benchmark. Results are based on average total returns of similar funds with all dividends and capital gain distributions reinvested. |
Cost in Dollars of a $1,000 Investment in MainStay VP Floating Rate Portfolio (Unaudited)
The example below is intended to describe the fees and expenses borne by shareholders during the six-month period from January 1, 2020, to June 30, 2020, and the impact of those costs on your investment.
Example
As a shareholder of the Portfolio you incur two types of costs: (1) transaction costs, including exchange fees and sales charges (loads) on purchases (as applicable), and (2) ongoing costs, including management fees, distribution and/or service (12b-1) fees, and other Portfolio expenses (as applicable). This example is intended to help you understand your ongoing costs (in dollars) of investing in the Portfolio and to compare these costs with the ongoing costs of investing in other mutual funds. The example is based on an investment of $1,000 made at the beginning of the six-month period and held for the entire period from January 1, 2020, to June 30, 2020. Shares are only sold in connection with variable life and annuity contracts and the example does not reflect any contract level or transactional fees or expenses. If these costs had been included, your costs would have been higher.
This example illustrates your Portfolio’s ongoing costs in two ways:
Actual Expenses
The second and third data columns in the table below provide information about actual account values and actual expenses. You may use the information in these columns, together with the amount you invested, to estimate the expenses that you paid during the six months
ended June 30, 2020. Simply divide your account value by $1,000 (for example, an $8,600 account value divided by $1,000 = 8.6), then multiply the result by the number under the heading entitled “Expenses Paid During Period” to estimate the expenses you paid on your account during this period.
Hypothetical Example for Comparison Purposes
The fourth and fifth data columns in the table below provide information about hypothetical account values and hypothetical expenses based on the Portfolio’s actual expense ratio and an assumed rate of return of 5% per year before expenses, which is not the Portfolio’s actual return. The hypothetical account values and expenses may not be used to estimate the actual ending account balances or expenses you paid for the six-month period shown. You may use this information to compare the ongoing costs of investing in the Portfolio with the ongoing costs of investing in other mutual funds. To do so, compare this 5% hypothetical example with the 5% hypothetical examples that appear in the shareholder reports of the other mutual funds.
Please note that the expenses shown in the table are meant to highlight your ongoing costs only and do not reflect any transactional costs, such as exchange fees or sales charges (loads). Therefore, the fourth and fifth data columns of the table are useful in comparing ongoing costs only and will not help you determine the relative total costs of owning different funds. In addition, if these transactional costs were included, your costs would have been higher.
| | | | | | | | | | | | | | | | | | | | | | |
| | | | | | | | | | | | | | | | | | |
| Share Class | | Beginning
Account
Value
1/1/20 | | | Ending Account
Value (Based
on Actual
Returns and
Expenses)
6/30/20 | | | Expenses
Paid
During
Period1 | | | Ending Account
Value (Based
on Hypothetical
5% Annualized
Return and
Actual Expenses)
6/30/20 | | | Expenses
Paid
During
Period1 | | | Net Expense
Ratio
During
Period2 |
| | | | | | |
| Initial Class Shares | | $ | 1,000.00 | | | $ | 956.10 | | | $ | 3.16 | | | $ | 1,021.63 | | | $ | 3.27 | | | 0.65% |
| | | | | | |
| Service Class Shares | | $ | 1,000.00 | | | $ | 954.90 | | | $ | 4.37 | | | $ | 1,020.39 | | | $ | 4.52 | | | 0.90% |
| 1 | Expenses are equal to the Portfolio’s annualized expense ratio of each class multiplied by the average account value over the period, divided by 366 and multiplied by 182 (to reflect the six-month period). The table above represents the actual expenses incurred during the six-month period. In addition to the fees and expenses which the Portfolio bears directly, it also indirectly bears a pro rata share of the fees and expenses of the underlying funds in which it invests. Such indirect expenses are not included in the above-reported expense figures. |
| 2 | Expenses are equal to the Portfolio’s annualized expense ratio to reflect the six-month period. |
| | |
| 6 | | MainStay VP Floating Rate Portfolio |
Industry Composition as of June 30, 2020 (Unaudited)
| | | | |
| |
| Electronics | | | 14.3 | % |
| |
| Healthcare, Education & Childcare | | | 9.0 | |
| |
| Hotels, Motels, Inns & Gaming | | | 5.8 | |
| |
| Utilities | | | 5.4 | |
| |
| Broadcasting & Entertainment | | | 4.6 | |
| |
| Diversified/Conglomerate Service | | | 4.3 | |
| |
| Telecommunications | | | 4.1 | |
| |
| Chemicals, Plastics & Rubber | | | 3.9 | |
| |
| Leisure, Amusement, Motion Pictures & Entertainment | | | 3.9 | |
| |
| Containers, Packaging & Glass | | | 3.6 | |
| |
| Diversified/Conglomerate Manufacturing | | | 3.5 | |
| |
| Insurance | | | 3.3 | |
| |
| Buildings & Real Estate | | | 3.1 | |
| |
| Beverage, Food & Tobacco | | | 2.9 | |
| |
| Retail Store | | | 2.6 | |
| |
| Personal, Food & Miscellaneous Services | | | 2.2 | |
| |
| Automobile | | | 2.1 | |
| |
| Banking | | | 1.7 | |
| |
| Oil & Gas | | | 1.6 | |
| |
| Aerospace & Defense | | | 1.5 | |
| |
| Machinery (Non-Agriculture, Non-Construct & Non-Electronic) | | | 1.5 | |
| |
| Mining, Steel, Iron & Non-Precious Metals | | | 1.5 | |
| |
| Finance | | | 1.3 | |
| |
Personal & Nondurable Consumer Products (Manufacturing Only) | | | 1.0 | |
| |
| Printing & Publishing | | | 1.0 | |
| |
| Electric | | | 0.9 | |
| |
| Commercial Services | | | 0.6 | |
| |
| Ecological | | | 0.5 | |
| |
| Affiliated Investment Company | | | 0.3 | |
| |
| Chemicals | | | 0.3 | |
| | | | |
| |
| Auto Manufacturers | | | 0.2 | % |
| |
| Biotechnology | | | 0.2 | |
| |
| Cargo Transport | | | 0.2 | |
| |
| Environmental Controls | | | 0.2 | |
| |
| Food | | | 0.2 | |
| |
| Lodging | | | 0.2 | |
| |
| Metals & Mining | | | 0.2 | |
| |
| Packaging & Containers | | | 0.2 | |
| |
| Distribution & Wholesale | | | 0.1 | |
| |
| Entertainment | | | 0.1 | |
| |
Home and Office Furnishings, Housewares & Durable Consumer Products | | | 0.1 | |
| |
| Household Products & Wares | | | 0.1 | |
| |
| Media | | | 0.1 | |
| |
| Mining | | | 0.1 | |
| |
| Miscellaneous—Manufacturing | | | 0.1 | |
| |
| Oil & Gas Services | | | 0.1 | |
| |
| Personal Transportation | | | 0.1 | |
| |
| Real Estate Investment Trusts | | | 0.1 | |
| |
| Retail | | | 0.1 | |
| |
| Communications Equipment | | | 0.0 | ‡ |
| |
| Housewares | | | 0.0 | ‡ |
| |
| Independent Power & Renewable Electricity Producers | | | 0.0 | ‡ |
| |
| Medical Equipment & Devices | | | 0.0 | ‡ |
| |
| Oil, Gas & Consumable Fuels | | | 0.0 | ‡ |
| |
| Pharmaceuticals | | | 0.0 | ‡ |
| |
| Real Estate | | | 0.0 | ‡ |
| |
| Short-Term Investments | | | 6.0 | |
| |
| Other Assets, Less Liabilities | | | –1.0 | |
| | | | |
| |
| | | 100.0 | % |
| | | | |
See Portfolio of Investments beginning on page 10 for specific holdings within these categories. The Portfolio’s holdings are subject to change.
| ‡Less | than one-tenth of a percent. |
Top Ten Issuers Held as of June 30, 2020 (excluding short-term investments) (Unaudited)
| 1. | Asurion LLC, 3.178%–6.678%, due 8/4/22–8/4/25 |
| 2. | Bausch Health Cos., Inc., 3.19%, due 6/2/25 |
| 3. | McAfee LLC, 3.934%–9.50%, due 9/30/24–9/29/25 |
| 4. | Charter Communications Operating LLC, 1.93%, due 4/30/25 |
| 5. | Calpine Corp., 2.43%, due 1/15/24–4/5/26 |
| 6. | Vistra Operations Co. LLC, 1.928%–5.00%, due 12/31/25–7/31/27 |
| 7. | Scientific Games International, Inc., 3.476%–7.00%, due 8/14/24–5/15/28 |
| 8. | UFC Holdings LLC, 4.25%, due 4/29/26 |
| 9. | SS&C Technologies, Inc., 1.928%, due 4/16/25 |
| 10. | Hyland Software, Inc., 4.00%–7.75%, due 7/1/24–7/7/25 |
Portfolio Management Discussion and Analysis (Unaudited)
Answers to the questions reflect the views of portfolio managers Robert H. Dial, Mark A. Campellone and Arthur S. Torrey of NYL Investors LLC, the Portfolio’s Subadvisor.
How did MainStay VP Floating Rate Portfolio perform relative to its benchmarks and peers during the six months ended June 30, 2020?
For the six months ended June 30, 2020, MainStay VP Floating Rate Portfolio returned –4.39% for Initial Class shares and –4.51% for Service Class shares. Over the same period, both share classes outperformed the –4.61% return of the S&P/LSTA Leveraged Loan Index, which is the Portfolio’s primary benchmark, and the –4.76% return of the Credit Suisse Leveraged Loan Index, which is the Portfolio’s secondary benchmark. As of June 30, 2020, both share classes also outperformed the –5.50% return of the Morningstar Bank Loan Category Average.1
What factors affected the Portfolio’s relative performance during the reporting period?
The Portfolio outperformed the S&P/LSTA Leveraged Loan Index primarily due to underweight exposure to sectors more vulnerable to the impact of the COVID-19 pandemic. The Portfolio also benefited from its underweight position in securities with low credit ratings, which underperformed the broader loan market. Finally, the Portfolio benefited from its exposure to high-yield bonds, which are not included in the benchmark and performed relatively well.
What was the Portfolio’s duration2 strategy during the reporting period?
Floating-rate loans are, by their nature, a low-duration asset. Loans earn a stated spread3 over a floating reference rate, which is the London InterBank Offered Rate (“LIBOR”).4 Issuers can generally borrow under a 30- to 90-day range with LIBOR. The weighted-average time to LIBOR reset on the Portfolio averaged approximately 40 days during the reporting period.
What specific factors, risks or market forces prompted significant decisions for the Portfolio during the reporting period?
The impact of the pandemic on the global economy and financial markets, along with the corresponding increase in market volatility, prompted a significant response for the Portfolio. We sought to lower the Portfolio’s exposure to issuers and sectors we believe could prove vulnerable to the pandemic’s impact. We also sought to raise the Portfolio’s average cash balance to maintain liquidity. As the markets began to recover in the second half of the reporting period, we selectively and modestly
added to the Portfolio’s high-yield bond allocation and to floating-rate loans we judged to be less vulnerable to the pandemic’s effects. These decisions collectively enhanced the Portfolio’s performance during the reporting period.
During the reporting period, which market segments were the strongest positive contributors to the Portfolio’s absolute performance and which market segments were particularly weak?
During the reporting period the Portfolio realized its largest contributions to absolute performance from its underweight positions in retail, healthcare, and oil & gas which all underperformed the broader market during the reporting period. (Contributions take weightings and total returns into account.) Conversely, the Portfolio realized its biggest detractors to absolute performance from its overweight positions in gaming and home furnishings and its market weight position in insurance.
Did the Portfolio make any significant purchases or sales during the reporting period?
Significant purchases during the reporting period included bonds issued by telecommunications companies Sprint and CenturyLink, reflecting our favorable view of the business prospects and management of these issuers. The Portfolio’s largest sales during the same period included securities from beauty and personal care products maker Revlon, electric utility Oregon Clean Energy, British telecommunications company Inmarsat and resort and casino operator Caesars Entertainment. With the exception of Revlon bonds, these sales were not of the Portfolio’s full positions. The reductions in the Portfolio’s Inmarsat and Caesars holdings reflected our concerns over business disruption from the pandemic. Other sales were undertaken to help maintain the Portfolio’s liquidity and relative value.
How did the Portfolio’s sector weightings change during the reporting period?
In response to the pandemic and our outlook for its impact on economic growth, we made several changes to the Portfolio’s allocations. In particular, we reduced the Portfolio’s exposure to sectors we believed likely to prove vulnerable to pandemic-related disruptions, including automobiles, building materials, energy, gaming and retail. Offsetting these reductions, we increased the Portfolio’s exposure to sectors we judged to be more resilient, including aerospace & defense, cable & television broadcasting, packaging, food products and telecommunications.
| 1. | See page 5 for more information on benchmark and peer group returns. |
| 2. | Duration is a measure of the price sensitivity of a fixed-income investment to changes in interest rates. Duration is expressed as a number of years and is considered a more accurate sensitivity gauge than average maturity. |
| 3. | The terms “spread” and “yield spread” may refer to the difference in yield between a security or type of security and comparable U.S. Treasury issues. The terms may also refer to the difference in yield between two specific securities or types of securities at a given time. |
| 4. | LIBOR is a composite of interest rates at which banks borrow from one another in the London market, and it is a widely used benchmark for short-term interest rates. |
| | |
| 8 | | MainStay VP Floating Rate Portfolio |
How was the Portfolio positioned at the end of the reporting period?
As noted earlier, during the reporting period the Portfolio moved to a modestly more defensive positioning in response to pandemic-related market volatility. As of June 30, 2020, the Portfolio was able to run with higher average cash balances. As of the same date, on a ratings basis, the Portfolio held overweight exposure to credits rated BB relative to the S&P/LSTA Leveraged Loan Index, and underweight exposure to credits rated B, CCC and below.5
| 5. | An obligation rated ‘BB’ by Standard & Poor’s (“S&P”) is deemed by S&P to be less vulnerable to nonpayment than other speculative issues. In the opinion of S&P, however, the obligor faces major ongoing uncertainties or exposure to adverse business, financial or economic conditions which could lead to the obligor’s inadequate capacity to meet its financial commitment on the obligation. An obligation rated ‘B’ by S&P is deemed by S&P to be more vulnerable to nonpayment than obligations rated ‘BB’, but in the opinion of S&P, the obligor currently has the capacity to meet its financial commitment on the obligation. It is the opinion of S&P that adverse business, financial, or economic conditions will likely impair the obligor’s capacity or willingness to meet its financial commitment on the obligation. An obligation rated ‘CCC’ by S&P is deemed by S&P to be currently vulnerable to nonpayment and is dependent upon favorable business, financial and economic conditions for the obligor to meet its financial commitment on the obligation. It is the opinion of S&P that in the event of adverse business, financial or economic conditions, the obligor is not likely to have the capacity to meet its financial commitment on the obligation. When applied to Portfolio holdings, ratings are based solely on the creditworthiness of the bonds in the Portfolio and are not meant to represent the security or safety of the Portfolio. |
The opinions expressed are those of the portfolio managers as of the date of this report and are subject to change. There is no guarantee that any forecasts will come to pass. This material does not constitute investment advice and is not intended as an endorsement of any specific investment.
Not all MainStay VP Portfolios and/or share classes are available under all policies.
Portfolio of Investments June 30, 2020 (Unaudited)
| | | | | | | | |
| | | Principal
Amount | | | Value | |
Long-Term Bonds 94.5%† Corporate Bonds 4.0% | |
Aerospace & Defense 0.2% | |
Howmet Aerospace, Inc.
6.875%, due 5/1/25 | | $ | 200,000 | | | $ | 216,972 | |
Spirit AeroSystems, Inc.
7.50%, due 4/15/25 (a) | | | 900,000 | | | | 887,625 | |
| | | | | | | | |
| | | | | | | 1,104,597 | |
| | | | | | | | |
Auto Manufacturers 0.2% | |
Ford Motor Co.
8.50%, due 4/21/23 | | | 300,000 | | | | 317,250 | |
9.00%, due 4/22/25 | | | 600,000 | | | | 649,320 | |
| | | | | | | | |
| | | | | | | 966,570 | |
| | | | | | | | |
Chemicals 0.3% | |
Atotech Alpha 3 B.V. / Alpha U.S. Bidco, Inc. 6.25%, due 2/1/25 (a) | | | 400,000 | | | | 396,000 | |
Element Solutions, Inc.
5.875%, due 12/1/25 (a) | | | 1,200,000 | | | | 1,211,625 | |
Starfruit Finco B.V. / Starfruit U.S. Holdco LLC
8.00%, due 10/1/26 (a) | | | 500,000 | | | | 511,845 | |
| | | | | | | | |
| | | | | | | 2,119,470 | |
| | | | | | | | |
Commercial Services 0.6% | |
Herc Holdings, Inc.
5.50%, due 7/15/27 (a) | | | 850,000 | | | | 851,827 | |
Jaguar Holding Co. II / PPD Development L.P.
4.625%, due 6/15/25 (a) | | | 1,200,000 | | | | 1,221,240 | |
Prime Security Services Borrower LLC / Prime Finance, Inc.
6.25%, due 1/15/28 (a) | | | 1,000,000 | | | | 942,500 | |
Refinitiv U.S. Holdings, Inc.
8.25%, due 11/15/26 (a) | | | 500,000 | | | | 541,485 | |
| | | | | | | | |
| | | | | | | 3,557,052 | |
| | | | | | | | |
Distribution & Wholesale 0.1% | |
IAA, Inc.
5.50%, due 6/15/27 (a) | | | 500,000 | | | | 515,810 | |
KAR Auction Services, Inc.
5.125%, due 6/1/25 (a) | | | 350,000 | | | | 344,750 | |
| | | | | | | | |
| | | | | | | 860,560 | |
| | | | | | | | |
Electric 0.9% | |
Clearway Energy Operating LLC
5.75%, due 10/15/25 | | | 1,630,000 | | | | 1,682,975 | |
NRG Energy, Inc.
7.25%, due 5/15/26 | | | 1,300,000 | | | | 1,371,500 | |
Vistra Energy Corp.
8.125%, due 1/30/26 (a) | | | 1,250,000 | | | | 1,303,125 | |
| | | | | | | | |
| | | Principal
Amount | | | Value | |
Electric (continued) | |
Vistra Operations Co. LLC
5.00%, due 7/31/27 (a) | | $ | 1,500,000 | | | $ | 1,516,875 | |
| | | | | | | | |
| | | | | | | 5,874,475 | |
| | | | | | | | |
Entertainment 0.1% | |
Scientific Games International, Inc.
7.00%, due 5/15/28 (a) | | | 900,000 | | | | 720,000 | |
| | | | | | | | |
|
Environmental Controls 0.2% | |
Advanced Disposal Services, Inc.
5.625%, due 11/15/24 (a) | | | 800,000 | | | | 830,000 | |
GFL Environmental, Inc. (a)
4.25%, due 6/1/25 | | | 500,000 | | | | 504,375 | |
8.50%, due 5/1/27 | | | 228,000 | | | | 247,950 | |
| | | | | | | | |
| | | | | | | 1,582,325 | |
| | | | | | | | |
Food 0.2% | |
Albertsons Cos., Inc. / Safeway, Inc. / New Albertsons, L.P. / Albertsons LLC
4.875%, due 2/15/30 (a) | | | 300,000 | | | | 306,939 | |
Post Holdings, Inc.
5.50%, due 12/15/29 (a) | | | 240,000 | | | | 248,189 | |
U.S. Foods, Inc.
6.25%, due 4/15/25 (a) | | | 500,000 | | | | 508,750 | |
| | | | | | | | |
| | | | | | | 1,063,878 | |
| | | | | | | | |
Household Products & Wares 0.1% | |
Prestige Brands, Inc.
6.375%, due 3/1/24 (a) | | | 300,000 | | | | 307,500 | |
| | | | | | | | |
|
Housewares 0.0%‡ | |
Scotts Miracle-Gro Co.
5.25%, due 12/15/26 | | | 200,000 | | | | 207,750 | |
| | | | | | | | |
|
Lodging 0.2% | |
Boyd Gaming Corp. (a)
4.75%, due 12/1/27 | | | 400,000 | | | | 344,000 | |
8.625%, due 6/1/25 | | | 1,000,000 | | | | 1,045,000 | |
| | | | | | | | |
| | | | | | | 1,389,000 | |
| | | | | | | | |
Media 0.1% | |
iHeartCommunications, Inc.
6.375%, due 5/1/26 | | | 105,206 | | | | 104,154 | |
8.375%, due 5/1/27 | | | 190,685 | | | | 174,738 | |
Univision Communications, Inc.
6.625%, due 6/1/27 (a) | | | 600,000 | | | | 573,000 | |
| | | | | | | | |
| | | | | | | 851,892 | |
| | | | | | | | |
|
Mining 0.1% | |
Kaiser Aluminum Corp.
6.50%, due 5/1/25 (a) | | | 650,000 | | | | 671,938 | |
| | | | | | | | |
| | | | |
| 10 | | MainStay VP Floating Rate Portfolio | | The notes to the financial statements are an integral part of,
and should be read in conjunction with, the financial statements. |
| | | | | | | | |
| | | Principal
Amount | | | Value | |
| Corporate Bonds (continued) | |
Miscellaneous—Manufacturing 0.1% | |
Koppers, Inc.
6.00%, due 2/15/25 (a) | | $ | 500,000 | | | $ | 486,250 | |
| | | | | | | | |
|
Oil & Gas 0.0%‡ | |
EP Energy LLC / Everest Acquisition Finance, Inc.
8.00%, due 2/15/25 (a)(b)(c) | | | 200,000 | | | | 2 | |
| | | | | | | | |
|
Oil & Gas Services 0.1% | |
USA Compression Partners, L.P. / USA Compression Finance Corp.
6.875%, due 4/1/26 | | | 360,000 | | | | 347,850 | |
| | | | | | | | |
|
Packaging & Containers 0.2% | |
Ardagh Packaging Finance PLC / Ardagh Holdings USA, Inc.
5.25%, due 4/30/25 (a) | | | 1,000,000 | | | | 1,024,990 | |
Plastipak Holdings, Inc.
6.25%, due 10/15/25 (a) | | | 220,000 | | | | 213,400 | |
| | | | | | | | |
| | | | | | | 1,238,390 | |
| | | | | | | | |
Pharmaceuticals 0.0%‡ | |
Bausch Health Cos., Inc.
5.50%, due 11/1/25 (a) | | | 300,000 | | | | 307,500 | |
| | | | | | | | |
|
Real Estate 0.0%‡ | |
Realogy Group LLC / Realogy Co-Issuer Corp.
7.625%, due 6/15/25 (a) | | | 240,000 | | | | 240,048 | |
| | | | | | | | |
|
Real Estate Investment Trusts 0.1% | |
Iron Mountain, Inc.
5.00%, due 7/15/28 (a) | | | 350,000 | | | | 342,895 | |
Ryman Hospitality Properties, Inc.
4.75%, due 10/15/27 (a) | | | 300,000 | | | | 267,000 | |
| | | | | | | | |
| | | | | | | 609,895 | |
| | | | | | | | |
Retail 0.1% | |
IRB Holding Corp.
7.00%, due 6/15/25 (a) | | | 580,000 | | | | 597,806 | |
| | | | | | | | |
|
Telecommunications 0.1% | |
Telesat Canada / Telesat LLC
4.875%, due 6/1/27 (a) | | | 600,000 | | | | 588,000 | |
| | | | | | | | |
Total Corporate Bonds
(Cost $25,737,626) | | | | 25,692,748 | |
| | | | | |
| | | | | | | | |
| | | Principal
Amount | | | Value | |
| Floating Rate Loans 79.7% (d) | |
Aerospace & Defense 1.0% | |
Dynasty Acquisition Co., Inc. 2020 Term Loan B1
3.808% (3 Month LIBOR + 3.50%), due 4/6/26 | | $ | 1,544,388 | | | $ | 1,316,590 | |
2020 CAD Term Loan B2 3.808% (3 Month LIBOR + 3.50%), due 4/6/26 | | | 830,316 | | | | 707,844 | |
Science Applications International Corp.
2018 Term Loan B
2.053% (1 Month LIBOR + 1.875%), due 10/31/25 | | | 886,500 | | | | 858,797 | |
TransDigm, Inc.
2020 Term Loan E
2.428% (1 Month LIBOR + 2.25%), due 5/30/25 | | | 977,588 | | | | 876,163 | |
2020 Term Loan F 2.428% (1 Month LIBOR + 2.25%), due 12/9/25 | | | 3,125,233 | | | | 2,811,407 | |
| | | | | | | | |
| | | | | | | 6,570,801 | |
| | | | | | | | |
Automobile 2.0% | |
American Axle and Manufacturing, Inc.
Term Loan B
3.00% (1 Month LIBOR + 2.25%), due 4/6/24 | | | 1,824,728 | | | | 1,728,930 | |
AP Exhaust Acquisition LLC
2019 Term Loan B
6.36%-6.721% (3 Month LIBOR + 5.00%, 6 Month LIBOR + 5.00%), due 5/10/24 (e) | | | 607,309 | | | | 91,096 | |
Autokiniton U.S. Holdings, Inc.
2018 Term Loan B
6.553% (1 Month LIBOR + 6.375%), due 5/22/25 (e)(f) | | | 1,771,406 | | | | 1,665,121 | |
Belron Finance U.S. LLC
2018 Term Loan B
2.934% (3 Month LIBOR + 2.50%), due 11/13/25 | | | 985,000 | | | | 952,988 | |
USD Term Loan B 2.974% (3 Month LIBOR + 2.50%), due 11/7/24 | | | 975,000 | | | | 943,313 | |
2019 USD Term Loan B 3.26% (3 Month LIBOR + 2.50%), due 10/30/26 | | | 1,243,750 | | | | 1,197,109 | |
Chassix, Inc.
2017 1st Lien Term Loan
6.50% (3 Month LIBOR + 5.50%), due 11/15/23 | | | 1,462,500 | | | | 1,023,750 | |
IAA, Inc.
Term Loan B
2.438% (1 Month LIBOR + 2.25%), due 6/28/26 | | | 1,418,750 | | | | 1,356,680 | |
| | | | | | |
The notes to the financial statements are an integral part of,
and should be read in conjunction with, the financial statements. | | | | | 11 | |
Portfolio of Investments June 30, 2020 (Unaudited) (continued)
| | | | | | | | |
| | | Principal
Amount | | | Value | |
| Floating Rate Loans (continued) | |
Automobile (continued) | |
KAR Auction Services, Inc.
2019 Term Loan B6
2.50% (1 Month LIBOR + 2.25%), due 9/19/26 | | $ | 741,888 | | | $ | 702,938 | |
Mavis Tire Express Services Corp.
2018 1st Lien Term Loan
3.558% (3 Month LIBOR + 3.25%), due 3/20/25 | | | 1,575,325 | | | | 1,403,351 | |
Wand NewCo 3, Inc.
2020 Term Loan
4.072% (3 Month LIBOR + 3.00%), due 2/5/26 | | | 2,178,055 | | | | 2,063,707 | |
| | | | | | | | |
| | | | | | | 13,128,983 | |
| | | | | | | | |
Banking 1.7% | |
Apollo Commercial Real Estate Finance, Inc.
Term Loan B
2.935% (1 Month LIBOR + 2.75%), due 5/15/26 | | | 1,485,000 | | | | 1,366,200 | |
Broadstreet Partners, Inc.
2020 Term Loan B
3.428% (1 Month LIBOR + 3.25%), due 1/27/27 | | | 2,553,953 | | | | 2,430,245 | |
Brookfield Property REIT, Inc.
1st Lien Term Loan B
2.678% (1 Month LIBOR + 2.50%), due 8/27/25 | | | 2,428,851 | | | | 1,991,658 | |
Edelman Financial Center LLC
2018 1st Lien Term Loan
3.18% (1 Month LIBOR + 3.00%), due 7/21/25 | | | 1,674,500 | | | | 1,597,473 | |
Greenhill & Co., Inc.
Term Loan B
3.44% (1 Month LIBOR + 3.25%), due 4/12/24 (e)(f) | | | 716,940 | | | | 673,924 | |
Jane Street Group LLC
2020 Term Loan
3.178% (1 Month LIBOR + 3.00%), due 1/31/25 | | | 1,861,587 | | | | 1,804,188 | |
Russell Investments U.S. Inst’l Holdco, Inc.
Term Loan B
3.822% (6 Month LIBOR + 2.75%), due 6/1/23 | | | 867,733 | | | | 840,254 | |
| | | | | | | | |
| | | | | | | 10,703,942 | |
| | | | | | | | |
Beverage, Food & Tobacco 1.9% | |
8th Avenue Food & Provisions, Inc.
2018 1st Lien Term Loan
3.685% (1 Month LIBOR + 3.50%), due 10/1/25 | | | 1,576,000 | | | | 1,529,705 | |
| | | | | | | | |
| | | Principal
Amount | | | Value | |
Beverage, Food & Tobacco (continued) | |
Advantage Sales & Marketing, Inc. | |
Term Loan B2 4.25% (3 Month LIBOR + 3.25%), due 7/25/21 | | $ | 970,000 | | | $ | 882,094 | |
2014 2nd Lien Term Loan 7.50% (3 Month LIBOR + 6.50%), due 7/25/22 (e) | | | 625,000 | | | | 508,985 | |
American Seafoods Group LLC
2017 1st Lien Term Loan
4.118%-4.13% (3 Month LIBOR + 2.75%), due 8/21/23 | | | 645,512 | | | | 622,919 | |
Arctic Glacier U.S.A., Inc.
2018 Term Loan B
4.50% (3 Month LIBOR + 3.50%), due 3/20/24 (e) | | | 619,218 | | | | 515,112 | |
ASP MSG Acquisition Co., Inc.
2017 Term Loan B
5.00% (1 Month LIBOR + 4.00%), due 8/16/23 (e) | | | 1,583,905 | | | | 1,476,001 | |
CHG PPC Parent LLC
2018 Term Loan B
2.928% (1 Month LIBOR + 2.75%), due 3/31/25 | | | 1,715,000 | | | | 1,629,250 | |
Hearthside Food Solutions LLC
2018 Term Loan B
3.866% (1 Month LIBOR + 3.687%), due 5/23/25 | | | 1,272,772 | | | | 1,207,224 | |
U.S. Foods, Inc.
2019 Term Loan B
3.072% (3 Month LIBOR + 2.00%), due 9/13/26 | | | 1,985,000 | | | | 1,855,975 | |
United Natural Foods, Inc.
Term Loan B
4.428% (1 Month LIBOR + 4.25%), due 10/22/25 | | | 2,380,982 | | | | 2,265,652 | |
| | | | | | | | |
| | | | | | | 12,492,917 | |
| | | | | | | | |
Biotechnology 0.2% | |
Elanco Animal Health, Inc.
Term Loan B
TBD, due 2/4/27 | | | 1,600,000 | | | | 1,524,000 | |
| | | | | | | | |
|
Broadcasting & Entertainment 4.0% | |
Charter Communications Operating LLC
2019 Term Loan B1
1.93% (1 Month LIBOR + 1.75%), due 4/30/25 | | | 4,875,000 | | | | 4,694,220 | |
Clear Channel Outdoor Holdings, Inc.
Term Loan B
4.26% (3 Month LIBOR + 3.50%), due 8/21/26 | | | 1,736,875 | | | | 1,571,872 | |
| | | | |
| 12 | | MainStay VP Floating Rate Portfolio | | The notes to the financial statements are an integral part of,
and should be read in conjunction with, the financial statements. |
| | | | | | | | |
| | | Principal
Amount | | | Value | |
| Floating Rate Loans (continued) | |
Broadcasting & Entertainment (continued) | |
Diamond Sports Group LLC
Term Loan
3.43% (3 Month LIBOR + 3.25%), due 8/24/26 | | $ | 2,972,513 | | | $ | 2,411,451 | |
Entercom Media Corp.
2019 Term Loan
2.684% (1 Month LIBOR + 2.50%), due 11/18/24 | | | 890,652 | | | | 829,976 | |
Gray Television, Inc.
2018 Term Loan C
2.673% (1 Month LIBOR + 2.50%), due 1/2/26 | | | 2,506,446 | | | | 2,420,809 | |
Nexstar Broadcasting, Inc.
2019 Term Loan B4
2.923% (1 Month LIBOR + 2.75%), due 9/18/26 | | | 3,242,110 | | | | 3,073,925 | |
Nielsen Finance LLC
Term Loan B4
2.18% (1 Month LIBOR + 2.00%), due 10/4/23 | | | 1,204,836 | | | | 1,159,052 | |
Radiate Holdco LLC
1st Lien Term Loan
3.75% (1 Month LIBOR + 3.00%), due 2/1/24 | | | 3,575,842 | | | | 3,406,983 | |
Terrier Media Buyer, Inc.
Term Loan B
4.428% (1 Month LIBOR + 4.25%), due 12/17/26 | | | 829,167 | | | | 789,091 | |
Univision Communications, Inc.
Term Loan C5
3.75% (1 Month LIBOR + 2.75%), due 3/15/24 | | | 3,624,095 | | | | 3,349,269 | |
WideOpenWest Finance LLC
2017 Term Loan B
4.25% (1 Month LIBOR + 3.25%), due 8/18/23 | | | 1,930,413 | | | | 1,835,500 | |
| | | | | | | | |
| | | | | | | 25,542,148 | |
| | | | | | | | |
Buildings & Real Estate 3.1% | |
American Bath Group LLC
2018 Term Loan B
5.00% (2 Month LIBOR + 4.00%), due 9/30/23 (e) | | | 979,875 | | | | 950,478 | |
Core & Main L.P.
2017 Term Loan B
3.75% (3 Month LIBOR + 2.75%, 6 Month LIBOR + 2.750%), due 8/1/24 | | | 2,564,186 | | | | 2,435,976 | |
Cushman & Wakefield U.S. Borrower LLC
2020 Term Loan B
2.928% (1 Month LIBOR + 2.75%), due 8/21/25 | | | 2,955,094 | | | | 2,774,094 | |
| | | | | | | | |
| | | Principal
Amount | | | Value | |
Buildings & Real Estate (continued) | |
Hamilton Holdco LLC
2018 Term Loan B
2.31% (3 Month LIBOR + 2.00%), due 1/2/27 | | $ | 367,500 | | | $ | 352,800 | |
Jeld-Wen, Inc.
2017 1st Lien Term Loan
2.178% (1 Month LIBOR + 2.00%), due 12/14/24 | | | 761,719 | | | | 716,016 | |
NCI Building Systems, Inc.
2018 Term Loan
3.941% (1 Month LIBOR + 3.75%), due 4/12/25 | | | 2,549,474 | | | | 2,417,750 | |
Realogy Group LLC
2018 Term Loan B
3.00% (3 Month LIBOR + 2.25%), due 2/8/25 | | | 1,829,960 | | | | 1,681,276 | |
SIWF Holdings, Inc.
1st Lien Term Loan
5.322% (3 Month LIBOR + 4.25%), due 6/15/25 | | | 1,268,911 | | | | 1,180,087 | |
2nd Lien Term Loan
9.572% (6 Month LIBOR + 8.50%), due 6/15/26 | | | 120,000 | | | | 100,200 | |
SMG U.S. Midco 2, Inc.
2020 Term Loan
3.271%-3.518% (1 Month LIBOR + 2.50%, 3 Month LIBOR + 2.50%), due 1/23/25 | | | 1,839,506 | | | | 1,618,766 | |
SRS Distribution, Inc.
2018 1st Lien Term Loan
4.322% (3 Month LIBOR + 3.25%), due 5/23/25 | | | 2,062,019 | | | | 1,948,608 | |
VC GB Holdings, Inc.
2017 1st Lien Term Loan
4.00% (3 Month LIBOR + 3.00%), due 2/28/24 (e)(f) | | | 1,182,128 | | | | 1,117,111 | |
Wilsonart LLC
2017 Term Loan B
4.25% (3 Month LIBOR + 3.25%), due 12/19/23 | | | 2,465,285 | | | | 2,374,890 | |
| | | | | | | | |
| | | | | | | 19,668,052 | |
| | | | | | | | |
Cargo Transport 0.2% | |
Genesee & Wyoming, Inc.
Term Loan
2.308% (3 Month LIBOR + 2.00%), due 12/30/26 | | | 1,496,250 | | | | 1,439,393 | |
| | | | | | | | |
| | | | | | |
The notes to the financial statements are an integral part of,
and should be read in conjunction with, the financial statements. | | | | | 13 | |
Portfolio of Investments June 30, 2020 (Unaudited) (continued)
| | | | | | | | |
| | | Principal
Amount | | | Value | |
| Floating Rate Loans (continued) | |
Chemicals, Plastics & Rubber 2.6% | |
Allnex USA, Inc.
Term Loan B3
4.00% (3 Month LIBOR + 3.25%), due 9/13/23 (e) | | $ | 942,932 | | | $ | 887,928 | |
Cabot Microelectronics Corp.
2019 Term Loan B1
2.188% (1 Month LIBOR + 2.00%), due 11/17/25 | | | 793,542 | | | | 768,744 | |
Emerald Performance Materials LLC (e) | |
New 1st Lien Term Loan
4.50% (1 Month LIBOR + 3.50%), due 8/1/21 | | | 1,206,191 | | | | 1,159,452 | |
New 2nd Lien Term Loan
8.75% (1 Month LIBOR + 7.75%), due 8/1/22 | | | 507,183 | | | | 483,092 | |
Encapsys LLC
2020 Term Loan B2
4.25% (1 Month LIBOR + 3.25%), due 11/7/24 | | | 456,768 | | | | 436,214 | |
Flex Acquisition Co., Inc.
1st Lien Term Loan
4.433% (3 Month LIBOR + 3.00%), due 12/29/23 | | | 874,735 | | | | 835,372 | |
Flint Group U.S. LLC
1st Lien Term Loan B2
4.02% (3 Month LIBOR + 3.00%), due 9/7/21 (e) | | | 1,752,415 | | | | 1,486,631 | |
Ineos U.S. Finance LLC
2017 Term Loan B
2.178% (1 Month LIBOR + 2.00%), due 4/1/24 | | | 1,456,329 | | | | 1,374,411 | |
Innophos, Inc.
2020 Term Loan B
3.928% (1 Month LIBOR + 3.75%), due 2/4/27 | | | 1,496,250 | | | | 1,462,584 | |
Minerals Technologies, Inc.
2017 Term Loan B
3.00% (1 Month LIBOR + 2.25%, 3 Month LIBOR + 2.25%), due 2/14/24 (e)(f) | | | 742,090 | | | | 719,827 | |
PQ Corp.
2018 Term Loan B
2.428% (1 Month LIBOR + 2.25%), due 2/7/27 | | | 1,227,861 | | | | 1,192,780 | |
TricorBraun Holdings, Inc.
2016 1st Lien Term Loan
4.75% (3 Month LIBOR + 3.75%), due 11/30/23 | | | 1,450,871 | | | | 1,392,836 | |
| | | | | | | | |
| | | Principal
Amount | | | Value | |
Chemicals, Plastics & Rubber (continued) | |
Tronox Finance LLC
Term Loan B
2.982%-3.058% (1 Month LIBOR + 2.75%, 3 Month LIBOR + 2.75%), due 9/23/24 | | $ | 2,521,130 | | | $ | 2,410,831 | |
Univar, Inc.
2019 USD Term Loan B5
2.178% (3 Month LIBOR + 2.00%), due 7/1/26 | | | 597,000 | | | | 567,896 | |
Venator Materials Corp.
Term Loan B
3.178% (1 Month LIBOR + 3.00%), due 8/8/24 | | | 1,945,000 | | | | 1,799,125 | |
Zep, Inc.
2017 1st Lien Term Loan
5.072% (3 Month LIBOR + 4.00%), due 8/12/24 (e) | | | 104,364 | | | | 86,659 | |
| | | | | | | | |
| | | | | | | 17,064,382 | |
| | | | | | | | |
Containers, Packaging & Glass 3.6% | |
Altium Packaging LLC
Term Loan B
3.178% (1 Month LIBOR + 3.00%), due 6/14/26 (e) | | | 990,025 | | | | 949,186 | |
Anchor Glass Container Corp.
2017 1st Lien Term Loan
4.121%-4.137% (1 Month LIBOR + 2.75%, 3 Month LIBOR + 2.75%), due 12/7/23 | | | 2,116,037 | | | | 1,585,265 | |
Berry Global, Inc.
Term Loan Y
2.177% (1 Month LIBOR + 2.00%), due 7/1/26 | | | 3,212,538 | | | | 3,067,973 | |
BWAY Holding Co.
2017 Term Loan B
4.561% (3 Month LIBOR + 3.25%), due 4/3/24 | | | 2,887,673 | | | | 2,580,136 | |
Charter NEX U.S., Inc.
Incremental Term Loan
3.428% (1 Month LIBOR + 3.25%), due 5/16/24 | | | 856,077 | | | | 815,414 | |
Clearwater Paper Corp.
Term Loan B
4.25% (3 Month LIBOR + 3.25%), due 7/26/26 | | | 1,993,750 | | | | 1,973,812 | |
Consolidated Container Co. LLC
2017 1st Lien Term Loan
3.75% (1 Month LIBOR + 2.75%), due 5/22/24 | | | 1,945,125 | | | | 1,862,457 | |
| | | | |
| 14 | | MainStay VP Floating Rate Portfolio | | The notes to the financial statements are an integral part of,
and should be read in conjunction with, the financial statements. |
| | | | | | | | |
| | | Principal
Amount | | | Value | |
| Floating Rate Loans (continued) | |
Containers, Packaging & Glass (continued) | |
Fort Dearborn Co.
2016 1st Lien Term Loan
5.192% (3 Month LIBOR + 4.00%), due 10/19/23 | | $ | 1,420,213 | | | $ | 1,327,900 | |
2016 2nd Lien Term Loan
9.516% (6 Month LIBOR + 8.50%), due 10/21/24 (e) | | | 1,000,000 | | | | 890,000 | |
Klockner-Pentaplast of America, Inc.
2017 Term Loan B2
5.25% (3 Month LIBOR + 4.25%), due 6/30/22 | | | 2,431,250 | | | | 2,247,387 | |
Reynolds Consumer Products LLC
Term Loan
1.928% (1 Month LIBOR + 1.75%), due 2/4/27 | | | 1,496,250 | | | | 1,435,776 | |
Reynolds Group Holdings, Inc.
2017 Term Loan
2.928% (1 Month LIBOR + 2.75%), due 2/5/23 | | | 2,040,240 | | | | 1,942,309 | |
Tank Holding Corp.
2020 Term Loan
3.678% (1 Month LIBOR + 3.50%), due 3/26/26 | | | 2,235,612 | | | | 2,080,982 | |
Trident TPI Holdings, Inc.
2017 Term Loan B1
4.072% (3 Month LIBOR + 3.00%), due 10/17/24 | | | 728,000 | | | | 692,510 | |
| | | | | | | | |
| | | | | | | 23,451,107 | |
| | | | | | | | |
Diversified/Conglomerate Manufacturing 3.3% | |
Allied Universal Holdco LLC
2019 Term Loan B
4.428% (1 Month LIBOR + 4.25%), due 7/10/26 | | | 995,000 | | | | 961,834 | |
EWT Holdings III Corp.
2020 Term Loan
2.928% (1 Month LIBOR + 2.75%), due 12/20/24 | | | 1,977,631 | | | | 1,913,358 | |
Filtration Group Corp.
2018 1st Lien Term Loan
3.178% (1 Month LIBOR + 3.00%), due 3/29/25 | | | 1,786,565 | | | | 1,712,869 | |
Gardner Denver, Inc.
2020 USD Term Loan
1.928% (1 Month LIBOR + 1.75%), due 3/1/27 | | | 2,008,713 | | | | 1,903,255 | |
GYP Holdings III Corp.
2018 Term Loan B
2.928% (1 Month LIBOR + 2.75%), due 6/1/25 | | | 1,410,519 | | | | 1,358,506 | |
| | | | | | | | |
| | | Principal
Amount | | | Value | |
Diversified/Conglomerate Manufacturing (continued) | |
Hyster-Yale Group, Inc.
Term Loan B
3.428% (1 Month LIBOR + 3.25%), due 5/30/23 (e)(f) | | $ | 1,369,444 | | | $ | 1,266,736 | |
Ingersoll-Rand Services Co.
2020 USD Spinco Term Loan
1.928% (1 Month LIBOR + 1.75%), due 3/1/27 | | | 870,887 | | | | 823,260 | |
Iron Mountain, Inc.
2018 Term Loan B
1.928% (1 Month LIBOR + 1.75%), due 1/2/26 | | | 1,832,813 | | | | 1,741,172 | |
LTI Holdings, Inc.
2018 Add On 1st Lien Term Loan
3.678% (1 Month LIBOR + 3.50%), due 9/6/25 | | | 1,079,469 | | | | 908,553 | |
Pre-Paid Legal Services, Inc.
2018 1st Lien Term Loan
3.428% (1 Month LIBOR + 3.25%), due 5/1/25 | | | 2,962,838 | | | | 2,810,993 | |
Quikrete Holdings, Inc.
2016 1st Lien Term Loan
2.678% (1 Month LIBOR + 2.50%), due 2/1/27 | | | 2,325,109 | | | | 2,238,886 | |
Red Ventures LLC
2020 Term Loan B
2.678% (1 Month LIBOR + 2.50%), due 11/8/24 | | | 3,023,545 | | | | 2,849,691 | |
TRC Cos., Inc.
Term Loan
4.50% (1 Month LIBOR + 3.50%), due 6/21/24 (e) | | | 875,250 | | | | 770,220 | |
| | | | | | | | |
| | | | | | | 21,259,333 | |
| | | | | | | | |
Diversified/Conglomerate Service 4.3% | |
Applied Systems, Inc.
2017 1st Lien Term Loan
4.25% (3 Month LIBOR + 3.25%), due 9/19/24 | | | 1,925,696 | | | | 1,876,109 | |
2017 2nd Lien Term Loan
8.00% (3 Month LIBOR + 7.00%), due 9/19/25 | | | 460,000 | | | | 457,700 | |
BidFair MergerRight, Inc.
Term Loan B
6.50% (1 Month LIBOR + 5.50%), due 1/15/27 | | | 2,321,422 | | | | 2,162,792 | |
Blackhawk Network Holdings, Inc.
2018 1st Lien Term Loan
3.178% (1 Month LIBOR + 3.00%), due 6/15/25 | | | 980,000 | | | | 898,334 | |
| | | | | | |
The notes to the financial statements are an integral part of,
and should be read in conjunction with, the financial statements. | | | | | 15 | |
Portfolio of Investments June 30, 2020 (Unaudited) (continued)
| | | | | | | | |
| | | Principal
Amount | | | Value | |
| Floating Rate Loans (continued) | |
Diversified/Conglomerate Service (continued) | |
BrightView Landscapes LLC
2018 1st Lien Term Loan B
2.722%-2.75% (1 Month LIBOR + 2.50%), due 8/15/25 | | $ | 1,103,148 | | | $ | 1,070,054 | |
CCC Information Services, Inc.
2017 1st Lien Term Loan
4.00% (1 Month LIBOR + 3.00%), due 4/29/24 | | | 945,128 | | | | 908,268 | |
Change Healthcare Holdings LLC
2017 Term Loan B
3.50% (1 Month LIBOR + 2.50%, 3 Month LIBOR + 2.50%), due 3/1/24 | | | 1,600,105 | | | | 1,533,101 | |
Element Materials Technology Group U.S. Holdings, Inc.
2017 Term Loan B
4.50% (3 Month LIBOR + 3.50%), due 6/28/24 (e) | | | 977,455 | | | | 905,673 | |
Greeneden U.S. Holdings II LLC
2018 Term Loan B
3.428% (1 Month LIBOR + 3.25%), due 12/1/23 | | | 1,436,885 | | | | 1,380,308 | |
IRI Holdings, Inc.
2018 1st Lien Term Loan
4.613% (3 Month LIBOR + 4.25%), due 12/1/25 | | | 2,203,782 | | | | 2,078,900 | |
Mitchell International, Inc.
2017 1st Lien Term Loan
3.428% (1 Month LIBOR + 3.25%), due 11/29/24 | | | 968,795 | | | | 902,594 | |
MKS Instruments, Inc.
2019 Term Loan B6
1.928% (1 Month LIBOR + 1.75%), due 2/2/26 | | | 700,409 | | | | 667,723 | |
Monitronics International, Inc.
Takeback Term Loan
7.75% (1 Month LIBOR + 6.50%), due 3/29/24 (e) | | | 956,132 | | | | 717,099 | |
MX Holdings U.S., Inc.
Term Loan B1C
3.50% (1 Month LIBOR + 2.75%), due 7/31/25 | | | 2,206,515 | | | | 2,134,804 | |
Prime Security Services Borrower LLC
2019 Term Loan B1
4.25% (1 Month LIBOR + 3.25%, 6 Month LIBOR + 3.250%, 12 Month LIBOR + 3.250%), due 9/23/26 | | | 3,525,821 | | | | 3,381,851 | |
Sophia L.P.
2017 Term Loan B
4.25% (3 Month LIBOR + 3.25%), due 9/30/22 | | | 1,002,888 | | | | 975,308 | |
| | | | | | | | |
| | | Principal
Amount | | | Value | |
Diversified/Conglomerate Service (continued) | |
TruGreen, Ltd. Partnership
2019 Term Loan
3.928% (1 Month LIBOR + 3.75%), due 3/19/26 | | $ | 1,737,728 | | | $ | 1,685,597 | |
Verint Systems, Inc.
2018 Term Loan B
2.173% (1 Month LIBOR + 2.00%), due 6/28/24 | | | 2,425,000 | | | | 2,346,188 | |
Verscend Holding Corp.
2018 Term Loan B
4.678% (1 Month LIBOR + 4.50%), due 8/27/25 | | | 982,495 | | | | 951,792 | |
WEX, Inc.
Term Loan B3
2.428% (1 Month LIBOR + 2.25%), due 5/15/26 | | | 960,344 | | | | 913,927 | |
| | | | | | | | |
| | | | | | | 27,948,122 | |
| | | | | | | | |
Ecological 0.3% | |
Advanced Disposal Services, Inc.
Term Loan B3
3.00% (1 Week LIBOR + 2.25%), due 11/10/23 | | | 2,014,611 | | | | 1,988,924 | |
| | | | | | | | |
|
Electronics 13.0% | |
ASG Technologies Group, Inc.
2018 Term Loan
4.50% (1 Month LIBOR + 3.50%), due 7/31/24 (e) | | | 1,422,601 | | | | 1,280,341 | |
Banff Merger Sub, Inc.
2018 Term Loan B
4.428% (1 Month LIBOR + 4.25%), due 10/2/25 | | | 2,413,618 | | | | 2,277,420 | |
Barracuda Networks, Inc.
1st Lien Term Loan
4.25% (3 Month LIBOR + 3.25%), due 2/12/25 | | | 1,963,703 | | | | 1,907,737 | |
Camelot U.S. Acquisition 1 Co.
Term Loan B
3.178% (1 Month LIBOR + 3.00%), due 10/30/26 | | | 1,882,645 | | | | 1,819,106 | |
Castle U.S. Holding Corp.
Term Loan B
4.058% (3 Month LIBOR + 3.75%), due 1/29/27 | | | 1,441,035 | | | | 1,318,547 | |
Cologix, Inc.
2017 1st Lien Term Loan
4.00% (1 Month LIBOR + 3.00%), due 3/20/24 | | | 1,925,227 | | | | 1,833,779 | |
| | | | |
| 16 | | MainStay VP Floating Rate Portfolio | | The notes to the financial statements are an integral part of,
and should be read in conjunction with, the financial statements. |
| | | | | | | | |
| | | Principal
Amount | | | Value | |
| Floating Rate Loans (continued) | |
Electronics (continued) | |
Colorado Buyer, Inc. (e) | |
Term Loan B
4.00% (1 Month LIBOR + 3.00%), due 5/1/24 | | $ | 970,000 | | | $ | 725,421 | |
2nd Lien Term Loan
8.25% (6 Month LIBOR + 7.25%), due 5/1/25 | | | 800,000 | | | | 275,200 | |
CommScope, Inc.
2019 Term Loan B
3.428% (1 Month LIBOR + 3.25%), due 4/6/26 | | | 4,278,913 | | | | 4,040,898 | |
DCert Buyer, Inc.
2019 Term Loan B
4.178% (1 Month LIBOR + 4.00%), due 10/16/26 | | | 1,995,000 | | | | 1,924,343 | |
Dell International LLC
2019 Term Loan B
2.75% (1 Month LIBOR + 2.00%), due 9/19/25 | | | 3,221,002 | | | | 3,133,156 | |
Diebold, Inc.
2017 Term Loan B
2.938% (1 Month LIBOR + 2.75%), due 11/6/23 | | | 645,313 | | | | 608,208 | |
ECI Macola Max Holdings LLC
1st Lien Term Loan
5.25% (3 Month LIBOR + 4.25%), due 9/27/24 | | | 2,197,358 | | | | 2,140,593 | |
EIG Investors Corp.
2018 1st Lien Term Loan
4.75% (3 Month LIBOR + 3.75%), due 2/9/23 | | | 2,757,792 | | | | 2,654,375 | |
Epicor Software Corp.
1st Lien Term Loan
3.43% (1 Month LIBOR + 3.25%), due 6/1/22 | | | 3,102,201 | | | | 3,027,968 | |
Finastra U.S.A., Inc.
1st Lien Term Loan
4.50% (3 Month LIBOR + 3.50%, 6 Month LIBOR + 3.50%), due 6/13/24 | | | 2,702,241 | | | | 2,357,705 | |
2nd Lien Term Loan
8.25% (6 Month LIBOR + 7.25%), due 6/13/25 | | | 1,400,000 | | | | 1,208,000 | |
Flexential Intermediate Corp.
2017 1st Lien Term Loan
3.808% (3 Month LIBOR + 3.50%), due 8/1/24 | | | 1,167,000 | | | | 931,655 | |
Flexera Software LLC
2018 1st Lien Term Loan
4.50% (3 Month LIBOR + 3.50%), due 2/26/25 | | | 1,422,237 | | | | 1,382,414 | |
| | | | | | | | |
| | | Principal
Amount | | | Value | |
Electronics (continued) | |
Go Daddy Operating Co. LLC
2017 Repriced Term Loan
1.928% (1 Month LIBOR + 1.75%), due 2/15/24 | | $ | 2,216,156 | | | $ | 2,127,510 | |
Hyland Software, Inc.
2018 1st Lien Term Loan
4.00% (1 Month LIBOR + 3.25%), due 7/1/24 | | | 3,609,658 | | | | 3,492,344 | |
2017 2nd Lien Term Loan
7.75% (1 Month LIBOR + 7.00%), due 7/7/25 | | | 608,333 | | | | 596,167 | |
Informatica LLC
2020 USD Term Loan B
3.428% (1 Month LIBOR + 3.25%), due 2/25/27 | | | 997,500 | | | | 950,119 | |
Kronos, Inc.
2017 Term Loan B
3.179% (1 Month LIBOR + 3.00%), due 11/1/23 | | | 1,529,173 | | | | 1,525,350 | |
MA FinanceCo. LLC
Term Loan B3
2.678% (1 Month LIBOR + 2.50%), due 6/21/24 | | | 352,345 | | | | 327,240 | |
McAfee LLC
2018 Term Loan B
3.934% (1 Month LIBOR + 3.75%), due 9/30/24 | | | 4,586,614 | | | | 4,444,429 | |
2017 2nd Lien Term Loan
9.50% (1 Month LIBOR + 8.50%), due 9/29/25 | | | 312,500 | | | | 307,813 | |
MH Sub I LLC
2017 1st Lien Term Loan
4.572% (3 Month LIBOR + 3.50%), due 9/13/24 | | | 3,055,866 | | | | 2,909,438 | |
Project Alpha Intermediate Holding, Inc.
2017 Term Loan B
5.38% (3 Month LIBOR + 3.50%), due 4/26/24 | | | 1,442,564 | | | | 1,382,457 | |
2019 Incremental Term Loan B
6.13% (3 Month LIBOR + 4.25%), due 4/26/24 | | | 594,000 | | | | 570,240 | |
Project Leopard Holdings, Inc.
2019 Term Loan
5.25% (3 Month LIBOR + 4.25%), due 7/7/23 (e) | | | 988,722 | | | | 960,708 | |
2018 Term Loan
5.50% (3 Month LIBOR + 4.50%), due 7/7/23 | | | 1,094,562 | | | | 1,061,725 | |
Refinitiv U.S. Holdings, Inc.
2018 Term Loan
3.428% (1 Month LIBOR + 3.25%), due 10/1/25 | | | 948,867 | | | | 927,280 | |
| | | | | | |
The notes to the financial statements are an integral part of,
and should be read in conjunction with, the financial statements. | | | | | 17 | |
Portfolio of Investments June 30, 2020 (Unaudited) (continued)
| | | | | | | | |
| | | Principal
Amount | | | Value | |
| Floating Rate Loans (continued) | |
Electronics (continued) | |
Rocket Software, Inc.
2018 Term Loan
4.428% (1 Month LIBOR + 4.25%), due 11/28/25 | | $ | 888,750 | | | $ | 848,312 | |
RP Crown Parent LLC
2016 Term Loan B
3.75% (1 Month LIBOR + 2.75%), due 10/12/23 | | | 1,817,292 | | | | 1,763,909 | |
Seattle Spinco, Inc.
Term Loan B3
2.678% (1 Month LIBOR + 2.50%), due 6/21/24 | | | 2,379,469 | | | | 2,209,932 | |
Solera LLC
Term Loan B
2.928% (1 Month LIBOR + 2.75%), due 3/3/23 | | | 1,911,791 | | | | 1,833,408 | |
SS&C Technologies, Inc.
2018 Term Loan B3
1.928% (1 Month LIBOR + 1.75%), due 4/16/25 | |
| 2,432,601
|
| |
| 2,317,052
|
|
2018 Term Loan B5
1.928% (1 Month LIBOR + 1.75%), due 4/16/25 | | | 1,964,630 | | | | 1,869,346 | |
STG-Fairway Holdings LLC
Term Loan B
4.572% (3 Month LIBOR + 3.50%), due 1/31/27 (e) | | | 500,000 | | | | 463,438 | |
Surf Holdings LLC
Term Loan
3.827% (3 Month LIBOR + 3.50%), due 3/5/27 | | | 1,750,000 | | | | 1,674,167 | |
Tempo Acquisition LLC
Term Loan
2.928% (1 Month LIBOR + 2.75%), due 5/1/24 | | | 3,384,848 | | | | 3,211,375 | |
Tibco Software, Inc.
2020 Term Loan B
3.93% (1 Month LIBOR + 3.75%), due 6/30/26 | | | 1,000,000 | | | | 953,125 | |
2020 2nd Lien Term Loan
7.43% (1 Month LIBOR + 7.25%), due 3/3/28 | | | 400,000 | | | | 382,500 | |
Ultimate Software Group, Inc.
2020 Incremental Term Loan B
TBD, due 5/4/26 | | | 720,000 | | | | 710,614 | |
Term Loan B
3.928% (1 Month LIBOR + 3.75%), due 5/4/26 | | | 1,736,875 | | | | 1,677,635 | |
| | | | | | | | |
| | | Principal
Amount | | | Value | |
Electronics (continued) | |
Vertafore, Inc.
2018 1st Lien Term Loan
3.428% (1 Month LIBOR + 3.25%), due 7/2/25 | | $ | 394,000 | | | $ | 370,079 | |
Vertiv Group Corp.
Term Loan B
3.183% (1 Month LIBOR + 3.00%), due 3/2/27 | | | 1,995,000 | | | | 1,873,638 | |
VS Buyer LLC
Term Loan B
3.428% (1 Month LIBOR + 3.25%), due 2/28/27 | | | 997,500 | | | | 962,588 | |
Web.com Group, Inc.
2018 Term Loan B
3.94% (1 Month LIBOR + 3.75%), due 10/10/25 | | | 1,453,881 | | | | 1,372,464 | |
2018 2nd Lien Term Loan
7.94% (1 Month LIBOR + 7.75%), due 10/9/26 | | | 969,724 | | | | 816,185 | |
Western Digital Corp.
2018 Term Loan B4
1.924% (3 Month LIBOR + 1.75%), due 4/29/23 | | | 1,241,810 | | | | 1,206,108 | |
Xerox Business Services LLC
Term Loan B
2.678% (1 Month LIBOR + 2.50%), due 12/7/23 | | | 1,449,851 | | | | 1,297,616 | |
| | | | | | | | |
| | | | | | | 84,243,177 | |
| | | | | | | | |
Finance 1.3% | |
Amentum Government Services Holdings LLC
Term Loan B
4.178% (1 Month LIBOR + 4.00%), due 2/1/27 | | | 625,000 | | | | 614,062 | |
Brand Energy & Infrastructure Services, Inc.
2017 Term Loan
5.452%-5.637% (3 Month LIBOR + 4.25%), due 6/21/24 | | | 2,674,448 | | | | 2,440,434 | |
Deerfield Dakota Holding LLC
2020 USD Term Loan B
TBD, due 4/9/27 | | | 1,000,000 | | | | 968,750 | |
IStar, Inc.
2016 Term Loan B
2.924%-2.944% (1 Month LIBOR + 2.75%), due 6/28/23 | | | 630,585 | | | | 605,362 | |
ON Semiconductor Corp.
2019 Term Loan B
2.178% (1 Month LIBOR + 2.00%), due 9/19/26 | | | 491,275 | | | | 469,782 | |
| | | | |
| 18 | | MainStay VP Floating Rate Portfolio | | The notes to the financial statements are an integral part of,
and should be read in conjunction with, the financial statements. |
| | | | | | | | |
| | | Principal
Amount | | | Value | |
| Floating Rate Loans (continued) | |
Finance (continued) | |
Transplace Holdings, Inc.
1st Lien Term Loan
4.822% (3 Month LIBOR + 3.75%), due 10/7/24 (e) | | $ | 1,170,242 | | | $ | 1,094,176 | |
USS Ultimate Holdings, Inc.
1st Lien Term Loan
4.75% (3 Month LIBOR + 3.75%), due 8/25/24 | | | 2,050,911 | | | | 1,897,093 | |
| | | | | | | | |
| | | | | | | 8,089,659 | |
| | | | | | | | |
Healthcare, Education & Childcare 7.4% | |
Acadia Healthcare Co., Inc
2018 Term Loan B4
2.678% (1 Month LIBOR + 2.50%), due 2/16/23 | | | 721,554 | | | | 703,967 | |
Agiliti Health, Inc.
Term Loan
3.188% (1 Month LIBOR + 3.00%), due 1/4/26 | | | 888,750 | | | | 855,422 | |
AHP Health Partners, Inc.
2018 Term Loan
5.50% (1 Month LIBOR + 4.50%), due 6/30/25 | | | 1,288,746 | | | | 1,237,196 | |
Akorn, Inc.
Term Loan B
0.75%-14.75% (1 Month LIBOR + 13.75%, PIK), due 4/16/21 (b)(e)(g) | | | 174,822 | | | | 165,207 | |
Alliance Healthcare Services, Inc.
2017 Term Loan B
5.50% (1 Month LIBOR + 4.50%), due 10/24/23 (e) | | | 832,500 | | | | 531,759 | |
Alvogen Pharma U.S., Inc.
2020 Extended Term Loan
6.32% (6 Month LIBOR + 5.25%), due 12/31/23 | | | 1,283,715 | | | | 1,190,645 | |
Amneal Pharmaceuticals LLC
2018 Term Loan B
3.688% (1 Month LIBOR + 3.50%), due 5/4/25 | | | 2,204,480 | | | | 2,008,832 | |
Athenahealth, Inc.
2019 Term Loan B
4.818% (3 Month LIBOR + 4.50%), due 2/11/26 | | | 740,006 | | | | 712,872 | |
Avantor Funding, Inc.
Term Loan B3
3.25% (1 Month LIBOR + 2.25%), due 11/21/24 | | | 741,758 | | | | 721,360 | |
Carestream Dental Equipment, Inc.
2017 1st Lien Term Loan
4.322% (3 Month LIBOR + 3.25%), due 9/1/24 | | | 972,500 | | | | 880,113 | |
| | | | | | | | |
| | | Principal
Amount | | | Value | |
Healthcare, Education & Childcare (continued) | |
Carestream Health, Inc.
2020 Extended 2nd Lien PIK Term Loan
5.50% (3 Month LIBOR + 4.50%, PIK), due 8/8/23 (g) | | $ | 1,395,690 | | | $ | 1,088,639 | |
2020 Extended Term Loan
7.822% (3 Month LIBOR + 6.75%), due 5/8/23 | | | 1,971,631 | | | | 1,873,050 | |
Compassus Intermediate, Inc.
Term Loan B
6.072% (3 Month LIBOR + 5.00%), due 12/31/26 (e) | | | 1,554,688 | | | | 1,476,953 | |
Da Vinci Purchaser Corp.
2019 Term Loan
5.238% (6 Month LIBOR + 4.00%), due 1/8/27 | | | 1,916,667 | | | | 1,860,763 | |
DaVita, Inc.
2020 Term Loan B
1.928% (1 Month LIBOR + 1.75%), due 8/12/26 | | | 2,729,409 | | | | 2,640,021 | |
Emerald TopCo, Inc.
Term Loan
4.26% (3 Month LIBOR + 3.50%), due 7/24/26 | | | 2,481,250 | | | | 2,388,203 | |
Envision Healthcare Corp.
2018 1st Lien Term Loan
3.928% (1 Month LIBOR + 3.75%), due 10/10/25 | | | 1,846,875 | | | | 1,218,938 | |
eResearchTechnology, Inc.
2020 1st Lien Term Loan
5.50% (1 Month LIBOR + 4.50%), due 2/4/27 | | | 1,200,000 | | | | 1,176,000 | |
ExamWorks Group, Inc.
2017 Term Loan
4.322% (3 Month LIBOR + 3.25%), due 7/27/23 | | | 2,906,734 | | | | 2,834,066 | |
Gentiva Health Services, Inc.
2020 Term Loan
3.438% (1 Month LIBOR + 3.25%), due 7/2/25 | | | 1,283,661 | | | | 1,240,337 | |
Grifols Worldwide Operations U.S.A., Inc.
2019 Term Loan B
2.109% (1 Week LIBOR + 2.00%), due 11/15/27 | | | 995,000 | | | | 956,029 | |
HCA, Inc.
Term Loan B12
1.928% (1 Month LIBOR + 1.75%), due 3/13/25 | | | 2,468,718 | | | | 2,414,407 | |
Jaguar Holding Co. II
2018 Term Loan
3.50% (1 Month LIBOR + 2.50%), due 8/18/22 | | | 2,637,980 | | | | 2,589,459 | |
| | | | | | |
The notes to the financial statements are an integral part of,
and should be read in conjunction with, the financial statements. | | | | | 19 | |
Portfolio of Investments June 30, 2020 (Unaudited) (continued)
| | | | | | | | |
| | | Principal
Amount | | | Value | |
| Floating Rate Loans (continued) | |
Healthcare, Education & Childcare (continued) | |
Ortho-Clinical Diagnostics S.A.
2018 Term Loan B
3.429% (1 Month LIBOR + 3.25%), due 6/30/25 | | $ | 1,902,576 | | | $ | 1,770,584 | |
RegionalCare Hospital Partners Holdings, Inc.
2018 Term Loan B
3.928% (1 Month LIBOR + 3.75%), due 11/17/25 | | | 1,901,968 | | | | 1,772,396 | |
RPI 2019 Intermediate Finance Trust
2020 Term Loan B1
1.928% (1 Month LIBOR + 1.75%), due 2/11/27 | | | 3,184,000 | | | | 3,105,728 | |
Select Medical Corp.
2017 Term Loan B
2.68% (1 Month LIBOR + 2.50%), due 3/6/25 | | | 3,048,392 | | | | 2,888,351 | |
Sound Inpatient Physicians
2018 1st Lien Term Loan
2.928% (1 Month LIBOR + 2.75%), due 6/27/25 (e) | | | 490,000 | | | | 468,358 | |
Team Health Holdings, Inc.
1st Lien Term Loan
3.75% (1 Month LIBOR + 2.75%), due 2/6/24 | | | 2,872,919 | | | | 2,199,220 | |
U.S. Anesthesia Partners, Inc.
2017 Term Loan
4.00% (6 Month LIBOR + 3.00%), due 6/23/24 | | | 2,817,356 | | | | 2,486,317 | |
| | | | | | | | |
| | | | | | | 47,455,192 | |
| | | | | | | | |
Home and Office Furnishings, Housewares & Durable Consumer Products 0.1% | |
Serta Simmons Bedding LLC
1st Lien Term Loan
4.61%-4.635% (3 Month LIBOR + 3.50%), due 11/8/23 | | | 3,423,010 | | | | 772,621 | |
| | | | | | | | |
|
Hotels, Motels, Inns & Gaming 5.1% | |
Affinity Gaming LLC
Initial Term Loan
4.25% (2 Month LIBOR + 3.25%), due 7/1/23 | | | 2,463,045 | | | | 2,081,273 | |
Aimbridge Acquisition Co., Inc.
2019 Term Loan B
3.928% (1 Month LIBOR + 3.75%), due 2/2/26 | | | 2,233,125 | | | | 1,942,819 | |
AP Gaming I LLC
2018 Incremental Term Loan
4.50% (3 Month LIBOR + 3.50%), due 2/15/24 | | | 1,844,143 | | | | 1,572,132 | |
| | | | | | | | |
| | | Principal
Amount | | | Value | |
Hotels, Motels, Inns & Gaming (continued) | |
Caesars Entertainment Operating Co.
Exit Term Loan
2.178% (1 Month LIBOR + 2.00%), due 10/7/24 | | $ | 1,351,389 | | | $ | 1,344,970 | |
Caesars Resort Collection LLC
2020 Term Loan
TBD, due 6/19/25 | | | 1,050,000 | | | | 984,375 | |
2017 1st Lien Term Loan B
2.928% (1 Month LIBOR + 2.75%), due 12/23/24 | | | 1,910,204 | | | | 1,700,613 | |
Churchill Downs, Inc.
2017 Term Loan B
2.18% (1 Month LIBOR + 2.00%), due 12/27/24 | | | 1,957,368 | | | | 1,879,562 | |
CityCenter Holdings LLC
2017 Term Loan B
3.00% (1 Month LIBOR + 2.25%), due 4/18/24 | | | 2,813,000 | | | | 2,550,454 | |
Everi Payments, Inc.
Term Loan B
3.822% (3 Month LIBOR + 2.75%), due 5/9/24 | | | 2,955,113 | | | | 2,774,112 | |
Golden Entertainment, Inc.
2017 1st Lien Term Loan
3.75% (1 Month LIBOR + 3.00%), due 10/21/24 | | | 1,600,000 | | | | 1,444,000 | |
Hilton Worldwide Finance LLC
2019 Term Loan B2
1.935% (1 Month LIBOR + 1.75%), due 6/22/26 | | | 235,804 | | | | 219,200 | |
PCI Gaming Authority
Term Loan
2.678% (1 Month LIBOR + 2.50%), due 5/29/26 | | | 658,702 | | | | 629,766 | |
Penn National Gaming, Inc.
2018 1st Lien Term Loan B
3.00% (3 Month LIBOR + 2.25%), due 10/15/25 | | | 328,333 | | | | 304,529 | |
Scientific Games International, Inc.
2018 Term Loan B5
3.476%-3.612% (1 Month LIBOR + 2.75%, 3 Month LIBOR + 2.750%, 6 Month LIBOR + 2.750%), due 8/14/24 | | | 4,321,316 | | | | 3,798,437 | |
Station Casinos LLC
2020 Term Loan B
2.50% (1 Month LIBOR + 2.25%), due 2/8/27 | | | 1,649,901 | | | | 1,506,223 | |
UFC Holdings LLC
2019 Term Loan
4.25% (6 Month LIBOR + 3.25%), due 4/29/26 | | | 4,530,496 | | | | 4,300,197 | |
| | | | |
| 20 | | MainStay VP Floating Rate Portfolio | | The notes to the financial statements are an integral part of,
and should be read in conjunction with, the financial statements. |
| | | | | | | | |
| | | Principal
Amount | | | Value | |
| Floating Rate Loans (continued) | |
Hotels, Motels, Inns & Gaming (continued) | |
Wyndham Destinations, Inc.
2018 1st Lien Term Loan
2.428% (1 Month LIBOR + 2.25%), due 5/30/25 | | $ | 1,972,424 | | | $ | 1,819,562 | |
Wyndham Hotels & Resorts, Inc.
Term Loan B
1.928% (1 Month LIBOR + 1.75%), due 5/30/25 | | | 2,463,674 | | | | 2,322,013 | |
| | | | | | | | |
| | | | | | | 33,174,237 | |
| | | | | | | | |
Insurance 3.3% | |
Acrisure LLC
2020 Term Loan B
3.678% (1 Month LIBOR + 3.50%), due 2/15/27 | | | 989,905 | | | | 931,748 | |
AmWINS Group, Inc.
2017 Term Loan B
3.75% (1 Month LIBOR + 2.75%), due 1/25/24 | | | 1,912,483 | | | | 1,855,108 | |
AssuredPartners, Inc.
2020 Term Loan B
3.678% (1 Month LIBOR + 3.50%), due 2/12/27 | | | 3,205,407 | | | | 3,057,157 | |
Asurion LLC
2017 Term Loan B4
3.178% (1 Month LIBOR + 3.00%), due 8/4/22 | | | 2,823,308 | | | | 2,743,902 | |
2018 Term Loan B6
3.178% (1 Month LIBOR + 3.00%), due 11/3/23 | | | 1,631,903 | | | | 1,575,806 | |
2018 Term Loan B7
3.178% (1 Month LIBOR + 3.00%), due 11/3/24 | | | 459,375 | | | | 442,723 | |
2017 2nd Lien Term Loan
6.678% (1 Month LIBOR + 6.50%), due 8/4/25 | | | 966,667 | | | | 958,611 | |
Hub International, Ltd.
2018 Term Loan B
4.02% (3 Month LIBOR + 3.00%), due 4/25/25 | | | 1,426,253 | | | | 1,357,079 | |
NFP Corp.
2020 Term Loan
3.428% (1 Month LIBOR + 3.25%), due 2/15/27 | | | 1,456,225 | | | | 1,354,289 | |
Sedgwick Claims Management Services, Inc.
2018 Term Loan B
3.428% (1 Month LIBOR + 3.25%), due 12/31/25 | | | 1,962,557 | | | | 1,848,891 | |
2019 Term Loan B
4.178% (1 Month LIBOR + 4.00%), due 9/3/26 | | | 990,000 | | | | 948,750 | |
| | | | | | | | |
| | | Principal
Amount | | | Value | |
Insurance (continued) | |
Terrier Media Buyer, Inc.
2020 Term Loan B
TBD, due 12/17/26 (e) | | $ | 1,500,000 | | | $ | 1,425,000 | |
USI, Inc.
2017 Repriced Term Loan
3.308% (3 Month LIBOR + 3.00%), due 5/16/24 | | | 2,917,500 | | | | 2,762,873 | |
| | | | | | | | |
| | | | | | | 21,261,937 | |
| | | | | | | | |
Leisure, Amusement, Motion Pictures & Entertainment 2.9% | |
Alterra Mountain Co.
Term Loan B1
2.928% (1 Month LIBOR + 2.75%), due 7/31/24 | | | 3,442,008 | | | | 3,229,034 | |
Boyd Gaming Corp.
Term Loan B3
2.359% (1 Week LIBOR + 2.25%), due 9/15/23 | | | 1,413,586 | | | | 1,329,780 | |
Cineworld, Ltd.
Incremental Term Loan
TBD, due 2/5/27 (e)(f)(h) | | | 3,000,000 | | | | 2,850,000 | |
Creative Artists Agency LLC
2019 Term Loan B
3.928% (1 Month LIBOR + 3.75%), due 11/27/26 | | | 1,492,500 | | | | 1,411,345 | |
Fitness International LLC
2018 Term Loan A
4.322% (6 Month LIBOR + 3.25%), due 1/8/25 | | | 1,243,125 | | | | 792,492 | |
2018 Term Loan B
4.322% (6 Month LIBOR + 3.25%), due 4/18/25 | | | 270,764 | | | | 167,705 | |
Life Time Fitness, Inc.
2017 Term Loan B
3.75% (3 Month LIBOR + 2.75%), due 6/10/22 | | | 1,775,585 | | | | 1,562,515 | |
Lions Gate Capital Holdings LLC
2018 Term Loan B
2.428% (1 Month LIBOR + 2.25%), due 3/24/25 | | | 1,039,484 | | | | 982,312 | |
Marriott Ownership Resorts, Inc.
2019 Term Loan B
1.928% (1 Month LIBOR + 1.75%), due 8/29/25 | | | 1,488,750 | | | | 1,391,981 | |
TKC Holdings, Inc.
2017 1st Lien Term Loan
4.75% (3 Month LIBOR + 3.75%), due 2/1/23 | | | 2,016,502 | | | | 1,883,917 | |
Travel Leaders Group LLC
2018 Term Loan B
4.184% (1 Month LIBOR + 4.00%), due 1/25/24 | | | 1,666,000 | | | | 1,124,550 | |
| | | | | | |
The notes to the financial statements are an integral part of,
and should be read in conjunction with, the financial statements. | | | | | 21 | |
Portfolio of Investments June 30, 2020 (Unaudited) (continued)
| | | | | | | | |
| | | Principal
Amount | | | Value | |
| Floating Rate Loans (continued) | |
Leisure, Amusement, Motion Pictures & Entertainment (continued) | |
William Morris Endeavor Entertainment LLC
2018 1st Lien Term Loan
2.93% (1 Month LIBOR + 2.75%), due 5/18/25 | | $ | 2,660,416 | | | $ | 2,154,937 | |
| | | | | | | | |
| | | | | | | 18,880,568 | |
| | | | | | | | |
Machinery (Non-Agriculture, Non-Construct & Non-Electronic) 1.2% | |
Advanced Drainage Systems, Inc.
Term Loan B
2.438% (1 Month LIBOR + 2.25%), due 7/31/26 | | | 692,679 | | | | 670,167 | |
Altra Industrial Motion Corp.
2018 Term Loan B
2.178% (1 Month LIBOR + 2.00%), due 10/1/25 | | | 2,129,346 | | | | 2,022,879 | |
Columbus McKinnon Corp.
2018 Term Loan B
3.50% (3 Month LIBOR + 2.50%), due 1/31/24 | | | 887,235 | | | | 851,746 | |
CPM Holdings, Inc.
2018 1st Lien Term Loan
3.962% (3 Month LIBOR + 3.75%), due 11/17/25 | | | 1,477,500 | | | | 1,331,597 | |
2018 2nd Lien Term Loan
8.462% (3 Month LIBOR + 8.25%), due 11/15/26 (e) | | | 1,000,000 | | | | 837,500 | |
Rexnord LLC
2019 Term Loan B
1.935% (1 Month LIBOR + 1.75%), due 8/21/24 | | | 1,027,720 | | | | 1,009,735 | |
Welbilt, Inc.
2018 Term Loan B
2.678% (1 Month LIBOR + 2.50%), due 10/23/25 | | | 1,284,178 | | | | 1,104,393 | |
| | | | | | | | |
| | | | | | | 7,828,017 | |
| | | | | | | | |
Mining, Steel, Iron & Non-Precious Metals 1.5% | |
American Rock Salt Co. LLC
2018 1st Lien Term Loan
4.50% (1 Month LIBOR + 3.50%), due 3/21/25 | | | 1,615,812 | | | | 1,575,416 | |
Covia Holdings Corp.
Term Loan
5.387% (3 Month LIBOR + 4.00%), due 6/1/25 | | | 1,403,571 | | | | 846,821 | |
Gates Global LLC
2017 Repriced Term Loan B
3.75% (1 Month LIBOR + 2.75%), due 4/1/24 | | | 2,394,358 | | | | 2,300,978 | |
| | | | | | | | |
| | | Principal
Amount | | | Value | |
Mining, Steel, Iron & Non-Precious Metals (continued) | |
GrafTech Finance, Inc.
2018 Term Loan B
4.50% (1 Month LIBOR + 3.50%), due 2/12/25 | | $ | 2,376,407 | | | $ | 2,293,233 | |
MRC Global (U.S)., Inc.
2018 1st Lien Term Loan B
3.178% (1 Month LIBOR + 3.00%), due 9/20/24 | | | 1,462,442 | | | | 1,345,447 | |
U.S. Silica Co.
2018 Term Loan B
5.00% (1 Month LIBOR + 4.00%), due 5/1/25 | | | 1,466,130 | | | | 1,036,066 | |
| | | | | | | | |
| | | | | | | 9,397,961 | |
| | | | | | | | |
Oil & Gas 1.4% | |
Apergy Corp.
2018 1st Lien Term Loan
2.688% (1 Month LIBOR + 2.50%), due 5/9/25 (e) | | | 383,133 | | | | 363,018 | |
Buckeye Partners, L.P.
2019 Term Loan B
2.923% (1 Month LIBOR + 2.75%), due 11/1/26 | | | 1,371,563 | | | | 1,314,643 | |
Fleet U.S. Bidco, Inc.
Term Loan B
4.322% (6 Month LIBOR + 3.25%), due 10/7/26 | | | 1,240,625 | | | | 1,178,594 | |
GIP III Stetson I, L.P.
2018 Term Loan B
4.43% (1 Month LIBOR + 4.25%), due 7/18/25 (e) | | | 1,553,387 | | | | 1,033,434 | |
Keane Group Holdings LLC
2018 1st Lien Term Loan
4.50% (1 Month LIBOR + 3.50%), due 5/25/25 | | | 980,000 | | | | 837,900 | |
Lucid Energy Group II Borrower LLC
2018 1st Lien Term Loan
4.00% (1 Month LIBOR + 3.00%), due 2/17/25 | | | 1,368,500 | | | | 1,098,221 | |
Medallion Midland Acquisition LLC
1st Lien Term Loan
4.25% (1 Month LIBOR + 3.25%), due 10/30/24 | | | 585,000 | | | | 519,919 | |
PES Holdings LLC
2018 Term Loan C
4.75%-6.99% (PIK, PRIME - 0.50%), due 12/31/22 (b)(e)(g) | | | 1,123,050 | | | | 286,378 | |
Prairie ECI Acquiror L.P.
Term Loan B
4.928% (1 Month LIBOR + 4.75%), due 3/11/26 | | | 1,185,525 | | | | 1,069,936 | |
| | | | |
| 22 | | MainStay VP Floating Rate Portfolio | | The notes to the financial statements are an integral part of,
and should be read in conjunction with, the financial statements. |
| | | | | | | | |
| | | Principal
Amount | | | Value | |
| Floating Rate Loans (continued) | |
Oil & Gas (continued) | |
Seadrill Partners Finco LLC
Term Loan B
7.00% (3 Month LIBOR + 6.00%), due 2/21/21 (e) | | $ | 870,249 | | | $ | 143,987 | |
Summit Midstream Partners Holdings LLC
Term Loan B
7.00% (3 Month LIBOR + 6.00%), due 5/13/22 (e) | | | 567,684 | | | | 115,429 | |
Traverse Midstream Partners LLC
2017 Term Loan
5.00% (1 Month LIBOR + 4.00%), due 9/27/24 | | | 1,310,000 | | | | 1,085,116 | |
| | | | | | | | |
| | | | | | | 9,046,575 | |
| | | | | | | | |
Personal & Nondurable Consumer Products (Manufacturing Only) 1.0% | |
American Builders & Contractors Supply Co., Inc.
2019 Term Loan
2.178% (1 Month LIBOR + 2.00%), due 1/15/27 | | | 2,729,375 | | | | 2,595,636 | |
Kronos Acquisition Holdings, Inc.
2015 Term Loan B
5.00% (2 Month LIBOR + 4.00%), due 5/15/23 | | | 1,003,846 | | | | 953,654 | |
Prestige Brands, Inc.
Term Loan B4
2.178% (1 Month LIBOR + 2.00%), due 1/26/24 | | | 466,376 | | | | 458,214 | |
SRAM LLC
2018 Term Loan B
3.75% (1 Month LIBOR + 2.75%, 3 Month LIBOR + 2.75%, 6 Month LIBOR + 2.75%), due 3/15/24 | | | 805,185 | | | | 783,043 | |
Varsity Brands, Inc.
2017 Term Loan B
4.50% (1 Month LIBOR + 3.50%), due 12/15/24 | | | 1,950,039 | | | | 1,651,034 | |
| | | | | | | | |
| | | | | | | 6,441,581 | |
| | | | | | | | |
Personal Transportation 0.1% | |
Uber Technologies, Inc.
2018 Incremental Term Loan
3.678% (1 Month LIBOR + 3.50%), due 7/13/23 | | | 581,365 | | | | 551,570 | |
| | | | | | | | |
|
Personal, Food & Miscellaneous Services 1.5% | |
Aramark Services, Inc.
2018 Term Loan B3
1.928% (1 Month LIBOR + 1.75%), due 3/11/25 | | | 2,182,663 | | | | 2,054,977 | |
| | | | | | | | |
| | | Principal
Amount | | | Value | |
Personal, Food & Miscellaneous Services (continued) | |
Golden Nugget, Inc.
2017 Incremental Term Loan B
3.25% (1 Month LIBOR + 2.50%, 2 Month LIBOR + 2.50%), due 10/4/23 | | $ | 2,377,942 | | | $ | 1,945,156 | |
IRB Holding Corp.
2020 Term Loan B
3.75% (1 Month LIBOR + 2.75%), due 2/5/25 | | | 2,448,560 | | | | 2,258,797 | |
KFC Holding Co.
2018 Term Loan B
1.944% (1 Month LIBOR + 1.75%), due 4/3/25 | | | 1,893,748 | | | | 1,812,474 | |
Weight Watchers International, Inc.
2017 Term Loan B
5.50% (1 Month LIBOR + 4.75%), due 11/29/24 | | | 1,435,208 | | | | 1,408,896 | |
| | | | | | | | |
| | | | | | | 9,480,300 | |
| | | | | | | | |
Printing & Publishing 0.6% | |
Getty Images, Inc.
2019 Term Loan B
4.688% (1 Month LIBOR + 4.50%), due 2/19/26 | | | 1,482,127 | | | | 1,313,535 | |
McGraw-Hill Global Education Holdings LLC
2016 Term Loan B
5.00% (3 Month LIBOR + 4.00%), due 5/4/22 | | | 1,120,847 | | | | 948,237 | |
Prometric Holdings, Inc.
1st Lien Term Loan
4.00% (1 Month LIBOR + 3.00%), due 1/29/25 | | | 495,854 | | | | 446,888 | |
Severin Acquisition LLC
2018 Term Loan B
3.425% (1 Month LIBOR + 3.25%), due 8/1/25 | | | 972,532 | | | | 931,199 | |
| | | | | | | | |
| | | | | | | 3,639,859 | |
| | | | | | | | |
Retail Store 2.5% | |
Alphabet Holding Co., Inc.
2017 1st Lien Term Loan
3.678% (1 Month LIBOR + 3.50%), due 9/26/24 | | | 2,042,250 | | | | 1,913,588 | |
Bass Pro Group LLC
Term Loan B
6.072% (1 Month LIBOR + 5.00%), due 9/25/24 | | | 1,920,064 | | | | 1,843,262 | |
Belk, Inc.
2019 Term Loan B
7.75% (6 Month LIBOR + 6.75%), due 7/31/25 | | | 1,351,165 | | | | 473,583 | |
| | | | | | |
The notes to the financial statements are an integral part of,
and should be read in conjunction with, the financial statements. | | | | | 23 | |
Portfolio of Investments June 30, 2020 (Unaudited) (continued)
| | | | | | | | |
| | | Principal
Amount | | | Value | |
| Floating Rate Loans (continued) | |
Retail Store (continued) | |
BJ’s Wholesale Club, Inc.
2017 1st Lien Term Loan
2.435% (1 Month LIBOR + 2.25%), due 2/3/24 | | $ | 2,897,012 | | | $ | 2,802,859 | |
CNT Holdings III Corp.
2017 Term Loan
4.08% (3 Month LIBOR + 3.00%), due 1/22/23 | | | 1,234,931 | | | | 1,198,912 | |
EG America LLC
2018 Term Loan
5.072% (6 Month LIBOR + 4.00%), due 2/7/25 | | | 1,466,265 | | | | 1,376,457 | |
HD Supply, Inc.
Term Loan B5
1.928% (1 Month LIBOR + 1.75%), due 10/17/23 | | | 982,387 | | | | 946,775 | |
Leslie’s Poolmart, Inc.
2016 Term Loan
3.678% (1 Month LIBOR + 3.50%), due 8/16/23 (e) | | | 535,227 | | | | 510,473 | |
Michaels Stores, Inc.
2018 Term Loan B
3.50%-3.568% (1 Month LIBOR + 2.50%, 3 Month LIBOR + 2.50%, 6 Month LIBOR + 2.50%), due 1/30/23 | | | 2,467,989 | | | | 2,252,040 | |
Party City Holdings, Inc.
2018 Term Loan B
4.072%-4.10% (1 Month LIBOR + 2.50%, 6 Month LIBOR + 2.50%), due 8/19/22 | | | 816,491 | | | | 384,771 | |
Petco Animal Supplies, Inc.
2017 Term Loan B
4.25% (3 Month LIBOR + 3.25%), due 1/26/23 | | | 1,451,152 | | | | 1,175,433 | |
Sally Holdings LLC
Term Loan B2
4.50%, due 7/5/24 | | | 1,166,667 | | | | 1,114,167 | |
| | | | | | | | |
| | | | | | | 15,992,320 | |
| | | | | | | | |
Telecommunications 3.2% | |
Avaya, Inc.
2018 Term Loan B
4.435% (1 Month LIBOR + 4.25%), due 12/15/24 | | | 1,345,545 | | | | 1,237,901 | |
CenturyLink, Inc.
2020 Term Loan B
2.428% (1 Month LIBOR + 2.25%), due 3/15/27 | | | 3,731,250 | | | | 3,506,211 | |
| | | | | | | | |
| | | Principal
Amount | | | Value | |
Telecommunications (continued) | |
CSC Holdings LLC
2019 Term Loan B5
2.685% (1 Month LIBOR + 2.50%), due 4/15/27 | | $ | 3,691,373 | | | $ | 3,499,422 | |
Frontier Communications Corp.
2017 Term Loan B1
5.35%-6.00% (1 Month LIBOR + 3.75%, PRIME + 2.75%), due 6/15/24 (b)(e) | | | 1,458,750 | | | | 1,418,635 | |
Level 3 Financing, Inc.
2019 Term Loan B
1.928% (1 Month LIBOR + 1.75%), due 3/1/27 | | | 1,500,000 | | | | 1,413,750 | |
Microchip Technology, Inc.
2018 Term Loan B
2.18% (1 Month LIBOR + 2.00%), due 5/29/25 | | | 1,137,775 | | | | 1,097,005 | |
SBA Senior Finance II LLC
2018 Term Loan B
1.93% (1 Month LIBOR + 1.75%), due 4/11/25 | | | 1,798,943 | | | | 1,721,738 | |
T-Mobile USA, Inc.
2020 Term Loan
3.178% (1 Month LIBOR + 3.00%), due 4/1/27 | | | 2,500,000 | | | | 2,496,250 | |
West Corp.
2017 Term Loan
5.00% (3 Month LIBOR + 4.00%), due 10/10/24 | | | 1,719,673 | | | | 1,464,301 | |
Zayo Group Holdings, Inc.
Term Loan
3.178% (1 Month LIBOR + 3.00%), due 3/9/27 | | | 2,909,375 | | | | 2,750,267 | |
| | | | | | | | |
| | | | | | | 20,605,480 | |
| | | | | | | | |
Utilities 5.4% | |
Astoria Energy LLC
Term Loan B
5.00% (1 Month LIBOR + 4.00%, 3 Month LIBOR + 4.00%), due 12/24/21 | | | 2,259,827 | | | | 2,222,163 | |
Brookfield WEC Holdings, Inc.
2020 Term Loan
3.75% (1 Month LIBOR + 3.00%), due 8/1/25 | | | 2,957,475 | | | | 2,849,651 | |
Calpine Corp. | |
Term Loan B5 2.43% (1 Month LIBOR + 2.25%), due 1/15/24 | | | 1,676,066 | | | | 1,613,912 | |
Term Loan B9 2.43% (1 Month LIBOR + 2.25%), due 4/5/26 | | | 3,118,500 | | | | 3,001,556 | |
| | | | |
| 24 | | MainStay VP Floating Rate Portfolio | | The notes to the financial statements are an integral part of,
and should be read in conjunction with, the financial statements. |
| | | | | | | | |
| | | Principal
Amount | | | Value | |
| Floating Rate Loans (continued) | |
Utilities (continued) | |
Compass Power Generation LLC
2018 Term Loan B
4.50% (1 Month LIBOR + 3.50%), due 12/20/24 | | $ | 647,295 | | | $ | 618,167 | |
Edgewater Generation LLC
Term Loan
3.928% (1 Month LIBOR + 3.75%), due 12/13/25 | | | 3,947,418 | | | | 3,759,916 | |
ExGen Renewables IV LLC
Term Loan B
4.00% (3 Month LIBOR + 3.00%), due 11/28/24 | | | 913,492 | | | | 888,371 | |
Granite Acquisition, Inc. | |
Term Loan B
4.50% (3 Month LIBOR + 3.50%), due 12/19/21 | | | 3,084,133 | | | | 3,010,885 | |
2nd Lien Term Loan B
8.25% (3 Month LIBOR + 7.25%), due 12/19/22 | | | 696,328 | | | | 679,499 | |
Granite Generation LLC
Term Loan B
4.75% (1 Month LIBOR + 3.75%, 3 Month LIBOR + 3.75%), due 11/9/26 | | | 3,409,248 | | | | 3,306,971 | |
Hamilton Projects Acquiror LLC
Term Loan B
5.75% (3 Month LIBOR + 4.75%), due 6/17/27 | | | 2,500,000 | | | | 2,434,375 | |
Helix Gen Funding LLC
Term Loan B
4.75% (1 Month LIBOR + 3.75%), due 6/3/24 | | | 2,808,091 | | | | 2,697,772 | |
Pacific Gas & Electric Co.
2020 Exit Term Loan B
5.50% (3 Month LIBOR + 4.50%), due 6/23/25 | | | 1,750,000 | | | | 1,725,208 | |
PG&E Corp.
DIP Term Loan
2.44% (1 Month LIBOR + 2.25%), due 12/31/20 | | | 2,750,000 | | | | 2,732,813 | |
Southeast PowerGen LLC
Term Loan B
4.50% (1 Month LIBOR + 3.50%), due 12/2/21 | | | 433,088 | | | | 394,110 | |
Vistra Operations Co. LLC
1st Lien Term Loan B3
1.928%-1.944% (1 Month LIBOR + 1.75%), due 12/31/25 | | | 3,169,428 | | | | 3,057,839 | |
| | | | | | | | |
| | | | | | | 34,993,208 | |
| | | | | | | | |
Total Floating Rate Loans
(Cost $556,872,159) | | | | 514,636,366 | |
| | | | | |
| | | | | | | | |
| | | Principal
Amount | | | Value | |
| Foreign Floating Rate Loans 10.8% (d) | |
Aerospace & Defense 0.3% | |
AI Convoy (Luxembourg) S.A.R.L
Term Loan B
4.65% (6 Month LIBOR + 3.50%), due 1/17/27 | | $ | 872,813 | | | $ | 829,717 | |
WestJet Airlines, Ltd.
Term Loan B
4.00% (6 Month LIBOR + 3.00%), due 12/11/26 | | | 1,243,750 | | | | 993,964 | |
| | | | | | | | |
| | | | | | | 1,823,681 | |
| | | | | | | | |
Automobile 0.1% | |
Panther BF Aggregator 2 L.P.
Term Loan B
3.678% (1 Month LIBOR + 3.50%), due 4/30/26 | | | 985,659 | | | | 937,198 | |
| | | | | | | | |
|
Beverage, Food & Tobacco 1.0% | |
Froneri International, Ltd.
2020 USD Term Loan
2.428% (1 Month LIBOR + 2.25%), due 1/29/27 | | | 1,485,000 | | | | 1,394,663 | |
JBS USA Lux S.A.
2019 Term Loan B
3.072% (2 Month LIBOR + 2.00%), due 5/1/26 | | | 3,617,213 | | | | 3,445,395 | |
Sunshine Investments B.V.
Term Loan B3
3.674% (3 Month LIBOR + 3.25%), due 3/28/25 | | | 1,980,000 | | | | 1,920,600 | |
| | | | | | | | |
| | | | | | | 6,760,658 | |
| | | | | | | | |
Broadcasting & Entertainment 0.6% | |
Altice France S.A. | |
Term Loan B12
3.872% (1 Month LIBOR + 3.687%), due 1/31/26 | | | 974,976 | | | | 931,711 | |
2018 Term Loan B13
4.185% (1 Month LIBOR + 4.00%), due 8/14/26 | | | 1,231,250 | | | | 1,182,000 | |
Numericable Group S.A.
Term Loan B11
2.928% (1 Month LIBOR + 2.75%), due 7/31/25 | | | 1,910,266 | | | | 1,809,977 | |
| | | | | | | | |
| | | | | | | 3,923,688 | |
| | | | | | | | |
Chemicals, Plastics & Rubber 1.3% | |
Allnex (Luxembourg) & Cy S.C.A.
2016 Term Loan B2
4.00% (2 Month LIBOR + 3.25%), due 9/13/23 (e) | | | 1,251,531 | | | | 1,178,526 | |
| | | | | | |
The notes to the financial statements are an integral part of,
and should be read in conjunction with, the financial statements. | | | | | 25 | |
Portfolio of Investments June 30, 2020 (Unaudited) (continued)
| | | | | | | | |
| | | Principal
Amount | | | Value | |
| Foreign Floating Rate Loans (continued) | |
Chemicals, Plastics & Rubber (continued) | |
Alpha 3 B.V.
2017 Term Loan B1
4.00% (3 Month LIBOR + 3.00%), due 1/31/24 | | $ | 1,734,827 | | | $ | 1,663,266 | |
Diamond (BC) B.V.
Term Loan
3.76% (3 Month LIBOR + 3.00%), due 9/6/24 | | | 1,625,000 | | | | 1,489,584 | |
Flint Group GmbH
Term Loan C
4.02% (3 Month LIBOR + 3.00%), due 9/7/21 (e) | | | 289,695 | | | | 245,758 | |
Oxea Holding Drei GmbH
2017 Term Loan B2
3.688% (1 Month LIBOR + 3.50%), due 10/14/24 | | | 2,262,500 | | | | 2,070,187 | |
Starfruit Finco B.V.
2018 Term Loan B
3.188% (1 Month LIBOR + 3.00%), due 10/1/25 | | | 2,164,847 | | | | 2,026,838 | |
| | | | | | | | |
| | | | | | | 8,674,159 | |
| | | | | | | | |
Diversified/Conglomerate Manufacturing 0.2% | |
AI Ladder (Luxembourg) Subco S.A R.L.
2018 Term Loan
4.678% (1 Month LIBOR + 4.50%), due 7/9/25 (e) | | | 800,466 | | | | 721,754 | |
Bright Bidco B.V.
2018 Term Loan B
4.572% (3 Month LIBOR + 3.50%), due 6/30/24 | | | 1,940,060 | | | | 816,765 | |
| | | | | | | | |
| | | | | | | 1,538,519 | |
| | | | | | | | |
Ecological 0.2% | |
GFL Environmental, Inc.
2018 Term Loan B
4.00% (1 Month LIBOR + 3.00%, 3 Month LIBOR + 3.00%), due 5/30/25 | | | 1,256,902 | | | | 1,218,148 | |
| | | | | | | | |
|
Electronics 1.3% | |
ION Trading Technologies S.A R.L.
Incremental Term Loan B
5.072% (3 Month LIBOR + 4.00%), due 11/21/24 | | | 1,462,227 | | | | 1,400,083 | |
Oberthur Technologies S.A.
2016 Term Loan B1
4.058% (3 Month LIBOR + 3.75%), due 1/10/24 | | | 1,089,607 | | | | 995,628 | |
| | | | | | | | |
| | | Principal
Amount | | | Value | |
Electronics (continued) | |
SS&C Technologies Holdings Europe S.A R.L.
2018 Term Loan B4
1.928% (1 Month LIBOR + 1.75%), due 4/16/25 | | $ | 1,709,072 | | | $ | 1,627,891 | |
Trader Corp.
2017 Term Loan B
4.00% (1 Month LIBOR + 3.00%), due 9/28/23 | | | 2,283,127 | | | | 2,197,509 | |
Veritas Bermuda, Ltd.
Repriced Term Loan B
5.50% (3 Month LIBOR + 4.50%), due 1/27/23 | | | 2,195,793 | | | | 2,025,619 | |
| | | | | | | | |
| | | | | | | 8,246,730 | |
| | | | | | | | |
Healthcare, Education & Childcare 1.6% | |
Auris Luxembourg III S.A.R.L.
2019 Term Loan B2
3.928% (1 Month LIBOR + 3.75%), due 2/27/26 | | | 1,167,671 | | | | 1,015,874 | |
Bausch Health Cos., Inc.
2018 Term Loan B
3.19% (1 Month LIBOR + 3.00%), due 6/2/25 | | | 4,946,211 | | | | 4,787,779 | |
Endo Luxembourg Finance Co. I S.A R.L.
2017 Term Loan B
5.00% (1 Month LIBOR + 4.25%), due 4/29/24 | | | 2,270,211 | | | | 2,128,323 | |
Mallinckrodt International Finance S.A.
Term Loan B
3.50% (3 Month LIBOR + 2.75%), due 9/24/24 | | | 1,042,393 | | | | 772,674 | |
Sunshine Luxembourg VII S.A R.L.
Term Loan B1
5.322% (6 Month LIBOR + 4.25%), due 10/1/26 | | | 1,592,000 | | | | 1,518,938 | |
| | | | | | | | |
| | | | | | | 10,223,588 | |
| | | | | | | | |
Hotels, Motels, Inns & Gaming 0.7% | |
Four Seasons Hotels, Ltd.
New 1st Lien Term Loan
2.178% (1 Month LIBOR + 2.00%), due 11/30/23 | | | 1,454,589 | | | | 1,376,405 | |
Gateway Casinos & Entertainment, Ltd.
2018 Term Loan B
3.308% (3 Month LIBOR + 3.00%), due 3/13/25 (e) | | | 1,572,925 | | | | 1,270,627 | |
GVC Holdings (Gibraltar), Ltd.
2020 Term Loan B3
3.308% (6 Month LIBOR + 2.25%), due 3/29/24 | | | 1,471,162 | | | | 1,412,316 | |
| | | | |
| 26 | | MainStay VP Floating Rate Portfolio | | The notes to the financial statements are an integral part of,
and should be read in conjunction with, the financial statements. |
| | | | | | | | |
| | | Principal
Amount | | | Value | |
| Foreign Floating Rate Loans (continued) | |
Hotels, Motels, Inns & Gaming (continued) | |
Stars Group Holdings B.V.
2018 Incremental Term Loan
3.808% (3 Month LIBOR + 3.50%), due 7/10/25 | | $ | 463,512 | | | $ | 460,325 | |
| | | | | | | | |
| | | | | | | 4,519,673 | |
| | | | | | | | |
Leisure, Amusement, Motion Pictures & Entertainment 1.0% | |
Bombardier Recreational Products, Inc.
2020 Term Loan
2.178% (1 Month LIBOR + 2.00%), due 5/24/27 | | | 3,332,117 | | | | 3,158,571 | |
Delta 2 (LUX) S.A.R.L.
2018 Term Loan
3.50% (1 Month LIBOR + 2.50%), due 2/1/24 | | | 2,568,089 | | | | 2,436,474 | |
DHX Media, Ltd.
Term Loan B
5.25% (1 Month LIBOR + 4.25%), due 12/29/23 | | | 698,207 | | | | 649,332 | |
| | | | | | | | |
| | | | | | | 6,244,377 | |
| | | | | | | | |
Machinery (Non-Agriculture, Non-Construct & Non-Electronic) 0.3% | |
Titan Acquisition, Ltd.
2018 Term Loan B
3.361% (3 Month LIBOR + 3.00%), due 3/28/25 | | | 1,826,027 | | | | 1,661,684 | |
| | | | | | | | |
|
Oil & Gas 0.2% | |
NorthRiver Midstream Finance L.P.
2018 Term Loan B
4.683% (3 Month LIBOR + 3.25%), due 10/1/25 | | | 1,179,000 | | | | 1,118,085 | |
| | | | | | | | |
|
Personal, Food & Miscellaneous Services 0.7% | |
1011778 B.C. Unlimited Liability Co.
Term Loan B4
1.928% (1 Month LIBOR + 1.75%), due 11/19/26 | | | 2,175,787 | | | | 2,058,295 | |
Jacobs Douwe Egberts International B.V.
2018 Term Loan B
2.188% (1 Month LIBOR + 2.00%), due 11/1/25 | | | 2,629,751 | | | | 2,574,965 | |
| | | | | | | | |
| | | | | | | 4,633,260 | |
| | | | | | | | |
Printing & Publishing 0.4% | |
Springer Nature Deutschland GmbH
Term Loan B16
4.50% (1 Month LIBOR + 3.50%), due 8/14/24 | | | 2,850,760 | | | | 2,752,409 | |
| | | | | | | | |
| | | | | | | | |
| | | Principal
Amount | | | Value | |
Retail Store 0.1% | |
EG Group, Ltd.
2018 Term Loan B
5.072% (6 Month LIBOR + 4.00%), due 2/7/25 | | $ | 675,545 | | | $ | 634,167 | |
| | | | | | | | |
|
Telecommunications 0.8% | |
Connect Finco S.A.R.L.
Term Loan B
5.50% (1 Month LIBOR + 4.50%), due 12/11/26 | | | 1,995,000 | | | | 1,872,307 | |
Intelsat Jackson Holdings S.A.
2020 DIP Term Loan
5.05% (3 Month LIBOR + 5.50%), due 7/14/21 | | | 120,763 | | | | 122,373 | |
2017 Term Loan B3
8.00% (PRIME + 4.75%), due 11/27/23 | | | 1,639,180 | | | | 1,630,984 | |
Telesat Canada
Term Loan B5
2.93% (1 Month LIBOR + 2.75%), due 12/7/26 | | | 1,492,500 | | | | 1,425,338 | |
| | | | | | | | |
| | | | | | | 5,051,002 | |
| | | | | | | | |
Total Foreign Floating Rate Loans
(Cost $75,229,032) | | | | 69,961,026 | |
| | | | | |
Total Long-Term Bonds
(Cost $657,838,817) | | | | 610,290,140 | |
| | | | | |
| | |
| | | | | | | | |
| | |
| | | Shares | | | | |
| Affiliated Investment Company 0.3% | |
Fixed Income Fund 0.3% | |
MainStay MacKay High Yield Corporate Bond Fund Class I | | | 436,571 | | | | 2,300,728 | |
| | | | | | | | |
Total Affiliated Investment Company
(Cost $2,467,271) | | | | 2,300,728 | |
| | | | | |
|
| Common Stocks 0.2% | |
Communications Equipment 0.0%‡ | |
Energy Future Holdings
Corp. (e)(f)(h)(i) | | | 94,456 | | | | 0 | |
Millennium Corporate
Trust (e)(f)(h)(i) | | | 1,243 | | | | 0 | |
Millennium Lender
Trust (e)(f)(h)(i) | | | 1,324 | | | | 0 | |
| | | | | | | | |
| | | | | | | 0 | |
| | | | | | | | |
Metals & Mining 0.2% | |
AFGlobal Corp. (e)(f)(h)(i) | | | 45,694 | | | | 939,469 | |
| | | | | | | | |
|
Oil & Gas 0.0%‡ | |
Templar Energy Corp.,
Class B (e)(f)(h)(i) | | | 36,393 | | | | 0 | |
Templar Energy LLC,
Class A (e)(f)(h)(i) | | | 36,029 | | | | 0 | |
| | | | | | | | |
| | | | | | | 0 | |
| | | | | | | | |
| | | | | | |
The notes to the financial statements are an integral part of,
and should be read in conjunction with, the financial statements. | | | | | 27 | |
Portfolio of Investments June 30, 2020 (Unaudited) (continued)
| | | | | | | | |
| | |
| | | Shares | | | Value | |
| Common Stocks (continued) | |
Oil, Gas & Consumable Fuels 0.0%‡ | |
Ascent Resources (e)(f)(h)(i) | | | 122,031 | | | $ | 89,082 | |
Philadelphia Energy Solutions, Inc., Class A (e)(f)(h)(i) | | | 52,608 | | | | 0 | |
| | | | | | | | |
| | | | | | | 89,082 | |
| | | | | | | | |
Total Common Stocks
(Cost $2,781,439) | | | | 1,028,551 | |
| | | | | |
|
| Preferred Stocks 0.0%‡ | |
Oil & Gas 0.0%‡ | |
Templar Energy Corp.,
(8.00% PIK) (e)(f)(g)(h)(i) | | | 58,865 | | | | 0 | |
| | | | | | | | |
Total Preferred Stocks
(Cost $227,580) | | | | 0 | |
| | | | | |
| | |
| | | | | | | | |
| | | Number of
Rights | | | | |
| Rights 0.0%‡ | |
Independent Power & Renewable Electricity Producers 0.0%‡ | |
Vistra Energy Corp.
Expires 12/31/46 (e)(f)(h)(i) | | | 57,684 | | | | 61,145 | |
| | | | | | | | |
Total Rights
(Cost $47,301) | | | | 61,145 | |
| | | | | |
| | |
| | | | | | | | |
| | | Number of
Warrants | | | | |
| Warrants 0.0%‡ | |
Medical Equipment & Devices 0.0%‡ | |
Carestream Health, Inc.
Expires 12/31/21 (e)(f)(h)(i) | | | 29 | | | | 0 | |
| | | | | | | | |
|
Oil, Gas & Consumable Fuels 0.0%‡ | |
Ascent Resources (e)(f)(h)(i)
1st Lien Warrants
Expires 3/30/23 | | | 11,684 | | | | 117 | |
2nd Lien Tranche A
Expires 3/30/23 | | | 15,022 | | | | 150 | |
2nd Lien Tranche B
Expires 3/30/23 | | | 31,000 | | | | 310 | |
| | | | | | | | |
| | | | | | | 577 | |
| | | | | | | | |
Total Warrants
(Cost $6,398) | | | | 577 | |
| | | | | |
| | |
| | | | | | | | |
| | | | | | | | |
| | | Principal
Amount | | | Value | |
| Short-Term Investments 6.0% | |
Repurchase Agreement 0.2% | |
Fixed Income Clearing Corp.
0.00%, dated 6/30/20
due 7/1/20
Proceeds at Maturity $1,053,340 (Collateralized by a United States Treasury Note with a rate of 2.50% and a maturity date of 2/28/26, with a Principal Amount of $952,100 and a Market Value of $1,074,429) | | $ | 1,053,340 | | | $ | 1,053,340 | |
| | | | | | | | |
Total Repurchase Agreement
(Cost $1,053,340) | | | | 1,053,340 | |
| | | | | |
|
U.S. Government & Federal Agencies 5.8% (j) | |
0.091%, due 7/14/20 | | | 28,271,000 | | | | 28,270,081 | |
0.102%, due 7/7/20 | | | 167,000 | | | | 166,997 | |
0.117%, due 7/9/20 | | | 1,353,000 | | | | 1,352,966 | |
0.12%, due 7/9/20 | | | 1,586,000 | | | | 1,585,958 | |
0.121%, due 7/28/20 | | | 1,509,000 | | | | 1,508,865 | |
0.128%, due 7/28/20 | | | 933,000 | | | | 932,912 | |
0.153%, due 8/11/20 | | | 1,732,000 | | | | 1,731,702 | |
0.158%, due 7/23/20 | | | 2,107,000 | | | | 2,106,800 | |
| | | | | | | | |
Total U.S. Government & Federal Agencies
(Cost $37,656,281) | | | | 37,656,281 | |
| | | | | |
Total Short-Term Investments
(Cost $38,709,621) | | | | 38,709,621 | |
| | | | | |
Total Investments
(Cost $702,078,427) | | | 101.0 | % | | | 652,390,762 | |
Other Assets, Less Liabilities | | | (1.0 | ) | | | (6,251,216 | ) |
Net Assets | | | 100.0 | % | | $ | 646,139,546 | |
| † | Percentages indicated are based on Portfolio net assets. |
| ‡ | Less than one-tenth of a percent. |
| (a) | May be sold to institutional investors only under Rule 144A or securities offered pursuant to Section 4(a)(2) of the Securities Act of 1933, as amended. |
| (c) | Issue in non-accrual status. |
| (d) | Floating rate—Rate shown was the rate in effect as of June 30, 2020. |
| (e) | Illiquid investment—As of June 30, 2020, the total market value of these illiquid investments was $38,252,684, which represented 5.9% of the Portfolio’s net assets. |
| (f) | Security in which significant unobservable inputs (Level 3) were used in determining fair value. |
| (g) | PIK (“Payment-in-Kind”)—issuer may pay interest or dividends with additional securities and/or in cash. |
| | | | |
| 28 | | MainStay VP Floating Rate Portfolio | | The notes to the financial statements are an integral part of,
and should be read in conjunction with, the financial statements. |
| (h) | Fair valued security—Represents fair value as measured in good faith under procedures approved by the Board of Trustees. As of June 30, 2020, the total market value of fair valued securities was $3,940,273, which represented 0.6% of the Portfolio’s net assets. |
| (i) | Non-income producing security. |
| (j) | Interest rate shown represents yield to maturity. |
The following abbreviations are used in the preceding pages:
LIBOR—London Interbank Offered Rate
TBD—To Be Determined
The following is a summary of the fair valuations according to the inputs used as of June 30, 2020, for valuing the Portfolio’s assets:
| | | | | | | | | | | | | | | | |
Description | | Quoted
Prices in
Active
Markets for
Identical
Assets (Level 1) | | | Significant
Other
Observable
Inputs (Level 2) | | | Significant
Unobservable
Inputs (Level 3) | | | Total | |
Asset Valuation Inputs | |
| Investments in Securities (a) | | | | | | | | | |
| Long-Term Bonds | | | | | | | | | |
Corporate Bonds | | $ | — | | | $ | 25,692,748 | | | $ | — | | | $ | 25,692,748 | |
Floating Rate Loans (b) | | | — | | | | 506,343,647 | | | | 8,292,719 | | | | 514,636,366 | |
Foreign Floating Rate Loans | | | — | | | | 69,961,026 | | | | — | | | | 69,961,026 | |
| | | | | | | | | | | | | | | | |
| Total Long-Term Bonds | | | — | | | | 601,997,421 | | | | 8,292,719 | | | | 610,290,140 | |
| | | | | | | | | | | | | | | | |
| Affiliated Investment Company | | | | | | | | | |
Fixed Income Fund | | | 2,300,728 | | | | — | | | | — | | | | 2,300,728 | |
| Common Stocks (c) | | | — | | | | — | | | | 1,028,551 | | | | 1,028,551 | |
| Preferred Stocks (d) | | | — | | | | — | | | | 0 | | | | 0 | |
| Rights (e) | | | — | | | | — | | | | 61,145 | | | | 61,145 | |
| Warrants (f) | | | — | | | | — | | | | 577 | | | | 577 | |
| Short-Term Investments | | | | | | | | | |
Repurchase Agreement | | | — | | | | 1,053,340 | | | | — | | | | 1,053,340 | |
U.S. Government & Federal Agencies | | | — | | | | 37,656,281 | | | | — | | | | 37,656,281 | |
| | | | | | | | | | | | | | | | |
| Total Short-Term Investments | | | — | | | | 38,709,621 | | | | — | | | | 38,709,621 | |
| | | | | | | | | | | | | | | | |
| Total Investments in Securities | | $ | 2,300,728 | | | $ | 640,707,042 | | | $ | 9,382,992 | | | $ | 652,390,762 | |
| | | | | | | | | | | | | | | | |
| (a) | For a complete listing of investments and their industries, see the Portfolio of Investments. |
| (b) | The Level 3 securities valued at $8,292,719 are held within the Floating Rate Loans section of the Portfolio of Investments were valued by a pricing service without adjustment. |
| (c) | The Level 3 securities valued at $0, $939,469, $0 and $89,082 are held in Communications Equipment, Metals & Mining, Oil & Gas and Oil, Gas & Consumable fuels, respectively, within the Common Stocks section of the Portfolio of Investments. |
| (d) | The Level 3 security valued at $0 is held in Oil & Gas within the Preferred Stocks section of the Portfolio of Investments. |
| (e) | The Level 3 security valued at $61,145 is held in Independent Power & Renewable Electricity Producers within the Rights section of the Portfolio of Investments. |
| (f) | The Level 3 securities valued at $0 and $577 are held in Medical Equipment & Devices and Oil, Gas & Consumable Fuels, respectively within the Warrants section of the Portfolio of Investments. |
| | | | | | |
The notes to the financial statements are an integral part of,
and should be read in conjunction with, the financial statements. | | | | | 29 | |
Portfolio of Investments June 30, 2020 (Unaudited) (continued)
The following is a reconciliation of investments in which significant unobservable inputs (Level 3) were used in determining value:
| | | | | | | | | | | | | | | | | | | | | | | | | | | | | | | | | | | | | | | | |
Investments in
Securities | | Balance
as of
December 31,
2019 | | | Accrued
Discounts
(Premiums) | | | Realized
Gain
(Loss) | | | Change in
Unrealized
Appreciation
(Depreciation) | | | Purchases | | | Sales (a) | | | Transfers
in to
Level 3 | | | Transfers
out of
Level 3 | | | Balance
as of
June 30,
2020 | | | Change in
Unrealized
Appreciation
(Depreciation)
from
Investments
Held at
June 30,
2020 | |
| Long-Term Bonds | | | | | | | | | | | | | | | | | | | | | | | | | | | | | | | | | | | | | | | | |
Floating Rate Loans | | $ | 12,006,938 | | | $ | 2,467 | | | $ | (320,835 | ) | | $ | (283,061 | ) | | $ | 3,963,372 | | | $ | (2,105,460 | ) | | $ | 4,055,671 | | | $ | (9,026,373 | ) | | $ | 8,292,719 | | | $ | (348,030 | ) |
Foreign Floating Rate Loans | | | — | | | | — | | | | — | | | | — | | | | — | | | | — | | | | — | | | | — | | | | — | | | | — | |
| Common Stocks | | | 2,853,761 | | | | — | | | | — | | | | (1,825,210 | ) | | | — | | | | — | | | | — | | | | — | | | | 1,028,551 | | | | (1,825,209 | ) |
| Preferred Stocks | | | — | | | | — | | | | — | | | | — | | | | — | | | | — | | | | — | | | | — | | | | — | | | | — | |
| Rights | | | 59,991 | | | | — | | | | — | | | | 1,154 | | | | — | | | | — | | | | — | | | | — | | | | 61,145 | | | | 1,154 | |
| Warrants | | | 3,684 | | | | — | | | | — | | | | (3,107 | ) | | | — | | | | — | | | | — | | | | — | | | | 577 | | | | (3,107 | ) |
| | | | | | | | | | | | | | | | | | | | | | | | | | | | | | | | | | | | | | | | |
| Total | | $ | 14,924,374 | | | $ | 2,467 | | | $ | (320,835 | ) | | $ | (2,110,224 | ) | | $ | 3,963,372 | | | $ | (2,105,460 | ) | | $ | 4,055,671 | | | $ | (9,026,373 | ) | | $ | 9,382,992 | | | $ | (2,175,192 | ) |
| | | | | | | | | | | | | | | | | | | | | | | | | | | | | | | | | | | | | | | | |
| (a) | Sales include principal reductions. |
As of June 30, 2020, securities with a market value of $4,055,671 transferred from Level 2 to Level 3 as the fair value obtained from an independent pricing service, utilized significant unobservable inputs. As of December 31, 2019, the fair value obtained for these securities, as determined by an independent pricing service, utilized significant other observable inputs.
As of June 30, 2020, securities with a market value of $9,026,373 transferred from Level 3 to Level 2 as the fair value obtained from an independent pricing service, utilized significant other observable inputs. As of December 31, 2019, the fair value obtained for these securities, as determined by an independent pricing service, utilized significant unobservable inputs.
| | | | |
| 30 | | MainStay VP Floating Rate Portfolio | | The notes to the financial statements are an integral part of,
and should be read in conjunction with, the financial statements. |
Statement of Assets and Liabilities as of June 30, 2020 (Unaudited)
| | | | |
| Assets | |
Investment in unaffiliated securities, at value
(identified cost $699,611,156) | | $ | 650,090,034 | |
Investment in affiliated investment company, at value (identified cost $2,467,271) | | | 2,300,728 | |
Unrealized appreciation on unfunded commitments (See Note 5) | | | 1,610 | |
Receivables: | |
Investment securities sold | | | 2,913,077 | |
Dividends and interest | | | 2,892,497 | |
Portfolio shares sold | | | 83,319 | |
Other assets | | | 3,390 | |
| | | | |
Total assets | | | 658,284,655 | |
| | | | |
|
| Liabilities | |
Payables: | |
Investment securities purchased | | | 11,230,769 | |
Portfolio shares redeemed | | | 365,499 | |
Manager (See Note 3) | | | 320,425 | |
NYLIFE Distributors (See Note 3) | | | 102,122 | |
Shareholder communication | | | 55,972 | |
Professional fees | | | 45,734 | |
Custodian | | | 15,644 | |
Trustees | | | 1,010 | |
Accrued expenses | | | 7,556 | |
Dividend payable | | | 378 | |
| | | | |
Total liabilities | | | 12,145,109 | �� |
| | | | |
Net assets | | $ | 646,139,546 | |
| | | | |
| |
| Composition of Net Assets | | | | |
Shares of beneficial interest outstanding (par value of $.001 per share) unlimited number of shares authorized | | $ | 77,211 | |
Additional paid-in capital | | | 733,529,219 | |
| | | | |
| | | 733,606,430 | |
Total distributable earnings (loss) | | | (87,466,884 | ) |
| | | | |
Net assets | | $ | 646,139,546 | |
| | | | |
| | | | |
Initial Class | | | | |
Net assets applicable to outstanding shares | | $ | 151,732,875 | |
| | | | |
Shares of beneficial interest outstanding | | | 18,142,418 | |
| | | | |
Net asset value per share outstanding | | $ | 8.36 | |
| | | | |
Service Class | | | | |
Net assets applicable to outstanding shares | | $ | 494,406,671 | |
| | | | |
Shares of beneficial interest outstanding | | | 59,068,863 | |
| | | | |
Net asset value per share outstanding | | $ | 8.37 | |
| | | | |
| | | | | | |
The notes to the financial statements are an integral part of,
and should be read in conjunction with, the financial statements. | | | | | 31 | |
Statement of Operations for the six months ended June 30, 2020 (Unaudited)
| | | | |
| Investment Income (Loss) | |
Income | | | | |
Interest | | $ | 16,623,112 | |
Dividends—affiliated | | | 104,893 | |
Securities lending | | | 130 | |
| | | | |
Total income | | | 16,728,135 | |
| | | | |
Expenses | | | | |
Manager (See Note 3) | | | 2,097,243 | |
Distribution/Service—Service Class (See Note 3) | | | 650,386 | |
Professional fees | | | 71,954 | |
Shareholder communication | | | 48,084 | |
Custodian | | | 29,197 | |
Trustees | | | 9,367 | |
Miscellaneous | | | 30,293 | |
| | | | |
Total expenses | | | 2,936,524 | |
| | | | |
Net investment income (loss) | | | 13,791,611 | |
| | | | |
|
| Realized and Unrealized Gain (Loss) on Investments and Unfunded Commitments | |
Net realized gain (loss) on: | | | | |
Unaffiliated investment transactions | | | (13,013,996 | ) |
Affiliated investment company transactions | | | (312,650 | ) |
| | | | |
Net realized gain (loss) on investments from affiliated and unaffiliated investment companies | | | (13,326,646 | ) |
| | | | |
Net change in unrealized appreciation (depreciation) on: | | | | |
Unaffiliated investments | | | (39,320,659 | ) |
Affiliated investments | | | (181,520 | ) |
Unfunded commitments | | | (10,981 | ) |
| | | | |
Net change in unrealized appreciation (depreciation) on investments and unfunded commitments | | | (39,513,160 | ) |
| | | | |
Net realized and unrealized gain (loss) on investments and unfunded commitments | | | (52,839,806 | ) |
| | | | |
Net increase (decrease) in net assets resulting from operations | | $ | (39,048,195 | ) |
| | | | |
| | | | |
| 32 | | MainStay VP Floating Rate Portfolio | | The notes to the financial statements are an integral part of,
and should be read in conjunction with, the financial statements. |
Statements of Changes in Net Assets
for the six months ended June 30, 2020 (Unaudited) and the year ended December 31, 2019
| | | | | | | | |
| | | 2020 | | | 2019 | |
| Increase (Decrease) in Net Assets | |
Operations: | | | | | | | | |
Net investment income (loss) | | $ | 13,791,611 | | | $ | 40,304,993 | |
Net realized gain (loss) on investments and investments from affiliated and unaffiliated investment companies | | | (13,326,646 | ) | | | (5,894,461 | ) |
Net change in unrealized appreciation (depreciation) on investments and unfunded commitments | | | (39,513,160 | ) | | | 30,016,459 | |
| | | | |
Net increase (decrease) in net assets resulting from operations | | | (39,048,195 | ) | | | 64,426,991 | |
| | | | |
Distributions to shareholders: | | | | | | | | |
Initial Class | | | (3,735,364 | ) | | | (11,829,497 | ) |
Service Class | | | (10,159,333 | ) | | | (28,371,764 | ) |
| | | | |
Total distributions to shareholders | | | (13,894,697 | ) | | | (40,201,261 | ) |
| | | | |
Capital share transactions: | | | | | | | | |
Net proceeds from sale of shares | | | 41,785,605 | | | | 184,315,713 | |
Net asset value of shares issued to shareholders in reinvestment of distributions | | | 13,894,697 | | | | 40,196,195 | |
Cost of shares redeemed | | | (141,613,342 | ) | | | (262,498,887 | ) |
| | | | |
Increase (decrease) in net assets derived from capital share transactions | | | (85,933,040 | ) | | | (37,986,979 | ) |
| | | | |
Net increase (decrease) in net assets | | | (138,875,932 | ) | | | (13,761,249 | ) |
|
| Net Assets | |
Beginning of period | | | 785,015,478 | | | | 798,776,727 | |
| | | | |
End of period | | $ | 646,139,546 | | | $ | 785,015,478 | |
| | | | |
| | | | | | |
The notes to the financial statements are an integral part of,
and should be read in conjunction with, the financial statements. | | | | | 33 | |
Financial Highlights selected per share data and ratios
| | | | | | | | | | | | | | | | | | | | | | | | | | | | |
| | | |
| | | Six months
ended
June 30, | | | | | | Year ended December 31, | |
| | | | | | | |
| Initial Class | | 2020* | | | | | | 2019 | | | 2018 | | | 2017 | | | 2016 | | | 2015 | |
| | | | | | | |
Net asset value at beginning of period | | $ | 8.93 | | | | | | | $ | 8.66 | | | $ | 9.08 | | | $ | 9.11 | | | $ | 8.74 | | | $ | 9.05 | |
| | | | | | | | | | | | | | | | | | | | | | | | | | | | |
| | | | | | | |
Net investment income (loss) (a) | | | 0.17 | | | | | | | | 0.44 | | | | 0.43 | | | | 0.39 | | | | 0.35 | | | | 0.35 | |
| | | | | | | |
Net realized and unrealized gain (loss) on investments | | | (0.57 | ) | | | | | | | 0.27 | | | | (0.42 | ) | | | (0.03 | ) | | | 0.37 | | | | (0.31 | ) |
| | | | | | | | | | | | | | | | | | | | | | | | | | | | |
| | | | | | | |
Total from investment operations | | | (0.40 | ) | | | | | | | 0.71 | | | | 0.01 | | | | 0.36 | | | | 0.72 | | | | 0.04 | |
| | | | | | | | | | | | | | | | | | | | | | | | | | | | |
|
| Less distributions: | |
| | | | | | | |
From net investment income | | | (0.17 | ) | | | | | | | (0.44 | ) | | | (0.43 | ) | | | (0.39 | ) | | | (0.35 | ) | | | (0.35 | ) |
| | | | | | | | | | | | | | | | | | | | | | | | | | | | |
| | | | | | | |
Net asset value at end of period | | $ | 8.36 | | | | | | | $ | 8.93 | | | $ | 8.66 | | | $ | 9.08 | | | $ | 9.11 | | | $ | 8.74 | |
| | | | | | | | | | | | | | | | | | | | | | | | | | | | |
| | | | | | | |
Total investment return (b) | | | (4.39 | %) | | | | | | | 8.48 | % | | | (0.00 | %)‡,(c) | | | 3.98 | % | | | 8.45 | % | | | 0.39 | % |
|
| Ratios (to average net assets)/Supplemental Data: | |
| | | | | | | |
Net investment income (loss) | | | 4.18 | % †† | | | | | | | 4.98 | % | | | 4.75 | % | | | 4.21 | % | | | 3.94 | %(d) | | | 3.88 | % |
| | | | | | | |
Net expenses (e) | | | 0.65 | % †† | | | | | | | 0.65 | % | | | 0.65 | % | | | 0.64 | % | | | 0.64 | %(f) | | | 0.64 | % |
| | | | | | | |
Portfolio turnover rate | | | 11 | % | | | | | | | 35 | % | | | 29 | % | | | 52 | % | | | 36 | % | | | 35 | % |
| | | | | | | |
Net assets at end of period (in 000’s) | | $ | 151,733 | | | | | | | $ | 205,596 | | | $ | 187,285 | | | $ | 259,054 | | | $ | 287,373 | | | $ | 226,083 | |
| ‡ | Less than one-tenth of a percent. |
| (a) | Per share data based on average shares outstanding during the period. |
| (b) | Total return does not reflect any deduction of sales charges, mortality and expense charges, contract charges or administrative charges. For periods of less than one year, total return is not annualized. |
| (c) | Total investment return may reflect adjustments to conform to generally accepted accounting principles. |
| (d) | Without the custody fee reimbursement, net investment income (loss) would have been 3.93%. |
| (e) | In addition to the fees and expenses which the Portfolio bears directly, it also indirectly bears a pro-rata share of the fees and expenses of the underlying funds in which it invests. Such indirect expenses are not included in the above expense ratios. |
| (f) | Without the custody fee reimbursement, net expenses would have been 0.65%. |
| | | | |
| 34 | | MainStay VP Floating Rate Portfolio | | The notes to the financial statements are an integral part of,
and should be read in conjunction with, the financial statements. |
Financial Highlights selected per share data and ratios
| | | | | | | | | | | | | | | | | | | | | | | | | | | | |
| | | |
| | | Six months
ended
June 30, | | | | | | Year ended December 31, | |
| | | | | | | |
| Service Class | | 2020* | | | | | | 2019 | | | 2018 | | | 2017 | | | 2016 | | | 2015 | |
| | | | | | | |
Net asset value at beginning of period | | $ | 8.94 | | | | | | | $ | 8.67 | | | $ | 9.09 | | | $ | 9.12 | | | $ | 8.75 | | | $ | 9.06 | |
| | | | | | | | | | �� | | | | | | | | | | | | | | | | | | |
| | | | | | | |
Net investment income (loss) (a) | | | 0.16 | | | | | | | | 0.42 | | | | 0.41 | | | | 0.36 | | | | 0.33 | | | | 0.33 | |
| | | | | | | |
Net realized and unrealized gain (loss) on investments | | | (0.57 | ) | | | | | | | 0.27 | | | | (0.42 | ) | | | (0.03 | ) | | | 0.37 | | | | (0.31 | ) |
| | | | | | | | | | | | | | | | | | | | | | | | | | | | |
| | | | | | | |
Total from investment operations | | | (0.41 | ) | | | | | | | 0.69 | | | | (0.01 | ) | | | 0.33 | | | | 0.70 | | | | 0.02 | |
| | | | | | | | | | | | | | | | | | | | | | | | | | | | |
|
| Less distributions: | |
| | | | | | | |
From net investment income | | | (0.16 | ) | | | | | | | (0.42 | ) | | | (0.41 | ) | | | (0.36 | ) | | | (0.33 | ) | | | (0.33 | ) |
| | | | | | | | | | | | | | | | | | | | | | | | | | | | |
| | | | | | | |
Net asset value at end of period | | $ | 8.37 | | | | | | | $ | 8.94 | | | $ | 8.67 | | | $ | 9.09 | | | $ | 9.12 | | | $ | 8.75 | |
| | | | | | | | | | | | | | | | | | | | | | | | | | | | |
| | | | | | | |
Total investment return (b) | | | (4.51 | %) | | | | | | | 8.19 | % | | | (0.25 | %)(c) | | | 3.71 | % | | | 8.18 | % | | | 0.14 | % |
|
| Ratios (to average net assets)/Supplemental Data: | |
| | | | | | | |
Net investment income (loss) | | | 3.87 | % †† | | | | | | | 4.73 | % | | | 4.52 | % | | | 3.96 | % | | | 3.68 | %(d) | | | 3.63 | % |
| | | | | | | |
Net expenses (e) | | | 0.90 | % †† | | | | | | | 0.90 | % | | | 0.90 | % | | | 0.89 | % | | | 0.89 | %(f) | | | 0.89 | % |
| | | | | | | |
Portfolio turnover rate | | | 11 | % | | | | | | | 35 | % | | | 29 | % | | | 52 | % | | | 36 | % | | | 35 | % |
| | | | | | | |
Net assets at end of period (in 000’s) | | $ | 494,407 | | | | | | | $ | 579,419 | | | $ | 611,492 | | | $ | 581,596 | | | $ | 582,341 | | | $ | 565,278 | |
| (a) | Per share data based on average shares outstanding during the period. |
| (b) | Total return does not reflect any deduction of sales charges, mortality and expense charges, contract charges or administrative charges. For periods of less than one year, total return is not annualized. |
| (c) | Total investment return may reflect adjustments to conform to generally accepted accounting principles. |
| (d) | Without the custody fee reimbursement, net investment income (loss) would have been 3.67%. |
| (e) | In addition to the fees and expenses which the Portfolio bears directly, it also indirectly bears a pro-rata share of the fees and expenses of the underlying funds in which it invests. Such indirect expenses are not included in the above expense ratios. |
| (f) | Without the custody fee reimbursement, net expenses would have been 0.90%. |
| | | | | | |
The notes to the financial statements are an integral part of,
and should be read in conjunction with, the financial statements. | | | | | 35 | |
Notes to Financial Statements (Unaudited)
Note 1–Organization and Business
MainStay VP Funds Trust (the “Fund”) was organized as a Delaware statutory trust on February 1, 2011. The Fund is registered under the Investment Company Act of 1940, as amended (the “1940 Act”), as an open-end management investment company. The Fund is comprised of thirty-one separate series (collectively referred to as the “Portfolios”). These financial statements and notes relate to the MainStay VP Floating Rate Portfolio (the “Portfolio”), a “non-diversified” portfolio, as that term is defined in the 1940 Act, as interpreted or modified by regulatory authorities having jurisdiction, from time to time. Since the Portfolio has historically operated as a “diversified” portfolio, it will not operate as “non-diversified” without first obtaining shareholder approval.
Shares of the Portfolio are currently offered to certain separate accounts to fund variable annuity policies and variable universal life insurance policies issued by New York Life Insurance and Annuity Corporation (“NYLIAC”), a wholly-owned subsidiary of New York Life Insurance Company (“New York Life”) and may also be offered to fund variable annuity policies and variable universal life insurance policies issued by other insurance companies. NYLIAC allocates shares of the Portfolios to, among others, certain NYLIAC separate accounts. Shares of the Portfolio are also offered to the MainStay VP Conservative Allocation Portfolio, MainStay VP Moderate Allocation Portfolio, MainStay VP Moderate Growth Allocation Portfolio and MainStay VP Growth Allocation Portfolio, which operate as “funds-of-funds,” and other variable insurance funds.
The Portfolio currently offers two classes of shares. Initial Class and Service Class shares commenced operations on May 2, 2005. Shares of the Portfolio are sold and are redeemed at a price equal to their respective net asset value (“NAV”) per share. No sales or redemption charge is applicable to the purchase or redemption of the Portfolio’s shares. Under the terms of the Fund’s multiple class plan adopted pursuant to Rule 18f-3 under the 1940 Act, the classes differ in that, among other things, Service Class shares of the Portfolio pay a combined distribution and service fee of 0.25% of average daily net assets attributable to Service Class shares of the Portfolio to the Distributor (as defined in Note 3(B)) pursuant to a plan adopted in accordance with Rule 12b-1 under the 1940 Act. Contract owners of variable annuity contracts purchased after June 2, 2003, are permitted to invest only in the Service Class shares.
The Portfolio’s investment objective is to seek high current income.
Note 2–Significant Accounting Policies
The Portfolio is an investment company and accordingly follows the investment company accounting and reporting guidance of the Financial Accounting Standards Board (“FASB”) Accounting Standard Codification Topic 946 Financial Services – Investment Companies. The Portfolio prepares its financial statements in accordance with generally accepted accounting principles (“GAAP”) in the United States of America and follows the significant accounting policies described below.
(A) Securities Valuation. Investments are usually valued as of the close of regular trading on the New York Stock Exchange (the “Exchange”) (usually 4:00 p.m. Eastern time) on each day the Portfolio is open for business (“valuation date”).
The Board of Trustees of the Fund (the “Board”) adopted procedures establishing methodologies for the valuation of the Portfolio’s securities
and other assets and delegated the responsibility for valuation determinations under those procedures to the Valuation Committee of the Fund (the “Valuation Committee”). The procedures state that, subject to the oversight of the Board and unless otherwise noted, the responsibility for the day-to-day valuation of portfolio assets (including fair value measurements for the Portfolio’s assets and liabilities) rests with New York Life Investment Management LLC (“New York Life Investments” or the “Manager”), aided to whatever extent necessary by the Subadvisor (as defined in Note 3(A)). To assess the appropriateness of security valuations, the Manager, the Subadvisor or the Portfolio’s third-party service provider, who is subject to oversight by the Manager, regularly compares prior day prices, prices on comparable securities and the sale prices to the prior and current day prices and challenges prices with changes exceeding certain tolerance levels with third-party pricing services or broker sources.
The Board authorized the Valuation Committee to appoint a Valuation Subcommittee (the “Subcommittee”) to establish the prices of securities for which market quotations are not readily available or the prices of which are not otherwise readily determinable under the procedures. The Subcommittee meets (in person, via electronic mail or via teleconference) on an as-needed basis. The Valuation Committee meets to ensure that actions taken by the Subcommittee were appropriate.
For those securities valued through either a standardized fair valuation methodology or a fair valuation measurement, the Subcommittee deals with such valuation and the Valuation Committee reviews and affirms, if appropriate, the reasonableness of the valuation based on such methodologies and measurements on a regular basis after considering information that is reasonably available and deemed relevant by the Valuation Committee. Any action taken by the Subcommittee with respect to the valuation of a portfolio security or other asset is submitted for review and ratification (if appropriate) to the Valuation Committee and the Board at the next regularly scheduled meeting.
“Fair value” is defined as the price the Portfolio would reasonably expect to receive upon selling an asset or liability in an orderly transaction to an independent buyer in the principal or most advantageous market for the asset or liability. Fair value measurements are determined within a framework that establishes a three-tier hierarchy that maximizes the use of observable market data and minimizes the use of unobservable inputs to establish a classification of fair value measurements for disclosure purposes. “Inputs” refer broadly to the assumptions that market participants would use in pricing the asset or liability, including assumptions about risk, such as the risk inherent in a particular valuation technique used to measure fair value using a pricing model and/or the risk inherent in the inputs for the valuation technique. Inputs may be observable or unobservable. Observable inputs reflect the assumptions market participants would use in pricing the asset or liability based on market data obtained from sources independent of the Portfolio. Unobservable inputs reflect the Portfolio’s own assumptions about the assumptions market participants would use in pricing the asset or liability based on the information available. The inputs or methodology used for valuing assets or liabilities may not be an indication of the risks associated with investing in those assets or liabilities. The three-tier hierarchy of inputs is summarized below.
| • | | Level 1—quoted prices in active markets for an identical asset or liability |
| | |
| 36 | | MainStay VP Floating Rate Portfolio |
| • | | Level 2—other significant observable inputs (including quoted prices for a similar asset or liability in active markets, interest rates and yield curves, prepayment speeds, credit risk, etc.) |
| • | | Level 3—significant unobservable inputs (including the Portfolio’s own assumptions about the assumptions that market participants would use in measuring fair value of an asset or liability) |
The level of an asset or liability within the fair value hierarchy is based on the lowest level of an input, both individually and in the aggregate, that is significant to the fair value measurement. The aggregate value by input level of the Portfolio’s assets and liabilities as of June 30, 2020 is included at the end of the Portfolio of Investments.
The Portfolio may use third-party vendor evaluations, whose prices may be derived from one or more of the following standard inputs, among others:
| | |
• Benchmark yields | | • Reported trades |
• Broker/dealer quotes | | • Issuer spreads |
• Two-sided markets | | • Benchmark securities |
• Bids/offers | | • Reference data (corporate actions or material event notices) |
• Industry and economic events | | • Comparable bonds |
• Monthly payment information | | |
An asset or liability for which market values cannot be measured using the methodologies described above is valued by methods deemed reasonable in good faith by the Valuation Committee, following the procedures established by the Board, to represent fair value. Under these procedures, the Portfolio generally uses a market-based approach which may use related or comparable assets or liabilities, recent transactions, market multiples, book values and other relevant information. The Portfolio may also use an income-based valuation approach in which the anticipated future cash flows of the asset or liability are discounted to calculate fair value. Discounts may also be applied due to the nature and/or duration of any restrictions on the disposition of the asset or liability. Fair value represents a good faith approximation of the value of a security. Fair value determinations involve the consideration of a number of subjective factors, an analysis of applicable facts and circumstances and the exercise of judgment. As a result, it is possible that the fair value for a security determined in good faith in accordance with the Portfolio’s valuation procedures may differ from valuations for the same security determined by other funds using their own valuation procedures. Although the Portfolio’s valuation procedures are designed to value a security at the price the Portfolio may reasonably expect to receive upon the security’s sale in an orderly transaction, there can be no assurance that any fair value determination thereunder would, in fact, approximate the amount that the Portfolio would actually realize upon the sale of the security or the price at which the security would trade if a reliable market price were readily available. During the six-month period ended June 30, 2020, there were no material changes to the fair value methodologies.
Securities which may be valued in this manner include, but are not limited to: (i) a security for which trading has been halted or suspended; (ii) a debt security that has recently gone into default and for which there is not a current market quotation; (iii) a security of an issuer that has entered into a restructuring; (iv) a security that has been delisted
from a national exchange; (v) a security for which the market price is not readily available from a third-party pricing source or, if so provided, does not, in the opinion of the Manager or the Subadvisor, reflect the security’s market value; (vi) a security subject to trading collars for which no or limited trading takes place; and (vii) a security whose principal market has been temporarily closed at a time when, under normal conditions, it would be open. Securities valued in this manner are generally categorized as Level 3 in the hierarchy. As of June 30, 2020, securities that were fair valued in such a manner are shown in the Portfolio of Investments.
Equity securities, including rights, warrants and exchange-traded funds (“ETFs”), are valued at the last quoted sales prices as of the close of regular trading on the relevant exchange on each valuation date. Securities that are not traded on the valuation date are valued at the mean of the last quoted bid and ask prices. Prices are normally taken from the principal market in which each security trades. These securities are generally categorized as Level 1 in the hierarchy.
Investments in mutual funds, including money market funds, are valued at their respective NAVs as of the close of the Exchange on the valuation date. These securities are generally categorized as Level 1 in the hierarchy.
Debt securities (other than convertible and municipal bonds) are valued at the evaluated bid prices (evaluated mean prices in the case of convertible and municipal bonds) supplied by a pricing agent or broker selected by the Manager, in consultation with the Subadvisor. The evaluations are market-based measurements processed through a pricing application and represents the pricing agent’s good faith determination as to what a holder may receive in an orderly transaction under market conditions. The rules based logic utilizes valuation techniques that reflect participants’ assumptions and vary by asset class and per methodology, maximizing the use of relevant observable data including quoted prices for similar assets, benchmark yield curves and market corroborated inputs. The evaluated bid or mean prices are deemed by the Manager, in consultation with the Subadvisor, to be representative of market values at the regular close of trading of the Exchange on each valuation date. Debt securities purchased on a delayed delivery basis are marked to market daily until settlement at the forward settlement date. Debt securities, including corporate bonds, U.S. government and federal agency bonds, municipal bonds, foreign bonds, convertible bonds, asset-backed securities and mortgage-backed securities are generally categorized as Level 2 in the hierarchy.
Loan assignments, participations and commitments are valued at the average of bid quotations obtained from the engaged independent pricing service and are generally categorized as Level 2 in the hierarchy. Certain loan assignments, participations and commitments may be valued by utilizing significant unobservable inputs obtained from the pricing service and are generally categorized as Level 3 in the hierarchy.
Temporary cash investments acquired in excess of 60 days to maturity at the time of purchase are valued using the latest bid prices or using valuations based on a matrix system (which considers such factors as security prices, yields, maturities and ratings), both as furnished by independent pricing services. Temporary cash investments that mature in 60 days or less at the time of purchase (“Short-Term Investments”) are valued using the amortized cost method of valuation, unless the use
Notes to Financial Statements (Unaudited) (continued)
of such method would be inappropriate. The amortized cost method involves valuing a security at its cost on the date of purchase and thereafter assuming a constant amortization to maturity of the difference between such cost and the value on maturity date. Amortized cost approximates the current fair value of a security. Securities valued using the amortized cost method are not valued using quoted prices in an active market and are generally categorized as Level 2 in the hierarchy.
The information above is not intended to reflect an exhaustive list of the methodologies that may be used to value portfolio investments. The valuation procedures permit the use of a variety of valuation methodologies in connection with valuing portfolio investments. The methodology used for a specific type of investment may vary based on the market data available or other considerations. The methodologies summarized above may not represent the specific means by which portfolio investments are valued on any particular business day.
A portfolio investment may be classified as an illiquid investment under the Portfolio’s written liquidity risk management program and related procedures (“Liquidity Program”). Illiquidity of an investment might prevent the sale of such investment at a time when the Manager or the Subadvisor might wish to sell, and these investments could have the effect of decreasing the overall level of the Portfolio’s liquidity. Further, the lack of an established secondary market may make it more difficult to value illiquid investments, requiring the Portfolio to rely on judgments that may be somewhat subjective in measuring value, which could vary materially from the amount that the Portfolio could realize upon disposition. Difficulty in selling illiquid investments may result in a loss or may be costly to the Portfolio. An illiquid investment is any investment that the Manager or Subadvisor reasonably expects cannot be sold or disposed of in current market conditions in seven calendar days or less without the sale or disposition significantly changing the market value of the investment. The liquidity classification of each investment will be made using information obtained after reasonable inquiry and taking into account, among other things, relevant market, trading and investment-specific considerations in accordance with the Liquidity Program. Illiquid investments are often valued in accordance with methods deemed by the Board in good faith to be reasonable and appropriate to accurately reflect their fair value. The liquidity of the Portfolio’s investments, as shown in the Portfolio of Investments, was determined as of June 30, 2020, and can change at any time. Illiquid investments as of June 30, 2020, are shown in the Portfolio of Investments.
(B) Income Taxes. The Portfolio’s policy is to comply with the requirements of the Internal Revenue Code of 1986, as amended (the “Internal Revenue Code”), applicable to regulated investment companies and to distribute all of its taxable income to the shareholders of the Portfolio within the allowable time limits.
The Manager evaluates the Portfolio’s tax positions to determine if the tax positions taken meet the minimum recognition threshold in connection with accounting for uncertainties in income tax positions taken or expected to be taken for the purposes of measuring and recognizing tax liabilities in the financial statements. Recognition of tax benefits of an uncertain tax position is permitted only to the extent the position is “more likely than not” to be sustained assuming examination by taxing authorities. The Manager analyzed the Portfolio’s tax positions taken on federal, state and local income tax returns for all open tax years (for up to three tax years) and has concluded that no provisions for federal,
state and local income tax are required in the Portfolio’s financial statements. The Portfolio’s federal, state and local income tax and federal excise tax returns for tax years for which the applicable statutes of limitations have not expired are subject to examination by the Internal Revenue Service and state and local departments of revenue.
(C) Dividends and Distributions to Shareholders. Dividends and distributions are recorded on the ex-dividend date. The Portfolio intends to declare dividends from net investment income, if any, daily and intends to pay them at least monthly and pays distributions from net realized capital and currency gains, if any, at least annually. Unless a shareholder elects otherwise, all dividends and distributions are reinvested at NAV in the same class of shares of the Portfolio. Dividends and distributions to shareholders are determined in accordance with federal income tax regulations and may differ from determinations using GAAP.
(D) Security Transactions and Investment Income. The Portfolio records security transactions on the trade date. Realized gains and losses on security transactions are determined using the identified cost method. Dividend income is recognized on the ex-dividend date, net of any foreign tax withheld at the source, and interest income is accrued as earned using the effective interest rate method. Distributions received from real estate investment trusts may be classified as dividends, capital gains and/or return of capital. Discounts and premiums on securities purchased for the Portfolio are accreted and amortized, respectively, on the effective interest rate method.
Investment income and realized and unrealized gains and losses on investments of the Portfolio are allocated pro rata to the separate classes of shares based upon their relative net assets on the date the income is earned or realized and unrealized gains and losses are incurred.
The Portfolio may place a debt security on non-accrual status and reduce related interest income by ceasing current accruals and writing off all or a portion of any interest receivables when the collection of all or a portion of such interest has become doubtful. A debt security is removed from non-accrual status when the issuer resumes interest payments or when collectability of interest is reasonably assured.
(E) Expenses. Expenses of the Fund are allocated to the individual Portfolios in proportion to the net assets of the respective Portfolios when the expenses are incurred, except where direct allocations of expenses can be made. Expenses (other than fees incurred under the distribution and service plans, further discussed in Note 3(B), which are charged directly to the Service Class shares) are allocated to separate classes of shares pro rata based upon their relative net assets on the date the expenses are incurred. The expenses borne by the Portfolio, including those of related parties to the Portfolio, are shown in the Statement of Operations.
Additionally, the Portfolio may invest in exchange-traded funds (“ETFs”) and mutual funds, which are subject to management fees and other fees that may cause the costs of investing in ETFs and mutual funds to be greater than the costs of owning the underlying securities directly. These indirect expenses of ETFs and mutual funds are not included in the amounts shown as expenses in the Portfolio’s Statement of Operations or in the expense ratios included in the Financial Highlights.
| | |
| 38 | | MainStay VP Floating Rate Portfolio |
(F) Use of Estimates. In preparing financial statements in conformity with GAAP, the Manager makes estimates and assumptions that affect the reported amounts and disclosures in the financial statements. Actual results could differ from those estimates.
(G) Repurchase Agreements. The Portfolio may enter into repurchase agreements (i.e., buy a security from another party with the agreement that it will be sold back in the future) to earn income. The Portfolio may enter into repurchase agreements only with counterparties, usually financial institutions, that are deemed by the Manager or the Subadvisor to be creditworthy, pursuant to guidelines established by the Board. During the term of any repurchase agreement, the Manager or the Subadvisor will continue to monitor the creditworthiness of the counterparty. Under the 1940 Act, repurchase agreements are considered to be collateralized loans by the Portfolio to the counterparty secured by the securities transferred to the Portfolio.
Repurchase agreements are subject to counterparty risk, meaning the Portfolio could lose money by the counterparty’s failure to perform under the terms of the agreement. The Portfolio mitigates this risk by ensuring the repurchase agreement is collateralized by cash, U.S. government securities, fixed income securities and/or other securities. The collateral is held by the Portfolio’s custodian and valued daily on a mark to market basis to determine if the value, including accrued interest, exceeds the repurchase price. In the event of the counterparty’s default on the obligation to repurchase, the Portfolio has the right to liquidate the collateral and apply the proceeds in satisfaction of the obligation. Under certain circumstances, such as in the event of default or bankruptcy by the counterparty, realization and/or retention of the collateral may be limited or subject to delay, to legal proceedings and possible realized loss to the Portfolio. Repurchase agreements as of June 30, 2020, are shown in the Portfolio of Investments.
(H) Rights and Warrants. Rights are certificates that permit the holder to purchase a certain number of shares, or a fractional share, of a new stock from the issuer at a specific price. Warrants are instruments that entitle the holder to buy an equity security at a specific price for a specific period of time. These investments can provide a greater potential for profit or loss than an equivalent investment in the underlying security. Prices of these investments do not necessarily move in tandem with the prices of the underlying securities.
There is risk involved in the purchase of rights and warrants in that these investments are speculative investments. The Portfolio could also lose the entire value of its investment in warrants if such warrants are not exercised by the date of its expiration. The Portfolio is exposed to risk until the sale or exercise of each right or warrant is completed. As of June 30, 2020, rights and warrants are shown in the Portfolio of Investments.
(I) Loan Assignments, Participations and Commitments. The Portfolio primarily invests in loan assignments and participations (“loans”). Commitments are agreements to make money available to a borrower in a specified amount, at a specified rate and within a specified time. The Portfolio records an investment when the borrower withdraws money on a commitment or when a funded loan is purchased (trade date) and records interest as earned. These loans pay interest at rates that are periodically reset by reference to a base
lending rate plus a spread. These base lending rates are generally the prime rate offered by a designated U.S. bank or the London Interbank Offered Rate (“LIBOR”).
The loans in which the Portfolio invests are generally readily marketable, but may be subject to some restrictions on resale. For example, the Portfolio may be contractually obligated to receive approval from the agent bank and/or borrower prior to the sale of these investments. If the Portfolio purchases an assignment from a lender, the Portfolio will generally have direct contractual rights against the borrower in favor of the lender. If the Portfolio purchases a participation interest either from a lender or a participant, the Portfolio typically will have established a direct contractual relationship with the seller of the participation interest, but not with the borrower. Consequently, the Portfolio is subject to the credit risk of the lender or participant who sold the participation interest to the Portfolio, in addition to the usual credit risk of the borrower. In the event that the borrower, selling participant or intermediate participants become insolvent or enter into bankruptcy, the Portfolio may incur certain costs and delays in realizing payment, or may suffer a loss of principal and/or interest.
Unfunded commitments represent the remaining obligation of the Portfolio to the borrower. At any point in time, up to the maturity date of the issue, the borrower may demand the unfunded portion. Unfunded amounts, if any, are marked to market and any unrealized gains or losses are recorded in the Statement of Assets and Liabilities. As of June 30, 2020, the Portfolio held unfunded commitments. (See Note 5)
(J) Securities Lending. In order to realize additional income, the Portfolio may engage in securities lending, subject to the limitations set forth in the 1940 Act and relevant guidance by the staff of the Securities and Exchange Commission (“SEC”). If the Portfolio engages in securities lending, the Portfolio will lend through its custodian, currently State Street Bank and Trust Company (“State Street”), acting as securities lending agent on behalf of the Portfolio. Under the current arrangement, State Street will manage the Portfolio’s collateral in accordance with the securities lending agency agreement between the Portfolio and State Street, and indemnify the Portfolio against counterparty risk. The loans will be collateralized by cash (which may be invested in a money market fund) and/or non-cash collateral (which may include U.S. Treasury securities and/or U.S. government agency securities issued or guaranteed by the United States government or its agencies or instrumentalities) at least equal at all times to the market value of the securities loaned. The Portfolio bears the risk of delay in recovery of, or loss of rights in, the securities loaned. The Portfolio may also record a realized gain or loss on securities deemed sold due to a borrower’s inability to return securities on loan. The Portfolio bears the risk of any loss on investment of cash collateral. The Portfolio will receive compensation for lending its securities in the form of fees or it will retain a portion of interest earned on the investment of any cash collateral. The Portfolio will also continue to receive interest and dividends on the securities loaned and any gain or loss in the market price of the securities loaned that may occur during the term of the loan will be for the account of the Portfolio. Income earned from securities lending activities, if any, is reflected in the Statement of Operations. As of June 30, 2020, the Portfolio did not have any portfolio securities on loan.
(K) Debt Securities Risk. The ability of issuers of debt securities held by the Portfolio to meet their obligations may be affected by,
Notes to Financial Statements (Unaudited) (continued)
among other things, economic or political developments in a specific country, industry or region. Debt securities are also subject to the risks associated with changes in interest rates.
The Portfolio’s principal investments include floating rate loans, which are usually rated below investment grade and are generally considered speculative because they present a greater risk of loss, including default, than higher rated debt securities. These investments pay investors a higher interest rate than investment grade debt securities because of the increased risk of loss. Although certain floating rate loans are collateralized, there is no guarantee that the value of the collateral will be sufficient to repay the loan. In a recession or serious credit event, the value of these investments could decline significantly. As a result, the Portfolio’s NAVs could decrease and you could lose money.
In addition, floating rate loans generally are subject to extended settlement periods that may be longer than seven days. As a result, the Portfolio may be adversely affected by selling other investments at an unfavorable time and/or under unfavorable conditions or engaging in borrowing transactions, such as borrowing against its credit facility, to raise cash to meet redemption obligations or pursue other investment opportunities. In certain circumstances, floating rate loans may not be deemed to be securities. As a result, the Portfolio may not have the protection of the anti-fraud provisions of the federal securities laws. In such cases, the Portfolio generally must rely on the contractual provisions in the loan agreement and common-law fraud protections under applicable state law.
The Portfolio may invest in foreign debt securities, which carry certain risks that are in addition to the usual risks inherent in domestic debt securities. These risks include those resulting from currency fluctuations, future adverse political or economic developments and possible imposition of currency exchange blockages or other foreign governmental laws or restrictions. These risks are likely to be greater in emerging markets than in developed markets.
(L) LIBOR Replacement Risk. The Portfolio may invest in certain debt securities, derivatives or other financial instruments that utilize the London Interbank Offered Rate (“LIBOR”), as a “benchmark” or “reference rate” for various interest rate calculations. The United Kingdom Financial Conduct Authority, which regulates LIBOR, announced that after 2021 it will cease its active encouragement of banks to provide the quotations needed to sustain LIBOR. As a result, it is anticipated that LIBOR will be discontinued or will no longer be sufficiently robust to be representative of its underlying market around that time. Although financial regulators and industry working groups have suggested alternative reference rates, such as the European Interbank Offer Rate (“EURIBOR”), Sterling Overnight Interbank Average Rate (“SONIA”) and Secured Overnight Financing Rate (“SOFR”), there are challenges to converting certain contracts and transactions to a new benchmark and neither the full effects of the transition process nor its ultimate outcome is known.
The elimination of LIBOR or changes to other reference rates or any other changes or reforms to the determination or supervision of reference rates could have an adverse impact on the market for, or value of, any securities or payments linked to those reference rates, which may adversely affect the Portfolio’s performance and/or net asset value. Uncertainty and risk also remain regarding the willingness and ability of
issuers and lenders to include revised provisions in new and existing contracts or instruments. Consequently, the transition away from LIBOR to other reference rates may lead to increased volatility and illiquidity in markets that are tied to LIBOR, fluctuations in values of LIBOR-related investments or investments in issuers that utilize LIBOR, increased difficulty in borrowing or refinancing and diminished effectiveness of hedging strategies, adversely affecting the Portfolio’s performance. Furthermore, the risks associated with the expected discontinuation of LIBOR and transition may be exacerbated if the work necessary to effect an orderly transition to an alternative reference rate is not completed in a timely manner. Because the usefulness of LIBOR as a benchmark could deteriorate during the transition period, these effects could occur prior to the end of 2021.
(M) Indemnifications. Under the Fund’s organizational documents, its officers and trustees are indemnified against certain liabilities that may arise out of performance of their duties to the Fund. Additionally, in the normal course of business, the Portfolio enters into contracts with third-party service providers that contain a variety of representations and warranties and that may provide general indemnifications. The Portfolio’s maximum exposure under these arrangements is unknown, as this would involve future claims that may be made against the Portfolio that have not yet occurred. The Manager believes that the risk of loss in connection with these potential indemnification obligations is remote. However, there can be no assurance that material liabilities related to such obligations will not arise in the future, which could adversely impact the Portfolio.
Note 3–Fees and Related Party Transactions
(A) Manager and Subadvisor. New York Life Investments, a registered investment adviser and an indirect, wholly-owned subsidiary of New York Life, serves as the Portfolio’s Manager, pursuant to an Amended and Restated Management Agreement (“Management Agreement”). The Manager provides offices, conducts clerical, recordkeeping and bookkeeping services and keeps most of the financial and accounting records required to be maintained by the Portfolio. Except for the portion of salaries and expenses that are the responsibility of the Portfolio, the Manager pays the salaries and expenses of all personnel affiliated with the Portfolio and certain operational expenses of the Portfolio. The Portfolio reimburses New York Life Investments in an amount equal to the portion of the compensation of the Chief Compliance Officer attributable to the Portfolio. NYL Investors LLC (“NYL Investors” or the ‘‘Subadvisor’’), a registered investment adviser and a direct, wholly-owned subsidiary of New York Life, serves as Subadvisor to the Portfolio and is responsible for the day-to-day portfolio management of the Portfolio. Pursuant to the terms of a Subadvisory Agreement (“Subadvisory Agreement”) between New York Life Investments and NYL Investors, New York Life Investments pays for the services of the Subadvisor.
The Fund, on behalf of the Portfolio, pays New York Life Investments in its capacity as the Portfolio’s investment manager and administrator, pursuant to the Management Agreement, a monthly fee for the services performed and the facilities furnished at an annual rate of average daily net assets as follows: 0.60% up to $1 billion; 0.575% from $1 billion to $3 billion; and 0.565% in excess of $3 billion. During the six-month period ended June 30, 2020, the effective management fee rate was 0.60%.
| | |
| 40 | | MainStay VP Floating Rate Portfolio |
During the six-month period ended June 30, 2020, New York Life Investments earned fees from the Portfolio in the amount of $2,097,243 and paid the Subadvisor in the amount of $1,048,621.
State Street provides sub-administration and sub-accounting services to the Portfolio pursuant to an agreement with New York Life Investments. These services include calculating the daily NAVs of the Portfolio, maintaining the general ledger and sub-ledger accounts for the calculation of the Portfolio’s NAVs and assisting New York Life Investments in conducting various aspects of the Portfolio’s administrative operations. For providing these services to the Portfolio, State Street is compensated by New York Life Investments.
Pursuant to an agreement between the Fund and New York Life Investments, New York Life Investments is responsible for providing or procuring certain regulatory reporting services for the Portfolio. The
Portfolio will reimburse New York Life Investments for the actual costs incurred by New York Life Investments in connection with providing or procuring these services for the Portfolio.
(B) Distribution and Service Fees. The Fund, on behalf of the Portfolio, has entered into a distribution agreement with NYLIFE Distributors LLC (the “Distributor”), an indirect, wholly-owned subsidiary of New York Life. The Portfolio has adopted a distribution plan (the “Plan”) in accordance with the provisions of Rule 12b-1 under the 1940 Act. Under the Plan, the Distributor has agreed to provide, through its affiliates or independent third parties, various distribution-related, shareholder and administrative support services to the Service Class shareholders. For its services, the Distributor is entitled to a combined distribution and service fee accrued daily and paid monthly at an annual rate of 0.25% of the average daily net assets attributable to the Service Class shares of the Portfolio.
(C) Investments in Affiliates (in 000’s). During the six-month period ended June 30, 2020, purchases and sales transactions, income earned from investments and shares held of investment companies managed by New York Life Investments or its affiliates were as follows:
| | | | | | | | | | | | | | | | | | | | | | | | | | | | | | | | | | | | |
Affiliated Investment Company | | Value,
Beginning
of Period | | | Purchases
at Cost | | | Proceeds from
Sales | | | Net Realized
Gain/(Loss)
on Sales | | | Change in
Unrealized
Appreciation/
(Depreciation) | | | Value,
End
of Period | | | Dividend
Income | | | Other
Distributions | | | Shares
End of
Period | |
MainStay MacKay High Yield Corporate Bond Fund Class I | | $ | 5,795 | | | $ | — | | | $ | (2,999 | ) | | $ | (313 | ) | | $ | (182 | ) | | $ | 2,301 | | | $ | 105 | | | $ | — | | | | 437 | |
Note 4–Federal Income Tax
As of June 30, 2020, the cost and unrealized appreciation (depreciation) of the Portfolio’s investment portfolio, including applicable derivative contracts and other financial instruments, as determined on a federal income tax basis, was as follows:
| | | | | | | | | | | | | | | | |
| | | Federal Tax
Cost | | | Gross
Unrealized
Appreciation | | | Gross
Unrealized
(Depreciation) | | | Net
Unrealized
Appreciation/
(Depreciation) | |
| | | | |
Investments in Securities | | $ | 702,087,484 | | | $ | 659,378 | | | $ | (50,356,100 | ) | | $ | (49,696,722 | ) |
As of December 31, 2019, for federal income tax purposes, capital loss carryforwards of $25,206,001, as shown in the table below, were available to the extent provided by the regulations to offset future realized gains of the Portfolio through the years indicated. Accordingly, no capital gains distributions are expected to be paid to shareholders until net gains have been realized in excess of such amounts.
| | | | |
Capital Loss
Available Through | | Short-Term
Capital Loss
Amounts (000’s) | | Long-Term
Capital Loss
Amounts (000’s) |
| | |
| Unlimited | | $527 | | $24,679 |
During the year ended December 31, 2019, the tax character of distributions paid as reflected in the Statements of Changes in Net Assets was as follows:
| | |
|
| 2019 |
Tax-Based
Distributions from Ordinary
Income | | Tax-Based
Distributions from Long-Term
Gains |
| |
| $40,201,261 | | $— |
Note 5–Commitments and Contingencies
As of June 30, 2020, the Portfolio held unfunded commitments pursuant to the following loan agreements:
| | | | | | | | |
Borrower | | Unfunded
Commitments | | | Unrealized Appreciation/
(Depreciation) | |
Intelsat Jackson Holdings S.A
Delayed Draw Term Loan
5.05%, due 7/14/21 | | $ | 120,763 | | | $ | 1,610 | |
Note 6–Custodian
State Street is the custodian of cash and securities held by the Portfolio. Custodial fees are charged to the Portfolio based on the Portfolio’s net assets and/or the market value of securities held by the Portfolio and the number of certain transactions incurred by the Portfolio.
Notes to Financial Statements (Unaudited) (continued)
Note 7–Line of Credit
The Portfolio and certain other funds managed by New York Life Investments maintain a line of credit with a syndicate of banks in order to secure a source of funds for temporary purposes to meet unanticipated or excessive redemption requests.
Effective July 28, 2020, under the credit agreement (the “Credit Agreement”), the aggregate commitment amount is $600,000,000 with an additional uncommitted amount of $100,000,000. The commitment fee is an annual rate of 0.15% of the average commitment amount payable quarterly, regardless of usage, to JP Morgan Chase Bank NA, who serves as the agent to the syndicate. The commitment fee is allocated among the Portfolio and certain other funds managed by New York Life Investments based upon their respective net assets and other factors. Interest on any revolving credit loan is charged based upon the Federal Funds Rate or the one-month LIBOR, whichever is higher. The Credit Agreement expires on July 27, 2021, although the Portfolio, certain other funds managed by New York Life Investments and the syndicate of banks may renew the Credit Agreement for an additional year on the same or different terms or enter into a credit agreement with a different syndicate of banks. Prior to July 28, 2020, the aggregate commitment amount and the commitment fee were the same as those under the current Credit Agreement, but State Street served as agent to the syndicate. As of June 30, 2020, there were no borrowings outstanding with respect to the Portfolio under the Credit Agreement or the credit agreement for which State Street served as agent.
Note 8–Interfund Lending Program
Pursuant to an exemptive order issued by the SEC, the Portfolio, along with certain other funds managed by New York Life Investments, may participate in an interfund lending program. The interfund lending program provides an alternative credit facility that permits the Portfolio and certain other funds managed by New York Life Investments to lend or borrow money for temporary purposes directly to or from one another subject to the conditions of the exemptive order. During the six-month period ended June 30, 2020, there were no interfund loans made or outstanding with respect to the Portfolio.
Note 9–Purchases and Sales of Securities (in 000’s)
During the six-month period ended June 30, 2020, purchases and sales of securities, other than short-term securities, were $74,308 and $165,314, respectively.
Note 10–Capital Share Transactions
Transactions in capital shares for the six-month period ended June 30, 2020 and the year ended December 31, 2019, were as follows:
| | | | | | | | |
Initial Class | | Shares | | | Amount | |
| | |
Six-month period ended June 30, 2020: | | | | | | | | |
Shares sold | | | 674,495 | | | $ | 5,719,309 | |
Shares issued to shareholders in reinvestment of distributions | | | 446,277 | | | | 3,735,364 | |
Shares redeemed | | | (6,002,415 | ) | | | (49,135,885 | ) |
| | | | | | | | |
Net increase (decrease) | | | (4,881,643 | ) | | $ | (39,681,212 | ) |
| | | | | | | | |
| | |
Year ended December 31, 2019: | | | | | | | | |
Shares sold | | | 11,418,903 | | | $ | 101,545,387 | |
Shares issued to shareholders in reinvestment of distributions | | | 1,331,142 | | | | 11,829,405 | |
Shares redeemed | | | (11,353,655 | ) | | | (100,606,569 | ) |
| | | | | | | | |
Net increase (decrease) | �� | | 1,396,390 | | | $ | 12,768,223 | |
| | | | | | | | |
| | |
| | | | | | | | |
Service Class | | Shares | | | Amount | |
| | |
Six-month period ended June 30, 2020: | | | | | | | | |
Shares sold | | | 4,270,129 | | | $ | 36,066,296 | |
Shares issued to shareholders in reinvestment of distributions | | | 1,212,049 | | | | 10,159,333 | |
Shares redeemed | | | (11,249,757 | ) | | | (92,477,457 | ) |
| | | | | | | | |
Net increase (decrease) | | | (5,767,579 | ) | | $ | (46,251,828 | ) |
| | | | | | | | |
| | |
Year ended December 31, 2019: | | | | | | | | |
Shares sold | | | 9,297,982 | | | $ | 82,770,326 | |
Shares issued to shareholders in reinvestment of distributions | | | 3,188,963 | | | | 28,366,790 | |
Shares redeemed | | | (18,208,049 | ) | | | (161,892,318 | ) |
| | | | | | | | |
Net increase (decrease) | | | (5,721,104 | ) | | $ | (50,755,202 | ) |
| | | | | | | | |
Note 11–Recent Accounting Pronouncement
In March 2020, the Financial Accounting Standards Board (“FASB”) issued Accounting Standards Update 2020-04 (“ASU 2020-04”), which provides optional guidance to ease the potential accounting burden associated with transitioning away from LIBOR and other reference rates that are expected to be discontinued. ASU 2020-04 is effective immediately upon release of the update on March 12, 2020 through December 31, 2022. At this time, the Manager is evaluating the implications of certain other provisions of ASU 2020-04 related to new disclosure requirements and any impact on the financial statement disclosures has not yet been determined.
Note 12–Subsequent Events
In connection with the preparation of the financial statements of the Portfolio as of and for the six-month period ended June 30, 2020, events and transactions subsequent to June 30, 2020, through the date the financial statements were issued have been evaluated by the Manager, for possible adjustment and/or disclosure. No subsequent events requiring financial statement adjustment or disclosure have been identified.
| | |
| 42 | | MainStay VP Floating Rate Portfolio |
Note 13–Other Matters
An outbreak of COVID-19, first detected in December 2019, has developed into a global pandemic and has resulted in travel restrictions, closure of international borders, certain businesses and securities markets, restrictions on securities trading activities, prolonged quarantines, supply chain disruptions, and lower consumer demand, as well as general concern and uncertainty. The continued impact of COVID-19 is uncertain and could further adversely affect the global economy, national economies, individual issuers and capital markets in unforeseeable ways and result in a substantial and extended economic downturn. Developments that disrupt global economies and financial markets, such as COVID-19, may magnify factors that affect the Portfolio’s performance.
Discussion of the Operation and Effectiveness of the Portfolio’s Liquidity Risk
Management Program (Unaudited)
In compliance with Rule 22e-4 under the Investment Company Act of 1940, as amended (the “Liquidity Rule”), the Portfolio has adopted and implemented a liquidity risk management program (the “Program”), which New York Life Investment Management LLC believes is reasonably designed to assess and manage the Portfolio’s liquidity risk. The Board designated New York Life Investment Management LLC as administrator of the Program (the “Administrator”). The Administrator has established a Liquidity Risk Management Committee to assist the Administrator in the implementation and day-to-day administration of the Program and to otherwise support the Administrator in fulfilling its responsibilities under the Program.
At a meeting of the Board held on March 11, 2020, the Administrator provided the Board with a written report addressing the Program’s operation, adequacy and effectiveness of implementation for the period from December 1, 2018 through December 31, 2019, as required under the Liquidity Rule. The report noted that the Administrator concluded that (i) the Program operated effectively to assess and manage the Portfolio’s liquidity risk, (ii) the Program has been adequately and effectively implemented to monitor and, as applicable, respond to the Portfolio’s liquidity developments and (iii) the Portfolio’s investment strategy continues to be appropriate for an open-end portfolio.
In accordance with the Program, the Portfolio’s liquidity risk is assessed no less frequently than annually taking into consideration certain factors, as applicable, such as (i) investment strategy and liquidity of portfolio investments, (ii) short-term and long-term cash flow projections and (iii) holdings of cash and cash equivalents and borrowing arrangements and other funding sources. Certain factors are considered under both normal and reasonably foreseeable stressed conditions.
Each Portfolio portfolio investment is classified into one of four liquidity categories. The classification is based on a determination of the number of days it is reasonably expected to take to convert the investment into cash, or sell or dispose of the investment, in current market conditions without significantly changing the market value of the investment. The Administrator has delegated liquidity classification determinations to the Portfolio’s subadvisor, subject to appropriate oversight by the Administrator, and classification determinations are made by taking into account the Portfolio’s reasonably anticipated trade size, various market, trading and investment-specific considerations, as well as market depth, and, in certain cases, third-party vendor data.
The Liquidity Rule requires portfolios that do not primarily hold assets that are highly liquid investments to adopt a minimum amount of net assets that must be invested in highly liquid investments that are assets (an “HLIM”). In addition, the Liquidity Rule limits a portfolio’s investments in illiquid investments. Specifically, the Liquidity Rule prohibits acquisition of illiquid investments if doing so would result in a portfolio holding more than 15% of its net assets in illiquid investments that are assets. The Program includes provisions reasonably designed to determine, periodically review and comply with the HLIM requirement, as applicable, and to comply with the 15% limit on illiquid investments.
| | |
| 44 | | MainStay VP Floating Rate Portfolio |
Proxy Voting Policies and Procedures and Proxy Voting Record
A description of the policies and procedures that New York Life Investments uses to vote proxies related to the Portfolio’s securities is available free of charge upon request (i) by calling 800-598-2019; (ii) by visiting New York Life Investments’ website at https://www.nylinvestments.com/mainstay/products-and-performance/mainstay-vp-funds-trust; or (iii) by visiting the SEC’s website at www.sec.gov.
The Portfolio is required to file with the SEC its proxy voting record for the 12-month period ending June 30 on Form N-PX. The Portfolio’s most recent Form N-PX or proxy voting record is available free of charge upon request (i) by calling 800-598-2019; (ii) by visiting New York Life Investments’ website at https://www.nylinvestments.com/mainstay/products-and-performance/mainstay-vp-funds-trust; or (iii) by visiting the SEC’s website at www.sec.gov.
Shareholder Reports and Quarterly Portfolio Disclosure
The Portfolio is required to file its complete schedule of portfolio holdings with the SEC 60 days after its first and third fiscal quarter on Form N-PORT. The Portfolio’s holdings report is available free of charge upon request by calling 800-598-2019 or by visiting the SEC’s website at www.sec.gov.
MainStay VP Portfolios
MainStay VP offers a wide range of Portfolios. The full array of MainStay VP offerings is listed here, with information about the manager, subadvisors, legal counsel, and independent registered public accounting firm.
Equity Portfolios
MainStay VP Emerging Markets Equity Portfolio
MainStay VP Epoch U.S. Equity Yield Portfolio
MainStay VP Fidelity Institutional AM® Utilities Portfolio†
MainStay VP MacKay Common Stock Portfolio
MainStay VP MacKay Growth Portfolio
MainStay VP MacKay International Equity Portfolio
MainStay VP MacKay Mid Cap Core Portfolio
MainStay VP MacKay S&P 500 Index Portfolio
MainStay VP MacKay Small Cap Core Portfolio
MainStay VP Mellon Natural Resources Portfolio
MainStay VP Small Cap Growth Portfolio
MainStay VP T. Rowe Price Equity Income Portfolio
MainStay VP Winslow Large Cap Growth Portfolio
Mixed Asset Portfolios
MainStay VP Balanced Portfolio
MainStay VP Income Builder Portfolio
MainStay VP Janus Henderson Balanced Portfolio
MainStay VP MacKay Convertible Portfolio
Income Portfolios
MainStay VP Bond Portfolio
MainStay VP Floating Rate Portfolio
MainStay VP Indexed Bond Portfolio
MainStay VP MacKay Government Portfolio
MainStay VP MacKay High Yield Corporate Bond Portfolio
MainStay VP MacKay Unconstrained Bond Portfolio
MainStay VP PIMCO Real Return Portfolio
Money Market
MainStay VP U.S. Government Money Market Portfolio
Alternative
MainStay VP CBRE Global Infrastructure Portfolio
MainStay VP IQ Hedge Multi-Strategy Portfolio
Asset Allocation Portfolios
MainStay VP Conservative Allocation Portfolio
MainStay VP Growth Allocation Portfolio
MainStay VP Moderate Allocation Portfolio
MainStay VP Moderate Growth Allocation Portfolio
Manager
New York Life Investment Management LLC
New York, New York
Subadvisors
Brown Advisory LLC
Baltimore, Maryland
Candriam Belgium S.A.*
Brussels, Belgium
CBRE Clarion Securities LLC
Radnor, Pennsylvania
Epoch Investment Partners, Inc.
New York, New York
FIAM LLC
Smithfield, Rhode Island
IndexIQ Advisors LLC*
New York, New York
Janus Capital Management LLC
Denver, Colorado
MacKay Shields LLC*
New York, New York
Mellon Investments Corporation
Boston, Massachusetts
NYL Investors LLC*
New York, New York
Pacific Investment Management Company LLC
Newport Beach, California
Segall Bryant & Hamill, LLC
Chicago, Illinois
T. Rowe Price Associates, Inc.
Baltimore, Maryland
Winslow Capital Management, LLC
Minneapolis, Minnesota
Distributor
NYLIFE Distributors LLC*
Jersey City, New Jersey
Custodian
State Street Bank and Trust Company
Boston, Massachusetts
Independent Registered Public Accounting Firm
PricewaterhouseCoopers LLP
New York, New York
Legal Counsel
Dechert LLP
Washington, District of Columbia
Some Portfolios may not be available in all products.
| † | Fidelity Institutional AM is a registered trade mark of FMR LLC. Used with permission. |
| * | An affiliate of New York Life Investment Management LLC |
Not part of the Semiannual Report
2020 Semiannual Report
This report is for the general information of New York Life Variable Annuities and NYLIAC Variable Universal Life Insurance Products policyowners. It must be preceded or accompanied by the appropriate product(s) and funds prospectuses if it is given to anyone who is not an owner of a New York Life variable annuity policy or a NYLIAC Variable Universal Life Insurance Product. This report does not offer for sale or solicit orders to purchase securities.
The performance data quoted in this report represents past performance. Past performance is no guarantee of future results. Due to market volatility and other factors, current performance may be lower or higher than the figures shown. The most recent month-end performance summary for your variable annuity or variable life policy is available by calling 800-598-2019 and is updated periodically on www.newyorklife.com.
The New York Life Variable Annuities and NYLIAC Variable Universal Life Insurance Products are issued by New York Life Insurance and Annuity Corporation (a Delaware Corporation) and distributed by NYLIFE Distributors LLC (Member FINRA/SIPC).
New York Life Insurance Company
New York Life Insurance and Annuity Corporation (NYLIAC) (A Delaware Corporation)
51 Madison Avenue, Room 551
New York, NY 10010
www.newyorklife.com
Printed on recycled paper
nylinvestments.com
NYLIFE Distributors LLC, 30 Hudson Street, Jersey City, NJ 07302
New York Life Investment Management LLC is the investment manager to the MainStay VP Funds Trust
©2020 by NYLIFE Distributors LLC. All rights reserved.
You may obtain copies of the Prospectus and the Statement of Additional Information free of charge, upon request, by calling toll-free 800-598-2019 or writing to New York Life Insurance and Annuity Corporation, 51 Madison Avenue, New York, NY 10010.
| | | | |
| Not FDIC Insured | | No Bank Guarantee | | May Lose Value |
| | | | |
| 1781620 | | | | MSVPFR10-08/20 (NYLIAC) NI518 |
MainStay VP MacKay
Government Portfolio
Message from the President and Semiannual Report
Unaudited | June 30, 2020
Beginning on January 1, 2021, as permitted by regulations adopted by the Securities and Exchange Commission, paper copies of the MainStay VP Portfolio annual and semi-annual shareholder reports may no longer be sent by mail, unless you specifically request paper copies of the reports from the insurance company that offers your policy. Instead, the reports will be made available online, and you will be notified by mail each time a report is posted and provided with a website link to access the report. Instructions for requesting paper copies will be provided by your insurance company.
If you already elected to receive shareholder reports electronically, you will not be affected by this change and you need not take any action. At any time, you may elect to receive reports and other communications from the insurance company electronically by following the instructions provided by the insurance company.
You may elect to receive all future shareholder reports in paper form free of charge. You can inform the insurance company that you wish to receive paper copies of reports by following the instructions provided by the insurance company. Your election to receive reports in paper form will apply to all portfolio companies available under your contract.
| | | | | | | | |
| Not FDIC/NCUA Insured | | Not a Deposit | | May Lose Value | | No Bank Guarantee | | Not Insured by Any Government Agency |

This page intentionally left blank
Message from the President
High levels of volatility shook financial markets in response to the COVID-19 pandemic and an abrupt decline in global economic activity during the six months ended June 30, 2020.
Markets entered 2020 riding strong fourth quarter performance and an economic expansion of historic longevity. Most broad stock and bond indices began to dip in late February as growing numbers of COVID-19 cases were seen in hotspots around the world. On March 11, 2020, the World Health Organization acknowledged that the disease had reached pandemic proportions, with over 80,000 identified cases in China, thousands in Italy, South Korea and the United States, and more in dozens of additional countries. Governments and central banks pledged trillions of dollars to address the mounting economic and public health crisis; however, “stay-at-home” orders and other restrictions on non-essential activity caused global economic activity to slow. Most stocks and bonds lost significant ground in this challenging environment, with equities declining by roughly a third and the yield on high-yield credit indices shooting higher.
Policymakers responded with extraordinary speed to address the situation. In the United States, the Federal Reserve (“Fed”) cut interest rates to near zero and announced unlimited quantitative easing. With help from Treasury, the Fed later rolled out a series of lending facilities to directly support market functioning. In late March, the Federal government declared a national emergency; Congress passed, and the President signed, a $2 trillion CARES Act (The Coronavirus Aid, Relief, and Economic Security Act), with the promise of further assistance for consumers and businesses to come. This enormous wave of policy support helped fuel a rapid recovery in market pricing as stocks bounced back and credit spreads narrowed. Some states rushed to ease restrictions on travel and social gatherings, further fueling optimism that the effects of the pandemic might prove short lived. However, the final weeks of the reporting period saw infection rates beginning to rise in some of the first states to reopen, raising concerns that a second round of restrictive government policies might prove necessary, once again stifling economic activity.
Despite all the market volatility, the broadly based S&P 500® Index finished the first half of 2020 only slightly below its starting point and the technology-heavy NASDAQ Composite Index posted gains, closing in near record territory. Small-cap stocks tended to trail their large cap counterparts, as illustrated by the Russell 2000® Index’s loss of approximately 15%, while value-oriented stocks lagged growth-oriented issues. From a global perspective, U.S. stocks generally outperformed international equities, with emerging markets hit particularly hard by the flight from risk.
Fixed-income markets also experienced unusually high levels of volatility. Recognized safe havens, such as U.S. government bonds, attracted increased investment, driving yields lower and prices higher, positioning long-term Treasury bonds to deliver particularly strong gains. Investment-grade corporate bonds lost value in March before recovering in the closing months of the reporting period, while relatively speculative high-yield credit faced the brunt of risk-off sentiment. Emerging market debt underperformed most other bonds types as investors sought to minimize currency and sovereign risks.
Today, as we at New York Life Investments continue to track the ongoing health crisis and its financial ramifications, we are particularly mindful of the people at the heart of our enterprise—our colleagues and valued clients. By taking appropriate steps to minimize community spread of COVID-19 within our organization, we strive to safeguard the health of our investment professionals so they can continue to provide you, as a MainStay investor, with world class investment solutions in this rapidly evolving environment.
Sincerely,

Kirk C. Lehneis
President
The opinions expressed are as of the date of this report and are subject to change. There is no guarantee that any forecast made will come to pass. This material does not constitute investment advice and is not intended as an endorsement of any specific investment. Past performance is no guarantee of future results.
Not part of the Semiannual Report
Table of Contents
Investors should refer to the Portfolio’s Summary Prospectus and/or Prospectus and consider the Portfolio’s investment objectives, strategies, risks, charges and expenses carefully before investing. The Summary Prospectus and/or Prospectus contain this and other information about the Portfolio. You may obtain copies of the Portfolio’s Summary Prospectus and/or the Prospectus and the Statement of Additional Information free of charge, upon request, by calling toll-free 800-598-2019, by writing to New York Life Insurance and Annuity Corporation, 51 Madison Avenue, Room 251, New York, New York 10010 or by sending an email to MainStayShareholdersServices@nylim.com. These documents are also available at nylinvestments.com/vpdocuments. Please read the Summary Prospectus and/or Prospectus carefully before investing. MainStay VP Funds Trust portfolios are separate account options which are purchased through a variable insurance or variable annuity contract.
Investment and Performance Comparison1 (Unaudited)
Performance data quoted represents past performance. Past performance is no guarantee of future results. Because of market volatility and other factors, current performance may be lower or higher than the figures shown. Investment return and principal value will fluctuate, and as a result, when shares are redeemed, they may be worth more or less than their original cost. The performance table and graph do not reflect any deduction of sales charges, mortality and expense charges, contract charges or administrative charges. Please refer to the Performance Summary appropriate for your policy. For performance information current to the most recent month-end, please call 800-598-2019 or visit www.newyorklife.com.
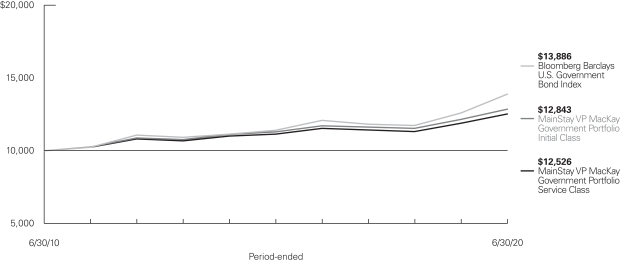
Average Annual Total Returns for the Period-Ended June 30, 2020
| | | | | | | | | | | | | | | | | | | | | | |
| Class | | Inception
Date | | Six Months | | | One Year | | | Five Years | | | Ten Years | | | Gross
Expense
Ratio2 | |
| | | | | | |
| Initial Class Shares | | 1/29/1993 | | | 4.27 | % | | | 5.74 | % | | | 2.63 | % | | | 2.53 | % | | | 0.57 | % |
| Service Class Shares | | 6/4/2003 | | | 4.14 | | | | 5.48 | | | | 2.38 | | | | 2.28 | | | | 0.82 | |
| | | | | | | | | | | | | | | | |
| Benchmark Performance | | Six
Months | | | One
Year | | | Five
Years | | | Ten
Years | |
| | | | |
Bloomberg Barclays U.S. Government Bond Index3 | | | 8.61 | % | | | 10.34 | % | | | 4.05 | % | | | 3.34 | % |
Morningstar Intermediate Government Category Average4 | | | 5.16 | | | | 6.71 | | | | 2.88 | | | | 2.68 | |
| 1. | Performance figures may reflect certain fee waivers and/or expense limitations, without which total returns may have been different. For information on current fee waivers and/or expense limitations (if any), please refer to the Notes to Financial Statements. |
| 2. | The gross expense ratios presented reflect the Portfolio’s “Total Annual Portfolio Operating Expenses” from the most recent Prospectus, as supplemented, and may differ from other expense ratios disclosed in this report. |
| 3. | The Bloomberg Barclays U.S. Government Bond Index is the Portfolio’s primary broad-based securities market index for comparison purposes. The Bloomberg Barclays U.S. Government Bond Index consists of publicly issued |
| | debt of the U.S. Treasury and government agencies. Results assume the reinvestment of all income and capital gains. An investment cannot be made directly in an index. |
| 4. | The Morningstar Intermediate Government Category Average is representative of funds that have at least 90% of their bond holdings in bonds backed by U.S. government or by U.S. government-linked agencies. These funds have durations between 3.5 and 6 years and/or average effective maturities between 4 and 10 years. Results are based on average total returns of similar funds with all dividends and capital gain distributions reinvested. |
Cost in Dollars of a $1,000 Investment in MainStay VP MacKay Government Portfolio (Unaudited)
The example below is intended to describe the fees and expenses borne by shareholders during the six-month period from January 1, 2020, to June 30, 2020, and the impact of those costs on your investment.
Example
As a shareholder of the Portfolio you incur two types of costs: (1) transaction costs, including exchange fees and sales charges (loads) on purchases (as applicable), and (2) ongoing costs, including management fees, distribution and/or service (12b-1) fees, and other Portfolio expenses (as applicable). This example is intended to help you understand your ongoing costs (in dollars) of investing in the Portfolio and to compare these costs with the ongoing costs of investing in other mutual funds. The example is based on an investment of $1,000 made at the beginning of the six-month period and held for the entire period from January 1, 2020, to June 30, 2020. Shares are only sold in connection with variable life and annuity contracts and the example does not reflect any contract level or transactional fees or expenses. If these costs had been included, your costs would have been higher.
This example illustrates your Portfolio’s ongoing costs in two ways:
Actual Expenses
The second and third data columns in the table below provide information about actual account values and actual expenses. You may use the information in these columns, together with the amount you invested, to estimate the expenses that you paid during the six months ended June 30, 2020. Simply divide your account value by $1,000
(for example, an $8,600 account value divided by $1,000 = 8.6), then multiply the result by the number under the heading entitled “Expenses Paid During Period” to estimate the expenses you paid on your account during this period.
Hypothetical Example for Comparison Purposes
The fourth and fifth data columns in the table below provide information about hypothetical account values and hypothetical expenses based on the Portfolio’s actual expense ratio and an assumed rate of return of 5% per year before expenses, which is not the Portfolio’s actual return. The hypothetical account values and expenses may not be used to estimate the actual ending account balances or expenses you paid for the six-month period shown. You may use this information to compare the ongoing costs of investing in the Portfolio with the ongoing costs of investing in other mutual funds. To do so, compare this 5% hypothetical example with the 5% hypothetical examples that appear in the shareholder reports of the other mutual funds.
Please note that the expenses shown in the table are meant to highlight your ongoing costs only and do not reflect any transactional costs, such as exchange fees or sales charges (loads). Therefore, the fourth and fifth data columns of the table are useful in comparing ongoing costs only and will not help you determine the relative total costs of owning different funds. In addition, if these transactional costs were included, your costs would have been higher.
| | | | | | | | | | | | | | | | | | | | | | |
| | | | | | | | | | | | | | | | | | |
| Share Class | | Beginning
Account
Value
1/1/20 | | | Ending Account
Value (Based
on Actual
Returns and
Expenses)
6/30/20 | | | Expenses
Paid
During
Period1 | | | Ending Account
Value (Based
on Hypothetical
5% Annualized
Return and
Actual Expenses)
6/30/20 | | | Expenses
Paid
During
Period1 | | | Net Expense
Ratio
During
Period2 |
| | | | | | |
| Initial Class Shares | | $ | 1,000.00 | | | $ | 1,042.70 | | | $ | 2.84 | | | $ | 1,022.08 | | | $ | 2.82 | | | 0.56% |
| | | | | | |
| Service Class Shares | | $ | 1,000.00 | | | $ | 1,041.40 | | | $ | 4.11 | | | $ | 1,020.84 | | | $ | 4.07 | | | 0.81% |
| 1. | Expenses are equal to the Portfolio’s annualized expense ratio of each class multiplied by the average account value over the period, divided by 366 and multiplied by 182 (to reflect the six-month period). The table above represents the actual expenses incurred during the six-month period. In addition to the fees and expenses which the Portfolio bears directly, it also indirectly bears a pro rata share of the fees and expenses of the underlying funds in which it invests. Such indirect expenses are not included in the above-reported expense figures. |
| 2. | Expenses are equal to the Portfolio’s annualized expense ratio to reflect the six-month period. |
| | |
| 6 | | MainStay VP MacKay Government Portfolio |
Portfolio Composition as of June 30, 2020 (Unaudited)
See Portfolio of Investments beginning on page 10 for specific holdings within these categories. The Portfolio’s holdings are subject to change.
Top Ten Holdings as of June 30, 2020 (excluding short-term investments) (Unaudited)
| 1. | United States Treasury Notes, 2.25%, due 4/30/24 |
| 2. | United States Treasury Notes, 2.25%, due 4/30/21 |
| 3. | United States Treasury Notes, 3.00%, due 10/31/25 |
| 4. | Federal National Mortgage Association (Mortgage Pass-Through Securities), 4.50%, due 4/1/41 |
| 5. | United States Treasury Notes, 2.75%, due 4/30/23 |
| 6. | Tennessee Valley Authority, 4.65%, due 6/15/35 |
| 7. | Federal National Mortgage Association (Mortgage Pass-Through Securities), 2.50%, due 5/1/50 |
| 8. | United States Treasury Inflation—Indexed Bond, 0.125%, due 1/15/30 |
| 9. | United States Treasury Notes, 0.375%, due 4/30/25 |
| 10. | United States Treasury Inflation—Indexed Note, 0.875%, due 1/15/29 |
Portfolio Management Discussion and Analysis (Unaudited)
Answers to the questions reflect the views of portfolio managers, Steven H. Rich, Stephen R. Cianci, CFA, and Neil Moriarty III, of MacKay Shields LLC, the Portfolio’s Subadvisor.
How did MainStay VP MacKay Government Portfolio perform relative to its benchmark and peers during the six months ended June 30, 2020?
For the six months ended June 30, 2020, MainStay VP MacKay Government Portfolio returned 4.27% for Initial Class shares and 4.14% for Service Class shares. Over the same period, both share classes underperformed the 8.61% return of the Bloomberg Barclays U.S. Government Bond Index, which is the Portfolio’s benchmark, and the 5.16% return of the Morningstar Intermediate Government Category Average.1
What factors affected the Portfolio’s relative performance during the reporting period?
Duration,2 yield-curve3 posture, sector weighting and issue selection were the four factors primarily responsible for the Portfolio’s performance relative to the Bloomberg Barclays U.S. Government Bond Index during the reporting period. Duration posture produced the principal headwind for the Portfolio, and its impact dominated yield advantage and yield-curve posture, both of which bolstered the Portfolio’s relative returns.
In the face of the widening COVID-19 pandemic, U.S. Treasury yields fell across the yield curve during the first three months of 2020. Shorter maturities were most responsive to the accommodative monetary policy initiated by the U.S. Federal Reserve in March and April. More modest declines in longer-maturity yields reflected investors’ selling longer-duration Treasury bonds to make room for accelerating issuance of longer-duration corporates as businesses termed-out their debt at attractive rates. The widening of the spread between 2-year and 30-year benchmark Treasury bonds was further influenced by positive momentum in the equity markets after the market bottomed out in late March.
Against this backdrop, the Portfolio proved less sensitive than the benchmark and longer-duration peers to changes in Treasury yields because of its shorter duration. As a consequence, duration posture disadvantaged the Portfolio for the majority of the reporting period, and was its main source of underperformance compared to the benchmark. Regarding yield-curve posture, the steepening of the yield curve disadvantaged peers whose assets were more concentrated in the long-end of the yield curve.
With regard to sector weighting, the Portfolio held overweight exposure to mortgage-backed securities, both residential and commercial, relative to its benchmark, with agency mortgage pass-throughs being the largest class of securities held in the
Portfolio. Our commitment to agency mortgage pass-throughs imparted a yield advantage over lower-yielding Treasury bonds and agency debentures.
Regarding issue selection, the Portfolio’s distribution of agency mortgage pass-through securities across the coupon stack favored higher coupons, which typically have durations equivalent to the shorter Treasury bonds associated with the sharpest yield declines for the reporting period. We also favored seasoned loans (i.e., loans originated in prior years) and low-balance loans. Mortgage pass-throughs backed by loans with these characteristics often have more stable cash-flow profiles. As lower mortgage rates prompted borrowers to refinance, the negative-return impact of prepayments was more extreme than in recent prior periods. This dynamic led the market to recalibrate the value of cash-flow stability, which boosted price performance for seasoning and loan balance. Similarly, the Portfolio benefited from the stability of its collateralized mortgage obligations, which are structured to dampen cash-flow variability.
What was the Portfolio’s duration strategy during the reporting period?
As Treasury yields and mortgage rates fell during the reporting period, the Portfolio’s duration contracted from 3.8 years to 3.1 years while the benchmark’s duration lengthened from 6.4 years to 7.0 years. Given the presence of residential mortgage-backed securities in the Portfolio, the Portfolio’s duration typically shortens as Treasury yields fall. Mortgage rates move directionally with Treasury rates as lower mortgage rates incentivize borrowers to refinance. Lower yields have the opposite effect on the benchmark’s duration due to its positive convexity.4
We prefer to maintain the Portfolio’s duration between 3 and 4 years because, in our opinion, the trade-off of increasing yield by extending duration is not compelling. Moving out the curve presents the risk of negative price return should Treasury yields rise, an effect that can readily erode the pickup in yield gained by shifting into longer maturities.
How did the Portfolio’s sector weightings change during the reporting period?
During the reporting period, we increased the Portfolio’s exposure to government-related residential mortgage-backed securities by 9% of net assets, and increased the Portfolio’s exposure to government-related commercial mortgage-backed
| 1. | See page 5 for more information on benchmark and peer group returns. |
| 2. | Duration is a measure of the price sensitivity of a fixed-income investment to changes in interest rates. Duration is expressed as a number of years and is considered a more accurate sensitivity gauge than average maturity. |
| 3. | The yield curve is a line that plots the yields of various securities of similar quality—typically U.S. Treasury issues—across a range of maturities. The U.S. Treasury yield curve serves as a benchmark for other debt and is used in economic forecasting. |
| 4. | Convexity is a mathematical measure of the sensitivity of an interest-bearing bond to changes in interest rates. |
| | |
| 8 | | MainStay VP MacKay Government Portfolio |
securities by 6% of net assets. These purchases were funded by sales of Treasury bonds and cash released by maturing securities and prepayments. The rotation into government-related mortgage-backed securities enhanced the Portfolio’s yield while preserving its credit quality.
During the same period, we also reintroduced Treasury-Inflation Protected Securities (“TIPS”) to the Portfolio at 3% of net assets. As the economy slowed, inflation fell and prices of TIPS weakened. This trend improved their relative value to nominal Treasury securities, providing an attractive entry point to initiate the Portfolio’s position.
How was the Portfolio positioned at the end of the reporting period?
Relative to the Bloomberg Barclays U.S. Government Bond Index, the Portfolio ended the reporting period with underweight exposure to Treasury securities, equivalently weighted exposure to agency debentures and overweight exposure to agency mortgage-backed securities, both residential and commercial. As of June 30, 2020, the Portfolio also held modest overweight positions in asset-backed securities, non-agency mortgage-backed securities and corporate bonds; collectively, this non-government exposure accounted for roughly 6% of Portfolio net assets. The Portfolio ended the reporting period with approximately 5% in cash and cash equivalents.
The opinions expressed are those of the portfolio managers as of the date of this report and are subject to change. There is no guarantee that any forecasts will come to pass. This material does not constitute investment advice and is not intended as an endorsement of any specific investment.
Not all MainStay VP Portfolios and/or share classes are available under all policies.
Portfolio of Investments June 30, 2020 (Unaudited)
| | | | | | | | |
| | | Principal
Amount | | | Value | |
Long-Term Bonds 97.4%† Asset-Backed Securities 2.9% | |
Other Asset-Backed Securities 2.8% | |
FirstEnergy Ohio PIRB Special Purpose Trust
Series 2013-1, Class A3
3.45%, due 1/15/36 | | $ | 547,429 | | | $ | 583,900 | |
PSNH Funding LLC
Series 2018-1, Class A1
3.094%, due 2/1/26 | | | 343,288 | | | | 353,784 | |
Small Business Administration Participation Certificates | | | | | | | | |
Series 2012-20L, Class 1
1.93%, due 12/1/32 | | | 451,393 | | | | 463,571 | |
Series 2014-20H, Class 1
2.88%, due 8/1/34 | | | 504,069 | | | | 536,034 | |
Series 2015-20G, Class 1
2.88%, due 7/1/35 | | | 1,347,755 | | | | 1,433,757 | |
Series 2014-20I, Class 1
2.92%, due 9/1/34 | | | 561,108 | | | | 600,668 | |
Series 2014-20C, Class 1
3.21%, due 3/1/34 | | | 956,143 | | | | 1,018,665 | |
Series 2018-20B, Class 1
3.22%, due 2/1/38 | | | 1,893,246 | | | | 2,050,654 | |
Series 2018-20D, Class 1
3.31%, due 4/1/38 | | | 2,098,997 | | | | 2,286,757 | |
| | | | | | | | |
| | | | | | | 9,327,790 | |
| | | | | | | | |
Utilities 0.1% | |
Atlantic City Electric Transition Funding LLC
Series 2002-1, Class A4
5.55%, due 10/20/23 | | | 419,764 | | | | 433,444 | |
| | | | | | | | |
Total Asset-Backed Securities
(Cost $9,371,542) | | | | | | | 9,761,234 | |
| | | | | | | | |
|
| Corporate Bonds 3.3% | |
Agriculture 0.4% | |
Altria Group, Inc.
2.85%, due 8/9/22 | | | 1,170,000 | | | | 1,218,962 | |
| | | | | | | | |
|
Electric 1.9% | |
Consolidated Edison Co. of New York, Inc.
0.697% (3 Month LIBOR + 0.40%), due 6/25/21 (a) | | | 1,550,000 | | | | 1,553,155 | |
Duke Energy Florida Project Finance LLC
2.538%, due 9/1/29 | | | 1,900,000 | | | | 2,035,700 | |
Monongahela Power Co.
4.10%, due 4/15/24 (b) | | | 2,000,000 | | | | 2,210,606 | |
PECO Energy Co.
1.70%, due 9/15/21 | | | 670,000 | | | | 679,834 | |
| | | | | | | | |
| | | | | | | 6,479,295 | |
| | | | | | | | |
| | | | | | | | |
| | | Principal
Amount | | | Value | |
Pipelines 0.3% | |
Plains All American Pipeline, L.P. / PAA Finance Corp.
5.00%, due 2/1/21 | | $ | 1,200,000 | | | $ | 1,210,986 | |
| | | | | | | | |
|
Real Estate Investment Trusts 0.7% | |
Host Hotels & Resorts, L.P.
3.75%, due 10/15/23 | | | 2,350,000 | | | | 2,398,487 | |
| | | | | | | | |
Total Corporate Bonds
(Cost $10,963,125) | | | | | | | 11,307,730 | |
| | | | | | | | |
|
| Mortgage-Backed Securities 16.2% | |
Agency (Collateralized Mortgage Obligations) 5.9% | |
Federal Home Loan Mortgage Corporation | | | | | | | | |
REMIC, Series 4913, Class UA
3.00%, due 3/15/49 | | | 1,004,180 | | | | 1,052,827 | |
REMIC, Series 4908, Class BD
3.00%, due 4/25/49 | | | 2,420,000 | | | | 2,555,886 | |
REMIC, Series 4926, Class BP
3.00%, due 10/25/49 | | | 3,135,000 | | | | 3,332,644 | |
REMIC Series 4888, Class BA
3.50%, due 9/15/48 | | | 399,849 | | | | 414,784 | |
REMIC Series 4877, Class AT
3.50%, due 11/15/48 | | | 535,744 | | | | 568,833 | |
REMIC Series 4877, Class BE
3.50%, due 11/15/48 | | | 874,664 | | | | 929,741 | |
REMIC, Series 4886, Class LA
4.00%, due 3/15/43 | | | 215,281 | | | | 217,744 | |
REMIC, Series 4837, Class BA
4.00%, due 6/15/43 | | | 1,718,647 | | | | 1,743,871 | |
Federal National Mortgage Association | | | | | | | | |
REMIC, Series 2019-13, Class PE
3.00%, due 3/25/49 | | | 579,765 | | | | 615,287 | |
REMIC, Series 2019-58, Class LP
3.00%, due 10/25/49 | | | 1,350,000 | | | | 1,436,993 | |
REMIC, Series 2018-76, Class BC
3.50%, due 11/25/42 | | | 1,018,396 | | | | 1,028,019 | |
REMIC, Series 2020-10, Class DA
3.50%, due 3/25/60 | | | 1,192,787 | | | | 1,302,739 | |
Government National Mortgage Association | | | | | | | | |
REMIC, Series 2019-3, Class A
3.00%, due 4/20/48 | | | 1,684,284 | | | | 1,741,765 | |
Series 2019-59, Class KA
3.00%, due 12/20/48 | | | 869,900 | | | | 910,736 | |
Series 2013-149, Class BA
3.25%, due 8/16/41 | | | 1,602,208 | | | | 1,714,417 | |
Seasoned Loans Structured Transaction Trust
Series 2019-1, Class A1
3.50%, due 5/25/29 | | | 434,193 | | | | 472,402 | |
| | | | | | | | |
| | | | | | | 20,038,688 | |
| | | | | | | | |
| | | | |
| 10 | | MainStay VP MacKay Government Portfolio | | The notes to the financial statements are an integral part of,
and should be read in conjunction with, the financial statements. |
| | | | | | | | |
| | | Principal
Amount | | | Value | |
| Mortgage-Backed Securities (continued) | |
Agency Collateral PAC CMO 0.5% | |
Government National Mortgage Association REMIC, Series 2014-63, Class PG
2.50%, due 7/20/43 | | $ | 1,624,367 | | | $ | 1,686,556 | |
| | | | | | | | |
|
Commercial Mortgage Loans
(Collateralized Mortgage Obligations) 9.3% | |
BX Trust
Series 2019-OC11, Class A
3.202%, due 12/9/41 (b) | | | 460,000 | | | | 479,210 | |
BXP Trust
Series 2017-GM, Class A
3.379%, due 6/13/39 (b) | | | 1,750,000 | | | | 1,916,370 | |
Four Times Square Trust
Series 2006-4TS, Class A
5.401%, due 12/13/28 (b) | | | 484,797 | | | | 489,117 | |
FREMF Mortgage Trust (b)(c) | | | | | | | | |
Series 2015-K720, Class B (b)(c)
3.51%, due 7/25/22 | | | 430,000 | | | | 443,823 | |
Series 2013-K27, Class B (b)(c)
3.616%, due 1/25/46 | | | 1,300,000 | | | | 1,356,243 | |
Series 2013-K24, Class B (b)(c)
3.622%, due 11/25/45 | | | 2,000,000 | | | | 2,075,461 | |
Series 2015-K721, Class B (b)(c)
3.681%, due 11/25/47 | | | 3,040,000 | | | | 3,133,644 | |
Series 2014-K717, Class B (b)(c)
3.754%, due 11/25/47 | | | 2,500,000 | | | | 2,552,850 | |
Series 2012-K23, Class B (b)(c)
3.782%, due 10/25/45 | | | 1,222,000 | | | | 1,276,024 | |
Series 2012-K22, Class B (b)(c)
3.81%, due 8/25/45 | | | 225,000 | | | | 230,478 | |
Series 2014-K41, Class B (b)(c)
3.963%, due 11/25/47 | | | 2,700,000 | | | | 2,901,273 | |
Series 2013-K35, Class B (b)(c)
4.073%, due 12/25/46 | | | 2,540,000 | | | | 2,726,918 | |
Series 2014-K716, Class B (b)(c)
4.081%, due 8/25/47 | | | 2,150,000 | | | | 2,190,738 | |
Series 2016-K54, Class B (b)(c)
4.189%, due 4/25/48 | | | 695,000 | | | | 765,943 | |
Series 2012-K17, Class B
4.318%, due 12/25/44 (b) | | | 2,264,000 | | | | 2,358,186 | |
Series 2014-K38, Class B (c)
4.376%, due 6/25/47 | | | 2,000,000 | | | | 2,187,188 | |
Series 2010-K9, Class B (b)(c)
5.301%, due 9/25/45 | | | 2,180,000 | | | | 2,185,290 | |
One Bryant Park Trust
Series 2019-OBP, Class A
2.516%, due 9/15/54 (b) | | | 1,265,000 | | | | 1,338,556 | |
Wells Fargo Commercial Mortgage Trust
Series 2018-1745, Class A
3.874%, due 6/15/36 (b)(c) | | | 695,000 | | | | 766,583 | |
| | | | | | | | |
| | | | | | | 31,373,895 | |
| | | | | | | | |
| | | | | | | | |
| | | Principal
Amount | | | Value | |
Residential Mortgage (Collateralized Mortgage Obligation) 0.0%‡ | |
Citigroup Mortgage Loan Trust, Inc.
Series 2006-AR6, Class 1A1
4.194%, due 8/25/36 (c) | | $ | 110,045 | | | $ | 97,981 | |
| | | | | | | | |
|
Whole Loan (Collateralized Mortgage Obligations) 0.5% | |
Chase Home Lending Mortgage Trust
Series 2019-ATR1, Class A4
4.00%, due 4/25/49 (b)(d) | | | 213,206 | | | | 214,929 | |
Wells Fargo Mortgage Backed Securities Trust
Series 2020-2, Class A1
3.00%, due 12/25/49 (d) | | | 1,500,000 | | | | 1,545,937 | |
| | | | | | | | |
| | | | | | | 1,760,866 | |
| | | | | | | | |
Total Mortgage-Backed Securities
(Cost $54,033,568) | | | | | | | 54,957,986 | |
| | | | | | | | |
|
| U.S. Government & Federal Agencies 75.0% | |
Fannie Mae (Collateralized Mortgage Obligation) 0.0%‡ (e) | |
Series 360, Class 2, IO
5.00%, due 8/25/35 | | | 76,350 | | | | 13,571 | |
Series 361, Class 2
6.00%, due 10/25/35 | | | 16,495 | | | | 3,747 | |
| | | | | | | | |
| | | | | | | 17,318 | |
| | | | | | | | |
Federal Home Loan Mortgage Corporation
(Mortgage Pass-Through Securities) 13.4% | |
2.00%, due 6/1/35 | | | 1,293,079 | | | | 1,338,387 | |
2.00%, due 6/1/50 | | | 2,993,568 | | | | 3,064,409 | |
2.50%, due 9/1/34 | | | 817,368 | | | | 856,343 | |
2.50%, due 1/1/40 | | | 1,272,601 | | | | 1,327,542 | |
2.50%, due 8/1/46 | | | 1,473,372 | | | | 1,560,951 | |
2.50%, due 3/1/50 | | | 2,741,400 | | | | 2,860,285 | |
2.50%, due 4/1/50 | | | 990,748 | | | | 1,033,052 | |
2.50%, due 5/1/50 | | | 2,982,190 | | | | 3,108,065 | |
2.50%, due 6/1/50 | | | 2,996,011 | | | | 3,124,532 | |
2.50%, due 7/1/50 | | | 3,000,000 | | | | 3,128,101 | |
3.00%, due 2/1/46 | | | 2,746,404 | | | | 2,918,257 | |
3.00%, due 4/1/47 | | | 2,850,191 | | | | 3,015,424 | |
3.00%, due 9/1/49 | | | 776,548 | | | | 818,422 | |
3.00%, due 11/1/49 | | | 1,748,266 | | | | 1,854,080 | |
3.50%, due 1/1/43 | | | 650,762 | | | | 722,012 | |
3.50%, due 1/1/44 | | | 353,771 | | | | 382,690 | |
3.50%, due 1/1/48 | | | 2,119,445 | | | | 2,259,491 | |
3.50%, due 2/1/48 | | | 2,387,114 | | | | 2,522,444 | |
4.00%, due 7/1/44 | | | 1,350,560 | | | | 1,481,587 | |
4.00%, due 3/1/45 | | | 307,869 | | | | 337,664 | |
4.00%, due 12/1/46 | | | 1,041,963 | | | | 1,127,254 | |
4.00%, due 2/1/48 | | | 565,615 | | | | 602,282 | |
4.00%, due 10/1/48 | | | 1,088,814 | | | | 1,192,648 | |
4.00%, due 3/1/49 | | | 850,391 | | | | 901,029 | |
| | | | | | |
The notes to the financial statements are an integral part of,
and should be read in conjunction with, the financial statements. | | | | | 11 | |
Portfolio of Investments June 30, 2020 (Unaudited) (continued)
| | | | | | | | |
| | | Principal
Amount | | | Value | |
| U.S. Government & Federal Agencies (continued) | |
Federal Home Loan Mortgage Corporation
(Mortgage Pass-Through Securities (continued) | |
4.50%, due 3/1/41 | | $ | 311,305 | | | $ | 342,220 | |
4.50%, due 8/1/44 | | | 205,475 | | | | 236,067 | |
4.50%, due 12/1/44 | | | 888,785 | | | | 995,308 | |
4.50%, due 7/1/45 | | | 580,959 | | | | 646,928 | |
4.50%, due 4/1/46 | | | 93,971 | | | | 104,497 | |
4.50%, due 8/1/47 | | | 192,898 | | | | 218,820 | |
5.00%, due 11/1/41 | | | 1,106,921 | | | | 1,270,190 | |
6.50%, due 4/1/37 | | | 32,388 | | | | 37,176 | |
| | | | | | | | |
| | | | | | | 45,388,157 | |
| | | | | | | | |
Federal National Mortgage Association
(Mortgage Pass-Through Securities) 31.4% | |
2.00%, due 5/1/35 | | | 504,070 | | | | 521,732 | |
2.00%, due 6/1/50 | | | 2,245,349 | | | | 2,288,988 | |
2.50%, due 12/1/37 | | | 1,998,086 | | | | 2,094,050 | |
2.50%, due 2/1/40 | | | 1,303,914 | | | | 1,359,973 | |
2.50%, due 1/1/47 | | | 3,017,760 | | | | 3,194,954 | |
2.50%, due 9/1/49 | | | 2,874,255 | | | | 2,998,959 | |
2.50%, due 2/1/50 TBA (f) | | | 3,000,000 | | | | 3,127,500 | |
2.50%, due 3/1/50 | | | 3,032,749 | | | | 3,163,445 | |
2.50%, due 3/1/50 | | | 2,960,154 | | | | 3,088,591 | |
2.50%, due 3/1/50 | | | 626,162 | | | | 656,600 | |
2.50%, due 5/1/50 | | | 4,991,123 | | | | 5,203,265 | |
2.50%, due 5/1/50 | | | 1,988,252 | | | | 2,072,370 | |
2.50%, due 6/1/50 | | | 977,887 | | | | 1,019,162 | |
2.50%, due 7/1/50 | | | 3,000,000 | | | | 3,128,101 | |
2.50%, due 1/1/57 | | | 834,471 | | | | 876,439 | |
3.00%, due 10/1/32 | | | 604,960 | | | | 644,830 | |
3.00%, due 10/1/44 | | | 1,893,511 | | | | 2,027,954 | |
3.00%, due 9/1/46 | | | 1,820,471 | | | | 1,886,644 | |
3.00%, due 10/1/46 | | | 1,700,325 | | | | 1,762,991 | |
3.00%, due 3/1/47 | | | 1,355,034 | | | | 1,433,556 | |
3.00%, due 12/1/47 | | | 1,814,915 | | | | 1,919,045 | |
3.00%, due 10/1/48 | | | 37,262 | | | | 38,316 | |
3.00%, due 10/1/49 | | | 2,517,067 | | | | 2,652,796 | |
3.00%, due 12/1/49 TBA (f) | | | 3,000,000 | | | | 3,159,609 | |
3.00%, due 3/1/50 | | | 2,708,392 | | | | 2,869,502 | |
3.00%, due 3/1/50 | | | 1,968,559 | | | | 2,082,566 | |
3.00%, due 3/1/50 | | | 3,084,033 | | | | 3,251,398 | |
3.00%, due 4/1/50 | | | 2,145,564 | | | | 2,261,997 | |
3.00%, due 5/1/50 | | | 1,988,979 | | | | 2,096,910 | |
3.00%, due 2/1/57 | | | 738,167 | | | | 790,819 | |
3.00%, due 6/1/57 | | | 816,358 | | | | 874,254 | |
3.50%, due 3/1/37 | | | 440,709 | | | | 476,112 | |
3.50%, due 2/1/43 | | | 1,592,545 | | | | 1,766,380 | |
3.50%, due 5/1/43 | | | 540,986 | | | | 585,024 | |
3.50%, due 7/1/43 | | | 531,127 | | | | 585,417 | |
3.50%, due 11/1/44 | | | 857,742 | | | | 927,565 | |
3.50%, due 3/1/45 | | | 902,470 | | | | 986,471 | |
3.50%, due 8/1/46 | | | 696,585 | | | | 747,793 | |
| | | | | | | | |
| | | Principal
Amount | | | Value | |
Federal National Mortgage Association
(Mortgage Pass-Through Securities) (continued) | |
3.50%, due 10/1/47 | | $ | 658,415 | | | $ | 696,899 | |
3.50%, due 2/1/48 | | | 406,561 | | | | 430,030 | |
3.50%, due 8/1/49 | | | 2,656,591 | | | | 2,792,456 | |
4.00%, due 8/1/38 | | | 2,848,188 | | | | 3,067,427 | |
4.00%, due 1/1/46 | | | 893,694 | | | | 980,284 | |
4.00%, due 9/1/47 | | | 565,600 | | | | 601,967 | |
4.00%, due 7/1/48 | | | 1,571,215 | | | | 1,663,956 | |
4.00%, due 9/1/48 | | | 1,421,152 | | | | 1,533,298 | |
4.00%, due 9/1/48 | | | 1,752,342 | | | | 1,857,166 | |
4.00%, due 4/1/49 | | | 421,069 | | | | 445,905 | |
4.50%, due 2/1/41 | | | 2,465,836 | | | | 2,763,753 | |
4.50%, due 4/1/41 | | | 6,000,712 | | | | 6,831,325 | |
4.50%, due 8/1/42 | | | 1,107,120 | | | | 1,239,358 | |
4.50%, due 12/1/43 | | | 283,326 | | | | 314,946 | |
4.50%, due 8/1/44 | | | 1,277,830 | | | | 1,420,431 | |
5.00%, due 9/1/41 | | | 2,097,349 | | | | 2,406,001 | |
5.00%, due 10/1/41 | | | 1,832,010 | | | | 2,101,267 | |
5.50%, due 7/1/41 | | | 3,264,795 | | | | 3,743,261 | |
6.00%, due 4/1/37 | | | 10,203 | | | | 11,595 | |
6.00%, due 7/1/39 | | | 740,685 | | | | 864,551 | |
6.50%, due 10/1/39 | | | 134,299 | | | | 154,920 | |
6.50%, due 8/1/47 | | | 14,686 | | | | 15,827 | |
| | | | | | | | |
| | | | | | | 106,558,701 | |
| | | | | | | | |
Government National Mortgage Association
(Mortgage Pass-Through Securities) 1.0% | |
4.00%, due 11/20/49 | | | 1,867,377 | | | | 1,978,918 | |
4.50%, due 7/20/49 | | | 1,353,092 | | | | 1,445,909 | |
| | | | | | | | |
| | | | | | | 3,424,827 | |
| | | | | | | | |
Overseas Private Investment Corporation 0.3% | |
5.142%, due 12/15/23 | | | 895,202 | | | | 968,921 | |
| | | | | | | | |
|
Tennessee Valley Authority 2.4% | |
3.875%, due 2/15/21 | | | 2,000,000 | | | | 2,045,325 | |
4.65%, due 6/15/35 | | | 4,395,000 | | | | 6,092,686 | |
| | | | | | | | |
| | | | | | | 8,138,011 | |
| | | | | | | | |
United States Treasury Bonds 2.5% | |
3.00%, due 5/15/45 | | | 2,790,000 | | | | 3,746,011 | |
3.00%, due 2/15/48 | | | 2,000,000 | | | | 2,737,891 | |
4.375%, due 11/15/39 | | | 1,200,000 | | | | 1,886,906 | |
| | | | | | | | |
| | | | | | | 8,370,808 | |
| | | | | | | | |
United States Treasury Notes 21.1% | |
0.25%, due 4/15/23 | | | 2,500,000 | | | | 2,505,273 | |
0.375%, due 4/30/25 | | | 5,000,000 | | | | 5,022,656 | |
1.50%, due 2/15/30 | | | 2,615,000 | | | | 2,826,856 | |
1.625%, due 8/15/22 | | | 2,170,000 | | | | 2,236,965 | |
1.625%, due 5/15/26 | | | 380,000 | | | | 407,238 | |
1.75%, due 9/30/22 | | | 3,070,000 | | | | 3,178,769 | |
1.75%, due 5/15/23 | | | 500,000 | | | | 522,500 | |
| | | | |
| 12 | | MainStay VP MacKay Government Portfolio | | The notes to the financial statements are an integral part of,
and should be read in conjunction with, the financial statements. |
| | | | | | | | |
| | | Principal
Amount | | | Value | |
| U.S. Government & Federal Agencies (continued) | |
United States Treasury Notes (continued) | |
2.00%, due 8/31/21 | | $ | 3,775,000 | | | $ | 3,855,071 | |
2.25%, due 4/30/21 | | | 12,000,000 | | | | 12,206,250 | |
2.25%, due 4/30/24 | | | 16,190,000 | | | | 17,447,255 | |
2.375%, due 8/15/24 | | | 1,695,000 | | | | 1,844,107 | |
2.625%, due 1/31/26 | | | 1,700,000 | | | | 1,912,633 | |
2.75%, due 4/30/23 | | | 5,885,000 | | | | 6,311,662 | |
2.75%, due 7/31/23 | | | 845,000 | | | | 911,610 | |
2.75%, due 8/31/23 | | | 1,325,000 | | | | 1,432,139 | |
3.00%, due 10/31/25 | | | 7,805,000 | | | | 8,903,798 | |
| | | | | | | | |
| | | | | | | 71,524,782 | |
| | | | | | | | |
United States Treasury Inflation—Indexed Bond 1.5% | |
0.125%, due 1/15/30 (g) | | | 4,764,465 | | | | 5,147,061 | |
| | | | | | | | |
|
United States Treasury Inflation—Indexed Note 1.4% | |
0.875%, due 1/15/29 (g) | | | 4,011,699 | | | | 4,570,358 | |
| | | | | | | | |
Total U.S. Government & Federal Agencies
(Cost $241,791,157) | | | | | | | 254,108,944 | |
| | | | | | | | |
Total Long-Term Bonds
(Cost $316,159,392) | | | | | | | 330,135,894 | |
| | | | | | | | |
| | |
| | | | | | | | |
| | |
| | | Shares | | | | |
| Short-Term Investments 4.7% | | | | | | | | |
Affiliated Investment Company 4.4% | |
MainStay U.S. Government Liquidity Fund, 0.05% (h) | | | 15,011,218 | | | | 15,011,218 | |
| | | | | | | | |
Total Affiliated Investment Company
(Cost $15,011,218) | | | | | | | 15,011,218 | |
| | | | | | | | |
| | |
| | | | | | | | |
| | | Principal
Amount | | | | |
| U.S. Government & Federal Agencies 0.3% | |
United States Treasury Bills (i)
| | | | | | | | |
0.112%, due 7/30/20 | | $ | 980,000 | | | | 979,913 | |
| | | | | | | | |
Total U.S. Government & Federal Agencies
(Cost $979,913) | | | | | | | 979,913 | |
| | | | | | | | |
Total Short-Term Investments
(Cost $15,991,131) | | | | | | | 15,991,131 | |
| | | | | | | | |
Total Investments
(Cost $332,150,523) | | | 102.1 | % | | | 346,127,025 | |
Other Assets, Less Liabilities | | | (2.1 | ) | | | (7,262,947 | ) |
Net Assets | | | 100.0 | % | | $ | 338,864,078 | |
| † | Percentages indicated are based on Portfolio net assets. |
| ‡ | Less than one-tenth of a percent. |
| (a) | Floating rate—Rate shown was the rate in effect as of June 30, 2020. |
| (b) | May be sold to institutional investors only under Rule 144A or securities offered pursuant to Section 4(a)(2) of the Securities Act of 1933, as amended. |
| (c) | Collateral strip rate—A bond whose interest was based on the weighted net interest rate of the collateral. The coupon rate adjusts periodically based on a predetermined schedule. Rate shown was the rate in effect as of June 30, 2020. |
| (d) | Coupon rate may change based on changes of the underlying collateral or prepayments of principal. Rate shown was the rate in effect as of June 30, 2020. |
| (e) | Collateralized Mortgage Obligation Interest Only Strip—Pays a fixed or variable rate of interest based on mortgage loans or mortgage pass-through securities. The principal amount of the underlying pool represents the notional amount on which the current interest was calculated. The value of these stripped securities may be particularly sensitive to changes in prevailing interest rates and are typically more sensitive to changes in prepayment rates than traditional mortgage-backed securities. |
| (f) | TBA—Securities purchased on a forward commitment basis with an approximate principal amount and maturity date. The actual principal amount and maturity date will be determined upon settlement. As of June 30, 2020, the total net market value of these securities was $6,287,109, which represented 1.9% of the Portfolio’s net assets. All or a portion of these securities are a part of a mortgage dollar roll agreement. |
| (g) | Treasury Inflation Protected Security—Pays a fixed rate of interest on a principal amount that is continuously adjusted for inflation based on the Consumer Price Index-Urban Consumers. |
| (h) | Current yield as of June 30, 2020. |
| (i) | Interest rate shown represents yield to maturity. |
The following abbreviations are used in the preceding pages:
IO—Interest Only
LIBOR—London Interbank Offered Rate
REMIC—Real Estate Mortgage Investment Conduit
TBA—To Be Announced
| | | | | | |
The notes to the financial statements are an integral part of,
and should be read in conjunction with, the financial statements. | | | | | 13 | |
Portfolio of Investments June 30, 2020 (Unaudited) (continued)
The following is a summary of the fair valuations according to the inputs used as of June 30, 2020, for valuing the Portfolio’s assets:
| | | | | | | | | | | | | | | | |
Description | | Quoted
Prices in
Active
Markets for
Identical
Assets
(Level 1) | | | Significant Other
Observable
Inputs
(Level 2) | | | Significant
Unobservable
Inputs
(Level 3) | | | Total | |
| | | | |
Asset Valuation Inputs | | | | | | | | | | | | | | | | |
| Investments in Securities (a) | | | | | | | | | | | | | | | | |
| Long-Term Bonds | | | | | | | | | | | | | | | | |
Asset-Backed Securities | | $ | — | | | $ | 9,761,234 | | | $ | — | | | $ | 9,761,234 | |
Corporate Bonds | | | — | | | | 11,307,730 | | | | — | | | | 11,307,730 | |
Mortgage-Backed Securities | | | — | | | | 54,957,986 | | | | — | | | | 54,957,986 | |
U.S. Government & Federal Agencies | | | — | | | | 254,108,944 | | | | — | | | | 254,108,944 | |
| | | | | | | | | | | | | | | | |
| Total Long-Term Bonds | | | — | | | | 330,135,894 | | | | — | | | | 330,135,894 | |
| | | | | | | | | | | | | | | | |
| Short-Term Investments | | | | | | | | | | | | | | | | |
Affiliated Investment Company | | | 15,011,218 | | | | — | | | | — | | | | 15,011,218 | |
U.S. Government & Federal Agencies | | | — | | | | 979,913 | | | | — | | | | 979,913 | |
| | | | | | | | | | | | | | | | |
| Total Short-Term Investments | | | 15,011,218 | | | | 979,913 | | | | — | | | | 15,991,131 | |
| | | | | | | | | | | | | | | | |
| Total Investments in Securities | | $ | 15,011,218 | | | $ | 331,115,807 | | | $ | — | | | $ | 346,127,025 | |
| | | | | | | | | | | | | | | | |
| (a) | For a complete listing of investments and their industries, see the Portfolio of Investments. |
| | | | |
| 14 | | MainStay VP MacKay Government Portfolio | | The notes to the financial statements are an integral part of,
and should be read in conjunction with, the financial statements. |
Statement of Assets and Liabilities as of June 30, 2020 (Unaudited)
| | | | |
| Assets | | | | |
Investment in unaffiliated securities, at value (identified cost $317,139,305) | | $ | 331,115,807 | |
Investment in affiliated investment company, at value (identified cost $15,011,218) | | | 15,011,218 | |
Receivables: | | | | |
Portfolio shares sold | | | 3,677,503 | |
Dividends and interest | | | 1,141,012 | |
Other assets | | | 1,961 | |
| | | | |
Total assets | | | 350,947,501 | |
| | | | |
| |
| Liabilities | | | | |
Payables: | | | | |
Investment securities purchased | | | 10,807,358 | |
Portfolio shares redeemed | | | 1,032,056 | |
Manager (See Note 3) | | | 133,085 | |
NYLIFE Distributors (See Note 3) | | | 54,490 | |
Professional fees | | | 27,360 | |
Shareholder communication | | | 19,651 | |
Custodian | | | 7,640 | |
Trustees | | | 297 | |
Accrued expenses | | | 1,486 | |
| | | | |
Total liabilities | | | 12,083,423 | |
| | | | |
Net assets | | $ | 338,864,078 | |
| | | | |
| |
| Composition of Net Assets | | | | |
Shares of beneficial interest outstanding (par value of $.001 per share) unlimited number of shares authorized | | $ | 30,233 | |
Additional paid-in capital | | | 321,823,854 | |
| | | | |
| | | 321,854,087 | |
Total distributable earnings (loss) | | | 17,009,991 | |
| | | | |
Net assets | | $ | 338,864,078 | |
| | | | |
| | | | |
Initial Class | | | | |
Net assets applicable to outstanding shares | | $ | 62,266,963 | |
| | | | |
Shares of beneficial interest outstanding | | | 5,510,320 | |
| | | | |
Net asset value per share outstanding | | $ | 11.30 | |
| | | | |
Service Class | | | | |
Net assets applicable to outstanding shares | | $ | 276,597,115 | |
| | | | |
Shares of beneficial interest outstanding | | | 24,722,193 | |
| | | | |
Net asset value per share outstanding | | $ | 11.19 | |
| | | | |
| | | | | | |
The notes to the financial statements are an integral part of,
and should be read in conjunction with, the financial statements. | | | | | 15 | |
Statement of Operations for the six months ended June 30, 2020 (Unaudited)
| | | | |
| Investment Income (Loss) | | | | |
Income | | | | |
Interest | | $ | 3,491,388 | |
Dividends-affiliated | | | 21,211 | |
Securities lending | | | 6,332 | |
Other | | | 958 | |
| | | | |
Total income | | | 3,519,889 | |
| | | | |
Expenses | | | | |
Manager (See Note 3) | | | 737,853 | |
Distribution/Service—Service Class (See Note 3) | | | 301,885 | |
Professional fees | | | 38,228 | |
Custodian | | | 20,381 | |
Shareholder communication | | | 18,694 | |
Trustees | | | 3,090 | |
Miscellaneous | | | 5,732 | |
| | | | |
Total expenses | | | 1,125,863 | |
| | | | |
Net investment income (loss) | | | 2,394,026 | |
| | | | |
|
| Realized and Unrealized Gain (Loss) on Investments | |
Net realized gain (loss) on unaffiliated investments | | | 874,343 | |
Net change in unrealized appreciation (depreciation) on unaffiliated investments | | | 8,169,817 | |
| | | | |
Net realized and unrealized gain (loss) on investments | | | 9,044,160 | |
| | | | |
Net increase (decrease) in net assets resulting from operations | | $ | 11,438,186 | |
| | | | |
| | | | |
| 16 | | MainStay VP MacKay Government Portfolio | | The notes to the financial statements are an integral part of,
and should be read in conjunction with, the financial statements. |
Statements of Changes in Net Assets
for the six months ended June 30, 2020 (Unaudited) and the year ended December 31, 2019
| | | | | | | | |
| | | 2020 | | | 2019 | |
| Increase (Decrease) in Net Assets | |
Operations: | | | | | | | | |
Net investment income (loss) | | $ | 2,394,026 | | | $ | 4,927,803 | |
Net realized gain (loss) on investments | | | 874,343 | | | | 1,165,496 | |
Net change in unrealized appreciation (depreciation) on investments | | | 8,169,817 | | | | 5,203,640 | |
| | | | |
Net increase (decrease) in net assets resulting from operations | | | 11,438,186 | | | | 11,296,939 | |
| | | | |
Distributions to shareholders: | | | | | | | | |
Initial Class | | | — | | | | (1,045,109 | ) |
Service Class | | | — | | | | (3,495,346 | ) |
| | | | |
Total distributions to shareholders | | | — | | | | (4,540,455 | ) |
| | | | |
Capital share transactions: | | | | | | | | |
Net proceeds from sale of shares | | | 141,135,641 | | | | 77,824,673 | |
Net asset value of shares issued to shareholders in reinvestment of distributions | | | — | | | | 4,540,455 | |
Cost of shares redeemed | | | (66,276,966 | ) | | | (48,682,350 | ) |
| | | | |
Increase (decrease) in net assets derived from capital share transactions | | | 74,858,675 | | | | 33,682,778 | |
| | | | |
Net increase (decrease) in net assets | | | 86,296,861 | | | | 40,439,262 | |
| | |
| Net Assets | | | | | | | | |
Beginning of period | | | 252,567,217 | | | | 212,127,955 | |
| | | | |
End of period | | $ | 338,864,078 | | | $ | 252,567,217 | |
| | | | |
| | | | | | |
The notes to the financial statements are an integral part of,
and should be read in conjunction with, the financial statements. | | | | | 17 | |
Financial Highlights selected per share data and ratios
| | | | | | | | | | | | | | | | | | | | | | | | | | | | | | | | | | | |
| | | |
| | | Six months
ended
June 30, | | | | Year ended December 31, |
| | | | | | | |
| Initial Class | | 2020* | | | | 2019 | | 2018 | | 2017 | | 2016 | | 2015 |
| | | | | | | |
Net asset value at beginning of period | | | $ | 10.84 | | | | | | | | | $ | 10.49 | | | | $ | 10.78 | | | | $ | 10.85 | | | | $ | 10.99 | | | | $ | 11.25 | |
| | | | | | | | | | | | | | | | | | | | | | | | | | | | | | | | | | | |
| | | | | | | |
Net investment income (loss) (a) | | | | 0.10 | | | | | | | | | | 0.25 | | | | | 0.26 | | | | | 0.25 | | | | | 0.24 | | | | | 0.29 | |
| | | | | | | |
Net realized and unrealized gain (loss) on investments | | | | 0.36 | | | | | | | | | | 0.32 | | | | | (0.27 | ) | | | | (0.02 | ) | | | | (0.11 | ) | | | | (0.23 | ) |
| | | | | | | | | | | | | | | | | | | | | | | | | | | | | | | | | | | |
| | | | | | | |
Total from investment operations | | | | 0.46 | | | | | | | | | | 0.57 | | | | | (0.01 | ) | | | | 0.23 | | | | | 0.13 | | | | | 0.06 | |
| | | | | | | | | | | | | | | | | | | | | | | | | | | | | | | | | | | |
| | | | | | | |
| Less distributions: | | | | | | | | | | | | | | | | | | | | | | | | | | | | | | | | | | | |
| | | | | | | |
From net investment income | | | | — | | | | | | | | | | (0.22 | ) | | | | (0.28 | ) | | | | (0.30 | ) | | | | (0.27 | ) | | | | (0.32 | ) |
| | | | | | | | | | | | | | | | | | | | | | | | | | | | | | | | | | | |
| | | | | | | |
Net asset value at end of period | | | $ | 11.30 | | | | | | | | | $ | 10.84 | | | | $ | 10.49 | | | | $ | 10.78 | | | | $ | 10.85 | | | | $ | 10.99 | |
| | | | | | | | | | | | | | | | | | | | | | | | | | | | | | | | | | | |
| | | | | | | |
Total investment return (b) | | | | 4.24 | %(c) | | | | | | | | | 5.42 | % | | | | (0.06 | %) | | | | 2.11 | % | | | | 1.07 | % | | | | 0.53 | % |
| | | | | | | |
| Ratios (to average net assets)/Supplemental Data: | | | | | | | | | | | | | | | | | | | | | | | | | | | | | | | | | | | |
| | | | | | | |
Net investment income (loss) | | | | 1.84 | % †† | | | | | | | | | 2.35 | % | | | | 2.44 | % | | | | 2.29 | % | | | | 2.14 | %(d) | | | | 2.54 | % |
| | | | | | | |
Net expenses (e) | | | | 0.56 | % †† | | | | | | | | | 0.57 | % | | | | 0.57 | % | | | | 0.56 | % | | | | 0.55 | %(f) | | | | 0.55 | % |
| | | | | | | |
Expenses (before waiver/reimbursement) (e) | | | | 0.56 | % †† | | | | | | | | | 0.57 | % | | | | 0.57 | % | | | | 0.56 | % | | | | 0.56 | % | | | | 0.55 | % |
| | | | | | | |
Portfolio turnover rate (g) | | | | 35 | % | | | | | | | | | 30 | % | | | | 92 | % | | | | 17 | % | | | | 64 | % | | | | 12 | % |
| | | | | | | |
Net assets at end of period (in 000’s) | | | $ | 62,267 | | | | | | | | | $ | 51,698 | | | | $ | 52,552 | | | | $ | 56,561 | | | | $ | 64,930 | | | | $ | 72,924 | |
| (a) | Per share data based on average shares outstanding during the period. |
| (b) | Total return does not reflect any deduction of sales charges, mortality and expense charges, contract charges or administrative charges. For periods of less than one year, total return is not annualized. |
| (c) | Total investment return may reflect adjustments to conform to generally accepted accounting principles. |
| (d) | Without the custody fee reimbursement, net investment income (loss) would have been 2.13%. |
| (e) | In addition to the fees and expenses which the Portfolio bears directly, it also indirectly bears a pro-rata share of the fees and expenses of the underlying funds in which it invests. Such indirect expenses are not included in the above expense ratios. |
| (f) | Without the custody fee reimbursement, net expenses would have been 0.56%. |
| (g) | The portfolio turnover rates not including mortgage dollar rolls were 31%, 80%, 5%, 19% and 11% for the six months ended June 30, 2020 and for the years ended December 31, 2018, 2017, 2016 and 2015, respectively. |
| | | | | | | | | | | | | | | | | | | | | | | | | | | | | | | | | | | |
| | | |
| | | Six months
ended
June 30, | | | | Year ended December 31, |
| | | | | | | |
| Service Class | | 2020* | | | | 2019 | | 2018 | | 2017 | | 2016 | | 2015 |
| | | | | | | |
Net asset value at beginning of period | | | $ | 10.74 | | | | | | | | | $ | 10.41 | | | | $ | 10.69 | | | | $ | 10.76 | | | | $ | 10.90 | | | | $ | 11.16 | |
| | | | | | | | | | | | | | | | | | | | | | | | | | | | | | | | | | | |
| | | | | | | |
Net investment income (loss) (a) | | | | 0.09 | | | | | | | | | | 0.22 | | | | | 0.23 | | | | | 0.22 | | | | | 0.21 | | | | | 0.26 | |
| | | | | | | |
Net realized and unrealized gain (loss) on investments | | | | 0.36 | | | | | | | | | | 0.31 | | | | | (0.26 | ) | | | | (0.03 | ) | | | | (0.11 | ) | | | | (0.23 | ) |
| | | | | | | | | | | | | | | | | | | | | | | | | | | | | | | | | | | |
| | | | | | | |
Total from investment operations | | | | 0.45 | | | | | | | | | | 0.53 | | | | | (0.03 | ) | | | | 0.19 | | | | | 0.10 | | | | | 0.03 | |
| | | | | | | | | | | | | | | | | | | | | | | | | | | | | | | | | | | |
| | | | | | | |
| Less distributions: | | | | | | | | | | | | | | | | | | | | | | | | | | | | | | | | | | | |
| | | | | | | |
From net investment income | | | | — | | | | | | | | | | (0.20 | ) | | | | (0.25 | ) | | | | (0.26 | ) | | | | (0.24 | ) | | | | (0.29 | ) |
| | | | | | | | | | | | | | | | | | | | | | | | | | | | | | | | | | | |
| | | | | | | |
Net asset value at end of period | | | $ | 11.19 | | | | | | | | | $ | 10.74 | | | | $ | 10.41 | | | | $ | 10.69 | | | | $ | 10.76 | | | | $ | 10.90 | |
| | | | | | | | | | | | | | | | | | | | | | | | | | | | | | | | | | | |
| | | | | | | |
Total investment return (b) | | | | 4.19 | %(c) | | | | | | | | | 5.15 | % | | | | (0.31 | %) | | | | 1.86 | % | | | | 0.82 | % | | | | 0.28 | % |
| | | | | | | |
| Ratios (to average net assets)/Supplemental Data: | | | | | | | | | | | | | | | | | | | | | | | | | | | | | | | | | | | |
| | | | | | | |
Net investment income (loss) | | | | 1.57 | % †† | | | | | | | | | 2.09 | % | | | | 2.19 | % | | | | 2.04 | % | | | | 1.89 | %(d) | | | | 2.29 | % |
| | | | | | | |
Net expenses (e) | | | | 0.81 | % †† | | | | | | | | | 0.82 | % | | | | 0.82 | % | | | | 0.81 | % | | | | 0.80 | %(f) | | | | 0.80 | % |
| | | | | | | |
Expenses (before waiver/reimbursement) (e) | | | | 0.81 | % †† | | | | | | | | | 0.82 | % | | | | 0.82 | % | | | | 0.81 | % | | | | 0.81 | % | | | | 0.80 | % |
| | | | | | | |
Portfolio turnover rate (g) | | | | 35 | % | | | | | | | | | 30 | % | | | | 92 | % | | | | 17 | % | | | | 64 | % | | | | 12 | % |
| | | | | | | |
Net assets at end of period (in 000’s) | | | $ | 276,597 | | | | | | | | | $ | 200,869 | | | | $ | 159,575 | | | | $ | 155,477 | | | | $ | 186,207 | | | | $ | 178,259 | |
| (a) | Per share data based on average shares outstanding during the period. |
| (b) | Total return does not reflect any deduction of sales charges, mortality and expense charges, contract charges or administrative charges. For periods of less than one year, total return is not annualized. |
| (c) | Total investment return may reflect adjustments to conform to generally accepted accounting principles. |
| (d) | Without the custody fee reimbursement, net investment income (loss) would have been 1.88%. |
| (e) | In addition to the fees and expenses which the Portfolio bears directly, it also indirectly bears a pro-rata share of the fees and expenses of the underlying funds in which it invests. Such indirect expenses are not included in the above expense ratios. |
| (f) | Without the custody fee reimbursement, net expenses would have been 0.81%. |
| (g) | The portfolio turnover rates not including mortgage dollar rolls were 31%, 80%, 5%, 19% and 11% for the six months ended June 30, 2020 and for the years ended December 31, 2018, 2017, 2016 and 2015, respectively. |
| | | | |
| 18 | | MainStay VP MacKay Government Portfolio | | The notes to the financial statements are an integral part of,
and should be read in conjunction with, the financial statements. |
Notes to Financial Statements (Unaudited)
Note 1–Organization and Business
MainStay VP Funds Trust (the “Fund”) was organized as a Delaware statutory trust on February 1, 2011. The Fund is registered under the Investment Company Act of 1940, as amended (the “1940 Act”), as an open-end management investment company. The Fund is comprised of thirty-one separate series (collectively referred to as the “Portfolios”). These financial statements and notes relate to the MainStay VP MacKay Government Portfolio (the “Portfolio”), a “diversified” portfolio, as that term is defined in the 1940 Act, as interpreted or modified by regulatory authorities having jurisdiction, from time to time.
Shares of the Portfolio are currently offered to certain separate accounts to fund variable annuity policies and variable universal life insurance policies issued by New York Life Insurance and Annuity Corporation (“NYLIAC”), a wholly-owned subsidiary of New York Life Insurance Company (“New York Life”) and may also be offered to fund variable annuity policies and variable universal life insurance policies issued by other insurance companies. NYLIAC allocates shares of the Portfolios to, among others, certain NYLIAC separate accounts. Shares of the Portfolio are also offered to the MainStay VP Conservative Allocation Portfolio, MainStay VP Moderate Allocation Portfolio, MainStay VP Moderate Growth Allocation Portfolio and MainStay VP Growth Allocation Portfolio, which operate as “funds-of-funds,” and other variable insurance funds.
The Portfolio currently offers two classes of shares. Initial Class shares commenced operations on January 29, 1993. Service Class shares commenced operations on June 4, 2003. Shares of the Portfolio are offered and are redeemed at a price equal to their respective net asset value (“NAV”) per share. No sales or redemption charge is applicable to the purchase or redemption of the Portfolio’s shares. Under the terms of the Fund’s multiple class plan adopted pursuant to Rule 18f-3 under the 1940 Act, the classes differ in that, among other things, Service Class shares of the Portfolio pay a combined distribution and service fee of 0.25% of average daily net assets attributable to Service Class shares of the Portfolio to the Distributor (as defined in Note 3 (B)) pursuant to a plan adopted in accordance with Rule 12b-1 under the 1940 Act. Contract owners of variable annuity contracts purchased after June 2, 2003, are permitted to invest only in the Service Class shares.
The Portfolio’s investment objective is to seek current income.
Note 2–Significant Accounting Policies
The Portfolio is an investment company and accordingly follows the investment company accounting and reporting guidance of the Financial Accounting Standards Board (“FASB”) Accounting Standard Codification Topic 946 Financial Services—Investment Companies. The Portfolio prepares its financial statements in accordance with generally accepted accounting principles (“GAAP”) in the United States of America and follows the significant accounting policies described below.
(A) Securities Valuation. Investments are usually valued as of the close of regular trading on the New York Stock Exchange (the “Exchange”) (usually 4:00 p.m. Eastern time) on each day the Portfolio is open for business (“valuation date”).
The Board of Trustees of the Fund (the “Board”) adopted procedures establishing methodologies for the valuation of the Portfolio’s securities
and other assets and delegated the responsibility for valuation determinations under those procedures to the Valuation Committee of the Fund (the “Valuation Committee”). The procedures state that, subject to the oversight of the Board and unless otherwise noted, the responsibility for the day-to-day valuation of portfolio assets (including fair value measurements for the Portfolio’s assets and liabilities) rests with New York Life Investment Management LLC (“New York Life Investments” or the “Manager”), aided to whatever extent necessary by the Subadvisor (as defined in Note 3(A)). To assess the appropriateness of security valuations, the Manager, the Subadvisor or the Portfolio’s third-party service provider, who is subject to oversight by the Manager, regularly compares prior day prices, prices on comparable securities and the sale prices to the prior and current day prices and challenges prices with changes exceeding certain tolerance levels with third-party pricing services or broker sources.
The Board authorized the Valuation Committee to appoint a Valuation Subcommittee (the “Subcommittee”) to establish the prices of securities for which market quotations are not readily available or the prices of which are not otherwise readily determinable under the procedures. The Subcommittee meets (in person, via electronic mail or via teleconference) on an as-needed basis. The Valuation Committee meets to ensure that actions taken by the Subcommittee were appropriate.
For those securities valued through either a standardized fair valuation methodology or a fair valuation measurement, the Subcommittee deals with such valuation and the Valuation Committee reviews and affirms, if appropriate, the reasonableness of the valuation based on such methodologies and measurements on a regular basis after considering information that is reasonably available and deemed relevant by the Valuation Committee. Any action taken by the Subcommittee with respect to the valuation of a portfolio security or other asset is submitted for review and ratification (if appropriate) to the Valuation Committee and the Board at the next regularly scheduled meeting.
“Fair value” is defined as the price the Portfolio would reasonably expect to receive upon selling an asset or liability in an orderly transaction to an independent buyer in the principal or most advantageous market for the asset or liability. Fair value measurements are determined within a framework that establishes a three-tier hierarchy that maximizes the use of observable market data and minimizes the use of unobservable inputs to establish a classification of fair value measurements for disclosure purposes. “Inputs” refer broadly to the assumptions that market participants would use in pricing the asset or liability, including assumptions about risk, such as the risk inherent in a particular valuation technique used to measure fair value using a pricing model and/or the risk inherent in the inputs for the valuation technique. Inputs may be observable or unobservable. Observable inputs reflect the assumptions market participants would use in pricing the asset or liability based on market data obtained from sources independent of the Portfolio. Unobservable inputs reflect the Portfolio’s own assumptions about the assumptions market participants would use in pricing the asset or liability based on the information available. The inputs or methodology used for valuing assets or liabilities may not be an indication of the risks associated with investing in those assets or liabilities. The three-tier hierarchy of inputs is summarized below.
| • | | Level 1—quoted prices in active markets for an identical asset or liability |
Notes to Financial Statements (Unaudited) (continued)
| • | | Level 2—other significant observable inputs (including quoted prices for a similar asset or liability in active markets, interest rates and yield curves, prepayment speeds, credit risk, etc.) |
| • | | Level 3—significant unobservable inputs (including the Portfolio’s own assumptions about the assumptions that market participants would use in measuring fair value of an asset or liability) |
The level of an asset or liability within the fair value hierarchy is based on the lowest level of an input, both individually and in the aggregate, that is significant to the fair value measurement. The aggregate value by input level of the Portfolio’s assets and liabilities as of June 30, 2020 is included at the end of the Portfolio of Investments.
The Portfolio may use third-party vendor evaluations, whose prices may be derived from one or more of the following standard inputs, among others:
| | |
• Benchmark yields | | • Reported trades |
• Broker/dealer quotes | | • Issuer spreads |
• Two-sided markets | | • Benchmark securities |
• Bids/offers | | • Reference data (corporate actions or material event notices) |
• Industry and economic events | | • Comparable bonds |
• Monthly payment information | | |
An asset or liability for which market values cannot be measured using the methodologies described above is valued by methods deemed reasonable in good faith by the Valuation Committee, following the procedures established by the Board, to represent fair value. Under these procedures, the Portfolio generally uses a market-based approach which may use related or comparable assets or liabilities, recent transactions, market multiples, book values and other relevant information. The Portfolio may also use an income-based valuation approach in which the anticipated future cash flows of the asset or liability are discounted to calculate fair value. Discounts may also be applied due to the nature and/or duration of any restrictions on the disposition of the asset or liability. Fair value represents a good faith approximation of the value of a security. Fair value determinations involve the consideration of a number of subjective factors, an analysis of applicable facts and circumstances and the exercise of judgment. As a result, it is possible that the fair value for a security determined in good faith in accordance with the Portfolio’s valuation procedures may differ from valuations for the same security determined by other funds using their own valuation procedures. Although the Portfolio’s valuation procedures are designed to value a security at the price the Portfolio may reasonably expect to receive upon the security’s sale in an orderly transaction, there can be no assurance that any fair value determination thereunder would, in fact, approximate the amount that the Portfolio would actually realize upon the sale of the security or the price at which the security would trade if a reliable market price were readily available. During the six-month period ended June 30, 2020, there were no material changes to the fair value methodologies.
Securities which may be valued in this manner include, but are not limited to: (i) a security for which trading has been halted or suspended; (ii) a debt security that has recently gone into default and for which there is not a current market quotation; (iii) a security of an issuer that
has entered into a restructuring; (iv) a security that has been delisted from a national exchange; (v) a security for which the market price is not readily available from a third-party pricing source or, if so provided, does not, in the opinion of the Manager or the Subadvisor, reflect the security’s market value; (vi) a security subject to trading collars for which no or limited trading takes place; and (vii) a security whose principal market has been temporarily closed at a time when, under normal conditions, it would be open. Securities valued in this manner are generally categorized as Level 3 in the hierarchy. As of June 30, 2020, no securities held by the Portfolio were fair valued in such a manner.
Debt securities (other than convertible and municipal bonds) are valued at the evaluated bid prices (evaluated mean prices in the case of convertible and municipal bonds) supplied by a pricing agent or broker selected by the Manager, in consultation with the Subadvisor. The evaluations are market-based measurements processed through a pricing application and represents the pricing agent’s good faith determination as to what a holder may receive in an orderly transaction under market conditions. The rules based logic utilizes valuation techniques that reflect participants’ assumptions and vary by asset class and per methodology, maximizing the use of relevant observable data including quoted prices for similar assets, benchmark yield curves and market corroborated inputs. The evaluated bid or mean prices are deemed by the Manager, in consultation with the Subadvisor, to be representative of market values at the regular close of trading of the Exchange on each valuation date. Debt securities purchased on a delayed delivery basis are marked to market daily until settlement at the forward settlement date. Debt securities, including corporate bonds, U.S. government and federal agency bonds, municipal bonds, foreign bonds, convertible bonds, asset-backed securities and mortgage-backed securities are generally categorized as Level 2 in the hierarchy.
Temporary cash investments acquired in excess of 60 days to maturity at the time of purchase are valued using the latest bid prices or using valuations based on a matrix system (which considers such factors as security prices, yields, maturities and ratings), both as furnished by independent pricing services. Temporary cash investments that mature in 60 days or less at the time of purchase (“Short-Term Investments”) are valued using the amortized cost method of valuation, unless the use of such method would be inappropriate. The amortized cost method involves valuing a security at its cost on the date of purchase and thereafter assuming a constant amortization to maturity of the difference between such cost and the value on maturity date. Amortized cost approximates the current fair value of a security. Securities valued using the amortized cost method are not valued using quoted prices in an active market and are generally categorized as Level 2 in the hierarchy.
The information above is not intended to reflect an exhaustive list of the methodologies that may be used to value portfolio investments. The valuation procedures permit the use of a variety of valuation methodologies in connection with valuing portfolio investments. The methodology used for a specific type of investment may vary based on the market data available or other considerations. The methodologies summarized above may not represent the specific means by which portfolio investments are valued on any particular business day.
(B) Income Taxes. The Portfolio’s policy is to comply with the requirements of the Internal Revenue Code of 1986, as amended (the
| | |
| 20 | | MainStay VP MacKay Government Portfolio |
“Internal Revenue Code”), applicable to regulated investment companies and to distribute all of its taxable income to the shareholders of the Portfolio within the allowable time limits.
The Manager evaluates the Portfolio’s tax positions to determine if the tax positions taken meet the minimum recognition threshold in connection with accounting for uncertainties in income tax positions taken or expected to be taken for the purposes of measuring and recognizing tax liabilities in the financial statements. Recognition of tax benefits of an uncertain tax position is permitted only to the extent the position is “more likely than not” to be sustained assuming examination by taxing authorities. The Manager analyzed the Portfolio’s tax positions taken on federal, state and local income tax returns for all open tax years (for up to three tax years) and has concluded that no provisions for federal, state and local income tax are required in the Portfolio’s financial statements. The Portfolio’s federal, state and local income tax and federal excise tax returns for tax years for which the applicable statutes of limitations have not expired are subject to examination by the Internal Revenue Service and state and local departments of revenue.
(C) Dividends and Distributions to Shareholders. Dividends and distributions are recorded on the ex-dividend date. The Portfolio intends to declare and pay dividends from net investment income and distributions from net realized capital and currency gains, if any, at least annually. Unless a shareholder elects otherwise, all dividends and distributions are reinvested at NAV in the same class of shares of the Portfolio. Dividends and distributions to shareholders are determined in accordance with federal income tax regulations and may differ from determinations using GAAP.
(D) Security Transactions and Investment Income. The Portfolio records security transactions on the trade date. Realized gains and losses on security transactions are determined using the identified cost method. Interest income is accrued as earned using the effective interest rate method and includes any realized gains and losses from repayments of principal on mortgage-backed securities. Distributions received from real estate investment trusts may be classified as dividends, capital gains and/or return of capital. Discounts and premiums on securities purchased for the Portfolio are accreted and amortized, respectively, on the effective interest rate method.
Investment income and realized and unrealized gains and losses on investments of the Portfolio are allocated pro rata to the separate classes of shares based upon their relative net assets on the date the income is earned or realized and unrealized gains and losses are incurred.
The Portfolio may place a debt security on non-accrual status and reduce related interest income by ceasing current accruals and writing off all or a portion of any interest receivables when the collection of all or a portion of such interest has become doubtful. A debt security is removed from non-accrual status when the issuer resumes interest payments or when collectability of interest is reasonably assured.
(E) Expenses. Expenses of the Fund are allocated to the individual Portfolios in proportion to the net assets of the respective Portfolios when the expenses are incurred, except where direct allocations of expenses can be made. Expenses (other than fees incurred under the distribution and service plans, further discussed in Note 3(B), which are charged directly to the Service Class shares) are allocated to separate
classes of shares pro rata based upon their relative net assets on the date the expenses are incurred. The expenses borne by the Portfolio, including those of related parties to the Portfolio, are shown in the Statement of Operations.
Additionally, the Portfolio may invest in mutual funds, which are subject to management fees and other fees that may cause the costs of investing in mutual funds to be greater than the costs of owning the underlying securities directly. These indirect expenses of mutual funds are not included in the amounts shown as expenses in the Portfolio’s Statement of Operations or in the expense ratios included in the Financial Highlights.
(F) Use of Estimates. In preparing financial statements in conformity with GAAP, the Manager makes estimates and assumptions that affect the reported amounts and disclosures in the financial statements. Actual results could differ from those estimates.
(G) Repurchase Agreements. The Portfolio may enter into repurchase agreements (i.e., buy a security from another party with the agreement that it will be sold back in the future) to earn income. The Portfolio may enter into repurchase agreements only with counterparties, usually financial institutions, that are deemed by the Manager or the Subadvisor to be creditworthy, pursuant to guidelines established by the Board. During the term of any repurchase agreement, the Manager or the Subadvisor will continue to monitor the creditworthiness of the counterparty. Under the 1940 Act, repurchase agreements are considered to be collateralized loans by the Portfolio to the counterparty secured by the securities transferred to the Portfolio.
Repurchase agreements are subject to counterparty risk, meaning the Portfolio could lose money by the counterparty’s failure to perform under the terms of the agreement. The Portfolio mitigates this risk by ensuring the repurchase agreement is collateralized by cash, U.S. government securities, fixed income securities and/or other securities. The collateral is held by the Portfolio’s custodian and valued daily on a mark to market basis to determine if the value, including accrued interest, exceeds the repurchase price. In the event of the counterparty’s default on the obligation to repurchase, the Portfolio has the right to liquidate the collateral and apply the proceeds in satisfaction of the obligation. Under certain circumstances, such as in the event of default or bankruptcy by the counterparty, realization and/or retention of the collateral may be limited or subject to delay, to legal proceedings and possible realized loss to the Portfolio. As of June 30, 2020, the Portfolio did not hold any repurchase agreements.
(H) Dollar Rolls. The Portfolio may enter into dollar roll transactions in which it sells mortgage-backed securities (“MBS”) from its portfolio to a counterparty from whom it simultaneously agrees to buy a similar security on a delayed delivery basis. The Portfolio generally transfers MBS where the MBS are “to be announced,” therefore, the Portfolio accounts for these transactions as purchases and sales.
When accounted for as purchase and sales, the securities sold in connection with the dollar rolls are removed from the portfolio and a realized gain or loss is recognized. The securities the Portfolio has agreed to acquire are included at market value in the Portfolio of Investments and liabilities for such purchase commitments are included as payables for investments purchased. During the roll period, the Portfolio foregoes principal and interest paid on the securities. The
Notes to Financial Statements (Unaudited) (continued)
Portfolio is compensated by the difference between the current sales price and the forward price for the future as well as by the earnings on the cash proceeds of the initial sale. Dollar rolls may be renewed without physical delivery of the securities subject to the contract. The Portfolio maintains liquid assets from its portfolio having a value not less than the repurchase price, including accrued interest. Dollar roll transactions involve certain risks, including the risk that the securities returned to the Portfolio at the end of the roll period, while substantially similar, could be inferior to what was initially sold to the counterparty.
The Portfolio accounts for a dollar roll transaction as a purchase and sale whereby the difference in the sales price and purchase price of the security sold is recorded as a realized gain (loss).
(I) Securities Lending. In order to realize additional income, the Portfolio may engage in securities lending, subject to the limitations set forth in the 1940 Act and relevant guidance by the staff of the Securities and Exchange Commission (“SEC”). If the Portfolio engages in securities lending, the Portfolio will lend through its custodian, currently State Street Bank and Trust Company (“State Street”), acting as securities lending agent on behalf of the Portfolio. Under the current arrangement, State Street will manage the Portfolio’s collateral in accordance with the securities lending agency agreement between the Portfolio and State Street, and indemnify the Portfolio against counterparty risk. The loans will be collateralized by cash (which may be invested in a money market fund) and/or non-cash collateral (which may include U.S. Treasury securities and/or U.S. government agency securities issued or guaranteed by the United States government or its agencies or instrumentalities) at least equal at all times to the market value of the securities loaned. The Portfolio bears the risk of delay in recovery of, or loss of rights in, the securities loaned. The Portfolio may also record a realized gain or loss on securities deemed sold due to a borrower’s inability to return securities on loan. The Portfolio bears the risk of any loss on investment of cash collateral. The Portfolio will receive compensation for lending its securities in the form of fees or it will retain a portion of interest earned on the investment of any cash collateral. The Portfolio will also continue to receive interest and dividends on the securities loaned and any gain or loss in the market price of the securities loaned that may occur during the term of the loan will be for the account of the Portfolio. Income earned from securities lending activities, if any, is reflected in the Statement of Operations. As of June 30, 2020, the Portfolio did not have any portfolio securities on loan.
(J) Debt Securities Risk. The ability of issuers of debt securities held by the Portfolio to meet their obligations may be affected by, among other things, economic or political developments in a specific country, industry or region. Debt securities are also subject to the risks associated with changes in interest rates.
Investments in the Portfolio are not guaranteed, even though some of the Portfolio’s underlying investments are guaranteed by the U.S. government or its agencies or instrumentalities. The principal risk of mortgage-related and asset-backed securities is that the underlying debt may be prepaid ahead of schedule, if interest rates fall, thereby reducing the value of the Portfolio’s investment. If interest rates rise, less of the debt may be prepaid and the Portfolio may lose money because the Portfolio may be unable to invest in higher yielding assets. The Portfolio is subject to interest-rate risk and can lose principal value
when interest rates rise. Bonds are also subject to credit risk, in which the bond issuer may fail to pay interest and principal in a timely manner.
(K) LIBOR Replacement Risk. The Portfolio may invest in certain debt securities, derivatives or other financial instruments that utilize the London Interbank Offered Rate (“LIBOR”), as a “benchmark” or “reference rate” for various interest rate calculations. The United Kingdom Financial Conduct Authority, which regulates LIBOR, announced that after 2021 it will cease its active encouragement of banks to provide the quotations needed to sustain LIBOR. As a result, it is anticipated that LIBOR will be discontinued or will no longer be sufficiently robust to be representative of its underlying market around that time. Although financial regulators and industry working groups have suggested alternative reference rates, such as the European Interbank Offer Rate (“EURIBOR”), Sterling Overnight Interbank Average Rate (“SONIA”) and Secured Overnight Financing Rate (“SOFR”), there are challenges to converting certain contracts and transactions to a new benchmark and neither the full effects of the transition process nor its ultimate outcome is known.
The elimination of LIBOR or changes to other reference rates or any other changes or reforms to the determination or supervision of reference rates could have an adverse impact on the market for, or value of, any securities or payments linked to those reference rates, which may adversely affect the Portfolio’s performance and/or net asset value. Uncertainty and risk also remain regarding the willingness and ability of issuers and lenders to include revised provisions in new and existing contracts or instruments. Consequently, the transition away from LIBOR to other reference rates may lead to increased volatility and illiquidity in markets that are tied to LIBOR, fluctuations in values of LIBOR-related investments or investments in issuers that utilize LIBOR, increased difficulty in borrowing or refinancing and diminished effectiveness of hedging strategies, adversely affecting the Portfolio’s performance. Furthermore, the risks associated with the expected discontinuation of LIBOR and transition may be exacerbated if the work necessary to effect an orderly transition to an alternative reference rate is not completed in a timely manner. Because the usefulness of LIBOR as a benchmark could deteriorate during the transition period, these effects could occur prior to the end of 2021.
(L) Indemnifications. Under the Fund’s organizational documents, its officers and trustees are indemnified against certain liabilities that may arise out of performance of their duties to the Fund. Additionally, in the normal course of business, the Portfolio enters into contracts with third-party service providers that contain a variety of representations and warranties and that may provide general indemnifications. The Portfolio’s maximum exposure under these arrangements is unknown, as this would involve future claims that may be made against the Portfolio that have not yet occurred. The Manager believes that the risk of loss in connection with these potential indemnification obligations is remote. However, there can be no assurance that material liabilities related to such obligations will not arise in the future, which could adversely impact the Portfolio.
Note 3–Fees and Related Party Transactions
(A) Manager and Subadvisor. New York Life Investments, a registered investment adviser and an indirect, wholly-owned subsidiary of New York Life, serves as the Portfolio’s Manager pursuant to an
| | |
| 22 | | MainStay VP MacKay Government Portfolio |
Amended and Restated Management Agreement (“Management Agreement”). The Manager provides offices, conducts clerical, recordkeeping and bookkeeping services, and keeps most of the financial and accounting records required to be maintained by the Portfolio. Except for the portion of salaries and expenses that are the responsibility of the Portfolio, the Manager pays the salaries and expenses of all personnel affiliated with the Portfolio and certain operational expenses of the Portfolio. The Portfolio reimburses New York Life Investments in an amount equal to the portion of the compensation of the Chief Compliance Officer attributable to the Portfolio. MacKay Shields LLC (“MacKay Shields” or “Subadvisor”), a registered investment adviser and an indirect, wholly-owned subsidiary of New York Life, serves as Subadvisor to the Portfolio and is responsible for the day-to-day portfolio management of the Portfolio. Pursuant to the terms of an Amended and Restated Subadvisory Agreement (“Subadvisory Agreement”) between New York Life Investments and MacKay Shields, New York Life Investments pays for the services of the Subadvisor.
The Fund, on behalf of the Portfolio, pays New York Life Investments in its capacity as the Portfolio’s investment manager and administrator, pursuant to the Management Agreement, a monthly fee for the services performed and facilities furnished at an annual rate of the Portfolio’s average daily net assets as follows: 0.50% up to $500 million; 0.475% from $500 million to $1 billion; and 0.45% in excess of $1 billion. During the six-month period ended June 30, 2020, the effective management fee rate was 0.50%.
During the six-month period ended June 30, 2020, New York Life Investments earned fees from the Portfolio in the amount of $737,853 and paid the Subadvisor in the amount of $368,926.
State Street provides sub-administration and sub-accounting services to the Portfolio pursuant to an agreement with New York Life Investments. These services include calculating the daily NAVs of the Portfolio, maintaining the general ledger and sub-ledger accounts for the calculation of the Portfolio’s NAVs and assisting New York Life Investments in conducting various aspects of the Portfolio’s administrative operations. For providing these services to the Portfolio, State Street is compensated by New York Life Investments.
Pursuant to an agreement between the Fund and New York Life Investments, New York Life Investments is responsible for providing or procuring certain regulatory reporting services for the Portfolio. The Portfolio will reimburse New York Life Investments for the actual costs incurred by New York Life Investments in connection with providing or procuring these services for the Portfolio.
(B) Distribution and Service Fees. The Fund, on behalf of the Portfolio, has entered into a distribution agreement with NYLIFE Distributors LLC (the “Distributor”), an indirect, wholly-owned subsidiary of New York Life. The Portfolio has adopted a distribution plan (the “Plan”) in accordance with the provisions of Rule 12b-1 under the 1940 Act. Under the Plan, the Distributor has agreed to provide, through its affiliates or independent third parties, various distribution-related, shareholder and administrative support services to the Service Class shareholders. For its services, the Distributor is entitled to a combined distribution and service fee accrued daily and paid monthly at an annual rate of 0.25% of the average daily net assets attributable to the Service Class shares of the Portfolio.
(C) Investments in Affiliates (in 000’s). During the six-month period ended June 30, 2020, purchases and sales transactions, income earned from investments and shares held of investment companies managed by New York Life Investments or its affiliates were as follows:
| | | | | | | | | | | | | | | | | | | | | | | | | | | | | | | | | | | | |
Affiliated Investment Company | | Value,
Beginning of
Period | | | Purchases
at Cost | | | Proceeds from
Sales | | | Net
Realized
Gain/
(Loss)
on Sales | | | Change in
Unrealized
Appreciation/
(Depreciation) | | | Value,
End of
Period | | | Dividend
Income | | | Other
Distributions | | | Shares
End of
Period | |
MainStay U.S. Government Liquidity Fund | | $ | 4,751 | | | $ | 129,265 | | | $ | (119,005 | ) | | $ | — | | | $ | — | | | $ | 15,011 | | | $ | 21 | | | $ | — | | | | 15,011 | |
Note 4–Federal Income Tax
As of June 30, 2020, the cost and unrealized appreciation (depreciation) of the Portfolio’s investment portfolio, including applicable derivative contracts and other financial instruments, as determined on a federal income tax basis, was as follows:
| | | | | | | | | | | | | | | | |
| | | Federal
Tax Cost | | | Gross
Unrealized
Appreciation | | | Gross
Unrealized
(Depreciation) | | | Net
Unrealized
Appreciation/
(Depreciation) | |
| | | | |
Investments in Securities | | $ | 332,161,985 | | | $ | 14,044,544 | | | $ | (79,504 | ) | | $ | 13,965,040 | |
As of December 31, 2019, for federal income tax purposes, capital loss carryforwards of $5,151,239 were available as shown in the table below, to the extent provided by the regulations to offset future realized gains of the Portfolio through the years indicated. To the extent that these capital loss carryforwards are used to offset future capital gains, it
is probable that the capital gains so offset will not be distributed to shareholders. No capital gain distributions shall be made until any capital loss carryforwards have been fully utilized or have expired.
| | | | |
Capital Loss
Available Through | | Short-Term
Capital Loss
Amounts (000’s) | | Long-Term
Capital Loss
Amounts (000’s) |
| | |
| Unlimited | | $589 | | $4,562 |
Notes to Financial Statements (Unaudited) (continued)
During the year ended December 31, 2019, the tax character of distributions paid as reflected in the Statements of Changes in Net Assets was as follows:
| | |
|
| 2019 |
Tax-Based
Distributions
from Ordinary
Income | | Tax-Based
Distributions
from Long-Term
Gains |
| |
| $4,540,455 | | $— |
Note 5–Custodian
State Street is the custodian of cash and securities held by the Portfolio. Custodial fees are charged to the Portfolio based on the Portfolio’s net assets and/or the market value of securities held by the Portfolio and the number of certain transactions incurred by the Portfolio.
Note 6–Line of Credit
The Portfolio and certain other funds managed by New York Life Investments maintain a line of credit with a syndicate of banks in order to secure a source of funds for temporary purposes to meet unanticipated or excessive redemption requests.
Effective July 28, 2020, under the credit agreement (the “Credit Agreement”), the aggregate commitment amount is $600,000,000 with an additional uncommitted amount of $100,000,000. The commitment fee is an annual rate of 0.15% of the average commitment amount payable quarterly, regardless of usage, to JP Morgan Chase Bank NA, who serves as the agent to the syndicate. The commitment fee is allocated among the Portfolio and certain other funds managed by New York Life Investments based upon their respective net assets and other factors. Interest on any revolving credit loan is charged based upon the Federal Funds Rate or the one-month LIBOR, whichever is higher. The Credit Agreement expires on July 27, 2021, although the Portfolio, certain other funds managed by New York Life Investments and the syndicate of banks may renew the Credit Agreement for an additional year on the same or different terms or enter into a credit agreement with a different syndicate of banks. Prior to July 28, 2020, the aggregate commitment amount and the commitment fee were the same as those under the current Credit Agreement, but State Street Served as agent to the syndicate. As of June 30, 2020, there were no borrowings outstanding with respect to the Portfolio under the Credit Agreement or the credit agreement for which State Street served as agent.
Note 7–Interfund Lending Program
Pursuant to an exemptive order issued by the SEC, the Portfolio, along with certain other funds managed by New York Life Investments, may participate in an interfund lending program. The interfund lending program provides an alternative credit facility that permits the Portfolio and certain other funds managed by New York Life Investments to lend or borrow money for temporary purposes directly to or from one another subject to the conditions of the exemptive order. During the six-month period ended June 30, 2020, there were no interfund loans made or outstanding with respect to the Portfolio.
Note 8–Purchases and Sales of Securities (in 000’s)
During the six-month period ended June 30, 2020, purchases and sales of U.S. government securities were $138,623 and $98,886, respectively. Purchases and sales of securities, other than U.S. government securities and short-term securities, were $22,015 and $1,454, respectively.
Note 9–Capital Share Transactions
Transactions in capital shares for the six-month period ended June 30, 2020 and the year ended December 31, 2019, were as follows:
| | | | | | | | |
Initial Class | | Shares | | | Amount | |
| | |
Six-month period ended June 30, 2020: | | | | | | | | |
Shares sold | | | 1,326,112 | | | $ | 14,892,010 | |
Shares redeemed | | | (586,074 | ) | | | (6,540,261 | ) |
| | | | |
Net increase (decrease) | | | 740,038 | | | $ | 8,351,749 | |
| | | | |
Year ended December 31, 2019: | | | | | | | | |
Shares sold | | | 333,172 | | | $ | 3,602,034 | |
Shares issued to shareholders in reinvestment of distributions | | | 95,996 | | | | 1,045,109 | |
Shares redeemed | | | (669,585 | ) | | | (7,205,847 | ) |
| | | | |
Net increase (decrease) | | | (240,417 | ) | | $ | (2,558,704 | ) |
| | | | |
| | |
| | | | | | | | |
Service Class | | Shares | | | Amount | |
Six-month period ended June 30, 2020: | | | | | | | | |
Shares sold | | | 11,420,278 | | | $ | 126,243,631 | |
Shares redeemed | | | (5,394,558 | ) | | | (59,736,705 | ) |
| | | | |
Net increase (decrease) | | | 6,025,720 | | | $ | 66,506,926 | |
| | | | |
Year ended December 31, 2019: | | | | | | | | |
Shares sold | | | 6,932,390 | | | $ | 74,222,639 | |
Shares issued to shareholders in reinvestment of distributions | | | 323,666 | | | | 3,495,346 | |
Shares redeemed | | | (3,895,948 | ) | | | (41,476,503 | ) |
| | | | |
Net increase (decrease) | | | 3,360,108 | | | $ | 36,241,482 | |
| | | | |
Note 10–Recent Accounting Pronouncement
In March 2020, the Financial Accounting Standards Board (“FASB”) issued Accounting Standards Update 2020-04 (“ASU 2020-04”), which provides optional guidance to ease the potential accounting burden associated with transitioning away from LIBOR and other reference rates that are expected to be discontinued. ASU 2020-04 is effective immediately upon release of the update on March 12, 2020 through December 31, 2022. At this time, the Manager is evaluating the implications of certain other provisions of ASU 2020-04 related to new disclosure requirements and any impact on the financial statement disclosures has not yet been determined.
Note 11–Subsequent Events
In connection with the preparation of the financial statements of the Portfolio as of and for the six-month period ended June 30, 2020, events and transactions subsequent to June 30, 2020, through the date the financial statements were issued have been evaluated by the Manager, for possible adjustment and/or disclosure. No subsequent events requiring financial statement adjustment or disclosure have been identified.
| | |
| 24 | | MainStay VP MacKay Government Portfolio |
Note 12–Other Matters
An outbreak of COVID-19, first detected in December 2019, has developed into a global pandemic and has resulted in travel restrictions, closure of international borders, certain businesses and securities markets, restrictions on securities trading activities, prolonged quarantines, supply chain disruptions, and lower consumer demand, as well as general concern and uncertainty. The continued impact of COVID-19
is uncertain and could further adversely affect the global economy, national economies, individual issuers and capital markets in unforeseeable ways and result in a substantial and extended economic downturn. Developments that disrupt global economies and financial markets, such as COVID-19, may magnify factors that affect the Portfolio’s performance.
Discussion of the Operation and Effectiveness of the Portfolio’s
Liquidity Risk Management Program (Unaudited)
In compliance with Rule 22e-4 under the Investment Company Act of 1940, as amended (the “Liquidity Rule”), the Portfolio has adopted and implemented a liquidity risk management program (the “Program”), which New York Life Investment Management LLC believes is reasonably designed to assess and manage the Portfolio’s liquidity risk. The Board designated New York Life Investment Management LLC as administrator of the Program (the “Administrator”). The Administrator has established a Liquidity Risk Management Committee to assist the Administrator in the implementation and day-to-day administration of the Program and to otherwise support the Administrator in fulfilling its responsibilities under the Program.
At a meeting of the Board held on March 11, 2020, the Administrator provided the Board with a written report addressing the Program’s operation, adequacy and effectiveness of implementation for the period from December 1, 2018 through December 31, 2019, as required under the Liquidity Rule. The report noted that the Administrator concluded that (i) the Program operated effectively to assess and manage the Portfolio’s liquidity risk, (ii) the Program has been adequately and effectively implemented to monitor and, as applicable, respond to the Portfolio’s liquidity developments and (iii) the Portfolio’s investment strategy continues to be appropriate for an open-end portfolio.
In accordance with the Program, the Portfolio’s liquidity risk is assessed no less frequently than annually taking into consideration certain factors, as applicable, such as (i) investment strategy and liquidity of portfolio investments, (ii) short-term and long-term cash flow projections and (iii) holdings of cash and cash equivalents and borrowing arrangements and other funding sources. Certain factors are considered under both normal and reasonably foreseeable stressed conditions.
Each Portfolio portfolio investment is classified into one of four liquidity categories. The classification is based on a determination of the number of days it is reasonably expected to take to convert the investment into cash, or sell or dispose of the investment, in current market conditions without significantly changing the market value of the investment. The Administrator has delegated liquidity classification determinations to the Portfolio’s subadvisor, subject to appropriate oversight by the Administrator, and classification determinations are made by taking into account the Portfolio’s reasonably anticipated trade size, various market, trading and investment-specific considerations, as well as market depth, and, in certain cases, third-party vendor data.
The Liquidity Rule requires portfolios that do not primarily hold assets that are highly liquid investments to adopt a minimum amount of net assets that must be invested in highly liquid investments that are assets (an “HLIM”). In addition, the Liquidity Rule limits a portfolio’s investments in illiquid investments. Specifically, the Liquidity Rule prohibits acquisition of illiquid investments if doing so would result in a portfolio holding more than 15% of its net assets in illiquid investments that are assets. The Program includes provisions reasonably designed to determine, periodically review and comply with the HLIM requirement, as applicable, and to comply with the 15% limit on illiquid investments.
| | |
| 26 | | MainStay VP MacKay Government Portfolio |
Proxy Voting Policies and Procedures and Proxy Voting Record
A description of the policies and procedures that New York Life Investments uses to vote proxies related to the Portfolio’s securities is available free of charge upon request (i) by calling 800-598-2019; (ii) by visiting New York Life Investments’ website at https://www.nylinvestments.com/mainstay/products-and -performance/mainstay-vp-funds-trust; or (iii) by visiting the SEC’s website at www.sec.gov.
The Portfolio is required to file with the SEC its proxy voting record for the 12-month period ending June 30 on Form N-PX. The Portfolio’s most recent Form N-PX or proxy voting record is available free of charge upon request (i) by calling 800-598-2019; (ii) by visiting New York Life Investments’ website at https://www.nylinvestments.com/mainstay/products-and-performance/mainstay-vp-funds-trust; or (iii) by visiting the SEC’s website at www.sec.gov.
Shareholder Reports and Quarterly Portfolio Disclosure
The Portfolio is required to file its complete schedule of portfolio holdings with the SEC 60 days after its first and third fiscal quarter on Form N-PORT. The Portfolio’s holdings report is available free of charge upon request by calling 800-598-2019 or by visiting the SEC’s website at www.sec.gov.
MainStay VP Portfolios
MainStay VP offers a wide range of Portfolios. The full array of MainStay VP offerings is listed here, with information about the manager, subadvisors, legal counsel, and independent registered public accounting firm.
Equity Portfolios
MainStay VP Emerging Markets Equity Portfolio
MainStay VP Epoch U.S. Equity Yield Portfolio
MainStay VP Fidelity Institutional AM® Utilities Portfolio†
MainStay VP MacKay Common Stock Portfolio
MainStay VP MacKay Growth Portfolio
MainStay VP MacKay International Equity Portfolio
MainStay VP MacKay Mid Cap Core Portfolio
MainStay VP MacKay S&P 500 Index Portfolio
MainStay VP MacKay Small Cap Core Portfolio
MainStay VP Mellon Natural Resources Portfolio
MainStay VP Small Cap Growth Portfolio
MainStay VP T. Rowe Price Equity Income Portfolio
MainStay VP Winslow Large Cap Growth Portfolio
Mixed Asset Portfolios
MainStay VP Balanced Portfolio
MainStay VP Income Builder Portfolio
MainStay VP Janus Henderson Balanced Portfolio
MainStay VP MacKay Convertible Portfolio
Income Portfolios
MainStay VP Bond Portfolio
MainStay VP Floating Rate Portfolio
MainStay VP Indexed Bond Portfolio
MainStay VP MacKay Government Portfolio
MainStay VP MacKay High Yield Corporate Bond Portfolio
MainStay VP MacKay Unconstrained Bond Portfolio
MainStay VP PIMCO Real Return Portfolio
Money Market
MainStay VP U.S. Government Money Market Portfolio
Alternative
MainStay VP CBRE Global Infrastructure Portfolio
MainStay VP IQ Hedge Multi-Strategy Portfolio
Asset Allocation Portfolios
MainStay VP Conservative Allocation Portfolio
MainStay VP Growth Allocation Portfolio
MainStay VP Moderate Allocation Portfolio
MainStay VP Moderate Growth Allocation Portfolio
Manager
New York Life Investment Management LLC
New York, New York
Subadvisors
Brown Advisory LLC
Baltimore, Maryland
Candriam Belgium S.A.*
Brussels, Belgium
CBRE Clarion Securities LLC
Radnor, Pennsylvania
Epoch Investment Partners, Inc.
New York, New York
FIAM LLC
Smithfield, Rhode Island
IndexIQ Advisors LLC*
New York, New York
Janus Capital Management LLC
Denver, Colorado
MacKay Shields LLC*
New York, New York
Mellon Investments Corporation
Boston, Massachusetts
NYL Investors LLC*
New York, New York
Pacific Investment Management Company LLC
Newport Beach, California
Segall Bryant & Hamill, LLC
Chicago, Illinois
T. Rowe Price Associates, Inc.
Baltimore, Maryland
Winslow Capital Management, LLC
Minneapolis, Minnesota
Distributor
NYLIFE Distributors LLC*
Jersey City, New Jersey
Custodian
State Street Bank and Trust Company
Boston, Massachusetts
Independent Registered Public Accounting Firm
PricewaterhouseCoopers LLP
New York, New York
Legal Counsel
Dechert LLP
Washington, District of Columbia
Some Portfolios may not be available in all products.
| † | Fidelity Institutional AM is a registered trade mark of FMR LLC. Used with permission. |
| * | An affiliate of New York Life Investment Management LLC |
Not part of the Semiannual Report
2020 Semiannual Report
This report is for the general information of New York Life Variable Annuities and NYLIAC Variable Universal Life Insurance Products policyowners. It must be preceded or accompanied by the appropriate product(s) and funds prospectuses if it is given to anyone who is not an owner of a New York Life variable annuity policy or a NYLIAC Variable Universal Life Insurance Product. This report does not offer for sale or solicit orders to purchase securities.
The performance data quoted in this report represents past performance. Past performance is no guarantee of future results. Due to market volatility and other factors, current performance may be lower or higher than the figures shown. The most recent month-end performance summary for your variable annuity or variable life policy is available by calling 800-598-2019 and is updated periodically on www.newyorklife.com.
The New York Life Variable Annuities and NYLIAC Variable Universal Life Insurance Products are issued by New York Life Insurance and Annuity Corporation (a Delaware Corporation) and distributed by NYLIFE Distributors LLC (Member FINRA/SIPC).
New York Life Insurance Company
New York Life Insurance and Annuity Corporation (NYLIAC) (A Delaware Corporation)
51 Madison Avenue, Room 551
New York, NY 10010
www.newyorklife.com
Printed on recycled paper
nylinvestments.com
NYLIFE Distributors LLC, 30 Hudson Street, Jersey City, NJ 07302
New York Life Investment Management LLC is the investment manager to the MainStay VP Funds Trust
©2020 by NYLIFE Distributors LLC. All rights reserved.
You may obtain copies of the Prospectus and the Statement of Additional Information free of charge, upon request, by calling toll-free 800-598-2019 or writing to New York Life Insurance and Annuity Corporation, 51 Madison Avenue, New York, NY 10010.
| | | | |
| Not FDIC Insured | | No Bank Guarantee | | May Lose Value |
| | | | |
| 1781622 | | | | MSVPG10-08/20 (NYLIAC) NI519 |
MainStay VP MacKay High Yield Corporate Bond Portfolio
Message from the President and Semiannual Report
Unaudited | June 30, 2020
Beginning on January 1, 2021, as permitted by regulations adopted by the Securities and Exchange Commission, paper copies of the MainStay VP Portfolio annual and semi-annual shareholder reports may no longer be sent by mail, unless you specifically request paper copies of the reports from the insurance company that offers your policy. Instead, the reports will be made available online, and you will be notified by mail each time a report is posted and provided with a website link to access the report. Instructions for requesting paper copies will be provided by your insurance company.
If you already elected to receive shareholder reports electronically, you will not be affected by this change and you need not take any action. At any time, you may elect to receive reports and other communications from the insurance company electronically by following the instructions provided by the insurance company.
You may elect to receive all future shareholder reports in paper form free of charge. You can inform the insurance company that you wish to receive paper copies of reports by following the instructions provided by the insurance company. Your election to receive reports in paper form will apply to all portfolio companies available under your contract.
| | | | | | | | |
| Not FDIC/NCUA Insured | | Not a Deposit | | May Lose Value | | No Bank Guarantee | | Not Insured by Any Government Agency |

This page intentionally left blank
Message from the President
High levels of volatility shook financial markets in response to the COVID-19 pandemic and an abrupt decline in global economic activity during the six months ended June 30, 2020.
Markets entered 2020 riding strong fourth quarter performance and an economic expansion of historic longevity. Most broad stock and bond indices began to dip in late February as growing numbers of COVID-19 cases were seen in hotspots around the world. On March 11, 2020, the World Health Organization acknowledged that the disease had reached pandemic proportions, with over 80,000 identified cases in China, thousands in Italy, South Korea and the United States, and more in dozens of additional countries. Governments and central banks pledged trillions of dollars to address the mounting economic and public health crisis; however, “stay-at-home” orders and other restrictions on non-essential activity caused global economic activity to slow. Most stocks and bonds lost significant ground in this challenging environment, with equities declining by roughly a third and the yield on high-yield credit indices shooting higher.
Policymakers responded with extraordinary speed to address the situation. In the United States, the Federal Reserve (“Fed”) cut interest rates to near zero and announced unlimited quantitative easing. With help from Treasury, the Fed later rolled out a series of lending facilities to directly support market functioning. In late March, the Federal government declared a national emergency; Congress passed, and the President signed, a $2 trillion CARES Act (The Coronavirus Aid, Relief, and Economic Security Act), with the promise of further assistance for consumers and businesses to come. This enormous wave of policy support helped fuel a rapid recovery in market pricing as stocks bounced back and credit spreads narrowed. Some states rushed to ease restrictions on travel and social gatherings, further fueling optimism that the effects of the pandemic might prove short lived. However, the final weeks of the reporting period saw infection rates beginning to rise in some of the first states to reopen, raising concerns that a second round of restrictive government policies might prove necessary, once again stifling economic activity.
Despite all the market volatility, the broadly based S&P 500® Index finished the first half of 2020 only slightly below its starting point and the technology-heavy NASDAQ Composite Index posted gains, closing in near record territory. Small-cap stocks tended to trail their large cap counterparts, as illustrated by the Russell 2000® Index’s loss of approximately 15%, while value-oriented stocks lagged growth-oriented issues. From a global perspective, U.S. stocks generally outperformed international equities, with emerging markets hit particularly hard by the flight from risk.
Fixed-income markets also experienced unusually high levels of volatility. Recognized safe havens, such as U.S. government bonds, attracted increased investment, driving yields lower and prices higher, positioning long-term Treasury bonds to deliver particularly strong gains. Investment-grade corporate bonds lost value in March before recovering in the closing months of the reporting period, while relatively speculative high-yield credit faced the brunt of risk-off sentiment. Emerging market debt underperformed most other bonds types as investors sought to minimize currency and sovereign risks.
Today, as we at New York Life Investments continue to track the ongoing health crisis and its financial ramifications, we are particularly mindful of the people at the heart of our enterprise—our colleagues and valued clients. By taking appropriate steps to minimize community spread of COVID-19 within our organization, we strive to safeguard the health of our investment professionals so they can continue to provide you, as a MainStay investor, with world class investment solutions in this rapidly evolving environment.
Sincerely,

Kirk C. Lehneis
President
The opinions expressed are as of the date of this report and are subject to change. There is no guarantee that any forecast made will come to pass. This material does not constitute investment advice and is not intended as an endorsement of any specific investment. Past performance is no guarantee of future results.
Not part of the Semiannual Report
Table of Contents
Investors should refer to the Portfolio’s Summary Prospectus and/or Prospectus and consider the Portfolio’s investment objectives, strategies, risks, charges and expenses carefully before investing. The Summary Prospectus and/or Prospectus contain this and other information about the Portfolio. You may obtain copies of the Portfolio’s Summary Prospectus and/or the Prospectus and the Statement of Additional Information free of charge, upon request, by calling toll-free 800-598-2019, by writing to New York Life Insurance and Annuity Corporation, 51 Madison Avenue, Room 251, New York, New York 10010 or by sending an email to MainStayShareholdersServices@nylim.com. These documents are also available at nylinvestments.com/vpdocuments. Please read the Summary Prospectus and/or Prospectus carefully before investing. MainStay VP Funds Trust portfolios are separate account options which are purchased through a variable insurance or variable annuity contract.
Investment and Performance Comparison1 (Unaudited)
Performance data quoted represents past performance. Past performance is no guarantee of future results. Because of market volatility and other factors, current performance may be lower or higher than the figures shown. Investment return and principal value will fluctuate, and as a result, when shares are redeemed, they may be worth more or less than their original cost. The performance table and graph do not reflect any deduction of sales charges, mortality and expense charges, contract charges or administrative charges. Please refer to the Performance Summary appropriate for your policy. For performance information current to the most recent month-end, please call 800-598-2019 or visit www.newyorklife.com.
Average Annual Total Returns for the Period-Ended June 30, 2020
| | | | | | | | | | | | | | | | | | | | | | |
| Class | | Inception
Date | | Six Months | | | One Year | | | Five Years | | | Ten Years | | | Gross
Expense
Ratio2 | |
| | | | | | |
| Initial Class Shares | | 5/1/1995 | | | –4.09 | % | | | –0.21 | % | | | 4.78 | % | | | 6.34 | % | | | 0.59 | % |
| Service Class Shares | | 6/4/2003 | | | –4.21 | | | | –0.46 | | | | 4.52 | | | | 6.08 | | | | 0.84 | |
| | | | | | | | | | | | | | | | |
| Benchmark Performance | | Six
Months | | | One Year | | | Five
Years | | | Ten
Years | |
| | | | |
ICE BofAML U.S. High Yield Constrained Index3 | | | –4.84 | % | | | –1.17 | % | | | 4.57 | % | | | 6.46 | % |
Morningstar High Yield Bond Category Average4 | | | –5.17 | | | | –1.89 | | | | 3.38 | | | | 5.49 | |
| 1. | Performance figures may reflect certain fee waivers and/or expense limitations, without which total returns may have been different. For information on current fee waivers and/or expense limitations (if any), please refer to the Notes to Financial Statements. |
| 2. | The gross expense ratios presented reflect the Portfolio’s “Total Annual Portfolio Operating Expenses” from the most recent Prospectus, as supplemented, and may differ from other expense ratios disclosed in this report. |
| 3. | The ICE BofAML U.S. High Yield Constrained Index is the Portfolio’s primary broad-based securities market index for comparison purposes. The ICE BofAML U.S. High Yield Constrained Index is a market value-weighted index of all domestic and Yankee high-yield bonds, including deferred interest |
| | bonds and payment-in-kind securities. Issuers included in the Index have maturities of one year or more and have a credit rating lower than BBB-/Baa3, but are not in default. No single issuer may constitute greater than 2% of the Index. Results assume reinvestment of all dividends and capital gains. An investment cannot be made directly in an index. |
| 4. | The Morningstar High Yield Bond Category Average is representative of funds that concentrate on lower-quality bonds, which are riskier than those of higher quality companies. These funds primarily invest in U.S. high-income debt securities where at least 65% or more of bond assets are not rated or are rated by a major agency such as Standard & Poor’s or Moody’s at the level of BB and below. Results are based on average total returns of similar funds with all dividends and capital gain distributions reinvested. |
Cost in Dollars of a $1,000 Investment in MainStay VP MacKay High Yield Corporate Bond Portfolio (Unaudited)
The example below is intended to describe the fees and expenses borne by shareholders during the six-month period from January 1, 2020, to June 30, 2020, and the impact of those costs on your investment.
Example
As a shareholder of the Portfolio you incur two types of costs: (1) transaction costs, including exchange fees and sales charges (loads) on purchases (as applicable), and (2) ongoing costs, including management fees, distribution and/or service (12b-1) fees, and other Portfolio expenses (as applicable). This example is intended to help you understand your ongoing costs (in dollars) of investing in the Portfolio and to compare these costs with the ongoing costs of investing in other mutual funds. The example is based on an investment of $1,000 made at the beginning of the six-month period and held for the entire period from January 1, 2020, to June 30, 2020. Shares are only sold in connection with variable life and annuity contracts and the example does not reflect any contract level or transactional fees or expenses. If these costs had been included, your costs would have been higher.
This example illustrates your Portfolio’s ongoing costs in two ways:
Actual Expenses
The second and third data columns in the table below provide information about actual account values and actual expenses. You may use the information in these columns, together with the amount you invested, to estimate the expenses that you paid during the six months
ended June 30, 2020. Simply divide your account value by $1,000 (for example, an $8,600 account value divided by $1,000 = 8.6), then multiply the result by the number under the heading entitled “Expenses Paid During Period” to estimate the expenses you paid on your account during this period.
Hypothetical Example for Comparison Purposes
The fourth and fifth data columns in the table below provide information about hypothetical account values and hypothetical expenses based on the Portfolio’s actual expense ratio and an assumed rate of return of 5% per year before expenses, which is not the Portfolio’s actual return. The hypothetical account values and expenses may not be used to estimate the actual ending account balances or expenses you paid for the six-month period shown. You may use this information to compare the ongoing costs of investing in the Portfolio with the ongoing costs of investing in other mutual funds. To do so, compare this 5% hypothetical example with the 5% hypothetical examples that appear in the shareholder reports of the other mutual funds.
Please note that the expenses shown in the table are meant to highlight your ongoing costs only and do not reflect any transactional costs, such as exchange fees or sales charges (loads). Therefore, the fourth and fifth data columns of the table are useful in comparing ongoing costs only and will not help you determine the relative total costs of owning different funds. In addition, if these transactional costs were included, your costs would have been higher.
| | | | | | | | | | | | | | | | | | | | | | |
| | | | | | | | | | | | | | | | | | |
| Share Class | | Beginning
Account
Value
1/1/20 | | | Ending Account
Value (Based
on Actual
Returns and
Expenses)
6/30/20 | | | Expenses
Paid
During
Period1 | | | Ending Account
Value (Based
on Hypothetical
5% Annualized
Return and
Actual Expenses)
6/30/20 | | | Expenses
Paid
During
Period1 | | | Net Expense
Ratio
During
Period2 |
| | | | | | |
| Initial Class Shares | | $ | 1,000.00 | | | $ | 959.10 | | | $ | 2.87 | | | $ | 1,021.93 | | | $ | 2.97 | | | 0.59% |
| | | | | | |
| Service Class Shares | | $ | 1,000.00 | | | $ | 957.90 | | | $ | 4.09 | | | $ | 1,020.69 | | | $ | 4.22 | | | 0.84% |
| 1 | Expenses are equal to the Portfolio’s annualized expense ratio of each class multiplied by the average account value over the period, divided by 366 and multiplied by 182 (to reflect the six-month period). The table above represents the actual expenses incurred during the six-month period. In addition to the fees and expenses which the Portfolio bears directly, it also indirectly bears a pro rata share of the fees and expenses of the underlying funds in which it invests. Such indirect expenses are not included in the above-reported expense figures. |
| 2 | Expenses are equal to the Portfolio’s annualized expense ratio to reflect the six-month period. |
| | |
| 6 | | MainStay VP MacKay High Yield Corporate Bond Portfolio |
Portfolio Composition as of June 30, 2020 (Unaudited)

See Portfolio of Investments beginning on page 10 for specific holdings within these categories. The Portfolio’s holdings are subject to change.
Top Ten Holdings or Issuers Held as of June 30, 2020 (excluding short-term investments) (Unaudited)
| 1. | CCO Holdings LLC / CCO Holdings Capital Corp., 4.50%–5.875%, due 4/1/24–5/1/32 |
| 2. | T-Mobile USA, Inc., 4.50%–6.50%, due 1/15/24–2/1/28 |
| 3. | HCA, Inc., 3.50%–8.36%, due 5/1/23–11/6/33 |
| 4. | Netflix, Inc., 4.875%–5.875%, due 2/15/22–6/15/30 |
| 5. | Sprint Capital Corp., 6.875%, due 11/15/28 |
| 6. | MSCI, Inc., 3.625%–5.375%, due 8/1/26–2/15/31 |
| 7. | Equinix, Inc., 5.375%–5.875%, due 1/15/26–5/15/27 |
| 8. | TransDigm, Inc., 2.428%–8.00%, due 7/15/24–3/15/27 |
| 9. | MGM Growth Properties Operating Partnership, L.P. / MGP Finance Co–Issuer, Inc., 4.625%–5.75%, due 5/1/24–2/1/27 |
| 10. | Kraft Heinz Foods Co., 3.875%–6.875%, due 7/15/25–2/9/40 |
Portfolio Management Discussion and Analysis (Unaudited)
Answers to the questions reflect the views of portfolio manager Andrew Susser of MacKay Shields LLC, the Portfolio’s Subadvisor.
How did MainStay VP MacKay High Yield Corporate Bond Portfolio perform relative to its benchmark and peers during the six months ended June 30, 2020?
For the six months ended June 30, 2020, MainStay VP MacKay High Yield Corporate Bond Portfolio returned –4.09% for Initial Class shares and –4.21% for Service Class shares. Over the same period, both share classes outperformed the –4.84% return of the ICE BofAML U.S. High Yield Constrained Index, which is the Portfolio’s primary benchmark, and the –5.17% return of the Morningstar High Yield Bond Category Average.1
During the reporting period, were there any market events that materially impacted the Portfolio’s performance or liquidity?
In the first quarter of 2020, the U.S. high-yield market experienced its highest levels of volatility in more than a decade as the COVID-19 pandemic spread fear, sharply slowed the global economy and shook investor sentiment. Mirroring the steep decline in broad-based equity indices, the ICE BofAML U.S. High Yield Constrained Index declined almost 18% in the first three weeks of March before rebounding almost 7% in the final week, then continuing to recover through the end of the reporting period.
The U.S. Federal Reserve (“Fed”) played a significant role in the recovery of credit markets by taking unprecedented actions. The recovery started on March 23, 2020, triggered by the Fed’s announcement that it would begin buying investment-grade corporate bonds and ETFs. The easing of stress in the investment-grade market carried over to the high-yield market. Further, on April 9, 2020, the Fed announced more expansive measures, including extending loans to companies and a further expansion of its direct purchase program to include recent “fallen angels” (credits downgraded from investment grade to high yield), syndicated loans and high-yield ETFs.
What factors affected the Portfolio’s relative performance during the reporting period?
The Portfolio outperformed the ICE BofAML U.S. High Yield Constrained Index during the reporting period largely due to favorable security selection in the lagging energy sector. Security selection within telecommunications and leisure also provided positive contributions to relative performance, as did underweight exposure to riskier credits rated CCC.2 (Contributions take weightings and total returns into account.)
Underweight exposure to health care and security selection within the capital goods sector detracted from relative returns.
What was the Portfolio’s duration3 strategy during the reporting period?
The Portfolio is not managed to a duration strategy, and the Portfolio’s duration positioning is the result of our bottom-up investment process. Throughout the reporting period, the Portfolio’s investment process resulted in a group of holdings with a lower average duration than the benchmark.
What specific factors, risks or market forces prompted significant decisions for the Portfolio during the reporting period?
Due to the sharp sell-off in the credit markets caused by the pandemic, which triggered a wave of downgrades, we were able to purchase crossover investment-grade and fallen angel credits trading at attractive spreads.4
During the reporting period, which market segments were the strongest positive contributors to the Portfolio’s absolute performance and which market segments were particularly weak?
Security selection in the energy sector, the weakest performing sector in the high-yield universe during the reporting period, was the strongest positive contributor to the Portfolio’s absolute performance. Security selection within telecommunications and leisure also provided positive contributions, as did the portfolio’s exposure to higher-quality credits. The largest detractor from absolute performance during the same period was security selection within the capital goods sector. Security selection in automotive and underweight exposure to health care also detracted.
Did the Portfolio make any significant purchases or sales during the reporting period?
The Portfolio purchased credits from Kraft Heinz as the issuer was downgraded from investment grade. The Portfolio also purchased Occidental Petroleum bonds during the reporting period. Conversely, the Portfolio trimmed positions in sectors hard hit by the economic impact of the pandemic, such as
| 1. | See page 5 for more information on benchmark and peer group returns. |
| 2. | An obligation rated ‘CCC’ by Standard & Poor’s (“S&P”) is deemed by S&P to be currently vulnerable to nonpayment and is dependent upon favorable business, financial and economic conditions for the obligor to meet its financial commitment on the obligation. It is the opinion of S&P that in the event of adverse business, financial or economic conditions, the obligor is not likely to have the capacity to meet its financial commitment on the obligation. When applied to Portfolio holdings, ratings are based solely on the creditworthiness of the bonds in the Portfolio and are not meant to represent the security or safety of the Portfolio. |
| 3. | Duration is a measure of the price sensitivity of a fixed-income investment to changes in interest rates. Duration is expressed as a number of years and is considered a more accurate sensitivity gauge than average maturity. |
| 4. | The terms “spread” and “yield spread” may refer to the difference in yield between a security or type of security and comparable U.S. Treasury issues. The terms may also refer to the difference in yield between two specific securities or types of securities at a given time. |
| | |
| 8 | | MainStay VP MacKay High Yield Corporate Bond Portfolio |
credits from American Axle & Manufacturing in the automotive sector and Triumph Group in the aerospace/defense sector.
How did the Portfolio’s sector weightings change during the reporting period?
There were no material changes to the Portfolio’s sector weightings during the reporting period. There was a decrease in telecommunications exposure due to a large issuer’s bond being called, and a decrease in retail exposure. The Portfolio marginally increased its health care and technology exposure.
How was the Portfolio positioned at the end of the reporting period?
As of June 30, 2020, the Portfolio held underweight exposure relative to the ICE BofAML U.S. High Yield Constrained Index in bonds rated CCC, and overweight exposure to higher-quality issuers, with a focus on crossover investment-grade and fallen angel credits. Across industries, as of the same date, the Portfolio held overweight exposure to basic industry and leisure, and underweight exposure to health care and services.
The opinions expressed are those of the portfolio managers as of the date of this report and are subject to change. There is no guarantee that any forecasts will come to pass. This material does not constitute investment advice and is not intended as an endorsement of any specific investment.
Not all MainStay VP Portfolios and/or share classes are available under all policies.
Portfolio of Investments June 30, 2020 (Unaudited)
| | | | | | | | |
| | | Principal
Amount | | | Value | |
Long-Term Bonds 94.8%† Convertible Bonds 0.6% | |
Investment Company 0.1% | |
Ares Capital Corp.
4.625%, due 3/1/24 | | $ | 2,940,000 | | | $ | 2,877,525 | |
| | | | | | | | |
|
Media 0.2% | |
Dish Network Corp.
2.375%, due 3/15/24 | | | 2,550,000 | | | | 2,291,421 | |
DISH Network Corp.
3.375%, due 8/15/26 | | | 3,870,000 | | | | 3,564,714 | |
| | | | | | | | |
| | | | | | | 5,856,135 | |
| | | | | | | | |
Real Estate Investment Trusts 0.3% | |
VEREIT, Inc.
3.75%, due 12/15/20 | | | 10,135,000 | | | | 10,128,952 | |
| | | | | | | | |
Total Convertible Bonds
(Cost $18,478,697) | | | | 18,862,612 | |
| | | | | |
|
| Corporate Bonds 91.7% | |
Advertising 1.4% | |
Lamar Media Corp.
3.75%, due 2/15/28 (a) | | | 6,320,000 | | | | 5,958,496 | |
4.00%, due 2/15/30 (a) | | | 4,000,000 | | | | 3,828,800 | |
4.875%, due 1/15/29 (a) | | | 2,195,000 | | | | 2,205,975 | |
5.75%, due 2/1/26 | | | 8,465,000 | | | | 8,732,663 | |
National CineMedia LLC
5.875%, due 4/15/28 (a) | | | 1,000,000 | | | | 822,500 | |
Outfront Media Capital LLC / Outfront Media Capital Corp.
5.00%, due 8/15/27 (a) | | | 7,660,000 | | | | 6,894,000 | |
5.625%, due 2/15/24 | | | 12,030,000 | | | | 12,060,075 | |
| | | | | | | | |
| | | | | | | 40,502,509 | |
| | | | | | | | |
Aerospace & Defense 1.5% | |
F-Brasile S.p.A. / F-Brasile U.S. LLC
7.375%, due 8/15/26 (a) | | | 5,587,000 | | | | 4,286,346 | |
SSL Robotics LLC
9.75%, due 12/31/23 (a) | | | 1,750,000 | | | | 1,872,500 | |
TransDigm UK Holdings PLC
6.875%, due 5/15/26 | | | 7,637,000 | | | | 7,102,410 | |
TransDigm, Inc.
6.25%, due 3/15/26 (a) | | | 22,850,000 | | | | 22,793,332 | |
6.50%, due 7/15/24 | | | 3,050,000 | | | | 2,912,110 | |
7.50%, due 3/15/27 | | | 2,500,000 | | | | 2,398,750 | |
8.00%, due 12/15/25 (a) | | | 2,000,000 | | | | 2,101,980 | |
| | | | | | | | |
| | | | | | | 43,467,428 | |
| | | | | | | | |
Airlines 0.3% | |
Delta Air Lines, Inc.
7.375%, due 1/15/26 | | | 2,160,000 | | | | 2,089,580 | |
| | | | | | | | |
| | | Principal
Amount | | | Value | |
Airlines (continued) | |
Mileage Plus Holdings LLC / Mileage Plus Intellectual Property Assets, Ltd.
6.50%, due 6/20/27 (a) | | $ | 6,405,000 | | | $ | 6,421,012 | |
| | | | | | | | |
| | | | | | | 8,510,592 | |
| | | | | | | | |
Auto Manufacturers 1.9% | |
BCD Acquisition, Inc.
9.625%, due 9/15/23 (a) | | | 6,410,000 | | | | 6,121,550 | |
Ford Holdings LLC
9.30%, due 3/1/30 | | | 7,979,000 | | | | 8,973,981 | |
Ford Motor Co.
5.291%, due 12/8/46 | | | 1,000,000 | | | | 822,290 | |
7.45%, due 7/16/31 | | | 5,200,000 | | | | 5,473,000 | |
9.625%, due 4/22/30 | | | 1,500,000 | | | | 1,776,450 | |
Ford Motor Credit Co. LLC
3.339%, due 3/28/22 | | | 2,561,000 | | | | 2,476,999 | |
4.271%, due 1/9/27 | | | 1,647,000 | | | | 1,535,313 | |
4.389%, due 1/8/26 | | | 750,000 | | | | 714,135 | |
5.125%, due 6/16/25 | | | 3,500,000 | | | | 3,501,400 | |
General Motors Co.
6.80%, due 10/1/27 | | | 3,000,000 | | | | 3,495,780 | |
J.B. Poindexter & Company, Inc.
7.125%, due 4/15/26 (a) | | | 8,055,000 | | | | 8,135,550 | |
McLaren Finance PLC
5.75%, due 8/1/22 (a) | | | 8,170,000 | | | | 5,719,000 | |
Wabash National Corp.
5.50%, due 10/1/25 (a) | | | 6,967,000 | | | | 6,392,223 | |
| | | | | | | | |
| | | | | | | 55,137,671 | |
| | | | | | | | |
Auto Parts & Equipment 2.3% | |
Adient Global Holdings, Ltd.
4.875%, due 8/15/26 (a) | | | 6,300,000 | | | | 5,164,740 | |
Adient U.S. LLC
7.00%, due 5/15/26 (a) | | | 4,000,000 | | | | 4,140,000 | |
American Axle & Manufacturing, Inc.
6.25%, due 4/1/25 (b) | | | 4,000,000 | | | | 3,930,000 | |
Exide International Holdings, L.P.
10.75% (6.25% Cash and 4.50% PIK), due 10/31/21 (a)(c)(d)(e)(f)(g)(h) | | | 9,857,254 | | | | 8,664,526 | |
Exide Technologies(a)(c)(d)(e)(f)(g)(h)
11.00% (3.00% Cash and 8.00% PIK), due 10/31/24 | | | 24,651,983 | | | | 4,314,097 | |
11.00% (3.00% Cash and 8.00% PIK), due 10/31/24 | | | 10,241,653 | | | | 0 | |
IHO Verwaltungs GmbH (a)(h)
4.75% (4.75% Cash or 5.50% PIK), due 9/15/26 | | | 6,643,000 | | | | 6,510,140 | |
6.00% (6.00% Cash or 6.75% PIK), due 5/15/27 | | | 9,191,000 | | | | 9,340,354 | |
6.375% (6.375% Cash or 7.125% PIK), due 5/15/29 | | | 10,105,000 | | | | 10,266,049 | |
| | | | |
| 10 | | MainStay VP MacKay High Yield Corporate Bond Portfolio | | The notes to the financial statements are an integral part of,
and should be read in conjunction with, the financial statements. |
| | | | | | | | |
| | | Principal
Amount | | | Value | |
| Corporate Bonds (continued) | |
Auto Parts & Equipment (continued) | |
Meritor, Inc.
6.25%, due 2/15/24 | | $ | 1,300,000 | | | $ | 1,309,750 | |
6.25%, due 6/1/25 (a) | | | 1,000,000 | | | | 1,010,000 | |
Nexteer Automotive Group, Ltd.
5.875%, due 11/15/21 (a) | | | 6,640,000 | | | | 6,670,662 | |
Tenneco, Inc.
5.00%, due 7/15/26 | | | 6,982,000 | | | | 4,608,120 | |
| | | | | | | | |
| | | | | | | 65,928,438 | |
| | | | | | | | |
Building Materials 1.3% | |
BMC East LLC
5.50%, due 10/1/24 (a) | | | 705,000 | | | | 710,288 | |
James Hardie International Finance DAC (a)
4.75%, due 1/15/25 | | | 3,300,000 | | | | 3,357,750 | |
5.00%, due 1/15/28 | | | 8,011,000 | | | | 8,171,220 | |
Patrick Industries, Inc.
7.50%, due 10/15/27 (a) | | | 5,210,000 | | | | 5,366,300 | |
Summit Materials LLC / Summit Materials Finance Corp.
5.125%, due 6/1/25 (a) | | | 3,270,000 | | | | 3,229,125 | |
6.125%, due 7/15/23 | | | 12,080,000 | | | | 12,026,244 | |
6.50%, due 3/15/27 (a) | | | 5,135,000 | | | | 5,250,537 | |
| | | | | | | | |
| | | | | | | 38,111,464 | |
| | | | | | | | |
Chemicals 2.2% | |
Blue Cube Spinco LLC
9.75%, due 10/15/23 | | | 8,120,000 | | | | 8,363,600 | |
10.00%, due 10/15/25 | | | 7,000,000 | | | | 7,297,500 | |
Innophos Holdings, Inc.
9.375%, due 2/15/28 (a) | | | 5,085,000 | | | | 4,983,300 | |
Minerals Technologies, Inc.
5.00%, due 7/1/28 (a) | | | 995,000 | | | | 1,009,925 | |
Neon Holdings, Inc.
10.125%, due 4/1/26 (a) | | | 5,400,000 | | | | 5,359,500 | |
NOVA Chemicals Corp. (a)
4.875%, due 6/1/24 | | | 2,635,000 | | | | 2,457,137 | |
5.25%, due 6/1/27 | | | 1,000,000 | | | | 877,870 | |
Olin Corp.
5.625%, due 8/1/29 | | | 2,979,000 | | | | 2,740,740 | |
9.50%, due 6/1/25 (a) | | | 2,670,000 | | | | 2,977,050 | |
PolyOne Corp.
5.25%, due 3/15/23 | | | 8,976,000 | | | | 9,694,080 | |
5.75%, due 5/15/25 (a) | | | 2,000,000 | | | | 2,057,500 | |
TPC Group, Inc.
10.50%, due 8/1/24 (a) | | | 15,103,000 | | | | 13,517,185 | |
Valvoline, Inc.
4.375%, due 8/15/25 (a) | | | 2,000,000 | | | | 2,010,000 | |
| | | | | | | | |
| | | | | | | 63,345,387 | |
| | | | | | | | |
| | | | | | | | |
| | | Principal
Amount | | | Value | |
Coal 0.1% | |
Natural Resource Partners LP / NRP Finance Corp.
9.125%, due 6/30/25 (a) | | $ | 3,465,000 | | | $ | 2,875,950 | |
| | | | | | | | |
|
Commercial Services 4.0% | |
Allied Universal Holdco LLC / Allied Universal Finance Corp.
9.75%, due 7/15/27 (a) | | | 4,115,000 | | | | 4,336,181 | |
Ashtead Capital, Inc. (a)
4.00%, due 5/1/28 | | | 4,595,000 | | | | 4,572,025 | |
4.25%, due 11/1/29 | | | 5,300,000 | | | | 5,300,000 | |
4.375%, due 8/15/27 | | | 2,008,000 | | | | 2,063,943 | |
5.25%, due 8/1/26 | | | 1,500,000 | | | | 1,576,875 | |
Cimpress PLC
7.00%, due 6/15/26 (a) | | | 8,542,000 | | | | 7,879,995 | |
Gartner, Inc.
5.125%, due 4/1/25 (a) | | | 13,007,000 | | | | 13,319,818 | |
Graham Holdings Co.
5.75%, due 6/1/26 (a) | | | 11,107,000 | | | | 11,486,082 | |
Harsco Corp.
5.75%, due 7/31/27 (a) | | | 2,000,000 | | | | 2,005,000 | |
IHS Markit, Ltd. (a)
4.75%, due 2/15/25 | | | 3,950,000 | | | | 4,424,000 | |
5.00%, due 11/1/22 | | | 18,089,000 | | | | 19,396,381 | |
Jaguar Holding Co. II / PPD Development L.P.
5.00%, due 6/15/28 (a) | | | 1,420,000 | | | | 1,453,725 | |
Korn Ferry
4.625%, due 12/15/27 (a) | | | 4,000,000 | | | | 3,880,000 | |
Nielsen Co. Luxembourg S.A.R.L.
5.50%, due 10/1/21 (a) | | | 911,000 | | | | 911,638 | |
Nielsen Finance LLC / Nielsen Finance Co. 5.00%, due 4/15/22 (a) | | | 17,214,000 | | | | 17,153,062 | |
Ritchie Bros. Auctioneers, Inc.
5.375%, due 1/15/25 (a) | | | 2,800,000 | | | | 2,880,500 | |
United Rentals North America, Inc.
3.875%, due 11/15/27 | | | 4,495,000 | | | | 4,483,763 | |
4.875%, due 1/15/28 | | | 1,000,000 | | | | 1,025,000 | |
5.50%, due 5/15/27 | | | 1,000,000 | | | | 1,030,000 | |
6.50%, due 12/15/26 | | | 3,420,000 | | | | 3,591,000 | |
| | | | | | | | |
| | | | | | | 112,768,988 | |
| | | | | | | | |
Computers 0.1% | |
NCR Corp.
6.375%, due 12/15/23 | | | 3,810,000 | | | | 3,871,913 | |
| | | | | | | | |
|
Cosmetics & Personal Care 0.4% | |
Edgewell Personal Care Co.
4.70%, due 5/24/22 | | | 7,320,000 | | | | 7,576,346 | |
5.50%, due 6/1/28 (a) | | | 4,000,000 | | | | 4,110,000 | |
| | | | | | | | |
| | | | | | | 11,686,346 | |
| | | | | | | | |
| | | | | | |
The notes to the financial statements are an integral part of,
and should be read in conjunction with, the financial statements. | | | | | 11 | |
Portfolio of Investments June 30, 2020 (Unaudited) (continued)
| | | | | | | | |
| | | Principal
Amount | | | Value | |
| Corporate Bonds (continued) | |
Distribution & Wholesale 0.3% | |
Anixter, Inc.
5.125%, due 10/1/21 | | $ | 2,425,000 | | | $ | 2,552,555 | |
Performance Food Group, Inc.
5.50%, due 10/15/27 (a) | | | 3,990,000 | | | | 3,850,350 | |
Resideo Funding, Inc.
6.125%, due 11/1/26 (a) | | | 3,000,000 | | | | 2,932,500 | |
| | | | | | | | |
| | | | | | | 9,335,405 | |
| | | | | | | | |
Diversified Financial Services 1.2% | |
Credit Acceptance Corp.
5.125%, due 12/31/24 (a) | | | 2,175,000 | | | | 2,100,398 | |
6.625%, due 3/15/26 | | | 7,590,000 | | | | 7,620,739 | |
INTL. FCStone, Inc.
8.625%, due 6/15/25 (a) | | | 1,300,000 | | | | 1,357,694 | |
Jefferies Finance LLC / JFIN Co-Issuer Corp. (a)
6.25%, due 6/3/26 | | | 5,000,000 | | | | 4,662,500 | |
7.25%, due 8/15/24 | | | 3,955,000 | | | | 3,480,400 | |
LPL Holdings, Inc. (a)
4.625%, due 11/15/27 | | | 1,535,000 | | | | 1,515,813 | |
5.75%, due 9/15/25 | | | 9,320,000 | | | | 9,436,500 | |
Oxford Finance LLC / Oxford Finance Co-Issuer II, Inc.
6.375%, due 12/15/22 (a) | | | 5,480,000 | | | | 5,041,600 | |
| | | | | | | | |
| | | | | | | 35,215,644 | |
| | | | | | | | |
Electric 1.3% | |
AES Corp.
5.50%, due 4/15/25 | | | 2,000,000 | | | | 2,052,600 | |
Clearway Energy Operating LLC
4.75%, due 3/15/28 (a) | | | 2,000,000 | | | | 2,039,880 | |
DPL, Inc.
4.125%, due 7/1/25 (a) | | | 5,815,000 | | | | 5,816,628 | |
Keystone Power Pass-Through Holders LLC / Conemaugh Power Pass-Through Holders
13.00% (7.625% Cash or 8.375% PIK), due 6/1/24 (a)(e)(h) | | | 3,040,811 | | | | 2,736,730 | |
NextEra Energy Operating Partners, L.P.
3.875%, due 10/15/26 (a) | | | 4,500,000 | | | | 4,493,475 | |
NRG Energy, Inc.
6.625%, due 1/15/27 | | | 7,000,000 | | | | 7,306,250 | |
PG&E Corp.
5.00%, due 7/1/28 | | | 5,550,000 | | | | 5,548,335 | |
5.25%, due 7/1/30 | | | 3,000,000 | | | | 3,017,100 | |
Vistra Operations Co. LLC
5.00%, due 7/31/27 (a) | | | 3,300,000 | | | | 3,337,125 | |
| | | | | | | | |
| | | | | | | 36,348,123 | |
| | | | | | | | |
| | | | | | | | |
| | | Principal
Amount | | | Value | |
Electrical Components & Equipment 0.7% | |
Energizer Holdings, Inc. (a) 4.75%, due 6/15/28 | | $ | 1,000,000 | | | $ | 980,970 | |
6.375%, due 7/15/26 | | | 2,935,000 | | | | 3,034,673 | |
WESCO Distribution, Inc.
5.375%, due 12/15/21 | | | 5,660,000 | | | | 5,665,660 | |
7.125%, due 6/15/25 (a) | | | 4,535,000 | | | | 4,775,944 | |
7.25%, due 6/15/28 (a) | | | 3,690,000 | | | | 3,902,175 | |
| | | | | | | | |
| | | | | | | 18,359,422 | |
| | | | | | | | |
Electronics 0.2% | |
Itron, Inc.
5.00%, due 1/15/26 (a) | | | 6,365,000 | | | | 6,341,131 | |
| | | | | | | | |
|
Energy—Alternate Sources 0.1% | |
Terraform Power Operating LLC
4.75%, due 1/15/30 (a) | | | 2,665,000 | | | | 2,704,975 | |
| | | | | | | | |
|
Engineering & Construction 0.5% | |
PowerTeam Services LLC
9.033%, due 12/4/25 (a) | | | 3,000,000 | | | | 3,060,000 | |
Weekley Homes LLC / Weekley Finance Corp.
6.00%, due 2/1/23 | | | 7,219,000 | | | | 7,164,857 | |
6.625%, due 8/15/25 | | | 4,423,000 | | | | 4,456,173 | |
| | | | | | | | |
| | | | | | | 14,681,030 | |
| | | | | | | | |
Entertainment 2.2% | |
Allen Media LLC / Allen Media Co-Issuer, Inc.
10.50%, due 2/15/28 (a) | | | 5,860,000 | | | | 5,365,709 | |
Boyne USA, Inc.
7.25%, due 5/1/25 (a) | | | 3,250,000 | | | | 3,404,375 | |
Churchill Downs, Inc. (a)
4.75%, due 1/15/28 | | | 6,067,000 | | | | 5,854,655 | |
5.50%, due 4/1/27 | | | 8,051,000 | | | | 7,880,319 | |
International Game Technology PLC
6.25%, due 1/15/27 (a) | | | 6,725,000 | | | | 6,893,125 | |
Jacobs Entertainment, Inc.
7.875%, due 2/1/24 (a) | | | 2,193,000 | | | | 1,932,033 | |
Live Nation Entertainment, Inc. (a)
4.75%, due 10/15/27 | | | 3,955,000 | | | | 3,402,130 | |
4.875%, due 11/1/24 | | | 570,000 | | | | 513,000 | |
6.50%, due 5/15/27 | | | 6,435,000 | | | | 6,628,050 | |
Merlin Entertainments PLC
5.75%, due 6/15/26 (a) | | | 10,050,000 | | | | 9,679,959 | |
Twin River Worldwide Holdings, Inc.
6.75%, due 6/1/27 (a) | | | 8,100,000 | | | | 7,695,000 | |
Vail Resorts, Inc.
6.25%, due 5/15/25 (a) | | | 2,000,000 | | | | 2,092,500 | |
| | | | | | | | |
| | | | | | | 61,340,855 | |
| | | | | | | | |
| | | | |
| 12 | | MainStay VP MacKay High Yield Corporate Bond Portfolio | | The notes to the financial statements are an integral part of,
and should be read in conjunction with, the financial statements. |
| | | | | | | | |
| | | Principal
Amount | | | Value | |
| Corporate Bonds (continued) | |
Food 2.0% | |
B&G Foods, Inc.
5.25%, due 4/1/25 | | $ | 4,142,000 | | | $ | 4,173,065 | |
Kraft Heinz Foods Co.
3.875%, due 5/15/27 (a) | | | 4,625,000 | | | | 4,833,071 | |
3.95%, due 7/15/25 | | | 1,879,000 | | | | 1,993,679 | |
4.25%, due 3/1/31 (a) | | | 3,500,000 | | | | 3,711,026 | |
6.50%, due 2/9/40 | | | 7,660,000 | | | | 9,220,011 | |
6.875%, due 1/26/39 | | | 7,588,000 | | | | 9,380,506 | |
Land O’Lakes Capital Trust I
7.45%, due 3/15/28 (a) | | | 5,130,000 | | | | 5,617,350 | |
Land O’Lakes, Inc.
6.00%, due 11/15/22 (a) | | | 7,880,000 | | | | 8,116,400 | |
TreeHouse Foods, Inc.
6.00%, due 2/15/24 (a) | | | 9,045,000 | | | | 9,225,900 | |
| | | | | | | | |
| | | | | | | 56,271,008 | |
| | | | | | | | |
Food Services 0.2% | |
Aramark Services, Inc.
6.375%, due 5/1/25 (a) | | | 4,300,000 | | | | 4,440,309 | |
| | | | | | | | |
|
Forest Products & Paper 1.2% | |
Mercer International, Inc.
5.50%, due 1/15/26 | | | 1,000,000 | | | | 940,000 | |
6.50%, due 2/1/24 | | | 6,005,000 | | | | 5,901,174 | |
7.375%, due 1/15/25 | | | 5,600,000 | | | | 5,572,000 | |
Schweitzer-Mauduit International, Inc.
6.875%, due 10/1/26 (a) | | | 3,000,000 | | | | 3,067,500 | |
Smurfit Kappa Treasury Funding DAC
7.50%, due 11/20/25 | | | 15,843,000 | | | | 18,373,127 | |
| | | | | | | | |
| | | | | | | 33,853,801 | |
| | | | | | | | |
Gas 0.7% | |
AmeriGas Partners, L.P. / AmeriGas Finance Corp.
5.625%, due 5/20/24 | | | 5,895,000 | | | | 6,114,294 | |
5.75%, due 5/20/27 | | | 2,485,000 | | | | 2,627,888 | |
5.875%, due 8/20/26 | | | 6,885,000 | | | | 7,263,675 | |
Rockpoint Gas Storage Canada, Ltd.
7.00%, due 3/31/23 (a) | | | 5,100,000 | | | | 4,673,844 | |
| | | | | | | | |
| | | | | | | 20,679,701 | |
| | | | | | | | |
Hand & Machine Tools 0.4% | |
Colfax Corp. (a)
6.00%, due 2/15/24 | | | 3,240,000 | | | | 3,341,250 | |
6.375%, due 2/15/26 | | | 4,071,000 | | | | 4,254,195 | |
Werner FinCo, L.P. / Werner FinCo, Inc.
8.75%, due 7/15/25 (a) | | | 4,250,000 | | | | 3,612,500 | |
| | | | | | | | |
| | | | | | | 11,207,945 | |
| | | | | | | | |
| | | | | | | | |
| | | Principal
Amount | | | Value | |
Health Care—Products 0.7% | |
Hill-Rom Holdings, Inc.
4.375%, due 9/15/27 (a) | | $ | 2,025,000 | | | $ | 2,073,094 | |
Hologic, Inc. (a)
4.375%, due 10/15/25 | | | 4,080,000 | | | | 4,119,943 | |
4.625%, due 2/1/28 | | | 3,000,000 | | | | 3,112,500 | |
Teleflex, Inc.
4.25%, due 6/1/28 (a) | | | 6,805,000 | | | | 6,975,125 | |
4.625%, due 11/15/27 | | | 2,275,000 | | | | 2,405,153 | |
| | | | | | | | |
| | | | | | | 18,685,815 | |
| | | | | | | | |
Health Care—Services 5.4% | |
Acadia Healthcare Co., Inc.
5.50%, due 7/1/28 (a) | | | 2,300,000 | | | | 2,305,750 | |
5.625%, due 2/15/23 | | | 7,087,000 | | | | 7,089,480 | |
6.50%, due 3/1/24 | | | 2,000,000 | | | | 2,035,360 | |
AHP Health Partners, Inc.
9.75%, due 7/15/26 (a) | | | 5,890,000 | | | | 6,051,975 | |
Catalent Pharma Solutions, Inc. (a)
4.875%, due 1/15/26 | | | 4,890,000 | | | | 4,964,328 | |
5.00%, due 7/15/27 | | | 220,000 | | | | 228,389 | |
Centene Corp.
4.25%, due 12/15/27 | | | 1,810,000 | | | | 1,867,757 | |
4.625%, due 12/15/29 | | | 5,370,000 | | | | 5,665,350 | |
4.75%, due 1/15/25 | | | 4,605,000 | | | | 4,714,461 | |
5.25%, due 4/1/25 (a) | | | 4,455,000 | | | | 4,587,180 | |
5.375%, due 6/1/26 (a) | | | 3,245,000 | | | | 3,363,962 | |
5.375%, due 8/15/26 (a) | | | 2,380,000 | | | | 2,475,700 | |
Charles River Laboratories International, Inc.
5.50%, due 4/1/26 (a) | | | 5,525,000 | | | | 5,746,000 | |
DaVita, Inc.
4.625%, due 6/1/30 (a) | | | 1,600,000 | | | | 1,592,320 | |
Encompass Health Corp.
4.50%, due 2/1/28 | | | 5,000,000 | | | | 4,795,600 | |
4.75%, due 2/1/30 | | | 7,100,000 | | | | 6,780,500 | |
5.75%, due 11/1/24 | | | 4,072,000 | | | | 4,072,000 | |
HCA, Inc.
3.50%, due 9/1/30 | | | 8,300,000 | | | | 7,994,327 | |
5.25%, due 4/15/25 | | | 4,220,000 | | | | 4,839,760 | |
5.375%, due 2/1/25 | | | 7,420,000 | | | | 7,948,675 | |
5.625%, due 9/1/28 | | | 2,090,000 | | | | 2,332,963 | |
5.875%, due 5/1/23 | | | 4,800,000 | | | | 5,190,000 | |
5.875%, due 2/15/26 | | | 9,015,000 | | | | 9,882,694 | |
7.50%, due 11/6/33 | | | 6,000,000 | | | | 7,290,000 | |
7.58%, due 9/15/25 | | | 2,007,000 | | | | 2,308,050 | |
7.69%, due 6/15/25 | | | 9,195,000 | | | | 10,482,300 | |
8.36%, due 4/15/24 | | | 1,955,000 | | | | 2,248,250 | |
IQVIA, Inc.
5.00%, due 10/15/26 (a) | | | 9,792,000 | | | | 10,073,030 | |
RegionalCare Hospital Partners Holdings, Inc. / LifePoint Health, Inc.
9.75%, due 12/1/26 (a) | | | 10,055,000 | | | | 10,356,650 | |
| | | | | | |
The notes to the financial statements are an integral part of,
and should be read in conjunction with, the financial statements. | | | | | 13 | |
Portfolio of Investments June 30, 2020 (Unaudited) (continued)
| | | | | | | | |
| | | Principal
Amount | | | Value | |
| Corporate Bonds (continued) | |
Health Care—Services (continued) | |
Select Medical Corp.
6.25%, due 8/15/26 (a) | | $ | 2,550,000 | | | $ | 2,577,922 | |
| | | | | | | | |
| | | | | | | 151,860,733 | |
| | | | | | | | |
Holding Company—Diversified 0.3% | |
Stena International S.A.
6.125%, due 2/1/25 (a) | | | 9,470,000 | | | | 9,043,850 | |
| | | | | | | | |
|
Home Builders 2.7% | |
Adams Homes, Inc.
7.50%, due 2/15/25 (a) | | | 3,925,000 | | | | 3,856,312 | |
Ashton Woods USA LLC / Ashton Woods Finance Co. (a)
6.625%, due 1/15/28 | | | 2,000,000 | | | | 1,965,000 | |
6.75%, due 8/1/25 | | | 2,237,000 | | | | 2,197,853 | |
9.875%, due 4/1/27 | | | 3,230,000 | | | | 3,431,875 | |
Brookfield Residential Properties, Inc. / Brookfield Residential U.S. Corp. (a)
4.875%, due 2/15/30 | | | 1,500,000 | | | | 1,253,400 | |
6.25%, due 9/15/27 | | | 4,855,000 | | | | 4,642,885 | |
6.375%, due 5/15/25 | | | 3,520,000 | | | | 3,484,800 | |
Century Communities, Inc.
5.875%, due 7/15/25 | | | 3,100,000 | | | | 3,084,500 | |
6.75%, due 6/1/27 | | | 6,775,000 | | | | 6,808,875 | |
Installed Building Products, Inc.
5.75%, due 2/1/28 (a) | | | 5,230,000 | | | | 5,230,000 | |
M/I Homes, Inc.
4.95%, due 2/1/28 | | | 3,000,000 | | | | 2,981,250 | |
5.625%, due 8/1/25 | | | 815,000 | | | | 823,150 | |
New Home Co., Inc.
7.25%, due 4/1/22 | | | 5,400,000 | | | | 5,022,000 | |
Picasso Finance Sub, Inc.
6.125%, due 6/15/25 (a) | | | 3,005,000 | | | | 3,072,612 | |
PulteGroup, Inc.
7.875%, due 6/15/32 | | | 3,595,000 | | | | 4,593,691 | |
Shea Homes, L.P. / Shea Homes Funding Corp. (a)
4.75%, due 2/15/28 | | | 6,000,000 | | | | 5,700,000 | |
6.125%, due 4/1/25 | | | 10,705,000 | | | | 10,758,525 | |
Williams Scotsman International, Inc.
7.875%, due 12/15/22 (a) | | | 4,441,000 | | | | 4,615,887 | |
Winnebago Industries
6.25%, due 7/15/28 | | | 2,210,000 | | | | 2,227,886 | |
| | | | | | | | |
| | | | | | | 75,750,501 | |
| | | | | | | | |
Household Products & Wares 0.8% | |
Prestige Brands, Inc. (a)
5.125%, due 1/15/28 | | | 4,245,000 | | | | 4,181,325 | |
6.375%, due 3/1/24 | | | 12,915,000 | | | | 13,237,875 | |
| | | | | | | | |
| | | Principal
Amount | | | Value | |
Household Products & Wares (continued) | |
Spectrum Brands, Inc.
5.50%, due 7/15/30 (a) | | $ | 2,500,000 | | | $ | 2,503,125 | |
5.75%, due 7/15/25 | | | 3,840,000 | | | | 3,940,877 | |
| | | | | | | | |
| | | | | | | 23,863,202 | |
| | | | | | | | |
Housewares 0.1% | |
CD&R Smokey Buyer, Inc.
6.75%, due 7/15/25 (a) | | | 1,540,000 | | | | 1,601,138 | |
| | | | | | | | |
|
Insurance 1.2% | |
American Equity Investment Life Holding Co.
5.00%, due 6/15/27 | | | 8,145,000 | | | | 8,843,183 | |
Fairfax Financial Holdings, Ltd.
8.30%, due 4/15/26 | | | 4,645,000 | | | | 5,746,148 | |
Fidelity & Guaranty Life Holdings, Inc.
5.50%, due 5/1/25 (a) | | | 2,500,000 | | | | 2,700,000 | |
MGIC Investment Corp.
5.75%, due 8/15/23 | | | 9,545,000 | | | | 9,855,212 | |
NMI Holdings, Inc.
7.375%, due 6/1/25 (a) | | | 2,000,000 | | | | 2,092,760 | |
USI, Inc.
6.875%, due 5/1/25 (a) | | | 5,890,000 | | | | 5,941,538 | |
| | | | | | | | |
| | | | | | | 35,178,841 | |
| | | | | | | | |
Internet 2.5% | |
Cogent Communications Group, Inc.
5.375%, due 3/1/22 (a) | | | 2,870,000 | | | | 2,952,513 | |
Expedia Group, Inc. (a)
6.25%, due 5/1/25 | | | 2,000,000 | | | | 2,130,546 | |
7.00%, due 5/1/25 | | | 3,385,000 | | | | 3,518,547 | |
Netflix, Inc.
4.875%, due 4/15/28 | | | 1,692,000 | | | | 1,809,205 | |
4.875%, due 6/15/30 (a) | | | 3,000,000 | | | | 3,217,500 | |
5.375%, due 11/15/29 (a) | | | 2,500,000 | | | | 2,738,000 | |
5.50%, due 2/15/22 | | | 7,455,000 | | | | 7,773,701 | |
5.75%, due 3/1/24 | | | 10,899,000 | | | | 11,798,167 | |
5.875%, due 2/15/25 | | | 3,320,000 | | | | 3,668,600 | |
5.875%, due 11/15/28 | | | 8,800,000 | | | | 10,021,000 | |
Uber Technologies, Inc. (a)
7.50%, due 5/15/25 | | | 2,000,000 | | | | 2,015,000 | |
7.50%, due 9/15/27 | | | 5,115,000 | | | | 5,127,788 | |
VeriSign, Inc.
4.75%, due 7/15/27 | | | 4,900,000 | | | | 5,147,401 | |
5.25%, due 4/1/25 | | | 9,025,000 | | | | 9,995,187 | |
| | | | | | | | |
| | | | | | | 71,913,155 | |
| | | | | | | | |
Investment Companies 1.4% | |
Compass Group Diversified Holdings LLC
8.00%, due 5/1/26 (a) | | | 6,090,000 | | | | 6,193,104 | |
FS Energy & Power Fund
7.50%, due 8/15/23 (a) | | | 18,275,000 | | | | 15,579,437 | |
| | | | |
| 14 | | MainStay VP MacKay High Yield Corporate Bond Portfolio | | The notes to the financial statements are an integral part of,
and should be read in conjunction with, the financial statements. |
| | | | | | | | |
| | | Principal
Amount | | | Value | |
| Corporate Bonds (continued) | |
Investment Companies (continued) | |
Icahn Enterprises, L.P. / Icahn Enterprises Finance Corp.
4.75%, due 9/15/24 | | $ | 3,570,000 | | | $ | 3,356,514 | |
5.25%, due 5/15/27 | | | 7,615,000 | | | | 7,348,475 | |
6.25%, due 5/15/26 | | | 7,290,000 | | | | 7,295,103 | |
| | | | | | | | |
| | | | | | | 39,772,633 | |
| | | | | | | | |
Iron & Steel 1.3% | |
Allegheny Ludlum LLC
6.95%, due 12/15/25 | | | 7,400,000 | | | | 7,178,000 | |
Allegheny Technologies, Inc.
7.875%, due 8/15/23 | | | 1,423,000 | | | | 1,456,796 | |
Big River Steel LLC / BRS Finance Corp.
7.25%, due 9/1/25 (a) | | | 19,084,000 | | | | 18,225,220 | |
Mineral Resources, Ltd.
8.125%, due 5/1/27 (a) | | | 9,130,000 | | | | 9,700,625 | |
| | | | | | | | |
| | | | | | | 36,560,641 | |
| | | | | | | | |
Leisure Time 1.3% | |
Carlson Travel, Inc. (a)
6.75%, due 12/15/23 (b) | | | 21,868,000 | | | | 14,214,200 | |
9.50%, due 12/15/24 | | | 15,253,000 | | | | 6,711,320 | |
Silversea Cruise Finance, Ltd.
7.25%, due 2/1/25 (a) | | | 8,000,000 | | | | 7,540,000 | |
Vista Outdoor, Inc.
5.875%, due 10/1/23 | | | 7,369,000 | | | | 7,203,197 | |
| | | | | | | | |
| | | | | | | 35,668,717 | |
| | | | | | | | |
Lodging 2.2% | |
Boyd Gaming Corp.
4.75%, due 12/1/27 (a) | | | 5,430,000 | | | | 4,669,800 | |
6.00%, due 8/15/26 | | | 9,595,000 | | | | 8,968,447 | |
6.375%, due 4/1/26 | | | 1,935,000 | | | | 1,838,250 | |
Choice Hotels International, Inc.
5.75%, due 7/1/22 | | | 8,283,000 | | | | 8,812,615 | |
Hilton Domestic Operating Co., Inc.
4.875%, due 1/15/30 | | | 7,000,000 | | | | 6,895,000 | |
5.125%, due 5/1/26 | | | 11,615,000 | | | | 11,564,242 | |
5.75%, due 5/1/28 (a) | | | 2,100,000 | | | | 2,121,000 | |
Hyatt Hotels Corp.
5.75%, due 4/23/30 | | | 2,315,000 | | | | 2,545,390 | |
Marriott International, Inc.
4.625%, due 6/15/30 | | | 1,000,000 | | | | 1,037,615 | |
5.75%, due 5/1/25 | | | 7,050,000 | | | | 7,658,818 | |
Marriott Ownership Resorts, Inc. / ILG LLC 6.50%, due 9/15/26 | | | 4,576,000 | | | | 4,610,320 | |
MGM Resorts International
5.75%, due 6/15/25 | | | 2,589,000 | | | | 2,559,926 | |
| | | | | | | | |
| | | | | | | 63,281,423 | |
| | | | | | | | |
| | | | | | | | |
| | | Principal
Amount | | | Value | |
Machinery—Construction & Mining 0.1% | |
BWX Technologies, Inc.
4.125%, due 6/30/28 (a) | | $ | 2,000,000 | | | $ | 1,995,000 | |
| | | | | | | | |
|
Machinery—Diversified 0.6% | |
Briggs & Stratton Corp.
6.875%, due 12/15/20 | | | 5,030,000 | | | | 1,647,325 | |
Stevens Holding Co., Inc.
6.125%, due 10/1/26 (a) | | | 3,734,000 | | | | 3,902,030 | |
Tennant Co.
5.625%, due 5/1/25 | | | 6,770,000 | | | | 6,837,700 | |
Vertical Holdco GmbH Co.
7.625%, due 7/15/28 | | | 785,000 | | | | 785,000 | |
Vertical U.S. Newco, Inc.
5.25%, due 7/15/27 | | | 2,820,000 | | | | 2,820,000 | |
| | | | | | | | |
| | | | | | | 15,992,055 | |
| | | | | | | | |
Media 6.8% | |
Block Communications, Inc.
4.875%, due 3/1/28 (a) | | | 3,775,000 | | | | 3,728,907 | |
CCO Holdings LLC / CCO Holdings Capital Corp. (a)
4.50%, due 8/15/30 | | | 13,555,000 | | | | 13,826,100 | |
4.50%, due 5/1/32 | | | 8,180,000 | | | | 8,282,250 | |
4.75%, due 3/1/30 | | | 7,715,000 | | | | 7,893,911 | |
5.00%, due 2/1/28 | | | 8,550,000 | | | | 8,827,875 | |
5.125%, due 5/1/27 | | | 12,000,000 | | | | 12,415,200 | |
5.375%, due 5/1/25 | | | 1,961,000 | | | | 2,010,025 | |
5.375%, due 6/1/29 | | | 4,780,000 | | | | 5,042,900 | |
5.75%, due 2/15/26 | | | 5,090,000 | | | | 5,264,791 | |
5.875%, due 4/1/24 | | | 8,005,000 | | | | 8,255,156 | |
5.875%, due 5/1/27 | | | 2,850,000 | | | | 2,973,833 | |
CSC Holdings LLC(a)
5.75%, due 1/15/30 | | | 9,020,000 | | | | 9,394,330 | |
6.50%, due 2/1/29 | | | 2,660,000 | | | | 2,909,375 | |
Diamond Sports Group LLC / Diamond Sports Finance Co.
6.625%, due 8/15/27 (a) | | | 2,600,000 | | | | 1,384,500 | |
DISH DBS Corp.
5.875%, due 7/15/22 | | | 7,655,000 | | | | 7,783,604 | |
6.75%, due 6/1/21 | | | 5,500,000 | | | | 5,603,125 | |
7.75%, due 7/1/26 | | | 10,255,000 | | | | 10,870,300 | |
LCPR Senior Secured Financing DAC
6.75%, due 10/15/27 (a) | | | 15,606,000 | | | | 15,918,120 | |
Meredith Corp.
6.875%, due 2/1/26 | | | 15,050,000 | | | | 12,514,225 | |
Quebecor Media, Inc.
5.75%, due 1/15/23 | | | 15,647,000 | | | | 16,390,232 | |
Sterling Entertainment Enterprises LLC
10.25%, due 1/15/25 (c)(d)(e)(i) | | | 7,000,000 | | | | 6,939,800 | |
| | | | | | |
The notes to the financial statements are an integral part of,
and should be read in conjunction with, the financial statements. | | | | | 15 | |
Portfolio of Investments June 30, 2020 (Unaudited) (continued)
| | | | | | | | |
| | | Principal
Amount | | | Value | |
| Corporate Bonds (continued) | |
Media (continued) | |
Videotron, Ltd.
5.00%, due 7/15/22 | | $ | 3,365,000 | | | $ | 3,474,363 | |
5.125%, due 4/15/27 (a) | | | 5,890,000 | | | | 6,111,640 | |
5.375%, due 6/15/24 (a) | | | 11,450,000 | | | | 12,194,250 | |
Virgin Media Finance PLC
5.00%, due 7/15/30 (a) | | | 2,100,000 | | | | 2,053,191 | |
| | | | | | | | |
| | | | | | | 192,062,003 | |
| | | | | | | | |
Metal Fabricate & Hardware 1.0% | |
Advanced Drainage Systems, Inc.
5.00%, due 9/30/27 (a) | | | 1,740,000 | | | | 1,753,050 | |
Grinding Media, Inc. / Moly-Cop AltaSteel, Ltd.
7.375%, due 12/15/23 (a) | | | 20,535,000 | | | | 20,432,325 | |
Optimas OE Solutions Holding LLC / Optimas OE Solutions, Inc.
8.625%, due 6/1/21 (a) | | | 3,250,000 | | | | 1,625,000 | |
Park-Ohio Industries, Inc.
6.625%, due 4/15/27 | | | 5,325,000 | | | | 4,366,500 | |
| | | | | | | | |
| | | | | | | 28,176,875 | |
| | | | | | | | |
Mining 2.2% | |
Alcoa Nederland Holding B.V. (a)
6.75%, due 9/30/24 | | | 2,765,000 | | | | 2,823,756 | |
7.00%, due 9/30/26 | | | 5,745,000 | | | | 5,888,625 | |
Arconic Corp.
6.00%, due 5/15/25 (a) | | | 2,200,000 | | | | 2,274,250 | |
Century Aluminum Co.
12.00%, due 7/1/25 (a) | | | 3,000,000 | | | | 3,022,500 | |
Compass Minerals International, Inc. (a)
4.875%, due 7/15/24 | | | 2,250,000 | | | | 2,255,625 | |
6.75%, due 12/1/27 | | | 7,990,000 | | | | 8,389,500 | |
Constellium S.E. (a)
5.625%, due 6/15/28 | | | 1,000,000 | | | | 980,000 | |
6.625%, due 3/1/25 | | | 1,650,000 | | | | 1,668,595 | |
First Quantum Minerals, Ltd.
7.25%, due 4/1/23 (a) | | | 7,480,000 | | | | 7,143,400 | |
Joseph T. Ryerson & Son, Inc.
11.00%, due 5/15/22 (a) | | | 1,450,000 | | | | 1,480,842 | |
Novelis Corp. (a)
4.75%, due 1/30/30 | | | 4,595,000 | | | | 4,388,225 | |
5.875%, due 9/30/26 | | | 20,805,000 | | | | 20,778,994 | |
| | | | | | | | |
| | | | | | | 61,094,312 | |
| | | | | | | | |
Miscellaneous—Manufacturing 1.0% | |
Amsted Industries, Inc. (a)
4.625%, due 5/15/30 | | | 2,615,000 | | | | 2,585,895 | |
5.625%, due 7/1/27 | | | 7,240,000 | | | | 7,466,250 | |
EnPro Industries, Inc.
5.75%, due 10/15/26 | | | 4,240,000 | | | | 4,240,000 | |
| | | | | | | | |
| | | Principal
Amount | | | Value | |
Miscellaneous—Manufacturing (continued) | |
FXI Holdings, Inc. (a)
7.875%, due 11/1/24 | | $ | 1,720,000 | | | $ | 1,479,200 | |
12.25%, due 11/15/26 | | | 3,921,000 | | | | 3,808,271 | |
Hillenbrand, Inc.
5.75%, due 6/15/25 | | | 2,000,000 | | | | 2,070,000 | |
Koppers, Inc.
6.00%, due 2/15/25 (a) | | | 6,270,000 | | | | 6,097,575 | |
| | | | | | | | |
| | | | | | | 27,747,191 | |
| | | | | | | | |
Oil & Gas 6.5% | |
Ascent Resources Utica Holdings LLC / ARU Finance Corp. (a)
7.00%, due 11/1/26 | | | 3,900,000 | | | | 2,496,000 | |
10.00%, due 4/1/22 | | | 4,206,000 | | | | 3,585,615 | |
California Resources Corp.
8.00%, due 12/15/22 (a)(f)(g) | | | 16,905,000 | | | | 581,194 | |
Callon Petroleum Co.
6.125%, due 10/1/24 | | | 8,080,000 | | | | 3,032,020 | |
CNX Resources Corp.
5.875%, due 4/15/22 | | | 1,084,000 | | | | 1,069,745 | |
Comstock Resources, Inc.
9.75%, due 8/15/26 | | | 500,000 | | | | 466,250 | |
9.75%, due 8/15/26 | | | 18,200,000 | | | | 17,017,000 | |
Continental Resources, Inc.
4.50%, due 4/15/23 | | | 3,250,000 | | | | 3,110,900 | |
5.00%, due 9/15/22 | | | 2,000,000 | | | | 1,965,000 | |
CVR Energy, Inc.
5.25%, due 2/15/25 (a) | | | 1,590,000 | | | | 1,462,800 | |
Endeavor Energy Resources, L.P. / EER Finance, Inc.
6.625%, due 7/15/25 (a) | | | 1,805,000 | | | | 1,819,115 | |
Energy Ventures Gom LLC / EnVen Finance Corp.
11.00%, due 2/15/23 (a) | | | 5,648,000 | | | | 4,716,080 | |
EQT Corp.
6.125%, due 2/1/25 | | | 4,500,000 | | | | 4,484,340 | |
Gulfport Energy Corp.
6.00%, due 10/15/24 | | | 15,745,000 | | | | 8,029,950 | |
6.375%, due 5/15/25 | | | 8,500,000 | | | | 4,239,842 | |
6.375%, due 1/15/26 | | | 5,051,000 | | | | 2,430,794 | |
Indigo Natural Resources LLC
6.875%, due 2/15/26 (a) | | | 4,505,000 | | | | 4,189,650 | |
Marathon Oil Corp.
4.40%, due 7/15/27 | | | 5,300,000 | | | | 5,214,480 | |
6.80%, due 3/15/32 | | �� | 2,665,000 | | | | 2,815,722 | |
Matador Resources Co.
5.875%, due 9/15/26 | | | 3,100,000 | | | | 2,294,000 | |
Moss Creek Resources Holdings, Inc.
7.50%, due 1/15/26 (a) | | | 4,065,000 | | | | 2,032,500 | |
Murphy Oil Corp.
6.875%, due 8/15/24 | | | 3,315,000 | | | | 3,099,525 | |
| | | | |
| 16 | | MainStay VP MacKay High Yield Corporate Bond Portfolio | | The notes to the financial statements are an integral part of,
and should be read in conjunction with, the financial statements. |
| | | | | | | | |
| | | Principal
Amount | | | Value | |
| Corporate Bonds (continued) | |
Oil & Gas (continued) | |
Noble Energy, Inc.
4.95%, due 8/15/47 | | $ | 4,330,000 | | | $ | 3,864,248 | |
5.05%, due 11/15/44 | | | 2,760,000 | | | | 2,512,806 | |
5.25%, due 11/15/43 | | | 1,800,000 | | | | 1,676,521 | |
Occidental Petroleum Corp.
2.70%, due 8/15/22 | | | 2,355,000 | | | | 2,192,387 | |
2.70%, due 2/15/23 | | | 3,500,000 | | | | 3,189,375 | |
2.90%, due 8/15/24 | | | 3,150,000 | | | | 2,691,612 | |
5.55%, due 3/15/26 | | | 9,840,000 | | | | 8,981,066 | |
6.45%, due 9/15/36 | | | 3,100,000 | | | | 2,619,500 | |
8.00%, due 7/15/25 | | | 1,750,000 | | | | 1,756,563 | |
Parkland Corp.
5.875%, due 7/15/27 (a) | | | 3,130,000 | | | | 3,247,375 | |
Parsley Energy LLC / Parsley Finance Corp. (a)
4.125%, due 2/15/28 | | | 1,000,000 | | | | 905,000 | |
5.25%, due 8/15/25 | | | 2,210,000 | | | | 2,122,373 | |
5.625%, due 10/15/27 | | | 1,635,000 | | | | 1,610,475 | |
PBF Holding Co. LLC / PBF Finance Corp.
6.00%, due 2/15/28 (a) | | | 10,410,000 | | | | 8,640,300 | |
7.25%, due 6/15/25 | | | 855,000 | | | | 775,913 | |
9.25%, due 5/15/25 (a) | | | 4,880,000 | | | | 5,209,400 | |
PDC Energy, Inc.
6.125%, due 9/15/24 | | | 5,783,000 | | | | 5,378,190 | |
PetroQuest Energy, Inc.
10.00% (10.00% PIK),
due 2/15/24 (c)(d)(e)(h) | | | 6,340,923 | | | | 634 | |
QEP Resources, Inc.
5.25%, due 5/1/23 | | | 1,803,000 | | | | 1,189,980 | |
5.625%, due 3/1/26 | | | 5,580,000 | | | | 3,543,300 | |
Range Resources Corp.
5.875%, due 7/1/22 | | | 2,903,000 | | | | 2,670,760 | |
9.25%, due 2/1/26 (a) | | | 6,738,000 | | | | 6,057,866 | |
Rex Energy Corp. (Escrow Claim)
8.00%, due 10/1/20 (e)(i) | | | 40,580,000 | | | | 304,350 | |
Southwestern Energy Co.
6.20%, due 1/23/25 | | | 7,455,000 | | | | 6,383,344 | |
7.50%, due 4/1/26 | | | 8,420,000 | | | | 7,370,026 | |
Sunoco, L.P. / Sunoco Finance Corp.
6.00%, due 4/15/27 | | | 2,000,000 | | | | 1,980,000 | |
Talos Production LLC / Talos Production Finance, Inc.
11.00%, due 4/3/22 | | | 9,828,857 | | | | 9,140,837 | |
Transocean Pontus, Ltd.
6.125%, due 8/1/25 (a) | | | 1,670,000 | | | | 1,452,900 | |
Transocean Poseidon, Ltd.
6.875%, due 2/1/27 (a) | | | 1,500,000 | | | | 1,275,000 | |
Transocean Sentry, Ltd.
5.375%, due 5/15/23 (a) | | | 3,000,000 | | | | 2,535,000 | |
| | | | | | | | |
| | | Principal
Amount | | | Value | |
Oil & Gas (continued) | |
Ultra Resources, Inc.
6.875%, due 4/15/22 (a)(f)(g) | | $ | 9,675,000 | | | $ | 24,188 | |
Viper Energy Partners, L.P.
5.375%, due 11/1/27 (a) | | | 2,000,000 | | | | 1,961,840 | |
Whiting Petroleum Corp. (f)(g)
6.25%, due 4/1/23 | | | 4,040,000 | | | | 701,950 | |
6.625%, due 1/15/26 | | | 4,550,000 | | | | 807,625 | |
| | | | | | | | |
| | | | | | | 184,925,226 | |
| | | | | | | | |
Oil & Gas Services 0.3% | |
Forum Energy Technologies, Inc.
6.25%, due 10/1/21 | | | 13,290,000 | | | | 5,199,712 | |
Nine Energy Service, Inc.
8.75%, due 11/1/23 (a) | | | 5,657,000 | | | | 2,757,788 | |
| | | | | | | | |
| | | | | | | 7,957,500 | |
| | | | | | | | |
Packaging & Containers 0.4% | |
ARD Finance S.A.
6.50% (6.50% Cash or 7.25% PIK), due 6/30/27 (a)(h) | | | 3,950,000 | | | | 3,908,031 | |
Cascades, Inc. / Cascades U.S.A., Inc. (a)
5.125%, due 1/15/26 | | | 2,810,000 | | | | 2,852,150 | |
5.375%, due 1/15/28 | | | 2,325,000 | | | | 2,359,875 | |
Matthews International Corp.
5.25%, due 12/1/25 (a) | | | 3,134,000 | | | | 2,820,600 | |
| | | | | | | | |
| | | | | | | 11,940,656 | |
| | | | | | | | |
Pharmaceuticals 1.2% | |
Bausch Health Americas, Inc.
9.25%, due 4/1/26 (a) | | | 1,435,000 | | | | 1,556,832 | |
Bausch Health Cos., Inc. (a)
5.00%, due 1/30/28 | | | 3,430,000 | | | | 3,229,311 | |
5.25%, due 1/30/30 | | | 2,645,000 | | | | 2,509,444 | |
6.125%, due 4/15/25 | | | 3,200,000 | | | | 3,245,664 | |
6.25%, due 2/15/29 | | | 6,400,000 | | | | 6,432,000 | |
7.00%, due 1/15/28 | | | 1,750,000 | | | | 1,802,500 | |
Endo Dac / Endo Finance LLC / Endo Finco, Inc. (a)
6.00%, due 6/30/28 | | | 4,575,000 | | | | 2,950,875 | |
9.50%, due 7/31/27 | | | 3,185,000 | | | | 3,368,774 | |
Par Pharmaceutical, Inc.
7.50%, due 4/1/27 (a) | | | 6,411,000 | | | | 6,578,968 | |
Vizient, Inc.
6.25%, due 5/15/27 (a) | | | 2,325,000 | | | | 2,435,437 | |
| | | | | | | | |
| | | | | | | 34,109,805 | |
| | | | | | | | |
Pipelines 4.8% | |
ANR Pipeline Co.
7.375%, due 2/15/24 | | | 395,000 | | | | 471,029 | |
9.625%, due 11/1/21 | | | 5,950,000 | | | | 6,635,051 | |
Antero Midstream Partners, L.P. / Antero Midstream Finance Corp.
5.375%, due 9/15/24 | | | 3,810,000 | | | | 3,246,082 | |
5.75%, due 1/15/28 (a) | | | 1,565,000 | | | | 1,236,350 | |
| | | | | | |
The notes to the financial statements are an integral part of,
and should be read in conjunction with, the financial statements. | | | | | 17 | |
Portfolio of Investments June 30, 2020 (Unaudited) (continued)
| | | | | | | | |
| | | Principal
Amount | | | Value | |
| Corporate Bonds (continued) | |
Pipelines (continued) | |
Cheniere Energy Partners, L.P.
5.25%, due 10/1/25 | | $ | 4,630,000 | | | $ | 4,614,721 | |
5.625%, due 10/1/26 | | | 1,800,000 | | | | 1,791,000 | |
CNX Midstream Partners, L.P. / CNX Midstream Finance Corp.
6.50%, due 3/15/26 (a) | | | 6,022,000 | | | | 5,540,240 | |
Enable Midstream Partners, L.P.
4.15%, due 9/15/29 | | | 2,260,000 | | | | 1,982,059 | |
4.40%, due 3/15/27 | | | 5,002,000 | | | | 4,659,355 | |
4.95%, due 5/15/28 | | | 1,640,000 | | | | 1,519,118 | |
EQM Midstream Partners, L.P. (a)
6.00%, due 7/1/25 | | | 2,000,000 | | | | 2,025,840 | |
6.50%, due 7/1/27 | | | 2,145,000 | | | | 2,196,952 | |
Hess Midstream Operations L.P.
5.625%, due 2/15/26 (a) | | | 3,300,000 | | | | 3,265,317 | |
Holly Energy Partners, L.P. / Holly Energy Finance Corp.
5.00%, due 2/1/28 (a) | | | 2,845,000 | | | | 2,709,863 | |
MPLX, L.P.
4.875%, due 12/1/24 | | | 5,790,000 | | | | 6,430,750 | |
4.875%, due 6/1/25 | | | 8,383,000 | | | | 9,357,773 | |
6.25%, due 10/15/22 | | | 524,000 | | | | 530,033 | |
6.375%, due 5/1/24 | | | 2,440,000 | | | | 2,519,355 | |
NGPL PipeCo LLC(a)
4.375%, due 8/15/22 | | | 2,500,000 | | | | 2,578,459 | |
4.875%, due 8/15/27 | | | 5,280,000 | | | | 5,802,301 | |
Northwest Pipeline LLC
7.125%, due 12/1/25 | | | 2,195,000 | | | | 2,791,680 | |
NuStar Logistics, L.P.
6.75%, due 2/1/21 | | | 6,125,000 | | | | 6,079,062 | |
PBF Logistics, L.P. / PBF Logistics Finance Corp.
6.875%, due 5/15/23 | | | 1,200,000 | | | | 1,143,000 | |
Plains All American Pipeline, L.P.
6.125%, due 11/15/22 (j)(k) | | | 14,265,000 | | | | 10,181,644 | |
Rockies Express Pipeline LLC(a)
3.60%, due 5/15/25 | | | 2,000,000 | | | | 1,845,600 | |
4.80%, due 5/15/30 | | | 5,000,000 | | | | 4,600,000 | |
Ruby Pipeline LLC
7.00%, due 4/1/22 (a) | | | 4,772,727 | | | | 4,441,233 | |
Tallgrass Energy Partners, L.P. / Tallgrass Energy Finance Corp. (a)
5.50%, due 9/15/24 | | | 9,560,000 | | | | 8,633,349 | |
6.00%, due 3/1/27 | | | 1,500,000 | | | | 1,331,250 | |
Targa Resources Partners, L.P. / Targa Resources Partners Finance Corp.
5.50%, due 3/1/30 (a) | | | 4,200,000 | | | | 4,055,604 | |
5.875%, due 4/15/26 | | | 4,915,000 | | | | 4,865,850 | |
| | | | | | | | |
| | | Principal
Amount | | | Value | |
Pipelines (continued) | |
TransMontaigne Partners, L.P. / TLP Finance Corp.
6.125%, due 2/15/26 | | $ | 8,055,000 | | | $ | 7,773,075 | |
Western Midstream Operating, L.P.
3.10%, due 2/1/25 | | | 1,200,000 | | | | 1,137,000 | |
4.65%, due 7/1/26 | | | 2,000,000 | | | | 1,915,600 | |
5.50%, due 8/15/48 | | | 6,360,000 | | | | 5,151,600 | |
| | | | | | | | |
| | | | | | | 135,057,195 | |
| | | | | | | | |
Real Estate 0.9% | |
CBRE Services, Inc.
5.25%, due 3/15/25 | | | 2,295,000 | | | | 2,584,609 | |
Howard Hughes Corp.
5.375%, due 3/15/25 (a) | | | 8,195,000 | | | | 7,626,267 | |
Kennedy-Wilson, Inc.
5.875%, due 4/1/24 | | | 6,305,000 | | | | 6,273,475 | |
Newmark Group, Inc.
6.125%, due 11/15/23 | | | 9,839,000 | | | | 9,768,602 | |
| | | | | | | | |
| | | | | | | 26,252,953 | |
| | | | | | | | |
Real Estate Investment Trusts 4.6% | |
Crown Castle International Corp.
5.25%, due 1/15/23 | | | 20,235,000 | | | | 22,516,676 | |
CTR Partnership, L.P. / CareTrust Capital Corp.
5.25%, due 6/1/25 | | | 3,500,000 | | | | 3,535,000 | |
Diversified Healthcare Trust
9.75%, due 6/15/25 | | | 4,200,000 | | | | 4,509,750 | |
Equinix, Inc.
5.375%, due 5/15/27 | | | 16,710,000 | | | | 18,230,610 | |
5.875%, due 1/15/26 | | | 14,253,000 | | | | 14,999,857 | |
GLP Capital, L.P. / GLP Financing II, Inc.
5.30%, due 1/15/29 | | | 5,400,000 | | | | 5,843,232 | |
5.375%, due 4/15/26 | | | 1,506,000 | | | | 1,645,441 | |
Ladder Capital Finance Holdings LLLP / Ladder Capital Finance Corp.
5.875%, due 8/1/21 (a) | | | 5,600,000 | | | | 5,544,000 | |
MGM Growth Properties Operating Partnership, L.P. / MGP Finance Co-Issuer, Inc.
4.625%, due 6/15/25 (a) | | | 4,000,000 | | | | 3,911,520 | |
5.625%, due 5/1/24 | | | 19,120,000 | | | | 19,789,582 | |
5.75%, due 2/1/27 | | | 6,090,000 | | | | 6,242,250 | |
MPT Operating Partnership, L.P. / MPT Finance Corp.
4.625%, due 8/1/29 | | | 3,000,000 | | | | 3,015,000 | |
5.00%, due 10/15/27 | | | 7,726,000 | | | | 7,938,465 | |
Ryman Hospitality Properties, Inc.
4.75%, due 10/15/27 (a) | | | 5,215,000 | | | | 4,641,350 | |
SBA Communications Corp.
3.875%, due 2/15/27 (a) | | | 3,000,000 | | | | 2,988,750 | |
| | | | |
| 18 | | MainStay VP MacKay High Yield Corporate Bond Portfolio | | The notes to the financial statements are an integral part of,
and should be read in conjunction with, the financial statements. |
| | | | | | | | |
| | | Principal
Amount | | | Value | |
| Corporate Bonds (continued) | |
Real Estate Investment Trusts (continued) | |
Starwood Property Trust, Inc.
5.00%, due 12/15/21 | | $ | 2,962,000 | | | $ | 2,873,140 | |
VICI Properties, L.P. / VICI Note Co., Inc. (a)
3.75%, due 2/15/27 | | | 1,810,000 | | | | 1,701,400 | |
4.125%, due 8/15/30 | | | 1,875,000 | | | | 1,788,281 | |
| | | | | | | | |
| | | | | | | 131,714,304 | |
| | | | | | | | |
Retail 2.9% | |
Asbury Automotive Group, Inc. (a)
4.50%, due 3/1/28 | | | 3,160,000 | | | | 3,065,200 | |
4.75%, due 3/1/30 | | | 4,000,000 | | | | 3,900,000 | |
Beacon Roofing Supply, Inc.
4.875%, due 11/1/25 (a) | | | 5,460,000 | | | | 4,873,050 | |
Group 1 Automotive, Inc.
5.00%, due 6/1/22 | | | 5,735,000 | | | | 5,699,271 | |
KFC Holding Co. / Pizza Hut Holdings LLC / Taco Bell of America LLC(a)
4.75%, due 6/1/27 | | | 5,275,000 | | | | 5,406,875 | |
5.00%, due 6/1/24 | | | 10,600,000 | | | | 10,798,750 | |
5.25%, due 6/1/26 | | | 7,500,000 | | | | 7,687,500 | |
KGA Escrow, LLC
7.50%, due 8/15/23 (a) | | | 5,350,000 | | | | 5,343,312 | |
Kohl’s Corp.
9.50%, due 5/15/25 | | | 2,380,000 | | | | 2,718,161 | |
L Brands, Inc.
6.694%, due 1/15/27 | | | 1,300,000 | | | | 1,098,500 | |
6.875%, due 7/1/25 (a) | | | 500,000 | | | | 516,250 | |
Lithia Motors, Inc.
4.625%, due 12/15/27 (a) | | | 2,430,000 | | | | 2,405,700 | |
Murphy Oil USA, Inc.
4.75%, due 9/15/29 | | | 2,000,000 | | | | 2,045,000 | |
5.625%, due 5/1/27 | | | 2,994,000 | | | | 3,091,305 | |
Penske Automotive Group, Inc.
5.375%, due 12/1/24 | | | 2,970,000 | | | | 2,962,575 | |
5.50%, due 5/15/26 | | | 3,097,000 | | | | 3,089,257 | |
5.75%, due 10/1/22 | | | 6,670,000 | | | | 6,670,000 | |
TPro Acquisition Corp.
11.00%, due 10/15/24 (a) | | | 1,962,000 | | | | 1,908,634 | |
Yum! Brands, Inc.
4.75%, due 1/15/30 (a) | | | 8,767,000 | | | | 8,898,505 | |
| | | | | | | | |
| | | | | | | 82,177,845 | |
| | | | | | | | |
Software 3.7% | |
ACI Worldwide, Inc.
5.75%, due 8/15/26 (a) | | | 4,405,000 | | | | 4,588,909 | |
Ascend Learning LLC
6.875%, due 8/1/25 (a) | | | 7,485,000 | | | | 7,540,202 | |
Camelot Finance S.A.
4.50%, due 11/1/26 (a) | | | 4,405,000 | | | | 4,405,000 | |
| | | | | | | | |
| | | Principal
Amount | | | Value | |
Software (continued) | |
CDK Global, Inc.
5.25%, due 5/15/29 (a) | | $ | 4,070,000 | | | $ | 4,226,369 | |
5.875%, due 6/15/26 | | | 10,900,000 | | | | 11,320,958 | |
Change Healthcare Holdings LLC / Change Healthcare Finance, Inc.
5.75%, due 3/1/25 (a) | | | 1,900,000 | | | | 1,876,250 | |
Fair Isaac Corp.
5.25%, due 5/15/26 (a) | | | 3,590,000 | | | | 3,913,100 | |
MSCI, Inc. (a)
3.625%, due 9/1/30 | | | 3,215,000 | | | | 3,198,925 | |
3.875%, due 2/15/31 | | | 10,620,000 | | | | 10,832,400 | |
4.00%, due 11/15/29 | | | 9,150,000 | | | | 9,333,000 | |
4.75%, due 8/1/26 | | | 3,570,000 | | | | 3,693,129 | |
5.375%, due 5/15/27 | | | 6,230,000 | | | | 6,611,587 | |
Open Text Corp. (a)
3.875%, due 2/15/28 | | | 4,560,000 | | | | 4,390,414 | |
5.875%, due 6/1/26 | | | 5,675,000 | | | | 5,888,437 | |
Open Text Holdings, Inc.
4.125%, due 2/15/30 (a) | | | 3,680,000 | | | | 3,615,600 | |
PTC, Inc. (a)
3.625%, due 2/15/25 | | | 3,400,000 | | | | 3,374,500 | |
4.00%, due 2/15/28 | | | 5,160,000 | | | | 5,109,019 | |
RP Crown Parent LLC
7.375%, due 10/15/24 (a) | | | 7,110,000 | | | | 7,092,225 | |
SS&C Technologies, Inc.
5.50%, due 9/30/27 (a) | | | 5,000,000 | | | | 5,073,200 | |
| | | | | | | | |
| | | | | | | 106,083,224 | |
| | | | | | | | |
Telecommunications 6.9% | |
Altice France S.A.
7.375%, due 5/1/26 (a) | | | 7,000,000 | | | | 7,299,600 | |
CenturyLink, Inc.
5.80%, due 3/15/22 | | | 9,925,000 | | | | 10,197,938 | |
CommScope Technologies LLC
6.00%, due 6/15/25 (a) | | | 1,500,000 | | | | 1,448,550 | |
CommScope, Inc.
8.25%, due 3/1/27 (a) | | | 8,924,000 | | | | 9,171,195 | |
Connect Finco SARL / Connect U.S. Finco LLC
6.75%, due 10/1/26 (a) | | | 12,365,000 | | | | 11,715,837 | |
Hughes Satellite Systems Corp.
5.25%, due 8/1/26 | | | 7,035,000 | | | | 7,275,597 | |
6.625%, due 8/1/26 | | | 6,460,000 | | | | 6,704,705 | |
7.625%, due 6/15/21 | | | 8,695,000 | | | | 8,955,850 | |
Level 3 Financing, Inc.
5.375%, due 5/1/25 | | | 6,300,000 | | | | 6,433,875 | |
5.625%, due 2/1/23 | | | 4,000,000 | | | | 4,002,800 | |
QualityTech, L.P. / QTS Finance Corp.
4.75%, due 11/15/25 (a) | | | 6,650,000 | | | | 6,786,392 | |
Sprint Capital Corp.
6.875%, due 11/15/28 | | | 31,465,000 | | | | 38,308,637 | |
Sprint Corp.
7.875%, due 9/15/23 | | | 14,030,000 | | | | 15,801,287 | |
| | | | | | |
The notes to the financial statements are an integral part of,
and should be read in conjunction with, the financial statements. | | | | | 19 | |
Portfolio of Investments June 30, 2020 (Unaudited) (continued)
| | | | | | | | |
| | | Principal
Amount | | | Value | |
| Corporate Bonds (continued) | |
Telecommunications (continued) | |
T-Mobile USA, Inc.
4.50%, due 2/1/26 | | $ | 3,345,000 | | | $ | 3,385,006 | |
4.75%, due 2/1/28 | | | 9,585,000 | | | | 10,125,594 | |
5.125%, due 4/15/25 | | | 7,520,000 | | | | 7,689,200 | |
5.375%, due 4/15/27 | | | 8,875,000 | | | | 9,340,938 | |
6.00%, due 4/15/24 | | | 6,840,000 | | | | 6,988,428 | |
6.375%, due 3/1/25 | | | 9,700,000 | | | | 9,966,750 | |
6.50%, due 1/15/24 | | | 4,000,000 | | | | 4,086,800 | |
6.50%, due 1/15/26 | | | 10,150,000 | | | | 10,607,866 | |
| | | | | | | | |
| | | | | | | 196,292,845 | |
| | | | | | | | |
Textiles 0.2% | |
Eagle Intermediate Global Holding B.V. / Ruyi U.S. Finance LLC
7.50%, due 5/1/25 (a) | | | 9,745,000 | | | | 6,772,775 | |
| | | | | | | | |
|
Toys, Games & Hobbies 0.8% | |
Mattel, Inc. (a)
5.875%, due 12/15/27 | | | 5,980,000 | | | | 6,159,400 | |
6.75%, due 12/31/25 | | | 16,965,000 | | | | 17,601,188 | |
| | | | | | | | |
| | | | | | | 23,760,588 | |
| | | | | | | | |
Transportation 0.4% | |
Teekay Corp.
9.25%, due 11/15/22 (a) | | | 1,500,000 | | | | 1,440,000 | |
Watco Cos. LLC / Watco Finance Corp.
6.50%, due 6/15/27 (a) | | | 9,000,000 | | | | 9,221,220 | |
| | | | | | | | |
| | | | | | | 10,661,220 | |
| | | | | | | | |
Total Corporate Bonds
(Cost $2,706,469,702) | | | | 2,604,940,256 | |
| | | | | |
|
| Loan Assignments 2.5% | |
Aerospace & Defense 0.1% | |
TransDigm, Inc.
2020 Term Loan F
2.428% (1 Month LIBOR + 2.25%), due 12/9/25 (l) | | | 2,786,000 | | | | 2,506,238 | |
| | | | | | | | |
|
Automobile 0.2% | |
Dealer Tire LLC
2020 Term Loan B
4.428% (1 Month LIBOR + 4.25%), due 12/12/25 (l) | | | 5,970,000 | | | | 5,691,398 | |
| | | | | | | | |
|
Beverage, Food & Tobacco 0.3% | |
United Natural Foods, Inc.
Term Loan B
4.428% (1 Month LIBOR + 4.25%), due 10/22/25 (l) | | | 9,437,508 | | | | 8,980,374 | |
| | | | | | | | |
| | | | | | | | |
| | | Principal
Amount | | | Value | |
Chemicals, Plastics & Rubber 0.4% | |
Innophos, Inc.
2020 Term Loan B
3.928% (1 Month LIBOR + 3.75%), due 2/4/27 (l) | | $ | 1,895,250 | | | $ | 1,852,607 | |
SCIH Salt Holdings, Inc.
Term Loan B
5.50% (3 Month LIBOR + 4.50%), due 3/16/27 (l) | | | 10,000,000 | | | | 9,800,000 | |
| | | | | | | | |
| | | | | | | 11,652,607 | |
| | | | | | | | |
|
Electronics 0.1% | |
RP Crown Parent LLC
2016 Term Loan B
3.75% (1 Month LIBOR + 2.75%), due 10/12/23 (l) | | | 2,392,875 | | | | 2,322,585 | |
| | | | | | | | |
|
Iron & Steel 0.0%‡ | |
Big River Steel LLC
Term Loan B
TBD, due 8/23/23 | | | 1,000,000 | | | | 937,500 | |
| | | | | | | | |
|
Oil & Gas 0.2% | |
PetroQuest Energy, Inc.
Term Loan Note
10.013%, due 11/8/23 (c)(d)(e) | | | 5,041,752 | | | | 4,134,237 | |
| | | | | | | | |
|
Retail Store 0.7% | |
Bass Pro Group LLC
Term Loan B
6.072% (3 Month LIBOR + 5.00%), due 9/25/24 (l) | | | 21,405,046 | | | | 20,548,844 | |
| | | | | | | | |
|
Utilities 0.5% | |
Pacific Gas & Electric Co.
2020 Exit Term Loan B
5.50% (3 Month LIBOR + 4.50%), due 6/23/25 (l) | | | 13,500,000 | | | | 13,308,745 | |
| | | | | | | | |
Total Loan Assignments
(Cost $71,657,861) | | | | 70,082,528 | |
| | | | | |
Total Long-Term Bonds
(Cost $2,796,606,260) | | | | 2,693,885,396 | |
| | | | | |
| | |
| | | | | | | | |
| | |
| | | Shares | | | | |
| Common Stocks 1.0% | |
Auto Parts & Equipment 0.0%‡ | |
ATD New Holdings, Inc. (e)(m) | | | 44,740 | | | | 592,805 | |
Exide Technologies (c)(d)(e)(i)(m) | | | 7,037,072 | | | | 0 | |
| | | | | | | | |
| | | | | | | 592,805 | |
| | | | | | | | |
| | | | |
| 20 | | MainStay VP MacKay High Yield Corporate Bond Portfolio | | The notes to the financial statements are an integral part of,
and should be read in conjunction with, the financial statements. |
| | | | | | | | |
| | | Sharres | | | Value | |
Electric Utilities 0.0%‡ | |
Keycon Power Holdings LLC (c)(d)(e)(m) | | | 11,280 | | | $ | 113 | |
| | | | | | | | |
|
Independent Power & Renewable Electricity Producers 0.7% | |
GenOn Energy, Inc. (d)(i) | | | 115,826 | | | | 21,427,810 | |
PetroQuest Energy, Inc. (c)(d)(e) | | | 668,661 | | | | 0 | |
| | | | | | | | |
| | | | | | | 21,427,810 | |
| | | | | | | | |
Media 0.0%‡ | |
ION Media Networks, Inc. (c)(d)(e)(i) | | | 725 | | | | 273,470 | |
| | | | | | | | |
|
Metals & Mining 0.1% | |
Neenah Enterprises, Inc. (c)(d)(e)(m) | | | 230,859 | | | | 2,006,164 | |
| | | | | | | | |
|
Oil, Gas & Consumable Fuels 0.2% | |
Talos Energy, Inc. (m) | | | 637,880 | | | | 5,868,496 | |
Titan Energy LLC (m) | | | 25,911 | | | | 1,788 | |
| | | | | | | | |
| | | | | | | 5,870,284 | |
| | | | | | | | |
|
Software 0.0%‡ | |
ASG Corp. (c)(d)(e)(m) | | | 3,368 | | | | 0 | |
| | | | | | | | |
Total Common Stocks
(Cost $72,538,436) | | | | 30,170,646 | |
| | | | | |
|
| Short-Term Investments 3.5% | |
Unaffiliated Investment Companies 3.5% | |
State Street Institutional U.S. Government Money Market Fund, Premier Class, 0.12% (n) | | | 94,505,008 | | | | 94,505,008 | |
State Street Navigator Securities Lending Government Money Market Portfolio, 0.13% (n)(o) | | | 4,019,400 | | | | 4,019,400 | |
| | | | | | | | |
Total Short-Term Investments
(Cost $98,524,408) | | | | 98,524,408 | |
| | | | | |
Total Investments
(Cost $2,967,669,104) | | | 99.3 | % | | | 2,822,580,450 | |
Other Assets, Less Liabilities | | | 0.7 | | | | 18,888,331 | |
Net Assets | | | 100.0 | % | | $ | 2,841,468,781 | |
| † | Percentages indicated are based on Portfolio net assets. |
| ‡ | Less than one-tenth of a percent. |
| (a) | May be sold to institutional investors only under Rule 144A or securities offered pursuant to Section 4(a)(2) of the Securities Act of 1933, as amended. |
| (b) | All or a portion of this security was held on loan. As of June 30, 2020, the aggregate market value of securities on loan was $17,972,344; the total market value of collateral held by the Portfolio was $18,325,488. The market value of the collateral held included non-cash collateral in the form of U.S. Treasury securities with a value of $14,306,088 (See Note 2(H)). |
| (c) | Security in which significant unobservable inputs (Level 3) were used in determining fair value. |
| (d) | Fair valued security—Represents fair value as measured in good faith under procedures approved by the Board of Trustees. As of June 30, 2020, the total market value of the fair valued securities was $47,760,851, which represented 1.7% of the Portfolio’s net assets. |
| (e) | Illiquid security—As of June 30, 2020, the total market value of these securities deemed illiquid under procedures approved by the Board of Trustees was $29,966,926, which represented 1.1% of the Portfolio’s net assets. |
| (g) | Issue in non-accrual status. |
| (h) | PIK (“Payment-in-Kind”)—issuer may pay interest or dividends with additional securities and/or in cash. |
| (i) | Restricted security. (See Note 5) |
| (j) | Securities are perpetual and, thus, do not have a predetermined maturity date. The date shown, if applicable, reflects the next call date. |
| (k) | Fixed to floating rate—Rate shown was the rate in effect as of June 30, 2020. |
| (l) | Floating rate—Rate shown was the rate in effect as of June 30, 2020. |
| (m) | Non-income producing security. |
| (n) | Current yield as of June 30, 2020. |
| (o) | Represents a security purchased with cash collateral received for securities on loan. |
The following abbreviations are used in the preceding pages:
LIBOR —London Interbank Offered Rate
TBD —To Be Determined
| | | | | | |
The notes to the financial statements are an integral part of,
and should be read in conjunction with, the financial statements. | | | | | 21 | |
Portfolio of Investments June 30, 2020 (Unaudited) (continued)
The following is a summary of the fair valuations according to the inputs used as of June 30, 2020, for valuing the Portfolio’s assets:
| | | | | | | | | | | | | | | | |
Description | | Quoted
Prices in
Active
Markets for
Identical
Assets (Level 1) | | | Significant
Other
Observable
Inputs
(Level 2) | | | Significant
Unobservable
Inputs (Level 3) | | | Total | |
| | | | |
Asset Valuation Inputs | | | | | | | | | | | | | | | | |
| Investments in Securities (a) | | | | | | | | | | | | | | | | |
| Long-Term Bonds | | | | | | | | | | | | | | | | |
Convertible Bonds | | $ | — | | | $ | 18,862,612 | | | $ | — | | | $ | 18,862,612 | |
Corporate Bonds (b) | | | — | | | | 2,585,021,199 | | | | 19,919,057 | | | | 2,604,940,256 | |
Loan Assignments (c) | | | — | | | | 65,948,291 | | | | 4,134,237 | | | | 70,082,528 | |
| | | | | | | | | | | | | | | | |
| Total Long-Term Bonds | | | — | | | | 2,669,832,102 | | | | 24,053,294 | | | | 2,693,885,396 | |
| | | | | | | | | | | | | | | | |
| Common Stocks (d) | | | 5,870,284 | | | | 22,020,615 | | | | 2,279,747 | | | | 30,170,646 | |
| Short-Term Investments | | | | | | | | | |
Unaffiliated Investment Companies | | | 98,524,408 | | | | — | | | | — | | | | 98,524,408 | |
| | | | | | | | | | | | | | | | |
| Total Investments in Securities | | $ | 104,394,692 | | | $ | 2,691,852,717 | | | $ | 26,333,041 | | | $ | 2,822,580,450 | |
| | | | | | | | | | | | | | | | |
| (a) | For a complete listing of investments and their industries, see the Portfolio of Investments. |
| (b) | The Level 3 securities valued at $12,978,623, $6,939,800 and $634 are held in Auto Parts & Equipment, Media and Oil & Gas, respectively, within the Corporate Bonds section of the Portfolio of Investments. |
| (c) | The Level 3 security valued at $4,134,237 is held in Oil & Gas within the Loan Assignments section of the Portfolio of Investments. |
| (d) | The Level 3 securities valued at $0, $113, $0, $273,470, $2,006,164 and $0 are held in Auto Parts & Equipment, Electric Utilities, Independent Power & Renewable Electricity Producers, Media, Metals & Mining and Software, respectively, within the Common Stocks section of the Portfolio of Investments. |
| | | | |
| 22 | | MainStay VP MacKay High Yield Corporate Bond Portfolio | | The notes to the financial statements are an integral part of,
and should be read in conjunction with, the financial statements. |
Statement of Assets and Liabilities as of June 30, 2020 (Unaudited)
| | | | |
| Assets | |
Investment in securities, at value
(identified cost $2,967,669,104) including securities on loan of $17,972,344 | | $ | 2,822,580,450 | |
Cash | | | 3,181 | |
Receivables: | | | | |
Interest | | | 42,476,977 | |
Investment securities sold | | | 11,496,859 | |
Portfolio shares sold | | | 1,367,263 | |
Securities lending | | | 3,555 | |
Other assets | | | 14,473 | |
| | | | |
Total assets | | | 2,877,942,758 | |
| | | | |
|
| Liabilities | |
Cash collateral received for securities on loan | | | 4,019,400 | |
Payables: | |
Investment securities purchased | | | 25,861,104 | |
Portfolio shares redeemed | | | 4,559,405 | |
Manager (See Note 3) | | | 1,311,327 | |
NYLIFE Distributors (See Note 3) | | | 498,749 | |
Shareholder communication | | | 148,895 | |
Professional fees | | | 42,617 | |
Custodian | | | 13,009 | |
Trustees | | | 3,599 | |
Accrued expenses | | | 15,872 | |
| | | | |
Total liabilities | | | 36,473,977 | |
| | | | |
Net assets | | $ | 2,841,468,781 | |
| | | | |
|
| Composition of Net Assets | |
Shares of beneficial interest outstanding (par value of $.001 per share) unlimited number of shares authorized | | $ | 301,774 | |
Additional paid-in capital | | | 2,839,075,850 | |
| | | | |
| | | 2,839,377,624 | |
Total distributable earnings (loss) | | | 2,091,157 | |
| | | | |
Net assets | | $ | 2,841,468,781 | |
| | | | |
| | | | |
Initial Class | |
Net assets applicable to outstanding shares | | $ | 432,343,929 | |
| | | | |
Shares of beneficial interest outstanding | | | 45,280,980 | |
| | | | |
Net asset value per share outstanding | | $ | 9.55 | |
| | | | |
Service Class | |
Net assets applicable to outstanding shares | | $ | 2,409,124,852 | |
| | | | |
Shares of beneficial interest outstanding | | | 256,492,627 | |
| | | | |
Net asset value per share outstanding | | $ | 9.39 | |
| | | | |
| | | | | | |
The notes to the financial statements are an integral part of,
and should be read in conjunction with, the financial statements. | | | | | 23 | |
Statement of Operations for the six months ended June 30, 2020 (Unaudited)
| | | | |
| Investment Income (Loss) | |
Income | | | | |
Interest | | $ | 85,259,757 | |
Securities lending | | | 10,904 | |
| | | | |
Total income | | | 85,270,661 | |
| | | | |
Expenses | |
Manager (See Note 3) | | | 7,895,651 | |
Distribution/Service—Service Class (See Note 3) | | | 3,002,242 | |
Shareholder communication | | | 152,838 | |
Professional fees | | | 148,455 | |
Trustees | | | 35,517 | |
Custodian | | | 25,638 | |
Miscellaneous | | | 51,691 | |
| | | | |
Total expenses | | | 11,312,032 | |
| | | | |
Net investment income (loss) | | | 73,958,629 | |
| | | | |
|
| Realized and Unrealized Gain (Loss) on Investments | |
| |
Net realized gain (loss) on investments | | | (16,757,767 | ) |
Net change in unrealized appreciation (depreciation) on investments | | | (191,781,641 | ) |
| | | | |
Net realized and unrealized gain (loss) on investments | | | (208,539,408 | ) |
| | | | |
Net increase (decrease) in net assets resulting from operations | | $ | (134,580,779 | ) |
| | | | |
| | | | |
| 24 | | MainStay VP MacKay High Yield Corporate Bond Portfolio | | The notes to the financial statements are an integral part of,
and should be read in conjunction with, the financial statements. |
Statements of Changes in Net Assets
for the six months ended June 30, 2020 (Unaudited) and the year ended December 31, 2019
| | | | | | | | |
| | | 2020 | | | 2019 | |
| Increase (Decrease) in Net Assets | |
Operations: | | | | | | | | |
Net investment income (loss) | | $ | 73,958,629 | | | $ | 164,890,627 | |
Net realized gain (loss) on investments | | | (16,757,767 | ) | | | (13,991,852 | ) |
Net change in unrealized appreciation (depreciation) on investments | | | (191,781,641 | ) | | | 201,579,960 | |
| | | | | | | | |
Net increase (decrease) in net assets resulting from operations | | | (134,580,779 | ) | | | 352,478,735 | |
| | | | | | | | |
Distributions to shareholders: | | | | | | | | |
Initial Class | | | — | | | | (25,956,045 | ) |
Service Class | | | — | | | | (135,444,236 | ) |
| | | | | | | | |
Total distributions to shareholders | | | — | | | | (161,400,281 | ) |
| | | | | | | | |
Capital share transactions: | | | | | | | | |
Net proceeds from sale of shares | | | 201,882,652 | | | | 302,869,732 | |
Net asset value of shares issued to shareholders in reinvestment of distributions | | | — | | | | 161,400,281 | |
Cost of shares redeemed | | | (254,677,831 | ) | | | (382,776,093 | ) |
| | | | | | | | |
Increase (decrease) in net assets derived from capital share transactions | | | (52,795,179 | ) | | | 81,493,920 | |
| | | | | | | | |
Net increase (decrease) in net assets | | | (187,375,958 | ) | | | 272,572,374 | |
| | |
| Net Assets | | | | | | | | |
Beginning of period | | | 3,028,844,739 | | | | 2,756,272,365 | |
| | | | | | | | |
End of period | | $ | 2,841,468,781 | | | $ | 3,028,844,739 | |
| | | | | | | | |
| | | | | | |
The notes to the financial statements are an integral part of,
and should be read in conjunction with, the financial statements. | | | | | 25 | |
Financial Highlights selected per share data and ratios
| | | | | | | | | | | | | | | | | | | | | | | | |
| | |
| | | Six months
ended
June 30, | | | Year ended December 31, | |
| | | | | | |
| Initial Class | | 2020* | | | 2019 | | | 2018 | | | 2017 | | | 2016 | | | 2015 | |
| | | | | | |
Net asset value at beginning of period | | $ | 9.96 | | | $ | 9.32 | | | $ | 10.05 | | | $ | 9.99 | | | $ | 9.10 | | | $ | 9.84 | |
| | | | | | | | | | | | | | | | | | | | | | | | |
| | | | | | |
Net investment income (loss) (a) | | | 0.26 | | | | 0.58 | | | | 0.55 | | | | 0.58 | | | | 0.62 | | | | 0.59 | |
| | | | | | |
Net realized and unrealized gain (loss) on investments | | | (0.67 | ) | | | 0.64 | | | | (0.68 | ) | | | 0.10 | | | | 0.85 | | | | (0.73 | ) |
| | | | | | | | | | | | | | | | | | | | | | | | |
| | | | | | |
Total from investment operations | | | (0.41 | ) | | | 1.22 | | | | (0.13 | ) | | | 0.68 | | | | 1.47 | | | | (0.14 | ) |
| | | | | | | | | | | | | | | | | | | | | | | | |
| | | | | | |
| Less distributions: | | | | | | | | | | | | | | | | | | | | | | | | |
| | | | | | |
From net investment income | | | — | | | | (0.58 | ) | | | (0.60 | ) | | | (0.62 | ) | | | (0.58 | ) | | | (0.60 | ) |
| | | | | | | | | | | | | | | | | | | | | | | | |
| | | | | | |
Net asset value at end of period | | $ | 9.55 | | | $ | 9.96 | | | $ | 9.32 | | | $ | 10.05 | | | $ | 9.99 | | | $ | 9.10 | |
| | | | | | | | | | | | | | | | | | | | | | | | |
| | | | | | |
Total investment return (b) | | | (4.12 | %)(c) | | | 13.22 | % | | | (1.46 | %) | | | 6.86 | % | | | 16.23 | % | | | (1.57 | %) |
| | | | | | |
| Ratios (to average net assets)/Supplemental Data: | | | | | | | | | | | | | | | | | | | | | | | | |
| | | | | | |
Net investment income (loss) | | | 5.43 | % †† | | | 5.84 | % | | | 5.58 | % | | | 5.69 | % | | | 6.41 | % | | | 5.99 | % |
| | | | | | |
Net expenses (d) | | | 0.59 | % †† | | | 0.59 | % | | | 0.58 | % | | | 0.58 | % | | | 0.59 | % | | | 0.58 | % |
| | | | | | |
Portfolio turnover rate | | | 22 | % | | | 28 | % | | | 28 | % | | | 40 | % | | | 39 | % | | | 37 | % |
| | | | | | |
Net assets at end of period (in 000’s) | | $ | 432,344 | | | $ | 471,775 | | | $ | 458,129 | | | $ | 574,162 | | | $ | 665,881 | | | $ | 642,186 | |
| (a) | Per share data based on average shares outstanding during the period. |
| (b) | Total return does not reflect any deduction of sales charges, mortality and expense charges, contract charges or administrative charges. For periods of less than one year, total return is not annualized. |
| (c) | Total investment return may reflect adjustments to conform to generally accepted accounting principles. |
| (d) | In addition to the fees and expenses which the Portfolio bears directly, it also indirectly bears a pro-rata share of the fees and expenses of the underlying funds in which it invests. Such indirect expenses are not included in the above expense ratios. |
| | | | |
| 26 | | MainStay VP MacKay High Yield Corporate Bond Portfolio | | The notes to the financial statements are an integral part of,
and should be read in conjunction with, the financial statements. |
Financial Highlights selected per share data and ratios
| | | | | | | | | | | | | | | | | | | | | | | | |
| | |
| | | Six months
ended
June 30, | | | Year ended December 31, | |
| | | | | | |
| Service Class | | 2020* | | | 2019 | | | 2018 | | | 2017 | | | 2016 | | | 2015 | |
| | | | | | |
Net asset value at beginning of period | | $ | 9.81 | | | $ | 9.19 | | | $ | 9.91 | | | $ | 9.86 | | | $ | 8.99 | | | $ | 9.73 | |
| | | | | | | | | | | | | | | | | | | | | | | | |
| | | | | | |
Net investment income (loss) (a) | | | 0.24 | | | | 0.55 | | | | 0.52 | | | | 0.55 | | | | 0.59 | | | | 0.56 | |
| | | | | | |
Net realized and unrealized gain (loss) on investments | | | (0.66 | ) | | | 0.62 | | | | (0.66 | ) | | | 0.10 | | | | 0.83 | | | | (0.72 | ) |
| | | | | | | | | | | | | | | | | | | | | | | | |
| | | | | | |
Total from investment operations | | | (0.42 | ) | | | 1.17 | | | | (0.14 | ) | | | 0.65 | | | | 1.42 | | | | (0.16 | ) |
| | | | | | | | | | | | | | | | | | | | | | | | |
| | | | | | |
| Less distributions: | | | | | | | | | | | | | | | | | | | | | | | | |
| | | | | | |
From net investment income | | | — | | | | (0.55 | ) | | | (0.58 | ) | | | (0.60 | ) | | | (0.55 | ) | | | (0.58 | ) |
| | | | | | | | | | | | | | | | | | | | | | | | |
| | | | | | |
Net asset value at end of period | | $ | 9.39 | | | $ | 9.81 | | | $ | 9.19 | | | $ | 9.91 | | | $ | 9.86 | | | $ | 8.99 | |
| | | | | | | | | | | | | | | | | | | | | | | | |
| | | | | | |
Total investment return (b) | | | (4.28 | %)(c) | | | 12.94 | % | | | (1.71 | %) | | | 6.59 | % | | | 15.94 | % | | | (1.82 | %) |
| | | | | | |
| Ratios (to average net assets)/Supplemental Data: | | | | | | | | | | | | | | | | | | | | | | | | |
| | | | | | |
Net investment income (loss) | | | 5.18 | % †† | | | 5.60 | % | | | 5.33 | % | | | 5.43 | % | | | 6.15 | % | | | 5.74 | % |
| | | | | | |
Net expenses (d) | | | 0.84 | % †† | | | 0.84 | % | | | 0.83 | % | | | 0.83 | % | | | 0.84 | % | | | 0.83 | % |
| | | | | | |
Portfolio turnover rate | | | 22 | % | | | 28 | % | | | 28 | % | | | 40 | % | | | 39 | % | | | 37 | % |
| | | | | | |
Net assets at end of period (in 000’s) | | $ | 2,409,125 | | | $ | 2,557,069 | | | $ | 2,298,144 | | | $ | 2,528,783 | | | $ | 2,315,441 | | | $ | 2,035,855 | |
| (a) | Per share data based on average shares outstanding during the period. |
| (b) | Total return does not reflect any deduction of sales charges, mortality and expense charges, contract charges or administrative charges. For periods of less than one year, total return is not annualized. |
| (c) | Total investment return may reflect adjustments to conform to generally accepted accounting principles. |
| (d) | In addition to the fees and expenses which the Portfolio bears directly, it also indirectly bears a pro-rata share of the fees and expenses of the underlying funds in which it invests. Such indirect expenses are not included in the above expense ratios. |
| | | | | | |
The notes to the financial statements are an integral part of,
and should be read in conjunction with, the financial statements. | | | | | 27 | |
Notes to Financial Statements (Unaudited)
Note 1–Organization and Business
MainStay VP Funds Trust (the “Fund”) was organized as a Delaware statutory trust on February 1, 2011. The Fund is registered under the Investment Company Act of 1940, as amended (the “1940 Act”), as an open-end management investment company. The Fund is comprised of thirty-one separate series (collectively referred to as the “Portfolios”). These financial statements and notes relate to the MainStay VP MacKay High Yield Corporate Bond Portfolio (the “Portfolio”), a “diversified” portfolio, as that term is defined in the 1940 Act, as interpreted or modified by regulatory authorities having jurisdiction, from time to time.
Shares of the Portfolio are currently offered to certain separate accounts to fund variable annuity policies and variable universal life insurance policies issued by New York Life Insurance and Annuity Corporation (“NYLIAC”), a wholly-owned subsidiary of New York Life Insurance Company (“New York Life”) and may also be offered to fund variable annuity policies and variable universal life insurance policies issued by other insurance companies. NYLIAC allocates shares of the Portfolios to, among others, certain NYLIAC separate accounts. Shares of the Portfolio are also offered to the MainStay VP Conservative Allocation Portfolio, MainStay VP Moderate Allocation Portfolio, MainStay VP Moderate Growth Allocation Portfolio and MainStay VP Growth Allocation Portfolio, which operate as “funds-of-funds,” and other variable insurance funds.
The Portfolio currently offers two classes of shares. Initial Class shares commenced operations on May 1, 1995. Service Class shares commenced operations on June 4, 2003. Shares of the Portfolio are offered and are redeemed at a price equal to their respective net asset value (“NAV”) per share. No sales or redemption charge is applicable to the purchase or redemption of the Portfolio’s shares. Under the terms of the Fund’s multiple class plan, adopted pursuant to Rule 18f-3 under the 1940 Act, the classes differ in that, among other things, Service Class shares of the Portfolio pay a combined distribution and service fee of 0.25% of average daily net assets attributable to Service Class shares of the Portfolio to the Distributor (as defined in Note 3(B)) pursuant to a plan adopted in accordance with Rule 12b-1 under the 1940 Act. Contract owners of variable annuity contracts purchased after June 2, 2003, are permitted to invest only in the Service Class shares.
The Portfolio’s investment objective is to seek maximum current income through investment in a diversified portfolio of high-yield debt securities. Capital appreciation is a secondary objective.
Note 2–Significant Accounting Policies
The Portfolio is an investment company and accordingly follows the investment company accounting and reporting guidance of the Financial Accounting Standards Board (“FASB”) Accounting Standard Codification Topic 946 Financial Services—Investment Companies. The Portfolio prepares its financial statements in accordance with generally accepted accounting principles (“GAAP”) in the United States of America and follows the significant accounting policies described below.
(A) Securities Valuation. Investments are usually valued as of the close of regular trading on the New York Stock Exchange (the “Exchange”) (usually 4:00 p.m. Eastern time) on each day the Portfolio is open for business (“valuation date”).
The Board of Trustees of the Fund (the “Board”) adopted procedures establishing methodologies for the valuation of the Portfolio’s securities and other assets and delegated the responsibility for valuation determinations under those procedures to the Valuation Committee of the Fund (the “Valuation Committee”). The procedures state that, subject to the oversight of the Board and unless otherwise noted, the responsibility for the day-to-day valuation of portfolio assets (including fair value measurements for the Portfolio’s assets and liabilities) rests with New York Life Investment Management LLC (“New York Life Investments” or the “Manager”), aided to whatever extent necessary by the Subadvisor (as defined in Note 3(A)). To assess the appropriateness of security valuations, the Manager, the Subadvisor or the Portfolio’s third-party service provider, who is subject to oversight by the Manager, regularly compares prior day prices, prices on comparable securities and the sale prices to the prior and current day prices and challenges prices with changes exceeding certain tolerance levels with third-party pricing services or broker sources.
The Board authorized the Valuation Committee to appoint a Valuation Subcommittee (the “Subcommittee”) to establish the prices of securities for which market quotations are not readily available or the prices of which are not otherwise readily determinable under the procedures. The Subcommittee meets (in person, via electronic mail or via teleconference) on an as-needed basis. The Valuation Committee meets to ensure that actions taken by the Subcommittee were appropriate.
For those securities valued through either a standardized fair valuation methodology or a fair valuation measurement, the Subcommittee deals with such valuation and the Valuation Committee reviews and affirms, if appropriate, the reasonableness of the valuation based on such methodologies and measurements on a regular basis after considering information that is reasonably available and deemed relevant by the Valuation Committee. Any action taken by the Subcommittee with respect to the valuation of a portfolio security or other asset is submitted for review and ratification (if appropriate) to the Valuation Committee and the Board at the next regularly scheduled meeting.
“Fair value” is defined as the price the Portfolio would reasonably expect to receive upon selling an asset or liability in an orderly transaction to an independent buyer in the principal or most advantageous market for the asset or liability. Fair value measurements are determined within a framework that establishes a three-tier hierarchy that maximizes the use of observable market data and minimizes the use of unobservable inputs to establish a classification of fair value measurements for disclosure purposes. “Inputs” refer broadly to the assumptions that market participants would use in pricing the asset or liability, including assumptions about risk, such as the risk inherent in a particular valuation technique used to measure fair value using a pricing model and/or the risk inherent in the inputs for the valuation technique. Inputs may be observable or unobservable. Observable inputs reflect the assumptions market participants would use in pricing the asset or liability based on market data obtained from sources independent of the Portfolio. Unobservable inputs reflect the Portfolio’s own assumptions about the assumptions market participants would use in pricing the asset or liability based on the information available. The inputs or methodology used for valuing assets or liabilities may not be an indication of the risks
| | |
| 28 | | MainStay VP MacKay High Yield Corporate Bond Portfolio |
associated with investing in those assets or liabilities. The three-tier hierarchy of inputs is summarized below.
| • | | Level 1—quoted prices in active markets for an identical asset or liability |
| • | | Level 2—other significant observable inputs (including quoted prices for a similar asset or liability in active markets, interest rates and yield curves, prepayment speeds, credit risk, etc.) |
| • | | Level 3—significant unobservable inputs (including the Portfolio’s own assumptions about the assumptions that market participants would use in measuring fair value of an asset or liability) |
The level of an asset or liability within the fair value hierarchy is based on the lowest level of an input, both individually and in the aggregate, that is significant to the fair value measurement. The aggregate value by input level of the Portfolio’s assets and liabilities as of June 30, 2020 is included at the end of the Portfolio of Investments.
The Portfolio may use third-party vendor evaluations, whose prices may be derived from one or more of the following standard inputs, among others:
| | |
• Benchmark yields | | • Reported trades |
• Broker/dealer quotes | | • Issuer spreads |
• Two-sided markets | | • Benchmark securities |
• Bids/offers | | • Reference data (corporate actions or material event notices) |
• Industry and economic events | | • Comparable bonds |
• Monthly payment information | | |
An asset or liability for which market values cannot be measured using the methodologies described above is valued by methods deemed reasonable in good faith by the Valuation Committee, following the procedures established by the Board, to represent fair value. Under these procedures, the Portfolio generally uses a market-based approach which may use related or comparable assets or liabilities, recent transactions, market multiples, book values and other relevant information. The Portfolio may also use an income-based valuation approach in which the anticipated future cash flows of the asset or liability are discounted to calculate fair value. Discounts may also be applied due to the nature and/or duration of any restrictions on the disposition of the asset or liability. Fair value represents a good faith approximation of the value of a security. Fair value determinations involve the consideration of a number of subjective factors, an analysis of applicable facts and circumstances and the exercise of judgment. As a result, it is possible that the fair value for a security determined in good faith in accordance with the Portfolio’s valuation procedures may differ from valuations for the same security determined by other funds using their own valuation procedures. Although the Portfolio’s valuation procedures are designed to value a security at the price the Portfolio may reasonably expect to receive upon the security’s sale in an orderly transaction, there can be no assurance that any fair value determination thereunder would, in fact, approximate the amount that the Portfolio would actually realize upon the sale of the security or the price at which the security would trade if a reliable market price were readily available. During the six-month period ended June 30, 2020, there were no material changes to the fair value methodologies.
Securities which may be valued in this manner include, but are not limited to: (i) a security for which trading has been halted or suspended; (ii) a debt security that has recently gone into default and for which there is not a current market quotation; (iii) a security of an issuer that has entered into a restructuring; (iv) a security that has been delisted from a national exchange; (v) a security for which the market price is not readily available from a third-party pricing source or, if so provided, does not, in the opinion of the Manager or the Subadvisor, reflect the security’s market value; (vi) a security subject to trading collars for which no or limited trading takes place; and (vii) a security whose principal market has been temporarily closed at a time when, under normal conditions, it would be open. Securities valued in this manner are generally categorized as Level 3 in the hierarchy. As of June 30, 2020, securities that were fair valued in such a manner are shown in the Portfolio of Investments.
Equity securities are valued at the last quoted sales prices as of the close of regular trading on the relevant exchange on each valuation date. Securities that are not traded on the valuation date are valued at the mean of the last quoted bid and ask prices. Prices are normally taken from the principal market in which each security trades. These securities are generally categorized as Level 1 in the hierarchy.
Investments in mutual funds, including money market funds, are valued at their respective NAVs as of the close of the Exchange on the valuation date. These securities are generally categorized as Level 1 in the hierarchy.
Debt securities (other than convertible and municipal bonds) are valued at the evaluated bid prices (evaluated mean prices in the case of convertible and municipal bonds) supplied by a pricing agent or broker selected by the Manager, in consultation with the Subadvisor. The evaluations are market-based measurements processed through a pricing application and represents the pricing agent’s good faith determination as to what a holder may receive in an orderly transaction under market conditions. The rules based logic utilizes valuation techniques that reflect participants’ assumptions and vary by asset class and per methodology, maximizing the use of relevant observable data including quoted prices for similar assets, benchmark yield curves and market corroborated inputs. The evaluated bid or mean prices are deemed by the Manager, in consultation with the Subadvisor, to be representative of market values at the regular close of trading of the Exchange on each valuation date. Debt securities purchased on a delayed delivery basis are marked to market daily until settlement at the forward settlement date. Debt securities, including corporate bonds, U.S. government and federal agency bonds, municipal bonds, foreign bonds, convertible bonds, asset-backed securities and mortgage-backed securities are generally categorized as Level 2 in the hierarchy.
Loan assignments, participations and commitments are valued at the average of bid quotations obtained from the engaged independent pricing service and are generally categorized as Level 2 in the hierarchy. Certain loan assignments, participations and commitments may be valued by utilizing significant unobservable inputs obtained from the pricing service and are generally categorized as Level 3 in the hierarchy. As of June 30, 2020, no securities held by the Fund were fair valued in such a manner.
Temporary cash investments acquired in excess of 60 days to maturity at the time of purchase are valued using the latest bid prices or using
Notes to Financial Statements (Unaudited) (continued)
valuations based on a matrix system (which considers such factors as security prices, yields, maturities and ratings), both as furnished by independent pricing services. Temporary cash investments that mature in 60 days or less at the time of purchase (“Short-Term Investments”) are valued using the amortized cost method of valuation, unless the use of such method would be inappropriate. The amortized cost method involves valuing a security at its cost on the date of purchase and thereafter assuming a constant amortization to maturity of the difference between such cost and the value on maturity date. Amortized cost approximates the current fair value of a security. Securities valued using the amortized cost method are not valued using quoted prices in an active market and are generally categorized as Level 2 in the hierarchy.
The information above is not intended to reflect an exhaustive list of the methodologies that may be used to value portfolio investments. The valuation procedures permit the use of a variety of valuation methodologies in connection with valuing portfolio investments. The methodology used for a specific type of investment may vary based on the market data available or other considerations. The methodologies summarized above may not represent the specific means by which portfolio investments are valued on any particular business day.
A portfolio investment may be classified as an illiquid investment under the Portfolio’s written liquidity risk management program and related procedures (“Liquidity Program”). Illiquidity of an investment might prevent the sale of such investment at a time when the Manager or the Subadvisor might wish to sell, and these investments could have the effect of decreasing the overall level of the Portfolio’s liquidity. Further, the lack of an established secondary market may make it more difficult to value illiquid investments, requiring the Portfolio to rely on judgments that may be somewhat subjective in measuring value, which could vary materially from the amount that the Portfolio could realize upon disposition. Difficulty in selling illiquid investments may result in a loss or may be costly to the Portfolio. An illiquid investment is any investment that the Manager or Subadvisor reasonably expects cannot be sold or disposed of in current market conditions in seven calendar days or less without the sale or disposition significantly changing the market value of the investment. The liquidity classification of each investment will be made using information obtained after reasonable inquiry and taking into account, among other things, relevant market, trading and investment-specific considerations in accordance with the Liquidity Program. Illiquid investments are often valued in accordance with methods deemed by the Board in good faith to be reasonable and appropriate to accurately reflect their fair value. The liquidity of the Portfolio’s investments, as shown in the Portfolio of Investments, was determined as of June 30, 2020, and can change at any time. Illiquid investments as of June 30, 2020, are shown in the Portfolio of Investments.
(B) Income Taxes. The Portfolio’s policy is to comply with the requirements of the Internal Revenue Code of 1986, as amended (the “Internal Revenue Code”), applicable to regulated investment companies and to distribute all of its taxable income to the shareholders of the Portfolio within the allowable time limits.
The Manager evaluates the Portfolio’s tax positions to determine if the tax positions taken meet the minimum recognition threshold in connection with accounting for uncertainties in income tax positions taken or expected to be taken for the purposes of measuring and recognizing
tax liabilities in the financial statements. Recognition of tax benefits of an uncertain tax position is permitted only to the extent the position is “more likely than not” to be sustained assuming examination by taxing authorities. The Manager analyzed the Portfolio’s tax positions taken on federal, state and local income tax returns for all open tax years (for up to three tax years) and has concluded that no provisions for federal, state and local income tax are required in the Portfolio’s financial statements. The Portfolio’s federal, state and local income tax and federal excise tax returns for tax years for which the applicable statutes of limitations have not expired are subject to examination by the Internal Revenue Service and state and local departments of revenue.
(C) Dividends and Distributions to Shareholders. Dividends and distributions are recorded on the ex-dividend date. The Portfolio intends to declare and pay dividends from net investment income and distributions from net realized capital and currency gains, if any, at least annually. Unless a shareholder elects otherwise, all dividends and distributions are reinvested at NAV in the same class of shares of the Portfolio. Dividends and distributions to shareholders are determined in accordance with federal income tax regulations and may differ from determinations using GAAP.
(D) Security Transactions and Investment Income. The Portfolio records security transactions on the trade date. Realized gains and losses on security transactions are determined using the identified cost method. Dividend income is recognized on the ex-dividend date, net of any foreign tax withheld at the source, and interest income is accrued as earned using the effective interest rate method. Discounts and premiums on securities purchased for the Portfolio are accreted and amortized, respectively, on the effective interest rate method. Income from payment-in-kind securities is accreted daily based on the effective interest method.
Investment income and realized and unrealized gains and losses on investments of the Portfolio are allocated pro rata to the separate classes of shares based upon their relative net assets on the date the income is earned or realized and unrealized gains and losses are incurred.
The Portfolio may place a debt security on non-accrual status and reduce related interest income by ceasing current accruals and writing off all or a portion of any interest receivables when the collection of all or a portion of such interest has become doubtful. A debt security is removed from non-accrual status when the issuer resumes interest payments or when collectability of interest is reasonably assured.
(E) Expenses. Expenses of the Fund are allocated to the individual Portfolios in proportion to the net assets of the respective Portfolios when the expenses are incurred, except where direct allocations of expenses can be made. Expenses (other than fees incurred under the distribution and service plans, further discussed in Note 3(B), which are charged directly to the Service Class shares) are allocated to separate classes of shares pro rata based upon their relative net assets on the date the expenses are incurred. The expenses borne by the Portfolio, including those of related parties to the Portfolio, are shown in the Statement of Operations.
Additionally, the Portfolio may invest in mutual funds, which are subject to management fees and other fees that may cause the costs of investing in mutual funds to be greater than the costs of owning the
| | |
| 30 | | MainStay VP MacKay High Yield Corporate Bond Portfolio |
underlying securities directly. These indirect expenses of mutual funds are not included in the amounts shown as expenses in the Portfolio’s Statement of Operations or in the expense ratios included in the Financial Highlights.
(F) Use of Estimates. In preparing financial statements in conformity with GAAP, the Manager makes estimates and assumptions that affect the reported amounts and disclosures in the financial statements. Actual results could differ from those estimates.
(G) Loan Assignments, Participations and Commitments. The Portfolio may invest in loan assignments and participations (“loans”). Commitments are agreements to make money available to a borrower in a specified amount, at a specified rate and within a specified time. The Portfolio records an investment when the borrower withdraws money on a commitment or when a funded loan is purchased (trade date) and records interest as earned. These loans pay interest at rates that are periodically reset by reference to a base lending rate plus a spread. These base lending rates are generally the prime rate offered by a designated U.S. bank or the London Interbank Offered Rate (“LIBOR”).
The loans in which the Portfolio may invest are generally readily marketable, but may be subject to some restrictions on resale. For example, the Portfolio may be contractually obligated to receive approval from the agent bank and/or borrower prior to the sale of these investments. If the Portfolio purchases an assignment from a lender, the Portfolio will generally have direct contractual rights against the borrower in favor of the lender. If the Portfolio purchases a participation interest either from a lender or a participant, the Portfolio typically will have established a direct contractual relationship with the seller of the participation interest, but not with the borrower. Consequently, the Portfolio is subject to the credit risk of the lender or participant who sold the participation interest to the Portfolio, in addition to the usual credit risk of the borrower. In the event that the borrower, selling participant or intermediate participants become insolvent or enter into bankruptcy, the Portfolio may incur certain costs and delays in realizing payment, or may suffer a loss of principal and/or interest.
Unfunded commitments represent the remaining obligation of the Portfolio to the borrower. At any point in time, up to the maturity date of the issue, the borrower may demand the unfunded portion. Unfunded amounts, if any, are marked to market and any unrealized gains or losses are recorded in the Statement of Assets and Liabilities. As of June 30, 2020, the Portfolio did not hold any unfunded commitments.
(H) Securities Lending. In order to realize additional income, the Portfolio may engage in securities lending, subject to the limitations set forth in the 1940 Act and relevant guidance by the staff of the Securities and Exchange Commission (“SEC”). If the Portfolio engages in securities lending, the Portfolio will lend through its custodian, currently State Street Bank and Trust Company (“State Street”), acting as securities lending agent on behalf of the Portfolio. Under the current arrangement, State Street will manage the Portfolio’s collateral in accordance with the securities lending agency agreement between the Portfolio and State Street, and indemnify the Portfolio against counterparty risk. The loans will be collateralized by cash (which may be invested in a money market fund) and/or non-cash collateral (which may include U.S. Treasury securities and/or U.S. government agency securities issued or
guaranteed by the United States government or its agencies or instrumentalities) at least equal at all times to the market value of the securities loaned. The Portfolio bears the risk of delay in recovery of, or loss of rights in, the securities loaned. The Portfolio may also record a realized gain or loss on securities deemed sold due to a borrower’s inability to return securities on loan. The Portfolio bears the risk of any loss on investment of cash collateral. The Portfolio will receive compensation for lending its securities in the form of fees or it will retain a portion of interest earned on the investment of any cash collateral. The Portfolio will also continue to receive interest and dividends on the securities loaned and any gain or loss in the market price of the securities loaned that may occur during the term of the loan will be for the account of the Portfolio. Income earned from securities lending activities, if any, is reflected in the Statement of Operations. As of June 30, 2020, the Portfolio had securities on loan with an aggregate market value of $17,972,344; the total market value of collateral held by the Portfolio was $18,325,488. The market value of the collateral held included non-cash collateral, in the form of U.S. Treasury securities, with a value of $14,306,088 and cash collateral, which was invested into the State Street Navigator Securities Lending Government Money Market Portfolio, with a value of $4,019,400.
(I) Debt Securities Risk. The ability of issuers of debt securities held by the Portfolio to meet their obligations may be affected by, among other things, economic or political developments in a specific country, industry or region. Debt securities are also subject to the risks associated with changes in interest rates. The Portfolio primarily invests in high-yield debt securities (commonly referred to as “junk bonds”), which are considered speculative because they present a greater risk of loss, including default, than higher rated debt securities. These securities pay investors a premium—a higher interest rate or yield than investment grade debt securities—because of the increased risk of loss. These securities can also be subject to greater price volatility. In times of unusual or adverse market, economic or political conditions, these securities may experience higher than normal default rates.
The loans in which the Portfolio invests are usually rated below investment grade, or if unrated, determined by the Subadvisor to be of comparable quality (commonly referred to as “junk bonds”) and are generally considered speculative because they present a greater risk of loss, including default, than higher quality debt securities. Moreover, such securities may, under certain circumstances, be particularly susceptible to liquidity and valuation risks. Although certain loans are collateralized, there is no guarantee that the value of the collateral will be sufficient or available to satisfy the borrower’s obligation. In times of unusual or adverse market, economic or political conditions, loans may experience higher than normal default rates. In the event of a recession or serious credit event, among other eventualities, the value of the Portfolio’s investments in loans are more likely to decline. The secondary market for loans is limited and, thus, the Portfolio’s ability to sell or realize the full value of its investment in these loans to reinvest sale proceeds or to meet redemption obligations may be impaired. In addition, loans generally are subject to extended settlement periods that may be longer than seven days. As a result, the Portfolio may be adversely affected by selling other investments at an unfavorable time and/or under unfavorable conditions or engaging in borrowing transactions, such as borrowing against its credit facility, to raise cash to meet redemption obligations or pursue other investment opportunities.
Notes to Financial Statements (Unaudited) (continued)
In certain circumstances, loans may not be deemed to be securities. As a result, the Portfolio may not have the protection of the anti-fraud provisions of the federal securities laws. In such cases, the Portfolio generally must rely on the contractual provisions in the loan agreement and common-law fraud protections under applicable state law.
(J) LIBOR Replacement Risk. The Portfolio may invest in certain debt securities, derivatives or other financial instruments that utilize the LIBOR as a “benchmark” or “reference rate” for various interest rate calculations. The United Kingdom Financial Conduct Authority, which regulates LIBOR, announced that after 2021 it will cease its active encouragement of banks to provide the quotations needed to sustain LIBOR. As a result, it is anticipated that LIBOR will be discontinued or will no longer be sufficiently robust to be representative of its underlying market around that time. Although financial regulators and industry working groups have suggested alternative reference rates, such as the European Interbank Offer Rate (“EURIBOR”), Sterling Overnight Interbank Average Rate (“SONIA”) and Secured Overnight Financing Rate (“SOFR”), there are challenges to converting certain contracts and transactions to a new benchmark and neither the full effects of the transition process nor its ultimate outcome is known.
The elimination of LIBOR or changes to other reference rates or any other changes or reforms to the determination or supervision of reference rates could have an adverse impact on the market for, or value of, any securities or payments linked to those reference rates, which may adversely affect the Portfolio’s performance and/or net asset value. Uncertainty and risk also remain regarding the willingness and ability of issuers and lenders to include revised provisions in new and existing contracts or instruments. Consequently, the transition away from LIBOR to other reference rates may lead to increased volatility and illiquidity in markets that are tied to LIBOR, fluctuations in values of LIBOR-related investments or investments in issuers that utilize LIBOR, increased difficulty in borrowing or refinancing and diminished effectiveness of hedging strategies, adversely affecting the Portfolio’s performance. Furthermore, the risks associated with the expected discontinuation of LIBOR and transition may be exacerbated if the work necessary to effect an orderly transition to an alternative reference rate is not completed in a timely manner. Because the usefulness of LIBOR as a benchmark could deteriorate during the transition period, these effects could occur prior to the end of 2021.
(K) Indemnifications. Under the Fund’s organizational documents, its officers and trustees are indemnified against certain liabilities that may arise out of performance of their duties to the Fund. Additionally, in the normal course of business, the Portfolio enters into contracts with third-party service providers that contain a variety of representations and warranties and that may provide general indemnifications. The Portfolio’s maximum exposure under these arrangements is unknown, as this would involve future claims that may be made against the Portfolio that have not yet occurred. The Manager believes that the risk of loss in connection with these potential indemnification obligations is remote. However, there can be no assurance that material liabilities related to such obligations will not arise in the future, which could adversely impact the Portfolio.
Note 3–Fees and Related Party Transactions
(A) Manager and Subadvisor. New York Life Investments, a registered investment adviser and an indirect, wholly-owned subsidiary of New York Life, serves as the Portfolio’s Manager pursuant to an Amended and Restated Management Agreement (“Management Agreement”). The Manager provides offices, conducts clerical, recordkeeping and bookkeeping services, and keeps most of the financial and accounting records required to be maintained by the Portfolio. Except for the portion of salaries and expenses that are the responsibility of the Portfolio, the Manager pays the salaries and expenses of all personnel affiliated with the Portfolio and certain operational expenses of the Portfolio. The Portfolio reimburses New York Life Investments in an amount equal to the portion of the compensation of the Chief Compliance Officer attributable to the Portfolio. MacKay Shields LLC (“MacKay Shields” or “Subadvisor”), a registered investment adviser and an indirect, wholly-owned subsidiary of New York Life, serves as Subadvisor to the Portfolio and is responsible for the day-to-day portfolio management of the Portfolio. Pursuant to the terms of an Amended and Restated Subadvisory Agreement (“Subadvisory Agreement”) between New York Life Investments and MacKay Shields, New York Life Investments pays for the services of the Subadvisor.
The Fund, on behalf of the Portfolio, pays New York Life Investments in its capacity as the Portfolio’s investment manager and administrator, pursuant to the Management Agreement, a monthly fee for the services performed and the facilities furnished at an annual rate of the average daily net assets as follows: 0.57% up to $1 billion; 0.55% from $1 billion up to $5 billion; and 0.525% in excess of $5 billion. During the six-month period ended June 30, 2020, the effective management fee rate was 0.56%.
During the six-month period ended June 30, 2020, New York Life Investments earned fees from the Portfolio in the amount of $7,895,651 and paid the Subadvisor in the amount of $3,947,826.
State Street provides sub-administration and sub-accounting services to the Portfolio pursuant to an agreement with New York Life Investments. These services include calculating the daily NAVs of the Portfolio, maintaining the general ledger and sub-ledger accounts for the calculation of the Portfolio’s NAVs and assisting New York Life Investments in conducting various aspects of the Portfolio’s administrative operations. For providing these services to the Portfolio, State Street is compensated by New York Life Investments.
Pursuant to an agreement between the Fund and New York Life Investments, New York Life Investments is responsible for providing or procuring certain regulatory reporting services for the Portfolio. The Portfolio will reimburse New York Life Investments for the actual costs incurred by New York Life Investments in connection with providing or procuring these services for the Portfolio.
(B) Distribution and Service Fees. The Fund, on behalf of the Portfolio, has entered into a distribution agreement with NYLIFE Distributors LLC (the “Distributor”), an indirect, wholly-owned subsidiary of New York Life. The Portfolio has adopted a distribution plan (the “Plan”) in accordance with the provisions of Rule 12b-1 under the 1940 Act. Under the Plan, the Distributor has agreed to provide, through its
| | |
| 32 | | MainStay VP MacKay High Yield Corporate Bond Portfolio |
affiliates or independent third parties, various distribution-related, shareholder and administrative support services to the Service Class shareholders. For its services, the Distributor is entitled to a combined distribution and service fee accrued daily and paid monthly at an annual rate of 0.25% of the average daily net assets attributable to the Service Class shares of the Portfolio.
Note 4–Federal Income Tax
As of June 30, 2020, the cost and unrealized appreciation (depreciation) of the Portfolio’s investment portfolio, including applicable derivative contracts and other financial instruments, as determined on a federal income tax basis, was as follows:
| | | | | | | | | | | | | | | | |
| | | Federal Tax
Cost | | | Gross
Unrealized
Appreciation | | | Gross
Unrealized
(Depreciation) | | | Net
Unrealized
Appreciation/
(Depreciation) | |
| | | | |
Investments in Securities | | $ | 2,968,592,713 | | | $ | 86,382,679 | | | $ | (232,394,942 | ) | | $ | (146,012,263 | ) |
As of December 31, 2019, for federal income tax purposes, capital loss carryforwards of $71,559,531, as shown in the table below, were available to the extent provided by the regulations to offset future realized gains of the Portfolio through the years indicated. Accordingly, no capital gains distributions are expected to be paid to shareholders until net gains have been realized in excess of such amounts.
| | | | |
Capital Loss
Available Through | | Short-Term
Capital Loss
Amounts (000’s) | | Long-Term
Capital Loss
Amounts (000’s) |
| | |
| Unlimited | | $8,268 | | $63,292 |
During the year ended December 31, 2019, the tax character of distributions paid as reflected in the Statements of Changes in Net Assets was as follows:
| | |
|
| 2019 |
Tax-Based
Distributions from Ordinary
Income | | Tax-Based
Distributions from Long-Term
Gains |
| |
| $161,400,281 | | $— |
Note 5–Restricted Securities
Restricted securities are subject to legal or contractual restrictions on resale. Private placement securities are generally considered to be restricted except for those securities traded between qualified institutional investors under the provisions of Rule 144A of the Securities Act of 1933, as amended. Disposal of restricted securities may involve time consuming negotiations and expenses, and prompt sale at an acceptable price may be difficult to achieve.
As of June 30, 2020, the Portfolio held the following restricted securities.
| | | | | | | | | | | | | | | | | | | | |
Security | | Date(s) of
Acquisition | | | Principal
Amount/
Shares | | | Cost | | | 6/30/20
Value | | | Percent of
Net Assets | |
| | | | | |
Exide Technologies
Common Stock | | | 4/30/15–12/02/19 | | | | 7,037,072 | | | $ | 28,301,527 | | | $ | — | | | | 0.0 | %‡ |
GenOn Energy, Inc.
Common Stock | | | 12/14/18 | | | | 115,826 | | | | 12,970,154 | | | | 21,427,810 | | | | 0.7 | |
ION Media Networks, Inc.
Common Stock | | | 3/12/10–12/20/10 | | | | 725 | | | | — | | | | 273,470 | | | | 0.0 | ‡ |
Rex Energy Corp. (Escrow Claim)
Corporate Bond
8.00%, due 10/1/20 | | | 10/3/18 | | | $ | 40,580,000 | | | | — | | | | 304,350 | | | | 0.0 | ‡ |
Sterling Entertainment Enterprises LLC
Corporate Bond
10.25%, due 1/15/25 | | | 12/28/17 | | | $ | 7,000,000 | | | | 6,924,071 | | | | 6,939,800 | | | | 0.2 | |
Total | | | | | | $ | 48,195,752 | | | $ | 28,945,430 | | | | 0.9 | % |
| ‡ | Less than one-tenth of a percent. |
Note 6–Custodian
State Street is the custodian of cash and securities held by the Portfolio. Custodial fees are charged to the Portfolio based on the Portfolio’s net assets and/or the market value of securities held by the Portfolio and the number of certain transactions incurred by the Portfolio.
Note 7–Line of Credit
The Portfolio and certain other funds managed by New York Life Investments maintain a line of credit with a syndicate of banks in order to secure a source of funds for temporary purposes to meet unanticipated or excessive redemption requests.
Notes to Financial Statements (Unaudited) (continued)
Effective July 28, 2020, under the credit agreement (the “Credit Agreement”), the aggregate commitment amount is $600,000,000 with an additional uncommitted amount of $100,000,000. The commitment fee is an annual rate of 0.15% of the average commitment amount payable quarterly, regardless of usage, to JP Morgan Chase Bank NA, who serves as the agent to the syndicate. The commitment fee is allocated among the Portfolio and certain other funds managed by New York Life Investments based upon their respective net assets and other factors. Interest on any revolving credit loan is charged based upon the Federal Funds Rate or the one-month LIBOR, whichever is higher. The Credit Agreement expires on July 27, 2021, although the Portfolio, certain other funds managed by New York Life Investments and the syndicate of banks may renew the Credit Agreement for an additional year on the same or different terms or enter into a credit agreement with a different syndicate of banks. Prior to July 28, 2020, the aggregate commitment amount and the commitment fee were the same as those under the current Credit Agreement, but State Street Served as agent to the syndicate. As of June 30, 2020, there were no borrowings outstanding with respect to the Portfolio under the Credit Agreement or the credit agreement for which State Street served as agent.
Note 8–Interfund Lending Program
Pursuant to an exemptive order issued by the SEC, the Portfolio, along with certain other funds managed by New York Life Investments, may participate in an interfund lending program. The interfund lending program provides an alternative credit facility that permits the Portfolio and certain other funds managed by New York Life Investments to lend or borrow money for temporary purposes directly to or from one another subject to the conditions of the exemptive order. During the six-month period ended June 30, 2020, there were no interfund loans made or outstanding with respect to the Portfolio.
Note 9–Purchases and Sales of Securities (in 000’s)
During the six-month period ended June 30, 2020, purchases and sales of securities, other than short-term securities, were $661,768 and $612,784, respectively.
Note 10–Capital Share Transactions
Transactions in capital shares for the six-month period ended June 30, 2020 and the year ended December 31, 2019, were as follows:
| | | | | | | | |
Initial Class | | Shares | | | Amount | |
| | |
Six-month period ended June 30, 2020: | | | | | | | | |
Shares sold | | | 2,497,472 | | | $ | 23,538,450 | |
Shares redeemed | | | (4,606,227 | ) | | | (43,419,458 | ) |
| | | | | | | | |
Net increase (decrease) | | | (2,108,755 | ) | | $ | (19,881,008 | ) |
| | | | | | | | |
Year ended December 31, 2019: | | | | | | | | |
Shares sold | | | 5,172,343 | | | $ | 51,704,719 | |
Shares issued to shareholders in reinvestment of distributions | | | 2,685,257 | | | | 25,956,045 | |
Shares redeemed | | | (9,632,914 | ) | | | (96,740,174 | ) |
| | | | | | | | |
Net increase (decrease) | | | (1,775,314 | ) | | $ | (19,079,410 | ) |
| | | | | | | | |
| | |
| | | | | | | | |
| | | | | | | | |
Service Class | | Shares | | | Amount | |
| | |
Six-month period ended June 30, 2020: | | | | | | | | |
Shares sold | | | 18,946,642 | | | $ | 178,344,202 | |
Shares redeemed | | | (23,237,572 | ) | | | (211,258,373 | ) |
| | | | | | | | |
Net increase (decrease) | | | (4,290,930 | ) | | $ | (32,914,171 | ) |
| | | | | | | | |
Year ended December 31, 2019: | | | | | | | | |
Shares sold | | | 25,652,819 | | | $ | 251,165,013 | |
Shares issued to shareholders in reinvestment of distributions | | | 14,217,789 | | | | 135,444,236 | |
Shares redeemed | | | (29,276,127 | ) | | | (286,035,919 | ) |
| | | | | | | | |
Net increase (decrease) | | | 10,594,481 | | | $ | 100,573,330 | |
| | | | | | | | |
Note 11–Recent Accounting Pronouncement
In March 2020, the Financial Accounting Standards Board (“FASB”) issued Accounting Standards Update 2020-04 (“ASU 2020-04”), which provides optional guidance to ease the potential accounting burden associated with transitioning away from LIBOR and other reference rates that are expected to be discontinued. ASU 2020-04 is effective immediately upon release of the update on March 12, 2020 through December 31, 2022. At this time, the Manager is evaluating the implications of certain other provisions of ASU 2020-04 related to new disclosure requirements and any impact on the financial statement disclosures has not yet been determined.
Note 12–Subsequent Events
In connection with the preparation of the financial statements of the Portfolio as of and for the six-month period ended June 30, 2020, events and transactions subsequent to June 30, 2020, through the date the financial statements were issued have been evaluated by the Manager, for possible adjustment and/or disclosure. No subsequent events requiring financial statement adjustment or disclosure have been identified.
Note 13–Other Matters
An outbreak of COVID-19, first detected in December 2019, has developed into a global pandemic and has resulted in travel restrictions, closure of international borders, certain businesses and securities markets, restrictions on securities trading activities, prolonged quarantines, supply chain disruptions, and lower consumer demand, as well as general concern and uncertainty. The continued impact of COVID-19 is uncertain and could further adversely affect the global economy, national economies, individual issuers and capital markets in unforeseeable ways and result in a substantial and extended economic downturn. Developments that disrupt global economies and financial markets, such as COVID-19, may magnify factors that affect the Portfolio’s performance.
| | |
| 34 | | MainStay VP MacKay High Yield Corporate Bond Portfolio |
Discussion of the Operation and Effectiveness of the Portfolio’s
Liquidity Risk Management Program (Unaudited)
In compliance with Rule 22e-4 under the Investment Company Act of 1940, as amended (the “Liquidity Rule”), the Portfolio has adopted and implemented a liquidity risk management program (the “Program”), which New York Life Investment Management LLC believes is reasonably designed to assess and manage the Portfolio’s liquidity risk. The Board designated New York Life Investment Management LLC as administrator of the Program (the “Administrator”). The Administrator has established a Liquidity Risk Management Committee to assist the Administrator in the implementation and day-to-day administration of the Program and to otherwise support the Administrator in fulfilling its responsibilities under the Program.
At a meeting of the Board held on March 11, 2020, the Administrator provided the Board with a written report addressing the Program’s operation, adequacy and effectiveness of implementation for the period from December 1, 2018 through December 31, 2019, as required under the Liquidity Rule. The report noted that the Administrator concluded that (i) the Program operated effectively to assess and manage the Portfolio’s liquidity risk, (ii) the Program has been adequately and effectively implemented to monitor and, as applicable, respond to the Portfolio’s liquidity developments and (iii) the Portfolio’s investment strategy continues to be appropriate for an open-end portfolio.
In accordance with the Program, the Portfolio’s liquidity risk is assessed no less frequently than annually taking into consideration certain factors, as applicable, such as (i) investment strategy and liquidity of portfolio investments, (ii) short-term and long-term cash flow projections and (iii) holdings of cash and cash equivalents and borrowing arrangements and other funding sources. Certain factors are considered under both normal and reasonably foreseeable stressed conditions.
Each Portfolio portfolio investment is classified into one of four liquidity categories. The classification is based on a determination of the number of days it is reasonably expected to take to convert the investment into cash, or sell or dispose of the investment, in current market conditions without significantly changing the market value of the investment. The Administrator has delegated liquidity classification determinations to the Portfolio’s subadvisor, subject to appropriate oversight by the Administrator, and classification determinations are made by taking into account the Portfolio’s reasonably anticipated trade size, various market, trading and investment-specific considerations, as well as market depth, and, in certain cases, third-party vendor data.
The Liquidity Rule requires portfolios that do not primarily hold assets that are highly liquid investments to adopt a minimum amount of net assets that must be invested in highly liquid investments that are assets (an “HLIM”). In addition, the Liquidity Rule limits a portfolio’s investments in illiquid investments. Specifically, the Liquidity Rule prohibits acquisition of illiquid investments if doing so would result in a portfolio holding more than 15% of its net assets in illiquid investments that are assets. The Program includes provisions reasonably designed to determine, periodically review and comply with the HLIM requirement, as applicable, and to comply with the 15% limit on illiquid investments.
Proxy Voting Policies and Procedures and Proxy Voting Record
A description of the policies and procedures that New York Life Investments uses to vote proxies related to the Portfolio’s securities is available free of charge upon request (i) by calling 800-598-2019; (ii) by visiting New York Life Investments’ website at https://www.nylinvestments.com/mainstay/products-and-performance/mainstay-vp-funds-trust; or (iii) by visiting the SEC’s website at www.sec.gov.
The Portfolio is required to file with the SEC its proxy voting record for the 12-month period ending June 30 on Form N-PX. The Portfolio’s most recent Form N-PX or proxy voting record is available free of charge upon request (i) by calling 800-598-2019; (ii) by visiting New York Life Investments’ website at https://www.nylinvestments.com/mainstay/products-and-performance/mainstay-vp-funds-trust; or (iii) by visiting the SEC’s website at www.sec.gov.
Shareholder Reports and Quarterly Portfolio Disclosure
The Portfolio is required to file its complete schedule of portfolio holdings with the SEC 60 days after its first and third fiscal quarter on Form N-PORT. The Portfolio’s holdings report is available free of charge upon request by calling 800-598-2019 or by visiting the SEC’s website at www.sec.gov.
| | |
| 36 | | MainStay VP MacKay High Yield Corporate Bond Portfolio |
MainStay VP Portfolios
MainStay VP offers a wide range of Portfolios. The full array of MainStay VP offerings is listed here, with information about the manager, subadvisors, legal counsel, and independent registered public accounting firm.
Equity Portfolios
MainStay VP Emerging Markets Equity Portfolio
MainStay VP Epoch U.S. Equity Yield Portfolio
MainStay VP Fidelity Institutional AM® Utilities Portfolio†
MainStay VP MacKay Common Stock Portfolio
MainStay VP MacKay Growth Portfolio
MainStay VP MacKay International Equity Portfolio
MainStay VP MacKay Mid Cap Core Portfolio
MainStay VP MacKay S&P 500 Index Portfolio
MainStay VP MacKay Small Cap Core Portfolio
MainStay VP Mellon Natural Resources Portfolio
MainStay VP Small Cap Growth Portfolio
MainStay VP T. Rowe Price Equity Income Portfolio
MainStay VP Winslow Large Cap Growth Portfolio
Mixed Asset Portfolios
MainStay VP Balanced Portfolio
MainStay VP Income Builder Portfolio
MainStay VP Janus Henderson Balanced Portfolio
MainStay VP MacKay Convertible Portfolio
Income Portfolios
MainStay VP Bond Portfolio
MainStay VP Floating Rate Portfolio
MainStay VP Indexed Bond Portfolio
MainStay VP MacKay Government Portfolio
MainStay VP MacKay High Yield Corporate Bond Portfolio
MainStay VP MacKay Unconstrained Bond Portfolio
MainStay VP PIMCO Real Return Portfolio
Money Market
MainStay VP U.S. Government Money Market Portfolio
Alternative
MainStay VP CBRE Global Infrastructure Portfolio
MainStay VP IQ Hedge Multi-Strategy Portfolio
Asset Allocation Portfolios
MainStay VP Conservative Allocation Portfolio
MainStay VP Growth Allocation Portfolio
MainStay VP Moderate Allocation Portfolio
MainStay VP Moderate Growth Allocation Portfolio
Manager
New York Life Investment Management LLC
New York, New York
Subadvisors
Brown Advisory LLC
Baltimore, Maryland
Candriam Belgium S.A.*
Brussels, Belgium
CBRE Clarion Securities LLC
Radnor, Pennsylvania
Epoch Investment Partners, Inc.
New York, New York
FIAM LLC
Smithfield, Rhode Island
IndexIQ Advisors LLC*
New York, New York
Janus Capital Management LLC
Denver, Colorado
MacKay Shields LLC*
New York, New York
Mellon Investments Corporation
Boston, Massachusetts
NYL Investors LLC*
New York, New York
Pacific Investment Management Company LLC
Newport Beach, California
Segall Bryant & Hamill, LLC
Chicago, Illinois
T. Rowe Price Associates, Inc.
Baltimore, Maryland
Winslow Capital Management, LLC
Minneapolis, Minnesota
Distributor
NYLIFE Distributors LLC*
Jersey City, New Jersey
Custodian
State Street Bank and Trust Company
Boston, Massachusetts
Independent Registered Public Accounting Firm
PricewaterhouseCoopers LLP
New York, New York
Legal Counsel
Dechert LLP
Washington, District of Columbia
Some Portfolios may not be available in all products.
| † | Fidelity Institutional AM is a registered trade mark of FMR LLC. Used with permission. |
| * | An affiliate of New York Life Investment Management LLC |
Not part of the Semiannual Report
2020 Semiannual Report
This report is for the general information of New York Life Variable Annuities and NYLIAC Variable Universal Life Insurance Products policyowners. It must be preceded or accompanied by the appropriate product(s) and funds prospectuses if it is given to anyone who is not an owner of a New York Life variable annuity policy or a NYLIAC Variable Universal Life Insurance Product. This report does not offer for sale or solicit orders to purchase securities.
The performance data quoted in this report represents past performance. Past performance is no guarantee of future results. Due to market volatility and other factors, current performance may be lower or higher than the figures shown. The most recent month-end performance summary for your variable annuity or variable life policy is available by calling 800-598-2019 and is updated periodically on www.newyorklife.com.
The New York Life Variable Annuities and NYLIAC Variable Universal Life Insurance Products are issued by New York Life Insurance and Annuity Corporation (a Delaware Corporation) and distributed by NYLIFE Distributors LLC (Member FINRA/SIPC).
New York Life Insurance Company
New York Life Insurance and Annuity Corporation (NYLIAC) (A Delaware Corporation)
51 Madison Avenue, Room 551
New York, NY 10010
www.newyorklife.com
Printed on recycled paper
nylinvestments.com
NYLIFE Distributors LLC, 30 Hudson Street, Jersey City, NJ 07302
New York Life Investment Management LLC is the investment manager to the MainStay VP Funds Trust
©2020 by NYLIFE Distributors LLC. All rights reserved.
You may obtain copies of the Prospectus and the Statement of Additional Information free of charge, upon request, by calling toll-free 800-598-2019 or writing to New York Life Insurance and Annuity Corporation, 51 Madison Avenue, New York, NY 10010.
| | | | |
| Not FDIC Insured | | No Bank Guarantee | | May Lose Value |
| | | | |
| 1781623 | | | | MSVPHYCB10-08/20 (NYLIAC) NI520 |
MainStay VP Income Builder Portfolio
Message from the President and Semiannual Report
Unaudited | June 30, 2020
Beginning on January 1, 2021, as permitted by regulations adopted by the Securities and Exchange Commission, paper copies of the MainStay VP Portfolio annual and semi-annual shareholder reports may no longer be sent by mail, unless you specifically request paper copies of the reports from the insurance company that offers your policy. Instead, the reports will be made available online, and you will be notified by mail each time a report is posted and provided with a website link to access the report. Instructions for requesting paper copies will be provided by your insurance company.
If you already elected to receive shareholder reports electronically, you will not be affected by this change and you need not take any action. At any time, you may elect to receive reports and other communications from the insurance company electronically by following the instructions provided by the insurance company.
You may elect to receive all future shareholder reports in paper form free of charge. You can inform the insurance company that you wish to receive paper copies of reports by following the instructions provided by the insurance company. Your election to receive reports in paper form will apply to all portfolio companies available under your contract.
| | | | | | | | |
| Not FDIC/NCUA Insured | | Not a Deposit | | May Lose Value | | No Bank Guarantee | | Not Insured by Any Government Agency |

This page intentionally left blank
Message from the President
High levels of volatility shook financial markets in response to the COVID-19 pandemic and an abrupt decline in global economic activity during the six months ended June 30, 2020.
Markets entered 2020 riding strong fourth quarter performance and an economic expansion of historic longevity. Most broad stock and bond indices began to dip in late February as growing numbers of COVID-19 cases were seen in hotspots around the world. On March 11, 2020, the World Health Organization acknowledged that the disease had reached pandemic proportions, with over 80,000 identified cases in China, thousands in Italy, South Korea and the United States, and more in dozens of additional countries. Governments and central banks pledged trillions of dollars to address the mounting economic and public health crisis; however, “stay-at-home” orders and other restrictions on non-essential activity caused global economic activity to slow. Most stocks and bonds lost significant ground in this challenging environment, with equities declining by roughly a third and the yield on high-yield credit indices shooting higher.
Policymakers responded with extraordinary speed to address the situation. In the United States, the Federal Reserve (“Fed”) cut interest rates to near zero and announced unlimited quantitative easing. With help from Treasury, the Fed later rolled out a series of lending facilities to directly support market functioning. In late March, the Federal government declared a national emergency; Congress passed, and the President signed, a $2 trillion CARES Act (The Coronavirus Aid, Relief, and Economic Security Act), with the promise of further assistance for consumers and businesses to come. This enormous wave of policy support helped fuel a rapid recovery in market pricing as stocks bounced back and credit spreads narrowed. Some states rushed to ease restrictions on travel and social gatherings, further fueling optimism that the effects of the pandemic might prove short lived. However, the final weeks of the reporting period saw infection rates beginning to rise in some of the first states to reopen, raising concerns that a second round of restrictive government policies might prove necessary, once again stifling economic activity.
Despite all the market volatility, the broadly based S&P 500® Index finished the first half of 2020 only slightly below its starting point and the technology-heavy NASDAQ Composite Index posted gains, closing in near record territory. Small-cap stocks tended to trail their large cap counterparts, as illustrated by the Russell 2000® Index’s loss of approximately 15%, while value-oriented stocks lagged growth-oriented issues. From a global perspective, U.S. stocks generally outperformed international equities, with emerging markets hit particularly hard by the flight from risk.
Fixed-income markets also experienced unusually high levels of volatility. Recognized safe havens, such as U.S. government bonds, attracted increased investment, driving yields lower and prices higher, positioning long-term Treasury bonds to deliver particularly strong gains. Investment-grade corporate bonds lost value in March before recovering in the closing months of the reporting period, while relatively speculative high-yield credit faced the brunt of risk-off sentiment. Emerging market debt underperformed most other bonds types as investors sought to minimize currency and sovereign risks.
Today, as we at New York Life Investments continue to track the ongoing health crisis and its financial ramifications, we are particularly mindful of the people at the heart of our enterprise—our colleagues and valued clients. By taking appropriate steps to minimize community spread of COVID-19 within our organization, we strive to safeguard the health of our investment professionals so they can continue to provide you, as a MainStay investor, with world class investment solutions in this rapidly evolving environment.
Sincerely,

Kirk C. Lehneis
President
The opinions expressed are as of the date of this report and are subject to change. There is no guarantee that any forecast made will come to pass. This material does not constitute investment advice and is not intended as an endorsement of any specific investment. Past performance is no guarantee of future results.
Not part of the Semiannual Report
Table of Contents
Investors should refer to the Portfolio’s Summary Prospectus and/or Prospectus and consider the Portfolio’s investment objectives, strategies, risks, charges and expenses carefully before investing. The Summary Prospectus and/or Prospectus contain this and other information about the Portfolio. You may obtain copies of the Portfolio’s Summary Prospectus and/or the Prospectus and the Statement of Additional Information free of charge, upon request, by calling toll-free 800-598-2019, by writing to New York Life Insurance and Annuity Corporation, 51 Madison Avenue, Room 251, New York, New York 10010 or by sending an email to MainStayShareholdersServices@nylim.com. These documents are also available at nylinvestments.com/vpdocuments. Please read the Summary Prospectus and/or Prospectus carefully before investing. MainStay VP Funds Trust portfolios are separate account options which are purchased through a variable insurance or variable annuity contract.
Investment and Performance Comparison1 (Unaudited)
Performance data quoted represents past performance. Past performance is no guarantee of future results. Because of market volatility and other factors, current performance may be lower or higher than the figures shown. Investment return and principal value will fluctuate, and as a result, when shares are redeemed, they may be worth more or less than their original cost. The performance table and graph do not reflect any deduction of sales charges, mortality and expense charges, contract charges or administrative charges. Please refer to the Performance Summary appropriate for your policy. For performance information current to the most recent month-end, please call 800-598-2019 or visit www.newyorklife.com.
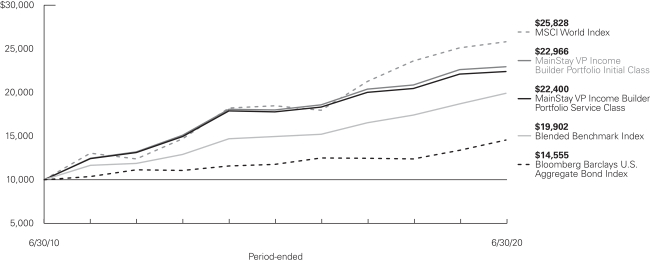
Average Annual Total Returns for the Period-Ended June 30, 2020
| | | | | | | | | | | | | | | | | | | | |
| Class | | Inception
Date | | | Six Months | | One Year | | Five Years | | | Ten Years | | | Gross
Expense
Ratio2 | |
| | | | | | |
| Initial Class Shares | | | 1/29/1993 | | | –4.42% | | 1.46% | | | 4.96 | % | | | 8.67 | % | | | 0.63 | % |
| Service Class Shares | | | 6/4/2003 | | | –4.54 | | 1.20 | | | 4.70 | | | | 8.40 | | | | 0.88 | |
| | | | | | | | | | | | | | | | |
| Benchmark Performance | | Six
Months | | | One Year | | | Five Years | | | Ten Years | |
| | | | |
MSCI World Index3 | | | –5.77 | % | | | 2.84 | % | | | 6.90 | % | | | 9.95 | % |
Bloomberg Barclays U.S. Aggregate Bond Index4 | | | 6.14 | | | | 8.74 | | | | 4.30 | | | | 3.82 | |
Blended Benchmark Index5 | | | 0.51 | | | | 6.35 | | | | 5.89 | | | | 7.12 | |
Morningstar World Allocation Category Average6 | | | –8.02 | | | | –3.32 | | | | 2.70 | | | | 5.44 | |
| 1. | Performance figures may reflect certain fee waivers and/or expense limitations, without which total returns may have been different. For information on current fee waivers and/or expense limitations (if any), please refer to the Notes to Financial Statements. |
| 2. | The gross expense ratios presented reflect the Portfolio’s “Total Annual Portfolio Operating Expenses” from the most recent Prospectus, as supplemented, and may differ from other expense ratios disclosed in this report. |
| 3. | The MSCI World Index is the Portfolio’s primary broad-based securities market index for comparison purposes. The MSCI World Index is a free float-adjusted market-capitalization-weighted index that is designed to measure the equity market performance of developed markets. Results assume reinvestment of all dividends and capital gains. An investment cannot be made directly in an index. |
| 4. | The Portfolio has selected the Bloomberg Barclays U.S. Aggregate Bond Index as a secondary benchmark. The Bloomberg Barclays U.S. Aggregate Bond Index is a broad-based benchmark that measures performance of the investment-grade, U.S. dollar denominated, fixed-rate taxable bond market, including Treasurys, government-related and corporate securities, |
| | mortgage-backed securities (agency fixed-rate and hybrid adjustable-rate mortgage pass-throughs), asset-backed securities and commercial mortgage-backed securities. Results assume reinvestment of all dividends and capital gains. An investment cannot be made directly in an index. |
| 5. | The Portfolio has selected the Blended Benchmark Index as an additional benchmark. The Blended Benchmark Index consists of the MSCI World Index and the Bloomberg Barclays U.S. Aggregate Bond Index, each weighted 50%. Results assume reinvestment of all dividends and capital gains. An investment cannot be made directly in an index. |
| 6. | The Morningstar World Allocation Category Average is representative of funds that seek to provide both capital appreciation and income by investing in three major areas: stocks, bonds, and cash. While these funds do explore the whole world, most of them focus on the U.S., Canada, Japan, and the larger markets in Europe. It is rare for such funds to invest more than 10% of their assets in emerging markets. These funds typically have at least 10% of assets in bonds, less than 70% of assets in stocks, and at least 40% of assets in non-U.S. stocks or bonds. Results are based on average total returns of similar funds with all dividends and capital gain distributions reinvested. |
Cost in Dollars of a $1,000 Investment in MainStay VP Income Builder Portfolio (Unaudited)
The example below is intended to describe the fees and expenses borne by shareholders during the six-month period from January 1, 2020, to June 30, 2020, and the impact of those costs on your investment.
Example
As a shareholder of the Portfolio you incur two types of costs: (1) transaction costs, including exchange fees and sales charges (loads) on purchases (as applicable), and (2) ongoing costs, including management fees, distribution and/or service (12b-1) fees, and other Portfolio expenses (as applicable). This example is intended to help you understand your ongoing costs (in dollars) of investing in the Portfolio and to compare these costs with the ongoing costs of investing in other mutual funds. The example is based on an investment of $1,000 made at the beginning of the six-month period and held for the entire period from January 1, 2020, to June 30, 2020. Shares are only sold in connection with variable life and annuity contracts and the example does not reflect any contract level or transactional fees or expenses. If these costs had been included, your costs would have been higher.
This example illustrates your Portfolio’s ongoing costs in two ways:
Actual Expenses
The second and third data columns in the table below provide information about actual account values and actual expenses. You may use the information in these columns, together with the amount you invested, to estimate the expenses that you paid during the six months
ended June 30, 2020. Simply divide your account value by $1,000 (for example, an $8,600 account value divided by $1,000 = 8.6), then multiply the result by the number under the heading entitled “Expenses Paid During Period” to estimate the expenses you paid on your account during this period.
Hypothetical Example for Comparison Purposes
The fourth and fifth data columns in the table below provide information about hypothetical account values and hypothetical expenses based on the Portfolio’s actual expense ratio and an assumed rate of return of 5% per year before expenses, which is not the Portfolio’s actual return. The hypothetical account values and expenses may not be used to estimate the actual ending account balances or expenses you paid for the six-month period shown. You may use this information to compare the ongoing costs of investing in the Portfolio with the ongoing costs of investing in other mutual funds. To do so, compare this 5% hypothetical example with the 5% hypothetical examples that appear in the shareholder reports of the other mutual funds.
Please note that the expenses shown in the table are meant to highlight your ongoing costs only and do not reflect any transactional costs, such as exchange fees or sales charges (loads). Therefore, the fourth and fifth data columns of the table are useful in comparing ongoing costs only and will not help you determine the relative total costs of owning different funds. In addition, if these transactional costs were included, your costs would have been higher.
| | | | | | | | | | | | | | | | | | | | | | |
| | | | | | | | | | | | | | | | | | |
| Share Class | | Beginning
Account
Value
1/1/20 | | | Ending Account
Value (Based
on Actual
Returns and
Expenses)
6/30/20 | | | Expenses
Paid
During
Period1 | | | Ending Account
Value (Based
on Hypothetical
5% Annualized
Return and
Actual Expenses)
6/30/20 | | | Expenses
Paid
During
Period1 | | | Net Expense
Ratio
During
Period2 |
| | | | | | |
| Initial Class Shares | | $ | 1,000.00 | | | $ | 955.80 | | | $ | 3.06 | | | $ | 1,021.73 | | | $ | 3.17 | | | 0.63% |
| | | | | | |
| Service Class Shares | | $ | 1,000.00 | | | $ | 954.60 | | | $ | 4.28 | | | $ | 1,020.49 | | | $ | 4.42 | | | 0.88% |
| 1 | Expenses are equal to the Portfolio’s annualized expense ratio of each class multiplied by the average account value over the period, divided by 366 and multiplied by 182 (to reflect the six-month period). The table above represents the actual expenses incurred during the six-month period. In addition to the fees and expenses which the Portfolio bears directly, it also indirectly bears a pro rata share of the fees and expenses of the underlying funds in which it invests. Such indirect expenses are not included in the above-reported expense figures. |
| 2 | Expenses are equal to the Portfolio’s annualized expense ratio to reflect the six-month period. |
| | |
| 6 | | MainStay VP Income Builder Portfolio |
Portfolio Composition as of June 30, 2020 (Unaudited)
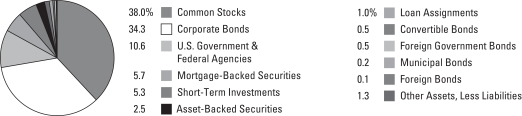
See Portfolio of Investments beginning on page 12 for specific holdings within these categories. The Portfolio’s holdings are subject to change.
Top Ten Holdings or Issuers Held as of June 30, 2020 (excluding short-term investments) (Unaudited)
| 1. | United States Treasury Notes, 0.125%–0.625%, due 4/30/22–5/15/30 |
| 2. | Federal National Mortgage Association (Mortgage Pass-Through Securities), 2.00%–6.00%, due 9/1/33–6/1/50 |
| 3. | Federal Home Loan Mortgage Corporation (Mortgage Pass-Through Securities), 2.00%–5.00%, due 1/1/40–6/1/50 |
| 4. | Bank of America Corp., 2.496%–6.30%, due 1/23/22–4/23/40 |
| 6. | United States Treasury Bonds, 2.00%–4.50%, due 5/15/38–2/15/50 |
| 7. | Federal Home Loan Mortgage Corporation, 3.00%–4.00%, due 9/15/48–1/25/50 |
| 9. | Verizon Communications, Inc. |
| 10. | Morgan Stanley, 3.125%–7.25%, due 10/15/20–4/1/32 |
Portfolio Management Discussion and Analysis (Unaudited)
Questions answered by portfolio managers Jae S. Yoon, CFA, and Jonathan Swaney of New York Life Investment Management LLC, the Portfolio’s Manager; Stephen R. Cianci, CFA, and Neil Moriarty III, of MacKay Shields LLC (“MacKay Shields”), the Subadvisor for the fixed-income portion of the Portfolio; and William W. Priest, CFA, Michael A. Welhoelter, CFA, John Tobin, PhD, CFA, and Kera Van Valen, CFA, of Epoch Investment Partners, Inc. (“Epoch”), the Subadvisor for the equity portion of the Portfolio.
How did MainStay VP Income Builder Portfolio perform relative to its benchmarks and peers during the six months ended June 30, 2020?
For the six months ended June 30, 2020, MainStay VP Income Builder Portfolio returned –4.42% for Initial Class shares and –4.54% for Service Class shares. Over the same period, both share classes outperformed the –5.77% return of the MSCI World Index, which is the Portfolio’s primary benchmark; underperformed the 6.14% return of the Bloomberg Barclays U.S. Aggregate Bond Index, which is the Portfolio’s secondary benchmark; and underperformed the 0.51% return of the Blended Benchmark Index, which is an additional benchmark of the Portfolio. For the six months ended June 30, 2020, both share classes outperformed the –8.02% return of the Morningstar World Allocation Category Average.1
During the reporting period, how was the Portfolio’s performance materially affected by investments in derivatives?
During the reporting period, the fixed-income portion of the Portfolio used U.S. Treasury futures to manage duration.2 The use of these instruments had a positive impact on Portfolio returns. During the same period, the equity portion of the Portfolio did not invest in derivatives.
What factors affected the relative performance of the equity portion of the Portfolio during the reporting period?
The performance of the equity portion of the Portfolio relative to the MSCI World Index was weakened by underweight exposure to information technology, which was the best performing sector in the benchmark. Stock selection in the information technology, communication services, consumer discretionary and real estate sectors also detracted. The Portfolio’s equity strategy was not immune to the indiscriminate, pandemic-related sell-off affecting global stock markets. While we understand cash distributions from shareholders have recently been called into question because of extreme policy measures to stimulate the global economy, we believe the blanket disregard for dividend-paying stocks has been undiscerning. Not all businesses face the same degree of stress. Many are experiencing strains but are still generating material cash flow and entered the reporting period with ample liquidity and strong balance sheets. We assess risks in the equity portion of the Portfolio on a company-by-company basis and remain highly confident that
we can continue to deliver attractive dividend income from a diversified portfolio of high-quality equities.
Which market segments were the strongest positive contributors to relative performance in the equity portion of the Portfolio, and which market segments detracted the most?
During the reporting period, the strongest positive contribution to the performance of the equity portion of the Portfolio relative to the MSCI World Index came from underweight exposure to, and favorable stock selection in, the industrials sector. (Contributions take weightings and total returns into account.) Over the same period, underweight exposure to, and disappointing stock selection in, the information technology sector was the largest detractor from the Portfolio’s relative performance. Other detractors included stock selection in real estate and communication services, as well as overweight exposure to energy, the worst performing sector in the benchmark. From a country perspective, the strongest positive contribution to the performance of the equity portion of the Portfolio relative to the MSCI World Index came from Spain, while U.S. holdings detracted.
During the reporting period, which individual stocks made the strongest positive contributions to absolute performance in the equity portion of the Portfolio and which stocks detracted the most?
The strongest positive contributors to the absolute performance of the equity portion of the Portfolio included global software company Microsoft and semiconductor tool maker KLA. Shares of Microsoft rose on the company’s role in supporting the pandemic-related increase in working from home. The company’s Azure cloud-based business and productivity software such as Office and Teams became increasingly important as the pandemic persisted, while Microsoft’s shift toward subscription-based services supported revenues in the face of end-demand uncertainty. Management remained dedicated to shareholder returns through continued improvements to its dividend and share repurchase plans. KLA shares rose on strong capital expenditure forecasts for semiconductor manufacturers, which solidified demand for the company’s process controls. The announcement of Taiwan Semiconductor Manufacturing’s plan to build a plant in the United States, along with escalating trade tensions between the United States and China, further improved
| 1. | See page 5 for more information on benchmark and peer group returns. |
| 2. | Duration is a measure of the price sensitivity of a fixed-income investment to changes in interest rates. Duration is expressed as a number of years and is considered a more accurate sensitivity gauge than average maturity. |
| | |
| 8 | | MainStay VP Income Builder Portfolio |
the demand outlook for semiconductor equipment going forward. KLA continued to return a significant percentage of free cash flow back to shareholders through a progressive dividend and share repurchases.
The weakest contributors to the absolute performance of the equity portion of the Portfolio included British financial firm Lloyds Banking and diversified global insurer AXA. Despite Lloyds’ encouraging guidance, its strong capital position and proposed dividend increase, shares traded lower in February 2020 following an earnings report that was modestly below expectations. Shares continued to fall in response to pandemic-related concerns. The Portfolio sold its position based on concerns that regulators would either request or require banks to discontinue shareholder distributions in light of the economic uncertainty caused by the pandemic. Following our decision to sell, Lloyds and the other major U.K. banks canceled dividends they had earlier announced. AXA stock suffered as the pandemic caused a deep economic contraction, driving interest rates and global equity markets sharply lower, thus making the near-term environment more challenging for insurance companies. We expect claims associated with business interruption, event cancellation and mortality will be manageable for the company. Facing pressure from regulators, AXA’s board announced its intention to pay the annual dividend in two installments. The first installment was approved for immediate distribution and the second will be considered later in 2020, depending on regulatory and market conditions, as well as shareholder approval. In our opinion, AXA’s business franchise remains strong and the company enjoys robust capital strength and liquidity. The company continues to have a transparent capital allocation policy with the ability to pay an attractive, growing dividend supported by earnings, and to maintain a strong regulatory capital position. Debt reduction also remains a focus for management.
Did the equity portion of the Portfolio make any significant purchases or sales during the reporting period?
During the reporting period, new positions initiated by the equity portion of the Portfolio included consumer electronics maker Apple and restaurant chain owner and franchiser Restaurant Brands International (“RBI”). Apple has shown strong growth in its services and wearables businesses despite pressure on iPhone sales. We believe the company should be able to grow cash flow despite an elongating handset replacement cycle and near-term pressure from the pandemic’s effects. Apple returns cash to shareholders through dividends and share repurchases. RBI is a large, global quick-service restaurant company with three brands: Tim Hortons, Burger King and Popeyes. Cash flows are sustained by RBI’s strong brands, franchised business
model and quick-service format. Cash flow growth drivers include net restaurant unit growth across all three brands within their large and growing categories; comparable sales growth driven by product innovation, digital leadership and restaurant design updates (reimages); and operating leverage from sales growth on fixed costs. RBI returns cash to shareholders through an attractive and growing dividend that is well-covered by free cash flow. In our view, the company maintains a healthy capital structure, which provides it with strong access to capital.
Positions that the equity portion of the Portfolio closed during the reporting period included mostly regulated utility CenterPoint Energy and U.S. bank Wells Fargo. CenterPoint has a stake in a midstream business that was negatively impacted by the pandemic and a price war in the oil markets. It was not surprising to us that the midstream company reduced their cash distribution to CenterPoint; however, we were surprised by the decision from CenterPoint to reduce their dividend as the distribution reduction was relatively small compared to the capital program and the expected proceeds from two recent asset sales. Our outlook for the company was further clouded by abrupt management departures before and around the time of the dividend decision. As a result, the Portfolio exited the position. Wells Fargo reported relatively weak first quarter results including a large provision for possible future loan losses. The company’s exposure to multiple vulnerable sectors, including oil & gas, retail, commercial real estate and transportation, among others, raised concerns about further credit deterioration and subsequent loan reserving. A broad and material deterioration in loan quality could impact capital adequacy relative to regulatory requirements, in turn affecting dividend growth and sustainability. As a result, we decided to sell the Portfolio’s position. The company subsequently announced a dividend reduction after the release of the annual stress test in June 2020.
How did sector weightings in the equity portion of the Portfolio change during the reporting period?
During the reporting period, the most substantial sector weighting increases in the equity portion of the Portfolio were in information technology and health care, while the most substantial reductions were in energy and utilities. From a country perspective, the most significant country weighting changes during the same period were increases in the United States and, to a smaller degree, Switzerland, and reductions in the U.K. and France. Sector allocations in the equity portion of the Portfolio are a result of our bottom-up fundamental investment process and reflect the companies and securities that we confidently believe can collect and distribute sustainable, growing shareholder yield. Large differences in sector returns over the reporting period and the subsequent relative performance of sectors and countries may impact changes in sector weightings.
How was the equity portion of the Portfolio positioned at the end of the reporting period?
As of June 30, 2020, the largest sectors in the equity portion of the Portfolio on an absolute basis were health care and information technology, while the smallest sectors were real estate and materials. As of the same date, the most substantially overweight sector position relative to the MSCI World Index in the equity portion of the Portfolio was utilities, which is a defensive sector that is typically more heavily represented in the equity portion of the Portfolio, while the most substantially underweight sector positions were information technology and consumer discretionary.
During the reporting period, were there any market events that materially impacted the performance or liquidity of the fixed-income portion of the Portfolio?
Fixed-income markets dropped sharply in the first quarter of 2020, impacting the entire reporting period as it became increasingly evident that the COVID-19 outbreak was not merely a medical concern, but an economic one with perhaps larger fiscal implications than those related to personal health. Other than Treasury securities, nearly all asset classes saw steep losses. Towards the end of the first quarter, the U.S. Federal Reserve (“Fed”) announced they would begin buying investment-grade corporate bonds and ETFs, which reversed the stress in the credit markets and led to a robust recovery in the second quarter.
What factors affected the relative performance of the fixed-income portion of the Portfolio during the reporting period?
The performance of the fixed-income portion of Portfolio relative to the Bloomberg Barclays U.S. Aggregate Bond Index was undermined by overweight exposure to corporate bonds, both investment-grade and high-yield. These holdings were hard hit in mid-March 2020, particularly at the front end of the yield curve3 where the dealer community stepped away as the pandemic-related sell-off escalated. Underweight exposure to Treasury bonds, the best-performing fixed-income asset class in the reporting period, further detracted from relative returns. Overweight exposure to securitized assets also detracted from relative performance as forced selling caused securitized assets to widen out in the first quarter. However, securitized assets recovered somewhat in April as the Fed cut rates to near zero and reinstituted a bond buying program to create liquidity.
What was the duration strategy of the fixed-income portion of the Portfolio during the reporting period?
Throughout the reporting period, the fixed-income portion of the Portfolio kept its duration neutral with that of the Bloomberg
Barclays U.S. Aggregate Bond Index. As of June 30, 2020, the duration of the fixed-income portion of the Portfolio and the benchmark were both 6.0 years.
What specific factors, risks or market forces prompted significant decisions for the fixed-income portion of the Portfolio during the reporting period?
We took advantage of pandemic-related weakness in the credit markets at the end of the first quarter of 2020 to increase the exposure of the fixed-income portion of the Portfolio to high-yield securities, with high-yield purchases funded by reducing holdings of agency mortgages. These transactions were accretive to returns as high-yield bonds experienced a strong recovery in the second quarter.
During the reporting period, which market segments were the strongest positive contributors to the absolute performance of the fixed-income portion of the Portfolio and which market segments were particularly weak?
The exposure of the fixed-income portion of the Portfolio to investment-grade corporate bonds, contributed to the absolute return during the reporting period. However, the return of high-yield corporates detracted from absolute performance, particularly at the front-end of the yield curve where the dealer community stepped away in mid-March 2020 as the sell-off escalated. In addition, the fixed-income portion of the Portfolio’s position in Treasury bonds with longer maturities was accretive to returns. Treasury bonds were the best-performing fixed-income asset class in the reporting period. Also boosting positive absolute results was the fixed-income portion of the Portfolio’s exposure to agency mortgages and commercial backed securities. Lastly, security selection in both the collateralized mortgage obligation and emerging-market sovereign debt markets were accretive to returns.
Did the fixed-income portion of the Portfolio make any significant purchases or sales during the reporting period?
During the reporting period the fixed-income portion of the Portfolio purchased a seasoned credit risk transfer deal from Freddie Mac backed by four-year-old prime mortgage loans. At the time, the liquidity premium was high as there were forced sellers of this type of paper. Given the underlying fundamentals of the borrower’s credit and bond structure, we believed the market would eventually price those in. The fixed-income portion of the Portfolio also purchased corporate bonds issued by graphics processor and software maker, Nvidia, a high-quality, low-levered name in a rapidly growing industry that came to market with a very attractive new issue premium during the height of the market’s volatility.
| 3. | The yield curve is a line that plots the yields of various securities of similar quality—typically U.S. Treasury issues—across a range of maturities. The U.S. Treasury yield curve serves as a benchmark for other debt and is used in economic forecasting. |
| | |
| 10 | | MainStay VP Income Builder Portfolio |
In early February 2020, the fixed-income portion of the Portfolio exited its position in an asset-backed securities (ABS) deal backed by equipment loans from DLL Finance as ABS spreads4 were historically narrow and liquidity was readily available. The fixed-income portion of the Portfolio also sold its position in bonds from integrated oil & gas company Petrobras Brasileiro during the reporting period, reflecting our opinion that valuation was tight although fundamentals were sound.
How did sector weightings change in the fixed-income portion of the Portfolio during the reporting period?
During the reporting period, we increased the exposure of the fixed-income portion of the Portfolio to high-yield corporate bonds and decreased exposure to U.S. Treasury securities and agency mortgage-backed securities.
How was the fixed-income portion of the Portfolio positioned at the end of the reporting period?
As of June 30, 2020, the fixed-income portion of the Portfolio held overweight exposure relative to the Bloomberg Barclays U.S. Aggregate Bond Index in high-yield and investment-grade corporate bonds, as well as in securitized assets. As of the same date, the fixed-income portion of the Portfolio held underweight exposure in U.S. Treasury securities and agency mortgage-backed securities.
| 4. | The terms “spread” and “yield spread” may refer to the difference in yield between a security or type of security and comparable U.S. Treasury issues. The terms may also refer to the difference in yield between two specific securities or types of securities at a given time. |
The opinions expressed are those of the portfolio managers as of the date of this report and are subject to change. There is no guarantee that any forecasts will come to pass. This material does not constitute investment advice and is not intended as an endorsement of any specific investment.
Not all MainStay VP Portfolios and/or share classes are available under all policies.
Portfolio of Investments June 30, 2020 (Unaudited)
| | | | | | | | |
| | | Principal
Amount | | | Value | |
Long-Term Bonds 55.4%† Asset-Backed Securities 2.5% | |
Auto Floor Plan Asset-Backed Securities 0.7% | |
Ford Credit Floorplan Master Owner Trust | |
Series 2019-4, Class A
2.44%, due 9/15/26 | | $ | 850,000 | | | $ | 857,624 | |
Series 2017-3, Class A
2.48%, due 9/15/24 | | | 895,000 | | | | 905,103 | |
Series 2018-4, Class A
4.06%, due 11/15/30 | | | 1,210,000 | | | | 1,298,641 | |
General Motors Floorplan Owner Revolving Trust
Series 2019-2, Class A
2.90%, due 4/15/26 (a) | | | 1,130,000 | | | | 1,177,469 | |
| | | | | | | | |
| | | | | | | 4,238,837 | |
| | | | | | | | |
Automobile Asset-Backed Securities 0.8% | |
Avis Budget Rental Car Funding AESOP LLC
Series 2020-1A, Class A
2.33%, due 8/20/26 (a) | | | 515,000 | | | | 498,099 | |
CarMax Auto Owner Trust
Series 2019-3, Class A3
2.18%, due 8/15/24 | | | 905,000 | | | | 930,887 | |
Ford Credit Auto Owner Trust
Series 2020-1, Class A
2.04%, due 8/15/31 (a) | | | 680,000 | | | | 690,978 | |
Santander Retail Auto Lease Trust
Series 2019-B, Class A3
2.30%, due 1/20/23 (a) | | | 650,000 | | | | 664,061 | |
Santander Revolving Auto Loan Trust
Series 2019-A, Class A
2.51%, due 1/26/32 (a) | | | 445,000 | | | | 465,380 | |
Toyota Auto Loan Extended Note Trust
Series 2019-1A, Class A
2.56%, due 11/25/31 (a) | | | 390,000 | | | | 415,089 | |
Volkswagen Auto Lease Trust
Series 2019-A, Class A3
1.99%, due 11/21/22 | | | 1,000,000 | | | | 1,016,917 | |
| | | | | | | | |
| | | | | | | 4,681,411 | |
| | | | | | | | |
Credit Cards 0.1% | |
Capital One Multi-Asset Execution Trust
Series 2019-A3, Class A3
2.06%, due 8/15/28 | | | 700,000 | | | | 746,463 | |
| | | | | | | | |
Home Equity 0.0%‡ | |
JPMorgan Mortgage Acquisition Trust
Series 2007-HE1, Class AF1
0.285% (1 Month LIBOR + 0.10%), due 3/25/47 (b) | | | 149,966 | | | | 94,908 | |
| | | | | | | | |
| | | Principal
Amount | | | Value | |
Home Equity (continued) | |
MASTR Asset-Backed Securities Trust
Series 2006-HE4, Class A1
0.235% (1 Month LIBOR + 0.05%), due 11/25/36 (b) | | $ | 224,336 | | | $ | 95,879 | |
| | | | | | | | |
| | | | | | | 190,787 | |
| | | | | | | | |
Other Asset-Backed Securities 0.8% | |
American Tower Trust I
Series 2013, Class 2A
3.07%, due 3/15/48 (a) | | | 175,000 | | | | 179,040 | |
Carrington Mortgage Loan Trust
Series 2007-HE1, Class A3
0.375% (1 Month LIBOR + 0.19%), due 6/25/37 (b) | | | 1,620,000 | | | | 1,496,905 | |
DLL Securitization Trust
Series 2019-MT3, Class A3
2.08%, due 2/21/23 (a) | | | 880,000 | | | | 894,082 | |
MVW Owner Trust
Series 2019-2A, Class A
2.22%, due 10/20/38 (a) | | | 889,539 | | | | 889,233 | |
PFS Financing Corp. (a) | |
Series 2020-B, Class B
1.71%, due 6/17/24 | | | 355,000 | | | | 354,929 | |
Series 2020-A, Class B
1.77%, due 6/16/25 | | | 765,000 | | | | 765,749 | |
| | | | | | | | |
| | | | | | | 4,579,938 | |
| | | | | | | | |
Student Loans 0.1% | |
KeyCorp Student Loan Trust
Series 2000-A, Class A2
0.68% (3 Month LIBOR + 0.32%), due 5/25/29 (b) | | | 20,494 | | | | 20,431 | |
Navient Student Loan Trust
Series 2020-DA, Class A
1.69%, due 5/15/69 (a) | | | 485,000 | | | | 486,810 | |
| | | | | | | | |
| | | | | | | 507,241 | |
| | | | | | | | |
Total Asset-Backed Securities
(Cost $14,672,781) | | | | 14,944,677 | |
| | | | | | | | |
|
| Convertible Bonds 0.5% | |
Machinery—Diversified 0.3% | |
Chart Industries, Inc.
1.00%, due 11/15/24 (a) | | | 1,528,000 | | | | 1,614,649 | |
| | | | | | | | |
|
Semiconductors 0.2% | |
ON Semiconductor Corp.
1.625%, due 10/15/23 | | | 1,289,000 | | | | 1,567,437 | |
| | | | | | | | |
Total Convertible Bonds
(Cost $2,522,918) | | | | 3,182,086 | |
| | | | | | | | |
| | | | |
| 12 | | MainStay VP Income Builder Portfolio | | The notes to the financial statements are an integral part of,
and should be read in conjunction with, the financial statements. |
| | | | | | | | |
| | | Principal
Amount | | | Value | |
| Corporate Bonds 34.3% | |
Aerospace & Defense 0.2% | |
L3Harris Technologies, Inc.
4.40%, due 6/15/28 | | $ | 810,000 | | | $ | 958,145 | |
| | | | | | | | |
|
Agriculture 0.3% | |
Altria Group, Inc.
3.80%, due 2/14/24 | | | 1,300,000 | | | | 1,421,393 | |
JBS Investments II GmbH
7.00%, due 1/15/26 (Austria) (a) | | | 460,000 | | | | 482,770 | |
| | | | | | | | |
| | | | | | | 1,904,163 | |
| | | | | | | | |
Airlines 0.8% | |
American Airlines Pass-Through Trust
Series 2013-2, Class A
4.95%, due 7/15/24 | | | 1,125,280 | | | | 911,455 | |
Delta Air Lines Pass-Through Trust | |
Series 2019-1, Class AA
3.204%, due 10/25/25 | | | 920,000 | | | | 921,045 | |
7.00%, due 5/1/25 (a) | | | 985,000 | | | | 1,016,784 | |
Mileage Plus Holdings LLC / Mileage Plus Intellectual Property Assets, Ltd.
6.50%, due 6/20/27 (a) | | | 795,000 | | | | 796,988 | |
U.S. Airways Pass-Through Trust | |
Series 2012-1, Class A
5.90%, due 4/1/26 | | | 595,433 | | | | 547,756 | |
Series 2010-1, Class A
6.25%, due 10/22/24 | | | 314,226 | | | | 268,003 | |
United Airlines Pass-Through Trust | |
Series 2014-2, Class B
4.625%, due 3/3/24 | | | 290,438 | | | | 256,021 | |
Series 2007-1
6.636%, due 1/2/24 | | | 388,961 | | | | 330,898 | |
| | | | | | | | |
| | | | | | | 5,048,950 | |
| | | | | | | | |
Auto Manufacturers 1.3% | |
Daimler Finance North America LLC
1.106% (3 Month LIBOR + 0.55%), due 5/4/21 (Germany) (a)(b) | | | 685,000 | | | | 681,464 | |
Ford Motor Co. | | | | | | | | |
8.50%, due 4/21/23 | | | 890,000 | | | | 941,175 | |
9.00%, due 4/22/25 | | | 890,000 | | | | 963,158 | |
Ford Motor Credit Co. LLC | | | | | | | | |
4.063%, due 11/1/24 | | | 780,000 | | | | 744,924 | |
4.25%, due 9/20/22 | | | 305,000 | | | | 298,964 | |
5.875%, due 8/2/21 | | | 150,000 | | | | 151,455 | |
General Motors Co.
6.125%, due 10/1/25 | | | 285,000 | | | | 320,250 | |
General Motors Financial Co., Inc. | | | | | | | | |
3.15%, due 6/30/22 | | | 320,000 | | | | 325,559 | |
3.45%, due 4/10/22 | | | 1,500,000 | | | | 1,529,487 | |
5.20%, due 3/20/23 | | | 345,000 | | | | 368,707 | |
| | | | | | | | |
| | | Principal
Amount | | | Value | |
Auto Manufacturers (continued) | |
Toyota Motor Credit Corp.
0.478% (3 Month LIBOR + 0.17%), due 9/18/20 (b) | | $ | 1,765,000 | | | $ | 1,765,457 | |
| | | | | | | | |
| | | | | | | 8,090,600 | |
| | | | | | | | |
Banks 8.0% | |
Bank of America Corp. | | | | | | | | |
2.496%, due 2/13/31 (c) | | | 650,000 | | | | 681,455 | |
2.738%, due 1/23/22 (c) | | | 1,150,000 | | | | 1,162,758 | |
3.004%, due 12/20/23 (c) | | | 734,000 | | | | 771,001 | |
3.458%, due 3/15/25 (c) | | | 1,425,000 | | | | 1,545,615 | |
3.499%, due 5/17/22 (c) | | | 1,635,000 | | | | 1,674,780 | |
3.705%, due 4/24/28 (c) | | | 555,000 | | | | 627,353 | |
4.078%, due 4/23/40 (c) | | | 785,000 | | | | 954,461 | |
4.20%, due 8/26/24 | | | 325,000 | | | | 360,815 | |
4.30%, due 1/28/25 (c)(d) | | | 1,461,000 | | | | 1,311,101 | |
6.30%, due 3/10/26 (c)(d) | | | 735,000 | | | | 815,644 | |
BNP Paribas S.A.
3.052%, due 1/13/31 (France) (a)(c) | | | 885,000 | | | | 932,164 | |
Citibank N.A.
3.40%, due 7/23/21 | | | 1,340,000 | | | | 1,379,962 | |
Citigroup, Inc. (United Kingdom) | | | | | | | | |
2.976%, due 11/5/30 (c) | | | 845,000 | | | | 899,257 | |
3.352%, due 4/24/25 (c) | | | 780,000 | | | | 842,774 | |
3.668%, due 7/24/28 (c) | | | 430,000 | | | | 479,422 | |
3.70%, due 1/12/26 | | | 545,000 | | | | 608,663 | |
3.98%, due 3/20/30 (c) | | | 565,000 | | | | 649,281 | |
4.05%, due 7/30/22 | | | 105,000 | | | | 111,349 | |
5.30%, due 5/6/44 | | | 436,000 | | | | 578,389 | |
6.625%, due 6/15/32 | | | 190,000 | | | | 260,515 | |
Citizens Financial Group, Inc.
4.30%, due 12/3/25 | | | 1,190,000 | | | | 1,331,513 | |
Credit Suisse Group A.G.
2.593%, due 9/11/25 (Switzerland) (a)(c) | | | 365,000 | | | | 377,475 | |
First Horizon National Corp.
4.00%, due 5/26/25 | | | 775,000 | | | | 810,517 | |
Goldman Sachs Group, Inc. | | | | | | | | |
1.562% (3 Month LIBOR + 1.17%), due 5/15/26 (b) | | | 815,000 | | | | 809,047 | |
2.60%, due 2/7/30 | | | 135,000 | | | | 141,560 | |
2.905%, due 7/24/23 (c) | | | 310,000 | | | | 322,062 | |
2.908%, due 6/5/23 (c) | | | 285,000 | | | | 295,441 | |
3.625%, due 1/22/23 | | | 1,330,000 | | | | 1,425,433 | |
5.25%, due 7/27/21 | | | 1,295,000 | | | | 1,359,759 | |
6.75%, due 10/1/37 | | | 159,000 | | | | 231,482 | |
HSBC Holdings PLC
3.973%, due 5/22/30 (United Kingdom) (c) | | | 465,000 | | | | 516,194 | |
Huntington Bancshares, Inc.
3.15%, due 3/14/21 | | | 1,295,000 | | | | 1,316,566 | |
| | | | | | |
The notes to the financial statements are an integral part of,
and should be read in conjunction with, the financial statements. | | | | | 13 | |
Portfolio of Investments June 30, 2020 (Unaudited) (continued)
| | | | | | | | |
| | | Principal
Amount | | | Value | |
| Corporate Bonds (continued) | |
Banks (continued) | |
JPMorgan Chase & Co. (c) | |
2.182%, due 6/1/28 | | $ | 1,250,000 | | | $ | 1,293,893 | |
2.956%, due 5/13/31 | | | 475,000 | | | | 503,777 | |
3.207%, due 4/1/23 | | | 1,540,000 | | | | 1,603,381 | |
3.54%, due 5/1/28 | | | 1,275,000 | | | | 1,423,014 | |
4.60%, due 2/1/25 (d) | | | 1,409,000 | | | | 1,257,533 | |
Lloyds Banking Group PLC (United Kingdom) | |
4.582%, due 12/10/25 | | | 508,000 | | | | 563,917 | |
4.65%, due 3/24/26 | | | 1,075,000 | | | | 1,195,543 | |
Morgan Stanley | |
3.125%, due 1/23/23 | | | 1,560,000 | | | | 1,654,076 | |
4.829% (3 Month LIBOR + 3.61%), due 10/15/20 (b)(d) | | | 645,000 | | | | 580,470 | |
4.875%, due 11/1/22 | | | 495,000 | | | | 538,294 | |
5.00%, due 11/24/25 | | | 1,150,000 | | | | 1,343,103 | |
6.25%, due 8/9/26 | | | 881,000 | | | | 1,127,493 | |
7.25%, due 4/1/32 | | | 100,000 | | | | 150,484 | |
PNC Bank N.A.
2.55%, due 12/9/21 | | | 815,000 | | | | 838,479 | |
PNC Financial Services Group, Inc.
2.55%, due 1/22/30 | | | 810,000 | | | | 875,411 | |
Royal Bank of Scotland Group PLC (United Kingdom) | |
3.073% (1 Year Treasury Constant Maturity Rate + 2.55%), due 5/22/28 (b) | | | 1,045,000 | | | | 1,099,843 | |
6.00%, due 12/19/23 | | | 70,000 | | | | 78,410 | |
Toronto-Dominion Bank
1.80%, due 7/13/21 (Canada) | | | 1,535,000 | | | | 1,557,282 | |
Truist Bank
2.636% (5 Year Treasury Constant Maturity Rate + 1.15%), due 9/17/29 (b) | | | 760,000 | | | | 759,676 | |
Truist Financial Corp.
4.95% (5 Year Treasury Constant Maturity Rate + 4.605%), due 9/1/25 (b)(d) | | | 940,000 | | | | 961,150 | |
Wachovia Corp.
5.50%, due 8/1/35 | | | 700,000 | | | | 913,452 | |
Wells Fargo & Co.
2.406%, due 10/30/25 (c) | | | 525,000 | | | | 546,524 | |
Wells Fargo Bank N.A. | |
2.60%, due 1/15/21 | | | 985,000 | | | | 996,909 | |
3.55%, due 8/14/23 | | | 1,015,000 | | | | 1,101,253 | |
| | | | | | | | |
| | | | | | | 48,547,175 | |
| | | | | | | | |
Beverages 0.2% | |
Anheuser-Busch Cos LLC / Anheuser-Busch InBev Worldwide, Inc.
4.70%, due 2/1/36 | | | 475,000 | | | | 559,585 | |
| | | | | | | | |
| | | Principal
Amount | | | Value | |
Beverages (continued) | |
Anheuser-Busch InBev Worldwide, Inc. (Belgium) | |
4.15%, due 1/23/25 | | $ | 250,000 | | | $ | 283,688 | |
4.75%, due 1/23/29 | | | 495,000 | | | | 598,106 | |
| | | | | | | | |
| | | | | | | 1,441,379 | |
| | | | | | | | |
Biotechnology 0.2% | |
Biogen, Inc.
3.625%, due 9/15/22 | | | 1,240,000 | | | | 1,317,442 | |
| | | | | | | | |
|
Building Materials 0.9% | |
Builders FirstSource, Inc. (a) | |
5.00%, due 3/1/30 | | | 1,020,000 | | | | 958,800 | |
6.75%, due 6/1/27 | | | 490,000 | | | | 501,637 | |
Carrier Global Corp.
2.493%, due 2/15/27 (a) | | | 1,100,000 | | | | 1,120,564 | |
Cemex S.A.B. de C.V.
3.125%, due 3/19/26 (Mexico) (a) | | EUR | 1,515,000 | | | | 1,548,947 | |
Standard Industries, Inc.
5.375%, due 11/15/24 (a) | | $ | 1,000,000 | | | | 1,027,500 | |
| | | | | | | | |
| | | | | | | 5,157,448 | |
| | | | | | | | |
Chemicals 0.7% | |
Air Liquide Finance S.A.
1.75%, due 9/27/21 (France) (a) | | | 610,000 | | | | 617,591 | |
Braskem Netherlands Finance B.V.
4.50%, due 1/10/28 (Netherlands) (a) | | | 745,000 | | | | 697,283 | |
Huntsman International LLC
4.50%, due 5/1/29 | | | 731,000 | | | | 769,068 | |
Orbia Advance Corp. S.A.B. de C.V.
4.00%, due 10/4/27 (Mexico) (a) | | | 625,000 | | | | 644,063 | |
PolyOne Corp.
5.75%, due 5/15/25 (a) | | | 1,218,000 | | | | 1,253,017 | |
| | | | | | | | |
| | | | | | | 3,981,022 | |
| | | | | | | | |
Commercial Services 0.7% | |
Ashtead Capital, Inc.
4.00%, due 5/1/28 (United Kingdom) (a) | | | 380,000 | | | | 378,100 | |
California Institute of Technology
3.65%, due 9/1/19 | | | 775,000 | | | | 856,043 | |
Cintas Corp. No 2
3.70%, due 4/1/27 | | | 1,065,000 | | | | 1,209,550 | |
Herc Holdings, Inc.
5.50%, due 7/15/27 (a) | | | 710,000 | | | | 711,526 | |
PayPal Holdings, Inc.
2.40%, due 10/1/24 | | | 1,120,000 | | | | 1,188,725 | |
| | | | | | | | |
| | | | | | | 4,343,944 | |
| | | | | | | | |
Computers 0.5% | |
Apple, Inc. | | | | | | | | |
1.55%, due 8/4/21 | | | 545,000 | | | | 553,002 | |
2.75%, due 1/13/25 | | | 715,000 | | | | 776,106 | |
| | | | |
| 14 | | MainStay VP Income Builder Portfolio | | The notes to the financial statements are an integral part of,
and should be read in conjunction with, the financial statements. |
| | | | | | | | |
| | | Principal
Amount | | | Value | |
| Corporate Bonds (continued) | |
Computers (continued) | |
Dell International LLC / EMC Corp. (a) | | | | | | | | |
4.90%, due 10/1/26 | | $ | 680,000 | | | $ | 750,313 | |
5.30%, due 10/1/29 | | | 318,000 | | | | 350,986 | |
8.10%, due 7/15/36 | | | 470,000 | | | | 619,807 | |
| | | | | | | | |
| | | | | | | 3,050,214 | |
| | | | | | | | |
Cosmetics & Personal Care 0.1% | |
Estee Lauder Cos., Inc.
2.60%, due 4/15/30 | | | 315,000 | | | | 342,709 | |
| | | | | | | | |
|
Distribution & Wholesale 0.3% | |
Performance Food Group, Inc.
5.50%, due 10/15/27 (a) | | | 1,893,000 | | | | 1,826,745 | |
| | | | | | | | |
|
Diversified Financial Services 1.8% | |
AerCap Ireland Capital DAC / AerCap Global Aviation Trust (Ireland) | | | | | | | | |
4.45%, due 12/16/21 | | | 285,000 | | | | 287,831 | |
4.625%, due 10/30/20 | | | 1,600,000 | | | | 1,606,960 | |
Air Lease Corp. | | | | | | | | |
2.30%, due 2/1/25 | | | 1,215,000 | | | | 1,161,978 | |
2.75%, due 1/15/23 | | | 500,000 | | | | 495,438 | |
3.50%, due 1/15/22 | | | 340,000 | | | | 343,536 | |
4.25%, due 9/15/24 | | | 420,000 | | | | 426,462 | |
Allied Universal Holdco LLC / Allied Universal Finance Corp.
6.625%, due 7/15/26 (a) | | | 650,000 | | | | 682,500 | |
Ally Financial, Inc. | | | | | | | | |
3.875%, due 5/21/24 | | | 310,000 | | | | 320,532 | |
8.00%, due 11/1/31 | | | 1,130,000 | | | | 1,458,067 | |
Avolon Holdings Funding, Ltd.
2.875%, due 2/15/25 (a) | | | 1,040,000 | | | | 872,724 | |
Capital One Financial Corp.
4.20%, due 10/29/25 | | | 165,000 | | | | 183,286 | |
Caterpillar Financial Services Corp.
2.90%, due 3/15/21 | | | 1,735,000 | | | | 1,767,462 | |
Charles Schwab Corp.
5.375% (5 Year Treasury Constant Maturity Rate + 4.971%), due 6/1/25 (b)(d) | | | 1,000,000 | | | | 1,068,320 | |
| | | | | | | | |
| | | | | | | 10,675,096 | |
| | | | | | | | |
Electric 1.0% | |
Connecticut Light & Power Co.
4.00%, due 4/1/48 | | | 450,000 | | | | 548,876 | |
Duke Energy Ohio, Inc.
4.30%, due 2/1/49 | | | 565,000 | | | | 715,070 | |
Duquesne Light Holdings, Inc.
3.616%, due 8/1/27 (a) | | | 865,000 | | | | 882,403 | |
| | | | | | | | |
| | | Principal
Amount | | | Value | |
Electric (continued) | |
Entergy Louisiana LLC
4.00%, due 3/15/33 | | $ | 790,000 | | | $ | 970,176 | |
Evergy, Inc.
5.292%, due 6/15/22 (e) | | | 500,000 | | | | 533,853 | |
Public Service Electric & Gas Co.
3.00%, due 5/15/27 | | | 800,000 | | | | 882,209 | |
Puget Energy, Inc.
5.625%, due 7/15/22 | | | 350,000 | | | | 373,036 | |
Southern California Edison Co. | | | | | | | | |
3.70%, due 8/1/25 | | | 330,000 | | | | 364,534 | |
4.00%, due 4/1/47 | | | 520,000 | | | | 592,562 | |
WEC Energy Group, Inc.
2.505% (3 Month LIBOR + 2.113%), due 5/15/67 (b) | | | 480,000 | | | | 379,200 | |
| | | | | | | | |
| | | | | | | 6,241,919 | |
| | | | | | | | |
Environmental Controls 0.2% | |
Republic Services, Inc.
4.75%, due 5/15/23 | | | 580,000 | | | | 642,808 | |
Waste Management, Inc.
2.40%, due 5/15/23 | | | 810,000 | | | | 846,545 | |
| | | | | | | | |
| | | | | | | 1,489,353 | |
| | | | | | | | |
Food 1.6% | |
JBS USA LUX S.A. / JBS Food Co. / JBS USA Finance, Inc.
5.50%, due 1/15/30 (a) | | | 485,000 | | | | 497,125 | |
Kerry Group Financial Services Unlimited Co.
3.20%, due 4/9/23 (Ireland) (a) | | | 1,290,000 | | | | 1,348,358 | |
Kraft Heinz Foods Co. | | | | | | | | |
4.25%, due 3/1/31 (a) | | | 1,267,000 | | | | 1,343,392 | |
5.00%, due 7/15/35 | | | 501,000 | | | | 551,242 | |
Mondelez International Holdings Netherlands B.V.
2.00%, due 10/28/21 (Netherlands) (a) | | | 1,110,000 | | | | 1,129,600 | |
Nestle Holdings, Inc.
3.10%, due 9/24/21 (a) | | | 1,615,000 | | | | 1,665,263 | |
Smithfield Foods, Inc.
3.35%, due 2/1/22 (a) | | | 565,000 | | | | 560,641 | |
Sysco Corp.
3.30%, due 2/15/50 | | | 465,000 | | | | 437,910 | |
Tyson Foods, Inc.
3.95%, due 8/15/24 | | | 965,000 | | | | 1,068,513 | |
U.S. Foods, Inc.
6.25%, due 4/15/25 (a) | | | 830,000 | | | | 844,525 | |
| | | | | | | | |
| | | | | | | 9,446,569 | |
| | | | | | | | |
Food Services 0.1% | |
Aramark Services, Inc.
6.375%, due 5/1/25 (a) | | | 757,000 | | | | 781,701 | |
| | | | | | | | |
| | | | | | |
The notes to the financial statements are an integral part of,
and should be read in conjunction with, the financial statements. | | | | | 15 | |
Portfolio of Investments June 30, 2020 (Unaudited) (continued)
| | | | | | | | |
| | | Principal
Amount | | | Value | |
| Corporate Bonds (continued) | |
Gas 0.1% | |
Southern California Gas Co.
4.30%, due 1/15/49 | | $ | 325,000 | | | $ | 413,403 | |
| | | | | | | | |
|
Health Care—Products 0.1% | |
Abbott Laboratories
3.40%, due 11/30/23 | | | 535,000 | | | | 582,673 | |
| | | | | | | | |
|
Health Care—Services 0.6% | |
Cigna Holding Co.
4.375%, due 12/15/20 | | | 135,000 | | | | 136,064 | |
Health Care Service Corp. A Mutual Legal Reserve Co.
2.20%, due 6/1/30 (a) | | | 1,685,000 | | | | 1,686,951 | |
Laboratory Corp. of America Holdings
2.30%, due 12/1/24 | | | 1,225,000 | | | | 1,289,583 | |
NYU Langone Hospitals
3.38%, due 7/1/55 | | | 630,000 | | | | 607,977 | |
| | | | | | | | |
| | | | | | | 3,720,575 | |
| | | | | | | | |
Holding Company—Diversified 0.2% | |
CK Hutchison International (17) II, Ltd.
3.25%, due 9/29/27 (Hong Kong) (a) | | | 925,000 | | | | 992,833 | |
| | | | | | | | |
|
Insurance 1.9% | |
Equitable Holdings, Inc.
5.00%, due 4/20/48 | | | 830,000 | | | | 949,613 | |
Jackson National Life Global Funding
0.795% (3 Month LIBOR + 0.48%), due 6/11/21 (a)(b) | | | 1,895,000 | | | | 1,899,910 | |
Liberty Mutual Group, Inc.
4.25%, due 6/15/23 (a) | | | 295,000 | | | | 320,196 | |
MassMutual Global Funding II (a) | | | | | | | | |
2.50%, due 10/17/22 | | | 1,270,000 | | | | 1,324,128 | |
2.95%, due 1/11/25 | | | 365,000 | | | | 395,770 | |
Peachtree Corners Funding Trust
3.976%, due 2/15/25 (a) | | | 425,000 | | | | 464,219 | |
Pricoa Global Funding I
2.55%, due 11/24/20 (a) | | | 765,000 | | | | 771,371 | |
Principal Life Global Funding II
2.375%, due 11/21/21 (a) | | | 1,470,000 | | | | 1,503,402 | |
Protective Life Corp.
8.45%, due 10/15/39 | | | 725,000 | | | | 1,115,597 | |
Reliance Standard Life Global Funding II
2.50%, due 10/30/24 (United Kingdom) (a) | | | 950,000 | | | | 978,685 | |
Voya Financial, Inc.
3.65%, due 6/15/26 | | | 310,000 | | | | 343,539 | |
Willis North America, Inc. | | | | | | | | |
2.95%, due 9/15/29 | | | 1,395,000 | | | | 1,476,688 | |
3.875%, due 9/15/49 | | | 185,000 | | | | 204,075 | |
| | | | | | | | |
| | | | | | | 11,747,193 | |
| | | | | | | | |
| | | | | | | | |
| | | Principal
Amount | | | Value | |
Internet 0.8% | |
Equinix, Inc.
1.25%, due 7/15/25 | | $ | 710,000 | | | $ | 709,822 | |
Expedia Group, Inc. | | | | | | | | |
3.25%, due 2/15/30 | | | 1,305,000 | | | | 1,216,710 | |
3.80%, due 2/15/28 | | | 157,000 | | | | 150,379 | |
5.00%, due 2/15/26 | | | 22,000 | | | | 22,643 | |
6.25%, due 5/1/25 (a) | | | 200,000 | | | | 213,055 | |
Tencent Holdings, Ltd. (China) (a) | | | | | | | | |
3.595%, due 1/19/28 | | | 440,000 | | | | 479,585 | |
3.925%, due 1/19/38 | | | 675,000 | | | | 757,963 | |
Weibo Corp. (China) | | | | | | | | |
3.375%, due 7/8/30 | | | 715,000 | | | | 710,260 | |
3.50%, due 7/5/24 | | | 465,000 | | | | 480,843 | |
| | | | | | | | |
| | | | | | | 4,741,260 | |
| | | | | | | | |
Iron & Steel 0.3% | |
ArcelorMittal S.A.
4.55%, due 3/11/26 (Luxembourg) | | | 800,000 | | | | 810,739 | |
Vale Overseas, Ltd. (Brazil) | | | | | | | | |
6.25%, due 8/10/26 | | | 435,000 | | | | 511,669 | |
6.875%, due 11/21/36 | | | 305,000 | | | | 398,483 | |
| | | | | | | | |
| | | | | | | 1,720,891 | |
| | | | | | | | |
Lodging 0.7% | |
Boyd Gaming Corp.
8.625%, due 6/1/25 (a) | | | 252,000 | | | | 263,340 | |
Hilton Domestic Operating Co., Inc. | | | | | | | | |
4.875%, due 1/15/30 | | | 695,000 | | | | 684,575 | |
5.75%, due 5/1/28 (a) | | | 315,000 | | | | 318,150 | |
Las Vegas Sands Corp.
3.20%, due 8/8/24 | | | 555,000 | | | | 553,085 | |
Marriott International, Inc. | | | | | | | | |
2.30%, due 1/15/22 | | | 890,000 | | | | 883,094 | |
3.60%, due 4/15/24 | | | 920,000 | | | | 925,048 | |
Sands China, Ltd. (Macao) | | | | | | | | |
4.60%, due 8/8/23 | | | 355,000 | | | | 373,744 | |
5.125%, due 8/8/25 | | | 460,000 | | | | 498,323 | |
| | | | | | | | |
| | | | | | | 4,499,359 | |
| | | | | | | | |
Machinery—Diversified 0.4% | |
CNH Industrial Capital LLC | | | | | | | | |
4.20%, due 1/15/24 | | | 545,000 | | | | 580,699 | |
4.875%, due 4/1/21 | | | 1,445,000 | | | | 1,482,565 | |
John Deere Capital Corp.
3.65%, due 10/12/23 | | | 135,000 | | | | 148,433 | |
| | | | | | | | |
| | | | | | | 2,211,697 | |
| | | | | | | | |
Media 0.8% | |
CCO Holdings LLC / CCO Holdings Capital Corp.
5.875%, due 4/1/24 (a) | | | 619,000 | | | | 638,344 | |
Comcast Corp. | | | | | | | | |
3.25%, due 11/1/39 | | | 675,000 | | | | 748,772 | |
4.70%, due 10/15/48 | | | 555,000 | | | | 746,432 | |
| | | | |
| 16 | | MainStay VP Income Builder Portfolio | | The notes to the financial statements are an integral part of,
and should be read in conjunction with, the financial statements. |
| | | | | | | | |
| | | Principal
Amount | | | Value | |
| Corporate Bonds (continued) | |
Media (continued) | |
Diamond Sports Group LLC / Diamond Sports Finance Co.
6.625%, due 8/15/27 (a)(f) | | $ | 1,330,000 | | | $ | 708,225 | |
Grupo Televisa S.A.B.
5.25%, due 5/24/49 (Mexico) | | | 480,000 | | | | 555,766 | |
Sirius XM Radio, Inc.
4.125%, due 7/1/30 (a) | | | 955,000 | | | | 944,457 | |
Sky, Ltd.
3.75%, due 9/16/24 (United Kingdom) (a) | | | 340,000 | | | | 378,596 | |
Time Warner Entertainment Co., L.P.
8.375%, due 3/15/23 | | | 355,000 | | | | 415,979 | |
| | | | | | | | |
| | | | | | | 5,136,571 | |
| | | | | | | | |
Metal Fabricate & Hardware 0.3% | |
Precision Castparts Corp.
3.25%, due 6/15/25 | | | 1,455,000 | | | | 1,613,904 | |
| | | | | | | | |
|
Mining 0.2% | |
Anglo American Capital PLC
4.875%, due 5/14/25 (United Kingdom) (a) | | | 455,000 | | | | 506,654 | |
Corp. Nacional del Cobre de Chile
3.00%, due 9/30/29 (Chile) (a) | | | 635,000 | | | | 656,804 | |
| | | | | | | | |
| | | | | | | 1,163,458 | |
| | | | | | | | |
Miscellaneous—Manufacturing 0.6% | |
General Electric Co. | | | | | | | | |
3.625%, due 5/1/30 | | | 645,000 | | | | 645,729 | |
4.25%, due 5/1/40 | | | 705,000 | | | | 701,530 | |
4.35%, due 5/1/50 | | | 550,000 | | | | 543,953 | |
Siemens Financieringsmaatschappij N.V.
2.70%, due 3/16/22 (Germany) (a) | | | 760,000 | | | | 788,936 | |
Textron Financial Corp.
2.127% (3 Month LIBOR + 1.735%), due 2/15/67 (a)(b) | | | 1,295,000 | | | | 809,375 | |
| | | | | | | | |
| | | | | | | 3,489,523 | |
| | | | | | | | |
Oil & Gas 1.2% | |
BP Capital Markets America, Inc.
3.00%, due 2/24/50 | | | 345,000 | | | | 339,019 | |
BP Capital Markets PLC
4.875% (5 Year Treasury Constant Maturity Rate + 4.398%), due 3/22/30 (United Kingdom) (b)(d) | | | 1,120,000 | | | | 1,156,400 | |
Gazprom PJSC Via Gaz Capital S.A.
7.288%, due 8/16/37 (a) (Luxembourg) | | | 640,000 | | | | 919,307 | |
Marathon Petroleum Corp. | | | | | | | | |
4.50%, due 5/1/23 | | | 620,000 | | | | 668,179 | |
4.70%, due 5/1/25 | | | 675,000 | | | | 755,635 | |
5.125%, due 12/15/26 | | | 450,000 | | | | 517,788 | |
| | | | | | | | |
| | | Principal
Amount | | | Value | |
Oil & Gas (continued) | |
Total Capital International S.A.
3.127%, due 5/29/50 (France) | | $ | 975,000 | | | $ | 1,000,320 | |
Valero Energy Corp. | | | | | | | | |
3.65%, due 3/15/25 | | | 1,000,000 | | | | 1,085,898 | |
6.625%, due 6/15/37 | | | 415,000 | | | | 551,876 | |
WPX Energy, Inc.
4.50%, due 1/15/30 | | | 465,000 | | | | 409,200 | |
| | | | | | | | |
| | | | | | | 7,403,622 | |
| | | | | | | | |
Packaging & Containers 0.4% | |
Berry Global, Inc.
4.875%, due 7/15/26 (a) | | | 84,000 | | | | 85,260 | |
Owens Brockway Glass Container, Inc.
6.625%, due 5/13/27 (a) | | | 1,135,000 | | | | 1,180,400 | |
Reynolds Group Issuer, Inc. / Reynolds Group Issuer LLC
5.125%, due 7/15/23 (a) (New Zealand) | | | 1,060,000 | | | | 1,068,045 | |
| | | | | | | | |
| | | | | | | 2,333,705 | |
| | | | | | | | |
Pharmaceuticals 0.9% | |
AbbVie, Inc. (a) | | | | | | | | |
3.45%, due 3/15/22 | | | 1,005,000 | | | | 1,045,260 | |
4.05%, due 11/21/39 | | | 1,125,000 | | | | 1,315,642 | |
Bausch Health Cos., Inc. (a) | | | | | | | | |
5.75%, due 8/15/27 | | | 465,000 | | | | 492,900 | |
6.25%, due 2/15/29 | | | 555,000 | | | | 557,775 | |
Becton Dickinson & Co.
4.669%, due 6/6/47 | | | 635,000 | | | | 778,627 | |
Bristol-Myers Squibb Co.
3.625%, due 5/15/24 (a) | | | 1,400,000 | | | | 1,541,779 | |
| | | | | | | | |
| | | | | | | 5,731,983 | |
| | | | | | | | |
Pipelines 0.6% | |
Enterprise Products Operating LLC | | | | | | | | |
3.125%, due 7/31/29 | | | 630,000 | | | | 674,354 | |
3.95%, due 1/31/60 | | | 595,000 | | | | 613,149 | |
4.20%, due 1/31/50 | | | 160,000 | | | | 178,521 | |
Spectra Energy Partners, L.P.
4.75%, due 3/15/24 | | | 795,000 | | | | 887,943 | |
Transcontinental Gas Pipe Line Co. LLC
4.60%, due 3/15/48 | | | 840,000 | | | | 955,188 | |
Western Midstream Operating, L.P.
5.25%, due 2/1/50 | | | 350,000 | | | | 302,855 | |
| | | | | | | | |
| | | | | | | 3,612,010 | |
| | | | | | | | |
Real Estate Investment Trusts 1.5% | |
Alexandria Real Estate Equities, Inc.
3.375%, due 8/15/31 | | | 825,000 | | | | 920,749 | |
American Tower Corp. | | | | | | | | |
3.375%, due 10/15/26 | | | 705,000 | | | | 784,114 | |
3.60%, due 1/15/28 | | | 375,000 | | | | 418,382 | |
Crown Castle International Corp. | | | | | | | | |
3.40%, due 2/15/21 | | | 920,000 | | | | 934,421 | |
5.25%, due 1/15/23 | | | 1,290,000 | | | | 1,435,459 | |
| | | | | | |
The notes to the financial statements are an integral part of,
and should be read in conjunction with, the financial statements. | | | | | 17 | |
Portfolio of Investments June 30, 2020 (Unaudited) (continued)
| | | | | | | | |
| | | Principal
Amount | | | Value | |
| Corporate Bonds (continued) | |
Real Estate Investment Trusts (continued) | |
Digital Realty Trust, L.P. | | | | | | | | |
2.75%, due 2/1/23 | | $ | 45,000 | | | $ | 47,164 | |
3.70%, due 8/15/27 | | | 1,295,000 | | | | 1,477,347 | |
Equinix, Inc.
2.625%, due 11/18/24 | | | 740,000 | | | | 787,819 | |
GLP Capital, L.P. / GLP Financing II, Inc.
3.35%, due 9/1/24 | | | 505,000 | | | | 504,596 | |
Iron Mountain, Inc.
5.25%, due 7/15/30 (a) | | | 720,000 | | | | 709,200 | |
Kilroy Realty, L.P.
3.45%, due 12/15/24 | | | 720,000 | | | | 754,773 | |
| | | | | | | | |
| | | | | | | 8,774,024 | |
| | | | | | | | |
Retail 1.1% | |
AutoNation, Inc.
4.75%, due 6/1/30 | | | 280,000 | | | | 303,399 | |
CVS Health Corp. | |
4.00%, due 12/5/23 | | | 1,355,000 | | | | 1,486,330 | |
4.78%, due 3/25/38 | | | 400,000 | | | | 497,041 | |
CVS Pass-Through Trust
5.789%, due 1/10/26 (a) | | | 27,472 | | | | 29,441 | |
Macy’s, Inc.
8.375%, due 6/15/25 (a) | | | 1,370,000 | | | | 1,363,821 | |
McDonald’s Corp.
3.35%, due 4/1/23 | | | 1,085,000 | | | | 1,162,877 | |
O’Reilly Automotive, Inc.
3.55%, due 3/15/26 | | | 1,000,000 | | | | 1,132,133 | |
Starbucks Corp. | |
3.35%, due 3/12/50 | | | 375,000 | | | | 381,927 | |
4.45%, due 8/15/49 | | | 475,000 | | | | 574,001 | |
| | | | | | | | |
| | | | | | | 6,930,970 | |
| | | | | | | | |
Semiconductors 0.5% | |
Broadcom, Inc.
3.125%, due 10/15/22 (a) | | | 945,000 | | | | 984,363 | |
Intel Corp.
4.75%, due 3/25/50 | | | 515,000 | | | | 726,026 | |
NXP B.V. / NXP Funding LLC (Netherlands) (a) | |
3.40%, due 5/1/30 | | | 555,000 | | | | 597,151 | |
4.625%, due 6/15/22 | | | 590,000 | | | | 628,534 | |
| | | | | | | | |
| | | | | | | 2,936,074 | |
| | | | | | | | |
Software 0.3% | |
Fiserv, Inc. | |
2.75%, due 7/1/24 | | | 325,000 | | | | 346,552 | |
3.20%, due 7/1/26 | | | 205,000 | | | | 226,896 | |
salesforce.com, Inc. | |
3.25%, due 4/11/23 | | | 510,000 | | | | 548,099 | |
3.70%, due 4/11/28 | | | 690,000 | | | | 805,476 | |
| | | | | | | | |
| | | | | | | 1,927,023 | |
| | | | | | | | |
| | | | | | | | |
| | | Principal
Amount | | | Value | |
Telecommunications 1.7% | |
AT&T, Inc. | |
2.875% (EUAM DB05 + 3.14%), due 3/2/25 (b)(d) | | EUR | 800,000 | | | $ | 851,025 | |
4.35%, due 3/1/29 | | $ | 320,000 | | | | 373,106 | |
4.90%, due 8/15/37 | | | 670,000 | | | | 805,212 | |
CommScope Technologies LLC
6.00%, due 6/15/25 (a) | | | 475,000 | | | | 458,708 | |
CommScope, Inc. (a) | |
5.00%, due 6/15/21 | | | 76,000 | | | | 76,000 | |
7.125%, due 7/1/28 | | | 1,080,000 | | | | 1,077,408 | |
Crown Castle Towers LLC
4.241%, due 7/15/48 (a) | | | 990,000 | | | | 1,132,639 | |
Level 3 Financing, Inc.
3.40%, due 3/1/27 (a) | | | 1,050,000 | | | | 1,110,333 | |
Sprint Communications, Inc.
6.00%, due 11/15/22 | | | 24,000 | | | | 25,314 | |
Sprint Spectrum Co. LLC / Sprint Spectrum Co. II LLC / Sprint Spectrum Co. III LLC
4.738%, due 9/20/29 (a) | | | 1,545,000 | | | | 1,676,665 | |
T-Mobile USA, Inc.
4.50%, due 4/15/50 (a) | | | 430,000 | | | | 511,799 | |
Telefonica Emisiones S.A.
5.462%, due 2/16/21 (Spain) | | | 175,000 | | | | 180,165 | |
Verizon Communications, Inc.
1.492% (3 Month LIBOR + 1.10%), due 5/15/25 (b) | | | 985,000 | | | | 996,997 | |
Vodafone Group PLC
4.25%, due 9/17/50 | | | 685,000 | | | | 815,685 | |
| | | | | | | | |
| | | | | | | 10,091,056 | |
| | | | | | | | |
Textiles, Apparel & Luxury Goods 0.1% | |
Hanesbrands, Inc.
5.375%, due 5/15/25 (Canada) (a) | | | 565,000 | | | | 571,356 | |
| | | | | | | | |
|
Toys, Games & Hobbies 0.1% | |
Hasbro, Inc.
2.60%, due 11/19/22 | | | 500,000 | | | | 517,466 | |
| | | | | | | | |
|
Transportation 0.0%‡ | |
XPO Logistics, Inc.
6.50%, due 6/15/22 (a) | | | 277,000 | | | | 277,346 | |
| | | | | | | | |
Total Corporate Bonds
(Cost $199,205,355) | | | | 207,784,549 | |
| | | | | | | | |
| | | | |
| 18 | | MainStay VP Income Builder Portfolio | | The notes to the financial statements are an integral part of,
and should be read in conjunction with, the financial statements. |
| | | | | | | | |
| | | Principal
Amount | | | Value | |
| Foreign Bonds 0.1% | |
Banks 0.1% | |
Barclays Bank PLC
Series Reg S
10.00%, due 5/21/21 (United Kingdom) | | GBP | 525,000 | | | $ | 695,810 | |
| | | | | | | | |
Total Foreign Bonds
(Cost $835,470) | | | | 695,810 | |
| | | | | | | | |
|
| Foreign Government Bonds 0.5% | |
Brazil 0.2% | |
Brazilian Government International Bond
4.625%, due 1/13/28 (Brazil) | | $ | 1,161,000 | | | | 1,213,837 | |
| | | | | | | | |
|
Mexico 0.3% | |
Mexico Government International Bond
3.25%, due 4/16/30 (Mexico) (f) | | | 2,031,000 | | | | 2,012,721 | |
| | | | | | | | |
Total Foreign Government Bonds
(Cost $3,241,052) | | | | 3,226,558 | |
| | | | | | | | |
|
| Loan Assignments 1.0% (b) | |
Buildings & Real Estate 0.2% | |
Realogy Group LLC
2018 Term Loan B
3.00% (3 Month LIBOR + 2.25%),
due 2/8/25 | | | 1,241,395 | | | | 1,140,531 | |
| | | | | | | | |
|
Containers, Packaging & Glass 0.2% | |
BWAY Holding Co.
2017 Term Loan B
4.561% (3 Month LIBOR + 3.25%), due 4/3/24 | | | 1,270,179 | | | | 1,134,905 | |
| | | | | | | | |
|
Ecological 0.2% | |
Advanced Disposal Services, Inc.
Term Loan B3
3.00% (1 Week LIBOR + 2.25%), due 11/10/23 | | | 1,604,927 | | | | 1,584,464 | |
| | | | | | | | |
|
Finance 0.2% | |
Alliant Holdings Intermediate LLC
2018 Term Loan B
2.928% (1 Month LIBOR + 2.75%), due 5/9/25 | | | 1,265,316 | | | | 1,192,561 | |
| | | | | | | | |
|
Personal & Nondurable Consumer Products (Manufacturing Only) 0.1% | |
Prestige Brands, Inc.
Term Loan B4
2.178% (1 Month LIBOR + 2.00%), due 1/26/24 | | | 472,571 | | | | 464,301 | |
| | | | | | | | |
| | | | | | | | |
| | | Principal
Amount | | | Value | |
Telecommunications 0.1% | |
Level 3 Financing, Inc.
2019 Term Loan B
1.928% (1 Month LIBOR + 1.75%), due 3/1/27 | | $ | 718,508 | | | $ | 677,194 | |
| | | | | | | | |
Total Loan Assignments
(Cost $6,467,160) | | | | 6,193,956 | |
| | | | | | | | |
|
| Mortgage-Backed Securities 5.7% | |
Agency (Collateralized Mortgage Obligations) 2.4% | |
Federal Home Loan Mortgage Corporation | |
REMIC, Series 4926, Class BP
3.00%, due 10/25/49 | | | 1,975,000 | | | | 2,099,512 | |
REMIC Series 4888, Class BA
3.50%, due 9/15/48 | | | 566,810 | | | | 587,981 | |
REMIC Series 4877, Class AT
3.50%, due 11/15/48 | | | 798,917 | | | | 848,260 | |
REMIC Series 4877, Class BE
3.50%, due 11/15/48 | | | 1,300,900 | | | | 1,382,818 | |
REMIC, Series 4958, Class DL
4.00%, due 1/25/50 | | | 1,775,000 | | | | 1,949,570 | |
Federal National Mortgage Association | |
REMIC, Series 2013-77, Class CY
3.00%, due 7/25/43 | | | 746,000 | | | | 813,789 | |
REMIC, Series 2019-13, Class PE
3.00%, due 3/25/49 | | | 862,347 | | | | 915,182 | |
REMIC Series 2019-13, Class CA
3.50%, due 4/25/49 | | | 1,202,438 | | | | 1,305,297 | |
REMIC, Series 2020-10, Class DA
3.50%, due 3/25/60 | | | 1,140,304 | | | | 1,245,418 | |
Government National Mortgage Association
Series 2013-149, Class BA
3.25%, due 8/16/41 | | | 2,281,932 | | | | 2,441,745 | |
Seasoned Loans Structured Transaction Trust
Series 2019-1, Class A1
3.50%, due 5/25/29 | | | 626,771 | | | | 681,928 | |
| | | | | | | | |
| | | | | | | 14,271,500 | |
| | | | | | | | |
Commercial Mortgage Loans
(Collateralized Mortgage Obligations) 3.0% | |
BANK | |
Series 2019-BN21, Class A5
2.851%, due 10/17/52 | | | 1,200,000 | | | | 1,313,018 | |
Series 2019-BN19, Class A2
2.926%, due 8/15/61 | | | 1,205,000 | | | | 1,324,531 | |
Bayview Commercial Asset Trust
Series 2006-4A, Class A1
0.415% (1 Month LIBOR + 0.23%), due 12/25/36 (a)(b) | | | 44,071 | | | | 39,845 | |
| | | | | | |
The notes to the financial statements are an integral part of,
and should be read in conjunction with, the financial statements. | | | | | 19 | |
Portfolio of Investments June 30, 2020 (Unaudited) (continued)
| | | | | | | | |
| | | Principal
Amount | | | Value | |
| Mortgage-Backed Securities (continued) | |
Commercial Mortgage Loans
(Collateralized Mortgage Obligations) (continued) | |
Benchmark Mortgage Trust
Series 2019-B12, Class A5
3.116%, due 8/15/52 | | $ | 1,119,000 | | | $ | 1,239,879 | |
BX Commercial Mortgage Trust (a) | |
Series 2018-BILT, Class A
0.985% (1 Month LIBOR + 0.80%), due 5/15/30 (b) | | | 850,000 | | | | 803,188 | |
Series 2018-GW, Class A
0.985% (1 Month LIBOR + 0.80%), due 5/15/35 (b) | | | 760,000 | | | | 720,040 | |
Series 2019-OC11, Class A
3.202%, due 12/9/41 | | | 515,000 | | | | 536,506 | |
Series 2019-0C11, Class B
3.605%, due 12/9/41 | | | 360,000 | | | | 361,844 | |
Series 2019-0C11, Class C
3.856%, due 12/9/41 | | | 990,000 | | | | 942,737 | |
CSAIL Commercial Mortgage Trust
Series 2015-C3, Class A4
3.718%, due 8/15/48 | | | 415,000 | | | | 454,199 | |
Four Times Square Trust
Series 2006-4TS, Class A
5.401%, due 12/13/28 (a) | | | 439,062 | | | | 442,974 | |
FREMF Mortgage Trust (a)(g) | |
Series 2015-K720, Class B
3.51%, due 7/25/22 | | | 460,000 | | | | 474,788 | |
Series 2013-K33, Class B
3.614%, due 8/25/46 | | | 1,094,000 | | | | 1,147,072 | |
Series 2014-K41, Class B
3.963%, due 11/25/47 | | | 330,000 | | | | 354,600 | |
Series 2013-K35, Class B
4.073%, due 12/25/46 | | | 345,000 | | | | 370,389 | |
GS Mortgage Securities Trust | |
Series 2019-GC42, Class A4
3.001%, due 9/1/52 | | | 475,000 | | | | 523,228 | |
Series 2019-GC40, Class A4
3.16%, due 7/10/52 | | | 788,000 | | | | 871,834 | |
Hawaii Hotel Trust
Series 2019-MAUI, Class A
1.335% (1 Month LIBOR + 1.15%), due 5/15/38 (a)(b) | | | 555,000 | | | | 534,901 | |
Hudson Yards Mortgage Trust
Series 2019-30HY, Class A
3.228%, due 7/10/39 (a) | | | 560,000 | | | | 625,661 | |
JP Morgan Chase Commercial Mortgage Securities Trust
Series 2013-C16, Class A4
4.166%, due 12/15/46 | | | 880,000 | | | | 950,928 | |
| | | | | | | | |
| | | Principal
Amount | | | Value | |
Commercial Mortgage Loans
(Collateralized Mortgage Obligations) (continued) | |
Morgan Stanley Bank of America Merrill Lynch Trust
Series-2015-C23, Class A3
3.451%, due 7/15/50 | | $ | 485,000 | | | $ | 522,577 | |
One Bryant Park Trust
Series 2019-OBP, Class A
2.516%, due 9/15/54 (a) | | | 1,030,000 | | | | 1,089,891 | |
Wells Fargo Commercial Mortgage Trust (a)(g) | |
Series 2018-1745, Class A
3.874%, due 6/15/36 | | | 940,000 | | | | 1,036,817 | |
Series 2018-AUS, Class A
4.194%, due 8/17/36 | | | 1,200,000 | | | | 1,305,672 | |
| | | | | | | | |
| | | | | | | 17,987,119 | |
| | | | | | | | |
Whole Loan (Collateralized Mortgage Obligations) 0.3% | |
Chase Home Lending Mortgage Trust (a)(h) | |
Series 2019-ATR2, Class A3
3.50%, due 7/25/49 | | | 156,456 | | | | 160,260 | |
Series 2019-ATR1, Class A4
4.00%, due 4/25/49 | | | 311,393 | | | | 313,909 | |
JP Morgan Mortgage Trust (a)(h) | |
Series 2019-3, Class A3
4.00%, due 9/25/49 | | | 245,746 | | | | 252,935 | |
Series 2019-5, Class A4
4.00%, due 11/25/49 | | | 163,469 | | | | 165,087 | |
Wells Fargo Mortgage Backed Securities Trust
Series 2020-2, Class A1
3.00%, due 12/25/49 (a)(h)(i) | | | 1,070,000 | | | | 1,102,769 | |
| | | | | | | | |
| | | | | | | 1,994,960 | |
| | | | | | | | |
Total Mortgage-Backed Securities
(Cost $33,023,159) | | | | 34,253,579 | |
| | | | | | | | |
|
| Municipal Bonds 0.2% | |
California 0.2% | |
Regents of the University of California Medical Center Pooled Revenue, Revenue Bonds
Series N
3.006%, due 5/15/50 | | | 1,115,000 | | | | 1,133,408 | |
| | | | | | | | |
|
New York 0.0%‡ | |
New York State Thruway Authority, Revenue Bonds
Series M
2.90%, due 1/1/35 | | | 175,000 | | | | 188,295 | |
| | | | | | | | |
Total Municipal Bonds
(Cost $1,290,000) | | | | 1,321,703 | |
| | | | | | | | |
| | | | |
| 20 | | MainStay VP Income Builder Portfolio | | The notes to the financial statements are an integral part of,
and should be read in conjunction with, the financial statements. |
| | | | | | | | |
| | | Principal
Amount | | | Value | |
| U.S. Government & Federal Agencies 10.6% | |
Federal Home Loan Mortgage Corporation
(Mortgage Pass-Through Securities) 1.8% | |
2.00%, due 6/1/50 | | $ | 1,257,298 | | | $ | 1,287,052 | |
2.50%, due 1/1/40 | | | 337,144 | | | | 351,699 | |
2.50%, due 4/1/50 | | | 752,968 | | | | 785,120 | |
2.50%, due 5/1/50 | | | 735,607 | | | | 766,656 | |
3.50%, due 1/1/48 | | | 3,730,223 | | | | 3,976,704 | |
4.00%, due 2/1/49 | | | 500,737 | | | | 535,115 | |
5.00%, due 12/1/44 | | | 1,333,184 | | | | 1,528,841 | |
5.00%, due 12/1/48 | | | 1,470,447 | | | | 1,606,065 | |
| | | | | | | | |
| | | | | | | 10,837,252 | |
| | | | | | | | |
Federal National Mortgage Association
(Mortgage Pass-Through Securities) 3.4% | |
2.00%, due 5/1/35 | | | 2,026,165 | | | | 2,097,157 | |
2.00%, due 6/1/50 | | | 269,442 | | | | 274,679 | |
2.50%, due 2/1/40 | | | 341,616 | | | | 356,303 | |
2.50%, due 5/1/50 | | | 828,526 | | | | 863,742 | |
2.50%, due 6/1/50 | | | 2,334,955 | | | | 2,433,509 | |
3.00%, due 3/1/50 | | | 1,408,364 | | | | 1,492,141 | |
3.00%, due 4/1/50 | | | 1,326,610 | | | | 1,398,600 | |
3.00%, due 5/1/50 | | | 1,879,585 | | | | 1,981,580 | |
3.50%, due 3/1/37 | | | 1,804,809 | | | | 1,949,793 | |
3.50%, due 2/1/42 | | | 1,402,520 | | | | 1,514,891 | |
4.00%, due 5/1/48 | | | 1,316,998 | | | | 1,396,836 | |
4.00%, due 9/1/48 | | | 2,111,305 | | | | 2,277,913 | |
4.00%, due 1/1/49 | | | 497,734 | | | | 536,835 | |
4.00%, due 2/1/49 | | | 437,615 | | | | 467,387 | |
5.00%, due 9/1/33 | | | 1,624,616 | | | | 1,859,752 | |
6.00%, due 4/1/37 | | | 9,151 | | | | 10,399 | |
| | | | | | | | |
| | | | | | | 20,911,517 | |
| | | | | | | | |
United States Treasury Bonds 1.2% | |
2.00%, due 2/15/50 | | | 310,000 | | | | 355,023 | |
4.375%, due 11/15/39 | | | 3,457,000 | | | | 5,435,862 | |
4.375%, due 5/15/40 | | | 705,000 | | | | 1,113,927 | |
4.50%, due 5/15/38 | | | 210,000 | | | | 331,300 | |
| | | | | | | | |
| | | | | | | 7,236,112 | |
| | | | | | | | |
United States Treasury Notes 3.5% | |
0.125%, due 4/30/22 | | | 12,210,000 | | | | 12,200,461 | |
0.375%, due 4/30/25 | | | 6,990,000 | | | | 7,021,674 | |
0.50%, due 4/30/27 | | | 1,295,000 | | | | 1,296,922 | |
0.625%, due 5/15/30 | | | 460,000 | | | | 458,724 | |
| | | | | | | | |
| | | | | | | 20,977,781 | |
| | | | | | | | |
United States Treasury Inflation—Indexed Note 0.7% (j) | |
0.875%, due 1/15/29 | | | 3,783,185 | | | | 4,310,021 | |
| | | | | | | | |
Total U.S. Government & Federal Agencies
(Cost $61,343,257) | | | | 64,272,683 | |
| | | | | | | | |
Total Long-Term Bonds
(Cost $322,601,152) | | | | 335,875,601 | |
| | | | | | | | |
| | | | | | | | |
| | |
| | | Shares | | | Value | |
| Common Stocks 38.0% | |
Aerospace & Defense 0.7% | |
BAE Systems PLC (United Kingdom) | | | 413,296 | | | $ | 2,472,081 | |
Lockheed Martin Corp. | | | 5,243 | | | | 1,913,275 | |
| | | | | | | | |
| | | | | | | 4,385,356 | |
| | | | | | | | |
Air Freight & Logistics 0.6% | |
Deutsche Post A.G., Registered (Germany) | | | 63,769 | | | | 2,326,271 | |
United Parcel Service, Inc., Class B | | | 13,193 | | | | 1,466,798 | |
| | | | | | | | |
| | | | | | | 3,793,069 | |
| | | | | | | | |
Auto Components 0.3% | |
Cie Generale des Etablissements Michelin SCA (France) | | | 19,536 | | | | 2,023,856 | |
| | | | | | | | |
|
Banks 1.2% | |
JPMorgan Chase & Co. | | | 13,278 | | | | 1,248,929 | |
People’s United Financial, Inc. | | | 120,097 | | | | 1,389,522 | |
PNC Financial Services Group, Inc. | | | 9,472 | | | | 996,549 | |
Royal Bank of Canada (Canada) | | | 26,810 | | | | 1,818,996 | |
Truist Financial Corp. | | | 41,949 | | | | 1,575,185 | |
| | | | | | | | |
| | | | | | | 7,029,181 | |
| | | | | | | | |
Beverages 0.9% | |
Coca-Cola Co. | | | 34,675 | | | | 1,549,279 | |
Coca-Cola European Partners PLC (United Kingdom) | | | 34,168 | | | | 1,290,184 | |
PepsiCo., Inc. | | | 18,242 | | | | 2,412,687 | |
| | | | | | | | |
| | | | | | | 5,252,150 | |
| | | | | | | | |
Biotechnology 1.0% | |
AbbVie, Inc. | | | 38,143 | | | | 3,744,880 | |
Amgen, Inc. | | | 9,303 | | | | 2,194,205 | |
| | | | | | | | |
| | | | | | | 5,939,085 | |
| | | | | | | | |
Capital Markets 1.1% | |
BlackRock, Inc. | | | 3,044 | | | | 1,656,210 | |
CME Group, Inc. | | | 6,427 | | | | 1,044,645 | |
Lazard, Ltd., Class A | | | 44,909 | | | | 1,285,745 | |
Macquarie Group, Ltd. (Australia) | | | 14,969 | | | | 1,232,156 | |
Singapore Exchange, Ltd. (Singapore) | | | 228,000 | | | | 1,368,247 | |
| | | | | | | | |
| | | | | | | 6,587,003 | |
| | | | | | | | |
Chemicals 1.1% | |
BASF S.E. (Germany) | | | 40,342 | | | | 2,254,309 | |
Dow, Inc. (k) | | | 31,208 | | | | 1,272,038 | |
LyondellBasell Industries N.V., Class A | | | 23,089 | | | | 1,517,409 | |
Nutrien, Ltd. | | | 54,551 | | | | 1,751,087 | |
| | | | | | | | |
| | | | | | | 6,794,843 | |
| | | | | | | | |
Commercial Services & Supplies 0.0%‡ | |
Quad/Graphics, Inc. | | | 6 | | | | 19 | |
| | | | | | | | |
|
Communications Equipment 0.5% | |
Cisco Systems, Inc. | | | 68,675 | | | | 3,203,002 | |
| | | | | | | | |
| | | | | | |
The notes to the financial statements are an integral part of,
and should be read in conjunction with, the financial statements. | | | | | 21 | |
Portfolio of Investments June 30, 2020 (Unaudited) (continued)
| | | | | | | | |
| | |
| | | Shares | | | Value | |
| Common Stocks (continued) | |
Diversified Telecommunication Services 2.6% | |
AT&T, Inc. | | | 102,843 | | | $ | 3,108,944 | |
BCE, Inc. (Canada) | | | 70,197 | | | | 2,927,633 | |
Deutsche Telekom A.G., Registered (Germany) | | | 84,913 | | | | 1,420,374 | |
Orange S.A. (France) | | | 101,997 | | | | 1,218,474 | |
TELUS Corp. (Canada) | | | 139,633 | | | | 2,341,959 | |
Verizon Communications, Inc. | | | 87,281 | | | | 4,811,801 | |
| | | | | | | | |
| | | | | | | 15,829,185 | |
| | | | | | | | |
Electric Utilities 2.4% | |
American Electric Power Co., Inc. | | | 26,472 | | | | 2,108,230 | |
Duke Energy Corp. | | | 34,474 | | | | 2,754,128 | |
Entergy Corp. | | | 25,710 | | | | 2,411,855 | |
FirstEnergy Corp. | | | 53,750 | | | | 2,084,425 | |
Fortis, Inc. (Canada) | | | 46,431 | | | | 1,765,787 | |
PPL Corp. | | | 49,476 | | | | 1,278,460 | |
Terna Rete Elettrica Nazionale S.p.A. (Italy) | | | 342,397 | | | | 2,350,776 | |
| | | | | | | | |
| | | | | | | 14,753,661 | |
| | | | | | | | |
Electrical Equipment 0.8% | |
Eaton Corp. PLC | | | 32,054 | | | | 2,804,084 | |
Emerson Electric Co. | | | 31,546 | | | | 1,956,798 | |
| | | | | | | | |
| | | | | | | 4,760,882 | |
| | | | | | | | |
Equity Real Estate Investment Trusts 1.0% | |
American Tower Corp. | | | 4,989 | | | | 1,289,856 | |
Iron Mountain, Inc. | | | 105,887 | | | | 2,763,651 | |
Welltower, Inc. | | | 39,327 | | | | 2,035,172 | |
| | | | | | | | |
| | | | | | | 6,088,679 | |
| | | | | | | | |
Food Products 1.0% | |
Danone S.A. (France) | | | 26,894 | | | | 1,858,416 | |
Nestle S.A., Registered (Switzerland) | | | 23,511 | | | | 2,597,382 | |
Orkla ASA (Norway) | | | 160,946 | | | | 1,410,754 | |
| | | | | | | | |
| | | | | | | 5,866,552 | |
| | | | | | | | |
Gas Utilities 0.6% | |
Snam S.p.A. (Italy) | | | 727,663 | | | | 3,539,241 | |
| | | | | | | | |
|
Health Care Providers & Services 0.3% | |
UnitedHealth Group, Inc. | | | 5,666 | | | | 1,671,187 | |
| | | | | | | | |
|
Hotels, Restaurants & Leisure 0.9% | |
Las Vegas Sands Corp. | | | 34,842 | | | | 1,586,705 | |
McDonald’s Corp. | | | 6,089 | | | | 1,123,238 | |
Restaurant Brands International, Inc. (Canada) | | | 23,188 | | | | 1,266,760 | |
Vail Resorts, Inc. | | | 7,358 | | | | 1,340,260 | |
| | | | | | | | |
| | | | | | | 5,316,963 | |
| | | | | | | | |
Household Durables 0.2% | |
Leggett & Platt, Inc. | | | 33,576 | | | | 1,180,196 | |
| | | | | | | | |
| | | | | | | | |
| | |
| | | Shares | | | Value | |
Household Products 0.8% | |
Kimberly-Clark Corp. | | | 20,862 | | | $ | 2,948,844 | |
Procter & Gamble Co. | | | 15,308 | | | | 1,830,377 | |
| | | | | | | | |
| | | | | | | 4,779,221 | |
| | | | | | | | |
Industrial Conglomerates 0.3% | |
Siemens A.G., Registered (Germany) | | | 15,392 | | | | 1,808,063 | |
| | | | | | | | |
|
Insurance 2.5% | |
Allianz S.E., Registered (Germany) | | | 17,929 | | | | 3,657,044 | |
Assicurazioni Generali S.p.A. (Italy) | | | 111,216 | | | | 1,680,757 | |
AXA S.A. (France) | | | 97,092 | | | | 2,026,223 | |
MetLife, Inc. | | | 55,396 | | | | 2,023,062 | |
Muenchener Rueckversicherungs-Gesellschaft A.G., Registered (Germany) | | | 11,502 | | | | 2,985,059 | |
SCOR S.E. (France) (k) | | | 49,053 | | | | 1,342,462 | |
Tokio Marine Holdings, Inc. (Japan) | | | 38,500 | | | | 1,677,290 | |
| | | | | | | | |
| | | | | | | 15,391,897 | |
| | | | | | | | |
IT Services 0.5% | |
International Business Machines Corp. | | | 26,387 | | | | 3,186,758 | |
| | | | | | | | |
|
Machinery 0.2% | |
Atlas Copco A.B., Class A (Sweden) | | | 34,168 | | | | 1,444,831 | |
| | | | | | | | |
|
Media 0.2% | |
Comcast Corp., Class A | | | 34,929 | | | | 1,361,532 | |
ION Media Networks, Inc. (i)(k)(l)(m)(n) | | | 8 | | | | 3,018 | |
| | | | | | | | |
| | | | | | | 1,364,550 | |
| | | | | | | | |
Multi-Utilities 1.7% | |
Ameren Corp. | | | 35,252 | | | | 2,480,331 | |
Dominion Energy, Inc. | | | 38,448 | | | | 3,121,209 | |
National Grid PLC (United Kingdom) | | | 195,778 | | | | 2,397,344 | |
WEC Energy Group, Inc. | | | 28,338 | | | | 2,483,826 | |
| | | | | | | | |
| | | | | | | 10,482,710 | |
| | | | | | | | |
Multiline Retail 0.3% | |
Target Corp. | | | 16,492 | | | | 1,977,886 | |
| | | | | | | | |
|
Oil, Gas & Consumable Fuels 1.8% | |
Chevron Corp. | | | 17,337 | | | | 1,546,981 | |
Enterprise Products Partners, L.P. | | | 109,440 | | | | 1,988,525 | |
Exxon Mobil Corp. | | | 32,476 | | | | 1,452,327 | |
Magellan Midstream Partners, L.P. | | | 40,934 | | | | 1,767,121 | |
Phillips 66 | | | 22,835 | | | | 1,641,836 | |
TOTAL S.A. (France) | | | 70,789 | | | | 2,696,324 | |
| | | | | | | | |
| | | | | | | 11,093,114 | |
| | | | | | | | |
Personal Products 0.6% | |
Unilever PLC (United Kingdom) | | | 60,809 | | | | 3,278,672 | |
| | | | | | | | |
| | | | |
| 22 | | MainStay VP Income Builder Portfolio | | The notes to the financial statements are an integral part of,
and should be read in conjunction with, the financial statements. |
| | | | | | | | |
| | |
| | | Shares | | | Value | |
| Common Stocks (continued) | |
Pharmaceuticals 4.8% | |
AstraZeneca PLC, Sponsored ADR (United Kingdom) | | | 46,431 | | | $ | 2,455,736 | |
GlaxoSmithKline PLC (United Kingdom) | | | 136,504 | | | | 2,765,836 | |
Johnson & Johnson | | | 19,706 | | | | 2,771,255 | |
Merck & Co., Inc. | | | 40,511 | | | | 3,132,716 | |
Novartis A.G., Registered (Switzerland) | | | 36,113 | | | | 3,137,882 | |
Novo Nordisk A/S, Class B (Denmark) | | | 24,696 | | | | 1,598,107 | |
Pfizer, Inc. | | | 93,091 | | | | 3,044,076 | |
Roche Holding A.G. (Switzerland) | | | 8,608 | | | | 2,980,361 | |
Sanofi (France) | | | 30,587 | | | | 3,111,891 | |
Takeda Pharmaceutical Co., Ltd. (Japan) | | | 108,500 | | | | 3,872,436 | |
| | | | | | | | |
| | | | | | | 28,870,296 | |
| | | | | | | | |
Semiconductors & Semiconductor Equipment 2.8% | |
Analog Devices, Inc. | | | 10,822 | | | | 1,327,210 | |
Broadcom, Inc. | | | 5,581 | | | | 1,761,419 | |
Intel Corp. | | | 35,183 | | | | 2,104,999 | |
KLA Corp. | | | 21,228 | | | | 4,128,422 | |
Maxim Integrated Products, Inc. | | | 27,994 | | | | 1,696,716 | |
Taiwan Semiconductor Manufacturing Co., Ltd., Sponsored ADR (Taiwan) | | | 51,929 | | | | 2,948,009 | |
Texas Instruments, Inc. | | | 22,835 | | | | 2,899,360 | |
| | | | | | | | |
| | | | | | | 16,866,135 | |
| | | | | | | | |
Software 0.9% | |
Microsoft Corp. | | | 25,880 | | | | 5,266,839 | |
| | | | | | | | |
|
Specialty Retail 0.3% | |
Home Depot, Inc. | | | 6,258 | | | | 1,567,692 | |
| | | | | | | | |
|
Technology Hardware, Storage & Peripherals 0.8% | |
Apple, Inc. | | | 6,607 | | | | 2,410,234 | |
Samsung Electronics Co., Ltd., GDR (Republic of Korea) (a) | | | 2,357 | | | | 2,599,771 | |
| | | | | | | | |
| | | | | | | 5,010,005 | |
| | | | | | | | |
Textiles, Apparel & Luxury Goods 0.2% | |
Hanesbrands, Inc. | | | 98,107 | | | | 1,107,628 | |
| | | | | | | | |
|
Tobacco 1.6% | |
Altria Group, Inc. | | | 74,764 | | | | 2,934,487 | |
British American Tobacco PLC (United Kingdom) | | | 69,520 | | | | 2,671,059 | |
British American Tobacco PLC, Sponsored ADR (United Kingdom) (f) | | | 24,949 | | | | 968,520 | |
Philip Morris International, Inc. | | | 43,048 | | | | 3,015,943 | |
| | | | | | | | |
| | | | | | | 9,590,009 | |
| | | | | | | | |
Trading Companies & Distributors 0.3% | |
Watsco, Inc. | | | 9,726 | | | | 1,728,310 | |
| | | | | | | | |
| | | | | | | | |
| | |
| | | Shares | | | Value | |
Wireless Telecommunication Services 0.2% | |
Rogers Communications, Inc., Class B (Canada) | | | 33,153 | | | $ | 1,332,127 | |
| | | | | | | | |
Total Common Stocks
(Cost $225,703,537) | | | | 230,160,853 | |
| | | | | | | | |
|
| Short-Term Investments 5.3% | |
Affiliated Investment Company 5.2% | |
MainStay U.S. Government Liquidity Fund, 0.05% (o) | | | 31,285,681 | | | | 31,285,681 | |
| | | | | | | | |
|
Unaffiliated Investment Company 0.1% | |
State Street Navigator Securities Lending Government Money Market Portfolio, 0.13% (o)(p) | | | 827,043 | | | | 827,043 | |
| | | | | | | | |
Total Short-Term Investments
(Cost $32,112,724) | | | | 32,112,724 | |
| | | | | | | | |
Total Investments
(Cost $580,417,413) | | | 98.7 | % | | | 598,149,178 | |
Other Assets, Less Liabilities | | | 1.3 | | | | 7,582,904 | |
Net Assets | | | 100.0 | % | | $ | 605,732,082 | |
| † | Percentages indicated are based on Portfolio net assets. |
| ‡ | Less than one-tenth of a percent. |
| (a) | May be sold to institutional investors only under Rule 144A or securities offered pursuant to Section 4(a)(2) of the Securities Act of 1933, as amended. |
| (b) | Floating rate—Rate shown was the rate in effect as of June 30, 2020. |
| (c) | Fixed to floating rate—Rate shown was the rate in effect as of June 30, 2020. |
| (d) | Securities are perpetual and, thus, do not have a predetermined maturity date. The date shown, if applicable, reflects the next call date. |
| (e) | Step coupon—Rate shown was the rate in effect as of June 30, 2020. |
| (f) | All or a portion of this security was held on loan. As of June 30, 2020, the aggregate market value of securities on loan was $1,286,837; the total market value of collateral held by the Portfolio was $1,319,899. The market value of the collateral held included non-cash collateral in the form of U.S. Treasury securities with a value of $492,856 (See Note 2(M)). |
| (g) | Collateral strip rate—A bond whose interest was based on the weighted net interest rate of the collateral. The coupon rate adjusts periodically based on a predetermined schedule. Rate shown was the rate in effect as of June 30, 2020. |
| (h) | Coupon rate may change based on changes of the underlying collateral or prepayments of principal. Rate shown was the rate in effect as of June 30, 2020. |
| | | | | | |
The notes to the financial statements are an integral part of,
and should be read in conjunction with, the financial statements. | | | | | 23 | |
Portfolio of Investments June 30, 2020 (Unaudited) (continued)
| (i) | Fair valued security—Represents fair value as measured in good faith under procedures approved by the Board of Trustees. As of June 30, 2020, the total market value of the fair valued securities was $1,105,787, which represented 0.2% of the Portfolio’s net assets. |
| (j) | Treasury Inflation Protected Security—Pays a fixed rate of interest on a principal amount that is continuously adjusted for inflation based on the Consumer Price Index-Urban Consumers. |
| (k) | Non-income producing security. |
| (l) | Illiquid security—As of June 30, 2020, the total market value of the security deemed illiquid under procedures approved by the Board of Trustees was $3,018, which represented less than one-tenth of a percent of the Portfolio’s net assets. |
| (m) | Restricted security. (See Note 5) |
| (n) | Security in which significant unobservable inputs (Level 3) were used in determining fair value. |
| (o) | Current yield as of June 30, 2020. |
| (p) | Represents a security purchased with cash collateral received for securities on loan. |
Foreign Currency Forward Contracts
As of June 30, 2020, the Portfolio held the following foreign currency forward contracts1:
| | | | | | | | | | | | | | | | | | | | | | | | | | | | | | |
Currency Purchased | | | Currency Sold | | | | | | Counterparty | | Settlement
Date | | | | | Unrealized
Appreciation
(Depreciation) | |
| | | | | | | | | |
USD | | | 16,696,475 | | | | | | | GBP | | | 13,443,000 | | | | | | | JPMorgan Chase Bank N.A. | | 8/3/20 | | | | | | $ | 35,751 | |
Total unrealized appreciation | | | | | | | 35,751 | |
JPY | | | 2,059,000,000 | | | | | | | USD | | | 19,239,916 | | | | | | | JPMorgan Chase Bank N.A. | | 8/3/20 | | | | | | | (163,107 | ) |
USD | | | 6,549,806 | | | | | | | CAD | | | 9,193,000 | | | | | | | JPMorgan Chase Bank N.A. | | 8/4/20 | | | | | | | (222,301 | ) |
USD | | | 7,761,329 | | | | | | | EUR | | | 7,152,000 | | | | | | | JPMorgan Chase Bank N.A. | | 8/3/20 | | | | | | | (279,519 | ) |
Total unrealized depreciation | | | | | | | (664,927 | ) |
Net unrealized depreciation | | | | | | $ | (629,176 | ) |
| 1. | Foreign Currency Forward Contracts are subject to limitations such that they cannot be “sold or repurchased,” although the Portfolio would be able to exit the transaction through other means, such as through the execution of an offsetting transaction. |
Futures Contracts
As of June 30, 2020, the Portfolio held the following futures contracts1:
| | | | | | | | | | | | | | | | | | | | |
Type | | Number of
Contracts | | | Expiration
Date | | | Value at
Trade Date | | | Current
Notional
Amount | | | Unrealized
Appreciation
(Depreciation)2 | |
| | | | | |
Long Contracts | | | | | | | | | | | | | | | | | | | | |
| 10-Year United States Treasury Note | | | 17 | | | | September 2020 | | | $ | 2,365,695 | | | $ | 2,365,922 | | | $ | 227 | |
| 2-Year United States Treasury Note | | | 183 | | | | September 2020 | | | | 40,396,803 | | | | 40,411,547 | | | | 14,744 | |
| Nikkei 225 | | | 164 | | | | September 2020 | | | | 17,589,060 | | | | 16,924,011 | | | | (665,049 | ) |
| S&P 500 Index Mini | | | 376 | | | | September 2020 | | | | 56,847,338 | | | | 58,095,760 | | | | 1,248,422 | |
| United States Treasury Bond | | | 18 | | | | September 2020 | | | | 3,192,511 | | | | 3,214,126 | | | | 21,615 | |
| United States Treasury Ultra Bond | | | 147 | | | | September 2020 | | | | 31,992,438 | | | | 32,068,968 | | | | 76,530 | |
| | | | | | | | | | | | | | | | | | | | |
| Total Long Contracts | | | | | | | | | | | | | | | | | | | 696,489 | |
| | | | | | | | | | | | | | | | | | | | |
|
Short Contracts | |
| 10-Year United States Treasury Ultra Note | | | (70 | ) | | | September 2020 | | | | (10,961,835 | ) | | | (11,023,907 | ) | | | (62,072 | ) |
| 5-Year United States Treasury Note | | | (142 | ) | | | September 2020 | | | | (17,797,429 | ) | | | (17,855,392 | ) | | | (57,963 | ) |
| Euro STOXX 50 | | | (88 | ) | | | September 2020 | | | | (3,068,065 | ) | | | (3,186,515 | ) | | | (118,450 | ) |
| | | | | | | | | | | | | | | | | | | | |
| Total Short Contracts | | | | | | | | | | | | | | | | | | | (238,485 | ) |
| | | | | | | | | | | | | | | | | | | | |
| Net Unrealized Appreciation | | | | | | | | | | | | | | | | | | $ | 458,004 | |
| | | | | | | | | | | | | | | | | | | | |
| 1. | As of June 30, 2020, cash in the amount of $7,328,991 was on deposit with a broker or futures commission merchant for futures transactions. |
| 2. | Represents the difference between the value of the contracts at the time they were opened and the value as of June 30, 2020. |
| | | | |
| 24 | | MainStay VP Income Builder Portfolio | | The notes to the financial statements are an integral part of,
and should be read in conjunction with, the financial statements. |
The following abbreviations are used in the preceding pages:
ADR—American Depositary Receipt
CAD—Canadian Dollar
EUAM—European Union Advisory Mission
EUR—Euro
GBP—British Pound Sterling
GDR—Global Depositary Receipt
JPY—Japanese Yen
LIBOR—London Interbank Offered Rate
REMIC—Real Estate Mortgage Investment Conduit
USD—United States Dollar
The following is a summary of the fair valuations according to the inputs used as of June 30, 2020, for valuing the Portfolio’s assets and liabilities:
| | | | | | | | | | | | | | | | |
Description | | Quoted
Prices in
Active
Markets for
Identical
Assets
(Level 1) | | | Significant
Other
Observable
Inputs
(Level 2) | | | Significant
Unobservable
Inputs
(Level 3) | | | Total | |
| | | | |
Asset Valuation Inputs | | | | | | | | | | | | | | | | |
| Investments in Securities (a) | | | | | | | | | | | | | | | | |
| Long-Term Bonds | | | | | | | | | | | | | | | | |
Asset-Backed Securities | | $ | — | | | $ | 14,944,677 | | | $ | — | | | $ | 14,944,677 | |
Convertible Bonds | | | — | | | | 3,182,086 | | | | — | | | | 3,182,086 | |
Corporate Bonds | | | — | | | | 207,784,549 | | | | — | | | | 207,784,549 | |
Foreign Bonds | | | — | | | | 695,810 | | | | — | | | | 695,810 | |
Foreign Government Bonds | | | — | | | | 3,226,558 | | | | — | | | | 3,226,558 | |
Loan Assignments | | | — | | | | 6,193,956 | | | | — | | | | 6,193,956 | |
Mortgage-Backed Securities | | | — | | | | 34,253,579 | | | | — | | | | 34,253,579 | |
Municipal Bonds | | | — | | | | 1,321,703 | | | | — | | | | 1,321,703 | |
U.S. Government & Federal Agencies | | | — | | | | 64,272,683 | | | | — | | | | 64,272,683 | |
| | | | | | | | | | | | | | | | |
| Total Long-Term Bonds | | | — | | | | 335,875,601 | | | | — | | | | 335,875,601 | |
| | | | | | | | | | | | | | | | |
| Common Stocks | | | | | | | | | | | | | | | | |
Aerospace & Defense | | | 1,913,275 | | | | 2,472,081 | | | | — | | | | 4,385,356 | |
Air Freight & Logistics | | | 1,466,798 | | | | 2,326,271 | | | | — | | | | 3,793,069 | |
Auto Components | | | — | | | | 2,023,856 | | | | — | | | | 2,023,856 | |
Capital Markets | | | 3,986,600 | | | | 2,600,403 | | | | — | | | | 6,587,003 | |
Chemicals | | | 4,540,534 | | | | 2,254,309 | | | | — | | | | 6,794,843 | |
Diversified Telecommunication Services | | | 13,190,337 | | | | 2,638,848 | | | | — | | | | 15,829,185 | |
Electric Utilities | | | 12,402,885 | | | | 2,350,776 | | | | — | | | | 14,753,661 | |
Food Products | | | — | | | | 5,866,552 | | | | — | | | | 5,866,552 | |
Gas Utilities | | | — | | | | 3,539,241 | | | | — | | | | 3,539,241 | |
Industrial Conglomerates | | | — | | | | 1,808,063 | | | | — | | | | 1,808,063 | |
Insurance | | | 2,023,062 | | | | 13,368,835 | | | | — | | | | 15,391,897 | |
Machinery | | | — | | | | 1,444,831 | | | | — | | | | 1,444,831 | |
Multi-Utilities | | | 8,085,366 | | | | 2,397,344 | | | | — | | | | 10,482,710 | |
Oil, Gas & Consumable Fuels | | | 8,396,790 | | | | 2,696,324 | | | | — | | | | 11,093,114 | |
Personal Products | | | — | | | | 3,278,672 | | | | — | | | | 3,278,672 | |
Pharmaceuticals | | | 11,403,783 | | | | 17,466,513 | | | | — | | | | 28,870,296 | |
Tobacco | | | 6,918,950 | | | | 2,671,059 | | | | — | | | | 9,590,009 | |
All Other Industries (b) | | | 84,625,477 | | | | — | | | | 3,018 | | | | 84,628,495 | |
| | | | | | | | | | | | | | | | |
| Total Common Stocks | | | 158,953,857 | | | | 71,203,978 | | | | 3,018 | | | | 230,160,853 | |
| | | | | | | | | | | | | | | | |
| Short-Term Investments | | | | | | | | | |
Affiliated Investment Company | | | 31,285,681 | | | | — | | | | — | | | | 31,285,681 | |
Unaffiliated Investment Company | | | 827,043 | | | | — | | | | — | | | | 827,043 | |
| | | | | | | | | | | | | | | | |
| Total Short-Term Investments | | | 32,112,724 | | | | — | | | | — | | | | 32,112,724 | |
| | | | | | | | | | | | | | | | |
| Total Investments in Securities | | | 191,066,581 | | | | 407,079,579 | | | | 3,018 | | | | 598,149,178 | |
| | | | | | | | | | | | | | | | |
| | | | | | |
The notes to the financial statements are an integral part of,
and should be read in conjunction with, the financial statements. | | | | | 25 | |
Portfolio of Investments June 30, 2020 (Unaudited) (continued)
| | | | | | | | | | | | | | | | |
Description | | Quoted
Prices in
Active
Markets for
Identical
Assets
(Level 1) | | | Significant
Other
Observable
Inputs
(Level 2) | | | Significant
Unobservable
Inputs
(Level 3) | | | Total | |
| Other Financial Instruments | | | | | | | | | |
Foreign Currency Forward Contracts (c) | | $ | — | | | $ | 35,751 | | | $ | — | | | $ | 35,751 | |
Futures Contracts (c) | | | 1,361,538 | | | | — | | | | — | | | | 1,361,538 | |
| | | | | | | | | | | | | | | | |
| Total Other Financial Instruments | | | 1,361,538 | | | | 35,751 | | | | — | | | | 1,397,289 | |
| | | | | | | | | | | | | | | | |
| Total Investments in Securities and Other Financial Instruments | | $ | 192,428,119 | | | $ | 407,115,330 | | | $ | 3,018 | | | $ | 599,546,467 | |
| | | | | | | | | | | | | | | | |
|
Liability Valuation Inputs | |
| Other Financial Instruments | | | | | | | | | |
Foreign Currency Forward Contracts (c) | | $ | — | | | $ | (664,927 | ) | | $ | — | | | $ | (664,927 | ) |
Futures Contracts (c) | | | (903,534 | ) | | | — | | | | — | | | | (903,534 | ) |
| | | | | | | | | | | | | | | | |
| Total Other Financial Instruments | | $ | (903,534 | ) | | $ | (664,927 | ) | | $ | — | | | $ | (1,568,461 | ) |
| | | | | | | | | | | | | | | | |
| (a) | For a complete listing of investments and their industries, see the Portfolio of Investments. |
| (b) | The Level 3 security valued at $3,018 is held in Media within the Common Stocks section of the Portfolio of Investments. |
| (c) | The value listed for these securities reflects unrealized appreciation (depreciation) as shown on the Portfolio of Investments. |
| | | | |
| 26 | | MainStay VP Income Builder Portfolio | | The notes to the financial statements are an integral part of,
and should be read in conjunction with, the financial statements. |
Statement of Assets and Liabilities as of June 30, 2020 (Unaudited)
| | | | |
| Assets | |
Investment in unaffiliated securities, at value
(identified cost $549,131,732) including securities on loan of $1,286,837 | | $ | 566,863,497 | |
Investment in affiliated investment company, at value (identified cost $31,285,681) | | | 31,285,681 | |
Cash collateral on deposit at broker for futures contracts | | | 7,328,991 | |
Cash denominated in foreign currencies
(identified cost $228,294) | | | 231,106 | |
Due from custodian | | | 81,499 | |
Cash | | | 13 | |
Receivables: | |
Dividends and interest | | | 3,313,053 | |
Investment securities sold | | | 1,083,997 | |
Variation margin on futures contracts | | | 617,914 | |
Portfolio shares sold | | | 386,709 | |
Securities lending | | | 1,850 | |
Unrealized appreciation on foreign currency forward contracts | | | 35,751 | |
Other assets | | | 3,172 | |
| | | | |
Total assets | | | 611,233,233 | |
| | | | |
| |
| Liabilities | | | | |
Cash collateral received for securities on loan | | | 827,043 | |
Payables: | |
Investment securities purchased | | | 2,709,978 | |
Portfolio shares redeemed | | | 817,361 | |
Manager (See Note 3) | | | 283,809 | |
NYLIFE Distributors (See Note 3) | | | 87,683 | |
Shareholder communication | | | 44,451 | |
Professional fees | | | 34,620 | |
Custodian | | | 21,704 | |
Trustees | | | 734 | |
Accrued expenses | | | 8,841 | |
Unrealized depreciation on foreign currency forward contracts | | | 664,927 | |
| | | | |
Total liabilities | | | 5,501,151 | |
| | | | |
Net assets | | $ | 605,732,082 | |
| | | | |
| |
| Composition of Net Assets | | | | |
Shares of beneficial interest outstanding (par value of $.001 per share) unlimited number of shares authorized | | $ | 37,728 | |
Additional paid-in capital | | | 579,527,903 | |
| | | | |
| | | 579,565,631 | |
Total distributable earnings (loss) | | | 26,166,451 | |
| | | | |
Net assets | | $ | 605,732,082 | |
| | | | |
| | | | |
Initial Class | | | | |
Net assets applicable to outstanding shares | | $ | 177,988,292 | |
| | | | |
Shares of beneficial interest outstanding | | | 11,020,815 | |
| | | | |
Net asset value per share outstanding | | $ | 16.15 | |
| | | | |
Service Class | | | | |
Net assets applicable to outstanding shares | | $ | 427,743,790 | |
| | | | |
Shares of beneficial interest outstanding | | | 26,707,314 | |
| | | | |
Net asset value per share outstanding | | $ | 16.02 | |
| | | | |
| | | | | | |
The notes to the financial statements are an integral part of,
and should be read in conjunction with, the financial statements. | | | | | 27 | |
Statement of Operations for the six months ended June 30, 2020 (Unaudited)
| | | | |
| Investment Income (Loss) | |
Income | |
Dividends-unaffiliated (a) | | $ | 5,066,739 | |
Interest | | | 5,045,902 | |
Dividends-affiliated | | | 80,924 | |
Securities lending | | | 17,256 | |
Other | | | 211 | |
| | | | |
Total income | | | 10,211,032 | |
| | | | |
Expenses | | | | |
Manager (See Note 3) | | | 1,697,737 | |
Distribution/Service—Service Class (See Note 3) | | | 520,970 | |
Professional fees | | | 61,298 | |
Custodian | | | 44,562 | |
Shareholder communication | | | 40,119 | |
Trustees | | | 7,312 | |
Miscellaneous | | | 17,591 | |
| | | | |
Total expenses | | | 2,389,589 | |
| | | | |
Net investment income (loss) | | | 7,821,443 | |
| | | | |
|
| Realized and Unrealized Gain (Loss) on Investments, Futures Contracts and Foreign Currency Transactions | |
Net realized gain (loss) on: | |
Unaffiliated investment transactions | | | (16,837,972 | ) |
Futures transactions | | | 962,012 | |
Foreign currency forward transactions | | | 1,514,227 | |
Foreign currency transactions | | | 73,060 | |
| | | | |
Net realized gain (loss) on investments, futures transactions and foreign currency transactions | | | (14,288,673 | ) |
| | | | |
Net change in unrealized appreciation (depreciation) on: | | | | |
Unaffiliated investments | | | (23,307,479 | ) |
Futures contracts | | | 162,405 | |
Foreign currency forward contracts | | | 72,954 | |
Translation of other assets and liabilities in foreign currencies | | | 2,078 | |
| | | | |
Net change in unrealized appreciation (depreciation) on investments, futures contracts and foreign currencies | | | (23,070,042 | ) |
| | | | |
Net realized and unrealized gain (loss) on investments, futures transactions and foreign currency transactions | | | (37,358,715 | ) |
| | | | |
Net increase (decrease) in net assets resulting from operations | | $ | (29,537,272 | ) |
| | | | |
| (a) | Dividends recorded net of foreign withholding taxes in the amount of $308,185. |
| | | | |
| 28 | | MainStay VP Income Builder Portfolio | | The notes to the financial statements are an integral part of,
and should be read in conjunction with, the financial statements. |
Statements of Changes in Net Assets
for the six months ended June 30, 2020 (Unaudited) and the year ended December 31, 2019
| | | | | | | | |
| | | 2020 | | | 2019 | |
| Increase (Decrease) in Net Assets | |
Operations: | |
Net investment income (loss) | | $ | 7,821,443 | | | $ | 16,415,734 | |
Net realized gain (loss) on investments, futures transactions and foreign currency transactions | | | (14,288,673 | ) | | | 28,938,994 | |
Net change in unrealized appreciation (depreciation) on investments, futures contracts and foreign currencies | | | (23,070,042 | ) | | | 49,267,957 | |
| | | | |
Net increase (decrease) in net assets resulting from operations | | | (29,537,272 | ) | | | 94,622,685 | |
| | | | |
Distributions to shareholders: | | | | | | | | |
Initial Class | | | (2,388,693 | ) | | | (9,012,589 | ) |
Service Class | | | (5,187,100 | ) | | | (18,348,399 | ) |
| | | | |
Total distributions to shareholders | | | (7,575,793 | ) | | | (27,360,988 | ) |
| | | | |
Capital share transactions: | | | | | | | | |
Net proceeds from sale of shares | | | 52,742,314 | | | | 65,962,538 | |
Net asset value of shares issued to shareholders in reinvestment of distributions | | | 7,575,793 | | | | 27,360,988 | |
Cost of shares redeemed | | | (44,239,771 | ) | | | (73,300,588 | ) |
| | | | | | | | |
Increase (decrease) in net assets derived from capital share transactions | | | 16,078,336 | | | | 20,022,938 | |
| | | | | | | | |
Net increase (decrease) in net assets | | | (21,034,729 | ) | | | 87,284,635 | |
|
| Net Assets | |
Beginning of period | | | 626,766,811 | | | | 539,482,176 | |
| | | | |
End of period | | $ | 605,732,082 | | | $ | 626,766,811 | |
| | | | |
| | | | | | |
The notes to the financial statements are an integral part of,
and should be read in conjunction with, the financial statements. | | | | | 29 | |
Financial Highlights selected per share data and ratios
| | | | | | | | | | | | | | | | | | | | | | | | |
| | |
| | | Six months
ended
June 30, | | | Year ended December 31, | |
| | | | | | |
| Initial Class | | 2020* | | | 2019 | | | 2018 | | | 2017 | | | 2016 | | | 2015 | |
| | | | | | |
Net asset value at beginning of period | | $ | 17.14 | | | $ | 15.23 | | | $ | 17.29 | | | $ | 15.94 | | | $ | 15.31 | | | $ | 17.30 | |
| | | | | | | | | | | | | | | | | | | | | | | | |
| | | | | | |
Net investment income (loss) (a) | | | 0.22 | | | | 0.49 | | | | 0.53 | | | | 0.49 | | | | 0.54 | | | | 0.64 | |
| | | | | | |
Net realized and unrealized gain (loss) on investments | | | (1.03 | ) | | | 2.22 | | | | (1.49 | ) | | | 1.62 | | | | 0.72 | | | | (1.36 | ) |
| | | | | | |
Net realized and unrealized gain (loss) on foreign currency transactions | | | 0.04 | | | | 0.00 | ‡ | | | 0.11 | | | | (0.14 | ) | | | 0.14 | | | | 0.14 | |
| | | | | | | | | | | | | | | | | | | | | | | | |
| | | | | | |
Total from investment operations | | | (0.77 | ) | | | 2.71 | | | | (0.85 | ) | | | 1.97 | | | | 1.40 | | | | (0.58 | ) |
| | | | | | | | | | | | | | | | | | | | | | | | |
| | | | | | |
| Less distributions: | | | | | | | | | | | | | | | | | | | | | | | | |
| | | | | | |
From net investment income | | | (0.22 | ) | | | (0.68 | ) | | | (0.46 | ) | | | (0.54 | ) | | | (0.68 | ) | | | (0.80 | ) |
| | | | | | |
From net realized gain on investments | | | — | | | | (0.12 | ) | | | (0.75 | ) | | | (0.08 | ) | | | (0.09 | ) | | | (0.61 | ) |
| | | | | | | | | | | | | | | | | | | | | | | | |
| | | | | | |
Total distributions | | | (0.22 | ) | | | (0.80 | ) | | | (1.21 | ) | | | (0.62 | ) | | | (0.77 | ) | | | (1.41 | ) |
| | | | | | | | | | | | | | | | | | | | | | | | |
| | | | | | |
Net asset value at end of period | | $ | 16.15 | | | $ | 17.14 | | | $ | 15.23 | | | $ | 17.29 | | | $ | 15.94 | | | $ | 15.31 | |
| | | | | | | | | | | | | | | | | | | | | | | | |
| | | | | | |
Total investment return (b) | | | (4.42 | %) | | | 18.07 | % | | | (5.21 | %) | | | 12.53 | % | | | 9.30 | % | | | (3.50 | %) |
| | | | | | |
| Ratios (to average net assets)/Supplemental Data: | | | | | | | | | | | | | | | | | | | | | | | | |
| | | | | | |
Net investment income (loss) | | | 2.80 | %†† | | | 3.00 | % | | | 3.18 | % | | | 2.91 | % | | | 3.47 | % | | | 3.79 | % |
| | | | | | |
Net expenses (c) | | | 0.63 | %†† | | | 0.63 | % | | | 0.62 | % | | | 0.62 | % | | | 0.63 | % | | | 0.63 | % |
| | | | | | |
Interest expense and fees | | | — | | | | — | | | | 0.00 | %(d) | | | 0.01 | % | | | — | | | | — | |
| | | | | | |
Portfolio turnover rate | | | 41 | %(e) | | | 59 | %(e) | | | 50 | %(e) | | | 26 | % | | | 28 | % | | | 35 | % |
| | | | | | |
Net assets at end of period (in 000’s) | | $ | 177,988 | | | $ | 193,252 | | | $ | 178,608 | | | $ | 207,056 | | | $ | 202,450 | | | $ | 206,198 | |
| ‡ | Less than one cent per share. |
| (a) | Per share data based on average shares outstanding during the period. |
| (b) | Total return does not reflect any deduction of sales charges, mortality and expense charges, contract charges or administrative charges. For periods of less than one year, total return is not annualized. |
| (c) | In addition to the fees and expenses which the Portfolio bears directly, it also indirectly bears a pro-rata share of the fees and expenses of the underlying funds in which it invests. Such indirect expenses are not included in the above expense ratios. |
| (e) | The portfolio turnover rates not including mortgage dollar rolls were 40%, 52% and 39% for the six months ended June 30, 2020 and for the years ended December 31, 2019 and 2018, respectively. |
| | | | |
| 30 | | MainStay VP Income Builder Portfolio | | The notes to the financial statements are an integral part of,
and should be read in conjunction with, the financial statements. |
Financial Highlights selected per share data and ratios
| | | | | | | | | | | | | | | | | | | | | | | | |
| | |
| | | Six months
ended
June 30, | | | Year ended December 31, | |
| | | | | | |
| Service Class | | 2020* | | | 2019 | | | 2018 | | | 2017 | | | 2016 | | | 2015 | |
| | | | | | |
Net asset value at beginning of period | | $ | 16.99 | | | $ | 15.11 | | | $ | 17.17 | | | $ | 15.83 | | | $ | 15.21 | | | $ | 17.20 | |
| | | | | | | | | | | | | | | | | | | | | | | | |
| | | | | | |
Net investment income (loss) (a) | | | 0.20 | | | | 0.45 | | | | 0.48 | | | | 0.44 | | | | 0.50 | | | | 0.59 | |
| | | | | | |
Net realized and unrealized gain (loss) on investments | | | (1.01 | ) | | | 2.19 | | | | (1.48 | ) | | | 1.62 | | | | 0.72 | | | | (1.35 | ) |
| | | | | | |
Net realized and unrealized gain (loss) on foreign currency transactions | | | 0.04 | | | | 0.00 | ‡ | | | 0.11 | | | | (0.14 | ) | | | 0.14 | | | | 0.14 | |
| | | | | | | | | | | | | | | | | | | | | | | | |
| | | | | | |
Total from investment operations | | | (0.77 | ) | | | 2.64 | | | | (0.89 | ) | | | 1.92 | | | | 1.36 | | | | (0.62 | ) |
| | | | | | | | | | | | | | | | | | | | | | | | |
| | | | | | |
| Less distributions: | | | | | | | | | | | | | | | | | | | | | | | | |
| | | | | | |
From net investment income | | | (0.20 | ) | | | (0.64 | ) | | | (0.42 | ) | | | (0.50 | ) | | | (0.65 | ) | | | (0.76 | ) |
| | | | | | |
From net realized gain on investments | | | — | | | | (0.12 | ) | | | (0.75 | ) | | | (0.08 | ) | | | (0.09 | ) | | | (0.61 | ) |
| | | | | | | | | | | | | | | | | | | | | | | | |
| | | | | | |
Total distributions | | | (0.20 | ) | | | (0.76 | ) | | | (1.17 | ) | | | (0.58 | ) | | | (0.74 | ) | | | (1.37 | ) |
| | | | | | | | | | | | | | | | | | | | | | | | |
| | | | | | |
Net asset value at end of period | | $ | 16.02 | | | $ | 16.99 | | | $ | 15.11 | | | $ | 17.17 | | | $ | 15.83 | | | $ | 15.21 | |
| | | | | | | | | | | | | | | | | | | | | | | | |
| | | | | | |
Total investment return (b) | | | (4.54 | %) | | | 17.78 | % | | | (5.45 | %) | | | 12.25 | % | | | 9.03 | % | | | (3.74 | %) |
| | | | | | |
| Ratios (to average net assets)/Supplemental Data: | | | | | | | | | | | | | | | | | | | | | | | | |
| | | | | | |
Net investment income (loss) | | | 2.55 | %†† | | | 2.74 | % | | | 2.93 | % | | | 2.65 | % | | | 3.20 | % | | | 3.54 | % |
| | | | | | |
Net expenses (including interest expense and fees) (c) | | | 0.88 | %†† | | | 0.88 | % | | | 0.87 | % | | | 0.87 | % | | | 0.88 | % | | | 0.88 | % |
| | | | | | |
Interest expense and fees | | | — | | | | — | | | | 0.00 | %(d) | | | 0.01 | % | | | — | | | | — | |
| | | | | | |
Portfolio turnover rate | | | 41 | %(e) | | | 59 | %(e) | | | 50 | %(e) | | | 26 | % | | | 28 | % | | | 35 | % |
| | | | | | |
Net assets at end of period (in 000’s) | | $ | 427,744 | | | $ | 433,515 | | | $ | 360,874 | | | $ | 425,340 | | | $ | 361,357 | | | $ | 309,350 | |
| ‡ | Less than one cent per share. |
| (a) | Per share data based on average shares outstanding during the period. |
| (b) | Total return does not reflect any deduction of sales charges, mortality and expense charges, contract charges or administrative charges. For periods of less than one year, total return is not annualized. |
| (c) | In addition to the fees and expenses which the Portfolio bears directly, it also indirectly bears a pro-rata share of the fees and expenses of the underlying funds in which it invests. Such indirect expenses are not included in the above expense ratios. |
| (e) | The portfolio turnover rates not including mortgage dollar rolls were 40%, 52% and 39% for the six months ended June 30, 2020 and for the years ended December 31, 2019 and 2018, respectively. |
| | | | | | |
The notes to the financial statements are an integral part of,
and should be read in conjunction with, the financial statements. | | | | | 31 | |
Notes to Financial Statements (Unaudited)
Note 1–Organization and Business
MainStay VP Funds Trust (the ‘‘Fund’’) was organized as a Delaware statutory trust on February 1, 2011. The Fund is registered under the Investment Company Act of 1940, as amended (the “1940 Act”), as an open-end management investment company. The Fund is comprised of thirty-one separate series (collectively referred to as the “Portfolios”). These financial statements and notes relate to the MainStay VP Income Builder Portfolio (the “Portfolio”), a “diversified” portfolio, as that term is defined in the 1940 Act, as interpreted or modified by regulatory authorities having jurisdiction, from time to time.
Shares of the Portfolio are currently offered to certain separate accounts to fund variable annuity policies and variable universal life insurance policies issued by New York Life Insurance and Annuity Corporation (“NYLIAC”), a wholly-owned subsidiary of New York Life Insurance Company (“New York Life”) and may also be offered to fund variable annuity policies and variable universal life insurance policies issued by other insurance companies. NYLIAC allocates shares of the Portfolios to, among others, certain NYLIAC separate accounts. Shares of the Portfolio are also offered to the MainStay VP Conservative Allocation Portfolio, MainStay VP Moderate Allocation Portfolio, MainStay VP Moderate Growth Allocation Portfolio and MainStay VP Growth Allocation Portfolio, which operate as “funds-of-funds,” and other variable insurance funds.
The Portfolio currently offers two classes of shares. Initial Class shares commenced operations on January 29, 1993. Service Class shares commenced operations on June 4, 2003. Shares of the Portfolio are offered and are redeemed at a price equal to their respective net asset value (“NAV”) per share. No sales or redemption charge is applicable to the purchase or redemption of the Portfolio’s shares. Under the terms of the Fund’s multiple class plan, adopted pursuant to Rule 18f-3 under the 1940 Act, the classes differ in that, among other things, Service Class shares of the Portfolio pay a combined distribution and service fee of 0.25% of average daily net assets attributable to Service Class shares of the Portfolio to the Distributor (as defined in Note 3(B)) pursuant to a plan adopted in accordance with Rule 12b-1 under the 1940 Act. Contract owners of variable annuity contracts purchased after June 2, 2003, are permitted to invest only in the Service Class shares.
The Portfolio’s investment objective is to seek current income consistent with reasonable opportunity for future growth of capital and income.
Note 2–Significant Accounting Policies
The Portfolio is an investment company and accordingly follows the investment company accounting and reporting guidance of the Financial Accounting Standards Board (“FASB”) Accounting Standard Codification Topic 946 Financial Services – Investment Companies. The Portfolio prepares its financial statements in accordance with generally accepted accounting principles (“GAAP”) in the United States of America and follows the significant accounting policies described below.
(A) Securities Valuation. Investments are usually valued as of the close of regular trading on the New York Stock Exchange (the “Exchange”) (usually 4:00 p.m. Eastern time) on each day the Portfolio is open for business (“valuation date”).
The Board of Trustees of the Fund (the “Board”) adopted procedures establishing methodologies for the valuation of the Portfolio’s securities and other assets and delegated the responsibility for valuation determinations under those procedures to the Valuation Committee of the Fund (the “Valuation Committee”). The procedures state that, subject to the oversight of the Board and unless otherwise noted, the responsibility for the day-to-day valuation of portfolio assets (including fair value measurements for the Portfolio’s assets and liabilities) rests with New York Life Investment Management LLC (“New York Life Investments” or the “Manager”), aided to whatever extent necessary by the Subadvisor (as defined in Note 3(A)). To assess the appropriateness of security valuations, the Manager, the Subadvisor or the Portfolio’s third-party service provider, who is subject to oversight by the Manager, regularly compares prior day prices, prices on comparable securities and the sale prices to the prior and current day prices and challenges prices with changes exceeding certain tolerance levels with third-party pricing services or broker sources.
The Board authorized the Valuation Committee to appoint a Valuation Subcommittee (the “Subcommittee”) to establish the prices of securities for which market quotations are not readily available or the prices of which are not otherwise readily determinable under the procedures. The Subcommittee meets (in person, via electronic mail or via teleconference) on an as-needed basis. The Valuation Committee meets to ensure that actions taken by the Subcommittee were appropriate.
For those securities valued through either a standardized fair valuation methodology or a fair valuation measurement, the Subcommittee deals with such valuation and the Valuation Committee reviews and affirms, if appropriate, the reasonableness of the valuation based on such methodologies and measurements on a regular basis after considering information that is reasonably available and deemed relevant by the Valuation Committee. Any action taken by the Subcommittee with respect to the valuation of a portfolio security or other asset is submitted for review and ratification (if appropriate) to the Valuation Committee and the Board at the next regularly scheduled meeting.
“Fair value” is defined as the price the Portfolio would reasonably expect to receive upon selling an asset or liability in an orderly transaction to an independent buyer in the principal or most advantageous market for the asset or liability. Fair value measurements are determined within a framework that establishes a three-tier hierarchy that maximizes the use of observable market data and minimizes the use of unobservable inputs to establish a classification of fair value measurements for disclosure purposes. “Inputs” refer broadly to the assumptions that market participants would use in pricing the asset or liability, including assumptions about risk, such as the risk inherent in a particular valuation technique used to measure fair value using a pricing model and/or the risk inherent in the inputs for the valuation technique. Inputs may be observable or unobservable. Observable inputs reflect the assumptions market participants would use in pricing the asset or liability based on market data obtained from sources independent of the Portfolio. Unobservable inputs reflect the Portfolio’s own assumptions about the assumptions market participants would use in pricing the asset or liability based on the information available. The inputs or methodology used for valuing assets or liabilities may not be an indication of the risks associated with investing in those assets or liabilities. The three-tier hierarchy of inputs is summarized below.
| | |
| 32 | | MainStay VP Income Builder Portfolio |
| • | | Level 1—quoted prices in active markets for an identical asset or liability |
| • | | Level 2—other significant observable inputs (including quoted prices for a similar asset or liability in active markets, interest rates and yield curves, prepayment speeds, credit risk, etc.) |
| • | | Level 3—significant unobservable inputs (including the Portfolio’s own assumptions about the assumptions that market participants would use in measuring fair value of an asset or liability) |
The level of an asset or liability within the fair value hierarchy is based on the lowest level of an input, both individually and in the aggregate, that is significant to the fair value measurement. The aggregate value by input level of the Portfolio’s assets and liabilities as of June 30, 2020 is included at the end of the Portfolio of Investments.
The Portfolio may use third-party vendor evaluations, whose prices may be derived from one or more of the following standard inputs, among others:
| | |
• Benchmark yields | | • Reported trades |
• Broker/dealer quotes | | • Issuer spreads |
• Two-sided markets | | • Benchmark securities |
• Bids/offers | | • Reference data (corporate actions or material event notices) |
• Industry and economic events | | • Comparable bonds |
• Monthly payment information | | |
An asset or liability for which market values cannot be measured using the methodologies described above is valued by methods deemed reasonable in good faith by the Valuation Committee, following the procedures established by the Board, to represent fair value. Under these procedures, the Portfolio generally uses a market-based approach which may use related or comparable assets or liabilities, recent transactions, market multiples, book values and other relevant information. The Portfolio may also use an income-based valuation approach in which the anticipated future cash flows of the asset or liability are discounted to calculate fair value. Discounts may also be applied due to the nature and/or duration of any restrictions on the disposition of the asset or liability. Fair value represents a good faith approximation of the value of a security. Fair value determinations involve the consideration of a number of subjective factors, an analysis of applicable facts and circumstances and the exercise of judgment. As a result, it is possible that the fair value for a security determined in good faith in accordance with the Portfolio’s valuation procedures may differ from valuations for the same security determined by other funds using their own valuation procedures. Although the Portfolio’s valuation procedures are designed to value a security at the price the Portfolio may reasonably expect to receive upon the security’s sale in an orderly transaction, there can be no assurance that any fair value determination thereunder would, in fact, approximate the amount that the Portfolio would actually realize upon the sale of the security or the price at which the security would trade if a reliable market price were readily available. During the six-month period ended June 30, 2020, there were no material changes to the fair value methodologies.
Securities which may be valued in this manner include, but are not limited to: (i) a security for which trading has been halted or suspended;
(ii) a debt security that has recently gone into default and for which there is not a current market quotation; (iii) a security of an issuer that has entered into a restructuring; (iv) a security that has been delisted from a national exchange; (v) a security for which the market price is not readily available from a third-party pricing source or, if so provided, does not, in the opinion of the Manager or the Subadvisors, reflect the security’s market value; (vi) a security subject to trading collars for which no or limited trading takes place; and (vii) a security whose principal market has been temporarily closed at a time when, under normal conditions, it would be open. Securities valued in this manner are generally categorized as Level 3 in the hierarchy. As of June 30, 2020, securities that were fair valued in such a manner are shown in the Portfolio of Investments.
Certain securities held by the Portfolio may principally trade in foreign markets. Events may occur between the time the foreign markets close and the time at which the Portfolio’s NAVs are calculated. These events may include, but are not limited to, situations relating to a single issuer in a market sector, significant fluctuations in U.S. or foreign markets, natural disasters, armed conflicts, governmental actions or other developments not tied directly to the securities markets. Should the Manager or Subadvisors conclude that such events may have affected the accuracy of the last price of such securities reported on the local foreign market, the Subcommittee may, pursuant to procedures adopted by the Board, adjust the value of the local price to reflect the estimated impact on the price of such securities as a result of such events. In this instance, securities are generally categorized as Level 3 in the hierarchy. Additionally, certain foreign equity securities are also fair valued whenever the movement of a particular index exceeds certain thresholds. In such cases, the securities are fair valued by applying factors provided by a third-party vendor in accordance with valuation procedures adopted by the Board and are generally categorized as Level 2 in the hierarchy. As of June 30, 2020, securities that were fair valued in such a manner are shown in the Portfolio of Investments.
Equity securities are valued at the last quoted sales prices as of the close of regular trading on the relevant exchange on each valuation date. Securities that are not traded on the valuation date are valued at the mean of the last quoted bid and ask prices. Prices are normally taken from the principal market in which each security trades. Futures contracts are valued at the last posted settlement price on the market where such futures are primarily traded. These securities are generally categorized as Level 1 in the hierarchy.
Investments in mutual funds, including money market funds, are valued at their respective NAVs as of the close of the Exchange on the valuation date. These securities are generally categorized as Level 1 in the hierarchy.
Debt securities (other than convertible and municipal bonds) are valued at the evaluated bid prices (evaluated mean prices in the case of convertible and municipal bonds) supplied by a pricing agent or brokers selected by the Manager, in consultation with the Subadvisors. The evaluations are market-based measurements processed through a pricing application and represents the pricing agent’s good faith determination as to what a holder may receive in an orderly transaction under market conditions. The rules based logic utilizes valuation techniques that reflect participants’ assumptions and vary by asset class and per methodology, maximizing the use of relevant observable data
Notes to Financial Statements (Unaudited) (continued)
including quoted prices for similar assets, benchmark yield curves and market corroborated inputs. The evaluated bid or mean prices are deemed by the Manager, in consultation with the Subadvisors to be representative of market values at the regular close of trading of the Exchange on each valuation date. Debt securities purchased on a delayed delivery basis are marked to market daily until settlement at the forward settlement date. Debt securities, including corporate bonds, U.S. government and federal agency bonds, municipal bonds, foreign bonds, convertible bonds, asset-backed securities and mortgage-backed securities are generally categorized as Level 2 in the hierarchy.
Foreign currency forward contracts are valued at their fair market values measured on the basis of the mean between the last current bid and ask prices based on dealer or exchange quotations and are generally categorized as Level 2 in the hierarchy.
Loan assignments, participations and commitments are valued at the average of bid quotations obtained from the engaged independent pricing service and are generally categorized as Level 2 in the hierarchy. Certain loan assignments, participations and commitments may be valued by utilizing significant unobservable inputs obtained from the pricing service and are generally categorized as Level 3 in the hierarchy. As of June 30, 2020, no securities held by the Portfolio were fair valued in such a manner.
Temporary cash investments acquired in excess of 60 days to maturity at the time of purchase are valued using the latest bid prices or using valuations based on a matrix system (which considers such factors as security prices, yields, maturities and ratings), both as furnished by independent pricing services. Temporary cash investments that mature in 60 days or less at the time of purchase (“Short-Term Investments”) are valued using the amortized cost method of valuation, unless the use of such method would be inappropriate. The amortized cost method involves valuing a security at its cost on the date of purchase and thereafter assuming a constant amortization to maturity of the difference between such cost and the value on maturity date. Amortized cost approximates the current fair value of a security. Securities valued using the amortized cost method are not valued using quoted prices in an active market and are generally categorized as Level 2 in the hierarchy.
The information above is not intended to reflect an exhaustive list of the methodologies that may be used to value portfolio investments. The valuation procedures permit the use of a variety of valuation methodologies in connection with valuing portfolio investments. The methodology used for a specific type of investment may vary based on the market data available or other considerations. The methodologies summarized above may not represent the specific means by which portfolio investments are valued on any particular business day.
A portfolio investment may be classified as an illiquid investment under the Portfolio’s written liquidity risk management program and related procedures (“Liquidity Program”). Illiquidity of an investment might prevent the sale of such investment at a time when the Manager or the Subadvisors might wish to sell, and these investments could have the effect of decreasing the overall level of the Portfolio’s liquidity. Further, the lack of an established secondary market may make it more difficult to value illiquid investments, requiring the Portfolio to rely on judgments that may be somewhat subjective in measuring value, which could vary materially from the amount that the Portfolio could realize upon
disposition. Difficulty in selling illiquid investments may result in a loss or may be costly to the Portfolio. An illiquid investment is any investment that the Manager or Subadvisors reasonably expects cannot be sold or disposed of in current market conditions in seven calendar days or less without the sale or disposition significantly changing the market value of the investment. The liquidity classification of each investment will be made using information obtained after reasonable inquiry and taking into account, among other things, relevant market, trading and investment-specific considerations in accordance with the Liquidity Program. Illiquid investments are often valued in accordance with methods deemed by the Board in good faith to be reasonable and appropriate to accurately reflect their fair value. The liquidity of the Portfolio’s investments, as shown in the Portfolio of Investments, was determined as of June 30, 2020 and can change at any time.
Illiquid investments as of June 30, 2020, are shown in the Portfolio of Investments.
(B) Income Taxes. The Portfolio’s policy is to comply with the requirements of the Internal Revenue Code of 1986, as amended (the “Internal Revenue Code”), applicable to regulated investment companies and to distribute all of its taxable income to the shareholders of the Portfolio within the allowable time limits. Therefore, no federal, state and local income tax provisions are required.
The Manager evaluates the Portfolio’s tax positions to determine if the tax positions taken meet the minimum recognition threshold in connection with accounting for uncertainties in income tax positions taken or expected to be taken for the purposes of measuring and recognizing tax liabilities in the financial statements. Recognition of tax benefits of an uncertain tax position is permitted only to the extent the position is “more likely than not” to be sustained assuming examination by taxing authorities. The Manager analyzed the Portfolio’s tax positions taken on federal, state and local income tax returns for all open tax years (for up to three tax years) and has concluded that no provisions for federal, state and local income tax are required in the Portfolio’s financial statements. The Portfolio’s federal, state and local income tax and federal excise tax returns for tax years for which the applicable statutes of limitations have not expired are subject to examination by the Internal Revenue Service and state and local departments of revenue.
(C) Foreign Taxes. The Portfolio may be subject to foreign taxes on income and other transaction-based taxes imposed by certain countries in which it invests. A portion of the taxes on gains on investments or currency purchases/repatriation may be reclaimable. The Portfolio will accrue such taxes and reclaims as applicable, based upon its current interpretation of tax rules and regulations that exist in the markets in which it invests.
The Portfolio may be subject to taxation on realized capital gains, repatriation proceeds and other transaction-based taxes imposed by certain countries in which it invests. The Portfolio will accrue such taxes as applicable based upon its current interpretation of tax rules and regulations that exist in the market in which it invests. Capital gains taxes relating to positions still held are reflected as a liability in the Statement of Assets and Liabilities, as well as an adjustment to the Portfolio’s net unrealized appreciation (depreciation). Taxes related to capital gains realized, if any, are reflected as part of net realized gain (loss) in the Statement of Operations. Changes in tax liabilities related to capital gains taxes on unrealized investment gains, if any, are reflected as part
| | |
| 34 | | MainStay VP Income Builder Portfolio |
of the change in net unrealized appreciation (depreciation) on investments in the Statement of Operations. Transaction-based charges are generally assessed as a percentage of the transaction amount.
(D) Dividends and Distributions to Shareholders. Dividends and distributions are recorded on the ex-dividend date. The Portfolio intends to declare and pay dividends from net investment income, if any, at least quarterly and distributions from net realized capital and currency gains, if any, at least annually. Unless a shareholder elects otherwise, all dividends and distributions are reinvested at NAV in the same class of shares of the Portfolio. Dividends and distributions to shareholders are determined in accordance with federal income tax regulations and may differ from determinations using GAAP.
(E) Security Transactions and Investment Income. The Portfolio records security transactions on the trade date. Realized gains and losses on security transactions are determined using the identified cost method. Dividend income is recognized on the ex-dividend date, net of any foreign tax withheld at the source, and interest income is accrued as earned using the effective interest rate method and includes any realized gains and losses from repayments of principal on mortgage-backed securities. Distributions received from real estate investment trusts may be classified as dividends, capital gains and/or return of capital. Discounts and premiums on securities purchased for the Portfolio are accreted and amortized, respectively, on the effective interest rate method.
Investment income and realized and unrealized gains and losses on investments of the Portfolio are allocated pro rata to the separate classes of shares based upon their relative net assets on the date the income is earned or realized and unrealized gains and losses are incurred.
The Portfolio may place a debt security on non-accrual status and reduce related interest income by ceasing current accruals and writing off all or a portion of any interest receivables when the collection of all or a portion of such interest has become doubtful. A debt security is removed from non-accrual status when the issuer resumes interest payments or when collectability of interest is reasonably assured.
(F) Expenses. Expenses of the Fund are allocated to the individual Portfolios in proportion to the net assets of the respective Portfolios when the expenses are incurred, except where direct allocations of expenses can be made. Expenses (other than fees incurred under the distribution and service plans, further discussed in Note 3(B), which are charged directly to the Service Class shares) are allocated to separate classes of shares pro rata based upon their relative net assets on the date the expenses are incurred. The expenses borne by the Portfolio, including those of related parties to the Portfolio, are shown in the Statement of Operations.
Additionally, the Portfolio may invest in mutual funds, which are subject to management fees and other fees that may cause the costs of investing in mutual funds to be greater than the costs of owning the underlying securities directly. These indirect expenses of mutual funds are not included in the amounts shown as expenses in the Portfolio’s Statement of Operations or in the expense ratios included in the Financial Highlights.
(G) Use of Estimates. In preparing financial statements in conformity with GAAP, the Manager makes estimates and assumptions that affect the reported amounts and disclosures in the financial statements. Actual results could differ from those estimates.
(H) Repurchase Agreements. The Portfolio may enter into repurchase agreements (i.e., buy a security from another party with the agreement that it will be sold back in the future) to earn income. The Portfolio may enter into repurchase agreements only with counterparties, usually financial institutions, that are deemed by the Manager or the Subadvisors to be creditworthy, pursuant to guidelines established by the Board. During the term of any repurchase agreement, the Manager or the Subadvisors will continue to monitor the creditworthiness of the counterparty. Under the 1940 Act, repurchase agreements are considered to be collateralized loans by the Portfolio to the counterparty secured by the securities transferred to the Portfolio.
Repurchase agreements are subject to counterparty risk, meaning the Portfolio could lose money by the counterparty’s failure to perform under the terms of the agreement. The Portfolio mitigates this risk by ensuring the repurchase agreement is collateralized by cash, U.S. government securities, fixed income securities and/or other securities. The collateral is held by the Portfolio’s custodian and valued daily on a mark to market basis to determine if the value, including accrued interest, exceeds the repurchase price. In the event of the counterparty’s default on the obligation to repurchase, the Portfolio has the right to liquidate the collateral and apply the proceeds in satisfaction of the obligation. Under certain circumstances, such as in the event of default or bankruptcy by the counterparty, realization and/or retention of the collateral may be limited or subject to delay, to legal proceedings and possible realized loss to the Portfolio. As of June 30, 2020, the Portfolio did not hold any repurchase agreements.
(I) Futures Contracts. A futures contract is an agreement to purchase or sell a specified quantity of an underlying instrument at a specified future date and price, or to make or receive a cash payment based on the value of a financial instrument (e.g., foreign currency, interest rate, security or securities index). The Portfolio is subject to risks such as market price risk and/or interest rate risk in the normal course of investing in these contracts. Upon entering into a futures contract, the Portfolio is required to pledge to the broker or futures commission merchant an amount of cash and/or U.S. government securities equal to a certain percentage of the collateral amount, known as the “initial margin.” During the period the futures contract is open, changes in the value of the contract are recognized as unrealized appreciation or depreciation by marking to market such contract on a daily basis to reflect the market value of the contract at the end of each day’s trading. The Portfolio agrees to receive from or pay to the broker or futures commission merchant an amount of cash equal to the daily fluctuation in the value of the contract. Such receipts or payments are known as “variation margin.” When the futures contract is closed, the Portfolio records a realized gain or loss equal to the difference between the proceeds from (or cost of) the closing transaction and the Portfolio’s basis in the contract.
The use of futures contracts involves, to varying degrees, elements of market risk in excess of the amount recognized in the Statement of Assets and Liabilities. The contract or notional amounts and variation margin reflect the extent of the Portfolio’s involvement in open futures
Notes to Financial Statements (Unaudited) (continued)
positions. There are several risks associated with the use of futures contracts as hedging techniques. There can be no assurance that a liquid market will exist at the time when the Portfolio seeks to close out a futures contract. If no liquid market exists, the Portfolio would remain obligated to meet margin requirements until the position is closed. Futures contracts may involve a small initial investment relative to the risk assumed, which could result in losses greater than if the Portfolio did not invest in futures contracts. Futures contracts may be more volatile than direct investments in the instrument underlying the futures and may not correlate to the underlying instrument, causing a given hedge not to achieve its objectives. The Portfolio’s activities in futures contracts have minimal counterparty risk as they are conducted through regulated exchanges that guarantee the futures against default by the counterparty. In the event of a bankruptcy or insolvency of a futures commission merchant that holds margin on behalf of the Portfolio, the Portfolio may not be entitled to the return of the entire margin owed to the Portfolio, potentially resulting in a loss. The Portfolio may invest in futures contracts in order to hedge against anticipated changes in interest rates that might otherwise have an adverse effect upon the value of the Portfolio’s securities. The Portfolio may also use equity index futures contracts to increase the equity sensitivity to the Portfolio. The Portfolio’s investment in futures contracts and other derivatives may increase the volatility of the Portfolio’s NAVs and may result in a loss to the Portfolio. Open futures contracts as of June 30, 2020, are shown in the Portfolio of Investments.
(J) Foreign Currency Forward Contracts. The Portfolio may enter into foreign currency forward contracts, which are agreements to buy or sell foreign currencies on a specified future date at a specified rate. The Portfolio is subject to foreign currency exchange rate risk in the normal course of investing in these transactions. During the period the forward contract is open, changes in the value of the contract are recognized as unrealized appreciation or depreciation by marking to market such contract on a daily basis to reflect the market value of the contract at the end of each day’s trading. Cash movement occurs on settlement date. When the forward contract is closed, the Portfolio records a realized gain or loss equal to the difference between the proceeds from (or cost of) the closing transaction and the Portfolio’s basis in the contract. The Portfolio may purchase and sell foreign currency forward contracts for purposes of seeking to enhance portfolio returns and manage portfolio risk more efficiently. Foreign currency forward contracts may also be used to gain exposure to a particular currency or to hedge against the risk of loss due to changing currency exchange rates. Foreign currency forward contracts to purchase or sell a foreign currency may also be used in anticipation of future purchases or sales of securities denominated in foreign currency, even if the specific investments have not yet been selected.
The use of foreign currency forward contracts involves, to varying degrees, elements of risk in excess of the amount recognized in the Statement of Assets and Liabilities, including counterparty risk, market risk and illiquidity risk. Counterparty risk is heightened for these instruments because foreign currency forward contracts are not exchange-traded and therefore no clearinghouse or exchange stands ready to meet the obligations under such contracts. Thus, the Portfolio faces the risk that its counterparties under such contracts may not perform their obligations. Market risk is the risk that the value of a foreign currency forward contract will depreciate due to unfavorable changes in
exchange rates. Illiquidity risk arises because the secondary market for foreign currency forward contracts may have less liquidity relative to markets for other securities and financial instruments. Risks also arise from the possible movements in the foreign exchange rates underlying these instruments. While the Portfolio may enter into forward contracts to reduce currency exchange risks, changes in currency exchange rates may result in poorer overall performance for the Portfolio than if it had not engaged in such transactions. Exchange rate movements can be large, depending on the currency, and can last for extended periods of time, affecting the value of the Portfolio’s assets. Moreover, there may be an imperfect correlation between the Portfolio’s holdings of securities denominated in a particular currency and forward contracts entered into by the Portfolio. Such imperfect correlation may prevent the Portfolio from achieving the intended hedge or expose the Portfolio to the risk of currency exchange loss. The unrealized appreciation (depreciation) on forward contracts also reflects the Portfolio’s exposure at the valuation date to credit loss in the event of a counterparty’s failure to perform its obligations. Open foreign currency forward contracts as of June 30, 2020, are shown in the Portfolio of Investments.
(K) Foreign Currency Transactions. The Portfolio’s books and records are maintained in U.S. dollars. Prices of securities denominated in foreign currency amounts are translated into U.S. dollars at the mean between the buying and selling rates last quoted by any major U.S. bank at the following dates:
| (i) | market value of investment securities, other assets and liabilities—at the valuation date; and |
| (ii) | purchases and sales of investment securities, income and expenses—at the date of such transactions. |
The assets and liabilities that are denominated in foreign currency amounts are presented at the exchange rates and market values at the close of the period. The realized and unrealized changes in net assets arising from fluctuations in exchange rates and market prices of securities are not separately presented.
Net realized gain (loss) on foreign currency transactions represents net currency gains or losses realized as a result of differences between the amounts of securities sale proceeds or purchase cost, dividends, interest and withholding taxes as recorded on the Portfolio’s books, and the U.S. dollar equivalent amount actually received or paid. Net currency gains or losses from valuing such foreign currency denominated assets and liabilities, other than investments at valuation date exchange rates, are reflected in unrealized foreign exchange gains or losses.
(L) Loan Assignments, Participations and Commitments. The Portfolio may invest in loan assignments and participations (“loans”). Commitments are agreements to make money available to a borrower in a specified amount, at a specified rate and within a specified time. The Portfolio records an investment when the borrower withdraws money on a commitment or when a funded loan is purchased (trade date) and records interest as earned. These loans pay interest at rates that are periodically reset by reference to a base lending rate plus a spread. These base lending rates are generally the prime rate offered by a designated U.S. bank or the London Interbank Offered Rate (“LIBOR”).
| | |
| 36 | | MainStay VP Income Builder Portfolio |
The loans in which the Portfolio may invest are generally readily marketable, but may be subject to some restrictions on resale. For example, the Portfolio may be contractually obligated to receive approval from the agent bank and/or borrower prior to the sale of these investments. If the Portfolio purchases an assignment from a lender, the Portfolio will generally have direct contractual rights against the borrower in favor of the lender. If the Portfolio purchases a participation interest either from a lender or a participant, the Portfolio typically will have established a direct contractual relationship with the seller of the participation interest, but not with the borrower. Consequently, the Portfolio is subject to the credit risk of the lender or participant who sold the participation interest to the Portfolio, in addition to the usual credit risk of the borrower. In the event that the borrower, selling participant or intermediate participants become insolvent or enter into bankruptcy, the Portfolio may incur certain costs and delays in realizing payment, or may suffer a loss of principal and/or interest.
Unfunded commitments represent the remaining obligation of the Portfolio to the borrower. At any point in time, up to the maturity date of the issue, the borrower may demand the unfunded portion. Unfunded amounts, if any, are marked to market and any unrealized gains or losses are recorded in the Statement of Assets and Liabilities. As of June 30, 2020, the Portfolio did not hold any unfunded commitments.
(M) Securities Lending. In order to realize additional income, the Portfolio may engage in securities lending, subject to the limitations set forth in the 1940 Act and relevant guidance by the staff of the Securities and Exchange Commission (“SEC”). If the Portfolio engages in securities lending, the Portfolio will lend through its custodian, currently State Street Bank and Trust Company (“State Street”), acting as securities lending agent on behalf of the Portfolio. Under the current arrangement, State Street will manage the Portfolio’s collateral in accordance with the securities lending agency agreement between the Portfolio and State Street, and indemnify the Portfolio against counterparty risk. The loans will be collateralized by cash (which may be invested in a money market fund) and/or non-cash collateral (which may include U.S. Treasury securities and/or U.S. government agency securities issued or guaranteed by the United States government or its agencies or instrumentalities) at least equal at all times to the market value of the securities loaned. The Portfolio bears the risk of delay in recovery of, or loss of rights in, the securities loaned. The Portfolio may also record a realized gain or loss on securities deemed sold due to a borrower’s inability to return securities on loan. The Portfolio bears the risk of any loss on investment of cash collateral. The Portfolio will receive compensation for lending its securities in the form of fees or it will retain a portion of interest earned on the investment of any cash collateral. The Portfolio will also continue to receive interest and dividends on the securities loaned and any gain or loss in the market price of the securities loaned that may occur during the term of the loan will be for the account of the Portfolio. Income earned from securities lending activities, if any, is reflected in the Statement of Operations. As of June 30, 2020, the Portfolio had securities on loan with an aggregate market value of $1,286,837; the total market value of collateral held by the Portfolio was $1,319,899. The market value of the collateral held included non-cash collateral, in the form of U.S. Treasury securities, with a value of $492,856 and cash collateral, which was invested into the State Street Navigator Securities Lending Government Money Market Portfolio, with a value of $827,043.
(N) Dollar Rolls. The Portfolio may enter into dollar roll transactions in which it sells mortgage-backed securities (“MBS”) from its portfolio to a counterparty from whom it simultaneously agrees to buy a similar security on a delayed delivery basis. The Portfolio generally transfers MBS where the MBS are “to be announced,” therefore, the Portfolio accounts for these transactions as purchases and sales.
When accounted for as purchase and sales, the securities sold in connection with the dollar rolls are removed from the portfolio and a realized gain or loss is recognized. The securities the Portfolio has agreed to acquire are included at market value in the Portfolio of Investments and liabilities for such purchase commitments are included as payables for investments purchased. During the roll period, the Portfolio foregoes principal and interest paid on the securities. The Portfolio is compensated by the difference between the current sales price and the forward price for the future as well as by the earnings on the cash proceeds of the initial sale. Dollar rolls may be renewed without physical delivery of the securities subject to the contract. The Portfolio maintains liquid assets from its portfolio having a value not less than the repurchase price, including accrued interest. Dollar roll transactions involve certain risks, including the risk that the securities returned to the Portfolio at the end of the roll period, while substantially similar, could be inferior to what was initially sold to the counterparty.
The Portfolio accounts for a dollar roll transaction as a purchase and sale whereby the difference in the sales price and purchase price of the security sold is recorded as a realized gain (loss).
(O) Securities Risk. The ability of issuers of debt securities held by the Portfolio to meet their obligations may be affected by, among other things, economic or political developments in a specific country, industry or region. Debt securities are also subject to the risks associated with changes in interest rates.
The Portfolio may invest in high-yield debt securities (sometimes called ‘‘junk bonds’’), which are generally considered speculative because they present a greater risk of loss, including default, than higher quality debt securities. These securities pay investors a premium—a higher interest rate or yield than investment grade debt securities—because of the increased risk of loss. These securities can also be subject to greater price volatility. In times of unusual or adverse market, economic or political conditions, these securities may experience higher than normal default rates.
The Portfolio may invest in foreign securities, which carry certain risks that are in addition to the usual risks inherent in domestic securities. These risks include those resulting from currency fluctuations, future adverse political or economic developments and possible imposition of currency exchange blockages or other foreign governmental laws or restrictions. These risks are likely to be greater in emerging markets than in developed markets. The ability of issuers of securities held by the Portfolio to meet their obligations may be affected by, among other things, economic or political developments in a specific country, industry or region.
The Portfolio may invest in loans which are usually rated below investment grade and are generally considered speculative because they present a greater risk of loss, including default, than higher rated debt securities. These investments pay investors a higher interest rate than investment grade debt securities because of the increased risk of loss.
Notes to Financial Statements (Unaudited) (continued)
Although certain loans are collateralized, there is no guarantee that the value of the collateral will be sufficient to repay the loan. In a recession or serious credit event, the value of these investments could decline significantly. As a result, the Portfolio’s NAVs could go down and you could lose money.
In addition, loans generally are subject to extended settlement periods that may be longer than seven days. As a result, the Portfolio may be adversely affected by selling other investments at an unfavorable time and/or under unfavorable conditions or engaging in borrowing transactions, such as borrowing against its credit facility, to raise cash to meet redemption obligations or pursue other investment opportunities.
In certain circumstances, loans may not be deemed to be securities. As a result, the Portfolio may not have the protection of anti-fraud provisions of the federal securities laws. In such cases, the Portfolio generally must rely on the contractual provisions in the loan agreement and common-law fraud protections under applicable state law.
(P) Counterparty Credit Risk. In order to better define its contractual rights and to secure rights that will help the Portfolio mitigate its counterparty risk, the Portfolio may enter into an International Swaps and Derivatives Association, Inc. Master Agreement (“ISDA Master Agreement”) or similar agreement with its counterparties. An ISDA Master Agreement is a bilateral agreement between the Portfolio and a counterparty that governs certain OTC derivatives and typically contains collateral posting terms and netting provisions. Under an ISDA Master Agreement, the Portfolio may, under certain circumstances, offset with the counterparty certain derivative financial instruments’ payables and/or receivables with collateral held and/or posted and create one single net payment. The provisions of the ISDA Master Agreement typically permit a single net payment in the event of default including the bankruptcy or insolvency of the counterparty. Bankruptcy or insolvency laws of a particular jurisdiction may restrict or prohibit the right of offset in bankruptcy, insolvency or other events. In addition, certain ISDA Master Agreements may contain provisions for early termination of OTC derivative transactions in the event the net assets of the Portfolio decline below specific levels or if the Portfolio fails to meet the terms of its ISDA Master Agreements. The result would cause the Portfolio to accelerate payment of any net liability owed to the counterparty.
For financial reporting purposes, the Portfolio does not offset derivative assets and derivative liabilities that are subject to netting arrangements, if any, in the Statement of Assets and Liabilities.
(Q) LIBOR Replacement Risk. The Portfolio may invest in certain debt securities, derivatives or other financial instruments that utilize the LIBOR as a “benchmark” or “reference rate” for various interest rate calculations. The United Kingdom Financial Conduct Authority, which regulates LIBOR, announced that after 2021 it will cease its active encouragement of banks to provide the quotations needed to sustain LIBOR. As a result, it is anticipated that LIBOR will be discontinued or will no longer be sufficiently robust to be representative of its underlying market around that time. Although financial regulators and industry working groups have suggested alternative reference rates, such as the European Interbank Offer Rate (“EURIBOR”), Sterling Overnight Interbank Average Rate (“SONIA”) and Secured Overnight Financing Rate
(“SOFR”), there are challenges to converting certain contracts and transactions to a new benchmark and neither the full effects of the transition process nor its ultimate outcome is known.
The elimination of LIBOR or changes to other reference rates or any other changes or reforms to the determination or supervision of reference rates could have an adverse impact on the market for, or value of, any securities or payments linked to those reference rates, which may adversely affect the Portfolio’s performance and/or net asset value. Uncertainty and risk also remain regarding the willingness and ability of issuers and lenders to include revised provisions in new and existing contracts or instruments. Consequently, the transition away from LIBOR to other reference rates may lead to increased volatility and illiquidity in markets that are tied to LIBOR, fluctuations in values of LIBOR-related investments or investments in issuers that utilize LIBOR, increased difficulty in borrowing or refinancing and diminished effectiveness of hedging strategies, adversely affecting the Portfolio’s performance. Furthermore, the risks associated with the expected discontinuation of LIBOR and transition may be exacerbated if the work necessary to effect an orderly transition to an alternative reference rate is not completed in a timely manner. Because the usefulness of LIBOR as a benchmark could deteriorate during the transition period, these effects could occur prior to the end of 2021.
(R) Indemnifications. Under the Fund’s organizational documents, its officers and trustees are indemnified against certain liabilities that may arise out of performance of their duties to the Fund. Additionally, in the normal course of business, the Portfolio enters into contracts with third-party service providers that contain a variety of representations and warranties and that may provide general indemnifications. The Portfolio’s maximum exposure under these arrangements is unknown, as this would involve future claims that may be made against the Portfolio that have not yet occurred. The Manager believes that the risk of loss in connection with these potential indemnification obligations is remote. However, there can be no assurance that material liabilities related to such obligations will not arise in the future, which could adversely impact the Portfolio.
(S) Quantitative Disclosure of Derivative Holdings. The following tables show additional disclosures related to the Portfolio’s derivative and hedging activities, including how such activities are accounted for and their effect on the Portfolio’s financial positions, performance and cash flows. The Portfolio entered into Treasury futures contracts in order to hedge against anticipated changes in interest rates that might otherwise have an adverse effect upon the value of the Portfolio’s securities. The Portfolio also entered into domestic and foreign equity index futures contracts to increase the equity sensitivity to the Portfolio. Foreign currency forward contracts were used to gain exposure to a particular currency or to hedge against the risk of loss due to changing currency exchange rates. These derivatives are not accounted for as hedging instruments.
| | |
| 38 | | MainStay VP Income Builder Portfolio |
Fair value of derivative instruments as of June 30, 2020:
Asset Derivatives
| | | | | | | | | | | | | | | | | | |
| | | Statement of
Assets and Liabilities
Location | | Foreign
Exchange
Contracts
Risk | | | Equity
Contracts
Risk | | | Interest
Rate
Contracts
Risk | | | Total | |
| | | | | |
Futures Contracts | | Net Assets—Net unrealized appreciation on investments and futures contracts (a) | | $ | — | | | $ | 1,248,422 | | | $ | 113,116 | | | $ | 1,361,538 | |
Forward Contracts | | Unrealized appreciation on foreign currency forward contracts | | | 35,751 | | | | — | | | | — | | | | 35,751 | |
| | | | | | |
Total Fair Value | | | | $ | 35,751 | | | $ | 1,248,422 | | | $ | 113,116 | | | $ | 1,397,289 | |
| | | | | | |
Liability Derivatives
| | | | | | | | | | | | | | | | | | |
| | | Statement of
Assets and Liabilities
Location | | Foreign
Exchange
Contracts
Risk | | | Equity
Contracts
Risk | | | Interest
Rate
Contracts
Risk | | | Total | |
| | | | | |
Futures Contracts | | Net Assets—Net unrealized depreciation on investments and futures contracts (a) | | $ | — | | | $ | (783,499 | ) | | $ | (120,035 | ) | | $ | (903,534 | ) |
Forward Contracts | | Unrealized depreciation on foreign currency forward contracts | | | (664,927 | ) | | | — | | | | — | | | | (664,927 | ) |
| | | | | | |
Total Fair Value | | | | $ | (664,927 | ) | | $ | (783,499 | ) | | $ | (120,035 | ) | | $ | (1,568,461 | ) |
| | | | | | |
| (a) | Includes cumulative appreciation (depreciation) of futures contracts as reported in the Portfolio of Investments. Only current day’s variation margin is reported within the Statement of Assets and Liabilities. |
The effect of derivative instruments on the Statement of Operations for the period ended June 30, 2020:
Realized Gain (Loss)
| | | | | | | | | | | | | | | | | | |
| | | Statement of
Operations
Location | | Foreign
Exchange
Contracts
Risk | | | Equity
Contracts
Risk | | | Interest
Rate
Contracts
Risk | | | Total | |
| | | | | |
Futures Contracts | | Net realized gain (loss) on futures transactions | | $ | — | | | $ | (3,899,155 | ) | | $ | 4,861,167 | | | $ | 962,012 | |
Forward Contracts | | Net realized gain (loss) on foreign currency forward transactions | | | 1,514,227 | | | | — | | | | — | | | | 1,514,227 | |
| | | | | | |
Total Realized Gain (Loss) | | | | $ | 1,514,227 | | | $ | (3,899,155 | ) | | $ | 4,861,167 | | | $ | 2,476,239 | |
| | | | | | |
Change in Unrealized Appreciation (Depreciation)
| | | | | | | | | | | | | | | | | | |
| | | Statement of
Operations
Location | | Foreign
Exchange
Contracts
Risk | | | Equity
Contracts
Risk | | | Interest
Rate
Contracts
Risk | | | Total | |
| | | | | |
Futures Contracts | | Net change in unrealized appreciation (depreciation) on futures contracts | | $ | — | | | $ | (734,994 | ) | | $ | 897,399 | | | $ | 162,405 | |
Forward Contracts | | Net change in unrealized appreciation (depreciation) on foreign currency forward contracts | | | 72,954 | | | | — | | | | — | | | | 72,954 | |
| | | | | | |
Total Change in Unrealized Appreciation (Depreciation) | | | | $ | 72,954 | | | $ | (734,994 | ) | | $ | 897,399 | | | $ | 235,359 | |
| | | | | | |
Notes to Financial Statements (Unaudited) (continued)
Average Notional Amount
| | | | | | | | | | | | | | | | |
| | | Foreign
Exchange
Contracts
Risk | | | Equity
Contracts
Risk | | | Interest
Rate
Contracts
Risk | | | Total | |
| | | | |
Futures Contracts Long | | $ | — | | | $ | 77,524,887 | | | $ | 79,908,345 | | | $ | 157,433,232 | |
Futures Contracts Short | | $ | — | | | $ | (3,080,991 | ) | | $ | (23,700,965 | ) | | $ | (26,781,956 | ) |
Forward Contracts Long | | $ | 45,019,698 | | | $ | — | | | $ | — | | | $ | 45,019,698 | |
Forward Contracts Short | | $ | (63,743,360 | ) | | $ | — | | | $ | — | | | $ | (63,743,360 | ) |
| | | | |
Note 3–Fees and Related Party Transactions
(A) Manager and Subadvisors. New York Life Investments, a registered investment adviser and an indirect, wholly-owned subsidiary of New York Life, serves as the Portfolio’s Manager, pursuant to an Amended and Restated Management Agreement (“Management Agreement”). The Manager provides offices, conducts clerical, recordkeeping and bookkeeping services, and keeps most of the financial and accounting records required to be maintained by the Portfolio. Except for the portion of salaries and expenses that are the responsibility of the Portfolio, the Manager pays the salaries and expenses of all personnel affiliated with the Portfolio and certain operational expenses of the Portfolio. The Portfolio reimburses New York Life Investments in an amount equal to the portion of the compensation of the Chief Compliance Officer attributable to the Portfolio. Pursuant to the terms of an Amended and Restated Subadvisory Agreement with New York Life Investments, MacKay Shields LLC (“MacKay Shields” or “Subadvisor”), a registered investment adviser and an indirect, wholly-owned subsidiary of New York Life, serves as a Subadvisor to the Portfolio and is responsible for the day-to-day portfolio management of the fixed-income portion of the Portfolio. Pursuant to the terms of an Amended and Restated Subadvisory Agreement with New York Life Investments, Epoch Investment Partners, Inc. (“Epoch” or “Subadvisor” and, together with MacKay Shields, the “Subadvisors”), a registered investment adviser, also serves as a Subadvisor to the Portfolio and is responsible for the day-to-day portfolio management of the equity portion of the Portfolio. Asset allocation decisions for the Portfolio are made by a committee chaired by New York Life Investments in collaboration with MacKay. New York Life Investments pays for the services of the Subadvisors.
The Fund, on behalf of the Portfolio, pays New York Life Investments in its capacity as the Portfolio’s investment manager and administrator, pursuant to the Management Agreement, a monthly fee for the services performed and the facilities furnished at an annual rate of the Portfolio’s average daily net assets as follows: 0.57% up to $1 billion and 0.55%
in excess of $1 billion. During the six-month period ended June 30, 2020, the effective management fee rate was 0.57%.
During the six-month period ended June 30, 2020, New York Life Investments earned fees from the Portfolio in the amount of $1,697,737 and paid MacKay Shields and Epoch $503,593 and $345,275, respectively.
State Street provides sub-administration and sub-accounting services to the Portfolio pursuant to an agreement with New York Life Investments. These services include calculating the daily NAVs of the Portfolio, maintaining the general ledger and sub-ledger accounts for the calculation of the Portfolio’s NAVs and assisting New York Life Investments in conducting various aspects of the Portfolio’s administrative operations. For providing these services to the Portfolio, State Street is compensated by New York Life Investments.
Pursuant to an agreement between the Fund and New York Life Investments, New York Life Investments is responsible for providing or procuring certain regulatory reporting services for the Portfolio. The Portfolio will reimburse New York Life Investments for the actual costs incurred by New York Life Investments in connection with providing or procuring these services for the Portfolio.
(B) Distribution and Service Fees. The Fund, on behalf of the Portfolio, has entered into a distribution agreement with NYLIFE Distributors LLC (the “Distributor”), an indirect, wholly-owned subsidiary of New York Life. The Portfolio has adopted a distribution plan (the “Plan”) in accordance with the provisions of Rule 12b-1 under the 1940 Act. Under the Plan, the Distributor has agreed to provide, through its affiliates or independent third parties, various distribution-related, shareholder and administrative support services to the Service Class shareholders. For its services, the Distributor is entitled to a combined distribution and service fee accrued daily and paid monthly at an annual rate of 0.25% of the average daily net assets attributable to the Service Class shares of the Portfolio.
(C) Investments in Affiliates (in 000’s). During the six-month period ended June 30, 2020, purchases and sales transactions, income earned from investments and shares held of investment companies managed by New York Life Investments or its affiliates were as follows:
| | | | | | | | | | | | | | | | | | | | | | | | | | | | | | | | | | | | |
Affiliated Investment Company | | Value,
Beginning
of Period | | | Purchases
at Cost | | | Proceeds
from
Sales | | | Net
Realized
Gain/(Loss)
on Sales | | | Change in
Unrealized
Appreciation/
(Depreciation) | | | Value,
End
of Period | | | Dividend
Income | | | Other
Distributions | | | Shares
End of
Period | |
MainStay U.S. Government Liquidity Fund | | $ | 31,151 | | | $ | 188,840 | | | $ | (188,705 | ) | | $ | — | | | $ | — | | | $ | 31,286 | | | $ | 81 | | | $ | — | | | | 31,286 | |
| | |
| 40 | | MainStay VP Income Builder Portfolio |
Note 4–Federal Income Tax
As of June 30, 2020, the cost and unrealized appreciation (depreciation) of the Portfolio’s investment portfolio, including applicable derivative contracts and other financial instruments, as determined on a federal income tax basis, was as follows:
| | | | | | | | | | | | | | | | |
| | | Federal Tax
Cost | | | Gross
Unrealized
Appreciation | | | Gross
Unrealized
(Depreciation) | | | Net
Unrealized
Appreciation/
(Depreciation) | |
| | | | |
Investments in Securities | | $ | 581,202,256 | | | $ | 41,945,683 | | | $ | (24,998,761 | ) | | $ | 16,946,922 | |
During the year ended December 31, 2019, the tax character of distributions paid as reflected in the Statements of Changes in Net Assets was as follows:
| | | | | | |
|
| 2019 | |
Tax-Based
Distributions from Ordinary
Income | | | Tax-Based
Distributions from Long-Term
Gains | |
| |
| $ | 27,360,988 | | | $ | — | |
Note 5–Restricted Securities
Restricted securities are securities which have been purchased through a private offering and cannot be resold to the general public without prior registration under the Securities Act of 1933, as amended. Disposal of these securities may involve time-consuming negotiations and expenses, and it may be difficult to obtain a prompt sale at an acceptable price.
As of June 30, 2020, the Portfolio held the following restricted security.
| | | | | | | | | | | | | | | | | | | | |
Security | | Date of
Acquisition | | | Shares | | | Cost | | | 6/30/20
Value | | | Percent of
Net Assets | |
ION Media Networks, Inc.
Common Stock | | | 3/11/14 | | | | 8 | | | $ | 13 | | | $ | 3,018 | | | | 0.0 | %‡ |
| ‡ | Less than one-tenth of a percent. |
Note 6–Custodian
State Street is the custodian of cash and securities held by the Portfolio. Custodial fees are charged to the Portfolio based on the Portfolio’s net assets and/or the market value of securities held by the Portfolio and the number of certain transactions incurred by the Portfolio.
Note 7–Line of Credit
The Portfolio and certain other funds managed by New York Life Investments maintain a line of credit with a syndicate of banks in order to secure a source of funds for temporary purposes to meet unanticipated or excessive redemption requests.
Effective July 28, 2020, under the credit agreement (the “Credit Agreement”), the aggregate commitment amount is $600,000,000 with an additional uncommitted amount of $100,000,000. The commitment fee is an annual rate of 0.15% of the average commitment amount payable quarterly, regardless of usage, to JP Morgan Chase Bank NA, who serves as the agent to the syndicate. The commitment fee is allocated among the Portfolio and certain other funds managed by New York Life Investments based upon their respective net assets and other factors. Interest on any revolving credit loan is charged based upon the Federal Funds Rate or the one-month London Interbank Offered Rate (“LIBOR”), whichever is higher. The Credit Agreement expires on July 27, 2021, although the Portfolio, certain other funds managed by New York Life Investments and the syndicate of banks may renew the Credit Agreement for an additional year on the same or different terms or enter into a credit agreement with a different syndicate of banks. Prior to July 28, 2020, the aggregate commitment amount and the commitment fee were the same as those under the current Credit
Agreement, but State Street Served as agent to the syndicate. As of June 30, 2020, there were no borrowings outstanding with respect to the Portfolio under the Credit Agreement or the credit agreement for which State Street served as agent.
Note 8–Interfund Lending Program
Pursuant to an exemptive order issued by the SEC, the Portfolio, along with certain other funds managed by New York Life Investments, may participate in an interfund lending program. The interfund lending program provides an alternative credit facility that permits the Portfolio and certain other funds managed by New York Life Investments to lend or borrow money for temporary purposes directly to or from one another, subject to the conditions of the exemptive order. During the six-month period ended June 30, 2020, there were no interfund loans made or outstanding with respect to the Portfolio.
Note 9–Purchases and Sales of Securities (in 000’s)
During the six-month period ended June 30, 2020, purchases and sales of U.S. government securities were $102,671 and $143,680, respectively. Purchases and sales of securities, other than U.S. government securities and short-term securities, were $136,449 and $87,308, respectively.
Notes to Financial Statements (Unaudited) (continued)
Note 10–Capital Share Transactions
Transactions in capital shares for the six-month period ended June 30, 2020 and the year ended December 31, 2019, were as follows:
| | | | | | | | |
Initial Class | | Shares | | | Amount | |
| | |
Six-month period ended June 30, 2020: | | | | | | | | |
Shares sold | | | 244,438 | | | $ | 3,939,854 | |
Shares issued to shareholders in reinvestment of distributions | | | 155,015 | | | | 2,388,693 | |
Shares redeemed | | | (656,565 | ) | | | (10,522,175 | ) |
| | | | |
Net increase (decrease) | | | (257,112 | ) | | $ | (4,193,628 | ) |
| | | | |
Year ended December 31, 2019: | | | | | | | | |
Shares sold | | | 375,597 | | | $ | 6,275,383 | |
Shares issued to shareholders in reinvestment of distributions | | | 545,038 | | | | 9,012,589 | |
Shares redeemed | | | (1,372,799 | ) | | | (22,552,026 | ) |
| | | | |
Net increase (decrease) | | | (452,164 | ) | | $ | (7,264,054 | ) |
| | | | |
| | |
| | | | | | | | |
Service Class | | Shares | | | Amount | |
| | |
Six-month period ended June 30, 2020: | | | | | | | | |
Shares sold | | | 3,022,731 | | | $ | 48,802,460 | |
Shares issued to shareholders in reinvestment of distributions | | | 339,255 | | | | 5,187,100 | |
Shares redeemed | | | (2,164,190 | ) | | | (33,717,596 | ) |
| | | | |
Net increase (decrease) | | | 1,197,796 | | | $ | 20,271,964 | |
| | | | |
Year ended December 31, 2019: | | | | | | | | |
Shares sold | | | 3,626,766 | | | $ | 59,687,155 | |
Shares issued to shareholders in reinvestment of distributions | | | 1,117,887 | | | | 18,348,399 | |
Shares redeemed | | | (3,121,769 | ) | | | (50,748,562 | ) |
| | | | |
Net increase (decrease) | | | 1,622,884 | | | $ | 27,286,992 | |
| | | | |
Note 11–Recent Accounting Pronouncement
In March 2020, the Financial Accounting Standards Board (“FASB”) issued Accounting Standards Update 2020-04 (“ASU 2020-04”), which provides optional guidance to ease the potential accounting burden associated with transitioning away from LIBOR and other reference rates that are expected to be discontinued. ASU 2020-04 is effective immediately upon release of the update on March 12, 2020 through December 31, 2022. At this time, the Manager is evaluating the implications of certain other provisions of ASU 2020-04 related to new disclosure requirements and any impact on the financial statement disclosures has not yet been determined.
Note 12–Subsequent Events
In connection with the preparation of the financial statements of the Portfolio as of and for the six-month period ended June 30, 2020, events and transactions subsequent to June 30, 2020, through the date the financial statements were issued have been evaluated by the Manager, for possible adjustment and/or disclosure. No subsequent events requiring financial statement adjustment or disclosure have been identified.
Note 13–Other Matters
An outbreak of COVID-19, first detected in December 2019, has developed into a global pandemic and has resulted in travel restrictions, closure of international borders, certain businesses and securities markets, restrictions on securities trading activities, prolonged quarantines, supply chain disruptions, and lower consumer demand, as well as general concern and uncertainty. The continued impact of COVID-19 is uncertain and could further adversely affect the global economy, national economies, individual issuers and capital markets in unforeseeable ways and result in a substantial and extended economic downturn. Developments that disrupt global economies and financial markets, such as COVID-19, may magnify factors that affect the Portfolio’s performance.
| | |
| 42 | | MainStay VP Income Builder Portfolio |
Discussion of the Operation and Effectiveness of the Portfolio’s Liquidity Risk
Management Program (Unaudited)
In compliance with Rule 22e-4 under the Investment Company Act of 1940, as amended (the “Liquidity Rule”), the Portfolio has adopted and implemented a liquidity risk management program (the “Program”), which New York Life Investment Management LLC believes is reasonably designed to assess and manage the Portfolio’s liquidity risk. The Board designated New York Life Investment Management LLC as administrator of the Program (the “Administrator”). The Administrator has established a Liquidity Risk Management Committee to assist the Administrator in the implementation and day-to-day administration of the Program and to otherwise support the Administrator in fulfilling its responsibilities under the Program.
At a meeting of the Board held on March 11, 2020, the Administrator provided the Board with a written report addressing the Program’s operation, adequacy and effectiveness of implementation for the period from December 1, 2018 through December 31, 2019, as required under the Liquidity Rule. The report noted that the Administrator concluded that (i) the Program operated effectively to assess and manage the Portfolio’s liquidity risk, (ii) the Program has been adequately and effectively implemented to monitor and, as applicable, respond to the Portfolio’s liquidity developments and (iii) the Portfolio’s investment strategy continues to be appropriate for an open-end portfolio.
In accordance with the Program, the Portfolio’s liquidity risk is assessed no less frequently than annually taking into consideration certain factors, as applicable, such as (i) investment strategy and liquidity of portfolio investments, (ii) short-term and long-term cash flow projections and (iii) holdings of cash and cash equivalents and borrowing arrangements and other funding sources. Certain factors are considered under both normal and reasonably foreseeable stressed conditions.
Each Portfolio portfolio investment is classified into one of four liquidity categories. The classification is based on a determination of the number of days it is reasonably expected to take to convert the investment into cash, or sell or dispose of the investment, in current market conditions without significantly changing the market value of the investment. The Administrator has delegated liquidity classification determinations to the Portfolio’s subadvisors, subject to appropriate oversight by the Administrator, and classification determinations are made by taking into account the Portfolio’s reasonably anticipated trade size, various market, trading and investment-specific considerations, as well as market depth, and, in certain cases, third-party vendor data.
The Liquidity Rule requires portfolios that do not primarily hold assets that are highly liquid investments to adopt a minimum amount of net assets that must be invested in highly liquid investments that are assets (an “HLIM”). In addition, the Liquidity Rule limits a portfolio’s investments in illiquid investments. Specifically, the Liquidity Rule prohibits acquisition of illiquid investments if doing so would result in a portfolio holding more than 15% of its net assets in illiquid investments that are assets. The Program includes provisions reasonably designed to determine, periodically review and comply with the HLIM requirement, as applicable, and to comply with the 15% limit on illiquid investments.
Proxy Voting Policies and Procedures and Proxy Voting Record
A description of the policies and procedures that New York Life Investments uses to vote proxies related to the Portfolio’s securities is available free of charge upon request (i) by calling 800-598-2019; (ii) by visiting New York Life Investments’ website at https://www.nylinvestments.com/mainstay/products-and-performance/mainstay-vp-funds-trust; or (iii) by visiting the SEC’s website at www.sec.gov.
The Portfolio is required to file with the SEC its proxy voting record for the 12-month period ending June 30 on Form N-PX. The Portfolio’s most recent Form N-PX or proxy voting record is available free of charge upon request (i) by calling 800-598-2019; (ii) by visiting New York Life Investments’ website at https://www.nylinvestments.com/mainstay/products-and-performance/mainstay-vp-funds-trust; or (iii) by visiting the SEC’s website at www.sec.gov.
Shareholder Reports and Quarterly Portfolio Disclosure
The Portfolio is required to file its complete schedule of portfolio holdings with the SEC 60 days after its first and third fiscal quarter on Form N-PORT. The Portfolio’s holdings report is available free of charge upon request by calling 800-598-2019 or by visiting the SEC’s website at www.sec.gov.
| | |
| 44 | | MainStay VP Income Builder Portfolio |
MainStay VP Portfolios
MainStay VP offers a wide range of Portfolios. The full array of MainStay VP offerings is listed here, with information about the manager, subadvisors, legal counsel, and independent registered public accounting firm.
Equity Portfolios
MainStay VP Emerging Markets Equity Portfolio
MainStay VP Epoch U.S. Equity Yield Portfolio
MainStay VP Fidelity Institutional AM® Utilities Portfolio†
MainStay VP MacKay Common Stock Portfolio
MainStay VP MacKay Growth Portfolio
MainStay VP MacKay International Equity Portfolio
MainStay VP MacKay Mid Cap Core Portfolio
MainStay VP MacKay S&P 500 Index Portfolio
MainStay VP MacKay Small Cap Core Portfolio
MainStay VP Mellon Natural Resources Portfolio
MainStay VP Small Cap Growth Portfolio
MainStay VP T. Rowe Price Equity Income Portfolio
MainStay VP Winslow Large Cap Growth Portfolio
Mixed Asset Portfolios
MainStay VP Balanced Portfolio
MainStay VP Income Builder Portfolio
MainStay VP Janus Henderson Balanced Portfolio
MainStay VP MacKay Convertible Portfolio
Income Portfolios
MainStay VP Bond Portfolio
MainStay VP Floating Rate Portfolio
MainStay VP Indexed Bond Portfolio
MainStay VP MacKay Government Portfolio
MainStay VP MacKay High Yield Corporate Bond Portfolio
MainStay VP MacKay Unconstrained Bond Portfolio
MainStay VP PIMCO Real Return Portfolio
Money Market
MainStay VP U.S. Government Money Market Portfolio
Alternative
MainStay VP CBRE Global Infrastructure Portfolio
MainStay VP IQ Hedge Multi-Strategy Portfolio
Asset Allocation Portfolios
MainStay VP Conservative Allocation Portfolio
MainStay VP Growth Allocation Portfolio
MainStay VP Moderate Allocation Portfolio
MainStay VP Moderate Growth Allocation Portfolio
Manager
New York Life Investment Management LLC
New York, New York
Subadvisors
Brown Advisory LLC
Baltimore, Maryland
Candriam Belgium S.A.*
Brussels, Belgium
CBRE Clarion Securities LLC
Radnor, Pennsylvania
Epoch Investment Partners, Inc.
New York, New York
FIAM LLC
Smithfield, Rhode Island
IndexIQ Advisors LLC*
New York, New York
Janus Capital Management LLC
Denver, Colorado
MacKay Shields LLC*
New York, New York
Mellon Investments Corporation
Boston, Massachusetts
NYL Investors LLC*
New York, New York
Pacific Investment Management Company LLC
Newport Beach, California
Segall Bryant & Hamill, LLC
Chicago, Illinois
T. Rowe Price Associates, Inc.
Baltimore, Maryland
Winslow Capital Management, LLC
Minneapolis, Minnesota
Distributor
NYLIFE Distributors LLC*
Jersey City, New Jersey
Custodian
State Street Bank and Trust Company
Boston, Massachusetts
Independent Registered Public Accounting Firm
PricewaterhouseCoopers LLP
New York, New York
Legal Counsel
Dechert LLP
Washington, District of Columbia
Some Portfolios may not be available in all products.
| † | Fidelity Institutional AM is a registered trade mark of FMR LLC. Used with permission. |
| * | An affiliate of New York Life Investment Management LLC |
Not part of the Semiannual Report
2020 Semiannual Report
This report is for the general information of New York Life Variable Annuities and NYLIAC Variable Universal Life Insurance Products policyowners. It must be preceded or accompanied by the appropriate product(s) and funds prospectuses if it is given to anyone who is not an owner of a New York Life variable annuity policy or a NYLIAC Variable Universal Life Insurance Product. This report does not offer for sale or solicit orders to purchase securities.
The performance data quoted in this report represents past performance. Past performance is no guarantee of future results. Due to market volatility and other factors, current performance may be lower or higher than the figures shown. The most recent month-end performance summary for your variable annuity or variable life policy is available by calling 800-598-2019 and is updated periodically on www.newyorklife.com.
The New York Life Variable Annuities and NYLIAC Variable Universal Life Insurance Products are issued by New York Life Insurance and Annuity Corporation (a Delaware Corporation) and distributed by NYLIFE Distributors LLC (Member FINRA/SIPC).
New York Life Insurance Company
New York Life Insurance and Annuity Corporation (NYLIAC) (A Delaware Corporation)
51 Madison Avenue, Room 551
New York, NY 10010
www.newyorklife.com
Printed on recycled paper
nylinvestments.com
NYLIFE Distributors LLC, 30 Hudson Street, Jersey City, NJ 07302
New York Life Investment Management LLC is the investment manager to the MainStay VP Funds Trust
©2020 by NYLIFE Distributors LLC. All rights reserved.
You may obtain copies of the Prospectus and the Statement of Additional Information free of charge, upon request, by calling toll-free 800-598-2019 or writing to New York Life Insurance and Annuity Corporation, 51 Madison Avenue, New York, NY 10010.
| | | | |
| Not FDIC Insured | | No Bank Guarantee | | May Lose Value |
| | | | |
| 1781626 | | | | MSVPIB10-08/20 (NYLIAC) NI522 |
MainStay VP Indexed Bond Portfolio
Message from the President and Semiannual Report
Unaudited | June 30, 2020
Beginning on January 1, 2021, as permitted by regulations adopted by the Securities and Exchange Commission, paper copies of the MainStay VP Portfolio annual and semi-annual shareholder reports may no longer be sent by mail, unless you specifically request paper copies of the reports from the insurance company that offers your policy. Instead, the reports will be made available online, and you will be notified by mail each time a report is posted and provided with a website link to access the report. Instructions for requesting paper copies will be provided by your insurance company.
If you already elected to receive shareholder reports electronically, you will not be affected by this change and you need not take any action. At any time, you may elect to receive reports and other communications from the insurance company electronically by following the instructions provided by the insurance company.
You may elect to receive all future shareholder reports in paper form free of charge. You can inform the insurance company that you wish to receive paper copies of reports by following the instructions provided by the insurance company. Your election to receive reports in paper form will apply to all portfolio companies available under your contract.
| | | | | | | | |
| Not FDIC/NCUA Insured | | Not a Deposit | | May Lose Value | | No Bank Guarantee | | Not Insured by Any Government Agency |

This page intentionally left blank
Message from the President
High levels of volatility shook financial markets in response to the COVID-19 pandemic and an abrupt decline in global economic activity during the six months ended June 30, 2020.
Markets entered 2020 riding strong fourth quarter performance and an economic expansion of historic longevity. Most broad stock and bond indices began to dip in late February as growing numbers of COVID-19 cases were seen in hotspots around the world. On March 11, 2020, the World Health Organization acknowledged that the disease had reached pandemic proportions, with over 80,000 identified cases in China, thousands in Italy, South Korea and the United States, and more in dozens of additional countries. Governments and central banks pledged trillions of dollars to address the mounting economic and public health crisis; however, “stay-at-home” orders and other restrictions on non-essential activity caused global economic activity to slow. Most stocks and bonds lost significant ground in this challenging environment, with equities declining by roughly a third and the yield on high-yield credit indices shooting higher.
Policymakers responded with extraordinary speed to address the situation. In the United States, the Federal Reserve (“Fed”) cut interest rates to near zero and announced unlimited quantitative easing. With help from Treasury, the Fed later rolled out a series of lending facilities to directly support market functioning. In late March, the Federal government declared a national emergency; Congress passed, and the President signed, a $2 trillion CARES Act (The Coronavirus Aid, Relief, and Economic Security Act), with the promise of further assistance for consumers and businesses to come. This enormous wave of policy support helped fuel a rapid recovery in market pricing as stocks bounced back and credit spreads narrowed. Some states rushed to ease restrictions on travel and social gatherings, further fueling optimism that the effects of the pandemic might prove short lived. However, the final weeks of the reporting period saw infection rates beginning to rise in some of the first states to reopen, raising concerns that a second round of restrictive government policies might prove necessary, once again stifling economic activity.
Despite all the market volatility, the broadly based S&P 500® Index finished the first half of 2020 only slightly below its starting point and the technology-heavy NASDAQ Composite Index posted gains, closing in near record territory. Small-cap stocks tended to trail their large cap counterparts, as illustrated by the Russell 2000® Index’s loss of approximately 15%, while value-oriented stocks lagged growth-oriented issues. From a global perspective, U.S. stocks generally outperformed international equities, with emerging markets hit particularly hard by the flight from risk.
Fixed-income markets also experienced unusually high levels of volatility. Recognized safe havens, such as U.S. government bonds, attracted increased investment, driving yields lower and prices higher, positioning long-term Treasury bonds to deliver particularly strong gains. Investment-grade corporate bonds lost value in March before recovering in the closing months of the reporting period, while relatively speculative high-yield credit faced the brunt of risk-off sentiment. Emerging market debt underperformed most other bonds types as investors sought to minimize currency and sovereign risks.
Today, as we at New York Life Investments continue to track the ongoing health crisis and its financial ramifications, we are particularly mindful of the people at the heart of our enterprise—our colleagues and valued clients. By taking appropriate steps to minimize community spread of COVID-19 within our organization, we strive to safeguard the health of our investment professionals so they can continue to provide you, as a MainStay investor, with world class investment solutions in this rapidly evolving environment.
Sincerely,

Kirk C. Lehneis
President
The opinions expressed are as of the date of this report and are subject to change. There is no guarantee that any forecast made will come to pass. This material does not constitute investment advice and is not intended as an endorsement of any specific investment. Past performance is no guarantee of future results.
Not part of the Semiannual Report
Table of Contents
Investors should refer to the Portfolio’s Summary Prospectus and/or Prospectus and consider the Portfolio’s investment objectives, strategies, risks, charges and expenses carefully before investing. The Summary Prospectus and/or Prospectus contain this and other information about the Portfolio. You may obtain copies of the Portfolio’s Summary Prospectus and/or the Prospectus and the Statement of Additional Information free of charge, upon request, by calling toll-free 800-598-2019, by writing to New York Life Insurance and Annuity Corporation, 51 Madison Avenue, Room 251, New York, New York 10010 or by sending an email to MainStayShareholdersServices@nylim.com. These documents are also available at nylinvestments.com/vpdocuments. Please read the Summary Prospectus and/or Prospectus carefully before investing. MainStay VP Funds Trust portfolios are separate account options which are purchased through a variable insurance or variable annuity contract.
Investment and Performance Comparison1 (Unaudited)
Performance data quoted represents past performance. Past performance is no guarantee of future results. Because of market volatility and other factors, current performance may be lower or higher than the figures shown. Investment return and principal value will fluctuate, and as a result, when shares are redeemed, they may be worth more or less than their original cost. The performance table and graph do not reflect any deduction of sales charges, mortality and expense charges, contract charges or administrative charges. Please refer to the Performance Summary appropriate for your policy. For performance information current to the most recent month-end, please call 800-598-2019 or visit www.newyorklife.com.
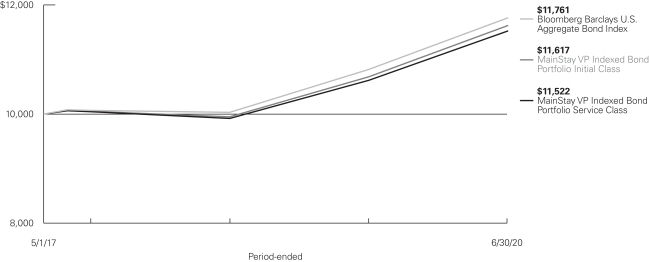
Average Annual Total Returns for the Period-Ended June 30, 2020
| | | | | | | | | | | | | | | | | | | | |
| Class | | Inception Date | | | Six Months | | | One Year | | | Since Inception | | | Gross
Expense
Ratio2 | |
| | | | | |
Initial Class Shares | | | 5/1/2017 | | | | 6.48 | % | | | 8.79 | % | | | 4.84 | % | | | 0.30 | % |
Service Class Shares | | | 5/1/2017 | | | | 6.35 | | | | 8.52 | | | | 4.58 | | | | 0.55 | |
| | | | | | | | | | | | |
| Benchmark Performance | | Six
Months | | | One
Year | | | Since Inception | |
| | | |
Bloomberg Barclays U.S. Aggregate Bond Index3 | | | 6.14 | % | | | 8.74 | % | | | 5.26 | % |
Morningstar Intermediate Core Bond Category Average4 | | | 5.56 | | | | 7.89 | | | | 4.75 | |
| 1. | Performance figures may reflect certain fee waivers and/or expense limitations, without which total returns may have been different. For information on current fee waivers and/or expense limitations (if any), please refer to the Notes to Financial Statements. |
| 2. | The gross expense ratios presented reflect the Portfolio’s “Total Annual Portfolio Operating Expenses” from the most recent Prospectus, as supplemented, and may differ from other expense ratios disclosed in this report. |
| 3. | The Bloomberg Barclays U.S. Aggregate Bond Index is the Portfolio’s primary broad-based securities market index for comparison purposes. The Bloomberg Barclays U.S. Aggregate Bond Index measures performance of the investment-grade, U.S. dollar denominated, fixed-rate taxable bond market, including Treasurys, government-related and corporate securities, |
| | mortgage-backed securities (agency fixed-rate and hybrid adjustable-rate mortgage pass-throughs), asset-backed securities and commercial mortgage-backed securities. Results assume reinvestment of all dividends and capital gains. An investment cannot be made directly in an index. |
| 4. | The Morningstar Intermediate Core Bond is representative of funds that invest primarily in investment-grade U.S. fixed-income issues including government, corporate, and securitized debt, and hold less than 5% in below-investment-grade exposures. Their durations (a measure of interest-rate sensitivity) typically range between 75% and 125% of the three-year average of the effective duration of the Morningstar Core Bond Index. Results are based on average total returns of similar funds with all dividends and capital gain distributions reinvested. |
Cost in Dollars of a $1,000 Investment in MainStay VP Indexed Bond Portfolio (Unaudited)
The example below is intended to describe the fees and expenses borne by shareholders during the six-month period from January 1, 2020, to June 30, 2020, and the impact of those costs on your investment.
Example
As a shareholder of the Portfolio you incur two types of costs: (1) transaction costs, including exchange fees and sales charges (loads) on purchases (as applicable), and (2) ongoing costs, including management fees, distribution and/or service (12b-1) fees, and other Portfolio expenses (as applicable). This example is intended to help you understand your ongoing costs (in dollars) of investing in the Portfolio and to compare these costs with the ongoing costs of investing in other mutual funds. The example is based on an investment of $1,000 made at the beginning of the six-month period and held for the entire period from January 1, 2020, to June 30, 2020. Shares are only sold in connection with variable life and annuity contracts and the example does not reflect any contract level or transactional fees or expenses. If these costs had been included, your costs would have been higher.
This example illustrates your Portfolio’s ongoing costs in two ways:
Actual Expenses
The second and third data columns in the table below provide information about actual account values and actual expenses. You may use the information in these columns, together with the amount you invested, to estimate the expenses that you paid during the six months ended June 30, 2020. Simply divide your account value by $1,000
(for example, an $8,600 account value divided by $1,000 = 8.6), then multiply the result by the number under the heading entitled “Expenses Paid During Period” to estimate the expenses you paid on your account during this period.
Hypothetical Example for Comparison Purposes
The fourth and fifth data columns in the table below provide information about hypothetical account values and hypothetical expenses based on the Portfolio’s actual expense ratio and an assumed rate of return of 5% per year before expenses, which is not the Portfolio’s actual return. The hypothetical account values and expenses may not be used to estimate the actual ending account balances or expenses you paid for the six-month period shown. You may use this information to compare the ongoing costs of investing in the Portfolio with the ongoing costs of investing in other mutual funds. To do so, compare this 5% hypothetical example with the 5% hypothetical examples that appear in the shareholder reports of the other mutual funds.
Please note that the expenses shown in the table are meant to highlight your ongoing costs only and do not reflect any transactional costs, such as exchange fees or sales charges (loads). Therefore, the fourth and fifth data columns of the table are useful in comparing ongoing costs only and will not help you determine the relative total costs of owning different funds. In addition, if these transactional costs were included, your costs would have been higher.
| | | | | | | | | | | | | | | | | | | | | | |
| | | | | | | | | | | | | | | | | | |
| Share Class | | Beginning
Account
Value
1/1/20 | | | Ending Account
Value (Based
on Actual
Returns and
Expenses)
6/30/20 | | | Expenses
Paid
During
Period1 | | | Ending Account
Value (Based
on Hypothetical
5% Annualized
Return and
Actual Expenses)
6/30/20 | | | Expenses
Paid
During
Period1 | | | Net Expense
Ratio
During
Period2 |
| | | | | | |
| Initial Class Shares | | $ | 1,000.00 | | | $ | 1,064.80 | | | $ | 1.44 | | | $ | 1,023.47 | | | $ | 1.41 | | | 0.28% |
| | | | | | |
| Service Class Shares | | $ | 1,000.00 | | | $ | 1,063.50 | | | $ | 2.72 | | | $ | 1,022.23 | | | $ | 2.66 | | | 0.53% |
| 1. | Expenses are equal to the Portfolio’s annualized expense ratio of each class multiplied by the average account value over the period, divided by 366 and multiplied by 182 (to reflect the six-month period). The table above represents the actual expenses incurred during the six-month period. In addition to the fees and expenses which the Portfolio bears directly, it also indirectly bears a pro rata share of the fees and expenses of the underlying funds in which it invests. Such indirect expenses are not included in the above-reported expense figures. |
| 2. | Expenses are equal to the Portfolio’s annualized expense ratio to reflect the six-month period. |
| | |
| 6 | | MainStay VP Indexed Bond Portfolio |
Portfolio Composition as of June 30, 2020 (Unaudited)
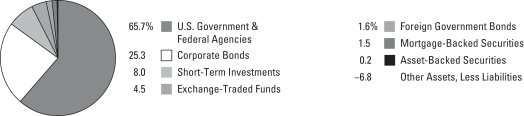
See Portfolio of Investments beginning on page 9 for specific holdings within these categories. The Portfolio’s holdings are subject to change.
Top Ten Holdings or Issuers Held as of June 30, 2020 (excluding short-term investments) (Unaudited)
| 1. | United States Treasury Notes, 0.125%–2.875%, due 7/15/20–5/15/30 |
| 2. | Federal National Mortgage Association (Mortgage Pass-Through Securities), 2.50%–5.50%, due 7/1/21–3/1/50 |
| 3. | United States Treasury Bonds, 2.00%–4.625%, due 2/15/36–2/15/50 |
| 4. | Government National Mortgage Association (Mortgage Pass-Through Securities), 2.50%–5.00%, due 11/20/42–12/1/49 |
| 5. | Federal Home Loan Mortgage Corporation (Mortgage Pass-Through Securities), 2.50%–5.50%, due 12/1/25–5/1/50 |
| 6. | iShares Long-Term Corporate Bond ETF |
| 7. | iShares Intermediate-Term Corporate Bond ETF |
| 8. | Bank of America Corp., 3.248%–5.625%, due 7/1/20–3/20/51 |
| 9. | United Mexican States, 4.125%, due 1/21/26 |
| 10. | Wells Fargo & Co., 2.55%–4.75%, due 12/7/20–12/7/46 |
Portfolio Management Discussion and Analysis (Unaudited)
Answers to the questions reflect the views of portfolio managers Kenneth Sommer and AJ Rzad, CFA, of NYL Investors LLC, the Portfolio’s Subadvisor.
How did MainStay VP Indexed Bond Portfolio perform relative to its benchmark and peers during the six months ended June 30, 2020?
For the six months ended June 30, 2020, MainStay VP Indexed Bond Portfolio returned 6.48% for Initial Class shares and 6.35% for Service Class shares. Over the same period, both share classes outperformed the 6.14% return of the Bloomberg Barclays U.S. Aggregate Bond Index, which is the Portfolio’s broad-based securities-market index. Although the Portfolio seeks investment results that correspond to the total return performance of fixed-income securities in the aggregate, as represented by the Portfolio’s broad-based securities-market index, the Portfolio’s performance will typically lag that of the Index because the Portfolio incurs fees and expenses that the Index does not. For the six months ended June 30, 2020, both share classes outperformed the 5.56% return of the Morningstar Intermediate Core Bond Category Average.1
During the reporting period, were there any market events that materially impacted the Portfolio’s performance or liquidity?
From a liquidity perspective, the first three months of the reporting period proved to be a challenging environment for all fixed-income investors. As investors flocked to the relative safety of cash and/or U.S. Treasury holdings, portfolio redemptions resulted in forced selling across the corporate landscape. This led to wider bid-ask spreads2 and a more difficult environment in which to transact. While the U.S. Federal Reserve’s heavy-handed response opened the primary market, secondary liquidity remained challenging until investors became more confident in the stability of the market.
During the reporting period, how was the Portfolio’s performance materially affected by investments in derivatives?
U.S. Treasury futures were used to reduce variations between the Portfolio and its benchmark. These trades reduced tracking error for the Portfolio and had a positive effect on the Portfolio’s performance during the reporting period.
During the reporting period, which credit-rating categories were strong performers and which credit-rating categories were weak?
During the reporting period, we witnessed the highest quality securities outperform. Credit rated AAA had the highest excess returns followed by credit rated AA. Credit rated A outperformed BBB-rated securities.3 The BBB-rated category was the weakest credit category during the reporting period. All credit rating categories produced negative excess returns, underperforming matched duration Treasury securities.
What was the Portfolio’s duration4 strategy during the reporting period?
The Portfolio employs a passive strategy that attempts to replicate the duration of its benchmark. The Portfolio’s duration strategy had a neutral impact on performance during the reporting period. As of June 30, 2020, the Portfolio’s duration was approximately 5.99 years compared to a duration of 6.00 years for the Bloomberg Barclays U.S. Aggregate Bond Index.
Which market segments made the strongest contributions to the Portfolio’s performance, and which market segments detracted the most?
During the reporting period, all the broad sectors in the Barclays Aggregate Bond Index produced positive total returns. The best performing sector during the reporting period was the U.S. Treasury sector. Within corporates, the utility subcomponent was the best performer. Industrials, utilities and financials all outperformed the non-corporate sector. Within the non-corporate sector, the foreign local government subsector was the best performer. The asset-backed securities sector was the worst performing sector. Within securitized products, commercial mortgage-backed securities outperformed both mortgage-backed securities and asset-backed securities. U.S. government agencies underperformed U.S. Treasuries during the same period.
Were there any significant changes to the Portfolio’s benchmark during the reporting period?
We did not consider any changes to the Bloomberg Barclays U.S. Aggregate Bond Index to be material enough to change our investment strategy.
| 1. | See page 5 for more information on benchmark and peer group returns. |
| 2. | The terms “spread” and “yield spread” may refer to the difference in yield between a security or type of security and comparable U.S. Treasury issues. The terms may also refer to the difference in yield between two specific securities or types of securities at a given time. |
| 3. | An obligation rated ‘AAA’ has the highest rating assigned by Standard & Poor’s (“S&P”), and in the opinion of S&P, the obligor’s capacity to meet its financial commitment on the obligation is extremely strong. An obligation rated ‘AA’ by S&P is deemed by S&P to differ from the highest-rated obligations only to a small degree. In the opinion of S&P, the obligor’s capacity to meet its financial commitment on the obligation is very strong. An obligation rated ‘A’ by S&P is deemed by S&P to be somewhat more susceptible to the adverse effects of changes in circumstances and economic conditions than obligations in higher-rated categories. In the opinion of S&P, however, the obligor’s capacity to meet its financial commitment on the obligation is still strong. An obligation rated ‘BBB’ by S&P is deemed by S&P to exhibit adequate protection parameters. In the opinion of S&P, however, adverse economic conditions or changing circumstances are more likely to lead to a weakened capacity of the obligor to meet its financial commitment on the obligation. When applied to Portfolio holdings, ratings are based solely on the creditworthiness of the bonds in the Portfolio and are not meant to represent the security or safety of the Portfolio. |
| 4. | Duration is a measure of the price sensitivity of a fixed-income investment to changes in interest rates. Duration is expressed as a number of years and is considered a more accurate sensitivity gauge than average maturity. |
The opinions expressed are those of the portfolio managers as of the date of this report and are subject to change. There is no guarantee that any forecasts will come to pass. This material does not constitute investment advice and is not intended as an endorsement of any specific investment.
Not all MainStay VP Portfolios and/or share classes are available under all policies.
| | |
| 8 | | MainStay VP Indexed Bond Portfolio |
Portfolio of Investments June 30, 2020 (Unaudited)
| | | | | | | | |
| | | Principal
Amount | | | Value | |
Long-Term Bonds 94.3%† Asset-Backed Securities 0.2% | |
Automobile 0.2% | |
Ally Auto Receivables Trust
Series 2018-3, Class A3
3.00%, due 1/17/23 | | $ | 69,848 | | | $ | 70,931 | |
BMW Vehicle Lease Trust
Series 2018-1, Class A3
3.26%, due 7/20/21 | | | 176,246 | | | | 177,586 | |
Ford Credit Floorplan Master Owner Trust
Series 2017-2, Class A1
2.16%, due 9/15/22 | | | 300,000 | | | | 300,768 | |
GM Financial Consumer Automobile Receivables Trust
Series 2018-3, Class A3
3.02%, due 5/16/23 | | | 617,473 | | | | 630,806 | |
Honda Auto Receivables Owner Trust
Series 2018-3, Class A3
2.95%, due 8/22/22 | | | 641,718 | | | | 652,970 | |
Hyundai Auto Lease Securitization Trust
Series 2018-B, Class A3
3.04%, due 10/15/21 (a) | | | 68,069 | | | | 68,437 | |
| | | | | | | | |
Total Asset-Backed Securities
(Cost $1,873,179) | | | | | | | 1,901,498 | |
| | | | | | | | |
|
| Corporate Bonds 25.3% | |
Aerospace & Defense 0.4% | |
Boeing Co. | | | | | | | | |
3.25%, due 3/1/28 | | | 610,000 | | | | 605,438 | |
5.15%, due 5/1/30 | | | 750,000 | | | | 836,272 | |
General Dynamics Corp.
3.00%, due 5/11/21 | | | 330,000 | | | | 337,619 | |
Lockheed Martin Corp.
4.07%, due 12/15/42 | | | 330,000 | | | | 418,571 | |
Northrop Grumman Corp.
7.75%, due 2/15/31 | | | 285,000 | | | | 425,689 | |
Raytheon Technologies Corp. | | | | | | | | |
3.15%, due 12/15/24 (a) | | | 330,000 | | | | 356,456 | |
3.50%, due 3/15/27 (a) | | | 285,000 | | | | 320,695 | |
3.65%, due 8/16/23 | | | 2,000 | | | | 2,166 | |
| | | | | | | | |
| | | | | | | 3,302,906 | |
| | | | | | | | |
Apparel 0.0%‡ | |
Nike, Inc.
3.625%, due 5/1/43 | | | 90,000 | | | | 104,104 | |
| | | | | | | | |
|
Auto Manufacturers 0.4% | |
Ford Motor Credit Co. LLC
3.219%, due 1/9/22 | | | 1,300,000 | | | | 1,264,523 | |
General Motors Financial Co., Inc.
4.35%, due 1/17/27 | | | 1,625,000 | | | | 1,681,393 | |
| | | | | | | | |
| | | Principal
Amount | | | Value | |
Auto Manufacturers (continued) | |
Toyota Motor Credit Corp.
2.25%, due 10/18/23 | | $ | 390,000 | | | $ | 408,356 | |
| | | | | | | | |
| | | | | | | 3,354,272 | |
| | | | | | | | |
Banks 6.2% | |
Bank of America Corp. | | | | | | | | |
3.248%, due 10/21/27 | | | 530,000 | | | | 584,523 | |
3.30%, due 1/11/23 | | | 1,085,000 | | | | 1,157,995 | |
3.419%, due 12/20/28 (b) | | | 1,910,000 | | | | 2,127,457 | |
4.083%, due 3/20/51 (b) | | | 670,000 | | | | 839,551 | |
5.625%, due 7/1/20 | | | 500,000 | | | | 500,000 | |
Bank of New York Mellon Corp. | | | | | | | | |
2.05%, due 5/3/21 | | | 120,000 | | | | 121,536 | |
2.50%, due 4/15/21 | | | 810,000 | | | | 822,348 | |
3.00%, due 2/24/25 | | | 535,000 | | | | 585,361 | |
Bank of Nova Scotia
2.70%, due 3/7/22 | | | 945,000 | | | | 979,218 | |
Barclays PLC
5.25%, due 8/17/45 | | | 270,000 | | | | 360,685 | |
BNP Paribas S.A.
3.25%, due 3/3/23 | | | 570,000 | | | | 612,785 | |
Citigroup, Inc. | | | | | | | | |
2.65%, due 10/26/20 | | | 810,000 | | | | 815,654 | |
3.375%, due 3/1/23 | | | 1,190,000 | | | | 1,268,246 | |
3.98%, due 3/20/30 (b) | | | 300,000 | | | | 344,751 | |
4.45%, due 9/29/27 | | | 1,610,000 | | | | 1,838,084 | |
4.65%, due 7/30/45 | | | 220,000 | | | | 283,188 | |
Cooperatieve Rabobank UA . 5.25%, due 5/24/41 | | | 530,000 | | | | 751,452 | |
Credit Suisse Group Funding Guernsey, Ltd.
3.80%, due 6/9/23 | | | 335,000 | | | | 360,695 | |
Fifth Third Bank N.A.
2.25%, due 6/14/21 | | | 670,000 | | | | 680,743 | |
Goldman Sachs Group, Inc. | | | | | | | | |
2.60%, due 12/27/20 | | | 675,000 | | | | 682,081 | |
2.905%, due 7/24/23 (b) | | | 1,870,000 | | | | 1,942,758 | |
3.85%, due 1/26/27 | | | 1,475,000 | | | | 1,663,822 | |
4.80%, due 7/8/44 | | | 450,000 | | | | 589,119 | |
HSBC Holdings PLC | | | | | | | | |
2.65%, due 1/5/22 | | | 1,385,000 | | | | 1,427,339 | |
3.90%, due 5/25/26 | | | 1,625,000 | | | | 1,804,100 | |
JPMorgan Chase & Co. | | | | | | | | |
4.25%, due 10/1/27 | | | 2,765,000 | | | | 3,219,946 | |
4.26%, due 2/22/48 (b) | | | 650,000 | | | | 818,940 | |
Keybank N.A.
2.40%, due 6/9/22 | | | 335,000 | | | | 346,719 | |
Kreditanstalt fuer Wiederaufbau
2.125%, due 3/7/22 | | | 3,580,000 | | | | 3,692,222 | |
Lloyds Banking Group PLC
3.75%, due 1/11/27 | | | 1,490,000 | | | | 1,649,408 | |
Mitsubishi UFJ Financial Group, Inc.
3.455%, due 3/2/23 | | | 660,000 | | | | 705,543 | |
| | | | | | |
The notes to the financial statements are an integral part of,
and should be read in conjunction with, the financial statements. | | | | | 9 | |
Portfolio of Investments June 30, 2020 (Unaudited) (continued)
| | | | | | | | |
| | | Principal
Amount | | | Value | |
| Corporate Bonds (continued) | |
Banks (continued) | |
Morgan Stanley | | | | | | | | |
2.50%, due 4/21/21 | | $ | 600,000 | | | $ | 610,047 | |
2.699% (SOFR + 1.143%), due 1/22/31 (b) | | | 750,000 | | | | 794,465 | |
3.625%, due 1/20/27 | | | 1,950,000 | | | | 2,201,630 | |
4.10%, due 5/22/23 | | | 730,000 | | | | 788,924 | |
National Australia Bank, Ltd.
2.50%, due 5/22/22 | | | 335,000 | | | | 347,127 | |
PNC Bank N.A.
2.625%, due 2/17/22 | | | 335,000 | | | | 347,049 | |
Royal Bank of Canada
2.75%, due 2/1/22 | | | 430,000 | | | | 446,094 | |
Royal Bank of Scotland Group PLC
3.875%, due 9/12/23 | | | 270,000 | | | | 291,099 | |
State Street Corp.
4.375%, due 3/7/21 | | | 450,000 | | | | 462,291 | |
Sumitomo Mitsui Banking Corp.
2.65%, due 7/23/20 | | | 1,780,000 | | | | 1,782,282 | |
Toronto-Dominion Bank
2.50%, due 12/14/20 | | | 570,000 | | | | 575,679 | |
Truist Financial Corp. | | | | | | | | |
2.05%, due 5/10/21 | | | 930,000 | | | | 941,964 | |
2.75%, due 4/1/22 | | | 330,000 | | | | 342,114 | |
Wells Fargo & Co. | | | | | | | | |
2.55%, due 12/7/20 | | | 400,000 | | | | 403,705 | |
3.00%, due 4/22/26 | | | 2,900,000 | | | | 3,166,806 | |
3.50%, due 3/8/22 | | | 455,000 | | | | 476,572 | |
4.75%, due 12/7/46 | | | 650,000 | | | | 833,051 | |
Westpac Banking Corp.
2.80%, due 1/11/22 | | | 570,000 | | | | 590,938 | |
| | | | | | | | |
| | | | | | | 48,978,106 | |
| | | | | | | | |
Beverages 0.6% | |
Anheuser-Busch InBev Worldwide, Inc. | | | | | | | | |
2.50%, due 7/15/22 | | | 122,000 | | | | 126,712 | |
4.60%, due 4/15/48 | | | 1,665,000 | | | | 1,949,077 | |
Coca Cola Co.
2.25%, due 9/1/26 | | | 390,000 | | | | 423,755 | |
Constellation Brands, Inc.
3.60%, due 2/15/28 | | | 125,000 | | | | 138,501 | |
Diageo Capital PLC
5.875%, due 9/30/36 | | | 293,000 | | | | 419,122 | |
Keurig Dr. Pepper, Inc.
4.985%, due 5/25/38 | | | 90,000 | | | | 114,620 | |
Molson Coors Beverage Co.
4.20%, due 7/15/46 | | | 90,000 | | | | 87,582 | |
PepsiCo, Inc. | | | | | | | | |
2.75%, due 3/1/23 | | | 430,000 | | | | 456,546 | |
2.85%, due 2/24/26 | | | 285,000 | | | | 314,885 | |
4.45%, due 4/14/46 | | | 625,000 | | | | 835,671 | |
| | | | | | | | |
| | | | | | | 4,866,471 | |
| | | | | | | | |
| | | | | | | | |
| | | Principal
Amount | | | Value | |
Biotechnology 0.3% | |
Amgen, Inc. | | | | | | | | |
2.70%, due 5/1/22 | | $ | 230,000 | | | $ | 237,885 | |
3.125%, due 5/1/25 | | | 330,000 | | | | 362,693 | |
3.375%, due 2/21/50 | | | 480,000 | | | | 535,247 | |
Baxalta, Inc.
3.60%, due 6/23/22 | | | 39,000 | | | | 41,058 | |
Gilead Sciences, Inc. | | | | | | | | |
3.65%, due 3/1/26 | | | 565,000 | | | | 646,741 | |
4.60%, due 9/1/35 | | | 230,000 | | | | 301,810 | |
| | | | | | | | |
| | | | | | | 2,125,434 | |
| | | | | | | | |
Building Materials 0.0%‡ | |
Johnson Controls International PLC
6.00%, due 1/15/36 | | | 75,000 | | | | 94,297 | |
| | | | | | | | |
|
Chemicals 0.3% | |
DuPont de Nemours, Inc.
4.493%, due 11/15/25 | | | 500,000 | | | | 575,102 | |
Ecolab, Inc.
2.70%, due 11/1/26 | | | 285,000 | | | | 316,370 | |
Mosaic Co.
4.05%, due 11/15/27 | | | 530,000 | | | | 562,850 | |
Nutrien, Ltd.
5.875%, due 12/1/36 | | | 285,000 | | | | 350,030 | |
Sherwin-Williams Co.
3.95%, due 1/15/26 | | | 330,000 | | | | 372,357 | |
| | | | | | | | |
| | | | | | | 2,176,709 | |
| | | | | | | | |
Computers 0.7% | |
Apple, Inc. | | | | | | | | |
2.15%, due 2/9/22 | | | 230,000 | | | | 236,641 | |
2.90%, due 9/12/27 | | | 325,000 | | | | 364,346 | |
3.35%, due 2/9/27 | | | 16,000 | | | | 18,228 | |
4.25%, due 2/9/47 | | | 230,000 | | | | 303,480 | |
4.50%, due 2/23/36 | | | 970,000 | | | | 1,279,596 | |
Dell International LLC / EMC Corp. (a) | | | | | | | | |
5.45%, due 6/15/23 | | | 570,000 | | | | 623,473 | |
6.02%, due 6/15/26 | | | 400,000 | | | | 458,590 | |
Hewlett Packard Enterprise Co.
4.40%, due 10/15/22 | | | 230,000 | | | | 246,222 | |
International Business Machines Corp. | | | | | | | | |
1.875%, due 8/1/22 | | | 300,000 | | | | 308,793 | |
3.45%, due 2/19/26 | | | 275,000 | | | | 310,768 | |
3.50%, due 5/15/29 | | | 1,365,000 | | | | 1,574,440 | |
| | | | | | | | |
| | | | | | | 5,724,577 | |
| | | | | | | | |
Cosmetics & Personal Care 0.1% | |
Procter & Gamble Co.
2.70%, due 2/2/26 | | | 285,000 | | | | 318,628 | |
Unilever Capital Corp.
3.10%, due 7/30/25 | | | 100,000 | | | | 111,156 | |
| | | | | | | | |
| | | | | | | 429,784 | |
| | | | | | | | |
| | | | |
| 10 | | MainStay VP Indexed Bond Portfolio | | The notes to the financial statements are an integral part of,
and should be read in conjunction with, the financial statements. |
| | | | | | | | |
| | | Principal
Amount | | | Value | |
| Corporate Bonds (continued) | |
Diversified Financial Services 0.6% | |
American Express Co. | | | | | | | | |
2.50%, due 8/1/22 | | $ | 400,000 | | | $ | 414,257 | |
3.40%, due 2/27/23 | | | 465,000 | | | | 497,479 | |
Capital One Financial Co.
3.05%, due 3/9/22 | | | 740,000 | | | | 767,953 | |
GE Capital International Funding Co.
3.373%, due 11/15/25 | | | 1,875,000 | | | | 1,967,385 | |
Visa, Inc. | | | | | | | | |
2.80%, due 12/14/22 | | | 530,000 | | | | 559,730 | |
4.30%, due 12/14/45 | | | 225,000 | | | | 297,095 | |
| | | | | | | | |
| | | | | | | 4,503,899 | |
| | | | | | | | |
Electric 1.5% | |
American Electric Power Co., Inc.
2.15%, due 11/13/20 | | | 675,000 | | | | 679,238 | |
CenterPoint Energy Houston Electric LLC
4.25%, due 2/1/49 | | | 325,000 | | | | 412,622 | |
Commonwealth Edison Co.
3.65%, due 6/15/46 | | | 515,000 | | | | 604,481 | |
Consolidated Edison Co. of New York, Inc.
5.85%, due 3/15/36 | | | 740,000 | | | | 1,000,991 | |
DTE Electric Co.
3.375%, due 3/1/25 | | | 230,000 | | | | 255,533 | |
Duke Energy Carolinas LLC | | | | | | | | |
3.875%, due 3/15/46 | | | 915,000 | | | | 1,091,180 | |
4.00%, due 9/30/42 | | | 285,000 | | | | 343,036 | |
Edison International
2.95%, due 3/15/23 | | | 230,000 | | | | 235,341 | |
Emera U.S. Finance, L.P.
2.70%, due 6/15/21 | | | 230,000 | | | | 234,205 | |
Florida Power & Light Co. | | | | | | | | |
2.75%, due 6/1/23 | | | 145,000 | | | | 153,147 | |
3.80%, due 12/15/42 | | | 1,050,000 | | | | 1,264,164 | |
Kentucky Utilities Co.
3.25%, due 11/1/20 | | | 335,000 | | | | 335,798 | |
MidAmerican Energy Co.
3.95%, due 8/1/47 | | | 430,000 | | | | 525,322 | |
National Rural Utilities Cooperative Finance Corp.
2.70%, due 2/15/23 | | | 115,000 | | | | 120,286 | |
Ohio Power Co.
Series G
6.60%, due 2/15/33 | | | 215,000 | | | | 299,429 | |
PPL Electric Utilities Corp.
3.95%, due 6/1/47 | | | 125,000 | | | | 151,465 | |
Public Service Electric & Gas Co.
2.70%, due 5/1/50 | | | 500,000 | | | | 517,793 | |
San Diego Gas & Electric Co.
4.15%, due 5/15/48 | | | 285,000 | | | | 344,019 | |
Sempra Energy
3.80%, due 2/1/38 | | | 285,000 | | | | 306,222 | |
| | | | | | | | |
| | | Principal
Amount | | | Value | |
Electric (continued) | | | | | | | | |
Southern California Edison Co.
4.125%, due 3/1/48 | | $ | 285,000 | | | $ | 331,452 | |
Southern Co. | | | | | | | | |
2.95%, due 7/1/23 | | | 230,000 | | | | 243,048 | |
4.40%, due 7/1/46 | | | 975,000 | | | | 1,157,034 | |
Virginia Electric & Power Co.
4.00%, due 1/15/43 | | | 465,000 | | | | 553,241 | |
Xcel Energy, Inc.
3.30%, due 6/1/25 | | | 955,000 | | | | 1,049,589 | |
| | | | | | | | |
| | | | | | | 12,208,636 | |
| | | | | | | | |
Environmental Controls 0.1% | |
Republic Services, Inc.
3.20%, due 3/15/25 | | | 330,000 | | | | 361,561 | |
Waste Management, Inc.
3.15%, due 11/15/27 | | | 330,000 | | | | 369,400 | |
| | | | | | | | |
| | | | | | | 730,961 | |
| | | | | | | | |
Food 0.2% | |
General Mills, Inc. | | | | | | | | |
3.15%, due 12/15/21 | | | 230,000 | | | | 237,016 | |
4.20%, due 4/17/28 | | | 90,000 | | | | 106,537 | |
Kroger Co.
2.20%, due 5/1/30 | | | 750,000 | | | | 780,057 | |
Sysco Corp.
3.25%, due 7/15/27 | | | 330,000 | | | | 349,172 | |
Tyson Foods, Inc.
5.10%, due 9/28/48 | | | 325,000 | | | | 418,013 | |
| | | | | | | | |
| | | | | | | 1,890,795 | |
| | | | | | | | |
Forest Products & Paper 0.1% | |
Fibria Overseas Finance, Ltd.
5.50%, due 1/17/27 | | | 530,000 | | | | 571,080 | |
International Paper Co.
3.80%, due 1/15/26 | | | 335,000 | | | | 377,848 | |
| | | | | | | | |
| | | | | | | 948,928 | |
| | | | | | | | |
Gas 0.0%‡ | |
NiSource, Inc.
3.49%, due 5/15/27 | | | 285,000 | | | | 322,299 | |
| | | | | | | | |
|
Health Care—Products 0.3% | |
Abbott Laboratories | | | | | | | | |
3.75%, due 11/30/26 | | | 200,000 | | | | 232,695 | |
4.90%, due 11/30/46 | | | 125,000 | | | | 179,458 | |
Boston Scientific Corp.
4.70%, due 3/1/49 | | | 250,000 | | | | 318,945 | |
Medtronic, Inc.
4.625%, due 3/15/45 | | | 449,000 | | | | 604,707 | |
Stryker Corp.
3.65%, due 3/7/28 | | | 285,000 | | | | 326,551 | |
Thermo Fisher Scientific, Inc.
2.95%, due 9/19/26 | | | 390,000 | | | | 431,378 | |
| | | | | | | | |
| | | | | | | 2,093,734 | |
| | | | | | | | |
| | | | | | |
The notes to the financial statements are an integral part of,
and should be read in conjunction with, the financial statements. | | | | | 11 | |
Portfolio of Investments June 30, 2020 (Unaudited) (continued)
| | | | | | | | |
| | | Principal
Amount | | | Value | |
| Corporate Bonds (continued) | |
Health Care—Services 0.6% | |
Aetna, Inc.
6.625%, due 6/15/36 | | $ | 285,000 | | | $ | 403,172 | |
Anthem, Inc.
4.375%, due 12/1/47 | | | 330,000 | | | | 410,615 | |
Laboratory Corporation of America Holdings
3.60%, due 2/1/25 | | | 330,000 | | | | 364,080 | |
UnitedHealth Group, Inc. | | | | | | | | |
3.10%, due 3/15/26 | | | 650,000 | | | | 725,390 | |
3.75%, due 7/15/25 | | | 1,925,000 | | | | 2,193,203 | |
4.25%, due 4/15/47 | | | 325,000 | | | | 417,334 | |
| | | | | | | | |
| | | | | | | 4,513,794 | |
| | | | | | | | |
Household Products & Wares 0.1% | |
Clorox Co.
3.90%, due 5/15/28 | | | 285,000 | | | | 332,868 | |
Kimberly-Clark Corp.
2.75%, due 2/15/26 | | | 285,000 | | | | 312,360 | |
| | | | | | | | |
| | | | | | | 645,228 | |
| | | | | | | | |
Housewares 0.0%‡ | |
Newell Brands, Inc.
4.35%, due 4/1/23 | | | 175,000 | | | | 180,215 | |
| | | | | | | | |
|
Insurance 0.7% | |
Allstate Corp.
5.35%, due 6/1/33 | | | 285,000 | | | | 395,622 | |
American International Group, Inc.
6.25%, due 5/1/36 | | | 450,000 | | | | 606,951 | |
Berkshire Hathaway Finance Corp.
4.30%, due 5/15/43 | | | 455,000 | | | | 596,544 | |
Chubb INA Holdings, Inc.
3.35%, due 5/3/26 | | | 230,000 | | | | 262,123 | |
Marsh & McLennan Cos., Inc.
2.75%, due 1/30/22 | | | 515,000 | | | | 531,802 | |
Metlife, Inc.
3.60%, due 11/13/25 | | | 1,815,000 | | | | 2,067,559 | |
Progressive Corp.
3.75%, due 8/23/21 | | | 400,000 | | | | 415,633 | |
Prudential Financial, Inc. | | | | | | | | |
4.418%, due 3/27/48 | | | 175,000 | | | | 211,427 | |
4.50%, due 11/15/20 | | | 430,000 | | | | 436,570 | |
| | | | | | | | |
| | | | | | | 5,524,231 | |
| | | | | | | | |
Internet 0.2% | |
Alphabet, Inc.
3.375%, due 2/25/24 | | | 400,000 | | | | 439,793 | |
Amazon.com, Inc.
3.875%, due 8/22/37 | | | 1,060,000 | | | | 1,312,498 | |
| | | | | | | | |
| | | | | | | 1,752,291 | |
| | | | | | | | |
| | | | | | | | |
| | | Principal
Amount | | | Value | |
Machinery—Construction & Mining 0.1% | |
Caterpillar, Inc.
5.30%, due 9/15/35 | | $ | 335,000 | | | $ | 453,340 | |
| | | | | | | | |
|
Machinery—Diversified 0.0%‡ | |
Deere & Co.
3.90%, due 6/9/42 | | | 195,000 | | | | 243,646 | |
| | | | | | | | |
|
Media 1.2% | |
Charter Communications Operating LLC / Charter Communications Operating Capital | | | | | | | | |
4.908%, due 7/23/25 | | | 975,000 | | | | 1,117,431 | |
5.75%, due 4/1/48 | | | 925,000 | | | | 1,151,485 | |
Comcast Corp. | | | | | | | | |
3.30%, due 4/1/27 | | | 825,000 | | | | 925,213 | |
3.40%, due 7/15/46 | | | 1,590,000 | | | | 1,766,383 | |
Discovery Communications LLC
3.95%, due 3/20/28 | | | 450,000 | | | | 502,852 | |
TWDC Enterprises 18 Corp.
2.35%, due 12/1/22 | | | 660,000 | | | | 687,064 | |
ViacomCBS, Inc.
4.95%, due 1/15/31 | | | 750,000 | | | | 885,652 | |
Walt Disney Co. | | | | | | | | |
3.00%, due 9/15/22 | | | 815,000 | | | | 859,716 | |
3.80%, due 3/22/30 | | | 750,000 | | | | 877,154 | |
6.40%, due 12/15/35 | | | 535,000 | | | | 803,167 | |
| | | | | | | | |
| | | | | | | 9,576,117 | |
| | | | | | | | |
Mining 0.2% | |
Barrick North America Finance LLC
5.70%, due 5/30/41 | | | 125,000 | | | | 168,032 | |
BHP Billiton Finance USA, Ltd.
3.85%, due 9/30/23 | | | 555,000 | | | | 611,519 | |
Rio Tinto Finance USA, Ltd.
3.75%, due 6/15/25 | | | 530,000 | | | | 599,430 | |
| | | | | | | | |
| | | | | | | 1,378,981 | |
| | | | | | | | |
Miscellaneous—Manufacturing 0.2% | |
3M Co.
4.00%, due 9/14/48 | | | 325,000 | | | | 402,814 | |
Eaton Corp.
4.00%, due 11/2/32 | | | 285,000 | | | | 337,003 | |
General Electric Co.
4.125%, due 10/9/42 | | | 69,000 | | | | 65,877 | |
Parker-Hannifin Corp. | | | | | | | | |
3.50%, due 9/15/22 | | | 315,000 | | | | 332,067 | |
4.20%, due 11/21/34 | | | 90,000 | | | | 107,807 | |
| | | | | | | | |
| | | | | | | 1,245,568 | |
| | | | | | | | |
Multi-National 1.2% | |
Asian Development Bank
2.75%, due 3/17/23 | | | 1,300,000 | | | | 1,385,319 | |
| | | | |
| 12 | | MainStay VP Indexed Bond Portfolio | | The notes to the financial statements are an integral part of,
and should be read in conjunction with, the financial statements. |
| | | | | | | | |
| | | Principal
Amount | | | Value | |
| Corporate Bonds (continued) | |
Multi-National (continued) | | | | | | | | |
European Investment Bank | | | | | | | | |
2.25%, due 8/15/22 | | $ | 2,000,000 | | | $ | 2,084,696 | |
2.375%, due 5/24/27 | | | 745,000 | | | | 831,219 | |
Inter-American Development Bank
1.75%, due 4/14/22 | | | 1,190,000 | | | | 1,220,850 | |
International Bank for Reconstruction & Development | | | | | | | | |
2.00%, due 1/26/22 | | | 2,000,000 | | | | 2,054,055 | |
3.00%, due 9/27/23 | | | 1,300,000 | | | | 1,412,641 | |
Japan Bank for International Cooperation
2.875%, due 6/1/27 | | | 776,000 | | | | 876,553 | |
| | | | | | | | |
| | | | | | | 9,865,333 | |
| | | | | | | | |
Oil & Gas 1.0% | |
BP Capital Markets America, Inc.
3.588%, due 4/14/27 | | | 325,000 | | | | 359,135 | |
Canadian Natural Resources, Ltd.
6.25%, due 3/15/38 | | | 125,000 | | | | 148,667 | |
Chevron Corp.
3.191%, due 6/24/23 | | | 535,000 | | | | 573,250 | |
ConocoPhillips Co.
5.95%, due 3/15/46 | | | 815,000 | | | | 1,188,077 | |
Devon Energy Corp.
4.75%, due 5/15/42 | | | 285,000 | | | | 249,905 | |
EOG Resources, Inc.
3.90%, due 4/1/35 | | | 230,000 | | | | 268,267 | |
Equinor ASA
5.10%, due 8/17/40 | | | 460,000 | | | | 621,697 | |
Exxon Mobil Corp.
4.114%, due 3/1/46 | | | 515,000 | | | | 619,626 | |
Hess Corp.
7.125%, due 3/15/33 | | | 125,000 | | | | 145,876 | |
Marathon Petroleum Corp.
5.125%, due 3/1/21 | | | 1,345,000 | | | | 1,382,346 | |
Shell International Finance B.V. | | | | | | | | |
2.375%, due 8/21/22 | | | 390,000 | | | | 406,893 | |
3.75%, due 9/12/46 | | | 660,000 | | | | 742,983 | |
Total Capital International S.A.
2.829%, due 1/10/30 | | | 1,000,000 | | | | 1,086,735 | |
| | | | | | | | |
| | | | | | | 7,793,457 | |
| | | | | | | | |
Oil & Gas Services 0.0%‡ | |
Halliburton Co.
3.80%, due 11/15/25 | | | 28,000 | | | | 30,243 | |
| | | | | | | | |
|
Pharmaceuticals 1.8% | |
AbbVie, Inc. | | | | | | | | |
3.20%, due 11/6/22 | | | 565,000 | | | | 593,686 | |
3.75%, due 11/14/23 | | | 95,000 | | | | 103,258 | |
3.80%, due 3/15/25 (a) | | | 200,000 | | | | 221,903 | |
| | | | | | | | |
| | | Principal
Amount | | | Value | |
Pharmaceuticals (continued) | | | | | | | | |
AbbVie, Inc. (continued) | | | | | | | | |
4.70%, due 5/14/45 | | $ | 1,205,000 | | | $ | 1,514,692 | |
4.75%, due 3/15/45 (a) | | | 100,000 | | | | 124,275 | |
Allergan Funding SCS | | | | | | | | |
3.80%, due 3/15/25 | | | 50,000 | | | | 53,534 | |
4.75%, due 3/15/45 | | | 25,000 | | | | 28,388 | |
AstraZeneca PLC
6.45%, due 9/15/37 | | | 565,000 | | | | 859,168 | |
Becton Dickinson & Co.
3.70%, due 6/6/27 | | | 181,000 | | | | 202,305 | |
Bristol-Myers Squibb Co.(a) | | | | | | | | |
2.75%, due 2/15/23 | | | 25,000 | | | | 26,359 | |
3.40%, due 7/26/29 | | | 1,680,000 | | | | 1,957,209 | |
3.55%, due 8/15/22 | | | 205,000 | | | | 217,674 | |
3.625%, due 5/15/24 | | | 660,000 | | | | 726,838 | |
Cigna Corp. | | | | | | | | |
3.90%, due 2/15/22 (a) | | | 405,000 | | | | 425,615 | |
4.125%, due 11/15/25 | | | 225,000 | | | | 258,644 | |
4.90%, due 12/15/48 | | | 250,000 | | | | 329,528 | |
CVS Health Corp. | | | | | | | | |
2.75%, due 12/1/22 | | | 430,000 | | | | 448,672 | |
2.80%, due 7/20/20 | | | 400,000 | | | | 400,360 | |
3.75%, due 4/1/30 | | | 1,285,000 | | | | 1,480,457 | |
4.25%, due 4/1/50 | | | 350,000 | | | | 418,231 | |
Eli Lilly & Co.
3.95%, due 3/15/49 | | | 325,000 | | | | 412,468 | |
GlaxoSmithKline Capital, Inc.
3.875%, due 5/15/28 | | | 330,000 | | | | 388,515 | |
Johnson & Johnson | | | | | | | | |
3.55%, due 3/1/36 | | | 400,000 | | | | 473,179 | |
4.95%, due 5/15/33 | | | 325,000 | | | | 446,730 | |
Merck & Co., Inc.
3.70%, due 2/10/45 | | | 285,000 | | | | 340,371 | |
Mylan, Inc. | | | | | | | | |
4.20%, due 11/29/23 | | | 75,000 | | | | 82,062 | |
5.20%, due 4/15/48 | | | 90,000 | | | | 111,731 | |
Novartis Capital Corp.
4.00%, due 11/20/45 | | | 335,000 | | | | 424,731 | |
Pfizer, Inc. | | | | | | | | |
3.00%, due 6/15/23 | | | 205,000 | | | | 219,816 | |
3.20%, due 9/15/23 | | | 25,000 | | | | 26,965 | |
4.00%, due 12/15/36 | | | 565,000 | | | | 692,733 | |
4.10%, due 9/15/38 | | | 95,000 | | | | 117,940 | |
| | | | | | | | |
| | | | | | | 14,128,037 | |
| | | | | | | | |
Pipelines 1.3% | |
Enbridge, Inc.
4.50%, due 6/10/44 | | | 285,000 | | | | 324,125 | |
Energy Transfer Operating, L.P.
4.05%, due 3/15/25 | | | 3,180,000 | | | | 3,374,400 | |
Enterprise Products Operating LLC | | | | | | | | |
3.70%, due 2/15/26 | | | 525,000 | | | | 589,996 | |
4.80%, due 2/1/49 | | | 450,000 | | | | 536,755 | |
| | | | | | |
The notes to the financial statements are an integral part of,
and should be read in conjunction with, the financial statements. | | | | | 13 | |
Portfolio of Investments June 30, 2020 (Unaudited) (continued)
| | | | | | | | |
| | | Principal
Amount | | | Value | |
| Corporate Bonds (continued) | |
Pipelines (continued) | | | | | | | | |
Kinder Morgan Energy Partners, L.P.
5.80%, due 3/15/35 | | $ | 330,000 | | | $ | 381,301 | |
Kinder Morgan, Inc.
4.30%, due 6/1/25 | | | 665,000 | | | | 746,092 | |
MPLX, L.P.
4.125%, due 3/1/27 | | | 980,000 | | | | 1,043,917 | |
ONEOK, Inc.
3.10%, due 3/15/30 | | | 750,000 | | | | 717,567 | |
Phillips 66 Partners, L.P.
4.68%, due 2/15/45 | | | 537,000 | | | | 570,816 | |
Plains All American Pipeline, L.P. / PAA Finance Corp.
3.65%, due 6/1/22 | | | 230,000 | | | | 235,106 | |
TransCanada PipeLines, Ltd. | | | | | | | | |
4.875%, due 1/15/26 | | | 335,000 | | | | 393,371 | |
4.875%, due 5/15/48 | | | 650,000 | | | | 806,457 | |
Williams Cos., Inc.
3.35%, due 8/15/22 | | | 325,000 | | | | 338,045 | |
| | | | | | | | |
| | | | | | | 10,057,948 | |
| | | | | | | | |
Real Estate 0.0%‡ | |
Prologis, L.P.
3.75%, due 11/1/25 | | | 230,000 | | | | 264,003 | |
| | | | | | | | |
|
Real Estate Investment Trusts 0.2% | |
American Tower Corp.
5.00%, due 2/15/24 | | | 220,000 | | | | 250,898 | |
AvalonBay Communities, Inc.
2.90%, due 10/15/26 | | | 230,000 | | | | 248,629 | |
ERP Operating, L.P. | | | | | | | | |
3.25%, due 8/1/27 | | | 285,000 | | | | 316,988 | |
4.625%, due 12/15/21 | | | 300,000 | | | | 314,303 | |
Realty Income Corp.
4.65%, due 3/15/47 | | | 175,000 | | | | 219,199 | |
Simon Property Group, L.P.
4.25%, due 11/30/46 | | | 493,000 | | | | 533,669 | |
| | | | | | | | |
| | | | | | | 1,883,686 | |
| | | | | | | | |
Retail 0.8% | |
Home Depot, Inc.
4.25%, due 4/1/46 | | | 975,000 | | | | 1,237,967 | |
Lowe’s Cos., Inc.
4.05%, due 5/3/47 | | | 460,000 | | | | 542,203 | |
McDonald’s Corp.
3.375%, due 5/26/25 | | | 1,710,000 | | | | 1,897,312 | |
Starbucks Corp.
2.55%, due 11/15/30 | | | 1,000,000 | | | | 1,048,948 | |
Target Corp.
3.50%, due 7/1/24 | | | 325,000 | | | | 363,009 | |
| | | | | | | | |
| | | Principal
Amount | | | Value | |
Retail (continued) | | | | | | | | |
Walmart, Inc. | | | | | | | | |
2.85%, due 7/8/24 | | $ | 300,000 | | | $ | 326,475 | |
3.30%, due 4/22/24 | | | 90,000 | | | | 98,911 | |
4.30%, due 4/22/44 | | | 725,000 | | | | 962,500 | |
| | | | | | | | |
| | | | | | | 6,477,325 | |
| | | | | | | | |
Semiconductors 0.5% | |
Applied Materials, Inc.
5.10%, due 10/1/35 | | | 285,000 | | | | 397,189 | |
Broadcom, Inc.
4.15%, due 11/15/30 (a) | | | 750,000 | | | | 815,011 | |
Intel Corp.
3.70%, due 7/29/25 | | | 1,660,000 | | | | 1,886,048 | |
QUALCOMM, Inc.
4.65%, due 5/20/35 | | | 285,000 | | | | 378,821 | |
Texas Instruments, Inc.
2.625%, due 5/15/24 | | | 400,000 | | | | 429,664 | |
| | | | | | | | |
| | | | | | | 3,906,733 | |
| | | | | | | | |
Software 0.9% | |
Fidelity National Information Services, Inc.
3.50%, due 4/15/23 | | | 88,000 | | | | 94,214 | |
Fiserv, Inc.
4.20%, due 10/1/28 | | | 725,000 | | | | 850,719 | |
Microsoft Corp. | | | | | | | | |
2.40%, due 2/6/22 | | | 535,000 | | | | 552,072 | |
3.30%, due 2/6/27 | | | 465,000 | | | | 532,075 | |
4.25%, due 2/6/47 | | | 1,455,000 | | | | 1,983,630 | |
Oracle Corp. | | | | | | | | |
2.95%, due 5/15/25 | | | 2,280,000 | | | | 2,491,258 | |
4.00%, due 7/15/46 | | | 230,000 | | | | 271,773 | |
5.375%, due 7/15/40 | | | 400,000 | | | | 548,710 | |
| | | | | | | | |
| | | | | | | 7,324,451 | |
| | | | | | | | |
Sovereign 0.1% | |
Svensk Exportkredit A.B.
2.375%, due 3/9/22 | | | 600,000 | | | | 620,300 | |
| | | | | | | | |
|
Telecommunications 1.4% | |
AT&T, Inc. | | | | | | | | |
3.60%, due 7/15/25 | | | 335,000 | | | | 372,144 | |
4.25%, due 3/1/27 | | | 1,500,000 | | | | 1,708,713 | |
5.15%, due 11/15/46 | | | 1,950,000 | | | | 2,415,364 | |
Cisco Systems, Inc.
2.95%, due 2/28/26 | | | 535,000 | | | | 602,861 | |
Deutsche Telekom International Finance B.V.
8.75%, due 6/15/30 | | | 285,000 | | | | 445,842 | |
T-Mobile USA, Inc.
3.875%, due 4/15/30 (a) | | | 750,000 | | | | 834,720 | |
Telefonica Emisiones S.A.
7.045%, due 6/20/36 | | | 400,000 | | | | 580,607 | |
| | | | |
| 14 | | MainStay VP Indexed Bond Portfolio | | The notes to the financial statements are an integral part of,
and should be read in conjunction with, the financial statements. |
| | | | | | | | |
| | | Principal
Amount | | | Value | |
| Corporate Bonds (continued) | |
Telecommunications (continued) | |
Verizon Communications, Inc. | | | | | | | | |
4.016%, due 12/3/29 | | $ | 665,000 | | | $ | 793,065 | |
5.50%, due 3/16/47 | | | 1,100,000 | | | | 1,629,248 | |
Vodafone Group PLC
4.375%, due 5/30/28 | | | 1,505,000 | | | | 1,789,904 | |
| | | | | | | | |
| | | | | | | 11,172,468 | |
| | | | | | | | |
Transportation 1.0% | |
Burlington Northern Santa Fe LLC
3.25%, due 6/15/27 | | | 1,081,000 | | | | 1,223,017 | |
Canadian National Railway Co.
6.25%, due 8/1/34 | | | 285,000 | | | | 422,849 | |
CSX Corp. | | | | | | | | |
3.35%, due 9/15/49 | | | 650,000 | | | | 714,831 | |
3.70%, due 11/1/23 | | | 815,000 | | | | 894,332 | |
FedEx Corp. | | | | | | | | |
2.625%, due 8/1/22 | | | 335,000 | | | | 348,424 | |
3.20%, due 2/1/25 | | | 655,000 | | | | 709,675 | |
Norfolk Southern Corp. | | | | | | | | |
3.942%, due 11/1/47 | | | 716,000 | | | | 842,540 | |
4.80%, due 8/15/43 | | | 40,000 | | | | 50,688 | |
Union Pacific Corp.
2.75%, due 3/1/26 | | | 1,905,000 | | | | 2,072,875 | |
United Parcel Service, Inc.
3.40%, due 11/15/46 | | | 530,000 | | | | 571,895 | |
| | | | | | | | |
| | | | | | | 7,851,126 | |
| | | | | | | | |
Total Corporate Bonds
(Cost $186,332,133) | | | | | | | 200,744,433 | |
| | | | | | | | |
|
| Foreign Government Bonds 1.6% | |
Canada 0.3% | |
Province of Ontario Canada
2.50%, due 4/27/26 | | | 1,270,000 | | | | 1,387,589 | |
Province of Quebec Canada
2.50%, due 4/20/26 | | | 850,000 | | | | 932,235 | |
| | | | | | | | |
| | | | | | | 2,319,824 | |
| | | | | | | | |
Colombia 0.1% | |
Colombia Government International Bond
6.125%, due 1/18/41 | | | 720,000 | | | | 898,920 | |
| | | | | | | | |
|
Mexico 0.7% | |
Mexico Government International Bond
4.125%, due 1/21/26 | | | 4,755,000 | | | | 5,135,448 | |
| | | | | | | | |
|
Panama 0.1% | |
Panama Government International Bond
3.75%, due 3/16/25 | | | 975,000 | | | | 1,054,462 | |
| | | | | | | | |
| | | | | | | | |
| | | Principal
Amount | | | Value | |
Peru 0.2% | |
Peruvian Government International Bond
7.35%, due 7/21/25 | | $ | 1,195,000 | | | $ | 1,520,637 | |
| | | | | | | | |
|
Philippines 0.1% | |
Philippine Government International Bond
5.00%, due 1/13/37 | | | 600,000 | | | | 771,402 | |
| | | | | | | | |
|
Republic of Korea 0.1% | |
Korea Development Bank
3.25%, due 2/19/24 | | | 850,000 | | | | 918,807 | |
| | | | | | | | |
Total Foreign Government Bonds
(Cost $11,835,073) | | | | | | | 12,619,500 | |
| | | | | | | | |
|
| Mortgage-Backed Securities 1.5% | |
Agency Collateral
(Collateralized Mortgage Obligation) 0.6% | |
Freddie Mac Multifamily Structured Pass Through Certificates
Series K094, Class A2
2.903%, due 6/25/29 | | | 4,000,000 | | | | 4,575,772 | |
| | | | | | | | |
|
Commercial Mortgage Loans
(Collateralized Mortgage Obligations) 0.9% | |
Bank
Series 2018-BN14, Class A3
3.966%, due 9/15/60 | | | 800,000 | | | | 927,509 | |
Benchmark Mortgage Trust | | | | | | | | |
Series 2018-B1, Class A2
3.571%, due 1/15/51 | | | 100,000 | | | | 103,256 | |
Series 2018-B1, Class A5
3.666%, due 1/15/51 (c) | | | 800,000 | | | | 906,092 | |
Series 2018-B6, Class A3
3.995%, due 10/10/51 | | | 900,000 | | | | 1,048,335 | |
CFCRE Commercial Mortgage Trust | | | | | | | | |
Series 2016-C6, Class A3
3.217%, due 11/10/49 (c) | | | 300,000 | | | | 318,472 | |
Series 2017-C8, Class A3
3.305%, due 6/15/50 | | | 200,000 | | | | 217,424 | |
Citigroup Commercial Mortgage Trust | | | | | | | | |
Series 2017-P8, Class A4
3.465%, due 9/15/50 | | | 300,000 | | | | 336,038 | |
Series 2015-GC35, Class A4
3.818%, due 11/10/48 | | | 300,000 | | | | 332,498 | |
CSAIL Commercial Mortgage Trust
Series 2017-CX9, Class A5
3.446%, due 9/15/50 | | | 300,000 | | | | 330,962 | |
GS Mortgage Securities Trust | | | | | | | | |
Series 2016-GS3, Class A4
2.85%, due 10/10/49 | | | 300,000 | | | | 320,151 | |
| | | | | | |
The notes to the financial statements are an integral part of,
and should be read in conjunction with, the financial statements. | | | | | 15 | |
Portfolio of Investments June 30, 2020 (Unaudited) (continued)
| | | | | | | | |
| | | Principal
Amount | | | Value | |
| Mortgage-Backed Securities (continued) | |
Commercial Mortgage Loans
(Collateralized Mortgage Obligations) (continued) | |
GS Mortgage Securities Trust (continued) | |
Series 2014-GC22, Class A5
3.862%, due 6/10/47 | | $ | 300,000 | | | $ | 324,407 | |
Series 2018-GS9, Class A4
3.992%, due 3/10/51 (c) | | | 800,000 | | | | 913,213 | |
Morgan Stanley Bank of America Merrill Lynch Trust
Series 2013-C7, Class A4
2.918%, due 2/15/46 | | | 300,000 | | | | 308,449 | |
Morgan Stanley Capital I Trust
Series 2018-H3, Class A4
3.914%, due 7/15/51 | | | 500,000 | | | | 575,503 | |
Wells Fargo Commercial Mortgage Trust
Series 2015-SG1, Class A4
3.789%, due 9/15/48 | | | 300,000 | | | | 325,849 | |
WFRBS Commercial Mortgage Trust
Series 2012-C8, Class A3
3.001%, due 8/15/45 | | | 200,000 | | | | 203,706 | |
| | | | | | | | |
| | | | | | | 7,491,864 | |
| | | | | | | | |
Total Mortgage-Backed Securities
(Cost $11,320,860) | | | | | | | 12,067,636 | |
| | | | | | | | |
|
| U.S. Government & Federal Agencies 65.7% | |
Federal Home Loan Bank 0.3% | | | | | | | | |
3.25%, due 11/16/28 | | | 2,200,000 | | | | 2,621,796 | |
| | | | | | | | |
|
Federal Home Loan Mortgage Corporation 0.1% | |
1.875%, due 11/17/20 | | | 400,000 | | | | 402,573 | |
2.375%, due 1/13/22 | | | 500,000 | | | | 516,669 | |
| | | | | | | | |
| | | | | | | 919,242 | |
| | | | | | | | |
Federal Home Loan Mortgage Corporation
(Mortgage Pass-Through Securities) 4.4% | |
2.50%, due 10/1/31 | | | 60,291 | | | | 63,887 | |
2.50%, due 2/1/32 | | | 323,178 | | | | 338,823 | |
2.50%, due 2/1/33 | | | 403,881 | | | | 423,940 | |
2.50%, due 4/1/33 | | | 519,822 | | | | 545,654 | |
2.50%, due 6/1/33 | | | 79,115 | | | | 82,913 | |
2.50%, due 7/1/33 | | | 199,415 | | | | 209,045 | |
2.50%, due 5/1/50 | | | 5,976,491 | | | | 6,282,544 | |
3.00%, due 9/1/27 | | | 181,235 | | | | 190,648 | |
3.00%, due 4/1/32 | | | 229,712 | | | | 241,760 | |
3.00%, due 6/1/32 | | | 61,246 | | | | 64,461 | |
3.00%, due 9/1/32 | | | 29,903 | | | | 31,449 | |
3.00%, due 10/1/32 | | | 132,702 | | | | 139,503 | |
3.00%, due 5/1/33 | | | 199,589 | | | | 209,884 | |
3.00%, due 9/1/33 | | | 214,703 | | | | 225,638 | |
3.00%, due 9/1/36 | | | 131,818 | | | | 141,324 | |
3.00%, due 11/1/37 | | | 128,503 | | | | 136,021 | |
| | | | | | | | |
| | | Principal
Amount | | | Value | |
Federal Home Loan Mortgage Corporation
(Mortgage Pass-Through Securities) (continued) | |
3.00%, due 12/1/37 | | $ | 206,260 | | | $ | 217,441 | |
3.00%, due 9/1/46 | | | 999,335 | | | | 1,058,853 | |
3.00%, due 12/1/46 | | | 68,561 | | | | 72,469 | |
3.00%, due 2/1/47 | | | 73,834 | | | | 78,100 | |
3.00%, due 3/1/47 | | | 333,297 | | | | 352,297 | |
3.00%, due 4/1/47 | | | 97,461 | | | | 102,886 | |
3.00%, due 1/1/48 | | | 833,923 | | | | 879,127 | |
3.00%, due 2/1/48 | | | 528,219 | | | | 556,962 | |
3.00%, due 3/1/48 | | | 454,084 | | | | 478,699 | |
3.00%, due 4/1/48 | | | 675,297 | | | | 727,444 | |
3.00%, due 6/1/48 | | | 715,555 | | | | 754,589 | |
3.50%, due 12/1/25 | | | 41,433 | | | | 43,543 | |
3.50%, due 5/1/33 | | | 180,280 | | | | 189,796 | |
3.50%, due 9/1/33 | | | 53,541 | | | | 56,254 | |
3.50%, due 2/1/37 | | | 174,387 | | | | 185,082 | |
3.50%, due 1/1/38 | | | 208,110 | | | | 220,819 | |
3.50%, due 6/1/43 | | | 197,873 | | | | 215,245 | |
3.50%, due 9/1/44 | | | 188,911 | | | | 206,498 | |
3.50%, due 8/1/45 | | | 388,842 | | | | 415,486 | |
3.50%, due 8/1/46 | | | 532,102 | | | | 568,034 | |
3.50%, due 8/1/47 | | | 62,771 | | | | 66,259 | |
3.50%, due 9/1/47 | | | 145,099 | | | | 153,099 | |
3.50%, due 11/1/47 | | | 285,636 | | | | 301,663 | |
3.50%, due 12/1/47 | | | 658,585 | | | | 695,692 | |
3.50%, due 12/1/47 | | | 5,302,820 | | | | 5,599,955 | |
3.50%, due 1/1/48 | | | 65,633 | | | | 69,412 | |
3.50%, due 3/1/48 | | | 821,225 | | | | 869,204 | |
3.50%, due 5/1/48 | | | 282,165 | | | | 298,426 | |
3.50%, due 6/1/48 | | | 576,906 | | | | 609,862 | |
3.50%, due 8/1/48 | | | 426,559 | | | | 448,292 | |
3.50%, due 9/1/48 | | | 488,320 | | | | 514,762 | |
3.50%, due 11/1/48 | | | 174,085 | | | | 183,004 | |
3.50%, due 12/1/48 | | | 450,084 | | | | 475,000 | |
4.00%, due 4/1/46 | | | 415,851 | | | | 448,317 | |
4.00%, due 5/1/46 | | | 142,572 | | | | 153,912 | |
4.00%, due 4/1/47 | | | 120,893 | | | | 129,313 | |
4.00%, due 6/1/47 | | | 319,998 | | | | 341,298 | |
4.00%, due 8/1/47 | | | 588,113 | | | | 627,784 | |
4.00%, due 10/1/47 | | | 141,100 | | | | 150,148 | |
4.00%, due 12/1/47 | | | 376,760 | | | | 401,146 | |
4.00%, due 1/1/48 | | | 122,840 | | | | 131,079 | |
4.00%, due 5/1/48 | | | 214,271 | | | | 227,949 | |
4.00%, due 9/1/48 | | | 820,113 | | | | 868,306 | |
4.00%, due 12/1/48 | | | 458,972 | | | | 486,124 | |
4.50%, due 5/1/38 | | | 110,994 | | | | 120,450 | |
4.50%, due 9/1/46 | | | 26,220 | | | | 28,520 | |
4.50%, due 9/1/46 | | | 57,484 | | | | 62,611 | |
4.50%, due 10/1/46 | | | 208,960 | | | | 227,599 | |
4.50%, due 2/1/47 | | | 46,352 | | | | 50,372 | |
4.50%, due 11/1/47 | | | 60,444 | | | | 65,281 | |
| | | | |
| 16 | | MainStay VP Indexed Bond Portfolio | | The notes to the financial statements are an integral part of,
and should be read in conjunction with, the financial statements. |
| | | | | | | | |
| | | Principal
Amount | | | Value | |
| U.S. Government & Federal Agencies (continued) | |
Federal Home Loan Mortgage Corporation
(Mortgage Pass-Through Securities) (continued) | |
4.50%, due 2/1/48 | | $ | 114,814 | | | $ | 123,645 | |
4.50%, due 4/1/48 | | | 162,093 | | | | 174,450 | |
4.50%, due 6/1/48 | | | 99,817 | | | | 107,285 | |
4.50%, due 7/1/48 | | | 353,804 | | | | 380,619 | |
4.50%, due 8/1/48 | | | 352,865 | | | | 379,655 | |
4.50%, due 1/1/49 | | | 521,988 | | | | 560,774 | |
5.00%, due 9/1/38 | | | 65,786 | | | | 75,410 | |
5.00%, due 11/1/41 | | | 112,253 | | | | 128,823 | |
5.00%, due 3/1/47 | | | 233,058 | | | | 255,398 | |
5.00%, due 9/1/48 | | | 360,549 | | | | 394,525 | |
5.00%, due 1/1/49 | | | 214,629 | | | | 234,777 | |
5.50%, due 1/1/29 | | | 67,753 | | | | 74,491 | |
5.50%, due 7/1/38 | | | 112,066 | | | | 128,098 | |
| | | | | | | | |
| | | | | | | 34,529,907 | |
| | | | | | | | |
Federal National Mortgage Association 0.4% | |
1.375%, due 9/6/22 | | | 725,000 | | | | 743,008 | |
1.875%, due 4/5/22 | | | 300,000 | | | | 308,855 | |
1.875%, due 9/24/26 | | | 1,650,000 | | | | 1,775,927 | |
2.875%, due 10/30/20 | | | 650,000 | | | | 655,803 | |
| | | | | | | | |
| | | | | | | 3,483,593 | |
| | | | | | | | |
Federal National Mortgage Association
(Mortgage Pass-Through Securities) 14.6% | |
2.50%, due 10/1/27 | | | 201,912 | | | | 211,710 | |
2.50%, due 4/1/30 | | | 170,964 | | | | 179,241 | |
2.50%, due 10/1/31 | | | 313,602 | | | | 329,136 | |
2.50%, due 2/1/32 | | | 261,917 | | | | 274,878 | |
2.50%, due 2/1/32 | | | 251,671 | | | | 264,139 | |
2.50%, due 8/1/32 | | | 466,388 | | | | 494,204 | |
2.50%, due 3/1/33 | | | 313,026 | | | | 332,810 | |
2.50%, due 6/1/33 | | | 288,477 | | | | 302,232 | |
2.50%, due 2/1/35 TBA (d) | | | 7,000,000 | | | | 7,328,672 | |
2.50%, due 4/1/46 | | | 63,852 | | | | 67,124 | |
2.50%, due 10/1/46 | | | 168,646 | | | | 178,391 | |
2.50%, due 2/1/50 TBA (d) | | | 4,500,000 | | | | 4,691,250 | |
3.00%, due 4/1/25 | | | 61,451 | | | | 64,566 | |
3.00%, due 11/1/31 | | | 205,912 | | | | 216,684 | |
3.00%, due 1/1/32 | | | 278,778 | | | | 293,058 | |
3.00%, due 6/1/32 | | | 169,690 | | | | 178,306 | |
3.00%, due 1/1/33 | | | 156,858 | | | | 164,966 | |
3.00%, due 2/1/33 | | | 233,249 | | | | 247,519 | |
3.00%, due 4/1/33 | | | 358,737 | | | | 377,195 | |
3.00%, due 5/1/33 | | | 399,641 | | | | 420,544 | |
3.00%, due 9/1/33 | | | 97,363 | | | | 102,298 | |
3.00%, due 9/1/34 | | | 1,877,091 | | | | 1,972,240 | |
3.00%, due 2/1/37 | | | 202,847 | | | | 217,028 | |
3.00%, due 1/1/38 | | | 614,603 | | | | 647,744 | |
3.00%, due 9/1/42 | | | 1,208,826 | | | | 1,294,828 | |
3.00%, due 3/1/43 | | | 7,925,123 | | | | 8,491,540 | |
| | | | | | | | |
| | | Principal
Amount | | | Value | |
Federal National Mortgage Association
(Mortgage Pass-Through Securities) (continued) | |
3.00%, due 12/1/43 | | $ | 932,376 | | | $ | 997,248 | |
3.00%, due 10/1/44 | | | 787,329 | | | | 843,089 | |
3.00%, due 10/1/46 | | | 167,251 | | | | 176,992 | |
3.00%, due 12/1/46 | | | 1,600,103 | | | | 1,693,288 | |
3.00%, due 2/1/47 | | | 245,616 | | | | 259,769 | |
3.00%, due 8/1/47 | | | 920,816 | | | | 994,853 | |
3.00%, due 10/1/47 | | | 789,786 | | | | 853,287 | |
3.00%, due 11/1/47 | | | 191,526 | | | | 202,117 | |
3.00%, due 6/1/48 | | | 154,580 | | | | 162,915 | |
3.00%, due 9/1/49 | | | 2,419,441 | | | | 2,549,905 | |
3.00%, due 12/1/49 TBA (d) | | | 11,000,000 | | | | 11,585,234 | |
3.00%, due 3/1/50 | | | 5,413,538 | | | | 5,727,056 | |
3.50%, due 7/1/21 | | | 12,625 | | | | 13,258 | |
3.50%, due 3/1/22 | | | 33,200 | | | | 34,867 | |
3.50%, due 5/1/26 | | | 48,278 | | | | 50,761 | |
3.50%, due 11/1/31 | | | 53,418 | | | | 56,460 | |
3.50%, due 5/1/33 | | | 123,507 | | | | 130,353 | |
3.50%, due 6/1/33 | | | 229,539 | | | | 241,265 | |
3.50%, due 7/1/33 | | | 111,798 | | | | 117,503 | |
3.50%, due 9/1/33 | | | 155,669 | | | | 163,629 | |
3.50%, due 5/1/45 | | | 855,348 | | | | 938,607 | |
3.50%, due 9/1/45 | | | 117,613 | | | | 125,037 | |
3.50%, due 12/1/45 | | | 281,743 | | | | 299,498 | |
3.50%, due 12/1/45 | | | 474,590 | | | | 513,336 | |
3.50%, due 1/1/46 | | | 288,413 | | | | 316,521 | |
3.50%, due 1/1/46 | | | 280,485 | | | | 301,543 | |
3.50%, due 4/1/46 | | | 126,340 | | | | 134,235 | |
3.50%, due 9/1/46 | | | 519,972 | | | | 568,435 | |
3.50%, due 10/1/46 | | | 283,400 | | | | 301,058 | |
3.50%, due 10/1/46 | | | 139,294 | | | | 147,835 | |
3.50%, due 1/1/47 | | | 257,318 | | | | 273,061 | |
3.50%, due 7/1/47 | | | 272,749 | | | | 294,982 | |
3.50%, due 7/1/47 | | | 69,061 | | | | 73,088 | |
3.50%, due 10/1/47 | | | 249,601 | | | | 262,384 | |
3.50%, due 11/1/47 | | | 716,339 | | | | 758,778 | |
3.50%, due 11/1/47 | | | 911,806 | | | | 963,431 | |
3.50%, due 11/1/47 | | | 345,580 | | | | 365,580 | |
3.50%, due 12/1/47 | | | 65,641 | | | | 69,315 | |
3.50%, due 3/1/48 | | | 6,163,188 | | | | 6,504,521 | |
3.50%, due 8/1/48 | | | 529,366 | | | | 556,534 | |
3.50%, due 9/1/48 | | | 641,425 | | | | 674,062 | |
3.50%, due 2/1/49 | | | 1,264,955 | | | | 1,329,184 | |
3.50%, due 4/1/49 TBA (d) | | | 8,000,000 | | | | 8,414,062 | |
3.50%, due 9/1/49 | | | 5,241,773 | | | | 5,509,155 | |
4.00%, due 5/1/24 | | | 71,407 | | | | 75,521 | |
4.00%, due 11/1/29 | | | 175,486 | | | | 185,623 | |
4.00%, due 2/1/37 | | | 48,425 | | | | 52,061 | |
4.00%, due 8/1/38 | | | 457,913 | | | | 488,996 | |
4.00%, due 8/1/44 | | | 260,527 | | | | 285,957 | |
4.00%, due 2/1/45 | | | 293,927 | | | | 320,011 | |
| | | | | | |
The notes to the financial statements are an integral part of,
and should be read in conjunction with, the financial statements. | | | | | 17 | |
Portfolio of Investments June 30, 2020 (Unaudited) (continued)
| | | | | | | | |
| | | Principal
Amount | | | Value | |
| U.S. Government & Federal Agencies (continued) | |
Federal National Mortgage Association
(Mortgage Pass-Through Securities) (continued) | |
4.00%, due 9/1/45 | | $ | 58,086 | | | $ | 62,872 | |
4.00%, due 5/1/46 | | | 252,868 | | | | 270,751 | |
4.00%, due 9/1/46 | | | 99,226 | | | | 107,178 | |
4.00%, due 9/1/46 | | | 114,887 | | | | 123,200 | |
4.00%, due 2/1/47 | | | 43,201 | | | | 46,263 | |
4.00%, due 4/1/47 | | | 25,668 | | | | 27,391 | |
4.00%, due 5/1/47 | | | 186,627 | | | | 198,658 | |
4.00%, due 5/1/47 | | | 190,439 | | | | 203,398 | |
4.00%, due 6/1/47 | | | 591,683 | | | | 630,796 | |
4.00%, due 9/1/47 | | | 4,807,602 | | | | 5,116,719 | |
4.00%, due 10/1/47 | | | 64,704 | | | | 69,021 | |
4.00%, due 11/1/47 | | | 62,223 | | | | 66,380 | |
4.00%, due 12/1/47 | | | 160,101 | | | | 169,846 | |
4.00%, due 1/1/48 | | | 413,989 | | | | 439,305 | |
4.00%, due 1/1/48 | | | 62,339 | | | | 66,548 | |
4.00%, due 1/1/48 | | | 351,918 | | | | 374,567 | |
4.00%, due 2/1/48 | | | 184,515 | | | | 195,982 | |
4.00%, due 6/1/48 | | | 813,931 | | | | 863,754 | |
4.00%, due 7/1/48 | | | 885,004 | | | | 936,918 | |
4.00%, due 7/1/48 | | | 225,204 | | | | 238,452 | |
4.00%, due 7/1/48 | | | 564,774 | | | | 598,330 | |
4.00%, due 8/1/48 | | | 151,390 | | | | 160,272 | |
4.00%, due 8/1/48 | | | 3,111,440 | | | | 3,293,572 | |
4.00%, due 9/1/48 | | | 552,954 | | | | 586,327 | |
4.00%, due 9/1/48 | | | 148,794 | | | | 157,522 | |
4.00%, due 10/1/48 | | | 103,598 | | | | 109,678 | |
4.00%, due 11/1/48 | | | 259,695 | | | | 275,095 | |
4.00%, due 1/1/49 | | | 197,596 | | | | 209,319 | |
4.00%, due 9/1/49 | | | 3,157,359 | | | | 3,344,862 | |
4.50%, due 7/1/46 | | | 56,715 | | | | 61,433 | |
4.50%, due 12/1/46 | | | 59,287 | | | | 64,552 | |
4.50%, due 4/1/47 | | | 428,214 | | | | 464,882 | |
4.50%, due 5/1/47 | | | 26,645 | | | | 28,851 | |
4.50%, due 7/1/47 | | | 355,380 | | | | 381,974 | |
4.50%, due 7/1/47 | | | 87,582 | | | | 94,833 | |
4.50%, due 8/1/47 | | | 22,951 | | | | 24,827 | |
4.50%, due 2/1/48 | | | 346,482 | | | | 373,257 | |
4.50%, due 4/1/48 | | | 114,415 | | | | 123,064 | |
4.50%, due 4/1/48 | | | 89,261 | | | | 95,978 | |
4.50%, due 4/1/48 | | | 41,525 | | | | 44,655 | |
4.50%, due 5/1/48 | | | 297,383 | | | | 320,077 | |
4.50%, due 6/1/48 | | | 159,561 | | | | 171,660 | |
4.50%, due 8/1/48 | | | 306,746 | | | | 330,299 | |
4.50%, due 10/1/48 | | | 106,995 | | | | 114,927 | |
4.50%, due 4/1/49 | | | 3,090,755 | | | | 3,319,767 | |
4.50%, due 9/1/49 | | | 1,439,654 | | | | 1,546,729 | |
5.00%, due 8/1/31 | | | 164,555 | | | | 179,392 | |
5.00%, due 6/1/39 | | | 163,641 | | | | 187,211 | |
5.00%, due 6/1/40 | | | 36,311 | | | | 41,731 | |
| | | | | | | | |
| | | Principal
Amount | | | Value | |
Federal National Mortgage Association
(Mortgage Pass-Through Securities) (continued) | |
5.00%, due 7/1/47 | | $ | 123,649 | | | $ | 135,454 | |
5.00%, due 1/1/48 | | | 216,695 | | | | 237,876 | |
5.00%, due 4/1/48 | | | 57,919 | | | | 63,569 | |
5.00%, due 5/1/48 | | | 165,891 | | | | 181,365 | |
5.00%, due 9/1/48 | | | 139,528 | | | | 153,518 | |
5.50%, due 8/1/27 | | | 64,123 | | | | 70,640 | |
5.50%, due 6/1/36 | | | 97,667 | | | | 111,862 | |
5.50%, due 5/1/44 | | | 101,369 | | | | 116,318 | |
5.50%, due 9/1/48 | | | 380,249 | | | | 419,058 | |
| | | | | | | | |
| | | | | | | 115,701,298 | |
| | | | | | | | |
Government National Mortgage Association
(Mortgage Pass-Through Securities) 7.1% | |
2.50%, due 4/20/47 | | | 75,056 | | | | 79,551 | |
2.50%, due 12/1/49 TBA (d) | | | 2,500,000 | | | | 2,631,641 | |
3.00%, due 6/15/45 | | | 44,296 | | | | 46,871 | |
3.00%, due 10/15/45 | | | 30,098 | | | | 31,822 | |
3.00%, due 11/20/45 | | | 743,522 | | | | 792,444 | |
3.00%, due 8/20/46 | | | 280,110 | | | | 298,098 | |
3.00%, due 9/20/46 | | | 148,203 | | | | 157,591 | |
3.00%, due 10/20/46 | | | 918,258 | | | | 976,990 | |
3.00%, due 1/20/47 | | | 1,038,736 | | | | 1,104,012 | |
3.00%, due 5/20/47 | | | 177,119 | | | | 188,225 | |
3.00%, due 12/20/47 | | | 599,127 | | | | 635,789 | |
3.00%, due 2/20/48 | | | 679,155 | | | | 720,614 | |
3.00%, due 3/20/48 | | | 803,504 | | | | 852,554 | |
3.00%, due 5/15/48 | | | 177,672 | | | | 187,890 | |
3.00%, due 12/1/49 TBA (d) | | | 12,700,000 | | | | 13,455,551 | |
3.50%, due 11/20/42 | | | 273,592 | | | | 291,782 | |
3.50%, due 9/20/44 | | | 392,967 | | | | 421,234 | |
3.50%, due 3/15/45 | | | 27,773 | | | | 29,333 | |
3.50%, due 4/15/45 | | | 47,955 | | | | 50,699 | |
3.50%, due 7/20/45 | | | 1,037,196 | | | | 1,110,577 | |
3.50%, due 11/20/45 | | | 473,847 | | | | 507,334 | |
3.50%, due 7/20/46 | | | 53,360 | | | | 57,091 | |
3.50%, due 10/20/46 | | | 54,063 | | | | 57,928 | |
3.50%, due 11/20/46 | | | 665,815 | | | | 712,098 | |
3.50%, due 1/20/47 | | | 768,272 | | | | 817,070 | |
3.50%, due 5/20/47 | | | 623,037 | | | | 664,478 | |
3.50%, due 9/20/47 | | | 665,535 | | | | 708,265 | |
3.50%, due 10/20/47 | | | 1,182,915 | | | | 1,258,277 | |
3.50%, due 12/20/47 | | | 579,682 | | | | 616,010 | |
3.50%, due 5/15/48 | | | 91,597 | | | | 96,454 | |
3.50%, due 7/20/48 | | | 316,982 | | | | 336,894 | |
3.50%, due 9/20/48 | | | 355,671 | | | | 377,145 | |
3.50%, due 10/20/48 | | | 363,965 | | | | 385,886 | |
3.50%, due 4/20/49 | | | 2,089,698 | | | | 2,207,142 | |
3.50%, due 6/1/49 TBA (d) | | | 9,000,000 | | | | 9,496,758 | |
3.50%, due 7/20/49 | | | 2,475,333 | | | | 2,614,450 | |
4.00%, due 8/15/46 | | | 80,850 | | | | 86,375 | |
4.00%, due 12/20/46 | | | 43,379 | | | | 46,693 | |
| | | | |
| 18 | | MainStay VP Indexed Bond Portfolio | | The notes to the financial statements are an integral part of,
and should be read in conjunction with, the financial statements. |
| | | | | | | | |
| | | Principal
Amount | | | Value | |
| U.S. Government & Federal Agencies (continued) | |
Government National Mortgage Association
(Mortgage Pass-Through Securities) (continued) | |
4.00%, due 1/20/47 | | $ | 357,416 | | | $ | 385,588 | |
4.00%, due 2/20/47 | | | 93,620 | | | | 100,687 | |
4.00%, due 3/20/47 | | | 72,192 | | | | 77,558 | |
4.00%, due 4/20/47 | | | 158,634 | | | | 170,883 | |
4.00%, due 5/20/47 | | | 132,957 | | | | 142,869 | |
4.00%, due 7/20/47 | | | 53,835 | | | | 57,907 | |
4.00%, due 11/15/47 | | | 164,554 | | | | 174,248 | |
4.00%, due 11/20/47 | | | 651,020 | | | | 699,368 | |
4.00%, due 12/20/47 | | | 142,479 | | | | 152,624 | |
4.00%, due 4/20/48 | | | 604,832 | | | | 644,222 | |
4.00%, due 5/20/48 | | | 259,543 | | | | 277,572 | |
4.00%, due 6/20/48 | | | 107,155 | | | | 114,570 | |
4.00%, due 8/20/48 | | | 703,806 | | | | 750,195 | |
4.00%, due 9/20/48 | | | 373,098 | | | | 398,636 | |
4.00%, due 3/20/49 | | | 105,016 | | | | 111,385 | |
4.00%, due 7/15/49 | | | 369,436 | | | | 391,200 | |
4.00%, due 7/20/49 | | | 2,704,469 | | | | 2,866,012 | |
4.50%, due 8/15/46 | | | 71,257 | | | | 78,336 | |
4.50%, due 8/20/46 | | | 133,741 | | | | 146,569 | |
4.50%, due 2/15/47 | | | 24,404 | | | | 26,809 | |
4.50%, due 4/15/47 | | | 48,383 | | | | 53,551 | |
4.50%, due 4/20/47 | | | 137,831 | | | | 150,579 | |
4.50%, due 8/15/47 | | | 259,161 | | | | 285,514 | |
4.50%, due 8/15/47 | | | 359,494 | | | | 396,441 | |
4.50%, due 11/20/47 | | | 132,520 | | | | 144,484 | |
4.50%, due 1/20/48 | | | 323,756 | | | | 348,733 | |
4.50%, due 3/20/48 | | | 143,735 | | | | 154,332 | |
4.50%, due 5/20/48 | | | 136,906 | | | | 147,755 | |
4.50%, due 6/20/48 | | | 233,275 | | | | 251,583 | |
4.50%, due 8/20/48 | | | 428,527 | | | | 458,671 | |
5.00%, due 8/20/45 | | | 151,728 | | | | 168,917 | |
5.00%, due 11/20/46 | | | 91,632 | | | | 103,360 | |
5.00%, due 4/15/47 | | | 45,546 | | | | 51,099 | |
5.00%, due 11/20/47 | | | 117,709 | | | | 130,163 | |
5.00%, due 12/15/47 | | | 55,414 | | | | 60,665 | |
5.00%, due 3/20/48 | | | 82,338 | | | | 90,212 | |
5.00%, due 6/20/48 | | | 188,892 | | | | 205,808 | |
| | | | | | | | |
| | | | | | | 56,078,721 | |
| | | | | | | | |
United States Treasury Bonds 7.5% | |
2.00%, due 2/15/50 | | | 5,175,000 | | | | 5,926,588 | |
2.25%, due 8/15/49 | | | 1,375,000 | | | | 1,653,599 | |
2.375%, due 11/15/49 | | | 6,310,000 | | | | 7,793,836 | |
2.75%, due 8/15/47 | | | 1,035,000 | | | | 1,352,333 | |
2.75%, due 11/15/47 | | | 300,000 | | | | 392,508 | |
2.875%, due 5/15/43 | | | 1,950,000 | | | | 2,547,416 | |
2.875%, due 11/15/46 | | | 140,000 | | | | 186,178 | |
2.875%, due 5/15/49 | | | 3,500,000 | | | | 4,735,117 | |
3.00%, due 2/15/47 | | | 815,000 | | | | 1,110,246 | |
| | | | | | | | |
| | | Principal
Amount | | | Value | |
United States Treasury Bonds (continued) | |
3.00%, due 5/15/47 | | $ | 1,175,000 | | | $ | 1,601,580 | |
3.00%, due 2/15/48 | | | 5,950,000 | | | | 8,145,225 | |
3.00%, due 8/15/48 | | | 2,790,000 | | | | 3,836,904 | |
3.00%, due 2/15/49 | | | 2,145,000 | | | | 2,961,441 | |
3.125%, due 5/15/48 | | | 7,900,000 | | | | 11,071,727 | |
3.375%, due 11/15/48 | | | 1,550,000 | | | | 2,277,652 | |
3.625%, due 2/15/44 | | | 150,000 | | | | 219,568 | |
4.50%, due 2/15/36 | | | 1,900,000 | | | | 2,908,484 | |
4.625%, due 2/15/40 | | | 750,000 | | | | 1,216,318 | |
| | | | | | | | |
| | | | | | | 59,936,720 | |
| | | | | | | | |
United States Treasury Notes 31.3% | | | | | | | | |
0.125%, due 4/30/22 | | | 3,000,000 | | | | 2,997,656 | |
0.125%, due 6/30/22 | | | 22,300,000 | | | | 22,286,062 | |
0.125%, due 5/15/23 | | | 9,500,000 | | | | 9,485,898 | |
0.25%, due 4/15/23 | | | 850,000 | | | | 851,793 | |
0.25%, due 6/15/23 | | | 15,450,000 | | | | 15,482,590 | |
0.25%, due 5/31/25 | | | 3,850,000 | | | | 3,845,338 | |
0.25%, due 6/30/25 | | | 4,000,000 | | | | 3,992,188 | |
0.375%, due 3/31/22 | | | 5,000,000 | | | | 5,017,773 | |
0.375%, due 4/30/25 | | | 12,025,000 | | | | 12,079,488 | |
0.50%, due 4/30/27 | | | 1,300,000 | | | | 1,301,930 | |
0.50%, due 5/31/27 | | | 3,050,000 | | | | 3,053,098 | |
0.50%, due 6/30/27 | | | 4,650,000 | | | | 4,653,814 | |
0.625%, due 5/15/30 | | | 6,825,000 | | | | 6,806,071 | |
1.375%, due 9/15/20 | | | 775,000 | | | | 776,911 | |
1.50%, due 7/15/20 | | | 460,000 | | | | 460,235 | |
1.50%, due 8/15/22 | | | 9,275,000 | | | | 9,537,309 | |
1.50%, due 9/15/22 | | | 3,400,000 | | | | 3,500,141 | |
1.50%, due 10/31/24 | | | 3,100,000 | | | | 3,267,715 | |
1.50%, due 1/31/27 | | | 2,400,000 | | | | 2,562,281 | |
1.50%, due 2/15/30 | | | 200,000 | | | | 216,203 | |
1.625%, due 10/15/20 | | | 2,450,000 | | | | 2,460,172 | |
1.625%, due 8/31/22 | | | 700,000 | | | | 721,984 | |
1.625%, due 11/15/22 | | | 8,000,000 | | | | 8,275,000 | |
1.625%, due 10/31/26 | | | 900,000 | | | | 966,691 | |
1.625%, due 8/15/29 | | | 4,150,000 | | | | 4,528,201 | |
1.75%, due 11/15/20 | | | 950,000 | | | | 955,455 | |
1.75%, due 7/31/21 | | | 4,273,600 | | | | 4,346,385 | |
1.75%, due 6/15/22 | | | 900,000 | | | | 927,844 | |
1.75%, due 6/30/22 | | | 1,925,000 | | | | 1,985,607 | |
1.75%, due 7/15/22 | | | 2,000,000 | | | | 2,064,297 | |
1.75%, due 6/30/24 | | | 2,875,000 | | | | 3,049,634 | |
1.75%, due 7/31/24 | | | 14,650,000 | | | | 15,555,897 | |
1.75%, due 11/15/29 | | | 5,600,000 | | | | 6,182,750 | |
1.875%, due 12/15/20 | | | 1,875,000 | | | | 1,889,502 | |
1.875%, due 9/30/22 | | | 950,000 | | | | 986,367 | |
1.875%, due 8/31/24 | | | 650,000 | | | | 694,307 | |
2.00%, due 4/30/24 | | | 4,035,000 | | | | 4,309,884 | |
2.00%, due 5/31/24 | | | 1,400,000 | | | | 1,497,125 | |
2.125%, due 7/31/24 | | | 150,000 | | | | 161,537 | |
| | | | | | |
The notes to the financial statements are an integral part of,
and should be read in conjunction with, the financial statements. | | | | | 19 | |
Portfolio of Investments June 30, 2020 (Unaudited) (continued)
| | | | | | | | |
| | | Principal
Amount | | | Value | |
| U.S. Government & Federal Agencies (continued) | |
United States Treasury Notes (continued) | | | | | |
2.125%, due 5/31/26 | | $ | 5,645,000 | | | $ | 6,216,336 | |
2.25%, due 2/15/21 | | | 3,000,000 | | | | 3,038,672 | |
2.375%, due 3/15/21 | | | 150,000 | | | | 152,314 | |
2.375%, due 4/30/26 | | | 200,000 | | | | 222,969 | |
2.375%, due 5/15/29 | | | 2,125,000 | | | | 2,452,383 | |
2.50%, due 2/15/22 | | | 17,450,000 | | | | 18,105,738 | |
2.50%, due 3/31/23 | | | 100,000 | | | | 106,363 | |
2.625%, due 7/31/20 | | | 55,000 | | | | 55,111 | |
2.625%, due 6/15/21 | | | 925,000 | | | | 946,607 | |
2.625%, due 7/15/21 | | | 4,965,000 | | | | 5,090,871 | |
2.625%, due 6/30/23 | | | 1,900,000 | | | | 2,038,789 | |
2.625%, due 12/31/23 | | | 150,000 | | | | 162,680 | |
2.75%, due 9/30/20 | | | 775,000 | | | | 779,948 | |
2.75%, due 8/15/21 | | | 3,700,000 | | | | 3,806,230 | |
2.75%, due 9/15/21 | | | 2,300,000 | | | | 2,371,336 | |
2.75%, due 4/30/23 | | | 5,425,000 | | | | 5,818,312 | |
2.75%, due 5/31/23 | | | 1,700,000 | | | | 1,826,969 | |
2.75%, due 7/31/23 | | | 4,675,000 | | | | 5,043,521 | |
2.75%, due 8/31/23 | | | 4,000,000 | | | | 4,323,438 | |
2.75%, due 6/30/25 | | | 275,000 | | | | 308,451 | |
2.875%, due 11/15/21 | | | 375,000 | | | | 388,843 | |
2.875%, due 9/30/23 | | | 2,875,000 | | | | 3,124,766 | |
2.875%, due 10/31/23 | | | 5,300,000 | | | | 5,772,031 | |
2.875%, due 11/30/23 | | | 600,000 | | | | 654,539 | |
2.875%, due 5/31/25 | | | 300,000 | | | | 337,840 | |
2.875%, due 7/31/25 | | | 1,425,000 | | | | 1,609,304 | |
| | | | | | | | |
| | | | | | | 248,487,494 | |
| | | | | | | | |
Total U.S. Government & Federal Agencies
(Cost $496,921,982) | | | | | | | 521,758,771 | |
| | | | | | | | |
Total Long-Term Bonds
(Cost $708,283,227) | | | | | | | 749,091,838 | |
| | | | | | | | |
| | |
| | | | | | | | |
| | |
Shares | | | | |
| Exchange-Traded Funds 4.5% | |
iShares Intermediate-Term Corporate Bond ETF | | | 197,918 | | | | 11,950,289 | |
iShares Long-Term Corporate Bond ETF | | | 297,696 | | | | 20,850,628 | |
iShares Short-Term Corporate Bond ETF | | | 54,601 | | | | 2,987,221 | |
| | | | | | | | |
Total Exchange-Traded Funds
(Cost $34,068,846) | | | | | | | 35,788,138 | |
| | | | | | | | |
| | |
| | | | | | | | |
| | | | | | | | |
| | | Principal
Amount | | | Value | |
| Short-Term Investments 8.0% | |
Commercial Paper 2.5% | |
NSTAR Electric Co.
0.051%, due 7/1/20 (e) | | $ | 20,000,000 | | | $ | 20,000,000 | |
| | | | | | | | |
Total Commercial Paper
(Cost $20,000,000) | | | | | | | 20,000,000 | |
| | | | | | | | |
|
Repurchase Agreement 0.6% | |
RBC Capital Markets
0.07%, dated 6/30/20
due 7/1/20
Proceeds at Maturity $4,328,008 (Collateralized by a United States Treasury Note with rates between 0.50% and 1.63% and maturity dates between 4/30/27 and 10/31/26, with a Principal Amount of $4,241,700 and a Market Value of $4,414,620) | | | 4,328,000 | | | | 4,328,000 | |
| | | | | | | | |
Total Repurchase Agreement
(Cost $4,328,000) | | | | | | | 4,328,000 | |
| | | | | | | | |
| | | | | | | | |
|
U.S. Government & Federal Agencies 4.9% | |
United States Treasury Bills
0.068%, due 7/2/20 (e) | | $ | 39,000,000 | | | | 38,999,927 | |
| | | | | | | | |
Total U.S. Government & Federal Agencies
(Cost $38,999,927) | | | | | | | 38,999,927 | |
| | | | | | | | |
Total Short-Term Investments
(Cost $63,327,927) | | | | | | | 63,327,927 | |
| | | | | | | | |
Total Investments
(Cost $805,680,000) | | | 106.8 | % | | | 848,207,903 | |
Other Assets, Less Liabilities | | | (6.8 | ) | | | (53,640,784 | ) |
Net Assets | | | 100.0 | % | | $ | 794,567,119 | |
| † | Percentages indicated are based on Portfolio net assets. |
| ‡ | Less than one-tenth of a percent. |
| (a) | May be sold to institutional investors only under Rule 144A or securities offered pursuant to Section 4(a)(2) of the Securities Act of 1933, as amended. |
| (b) | Fixed to floating rate—Rate shown was the rate in effect as of June 30, 2020. |
| (c) | Coupon rate may change based on changes of the underlying collateral or prepayments of principal. Rate shown was the rate in effect as of June 30, 2020. |
| (d) | TBA—Securities purchased on a forward commitment basis with an approximate principal amount and maturity date. The actual principal amount and maturity date will be determined upon settlement. As of June 30, 2020, the total net market value of these securities was $57,603,168, which represented 7.2% of the Portfolio’s net assets. All or a portion of these securities are a part of a mortgage dollar roll agreement. |
| (e) | Interest rate shown represents yield to maturity. |
| | | | |
| 20 | | MainStay VP Indexed Bond Portfolio | | The notes to the financial statements are an integral part of,
and should be read in conjunction with, the financial statements. |
Futures Contracts
As of June 30, 2020, the Portfolio held the following futures contracts1:
| | | | | | | | | | | | | | | | | | | | |
Type | | Number of
Contracts | | | Expiration
Date | | | Value at
Trade Date | | | Current
Notional
Amount | | | Unrealized
Appreciation
(Depreciation)2 | |
| | | | | |
Long Contracts | | | | | | | | | | | | | | | | | | | | |
| 5-Year United States Treasury Note | | | 152 | | | | September 2020 | | | $ | 19,082,082 | | | $ | 19,112,813 | | | $ | 30,731 | |
| 10-Year United States Treasury Note | | | 96 | | | | September 2020 | | | | 13,338,357 | | | | 13,360,500 | | | | 22,143 | |
| 10-Year United States Treasury Ultra Note | | | 54 | | | | September 2020 | | | | 8,490,588 | | | | 8,504,156 | | | | 13,568 | |
| United States Treasury Ultra Bond | | | 14 | | | | September 2020 | | | | 3,042,057 | | | | 3,054,187 | | | | 12,130 | |
| | | | | | | | | | | | | | | | | | | | |
| Total Long Contracts | | | | | | | | | | | | | | | | | | | 78,572 | |
| | | | | | | | | | | | | | | | | | | | |
| | | |
Short Contracts | | | | | | | | | | | | | |
| 2-Year United States Treasury Note | | | (62 | ) | | | September 2020 | | | | (13,689,373 | ) | | | (13,691,344 | ) | | | (1,971 | ) |
| United States Treasury Long Bond | | | (4 | ) | | | September 2020 | | | | (715,586 | ) | | | (714,250 | ) | | | 1,336 | |
| | | | | | | | | | | | | | | | | | | | |
| Total Short Contracts | | | | | | | | | | | | | | | | | | | (635 | ) |
| | | | | | | | | | | | | | | | | | | | |
| Net Unrealized Appreciation | | | | | | | | | | | | | | | | | | $ | 77,937 | |
| | | | | | | | | | | | | | | | | | | | |
| 1. | As of June 30, 2020, cash in the amount of $552,450 was on deposit with a broker or futures commission merchant for futures transactions. |
| 2. | Represents the difference between the value of the contracts at the time they were opened and the value as of June 30, 2020. |
The following abbreviations are used in the preceding pages:
ETF—Exchange-Traded Fund
SOFR—Secured Overnight Financing Rate
TBA—To Be Announced
| | | | | | |
The notes to the financial statements are an integral part of,
and should be read in conjunction with, the financial statements. | | | | | 21 | |
Portfolio of Investments June 30, 2020 (Unaudited) (continued)
The following is a summary of the fair valuations according to the inputs used as of June 30, 2020, for valuing the Portfolio’s assets and liabilities:
| | | | | | | | | | | | | | | | |
Description | | Quoted
Prices in
Active
Markets for
Identical
Assets (Level 1) | | | Significant
Other
Observable
Inputs (Level 2) | | | Significant
Unobservable
Inputs (Level 3) | | | Total | |
| | | | |
Asset Valuation Inputs | | | | | | | | | | | | | | | | |
| Investments in Securities (a) | | | | | | | | | | | | | | | | |
| Long-Term Bonds | | | | | | | | | | | | | | | | |
Asset-Backed Securities | | $ | — | | | $ | 1,901,498 | | | $ | — | | | $ | 1,901,498 | |
Corporate Bonds | | | — | | | | 200,744,433 | | | | — | | | | 200,744,433 | |
Foreign Government Bonds | | | — | | | | 12,619,500 | | | | — | | | | 12,619,500 | |
Mortgage-Backed Securities | | | — | | | | 12,067,636 | | | | — | | | | 12,067,636 | |
U.S. Government & Federal Agencies | | | — | | | | 521,758,771 | | | | — | | | | 521,758,771 | |
| | | | | | | | | | | | | | | | |
| Total Long-Term Bonds | | | — | | | | 749,091,838 | | | | — | | | | 749,091,838 | |
| | | | | | | | | | | | | | | | |
| Exchange-Traded Funds | | | 35,788,138 | | | | — | | | | — | | | | 35,788,138 | |
| Short-Term Investments | | | | | | | | | | | | | | | | |
Commercial Paper | | | — | | | | 20,000,000 | | | | — | | | | 20,000,000 | |
Repurchase Agreement | | | — | | | | 4,328,000 | | | | — | | | | 4,328,000 | |
U.S. Government & Federal Agencies | | | — | | | | 38,999,927 | | | | — | | | | 38,999,927 | |
| | | | | | | | | | | | | | | | |
| Total Short-Term Investments | | | — | | | | 63,327,927 | | | | — | | | | 63,327,927 | |
| | | | | | | | | | | | | | | | |
| Total Investments in Securities | | | 35,788,138 | | | | 812,419,765 | | | | — | | | | 848,207,903 | |
| | | | | | | | | | | | | | | | |
| Other Financial Instruments | | | | | | | | | | | | | | | | |
Futures Contracts (b) | | | 79,908 | | | | — | | | | — | | | | 79,908 | |
| | | | | | | | | | | | | | | | |
| Total Investments in Securities and Other Financial Instruments | | $ | 35,868,046 | | | $ | 812,419,765 | | | $ | — | | | $ | 848,287,811 | |
| | | | | | | | | | | | | | | | |
| | | | |
Liability Valuation Inputs | | | | | | | | | | | | | | | | |
| Other Financial Instruments | | | | | | | | | | | | | | | | |
Futures Contracts (b) | | $ | (1,971 | ) | | $ | — | | | $ | — | | | $ | (1,971 | ) |
| | | | | | | | | | | | | | | | |
| (a) | For a complete listing of investments and their industries, see the Portfolio of Investments. |
| (b) | The value listed for these securities reflects unrealized appreciation (depreciation) as shown on the Portfolio of Investments. |
| | | | |
| 22 | | MainStay VP Indexed Bond Portfolio | | The notes to the financial statements are an integral part of,
and should be read in conjunction with, the financial statements. |
Statement of Assets and Liabilities as of June 30, 2020 (Unaudited)
| | | | |
| Assets | | | | |
Investment in securities, at value
(identified cost $805,680,000) | | $ | 848,207,903 | |
Cash collateral on deposit at broker for futures contracts | | | 552,450 | |
Cash | | | 605 | |
Receivables: | | | | |
Interest | | | 3,677,155 | |
Portfolio shares sold | | | 1,528,265 | |
Other assets | | | 5,320 | |
| | | | |
Total assets | | | 853,971,698 | |
| | | | |
| |
| Liabilities | | | | |
Payables: | | | | |
Investment securities purchased | | | 58,796,615 | |
Portfolio shares redeemed | | | 195,782 | |
Variation margin on futures contracts | | | 181,290 | |
Manager (See Note 3) | | | 157,671 | |
NYLIFE Distributors (See Note 3) | | | 34,358 | |
Professional fees | | | 28,250 | |
Custodian | | | 10,004 | |
Trustees | | | 609 | |
| | | | |
Total liabilities | | | 59,404,579 | |
| | | | |
Net assets | | $ | 794,567,119 | |
| | | | |
| |
| Composition of Net Assets | | | | |
Shares of beneficial interest outstanding (par value of $.001 per share) unlimited number of shares authorized | | $ | 70,383 | |
Additional paid-in capital | | | 727,813,598 | |
| | | | |
| | | 727,883,981 | |
Total distributable earnings (loss) | | | 66,683,138 | |
| | | | |
Net assets | | $ | 794,567,119 | |
| | | | |
| | | | |
Initial Class | | | | |
Net assets applicable to outstanding shares | | $ | 620,141,829 | |
| | | | |
Shares of beneficial interest outstanding | | | 54,857,867 | |
| | | | |
Net asset value per share outstanding | | $ | 11.30 | |
| | | | |
Service Class | | | | |
Net assets applicable to outstanding shares | | $ | 174,425,290 | |
| | | | |
Shares of beneficial interest outstanding | | | 15,524,951 | |
| | | | |
Net asset value per share outstanding | | $ | 11.24 | |
| | | | |
| | | | | | |
The notes to the financial statements are an integral part of,
and should be read in conjunction with, the financial statements. | | | | | 23 | |
Statement of Operations for the six months ended June 30, 2020 (Unaudited)
| | | | |
| Investment Income (Loss) | | | | |
Income | | | | |
Interest | | $ | 6,917,641 | |
Dividends | | | 340,460 | |
Securities lending | | | 10,396 | |
Other | | | 1,879 | |
| | | | |
Total income | | | 7,270,376 | |
| | | | |
Expenses | | | | |
Manager (See Note 3) | | | 789,271 | |
Distribution/Service—Service Class (See Note 3) | | | 182,995 | |
Professional fees | | | 50,284 | |
Custodian | | | 22,371 | |
Shareholder communication | | | 14,184 | |
Trustees | | | 6,925 | |
Miscellaneous | | | 10,858 | |
| | | | |
Total expenses | | | 1,076,888 | |
| | | | |
Net investment income (loss) | | | 6,193,488 | |
| | | | |
|
| Realized and Unrealized Gain (Loss) on Investments and Futures Contracts | |
Net realized gain (loss) on: | | | | |
Investment transactions | | | 4,460,826 | |
Futures transactions | | | 1,671,388 | |
| | | | |
Net realized gain (loss) on investments and futures transactions | | | 6,132,214 | |
| | | | |
Net change in unrealized appreciation (depreciation) on: | | | | |
Investments | | | 25,039,687 | |
Futures contracts | | | 167,063 | |
| | | | |
Net change in unrealized appreciation (depreciation) on investments and futures contracts | | | 25,206,750 | |
| | | | |
Net realized and unrealized gain (loss) on investments and futures transactions | | | 31,338,964 | |
| | | | |
Net increase (decrease) in net assets resulting from operations | | $ | 37,532,452 | |
| | | | |
| | | | |
| 24 | | MainStay VP Indexed Bond Portfolio | | The notes to the financial statements are an integral part of,
and should be read in conjunction with, the financial statements. |
Statements of Changes in Net Assets
for the six months ended June 30, 2020 (Unaudited) and the year ended December 31, 2019
| | | | | | | | |
| | | 2020 | | | 2019 | |
| Increase (Decrease) in Net Assets | |
Operations: | | | | | | | | |
Net investment income (loss) | | $ | 6,193,488 | | | $ | 11,583,504 | |
Net realized gain (loss) on investments and futures transactions | | | 6,132,214 | | | | 2,399,666 | |
Net change in unrealized appreciation (depreciation) on investments and futures contracts | | | 25,206,750 | | | | 18,694,074 | |
| | | | |
Net increase (decrease) in net assets resulting from operations | | | 37,532,452 | | | | 32,677,244 | |
| | | | |
Capital share transactions: | | | | | | | | |
Net proceeds from sale of shares | | | 320,266,266 | | | | 211,348,070 | |
Cost of shares redeemed | | | (101,944,688 | ) | | | (104,416,966 | ) |
| | | | |
Increase (decrease) in net assets derived from capital share transactions | | | 218,321,578 | | | | 106,931,104 | |
| | | | |
Net increase (decrease) in net assets | | | 255,854,030 | | | | 139,608,348 | |
|
| Net Assets | |
Beginning of period | | | 538,713,089 | | | | 399,104,741 | |
| | | | |
End of period | | $ | 794,567,119 | | | $ | 538,713,089 | |
| | | | |
| | | | | | |
The notes to the financial statements are an integral part of,
and should be read in conjunction with, the financial statements. | | | | | 25 | |
Financial Highlights selected per share data and ratios
| | | | | | | | | | | | | | | | | | | | |
| | | | |
| | | Six months
ended
June 30, | | | | | | Year ended December 31, | | | May 1,
2017^
through
December 31, | |
| | | | | |
| Initial Class | | 2020* | | | | | | 2019 | | | 2018 | | | 2017 | |
| | | | | |
Net asset value at beginning of period | | $ | 10.62 | | | | | | | $ | 9.80 | | | $ | 10.04 | | | $ | 10.00 | |
| | | | | | | | | | | | | | | | | | | | |
| | | | | |
Net investment income (loss) (a) | | | 0.11 | | | | | | | | 0.27 | | | | 0.26 | | | | 0.13 | |
| | | | | |
Net realized and unrealized gain (loss) on investments | | | 0.57 | | | | | | | | 0.55 | | | | (0.33 | ) | | | 0.01 | |
| | | | | | | | | | | | | | | | | | | | |
| | | | | |
Total from investment operations | | | 0.68 | | | | | | | | 0.82 | | | | (0.07 | ) | | | 0.14 | |
| | | | | | | | | | | | | | | | | | | | |
| | | | | |
| Less distributions: | | | | | | | | | | | | | | | | | | | | |
| | | | | |
From net investment income | | | — | | | | | | | | — | | | | (0.17 | ) | | | (0.10 | ) |
| | | | | |
From net realized gain on investments | | | — | | | | | | | | — | | | | — | | | | (0.00 | )‡ |
| | | | | | | | | | | | | | | | | | | | |
| | | | | |
Total distributions | | | — | | | | | | | | — | | | | (0.17 | ) | | | (0.10 | ) |
| | | | | | | | | | | | | | | | | | | | |
| | | | | |
Net asset value at end of period | | $ | 11.30 | | | | | | | $ | 10.62 | | | $ | 9.80 | | | $ | 10.04 | |
| | | | | | | | | | | | | | | | | | | | |
| | | | | |
Total investment return (b) | | | 6.40 | %(c) | | | | | | | 8.37 | %(c) | | | (0.67 | %) | | | 1.42 | % |
| | | | | |
| Ratios (to average net assets)/Supplemental Data: | | | | | | | | | | | | | | | | | | | | |
| | | | | |
Net investment income (loss) | | | 2.02 | %†† | | | | | | | 2.66 | % | | | 2.67 | % | | | 1.92 | %†† |
| | | | | |
Net expenses (d) | | | 0.28 | %†† | | | | | | | 0.30 | % | | | 0.31 | % | | | 0.37 | %†† |
| | | | | |
Portfolio turnover rate (e) | | | 60 | % | | | | | | | 65 | % | | | 143 | % | | | 104 | %(f) |
| | | | | |
Net assets at end of period (in 000’s) | | $ | 620,142 | | | | | | | $ | 422,163 | | | $ | 362,545 | | | $ | 140,759 | |
| ‡ | Less than one cent per share. |
| (a) | Per share data based on average shares outstanding during the period. |
| (b) | Total return does not reflect any deduction of sales charges, mortality and expense charges, contract charges or administrative charges. For periods of less than one year, total return is not annualized. |
| (c) | Total investment return may reflect adjustments to conform to generally accepted accounting principles. |
| (d) | In addition to the fees and expenses which the Portfolio bears directly, it also indirectly bears a pro-rata share of the fees and expenses of the underlying funds in which it invests. Such indirect expenses are not included in the above expense ratios. |
| (e) | The portfolio turnover rate not including mortgage dollar rolls were 46%, 57%, 104% and 59% for the six months ended June 30, 2020 and for the years ended December 31, 2019, 2018 and for the period ended December 31, 2017, respectively. |
| (f) | Portfolio turnover rate is not annualized. |
| | | | |
| 26 | | MainStay VP Indexed Bond Portfolio | | The notes to the financial statements are an integral part of,
and should be read in conjunction with, the financial statements. |
Financial Highlights selected per share data and ratios
| | | | | | | | | | | | | | | | | | | | |
| | | | |
| | | Six months
ended
June 30, | | | | | | Year ended December 31, | | | May 1,
2017^
through December 31, | |
| | | | | |
| Service Class | | 2020* | | | | | | 2019 | | | 2018 | | | 2017 | |
| | | | | |
Net asset value at beginning of period | | $ | 10.56 | | | | | | | $ | 9.78 | | | $ | 10.03 | | | $ | 10.00 | |
| | | | | | | | | | | | | | | | | | | | |
| | | | | |
Net investment income (loss) (a) | | | 0.10 | | | | | | | | 0.24 | | | | 0.24 | | | | 0.12 | |
| | | | | |
Net realized and unrealized gain (loss) on investments | | | 0.58 | | | | | | | | 0.54 | | | | (0.33 | ) | | | 0.00 | ‡ |
| | | | | | | | | | | | | | | | | | | | |
| | | | | |
Total from investment operations | | | 0.68 | | | | | | | | 0.78 | | | | (0.09 | ) | | | 0.12 | |
| | | | | | | | | | | | | | | | | | | | |
| | | | | |
| Less distributions: | | | | | | | | | | | | | | | | | | | | |
| | | | | |
From net investment income | | | — | | | | | | | | — | | | | (0.16 | ) | | | (0.09 | ) |
| | | | | |
From net realized gain on investments | | | — | | | | | | | | — | | | | — | | | | (0.00 | )‡ |
| | | | | | | | | | | | | | | | | | | | |
| | | | | |
Total distributions | | | — | | | | | | | | — | | | | (0.16 | ) | | | (0.09 | ) |
| | | | | | | | | | | | | | | | | | | | |
| | | | | |
Net asset value at end of period | | $ | 11.24 | | | | | | | $ | 10.56 | | | $ | 9.78 | | | $ | 10.03 | |
| | | | | | | | | | | | | | | | | | | | |
| | | | | |
Total investment return (b) | | | 6.44 | %(c) | | | | | | | 7.98 | %(c) | | | (0.92 | %) | | | 1.26 | % |
| | | | | |
| Ratios (to average net assets)/Supplemental Data: | | | | | | | | | | | | | | | | | | | | |
| | | | | |
Net investment income (loss) | | | 1.77 | %†† | | | | | | | 2.36 | % | | | 2.48 | % | | | 1.70 | %†† |
| | | | | |
Net expenses (d) | | | 0.53 | %†† | | | | | | | 0.55 | % | | | 0.56 | % | | | 0.62 | %†† |
| | | | | |
Portfolio turnover rate (e) | | | 60 | % | | | | | | | 65 | % | | | 143 | % | | | 104 | %(f) |
| | | | | |
Net assets at end of period (in 000’s) | | $ | 174,425 | | | | | | | $ | 116,550 | | | $ | 36,560 | | | $ | 3,424 | |
| ‡ | Less than one cent per share. |
| (a) | Per share data based on average shares outstanding during the period. |
| (b) | Total return does not reflect any deduction of sales charges, mortality and expense charges, contract charges or administrative charges. For periods of less than one year, total return is not annualized. |
| (c) | Total investment return may reflect adjustments to conform to generally accepted accounting principles. |
| (d) | In addition to the fees and expenses which the Portfolio bears directly, it also indirectly bears a pro-rata share of the fees and expenses of the underlying funds in which it invests. Such indirect expenses are not included in the above expense ratios. |
| (e) | The portfolio turnover rate not including mortgage dollar rolls were 46%, 57%, 104% and 59% for the six months ended June 30, 2020 and for the years ended December 31, 2019, 2018 and for the period ended December 31, 2017, respectively. |
| (f) | Portfolio turnover rate is not annualized. |
| | | | | | |
The notes to the financial statements are an integral part of,
and should be read in conjunction with, the financial statements. | | | | | 27 | |
Notes to Financial Statements (Unaudited)
Note 1–Organization and Business
MainStay VP Funds Trust (the “Fund”) was organized as a Delaware statutory trust on February 1, 2011. The Fund is registered under the Investment Company Act of 1940, as amended (the “1940 Act”), as an open-end management investment company. The Fund is comprised of thirty-one separate series (collectively referred to as the “Portfolios”). These financial statements and notes relate to the MainStay VP Indexed Bond Portfolio (the “Portfolio”), a “diversified” portfolio, as that term is defined in the 1940 Act, as interpreted or modified by regulatory authorities having jurisdiction, from time to time.
Shares of the Portfolio are currently offered to certain separate accounts to fund variable annuity policies and variable universal life insurance policies issued by New York Life Insurance and Annuity Corporation (“NYLIAC”), a wholly-owned subsidiary of New York Life Insurance Company (“New York Life”) and may also be offered to fund variable annuity policies and variable universal life insurance policies issued by other insurance companies. NYLIAC allocates shares of the Portfolios to, among others, certain NYLIAC separate accounts. Shares of the Portfolio are also offered to the MainStay VP Conservative Allocation Portfolio, MainStay VP Moderate Allocation Portfolio, MainStay VP Moderate Growth Allocation Portfolio and MainStay VP Growth Allocation Portfolio, which operate as “funds-of-funds,” and other variable insurance funds.
The Portfolio currently offers two classes of shares. Initial Class and Service Class shares commenced operations on May 1, 2017. Shares of the Portfolio are offered and are redeemed at a price equal to their respective net asset value (“NAV”) per share. No sales or redemption charge is applicable to the purchase or redemption of the Portfolio’s shares. Under the terms of the Fund’s multiple class plan adopted pursuant to Rule 18f-3 under the 1940 Act, the classes differ in that, among other things, Service Class shares of the Portfolio pay a combined distribution and service fee of 0.25% of average daily net assets attributable to Service Class shares of the Portfolio to the Distributor (as defined in Note 3(B)) pursuant to a plan adopted in accordance with Rule 12b-1 under the 1940 Act. Contract owners of variable annuity contracts purchased after June 2, 2003, are permitted to invest only in the Service Class shares.
The Portfolio’s investment objective is to seek investment results that correspond to the total return performance of fixed-income securities in the aggregate, as represented by the Portfolio’s primary benchmark index.
Note 2–Significant Accounting Policies
The Portfolio is an investment company and accordingly follows the investment company accounting and reporting guidance of the Financial Accounting Standards Board (“FASB”) Accounting Standard Codification Topic 946 Financial Services—Investment Companies. The Portfolio prepares its financial statements in accordance with generally accepted accounting principles (“GAAP”) in the United States of America and follows the significant accounting policies described below.
(A) Securities Valuation. Investments are usually valued as of the close of regular trading on the New York Stock Exchange (the “Exchange”) (usually 4:00 p.m. Eastern time) on each day the Portfolio is open for business (“valuation date”).
The Board of Trustees of the Fund (the “Board”) adopted procedures establishing methodologies for the valuation of the Portfolio’s securities and other assets and delegated the responsibility for valuation determinations under those procedures to the Valuation Committee of the Fund (the “Valuation Committee”). The procedures state that, subject to the oversight of the Board and unless otherwise noted, the responsibility for the day-to-day valuation of portfolio assets (including fair value measurements for the Portfolio’s assets and liabilities) rests with New York Life Investment Management LLC (“New York Life Investments” or the “Manager”), aided to whatever extent necessary by the Subadvisor (as defined in Note 3(A)). To assess the appropriateness of security valuations, the Manager, the Subadvisor or the Portfolio’s third-party service provider, who is subject to oversight by the Manager, regularly compares prior day prices, prices on comparable securities and the sale prices to the prior and current day prices and challenges prices with changes exceeding certain tolerance levels with third-party pricing services or broker sources.
The Board authorized the Valuation Committee to appoint a Valuation Subcommittee (the “Subcommittee”) to establish the prices of securities for which market quotations are not readily available or the prices of which are not otherwise readily determinable under the procedures. The Subcommittee meets (in person, via electronic mail or via teleconference) on an as-needed basis. The Valuation Committee meets to ensure that actions taken by the Subcommittee were appropriate.
For those securities valued through either a standardized fair valuation methodology or a fair valuation measurement, the Subcommittee deals with such valuation and the Valuation Committee reviews and affirms, if appropriate, the reasonableness of the valuation based on such methodologies and measurements on a regular basis after considering information that is reasonably available and deemed relevant by the Valuation Committee. Any action taken by the Subcommittee with respect to the valuation of a portfolio security or other asset is submitted for review and ratification (if appropriate) to the Valuation Committee and the Board at the next regularly scheduled meeting.
“Fair value” is defined as the price the Portfolio would reasonably expect to receive upon selling an asset or liability in an orderly transaction to an independent buyer in the principal or most advantageous market for the asset or liability. Fair value measurements are determined within a framework that establishes a three-tier hierarchy that maximizes the use of observable market data and minimizes the use of unobservable inputs to establish a classification of fair value measurements for disclosure purposes. “Inputs” refer broadly to the assumptions that market participants would use in pricing the asset or liability, including assumptions about risk, such as the risk inherent in a particular valuation technique used to measure fair value using a pricing model and/or the risk inherent in the inputs for the valuation technique. Inputs may be observable or unobservable. Observable inputs reflect the assumptions market participants would use in pricing the asset or liability based on market data obtained from sources independent of the Portfolio. Unobservable inputs reflect the Portfolio’s own assumptions about the assumptions market participants would use in pricing the asset or liability based on the information available. The inputs or methodology used for valuing assets or liabilities may not be an indication of the risks
| | |
| 28 | | MainStay VP Indexed Bond Portfolio |
associated with investing in those assets or liabilities. The three-tier hierarchy of inputs is summarized below.
| • | | Level 1—quoted prices in active markets for an identical asset or liability |
| • | | Level 2—other significant observable inputs (including quoted prices for a similar asset or liability in active markets, interest rates and yield curves, prepayment speeds, credit risk, etc.) |
| • | | Level 3—significant unobservable inputs (including the Portfolio’s own assumptions about the assumptions that market participants would use in measuring fair value of an asset or liability) |
The level of an asset or liability within the fair value hierarchy is based on the lowest level of an input, both individually and in the aggregate, that is significant to the fair value measurement. The aggregate value by input level of the Portfolio’s assets and liabilities as of June 30, 2020 is included at the end of the Portfolio of Investments.
The Portfolio may use third-party vendor evaluations, whose prices may be derived from one or more of the following standard inputs, among others:
| | |
• Benchmark yields | | • Reported trades |
• Broker/dealer quotes | | • Issuer spreads |
• Two-sided markets | | • Benchmark securities |
• Bids/offers | | • Reference data (corporate actions or material event notices) |
• Industry and economic events | | • Comparable bonds |
• Monthly payment information | | |
An asset or liability for which market values cannot be measured using the methodologies described above is valued by methods deemed reasonable in good faith by the Valuation Committee, following the procedures established by the Board, to represent fair value. Under these procedures, the Portfolio generally uses a market-based approach which may use related or comparable assets or liabilities, recent transactions, market multiples, book values and other relevant information. The Portfolio may also use an income-based valuation approach in which the anticipated future cash flows of the asset or liability are discounted to calculate fair value. Discounts may also be applied due to the nature and/or duration of any restrictions on the disposition of the asset or liability. Fair value represents a good faith approximation of the value of a security. Fair value determinations involve the consideration of a number of subjective factors, an analysis of applicable facts and circumstances and the exercise of judgment. As a result, it is possible that the fair value for a security determined in good faith in accordance with the Portfolio’s valuation procedures may differ from valuations for the same security determined by other funds using their own valuation procedures. Although the Portfolio’s valuation procedures are designed to value a security at the price the Portfolio may reasonably expect to receive upon the security’s sale in an orderly transaction, there can be no assurance that any fair value determination thereunder would, in fact, approximate the amount that the Portfolio would actually realize upon the sale of the security or the price at which the security would trade if a reliable market price were readily available. During the six-month period ended June 30, 2020, there were no material changes to the fair value methodologies.
Securities which may be valued in this manner include, but are not limited to: (i) a security for which trading has been halted or suspended; (ii) a debt security that has recently gone into default and for which there is not a current market quotation; (iii) a security of an issuer that has entered into a restructuring; (iv) a security that has been delisted from a national exchange; (v) a security for which the market price is not readily available from a third-party pricing source or, if so provided, does not, in the opinion of the Manager or the Subadvisor, reflect the security’s market value; (vi) a security subject to trading collars for which no or limited trading takes place; and (vii) a security whose principal market has been temporarily closed at a time when, under normal conditions, it would be open. Securities valued in this manner are generally categorized as Level 3 in the hierarchy. As of June 30, 2020, no securities held by the Portfolio were fair valued in such a manner.
Exchange-traded funds (“ETFs”) are valued at the last quoted sales prices as of the close of regular trading on the relevant exchange on each valuation date. Securities that are not traded on the valuation date are valued at the mean of the last quoted bid and ask prices. Prices are normally taken from the principal market in which each security trades. Futures contracts are valued at the last posted settlement price on the market where such futures are primarily traded. These securities are generally categorized as Level 1 in the hierarchy.
Investments in mutual funds, including money market funds, are valued at their respective NAVs as of the close of the Exchange on the valuation date. These securities are generally categorized as Level 1 in the hierarchy.
Debt securities (other than convertible and municipal bonds) are valued at the evaluated bid prices (evaluated mean prices in the case of convertible and municipal bonds) supplied by a pricing agent or broker selected by the Manager, in consultation with the Subadvisor. The evaluations are market-based measurements processed through a pricing application and represents the pricing agent’s good faith determination as to what a holder may receive in an orderly transaction under market conditions. The rules based logic utilizes valuation techniques that reflect participants’ assumptions and vary by asset class and per methodology, maximizing the use of relevant observable data including quoted prices for similar assets, benchmark yield curves and market corroborated inputs. The evaluated bid or mean prices are deemed by the Manager, in consultation with the Subadvisor to be representative of market values at the regular close of trading of the Exchange on each valuation date. Debt securities purchased on a delayed delivery basis are marked to market daily until settlement at the forward settlement date. Debt securities, including corporate bonds, U.S. government and federal agency bonds, municipal bonds, foreign bonds, convertible bonds, asset-backed securities and mortgage-backed securities are generally categorized as Level 2 in the hierarchy.
Temporary cash investments acquired in excess of 60 days to maturity at the time of purchase are valued using the latest bid prices or using valuations based on a matrix system (which considers such factors as security prices, yields, maturities and ratings), both as furnished by independent pricing services. Temporary cash investments that mature in 60 days or less at the time of purchase (“Short-Term Investments”) are valued using the amortized cost method of valuation, unless the use of such method would be inappropriate. The amortized cost method
Notes to Financial Statements (Unaudited) (continued)
involves valuing a security at its cost on the date of purchase and thereafter assuming a constant amortization to maturity of the difference between such cost and the value on maturity date. Amortized cost approximates the current fair value of a security. Securities valued using the amortized cost method are not valued using quoted prices in an active market and are generally categorized as Level 2 in the hierarchy.
The information above is not intended to reflect an exhaustive list of the methodologies that may be used to value portfolio investments. The valuation procedures permit the use of a variety of valuation methodologies in connection with valuing portfolio investments. The methodology used for a specific type of investment may vary based on the market data available or other considerations. The methodologies summarized above may not represent the specific means by which portfolio investments are valued on any particular business day.
(B) Income Taxes. The Portfolio’s policy is to comply with the requirements of the Internal Revenue Code of 1986, as amended (the “Internal Revenue Code”), applicable to regulated investment companies and to distribute all of its taxable income to the shareholders of the Portfolio within the allowable time limits.
The Manager evaluates the Portfolio’s tax positions to determine if the tax positions taken meet the minimum recognition threshold in connection with accounting for uncertainties in income tax positions taken or expected to be taken for the purposes of measuring and recognizing tax liabilities in the financial statements. Recognition of tax benefits of an uncertain tax position is permitted only to the extent the position is “more likely than not” to be sustained assuming examination by taxing authorities. The Manager analyzed the Portfolio’s tax positions taken on federal, state and local income tax returns for all open tax years (for up to three tax years) and has concluded that no provisions for federal, state and local income tax are required in the Portfolio’s financial statements. The Portfolio’s federal, state and local income tax and federal excise tax returns for tax years for which the applicable statutes of limitations have not expired are subject to examination by the Internal Revenue Service and state and local departments of revenue.
(C) Dividends and Distributions to Shareholders. Dividends and distributions are recorded on the ex-dividend date. The Portfolio intends to declare and pay dividends from net investment income and distributions from net realized capital and currency gains, if any, at least annually. Unless a shareholder elects otherwise, all dividends and distributions are reinvested at NAV in the same class of shares of the Portfolio. Dividends and distributions to shareholders are determined in accordance with federal income tax regulations and may differ from determinations using GAAP.
(D) Security Transactions and Investment Income. The Portfolio records security transactions on the trade date. Realized gains and losses on security transactions are determined using the identified cost method. Dividend income is recognized on the ex-dividend date, net of any foreign tax withheld at the source, and interest income is accrued as earned using the effective interest rate method. Distributions received from real estate investment trusts may be classified as dividends, capital gains and/or return of capital. Discounts and premiums on securities purchased, other than Short-Term Investments, for the Portfolio are accreted and amortized, respectively, on the effective interest rate method.
Investment income and realized and unrealized gains and losses on investments of the Portfolio are allocated pro rata to the separate classes of shares based upon their relative net assets on the date the income is earned or realized and unrealized gains and losses are incurred.
The Portfolio may place a debt security on non-accrual status and reduce related interest income by ceasing current accruals and writing off all or a portion of any interest receivables when the collection of all or a portion of such interest has become doubtful. A debt security is removed from non-accrual status when the issuer resumes interest payments or when collectability of interest is reasonably assured.
(E) Expenses. Expenses of the Fund are allocated to the individual Portfolios in proportion to the net assets of the respective Portfolios when the expenses are incurred, except where direct allocations of expenses can be made. Expenses (other than fees incurred under the distribution and service plans, further discussed in Note 3(B), which are charged directly to the Service Class shares) are allocated to separate classes of shares pro rata based upon their relative net assets on the date the expenses are incurred. The expenses borne by the Portfolio, including those of related parties to the Portfolio, are shown in the Statement of Operations.
Additionally, the Portfolio may invest in ETFs and mutual funds, which are subject to management fees and other fees that may cause the costs of investing in ETFs and mutual funds to be greater than the costs of owning the underlying securities directly. These indirect expenses of ETFs and mutual funds are not included in the amounts shown as expenses in the Portfolio’s Statement of Operations or in the expense ratios included in the Financial Highlights.
(F) Use of Estimates. In preparing financial statements in conformity with GAAP, the Manager makes estimates and assumptions that affect the reported amounts and disclosures in the financial statements. Actual results could differ from those estimates.
(G) Repurchase Agreements. The Portfolio may enter into repurchase agreements (i.e., buy a security from another party with the agreement that it will be sold back in the future) to earn income. The Portfolio may enter into repurchase agreements only with counterparties, usually financial institutions, that are deemed by the Manager or the Subadvisor to be creditworthy, pursuant to guidelines established by the Board. During the term of any repurchase agreement, the Manager or the Subadvisor will continue to monitor the creditworthiness of the counterparty. Under the 1940 Act, repurchase agreements are considered to be collateralized loans by the Portfolio to the counterparty secured by the securities transferred to the Portfolio.
Repurchase agreements are subject to counterparty risk, meaning the Portfolio could lose money by the counterparty’s failure to perform under the terms of the agreement. The Portfolio mitigates this risk by ensuring the repurchase agreement is collateralized by cash, U.S. government securities, fixed income securities and/or other securities. The collateral is held by the Portfolio’s custodian and valued daily on a mark to market basis to determine if the value, including accrued interest, exceeds the repurchase price. In the event of the counterparty’s default on the obligation to repurchase, the Portfolio has the right to liquidate the collateral and apply the proceeds in satisfaction of the obligation. Under certain circumstances, such as in the event of
| | |
| 30 | | MainStay VP Indexed Bond Portfolio |
default or bankruptcy by the counterparty, realization and/or retention of the collateral may be limited or subject to delay, to legal proceedings and possible realized loss to the Portfolio. Repurchase agreements as of June 30, 2020, are shown in the Portfolio of Investments.
(H) Futures Contracts. A futures contract is an agreement to purchase or sell a specified quantity of an underlying instrument at a specified future date and price, or to make or receive a cash payment based on the value of a financial instrument (e.g., foreign currency, interest rate, security or securities index). The Portfolio is subject to risks such as market price risk and/or interest rate risk in the normal course of investing in these contracts. Upon entering into a futures contract, the Portfolio is required to pledge to the broker or futures commission merchant an amount of cash and/or U.S. government securities equal to a certain percentage of the collateral amount, known as the “initial margin.” During the period the futures contract is open, changes in the value of the contract are recognized as unrealized appreciation or depreciation by marking to market such contract on a daily basis to reflect the market value of the contract at the end of each day’s trading. The Portfolio agrees to receive from or pay to the broker or futures commission merchant an amount of cash equal to the daily fluctuation in the value of the contract. Such receipts or payments are known as “variation margin.” When the futures contract is closed, the Portfolio records a realized gain or loss equal to the difference between the proceeds from (or cost of) the closing transaction and the Portfolio’s basis in the contract.
The use of futures contracts involves, to varying degrees, elements of market risk in excess of the amount recognized in the Statement of Assets and Liabilities. The contract or notional amounts and variation margin reflect the extent of the Portfolio’s involvement in open futures positions. There are several risks associated with the use of futures contracts as hedging techniques. There can be no assurance that a liquid market will exist at the time when the Portfolio seeks to close out a futures contract. If no liquid market exists, the Portfolio would remain obligated to meet margin requirements until the position is closed. Futures contracts may involve a small initial investment relative to the risk assumed, which could result in losses greater than if the Portfolio did not invest in futures contracts. Futures contracts may be more volatile than direct investments in the instrument underlying the futures and may not correlate to the underlying instrument, causing a given hedge not to achieve its objectives. The Portfolio’s activities in futures contracts have minimal counterparty risk as they are conducted through regulated exchanges that guarantee the futures against default by the counterparty. In the event of a bankruptcy or insolvency of a futures commission merchant that holds margin on behalf of the Portfolio, the Portfolio may not be entitled to the return of the entire margin owed to the Portfolio, potentially resulting in a loss. The Portfolio’s investment in futures contracts and other derivatives may increase the volatility of the Portfolio’s NAVs and may result in a loss to the Portfolio. Open futures contracts as of June 30, 2020, are shown in the Portfolio of Investments.
(I) Dollar Rolls. The Portfolio may enter into dollar roll transactions in which it sells mortgage-backed securities (“MBS”) from its portfolio to a counterparty from whom it simultaneously agrees to buy a similar security on a delayed delivery basis. The Portfolio generally transfers MBS where the MBS are “to be announced,” therefore, the Portfolio accounts for these transactions as purchases and sales.
When accounted for as purchase and sales, the securities sold in connection with the dollar rolls are removed from the portfolio and a realized gain or loss is recognized. The securities the Portfolio has agreed to acquire are included at market value in the Portfolio of Investments and liabilities for such purchase commitments are included as payables for investments purchased. During the roll period, the Portfolio foregoes principal and interest paid on the securities. The Portfolio is compensated by the difference between the current sales price and the forward price for the future as well as by the earnings on the cash proceeds of the initial sale. Dollar rolls may be renewed without physical delivery of the securities subject to the contract. The Portfolio maintains liquid assets from its portfolio having a value not less than the repurchase price, including accrued interest. Dollar roll transactions involve certain risks, including the risk that the securities returned to the Portfolio at the end of the roll period, while substantially similar, could be inferior to what was initially sold to the counterparty.
The Portfolio accounts for a dollar roll transaction as a purchase and sale whereby the difference in the sales price and purchase price of the security sold is recorded as a realized gain (loss).
(J) Securities Lending. In order to realize additional income, the Portfolio may engage in securities lending, subject to the limitations set forth in the 1940 Act and relevant guidance by the staff of the Securities and Exchange Commission (“SEC”). If the Portfolio engages in securities lending, the Portfolio will lend through its custodian, currently State Street Bank and Trust Company (“State Street”), acting as securities lending agent on behalf of the Portfolio. Under the current arrangement, State Street will manage the Portfolio’s collateral in accordance with the securities lending agency agreement between the Portfolio and State Street, and indemnify the Portfolio against counterparty risk. The loans will be collateralized by cash (which may be invested in a money market fund) and/or non-cash collateral (which may include U.S. Treasury securities and/or U.S. government agency securities issued or guaranteed by the United States government or its agencies or instrumentalities) at least equal at all times to the market value of the securities loaned. The Portfolio bears the risk of delay in recovery of, or loss of rights in, the securities loaned. The Portfolio may also record a realized gain or loss on securities deemed sold due to a borrower’s inability to return securities on loan. The Portfolio bears the risk of any loss on investment of cash collateral. The Portfolio will receive compensation for lending its securities in the form of fees or it will retain a portion of interest earned on the investment of any cash collateral. The Portfolio will also continue to receive interest and dividends on the securities loaned and any gain or loss in the market price of the securities loaned that may occur during the term of the loan will be for the account of the Portfolio. Income earned from securities lending activities, if any, is reflected in the Statement of Operations. As of June 30, 2020, the Portfolio did not have any portfolio securities on loan.
(K) Debt Securities Risk. The ability of issuers of debt securities held by the Portfolio to meet their obligations may be affected by, among other things, economic or political developments in a specific country, industry or region. Debt securities are also subject to the risks associated with changes in interest rates.
Investments in the Portfolio are not guaranteed, even though some of the Portfolio’s underlying investments are guaranteed by the U.S. government or its agencies or instrumentalities. The principal risk of
Notes to Financial Statements (Unaudited) (continued)
mortgage-related and asset-backed securities is that the underlying debt may be prepaid ahead of schedule, if interest rates fall, thereby reducing the value of the Portfolio’s investment. If interest rates rise, less of the debt may be prepaid and the Portfolio may lose money because the Portfolio may be unable to invest in higher yielding assets. The Portfolio is subject to interest-rate risk and can lose principal value when interest rates rise. Bonds are also subject to credit risk, in which the bond issuer may fail to pay interest and principal in a timely manner.
The Portfolio may invest in foreign debt securities, which carry certain risks that are in addition to the usual risks inherent in domestic debt securities. These risks include those resulting from currency fluctuations, future adverse political or economic developments and possible imposition of currency exchange blockages or other foreign governmental laws or restrictions. These risks are likely to be greater in emerging markets than in developed markets. The ability of issuers of debt securities held by the Portfolio to meet their obligations may be affected by, among other things, economic or political developments in a specific country, industry or region.
(L) LIBOR Replacement Risk. The Portfolio may invest in certain debt securities, derivatives or other financial instruments that utilize the London Interbank Offered Rate (“LIBOR”), as a “benchmark” or “reference rate” for various interest rate calculations. The United Kingdom Financial Conduct Authority, which regulates LIBOR, announced that after 2021 it will cease its active encouragement of banks to provide the quotations needed to sustain LIBOR. As a result, it is anticipated that LIBOR will be discontinued or will no longer be sufficiently robust to be representative of its underlying market around that time. Although financial regulators and industry working groups have suggested alternative reference rates, such as the European Interbank Offer Rate (“EURIBOR”), Sterling Overnight Interbank Average Rate (“SONIA”) and Secured Overnight Financing Rate (“SOFR”), there are challenges to converting certain contracts and transactions to a new benchmark and neither the full effects of the transition process nor its ultimate outcome is known. The elimination of LIBOR or changes to other reference rates or any other changes or reforms to the determination or supervision of reference rates could have an adverse impact on the market for, or value of, any securities or payments linked to those reference rates, which may adversely affect the Portfolio’s performance and/or net asset value. Uncertainty and risk also remain regarding the willingness and ability of issuers and lenders to include revised provisions in new and existing contracts or instruments. Consequently, the transition away from LIBOR to other reference rates may lead to increased volatility and illiquidity in markets that are tied to LIBOR, fluctuations in values of LIBOR-related investments or investments in issuers that utilize LIBOR, increased difficulty in borrowing or refinancing and diminished effectiveness of hedging strategies, adversely affecting the Portfolio’s performance. Furthermore, the risks associated with the expected discontinuation of LIBOR and transition may be exacerbated if the work necessary to effect an orderly transition to an alternative reference rate is not completed in a timely manner. Because the usefulness of LIBOR as a benchmark could deteriorate during the transition period, these effects could occur prior to the end of 2021.
(M) Indemnifications. Under the Fund’s organizational documents, its officers and trustees are indemnified against certain liabilities that
may arise out of performance of their duties to the Fund. Additionally, in the normal course of business, the Portfolio enters into contracts with third-party service providers that contain a variety of representations and warranties and that may provide general indemnifications. The Portfolio’s maximum exposure under these arrangements is unknown, as this would involve future claims that may be made against the Portfolio that have not yet occurred. The Manager believes that the risk of loss in connection with these potential indemnification obligations is remote. However, there can be no assurance that material liabilities related to such obligations will not arise in the future, which could adversely impact the Portfolio.
(N) Quantitative Disclosure of Derivative Holdings. The following tables show additional disclosures related to the Portfolio’s derivative and hedging activities, including how such activities are accounted for and their effect on the Portfolio’s financial positions, performance and cash flows. The Portfolio entered into futures contracts in order to hedge against anticipated changes in interest rates that might otherwise have an adverse effect upon the value of the Portfolio’s securities as well as help manage the duration and yield curve of the portfolio. These derivatives are not accounted for as hedging instruments.
Fair value of derivative instruments as of June 30, 2020:
Asset Derivatives
| | | | | | | | | | |
| | | Statement of
Assets and
Liabilities
Location | | Interest
Rate
Contracts
Risk | | | Total | |
| | | |
Futures Contracts | | Net Assets—Net unrealized appreciation on investments and futures contracts (a) | | $ | 79,908 | | | $ | 79,908 | |
| | | | | | |
Total Fair Value | | | | $ | 79,908 | | | $ | 79,908 | |
| | | | | | |
Liability Derivatives
| | | | | | | | | | |
| | | Statement of
Assets and
Liabilities
Location | | Interest
Rate
Contracts
Risk | | | Total | |
| | | |
Futures Contracts | | Net Assets—Net unrealized depreciation on investments and futures contracts (a) | | $ | (1,971 | ) | | $ | (1,971 | ) |
| | | | | | |
Total Fair Value | | | | $ | (1,971 | ) | | $ | (1,971 | ) |
| | | | | | |
| (a) | Includes cumulative appreciation (depreciation) of futures contracts as reported in the Portfolio of Investments. Only current day’s variation margin is reported within the Statement of Assets and Liabilities. |
| | |
| 32 | | MainStay VP Indexed Bond Portfolio |
The effect of derivative instruments on the Statement of Operations for the period ended June 30, 2020:
Realized Gain (Loss)
| | | | | | | | | | |
| | | Statement of
Operations
Location | | Interest
Rate
Contracts
Risk | | | Total | |
| | | |
Futures Contracts | | Net realized gain (loss) on futures transactions | | $ | 1,671,388 | | | $ | 1,671,388 | |
| | | | | | |
Total Realized Gain (Loss) | | | | $ | 1,671,388 | | | $ | 1,671,388 | |
| | | | | | |
Change in Unrealized Appreciation (Depreciation)
| | | | | | | | | | |
| | | Statement of
Operations
Location | | Interest
Rate
Contracts
Risk | | | Total | |
| | | |
Futures Contracts | | Net change in unrealized appreciation (depreciation) on futures contracts | | $ | 167,063 | | | $ | 167,063 | |
| | | | | | |
Total Change in Unrealized Appreciation (Depreciation) | | $ | 167,063 | | | $ | 167,063 | |
| | | | | | |
Average Notional Amount
| | | | | | | | |
| | | Interest
Rate
Contracts
Risk | | | Total | |
| | |
Futures Contracts Long | | $ | 41,219,168 | | | $ | 41,219,168 | |
Futures Contracts Short | | $ | (12,562,220 | ) | | $ | (12,562,220 | ) |
| | | | | | | | |
Note 3–Fees and Related Party Transactions
(A) Manager and Subadvisor. New York Life Investments, a registered investment adviser and an indirect, wholly-owned subsidiary of New York Life, serves as the Portfolio’s Manager pursuant to an Amended and Restated Management Agreement (“Management Agreement”). The Manager provides offices, conducts clerical, recordkeeping and bookkeeping services, and keeps most of the financial and accounting records required to be maintained by the Portfolio. Except for the portion of salaries and expenses that are the responsibility of the Portfolio, the Manager pays the salaries and expenses of all personnel affiliated with the Portfolio and certain operational expenses of the Portfolio. The Portfolio reimburses New York Life Investments in an amount equal to the portion of the compensation of the Chief Compliance Officer attributable to the Portfolio. NYL Investors LLC (“NYL Investors” or “Subadvisor”), a registered investment adviser and a direct, wholly-owned subsidiary of New York Life, serves as Subadvisor to the Portfolio and is responsible for the day-to-day portfolio management of the Portfolio. Pursuant to the terms of a Subadvisory Agreement (“Subadvisory Agreement”) between New York Life Investments and NYL Investors, New York Life Investments pays for the services of the Subadvisor.
Under the Management Agreement, the Portfolio pays the Manager a monthly fee for the services performed and the facilities furnished at an
annual rate of the Portfolio’s average daily net assets as follows: 0.25% up to $1 billion and 0.20% in excess of $1 billion. During the six-month period ended June 30, 2020, the effective management fee rate was 0.25%.
Effective May 1, 2020 New York Life Investments has contractually agreed to waive fees and/or reimburse expenses so that Total Annual Portfolio Operating Expenses (excluding taxes, interest, litigation, extraordinary expenses, brokerage and other transaction expenses relating to the purchase or sale of portfolio investments, and acquired (underlying) fund fees and expenses) do not exceed the following percentages of average daily net assets: Initial Class, 0.375%; and Service Class, 0.625%. This agreement will remain in effect until May 1, 2021, and shall renew automatically for one-year terms unless New York Life Investments provides written notice of termination prior to the start of the next term or upon approval of the Board.
During the six-month period ended June 30, 2020, New York Life Investments earned fees from the Portfolio in the amount of $789,271 and paid the Subadvisor in the amount of $394,636.
State Street provides sub-administration and sub-accounting services to the Portfolio pursuant to an agreement with New York Life Investments. These services include calculating the daily NAVs of the Portfolio, maintaining the general ledger and sub-ledger accounts for the calculation of the Portfolio’s NAVs and assisting New York Life Investments in conducting various aspects of the Portfolio’s administrative operations. For providing these services to the Portfolio, State Street is compensated by New York Life Investments.
Pursuant to an agreement between the Fund and New York Life Investments, New York Life Investments is responsible for providing or procuring certain regulatory reporting services for the Portfolio. The Portfolio will reimburse New York Life Investments for the actual costs incurred by New York Life Investments in connection with providing or procuring these services for the Portfolio.
(B) Distribution and Service Fees. The Fund, on behalf of the Portfolio, has entered into a distribution agreement with NYLIFE Distributors LLC (the “Distributor”), an indirect, wholly-owned subsidiary of New York Life. The Portfolio has adopted a distribution plan (the “Plan”) in accordance with the provisions of Rule 12b-1 under the 1940 Act. Under the Plan, the Distributor has agreed to provide, through its affiliates or independent third parties, various distribution-related, shareholder and administrative support services to the Service Class shareholders. For its services, the Distributor is entitled to a combined distribution and service fee accrued daily and paid monthly at an annual rate of 0.25% of the average daily net assets attributable to the Service Class shares of the Portfolio.
Note 4–Federal Income Tax
As of June 30, 2020, the cost and unrealized appreciation (depreciation) of the Portfolio’s investment portfolio, including applicable derivative contracts and other financial instruments, as determined on a federal income tax basis, was as follows:
| | | | | | | | | | | | | | | | |
| | | Federal Tax
Cost | | | Gross
Unrealized
Appreciation | | | Gross
Unrealized
(Depreciation) | | | Net
Unrealized
Appreciation/
(Depreciation) | |
| | | | |
Investments in Securities | | $ | 807,283,011 | | | $ | 42,840,092 | | | $ | (1,915,200 | ) | | $ | 40,924,892 | |
Notes to Financial Statements (Unaudited) (continued)
Note 5–Custodian
State Street is the custodian of cash and securities held by the Portfolio. Custodial fees are charged to the Portfolio based on the Portfolio’s net assets and/or the market value of securities held by the Portfolio and the number of certain transactions incurred by the Portfolio.
Note 6–Line of Credit
The Portfolio and certain other funds managed by New York Life Investments maintain a line of credit with a syndicate of banks in order to secure a source of funds for temporary purposes to meet unanticipated or excessive redemption requests.
Effective July 28, 2020, under the credit agreement (the “Credit Agreement”), the aggregate commitment amount is $600,000,000 with an additional uncommitted amount of $100,000,000. The commitment fee is an annual rate of 0.15% of the average commitment amount payable quarterly, regardless of usage, to JP Morgan Chase Bank NA, who serves as the agent to the syndicate. The commitment fee is allocated among the Portfolio and certain other funds managed by New York Life Investments based upon their respective net assets and other factors. Interest on any revolving credit loan is charged based upon the Federal Funds Rate or the one-month London Interbank Offered Rate (“LIBOR”), whichever is higher. The Credit Agreement expires on July 27, 2021, although the Portfolio, certain other funds managed by New York Life Investments and the syndicate of banks may renew the Credit Agreement for an additional year on the same or different terms or enter into a credit agreement with a different syndicate of banks. Prior to July 28, 2020, the aggregate commitment amount and the commitment fee were the same as those under the current Credit Agreement, but State Street served as agent to the syndicate. As of June 30, 2020, there were no borrowings outstanding with respect to the Portfolio under the Credit Agreement or the credit agreement for which State Street served as agent.
Note 7–Interfund Lending Program
Pursuant to an exemptive order issued by the SEC, the Portfolio, along with certain other funds managed by New York Life Investments, may participate in an interfund lending program. The interfund lending program provides an alternative credit facility that permits the Portfolio and certain other funds managed by New York Life Investments to lend or borrow money for temporary purposes directly to or from one another subject to the conditions of the exemptive order. During the six-month period ended June 30, 2020, there were no interfund loans made or outstanding with respect to the Portfolio.
Note 8–Purchases and Sales of Securities (in 000’s)
During the six-month period ended June 30, 2020, purchases and sales of U.S. government securities were $496,593 and $361,937, respectively. Purchases and sales of securities, other than U.S. government securities and short-term securities, were $99,105 and $12,861, respectively.
Note 9–Capital Share Transactions
Transactions in capital shares for the six-month period ended June 30, 2020 and the year ended December 31, 2019, were as follows:
| | | | | | | | |
Initial Class | | Shares | | | Amount | |
| | |
Six-month period ended June 30, 2020: | | | | | | | | |
Shares sold | | | 22,361,374 | | | $ | 247,649,250 | |
Shares redeemed | | | (7,268,763 | ) | | | (78,536,488 | ) |
| | | | |
Net increase (decrease) | | | 15,092,611 | | | $ | 169,112,762 | |
| | | | |
Year ended December 31, 2019: | | | | | | | | |
Shares sold | | | 12,165,666 | | | $ | 128,158,050 | |
Shares redeemed | | | (9,387,047 | ) | | | (96,122,384 | ) |
| | | | |
Net increase (decrease) | | | 2,778,619 | | | $ | 32,035,666 | |
| | | | |
| | |
| | | | | | | | |
Service Class | | Shares | | | Amount | |
Six-month period ended June 30, 2020: | | | | | | | | |
Shares sold | | | 6,622,662 | | | $ | 72,617,016 | |
Shares redeemed | | | (2,130,123 | ) | | | (23,408,200 | ) |
| | | | |
Net increase (decrease) | | | 4,492,539 | | | $ | 49,208,816 | |
| | | | |
Year ended December 31, 2019: | | | | | | | | |
Shares sold | | | 8,101,264 | | | $ | 83,190,020 | |
Shares redeemed | | | (807,716 | ) | | | (8,294,582 | ) |
| | | | |
Net increase (decrease) | | | 7,293,548 | | | $ | 74,895,438 | |
| | | | |
Note 10–Recent Accounting Pronouncement
In March 2020, the Financial Accounting Standards Board (“FASB”) issued Accounting Standards Update 2020-04 (“ASU 2020-04”), which provides optional guidance to ease the potential accounting burden associated with transitioning away from LIBOR and other reference rates that are expected to be discontinued. ASU 2020-04 is effective immediately upon release of the update on March 12, 2020 through December 31, 2022. At this time, the Manager is evaluating the implications of certain other provisions of ASU 2020-04 related to new disclosure requirements and any impact on the financial statement disclosures has not yet been determined.
Note 11–Subsequent Events
In connection with the preparation of the financial statements of the Portfolio as of and for the six-month period ended June 30, 2020, events and transactions subsequent to June 30, 2020, through the date the financial statements were issued have been evaluated by the Manager, for possible adjustment and/or disclosure. No subsequent events requiring financial statement adjustment or disclosure have been identified.
Note 12–Other Matters
An outbreak of COVID-19, first detected in December 2019, has developed into a global pandemic and has resulted in travel restrictions, closure of international borders, certain businesses and securities markets, restrictions on securities trading activities, prolonged quarantines, supply chain disruptions, and lower consumer demand, as well as general concern and uncertainty. The continued impact of COVID-19 is uncertain and could further adversely affect the global economy, national economies, individual issuers and capital markets in unforeseeable ways and result in a substantial and extended economic downturn. Developments that disrupt global economies and financial markets, such as COVID-19, may magnify factors that affect the Portfolio’s performance.
| | |
| 34 | | MainStay VP Indexed Bond Portfolio |
Discussion of the Operation and Effectiveness of the Portfolio’s
Liquidity Risk Management Program (Unaudited)
In compliance with Rule 22e-4 under the Investment Company Act of 1940, as amended (the “Liquidity Rule”), the Portfolio has adopted and implemented a liquidity risk management program (the “Program”), which New York Life Investment Management LLC believes is reasonably designed to assess and manage the Portfolio’s liquidity risk. The Board designated New York Life Investment Management LLC as administrator of the Program (the “Administrator”). The Administrator has established a Liquidity Risk Management Committee to assist the Administrator in the implementation and day-to-day administration of the Program and to otherwise support the Administrator in fulfilling its responsibilities under the Program.
At a meeting of the Board held on March 11, 2020, the Administrator provided the Board with a written report addressing the Program’s operation, adequacy and effectiveness of implementation for the period from December 1, 2018 through December 31, 2019, as required under the Liquidity Rule. The report noted that the Administrator concluded that (i) the Program operated effectively to assess and manage the Portfolio’s liquidity risk, (ii) the Program has been adequately and effectively implemented to monitor and, as applicable, respond to the Portfolio’s liquidity developments and (iii) the Portfolio’s investment strategy continues to be appropriate for an open-end portfolio.
In accordance with the Program, the Portfolio’s liquidity risk is assessed no less frequently than annually taking into consideration certain factors, as applicable, such as (i) investment strategy and liquidity of portfolio investments, (ii) short-term and long-term cash flow projections and (iii) holdings of cash and cash equivalents and borrowing arrangements and other funding sources. Certain factors are considered under both normal and reasonably foreseeable stressed conditions.
Each Portfolio portfolio investment is classified into one of four liquidity categories. The classification is based on a determination of the number of days it is reasonably expected to take to convert the investment into cash, or sell or dispose of the investment, in current market conditions without significantly changing the market value of the investment. The Administrator has delegated liquidity classification determinations to the Portfolio’s subadvisor, subject to appropriate oversight by the Administrator, and classification determinations are made by taking into account the Portfolio’s reasonably anticipated trade size, various market, trading and investment-specific considerations, as well as market depth, and, in certain cases, third-party vendor data.
The Liquidity Rule requires portfolios that do not primarily hold assets that are highly liquid investments to adopt a minimum amount of net assets that must be invested in highly liquid investments that are assets (an “HLIM”). In addition, the Liquidity Rule limits a portfolio’s investments in illiquid investments. Specifically, the Liquidity Rule prohibits acquisition of illiquid investments if doing so would result in a portfolio holding more than 15% of its net assets in illiquid investments that are assets. The Program includes provisions reasonably designed to determine, periodically review and comply with the HLIM requirement, as applicable, and to comply with the 15% limit on illiquid investments.
Proxy Voting Policies and Procedures and Proxy Voting Record
A description of the policies and procedures that New York Life Investments uses to vote proxies related to the Portfolio’s securities is available free of charge upon request (i) by calling 800-598-2019; (ii) by visiting New York Life Investments’ website at https://www.nylinvestments.com/mainstay/products-and-performance/mainstay-vp-funds-trust; or (iii) by visiting the SEC’s website at www.sec.gov.
The Portfolio is required to file with the SEC its proxy voting record for the 12-month period ending June 30 on Form N-PX. The Portfolio’s most recent Form N-PX or proxy voting record is available free of charge upon request (i) by calling 800-598-2019; (ii) by visiting New York Life Investments’ website at https://www.nylinvestments.com/mainstay/products-and-performance/mainstay-vp-funds-trust; or (iii) by visiting the SEC’s website at www.sec.gov.
Shareholder Reports and Quarterly Portfolio Disclosure
The Portfolio is required to file its complete schedule of portfolio holdings with the SEC 60 days after its first and third fiscal quarter on Form N-PORT. The Portfolio’s holdings report is available free of charge upon request by calling 800-598-2019 or by visiting the SEC’s website at www.sec.gov.
| | |
| 36 | | MainStay VP Indexed Bond Portfolio |
MainStay VP Portfolios
MainStay VP offers a wide range of Portfolios. The full array of MainStay VP offerings is listed here, with information about the manager, subadvisors, legal counsel, and independent registered public accounting firm.
Equity Portfolios
MainStay VP Emerging Markets Equity Portfolio
MainStay VP Epoch U.S. Equity Yield Portfolio
MainStay VP Fidelity Institutional AM® Utilities Portfolio†
MainStay VP MacKay Common Stock Portfolio
MainStay VP MacKay Growth Portfolio
MainStay VP MacKay International Equity Portfolio
MainStay VP MacKay Mid Cap Core Portfolio
MainStay VP MacKay S&P 500 Index Portfolio
MainStay VP MacKay Small Cap Core Portfolio
MainStay VP Mellon Natural Resources Portfolio
MainStay VP Small Cap Growth Portfolio
MainStay VP T. Rowe Price Equity Income Portfolio
MainStay VP Winslow Large Cap Growth Portfolio
Mixed Asset Portfolios
MainStay VP Balanced Portfolio
MainStay VP Income Builder Portfolio
MainStay VP Janus Henderson Balanced Portfolio
MainStay VP MacKay Convertible Portfolio
Income Portfolios
MainStay VP Bond Portfolio
MainStay VP Floating Rate Portfolio
MainStay VP Indexed Bond Portfolio
MainStay VP MacKay Government Portfolio
MainStay VP MacKay High Yield Corporate Bond Portfolio
MainStay VP MacKay Unconstrained Bond Portfolio
MainStay VP PIMCO Real Return Portfolio
Money Market
MainStay VP U.S. Government Money Market Portfolio
Alternative
MainStay VP CBRE Global Infrastructure Portfolio
MainStay VP IQ Hedge Multi-Strategy Portfolio
Asset Allocation Portfolios
MainStay VP Conservative Allocation Portfolio
MainStay VP Growth Allocation Portfolio
MainStay VP Moderate Allocation Portfolio
MainStay VP Moderate Growth Allocation Portfolio
Manager
New York Life Investment Management LLC
New York, New York
Subadvisors
Brown Advisory LLC
Baltimore, Maryland
Candriam Belgium S.A.*
Brussels, Belgium
CBRE Clarion Securities LLC
Radnor, Pennsylvania
Epoch Investment Partners, Inc.
New York, New York
FIAM LLC
Smithfield, Rhode Island
IndexIQ Advisors LLC*
New York, New York
Janus Capital Management LLC
Denver, Colorado
MacKay Shields LLC*
New York, New York
Mellon Investments Corporation
Boston, Massachusetts
NYL Investors LLC*
New York, New York
Pacific Investment Management Company LLC
Newport Beach, California
Segall Bryant & Hamill, LLC
Chicago, Illinois
T. Rowe Price Associates, Inc.
Baltimore, Maryland
Winslow Capital Management, LLC
Minneapolis, Minnesota
Distributor
NYLIFE Distributors LLC*
Jersey City, New Jersey
Custodian
State Street Bank and Trust Company
Boston, Massachusetts
Independent Registered Public Accounting Firm
PricewaterhouseCoopers LLP
New York, New York
Legal Counsel
Dechert LLP
Washington, District of Columbia
Some Portfolios may not be available in all products.
| † | Fidelity Institutional AM is a registered trade mark of FMR LLC. Used with permission. |
| * | An affiliate of New York Life Investment Management LLC |
Not part of the Semiannual Report
2020 Semiannual Report
This report is for the general information of New York Life Variable Annuities and NYLIAC Variable Universal Life Insurance Products policyowners. It must be preceded or accompanied by the appropriate product(s) and funds prospectuses if it is given to anyone who is not an owner of a New York Life variable annuity policy or a NYLIAC Variable Universal Life Insurance Product. This report does not offer for sale or solicit orders to purchase securities.
The performance data quoted in this report represents past performance. Past performance is no guarantee of future results. Due to market volatility and other factors, current performance may be lower or higher than the figures shown. The most recent month-end performance summary for your variable annuity or variable life policy is available by calling 800-598-2019 and is updated periodically on www.newyorklife.com.
The New York Life Variable Annuities and NYLIAC Variable Universal Life Insurance Products are issued by New York Life Insurance and Annuity Corporation (a Delaware Corporation) and distributed by NYLIFE Distributors LLC (Member FINRA/SIPC).
New York Life Insurance Company
New York Life Insurance and Annuity Corporation (NYLIAC) (A Delaware Corporation)
51 Madison Avenue, Room 551
New York, NY 10010
www.newyorklife.com
Printed on recycled paper
nylinvestments.com
NYLIFE Distributors LLC, 30 Hudson Street, Jersey City, NJ 07302
New York Life Investment Management LLC is the investment manager to the MainStay VP Funds Trust
©2020 by NYLIFE Distributors LLC. All rights reserved.
You may obtain copies of the Prospectus and the Statement of Additional Information free of charge, upon request, by calling toll-free 800-598-2019 or writing to New York Life Insurance and Annuity Corporation, 51 Madison Avenue, New York, NY 10010.
| | | | |
| Not FDIC Insured | | No Bank Guarantee | | May Lose Value |
| | | | |
| 1781627 | | | | MSVPIN10-08/20 (NYLIAC) NI555 |
MainStay VP Janus Henderson
Balanced Portfolio
Message from the President and Semiannual Report
Unaudited | June 30, 2020
Beginning on January 1, 2021, as permitted by regulations adopted by the Securities and Exchange Commission, paper copies of the MainStay VP Portfolio annual and semi-annual shareholder reports may no longer be sent by mail, unless you specifically request paper copies of the reports from the insurance company that offers your policy. Instead, the reports will be made available online, and you will be notified by mail each time a report is posted and provided with a website link to access the report. Instructions for requesting paper copies will be provided by your insurance company.
If you already elected to receive shareholder reports electronically, you will not be affected by this change and you need not take any action. At any time, you may elect to receive reports and other communications from the insurance company electronically by following the instructions provided by the insurance company.
You may elect to receive all future shareholder reports in paper form free of charge. You can inform the insurance company that you wish to receive paper copies of reports by following the instructions provided by the insurance company. Your election to receive reports in paper form will apply to all portfolio companies available under your contract.
| | | | | | | | |
| Not FDIC/NCUA Insured | | Not a Deposit | | May Lose Value | | No Bank Guarantee | | Not Insured by Any Government Agency |

This page intentionally left blank
Message from the President
High levels of volatility shook financial markets in response to the COVID-19 pandemic and an abrupt decline in global economic activity during the six months ended June 30, 2020.
Markets entered 2020 riding strong fourth quarter performance and an economic expansion of historic longevity. Most broad stock and bond indices began to dip in late February as growing numbers of COVID-19 cases were seen in hotspots around the world. On March 11, 2020, the World Health Organization acknowledged that the disease had reached pandemic proportions, with over 80,000 identified cases in China, thousands in Italy, South Korea and the United States, and more in dozens of additional countries. Governments and central banks pledged trillions of dollars to address the mounting economic and public health crisis; however, “stay-at-home” orders and other restrictions on non-essential activity caused global economic activity to slow. Most stocks and bonds lost significant ground in this challenging environment, with equities declining by roughly a third and the yield on high-yield credit indices shooting higher.
Policymakers responded with extraordinary speed to address the situation. In the United States, the Federal Reserve (“Fed”) cut interest rates to near zero and announced unlimited quantitative easing. With help from Treasury, the Fed later rolled out a series of lending facilities to directly support market functioning. In late March, the Federal government declared a national emergency; Congress passed, and the President signed, a $2 trillion CARES Act (The Coronavirus Aid, Relief, and Economic Security Act), with the promise of further assistance for consumers and businesses to come. This enormous wave of policy support helped fuel a rapid recovery in market pricing as stocks bounced back and credit spreads narrowed. Some states rushed to ease restrictions on travel and social gatherings, further fueling optimism that the effects of the pandemic might prove short lived. However, the final weeks of the reporting period saw infection rates beginning to rise in some of the first states to reopen, raising concerns that a second round of restrictive government policies might prove necessary, once again stifling economic activity.
Despite all the market volatility, the broadly based S&P 500® Index finished the first half of 2020 only slightly below its starting point and the technology-heavy NASDAQ Composite Index posted gains, closing in near record territory. Small-cap stocks tended to trail their large cap counterparts, as illustrated by the Russell 2000® Index’s loss of approximately 15%, while value-oriented stocks lagged growth-oriented issues. From a global perspective, U.S. stocks generally outperformed international equities, with emerging markets hit particularly hard by the flight from risk.
Fixed-income markets also experienced unusually high levels of volatility. Recognized safe havens, such as U.S. government bonds, attracted increased investment, driving yields lower and prices higher, positioning long-term Treasury bonds to deliver particularly strong gains. Investment-grade corporate bonds lost value in March before recovering in the closing months of the reporting period, while relatively speculative high-yield credit faced the brunt of risk-off sentiment. Emerging market debt underperformed most other bonds types as investors sought to minimize currency and sovereign risks.
Today, as we at New York Life Investments continue to track the ongoing health crisis and its financial ramifications, we are particularly mindful of the people at the heart of our enterprise—our colleagues and valued clients. By taking appropriate steps to minimize community spread of COVID-19 within our organization, we strive to safeguard the health of our investment professionals so they can continue to provide you, as a MainStay investor, with world class investment solutions in this rapidly evolving environment.
Sincerely,

Kirk C. Lehneis
President
The opinions expressed are as of the date of this report and are subject to change. There is no guarantee that any forecast made will come to pass. This material does not constitute investment advice and is not intended as an endorsement of any specific investment. Past performance is no guarantee of future results.
Not part of the Semiannual Report
Table of Contents
Investors should refer to the Portfolio’s Summary Prospectus and/or Prospectus and consider the Portfolio’s investment objectives, strategies, risks, charges and expenses carefully before investing. The Summary Prospectus and/or Prospectus contain this and other information about the Portfolio. You may obtain copies of the Portfolio’s Summary Prospectus and/or the Prospectus and the Statement of Additional Information free of charge, upon request, by calling toll-free 800-598-2019, by writing to New York Life Insurance and Annuity Corporation, 51 Madison Avenue, Room 251, New York, New York 10010 or by sending an email to MainStayShareholdersServices@nylim.com. These documents are also available at nylinvestments.com/vpdocuments. Please read the Summary Prospectus and/or Prospectus carefully before investing. MainStay VP Funds Trust portfolios are separate account options which are purchased through a variable insurance contract.
Investment and Performance Comparison1 (Unaudited)
Performance data quoted represents past performance. Past performance is no guarantee of future results. Because of market volatility and other factors. current performance may be lower or higher than the figures shown. Investment return and principal value will fluctuate, and as a result, when shares are redeemed, they may be worth more or less than their original cost. The performance table and graph do not reflect any deduction of sales charges, mortality and expense charges, contract charges or administrative charges. Please refer to the Performance Summary appropriate for your policy. For performance information current to the most recent month-end, please call 800-598-2019 or visit www.newyorklife.com.
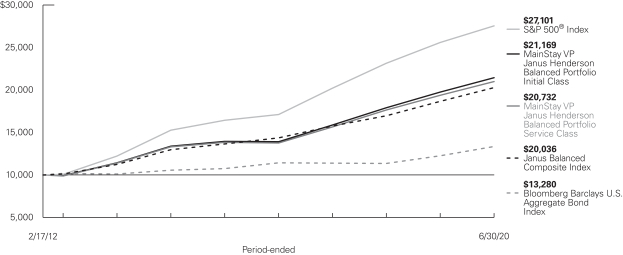
Average Annual Total Returns for the Period-Ended June 30, 2020
| | | | | | | | | | | | | | | | | | | | | | |
| Class | | Inception Date | | Six Months | | | One Year | | | Five Years | | | Since Inception | | | Gross
Expense
Ratio2 | |
| | | | | | |
| Initial Class Shares | | 2/17/2012 | | | –0.24 | % | | | 8.53 | % | | | 8.80 | % | | | 9.37 | % | | | 0.58 | % |
| Service Class Shares | | 2/17/2012 | | | –0.36 | | | | 8.26 | | | | 8.53 | | | | 9.10 | | | | 0.83 | |
| | | | | | | | | | | | | | | | |
| Benchmark Performance | | Six
Months | | | One Year | | | Five
Years | | | Since Inception | |
| | | | |
S&P 500® Index3 | | | –3.08 | % | | | 7.51 | % | | | 10.73 | % | | | 12.66 | % |
Bloomberg Barclays U.S. Aggregate Bond Index4 | | | 6.14 | | | | 8.74 | | | | 4.30 | | | | 3.45 | |
Janus Balanced Composite Index5 | | | 1.46 | | | | 8.66 | | | | 8.10 | | | | 8.65 | |
Morningstar Allocation—50% to 70% Equity Category Average6 | | | –3.58 | | | | 2.30 | | | | 5.22 | | | | 6.29 | |
| 1. | Performance figures may reflect certain fee waivers and/or expense limitations, without which total returns may have been different. For information on current fee waivers and/or expense limitations (if any), please refer to the Notes to Financial Statements. |
| 2. | The gross expense ratios presented reflect the Portfolio’s “Total Annual Portfolio Operating Expenses” from the most recent Prospectus, as supplemented, and may differ from other expense ratios disclosed in this report. |
| 3. | The S&P 500® Index is the Portfolio’s primary broad-based securities market index for comparison purposes. “S&P 500®” is a trademark of The McGraw-Hill Companies, Inc. The S&P 500® Index is widely regarded as the standard index for measuring large-cap U.S. stock market performance. Results assume reinvestment of all dividends and capital gains. An investment cannot be made directly in an index. |
| 4. | The Portfolio has selected the Bloomberg Barclays U.S. Aggregate Bond Index as a secondary benchmark. The Bloomberg Barclays U.S. Aggregate Bond Index is a broad-based benchmark that measures performance of the investment-grade, U.S. dollar-denominated, fixed-rate taxable bond market, |
| | including Treasurys, government-related and corporate securities, mortgage-backed securities (agency fixed-rate and hybrid adjustable-rate mortgage pass-throughs), asset-backed securities and commercial mortgage-backed securities. Results assume reinvestment of all dividends and capital gains. An investment cannot be made directly in an index. |
| 5. | The Portfolio has selected the Janus Balanced Composite Index as an additional benchmark. The Janus Balanced Composite Index consists of the S&P 500® Index (55% weighted) and the Bloomberg Barclays U.S. Aggregate Bond Index (45% weighted). Results assume reinvestment of all dividends and capital gains. An investment cannot be made directly in an index. |
| 6. | The Morningstar Allocation—50% to 70% Equity Category Average is representative of funds that seek to provide both income and capital appreciation by investing in multiple asset classes, including stocks, bonds, and cash. These funds are dominated by domestic holdings and have equity exposures between 50% and 70%. Results are based on average total returns of similar funds with all dividends and capital gain distributions reinvested. |
Cost in Dollars of a $1,000 Investment in MainStay VP Janus Henderson Balanced Portfolio (Unaudited)
The example below is intended to describe the fees and expenses borne by shareholders during the six-month period from January 1, 2020, to June 30, 2020, and the impact of those costs on your investment.
Example
As a shareholder of the Portfolio you incur two types of costs: (1) transaction costs, including exchange fees and sales charges (loads) on purchases (as applicable), and (2) ongoing costs, including management fees, distribution and/or service (12b-1) fees, and other Portfolio expenses (as applicable). This example is intended to help you understand your ongoing costs (in dollars) of investing in the Portfolio and to compare these costs with the ongoing costs of investing in other mutual funds. The example is based on an investment of $1,000 made at the beginning of the six-month period and held for the entire period from January 1, 2020, to June 30, 2020. Shares are only sold in connection with variable life and annuity contracts and the example does not reflect any contract level or transactional fees or expenses. If these costs had been included, your costs would have been higher.
This example illustrates your Portfolio’s ongoing costs in two ways:
Actual Expenses
The second and third data columns in the table below provide information about actual account values and actual expenses. You may use the information in these columns, together with the amount you invested, to estimate the expenses that you paid during the six months
ended June 30, 2020. Simply divide your account value by $1,000 (for example, an $8,600 account value divided by $1,000 = 8.6), then multiply the result by the number under the heading entitled “Expenses Paid During Period” to estimate the expenses you paid on your account during this period.
Hypothetical Example for Comparison Purposes
The fourth and fifth data columns in the table below provide information about hypothetical account values and hypothetical expenses based on the Portfolio’s actual expense ratio and an assumed rate of return of 5% per year before expenses, which is not the Portfolio’s actual return. The hypothetical account values and expenses may not be used to estimate the actual ending account balances or expenses you paid for the six-month period shown. You may use this information to compare the ongoing costs of investing in the Portfolio with the ongoing costs of investing in other mutual funds. To do so, compare this 5% hypothetical example with the 5% hypothetical examples that appear in the shareholder reports of the other mutual funds.
Please note that the expenses shown in the table are meant to highlight your ongoing costs only and do not reflect any transactional costs, such as exchange fees or sales charges (loads). Therefore, the fourth and fifth data columns of the table are useful in comparing ongoing costs only and will not help you determine the relative total costs of owning different funds. In addition, if these transactional costs were included, your costs would have been higher.
| | | | | | | | | | | | | | | | | | | | | | |
| | | | | | | | | | | | | | | | | | |
| Share Class | | Beginning
Account
Value
1/1/20 | | | Ending Account
Value (Based
on Actual
Returns and
Expenses)
6/30/20 | | | Expenses
Paid
During
Period1 | | | Ending Account
Value (Based
on Hypothetical
5% Annualized
Return and
Actual Expenses)
6/30/20 | | | Expenses
Paid
During
Period1 | | | Net Expense
Ratio
During
Period2 |
| | | | | | |
| Initial Class Shares | | $ | 1,000.00 | | | $ | 997.60 | | | $ | 2.88 | | | $ | 1,021.98 | | | $ | 2.92 | | | 0.58% |
| | | | | | |
| Service Class Shares | | $ | 1,000.00 | | | $ | 996.40 | | | $ | 4.12 | | | $ | 1,020.74 | | | $ | 4.17 | | | 0.83% |
| 1. | Expenses are equal to the Portfolio’s annualized expense ratio of each class multiplied by the average account value over the period, divided by 366 and multiplied by 182 (to reflect the six-month period). The table above represents the actual expenses incurred during the six-month period. In addition to the fees and expenses which the Portfolio bears directly, it also indirectly bears a pro rata share of the fees and expenses of the underlying funds in which it invests. Such indirect expenses are not included in the above-reported expense figures. |
| 2. | Expenses are equal to the Portfolio’s annualized expense ratio to reflect the six-month period. |
| | |
| 6 | | MainStay VP Janus Henderson Balanced Portfolio |
Portfolio Composition as of June 30, 2020 (Unaudited)
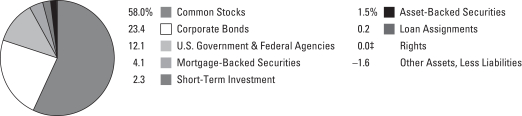
See Portfolio of Investments beginning on page 11 for specific holdings within these categories. The Portfolio’s holdings are subject to change.
| ‡ | Less than one-tenth of a percent. |
Top Ten Holdings or Issuers Held as of June 30, 2020 (excluding short-term investment) (Unaudited)
| 1. | Federal National Mortgage Association (Mortgage Pass-Through Securities), 2.00%–6.00%, due 12/1/24–6/1/57 |
| 5. | United States Treasury Bonds, 1.125%–2.75%, due 5/15/40–2/15/50 |
| 6. | Alphabet, Inc., Class C |
| 8. | Federal Home Loan Mortgage Corporation (Mortgage Pass-Through Securities), 2.00%–6.00%, due 5/1/31–5/1/50 |
| 10. | UnitedHealth Group, Inc. |
Portfolio Management Discussion and Analysis (Unaudited)
Answers to the questions reflect the views of portfolio managers Jeremiah Buckley, CFA, E. Marc Pinto, CFA, Greg Wilensky and Michael Keough of Janus Capital Management LLC (“Janus Capital”), the Portfolio’s Subadvisor.
How did MainStay VP Janus Henderson Balanced Portfolio perform relative to its benchmarks and peers during the six months ended June 30, 2020?
For the six months ended June 30, 2020, MainStay VP Janus Henderson Balanced Portfolio returned –0.24% for Initial Class shares and –0.36% for Service Class shares. Over the same period, both share classes outperformed the –3.08% return of the S&P 500® Index, which is the Portfolio’s primary benchmark, and underperformed the 6.14% return of the Bloomberg Barclays U.S. Aggregate Bond Index, which is a secondary benchmark of the Portfolio. For the six months ended June 30, 2020, both share classes underperformed the 1.46% return of the Janus Balanced Composite Index, which is an additional benchmark of the Portfolio, and outperformed the –3.58% return of the Morningstar Allocation—50% to 70% Equity Category Average.1
During the reporting period, were there any liquidity events that materially impacted the Portfolio’s performance?
While liquidity across multiple asset classes was challenged at times during the pandemic-related broad market sell-off that occurred during the first quarter of 2020, aggressive support of financial markets and corporations by the U.S. Federal Reserve (“Fed”) contributed to a rapid improvement in market conditions—particularly in fixed-income markets—by late March and throughout the second quarter. Improved liquidity in the U.S. Treasury market and an opening of capital markets for corporations resulted in a record of over $1 trillion in debt issued by investment-grade companies in the first half of 2020.
During the reporting period, were there any market events that materially impacted the Portfolio’s performance or liquidity?
In the first half of the reporting period, the exogenous shock of the COVID-19 pandemic ushered in a period of severe economic uncertainty and market volatility as governments around the world restricted travel and social activity to help contain the virus. Staggering levels of monetary and fiscal stimulus provided a backstop that bolstered investor confidence by late March and throughout the latter half of the reporting period.
What factors affected the Portfolio’s performance relative to its primary prospectus benchmark during the reporting period?
The Portfolio’s outperformance of the S&P 500® Index was driven by its allocation to fixed-income securities at a time when most equities generated negative returns and broadly underperformed the U.S. fixed-income market.
Heading into March’s precipitous decline in risk markets, we had been trimming the Portfolio’s equity exposure—particularly
in travel and leisure, energy, and rate-sensitive financials—and adopting a more defensive stance among the Portfolio’s fixed-income holdings. The Portfolio’s equity weighting, which began the reporting period at 62%, was cut to 48% by the end of March.
Robust monetary and fiscal stimulus and initial progress in containing the virus led us to increase the Portfolio’s equity exposure in late March and during the second half of the reporting period. We sought to take advantage of what we viewed as attractive equity valuations after the March sell-off to increase the Portfolio’s exposure to companies we expected to play a larger role in the post-pandemic economy. Similarly, among fixed-income holdings, we sought to take advantage of the most attractive corporate valuations we had seen in some time, adding at first to more defensive-business models near the middle of the reporting period, but eventually increasing our focus on more challenged and in some cases cyclical names that we believed could navigate a period of extreme economic uncertainty. The Portfolio ended the reporting period with an allocation of approximately 58% of asset to stocks, 41% to fixed-income instruments and a small portion in cash.
During the reporting period, which sectors were the strongest positive contributors to relative performance in the equity portion of the Portfolio and which sectors were particularly weak?
Supported by favorable stock selection and overweight exposure, the information technology sector provided the strongest positive contribution to the performance of the equity portion of the Portfolio relative to the S&P 500® Index. (Contributions take weightings and total returns into account.) Financials made the second-strongest positive sector contribution to relative performance due to stock selection and an underweight position earlier in the reporting period when the sector was lagging (the Portfolio ended the reporting period with modestly overweight exposure to financials). Underweight exposure to energy made it the third-strongest contributing sector; as of June 30, 2020, the Portfolio held zero exposure to the energy sector.
Stock selection made industrials the weakest contributing sector, the consumer discretionary sector the second-weakest contributing sector and materials the third-weakest contributing sector relative to the S&P 500® Index.
During the reporting period, which individual stocks made the strongest positive contributions to the absolute performance of the equity portion of the Portfolio and which individual stocks detracted the most?
Software developer Microsoft was the strongest positive contributor to absolute performance in the equity portion of the
| 1. | See page 5 for more information on benchmark and peer group returns. |
| | |
| 8 | | MainStay VP Janus Henderson Balanced Portfolio |
Portfolio. The COVID-19 pandemic radically accelerated the digital transformation of our economy and society, and companies offering products and services relevant to this shift in technology and capital spending continued to be rewarded by the market. In this environment, Microsoft’s Azure cloud platform and its subscription-based Office 365 suite experienced robust and growing demand.
E-commerce cloud computing and digital streaming company Amazon.com was the second-strongest positive contributor to absolute performance. Buyers made heavy use of the company’s home delivery services during the pandemic. Amazon Web Services (AWS) remained entrenched as the largest cloud services provider, and we expect demand for this highly profitable business segment to remain strong as the digital transformation continues.
Technology company Apple was the third-strongest positive contributor to absolute performance. Optimism around the rollout of 5G cellular networks and Apple’s newest product lineup supported the stock. In addition, the company’s services business has helped create a recurring revenue stream that makes the company less dependent on the phone replacement cycle.
Aircraft manufacturing company Boeing was the weakest contributor to absolute performance in the equity portion of the Portfolio. Boeing’s 737 MAX aircraft remained grounded, and the pandemic could result in long-lasting headwinds for global air traffic and Boeing’s airline partners. We became concerned with the level of debt the company had accumulated amid these challenges and closed the Portfolio’s position.
Chemicals producer LyondellBasell was the second-weakest contributor to absolute performance. The stock struggled as prices for ethylene—a primary product line—are generally tied to oil prices, which fell to extremely low levels during the reporting period. We closed the Portfolio’s position in the first half of the reporting period.
Bank holding company U.S. Bancorp was the third-weakest contributor to absolute performance. Banks were negatively impacted during the March market sell-off as investors calculated the consequences of a low-rate environment. We trimmed the Portfolio’s position but continue to believe U.S. Bancorp is a high-quality bank with less rate sensitivity than the broader sector.
Did the equity portion of the Portfolio make any significant purchases or sales during the reporting period?
The equity portion of the Portfolio initiated a position in biopharmaceutical company AbbVie during the reporting period as we sought to increase the Portfolio’s exposure to health care
stocks we believed were positioned to benefit from pent-up demand for elective procedures. AbbVie recently acquired pharmaceutical company Allergan, which we expect to benefit as treatments using Allergan’s BOTOX® Cosmetic Treatment resume. We also believe the long-term growth outlook for AbbVie is robust and its acquisition of Allergan should ultimately be accretive to earnings.
The equity portion of the Portfolio also initiated a position in paint company Sherwin-Williams. We believe the company is well positioned within the paint manufacturing and distribution industry and has done a commendable job of growing their number of distribution centers. The company generates strong free cash flow with healthy incremental returns.
During the reporting period, the equity portion of the Portfolio sold its positions in Boeing and LyondellBasell.
How did sector weightings change in the equity portion of the Portfolio during the reporting period?
During the reporting period, the equity portion of the Portfolio increased its exposure to health care, information technology and consumer discretionary, while decreasing its exposure to industrials, consumer staples and financials.
What was the duration2 strategy of the fixed-income portion of the Portfolio during the reporting period?
As of June 30, 2020, the duration of the fixed-income portion of the Portfolio was 6.38 years, or approximately 107% of the Bloomberg Barclays U.S. Aggregate Bond Index. As the spread of COVID-19 gathered momentum early in the reporting period, but before most of the markets’ March sell-off, we increased duration by shifting the fixed-income portion of the Portfolio into longer-date U.S. Treasury bonds to counter the overall Portfolio’s risk asset allocations. The fixed-income portion of the Portfolio maintained a duration overweight through the end of the reporting period.
During the reporting period, which market segments made the strongest positive contributions to the performance of the fixed-income portion of the Portfolio and which market segments were particularly weak?
Overweight exposure relative to the Bloomberg Barclays U.S. Aggregate Bond Index and favorable security selection made investment-grade corporate bonds a strong positive contributor to the performance of the fixed-income portion of the Portfolio. Investment-grade corporate bonds generally performed well during the reporting period, driven in large part by the Fed’s bond-buying program. The performance of the fixed-income portion of the Portfolio also benefited from underweight
| 2. | Duration is a measure of the price sensitivity of a fixed-income investment to changes in interest rates. Duration is expressed as a number of years and is considered a more accurate sensitivity gauge than average maturity. |
exposure to agency mortgage-backed securities (“MBS”) and government-related securities. While these asset classes produced positive returns for the reporting period, they did not keep pace with U.S. Treasury bonds and investment-grade corporate bonds. Conversely, an out-of-Index allocation to high-yield investment-grade corporate credit lagged the benchmark and detracted from relative performance. Security selection within asset-backed securities (“ABS”) also detracted from relative returns.
Did the fixed-income portion of the Portfolio make any significant purchases or sales during the reporting period?
One of the largest shifts in the fixed-income portion of the Portfolio was the aforementioned increase in corporate bond exposure beginning in mid-March 2020. We added risk to the Portfolio at first by purchasing select higher-quality securities that we thought would be better positioned in the event of an extended downturn, particularly in the utilities, telecom, and aerospace & defense sectors. As the Fed’s level of commitment to supporting credit markets solidified, we became increasingly comfortable adding additional risk, turning focus to sectors and securities that were more challenged but, in our view, could still navigate the extremely elevated level of prevailing economic uncertainty. We gained further confidence amid the reopening of economies and positive developments in COVID-19 treatments, adding, in some cases, more cyclical names, including those driven by consumer demand. With spreads3 in many corporate bonds at their widest levels in a decade, we sought to take advantage of what was, in our view, an abundance of attractive relative value opportunities.
Ultimately, we added more than 26% to the Portfolio’s corporate bond allocation from its lowest intra-period level in mid-March. Compared to the start of the reporting period, the Portfolio’s corporate bond allocation was over 15% higher as of June 30, 2020. The additions were primarily in investment-grade securities, but also, and more selectively, in high-yield corporate issues. We significantly reduced the Portfolio’s Treasury and agency MBS allocations in order reallocate more fixed-income assets into corporate bonds.
During the reporting period, how did sector (or industry) weightings change in the fixed-income portion of the Portfolio?
On a corporate industry basis, the fixed-income portion of the Portfolio increased exposure to technology, banking, and aerospace & defense while decreasing exposure to wirelines, midstream energy and independent energy.
How was the fixed-income portion of the Portfolio positioned at the end of the reporting period?
Relative to the Bloomberg Barclays U.S. Aggregate Bond Index, the fixed-income portion of the Portfolio ended the reporting period with underweight exposure to Treasury bonds and MBS. It held zero exposure to government-related securities. As of June 30, 2020, the fixed-income portion of the Portfolio held overweight exposure to corporate credit, commercial-backed securities, and ABS. As of the same date, the fixed-income portion of the Portfolio also held out-of-Index positions in high-yield corporate credit, collateralized mortgage obligations, bank loans and cash.
| 3. | The terms “spread” and “yield spread” may refer to the difference in yield between a security or type of security and comparable U.S. Treasury issues. The terms may also refer to the difference in yield between two specific securities or types of securities at a given time. |
The opinions expressed are those of the portfolio managers as of the date of this report and are subject to change. There is no guarantee that any forecasts will come to pass. This material does not constitute investment advice and is not intended as an endorsement of any specific investment.
Not all MainStay VP Portfolios and/or share classes are available under all policies.
| | |
| 10 | | MainStay VP Janus Henderson Balanced Portfolio |
Portfolio of Investments June 30, 2020 (Unaudited)
| | | | | | | | |
| | | Principal
Amount | | | Value | |
Long-Term Bonds 41.3%† Asset-Backed Securities 1.5% | |
Automobile Asset-Backed Securities 0.7% | |
CarMax Auto Owner Trust
Series 2017-3, Class C
2.72%, due 5/15/23 | | $ | 642,000 | | | $ | 648,808 | |
Credit Acceptance Auto Loan
Series 2018-2A, Class B
3.94%, due 7/15/27 (a) | | | 387,000 | | | | 398,550 | |
Drive Auto Receivables Trust | | | | | | | | |
Series 2019-2, Class A3
3.04%, due 3/15/23 | | | 383,289 | | | | 384,689 | |
Series 2017-3, Class D
3.53%, due 12/15/23 (a) | | | 173,759 | | | | 176,216 | |
Series 2018-4, Class C
3.66%, due 11/15/24 | | | 255,980 | | | | 258,318 | |
Series 2017-AA, Class D
4.16%, due 5/15/24 (a) | | | 316,732 | | | | 320,963 | |
Series 2017-1, Class E
5.17%, due 9/16/24 | | | 1,590,000 | | | | 1,636,196 | |
Series 2017-2, Class E
5.27%, due 11/15/24 | | | 1,400,000 | | | | 1,445,695 | |
OneMain Direct Auto Receivables Trust (a) | | | | | | | | |
Series 2018-1A, Class C
3.85%, due 10/14/25 | | | 181,000 | | | | 182,242 | |
Series 2018-1A, Class D
4.40%, due 1/14/28 | | | 180,000 | | | | 181,059 | |
Santander Consumer Auto Receivables Trust
Series 2020-AA, Class A
1.37%, due 10/15/24 (a) | | | 801,499 | | | | 806,148 | |
Santander Drive Auto Receivables Trust | | | | | | | | |
Series 2020-1, Class A2A
2.07%, due 1/17/23 | | | 477,000 | | | | 480,900 | |
Series 2016-3, Class E
4.29%, due 2/15/24 | | | 1,868,000 | | | | 1,885,965 | |
United Auto Credit Securitization Trust
Series 2019-1, Class C
3.16%, due 8/12/24 (a) | | | 390,000 | | | | 394,805 | |
| | | | | | | | |
| | | | | | | 9,200,554 | |
| | | | | | | | |
Other Asset-Backed Securities 0.8% | |
Applebee’s Funding LLC / IHOP Funding LLC
Series 2019-1A, Class A2I
4.194%, due 6/7/49 (a) | | | 1,022,000 | | | | 905,829 | |
Deutsche Bank Master Finance LLC (a) | | | | | | | | |
Series 2019-1A, Class A2I
3.787%, due 5/20/49 | | | 464,490 | | | | 479,349 | |
Series 2019-1A, Class A2II
4.021%, due 5/20/49 | | | 256,065 | | | | 269,450 | |
| | | | | | | | |
| | | Principal
Amount | | | Value | |
Other Asset-Backed Securities (continued) | |
Deutsche Bank Master Finance LLC (a) (continued) | | | | | |
Series 2019-1A, Class A23
4.352%, due 5/20/49 | | $ | 371,195 | | | $ | 401,384 | |
Domino’s Pizza Master Issuer LLC (a) | | | | | | | | |
Series 2017-1A, Class A2II
3.082%, due 7/25/47 | | | 195,975 | | | | 200,165 | |
Series 2019-1A, Class A2
3.668%, due 10/25/49 | | | 1,640,755 | | | | 1,718,839 | |
Series 2018-1A, Class A2I
4.116%, due 7/25/48 | | | 909,795 | | | | 968,513 | |
Series 2017-1A, Class A23
4.118%, due 7/25/47 | | | 209,625 | | | | 226,081 | |
Series 2018-1A, Class A2II
4.328%, due 7/25/48 | | | 498,128 | | | | 541,763 | |
Jack In The Box Funding LLC (a) | | | | | | | | |
Series 2019-1A, Class A2I
3.982%, due 8/25/49 | | | 986,045 | | | | 1,016,090 | |
Series 2019-1A, Class A2II
4.476%, due 8/25/49 | | | 986,045 | | | | 1,026,029 | |
Series 2019-1A, Class A23
4.97%, due 8/25/49 | | | 986,045 | | | | 1,009,128 | |
Planet Fitness Master Issuer LLC
Series 2019-1A, Class A2
3.858%, due 12/5/49 (a) | | | 868,635 | | | | 748,294 | |
Taco Bell Funding LLC
Series 2018-1A, Class A2II
4.94%, due 11/25/48 (a) | | | 196,015 | | | | 211,833 | |
Wendy’s Funding LLC (a) | | | | | | | | |
Series 2018-1A, Class A2I
3.573%, due 3/15/48 | | | 315,900 | | | | 327,415 | |
Series 2019-1A, Class A2I
3.783%, due 6/15/49 | | | 508,620 | | | | 536,904 | |
Series 2018-1A, Class A2II
3.884%, due 3/15/48 | | | 88,725 | | | | 93,708 | |
| | | | | | | | |
| | | | | | | 10,680,774 | |
| | | | | | | | |
Total Asset-Backed Securities
(Cost $19,706,601) | | | | | | | 19,881,328 | |
| | | | | | | | |
|
| Corporate Bonds 23.4% | |
Aerospace & Defense 0.9% | |
BAE Systems PLC
3.40%, due 4/15/30 (a) | | | 544,000 | | | | 592,507 | |
Boeing Co. | | | | | | | | |
2.25%, due 6/15/26 | | | 144,000 | | | | 139,174 | |
3.60%, due 5/1/34 | | | 1,195,000 | | | | 1,127,746 | |
4.508%, due 5/1/23 | | | 1,427,000 | | | | 1,507,524 | |
4.875%, due 5/1/25 | | | 460,000 | | | | 501,310 | |
5.705%, due 5/1/40 | | | 1,178,000 | | | | 1,341,052 | |
5.805%, due 5/1/50 | | | 684,000 | | | | 807,794 | |
5.93%, due 5/1/60 | | | 534,000 | | | | 633,266 | |
| | | | | | |
The notes to the financial statements are an integral part of,
and should be read in conjunction with, the financial statements. | | | | | 11 | |
Portfolio of Investments June 30, 2020 (Unaudited) (continued)
| | | | | | | | |
| | | Principal
Amount | | | Value | |
| Corporate Bonds (continued) | |
Aerospace & Defense (continued) | |
General Dynamics Corp. | | | | | | | | |
3.25%, due 4/1/25 | | $ | 861,000 | | | $ | 954,868 | |
3.50%, due 4/1/27 | | | 1,245,000 | | | | 1,423,447 | |
4.25%, due 4/1/50 | | | 244,000 | | | | 315,780 | |
Northrop Grumman Corp. | | | | | | | | |
4.40%, due 5/1/30 | | | 862,000 | | | | 1,044,986 | |
5.15%, due 5/1/40 | | | 374,000 | | | | 497,857 | |
5.25%, due 5/1/50 | | | 482,000 | | | | 691,410 | |
| | | | | | | | |
| | | | | | | 11,578,721 | |
| | | | | | | | |
Agriculture 0.1% | |
Cargill, Inc. (a) | | | | | | | | |
1.375%, due 7/23/23 | | | 330,000 | | | | 335,694 | |
2.125%, due 4/23/30 | | | 486,000 | | | | 509,459 | |
| | | | | | | | |
| | | | | | | 845,153 | |
| | | | | | | | |
Auto Manufacturers 0.2% | |
General Motors Co. | | | | | | | | |
4.20%, due 10/1/27 | | | 396,000 | | | | 403,505 | |
5.00%, due 10/1/28 | | | 1,091,000 | | | | 1,160,526 | |
5.40%, due 4/1/48 | | | 378,000 | | | | 370,682 | |
General Motors Financial Co., Inc. | | | | | | | | |
4.30%, due 7/13/25 | | | 223,000 | | | | 232,491 | |
4.35%, due 4/9/25 | | | 411,000 | | | | 433,067 | |
4.35%, due 1/17/27 | | | 405,000 | | | | 419,055 | |
| | | | | | | | |
| | | | | | | 3,019,326 | |
| | | | | | | | |
Banks 4.2% | |
Bank of America Corp. (b) | | | | | | | | |
2.592%, due 4/29/31 | | | 3,373,000 | | | | 3,569,125 | |
3.705%, due 4/24/28 | | | 2,007,000 | | | | 2,268,643 | |
3.97%, due 3/5/29 | | | 670,000 | | | | 767,602 | |
6.10%, due 3/17/25 (c) | | | 512,000 | | | | 540,160 | |
6.25%, due 9/5/24 (c) | | | 1,172,000 | | | | 1,213,102 | |
Bank of New York Mellon Corp.
4.70% (5 Year Treasury Constant Maturity Rate + 4.358%), due 9/20/25 (c)(d) | | | 2,024,000 | | | | 2,104,960 | |
BNP Paribas S.A. (a)(b) | | | | | | | | |
2.819%, due 11/19/25 | | | 227,000 | | | | 237,723 | |
3.052%, due 1/13/31 | | | 1,400,000 | | | | 1,474,610 | |
4.705%, due 1/10/25 | | | 758,000 | | | | 838,960 | |
Citigroup, Inc. (b) | | | | | | | | |
3.887%, due 1/10/28 | | | 2,396,000 | | | | 2,700,777 | |
4.412%, due 3/31/31 | | | 1,635,000 | | | | 1,939,959 | |
5.90%, due 2/15/23 (c) | | | 113,000 | | | | 112,365 | |
5.95%, due 1/30/23 (c) | | | 890,000 | | | | 887,648 | |
5.95%, due 5/15/25 (c) | | | 584,000 | | | | 579,912 | |
Citizens Financial Group, Inc. | | | | | | | | |
3.75%, due 7/1/24 | | | 264,000 | | | | 283,805 | |
4.30%, due 12/3/25 | | | 396,000 | | | | 443,092 | |
4.35%, due 8/1/25 | | | 203,000 | | | | 224,690 | |
| | | | | | | | |
| | | Principal
Amount | | | Value | |
Banks (continued) | |
Credit Agricole S.A.
1.907%, due 6/16/26 (a)(b) | | $ | 426,000 | | | $ | 432,218 | |
First Republic Bank
4.625%, due 2/13/47 | | | 391,000 | | | | 469,385 | |
Goldman Sachs Group, Inc. | | | | | | | | |
3.50%, due 4/1/25 | | | 3,545,000 | | | | 3,887,119 | |
4.37% (3 Month LIBOR + 3.922%), due 7/31/20 (c)(d) | | | 2,013,000 | | | | 1,845,317 | |
JPMorgan Chase & Co. (b) | | | | | | | | |
2.083%, due 4/22/26 | | | 4,021,000 | | | | 4,176,285 | |
2.956%, due 5/13/31 | | | 3,100,000 | | | | 3,287,809 | |
3.96%, due 1/29/27 | | | 2,044,000 | | | | 2,328,213 | |
4.452%, due 12/5/29 | | | 1,840,000 | | | | 2,203,595 | |
Morgan Stanley | | | | | | | | |
2.188%, due 4/28/26 (b) | | | 2,926,000 | | | | 3,046,578 | |
3.95%, due 4/23/27 | | | 1,401,000 | | | | 1,576,797 | |
4.35%, due 9/8/26 | | | 1,128,000 | | | | 1,300,675 | |
Wells Fargo & Co. (b) | | | | | | | | |
1.654%, due 6/2/24 | | | 1,306,000 | | | | 1,326,649 | |
2.164%, due 2/11/26 | | | 2,686,000 | | | | 2,768,311 | |
2.188%, due 4/30/26 | | | 2,118,000 | | | | 2,189,943 | |
2.879%, due 10/30/30 | | | 1,254,000 | | | | 1,341,521 | |
5.875%, due 6/15/25 (c) | | | 1,199,000 | | | | 1,246,205 | |
| | | | | | | | |
| | | | | | | 53,613,753 | |
| | | | | | | | |
Beverages 0.8% | |
Anheuser-Busch InBev Worldwide, Inc. | | | | | | | | |
4.35%, due 6/1/40 | | | 809,000 | | | | 921,567 | |
4.90%, due 2/1/46 | | | 1,134,000 | | | | 1,387,659 | |
Coca-Cola Co.
3.375%, due 3/25/27 | | | 1,104,000 | | | | 1,266,062 | |
Coca-Cola Femsa S.A.B. de C.V.
2.75%, due 1/22/30 | | | 651,000 | | | | 688,641 | |
Diageo Capital PLC | | | | | | | | |
1.375%, due 9/29/25 | | | 757,000 | | | | 770,475 | |
2.00%, due 4/29/30 | | | 713,000 | | | | 737,636 | |
2.125%, due 4/29/32 | | | 572,000 | | | | 593,098 | |
Fomento Economico Mexicano S.A.B. de C.V.
3.50%, due 1/16/50 | | | 766,000 | | | | 790,635 | |
Keurig Dr. Pepper, Inc. | | | | | | | | |
3.20%, due 5/1/30 | | | 242,000 | | | | 269,220 | |
3.80%, due 5/1/50 | | | 552,000 | | | | 623,736 | |
4.597%, due 5/25/28 | | | 1,145,000 | | | | 1,373,361 | |
PepsiCo, Inc. | | | | | | | | |
2.25%, due 3/19/25 | | | 782,000 | | | | 835,743 | |
2.625%, due 3/19/27 | | | 242,000 | | | | 264,546 | |
| | | | | | | | |
| | | | | | | 10,522,379 | |
| | | | | | | | |
Building Materials 0.1% | |
Vulcan Materials Co.
3.50%, due 6/1/30 | | | 671,000 | | | | 730,939 | |
| | | | | | | | |
| | | | |
| 12 | | MainStay VP Janus Henderson Balanced Portfolio | | The notes to the financial statements are an integral part of,
and should be read in conjunction with, the financial statements. |
| | | | | | | | |
| | | Principal
Amount | | | Value | |
| Corporate Bonds (continued) | |
Chemicals 0.1% | |
Ecolab, Inc.
4.80%, due 3/24/30 | | $ | 568,000 | | | $ | 719,758 | |
| | | | | | | | |
|
Commercial Services 1.3% | |
CoStar Group, Inc.
2.80%, due 7/15/30 (a) | | | 1,339,000 | | | | 1,370,288 | |
Equifax, Inc. | | | | | | | | |
2.60%, due 12/1/24 | | | 1,779,000 | | | | 1,881,449 | |
2.60%, due 12/15/25 | | | 1,126,000 | | | | 1,199,442 | |
3.10%, due 5/15/30 | | | 1,026,000 | | | | 1,094,447 | |
Experian Finance PLC
2.75%, due 3/8/30 (a) | | | 2,299,000 | | | | 2,450,214 | |
Global Payments, Inc. | | | | | | | | |
2.90%, due 5/15/30 | | | 1,019,000 | | | | 1,069,292 | |
3.20%, due 8/15/29 | | | 309,000 | | | | 331,013 | |
4.80%, due 4/1/26 | | | 629,000 | | | | 736,183 | |
IHS Markit, Ltd. (a) | | | | | | | | |
4.75%, due 2/15/25 | | | 924,000 | | | | 1,034,880 | |
5.00%, due 11/1/22 | | | 119,000 | | | | 127,601 | |
PayPal Holdings, Inc. | | | | | | | | |
1.35%, due 6/1/23 | | | 285,000 | | | | 290,561 | |
1.65%, due 6/1/25 | | | 530,000 | | | | 547,886 | |
2.30%, due 6/1/30 | | | 612,000 | | | | 639,195 | |
2.40%, due 10/1/24 | | | 577,000 | | | | 612,405 | |
2.65%, due 10/1/26 | | | 1,436,000 | | | | 1,560,546 | |
3.25%, due 6/1/50 | | | 844,000 | | | | 913,960 | |
Verisk Analytics, Inc. | | | | | | | | |
3.625%, due 5/15/50 | | | 704,000 | | | | 796,995 | |
5.50%, due 6/15/45 | | | 374,000 | | | | 512,925 | |
| | | | | | | | |
| | | | | | | 17,169,282 | |
| | | | | | | | |
Computers 0.3% | |
Dell International LLC
5.875%, due 6/15/21 (a) | | | 1,417,000 | | | | 1,417,425 | |
Leidos, Inc. (a) | | | | | | | | |
2.95%, due 5/15/23 | | | 191,000 | | | | 198,965 | |
3.625%, due 5/15/25 | | | 741,000 | | | | 807,475 | |
4.375%, due 5/15/30 | | | 1,055,000 | | | | 1,188,405 | |
| | | | | | | | |
| | | | | | | 3,612,270 | |
| | | | | | | | |
Cosmetics & Personal Care 0.1% | |
Procter & Gamble Co. | | | | | | | | |
3.00%, due 3/25/30 | | | 287,000 | | | | 328,581 | |
3.55%, due 3/25/40 | | | 572,000 | | | | 687,710 | |
3.60%, due 3/25/50 | | | 304,000 | | | | 381,997 | |
| | | | | | | | |
| | | | | | | 1,398,288 | |
| | | | | | | | |
Diversified Financial Services 0.8% | |
CBOE Global Markets, Inc.
3.65%, due 1/12/27 | | | 745,000 | | | | 837,090 | |
| | | | | | | | |
| | | Principal
Amount | | | Value | |
Diversified Financial Services (continued) | |
Charles Schwab Corp. | | | | | | | | |
4.20%, due 3/24/25 | | $ | 1,053,000 | | | $ | 1,208,227 | |
5.375% (5 Year Treasury Constant Maturity Rate + 4.971%), due 6/1/25 (c)(d) | | | 3,657,000 | | | | 3,906,846 | |
Mastercard, Inc. | | | | | | | | |
3.30%, due 3/26/27 | | | 1,072,000 | | | | 1,214,139 | |
3.35%, due 3/26/30 | | | 1,359,000 | | | | 1,570,997 | |
Raymond James Financial, Inc. | | | | | | | | |
4.65%, due 4/1/30 | | | 480,000 | | | | 572,020 | |
4.95%, due 7/15/46 | | | 477,000 | | | | 577,022 | |
5.625%, due 4/1/24 | | | 358,000 | | | | 407,003 | |
USAA Capital Corp
2.125%, due 5/1/30 (a) | | | 150,000 | | | | 154,473 | |
| | | | | | | | |
| | | | | | | 10,447,817 | |
| | | | | | | | |
Electric 1.2% | |
AEP Transmission Co. LLC
3.65%, due 4/1/50 | | | 688,000 | | | | 795,446 | |
Ameren Corp.
3.50%, due 1/15/31 | | | 2,823,000 | | | | 3,169,155 | |
Berkshire Hathaway Energy Co.
4.25%, due 10/15/50 (a) | | | 1,168,000 | | | | 1,470,846 | |
Black Hills Corp.
2.50%, due 6/15/30 | | | 407,000 | | | | 420,554 | |
Dominion Energy, Inc.
3.375%, due 4/1/30 | | | 1,436,000 | | | | 1,585,101 | |
NextEra Energy Capital Holdings, Inc.
2.75%, due 5/1/25 | | | 629,000 | | | | 680,769 | |
NRG Energy, Inc. | | | | | | | | |
6.625%, due 1/15/27 | | | 1,343,000 | | | | 1,401,756 | |
7.25%, due 5/15/26 | | | 1,111,000 | | | | 1,172,105 | |
Oncor Electric Delivery Co. LLC
3.80%, due 6/1/49 | | | 631,000 | | | | 763,930 | |
Pacific Gas & Electric Co. | | | | | | | | |
2.10%, due 8/1/27 | | | 478,000 | | | | 473,053 | |
2.50%, due 2/1/31 | | | 982,000 | | | | 960,720 | |
PPL WEM, Ltd. / Western Power Distribution, Ltd.
5.375%, due 5/1/21 (a) | | | 756,000 | | | | 774,347 | |
Southern Co.
3.70%, due 4/30/30 | | | 2,147,000 | | | | 2,434,981 | |
| | | | | | | | |
| | | | | | | 16,102,763 | |
| | | | | | | | |
Electronics 0.4% | |
Keysight Technologies, Inc.
3.00%, due 10/30/29 | | | 1,199,000 | | | | 1,297,202 | |
Trimble, Inc. | | | | | | | | |
4.75%, due 12/1/24 | | | 1,238,000 | | | | 1,346,832 | |
4.90%, due 6/15/28 | | | 2,256,000 | | | | 2,589,601 | |
| | | | | | | | |
| | | | | | | 5,233,635 | |
| | | | | | | | |
| | | | | | |
The notes to the financial statements are an integral part of,
and should be read in conjunction with, the financial statements. | | | | | 13 | |
Portfolio of Investments June 30, 2020 (Unaudited) (continued)
| | | | | | | | |
| | | Principal
Amount | | | Value | |
| Corporate Bonds (continued) | |
Food 0.8% | |
Campbell Soup Co.
3.95%, due 3/15/25 | | $ | 311,000 | | | $ | 349,280 | |
J M Smucker Co. | | | | | | | | |
2.375%, due 3/15/30 | | | 688,000 | | | | 702,455 | |
3.55%, due 3/15/50 | | | 323,000 | | | | 333,258 | |
JBS USA LUX S.A. / JBS USA Finance, Inc.
6.75%, due 2/15/28 (a) | | | 314,000 | | | | 331,666 | |
Mars, Inc. (a) | | | | | | | | |
2.70%, due 4/1/25 | | | 468,000 | | | | 500,926 | |
4.20%, due 4/1/59 | | | 233,000 | | | | 298,891 | |
Mondelez International, Inc. | | | | | | | | |
2.125%, due 4/13/23 | | | 352,000 | | | | 364,578 | |
2.25%, due 9/19/24 (a) | | | 727,000 | | | | 764,811 | |
2.75%, due 4/13/30 | | | 173,000 | | | | 186,224 | |
Sysco Corp. | | | | | | | | |
2.40%, due 2/15/30 | | | 299,000 | | | | 295,563 | |
5.65%, due 4/1/25 | | | 917,000 | | | | 1,070,384 | |
5.95%, due 4/1/30 | | | 1,883,000 | | | | 2,365,248 | |
6.60%, due 4/1/40 | | | 1,139,000 | | | | 1,535,968 | |
6.60%, due 4/1/50 | | | 850,000 | | | | 1,177,212 | |
| | | | | | | | |
| | | | | | | 10,276,464 | |
| | | | | | | | |
Food Services 0.2% | |
Aramark Services, Inc.
6.375%, due 5/1/25 (a) | | | 2,032,000 | | | | 2,098,304 | |
| | | | | | | | |
|
Forest Products & Paper 0.1% | |
Georgia-Pacific LLC
3.163%, due 11/15/21 (a) | | | 1,387,000 | | | | 1,425,809 | |
| | | | | | | | |
|
Gas 0.0%‡ | |
East Ohio Gas Co. (a) | | | | | | | | |
1.30%, due 6/15/25 | | | 165,000 | | | | 165,777 | |
2.00%, due 6/15/30 | | | 152,000 | | | | 151,849 | |
3.00%, due 6/15/50 | | | 221,000 | | | | 220,022 | |
| | | | | | | | |
| | | | | | | 537,648 | |
| | | | | | | | |
Health Care—Products 0.6% | |
Baxter International, Inc. (a) | | | | | | | | |
3.75%, due 10/1/25 | | | 1,148,000 | | | | 1,307,952 | |
3.95%, due 4/1/30 | | | 1,002,000 | | | | 1,186,979 | |
Boston Scientific Corp. | | | | | | | | |
3.75%, due 3/1/26 | | | 560,000 | | | | 635,893 | |
4.00%, due 3/1/29 | | | 291,000 | | | | 332,971 | |
4.70%, due 3/1/49 | | | 467,000 | | | | 595,788 | |
DH Europe Finance II S.A.R.L. | | | | | | | | |
2.20%, due 11/15/24 | | | 543,000 | | | | 570,705 | |
2.60%, due 11/15/29 | | | 298,000 | | | | 317,135 | |
3.40%, due 11/15/49 | | | 383,000 | | | | 431,503 | |
| | | | | | | | |
| | | Principal
Amount | | | Value | |
Health Care—Products (continued) | |
Thermo Fisher Scientific, Inc. | | | | | | | | |
4.133%, due 3/25/25 | | $ | 667,000 | | | $ | 760,495 | |
4.497%, due 3/25/30 | | | 1,566,000 | | | | 1,940,957 | |
| | | | | | | | |
| | | | | | | 8,080,378 | |
| | | | | | | | |
Health Care—Services 1.1% | |
Centene Corp. | | | | | | | | |
3.375%, due 2/15/30 | | | 876,000 | | | | 884,506 | |
4.25%, due 12/15/27 | | | 1,372,000 | | | | 1,415,781 | |
4.625%, due 12/15/29 | | | 1,770,000 | | | | 1,867,350 | |
4.75%, due 5/15/22 | | | 64,000 | | | | 64,720 | |
5.375%, due 6/1/26 (a) | | | 1,510,000 | | | | 1,565,357 | |
Cigna Corp. | | | | | | | | |
2.40%, due 3/15/30 | | | 478,000 | | | | 495,980 | |
3.20%, due 3/15/40 | | | 217,000 | | | | 229,873 | |
3.40%, due 9/17/21 | | | 186,000 | | | | 192,178 | |
3.40%, due 3/15/50 | | | 328,000 | | | | 352,975 | |
DaVita, Inc.
4.625%, due 6/1/30 (a) | | | 1,054,000 | | | | 1,048,941 | |
HCA, Inc. | | | | | | | | |
3.50%, due 9/1/30 | | | 1,621,000 | | | | 1,561,302 | |
5.375%, due 2/1/25 | | | 545,000 | | | | 583,831 | |
5.375%, due 9/1/26 | | | 220,000 | | | | 239,525 | |
5.625%, due 9/1/28 | | | 310,000 | | | | 346,037 | |
5.875%, due 2/15/26 | | | 286,000 | | | | 313,527 | |
5.875%, due 2/1/29 | | | 459,000 | | | | 519,400 | |
Molina Healthcare, Inc.
4.375%, due 6/15/28 (a) | | | 2,834,000 | | | | 2,830,457 | |
| | | | | | | | |
| | | | | | | 14,511,740 | |
| | | | | | | | |
Home Builders 0.0%‡ | |
MDC Holdings, Inc.
5.50%, due 1/15/24 | | | 465,000 | | | | 497,550 | |
| | | | | | | | |
|
Household Products & Wares 0.1% | |
Avery Dennison Corp.
2.65%, due 4/30/30 | | | 1,251,000 | | | | 1,282,201 | |
| | | | | | | | |
|
Insurance 0.1% | |
Brown & Brown, Inc.
4.50%, due 3/15/29 | | | 697,000 | | | | 751,102 | |
| | | | | | | | |
|
Internet 0.4% | |
Booking Holdings, Inc. | | | | | | | | |
4.10%, due 4/13/25 | | | 2,655,000 | | | | 2,979,916 | |
4.50%, due 4/13/27 | | | 1,432,000 | | | | 1,644,745 | |
4.625%, due 4/13/30 | | | 999,000 | | | | 1,179,140 | |
| | | | | | | | |
| | | | | | | 5,803,801 | |
| | | | | | | | |
Iron & Steel 0.2% | |
Allegheny Technologies, Inc.
5.875%, due 12/1/27 | | | 1,047,000 | | | | 968,475 | |
| | | | |
| 14 | | MainStay VP Janus Henderson Balanced Portfolio | | The notes to the financial statements are an integral part of,
and should be read in conjunction with, the financial statements. |
| | | | | | | | |
| | | Principal
Amount | | | Value | |
| Corporate Bonds (continued) | |
Iron & Steel (continued) | |
Reliance Steel & Aluminum Co.
4.50%, due 4/15/23 | | $ | 469,000 | | | $ | 503,004 | |
Steel Dynamics, Inc.
5.50%, due 10/1/24 | | | 861,000 | | | | 884,678 | |
| | | | | | | | |
| | | | | | | 2,356,157 | |
| | | | | | | | |
Lodging 0.2% | |
Choice Hotels International, Inc.
3.70%, due 12/1/29 | | | 1,074,000 | | | | 1,075,901 | |
Marriott International, Inc.
5.75%, due 5/1/25 | | | 1,540,000 | | | | 1,672,990 | |
MGM Resorts International
7.75%, due 3/15/22 | | | 182,000 | | | | 185,640 | |
| | | | | | | | |
| | | | | | | 2,934,531 | |
| | | | | | | | |
Machinery—Diversified 0.5% | |
Otis Worldwide Corp.
2.056%, due 4/5/25 (a) | | | 711,000 | | | | 745,904 | |
Wabtec Corp. | | | | | | | | |
3.20%, due 6/15/25 | | | 1,132,000 | | | | 1,153,505 | |
3.45%, due 11/15/26 | | | 273,000 | | | | 281,021 | |
4.40%, due 3/15/24 | | | 1,014,000 | | | | 1,074,985 | |
4.95%, due 9/15/28 | | | 2,348,000 | | | | 2,616,945 | |
| | | | | | | | |
| | | | | | | 5,872,360 | |
| | | | | | | | |
Media 0.9% | |
Charter Communications Operating LLC / Charter Communications Operating Capital | | | | | | | | |
2.80%, due 4/1/31 | | | 2,142,000 | | | | 2,169,892 | |
3.70%, due 4/1/51 | | | 1,084,000 | | | | 1,063,206 | |
4.80%, due 3/1/50 | | | 1,115,000 | | | | 1,234,106 | |
5.375%, due 5/1/47 | | | 205,000 | | | | 242,088 | |
6.484%, due 10/23/45 | | | 256,000 | | | | 338,495 | |
Comcast Corp. | | | | | | | | |
3.10%, due 4/1/25 | | | 335,000 | | | | 369,140 | |
3.15%, due 3/1/26 | | | 584,000 | | | | 652,466 | |
3.30%, due 4/1/27 | | | 914,000 | | | | 1,025,023 | |
3.75%, due 4/1/40 | | | 365,000 | | | | 427,375 | |
4.60%, due 10/15/38 | | | 406,000 | | | | 516,288 | |
CSC Holdings LLC
4.125%, due 12/1/30 (a) | | | 1,351,000 | | | | 1,339,179 | |
Fox Corp.
4.03%, due 1/25/24 | | | 429,000 | | | | 475,526 | |
Sirius XM Radio, Inc.
4.125%, due 7/1/30 (a) | | | 1,625,000 | | | | 1,607,060 | |
| | | | | | | | |
| | | | | | | 11,459,844 | |
| | | | | | | | |
Mining 0.1% | |
Constellium S.E.
5.75%, due 5/15/24 (a) | | | 849,000 | | | | 849,000 | |
| | | | | | | | |
| | | Principal
Amount | | | Value | |
Mining (continued) | |
Hudbay Minerals, Inc.
7.25%, due 1/15/23 (a) | | $ | 992,000 | | | $ | 977,120 | |
| | | | | | | | |
| | | | | | | 1,826,120 | |
| | | | | | | | |
Miscellaneous—Manufacturing 0.2% | |
General Electric Co. | | | | | | | | |
3.45%, due 5/1/27 | | | 446,000 | | | | 456,487 | |
5.00%, due 1/21/21 (b)(c) | | | 1,414,000 | | | | 1,104,447 | |
Series A
6.75%, due 3/15/32 | | | 542,000 | | | | 659,373 | |
| | | | | | | | |
| | | | | | | 2,220,307 | |
| | | | | | | | |
Oil & Gas 0.1% | |
WPX Energy, Inc.
4.50%, due 1/15/30 | | | 1,209,000 | | | | 1,063,920 | |
| | | | | | | | |
|
Pharmaceuticals 0.4% | |
AbbVie, Inc. (a) | | | | | | | | |
2.60%, due 11/21/24 | | | 695,000 | | | | 737,820 | |
2.80%, due 3/15/23 | | | 57,000 | | | | 59,197 | |
3.25%, due 10/1/22 | | | 721,000 | | | | 755,580 | |
3.45%, due 3/15/22 | | | 1,331,000 | | | | 1,384,320 | |
3.80%, due 3/15/25 | | | 288,000 | | | | 319,540 | |
Bristol-Myers Squibb Co.
3.40%, due 7/26/29 (a) | | | 513,000 | | | | 597,648 | |
Elanco Animal Health, Inc.
5.022%, due 8/28/23 | | | 150,000 | | | | 157,500 | |
Pfizer, Inc.
2.625%, due 4/1/30 | | | 336,000 | | | | 370,144 | |
Takeda Pharmaceutical Co., Ltd. | | | | | | | | |
3.025%, due 7/9/40 | | | 322,000 | | | | 324,370 | |
3.375%, due 7/9/60 | | | 322,000 | | | | 321,518 | |
Upjohn, Inc. (a) | | | | | | | | |
1.65%, due 6/22/25 | | | 206,000 | | | | 210,044 | |
2.30%, due 6/22/27 | | | 239,000 | | | | 246,536 | |
3.85%, due 6/22/40 | | | 239,000 | | | | 256,842 | |
| | | | | | | | |
| | | | | | | 5,741,059 | |
| | | | | | | | |
Pipelines 0.7% | |
Cheniere Corpus Christi Holdings LLC
3.70%, due 11/15/29 (a) | | | 1,761,000 | | | | 1,796,698 | |
Energy Transfer Operating, L.P. | | | | | | | | |
4.95%, due 6/15/28 | | | 116,000 | | | | 124,572 | |
5.50%, due 6/1/27 | | | 401,000 | | | | 446,955 | |
5.875%, due 1/15/24 | | | 301,000 | | | | 335,104 | |
Hess Midstream Operations, L.P.
5.125%, due 6/15/28 (a) | | | 1,605,000 | | | | 1,544,684 | |
Kinder Morgan, Inc. | | | | | | | | |
4.30%, due 3/1/28 | | | 280,000 | | | | 317,328 | |
6.50%, due 9/15/20 | | | 59,000 | | | | 59,651 | |
NGPL PipeCo LLC
4.375%, due 8/15/22 (a) | | | 747,000 | | | | 770,444 | |
| | | | | | |
The notes to the financial statements are an integral part of,
and should be read in conjunction with, the financial statements. | | | | | 15 | |
Portfolio of Investments June 30, 2020 (Unaudited) (continued)
| | | | | | | | |
| | | Principal
Amount | | | Value | |
| Corporate Bonds (continued) | |
Pipelines (continued) | |
ONEOK, Inc. | | | | | | | | |
5.85%, due 1/15/26 | | $ | 378,000 | | | $ | 431,435 | |
6.35%, due 1/15/31 | | | 808,000 | | | | 945,818 | |
7.15%, due 1/15/51 | | | 211,000 | | | | 256,321 | |
Plains All American Pipeline, L.P. / PAA Finance Corp.
4.65%, due 10/15/25 | | | 249,000 | | | | 265,942 | |
TransCanada PipeLines, Ltd.
4.10%, due 4/15/30 | | | 1,784,000 | | | | 2,031,695 | |
| | | | | | | | |
| | | | | | | 9,326,647 | |
| | | | | | | | |
Real Estate 0.3% | |
Camden Property Trust
2.80%, due 5/15/30 | | | 1,469,000 | | | | 1,589,191 | |
Crown Castle International Corp.
3.10%, due 11/15/29 | | | 1,154,000 | | | | 1,237,075 | |
Jones Lang LaSalle, Inc.
4.40%, due 11/15/22 | | | 651,000 | | | | 682,416 | |
| | | | | | | | |
| | | | | | | 3,508,682 | |
| | | | | | | | |
Real Estate Investment Trusts 0.7% | |
Alexandria Real Estate Equities, Inc.
4.90%, due 12/15/30 | | | 1,155,000 | | | | 1,438,567 | |
Crown Castle International Corp. | | | | | | | | |
3.65%, due 9/1/27 | | | 548,000 | | | | 612,406 | |
4.30%, due 2/15/29 | | | 636,000 | | | | 737,508 | |
Equinix, Inc. | | | | | | | | |
1.80%, due 7/15/27 | | | 1,374,000 | | | | 1,373,272 | |
2.15%, due 7/15/30 | | | 623,000 | | | | 617,536 | |
2.625%, due 11/18/24 | | | 522,000 | | | | 555,732 | |
2.90%, due 11/18/26 | | | 437,000 | | | | 471,051 | |
3.20%, due 11/18/29 | | | 688,000 | | | | 748,241 | |
GLP Capital, L.P. / GLP Financing II, Inc. | | | | | | | | |
3.35%, due 9/1/24 | | | 187,000 | | | | 186,850 | |
4.00%, due 1/15/30 | | | 1,262,000 | | | | 1,250,957 | |
4.00%, due 1/15/31 | | | 429,000 | | | | 425,890 | |
5.25%, due 6/1/25 | | | 361,000 | | | | 392,551 | |
5.30%, due 1/15/29 | | | 86,000 | | | | 93,059 | |
5.375%, due 4/15/26 | | | 381,000 | | | | 416,277 | |
| | | | | | | | |
| | | | | | | 9,319,897 | |
| | | | | | | | |
Retail 1.3% | |
Alimentation Couche-Tard, Inc.
2.95%, due 1/25/30 (a) | | | 316,000 | | | | 327,645 | |
AutoZone, Inc.
3.75%, due 4/18/29 | | | 984,000 | | | | 1,118,236 | |
CVS Health Corp. | | | | | | | | |
3.00%, due 8/15/26 | | | 135,000 | | | | 147,750 | |
4.10%, due 3/25/25 | | | 1,369,000 | | | | 1,548,260 | |
4.125%, due 4/1/40 | | | 593,000 | | | | 699,995 | |
4.25%, due 4/1/50 | | | 293,000 | | | | 350,119 | |
| | | | | | | | |
| | | Principal
Amount | | | Value | |
Retail (continued) | |
CVS Health Corp. (continued) | | | | | | | | |
4.30%, due 3/25/28 | | $ | 491,000 | | | $ | 574,258 | |
5.05%, due 3/25/48 | | | 617,000 | | | | 808,204 | |
Dollar General Corp. | | | | | | | | |
3.50%, due 4/3/30 | | | 790,000 | | | | 887,362 | |
4.125%, due 4/3/50 | | | 762,000 | | | | 911,819 | |
Lowe’s Cos., Inc. | | | | | | | | |
4.00%, due 4/15/25 | | | 1,289,000 | | | | 1,468,921 | |
4.50%, due 4/15/30 | | | 1,070,000 | | | | 1,312,669 | |
5.00%, due 4/15/40 | | | 682,000 | | | | 889,232 | |
5.125%, due 4/15/50 | | | 932,000 | | | | 1,271,955 | |
McDonald’s Corp. | | | | | | | | |
3.30%, due 7/1/25 | | | 363,000 | | | | 403,270 | |
3.50%, due 7/1/27 | | | 1,141,000 | | | | 1,295,592 | |
3.625%, due 9/1/49 | | | 607,000 | | | | 666,022 | |
Nordstrom, Inc.
4.375%, due 4/1/30 | | | 1,153,000 | | | | 904,614 | |
O’Reilly Automotive, Inc. | | | | | | | | |
3.60%, due 9/1/27 | | | 25,000 | | | | 28,096 | |
3.90%, due 6/1/29 | | | 1,129,000 | | | | 1,298,398 | |
4.35%, due 6/1/28 | | | 192,000 | | | | 223,854 | |
| | | | | | | | |
| | | | | | | 17,136,271 | |
| | | | | | | | |
Semiconductors 1.1% | |
Analog Devices, Inc.
2.95%, due 4/1/25 | | | 676,000 | | | | 732,328 | |
Broadcom, Inc. (a) | | | | | | | | |
3.15%, due 11/15/25 | | | 1,496,000 | | | | 1,592,226 | |
4.15%, due 11/15/30 | | | 1,233,000 | | | | 1,339,879 | |
4.30%, due 11/15/32 | | | 986,000 | | | | 1,081,818 | |
4.70%, due 4/15/25 | | | 1,782,000 | | | | 2,007,912 | |
Lam Research Corp.
4.00%, due 3/15/29 | | | 208,000 | | | | 247,196 | |
Marvell Technology Group, Ltd. | | | | | | | | |
4.20%, due 6/22/23 | | | 142,000 | | | | 152,586 | |
4.875%, due 6/22/28 | | | 1,848,000 | | | | 2,222,957 | |
Microchip Technology, Inc. (a) | | | | | | | | |
2.67%, due 9/1/23 | | | 1,514,000 | | | | 1,558,333 | |
4.25%, due 9/1/25 | | | 1,186,000 | | | | 1,193,547 | |
Micron Technology, Inc.
2.497%, due 4/24/23 | | | 1,576,000 | | | | 1,637,879 | |
| | | | | | | | |
| | | | | | | 13,766,661 | |
| | | | | | | | |
Shipbuilding 0.3% | |
Huntington Ingalls Industries, Inc. (a) | | | | | | | | |
3.844%, due 5/1/25 | | | 864,000 | | | | 938,153 | |
4.20%, due 5/1/30 | | | 1,554,000 | | | | 1,731,599 | |
5.00%, due 11/15/25 | | | 1,190,000 | | | | 1,232,067 | |
| | | | | | | | |
| | | | | | | 3,901,819 | |
| | | | | | | | |
Software 0.6% | |
Broadridge Financial Solutions, Inc.
2.90%, due 12/1/29 | | | 2,035,000 | | | | 2,175,217 | |
| | | | |
| 16 | | MainStay VP Janus Henderson Balanced Portfolio | | The notes to the financial statements are an integral part of,
and should be read in conjunction with, the financial statements. |
| | | | | | | | |
| | | Principal
Amount | | | Value | |
| Corporate Bonds (continued) | |
Software (continued) | |
Intuit, Inc. | | | | | | | | |
0.95%, due 7/15/25 | | $ | 225,000 | | | $ | 225,487 | |
1.35%, due 7/15/27 | | | 235,000 | | | | 236,082 | |
MSCI, Inc. (a) | | | | | | | | |
3.625%, due 9/1/30 | | | 821,000 | | | | 816,895 | |
3.875%, due 2/15/31 | | | 1,122,000 | | | | 1,144,440 | |
4.00%, due 11/15/29 | | | 104,000 | | | | 106,080 | |
VMware, Inc. | | | | | | | | |
4.50%, due 5/15/25 | | | 1,128,000 | | | | 1,234,136 | |
4.65%, due 5/15/27 | | | 1,266,000 | | | | 1,399,393 | |
| | | | | | | | |
| | | | | | | 7,337,730 | |
| | | | | | | | |
Telecommunications 1.2% | |
AT&T, Inc. | | | | | | | | |
3.60%, due 7/15/25 | | | 448,000 | | | | 497,673 | |
4.50%, due 3/9/48 | | | 640,000 | | | | 756,531 | |
4.75%, due 5/15/46 | | | 439,000 | | | | 526,291 | |
4.85%, due 3/1/39 | | | 581,000 | | | | 700,758 | |
5.25%, due 3/1/37 | | | 296,000 | | | | 365,989 | |
CenturyLink, Inc. | | | | | | | | |
5.80%, due 3/15/22 | | | 419,000 | | | | 430,523 | |
6.45%, due 6/15/21 | | | 447,000 | | | | 457,147 | |
Level 3 Financing, Inc.
3.875%, due 11/15/29 (a) | | | 1,299,000 | | | | 1,369,562 | |
T-Mobile USA, Inc. | | | | | | | | |
1.50%, due 2/15/26 (a) | | | 293,000 | | | | 292,979 | |
2.05%, due 2/15/28 (a) | | | 270,000 | | | | 270,127 | |
2.55%, due 2/15/31 (a) | | | 367,000 | | | | 368,292 | �� |
3.50%, due 4/15/25 (a) | | | 1,139,000 | | | | 1,239,676 | |
3.75%, due 4/15/27 (a) | | | 2,904,000 | | | | 3,218,126 | |
3.875%, due 4/15/30 (a) | | | 976,000 | | | | 1,086,249 | |
6.375%, due 3/1/25 | | | 863,000 | | | | 886,732 | |
Verizon Communications, Inc. | | | | | | | | |
2.625%, due 8/15/26 | | | 613,000 | | | | 666,974 | |
3.00%, due 3/22/27 | | | 535,000 | | | | 593,496 | |
4.00%, due 3/22/50 | | | 323,000 | | | | 413,136 | |
4.522%, due 9/15/48 | | | 281,000 | | | | 371,710 | |
4.862%, due 8/21/46 | | | 381,000 | | | | 517,381 | |
| | | | | | | | |
| | | | | | | 15,029,352 | |
| | | | | | | | |
Toys, Games & Hobbies 0.3% | |
Hasbro, Inc. | | | | | | | | |
3.00%, due 11/19/24 | | | 610,000 | | | | 638,761 | |
3.55%, due 11/19/26 | | | 811,000 | | | | 857,012 | |
3.90%, due 11/19/29 | | | 1,867,000 | | | | 1,944,199 | |
| | | | | | | | |
| | | | | | | 3,439,972 | |
| | | | | | | | |
Transportation 0.2% | |
United Parcel Service, Inc. | | | | | | | | |
3.90%, due 4/1/25 | | | 727,000 | | | | 824,985 | |
5.20%, due 4/1/40 | | | 415,000 | | | | 572,970 | |
| | | | | | | | |
| | | Principal
Amount | | | Value | |
Transportation (continued) | |
United Parcel Service, Inc. (continued) | | | | | | | | |
5.30%, due 4/1/50 | | $ | 897,000 | | | $ | 1,290,886 | |
| | | | | | | | |
| | | | | | | 2,688,841 | |
| | | | | | | | |
Water 0.2% | |
American Water Capital Corp. | | | | | | | | |
2.80%, due 5/1/30 | | | 902,000 | | | | 982,613 | |
3.45%, due 5/1/50 | | | 1,072,000 | | | | 1,203,365 | |
| | | | | | | | |
| | | | | | | 2,185,978 | |
| | | | | | | | |
Total Corporate Bonds
(Cost $279,224,252) | | | | | | | 301,375,229 | |
| | | | | | | | |
|
| Loan Assignments 0.2% | |
Biotechnology 0.2% | |
Elanco Animal Health, Inc.
Term Loan B TBD, due 2/4/27 | | | 2,306,847 | | | | 2,197,272 | |
| | | | | | | | |
Total Loan Assignments
(Cost $2,306,847) | | | | | | | 2,197,272 | |
| | | | | | | | |
|
| Mortgage-Backed Securities 4.1% | |
Agency (Collateralized Mortgage Obligations) 0.2% | |
Federal National Mortgage Association | | | | | | | | |
Series 2018-27, Class EA
3.00%, due 5/25/48 | | | 1,082,948 | | | | 1,141,405 | |
REMIC, Series 2019-71, Class P
3.00%, due 11/25/49 | | | 1,767,507 | | | | 1,896,813 | |
| | | | | | | | |
| | | | | | | 3,038,218 | |
| | | | | | | | |
Commercial Mortgage Loans
(Collateralized Mortgage Obligations) 1.6% | |
BANK | | | | | | | | |
Series 2019-BN23, Class A3
2.92%, due 12/15/52 | | | 888,598 | | | | 979,986 | |
Series 2019-BN24, Class A3
2.96%, due 11/15/62 | | | 218,800 | | | | 242,329 | |
Series 2019-BN20, Class A3
3.011%, due 9/15/62 | | | 493,957 | | | | 546,972 | |
Series 2019-BN18, Class A4
3.584%, due 5/15/62 | | | 1,026,801 | | | | 1,182,379 | |
Series 2019-BN17, Class A4
3.714%, due 4/15/52 | | | 603,641 | | | | 698,901 | |
Series 2018-BN12, Class A4
4.255%, due 5/15/61 (e) | | | 271,673 | | | | 320,047 | |
Barclays Commercial Mortgage Securities LLC
Series 2015-SRCH, Class A2
4.197%, due 8/10/35 (a) | | | 875,000 | | | | 969,097 | |
BBCMS Mortgage Trust
Series 2017-DELC, Class A
1.035% (1 Month LIBOR + 0.85%), due 8/15/36 (a)(d) | | | 495,000 | | | | 472,698 | |
| | | | | | |
The notes to the financial statements are an integral part of,
and should be read in conjunction with, the financial statements. | | | | | 17 | |
Portfolio of Investments June 30, 2020 (Unaudited) (continued)
| | | | | | | | |
| | | Principal
Amount | | | Value | |
| Mortgage-Backed Securities (continued) | |
Commercial Mortgage Loans
(Collateralized Mortgage Obligations) (continued) | |
Benchmark Mortgage Trust
Series 2020-B16, Class A5
2.732%, due 2/15/53 | | $ | 550,000 | | | $ | 597,432 | |
BX Commercial Mortgage Trust (a) | | | | | | | | |
Series 2018-IND, Class A
0.935% (1 Month LIBOR + 0.75%), due 11/15/35 (d) | | | 914,639 | | | | 905,518 | |
Series 2019-XL, Class A
1.105% (1 Month LIBOR + 0.92%), due 10/15/36 (d) | | | 1,128,328 | | | | 1,119,740 | |
Series 2019-XL, Class B
1.265% (1 Month LIBOR + 1.08%), due 10/15/36 (d) | | | 182,482 | | | | 179,284 | |
Series 2019-OC11, Class A
3.202%, due 12/9/41 | | | 1,129,000 | | | | 1,176,147 | |
Series 2019-0C11, Class B
3.605%, due 12/9/41 | | | 564,000 | | | | 566,888 | |
Series 2019-0C11, Class C
3.856%, due 12/9/41 | | | 564,000 | | | | 537,074 | |
Series 2019-0C11, Class D
4.076%, due 12/9/41 (e) | | | 847,000 | | | | 782,448 | |
Series 2019-OC11, Class E
4.076%, due 12/9/41 (e) | | | 215,000 | | | | 190,500 | |
BXP Trust
Series 2017-GM, Class A
3.379%, due 6/13/39 (a) | | | 396,000 | | | | 433,647 | |
CHT Mortgage Trust
Series 2017-CSMO, Class A
1.115% (1 Month LIBOR + 0.93%), due 11/15/36 (a)(d) | | | 617,327 | | | | 590,263 | |
Great Wolf Trust (a)(d) | | | | | | | | |
Series 2019-WOLF, Class A
1.219% (1 Month LIBOR + 1.034%), due 12/15/36 | | | 270,000 | | | | 259,288 | |
Series 2019-WOLF, Class B
1.519% (1 Month LIBOR + 1.334%), due 12/15/36 | | | 303,000 | | | | 284,039 | |
Series 2019-WOLF, Class C
1.818% (1 Month LIBOR + 1.633%), due 12/15/36 | | | 337,000 | | | | 311,694 | |
GS Mortgage Securities Trust | | | | | | | | |
Series 2020-GC47, Class A5
2.377%, due 5/12/53 | | | 736,000 | | | | 775,681 | |
Series 2020-GC45, Class A5
2.911%, due 2/13/53 | | | 547,000 | | | | 598,663 | |
Series 2018-GS9, Class A4
3.992%, due 3/10/51 (e) | | | 645,957 | | | | 737,371 | |
Series 2018-GS10, Class A5
4.155%, due 7/10/51 (e) | | | 388,105 | | | | 453,916 | |
| | | | | | | | |
| | | Principal
Amount | | | Value | |
Commercial Mortgage Loans
(Collateralized Mortgage Obligations) (continued) | |
Morgan Stanley Capital I Trust | | | | | | | | |
Series 2016-UB11, Class A4
2.782%, due 8/15/49 | | $ | 656,000 | | | $ | 699,472 | |
Series 2019-H6, Class A4
3.417%, due 6/15/52 | | | 343,549 | | | | 386,987 | |
Series 2015-UBS8, Class A4
3.809%, due 12/15/48 | | | 517,000 | | | | 571,230 | |
Series 2018-H3, Class A5
4.177%, due 7/15/51 | | | 561,262 | | | | 656,959 | |
Series 2018-H4, Class A4
4.31%, due 12/15/51 | | | 840,223 | | | | 998,305 | |
WFRBS Commercial Mortgage Trust
Series 2014-C25, Class A5
3.631%, due 11/15/47 | | | 556,000 | | | | 599,135 | |
| | | | | | | | |
| | | | | | | 19,824,090 | |
| | | | | | | | |
Whole Loan (Collateralized Mortgage Obligations) 2.3% | |
Angel Oak Mortgage Trust (a)(e) | | | | | | | | |
Series 2020-3, Class A2
2.41%, due 4/25/65 (f) | | | 868,000 | | | | 867,991 | |
Series 2019-5, Class A1
2.593%, due 10/25/49 | | | 617,504 | | | | 625,555 | |
Series 2019-6, Class A1
2.62%, due 11/25/59 | | | 597,013 | | | | 601,352 | |
Series 2018-2, Class A1
3.674%, due��7/27/48 | | | 124,892 | | | | 127,336 | |
Arroyo Mortgage Trust
Series 2018-1, Class A1
3.763%, due 4/25/48 (a)(e) | | | 258,128 | | | | 264,991 | |
Chase Mortgage Finance Corporation
Series 2019-ATR2, Class A11
1.085% (1 Month LIBOR + 0.90%), due 7/25/49 (a)(d) | | | 143,819 | | | | 142,785 | |
COLT Mortgage Loan Trust (a)(e) | | | | | | | | |
Series 2020-3, Class A1
1.506%, due 4/27/65 | | | 509,000 | | | | 509,852 | |
Series 2020-2, Class A1
1.853%, due 3/25/65 | | | 532,951 | | | | 533,468 | |
Connecticut Avenue Securities Trust (Mortgage Pass-Through Securities) (d) | | | | | | | | |
Series 2020-R01, Class 1M1
0.985% (1 Month LIBOR + 0.80%), due 1/25/40 (a) | | | 413,943 | | | | 411,589 | |
Series 2017-C03, Class 1M1
1.135% (1 Month LIBOR + 0.95%), due 10/25/29 | | | 16,842 | | | | 16,825 | |
Series 2018-C06, Class 1M2
2.185% (1 Month LIBOR + 2.00%), due 3/25/31 | | | 1,101,380 | | | | 1,057,200 | |
Series 2019-R05, Class 1M2
2.185% (1 Month LIBOR + 2.00%), due 7/25/39 (a) | | | 1,322,627 | | | | 1,293,638 | |
| | | | |
| 18 | | MainStay VP Janus Henderson Balanced Portfolio | | The notes to the financial statements are an integral part of,
and should be read in conjunction with, the financial statements. |
| | | | | | | | |
| | | Principal
Amount | | | Value | |
| Mortgage-Backed Securities (continued) | |
Whole Loan (Collateralized Mortgage Obligations) (continued) | |
Connecticut Avenue Securities Trust (Mortgage Pass-Through Securities) (d) (continued) | | | | | |
Series 2020-R02, Class 2M2
2.185% (1 Month LIBOR + 2.00%), due 1/25/40 (a) | | $ | 1,290,627 | | | $ | 1,221,839 | |
Series 2019-R04, Class 2M2
2.285% (1 Month LIBOR + 2.10%), due 6/25/39 (a) | | | 652,469 | | | | 633,409 | |
Series 2019-R07, Class 1M2
2.285% (1 Month LIBOR + 2.10%), due 10/25/39 (a) | | | 1,403,277 | | | | 1,360,227 | |
Series 2019-R03, Class 1M2
2.335% (1 Month LIBOR + 2.15%), due 9/25/31 (a) | | | 991,665 | | | | 979,235 | |
Series 2019-R02, Class 1M2
2.485% (1 Month LIBOR + 2.30%), due 8/25/31 (a) | | | 448,649 | | | | 441,900 | |
Series 2018-C05, Class 1M2
2.535% (1 Month LIBOR + 2.35%), due 1/25/31 | | | 404,343 | | | | 395,336 | |
Series 2017-C07, Class 1M2
3.735% (1 Month LIBOR + 3.55%), due 7/25/29 | | | 665,974 | | | | 677,076 | |
Series 2016-C04, Class 1M2
4.435% (1 Month LIBOR + 4.25%), due 1/25/29 | | | 483,578 | | | | 500,440 | |
Series 2014-C04, Class 1M2
5.085% (1 Month LIBOR + 4.90%), due 11/25/24 | | | 120,766 | | | | 125,144 | |
Series 2015-C03, Class 1M2
5.185% (1 Month LIBOR + 5.00%), due 7/25/25 | | | 767,644 | | | | 782,893 | |
Series 2015-C04, Class 1M2
5.885% (1 Month LIBOR + 5.70%), due 4/25/28 | | | 389,816 | | | | 409,671 | |
Series 2016-C03, Class 2M2
6.085% (1 Month LIBOR + 5.90%), due 10/25/28 | | | 206,330 | | | | 214,474 | |
Federal Home Loan Mortgage Corporation Structured Agency Credit Risk Debt Notes (d) | | | | | | | | |
REMIC, Series 2020-DN, Class A2
0.935% (1 Month LIBOR + 0.75%), due 2/25/50 (a) | | | 101,872 | | | | 100,938 | |
REMIC, Series 2019-HQA4, Class M1
0.955% (1 Month LIBOR + 0.77%), due 11/25/49 (a) | | | 23,205 | | | | 23,098 | |
Series 2020-DNA3, Class M2
1.00% (1 Month LIBOR + 3.00%), due 6/25/50 | | | 465,000 | | | | 465,000 | |
REMIC, Series 2020-DNA1, Class M2
1.885% (1 Month LIBOR + 1.70%), due 1/25/50 (a) | | | 977,000 | | | | 933,757 | |
| | | | | | | | |
| | | Principal
Amount | | | Value | |
Whole Loan (Collateralized Mortgage Obligations) (continued) | |
JP Morgan Mortgage Trust (a)(d) | | | | | | | | |
Series 2019-5, Class A11
1.085% (1 Month LIBOR + 0.90%), due 11/25/49 | | $ | 80,656 | | | $ | 80,354 | |
Series 2019-LTV2, Class A11
1.085% (1 Month LIBOR + 0.90%), due 12/25/49 | | | 377,688 | | | | 375,110 | |
Series 2019-7, Class A11
1.085% (1 Month LIBOR + 0.90%), due 2/25/50 | | | 528,913 | | | | 526,931 | |
Series 2019-INV1, Class A11
1.135% (1 Month LIBOR + 0.95%), due 10/25/49 | | | 303,497 | | | | 302,924 | |
Series 2020-4, Class A11
1.44% (1 Month LIBOR + 1.25%), due 11/25/50 (f) | | | 472,000 | | | | 471,984 | |
Series 2020-3, Class A11
2.168% (1 Month LIBOR + 2.00%), due 8/25/50 | | | 376,576 | | | | 383,670 | |
Mello Warehouse Securitization Trust (a)(d) | | | | | | | | |
Series 2018-W1, Class A
1.035% (1 Month LIBOR + 0.85%), due 11/25/51 | | | 1,312,000 | | | | 1,309,121 | |
Series 2018-W1, Class B
1.235% (1 Month LIBOR + 1.05%), due 11/25/51 | | | 95,333 | | | | 95,161 | |
New Residential Mortgage Loan Trust
Series 2018-2A, Class A1
4.50%, due 2/25/58 (a)(e) | | | 329,404 | | | | 350,874 | |
Preston Ridge Partners Mortgage LLC (a)(g) | | | | | | | | |
Series 2020-1A, Class A1
2.981%, due 2/25/25 | | | 267,870 | | | | 266,175 | |
Series 2019-3A, Class A1
3.351%, due 7/25/24 | | | 472,386 | | | | 474,834 | |
Series 2019-4A, Class A1
3.351%, due 11/25/24 | | | 665,858 | | | | 665,934 | |
Series 2019-2A, Class A1
3.967%, due 4/25/24 | | | 638,449 | | | | 643,320 | |
Series 2019-1A, Class A1
4.50%, due 1/25/24 | | | 328,655 | | | | 330,038 | |
Provident Funding Mortgage Trust
Series 2020-1, Class A5
3.00%, due 2/25/50 (a)(e) | | | 336,171 | | | | 337,650 | |
Sequoia Mortgage Trust | | | | | | | | |
Series 2013-5, Class A1
2.50%, due 5/25/43 (a)(h) | | | 599,097 | | | | 613,396 | |
Series 2013-7, Class A2
3.00%, due 6/25/43 (h) | | | 160,359 | | | | 166,333 | |
Series 2013-9, Class A1
3.50%, due 7/25/43 (a) | | | 76,818 | | | | 79,873 | |
| | | | | | |
The notes to the financial statements are an integral part of,
and should be read in conjunction with, the financial statements. | | | | | 19 | |
Portfolio of Investments June 30, 2020 (Unaudited) (continued)
| | | | | | | | |
| | | Principal
Amount | | | Value | |
| Mortgage-Backed Securities (continued) | |
Whole Loan (Collateralized Mortgage Obligations) (continued) | |
Sequoia Mortgage Trust (continued) | | | | | | | | |
Series 2019-3, Class A2
3.50%, due 9/25/49 (a)(e) | | $ | 180,431 | | | $ | 185,395 | |
Series 2020-2, Class A19
3.50%, due 3/25/50 (a)(e) | | | 249,853 | | | | 254,825 | |
Series 2019-CH2, Class A1
4.50%, due 8/25/49 (e) | | | 18,331 | | | | 18,978 | |
Spruce Hill Mortgage Loan Trust (a)(e) | | | | | | | | |
Series 2020-SH1, Class A1
2.521%, due 1/28/50 | | | 220,941 | | | | 221,738 | |
Series 2020-SH1, Class A2
2.624%, due 1/28/50 | | | 436,154 | | | | 437,314 | |
Series 2020-SH2, Class A1
3.407%, due 6/25/55 (f) | | | 1,849,000 | | | | 1,848,975 | |
Starwood Mortgage Residential Trust
Series 2020-2, Class A1
2.718%, due 4/25/60 (a)(e) | | | 483,186 | | | | 483,241 | |
Station Place Securitization Trust
Series 2020-1
1.085% (1 Month LIBOR + 0.90%), due 10/24/20 (a)(d) | | | 2,000,000 | | | | 1,999,920 | |
Towd Point HE Trust
Series 2019-HE1, Class A1
1.085% (1 Month LIBOR + 0.90%), due 4/25/48 (a)(d) | | | 360,129 | | | | 353,779 | |
Wells Fargo Mortgage Backed Securities Trust
Series 2019-4, Class A3
3.50%, due 9/25/49 (a)(e) | | | 401,684 | | | | 408,649 | |
| | | | | | | | |
| | | | | | | 29,403,515 | |
| | | | | | | | |
Total Mortgage-Backed Securities
(Cost $51,480,384) | | | | | | | 52,265,823 | |
| | | | | | | | |
|
| U.S. Government & Federal Agencies 12.1% | |
Federal Home Loan Mortgage Corporation
(Mortgage Pass-Through Securities) 2.2% | |
2.00%, due 4/1/35 TBA (i) | | | 615,000 | | | | 633,979 | |
2.50%, due 12/1/33 | | | 1,918,723 | | | | 2,013,646 | |
2.50%, due 11/1/34 | | | 344,749 | | | | 366,040 | |
2.50%, due 11/1/34 | | | 318,345 | | | | 338,005 | |
2.50%, due 1/1/50 | | | 62,705 | | | | 65,916 | |
2.50%, due 2/1/50 TBA (i) | | | 184,000 | | | | 191,522 | |
3.00%, due 5/1/31 | | | 1,453,621 | | | | 1,549,513 | |
3.00%, due 9/1/32 | | | 343,870 | | | | 365,274 | |
3.00%, due 10/1/32 | | | 132,025 | | | | 138,935 | |
3.00%, due 1/1/33 | | | 183,145 | | | | 194,535 | |
3.00%, due 10/1/34 | | | 158,841 | | | | 168,272 | |
3.00%, due 10/1/34 | | | 381,517 | | | | 405,511 | |
3.00%, due 6/1/43 | | | 80,544 | | | | 84,037 | |
| | | | | | | | |
| | | Principal
Amount | | | Value | |
Federal Home Loan Mortgage Corporation
(Mortgage Pass-Through Securities) (continued) | |
3.00%, due 1/1/45 | | $ | 292,022 | | | $ | 310,639 | |
3.00%, due 8/1/46 | | | 21,462 | | | | 22,724 | |
3.00%, due 10/1/46 | | | 1,152,624 | | | | 1,224,325 | |
3.00%, due 4/1/47 | | | 33,335 | | | | 35,132 | |
3.00%, due 8/1/49 | | | 280,864 | | | | 298,289 | |
3.00%, due 8/1/49 | | | 94,695 | | | | 102,012 | |
3.00%, due 10/1/49 | | | 198,524 | | | | 209,284 | |
3.00%, due 11/1/49 | | | 115,327 | | | | 121,549 | |
3.00%, due 11/1/49 | | | 234,206 | | | | 246,959 | |
3.00%, due 11/1/49 | | | 595,228 | | | | 627,414 | |
3.00%, due 12/1/49 | | | 318,312 | | | | 335,605 | |
3.00%, due 12/1/49 | | | 201,746 | | | | 212,625 | |
3.00%, due 12/1/49 | | | 329,065 | | | | 346,809 | |
3.00%, due 1/1/50 | | | 56,391 | | | | 59,452 | |
3.00%, due 1/1/50 | | | 555,410 | | | | 585,551 | |
3.00%, due 2/1/50 | | | 133,764 | | | | 141,023 | |
3.00%, due 3/1/50 | | | 119,197 | | | | 125,666 | |
3.00%, due 3/1/50 | | | 117,290 | | | | 123,655 | |
3.00%, due 5/1/50 | | | 1,194,504 | | | | 1,259,327 | |
3.50%, due 7/1/42 | | | 49,936 | | | | 53,947 | |
3.50%, due 8/1/42 | | | 53,450 | | | | 57,730 | |
3.50%, due 8/1/42 | | | 61,072 | | | | 65,962 | |
3.50%, due 2/1/43 | | | 318,505 | | | | 343,980 | |
3.50%, due 2/1/44 | | | 374,461 | | | | 404,368 | |
3.50%, due 12/1/44 | | | 802,373 | | | | 867,701 | |
3.50%, due 7/1/46 | | | 243,943 | | | | 262,480 | |
3.50%, due 7/1/46 | | | 976,875 | | | | 1,078,080 | |
3.50%, due 9/1/47 | | | 1,075,031 | | | | 1,139,877 | |
3.50%, due 9/1/47 | | | 557,375 | | | | 590,066 | |
3.50%, due 11/1/47 | | | 349,650 | | | | 377,054 | |
3.50%, due 12/1/47 | | | 1,514,910 | | | | 1,655,717 | |
3.50%, due 12/1/47 | | | 261,510 | | | | 282,005 | |
3.50%, due 2/1/48 | | | 435,045 | | | | 469,044 | |
3.50%, due 2/1/48 | | | 389,672 | | | | 415,236 | |
3.50%, due 7/1/49 | | | 1,594,049 | | | | 1,680,895 | |
3.50%, due 8/1/49 | | | 288,412 | | | | 303,786 | |
3.50%, due 8/1/49 | | | 61,303 | | | | 64,568 | |
3.50%, due 9/1/49 | | | 538,051 | | | | 566,064 | |
3.50%, due 3/1/50 | | | 12,947 | | | | 13,824 | |
4.00%, due 3/1/47 | | | 60,282 | | | | 65,436 | |
4.00%, due 3/1/48 | | | 278,033 | | | | 303,155 | |
4.00%, due 4/1/48 | | | 11,299 | | | | 11,977 | |
4.00%, due 4/1/48 | | | 485,142 | | | | 526,550 | |
4.00%, due 5/1/48 | | | 1,157,312 | | | | 1,229,158 | |
4.50%, due 5/1/44 | | | 768,009 | | | | 852,591 | |
4.50%, due 3/1/48 | | | 368,522 | | | | 395,566 | |
4.50%, due 12/1/48 | | | 394,746 | | | | 439,094 | |
5.00%, due 9/1/48 | | | 90,006 | | | | 98,458 | |
6.00%, due 4/1/40 | | | 661,555 | | | | 786,378 | |
| | | | | | | | |
| | | | | | | 28,303,972 | |
| | | | | | | | |
| | | | |
| 20 | | MainStay VP Janus Henderson Balanced Portfolio | | The notes to the financial statements are an integral part of,
and should be read in conjunction with, the financial statements. |
| | | | | | | | |
| | | Principal
Amount | | | Value | |
| U.S. Government & Federal Agencies (continued) | |
Federal National Mortgage Association
(Mortgage Pass-Through Securities)��5.1% | |
2.00%, due 3/1/50 TBA (i) | | $ | 85,600 | | | $ | 87,434 | |
2.50%, due 11/1/34 | | | 423,799 | | | | 449,894 | |
2.50%, due 2/1/35 TBA (i) | | | 1,253,900 | | | | 1,310,570 | |
2.50%, due 1/1/50 | | | 134,521 | | | | 141,409 | |
3.00%, due 2/1/34 TBA (i) | | | 477,200 | | | | 501,582 | |
3.00%, due 10/1/34 | | | 210,992 | | | | 223,675 | |
3.00%, due 11/1/34 | | | 41,058 | | | | 43,918 | |
3.00%, due 12/1/34 | | | 39,740 | | | | 42,375 | |
3.00%, due 1/1/43 | | | 78,585 | | | | 84,213 | |
3.00%, due 2/1/43 | | | 28,978 | | | | 30,970 | |
3.00%, due 5/1/43 | | | 1,088,450 | | | | 1,165,286 | |
3.00%, due 5/1/43 | | | 110,582 | | | | 118,159 | |
3.00%, due 1/1/46 | | | 4,792 | | | | 5,050 | |
3.00%, due 9/1/46 | | | 1,494,614 | | | | 1,600,897 | |
3.00%, due 2/1/47 | | | 12,800,976 | | | | 13,707,563 | |
3.00%, due 3/1/47 | | | 854,288 | | | | 912,792 | |
3.00%, due 11/1/48 | | | 153,782 | | | | 162,196 | |
3.00%, due 8/1/49 | | | 295,436 | | | | 318,262 | |
3.00%, due 9/1/49 | | | 62,687 | | | | 67,771 | |
3.00%, due 1/1/50 | | | 300,422 | | | | 316,726 | |
3.00%, due 3/1/50 | | | 4,246,069 | | | | 4,476,496 | |
3.00%, due 2/1/57 | | | 1,235,023 | | | | 1,323,114 | |
3.00%, due 6/1/57 | | | 19,722 | | | | 21,121 | |
3.50%, due 6/1/33 TBA (i) | | | 1,388,101 | | | | 1,458,428 | |
3.50%, due 12/1/42 | | | 775,521 | | | | 837,447 | |
3.50%, due 2/1/43 | | | 1,181,721 | | | | 1,275,973 | |
3.50%, due 4/1/43 | | | 852,149 | | | | 920,397 | |
3.50%, due 11/1/43 | | | 401,595 | | | | 433,655 | |
3.50%, due 12/1/43 | | | 623,615 | | | | 673,394 | |
3.50%, due 4/1/44 | | | 506,394 | | | | 558,620 | |
3.50%, due 2/1/45 | | | 109,865 | | | | 118,593 | |
3.50%, due 2/1/45 | | | 1,023,715 | | | | 1,105,680 | |
3.50%, due 12/1/45 | | | 262,463 | | | | 289,531 | |
3.50%, due 7/1/46 | | | 506,462 | | | | 553,665 | |
3.50%, due 8/1/47 | | | 129,066 | | | | 143,207 | |
3.50%, due 8/1/47 | | | 241,760 | | | | 256,205 | |
3.50%, due 8/1/47 | | | 181,586 | | | | 195,014 | |
3.50%, due 12/1/47 | | | 392,352 | | | | 422,099 | |
3.50%, due 12/1/47 | | | 276,111 | | | | 299,523 | |
3.50%, due 12/1/47 | | | 36,102 | | | | 40,057 | |
3.50%, due 12/1/47 | | | 76,081 | | | | 84,416 | |
3.50%, due 1/1/48 | | | 283,014 | | | | 305,131 | |
3.50%, due 1/1/48 | | | 456,745 | | | | 494,232 | |
3.50%, due 3/1/48 | | | 184,698 | | | | 200,024 | |
3.50%, due 3/1/48 | | | 53,188 | | | | 57,920 | |
3.50%, due 4/1/48 | | | 614,522 | | | | 677,391 | |
3.50%, due 11/1/48 | | | 1,017,644 | | | | 1,121,756 | |
3.50%, due 4/1/49 TBA (i) | | | 3,341,979 | | | | 3,514,952 | |
3.50%, due 7/1/49 | | | 429,803 | | | | 452,557 | |
| | | | | | | | |
| | | Principal
Amount | | | Value | |
Federal National Mortgage Association
(Mortgage Pass-Through Securities) (continued) | |
3.50%, due 8/1/56 | | $ | 1,589,179 | | | $ | 1,719,637 | |
3.50%, due 2/1/57 | | | 1,751,935 | | | | 1,907,897 | |
4.00%, due 12/1/24 TBA (i) | | | 396,559 | | | | 419,463 | |
4.00%, due 6/1/47 | | | 24,887 | | | | 26,789 | |
4.00%, due 6/1/47 | | | 48,494 | | | | 51,729 | |
4.00%, due 6/1/47 | | | 104,232 | | | | 111,015 | |
4.00%, due 6/1/47 | | | 56,938 | | | | 61,290 | |
4.00%, due 7/1/47 | | | 27,171 | | | | 28,898 | |
4.00%, due 7/1/47 | | | 85,573 | | | | 91,439 | |
4.00%, due 7/1/47 | | | 17,427 | | | | 18,543 | |
4.00%, due 7/1/47 | | | 84,194 | | | | 89,543 | |
4.00%, due 8/1/47 | | | 98,852 | | | | 105,478 | |
4.00%, due 8/1/47 | | | 172,833 | | | | 184,538 | |
4.00%, due 9/1/47 | | | 43,933 | | | | 47,988 | |
4.00%, due 10/1/47 | | | 210,734 | | | | 223,957 | |
4.00%, due 10/1/47 | | | 113,948 | | | | 121,396 | |
4.00%, due 10/1/47 | | | 191,028 | | | | 208,761 | |
4.00%, due 10/1/47 | | | 120,075 | | | | 131,263 | |
4.00%, due 10/1/47 | | | 181,852 | | | | 198,620 | |
4.00%, due 11/1/47 | | | 298,359 | | | | 317,838 | |
4.00%, due 11/1/47 | | | 84,209 | | | | 89,713 | |
4.00%, due 12/1/47 | | | 532,288 | | | | 567,463 | |
4.00%, due 1/1/48 | | | 970,473 | | | | 1,056,401 | |
4.00%, due 1/1/48 | | | 1,959,021 | | | | 2,127,232 | |
4.00%, due 1/1/48 | | | 112,090 | | | | 119,658 | |
4.00%, due 3/1/48 | | | 377,904 | | | | 416,406 | |
4.00%, due 5/1/48 | | | 753,855 | | | | 798,084 | |
4.00%, due 2/1/49 | | | 350,521 | | | | 371,341 | |
4.00%, due 9/1/49 | | | 1,733,444 | | | | 1,888,580 | |
4.50%, due 11/1/42 | | | 110,839 | | | | 124,240 | |
4.50%, due 10/1/44 | | | 314,101 | | | | 356,684 | |
4.50%, due 3/1/45 | | | 490,150 | | | | 556,646 | |
4.50%, due 6/1/45 | | | 254,344 | | | | 282,064 | |
4.50%, due 2/1/46 | | | 631,561 | | | | 702,048 | |
4.50%, due 5/1/47 | | | 27,873 | | | | 30,680 | |
4.50%, due 5/1/47 | | | 17,834 | | | | 19,714 | |
4.50%, due 5/1/47 | | | 92,599 | | | | 103,497 | |
4.50%, due 5/1/47 | | | 82,199 | | | | 90,866 | |
4.50%, due 5/1/47 | | | 83,595 | | | | 91,801 | |
4.50%, due 5/1/47 | | | 56,562 | | | | 63,349 | |
4.50%, due 5/1/47 | | | 43,916 | | | | 48,339 | |
4.50%, due 5/1/47 | | | 58,773 | | | | 64,542 | |
4.50%, due 5/1/47 | | | 19,415 | | | | 21,744 | |
4.50%, due 6/1/47 | | | 373,586 | | | | 406,519 | |
4.50%, due 6/1/47 | | | 31,626 | | | | 35,056 | |
4.50%, due 7/1/47 | | | 187,630 | | | | 203,076 | |
4.50%, due 7/1/47 | | | 170,239 | | | | 184,993 | |
4.50%, due 7/1/47 | | | 273,333 | | | | 297,428 | |
4.50%, due 8/1/47 | | | 30,857 | | | | 33,379 | |
4.50%, due 8/1/47 | | | 275,478 | | | | 298,193 | |
| | | | | | |
The notes to the financial statements are an integral part of,
and should be read in conjunction with, the financial statements. | | | | | 21 | |
Portfolio of Investments June 30, 2020 (Unaudited) (continued)
| | | | | | | | |
| | | Principal
Amount | | | Value | |
| U.S. Government & Federal Agencies (continued) | |
Federal National Mortgage Association
(Mortgage Pass-Through Securities) (continued) | |
4.50%, due 9/1/47 | | $ | 265,939 | | | $ | 289,384 | |
4.50%, due 9/1/47 | | | 417,651 | | | | 453,280 | |
4.50%, due 9/1/47 | | | 161,798 | | | | 175,140 | |
4.50%, due 10/1/47 | | | 30,866 | | | | 33,389 | |
4.50%, due 10/1/47 | | | 22,359 | | | | 24,330 | |
4.50%, due 11/1/47 | | | 178,741 | | | | 193,352 | |
4.50%, due 3/1/48 | | | 265,270 | | | | 287,681 | |
4.50%, due 3/1/48 | | | 401,984 | | | | 432,465 | |
4.50%, due 4/1/48 | | | 292,867 | | | | 319,792 | |
4.50%, due 5/1/48 | | | 165,737 | | | | 179,490 | |
4.50%, due 5/1/48 | | | 179,309 | | | | 193,216 | |
4.50%, due 6/1/48 | | | 224,663 | | | | 244,707 | |
4.50%, due 6/1/48 | | | 182,628 | | | | 196,363 | |
4.50%, due 8/1/48 | | | 361,290 | | | | 388,395 | |
5.00%, due 7/1/44 | | | 455,514 | | | | 508,971 | |
5.00%, due 5/1/48 | | | 324,533 | | | | 354,935 | |
6.00%, due 2/1/37 | | | 37,072 | | | | 43,824 | |
| | | | | | | | |
| | | | | | | 65,435,872 | |
| | | | | | | | |
Government National Mortgage Association
(Mortgage Pass-Through Securities) 1.4% | |
2.50%, due 12/1/49 TBA (i) | | | 4,969,800 | | | | 5,220,814 | |
3.00%, due 12/1/49 TBA (i) | | | 797,300 | | | | 841,525 | |
4.00%, due 1/15/45 | | | 923,447 | | | | 1,003,760 | |
4.00%, due 7/15/47 | | | 962,417 | | | | 1,024,829 | |
4.00%, due 8/15/47 | | | 201,876 | | | | 214,954 | |
4.00%, due 8/20/47 | | | 52,849 | | | | 58,071 | |
4.00%, due 8/20/47 | | | 100,232 | | | | 107,615 | |
4.00%, due 8/20/47 | | | 29,264 | | | | 31,606 | |
4.00%, due 11/15/47 | | | 203,449 | | | | 215,976 | |
4.00%, due 12/15/47 | | | 269,956 | | | | 287,374 | |
4.00%, due 6/20/48 | | | 827,633 | | | | 884,907 | |
4.50%, due 8/15/46 | | | 1,000,582 | | | | 1,115,645 | |
4.50%, due 2/20/48 | | | 157,711 | | | | 171,222 | |
4.50%, due 5/20/48 | | | 151,486 | | | | 163,863 | |
4.50%, due 5/20/48 | | | 605,733 | | | | 654,653 | |
5.00%, due 5/20/48 | | | 1,317,099 | | | | 1,435,614 | |
5.00%, due 6/20/48 | | | 620,515 | | | | 676,084 | |
5.00%, due 8/20/48 | | | 1,058,714 | | | | 1,153,393 | |
5.00%, due 4/20/49 | | | 2,941,103 | | | | 3,194,214 | |
| | | | | | | | |
| | | | | | | 18,456,119 | |
| | | | | | | | |
United States Treasury Bonds 2.6% | | | | | | | | |
1.125%, due 5/15/40 | | | 257,000 | | | | 255,173 | |
2.00%, due 2/15/50 | | | 12,350,400 | | | | 14,144,103 | |
2.375%, due 11/15/49 | | | 4,882,900 | | | | 6,031,144 | |
2.75%, due 8/15/42 | | | 9,549,500 | | | | 12,242,757 | |
| | | | | | | | |
| | | | | | | 32,673,177 | |
| | | | | | | | |
| | | | | | | | |
| | | Principal
Amount | | | Value | |
United States Treasury Notes 0.8% | | | | | | | | |
0.25%, due 6/30/25 | | $ | 5,016,400 | | | $ | 5,003,799 | |
0.625%, due 5/15/30 | | | 1,902,700 | | | | 1,897,423 | |
1.50%, due 2/15/30 | | | 3,359,500 | | | | 3,631,672 | |
| | | | | | | | |
| | | | | | | 10,532,894 | |
| | | | | | | | |
Total U.S. Government & Federal Agencies
(Cost $150,250,322) | | | | | | | 155,402,034 | |
| | | | | | | | |
Total Long-Term Bonds
(Cost $502,968,406) | | | | | | | 531,121,686 | |
| | | | | | | | |
| | |
| | | | | | | | |
| | |
| | | Shares | | | | |
| Common Stocks 58.0% | | | | | | | | |
Aerospace & Defense 1.1% | | | | | | | | |
General Dynamics Corp. | | | 93,570 | | | | 13,984,972 | |
| | | | | | | | |
|
Air Freight & Logistics 0.4% | |
United Parcel Service, Inc., Class B | | | 46,966 | | | | 5,221,680 | |
| | | | | | | | |
|
Banks 1.1% | |
Bank of America Corp. | | | 367,027 | | | | 8,716,891 | |
U.S. Bancorp | | | 152,999 | | | | 5,633,423 | |
| | | | | | | | |
| | | | | | | 14,350,314 | |
| | | | | | | | |
Beverages 0.7% | |
Monster Beverage Corp. (j) | | | 123,421 | | | | 8,555,544 | |
| | | | | | | | |
|
Biotechnology 0.7% | |
AbbVie, Inc. | | | 89,501 | | | | 8,787,208 | |
| | | | | | | | |
|
Capital Markets 2.7% | |
Apollo Global Management, Inc. | | | 31,508 | | | | 1,572,879 | |
Blackstone Group, Inc., Class A | | | 199,707 | | | | 11,315,399 | |
CME Group, Inc. | | | 58,577 | | | | 9,521,106 | |
Morgan Stanley | | | 191,867 | | | | 9,267,176 | |
S&P Global, Inc. | | | 11,473 | | | | 3,780,124 | |
| | | | | | | | |
| | | | | | | 35,456,684 | |
| | | | | | | | |
Chemicals 0.4% | |
Sherwin-Williams Co. | | | 9,203 | | | | 5,317,954 | |
| | | | | | | | |
|
Consumer Finance 0.8% | |
American Express Co. | | | 78,598 | | | | 7,482,529 | |
Synchrony Financial | | | 116,548 | | | | 2,582,704 | |
| | | | | | | | |
| | | | | | | 10,065,233 | |
| | | | | | | | |
Electronic Equipment, Instruments & Components 0.4% | |
Corning, Inc. | | | 183,172 | | | | 4,744,155 | |
| | | | | | | | |
|
Entertainment 0.6% | |
Walt Disney Co. | | | 74,993 | | | | 8,362,469 | |
| | | | | | | | |
| | | | |
| 22 | | MainStay VP Janus Henderson Balanced Portfolio | | The notes to the financial statements are an integral part of,
and should be read in conjunction with, the financial statements. |
| | | | | | | | |
| | |
| | | Shares | | | Value | |
| Common Stocks (continued) | | | | | | | | |
Equity Real Estate Investment Trusts 1.0% | |
Crown Castle International Corp. | | | 52,324 | | | $ | 8,756,421 | |
MGM Growth Properties LLC, Class A | | | 150,779 | | | | 4,102,697 | |
| | | | | | | | |
| | | | | | | 12,859,118 | |
| | | | | | | | |
Food & Staples Retailing 1.5% | |
Costco Wholesale Corp. | | | 50,725 | | | | 15,380,327 | |
Sysco Corp. | | | 62,932 | | | | 3,439,863 | |
| | | | | | | | |
| | | | | | | 18,820,190 | |
| | | | | | | | |
Food Products 0.5% | |
Hershey Co. | | | 46,814 | | | | 6,068,031 | |
| | | | | | | | |
|
Health Care Equipment & Supplies 2.2% | |
Abbott Laboratories | | | 147,496 | | | | 13,485,559 | |
Intuitive Surgical, Inc. (j) | | | 5,021 | | | | 2,861,116 | |
Medtronic PLC | | | 91,486 | | | | 8,389,266 | |
Stryker Corp. | | | 18,729 | | | | 3,374,779 | |
| | | | | | | | |
| | | | | | | 28,110,720 | |
| | | | | | | | |
Health Care Providers & Services 2.0% | |
UnitedHealth Group, Inc. | | | 87,182 | | | | 25,714,331 | |
| | | | | | | | |
|
Hotels, Restaurants & Leisure 2.3% | |
Hilton Worldwide Holdings, Inc. | | | 75,360 | | | | 5,535,192 | |
McDonald’s Corp. | | | 96,435 | | | | 17,789,364 | |
Starbucks Corp. | | | 86,820 | | | | 6,389,084 | |
| | | | | | | | |
| | | | | | | 29,713,640 | |
| | | | | | | | |
Household Products 1.1% | |
Clorox Co. | | | 15,336 | | | | 3,364,259 | |
Procter & Gamble Co. | | | 88,132 | | | | 10,537,943 | |
| | | | | | | | |
| | | | | | | 13,902,202 | |
| | | | | | | | |
Industrial Conglomerates 0.9% | |
Honeywell International, Inc. | | | 78,904 | | | | 11,408,729 | |
| | | | | | | | |
|
Insurance 1.5% | |
Marsh & McLennan Cos., Inc. | | | 35,218 | | | | 3,781,357 | |
Progressive Corp. | | | 193,286 | | | | 15,484,141 | |
| | | | | | | | |
| | | | | | | 19,265,498 | |
| | | | | | | | |
Interactive Media & Services 2.3% | |
Alphabet, Inc., Class C (j) | | | 20,609 | | | | 29,133,089 | |
| | | | | | | | |
|
Internet & Direct Marketing Retail 2.2% | |
Amazon.com, Inc. (j) | | | 10,409 | | | | 28,716,557 | |
| | | | | | | | |
|
IT Services 3.8% | |
Accenture PLC, Class A | | | 86,754 | | | | 18,627,819 | |
Mastercard, Inc. | | | 103,426 | | | | 30,583,068 | |
| | | | | | | | |
| | | | | | | 49,210,887 | |
| | | | | | | | |
| | | | | | | | |
| | |
| | | Shares | | | Value | |
Leisure Products 0.5% | |
Hasbro, Inc. | | | 82,802 | | | $ | 6,206,010 | |
| | | | | | | | |
|
Life Sciences Tools & Services 0.9% | |
Thermo Fisher Scientific, Inc. | | | 32,344 | | | | 11,719,525 | |
| | | | | | | | |
|
Machinery 0.6% | |
Deere & Co. | | | 49,089 | | | | 7,714,336 | |
| | | | | | | | |
|
Media 1.2% | |
Comcast Corp., Class A | | | 415,691 | | | | 16,203,635 | |
| | | | | | | | |
|
Multi-Utilities 0.3% | |
Sempra Energy | | | 31,108 | | | | 3,646,791 | |
| | | | | | | | |
|
Multiline Retail 0.9% | |
Dollar General Corp. | | | 63,756 | | | | 12,146,156 | |
| | | | | | | | |
|
Personal Products 0.2% | |
Estee Lauder Cos., Inc., Class A | | | 14,055 | | | | 2,651,897 | |
| | | | | | | | |
|
Pharmaceuticals 3.9% | |
Bristol-Myers Squibb Co. | | | 224,116 | | | | 13,178,021 | |
Eli Lilly & Co. | | | 104,340 | | | | 17,130,541 | |
Merck & Co., Inc. | | | 252,816 | | | | 19,550,261 | |
| | | | | | | | |
| | | | | | | 49,858,823 | |
| | | | | | | | |
Real Estate Management & Development 0.4% | |
CBRE Group, Inc., Class A (j) | | | 126,601 | | | | 5,724,897 | |
| | | | | | | | |
|
Road & Rail 0.7% | |
CSX Corp. | | | 129,958 | | | | 9,063,271 | |
| | | | | | | | |
|
Semiconductors & Semiconductor Equipment 3.9% | |
Intel Corp. | | | 238,804 | | | | 14,287,643 | |
Lam Research Corp. | | | 49,221 | | | | 15,921,025 | |
NVIDIA Corp. | | | 29,558 | | | | 11,229,380 | |
Texas Instruments, Inc. | | | 74,876 | | | | 9,507,006 | |
| | | | | | | | |
| | | | | | | 50,945,054 | |
| | | | | | | | |
Software 7.7% | |
Adobe, Inc. (j) | | | 59,259 | | | | 25,796,035 | |
Microsoft Corp. | | | 314,973 | | | | 64,100,155 | |
salesforce.com, Inc. (j) | | | 49,836 | | | | 9,335,778 | |
| | | | | | | | |
| | | | | | | 99,231,968 | |
| | | | | | | | |
Specialty Retail 1.9% | |
Home Depot, Inc. | | | 98,905 | | | | 24,776,692 | |
| | | | | | | | |
|
Technology Hardware, Storage & Peripherals 2.9% | |
Apple, Inc. | | | 101,256 | | | | 36,938,189 | |
| | | | | | | | |
| | | | | | |
The notes to the financial statements are an integral part of,
and should be read in conjunction with, the financial statements. | | | | | 23 | |
Portfolio of Investments June 30, 2020 (Unaudited) (continued)
| | | | | | | | |
| | |
| | | Shares | | | Value | |
| Common Stocks (continued) | | | | | | | | |
Textiles, Apparel & Luxury Goods 0.8% | |
NIKE, Inc., Class B | | | 107,067 | | | $ | 10,497,919 | |
| | | | | | | | |
|
Tobacco 0.7% | |
Altria Group, Inc. | | | 232,031 | | | | 9,107,217 | |
| | | | | | | | |
|
Wireless Telecommunication Services 0.3% | |
T-Mobile U.S., Inc. (j) | | | 40,825 | | | | 4,251,924 | |
| | | | | | | | |
Total Common Stocks
(Cost $545,106,152) | | | | | | | 748,453,509 | |
| | | | | | | | |
| | |
| | | | | | | | |
| | | Number of
Rights | | | | |
| Rights 0.0%‡ | | | | | | | | |
Wireless Telecommunication Services 0.0%‡ | | | | | |
T-Mobile U.S., Inc. (j) | | | 40,825 | | | | 6,859 | |
| | | | | | | | |
Total Rights
(Cost $15,105) | | | | | | | 6,859 | |
| | | | | | | | |
| | |
| | | | | | | | |
| | |
| | | Shares | | | | |
| Short-Term Investment 2.3% | | | | | | | | |
Affiliated Investment Company 2.3% | |
MainStay U.S. Government Liquidity Fund, 0.05% (k) | | | 30,053,822 | | | | 30,053,822 | |
| | | | | | | | |
Total Short-Term Investment
(Cost $30,053,822) | | | | | | | 30,053,822 | |
| | | | | | | | |
Total Investments
(Cost $1,078,143,485) | | | 101.6 | % | | | 1,309,635,876 | |
Other Assets, Less Liabilities | | | (1.6 | ) | | | (20,077,626 | ) |
Net Assets | | | 100.0 | % | | $ | 1,289,558,250 | |
| † | Percentages indicated are based on Portfolio net assets. |
| ‡ | Less than one-tenth of a percent. |
| (a) | May be sold to institutional investors only under Rule 144A or securities offered pursuant to Section 4(a)(2) of the Securities Act of 1933, as amended. |
| (b) | Fixed to floating rate—Rate shown was the rate in effect as of June 30, 2020. |
| (c) | Securities are perpetual and, thus, do not have a predetermined maturity date. The date shown, if applicable, reflects the next call date. |
| (d) | Floating rate—Rate shown was the rate in effect as of June 30, 2020. |
| (e) | Coupon rate may change based on changes of the underlying collateral or prepayments of principal. Rate shown was the rate in effect as of June 30, 2020. |
| (f) | Fair valued security—Represents fair value as measured in good faith under procedures approved by the Board of Trustees. As of June 30, 2020, the total market value of fair valued securities was $3,188,950, which represented 0.2% of the Portfolio’s net assets. |
| (g) | Step coupon—Rate shown was the rate in effect as of June 30, 2020. |
| (h) | Collateral strip rate—A bond whose interest was based on the weighted net interest rate of the collateral. The coupon rate adjusts periodically based on a predetermined schedule. Rate shown was the rate in effect as of June 30, 2020. |
| (i) | TBA—Securities purchased on a forward commitment basis with an approximate principal amount and maturity date. The actual principal amount and maturity date will be determined upon settlement. As of June 30, 2020, the total net market value of these securities was $14,180,269, which represented 1.1% of the Portfolio’s net assets. All or a portion of these securities are a part of a mortgage dollar roll agreement. |
| (j) | Non-income producing security. |
| (k) | Current yield as of June 30, 2020. |
The following abbreviations are used in the preceding pages:
LIBOR—London Interbank Offered Rate
REMIC—Real Estate Mortgage Investment Conduit
TBD—To Be Determined
| | | | |
| 24 | | MainStay VP Janus Henderson Balanced Portfolio | | The notes to the financial statements are an integral part of,
and should be read in conjunction with, the financial statements. |
The following is a summary of the fair valuations according to the inputs used as of June 30, 2020, for valuing the Portfolio’s assets:
| | | | | | | | | | | | | | | | |
Description | | Quoted
Prices in
Active
Markets for
Identical
Assets
(Level 1) | | | Significant
Other
Observable
Inputs
(Level 2) | | | Significant
Unobservable
Inputs
(Level 3) | | | Total | |
| | | | |
Asset Valuation Inputs | | | | | | | | | | | | | | | | |
| Investments in Securities (a) | | | | | | | | | | | | | | | | |
| Long-Term Bonds | | | | | | | | | | | | | | | | |
Asset-Backed Securities | | $ | — | | | $ | 19,881,328 | | | $ | — | | | $ | 19,881,328 | |
Corporate Bonds | | | — | | | | 301,375,229 | | | | — | | | | 301,375,229 | |
Loan Assignments | | | — | | | | 2,197,272 | | | | — | | | | 2,197,272 | |
Mortgage-Backed Securities | | | — | | | | 52,265,823 | | | | — | | | | 52,265,823 | |
U.S. Government & Federal Agencies | | | — | | | | 155,402,034 | | | | — | | | | 155,402,034 | |
| | | | | | | | | | | | | | | | |
| Total Long-Term Bonds | | | — | | | | 531,121,686 | | | | — | | | | 531,121,686 | |
| | | | | | | | | | | | | | | | |
| Common Stocks | | | 748,453,509 | | | | — | | | | — | | | | 748,453,509 | |
| Rights | | | 6,859 | | | | — | | | | — | | | | 6,859 | |
| Short-Term Investment | | | | | | | | | | | | | | | | |
Affiliated Investment Company | | | 30,053,822 | | | | — | | | | — | | | | 30,053,822 | |
| | | | | | | | | | | | | | | | |
| Total Investments in Securities | | $ | 778,514,190 | | | $ | 531,121,686 | | | $ | — | | | $ | 1,309,635,876 | |
| | | | | | | | | | | | | | | | |
| (a) | For a complete listing of investments and their industries, see the Portfolio of Investments. |
| | | | | | |
The notes to the financial statements are an integral part of,
and should be read in conjunction with, the financial statements. | | | | | 25 | |
Statement of Assets and Liabilities as of June 30, 2020 (Unaudited)
| | | | |
| Assets | | | | |
Investment in unaffiliated securities, at value (identified cost $1,048,089,663) | | $ | 1,279,582,054 | |
Investment in affiliated investment company, at value (identified cost $30,053,822) | | | 30,053,822 | |
Due from custodian | | | 72,103 | |
Receivables: | | | | |
Investment securities sold | | | 37,956,599 | |
Dividends and interest | | | 3,801,243 | |
Portfolio shares sold | | | 497,892 | |
Securities lending | | | 38 | |
Other assets | | | 6,698 | |
| | | | |
Total assets | | | 1,351,970,449 | |
| | | | |
| |
| Liabilities | | | | |
Payables: | | | | |
Investment securities purchased | | | 60,830,743 | |
Portfolio shares redeemed | | | 711,103 | |
Manager (See Note 3) | | | 572,406 | |
NYLIFE Distributors (See Note 3) | | | 185,171 | |
Shareholder communication | | | 55,464 | |
Professional fees | | | 31,076 | |
Custodian | | | 16,702 | |
Trustees | | | 1,565 | |
Accrued expenses | | | 7,969 | |
| | | | |
Total liabilities | | | 62,412,199 | |
| | | | |
Net assets | | $ | 1,289,558,250 | |
| | | | |
| |
| Composition of Net Assets | | | | |
Shares of beneficial interest outstanding (par value of $.001 per share) unlimited number of shares authorized | | $ | 92,610 | |
Additional paid-in capital | | | 947,157,907 | |
| | | | |
| | | 947,250,517 | |
Total distributable earnings (loss) | | | 342,307,733 | |
| | | | |
Net assets | | $ | 1,289,558,250 | |
| | | | |
| | | | |
Initial Class | | | | |
Net assets applicable to outstanding shares | | $ | 380,123,937 | |
| | | | |
Shares of beneficial interest outstanding | | | 27,149,131 | |
| | | | |
Net asset value per share outstanding | | $ | 14.00 | |
| | | | |
Service Class | | | | |
Net assets applicable to outstanding shares | | $ | 909,434,313 | |
| | | | |
Shares of beneficial interest outstanding | | | 65,460,966 | |
| | | | |
Net asset value per share outstanding | | $ | 13.89 | |
| | | | |
| | | | |
| 26 | | MainStay VP Janus Henderson Balanced Portfolio | | The notes to the financial statements are an integral part of,
and should be read in conjunction with, the financial statements. |
Statement of Operations for the six months ended June 30, 2020 (Unaudited)
| | | | |
| Investment Income (Loss) | | | | |
Income | | | | |
Interest | | $ | 7,819,924 | |
Dividends-unaffiliated (a) | | | 6,908,201 | |
Dividends-affiliated | | | 76,295 | |
Securities lending | | | 24,377 | |
| | | | |
Total income | | | 14,828,797 | |
| | | | |
Expenses | | | | |
Manager (See Note 3) | | | 3,424,823 | |
Distribution/Service—Service Class (See Note 3) | | | 1,100,873 | |
Professional fees | | | 78,042 | |
Shareholder communication | | | 63,061 | |
Custodian | | | 41,882 | |
Trustees | | | 15,311 | |
Miscellaneous | | | 23,741 | |
| | | | |
Total expenses | | | 4,747,733 | |
| | | | |
Net investment income (loss) | | | 10,081,064 | |
| | | | |
|
| Realized and Unrealized Gain (Loss) on Investments and Foreign Currency Transactions | |
Net realized gain (loss) on: | | | | |
Unaffiliated investment transactions | | | 32,871,822 | |
Foreign currency transactions | | | (9,361 | ) |
| | | | |
Net realized gain (loss) on investments and foreign currency transactions | | | 32,862,461 | |
| | | | |
Net change in unrealized appreciation (depreciation) on unaffiliated investments | | | (50,524,215 | ) |
Net realized and unrealized gain (loss) on investments and foreign currency transactions | | | (17,661,754 | ) |
| | | | |
Net increase (decrease) in net assets resulting from operations | | $ | (7,580,690 | ) |
| | | | |
| (a) | Dividends recorded net of foreign withholding taxes in the amount of $14,690. |
| | | | | | |
The notes to the financial statements are an integral part of,
and should be read in conjunction with, the financial statements. | | | | | 27 | |
Statements of Changes in Net Assets
for the six months ended June 30, 2020 (Unaudited) and the year ended December 31, 2019
| | | | | | | | |
| | | 2020 | | | 2019 | |
| Increase (Decrease) in Net Assets | |
Operations: | | | | | | | | |
Net investment income (loss) | | $ | 10,081,064 | | | $ | 22,723,253 | |
Net realized gain (loss) on investments and foreign currency transactions | | | 32,862,461 | | | | 49,665,810 | |
Net change in unrealized appreciation (depreciation) on investments | | | (50,524,215 | ) | | | 178,045,019 | |
| | | | |
Net increase (decrease) in net assets resulting from operations | | | (7,580,690 | ) | | | 250,434,082 | |
| | | | |
Distributions to shareholders: | | | | | | | | |
Initial Class | | | — | | | | (28,182,304 | ) |
Service Class | | | — | | | | (60,334,066 | ) |
| | | | |
Total distributions to shareholders | | | — | | | | (88,516,370 | ) |
| | | | |
Capital share transactions: | | | | | | | | |
Net proceeds from sale of shares | | | 84,396,975 | | | | 126,141,088 | |
Net asset value of shares issued to shareholders in reinvestment of distributions | | | — | | | | 88,516,370 | |
Cost of shares redeemed | | | (111,150,578 | ) | | | (172,441,690 | ) |
| | | | |
Increase (decrease) in net assets derived from capital share transactions | | | (26,753,603 | ) | | | 42,215,768 | |
| | | | |
Net increase (decrease) in net assets | | | (34,334,293 | ) | | | 204,133,480 | |
| | |
| Net Assets | | | | | | | | |
Beginning of period | | | 1,323,892,543 | | | | 1,119,759,063 | |
| | | | |
End of period | | $ | 1,289,558,250 | | | $ | 1,323,892,543 | |
| | | | |
| | | | |
| 28 | | MainStay VP Janus Henderson Balanced Portfolio | | The notes to the financial statements are an integral part of,
and should be read in conjunction with, the financial statements. |
Financial Highlights selected per share data and ratios
| | | | | | | | | | | | | | | | | | | | | | | | | | | | |
| | | |
| | | Six months
ended
June 30, | | | | | | Year ended December 31, | |
| | | | | | | |
| Initial Class | | 2020* | | | | | | 2019 | | | 2018 | | | 2017 | | | 2016 | | | 2015 | |
| | | | | | | |
Net asset value at beginning of period | | $ | 14.04 | | | | | | | $ | 12.31 | | | $ | 13.18 | | | $ | 11.82 | | | $ | 12.11 | | | $ | 13.13 | |
| | | | | | | | | | | | | | | | | | | | | | | | | | | | |
| | | | | | | |
Net investment income (loss) (a) | | | 0.12 | | | | | | | | 0.27 | | | | 0.26 | | | | 0.25 | | | | 0.22 | | | | 0.24 | |
| | | | | | | |
Net realized and unrealized gain (loss) on investments | | | (0.16 | ) | | | | | | | 2.48 | | | | (0.14 | ) | | | 1.89 | | | | 0.32 | | | | (0.17 | ) |
| | | | | | | |
Net realized and unrealized gain (loss) on foreign currency transactions | | | (0.00 | )‡ | | | | | | | 0.00 | ‡ | | | (0.00 | )‡ | | | 0.00 | ‡ | | | 0.00 | ‡ | | | (0.00 | )‡ |
| | | | | | | | | | | | | | | | | | | | | | | | | | | | |
| | | | | | | |
Total from investment operations | | | (0.04 | ) | | | | | | | 2.75 | | | | 0.12 | | | | 2.14 | | | | 0.54 | | | | 0.07 | |
| | | | | | | | | | | | | | | | | | | | | | | | | | | | |
| | | | | | | |
| Less distributions: | | | | | | | | | | | | | | | | | | | | | | | | | | | | |
| | | | | | | |
From net investment income | | | — | | | | | | | | (0.25 | ) | | | (0.25 | ) | | | (0.23 | ) | | | (0.23 | ) | | | (0.25 | ) |
| | | | | | | |
From net realized gain on investments | | | — | | | | | | | | (0.77 | ) | | | (0.74 | ) | | | (0.55 | ) | | | (0.60 | ) | | | (0.84 | ) |
| | | | | | | | | | | | | | | | | | | | | | | | | | | | |
| | | | | | | |
Total distributions | | | — | | | | | | | | (1.02 | ) | | | (0.99 | ) | | | (0.78 | ) | | | (0.83 | ) | | | (1.09 | ) |
| | | | | | | | | | | | | | | | | | | | | | | | | | | | |
| | | | | | | |
Net asset value at end of period | | $ | 14.00 | | | | | | | $ | 14.04 | | | $ | 12.31 | | | $ | 13.18 | | | $ | 11.82 | | | $ | 12.11 | |
| | | | | | | | | | | | | | | | | | | | | | | | | | | | |
| | | | | | | |
Total investment return (b) | | | (0.28 | %)(c) | | | | | | | 22.93 | % | | | 0.42 | % | | | 18.35 | % | | | 4.70 | % | | | 0.70 | % |
| | | | | | | |
| Ratios (to average net assets)/Supplemental Data: | | | | | | | | | | | | | | | | | | | | | | | | | | | | |
| | | | | | | |
Net investment income (loss) | | | 1.78 | % †† | | | | | | | 2.01 | % | | | 1.93 | % | | | 1.95 | % | | | 1.87 | % | | | 1.84 | % |
| | | | | | | |
Net expenses (d) | | | 0.58 | % †† | | | | | | | 0.58 | % | | | 0.58 | % | | | 0.58 | % | | | 0.59 | % | | | 0.58 | % |
| | | | | | | |
Expenses (before waiver/reimbursement) (d) | | | 0.58 | % †† | | | | | | | 0.58 | % | | | 0.58 | %(e) | | | 0.58 | %(e) | | | 0.59 | % | | | 0.58 | % |
| | | | | | | |
Portfolio turnover rate | | | 74 | % (f) | | | | | | | 98 | %(f) | | | 132 | %(f) | | | 73 | %(f) | | | 74 | % | | | 76 | % |
| | | | | | | |
Net assets at end of period (in 000’s) | | $ | 380,124 | | | | | | | $ | 404,231 | | | $ | 371,106 | | | $ | 417,996 | | | $ | 401,219 | | | $ | 429,680 | |
| ‡ | Less than one cent per share. |
| (a) | Per share data based on average shares outstanding during the period. |
| (b) | Total return does not reflect any deduction of sales charges, mortality and expense charges, contract charges or administrative charges. For periods of less than one year, total return is not annualized. |
| (c) | Total investment return may reflect adjustments to conform to generally accepted accounting principles. |
| (d) | In addition to the fees and expenses which the Portfolio bears directly, it also indirectly bears a pro-rata share of the fees and expenses of the underlying funds in which it invests. Such indirect expenses are not included in the above expense ratios. |
| (e) | Expense waiver/reimbursement less than 0.01%. |
| (f) | The portfolio turnover rate not including mortgage dollar rolls were 69%, 93%, 103% and 66% for the six months ended June 30, 2020 and for the years ended December 31, 2019, 2018 and 2017, respectively. |
| | | | | | |
The notes to the financial statements are an integral part of,
and should be read in conjunction with, the financial statements. | | | | | 29 | |
Financial Highlights selected per share data and ratios
| | | | | | | | | | | | | | | | | | | | | | | | | | | | |
| | | |
| | | Six months
ended
June 30, | | | | | | Year ended December 31, | |
| | | | | | | |
| Service Class | | 2020* | | | | | | 2019 | | | 2018 | | | 2017 | | | 2016 | | | 2015 | |
| | | | | | | |
Net asset value at beginning of period | | $ | 13.94 | | | | | | | $ | 12.24 | | | $ | 13.11 | | | $ | 11.77 | | | $ | 12.06 | | | $ | 13.08 | |
| | | | | | | | | | | | | | | | | | | | | | | | | | | | |
| | | | | | | |
Net investment income (loss) (a) | | | 0.10 | | | | | | | | 0.24 | | | | 0.22 | | | | 0.22 | | | | 0.19 | | | | 0.21 | |
| | | | | | | |
Net realized and unrealized gain (loss) on investments | | | (0.15 | ) | | | | | | | 2.45 | | | | (0.13 | ) | | | 1.88 | | | | 0.32 | | | | (0.17 | ) |
| | | | | | | |
Net realized and unrealized gain (loss) on foreign currency transactions | | | (0.00 | )‡ | | | | | | | 0.00 | ‡ | | | (0.00 | )‡ | | | 0.00 | ‡ | | | 0.00 | ‡ | | | (0.00 | )‡ |
| | | | | | | | | | | | | | | | | | | | | | | | | | | | |
| | | | | | | |
Total from investment operations | | | (0.05 | ) | | | | | | | 2.69 | | | | 0.09 | | | | 2.10 | | | | 0.51 | | | | 0.04 | |
| | | | | | | | | | | | | | | | | | | | | | | | | | | | |
| | | | | | | |
| Less distributions: | | | | | | | | | | | | | | | | | | | | | | | | | | | | |
| | | | | | | |
From net investment income | | | — | | | | | | | | (0.22 | ) | | | (0.22 | ) | | | (0.21 | ) | | | (0.20 | ) | | | (0.22 | ) |
| | | | | | | |
From net realized gain on investments | | | — | | | | | | | | (0.77 | ) | | | (0.74 | ) | | | (0.55 | ) | | | (0.60 | ) | | | (0.84 | ) |
| | | | | | | | | | | | | | | | | | | | | | | | | | | | |
| | | | | | | |
Total distributions | | | — | | | | | | | | (0.99 | ) | | | (0.96 | ) | | | (0.76 | ) | | | (0.80 | ) | | | (1.06 | ) |
| | | | | | | | | | | | | | | | | | | | | | | | | | | | |
| | | | | | | |
Net asset value at end of period | | $ | 13.89 | | | | | | | $ | 13.94 | | | $ | 12.24 | | | $ | 13.11 | | | $ | 11.77 | | | $ | 12.06 | |
| | | | | | | | | | | | | | | | | | | | | | | | | | | | |
| | | | | | | |
Total investment return (b) | | | (0.36 | %) | | | | | | | 22.62 | % | | | 0.17 | % | | | 18.05 | % | | | 4.44 | % | | | 0.45 | % |
| | | | | | | |
| Ratios (to average net assets)/Supplemental Data: | | | | | | | | | | | | | | | | | | | | | | | | | | | | |
| | | | | | | |
Net investment income (loss) | | | 1.53 | % †† | | | | | | | 1.76 | % | | | 1.69 | % | | | 1.70 | % | | | 1.62 | % | | | 1.60 | % |
| | | | | | | |
Net expenses (c) | | | 0.83 | % †† | | | | | | | 0.83 | % | | | 0.83 | % | | | 0.83 | % | | | 0.84 | % | | | 0.83 | % |
| | | | | | | |
Expenses (before waiver/reimbursement) (c) | | | 0.83 | % †† | | | | | | | 0.83 | % | | | 0.83 | %(d) | | | 0.83 | %(d) | | | 0.84 | % | | | 0.83 | % |
| | | | | | | |
Portfolio turnover rate | | | 74 | % (e) | | | | | | | 98 | %(e) | | | 132 | %(e) | | | 73 | %(e) | | | 74 | % | | | 76 | % |
| | | | | | | |
Net assets at end of period (in 000’s) | | $ | 909,434 | | | | | | | $ | 919,661 | | | $ | 748,653 | | | $ | 730,439 | | | $ | 619,849 | | | $ | 591,626 | |
| ‡ | Less than one cent per share. |
| (a) | Per share data based on average shares outstanding during the period. |
| (b) | Total return does not reflect any deduction of sales charges, mortality and expense charges, contract charges or administrative charges. For periods of less than one year, total return is not annualized. |
| (c) | In addition to the fees and expenses which the Portfolio bears directly, it also indirectly bears a pro-rata share of the fees and expenses of the underlying funds in which it invests. Such indirect expenses are not included in the above expense ratios. |
| (d) | Expense waiver/reimbursement less than 0.01%. |
| (e) | The portfolio turnover rate not including mortgage dollar rolls were 69%, 93%, 103% and 66% for the six months ended June 30, 2020 and for the years ended December 31, 2019, 2018 and 2017, respectively. |
| | | | |
| 30 | | MainStay VP Janus Henderson Balanced Portfolio | | The notes to the financial statements are an integral part of,
and should be read in conjunction with, the financial statements. |
Notes to Financial Statements (Unaudited)
Note 1–Organization and Business
MainStay VP Funds Trust (the “Fund”) was organized as a Delaware statutory trust on February 1, 2011. The Fund is registered under the Investment Company Act of 1940, as amended (the “1940 Act”), as an open-end management investment company. The Fund is comprised of thirty-one separate series (collectively referred to as the “Portfolios”). These financial statements and notes relate to the MainStay VP Janus Henderson Balanced Portfolio (the “Portfolio”), a “diversified” portfolio, as that term is defined in the 1940 Act, as interpreted or modified by regulatory authorities having jurisdiction, from time to time.
Shares of the Portfolio are currently offered to certain separate accounts to fund variable annuity policies and variable universal life insurance policies issued by New York Life Insurance and Annuity Corporation (“NYLIAC”), a wholly-owned subsidiary of New York Life Insurance Company (“New York Life”) and may also be offered to fund variable annuity policies and variable universal life insurance policies issued by other insurance companies. NYLIAC allocates shares of the Portfolios to, among others, certain NYLIAC separate accounts. Shares of the Portfolio are also offered to the MainStay VP Conservative Allocation Portfolio, MainStay VP Moderate Allocation Portfolio, MainStay VP Moderate Growth Allocation Portfolio and MainStay VP Growth Allocation Portfolio, which operate as “funds-of-funds,” and other variable insurance funds.
The Portfolio currently offers two classes of shares. Initial Class and Service Class shares commenced operations on February 17, 2012. Shares of the Portfolio are offered and are redeemed at a price equal to their respective net asset value (“NAV”) per share. No sales or redemption charge is applicable to the purchase or redemption of the Portfolio’s shares. Under the terms of the Fund’s multiple class plan adopted pursuant to Rule 18f-3 under the 1940 Act, the classes differ in that, among other things, Service Class shares of the Portfolio pay a combined distribution and service fee of 0.25% of average daily net assets attributable to Service Class shares of the Portfolio to the Distributor (as defined in Note 3(B)) pursuant to a plan adopted in accordance with Rule 12b-1 under the 1940 Act. Contract owners of variable annuity contracts purchased after June 2, 2003, are permitted to invest only in the Service Class shares.
The Portfolio’s investment objective is to seek long-term capital growth, consistent with preservation of capital and balanced by current income.
Note 2–Significant Accounting Policies
The Portfolio is an investment company and accordingly follows the investment company accounting and reporting guidance of the Financial Accounting Standards Board (“FASB”) Accounting Standard Codification Topic 946 Financial Services—Investment Companies. The Portfolio prepares its financial statements in accordance with generally accepted accounting principles (“GAAP”) in the United States of America and follows the significant accounting policies described below.
(A) Securities Valuation. Investments are usually valued as of the close of regular trading on the New York Stock Exchange (the “Exchange”) (usually 4:00 p.m. Eastern time) on each day the Portfolio is open for business (“valuation date”).
The Board of Trustees of the Fund (the “Board”) adopted procedures establishing methodologies for the valuation of the Portfolio’s securities
and other assets and delegated the responsibility for valuation determinations under those procedures to the Valuation Committee of the Fund (the “Valuation Committee”). The procedures state that, subject to the oversight of the Board and unless otherwise noted, the responsibility for the day-to-day valuation of portfolio assets (including fair value measurements for the Portfolio’s assets and liabilities) rests with New York Life Investment Management LLC (“New York Life Investments” or the “Manager”), aided to whatever extent necessary by the Subadvisor (as defined in Note 3(A)). To assess the appropriateness of security valuations, the Manager, the Subadvisor or the Portfolio’s third-party service provider, who is subject to oversight by the Manager, regularly compares prior day prices, prices on comparable securities and the sale prices to the prior and current day prices and challenges prices with changes exceeding certain tolerance levels with third-party pricing services or broker sources.
The Board authorized the Valuation Committee to appoint a Valuation Subcommittee (the “Subcommittee”) to establish the prices of securities for which market quotations are not readily available or the prices of which are not otherwise readily determinable under the procedures. The Subcommittee meets (in person, via electronic mail or via teleconference) on an as-needed basis. The Valuation Committee meets to ensure that actions taken by the Subcommittee were appropriate.
For those securities valued through either a standardized fair valuation methodology or a fair valuation measurement, the Subcommittee deals with such valuation and the Valuation Committee reviews and affirms, if appropriate, the reasonableness of the valuation based on such methodologies and measurements on a regular basis after considering information that is reasonably available and deemed relevant by the Valuation Committee. Any action taken by the Subcommittee with respect to the valuation of a portfolio security or other asset is submitted for review and ratification (if appropriate) to the Valuation Committee and the Board at the next regularly scheduled meeting.
“Fair value” is defined as the price the Portfolio would reasonably expect to receive upon selling an asset or liability in an orderly transaction to an independent buyer in the principal or most advantageous market for the asset or liability. Fair value measurements are determined within a framework that establishes a three-tier hierarchy that maximizes the use of observable market data and minimizes the use of unobservable inputs to establish a classification of fair value measurements for disclosure purposes. “Inputs” refer broadly to the assumptions that market participants would use in pricing the asset or liability, including assumptions about risk, such as the risk inherent in a particular valuation technique used to measure fair value using a pricing model and/or the risk inherent in the inputs for the valuation technique. Inputs may be observable or unobservable. Observable inputs reflect the assumptions market participants would use in pricing the asset or liability based on market data obtained from sources independent of the Portfolio. Unobservable inputs reflect the Portfolio’s own assumptions about the assumptions market participants would use in pricing the asset or liability based on the information available. The inputs or methodology used for valuing assets or liabilities may not be an indication of the risks associated with investing in those assets or liabilities. The three-tier hierarchy of inputs is summarized below.
| • | | Level 1—quoted prices in active markets for an identical asset or liability |
Notes to Financial Statements (Unaudited) (continued)
| • | | Level 2—other significant observable inputs (including quoted prices for a similar asset or liability in active markets, interest rates and yield curves, prepayment speeds, credit risk, etc.) |
| • | | Level 3—significant unobservable inputs (including the Portfolio’s own assumptions about the assumptions that market participants would use in measuring fair value of an asset or liability) |
The level of an asset or liability within the fair value hierarchy is based on the lowest level of an input, both individually and in the aggregate, that is significant to the fair value measurement. The aggregate value by input level of the Portfolio’s assets and liabilities as of June 30, 2020 is included at the end of the Portfolio of Investments.
The Portfolio may use third-party vendor evaluations, whose prices may be derived from one or more of the following standard inputs, among others:
| | |
• Benchmark yields | | • Reported trades |
• Broker/dealer quotes | | • Issuer spreads |
• Two-sided markets | | • Benchmark securities |
• Bids/offers | | • Reference data (corporate actions or material event notices) |
• Industry and economic events | | • Comparable bonds |
• Monthly payment information | | |
An asset or liability for which market values cannot be measured using the methodologies described above is valued by methods deemed reasonable in good faith by the Valuation Committee, following the procedures established by the Board, to represent fair value. Under these procedures, the Portfolio generally uses a market-based approach which may use related or comparable assets or liabilities, recent transactions, market multiples, book values and other relevant information. The Portfolio may also use an income-based valuation approach in which the anticipated future cash flows of the asset or liability are discounted to calculate fair value. Discounts may also be applied due to the nature and/or duration of any restrictions on the disposition of the asset or liability. Fair value represents a good faith approximation of the value of a security. Fair value determinations involve the consideration of a number of subjective factors, an analysis of applicable facts and circumstances and the exercise of judgment. As a result, it is possible that the fair value for a security determined in good faith in accordance with the Portfolio’s valuation procedures may differ from valuations for the same security determined by other funds using their own valuation procedures. Although the Portfolio’s valuation procedures are designed to value a security at the price the Portfolio may reasonably expect to receive upon the security’s sale in an orderly transaction, there can be no assurance that any fair value determination thereunder would, in fact, approximate the amount that the Portfolio would actually realize upon the sale of the security or the price at which the security would trade if a reliable market price were readily available. During the six-month period ended June 30, 2020, there were no material changes to the fair value methodologies.
Securities which may be valued in this manner include, but are not limited to: (i) a security for which trading has been halted or suspended; (ii) a debt security that has recently gone into default and for which there is not a current market quotation; (iii) a security of an issuer that has entered into a restructuring; (iv) a security that has been delisted
from a national exchange; (v) a security for which the market price is not readily available from a third-party pricing source or, if so provided, does not, in the opinion of the Manager or the Subadvisor, reflect the security’s market value; (vi) a security subject to trading collars for which no or limited trading takes place; and (vii) a security whose principal market has been temporarily closed at a time when, under normal conditions, it would be open. Securities valued in this manner are generally categorized as Level 3 in the hierarchy. As of June 30, 2020, no securities held by the Portfolio were fair valued in such a manner.
Equity securities are valued at the last quoted sales prices as of the close of regular trading on the relevant exchange on each valuation date. Securities that are not traded on the valuation date are valued at the mean of the last quoted bid and ask prices. Prices are normally taken from the principal market in which each security trades. These securities are generally categorized as Level 1 in the hierarchy.
Investments in mutual funds, including money market funds, are valued at their respective NAVs as of the close of the Exchange on the valuation date. These securities are generally categorized as Level 1 in the hierarchy.
Debt securities (other than convertible and municipal bonds) are valued at the evaluated bid prices (evaluated mean prices in the case of convertible and municipal bonds) supplied by a pricing agent or broker selected by the Manager, in consultation with the Subadvisor. The evaluations are market-based measurements processed through a pricing application and represents the pricing agent’s good faith determination as to what a holder may receive in an orderly transaction under market conditions. The rules based logic utilizes valuation techniques that reflect participants’ assumptions and vary by asset class and per methodology, maximizing the use of relevant observable data including quoted prices for similar assets, benchmark yield curves and market corroborated inputs. The evaluated bid or mean prices are deemed by the Manager, in consultation with the Subadvisor, to be representative of market values at the regular close of trading of the Exchange on each valuation date. Debt securities purchased on a delayed delivery basis are marked to market daily until settlement at the forward settlement date. Debt securities, including corporate bonds, U.S. government and federal agency bonds, municipal bonds, foreign bonds, convertible bonds, asset-backed securities and mortgage-backed securities are generally categorized as Level 2 in the hierarchy.
Loan assignments, participations and commitments are valued at the average of bid quotations obtained from the engaged independent pricing service and are generally categorized as Level 2 in the hierarchy. Certain loan assignments, participations and commitments may be valued by utilizing significant unobservable inputs obtained from the pricing service and are generally categorized as Level 3 in the hierarchy. As of June 30, 2020, no securities held by the Portfolio were fair valued in such a manner.
Temporary cash investments acquired in excess of 60 days to maturity at the time of purchase are valued using the latest bid prices or using valuations based on a matrix system (which considers such factors as security prices, yields, maturities and ratings), both as furnished by independent pricing services. Temporary cash investments that mature in 60 days or less at the time of purchase (“Short-Term Investments”)
| | |
| 32 | | MainStay VP Janus Henderson Balanced Portfolio |
are valued using the amortized cost method of valuation, unless the use of such method would be inappropriate. The amortized cost method involves valuing a security at its cost on the date of purchase and thereafter assuming a constant amortization to maturity of the difference between such cost and the value on maturity date. Amortized cost approximates the current fair value of a security. Securities valued using the amortized cost method are not valued using quoted prices in an active market and are generally categorized as Level 2 in the hierarchy.
The information above is not intended to reflect an exhaustive list of the methodologies that may be used to value portfolio investments. The valuation procedures permit the use of a variety of valuation methodologies in connection with valuing portfolio investments. The methodology used for a specific type of investment may vary based on the market data available or other considerations. The methodologies summarized above may not represent the specific means by which portfolio investments are valued on any particular business day.
(B) Income Taxes. The Portfolio’s policy is to comply with the requirements of the Internal Revenue Code of 1986, as amended (the “Internal Revenue Code”), applicable to regulated investment companies and to distribute all of its taxable income to the shareholders of the Portfolio within the allowable time limits.
The Manager evaluates the Portfolio’s tax positions to determine if the tax positions taken meet the minimum recognition threshold in connection with accounting for uncertainties in income tax positions taken or expected to be taken for the purposes of measuring and recognizing tax liabilities in the financial statements. Recognition of tax benefits of an uncertain tax position is permitted only to the extent the position is “more likely than not” to be sustained assuming examination by taxing authorities. The Manager analyzed the Portfolio’s tax positions taken on federal, state and local income tax returns for all open tax years (for up to three tax years) and has concluded that no provisions for federal, state and local income tax are required in the Portfolio’s financial statements. The Portfolio’s federal, state and local income tax and federal excise tax returns for tax years for which the applicable statutes of limitations have not expired are subject to examination by the Internal Revenue Service and state and local departments of revenue.
(C) Dividends and Distributions to Shareholders. Dividends and distributions are recorded on the ex-dividend date. The Portfolio intends to declare and pay dividends from net investment income and distributions from net realized capital and currency gains, if any, at least annually. Unless a shareholder elects otherwise, all dividends and distributions are reinvested at NAV in the same class of shares of the Portfolio. Dividends and distributions to shareholders are determined in accordance with federal income tax regulations and may differ from determinations using GAAP.
(D) Security Transactions and Investment Income. The Portfolio records security transactions on the trade date. Realized gains and losses on security transactions are determined using the identified cost method. Dividend income is recognized on the ex-dividend date, net of any foreign tax withheld at the source, and interest income is accrued as earned using the effective interest rate method and includes any realized gains and losses from repayments of principal on mortgage-backed securities. Distributions received from real estate investment trusts may be classified as dividends, capital gains and/or
return of capital. Discounts and premiums on securities purchased for the Portfolio are accreted and amortized, respectively, on the effective interest rate method.
Investment income and realized and unrealized gains and losses on investments of the Portfolio are allocated pro rata to the separate classes of shares based upon their relative net assets on the date the income is earned or realized and unrealized gains and losses are incurred.
The Portfolio may place a debt security on non-accrual status and reduce related interest income by ceasing current accruals and writing off all or a portion of any interest receivables when the collection of all or a portion of such interest has become doubtful. A debt security is removed from non-accrual status when the issuer resumes interest payments or when collectability of interest is reasonably assured.
(E) Expenses. Expenses of the Fund are allocated to the individual Portfolios in proportion to the net assets of the respective Portfolios when the expenses are incurred, except where direct allocations of expenses can be made. Expenses (other than fees incurred under the distribution and service plans, further discussed in Note 3(B), which are charged directly to the Service Class shares) are allocated to separate classes of shares pro rata based upon their relative net assets on the date the expenses are incurred. The expenses borne by the Portfolio, including those of related parties to the Portfolio, are shown in the Statement of Operations.
Additionally, the Portfolio may invest in mutual funds, which are subject to management fees and other fees that may cause the costs of investing in mutual funds to be greater than the costs of owning the underlying securities directly. These indirect expenses of mutual funds are not included in the amounts shown as expenses in the Portfolio’s Statement of Operations or in the expense ratios included in the Financial Highlights.
(F) Use of Estimates. In preparing financial statements in conformity with GAAP, the Manager makes estimates and assumptions that affect the reported amounts and disclosures in the financial statements. Actual results could differ from those estimates.
(G) Repurchase Agreements. The Portfolio may enter into repurchase agreements (i.e., buy a security from another party with the agreement that it will be sold back in the future) to earn income. The Portfolio may enter into repurchase agreements only with counterparties, usually financial institutions, that are deemed by the Manager or the Subadvisor to be creditworthy, pursuant to guidelines established by the Board. During the term of any repurchase agreement, the Manager or the Subadvisor will continue to monitor the creditworthiness of the counterparty. Under the 1940 Act, repurchase agreements are considered to be collateralized loans by the Portfolio to the counterparty secured by the securities transferred to the Portfolio.
Repurchase agreements are subject to counterparty risk, meaning the Portfolio could lose money by the counterparty’s failure to perform under the terms of the agreement. The Portfolio mitigates this risk by ensuring the repurchase agreement is collateralized by cash, U.S. government securities, fixed income securities and/or other securities. The collateral is held by the Portfolio’s custodian and valued daily on a mark to market basis to determine if the value, including accrued
Notes to Financial Statements (Unaudited) (continued)
interest, exceeds the repurchase price. In the event of the counterparty’s default on the obligation to repurchase, the Portfolio has the right to liquidate the collateral and apply the proceeds in satisfaction of the obligation. Under certain circumstances, such as in the event of default or bankruptcy by the counterparty, realization and/or retention of the collateral may be limited or subject to delay, to legal proceedings and possible realized loss to the Portfolio. As of June 30, 2020, the Portfolio did not hold any repurchase agreements.
(H) Dollar Rolls. The Portfolio may enter into dollar roll transactions in which it sells mortgage-backed securities (“MBS”) from its portfolio to a counterparty from whom it simultaneously agrees to buy a similar security on a delayed delivery basis. The Portfolio generally transfers MBS where the MBS are “to be announced,” therefore, the Portfolio accounts for these transactions as purchases and sales.
When accounted for as purchase and sales, the securities sold in connection with the dollar rolls are removed from the portfolio and a realized gain or loss is recognized. The securities the Portfolio has agreed to acquire are included at market value in the Portfolio of Investments and liabilities for such purchase commitments are included as payables for investments purchased. During the roll period, the Portfolio foregoes principal and interest paid on the securities. The Portfolio is compensated by the difference between the current sales price and the forward price for the future as well as by the earnings on the cash proceeds of the initial sale. Dollar rolls may be renewed without physical delivery of the securities subject to the contract. The Portfolio maintains liquid assets from its portfolio having a value not less than the repurchase price, including accrued interest. Dollar roll transactions involve certain risks, including the risk that the securities returned to the Portfolio at the end of the roll period, while substantially similar, could be inferior to what was initially sold to the counterparty.
The Portfolio accounts for a dollar roll transaction as a purchase and sale whereby the difference in the sales price and purchase price of the security sold is recorded as a realized gain (loss). A Portfolio accounts for a dollar roll transaction as a purchase and sale whereby the difference in the sales price and purchase price of the security sold is recorded as a realized gain (loss).
(I) Loan Assignments, Participations and Commitments. The Portfolio may invest in loan assignments and participations (“loans”). Commitments are agreements to make money available to a borrower in a specified amount, at a specified rate and within a specified time. The Portfolio records an investment when the borrower withdraws money on a commitment or when a funded loan is purchased (trade date) and records interest as earned. These loans pay interest at rates that are periodically reset by reference to a base lending rate plus a spread. These base lending rates are generally the prime rate offered by a designated U.S. bank or the London Interbank Offered Rate (“LIBOR”).
The loans in which the Portfolio may invest are generally readily marketable, but may be subject to some restrictions on resale. For example, the Portfolio may be contractually obligated to receive approval from the agent bank and/or borrower prior to the sale of these investments. If the Portfolio purchases an assignment from a lender, the Portfolio will generally have direct contractual rights against the borrower in favor of the lender. If the Portfolio purchases a participation interest either from
a lender or a participant, the Portfolio typically will have established a direct contractual relationship with the seller of the participation interest, but not with the borrower. Consequently, the Portfolio is subject to the credit risk of the lender or participant who sold the participation interest to the Portfolio, in addition to the usual credit risk of the borrower. In the event that the borrower, selling participant or intermediate participants become insolvent or enter into bankruptcy, the Portfolio may incur certain costs and delays in realizing payment, or may suffer a loss of principal and/or interest.
Unfunded commitments represent the remaining obligation of the Portfolio to the borrower. At any point in time, up to the maturity date of the issue, the borrower may demand the unfunded portion. Unfunded amounts, if any, are marked to market and any unrealized gains or losses are recorded in the Statement of Assets and Liabilities. As of June 30, 2020, the Portfolio did not hold any unfunded commitments.
(J) Securities Lending. In order to realize additional income, the Portfolio may engage in securities lending, subject to the limitations set forth in the 1940 Act and relevant guidance by the staff of the Securities and Exchange Commission (“SEC”). If the Portfolio engages in securities lending, the Portfolio will lend through its custodian, currently State Street Bank and Trust Company (“State Street”), acting as securities lending agent on behalf of the Portfolio. Under the current arrangement, State Street will manage the Portfolio’s collateral in accordance with the securities lending agency agreement between the Portfolio and State Street, and indemnify the Portfolio against counterparty risk. The loans will be collateralized by cash (which may be invested in a money market fund) and/or non-cash collateral (which may include U.S. Treasury securities and/or U.S. government agency securities issued or guaranteed by the United States government or its agencies or instrumentalities) at least equal at all times to the market value of the securities loaned. The Portfolio bears the risk of delay in recovery of, or loss of rights in, the securities loaned. The Portfolio may also record a realized gain or loss on securities deemed sold due to a borrower’s inability to return securities on loan. The Portfolio bears the risk of any loss on investment of cash collateral. The Portfolio will receive compensation for lending its securities in the form of fees or it will retain a portion of interest earned on the investment of any cash collateral. The Portfolio will also continue to receive interest and dividends on the securities loaned and any gain or loss in the market price of the securities loaned that may occur during the term of the loan will be for the account of the Portfolio. Income earned from securities lending activities, if any, is reflected in the Statement of Operations. As of June 30, 2020, the Portfolio did not have any portfolio securities on loan.
(K) Debt Securities and Loan Risk. The ability of issuers of debt securities held by the Portfolio to meet their obligations may be affected by, among other things, economic or political developments in a specific country, industry or region. Debt securities are also subject to the risks associated with changes in interest rates.
The Portfolio may invest in high-yield debt securities (sometimes called “junk bonds”), which are generally considered speculative because they present a greater risk of loss, including default, than higher rated debt securities. These securities pay investors a premium—a higher interest rate or yield than investment grade debt securities—because of the increased risk of loss. These securities can also be subject to greater price volatility. In times of unusual or adverse market, economic or
| | |
| 34 | | MainStay VP Janus Henderson Balanced Portfolio |
political conditions, these securities may experience higher than normal default rates.
The Portfolio’s investments may include loans which are usually rated below investment grade and are generally considered speculative because they present a greater risk of loss, including default, than higher rated debt securities. These investments pay investors a higher interest rate than investment grade debt securities because of the increased risk of loss. Although certain loans are collateralized, there is no guarantee that the value of the collateral will be sufficient to repay the loan. In a recession or serious credit event, the value of these investments could decline significantly. As a result, the Portfolio’s NAVs could go down and you could lose money.
In addition, loans generally are subject to extended settlement periods that may be longer than seven days. As a result, the Portfolio may be adversely affected by selling other investments at an unfavorable time and/or under unfavorable conditions or engaging in borrowing transactions, such as borrowing against its credit facility, to raise cash to meet redemption obligations or pursue other investment opportunities.
The Portfolio may invest in foreign securities, both debt and equity securities, which carry certain risks that are in addition to the usual risks inherent in domestic securities. These risks include those resulting from currency fluctuations, future adverse political or economic developments and possible imposition of currency exchange blockages or other foreign governmental laws or restrictions. These risks are likely to be greater in emerging markets than in developed markets. The ability of issuers of securities held by the Portfolio to meet their obligations may be affected by, among other things, economic or political developments in a specific country, industry or region.
(L) LIBOR Replacement Risk. The Portfolio may invest in certain debt securities, derivatives or other financial instruments that utilize the LIBOR, as a “benchmark” or “reference rate” for various interest rate calculations. The United Kingdom Financial Conduct Authority, which regulates LIBOR, announced that after 2021 it will cease its active encouragement of banks to provide the quotations needed to sustain LIBOR. As a result, it is anticipated that LIBOR will be discontinued or will no longer be sufficiently robust to be representative of its underlying market around that time. Although financial regulators and industry working groups have suggested alternative reference rates, such as the European Interbank Offer Rate (“EURIBOR”), Sterling Overnight Interbank Average Rate (“SONIA”) and Secured Overnight Financing Rate (“SOFR”), there are challenges to converting certain contracts and transactions to a new benchmark and neither the full effects of the transition process nor its ultimate outcome is known.
The elimination of LIBOR or changes to other reference rates or any other changes or reforms to the determination or supervision of reference rates could have an adverse impact on the market for, or value of, any securities or payments linked to those reference rates, which may adversely affect the Portfolio’s performance and/or net asset value. Uncertainty and risk also remain regarding the willingness and ability of issuers and lenders to include revised provisions in new and existing contracts or instruments. Consequently, the transition away from LIBOR to other reference rates may lead to increased volatility and illiquidity in markets that are tied to LIBOR, fluctuations in values of LIBOR-related investments or investments in issuers that utilize LIBOR, increased difficulty in borrowing or refinancing and diminished effectiveness of
hedging strategies, adversely affecting the Portfolio’s performance. Furthermore, the risks associated with the expected discontinuation of LIBOR and transition may be exacerbated if the work necessary to effect an orderly transition to an alternative reference rate is not completed in a timely manner. Because the usefulness of LIBOR as a benchmark could deteriorate during the transition period, these effects could occur prior to the end of 2021.
(M) Indemnifications. Under the Fund’s organizational documents, its officers and trustees are indemnified against certain liabilities that may arise out of performance of their duties to the Fund. Additionally, in the normal course of business, the Portfolio enters into contracts with third-party service providers that contain a variety of representations and warranties and that may provide general indemnifications. The Portfolio’s maximum exposure under these arrangements is unknown, as this would involve future claims that may be made against the Portfolio that have not yet occurred. The Manager believes that the risk of loss in connection with these potential indemnification obligations is remote. However, there can be no assurance that material liabilities related to such obligations will not arise in the future, which could adversely impact the Portfolio.
Note 3–Fees and Related Party Transactions
(A) Manager and Subadvisor. New York Life Investments, a registered investment adviser and an indirect, wholly-owned subsidiary of New York Life, serves as the Portfolio’s Manager pursuant to an Amended and Restated Management Agreement (“Management Agreement”). The Manager provides offices, conducts clerical, recordkeeping and bookkeeping services, and keeps most of the financial and accounting records required to be maintained by the Portfolio. Except for the portion of salaries and expenses that are the responsibility of the Portfolio, the Manager pays the salaries and expenses of all personnel affiliated with the Portfolio and certain operational expenses of the Portfolio. The Portfolio reimburses New York Life Investments in an amount equal to the portion of the compensation of the Chief Compliance Officer attributable to the Portfolio. Janus Capital Management LLC (“Janus” or “Subadvisor”), a registered investment adviser and wholly- owned subsidiary of Janus Henderson Group PLC, doing business as Janus Henderson Investors, serves as Subadvisor to the Portfolio and is responsible for the day-to-day portfolio management of the Portfolio. Pursuant to the terms of a Subadvisory Agreement (“Subadvisory Agreement”) between New York Life Investments and Janus, New York Life Investments pays for the services of the Subadvisor.
The Fund, on behalf of the Portfolio, pays New York Life Investments in its capacity as the Portfolio’s investment manager and administrator, pursuant to the Management Agreement, a monthly fee for the services performed and the facilities furnished at an annual rate of the average daily net assets as follows: 0.55% up to $1 billion; 0.525% from $1 billion to $2 billion; and 0.515% in excess of $2 billion. During the six-month period ended June 30, 2020, the effective management fee rate was 0.54%.
During the six-month period ended June 30, 2020, New York Life Investments earned fees from the Portfolio in the amount of $3,424,823 and paid the Subadvisor in the amount of $1,596,533.
Notes to Financial Statements (Unaudited) (continued)
State Street provides sub-administration and sub-accounting services to the Portfolio pursuant to an agreement with New York Life Investments. These services include calculating the daily NAVs of the Portfolio, maintaining the general ledger and sub-ledger accounts for the calculation of the Portfolio’s NAVs and assisting New York Life Investments in conducting various aspects of the Portfolio’s administrative operations. For providing these services to the Portfolio, State Street is compensated by New York Life Investments.
Pursuant to an agreement between the Fund and New York Life Investments, New York Life Investments is responsible for providing or procuring certain regulatory reporting services for the Portfolio. The Portfolio will reimburse New York Life Investments for the actual costs incurred by New York Life Investments in connection with providing or procuring these services for the Portfolio.
(B) Distribution and Service Fees. The Fund, on behalf of the Portfolio, has entered into a distribution agreement with NYLIFE Distributors LLC (the “Distributor”), an indirect, wholly-owned subsidiary of New York Life. The Portfolio has adopted a distribution plan (the “Plan”) in accordance with the provisions of Rule 12b-1 under the 1940 Act. Under the Plan, the Distributor has agreed to provide, through its affiliates or independent third parties, various distribution-related, shareholder and administrative support services to the Service Class shareholders. For its services, the Distributor is entitled to a combined distribution and service fee accrued daily and paid monthly at an annual rate of 0.25% of the average daily net assets attributable to the Service Class shares of the Portfolio.
(C) Investments in Affiliates (in 000’s). During the six-month period ended June 30, 2020, purchases and sales transactions, income earned from investments and shares held of investment companies managed by New York Life Investments or its affiliates were as follows:
| | | | | | | | | | | | | | | | | | | | | | | | | | | | | | | | | | | | |
Affiliated Investment
Company | | Value,
Beginning
of Period | | | Purchases
at Cost | | | Proceeds
from
Sales | | | Net
Realized
Gain/(Loss)
on Sales | | | Change in
Unrealized
Appreciation/
(Depreciation) | | | Value,
End of
Period | | | Dividend
Income | | | Other
Distributions | | | Shares
End of
Period | |
MainStay U.S. Government Liquidity Fund | | $ | 19,877 | | | $ | 307,335 | | | $ | (297,158 | ) | | $ | — | | | $ | — | | | $ | 30,054 | | | $ | 76 | | | $ | — | | | | 30,054 | |
Note 4–Federal Income Tax
As of June 30, 2020, the cost and unrealized appreciation (depreciation) of the Portfolio’s investment portfolio, including applicable derivative contracts and other financial instruments, as determined on a federal income tax basis, was as follows:
| | | | | | | | | | | | | | | | |
| | | Federal Tax
Cost | | | Gross
Unrealized
Appreciation | | | Gross
Unrealized
(Depreciation) | | | Net
Unrealized
Appreciation/
(Depreciation) | |
| | | | |
Investments in Securities | | $ | 1,081,820,081 | | | $ | 251,236,363 | | | $ | (23,420,568 | ) | | $ | 227,815,795 | |
During the year ended December 31, 2019, the tax character of distributions paid as reflected in the Statements of Changes in Net Assets was as follows:
| | |
|
| 2019 |
Tax-Based
Distributions
from Ordinary
Income | | Tax-Based
Distributions
from Long-
Term Gains |
| |
| $20,457,199 | | $68,059,171 |
Note 5–Custodian
State Street is the custodian of cash and securities held by the Portfolio. Custodial fees are charged to the Portfolio based on the Portfolio’s net assets and/or the market value of securities held by the Portfolio and the number of certain transactions incurred by the Portfolio.
Note 6–Line of Credit
The Portfolio and certain other funds managed by New York Life Investments maintain a line of credit with a syndicate of banks in order to secure a source of funds for temporary purposes to meet unanticipated or excessive redemption requests.
Effective July 28, 2020, under the credit agreement (the “Credit Agreement”), the aggregate commitment amount is $600,000,000 with an additional uncommitted amount of $100,000,000. The commitment fee is an annual rate of 0.15% of the average commitment amount payable quarterly, regardless of usage, to JP Morgan Chase Bank NA, who serves as the agent to the syndicate. The commitment fee is allocated among the Portfolio and certain other funds managed by New York Life Investments based upon their respective net assets and other factors. Interest on any revolving credit loan is charged based upon the Federal Funds Rate or the one-month London Interbank Offered Rate (“LIBOR”), whichever is higher. The Credit Agreement expires on July 27, 2021, although the Portfolio, certain other funds managed by New York Life Investments and the syndicate of banks may renew the Credit Agreement for an additional year on the same or different terms or enter into a credit agreement with a different syndicate of banks. Prior to July 28, 2020, the aggregate commitment amount and the commitment fee were the same as those under the current Credit Agreement, but State Street Served as agent to the syndicate. As of June 30, 2020, there were no borrowings outstanding with respect to the Portfolio under the Credit Agreement or the credit agreement for which State Street served as agent.
Note 7–Interfund Lending Program
Pursuant to an exemptive order issued by the SEC, the Portfolio, along with certain other funds managed by New York Life Investments, may participate in an interfund lending program. The interfund lending program provides an alternative credit facility that permits the Portfolio
| | |
| 36 | | MainStay VP Janus Henderson Balanced Portfolio |
and certain other funds managed by New York Life Investments to lend or borrow money for temporary purposes directly to or from one another subject to the conditions of the exemptive order. During the six-month period ended June 30, 2020, there were no interfund loans made or outstanding with respect to the Portfolio.
Note 8–Purchases and Sales of Securities (in 000’s)
During the six-month period ended June 30, 2020, purchases and sales of U.S. government securities were $492,804 and $571,829, respectively. Purchases and sales of securities, other than U.S. government securities and short-term securities, were $444,788 and $362,068, respectively.
Note 9–Capital Share Transactions
Transactions in capital shares for the six-month period ended June 30, 2020 and the year ended December 31, 2019, were as follows:
| | | | | | | | |
Initial Class | | Shares | | | Amount | |
| | |
Six-month period ended June 30, 2020: | | | | | | | | |
Shares sold | | | 298,402 | | | $ | 4,056,536 | |
Shares redeemed | | | (1,950,564 | ) | | | (26,282,120 | ) |
| | | | |
Net increase (decrease) | | | (1,652,162 | ) | | $ | (22,225,584 | ) |
| | | | |
Year ended December 31, 2019: | | | | | | | | |
Shares sold | | | 606,484 | | | $ | 8,220,994 | |
Shares issued to shareholders in reinvestment of distributions | | | 2,152,552 | | | | 28,182,304 | |
Shares redeemed | | | (4,111,991 | ) | | | (55,709,208 | ) |
| | | | |
Net increase (decrease) | | | (1,352,955 | ) | | $ | (19,305,910 | ) |
| | | | |
| | |
| | | | | | | | |
Service Class | | Shares | | | Amount | |
Six-month period ended June 30, 2020: | | | | | | | | |
Shares sold | | | 5,978,920 | | | $ | 80,340,439 | |
Shares redeemed | | | (6,473,291 | ) | | | (84,868,458 | ) |
| | | | |
Net increase (decrease) | | | (494,371 | ) | | $ | (4,528,019 | ) |
| | | | |
Year ended December 31, 2019: | | | | | | | | |
Shares sold | | | 8,740,283 | | | $ | 117,920,094 | |
Shares issued to shareholders in reinvestment of distributions | | | 4,635,701 | | | | 60,334,066 | |
Shares redeemed | | | (8,608,975 | ) | | | (116,732,482 | ) |
| | | | |
Net increase (decrease) | | | 4,767,009 | | | $ | 61,521,678 | |
| | | | |
Note 10–Recent Accounting Pronouncement
In March 2020, the Financial Accounting Standards Board (“FASB”) issued Accounting Standards Update 2020-04 (“ASU 2020-04”), which provides optional guidance to ease the potential accounting burden associated with transitioning away from LIBOR and other reference rates that are expected to be discontinued. ASU 2020-04 is effective immediately upon release of the update on March 12, 2020 through December 31, 2022. At this time, the Manager is evaluating the implications of certain other provisions of ASU 2020-04 related to new disclosure requirements and any impact on the financial statement disclosures has not yet been determined.
Note 11–Subsequent Events
In connection with the preparation of the financial statements of the Portfolio as of and for the six-month period ended June 30, 2020, events and transactions subsequent to June 30, 2020, through the date the financial statements were issued have been evaluated by the Manager, for possible adjustment and/or disclosure. No subsequent events requiring financial statement adjustment or disclosure have been identified.
Note 12–Other Matters
An outbreak of COVID-19, first detected in December 2019, has developed into a global pandemic and has resulted in travel restrictions, closure of international borders, certain businesses and securities markets, restrictions on securities trading activities, prolonged quarantines, supply chain disruptions, and lower consumer demand, as well as general concern and uncertainty. The continued impact of COVID-19 is uncertain and could further adversely affect the global economy, national economies, individual issuers and capital markets in unforeseeable ways and result in a substantial and extended economic downturn. Developments that disrupt global economies and financial markets, such as COVID-19, may magnify factors that affect the Portfolio’s performance.
Discussion of the Operation and Effectiveness of the Portfolio’s Liquidity Risk
Management Program (Unaudited)
In compliance with Rule 22e-4 under the Investment Company Act of 1940, as amended (the “Liquidity Rule”), the Portfolio has adopted and implemented a liquidity risk management program (the “Program”), which New York Life Investment Management LLC believes is reasonably designed to assess and manage the Portfolio’s liquidity risk. The Board designated New York Life Investment Management LLC as administrator of the Program (the “Administrator”). The Administrator has established a Liquidity Risk Management Committee to assist the Administrator in the implementation and day-to-day administration of the Program and to otherwise support the Administrator in fulfilling its responsibilities under the Program.
At a meeting of the Board held on March 11, 2020, the Administrator provided the Board with a written report addressing the Program’s operation, adequacy and effectiveness of implementation for the period from December 1, 2018 through December 31, 2019, as required under the Liquidity Rule. The report noted that the Administrator concluded that (i) the Program operated effectively to assess and manage the Portfolio’s liquidity risk, (ii) the Program has been adequately and effectively implemented to monitor and, as applicable, respond to the Portfolio’s liquidity developments and (iii) the Portfolio’s investment strategy continues to be appropriate for an open-end portfolio.
In accordance with the Program, the Portfolio’s liquidity risk is assessed no less frequently than annually taking into consideration certain factors, as applicable, such as (i) investment strategy and liquidity of portfolio investments, (ii) short-term and long-term cash flow projections and (iii) holdings of cash and cash equivalents and borrowing arrangements and other funding sources. Certain factors are considered under both normal and reasonably foreseeable stressed conditions.
Each Portfolio portfolio investment is classified into one of four liquidity categories. The classification is based on a determination of the number of days it is reasonably expected to take to convert the investment into cash, or sell or dispose of the investment, in current market conditions without significantly changing the market value of the investment. The Administrator has delegated liquidity classification determinations to the Portfolio’s subadvisor, subject to appropriate oversight by the Administrator, and classification determinations are made by taking into account the Portfolio’s reasonably anticipated trade size, various market, trading and investment-specific considerations, as well as market depth, and, in certain cases, third-party vendor data.
The Liquidity Rule requires portfolios that do not primarily hold assets that are highly liquid investments to adopt a minimum amount of net assets that must be invested in highly liquid investments that are assets (an “HLIM”). In addition, the Liquidity Rule limits a portfolio’s investments in illiquid investments. Specifically, the Liquidity Rule prohibits acquisition of illiquid investments if doing so would result in a portfolio holding more than 15% of its net assets in illiquid investments that are assets. The Program includes provisions reasonably designed to determine, periodically review and comply with the HLIM requirement, as applicable, and to comply with the 15% limit on illiquid investments.
| | |
| 38 | | MainStay VP Janus Henderson Balanced Portfolio |
Proxy Voting Policies and Procedures and Proxy Voting Record
A description of the policies and procedures that New York Life Investments uses to vote proxies related to the Portfolio’s securities is available free of charge upon request (i) by calling 800-598-2019; (ii) by visiting New York Life Investments’ website at https://www.nylinvestments.com/mainstay/products-and-performance/mainstay-vp-funds-trust; or (iii) by visiting the SEC’s website at www.sec.gov.
The Portfolio is required to file with the SEC its proxy voting record for the 12-month period ending June 30 on Form N-PX. The Portfolio’s most recent Form N-PX or proxy voting record is available free of charge upon request (i) by calling 800-598-2019; (ii) by visiting New York Life Investments’ website at https://www.nylinvestments.com/mainstay/products-and-performance/mainstay-vp-funds-trust; or (iii) by visiting the SEC’s website at www.sec.gov.
Shareholder Reports and Quarterly Portfolio Disclosure
The Portfolio is required to file its complete schedule of portfolio holdings with the SEC 60 days after its first and third fiscal quarter on Form N-PORT. The Portfolio’s holdings report is available free of charge upon request by calling 800-598-2019 or by visiting the SEC’s website at www.sec.gov.
MainStay VP Portfolios
MainStay VP offers a wide range of Portfolios. The full array of MainStay VP offerings is listed here, with information about the manager, subadvisors, legal counsel, and independent registered public accounting firm.
Equity Portfolios
MainStay VP Emerging Markets Equity Portfolio
MainStay VP Epoch U.S. Equity Yield Portfolio
MainStay VP Fidelity Institutional AM® Utilities Portfolio†
MainStay VP MacKay Common Stock Portfolio
MainStay VP MacKay Growth Portfolio
MainStay VP MacKay International Equity Portfolio
MainStay VP MacKay Mid Cap Core Portfolio
MainStay VP MacKay S&P 500 Index Portfolio
MainStay VP MacKay Small Cap Core Portfolio
MainStay VP Mellon Natural Resources Portfolio
MainStay VP Small Cap Growth Portfolio
MainStay VP T. Rowe Price Equity Income Portfolio
MainStay VP Winslow Large Cap Growth Portfolio
Mixed Asset Portfolios
MainStay VP Balanced Portfolio
MainStay VP Income Builder Portfolio
MainStay VP Janus Henderson Balanced Portfolio
MainStay VP MacKay Convertible Portfolio
Income Portfolios
MainStay VP Bond Portfolio
MainStay VP Floating Rate Portfolio
MainStay VP Indexed Bond Portfolio
MainStay VP MacKay Government Portfolio
MainStay VP MacKay High Yield Corporate Bond Portfolio
MainStay VP MacKay Unconstrained Bond Portfolio
MainStay VP PIMCO Real Return Portfolio
Money Market
MainStay VP U.S. Government Money Market Portfolio
Alternative
MainStay VP CBRE Global Infrastructure Portfolio
MainStay VP IQ Hedge Multi-Strategy Portfolio
Asset Allocation Portfolios
MainStay VP Conservative Allocation Portfolio
MainStay VP Growth Allocation Portfolio
MainStay VP Moderate Allocation Portfolio
MainStay VP Moderate Growth Allocation Portfolio
Manager
New York Life Investment Management LLC
New York, New York
Subadvisors
Brown Advisory LLC
Baltimore, Maryland
Candriam Belgium S.A.*
Brussels, Belgium
CBRE Clarion Securities LLC
Radnor, Pennsylvania
Epoch Investment Partners, Inc.
New York, New York
FIAM LLC
Smithfield, Rhode Island
IndexIQ Advisors LLC*
New York, New York
Janus Capital Management LLC
Denver, Colorado
MacKay Shields LLC*
New York, New York
Mellon Investments Corporation
Boston, Massachusetts
NYL Investors LLC*
New York, New York
Pacific Investment Management Company LLC
Newport Beach, California
Segall Bryant & Hamill, LLC
Chicago, Illinois
T. Rowe Price Associates, Inc.
Baltimore, Maryland
Winslow Capital Management, LLC
Minneapolis, Minnesota
Distributor
NYLIFE Distributors LLC*
Jersey City, New Jersey
Custodian
State Street Bank and Trust Company
Boston, Massachusetts
Independent Registered Public Accounting Firm
PricewaterhouseCoopers LLP
New York, New York
Legal Counsel
Dechert LLP
Washington, District of Columbia
Some Portfolios may not be available in all products.
| † | Fidelity Institutional AM is a registered trade mark of FMR LLC. Used with permission. |
| * | An affiliate of New York Life Investment Management LLC |
Not part of the Semiannual Report
2020 Semiannnual Report
This report is for the general information of New York Life Variable Annuities and NYLIAC Variable Universal Life Insurance Products policyowners. It must be preceded or accompanied by the appropriate product(s) and funds prospectuses if it is given to anyone who is not an owner of a New York Life variable annuity policy or a NYLIAC Variable Universal Life Insurance Product. This report does not offer for sale or solicit orders to purchase securities.
The performance data quoted in this report represents past performance. Past performance is no guarantee of future results. Due to market volatility and other factors, current performance may be lower or higher than the figures shown. The most recent month-end performance summary for your variable annuity or variable life policy is available by calling 800-598-2019 and is updated periodically on www.newyorklife.com.
The New York Life Variable Annuities and NYLIAC Variable Universal Life Insurance Products are issued by New York Life Insurance and Annuity Corporation (a Delaware Corporation) and distributed by NYLIFE Distributors LLC (Member FINRA/SIPC).
New York Life Insurance Company
New York Life Insurance and Annuity Corporation (NYLIAC) (A Delaware Corporation)
51 Madison Avenue, Room 551
New York, NY 10010
www.newyorklife.com
Printed on recycled paper
nylinvestments.com
NYLIFE Distributors LLC, 30 Hudson Street, Jersey City, NJ 07302
New York Life Investment Management LLC is the investment manager to the MainStay VP Funds Trust
©2020 by NYLIFE Distributors LLC. All rights reserved.
You may obtain copies of the Prospectus and the Statement of Additional Information free of charge, upon request, by calling toll-free 800-598-2019 or writing to New York Life Insurance and Annuity Corporation,
51 Madison Avenue, New York, NY 10010.
| | | | |
| Not FDIC Insured | | No Bank Guarantee | | May Lose Value |
| | | | |
1781630 | | | | MSVPJB10-08/20 (NYLIAC) NI524 |
MainStay VP MacKay S&P 500 Index Portfolio
Message from the President and Semiannual Report
Unaudited | June 30, 2020
Beginning on January 1, 2021, as permitted by regulations adopted by the Securities and Exchange Commission, paper copies of the MainStay VP Portfolio annual and semi-annual shareholder reports may no longer be sent by mail, unless you specifically request paper copies of the reports from the insurance company that offers your policy. Instead, the reports will be made available online, and you will be notified by mail each time a report is posted and provided with a website link to access the report. Instructions for requesting paper copies will be provided by your insurance company.
If you already elected to receive shareholder reports electronically, you will not be affected by this change and you need not take any action. At any time, you may elect to receive reports and other communications from the insurance company electronically by following the instructions provided by the insurance company.
You may elect to receive all future shareholder reports in paper form free of charge. You can inform the insurance company that you wish to receive paper copies of reports by following the instructions provided by the insurance company. Your election to receive reports in paper form will apply to all portfolio companies available under your contract.
| | | | | | | | |
| Not FDIC/NCUA Insured | | Not a Deposit | | May Lose Value | | No Bank Guarantee | | Not Insured by Any Government Agency |

This page intentionally left blank
Message from the President
High levels of volatility shook financial markets in response to the COVID-19 pandemic and an abrupt decline in global economic activity during the six months ended June 30, 2020.
Markets entered 2020 riding strong fourth quarter performance and an economic expansion of historic longevity. Most broad stock and bond indices began to dip in late February as growing numbers of COVID-19 cases were seen in hotspots around the world. On March 11, 2020, the World Health Organization acknowledged that the disease had reached pandemic proportions, with over 80,000 identified cases in China, thousands in Italy, South Korea and the United States, and more in dozens of additional countries. Governments and central banks pledged trillions of dollars to address the mounting economic and public health crisis; however, “stay-at-home” orders and other restrictions on non-essential activity caused global economic activity to slow. Most stocks and bonds lost significant ground in this challenging environment, with equities declining by roughly a third and the yield on high-yield credit indices shooting higher.
Policymakers responded with extraordinary speed to address the situation. In the United States, the Federal Reserve (“Fed”) cut interest rates to near zero and announced unlimited quantitative easing. With help from Treasury, the Fed later rolled out a series of lending facilities to directly support market functioning. In late March, the Federal government declared a national emergency; Congress passed, and the President signed, a $2 trillion CARES Act (The Coronavirus Aid, Relief, and Economic Security Act), with the promise of further assistance for consumers and businesses to come. This enormous wave of policy support helped fuel a rapid recovery in market pricing as stocks bounced back and credit spreads narrowed. Some states rushed to ease restrictions on travel and social gatherings, further fueling optimism that the effects of the pandemic might prove short lived. However, the final weeks of the reporting period saw infection rates beginning to rise in some of the first states to reopen, raising concerns that a second round of restrictive government policies might prove necessary, once again stifling economic activity.
Despite all the market volatility, the broadly based S&P 500® Index finished the first half of 2020 only slightly below its starting point and the technology-heavy NASDAQ Composite Index posted gains, closing in near record territory. Small-cap stocks tended to trail their large cap counterparts, as illustrated by the Russell 2000® Index’s loss of approximately 15%, while value-oriented stocks lagged growth-oriented issues. From a global perspective, U.S. stocks generally outperformed international equities, with emerging markets hit particularly hard by the flight from risk.
Fixed-income markets also experienced unusually high levels of volatility. Recognized safe havens, such as U.S. government bonds, attracted increased investment, driving yields lower and prices higher, positioning long-term Treasury bonds to deliver particularly strong gains. Investment-grade corporate bonds lost value in March before recovering in the closing months of the reporting period, while relatively speculative high-yield credit faced the brunt of risk-off sentiment. Emerging market debt underperformed most other bonds types as investors sought to minimize currency and sovereign risks.
Today, as we at New York Life Investments continue to track the ongoing health crisis and its financial ramifications, we are particularly mindful of the people at the heart of our enterprise—our colleagues and valued clients. By taking appropriate steps to minimize community spread of COVID-19 within our organization, we strive to safeguard the health of our investment professionals so they can continue to provide you, as a MainStay investor, with world class investment solutions in this rapidly evolving environment.
Sincerely,

Kirk C. Lehneis
President
The opinions expressed are as of the date of this report and are subject to change. There is no guarantee that any forecast made will come to pass. This material does not constitute investment advice and is not intended as an endorsement of any specific investment. Past performance is no guarantee of future results.
Not part of the Semiannual Report
Table of Contents
Investors should refer to the Portfolio’s Summary Prospectus and/or Prospectus and consider the Portfolio’s investment objectives, strategies, risks, charges and expenses carefully before investing. The Summary Prospectus and/or Prospectus contain this and other information about the Portfolio. You may obtain copies of the Portfolio’s Summary Prospectus and/or the Prospectus and the Statement of Additional Information free of charge, upon request, by calling toll-free 800-598-2019, by writing to New York Life Insurance and Annuity Corporation, 51 Madison Avenue, Room 251, New York, New York 10010 or by sending an email to MainStayShareholdersServices@nylim.com. These documents are also available at nylinvestments.com/vpdocuments. Please read the Summary Prospectus and/or Prospectus carefully before investing. MainStay VP Funds Trust portfolios are separate account options which are purchased through a variable insurance or variable annuity contract.
Investment and Performance Comparison1 (Unaudited)
Performance data quoted represents past performance. Past performance is no guarantee of future results. Because of market volatility and other factors, current performance may be lower or higher than the figures shown. Investment return and principal value will fluctuate, and as a result, when shares are redeemed, they may be worth more or less than their original cost. The performance table and graph do not reflect any deduction of sales charges, mortality and expense charges, contract charges or administrative charges. Please refer to the Performance Summary appropriate for your policy. For performance information current to the most recent month-end, please call 800-598-2019 or visit www.newyorklife.com.
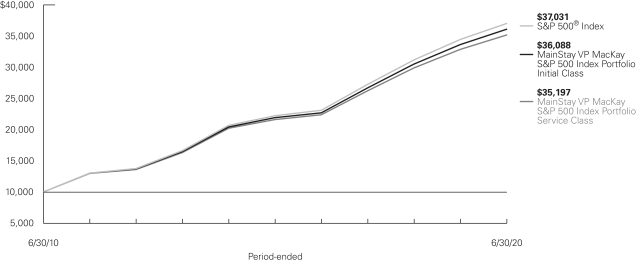
Average Annual Total Returns for the Period-Ended June 30, 2020
| | | | | | | | | | | | | | | | | | | | | | |
| Class | | Inception
Date | | Six Months | | | One Year | | | Five Years | | | Ten Years | | | Gross
Expense
Ratio2 | |
| | | | | | |
| Initial Class Shares | | 1/29/1993 | | | –3.13 | % | | | 7.35 | % | | | 10.48 | % | | | 13.69 | % | | | 0.19 | % |
| Service Class Shares | | 6/5/2003 | | | –3.25 | | | | 7.08 | | | | 10.21 | | | | 13.41 | | | | 0.44 | |
| | | | | | | | | | | | | | | | |
| Benchmark Performance | | Six
Months | | | One
Year | | | Five
Years | | | Ten
Years | |
| | | | |
S&P 500® Index3 | | | –3.08 | % | | | 7.51 | % | | | 10.73 | % | | | 13.99 | % |
Morningstar Large Blend Category Average4 | | | –5.48 | | | | 3.74 | | | | 8.35 | | | | 12.22 | |
| 1. | Performance figures may reflect certain fee waivers and/or expense limitations, without which total returns may have been different. For information on current fee waivers and/or expense limitations (if any), please refer to the Notes to Financial Statements. |
| 2. | The gross expense ratios presented reflect the Portfolio’s “Total Annual Portfolio Operating Expenses” from the most recent Prospectus, as supplemented, and may differ from other expense ratios disclosed in this report. |
| 3. | The S&P 500® Index is the Portfolio’s primary broad-based securities market index for comparison purposes. “S&P 500®” is a trademark of The McGraw-Hill Companies, Inc. The S&P 500® Index is widely regarded as the standard index for measuring large-cap U.S. stock market performance. |
| | Results assume reinvestment of all dividends and capital gains. An investment cannot be made directly in an index. |
| 4. | The Morningstar Large Blend Category Average is representative of funds that represent the overall U.S. stock market in size, growth rates and price. Stocks in the top 70% of the capitalization of the U.S. equity market are defined as large cap. The blend style is assigned to funds where neither growth nor value characteristics predominate. These funds tend to invest across the spectrum of U.S. industries, and owing to their broad exposure, the funds’ returns are often similar to those of the S&P 500 Index. Results are based on average total returns of similar funds with all dividends and capital gain distributions reinvested. |
|
Cost in Dollars of a $1,000 Investment in MainStay VP MacKay S&P 500 Index Portfolio (Unaudited) |
The example below is intended to describe the fees and expenses borne by shareholders during the six-month period from January 1, 2020, to June 30, 2020, and the impact of those costs on your investment.
Example
As a shareholder of the Portfolio you incur two types of costs: (1) transaction costs, including exchange fees and sales charges (loads) on purchases (as applicable), and (2) ongoing costs, including management fees, distribution and/or service (12b-1) fees, and other Portfolio expenses (as applicable). This example is intended to help you understand your ongoing costs (in dollars) of investing in the Portfolio and to compare these costs with the ongoing costs of investing in other mutual funds. The example is based on an investment of $1,000 made at the beginning of the six-month period and held for the entire period from January 1, 2020, to June 30, 2020. Shares are only sold in connection with variable life and annuity contracts and the example does not reflect any contract level or transactional fees or expenses. If these costs had been included, your costs would have been higher.
This example illustrates your Portfolio’s ongoing costs in two ways:
Actual Expenses
The second and third data columns in the table below provide information about actual account values and actual expenses. You may use the information in these columns, together with the amount you invested, to estimate the expenses that you paid during the six months
ended June 30, 2020. Simply divide your account value by $1,000 (for example, an $8,600 account value divided by $1,000 = 8.6), then multiply the result by the number under the heading entitled “Expenses Paid During Period” to estimate the expenses you paid on your account during this period.
Hypothetical Example for Comparison Purposes
The fourth and fifth data columns in the table below provide information about hypothetical account values and hypothetical expenses based on the Portfolio’s actual expense ratio and an assumed rate of return of 5% per year before expenses, which is not the Portfolio’s actual return. The hypothetical account values and expenses may not be used to estimate the actual ending account balances or expenses you paid for the six-month period shown. You may use this information to compare the ongoing costs of investing in the Portfolio with the ongoing costs of investing in other mutual funds. To do so, compare this 5% hypothetical example with the 5% hypothetical examples that appear in the shareholder reports of the other mutual funds.
Please note that the expenses shown in the table are meant to highlight your ongoing costs only and do not reflect any transactional costs, such as exchange fees or sales charges (loads). Therefore, the fourth and fifth data columns of the table are useful in comparing ongoing costs only and will not help you determine the relative total costs of owning different funds. In addition, if these transactional costs were included, your costs would have been higher.
| | | | | | | | | | | | | | | | | | | | | | |
| | | | | | | | | | | | | | | | | | |
| Share Class | | Beginning
Account
Value
1/1/20 | | | Ending Account
Value (Based
on Actual
Returns and
Expenses)
6/30/20 | | | Expenses
Paid
During
Period1 | | | Ending Account
Value (Based
on Hypothetical
5% Annualized
Return and
Actual Expenses)
6/30/20 | | | Expenses
Paid
During
Period1 | | | Net Expense
Ratio
During
Period2 |
| | | | | | |
| Initial Class Shares | | $ | 1,000.00 | | | $ | 968.70 | | | $ | 0.73 | | | $ | 1,024.12 | | | $ | 0.75 | | | 0.15% |
| | | | | | |
| Service Class Shares | | $ | 1,000.00 | | | $ | 967.50 | | | $ | 1.96 | | | $ | 1,022.87 | | | $ | 2.01 | | | 0.40% |
| 1 | Expenses are equal to the Portfolio’s annualized expense ratio of each class multiplied by the average account value over the period, divided by 366 and multiplied by 182 (to reflect the six-month period). The table above represents the actual expenses incurred during the six-month period. In addition to the fees and expenses which the Portfolio bears directly, it also indirectly bears a pro rata share of the fees and expenses of the underlying funds in which it invests. Such indirect expenses are not included in the above-reported expense figures. |
| 2 | Expenses are equal to the Portfolio’s annualized expense ratio to reflect the six-month period. |
| | |
| 6 | | MainStay VP MacKay S&P 500 Index Portfolio |
Industry Composition as of June 30, 2020 (Unaudited)
| | | | |
| |
| Software | | | 8.7 | % |
| |
| Technology Hardware, Storage & Peripherals | | | 5.6 | |
| |
| IT Services | | | 5.3 | |
| |
| Interactive Media & Services | | | 5.1 | |
| |
| Internet & Direct Marketing Retail | | | 4.6 | |
| |
| Semiconductors & Semiconductor Equipment | | | 4.4 | |
| |
| Pharmaceuticals | | | 4.0 | |
| |
| Health Care Equipment & Supplies | | | 3.5 | |
| |
| Banks | | | 3.4 | |
| |
| Equity Real Estate Investment Trusts | | | 2.6 | |
| |
| Health Care Providers & Services | | | 2.6 | |
| |
| Capital Markets | | | 2.5 | |
| |
| Oil, Gas & Consumable Fuels | | | 2.4 | |
| |
| Biotechnology | | | 2.3 | |
| |
| Specialty Retail | | | 2.2 | |
| |
| Entertainment | | | 1.9 | |
| |
| Electric Utilities | | | 1.8 | |
| |
| Insurance | | | 1.8 | |
| |
| Aerospace & Defense | | | 1.6 | |
| |
| Beverages | | | 1.6 | |
| |
| Chemicals | | | 1.6 | |
| |
| Diversified Telecommunication Services | | | 1.6 | |
| |
| Household Products | | | 1.6 | |
| |
| Food & Staples Retailing | | | 1.4 | |
| |
| Hotels, Restaurants & Leisure | | | 1.4 | |
| |
| Machinery | | | 1.4 | |
| |
| Diversified Financial Services | | | 1.3 | |
| |
| Media | | | 1.2 | |
| |
| Industrial Conglomerates | | | 1.1 | |
| |
| Life Sciences Tools & Services | | | 1.1 | |
| |
| Food Products | | | 1.0 | |
| |
| Communications Equipment | | | 0.9 | |
| |
| Multi-Utilities | | | 0.9 | |
| |
| Road & Rail | | | 0.9 | |
| | | | |
| |
| Tobacco | | | 0.7 | % |
| |
| Textiles, Apparel & Luxury Goods | | | 0.6 | |
| |
| Air Freight & Logistics | | | 0.5 | |
| |
| Electronic Equipment, Instruments & Components | | | 0.5 | |
| |
| Multiline Retail | | | 0.5 | |
| |
| Building Products | | | 0.4 | |
| |
| Commercial Services & Supplies | | | 0.4 | |
| |
| Consumer Finance | | | 0.4 | |
| |
| Electrical Equipment | | | 0.4 | |
| |
| Containers & Packaging | | | 0.3 | |
| |
| Household Durables | | | 0.3 | |
| |
| Metals & Mining | | | 0.3 | |
| |
| Professional Services | | | 0.3 | |
| |
| Airlines | | | 0.2 | |
| |
| Automobiles | | | 0.2 | |
| |
| Energy Equipment & Services | | | 0.2 | |
| |
| Personal Products | | | 0.2 | |
| |
| Trading Companies & Distributors | | | 0.2 | |
| |
| Wireless Telecommunication Services | | | 0.2 | |
| |
| Auto Components | | | 0.1 | |
| |
| Construction & Engineering | | | 0.1 | |
| |
| Construction Materials | | | 0.1 | |
| |
| Distributors | | | 0.1 | |
| |
| Health Care Technology | | | 0.1 | |
| |
| Real Estate Management & Development | | | 0.1 | |
| |
| Water Utilities | | | 0.1 | |
| |
| Diversified Consumer Services | | | 0.0 | ‡ |
| |
| Gas Utilities | | | 0.0 | ‡ |
| |
| Independent Power & Renewable Electricity Producers | | | 0.0 | ‡ |
| |
| Leisure Products | | | 0.0 | ‡ |
| |
| Short-Term Investment | | | 7.3 | |
| |
| Other Assets, Less Liabilities | | | –0.1 | |
| | | | |
| |
| | | 100.0 | % |
| | | | |
See Portfolio of Investments beginning on page XX for specific holdings within these categories. The Portfolio’s holdings are subject to change.
| ‡ | Less than one-tenth of a percent. |
Top Ten Holdings as of June 30, 2020 (excluding short-term investments) (Unaudited)
| 5. | Facebook, Inc., Class A |
| 7. | Berkshire Hathaway, Inc., Class B |
Portfolio Management Discussion and Analysis (Unaudited)
Answers to the questions reflect the views of portfolio managers Francis J. Ok and Lee Baker of MacKay Shields LLC, the Portfolio’s Subadvisor.
How did MainStay VP MacKay S&P 500 Index Portfolio perform relative to its benchmark and peers during the six months ended June 30, 2020?
For the six months ended June 30, 2020, MainStay VP MacKay S&P 500 Index Portfolio returned –3.13% for Initial Class shares and –3.25% for Service Class shares. Over the same period, both share classes underperformed the –3.08% return of the S&P 500® Index, which is the Portfolio’s benchmark. Although the Portfolio seeks investment results that correspond to the total return performance of common stocks in the aggregate as represented by the S&P 500® Index, the Portfolio’s net performance will typically lag that of the Index because the Portfolio incurs operating expenses that the Index does not. For the six months ended June 30, 2020, both share classes outperformed the –5.48% return of the Morningstar Large Blend Category Average.1
During the reporting period, how was the Portfolio’s performance materially affected by investments in derivatives?
The Portfolio invests in futures contracts to provide an efficient means of maintaining liquidity while remaining fully invested in the market. Derivatives had a positive impact on the Portfolio’s performance.
During the reporting period, which S&P 500® industries had the highest total returns and which industries had the lowest total returns?
The S&P 500® industry groups with highest total returns during the reporting period included Internet & direct marketing retail, wireless telecommunication services and software. During the same period, the S&P 500® industry groups that had the lowest total returns were energy equipment & services, airlines and diversified consumer services.
During the reporting period, which S&P 500® industries made the strongest positive contributions to the Portfolio’s absolute performance and which industries made the weakest contributions?
The S&P 500® industries that made the strongest positive contributions to the Portfolio’s absolute performance during the reporting period included software, internet & catalog retail, and technology hardware, storage & peripherals. (Contributions take weightings and total returns into account.) During the same period, the S&P 500® industries that made the weakest contributions to the Portfolio’s absolute performance included banks, oil, gas & consumable fuels, and aerospace & defense.
During the reporting period, which individual stocks in the S&P 500® Index had the highest total returns and which individual stocks had the lowest total returns?
The S&P 500® stocks with the highest total returns during the reporting period were video-oriented semiconductor maker NVIDIA, digital payments company PayPal and online retailer Amazon.com. Conversely, the S&P® 500 stocks with the lowest total returns over the same period were diversified financial services company Wells Fargo, aerospace & defense contractor Raytheon Technology, and aircraft maker Boeing.
During the reporting period, which S&P 500® stocks made the strongest positive contributions to the Portfolio’s absolute performance and which S&P 500® stocks made the weakest contributions?
The strongest positive contributors to the Portfolio’s absolute performance during the reporting period included Amazon.com, software developer Microsoft and consumer electronics maker Apple. During the same period, the S&P 500® stocks that made the weakest contributions to the Portfolio’s absolute performance were diversified financial company JPMorgan Chase, Wells Fargo and diversified conglomerate Berkshire Hathaway.
Were there any changes in the S&P 500® Index during the reporting period?
During the reporting period, there were 10 additions to, and 10 deletions from, the S&P 500® Index.
| 1. | See page 5 for more information on benchmark and peer group returns. |
The opinions expressed are those of the portfolio managers as of the date of this report and are subject to change. There is no guarantee that any forecasts will come to pass. This material does not constitute investment advice and is not intended as an endorsement of any specific investment.
Not all MainStay VP Portfolios and/or share classes are available under all policies.
| | |
| 8 | | MainStay VP MacKay S&P 500 Index Portfolio |
Portfolio of Investments June 30, 2020 (Unaudited)
| | | | | | | | |
| | |
| | | Shares | | | Value | |
| | | | | | | | |
| Common Stocks 92.8%† | |
Aerospace & Defense 1.6% | |
Boeing Co. | | | 51,090 | | | $ | 9,364,797 | |
General Dynamics Corp. | | | 22,164 | | | | 3,312,631 | |
Howmet Aerospace, Inc. | | | 36,695 | | | | 581,616 | |
Huntington Ingalls Industries, Inc. | | | 3,915 | | | | 683,128 | |
L3Harris Technologies, Inc. | | | 20,572 | | | | 3,490,451 | |
Lockheed Martin Corp. | | | 23,540 | | | | 8,590,217 | |
Northrop Grumman Corp. | | | 14,774 | | | | 4,542,119 | |
Raytheon Technologies Corp. | | | 140,163 | | | | 8,636,844 | |
Teledyne Technologies, Inc. (a) | | | 3,494 | | | | 1,086,459 | |
Textron, Inc. | | | 21,795 | | | | 717,274 | |
TransDigm Group, Inc. | | | 4,792 | | | | 2,118,304 | |
| | | | | | | | |
| | | | | | | 43,123,840 | |
| | | | | | | | |
Air Freight & Logistics 0.5% | | | | | | | | |
C.H. Robinson Worldwide, Inc. | | | 12,823 | | | | 1,013,786 | |
Expeditors International of Washington, Inc. | | | 16,171 | | | | 1,229,643 | |
FedEx Corp. | | | 22,735 | | | | 3,187,902 | |
United Parcel Service, Inc., Class B | | | 67,101 | | | | 7,460,289 | |
| | | | | | | | |
| | | | | | | 12,891,620 | |
| | | | | | | | |
Airlines 0.2% | | | | | | | | |
Alaska Air Group, Inc. | | | 11,678 | | | | 423,444 | |
American Airlines Group, Inc. (b) | | | 40,814 | | | | 533,439 | |
Delta Air Lines, Inc. | | | 54,809 | | | | 1,537,393 | |
Southwest Airlines Co. | | | 51,112 | | | | 1,747,008 | |
United Airlines Holdings, Inc. (a) | | | 24,080 | | | | 833,409 | |
| | | | | | | | |
| | | | | | | 5,074,693 | |
| | | | | | | | |
Auto Components 0.1% | | | | | | | | |
Aptiv PLC | | | 24,814 | | | | 1,933,507 | |
BorgWarner, Inc. | | | 19,563 | | | | 690,574 | |
| | | | | | | | |
| | | | | | | 2,624,081 | |
| | | | | | | | |
Automobiles 0.2% | | | | | | | | |
Ford Motor Co. | | | 371,175 | | | | 2,256,744 | |
General Motors Co. | | | 120,014 | | | | 3,036,354 | |
| | | | | | | | |
| | | | | | | 5,293,098 | |
| | | | | | | | |
Banks 3.4% | | | | | | | | |
Bank of America Corp. | | | 743,355 | | | | 17,654,681 | |
Citigroup, Inc. | | | 198,393 | | | | 10,137,882 | |
Citizens Financial Group, Inc. | | | 41,379 | | | | 1,044,406 | |
Comerica, Inc. | | | 13,721 | | | | 522,770 | |
Fifth Third Bancorp | | | 67,547 | | | | 1,302,306 | |
First Republic Bank | | | 16,341 | | | | 1,731,983 | |
Huntington Bancshares, Inc. | | | 98,299 | | | | 888,132 | |
JPMorgan Chase & Co. | | | 290,376 | | | | 27,312,767 | |
KeyCorp | | | 93,752 | | | | 1,141,899 | |
M&T Bank Corp. | | | 12,224 | | | | 1,270,929 | |
People’s United Financial, Inc. | | | 41,390 | | | | 478,882 | |
PNC Financial Services Group, Inc. | | | 40,431 | | | | 4,253,746 | |
Regions Financial Corp. | | | 91,817 | | | | 1,021,005 | |
| | | | | | | | |
| | |
| | | Shares | | | Value | |
| | | | | | | | |
Banks (continued) | | | | | | | | |
SVB Financial Group (a) | | | 4,882 | | | $ | 1,052,217 | |
Truist Financial Corp. | | | 128,412 | | | | 4,821,871 | |
U.S. Bancorp | | | 130,628 | | | | 4,809,723 | |
Wells Fargo & Co. | | | 355,558 | | | | 9,102,285 | |
Zions Bancorp., N.A. | | | 15,742 | | | | 535,228 | |
| | | | | | | | |
| | | | | | | 89,082,712 | |
| | | | | | | | |
Beverages 1.6% | | | | | | | | |
Brown-Forman Corp., Class B | | | 17,242 | | | | 1,097,626 | |
Coca-Cola Co. | | | 368,483 | | | | 16,463,820 | |
Constellation Brands, Inc., Class A | | | 16,006 | | | | 2,800,250 | |
Molson Coors Beverage Co., Class B | | | 17,794 | | | | 611,402 | |
Monster Beverage Corp. (a) | | | 35,627 | | | | 2,469,663 | |
PepsiCo., Inc. | | | 132,227 | | | | 17,488,343 | |
| | | | | | | | |
| | | | | | | 40,931,104 | |
| | | | | | | | |
Biotechnology 2.3% | | | | | | | | |
AbbVie, Inc. | | | 167,948 | | | | 16,489,134 | |
Alexion Pharmaceuticals, Inc. (a) | | | 21,233 | | | | 2,383,192 | |
Amgen, Inc. | | | 56,059 | | | | 13,222,076 | |
Biogen, Inc. (a) | | | 15,551 | | | | 4,160,670 | |
Gilead Sciences, Inc. | | | 119,504 | | | | 9,194,638 | |
Incyte Corp. (a) | | | 17,194 | | | | 1,787,660 | |
Regeneron Pharmaceuticals, Inc. (a) | | | 9,612 | | | | 5,994,524 | |
Vertex Pharmaceuticals, Inc. (a) | | | 24,709 | | | | 7,173,270 | |
| | | | | | | | |
| | | | | | | 60,405,164 | |
| | | | | | | | |
Building Products 0.4% | | | | | | | | |
A.O. Smith Corp. | | | 13,103 | | | | 617,413 | |
Allegion PLC | | | 8,844 | | | | 904,034 | |
Carrier Global Corp. | | | 77,239 | | | | 1,716,251 | |
Fortune Brands Home & Security, Inc. | | | 13,249 | | | | 847,009 | |
Johnson Controls International PLC | | | 70,422 | | | | 2,404,207 | |
Masco Corp. | | | 25,135 | | | | 1,262,028 | |
Trane Technologies PLC | | | 22,879 | | | | 2,035,773 | |
| | | | | | | | |
| | | | | | | 9,786,715 | |
| | | | | | | | |
Capital Markets 2.5% | | | | | | | | |
Ameriprise Financial, Inc. | | | 11,659 | | | | 1,749,316 | |
Bank of New York Mellon Corp. | | | 76,890 | | | | 2,971,799 | |
BlackRock, Inc. | | | 14,701 | | | | 7,998,667 | |
Cboe Global Markets, Inc. | | | 10,577 | | | | 986,623 | |
Charles Schwab Corp. | | | 108,545 | | | | 3,662,308 | |
CME Group, Inc. | | | 34,110 | | | | 5,544,239 | |
E*TRADE Financial Corp. | | | 21,481 | | | | 1,068,250 | |
Franklin Resources, Inc. | | | 26,710 | | | | 560,109 | |
Goldman Sachs Group, Inc. | | | 29,495 | | | | 5,828,802 | |
Intercontinental Exchange, Inc. | | | 52,149 | | | | 4,776,848 | |
Invesco, Ltd. | | | 35,427 | | | | 381,195 | |
MarketAxess Holdings, Inc. | | | 3,578 | | | | 1,792,292 | |
Moody’s Corp. | | | 15,412 | | | | 4,234,139 | |
Morgan Stanley | | | 114,235 | | | | 5,517,550 | |
MSCI, Inc. | | | 8,102 | | | | 2,704,610 | |
Nasdaq, Inc. | | | 10,919 | | | | 1,304,493 | |
| | | | | | |
The notes to the financial statements are an integral part of,
and should be read in conjunction with, the financial statements. | | | | | 9 | |
Portfolio of Investments June 30, 2020 (Unaudited) (continued)
| | | | | | | | |
| | |
| | | Shares | | | Value | |
| | | | | | | | |
| Common Stocks (continued) | |
Capital Markets (continued) | | | | | | | | |
Northern Trust Corp. | | | 19,827 | | | $ | 1,573,074 | |
Raymond James Financial, Inc. | | | 11,705 | | | | 805,655 | |
S&P Global, Inc. | | | 22,957 | | | | 7,563,872 | |
State Street Corp. | | | 33,815 | | | | 2,148,943 | |
T. Rowe Price Group, Inc. | | | 21,574 | | | | 2,664,389 | |
| | | | | | | | |
| | | | | | | 65,837,173 | |
| | | | | | | | |
Chemicals 1.6% | | | | | | | | |
Air Products & Chemicals, Inc. | | | 21,047 | | | | 5,082,009 | |
Albemarle Corp. | | | 10,039 | | | | 775,111 | |
Celanese Corp. | | | 11,506 | | | | 993,428 | |
CF Industries Holdings, Inc. | | | 20,679 | | | | 581,907 | |
Corteva, Inc. (a) | | | 70,940 | | | | 1,900,483 | |
Dow, Inc. (a) | | | 70,398 | | | | 2,869,423 | |
DuPont de Nemours, Inc. | | | 69,930 | | | | 3,715,381 | |
Eastman Chemical Co. | | | 12,975 | | | | 903,579 | |
Ecolab, Inc. | | | 23,567 | | | | 4,688,655 | |
FMC Corp. | | | 12,353 | | | | 1,230,606 | |
International Flavors & Fragrances, Inc. | | | 10,114 | | | | 1,238,560 | |
Linde PLC | | | 50,049 | | | | 10,615,893 | |
LyondellBasell Industries N.V., Class A | | | 24,449 | | | | 1,606,788 | |
Mosaic Co. | | | 33,614 | | | | 420,511 | |
PPG Industries, Inc. | | | 22,383 | | | | 2,373,941 | |
Sherwin-Williams Co. | | | 7,701 | | | | 4,450,023 | |
| | | | | | | | |
| | | | | | | 43,446,298 | |
| | | | | | | | |
Commercial Services & Supplies 0.4% | | | | | | | | |
Cintas Corp. | | | 7,980 | | | | 2,125,553 | |
Copart, Inc. (a) | | | 19,689 | | | | 1,639,503 | |
Republic Services, Inc. | | | 20,051 | | | | 1,645,184 | |
Rollins, Inc. | | | 13,340 | | | | 565,483 | |
Waste Management, Inc. | | | 36,971 | | | | 3,915,599 | |
| | | | | | | | |
| | | | | | | 9,891,322 | |
| | | | | | | | |
Communications Equipment 0.9% | | | | | | | | |
Arista Networks, Inc. (a) | | | 5,155 | | | | 1,082,705 | |
Cisco Systems, Inc. | | | 404,149 | | | | 18,849,509 | |
F5 Networks, Inc. (a) | | | 5,697 | | | | 794,617 | |
Juniper Networks, Inc. | | | 31,859 | | | | 728,297 | |
Motorola Solutions, Inc. | | | 16,308 | | | | 2,285,240 | |
| | | | | | | | |
| | | | | | | 23,740,368 | |
| | | | | | | | |
Construction & Engineering 0.1% | | | | | | | | |
Jacobs Engineering Group, Inc. | | | 12,399 | | | | 1,051,435 | |
Quanta Services, Inc. | | | 13,470 | | | | 528,428 | |
| | | | | | | | |
| | | | | | | 1,579,863 | |
| | | | | | | | |
Construction Materials 0.1% | | | | | | | | |
Martin Marietta Materials, Inc. | | | 5,915 | | | | 1,221,862 | |
Vulcan Materials Co. | | | 12,531 | | | | 1,451,716 | |
| | | | | | | | |
| | | | | | | 2,673,578 | |
| | | | | | | | |
| | | | | | | | |
| | |
| | | Shares | | | Value | |
| | | | | | | | |
Consumer Finance 0.4% | | | | | | | | |
American Express Co. | | | 62,904 | | | $ | 5,988,461 | |
Capital One Financial Corp. | | | 43,642 | | | | 2,731,553 | |
Discover Financial Services | | | 29,190 | | | | 1,462,127 | |
Synchrony Financial | | | 51,176 | | | | 1,134,060 | |
| | | | | | | | |
| | | | | | | 11,316,201 | |
| | | | | | | | |
Containers & Packaging 0.3% | | | | | | | | |
Amcor PLC (a) | | | 150,041 | | | | 1,531,919 | |
Avery Dennison Corp. | | | 7,975 | | | | 909,868 | |
Ball Corp. | | | 31,138 | | | | 2,163,780 | |
International Paper Co. | | | 37,211 | | | | 1,310,199 | |
Packaging Corp. of America | | | 8,966 | | | | 894,807 | |
Sealed Air Corp. | | | 14,637 | | | | 480,825 | |
WestRock Co. | | | 24,379 | | | | 688,950 | |
| | | | | | | | |
| | | | | | | 7,980,348 | |
| | | | | | | | |
Distributors 0.1% | | | | | | | | |
Genuine Parts Co. | | | 13,837 | | | | 1,203,266 | |
LKQ Corp. (a) | | | 29,191 | | | | 764,804 | |
| | | | | | | | |
| | | | | | | 1,968,070 | |
| | | | | | | | |
Diversified Consumer Services 0.0%‡ | |
H&R Block, Inc. | | | 19,000 | | | | 271,320 | |
| | | | | | | | |
| | |
Diversified Financial Services 1.3% | | | | | | | | |
Berkshire Hathaway, Inc., Class B (a) | | | 185,263 | | | | 33,071,298 | |
| | | | | | | | |
| |
Diversified Telecommunication Services 1.6% | | | | | |
AT&T, Inc. | | | 679,072 | | | | 20,528,346 | |
CenturyLink, Inc. | | | 92,992 | | | | 932,710 | |
Verizon Communications, Inc. | | | 394,344 | | | | 21,740,185 | |
| | | | | | | | |
| | | | | | | 43,201,241 | |
| | | | | | | | |
Electric Utilities 1.8% | | | | | | | | |
Alliant Energy Corp. | | | 23,356 | | | | 1,117,351 | |
American Electric Power Co., Inc. | | | 47,228 | | | | 3,761,238 | |
Duke Energy Corp. | | | 70,030 | | | | 5,594,697 | |
Edison International | | | 36,017 | | | | 1,956,083 | |
Entergy Corp. | | | 18,835 | | | | 1,766,911 | |
Evergy, Inc. | | | 21,692 | | | | 1,286,119 | |
Eversource Energy | | | 32,034 | | | | 2,667,471 | |
Exelon Corp. | | | 92,860 | | | | 3,369,889 | |
FirstEnergy Corp. | | | 51,151 | | | | 1,983,636 | |
NextEra Energy, Inc. | | | 46,644 | | | | 11,202,490 | |
NRG Energy, Inc. | | | 23,961 | | | | 780,170 | |
Pinnacle West Capital Corp. | | | 10,638 | | | | 779,659 | |
PPL Corp. | | | 73,275 | | | | 1,893,426 | |
Southern Co. | | | 100,631 | | | | 5,217,717 | |
Xcel Energy, Inc. | | | 49,672 | | | | 3,104,500 | |
| | | | | | | | |
| | | | | | | 46,481,357 | |
| | | | | | | | |
| | | | |
| 10 | | MainStay VP MacKay S&P 500 Index Portfolio | | The notes to the financial statements are an integral part of,
and should be read in conjunction with, the financial statements. |
| | | | | | | | |
| | |
| | | Shares | | | Value | |
| | | | | | | | |
| Common Stocks (continued) | |
Electrical Equipment 0.4% | | | | | | | | |
AMETEK, Inc. | | | 21,864 | | | $ | 1,953,986 | |
Eaton Corp. PLC | | | 38,119 | | | | 3,334,650 | |
Emerson Electric Co. | | | 56,938 | | | | 3,531,864 | |
Rockwell Automation, Inc. | | | 11,079 | | | | 2,359,827 | |
| | | | | | | | |
| | | | | | | 11,180,327 | |
| | | | | | | | |
Electronic Equipment, Instruments & Components 0.5% | |
Amphenol Corp., Class A | | | 28,425 | | | | 2,723,399 | |
CDW Corp. | | | 13,731 | | | | 1,595,268 | |
Corning, Inc. | | | 73,207 | | | | 1,896,061 | |
FLIR Systems, Inc. | | | 12,843 | | | | 521,040 | |
IPG Photonics Corp. (a) | | | 3,375 | | | | 541,316 | |
Keysight Technologies, Inc. (a) | | | 17,769 | | | | 1,790,760 | |
TE Connectivity, Ltd. | | | 31,434 | | | | 2,563,443 | |
Zebra Technologies Corp., Class A (a) | | | 5,119 | | | | 1,310,208 | |
| | | | | | | | |
| | | | | | | 12,941,495 | |
| | | | | | | | |
Energy Equipment & Services 0.2% | | | | | | | | |
Baker Hughes Co. | | | 61,457 | | | | 945,823 | |
Halliburton Co. | | | 82,980 | | | | 1,077,080 | |
National Oilwell Varco, Inc. | | | 36,554 | | | | 447,787 | |
Schlumberger, Ltd. | | | 132,256 | | | | 2,432,188 | |
TechnipFMC PLC | | | 39,757 | | | | 271,938 | |
| | | | | | | | |
| | | | | | | 5,174,816 | |
| | | | | | | | |
Entertainment 1.9% | |
Activision Blizzard, Inc. | | | 73,426 | | | | 5,573,033 | |
Electronic Arts, Inc. (a) | | | 27,512 | | | | 3,632,960 | |
Live Nation Entertainment, Inc. (a) | | | 13,379 | | | | 593,091 | |
Netflix, Inc. (a) | | | 41,913 | | | | 19,072,092 | |
Take-Two Interactive Software, Inc. (a) | | | 10,721 | | | | 1,496,330 | |
Walt Disney Co. | | | 172,134 | | | | 19,194,662 | |
| | | | | | | | |
| | | | | | | 49,562,168 | |
| | | | | | | | |
Equity Real Estate Investment Trusts 2.6% | |
Alexandria Real Estate Equities, Inc. | | | 12,075 | | | | 1,959,169 | |
American Tower Corp. | | | 42,246 | | | | 10,922,281 | |
Apartment Investment & Management Co., Class A | | | 14,103 | | | | 530,837 | |
AvalonBay Communities, Inc. | | | 13,412 | | | | 2,074,032 | |
Boston Properties, Inc. | | | 13,687 | | | | 1,237,031 | |
Crown Castle International Corp. | | | 39,716 | | | | 6,646,473 | |
Digital Realty Trust, Inc. | | | 25,570 | | | | 3,633,753 | |
Duke Realty Corp. | | | 34,986 | | | | 1,238,155 | |
Equinix, Inc. | | | 8,435 | | | | 5,923,900 | |
Equity Residential | | | 33,023 | | | | 1,942,413 | |
Essex Property Trust, Inc. | | | 6,290 | | | | 1,441,479 | |
Extra Space Storage, Inc. | | | 12,327 | | | | 1,138,645 | |
Federal Realty Investment Trust | | | 6,686 | | | | 569,714 | |
Healthpeak Properties, Inc. | | | 51,143 | | | | 1,409,501 | |
Host Hotels & Resorts, Inc. | | | 69,110 | | | | 745,697 | |
| | | | | | | | |
| | |
| | | Shares | | | Value | |
| | | | | | | | |
Equity Real Estate Investment Trusts (continued) | |
Iron Mountain, Inc. | | | 27,198 | | | $ | 709,868 | |
Kimco Realty Corp. | | | 41,158 | | | | 528,469 | |
Mid-America Apartment Communities, Inc. | | | 10,803 | | | | 1,238,780 | |
Prologis, Inc. | | | 70,386 | | | | 6,569,125 | |
Public Storage | | | 14,225 | | | | 2,729,635 | |
Realty Income Corp. | | | 32,727 | | | | 1,947,256 | |
Regency Centers Corp. | | | 15,872 | | | | 728,366 | |
SBA Communications Corp. | | | 10,713 | | | | 3,191,617 | |
Simon Property Group, Inc. | | | 29,175 | | | | 1,994,986 | |
SL Green Realty Corp. | | | 7,441 | | | | 366,767 | |
UDR, Inc. | | | 27,740 | | | | 1,036,921 | |
Ventas, Inc. | | | 35,293 | | | | 1,292,430 | |
Vornado Realty Trust | | | 15,002 | | | | 573,226 | |
Welltower, Inc. | | | 39,785 | | | | 2,058,874 | |
Weyerhaeuser Co. | | | 70,565 | | | | 1,584,890 | |
| | | | | | | | |
| | | | | | | 67,964,290 | |
| | | | | | | | |
Food & Staples Retailing 1.4% | |
Costco Wholesale Corp. | | | 42,051 | | | | 12,750,284 | |
Kroger Co. | | | 75,676 | | | | 2,561,633 | |
Sysco Corp. | | | 48,605 | | | | 2,656,749 | |
Walgreens Boots Alliance, Inc. | | | 70,222 | | | | 2,976,710 | |
Walmart, Inc. | | | 134,940 | | | | 16,163,113 | |
| | | | | | | | |
| | | | | | | 37,108,489 | |
| | | | | | | | |
Food Products 1.0% | |
Archer-Daniels-Midland Co. | | | 52,760 | | | | 2,105,124 | |
Campbell Soup Co. | | | 15,975 | | | | 792,839 | |
Conagra Brands, Inc. | | | 46,094 | | | | 1,621,126 | |
General Mills, Inc. | | | 57,528 | | | | 3,546,601 | |
Hershey Co. | | | 14,111 | | | | 1,829,068 | |
Hormel Foods Corp. | | | 26,303 | | | | 1,269,646 | |
J.M. Smucker Co. | | | 10,804 | | | | 1,143,171 | |
Kellogg Co. | | | 23,557 | | | | 1,556,175 | |
Kraft Heinz Co. | | | 58,941 | | | | 1,879,629 | |
Lamb Weston Holdings, Inc. | | | 13,800 | | | | 882,234 | |
McCormick & Co., Inc. | | | 11,762 | | | | 2,110,220 | |
Mondelez International, Inc., Class A | | | 136,035 | | | | 6,955,470 | |
Tyson Foods, Inc., Class A | | | 27,915 | | | | 1,666,805 | |
| | | | | | | | |
| | | | | | | 27,358,108 | |
| | | | | | | | |
|
Gas Utilities 0.0%‡ | |
Atmos Energy Corp. | | | 11,652 | | | | 1,160,306 | |
| | | | | | | | |
|
Health Care Equipment & Supplies 3.5% | |
Abbott Laboratories | | | 168,568 | | | | 15,412,172 | |
ABIOMED, Inc. (a) | | | 4,296 | | | | 1,037,742 | |
Align Technology, Inc. (a) | | | 6,883 | | | | 1,888,971 | |
Baxter International, Inc. | | | 48,364 | | | | 4,164,140 | |
Becton Dickinson & Co. | | | 28,101 | | | | 6,723,726 | |
Boston Scientific Corp. (a) | | | 136,152 | | | | 4,780,297 | |
Cooper Cos., Inc. | | | 4,696 | | | | 1,331,973 | |
| | | | | | |
The notes to the financial statements are an integral part of,
and should be read in conjunction with, the financial statements. | | | | | 11 | |
Portfolio of Investments June 30, 2020 (Unaudited) (continued)
| | | | | | | | |
| | |
| | | Shares | | | Value | |
| | | | | | | | |
| Common Stocks (continued) | |
Health Care Equipment & Supplies (continued) | |
Danaher Corp. | | | 59,966 | | | $ | 10,603,788 | |
DENTSPLY SIRONA, Inc. | | | 21,233 | | | | 935,526 | |
DexCom, Inc. (a) | | | 8,796 | | | | 3,565,898 | |
Edwards Lifesciences Corp. (a) | | | 59,106 | | | | 4,084,816 | |
Hologic, Inc. (a) | | | 24,607 | | | | 1,402,599 | |
IDEXX Laboratories, Inc. (a) | | | 8,155 | | | | 2,692,455 | |
Intuitive Surgical, Inc. (a) | | | 11,114 | | | | 6,333,091 | |
Medtronic PLC | | | 127,802 | | | | 11,719,443 | |
ResMed, Inc. | | | 13,790 | | | | 2,647,680 | |
STERIS PLC | | | 8,049 | | | | 1,235,039 | |
Stryker Corp. | | | 30,647 | | | | 5,522,283 | |
Teleflex, Inc. | | | 4,380 | | | | 1,594,232 | |
Varian Medical Systems, Inc. (a) | | | 8,626 | | | | 1,056,858 | |
West Pharmaceutical Services, Inc. | | | 7,013 | | | | 1,593,143 | |
Zimmer Biomet Holdings, Inc. | | | 19,708 | | | | 2,352,347 | |
| | | | | | | | |
| | | | | | | 92,678,219 | |
| | | | | | | | |
Health Care Providers & Services 2.6% | |
AmerisourceBergen Corp. | | | 14,150 | | | | 1,425,895 | |
Anthem, Inc. | | | 24,026 | | | | 6,318,357 | |
Cardinal Health, Inc. | | | 27,840 | | | | 1,452,970 | |
Centene Corp. (a) | | | 55,287 | | | | 3,513,489 | |
Cigna Corp. (a) | | | 35,163 | | | | 6,598,337 | |
CVS Health Corp. | | | 124,564 | | | | 8,092,923 | |
DaVita, Inc. (a) | | | 8,125 | | | | 643,013 | |
HCA Healthcare, Inc. | | | 25,191 | | | | 2,445,038 | |
Henry Schein, Inc. (a) | | | 13,683 | | | | 798,950 | |
Humana, Inc. | | | 12,605 | | | | 4,887,589 | |
Laboratory Corp. of America Holdings (a) | | | 9,253 | | | | 1,537,016 | |
McKesson Corp. | | | 15,310 | | | | 2,348,860 | |
Quest Diagnostics, Inc. | | | 12,756 | | | | 1,453,674 | |
UnitedHealth Group, Inc. | | | 90,379 | | | | 26,657,286 | |
Universal Health Services, Inc., Class B | | | 7,402 | | | | 687,572 | |
| | | | | | | | |
| | | | | | | 68,860,969 | |
| | | | | | | | |
Health Care Technology 0.1% | |
Cerner Corp. | | | 29,081 | | | | 1,993,503 | |
| | | | | | | | |
|
Hotels, Restaurants & Leisure 1.4% | |
Carnival Corp. (b) | | | 45,148 | | | | 741,330 | |
Chipotle Mexican Grill, Inc. (a) | | | 2,445 | | | | 2,573,020 | |
Darden Restaurants, Inc. | | | 12,377 | | | | 937,805 | |
Domino’s Pizza, Inc. | | | 3,728 | | | | 1,377,272 | |
Hilton Worldwide Holdings, Inc. | | | 26,423 | | | | 1,940,769 | |
Las Vegas Sands Corp. | | | 32,065 | | | | 1,460,240 | |
Marriott International, Inc., Class A | | | 25,891 | | | | 2,219,636 | |
McDonald’s Corp. | | | 70,860 | | | | 13,071,544 | |
MGM Resorts International | | | 47,016 | | | | 789,869 | |
Norwegian Cruise Line Holdings, Ltd. (a) | | | 23,566 | | | | 387,189 | |
Royal Caribbean Cruises, Ltd. | | | 16,278 | | | | 818,784 | |
Starbucks Corp. | | | 111,318 | | | | 8,191,892 | |
| | | | | | | | |
| | |
| | | Shares | | | Value | |
| | | | | | | | |
Hotels, Restaurants & Leisure (continued) | |
Wynn Resorts, Ltd. | | | 9,173 | | | $ | 683,297 | |
Yum! Brands, Inc. | | | 28,821 | | | | 2,504,833 | |
| | | | | | | | |
| | | | | | | 37,697,480 | |
| | | | | | | | |
Household Durables 0.3% | |
D.R. Horton, Inc. | | | 31,875 | | | | 1,767,469 | |
Garmin, Ltd. | | | 13,686 | | | | 1,334,385 | |
Leggett & Platt, Inc. | | | 12,453 | | | | 437,723 | |
Lennar Corp., Class A | | | 26,171 | | | | 1,612,657 | |
Mohawk Industries, Inc. (a) | | | 5,672 | | | | 577,183 | |
Newell Brands, Inc. | | | 36,097 | | | | 573,220 | |
NVR, Inc. (a) | | | 332 | | | | 1,081,905 | |
PulteGroup, Inc. | | | 24,410 | | | | 830,672 | |
Whirlpool Corp. | | | 6,017 | | | | 779,382 | |
| | | | | | | | |
| | | | | | | 8,994,596 | |
| | | | | | | | |
Household Products 1.6% | |
Church & Dwight Co., Inc. | | | 23,402 | | | | 1,808,975 | |
Clorox Co. | | | 11,912 | | | | 2,613,135 | |
Colgate-Palmolive Co. | | | 81,626 | | | | 5,979,921 | |
Kimberly-Clark Corp. | | | 32,602 | | | | 4,608,293 | |
Procter & Gamble Co. | | | 235,925 | | | | 28,209,552 | |
| | | | | | | | |
| | | | | | | 43,219,876 | |
| | | | | | | | |
Independent Power & Renewable Electricity Producers 0.0%‡ | |
AES Corp. | | | 62,885 | | | | 911,204 | |
| | | | | | | | |
|
Industrial Conglomerates 1.1% | |
3M Co. | | | 54,815 | | | | 8,550,592 | |
General Electric Co. | | | 833,584 | | | | 5,693,378 | |
Honeywell International, Inc. | | | 66,885 | | | | 9,670,902 | |
Roper Technologies, Inc. | | | 9,949 | | | | 3,862,799 | |
| | | | | | | | |
| | | | | | | 27,777,671 | |
| | | | | | | | |
Insurance 1.8% | |
Aflac, Inc. | | | 68,377 | | | | 2,463,623 | |
Allstate Corp. | | | 29,935 | | | | 2,903,396 | |
American International Group, Inc. | | | 82,404 | | | | 2,569,357 | |
Aon PLC, Class A | | | 22,022 | | | | 4,241,437 | |
Arthur J. Gallagher & Co. | | | 17,948 | | | | 1,749,750 | |
Assurant, Inc. | | | 5,790 | | | | 598,049 | |
Chubb, Ltd. | | | 43,166 | | | | 5,465,679 | |
Cincinnati Financial Corp. | | | 14,390 | | | | 921,392 | |
Everest Re Group, Ltd. | | | 3,860 | | | | 795,932 | |
Globe Life, Inc. | | | 9,506 | | | | 705,630 | |
Hartford Financial Services Group, Inc. | | | 34,249 | | | | 1,320,299 | |
Lincoln National Corp. | | | 18,414 | | | | 677,451 | |
Loews Corp. | | | 23,623 | | | | 810,033 | |
Marsh & McLennan Cos., Inc. | | | 48,623 | | | | 5,220,651 | |
MetLife, Inc. | | | 73,518 | | | | 2,684,877 | |
Principal Financial Group, Inc. | | | 24,559 | | | | 1,020,181 | |
Progressive Corp. | | | 55,778 | | | | 4,468,376 | |
Prudential Financial, Inc. | | | 37,643 | | | | 2,292,459 | |
Travelers Cos., Inc. | | | 24,095 | | | | 2,748,035 | |
| | | | |
| 12 | | MainStay VP MacKay S&P 500 Index Portfolio | | The notes to the financial statements are an integral part of,
and should be read in conjunction with, the financial statements. |
| | | | | | | | |
| | |
| | | Shares | | | Value | |
| | | | | | | | |
| Common Stocks (continued) | |
Insurance (continued) | |
Unum Group | | | 19,758 | | | $ | 327,785 | |
W.R. Berkley Corp. | | | 13,710 | | | | 785,446 | |
Willis Towers Watson PLC | | | 12,218 | | | | 2,406,335 | |
| | | | | | | | |
| | | | | | | 47,176,173 | |
| | | | | | | | |
Interactive Media & Services 5.1% | |
Alphabet, Inc. (a) | |
Class A | | | 28,594 | | | | 40,547,722 | |
Class C | | | 27,871 | | | | 39,398,724 | |
Facebook, Inc., Class A (a) | | | 229,150 | | | | 52,033,091 | |
Twitter, Inc. (a) | | | 74,774 | | | | 2,227,517 | |
| | | | | | | | |
| | | | | | | 134,207,054 | |
| | | | | | | | |
Internet & Direct Marketing Retail 4.6% | |
Amazon.com, Inc. (a) | | | 39,927 | | | | 110,151,406 | |
Booking Holdings, Inc. (a) | | | 3,901 | | | | 6,211,718 | |
eBay, Inc. | | | 62,946 | | | | 3,301,518 | |
Expedia Group, Inc. | | | 12,909 | | | | 1,061,120 | |
| | | | | | | | |
| | | | | | | 120,725,762 | |
| | | | | | | | |
IT Services 5.3% | |
Accenture PLC, Class A | | | 60,734 | | | | 13,040,804 | |
Akamai Technologies, Inc. (a) | | | 15,383 | | | | 1,647,365 | |
Automatic Data Processing, Inc. | | | 41,103 | | | | 6,119,826 | |
Broadridge Financial Solutions, Inc. | | | 10,911 | | | | 1,376,859 | |
Cognizant Technology Solutions Corp., Class A | | | 51,516 | | | | 2,927,139 | |
DXC Technology Co. | | | 24,800 | | | | 409,200 | |
Fidelity National Information Services, Inc. | | | 58,879 | | | | 7,895,085 | |
Fiserv, Inc. (a) | | | 53,593 | | | | 5,231,749 | |
FleetCor Technologies, Inc. (a) | | | 7,986 | | | | 2,008,719 | |
Gartner, Inc. (a) | | | 8,537 | | | | 1,035,794 | |
Global Payments, Inc. | | | 28,403 | | | | 4,817,717 | |
International Business Machines Corp. | | | 84,615 | | | | 10,218,954 | |
Jack Henry & Associates, Inc. | | | 7,295 | | | | 1,342,499 | |
Leidos Holdings, Inc. | | | 12,666 | | | | 1,186,424 | |
Mastercard, Inc., Class A | | | 84,282 | | | | 24,922,187 | |
Paychex, Inc. | | | 30,294 | | | | 2,294,771 | |
PayPal Holdings, Inc. (a) | | | 111,896 | | | | 19,495,640 | |
VeriSign, Inc. (a) | | | 9,689 | | | | 2,003,976 | |
Visa, Inc., Class A | | | 160,779 | | | | 31,057,679 | |
Western Union Co. | | | 40,142 | | | | 867,870 | |
| | | | | | | | |
| | | | | | | 139,900,257 | |
| | | | | | | | |
Leisure Products 0.0% ‡ | |
Hasbro, Inc. | | | 12,112 | | | | 907,794 | |
| | | | | | | | |
|
Life Sciences Tools & Services 1.1% | |
Agilent Technologies, Inc. | | | 29,314 | | | | 2,590,478 | |
Bio-Rad Laboratories, Inc., Class A (a) | | | 2,037 | | | | 919,685 | |
Illumina, Inc. (a) | | | 14,009 | | | | 5,188,233 | |
IQVIA Holdings, Inc. (a) | | | 16,925 | | | | 2,401,319 | |
| | | | | | | | |
| | |
| | | Shares | | | Value | |
| | | | | | | | |
Life Sciences Tools & Services (continued) | |
Mettler-Toledo International, Inc. (a) | | | 2,278 | | | $ | 1,835,043 | |
PerkinElmer, Inc. | | | 10,522 | | | | 1,032,103 | |
Thermo Fisher Scientific, Inc. | | | 37,638 | | | | 13,637,753 | |
Waters Corp. (a) | | | 5,933 | | | | 1,070,313 | |
| | | | | | | | |
| | | | | | | 28,674,927 | |
| | | | | | | | |
Machinery 1.4% | |
Caterpillar, Inc. | | | 51,579 | | | | 6,524,743 | |
Cummins, Inc. | | | 13,960 | | | | 2,418,710 | |
Deere & Co. | | | 29,827 | | | | 4,687,313 | |
Dover Corp. | | | 13,778 | | | | 1,330,404 | |
Flowserve Corp. | | | 12,425 | | | | 354,361 | |
Fortive Corp. | | | 27,969 | | | | 1,892,382 | |
IDEX Corp. | | | 7,186 | | | | 1,135,675 | |
Illinois Tool Works, Inc. | | | 27,398 | | | | 4,790,540 | |
Ingersoll Rand, Inc. (a) | | | 32,830 | | | | 923,180 | |
Otis Worldwide Corp. | | | 38,619 | | | | 2,195,876 | |
PACCAR, Inc. | | | 32,808 | | | | 2,455,679 | |
Parker-Hannifin Corp. | | | 12,167 | | | | 2,229,846 | |
Pentair PLC | | | 15,919 | | | | 604,763 | |
Snap-On, Inc. | | | 5,229 | | | | 724,269 | |
Stanley Black & Decker, Inc. | | | 14,684 | | | | 2,046,656 | |
Westinghouse Air Brake Technologies Corp. | | | 17,251 | | | | 993,140 | |
Xylem, Inc. | | | 17,053 | | | | 1,107,763 | |
| | | | | | | | |
| | | | | | | 36,415,300 | |
| | | | | | | | |
Media 1.2% | |
Charter Communications, Inc., Class A (a) | | | 14,363 | | | | 7,325,704 | |
Comcast Corp., Class A | | | 434,057 | | | | 16,919,542 | |
Discovery, Inc. (a) | |
Class A (b) | | | 14,969 | | | | 315,846 | |
Class C | | | 29,200 | | | | 562,392 | |
DISH Network Corp., Class A (a) | | | 24,339 | | | | 839,939 | |
Fox Corp. | |
Class A | | | 32,907 | | | | 882,566 | |
Class B (a) | | | 15,382 | | | | 412,853 | |
Interpublic Group of Cos., Inc. | | | 36,681 | | | | 629,446 | |
News Corp. | |
Class A | | | 36,985 | | | | 438,642 | |
Class B | | | 11,535 | | | | 137,843 | |
Omnicom Group, Inc. | | | 20,605 | | | | 1,125,033 | |
ViacomCBS, Inc., Class B | | | 50,996 | | | | 1,189,227 | |
| | | | | | | | |
| | | | | | | 30,779,033 | |
| | | | | | | | |
Metals & Mining 0.3% | |
Freeport-McMoRan, Inc. | | | 137,438 | | | | 1,590,158 | |
Newmont Corp. | | | 76,485 | | | | 4,722,184 | |
Nucor Corp. | | | 28,718 | | | | 1,189,212 | |
| | | | | | | | |
| | | | | | | 7,501,554 | |
| | | | | | | | |
Multi-Utilities 0.9% | |
Ameren Corp. | | | 23,284 | | | | 1,638,262 | |
CenterPoint Energy, Inc. | | | 51,908 | | | | 969,122 | |
CMS Energy Corp. | | | 26,881 | | | | 1,570,388 | |
| | | | | | |
The notes to the financial statements are an integral part of,
and should be read in conjunction with, the financial statements. | | | | | 13 | |
Portfolio of Investments June 30, 2020 (Unaudited) (continued)
| | | | | | | | |
| | |
| | | Shares | | | Value | |
| | | | | | | | |
| Common Stocks (continued) | |
Multi-Utilities (continued) | |
Consolidated Edison, Inc. | | | 31,839 | | | $ | 2,290,179 | |
Dominion Energy, Inc. | | | 79,979 | | | | 6,492,695 | |
DTE Energy Co. | | | 18,286 | | | | 1,965,745 | |
NiSource, Inc. | | | 36,433 | | | | 828,487 | |
Public Service Enterprise Group, Inc. | | | 47,898 | | | | 2,354,666 | |
Sempra Energy | | | 28,028 | | | | 3,285,723 | |
WEC Energy Group, Inc. | | | 29,880 | | | | 2,618,982 | |
| | | | | | | | |
| | | | | | | 24,014,249 | |
| | | | | | | | |
Multiline Retail 0.5% | |
Dollar General Corp. | | | 23,989 | | | | 4,570,144 | |
Dollar Tree, Inc. (a) | | | 22,415 | | | | 2,077,422 | |
Kohl’s Corp. | | | 15,066 | | | | 312,921 | |
Target Corp. | | | 47,651 | | | | 5,714,785 | |
| | | | | | | | |
| | | | | | | 12,675,272 | |
| | | | | | | | |
Oil, Gas & Consumable Fuels 2.4% | |
Apache Corp. | | | 35,614 | | | | 480,789 | |
Cabot Oil & Gas Corp. | | | 37,984 | | | | 652,565 | |
Chevron Corp. | | | 177,920 | | | | 15,875,802 | |
Concho Resources, Inc. | | | 19,048 | | | | 980,972 | |
ConocoPhillips | | | 102,200 | | | | 4,294,444 | |
Devon Energy Corp. | | | 36,836 | | | | 417,720 | |
Diamondback Energy, Inc. | | | 15,440 | | | | 645,701 | |
EOG Resources, Inc. | | | 55,468 | | | | 2,810,009 | |
Exxon Mobil Corp. | | | 402,942 | | | | 18,019,566 | |
Hess Corp. | | | 24,517 | | | | 1,270,226 | |
HollyFrontier Corp. | | | 14,336 | | | | 418,611 | |
Kinder Morgan, Inc. | | | 184,425 | | | | 2,797,727 | |
Marathon Oil Corp. | | | 76,154 | | | | 466,063 | |
Marathon Petroleum Corp. | | | 62,338 | | | | 2,330,194 | |
Noble Energy, Inc. | | | 45,303 | | | | 405,915 | |
Occidental Petroleum Corp. | | | 84,728 | | | | 1,550,522 | |
ONEOK, Inc. | | | 40,338 | | | | 1,340,028 | |
Phillips 66 | | | 41,614 | | | | 2,992,047 | |
Pioneer Natural Resources Co. | | | 15,829 | | | | 1,546,493 | |
Valero Energy Corp. | | | 38,853 | | | | 2,285,334 | |
Williams Cos., Inc. | | | 114,811 | | | | 2,183,705 | |
| | | | | | | | |
| | | | | | | 63,764,433 | |
| | | | | | | | |
Personal Products 0.2% | |
Coty, Inc., Class A | | | 27,866 | | | | 124,561 | |
Estee Lauder Cos., Inc., Class A | | | 21,420 | | | | 4,041,526 | |
| | | | | | | | |
| | | | | | | 4,166,087 | |
| | | | | | | | |
Pharmaceuticals 4.0% | |
Bristol-Myers Squibb Co. | | | 215,631 | | | | 12,679,103 | |
Eli Lilly & Co. | | | 80,260 | | | | 13,177,087 | |
Johnson & Johnson | | | 251,073 | | | | 35,308,396 | |
Merck & Co., Inc. | | | 240,543 | | | | 18,601,190 | |
Mylan N.V. (a) | | | 48,869 | | | | 785,814 | |
Perrigo Co. PLC | | | 12,889 | | | | 712,375 | |
Pfizer, Inc. | | | 529,367 | | | | 17,310,301 | |
| | | | | | | | |
| | |
| | | Shares | | | Value | |
| | | | | | | | |
Pharmaceuticals (continued) | |
Zoetis, Inc. | | | 45,233 | | | $ | 6,198,730 | |
| | | | | | | | |
| | | | | | | 104,772,996 | |
| | | | | | | | |
Professional Services 0.3% | |
Equifax, Inc. | | | 11,452 | | | | 1,968,370 | |
IHS Markit, Ltd. | | | 37,995 | | | | 2,868,622 | |
Nielsen Holdings PLC | | | 33,692 | | | | 500,663 | |
Robert Half International, Inc. | | | 10,984 | | | | 580,285 | |
Verisk Analytics, Inc. | | | 15,488 | | | | 2,636,058 | |
| | | | | | | | |
| | | | | | | 8,553,998 | |
| | | | | | | | |
Real Estate Management & Development 0.1% | |
CBRE Group, Inc., Class A (a) | | | 31,857 | | | | 1,440,574 | |
| | | | | | | | |
|
Road & Rail 0.9% | |
CSX Corp. | | | 72,948 | | | | 5,087,394 | |
J.B. Hunt Transport Services, Inc. | | | 8,092 | | | | 973,791 | |
Kansas City Southern | | | 9,176 | | | | 1,369,885 | |
Norfolk Southern Corp. | | | 24,413 | | | | 4,286,190 | |
Old Dominion Freight Line, Inc. | | | 9,092 | | | | 1,541,912 | |
Union Pacific Corp. | | | 64,666 | | | | 10,933,081 | |
| | | | | | | | |
| | | | | | | 24,192,253 | |
| | | | | | | | |
Semiconductors & Semiconductor Equipment 4.4% | |
Advanced Micro Devices, Inc. (a) | | | 111,613 | | | | 5,871,960 | |
Analog Devices, Inc. | | | 34,990 | | | | 4,291,174 | |
Applied Materials, Inc. | | | 87,504 | | | | 5,289,617 | |
Broadcom, Inc. | | | 38,099 | | | | 12,024,425 | |
Intel Corp. | | | 403,493 | | | | 24,140,986 | |
KLA Corp. | | | 14,776 | | | | 2,873,636 | |
Lam Research Corp. | | | 13,834 | | | | 4,474,746 | |
Maxim Integrated Products, Inc. | | | 25,696 | | | | 1,557,435 | |
Microchip Technology, Inc. | | | 23,380 | | | | 2,462,148 | |
Micron Technology, Inc. (a) | | | 105,990 | | | | 5,460,605 | |
NVIDIA Corp. | | | 58,621 | | | | 22,270,704 | |
Qorvo, Inc. (a) | | | 11,153 | | | | 1,232,741 | |
QUALCOMM, Inc. | | | 107,204 | | | | 9,778,077 | |
Skyworks Solutions, Inc. | | | 15,899 | | | | 2,032,846 | |
Texas Instruments, Inc. | | | 87,462 | | | | 11,105,050 | |
Xilinx, Inc. | | | 23,173 | | | | 2,279,991 | |
| | | | | | | | |
| | | | | | | 117,146,141 | |
| | | | | | | | |
Software 8.7% | |
Adobe, Inc. (a) | | | 45,915 | | | | 19,987,259 | |
ANSYS, Inc. (a) | | | 8,187 | | | | 2,388,394 | |
Autodesk, Inc. (a) | | | 20,802 | | | | 4,975,630 | |
Cadence Design Systems, Inc. (a) | | | 26,539 | | | | 2,546,682 | |
Citrix Systems, Inc. | | | 10,929 | | | | 1,616,508 | |
Fortinet, Inc. (a) | | | 12,786 | | | | 1,755,134 | |
Intuit, Inc. | | | 24,851 | | | | 7,360,618 | |
Microsoft Corp. | | | 722,690 | | | | 147,074,642 | |
NortonLifeLock, Inc. | | | 51,643 | | | | 1,024,081 | |
Oracle Corp. | | | 198,351 | | | | 10,962,860 | |
Paycom Software, Inc. (a) | | | 4,657 | | | | 1,442,413 | |
| | | | |
| 14 | | MainStay VP MacKay S&P 500 Index Portfolio | | The notes to the financial statements are an integral part of,
and should be read in conjunction with, the financial statements. |
| | | | | | | | |
| | |
| | | Shares | | | Value | |
| | | | | | | | |
| Common Stocks (continued) | |
Software (continued) | |
salesforce.com, Inc. (a) | | | 85,864 | | | $ | 16,084,903 | |
ServiceNow, Inc. (a) | | | 18,174 | | | | 7,361,560 | |
Synopsys, Inc. (a) | | | 14,370 | | | | 2,802,150 | |
Tyler Technologies, Inc. (a) | | | 3,789 | | | | 1,314,328 | |
| | | | | | | | |
| | | | | | | 228,697,162 | |
| | | | | | | | |
Specialty Retail 2.2% | |
Advance Auto Parts, Inc. | | | 6,585 | | | | 938,033 | |
AutoZone, Inc. (a) | | | 2,225 | | | | 2,510,067 | |
Best Buy Co., Inc. | | | 21,662 | | | | 1,890,443 | |
CarMax, Inc. (a) | | | 15,683 | | | | 1,404,413 | |
Gap, Inc. | | | 20,286 | | | | 256,009 | |
Home Depot, Inc. | | | 102,496 | | | | 25,676,273 | |
L Brands, Inc. | | | 21,993 | | | | 329,235 | |
Lowe’s Cos., Inc. | | | 71,951 | | | | 9,722,019 | |
O’Reilly Automotive, Inc. (a) | | | 7,074 | | | | 2,982,894 | |
Ross Stores, Inc. | | | 33,868 | | | | 2,886,908 | |
Tiffany & Co. | | | 10,296 | | | | 1,255,494 | |
TJX Cos., Inc. | | | 114,528 | | | | 5,790,536 | |
Tractor Supply Co. | | | 11,019 | | | | 1,452,194 | |
Ulta Beauty, Inc. (a) | | | 5,366 | | | | 1,091,552 | |
| | | | | | | | |
| | | | | | | 58,186,070 | |
| | | | | | | | |
Technology Hardware, Storage & Peripherals 5.6% | |
Apple, Inc. (c) | | | 388,272 | | | | 141,641,626 | |
Hewlett Packard Enterprise Co. | | | 123,647 | | | | 1,203,085 | |
HP, Inc. | | | 136,273 | | | | 2,375,238 | |
NetApp, Inc. | | | 21,110 | | | | 936,651 | |
Seagate Technology PLC | | | 22,005 | | | | 1,065,262 | |
Western Digital Corp. | | | 28,043 | | | | 1,238,098 | |
Xerox Holdings Corp. (a) | | | 18,016 | | | | 275,465 | |
| | | | | | | | |
| | | | | | | 148,735,425 | |
| | | | | | | | |
Textiles, Apparel & Luxury Goods 0.6% | |
Hanesbrands, Inc. | | | 34,248 | | | | 386,660 | |
NIKE, Inc., Class B | | | 118,172 | | | | 11,586,764 | |
PVH Corp. | | | 7,024 | | | | 337,503 | |
Ralph Lauren Corp. | | | 4,734 | | | | 343,310 | |
Tapestry, Inc. | | | 26,264 | | | | 348,786 | |
Under Armour, Inc. (a) | |
Class A | | | 17,823 | | | | 173,596 | |
Class C | | | 18,411 | | | | 162,753 | |
VF Corp. | | | 30,387 | | | | 1,851,784 | |
| | | | | | | | |
| | | | | | | 15,191,156 | |
| | | | | | | | |
Tobacco 0.7% | |
Altria Group, Inc. | | | 176,959 | | | | 6,945,641 | |
Philip Morris International, Inc. | | | 148,392 | | | | 10,396,343 | |
| | | | | | | | |
| | | | | | | 17,341,984 | |
| | | | | | | | |
Trading Companies & Distributors 0.2% | |
Fastenal Co. | | | 54,320 | | | | 2,327,069 | |
| | | | | | | | |
| | |
| | | Shares | | | Value | |
| | | | | | | | |
Trading Companies & Distributors (continued) | |
United Rentals, Inc. (a) | | | 6,866 | | | $ | 1,023,309 | |
W.W. Grainger, Inc. | | | 4,185 | | | | 1,314,759 | |
| | | | | | | | |
| | | | | | | 4,665,137 | |
| | | | | | | | |
Water Utilities 0.1% | |
American Water Works Co., Inc. | | | 17,112 | | | | 2,201,630 | |
| | | | | | | | |
|
Wireless Telecommunication Services 0.2% | |
T-Mobile U.S., Inc. (a) | | | 44,763 | | | | 4,662,066 | |
| | | | | | | | |
Total Common Stocks (d)
(Cost $1,014,469,608) | | | | | | | 2,441,949,468 | |
| | | | | | | | |
|
| Short-Term Investments 7.3% | |
Affiliated Investment Company 0.1% | |
MainStay U.S. Government Liquidity Fund, 0.05% (e) | | | 3,535,664 | | | | 3,535,664 | |
| | | | | | | | |
Total Affiliated Investment Company
(Cost $3,535,664) | | | | 3,535,664 | |
| | | | | | | | |
| | |
| | | | | | | | |
| | | Principal
Amount | | | | |
| U.S. Government & Federal Agencies 7.2% | |
United States Treasury Bills 7.2% (f) | |
(zero coupon), due 7/30/20 (c) | | $ | 6,300,000 | | | | 6,300,124 | |
0.004%, due 7/30/20 (c) | | | 1,000,000 | | | | 999,997 | |
0.052%, due 7/2/20 | | | 1,900,000 | | | | 1,899,997 | |
0.054%, due 7/2/20 | | | 2,200,000 | | | | 2,199,997 | |
0.069%, due 7/2/20 | | | 7,300,000 | | | | 7,299,986 | |
0.071%, due 7/2/20 | | | 2,100,000 | | | | 2,099,996 | |
0.073%, due 7/2/20 | | | 9,700,000 | | | | 9,699,981 | |
0.074%, due 7/2/20 | | | 2,800,000 | | | | 2,799,994 | |
0.083%, due 7/2/20 | | | 1,800,000 | | | | 1,799,996 | |
0.086%, due 7/2/20 | | | 33,800,000 | | | | 33,799,920 | |
0.087%, due 7/2/20 | | | 100,000 | | | | 100,000 | |
0.088%, due 7/2/20 | | | 3,900,000 | | | | 3,899,991 | |
0.089%, due 7/2/20 | | | 6,400,000 | | | | 6,399,984 | |
0.091%, due 7/2/20 | | | 4,500,000 | | | | 4,499,989 | |
0.092%, due 7/2/20 | | | 1,100,000 | | | | 1,099,997 | |
0.095%, due 7/2/20 | | | 6,700,000 | | | | 6,699,983 | |
0.096%, due 7/2/20 | | | 9,500,000 | | | | 9,499,975 | |
0.098%, due 7/2/20 | | | 2,800,000 | | | | 2,799,992 | |
0.098%, due 7/30/20 (c) | | | 3,700,000 | | | | 3,699,711 | |
0.10%, due 7/2/20 | | | 29,000,000 | | | | 28,999,920 | |
0.101%, due 7/2/20 | | | 3,100,000 | | | | 3,099,991 | |
0.101%, due 7/30/20 (c) | | | 500,000 | | | | 499,960 | |
0.104%, due 7/2/20 | | | 1,200,000 | | | | 1,199,997 | |
0.105%, due 7/2/20 | | | 9,400,000 | | | | 9,399,973 | |
0.106%, due 7/2/20 | | | 2,700,000 | | | | 2,699,992 | |
0.115%, due 7/2/20 | | | 700,000 | | | | 699,998 | |
0.118%, due 7/2/20 | | | 4,800,000 | | | | 4,799,984 | |
0.122%, due 7/2/20 | | | 5,400,000 | | | | 5,399,982 | |
| | | | | | |
The notes to the financial statements are an integral part of,
and should be read in conjunction with, the financial statements. | | | | | 15 | |
Portfolio of Investments June 30, 2020 (Unaudited) (continued)
| | | | | | | | |
| | | Principal
Amount | | | Value | |
| | | | | | | | |
| U.S. Government & Federal Agencies (continued) | |
United States Treasury Bills (continued) | |
0.127%, due 7/30/20 (c) | | $ | 300,000 | | | $ | 299,970 | |
0.134%, due 7/30/20 (c) | | | 500,000 | | | | 499,947 | |
0.138%, due 7/30/20 (c) | | | 300,000 | | | | 299,967 | |
0.14%, due 7/30/20 (c) | | | 1,000,000 | | | | 999,888 | |
0.14%, due 10/8/20 | | | 3,300,000 | | | | 3,298,593 | |
0.143%, due 7/2/20 | | | 600,000 | | | | 599,998 | |
0.145%, due 10/8/20 | | | 3,500,000 | | | | 3,498,508 | |
0.16%, due 10/8/20 | | | 300,000 | | | | 299,872 | |
0.168%, due 10/8/20 | | | 4,200,000 | | | | 4,198,210 | |
0.194%, due 7/30/20 (c) | | | 300,000 | | | | 299,954 | |
0.203%, due 7/2/20 | | | 8,600,000 | | | | 8,599,952 | |
0.231%, due 7/30/20 (c) | | | 200,000 | | | | 199,963 | |
0.388%, due 7/30/20 (c) | | | 1,000,000 | | | | 999,692 | |
0.562%, due 7/30/20 (c) | | | 500,000 | | | | 499,777 | |
| | | | | | | | |
Total U.S. Government & Federal Agencies
(Cost $188,993,848) | | | | 188,993,698 | |
| | | | | | | | |
| | |
| | | | | | | | |
| | | Shares | | | | |
Unaffiliated Investment Company 0.0% ‡ | |
State Street Navigator Securities Lending Government Money Market Portfolio, 0.13% (e)(g) | | | 714,892 | | | | 714,892 | |
| | | | | | | | |
| | | | | | | | |
| | |
| | | Shares | | | Value | |
Unaffiliated Investment Company (continued) | |
Total Unaffiliated Investment Company
(Cost $714,892) | | | $ | 714,892 | |
| | | | | | | | |
Total Short-Term Investments
(Cost $193,244,404) | | | | 193,244,254 | |
| | | | | | | | |
Total Investments
(Cost $1,207,714,012) | | | 100.1 | % | | | 2,635,193,722 | |
Other Assets, Less Liabilities | | | (0.1 | ) | | | (3,439,915 | ) |
Net Assets | | | 100.0 | % | | $ | 2,631,753,807 | |
| † | Percentages indicated are based on Portfolio net assets. |
| ‡ | Less than one-tenth of a percent. |
| (a) | Non-income producing security. |
| (b) | All or a portion of this security was held on loan. As of June 30, 2020, the aggregate market value of securities on loan was $1,522,667; the total market value of collateral held by the Portfolio was $1,580,777. The market value of the collateral held included non-cash collateral in the form of U.S. Treasury securities with a value of $865,885 (See Note 2(I)). |
| (c) | Represents a security which was maintained at the broker as collateral for futures contracts. |
| (d) | The combined market value of common stocks and notional value of Standard & Poor’s 500 Index futures contracts represents 99.9% of the Portfolio’s net assets. |
| (e) | Current yield as of June 30, 2020. |
| (f) | Interest rate shown represents yield to maturity. |
| (g) | Represents a security purchased with cash collateral received for securities on loan. |
Futures Contracts
As of June 30, 2020, the Portfolio held the following futures contracts:
| | | | | | | | | | | | | | | | | | |
Type | | Number of
Contracts | | Expiration
Date | | | Value at
Trade Date | | | Current
Notional
Amount | | | Unrealized
Appreciation
(Depreciation)1 | |
Long Contracts | |
| | | | | |
S&P 500 Index Mini | | 1,216 | | | September 2020 | | | $ | 187,315,995 | | | $ | 187,884,160 | | | $ | 568,165 | |
| | | | | | | | | | | | | | | | | | |
| 1. | Represents the difference between the value of the contracts at the time they were opened and the value as of June 30, 2020. |
| | | | |
| 16 | | MainStay VP MacKay S&P 500 Index Portfolio | | The notes to the financial statements are an integral part of,
and should be read in conjunction with, the financial statements. |
The following is a summary of the fair valuations according to the inputs used as of June 30, 2020, for valuing the Portfolio’s assets:
| | | | | | | | | | | | | | | | |
Description | | Quoted
Prices in
Active
Markets for
Identical
Assets
(Level 1) | | | Significant
Other
Observable
Inputs (Level 2) | | | Significant
Unobservable
Inputs (Level 3) | | | Total | |
|
Asset Valuation Inputs | |
| Investments in Securities (a) | | | | | | | | | |
| Common Stocks | | $ | 2,441,949,468 | | | $ | — | | | $ | — | | | $ | 2,441,949,468 | |
| Short-Term Investments | | | | | | | | | |
Affiliated Investment Company | | | 3,535,664 | | | | — | | | | — | | | | 3,535,664 | |
U.S. Government & Federal Agencies | | | — | | | | 188,993,698 | | | | — | | | | 188,993,698 | |
Unaffiliated Investment Company | | | 714,892 | | | | — | | | | — | | | | 714,892 | |
| Total Short-Term Investments | | | 4,250,556 | | | | 188,993,698 | | | | — | | | | 193,244,254 | |
| | | | | | | | | | | | | | | | |
| Total Investments in Securities | | | 2,446,200,024 | | | | 188,993,698 | | | | — | | | | 2,635,193,722 | |
| | | | | | | | | | | | | | | | |
| Other Financial Instruments Futures Contracts (b) | | | 568,165 | | | | — | | | | — | | | | 568,165 | |
| | | | | | | | | | | | | | | | |
| Total Investments in Securities and Other Financial Instruments | | $ | 2,446,768,189 | | | $ | 188,993,698 | | | $ | — | | | $ | 2,635,761,887 | |
| | | | | | | | | | | | | | | | |
| (a) | For a complete listing of investments and their industries, see the Portfolio of Investments. |
| (b) | The value listed for these securities reflects unrealized appreciation (depreciation) as shown on the Portfolio of Investments. |
| | | | | | |
The notes to the financial statements are an integral part of,
and should be read in conjunction with, the financial statements. | | | | | 17 | |
Statement of Assets and Liabilities as of June 30, 2020 (Unaudited)
| | | | |
| Assets | |
Investment in unaffiliated securities, at value
(identified cost $1,204,178,348) including securities on loan of $1,522,667 | | $ | 2,631,658,058 | |
Investment in affiliated investment company, at value
(identified cost $3,535,664) | | | 3,535,664 | |
Receivables: | |
Variation margin on futures contracts | | | 2,628,308 | |
Portfolio shares sold | | | 2,241,536 | |
Dividends | | | 1,919,420 | |
Securities lending | | | 7,971 | |
Investment securities sold | | | 7,842 | |
Other assets | | | 50,347 | |
| | | | |
Total assets | | | 2,642,049,146 | |
| | | | |
|
| Liabilities | |
Due to custodian | | | 3,498,612 | |
Cash collateral received for securities on loan | | | 714,892 | |
Payables: | |
Portfolio shares redeemed | | | 5,556,866 | |
NYLIFE Distributors (See Note 3) | | | 279,003 | |
Manager (See Note 3) | | | 200,185 | |
Shareholder communication | | | 38,065 | |
Professional fees | | | 4,885 | |
Trustees | | | 2,831 | |
| | | | |
Total liabilities | | | 10,295,339 | |
| | | | |
Net assets | | $ | 2,631,753,807 | |
| | | | |
|
| Composition of Net Assets | |
Shares of beneficial interest outstanding (par value of $.001 per share) unlimited number of shares authorized | | $ | 44,253 | |
Additional paid-in capital | | | 1,123,125,767 | |
| | | | |
| | | 1,123,170,020 | |
Total distributable earnings (loss) | | | 1,508,583,787 | |
| | | | |
Net assets | | $ | 2,631,753,807 | |
| | | | |
Initial Class | |
Net assets applicable to outstanding shares | | $ | 1,271,243,136 | |
| | | | |
Shares of beneficial interest outstanding | | | 21,269,797 | |
| | | | |
Net asset value per share outstanding | | $ | 59.77 | |
| | | | |
Service Class | |
Net assets applicable to outstanding shares | | $ | 1,360,510,671 | |
| | | | |
Shares of beneficial interest outstanding | | | 22,983,253 | |
| | | | |
Net asset value per share outstanding | | $ | 59.20 | |
| | | | |
| | | | |
| 18 | | MainStay VP MacKay S&P 500 Index Portfolio | | The notes to the financial statements are an integral part of,
and should be read in conjunction with, the financial statements. |
Statement of Operations for the six months ended June 30, 2020 (Unaudited)
| | | | |
| Investment Income (Loss) | |
| |
Income | |
Dividends-unaffiliated | | $ | 23,087,673 | |
Interest | | | 284,800 | |
Securities lending | | | 15,008 | |
Dividends-affiliated | | | 6,138 | |
| | | | |
Total income | | | 23,393,619 | |
| | | | |
Expenses | |
Manager (See Note 3) | | | 1,903,386 | |
Distribution/Service—Service Class (See Note 3) | | | 1,590,607 | |
Professional fees | | | 98,576 | |
Shareholder communication | | | 85,932 | |
Custodian | | | 46,134 | |
Trustees | | | 27,621 | |
Miscellaneous | | | 50,580 | |
| | | | |
Total expenses before waiver/reimbursement | | | 3,802,836 | |
Expense waiver/reimbursement from Manager (See Note 3) | | | (475,427 | ) |
| | | | |
Net expenses | | | 3,327,409 | |
| | | | |
Net investment income (loss) | | | 20,066,210 | |
| | | | |
|
| Realized and Unrealized Gain (Loss) on Investments and Futures Contracts | |
| |
Net realized gain (loss) on: | |
Unaffiliated investment transactions | | | (2,318,512 | ) |
Futures transactions | | | 19,923,943 | |
| | | | |
Net realized gain (loss) on investments and futures transactions | | | 17,605,431 | |
| | | | |
Net change in unrealized appreciation (depreciation) on: | |
Unaffiliated investments | | | (85,067,856 | ) |
Futures contracts | | | (478,129 | ) |
| | | | |
Net change in unrealized appreciation (depreciation) on investments and futures contracts | | | (85,545,985 | ) |
| | | | |
Net realized and unrealized gain (loss) on investments and futures transactions | | | (67,940,554 | ) |
| | | | |
Net increase (decrease) in net assets resulting from operations | | $ | (47,874,344 | ) |
| | | | |
| | | | | | |
The notes to the financial statements are an integral part of,
and should be read in conjunction with, the financial statements. | | | | | 19 | |
Statements of Changes in Net Assets
for the six months ended June 30, 2020 (Unaudited) and the year ended December 31, 2019
| | | | | | | | |
| | | 2020 | | | 2019 | |
| Increase (Decrease) in Net Assets | |
Operations: | | | | | | | | |
Net investment income (loss) | | $ | 20,066,210 | | | $ | 37,081,903 | |
Net realized gain (loss) on investments and futures transactions | | | 17,605,431 | | | | 24,021,995 | |
| | | | |
Net change in unrealized appreciation (depreciation) on investments and futures contracts | | | (85,545,985 | ) | | | 531,359,165 | |
| | | | |
Net increase (decrease) in net assets resulting from operations | | | (47,874,344 | ) | | | 592,463,063 | |
| | | | |
Distributions to shareholders: | | | | | | | | |
Initial Class | | | — | | | | (23,519,063 | ) |
Service Class | | | — | | | | (24,823,269 | ) |
| | | | |
Total distributions to shareholders | | | — | | | | (48,342,332 | ) |
| | | | |
Capital share transactions: | |
Net proceeds from sale of shares | | | 370,589,080 | | | | 262,379,287 | |
Net asset value of shares issued to shareholders in reinvestment of distributions | | | — | | | | 48,342,332 | |
Cost of shares redeemed | | | (156,542,446 | ) | | | (311,703,215 | ) |
| | | | |
Increase (decrease) in net assets derived from capital share transactions | | | 214,046,634 | | | | (981,596 | ) |
| | | | |
Net increase (decrease) in net assets | | | 166,172,290 | | | | 543,139,135 | |
| | |
| Net Assets | | | | | | | | |
Beginning of period | | | 2,465,581,517 | | | | 1,922,442,382 | |
| | | | |
End of period | | $ | 2,631,753,807 | | | $ | 2,465,581,517 | |
| | | | |
| | | | |
| 20 | | MainStay VP MacKay S&P 500 Index Portfolio | | The notes to the financial statements are an integral part of,
and should be read in conjunction with, the financial statements. |
Financial Highlights selected per share data and ratios
| | | | | | | | | | | | | | | | | | | | | | | | | | | | |
| | | |
| | | Six months
ended
June 30, | | | | | | Year ended December 31, | |
| | | | | | | |
| Initial Class | | 2020* | | | | | | 2019 | | | 2018 | | | 2017 | | | 2016 | | | 2015 | |
| | | | | | | |
Net asset value at beginning of period | | $ | 61.70 | | | | | | | $ | 48.11 | | | $ | 52.02 | | | $ | 44.05 | | | $ | 41.29 | | | $ | 41.99 | |
| | | | | | | | | | | | | | | | | | | | | | | | | | | | |
| | | | | | | |
Net investment income (loss) (a) | | | 0.52 | | | | | | | | 1.01 | | | | 1.04 | | | | 0.80 | | | | 0.70 | | | | 0.70 | |
| | | | | | | |
Net realized and unrealized gain (loss) on investments | | | (2.45 | ) | | | | | | | 13.88 | | | | (3.15 | ) | | | 8.60 | | | | 4.02 | | | | (0.29 | ) |
| | | | | | | | | | | | | | | | | | | | | | | | | | | | |
| | | | | | | |
Total from investment operations | | | (1.93 | ) | | | | | | | 14.89 | | | | (2.11 | ) | | | 9.40 | | | | 4.72 | | | | 0.41 | |
| | | | | | | | | | | | | | | | | | | | | | | | | | | | |
| | | | | | | |
| Less distributions: | | | | | | | | | | | | | | | | | | | | | | | | | | | | |
| | | | | | | |
From net investment income | | | — | | | | | | | | (1.00 | ) | | | (0.78 | ) | | | (0.70 | ) | | | (0.70 | ) | | | (0.60 | ) |
| | | | | | | |
From net realized gain on investments | | | — | | | | | | | | (0.30 | ) | | | (1.02 | ) | | | (0.73 | ) | | | (1.26 | ) | | | (0.51 | ) |
| | | | | | | | | | | | | | | | | | | | | | | | | | | | |
| | | | | | | |
Total distributions | | | — | | | | | | | | (1.30 | ) | | | (1.80 | ) | | | (1.43 | ) | | | (1.96 | ) | | | (1.11 | ) |
| | | | | | | | | | | | | | | | | | | | | | | | | | | | |
| | | | | | | |
Net asset value at end of period | | $ | 59.77 | | | | | | | $ | 61.70 | | | $ | 48.11 | | | $ | 52.02 | | | $ | 44.05 | | | $ | 41.29 | |
| | | | | | | | | | | | | | | | | | | | | | | | | | | | |
| | | | | | | |
Total investment return (b) | | | (3.13 | %) | | | | | | | 31.25 | % | | | (4.52 | %) | | | 21.49 | % | | | 11.62 | % | | | 1.10 | % |
| | | | | | | |
| Ratios (to average net assets)/Supplemental Data: | | | | | | | | | | | | | | | | | | | | | | | | | | | | |
| | | | | | | |
Net investment income (loss) | | | 1.82 | % †† | | | | | | | 1.80 | % | | | 1.95 | % | | | 1.65 | % | | | 1.66 | % | | | 1.67 | % |
| | | | | | | |
Net expenses (c) | | | 0.15 | % †† | | | | | | | 0.16 | % | | | 0.16 | % | | | 0.22 | % | | | 0.28 | % | | | 0.27 | % |
| | | | | | | |
Expenses (before waiver/reimbursement) (c) | | | 0.19 | % †† | | | | | | | 0.19 | % | | | 0.19 | % | | | 0.23 | % | | | 0.28 | % | | | 0.27 | % |
| | | | | | | |
Portfolio turnover rate | | | 1 | % | | | | | | | 7 | % | | | 9 | % | | | 3 | % | | | 3 | % | | | 3 | % |
| | | | | | | |
Net assets at end of period (in 000’s) | | $ | 1,271,243 | | | | | | | $ | 1,123,943 | | | $ | 1,001,911 | | | $ | 1,156,346 | | | $ | 899,633 | | | $ | 1,017,929 | |
| (a) | Per share data based on average shares outstanding during the period. |
| (b) | Total return does not reflect any deduction of sales charges, mortality and expense charges, contract charges or administrative charges. For periods of less than one year, total return is not annualized. |
| (c) | In addition to the fees and expenses which the Portfolio bears directly, it also indirectly bears a pro-rata share of the fees and expenses of the underlying funds in which it invests. Such indirect expenses are not included in the above expense ratios. |
| | | | | | |
The notes to the financial statements are an integral part of,
and should be read in conjunction with, the financial statements. | | | | | 21 | |
Financial Highlights selected per share data and ratios
| | | | | | | | | | | | | | | | | | | | | | | | | | | | |
| | | |
| | | Six months
ended
June 30, | | | | | | Year ended December 31, | |
| | | | | | | |
| Service Class | | 2020* | | | | | | 2019 | | | 2018 | | | 2017 | | | 2016 | | | 2015 | |
| | | | | | | |
Net asset value at beginning of period | | $ | 61.19 | | | | | | | $ | 47.74 | | | $ | 51.66 | | | $ | 43.80 | | | $ | 41.08 | | | $ | 41.79 | |
| | | | | | | | | | | | | | | | | | | | | | | | | | | | |
| | | | | | | |
Net investment income (loss) (a) | | | 0.45 | | | | | | | | 0.86 | | | | 0.90 | | | | 0.67 | | | | 0.59 | | | | 0.60 | |
| | | | | | | |
Net realized and unrealized gain (loss) on investments | | | (2.44 | ) | | | | | | | 13.77 | | | | (3.13 | ) | | | 8.54 | | | | 4.00 | | | | (0.28 | ) |
| | | | | | | | | | | | | | | | | | | | | | | | | | | | |
| | | | | | | |
Total from investment operations | | | (1.99 | ) | | | | | | | 14.63 | | | | (2.23 | ) | | | 9.21 | | | | 4.59 | | | | 0.32 | |
| | | | | | | | | | | | | | | | | | | | | | | | | | | | |
| | | | | | | |
| Less distributions: | | | | | | | | | | | | | | | | | | | | | | | | | | | | |
| | | | | | | |
From net investment income | | | — | | | | | | | | (0.88 | ) | | | (0.67 | ) | | | (0.62 | ) | | | (0.61 | ) | | | (0.52 | ) |
| | | | | | | |
From net realized gain on investments | | | — | | | | | | | | (0.30 | ) | | | (1.02 | ) | | | (0.73 | ) | | | (1.26 | ) | | | (0.51 | ) |
| | | | | | | | | | | | | | | | | | | | | | | | | | | | |
| | | | | | | |
Total distributions | | | — | | | | | | | | (1.18 | ) | | | (1.69 | ) | | | (1.35 | ) | | | (1.87 | ) | | | (1.03 | ) |
| | | | | | | | | | | | | | | | | | | | | | | | | | | | |
| | | | | | | |
Net asset value at end of period | | $ | 59.20 | | | | | | | $ | 61.19 | | | $ | 47.74 | | | $ | 51.66 | | | $ | 43.80 | | | $ | 41.08 | |
| | | | | | | | | | | | | | | | | | | | | | | | | | | | |
| | | | | | | |
Total investment return (b) | | | (3.25 | %) | | | | | | | 30.92 | % | | | (4.76 | %) | | | 21.19 | % | | | 11.34 | % | | | 0.85 | % |
| | | | | | | |
| Ratios (to average net assets)/Supplemental Data: | | | | | | | | | | | | | | | | | | | | | | | | | | | | |
| | | | | | | |
Net investment income (loss) | | | 1.57 | % †† | | | | | | | 1.54 | % | | | 1.70 | % | | | 1.40 | % | | | 1.41 | % | | | 1.42 | % |
| | | | | | | |
Net expenses (c) | | | 0.40 | % †† | | † | | | | | 0.41 | % | | | 0.41 | % | | | 0.47 | % | | | 0.53 | % | | | 0.52 | % |
| | | | | | | |
Expenses (before waiver/reimbursement) (c) | | | 0.44 | % †† | | | | | | | 0.44 | % | | | 0.44 | % | | | 0.48 | % | | | 0.53 | % | | | 0.52 | % |
| | | | | | | |
Portfolio turnover rate | | | 1 | % | | | | | | | 7 | % | | | 9 | % | | | 3 | % | | | 3 | % | | | 3 | % |
| | | | | | | |
Net assets at end of period (in 000’s) | | $ | 1,360,511 | | | | | | | $ | 1,341,639 | | | $ | 920,531 | | | $ | 897,611 | | | $ | 613,011 | | | $ | 476,730 | |
| (a) | Per share data based on average shares outstanding during the period. |
| (b) | Total return does not reflect any deduction of sales charges, mortality and expense charges, contract charges or administrative charges. For periods of less than one year, total return is not annualized. |
| (c) | In addition to the fees and expenses which the Portfolio bears directly, it also indirectly bears a pro-rata share of the fees and expenses of the underlying funds in which it invests. Such indirect expenses are not included in the above expense ratios. |
| | | | |
| 22 | | MainStay VP MacKay S&P 500 Index Portfolio | | The notes to the financial statements are an integral part of,
and should be read in conjunction with, the financial statements. |
Notes to Financial Statements (Unaudited)
Note 1–Organization and Business
MainStay VP Funds Trust (the ‘‘Fund’’) was organized as a Delaware statutory trust on February 1, 2011. The Fund is registered under the Investment Company Act of 1940, as amended (the “1940 Act”), as an open-end management investment company. The Fund is comprised of thirty-one separate series (collectively referred to as the “Portfolios”). These financial statements and notes relate to the MainStay VP MacKay S&P 500 Index Portfolio (the “Portfolio”), a “diversified” portfolio, as that term is defined in the 1940 Act, as interpreted or modified by regulatory authorities having jurisdiction, from time to time.
Shares of the Portfolio are currently offered to certain separate accounts to fund variable annuity policies and variable universal life insurance policies issued by New York Life Insurance and Annuity Corporation (“NYLIAC”), a wholly-owned subsidiary of New York Life Insurance Company (“New York Life”) and may also be offered to fund variable annuity policies and variable universal life insurance policies issued by other insurance companies. NYLIAC allocates shares of the Portfolios to, among others, certain NYLIAC separate accounts. Shares of the Portfolio are also offered to the MainStay VP Conservative Allocation Portfolio, MainStay VP Moderate Allocation Portfolio, MainStay VP Moderate Growth Allocation Portfolio and MainStay VP Growth Allocation Portfolio, which operate as “funds-of-funds,” and other variable insurance funds.
The Portfolio currently offers two classes of shares. Initial Class shares commenced operations on January 29, 1993. Service Class shares commenced operations on June 5, 2003. Shares of the Portfolio are offered and are redeemed at a price equal to their respective net asset value (“NAV”) per share. No sales or redemption charge is applicable to the purchase or redemption of the Portfolio’s shares. Under the terms of the Fund’s multiple class plan adopted pursuant to Rule 18f-3 under the 1940 Act, the classes differ in that, among other things, Service Class shares of the Portfolio pay a combined distribution and service fee of 0.25% of average daily net assets attributable to Service Class shares of the Portfolio to the Distributor (as defined in Note 3(B)) pursuant to a plan adopted in accordance with Rule 12b-1 under the 1940 Act. Contract owners of variable annuity contracts purchased after June 2, 2003, are permitted to invest only in the Service Class shares.
The Portfolio’s investment objective is to seek investment results that correspond to the total return performance (reflecting reinvestment of dividends) of common stocks in the aggregate, as represented by the S&P 500® Index.
Note 2–Significant Accounting Policies
The Portfolio is an investment company and accordingly follows the investment company accounting and reporting guidance of the Financial Accounting Standards Board (“FASB”) Accounting Standard Codification Topic 946 Financial Services—Investment Companies. The Portfolio prepares its financial statements in accordance with generally accepted accounting principles (“GAAP”) in the United States of America and follows the significant accounting policies described below.
(A) Securities Valuation. Investments are usually valued as of the close of regular trading on the New York Stock Exchange (the “Exchange”) (usually 4:00 p.m. Eastern time) on each day the Portfolio is open for business (“valuation date”).
The Board of Trustees of the Fund (the “Board”) adopted procedures establishing methodologies for the valuation of the Portfolio’s securities and other assets and delegated the responsibility for valuation determinations under those procedures to the Valuation Committee of the Fund (the “Valuation Committee”). The procedures state that, subject to the oversight of the Board and unless otherwise noted, the responsibility for the day-to-day valuation of portfolio assets (including fair value measurements for the Portfolio’s assets and liabilities) rests with New York Life Investment Management LLC (“New York Life Investments” or the “Manager”), aided to whatever extent necessary by the Subadvisor (as defined in Note 3(A)). To assess the appropriateness of security valuations, the Manager, the Subadvisor or the Portfolio’s third-party service provider, who is subject to oversight by the Manager, regularly compares prior day prices, prices on comparable securities and the sale prices to the prior and current day prices and challenges prices with changes exceeding certain tolerance levels with third-party pricing services or broker sources.
The Board authorized the Valuation Committee to appoint a Valuation Subcommittee (the “Subcommittee”) to establish the prices of securities for which market quotations are not readily available or the prices of which are not otherwise readily determinable under the procedures. The Subcommittee meets (in person, via electronic mail or via teleconference) on an as-needed basis. The Valuation Committee meets to ensure that actions taken by the Subcommittee were appropriate.
For those securities valued through either a standardized fair valuation methodology or a fair valuation measurement, the Subcommittee deals with such valuation and the Valuation Committee reviews and affirms, if appropriate, the reasonableness of the valuation based on such methodologies and measurements on a regular basis after considering information that is reasonably available and deemed relevant by the Valuation Committee. Any action taken by the Subcommittee with respect to the valuation of a portfolio security or other asset is submitted for review and ratification (if appropriate) to the Valuation Committee and the Board at the next regularly scheduled meeting.
“Fair value” is defined as the price the Portfolio would reasonably expect to receive upon selling an asset or liability in an orderly transaction to an independent buyer in the principal or most advantageous market for the asset or liability. Fair value measurements are determined within a framework that establishes a three-tier hierarchy that maximizes the use of observable market data and minimizes the use of unobservable inputs to establish a classification of fair value measurements for disclosure purposes. “Inputs” refer broadly to the assumptions that market participants would use in pricing the asset or liability, including assumptions about risk, such as the risk inherent in a particular valuation technique used to measure fair value using a pricing model and/or the risk inherent in the inputs for the valuation technique. Inputs may be observable or unobservable. Observable inputs reflect the assumptions market participants would use in pricing the asset or liability based on market data obtained from sources independent of the Portfolio. Unobservable inputs reflect the Portfolio’s own assumptions about the assumptions market participants would use in pricing the asset or liability based on the information available. The inputs or methodology used for valuing assets or liabilities may not be an indication of the risks associated with investing in those assets or liabilities. The three-tier hierarchy of inputs is summarized below.
| • | | Level 1—quoted prices in active markets for an identical asset or liability |
Notes to Financial Statements (Unaudited) (continued)
| • | | Level 2—other significant observable inputs (including quoted prices for a similar asset or liability in active markets, interest rates and yield curves, prepayment speeds, credit risk, etc.) |
| • | | Level 3—significant unobservable inputs (including the Portfolio’s own assumptions about the assumptions that market participants would use in measuring fair value of an asset or liability) |
The level of an asset or liability within the fair value hierarchy is based on the lowest level of an input, both individually and in the aggregate, that is significant to the fair value measurement. The aggregate value by input level of the Portfolio’s assets and liabilities as of June 30, 2020 is included at the end of the Portfolio of Investments.
The Portfolio may use third-party vendor evaluations, whose prices may be derived from one or more of the following standard inputs, among others:
| | |
• Broker/dealer quotes | | • Benchmark securities |
• Two-sided markets | | • Reference data (corporate actions or material event notices) |
• Bids/offers | | • Monthly payment information |
• Industry and economic events | | • Reported trades |
An asset or liability for which market values cannot be measured using the methodologies described above is valued by methods deemed reasonable in good faith by the Valuation Committee, following the procedures established by the Board, to represent fair value. Under these procedures, the Portfolio generally uses a market-based approach which may use related or comparable assets or liabilities, recent transactions, market multiples, book values and other relevant information. The Portfolio may also use an income-based valuation approach in which the anticipated future cash flows of the asset or liability are discounted to calculate fair value. Discounts may also be applied due to the nature and/or duration of any restrictions on the disposition of the asset or liability. Fair value represents a good faith approximation of the value of a security. Fair value determinations involve the consideration of a number of subjective factors, an analysis of applicable facts and circumstances and the exercise of judgment. As a result, it is possible that the fair value for a security determined in good faith in accordance with the Portfolio’s valuation procedures may differ from valuations for the same security determined by other funds using their own valuation procedures. Although the Portfolio’s valuation procedures are designed to value a security at the price the Portfolio may reasonably expect to receive upon the security’s sale in an orderly transaction, there can be no assurance that any fair value determination thereunder would, in fact, approximate the amount that the Portfolio would actually realize upon the sale of the security or the price at which the security would trade if a reliable market price were readily available. During the six-month period ended June 30, 2020, there were no material changes to the fair value methodologies.
Securities which may be valued in this manner include, but are not limited to: (i) a security for which trading has been halted or suspended; (ii) a debt security that has recently gone into default and for which there is not a current market quotation; (iii) a security of an issuer that has entered into a restructuring; (iv) a security that has been delisted from a national exchange; (v) a security for which the market price is not readily available from a third-party pricing source or, if so provided,
does not, in the opinion of the Manager or the Subadvisor, reflect the security’s market value; (vi) a security subject to trading collars for which no or limited trading takes place; and (vii) a security whose principal market has been temporarily closed at a time when, under normal conditions, it would be open. Securities valued in this manner are generally categorized as Level 3 in the hierarchy. As of June 30, 2020, no securities held by the Portfolio were fair valued in such a manner.
Equity securities, including exchange-traded funds (“ETFs”), are valued at the last quoted sales prices as of the close of regular trading on the relevant exchange on each valuation date. Securities that are not traded on the valuation date are valued at the mean of the last quoted bid and ask prices. Prices are normally taken from the principal market in which each security trades. Futures contracts are valued at the last posted settlement price on the market where such futures are primarily traded. These securities are generally categorized as Level 1 in the hierarchy.
Debt securities (other than convertible and municipal bonds) are valued at the evaluated bid prices (evaluated mean prices in the case of convertible and municipal bonds) supplied by a pricing agent or broker selected by the Manager, in consultation with the Subadvisor. The evaluations are market-based measurements processed through a pricing application and represents the pricing agent’s good faith determination as to what a holder may receive in an orderly transaction under market conditions. The rules based logic utilizes valuation techniques that reflect participants’ assumptions and vary by asset class and per methodology, maximizing the use of relevant observable data including quoted prices for similar assets, benchmark yield curves and market corroborated inputs. The evaluated bid or mean prices are deemed by the Manager, in consultation with the Subadvisor to be representative of market values at the regular close of trading of the Exchange on each valuation date. Debt securities purchased on a delayed delivery basis are marked to market daily until settlement at the forward settlement date. Debt securities, including corporate bonds, U.S. government and federal agency bonds, municipal bonds, foreign bonds, convertible bonds, asset-backed securities and mortgage-backed securities are generally categorized as Level 2 in the hierarchy.
Investments in mutual funds, including money market funds, are valued at their respective NAVs as of the close of the Exchange on the valuation date. These securities are generally categorized as Level 1 in the hierarchy.
Debt securities (other than convertible and municipal bonds) are valued at the evaluated bid prices (evaluated mean prices in the case of convertible and municipal bonds) supplied by a pricing agent or broker selected by the Manager, in consultation with the Subadvisor. The evaluations are market-based measurements processed through a pricing application and represents the pricing agent’s good faith determination as to what a holder may receive in an orderly transaction under market conditions. The rules based logic utilizes valuation techniques that reflect participants’ assumptions and vary by asset class and per methodology, maximizing the use of relevant observable data including quoted prices for similar assets, benchmark yield curves and market corroborated inputs. The evaluated bid or mean prices are deemed by the Manager, in consultation with the Subadvisor, to be representative of market values at the regular close of trading of the Exchange on each valuation date. Debt securities purchased on a
| | |
| 24 | | MainStay VP MacKay S&P 500 Index Portfolio |
delayed delivery basis are marked to market daily until settlement at the forward settlement date. Debt securities, including corporate bonds, U.S. government and federal agency bonds, municipal bonds, foreign bonds, convertible bonds, asset-backed securities and mortgage-backed securities are generally categorized as Level 2 in the hierarchy.
Temporary cash investments acquired in excess of 60 days to maturity at the time of purchase are valued using the latest bid prices or using valuations based on a matrix system (which considers such factors as security prices, yields, maturities and ratings), both as furnished by independent pricing services. Temporary cash investments that mature in 60 days or less at the time of purchase (“Short-Term Investments”) are valued using the amortized cost method of valuation, unless the use of such method would be inappropriate. The amortized cost method involves valuing a security at its cost on the date of purchase and thereafter assuming a constant amortization to maturity of the difference between such cost and the value on maturity date. Amortized cost approximates the current fair value of a security. Securities valued using the amortized cost method are not valued using quoted prices in an active market and are generally categorized as Level 2 in the hierarchy.
The information above is not intended to reflect an exhaustive list of the methodologies that may be used to value portfolio investments. The valuation procedures permit the use of a variety of valuation methodologies in connection with valuing portfolio investments. The methodology used for a specific type of investment may vary based on the market data available or other considerations. The methodologies summarized above may not represent the specific means by which portfolio investments are valued on any particular business day.
(B) Income Taxes. The Portfolio’s policy is to comply with the requirements of the Internal Revenue Code of 1986, as amended (the “Internal Revenue Code”), applicable to regulated investment companies and to distribute all of its taxable income to the shareholders of the Portfolio within the allowable time limits.
The Manager evaluates the Portfolio’s tax positions to determine if the tax positions taken meet the minimum recognition threshold in connection with accounting for uncertainties in income tax positions taken or expected to be taken for the purposes of measuring and recognizing tax liabilities in the financial statements. Recognition of tax benefits of an uncertain tax position is permitted only to the extent the position is “more likely than not” to be sustained assuming examination by taxing authorities. The Manager analyzed the Portfolio’s tax positions taken on federal, state and local income tax returns for all open tax years (for up to three tax years) and has concluded that no provisions for federal, state and local income tax are required in the Portfolio’s financial statements. The Portfolio’s federal, state and local income tax and federal excise tax returns for tax years for which the applicable statutes of limitations have not expired are subject to examination by the Internal Revenue Service and state and local departments of revenue.
(C) Dividends and Distributions to Shareholders. Dividends and distributions are recorded on the ex-dividend date. The Portfolio intends to declare and pay dividends from net investment income and distributions from net realized capital and currency gains, if any, at least annually. Unless a shareholder elects otherwise, all dividends and distributions are reinvested at NAV in the same class of shares of the Portfolio. Dividends and distributions to shareholders are determined in accordance with federal income tax regulations and may differ from determinations using GAAP.
(D) Security Transactions and Investment Income. The Portfolio records security transactions on the trade date. Realized gains and losses on security transactions are determined using the identified cost method. Dividend income is recognized on the ex-dividend date, net of any foreign tax withheld at the source, and interest income is accrued as earned using the effective interest rate method. Distributions received from real estate investment trusts may be classified as dividends, capital gains and/or return of capital.
Investment income and realized and unrealized gains and losses on investments of the Portfolio are allocated pro rata to the separate classes of shares based upon their relative net assets on the date the income is earned or realized and unrealized gains and losses are incurred.
(E) Expenses. Expenses of the Fund are allocated to the individual Portfolios in proportion to the net assets of the respective Portfolios when the expenses are incurred, except where direct allocations of expenses can be made. Expenses (other than fees incurred under the distribution and service plans, further discussed in Note 3(B), which are charged directly to the Service Class shares) are allocated to separate classes of shares pro rata based upon their relative net assets on the date the expenses are incurred. The expenses borne by the Portfolio, including those of related parties to the Portfolio, are shown in the Statement of Operations.
Additionally, the Portfolio may invest in mutual funds, which are subject to management fees and other fees that may cause the costs of investing in mutual funds to be greater than the costs of owning the underlying securities directly. These indirect expenses of mutual funds are not included in the amounts shown as expenses in the Portfolio’s Statement of Operations or in the expense ratios included in the Financial Highlights.
(F) Use of Estimates. In preparing financial statements in conformity with GAAP, the Manager makes estimates and assumptions that affect the reported amounts and disclosures in the financial statements. Actual results could differ from those estimates.
(G) Repurchase Agreements. The Portfolio may enter into repurchase agreements (i.e., buy a security from another party with the agreement that it will be sold back in the future) to earn income. The Portfolio may enter into repurchase agreements only with counterparties, usually financial institutions, that are deemed by the Manager or the Subadvisor to be creditworthy, pursuant to guidelines established by the Board. During the term of any repurchase agreement, the Manager or the Subadvisor will continue to monitor the creditworthiness of the counterparty. Under the 1940 Act, repurchase agreements are considered to be collateralized loans by the Portfolio to the counterparty secured by the securities transferred to the Portfolio.
Repurchase agreements are subject to counterparty risk, meaning the Portfolio could lose money by the counterparty’s failure to perform under the terms of the agreement. The Portfolio mitigates this risk by ensuring the repurchase agreement is collateralized by cash, U.S. government securities, fixed income securities and/or other securities. The collateral is held by the Portfolio’s custodian and valued daily on a mark to market basis to determine if the value, including accrued interest, exceeds the repurchase price. In the event of the counterparty’s default on the obligation to repurchase, the Portfolio has the
Notes to Financial Statements (Unaudited) (continued)
right to liquidate the collateral and apply the proceeds in satisfaction of the obligation. Under certain circumstances, such as in the event of default or bankruptcy by the counterparty, realization and/or retention of the collateral may be limited or subject to delay, to legal proceedings and possible realized loss to the Portfolio. As of June 30, 2020, the Portfolio did not hold any repurchase agreements.
(H) Futures Contracts. A futures contract is an agreement to purchase or sell a specified quantity of an underlying instrument at a specified future date and price, or to make or receive a cash payment based on the value of a financial instrument (e.g., foreign currency, interest rate, security or securities index). The Portfolio is subject to risks such as market price risk and/or interest rate risk in the normal course of investing in these contracts. Upon entering into a futures contract, the Portfolio is required to pledge to the broker or futures commission merchant an amount of cash and/or U.S. government securities equal to a certain percentage of the collateral amount, known as the “initial margin.” During the period the futures contract is open, changes in the value of the contract are recognized as unrealized appreciation or depreciation by marking to market such contract on a daily basis to reflect the market value of the contract at the end of each day’s trading. The Portfolio agrees to receive from or pay to the broker or futures commission merchant an amount of cash equal to the daily fluctuation in the value of the contract. Such receipts or payments are known as “variation margin.” When the futures contract is closed, the Portfolio records a realized gain or loss equal to the difference between the proceeds from (or cost of) the closing transaction and the Portfolio’s basis in the contract.
The use of futures contracts involves, to varying degrees, elements of market risk in excess of the amount recognized in the Statement of Assets and Liabilities. The contract or notional amounts and variation margin reflect the extent of the Portfolio’s involvement in open futures positions. There are several risks associated with the use of futures contracts as hedging techniques. There can be no assurance that a liquid market will exist at the time when the Portfolio seeks to close out a futures contract. If no liquid market exists, the Portfolio would remain obligated to meet margin requirements until the position is closed. Futures contracts may involve a small initial investment relative to the risk assumed, which could result in losses greater than if the Portfolio did not invest in futures contracts. Futures contracts may be more volatile than direct investments in the instrument underlying the futures and may not correlate to the underlying instrument, causing a given hedge not to achieve its objectives. The Portfolio’s activities in futures contracts have minimal counterparty risk as they are conducted through regulated exchanges that guarantee the futures against default by the counterparty. In the event of a bankruptcy or insolvency of a futures commission merchant that holds margin on behalf of the Portfolio, the Portfolio may not be entitled to the return of the entire margin owed to the Portfolio, potentially resulting in a loss. The Portfolio’s investment in futures contracts and other derivatives may increase the volatility of the Portfolio’s NAVs and may result in a loss to the Portfolio. Open futures contracts as of June 30, 2020, are shown in the Portfolio of Investments.
(I) Securities Lending. In order to realize additional income, the Portfolio may engage in securities lending, subject to the limitations set forth in the 1940 Act and relevant guidance by the staff of the Securities
and Exchange Commission (“SEC”). If the Portfolio engages in securities lending, the Portfolio will lend through its custodian, currently State Street Bank and Trust Company (“State Street”), acting as securities lending agent on behalf of the Portfolio. Under the current arrangement, State Street will manage the Portfolio’s collateral in accordance with the securities lending agency agreement between the Portfolio and State Street, and indemnify the Portfolio against counterparty risk. The loans will be collateralized by cash (which may be invested in a money market fund) and/or non-cash collateral (which may include U.S. Treasury securities and/or U.S. government agency securities issued or guaranteed by the United States government or its agencies or instrumentalities) at least equal at all times to the market value of the securities loaned. The Portfolio bears the risk of delay in recovery of, or loss of rights in, the securities loaned. The Portfolio may also record a realized gain or loss on securities deemed sold due to a borrower’s inability to return securities on loan. The Portfolio bears the risk of any loss on investment of cash collateral. The Portfolio will receive compensation for lending its securities in the form of fees or it will retain a portion of interest earned on the investment of any cash collateral. The Portfolio will also continue to receive interest and dividends on the securities loaned and any gain or loss in the market price of the securities loaned that may occur during the term of the loan will be for the account of the Portfolio. Income earned from securities lending activities, if any, is reflected in the Statement of Operations. As of June 30, 2020, the Portfolio had securities on loan with an aggregate market value of $1,522,667; the total market value of collateral held by the Portfolio was $1,580,777. The market value of the collateral held included non-cash collateral, in the form of U.S. Treasury securities, with a value of $865,885 and cash collateral, which was invested into the State Street Navigator Securities Lending Government Money Market Portfolio, with a value of $714,892.
(J) Securities Risk. The ability of issuers of debt securities held by the Portfolio to meet their obligations may be affected by, among other things, economic or political developments in a specific country, industry or region. Debt securities are also subject to the risks associated with changes in interest rates.
(K) Indemnifications. Under the Fund’s organizational documents, its officers and trustees are indemnified against certain liabilities that may arise out of performance of their duties to the Fund. Additionally, in the normal course of business, the Portfolio enters into contracts with third-party service providers that contain a variety of representations and warranties and that may provide general indemnifications. The Portfolio’s maximum exposure under these arrangements is unknown, as this would involve future claims that may be made against the Portfolio that have not yet occurred. The Manager believes that the risk of loss in connection with these potential indemnification obligations is remote. However, there can be no assurance that material liabilities related to such obligations will not arise in the future, which could adversely impact the Portfolio.
(L) Quantitative Disclosure of Derivative Holdings. The following tables show additional disclosures related to the Portfolio’s derivative and hedging activities, including how such activities are accounted for and their effect on the Portfolio’s financial positions, performance and cash flows. The Portfolio entered into futures contracts to help manage the duration and yield curve positioning of the portfolio
| | |
| 26 | | MainStay VP MacKay S&P 500 Index Portfolio |
while minimizing the exposure to wider bid/ask spreads in traditional bonds. These derivatives are not accounted for as hedging instruments.
Fair value of derivative instruments as of June 30, 2020:
Asset Derivatives
| | | | | | | | | | |
| | | Statement of
Assets and
Liabilities
Location | | Equity
Contracts
Risk | | | Total | |
| | | |
Futures Contracts | | Net Assets—Net unrealized appreciation on investments and futures contracts (a) | | $ | 568,165 | | | $ | 568,165 | |
| | | | | | |
Total Fair Value | | | | $ | 568,165 | | | $ | 568,165 | |
| | | | | | |
| (a) | Includes cumulative appreciation (depreciation) of futures contracts as reported in the Portfolio of Investments. Only current day’s variation margin is reported within the Statement of Assets and Liabilities. |
The effect of derivative instruments on the Statement of Operations for the period ended June 30, 2020:
Realized Gain (Loss)
| | | | | | | | | | |
| | | Statement of
Operations
Location | | Equity
Contracts
Risk | | | Total | |
| | | |
Futures Contracts | | Net realized gain (loss) on futures transactions | | $ | 19,923,943 | | | $ | 19,923,943 | |
| | | | | | |
Total Realized Gain (Loss) | | | | $ | 19,923,943 | | | $ | 19,923,943 | |
| | | | | | |
Change in Unrealized Appreciation (Depreciation)
| | | | | | | | | | |
| | | Statement of
Operations
Location | | Equity
Contracts
Risk | | | Total | |
| | | |
Futures Contracts | | Net change in unrealized appreciation (depreciation) on futures contracts | | $ | (478,129 | ) | | $ | (478,129 | ) |
| | | | | | |
Total Change in Unrealized Appreciation (Depreciation) | | | | $ | (478,129 | ) | | $ | (478,129 | ) |
| | | | | | |
Average Notional Amount
| | | | | | | | |
| | | Equity
Contracts
Risk | | | Total | |
| | |
Futures Contracts Long | | $ | 131,339,650 | | | $ | 131,339,650 | |
| | | | |
Note 3–Fees and Related Party Transactions
(A) Manager and Subadvisor. New York Life Investments, a registered investment adviser and an indirect, wholly-owned subsidiary of New York Life, serves as the Portfolio’s Manager, pursuant to an Amended and Restated Management Agreement (“Management Agreement”). The Manager provides offices, conducts clerical, recordkeeping and bookkeeping services and keeps most of the financial and accounting records required to be maintained by the Portfolio. Except for the portion of salaries and expenses that are the responsibility of the Portfolio, the Manager pays the salaries and expenses of all personnel affiliated with the Portfolio and certain operational expenses of the Portfolio. The Portfolio reimburses New York Life Investments in an amount equal to the portion of the compensation of the Chief Compliance Officer attributable to the Portfolio. MacKay Shields LLC (“MacKay Shields” or the “Subadvisor”), a registered investment adviser and an indirect, wholly-owned subsidiary of New York Life, serves as Subadvisor to the Portfolio and is responsible for the day-to-day portfolio management of the Portfolio. Pursuant to the terms of an Amended and Restated Subadvisory Agreement (“Subadvisory Agreement”) between New York Life Investments and MacKay Shields, New York Life Investments pays for the services of the Subadvisor.
The Fund, on behalf of the Portfolio, pays New York Life Investments in its capacity as the Portfolio’s investment manager and administrator, pursuant to the Management Agreement, a monthly fee for the services performed and the facilities furnished at an annual rate of average daily net assets as follows: 0.16% up to $2.5 billion and 0.15% in excess of $2.5 billion. During the six-month period ended June 30, 2020, the effective management fee rate was 0.16% (exclusive of any applicable waivers/reimbursements).
New York Life Investments has contractually agreed to waive fees and/or reimburse expenses so that total annual operating expenses (excluding taxes, interest, litigation, extraordinary expenses, brokerage and other transaction expenses relating to the purchase or sale of portfolio investments, and acquired (underlying) portfolio/fund fees and expenses) of Initial Class shares and Service Class shares do not exceed 0.12% and 0.37%, respectively of the Portfolio’s average daily net assets. New York Life Investments will apply an equivalent waiver or reimbursement, in an equal number of basis points to Service Class shares. This agreement will remain in effect until May 1, 2021, and shall renew automatically for one-year terms unless New York Life Investments provides written notice of termination prior to the start of the next term or upon approval of the Board.
During the six-month period ended June 30, 2020, New York Life Investments earned fees from the Portfolio in the amount of $1,903,386 and waived fees/reimbursed expenses in the amount of $475,427 and paid the Subadvisor in the amount of $713,980.
State Street provides sub-administration and sub-accounting services to the Portfolio pursuant to an agreement with New York Life Investments. These services include calculating the daily NAVs of the Portfolio, maintaining the general ledger and sub-ledger accounts for the calculation of the Portfolio’s NAVs and assisting New York Life Investments in conducting various aspects of the Portfolio’s administrative operations. For providing these services to the Portfolio, State Street is compensated by New York Life Investments.
Notes to Financial Statements (Unaudited) (continued)
Pursuant to an agreement between the Fund and New York Life Investments, New York Life Investments is responsible for providing or procuring certain regulatory reporting services for the Portfolio. The Portfolio will reimburse New York Life Investments for the actual costs incurred by New York Life Investments in connection with providing or procuring these services for the Portfolio.
(B) Distribution and Service Fees. The Fund, on behalf of the Portfolio, has entered into a distribution agreement with NYLIFE Distributors LLC (the “Distributor”), an indirect, wholly-owned subsidiary of
New York Life. The Portfolio has adopted a distribution plan (the “Plan”) in accordance with the provisions of Rule 12b-1 under the 1940 Act. Under the Plan, the Distributor has agreed to provide, through its affiliates or independent third parties, various distribution-related, shareholder and administrative support services to the Service Class shareholders. For its services, the Distributor is entitled to a combined distribution and service fee accrued daily and paid monthly at an annual rate of 0.25% of the average daily net assets attributable to the Service Class shares of the Portfolio.
(C) Investments in Affiliates (in 000’s). During the six-month period ended June 30, 2020, purchases and sales transactions, income earned from investments and shares held of investment companies managed by New York Life Investments or its affiliates were as follows:
| | | | | | | | | | | | | | | | | | | | | | | | | | | | | | | | | | | | |
Affiliated Investment Company | | Value,
Beginning of
Period | | | Purchases
at Cost | | | Proceeds
from Sales | | | Net
Realized
Gain/(Loss)
on Sales | | | Change in
Unrealized
Appreciation/
(Depreciation) | | | Value,
End of
Period | | | Dividend
Income | | | Other
Distributions | | | Shares
End of
Period | |
| | | | | | | | | |
MainStay U.S. Government Liquidity Fund | | $ | 708 | | | $ | 359,952 | | | $ | (357,124 | ) | | $ | — | | | $ | — | | | $ | 3,536 | | | $ | 6 | | | $ | — | | | | 3,536 | |
Note 4–Federal Income Tax
As of June 30, 2020, the cost and unrealized appreciation (depreciation) of the Portfolio’s investment portfolio, including applicable derivative contracts and other financial instruments, as determined on a federal income tax basis, was as follows:
| | | | | | | | | | | | | | | | |
| | | Federal Tax
Cost | | | Gross
Unrealized
Appreciation | | | Gross
Unrealized
(Depreciation) | | | Net
Unrealized
Appreciation/
(Depreciation) | |
| | | | |
Investments in Securities | | $ | 1,224,895,205 | | | $ | 1,473,520,038 | | | $ | (63,221,521 | ) | | $ | 1,410,298,517 | |
During the year ended December 31, 2019, the tax character of distributions paid as reflected in the Statements of Changes in Net Assets was as follows:
| | |
|
| 2019 |
Tax-Based
Distributions from Ordinary
Income | | Tax-Based
Distributions from Long-Term
Gains |
| |
| $38,388,340 | | $9,953,992 |
Note 5–Custodian
State Street is the custodian of cash and securities held by the Portfolio. Custodial fees are charged to the Portfolio based on the Portfolio’s net assets and/or the market value of securities held by the Portfolio and the number of certain transactions incurred by the Portfolio.
Note 6–Line of Credit
The Portfolio and certain other funds managed by New York Life Investments maintain a line of credit with a syndicate of banks in order to secure a source of funds for temporary purposes to meet unanticipated or excessive redemption requests.
Effective July 28, 2020, under the credit agreement (the “Credit Agreement”), the aggregate commitment amount is $600,000,000 with
an additional uncommitted amount of $100,000,000. The commitment fee is an annual rate of 0.15% of the average commitment amount payable quarterly, regardless of usage, to JP Morgan Chase Bank NA, who serves as the agent to the syndicate. The commitment fee is allocated among the Portfolio and certain other funds managed by New York Life Investments based upon their respective net assets and other factors. Interest on any revolving credit loan is charged based upon the Federal Funds Rate or the one-month London Interbank Offered Rate (“LIBOR”), whichever is higher. The Credit Agreement expires on July 27, 2021, although the Portfolio, certain other funds managed by New York Life Investments and the syndicate of banks may renew the Credit Agreement for an additional year on the same or different terms or enter into a credit agreement with a different syndicate of banks. Prior to July 28, 2020, the aggregate commitment amount and the commitment fee were the same as those under the current Credit Agreement, but State Street served as agent to the syndicate. During the six-month period ended June 30, 2020, there were no borrowings made or outstanding with respect to the Portfolio under the Credit Agreement or the credit agreement for which State Street served as agent.
Note 7–Interfund Lending Program
Pursuant to an exemptive order issued by the SEC, the Portfolio, along with certain other funds managed by New York Life Investments, may participate in an interfund lending program. The interfund lending program provides an alternative credit facility that permits the Portfolio and certain other funds managed by New York Life Investments to lend
| | |
| 28 | | MainStay VP MacKay S&P 500 Index Portfolio |
or borrow money for temporary purposes directly to or from one another subject to the conditions of the exemptive order. During the six-month period ended June 30, 2020, there were no interfund loans made or outstanding with respect to the Portfolio.
Note 8–Purchases and Sales of Securities (in 000’s)
During the six-month period ended June 30, 2020, purchases and sales of securities, other than short-term securities, were $174,228 and $33,204, respectively.
Note 9–Capital Share Transactions
Transactions in capital shares for the six-month period ended June 30, 2020 and the year ended December 31, 2019, were as follows:
| | | | | | | | |
Initial Class | | Shares | | | Amount | |
| | |
Six-month period ended June 30, 2020: | | | | | | | | |
Shares sold | | | 4,046,651 | | | $ | 214,250,042 | |
Shares redeemed | | | (993,064 | ) | | | (55,385,181 | ) |
| | | | |
Net increase (decrease) | | | 3,053,587 | | | $ | 158,864,861 | |
| | | | |
Year ended December 31, 2019: | | | | | | | | |
Shares sold | | | 430,611 | | | $ | 23,884,514 | |
Shares issued to shareholders in reinvestment of distributions | | | 424,872 | | | | 23,519,063 | |
Shares redeemed | | | (3,463,147 | ) | | | (193,423,909 | ) |
| | | | |
Net increase (decrease) | | | (2,607,664 | ) | | $ | (146,020,332 | ) |
| | | | |
|
| |
Service Class | | Shares | | | Amount | |
| | |
Six-month period ended June 30, 2020: | | | | | | | | |
Shares sold | | | 2,838,105 | | | $ | 156,339,038 | |
Shares redeemed | | | (1,782,074 | ) | | | (101,157,265 | ) |
| | | | |
Net increase (decrease) | | | 1,056,031 | | | $ | 55,181,773 | |
| | | | |
Year ended December 31, 2019: | | | | | | | | |
Shares sold | | | 4,305,106 | | | $ | 238,494,773 | |
Shares issued to shareholders in reinvestment of distributions | | | 451,926 | | | | 24,823,269 | |
Shares redeemed | | | (2,111,869 | ) | | | (118,279,306 | ) |
| | | | |
Net increase (decrease) | | | 2,645,163 | | | $ | 145,038,736 | |
| | | | |
Note 10–Litigation
The Portfolio has been named as a defendant in the case entitled Kirschner v. FitzSimons, No. 12-2652 (S.D.N.Y.) (the “FitzSimons action”) as a result of its ownership of shares in the Tribune Company (“Tribune”) in 2007 when Tribune effected a leveraged buyout transaction (“LBO”) by which Tribune converted to a privately-held company. In its complaint, the plaintiff asserts claims against certain insiders, major shareholders, professional advisers, and others involved in the LBO. Separately, the complaint also seeks to obtain from former Tribune shareholders, including the Portfolio, any proceeds they received in connection with the LBO. The sole claim and cause of action brought against the Portfolio is for fraudulent conveyance pursuant to United States Bankruptcy Code Section 548(a)(1)(A).
In June 2011, certain Tribune creditors filed numerous additional actions asserting state law constructive fraudulent conveyance claims
(the “SLCFC actions”) against specifically-named former Tribune shareholders and, in some cases, putative defendant classes comprised of former Tribune shareholders. One of the SLCFC actions, entitled Deutsche Bank Trust Co. Americas v. Blackrock Institutional Trust Co., No. 11-9319 (S.D.N.Y.) (the “Deutsche Bank action”), named the Portfolio as a defendant.
The FitzSimons action and Deutsche Bank action have been consolidated with the majority of the other Tribune LBO related lawsuits in a multidistrict litigation proceeding entitled In re Tribune Co. Fraudulent Conveyance Litig., No. 11-md-2296 (S.D.N.Y.) (the “MDL Proceeding”).
On September 23, 2013, the District Court granted the defendants’ motion to dismiss the SLCFC actions, including the Deutsche Bank action, on the basis that the plaintiffs did not have standing to pursue their claims. On September 30, 2013, the plaintiffs in the SLCFC actions filed a notice of appeal to the United States Court of Appeals for the Second Circuit. On October 28, 2013, the defendants filed a joint notice of cross-appeal of that same order. On March 29, 2016, the United States Court of Appeals for the Second Circuit issued its opinion on the appeal of the SLCFC actions. The appeals court affirmed the District Court’s dismissal of those lawsuits, but on different grounds than the District Court. The appeals court held that while the plaintiffs have standing under the U.S. Bankruptcy Code, their claims were preempted by Section 546(e) of the Bankruptcy Code-the statutory safe harbor for settlement payments. On April 12, 2016 the Plaintiffs in the SLCFC actions filed a petition seeking rehearing en banc before the appeals court. On July 22, 2016, the appeals court denied the petition. On September 9, 2016, the plaintiffs filed a petition for writ of certiorari in the U.S. Supreme Court challenging the Second Circuit’s decision that the safe harbor of Section 546(e) applied to their claims. Certain shareholder defendants filed a joint brief in opposition to the petition for certiorari on October 24, 2016. The plaintiffs filed a reply in support of the petition on November 4, 2016. On April 3, 2018, Justice Kennedy and Justice Thomas issued a “Statement” related to the petition for certiorari noting that “there might not be a quorum in [the Supreme Court]” to rule suggesting that the Second Circuit and/or District Court may want to take steps to reexamine the application of the Section 546(e) safe harbor to the previously dismissed state law constructive fraudulent transfer claims based on the Supreme Court’s decision in Merit Management Group LP v. FTI Consulting, Inc. On April 10, 2018, the plaintiffs filed in the Second Circuit a motion for that court to recall its mandate, vacate its prior decision, and remand to the District Court for further proceedings consistent with Merit Management. On April 20, 2018, the shareholder defendants filed a response to the plaintiffs’ motion to recall the mandate. On May 15, 2018, the Second Circuit issued an order recalling the mandate “in anticipation of further panel review.” On December 19, 2019, the Second Circuit issued an amended opinion that again affirmed the district court’s ruling on the basis that plaintiffs’ claims were preempted by Section 546(e) of the Bankruptcy Code. Plaintiffs filed a motion for rehearing and rehearing en banc on January 2, 2020, which was denied on February 6, 2020. On July 6, 2020, the plaintiffs filed a new petition for a writ of certiorari in the U.S. Supreme Court. In that petition, the plaintiffs stated that “[t]o make it more likely that there will be a quorum for this petition,” they have “abandon[ed] the case and let the judgment below stand” with respect to certain defendants, the Fund, as issuer of the Portfolio.
Notes to Financial Statements (Unaudited) (continued)
On August 2, 2013, the plaintiff in the FitzSimons action filed a Fifth Amended Complaint. On May 23, 2014, the defendants filed motions to dismiss the FitzSimons action, including a global motion to dismiss Count I, which is the claim brought against former Tribune shareholders, for intentional fraudulent conveyance under U.S. federal law.
On January 6, 2017, the United States District Court for the Southern District of New York granted the shareholder defendants’ motion to dismiss the intentional fraudulent conveyance claim in the FitzSimons action. In dismissing the intentional fraudulent conveyance claim, the Court denied the plaintiff’s request to amend the complaint. While the District Court’s dismissal of the intentional fraudulent conveyance claim was not immediately appealable, the Trustee asked the District Court to enter judgment immediately so that an appeal could be taken. On February 23, 2017, the Court issued an order stating that it intended to permit an interlocutory appeal of the dismissal order, but would wait to do so until it has resolved outstanding motions to dismiss filed by other defendants.
On July 18, 2017, the plaintiff submitted a letter to the District Court seeking leave to amend its complaint to add a constructive fraudulent transfer claim. The shareholder defendants opposed that request.
On August 24, 2017, the Court denied the plaintiff’s request without prejudice to renewal of the request in the event of an intervening change in the law. On March 8, 2018, the plaintiff renewed the request for leave to file a motion to amend the complaint to assert a constructive fraudulent transfer claim based on the Supreme Court’s ruling in Merit Management. The shareholder defendants opposed that request. On June 18, 2018, the District Court ordered that the request would be stayed pending further action by the Second Circuit in the still-pending appeal, discussed above. On December 18, 2018, the plaintiff filed a letter with the District Court requesting that the stay be dissolved in order to permit briefing on the motion to amend the complaint and indicating the plaintiff’s intention to file another motion to amend the complaint to reinstate claims for intentional fraudulent transfer. The shareholder defendants opposed that request. On January 14, 2019, the Court held a case management conference, during which the Court stated that it would not lift the stay prior to further action from the Second Circuit. The Court stated that it would allow the plaintiff to file a motion to amend to try to reinstate its intentional fraudulent transfer claim. On January 23, 2019, the Court ordered the parties still facing pending claims to participate in a mediation. On March 27, 2019, the Court held a telephone conference and decided to allow the plaintiff to file a motion for leave to amend. On April 4, 2019, the plaintiff filed a motion to amend the Fifth Amended Complaint to assert a federal constructive fraudulent transfer claim against certain shareholder defendants. On April 10, 2019, the shareholder defendants filed a brief in opposition to the plaintiff’s motion to amend. On April 12, 2019, the plaintiff filed a reply brief. The Court denied leave to amend the complaint on April 23, 2019. On June 13, 2019, the Court entered judgment pursuant to Rule 54(b), which would permit an appeal of the Court’s dismissal of the claim against the shareholder defendants. On July 15, 2019, the Trustee filed a notice of appeal to the Second Circuit. Appellant filed his opening brief on January 7, 2020. The shareholder defendants filed an opposition brief on April 27, 2020, and Appellant filed a reply brief on May 18, 2020. On June 22, 2020, the Court scheduled oral argument to occur on August 24, 2020. In addition, the
District Court has entered two bar orders in connection with the plaintiff’s settlement with certain non-shareholder defendants. The orders bar claims against the settling defendants, but contain a judgment reduction provision that preserves the value of any potential claim by a shareholder defendant against a settling defendant. Specifically, the judgment reduction provision reduces the amount of money recoverable against a shareholder defendant to the extent the shareholder defendant could have recovered on a claim against a settling defendant.
The value of the proceeds received by the Portfolio in connection with the LBO and the Portfolio’s cost basis in shares of Tribune was as follows:
| | | | | | | | |
Portfolio | | Proceeds | | | Cost Basis | |
MainStay VP MacKay S&P 500 Index Portfolio | | $ | 682,856 | | | $ | 527,309 | |
At this stage of the proceedings, it would be difficult to assess with any reasonable certainty the probable outcome of the pending litigation or the effect, if any, on the Portfolio’s net asset value.
Note 11–Recent Accounting Pronouncement
In March 2020, the Financial Accounting Standards Board (“FASB”) issued Accounting Standards Update 2020-04 (“ASU 2020-04”), which provides optional guidance to ease the potential accounting burden associated with transitioning away from LIBOR and other reference rates that are expected to be discontinued. ASU 2020-04 is effective immediately upon release of the update on March 12, 2020 through December 31, 2022. At this time, the Manager is evaluating the implications of certain other provisions of ASU 2020-04 related to new disclosure requirements and any impact on the financial statement disclosures has not yet been determined.
Note 12–Subsequent Events
In connection with the preparation of the financial statements of the Portfolio as of and for the six-month period ended June 30, 2020, events and transactions subsequent to June 30, 2020, through the date the financial statements were issued have been evaluated by the Manager, for possible adjustment and/or disclosure. No subsequent events requiring financial statement adjustment or disclosure have been identified.
Note 13–Other Matters
An outbreak of COVID-19, first detected in December 2019, has developed into a global pandemic and has resulted in travel restrictions, closure of international borders, certain businesses and securities markets, restrictions on securities trading activities, prolonged quarantines, supply chain disruptions, and lower consumer demand, as well as general concern and uncertainty. The continued impact of COVID-19 is uncertain and could further adversely affect the global economy, national economies, individual issuers and capital markets in unforeseeable ways and result in a substantial and extended economic downturn. Developments that disrupt global economies and financial markets, such as COVID-19, may magnify factors that affect the Portfolio’s performance.
| | |
| 30 | | MainStay VP MacKay S&P 500 Index Portfolio |
Discussion of the Operation and Effectiveness of the Portfolio’s Liquidity
Risk Management Program (Unaudited)
In compliance with Rule 22e-4 under the Investment Company Act of 1940, as amended (the “Liquidity Rule”), the Portfolio has adopted and implemented a liquidity risk management program (the “Program”), which New York Life Investment Management LLC believes is reasonably designed to assess and manage the Portfolio’s liquidity risk. The Board designated New York Life Investment Management LLC as administrator of the Program (the “Administrator”). The Administrator has established a Liquidity Risk Management Committee to assist the Administrator in the implementation and day-to-day administration of the Program and to otherwise support the Administrator in fulfilling its responsibilities under the Program.
At a meeting of the Board held on March 11, 2020, the Administrator provided the Board with a written report addressing the Program’s operation, adequacy and effectiveness of implementation for the period from December 1, 2018 through December 31, 2019, as required under the Liquidity Rule. The report noted that the Administrator concluded that (i) the Program operated effectively to assess and manage the Portfolio’s liquidity risk, (ii) the Program has been adequately and effectively implemented to monitor and, as applicable, respond to the Portfolio’s liquidity developments and (iii) the Portfolio’s investment strategy continues to be appropriate for an open-end portfolio.
In accordance with the Program, the Portfolio’s liquidity risk is assessed no less frequently than annually taking into consideration certain factors, as applicable, such as (i) investment strategy and liquidity of portfolio investments, (ii) short-term and long-term cash flow projections and (iii) holdings of cash and cash equivalents and borrowing arrangements and other funding sources. Certain factors are considered under both normal and reasonably foreseeable stressed conditions.
Each Portfolio portfolio investment is classified into one of four liquidity categories. The classification is based on a determination of the number of days it is reasonably expected to take to convert the investment into cash, or sell or dispose of the investment, in current market conditions without significantly changing the market value of the investment. The Administrator has delegated liquidity classification determinations to the Portfolio’s subadvisor, subject to appropriate oversight by the Administrator, and classification determinations are made by taking into account the Portfolio’s reasonably anticipated trade size, various market, trading and investment-specific considerations, as well as market depth, and, in certain cases, third-party vendor data.
The Liquidity Rule requires portfolios that do not primarily hold assets that are highly liquid investments to adopt a minimum amount of net assets that must be invested in highly liquid investments that are assets (an “HLIM”). In addition, the Liquidity Rule limits a portfolio’s investments in illiquid investments. Specifically, the Liquidity Rule prohibits acquisition of illiquid investments if doing so would result in a portfolio holding more than 15% of its net assets in illiquid investments that are assets. The Program includes provisions reasonably designed to determine, periodically review and comply with the HLIM requirement, as applicable, and to comply with the 15% limit on illiquid investments.
Proxy Voting Policies and Procedures and Proxy Voting Record
A description of the policies and procedures that New York Life Investments uses to vote proxies related to the Portfolio’s securities is available free of charge upon request (i) by calling 800-598-2019; (ii) by visiting New York Life Investments’ website at https://www.nylinvestments.com/mainstay/products-and-performance/mainstay-vp-funds-trust; or (iii) by visiting the SEC’s website at www.sec.gov.
The Portfolio is required to file with the SEC its proxy voting record for the 12-month period ending June 30 on Form N-PX. The Portfolio’s most recent Form N-PX or proxy voting record is available free of charge upon request (i) by calling 800-598-2019; (ii) by visiting New York Life Investments’ website at https://www.nylinvestments.com/mainstay/products-and-performance/mainstay-vp-funds-trust; or (iii) by visiting the SEC’s website at www.sec.gov.
Shareholder Reports and Quarterly Portfolio Disclosure
The Portfolio is required to file its complete schedule of portfolio holdings with the SEC 60 days after its first and third fiscal quarter on Form N-PORT. The Portfolio’s holdings report is available free of charge upon request by calling 800-598-2019 or by visiting the SEC’s website at www.sec.gov.
| | |
| 32 | | MainStay VP MacKay S&P 500 Index Portfolio |
MainStay VP Portfolios
MainStay VP offers a wide range of Portfolios. The full array of MainStay VP offerings is listed here, with information about the manager, subadvisors, legal counsel, and independent registered public accounting firm.
Equity Portfolios
MainStay VP Emerging Markets Equity Portfolio
MainStay VP Epoch U.S. Equity Yield Portfolio
MainStay VP Fidelity Institutional AM® Utilities Portfolio†
MainStay VP MacKay Common Stock Portfolio
MainStay VP MacKay Growth Portfolio
MainStay VP MacKay International Equity Portfolio
MainStay VP MacKay Mid Cap Core Portfolio
MainStay VP MacKay S&P 500 Index Portfolio
MainStay VP MacKay Small Cap Core Portfolio
MainStay VP Mellon Natural Resources Portfolio
MainStay VP Small Cap Growth Portfolio
MainStay VP T. Rowe Price Equity Income Portfolio
MainStay VP Winslow Large Cap Growth Portfolio
Mixed Asset Portfolios
MainStay VP Balanced Portfolio
MainStay VP Income Builder Portfolio
MainStay VP Janus Henderson Balanced Portfolio
MainStay VP MacKay Convertible Portfolio
Income Portfolios
MainStay VP Bond Portfolio
MainStay VP Floating Rate Portfolio
MainStay VP Indexed Bond Portfolio
MainStay VP MacKay Government Portfolio
MainStay VP MacKay High Yield Corporate Bond Portfolio
MainStay VP MacKay Unconstrained Bond Portfolio
MainStay VP PIMCO Real Return Portfolio
Money Market
MainStay VP U.S. Government Money Market Portfolio
Alternative
MainStay VP CBRE Global Infrastructure Portfolio
MainStay VP IQ Hedge Multi-Strategy Portfolio
Asset Allocation Portfolios
MainStay VP Conservative Allocation Portfolio
MainStay VP Growth Allocation Portfolio
MainStay VP Moderate Allocation Portfolio
MainStay VP Moderate Growth Allocation Portfolio
Manager
New York Life Investment Management LLC
New York, New York
Subadvisors
Brown Advisory LLC
Baltimore, Maryland
Candriam Belgium S.A.*
Brussels, Belgium
CBRE Clarion Securities LLC
Radnor, Pennsylvania
Epoch Investment Partners, Inc.
New York, New York
FIAM LLC
Smithfield, Rhode Island
IndexIQ Advisors LLC*
New York, New York
Janus Capital Management LLC
Denver, Colorado
MacKay Shields LLC*
New York, New York
Mellon Investments Corporation
Boston, Massachusetts
NYL Investors LLC*
New York, New York
Pacific Investment Management Company LLC
Newport Beach, California
Segall Bryant & Hamill, LLC
Chicago, Illinois
T. Rowe Price Associates, Inc.
Baltimore, Maryland
Winslow Capital Management, LLC
Minneapolis, Minnesota
Distributor
NYLIFE Distributors LLC*
Jersey City, New Jersey
Custodian
State Street Bank and Trust Company
Boston, Massachusetts
Independent Registered Public Accounting Firm
PricewaterhouseCoopers LLP
New York, New York
Legal Counsel
Dechert LLP
Washington, District of Columbia
Some Portfolios may not be available in all products.
| † | Fidelity Institutional AM is a registered trade mark of FMR LLC. Used with permission. |
| * | An affiliate of New York Life Investment Management LLC |
Not part of the Semiannual Report
2020 Semiannual Report
This report is for the general information of New York Life Variable Annuities and NYLIAC Variable Universal Life Insurance Products policyowners. It must be preceded or accompanied by the appropriate product(s) and funds prospectuses if it is given to anyone who is not an owner of a New York Life variable annuity policy or a NYLIAC Variable Universal Life Insurance Product. This report does not offer for sale or solicit orders to purchase securities.
The performance data quoted in this report represents past performance. Past performance is no guarantee of future results. Due to market volatility and other factors, current performance may be lower or higher than the figures shown. The most recent month-end performance summary for your variable annuity or variable life policy is available by calling 800-598-2019 and is updated periodically on www.newyorklife.com.
The New York Life Variable Annuities and NYLIAC Variable Universal Life Insurance Products are issued by New York Life Insurance and Annuity Corporation (a Delaware Corporation) and distributed by NYLIFE Distributors LLC (Member FINRA/SIPC).
New York Life Insurance Company
New York Life Insurance and Annuity Corporation
(NYLIAC) (A Delaware Corporation)
51 Madison Avenue, Room 551
New York, NY 10010
www.newyorklife.com
Printed on recycled paper
nylinvestments.com
NYLIFE Distributors LLC, 30 Hudson Street, Jersey City, NJ 07302
New York Life Investment Management LLC is the investment manager to the MainStay VP Funds Trust
©2020 by NYLIFE Distributors LLC. All rights reserved.
You may obtain copies of the Prospectus and the Statement of Additional Information free of charge, upon request, by calling toll-free 800-598-2019 or writing to New York Life Insurance and Annuity Corporation, 51 Madison Avenue, New York, NY 10010.
| | | | |
| Not FDIC Insured | | No Bank Guarantee | | May Lose Value |
| | | | |
| 1781637 | | | | MSVPSP10-08/20 (NYLIAC) NI529 |
MainStay VP MacKay Unconstrained
Bond Portfolio
Message from the President and Semiannual Report
Unaudited | June 30, 2020
Beginning on January 1, 2021, as permitted by regulations adopted by the Securities and Exchange Commission, paper copies of the MainStay VP Portfolio annual and semi-annual shareholder reports may no longer be sent by mail, unless you specifically request paper copies of the reports from the insurance company that offers your policy. Instead, the reports will be made available online, and you will be notified by mail each time a report is posted and provided with a website link to access the report. Instructions for requesting paper copies will be provided by your insurance company.
If you already elected to receive shareholder reports electronically, you will not be affected by this change and you need not take any action. At any time, you may elect to receive reports and other communications from the insurance company electronically by following the instructions provided by the insurance company.
You may elect to receive all future shareholder reports in paper form free of charge. You can inform the insurance company that you wish to receive paper copies of reports by following the instructions provided by the insurance company. Your election to receive reports in paper form will apply to all portfolio companies available under your contract.
| | | | | | | | |
| Not FDIC/NCUA Insured | | Not a Deposit | | May Lose Value | | No Bank Guarantee | | Not Insured by Any Government Agency |

This page intentionally left blank
Message from the President
High levels of volatility shook financial markets in response to the COVID-19 pandemic and an abrupt decline in global economic activity during the six months ended June 30, 2020.
Markets entered 2020 riding strong fourth quarter performance and an economic expansion of historic longevity. Most broad stock and bond indices began to dip in late February as growing numbers of COVID-19 cases were seen in hotspots around the world. On March 11, 2020, the World Health Organization acknowledged that the disease had reached pandemic proportions, with over 80,000 identified cases in China, thousands in Italy, South Korea and the United States, and more in dozens of additional countries. Governments and central banks pledged trillions of dollars to address the mounting economic and public health crisis; however, “stay-at-home” orders and other restrictions on non-essential activity caused global economic activity to slow. Most stocks and bonds lost significant ground in this challenging environment, with equities declining by roughly a third and the yield on high-yield credit indices shooting higher.
Policymakers responded with extraordinary speed to address the situation. In the United States, the Federal Reserve (“Fed”) cut interest rates to near zero and announced unlimited quantitative easing. With help from Treasury, the Fed later rolled out a series of lending facilities to directly support market functioning. In late March, the Federal government declared a national emergency; Congress passed, and the President signed, a $2 trillion CARES Act (The Coronavirus Aid, Relief, and Economic Security Act), with the promise of further assistance for consumers and businesses to come. This enormous wave of policy support helped fuel a rapid recovery in market pricing as stocks bounced back and credit spreads narrowed. Some states rushed to ease restrictions on travel and social gatherings, further fueling optimism that the effects of the pandemic might prove short lived. However, the final weeks of the reporting period saw infection rates beginning to rise in some of the first states to reopen, raising concerns that a second round of restrictive government policies might prove necessary, once again stifling economic activity.
Despite all the market volatility, the broadly based S&P 500® Index finished the first half of 2020 only slightly below its starting point and the technology-heavy NASDAQ Composite Index posted gains, closing in near record territory. Small-cap stocks tended to trail their large cap counterparts, as illustrated by the Russell 2000® Index’s loss of approximately 15%, while value-oriented stocks lagged growth-oriented issues. From a global perspective, U.S. stocks generally outperformed international equities, with emerging markets hit particularly hard by the flight from risk.
Fixed-income markets also experienced unusually high levels of volatility. Recognized safe havens, such as U.S. government bonds, attracted increased investment, driving yields lower and prices higher, positioning long-term Treasury bonds to deliver particularly strong gains. Investment-grade corporate bonds lost value in March before recovering in the closing months of the reporting period, while relatively speculative high-yield credit faced the brunt of risk-off sentiment. Emerging market debt underperformed most other bonds types as investors sought to minimize currency and sovereign risks.
Today, as we at New York Life Investments continue to track the ongoing health crisis and its financial ramifications, we are particularly mindful of the people at the heart of our enterprise—our colleagues and valued clients. By taking appropriate steps to minimize community spread of COVID-19 within our organization, we strive to safeguard the health of our investment professionals so they can continue to provide you, as a MainStay investor, with world class investment solutions in this rapidly evolving environment.
Sincerely,

Kirk C. Lehneis
President
The opinions expressed are as of the date of this report and are subject to change. There is no guarantee that any forecast made will come to pass. This material does not constitute investment advice and is not intended as an endorsement of any specific investment. Past performance is no guarantee of future results.
Not part of the Semiannual Report
Table of Contents
Investors should refer to the Portfolio’s Summary Prospectus and/or Prospectus and consider the Portfolio’s investment objectives, strategies, risks, charges and expenses carefully before investing. The Summary Prospectus and/or Prospectus contain this and other information about the Portfolio. You may obtain copies of the Portfolio’s Summary Prospectus and/or the Prospectus and the Statement of Additional Information free of charge, upon request, by calling toll-free 800-598-2019, by writing to New York Life Insurance and Annuity Corporation, 51 Madison Avenue, Room 251, New York, New York 10010 or by sending an email to MainStayShareholdersServices@nylim.com. These documents are also available at nylinvestments.com/vpdocuments. Please read the Summary Prospectus and/or Prospectus carefully before investing. MainStay VP Funds Trust portfolios are separate account options which are purchased through a variable insurance or variable annuity contract.
Investment and Performance Comparison1 (Unaudited)
Performance data quoted represents past performance. Past performance is no guarantee of future results. Because of market volatility and other factors, current performance may be lower or higher than the figures shown. Investment return and principal value will fluctuate, and as a result, when shares are redeemed, they may be worth more or less than their original cost. The performance table and graph do not reflect any deduction of sales charges, mortality and expense charges, contract charges or administrative charges. Please refer to the Performance Summary appropriate for your policy. For performance information current to the most recent month-end, please call 800-598-2019 or visit www.newyorklife.com.
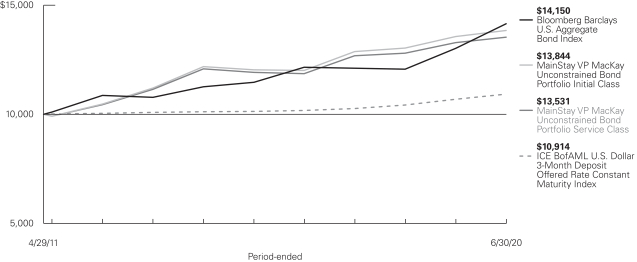
Average Annual Total Returns for the Period-Ended June 30, 2020
| | | | | | | | | | | | | | | | | | | | | | |
| Class | | Inception Date | | Six Months | | | One Year | | | Five Years | | | Since Inception | | | Gross
Expense
Ratio2 | |
| | | | | | |
| Initial Class Shares | | 4/29/2011 | | | -0.21 | % | | | 2.07 | % | | | 2.83 | % | | | 3.61 | % | | | 0.77 | % |
| Service Class Shares | | 4/29/2011 | | | -0.33 | | | | 1.81 | | | | 2.57 | | | | 3.35 | | | | 1.02 | |
| | | | | | | | | | | | | | | | |
| Benchmark Performance | | Six
Months | | | One Year | | | Five Years | | | Since Inception | |
| | | | |
Bloomberg Barclays U.S. Aggregate Bond Index3 | | | 6.14 | % | | | 8.74 | % | | | 4.30 | % | | | 3.86 | % |
ICE BofAML U.S. Dollar 3-Month Deposit Offered Rate Constant Maturity Index4 | | | 0.94 | | | | 2.11 | | | | 1.50 | | | | 0.96 | |
Morningstar Nontraditional Bond Category Average5 | | | -2.41 | | | | -0.51 | | | | 2.07 | | | | 1.80 | |
| 1. | Performance figures may reflect certain fee waivers and/or expense limitations, without which total returns may have been different. For information on current fee waivers and/or expense limitations (if any), please refer to the Notes to Financial Statements. |
| 2. | The gross expense ratios presented reflect the Portfolio’s “Total Annual Portfolio Operating Expenses” from the most recent Prospectus, as supplemented, and may differ from other expense ratios disclosed in this report. |
| 3. | The Bloomberg Barclays U.S. Aggregate Bond Index is the Portfolio’s primary broad-based securities market index for comparison purposes. The Bloomberg Barclays U.S. Aggregate Bond Index measures performance of the investment-grade, U.S. dollar denominated, fixed-rate taxable bond market, including Treasurys, government-related and corporate securities, mortgage-backed securities (agency fixed-rate and hybrid adjustable-rate mortgage pass-throughs), asset-backed securities and commercial mortgage-backed securities. Results assume reinvestment of all dividends and capital gains. An investment cannot be made directly in an index. |
| 4. | The Portfolio has selected the ICE BofAML U.S. Dollar 3-Month Deposit Offered Rate Constant Maturity Index as a secondary benchmark. The ICE BofAML U.S. Dollar 3-Month Deposit Offered Rate Constant Maturity Index represents the London InterBank Offered Rate (“LIBOR”) with a constant 3-month average maturity. Results assume reinvestment of all dividends and capital gains. An investment cannot be made directly in an index. |
| 5. | The Portfolio has selected the Morningstar Nontraditional Bond Category Average as an additional benchmark. The Morningstar Nontraditional Bond Category Average contains funds that pursue strategies divergent in one or more ways from conventional practice in the broader bond-fund universe. Morningstar category averages are equal-weighted returns based on constituents of the category at the end of the period. Results are based on average total returns of similar funds with all dividends and capital gain distributions reinvested. |
Cost in Dollars of a $1,000 Investment in MainStay VP MacKay Unconstrained Bond Portfolio (Unaudited)
The example below is intended to describe the fees and expenses borne by shareholders during the six-month period from January 1, 2020, to June 30, 2020, and the impact of those costs on your investment.
Example
As a shareholder of the Portfolio you incur two types of costs: (1) transaction costs, including exchange fees and sales charges (loads) on purchases (as applicable), and (2) ongoing costs, including management fees, distribution and/or service (12b-1) fees, and other Portfolio expenses (as applicable). This example is intended to help you understand your ongoing costs (in dollars) of investing in the Portfolio and to compare these costs with the ongoing costs of investing in other mutual funds. The example is based on an investment of $1,000 made at the beginning of the six-month period and held for the entire period from January 1, 2020, to June 30, 2020. Shares are only sold in connection with variable life and annuity contracts and the example does not reflect any contract level or transactional fees or expenses. If these costs had been included, your costs would have been higher.
This example illustrates your Portfolio’s ongoing costs in two ways:
Actual Expenses
The second and third data columns in the table below provide information about actual account values and actual expenses. You may use the information in these columns, together with the amount you invested, to estimate the expenses that you paid during the six months
ended June 30, 2020. Simply divide your account value by $1,000 (for example, an $8,600 account value divided by $1,000 = 8.6), then multiply the result by the number under the heading entitled “Expenses Paid During Period” to estimate the expenses you paid on your account during this period.
Hypothetical Example for Comparison Purposes
The fourth and fifth data columns in the table below provide information about hypothetical account values and hypothetical expenses based on the Portfolio’s actual expense ratio and an assumed rate of return of 5% per year before expenses, which is not the Portfolio’s actual return. The hypothetical account values and expenses may not be used to estimate the actual ending account balances or expenses you paid for the six-month period shown. You may use this information to compare the ongoing costs of investing in the Portfolio with the ongoing costs of investing in other mutual funds. To do so, compare this 5% hypothetical example with the 5% hypothetical examples that appear in the shareholder reports of the other mutual funds.
Please note that the expenses shown in the table are meant to highlight your ongoing costs only and do not reflect any transactional costs, such as exchange fees or sales charges (loads). Therefore, the fourth and fifth data columns of the table are useful in comparing ongoing costs only and will not help you determine the relative total costs of owning different funds. In addition, if these transactional costs were included, your costs would have been higher.
| | | | | | | | | | | | | | | | | | | | | | |
| | | | | | | | | | | | | | | | | | |
| Share Class | | Beginning Account Value 1/1/20 | | | Ending Account Value (Based on Actual Returns and Expenses) 6/30/20 | | | Expenses Paid During Period1 | | | Ending Account Value (Based on Hypothetical 5% Annualized Return and Actual Expenses) 6/30/20 | | | Expenses Paid During Period1 | | | Net Expense Ratio During Period2,3 |
| | | | | | |
| Initial Class Shares | | $ | 1,000.00 | | | $ | 997.90 | | | $ | 3.68 | | | $ | 1,021.18 | | | $ | 3.72 | | | 0.74% |
| | | | | | |
| Service Class Shares | | $ | 1,000.00 | | | $ | 996.70 | | | $ | 4.91 | | | $ | 1,019.94 | | | $ | 4.97 | | | 0.99% |
| 1 | Expenses are equal to the Portfolio’s annualized expense ratio of each class multiplied by the average account value over the period, divided by 366 and multiplied by 182 (to reflect the six-month period). The table above represents the actual expenses incurred during the six-month period. In addition to the fees and expenses which the Portfolio bears directly, it also indirectly bears a pro rata share of the fees and expenses of the underlying funds in which it invests. Such indirect expenses are not included in the above-reported expense figures. |
| 2 | Expenses are equal to the Portfolio’s annualized expense ratio to reflect the six-month period. |
| 3 | Expenses are inclusive of dividends and interest on investments sold short. |
| | |
| 6 | | MainStay VP MacKay Unconstrained Bond Portfolio |
Portfolio Composition as of June 30, 2020 (Unaudited)
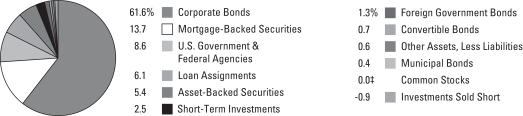
See Portfolio of Investments beginning on page 10 for specific holdings within these categories. The Portfolio’s holdings are subject to change.
| ‡ | Less than one-tenth of a percent. |
Top Ten Issuers as of June 30, 2020 (excluding short-term investments) (Unaudited)
| 1. | United States Treasury Inflation—Indexed Notes, 0.75%–0.875%, due 7/15/28–1/15/29 |
| 2. | Fannie Mae Connecticut Avenue Securities (Mortgage Pass-Through Securities), 3.835%–4.635%, due 1/25/29–9/25/29 |
| 3. | Bank of America Corp., 3.004%–8.57%, due 12/20/23–4/24/28 |
| 4. | Morgan Stanley, 3.875%–5.00%, due 10/15/20–1/27/26 |
| 5. | JPMorgan Chase & Co., 2.956%–4.60%, due 2/1/25–5/13/31 |
| 6. | GS Mortgage Securities Trust, 1.385%–3.43%, due 6/15/38–9/1/52 |
| 7. | Wells Fargo Commercial Mortgage Trust, 2.787%–4.194%, due 6/15/36–10/15/52 |
| 8. | FREMF Mortgage Trust, 3.614%-4.073%, due 6/25/45–11/25/47 |
| 9. | Federal Home Loan Mortgage Corporation Structured Agency Credit Risk Debt Notes, 2.035%–6.535%, due 9/25/28–2/25/50 |
| 10. | Marathon Petroleum Corp., 4.50%–5.125%, due 5/1/23–12/15/26 |
Portfolio Management Discussion and Analysis (Unaudited)
Answers to the questions reflect the views of portfolio managers Joseph Cantwell, Shu-Yang Tan, Matt Jacob, Stephen R. Cianci, CFA, and Neil Moriarty III, of MacKay Shields LLC, the Portfolio’s Subadvisor.
How did MainStay VP MacKay Unconstrained Bond Portfolio perform relative to its benchmarks and peers during the six months ended June 30, 2020?
For the six months ended June 30, 2020, MainStay VP MacKay Unconstrained Bond Portfolio returned –0.21% for Initial Class shares and –0.33% for Service Class shares. Over the same period, both share classes underperformed the 6.14% return of the Bloomberg Barclays U.S. Aggregate Bond Index, which is the Portfolio’s primary benchmark, and the 0.94% return of the ICE BofAML U.S. Dollar 3-Month Deposit Offered Rate Constant Maturity Index, which is the Portfolio’s secondary benchmark. For the six months ended June 30, 2020, both share classes outperformed the –2.41% return of the Morningstar Nontraditional Bond Category Average.1
During the reporting period, were there any market events that materially impacted the Fund’s performance or liquidity?
Financial markets dropped sharply in the first quarter of 2020, impacting the entire reporting period as it became increasingly evident that the COVID-19 outbreak was not merely a medical concern, but an economic one with perhaps larger fiscal implications than those related to personal health. Other than Treasury securities, nearly all fixed-income asset classes saw steep losses. Toward the end of the first quarter, the U.S. Federal Reserve (“Fed”) announced they would begin buying investment-grade corporate bonds and ETFs, which reversed the stress in the credit markets and led to a robust recovery in the second quarter.
What factors affected the Portfolio’s relative performance during the reporting period?
The Portfolio’s performance relative to that of the Bloomberg Barclays U.S. Aggregate Bond Index was undermined by overweight exposure to corporate bonds, both investment grade and high yield. These holding were hard hit in mid-March 2020, particularly at the front end of the yield curve2 where the dealer community stepped away as the pandemic-related sell-off escalated. Underweight exposure to Treasury bonds, the best-performing fixed-income asset class in the reporting period, further detracted from relative returns. Overweight exposure to securitized assets also detracted from relative performance as forced selling caused securitized assets to widen out in the first quarter. However, securitized assets recovered somewhat in April as the Fed cut rates to near zero and reinstituted a bond buying program to create liquidity.
During the reporting period, how was the Portfolio’s performance materially affected by investments in derivatives?
During the reporting period, the Portfolio used U.S. Treasury futures to manage duration.3 The use of these instruments negatively affected Portfolio returns.
What was the Portfolio’s duration strategy during the reporting period?
Though we had been extending the Portfolio’s duration during the reporting period, it remained below that of the Bloomberg Barclays U.S. Aggregate Bond Index, thereby detracting from relative performance as longer duration bonds outperformed. At the end of the period the Portfolio’s duration was 1.9 years, while the primary benchmark’s duration was 6.0 years.
What specific factors, risks or market forces prompted significant decisions for the Portfolio during the reporting period?
We took advantage of pandemic-related weakness in the credit markets at the end of the first quarter of 2020 to increase the Portfolio’s exposure to high-yield securities. The Portfolio’s high-yield purchases were funded by reducing holdings of agency mortgages. These transactions were accretive to returns as high-yield bonds experienced a strong recovery in the second quarter.
During the reporting period, which market segments were the strongest positive contributors to the Portfolio’s absolute performance and which market segments were particularly weak?
The Portfolio’s overweight exposure to corporate bonds, both investment grade and high yield, detracted from absolute performance, particularly at the front-end of the yield curve where the dealer community stepped away in mid-March 2020 as the sell-off escalated. Underweight exposure to U.S. Treasury bonds also detracted from performance as Treasury bonds were the best performing fixed-income asset class in the reporting period. Forced selling caused securitized assets to widen out where the Portfolio held overweight exposure. Though the Portfolio held underweight exposure to Treasury bonds, its position in Treasury bonds with longer maturities was accretive to returns. Security selection in both the collateralized mortgage obligation and emerging market sovereign debt markets were accretive to returns.
| 1. | See page 5 for more information on benchmark and peer group returns. |
| 2. | The yield curve is a line that plots the yields of various securities of similar quality—typically U.S. Treasury issues—across a range of maturities. The U.S. Treasury yield curve serves as a benchmark for other debt and is used in economic forecasting. |
| 3. | Duration is a measure of the price sensitivity of a fixed-income investment to changes in interest rates. Duration is expressed as a number of years and is considered a more accurate sensitivity gauge than average maturity. |
| | |
| 8 | | MainStay VP MacKay Unconstrained Bond Portfolio |
Did the Portfolio make any significant purchases or sales during the reporting period?
During the reporting period the Portfolio purchased a seasoned credit-risk transfer deal from Freddie Mac backed by four-year-old prime mortgage loans. At the time of the purchase, the liquidity premium was high, as there were forced sellers of this type of paper. Given the underlying fundamentals of the borrower’s credit and bond structure, we believed the market would eventually price those in. We also purchased corporate bonds issued by graphics processor and software maker, Nvidia, a high-quality, low-levered name in a rapidly growing industry that came to market with what we viewed as a very attractive new issue premium during the height of the market’s volatility.
In early February 2020, the Portfolio exited its position in an asset-backed securities (“ABS”) deal backed by equipment loans from DLL Finance, as ABS spreads4 were historically narrow and liquidity was readily available. The Portfolio also sold
its position in bonds from integrated oil & gas company Petrobras Brasileiro during the reporting period, reflecting our opinion that valuation was tight although fundamentals were sound.
How did the Portfolio’s sector weightings change during the reporting period?
During the reporting period, we increased the Portfolio’s exposure to high-yield corporate bonds and decreased exposure to agency mortgage-backed securities.
How was the Portfolio positioned at the end of the reporting period?
As of June 30, 2020, the Portfolio held overweight exposure relative to the Bloomberg Barclays U.S. Aggregate Bond Index in high-yield and investment-grade corporate bonds, as well as in securitized assets. As of the same date, the Portfolio held underweight exposure to U.S. Treasury securities and agency mortgage-backed securities.
| 4. | The terms “spread” and “yield spread” may refer to the difference in yield between a security or type of security and comparable U.S. Treasury issues. The terms may also refer to the difference in yield between two specific securities or types of securities at a given time. |
The opinions expressed are those of the portfolio managers as of the date of this report and are subject to change. There is no guarantee that any forecasts will come to pass. This material does not constitute investment advice and is not intended as an endorsement of any specific investment.
Not all MainStay VP Portfolios and/or share classes are available under all policies.
Portfolio of Investments June 30, 2020 (Unaudited)
| | | | | | | | |
| | | Principal
Amount | | | Value | |
Long-Term Bonds 97.8%† Asset-Backed Securities 5.4% | |
Auto Floor Plan Asset-Backed Securities 1.1% | |
Ford Credit Floorplan Master Owner Trust | |
Series 2019-4, Class A
2.44%, due 9/15/26 | | $ | 2,240,000 | | | $ | 2,260,092 | |
Series 2017-3, Class A
2.48%, due 9/15/24 | | | 1,900,000 | | | | 1,921,447 | |
Series 2018-4, Class A
4.06%, due 11/15/30 | | | 5,250,000 | | | | 5,634,598 | |
| | | | | | | | |
| | | | | | | 9,816,137 | |
| | | | | | | | |
Automobile Asset-Backed Securities 1.0% | |
American Credit Acceptance Receivables Trust | |
Series 2020-2, Class C
3.88%, due 4/13/26 (a) | | | 1,890,000 | | | | 1,976,238 | |
Avis Budget Rental Car Funding AESOP LLC (a) | |
Series 2020-1A, Class A
2.33%, due 8/20/26 | | | 1,505,000 | | | | 1,455,609 | |
Series 2017-2A, Class A
2.97%, due 3/20/24 | | | 1,420,000 | | | | 1,424,488 | |
Series 2018-2A, Class A
4.00%, due 3/20/25 | | | 1,200,000 | | | | 1,211,002 | |
Ford Credit Auto Owner Trust
Series 2020-1, Class A
2.04%, due 8/15/31 (a) | | | 1,960,000 | | | | 1,991,643 | |
Santander Revolving Auto Loan Trust
Series 2019-A, Class A
2.51%, due 1/26/32 (a) | | | 1,350,000 | | | | 1,411,828 | |
| | | | | | | | |
| | | | | | | 9,470,808 | |
| | | | | | | | |
Credit Cards 0.4% | |
Capital One Multi-Asset Execution Trust
Series 2019-A3, Class A3
2.06%, due 8/15/28 | | | 3,780,000 | | | | 4,030,902 | |
| | | | | | | | |
Home Equity 0.1% | |
Bayview Financial Acquisition Trust
Series 2006-D, Class 2A4
0.464% (1 Month LIBOR + 0.28%), due 12/28/36 (b) | | | 597,867 | | | | 593,330 | |
First NLC Trust
Series 2007-1, Class A1
0.255% (1 Month LIBOR + 0.07%), due 8/25/37 (a)(b) | | | 68,594 | | | | 38,092 | |
MASTR Asset-Backed Securities Trust
Series 2006-HE4, Class A1
0.235% (1 Month LIBOR + 0.05%), due 11/25/36 (b) | | | 18,309 | | | | 7,825 | |
Morgan Stanley ABS Capital I Trust
Series 2007-HE4, Class A2A
0.295% (1 Month LIBOR + 0.11%), due 2/25/37 (b) | | | 18,734 | | | | 7,683 | |
| | | | | | | | |
| | | | | | | 646,930 | |
| | | | | | | | |
| | | | | | | | |
| | | Principal
Amount | | | Value | |
Other Asset-Backed Securities 2.8% | |
Carrington Mortgage Loan Trust
Series 2007-HE1, Class A3
0.375% (1 Month LIBOR + 0.19%), due 6/25/37 (b) | | $ | 4,400,000 | | | $ | 4,065,668 | |
DB Master Finance LLC
Series 2017-1A, Class A2I
3.629%, due 11/20/47 (a) | | | 1,842,588 | | | | 1,902,582 | |
Domino’s Pizza Master Issuer LLC
Series 2015-1A, Class A2II
4.474%, due 10/25/45 (a) | | | 1,977,938 | | | | 2,139,496 | |
Hilton Grand Vacations Trust (a) | |
Series 2019-AA, Class A
2.34%, due 7/25/33 | | | 2,782,687 | | | | 2,782,496 | |
Series 2020-AA, Class A
2.74%, due 2/25/39 | | | 1,849,796 | | | | 1,866,587 | |
Series 2020-AA, Class B
4.22%, due 2/25/39 | | | 973,577 | | | | 978,164 | |
JPMorgan Mortgage Acquisition Trust
Series 2007-HE1, Class AF1
0.285% (1 Month LIBOR + 0.10%), due 3/25/47 (b) | | | 23,608 | | | | 14,940 | |
MVW Owner Trust
Series 2019-2A, Class A
2.22%, due 10/20/38 (a) | | | 2,736,715 | | | | 2,735,774 | |
PFS Financing Corp. (a) | |
Series 2020-B, Class B
1.71%, due 6/17/24 | | | 910,000 | | | | 909,818 | |
Series 2020-A, Class B
1.77%, due 6/16/25 | | | 1,880,000 | | | | 1,881,841 | |
Sierra Receivables Funding Co.
Series 2019-3A, Class A
2.34%, due 8/20/36 (a) | | | 1,301,615 | | | | 1,296,677 | |
Sierra Timeshare Receivables Funding Co. LLC Series 2019-1A, Class A
3.20%, due 1/20/36 (a) | | | 2,940,719 | | | | 2,997,831 | |
Wendy’s Funding LLC
Series 2019-1A, Class A2I
3.783%, due 6/15/49 (a) | | | 2,004,100 | | | | 2,115,548 | |
| | | | | | | | |
| | | | | | | 25,687,422 | |
| | | | | | | | |
Student Loans 0.0% ‡ | |
KeyCorp Student Loan Trust
Series 2000-A, Class A2
0.68% (3 Month LIBOR + 0.32%), due 5/25/29 (b) | | | 19,551 | | | | 19,491 | |
| | | | | | | | |
Total Asset-Backed Securities
(Cost $48,279,940) | | | | 49,671,690 | |
| | | | | | | | |
| | | | |
| 10 | | MainStay VP MacKay Unconstrained Bond Portfolio | | The notes to the financial statements are an integral part of,
and should be read in conjunction with, the financial statements. |
| | | | | | | | |
| | | Principal
Amount | | | Value | |
| Convertible Bonds 0.7% | |
Machinery—Diversified 0.4% | |
Chart Industries, Inc.
1.00%, due 11/15/24 (a) | | $ | 3,036,000 | | | $ | 3,208,165 | |
| | | | | | | | |
Semiconductors 0.3% | |
ON Semiconductor Corp.
1.625%, due 10/15/23 | | | 2,562,000 | | | | 3,115,418 | |
| | | | | | | | |
Total Convertible Bonds
(Cost $5,013,768) | | | | 6,323,583 | |
| | | | | | | | |
|
| Corporate Bonds 61.6% | |
Advertising 0.1% | |
Lamar Media Corp.
5.00%, due 5/1/23 | | | 900,000 | | | | 904,500 | |
| | | | | | | | |
Aerospace & Defense 0.4% | |
L3Harris Technologies, Inc.
4.40%, due 6/15/28 | | | 3,270,000 | | | | 3,868,066 | |
| | | | | | | | |
Agriculture 1.1% | |
Altria Group, Inc.
3.80%, due 2/14/24 | | | 3,400,000 | | | | 3,717,489 | |
Bunge, Ltd. Finance Corp.
3.50%, due 11/24/20 | | | 4,435,000 | | | | 4,476,917 | |
JBS Investments II GmbH
7.00%, due 1/15/26 (a) | | | 1,775,000 | | | | 1,862,863 | |
| | | | | | | | |
| | | | | | | 10,057,269 | |
| | | | | | | | |
Airlines 1.7% | |
American Airlines Pass-Through Trust | |
Series 2015-2, Class A
4.00%, due 9/22/27 | | | 405,276 | | | | 333,621 | |
Series 2013-2, Class A
4.95%, due 1/15/23 | | | 2,929,975 | | | | 2,373,223 | |
Continental Airlines Pass-Through Trust | |
Series 2007-1, Class A
5.983%, due 4/19/22 | | | 506,961 | | | | 475,486 | |
Series 2005-ERJ1
9.798%, due 4/1/21 | | | 29,058 | | | | 25,602 | |
Delta Air Lines Pass-Through Trust | |
Series 2019-1, Class AA
3.204%, due 4/25/24 | | | 3,695,000 | | | | 3,699,198 | |
7.00%, due 5/1/25 (a) | | | 2,555,000 | | | | 2,637,445 | |
Mileage Plus Holdings LLC / Mileage Plus Intellectual Property Assets, Ltd.
6.50%, due 6/20/27 (a) | | | 2,050,000 | | | | 2,055,125 | |
U.S. Airways Pass-Through Trust | |
Series 2012-1, Class A
5.90%, due 10/1/24 | | | 1,035,942 | | | | 952,994 | |
Series 2010-1, Class A
6.25%, due 4/22/23 | | | 691,296 | | | | 589,607 | |
| | | | | | | | |
| | | Principal
Amount | | | Value | |
Airlines (continued) | |
United Airlines Pass-Through Trust | |
Series 2014-2, Class B
4.625%, due 9/3/20 | | $ | 1,016,534 | | | $ | 896,073 | |
Series 2007-1
6.636%, due 7/2/20 | | | 1,555,845 | | | | 1,323,592 | |
| | | | | | | | |
| | | | | | | 15,361,966 | |
| | | | | | | | |
Apparel 0.2% | |
Hanesbrands, Inc. (a) | |
4.875%, due 5/15/26 | | | 790,000 | | | | 795,925 | |
5.375%, due 5/15/25 | | | 1,465,000 | | | | 1,481,481 | |
| | | | | | | | |
| | | | | | | 2,277,406 | |
| | | | | | | | |
Auto Manufacturers 2.2% | |
Daimler Finance North America LLC
1.106% (3 Month LIBOR + 0.55%), due 5/4/21 (a)(b) | | | 2,335,000 | | | | 2,322,946 | |
Ford Motor Co. | |
8.50%, due 4/21/23 | | | 2,335,000 | | | | 2,469,263 | |
9.00%, due 4/22/25 | | | 2,400,000 | | | | 2,597,280 | |
Ford Motor Credit Co. LLC | |
1.627% (3 Month LIBOR + 1.235%), due 2/15/23 (b) | | | 1,230,000 | | | | 1,100,987 | |
4.063%, due 11/1/24 | | | 2,485,000 | | | | 2,373,250 | |
4.25%, due 9/20/22 | | | 900,000 | | | | 882,189 | |
General Motors Co.
6.125%, due 10/1/25 | | | 745,000 | | | | 837,145 | |
General Motors Financial Co., Inc. | |
3.45%, due 4/10/22 (c) | | | 4,000,000 | | | | 4,078,633 | |
5.20%, due 3/20/23 | | | 905,000 | | | | 967,188 | |
Volkswagen Group of America Finance LLC
3.875%, due 11/13/20 (a) | | | 3,100,000 | | | | 3,129,404 | |
| | | | | | | | |
| | | | | | | 20,758,285 | |
| | | | | | | | |
Auto Parts & Equipment 0.3% | |
LKQ European Holdings B.V.
3.625%, due 4/1/26 (a) | | EUR | 2,835,000 | | | | 3,231,306 | |
| | | | | | | | |
Banks 10.0% | |
Bank of America Corp. | |
3.004%, due 12/20/23 (d) | | $ | 6,566,000 | | | | 6,896,992 | |
3.705%, due 4/24/28 (d) | | | 1,695,000 | | | | 1,915,970 | |
4.30%, due 1/28/25 (d)(e) | | | 4,056,000 | | | | 3,639,854 | |
6.30%, due 3/10/26 (d)(e) | | | 1,810,000 | | | | 2,008,593 | |
8.57%, due 11/15/24 | | | 455,000 | | | | 581,056 | |
Barclays Bank PLC
Series Reg S
10.00%, due 5/21/21 | | GBP | 401,000 | | | | 531,466 | |
Barclays PLC
2.852%, due 5/7/26 (d) | | $ | 3,010,000 | | | | 3,145,039 | |
5.20%, due 5/12/26 | | | 1,725,000 | | | | 1,918,890 | |
BNP Paribas S.A.
3.052%, due 1/13/31 (a)(d) | | | 2,900,000 | | | | 3,054,550 | |
| | | | | | |
The notes to the financial statements are an integral part of,
and should be read in conjunction with, the financial statements. | | | | | 11 | |
Portfolio of Investments June 30, 2020 (Unaudited) (continued)
| | | | | | | | |
| | | Principal
Amount | | | Value | |
| Corporate Bonds (continued) | |
Banks (continued) | |
Citigroup, Inc.
5.50%, due 9/13/25 | | $ | 2,710,000 | | | $ | 3,213,569 | |
6.30%, due 5/15/24 (d)(e) | | | 3,975,000 | | | | 3,981,917 | |
Citizens Financial Group, Inc.
4.30%, due 12/3/25 | | | 2,550,000 | | | | 2,853,243 | |
Goldman Sachs Group, Inc.
1.562% (3 Month LIBOR + 1.17%), due 5/15/26 (b) | | | 3,075,000 | | | | 3,052,540 | |
2.60%, due 2/7/30 | | | 360,000 | | | | 377,494 | |
6.75%, due 10/1/37 | | | 1,828,000 | | | | 2,661,317 | |
Huntington National Bank
3.55%, due 10/6/23 | | | 1,445,000 | | | | 1,578,461 | |
JPMorgan Chase & Co. (d)
2.956%, due 5/13/31 | | | 1,245,000 | | | | 1,320,426 | |
3.54%, due 5/1/28 | | | 6,265,000 | | | | 6,992,301 | |
4.60%, due 2/1/25 (e) | | | 5,617,000 | | | | 5,013,172 | |
Lloyds Banking Group PLC
2.907%, due 11/7/23 (d) | | | 1,160,000 | | | | 1,207,167 | |
4.582%, due 12/10/25 | | | 2,500,000 | | | | 2,775,181 | |
Morgan Stanley
3.875%, due 4/29/24 | | | 6,015,000 | | | | 6,651,246 | |
3.875%, due 1/27/26 | | | 400,000 | | | | 452,482 | |
4.829% (3 Month LIBOR + 3.61%), due 10/15/20 (b)(e) | | | 2,125,000 | | | | 1,912,401 | |
5.00%, due 11/24/25 | | | 3,840,000 | | | | 4,484,795 | |
Popular, Inc.
6.125%, due 9/14/23 | | | 1,953,000 | | | | 1,972,530 | |
Royal Bank of Scotland Group PLC
3.073% (1 Year Treasury Constant Maturity Rate + 2.55%), due 5/22/28 (b) | | | 2,685,000 | | | | 2,825,912 | |
Santander Holdings USA, Inc.
3.40%, due 1/18/23 | | | 5,055,000 | | | | 5,258,150 | |
Truist Bank
2.636% (5 Year Treasury Constant Maturity Rate + 1.15%), due 9/17/29 (b) | | | 2,700,000 | | | | 2,698,848 | |
Truist Financial Corp.
4.95% (5 Year Treasury Constant Maturity Rate + 4.605%), due 9/1/25 (b)(e) | | | 2,420,000 | | | | 2,474,450 | |
Wells Fargo & Co.
3.00%, due 10/23/26 | | | 1,640,000 | | | | 1,787,219 | |
5.875%, due 6/15/25 (d)(e) | | | 595,000 | | | | 618,425 | |
5.90%, due 6/15/24 (d)(e) | | | 3,270,000 | | | | 3,229,371 | |
| | | | | | | | |
| | | | | | | 93,085,027 | |
| | | | | | | | |
Beverages 0.6% | |
Anheuser-Busch InBev Worldwide, Inc.
4.75%, due 1/23/29 | | | 1,833,000 | | | | 2,214,803 | |
| | | | | | | | |
| | | Principal
Amount | | | Value | |
Beverages (continued) | | | | | | | | |
Constellation Brands, Inc.
4.25%, due 5/1/23 | | $ | 2,985,000 | | | $ | 3,272,119 | |
| | | | | | | | |
| | | | | | | 5,486,922 | |
| | | | | | | | |
Biotechnology 0.5% | |
Biogen, Inc.
3.15%, due 5/1/50 | | | 1,125,000 | | | | 1,083,209 | |
3.625%, due 9/15/22 | | | 3,560,000 | | | | 3,782,334 | |
| | | | | | | | |
| | | | | | | 4,865,543 | |
| | | | | | | | |
Building Materials 0.9% | |
Builders FirstSource, Inc. (a)
5.00%, due 3/1/30 | | | 2,750,000 | | | | 2,585,000 | |
6.75%, due 6/1/27 | | | 845,000 | | | | 865,069 | |
Standard Industries, Inc. (a)
4.75%, due 1/15/28 | | | 970,000 | | | | 983,337 | |
5.375%, due 11/15/24 | | | 3,680,000 | | | | 3,781,200 | |
| | | | | | | | |
| | | | | | | 8,214,606 | |
| | | | | | | | |
Chemicals 0.7% | |
Braskem Netherlands Finance B.V.
4.50%, due 1/10/28 (a) | | | 1,015,000 | | | | 949,990 | |
Orbia Advance Corp. S.A.B. de C.V.
4.00%, due 10/4/27 (a) | | | 2,200,000 | | | | 2,267,100 | |
W.R. Grace & Co.
5.125%, due 10/1/21 (a) | | | 2,915,000 | | | | 3,070,369 | |
| | | | | | | | |
| | | | | | | 6,287,459 | |
| | | | | | | | |
Commercial Services 1.8% | |
Ashtead Capital, Inc.
4.25%, due 11/1/29 (a) | | | 2,250,000 | | | | 2,250,000 | |
California Institute of Technology
3.65%, due 9/1/19 | | | 2,434,000 | | | | 2,688,527 | |
Herc Holdings, Inc.
5.50%, due 7/15/27 (a) | | | 2,435,000 | | | | 2,440,235 | |
IHS Markit, Ltd.
4.125%, due 8/1/23 | | | 2,175,000 | | | | 2,378,167 | |
4.75%, due 2/15/25 (a) | | | 3,105,000 | | | | 3,477,600 | |
Service Corp. International
5.375%, due 5/15/24 | | | 530,000 | | | | 539,937 | |
Trustees of the University of Pennsylvania
3.61%, due 2/15/19 | | | 2,515,000 | | | | 2,920,812 | |
| | | | | | | | |
| | | | | | | 16,695,278 | |
| | | | | | | | |
Computers 1.0% | |
Dell International LLC / EMC Corp. (a)
4.90%, due 10/1/26 | | | 3,695,000 | | | | 4,077,069 | |
6.02%, due 6/15/26 | | | 625,000 | | | | 716,547 | |
8.10%, due 7/15/36 | | | 1,240,000 | | | | 1,635,234 | |
NCR Corp. (a)
6.125%, due 9/1/29 | | | 893,000 | | | | 890,768 | |
8.125%, due 4/15/25 | | | 1,484,000 | | | | 1,573,040 | |
| | | | | | | | |
| | | | | | | 8,892,658 | |
| | | | | | | | |
| | | | |
| 12 | | MainStay VP MacKay Unconstrained Bond Portfolio | | The notes to the financial statements are an integral part of,
and should be read in conjunction with, the financial statements. |
| | | | | | | | |
| | | Principal
Amount | | | Value | |
| Corporate Bonds (continued) | |
Distribution & Wholesale 0.7% | |
H&E Equipment Services, Inc.
5.625%, due 9/1/25 | | $ | 3,000,000 | | | $ | 3,029,370 | |
Performance Food Group, Inc.
5.50%, due 10/15/27 (a) | | | 3,400,000 | | | | 3,281,000 | |
| | | | | | | | |
| | | | | | | 6,310,370 | |
| | | | | | | | |
Diversified Financial Services 3.3% | |
AerCap Ireland Capital DAC / AerCap Global Aviation Trust
4.45%, due 12/16/21 (c) | | | 2,200,000 | | | | 2,221,854 | |
4.625%, due 10/30/20 | | | 3,585,000 | | | | 3,600,595 | |
Air Lease Corp.
2.30%, due 2/1/25 | | | 3,640,000 | | | | 3,481,151 | |
2.625%, due 7/1/22 | | | 2,155,000 | | | | 2,136,587 | |
2.75%, due 1/15/23 | | | 1,040,000 | | | | 1,030,511 | |
Ally Financial, Inc.
5.75%, due 11/20/25 | | | 3,570,000 | | | | 3,820,038 | |
8.00%, due 11/1/31 | | | 3,450,000 | | | | 4,451,620 | |
Avolon Holdings Funding, Ltd.
3.25%, due 2/15/27 (a) | | | 2,340,000 | | | | 1,890,079 | |
Capital One Financial Corp.
4.15% (3 Month LIBOR + 3.80%), due 9/1/20 (b)(c)(e) | | | 2,365,000 | | | | 1,927,475 | |
Charles Schwab Corp.
5.375% (5 Year Treasury Constant Maturity Rate + 4.971%), due 6/1/25 (b)(e) | | | 2,600,000 | | | | 2,777,632 | |
Discover Financial Services
3.85%, due 11/21/22 | | | 300,000 | | | | 317,753 | |
Nationstar Mortgage Holdings, Inc.
6.00%, due 1/15/27 (a) | | | 1,725,000 | | | | 1,638,750 | |
Springleaf Finance Corp.
6.125%, due 3/15/24 | | | 880,000 | | | | 894,300 | |
| | | | | | | | |
| | | | | | | 30,188,345 | |
| | | | | | | | |
Electric 1.7% | |
AEP Transmission Co. LLC
3.10%, due 12/1/26 | | | 3,360,000 | | | | 3,759,771 | |
Appalachian Power Co.
3.30%, due 6/1/27 | | | 1,400,000 | | | | 1,511,048 | |
Duke Energy Corp.
4.875% (5 Year Treasury Constant Maturity Rate + 3.388%), due 9/16/24 (b)(e) | | | 2,625,000 | | | | 2,622,113 | |
FirstEnergy Transmission LLC
4.35%, due 1/15/25 (a) | | | 1,675,000 | | | | 1,894,370 | |
Pacific Gas and Electric Co.
3.50%, due 8/1/50 (f) | | | 1,605,000 | | | | 1,551,201 | |
Puget Energy, Inc.
5.625%, due 7/15/22 | | | 585,000 | | | | 623,503 | |
| | | | | | | | |
| | | Principal
Amount | | | Value | |
Electric (continued) | | | | | | | | |
WEC Energy Group, Inc.
2.505% (3 Month LIBOR + 2.113%), due 5/15/67 (b) | | $ | 1,860,340 | | | $ | 1,469,669 | |
3.10%, due 3/8/22 | | | 2,165,000 | | | | 2,254,093 | |
| | | | | | | | |
| | | | | | | 15,685,768 | |
| | | | | | | | |
Entertainment 0.8% | |
Eldorado Resorts, Inc. | | | | | | | | |
6.00%, due 4/1/25 | | | 517,000 | | | | 540,782 | |
7.00%, due 8/1/23 | | | 2,395,000 | | | | 2,472,838 | |
International Game Technology PLC
6.25%, due 2/15/22 (a) | | | 1,491,000 | | | | 1,504,978 | |
Six Flags Theme Parks, Inc.
7.00%, due 7/1/25 (a) | | | 2,760,000 | | | | 2,853,150 | |
| | | | | | | | |
| | | | | | | 7,371,748 | |
| | | | | | | | |
Environmental Controls 0.5% | |
Republic Services, Inc.
4.75%, due 5/15/23 | | | 3,665,000 | | | | 4,061,878 | |
Waste Management, Inc.
2.40%, due 5/15/23 | | | 505,000 | | | | 527,784 | |
| | | | | | | | |
| | | | | | | 4,589,662 | |
| | | | | | | | |
Food 1.1% | |
JBS USA LUX S.A. / JBS Food Co. / JBS USA Finance, Inc.
5.50%, due 1/15/30 (a) | | | 1,435,000 | | | | 1,470,875 | |
Kraft Heinz Foods Co. | | | | | | | | |
4.25%, due 3/1/31 (a) | | | 2,364,000 | | | | 2,506,533 | |
5.00%, due 7/15/35 | | | 997,000 | | | | 1,096,983 | |
Smithfield Foods, Inc.
3.35%, due 2/1/22 (a) | | | 1,805,000 | | | | 1,791,076 | |
Sysco Corp.
3.30%, due 7/15/26 | | | 1,735,000 | | | | 1,858,124 | |
U.S. Foods, Inc.
6.25%, due 4/15/25 (a) | | | 1,425,000 | | | | 1,449,938 | |
| | | | | | | | |
| | | | | | | 10,173,529 | |
| | | | | | | | |
Food Services 0.1% | |
Aramark Services, Inc.
6.375%, due 5/1/25 (a) | | | 1,294,000 | | | | 1,336,223 | |
| | | | | | | | |
Health Care—Products 0.7% | |
Baxter International, Inc.
2.60%, due 8/15/26 | | | 6,085,000 | | | | 6,680,871 | |
| | | | | | | | |
Health Care—Services 0.4% | |
Health Care Service Corp. A Mutual Legal Reserve Co.
3.20%, due 6/1/50 (a) | | | 1,845,000 | | | | 1,877,283 | |
NYU Langone Hospitals
3.38%, due 7/1/55 | | | 1,880,000 | | | | 1,814,281 | |
| | | | | | | | |
| | | | | | | 3,691,564 | |
| | | | | | | | |
| | | | | | |
The notes to the financial statements are an integral part of,
and should be read in conjunction with, the financial statements. | | | | | 13 | |
Portfolio of Investments June 30, 2020 (Unaudited) (continued)
| | | | | | | | |
| | | Principal
Amount | | | Value | |
| Corporate Bonds (continued) | |
Home Builders 1.0% | |
D.R. Horton, Inc.
4.375%, due 9/15/22 | | $ | 3,350,000 | | | $ | 3,558,641 | |
Lennar Corp.
4.75%, due 11/29/27 | | | 868,000 | | | | 941,780 | |
Toll Brothers Finance Corp.
| | | | | | | | |
3.80%, due 11/1/29 | | | 1,251,000 | | | | 1,257,880 | |
4.35%, due 2/15/28 | | | 764,000 | | | | 792,650 | |
5.875%, due 2/15/22 | | | 2,475,000 | | | | 2,577,663 | |
| | | | | | | | |
| | | | | | | 9,128,614 | |
| | | | | | | | |
Home Furnishing 0.4% | |
Panasonic Corp.
2.536%, due 7/19/22 (a) | | | 3,500,000 | | | | 3,600,961 | |
| | | | | | | | |
Housewares 0.2% | |
Scotts Miracle-Gro Co.
5.25%, due 12/15/26 | | | 1,960,000 | | | | 2,035,950 | |
| | | | | | | | |
Insurance 1.6% | |
Lincoln National Corp.
2.743% (3 Month LIBOR + 2.358%), due 5/17/66 (b)(f) | | | 6,418,000 | | | | 4,267,970 | |
MassMutual Global Funding II
2.95%, due 1/11/25 (a) | | | 2,995,000 | | | | 3,247,484 | |
NMI Holdings, Inc.
7.375%, due 6/1/25 (a) | | | 870,000 | | | | 910,351 | |
Protective Life Corp.
8.45%, due 10/15/39 | | | 1,564,000 | | | | 2,406,611 | |
Reliance Standard Life Global Funding II
2.50%, due 10/30/24 (a) | | | 3,100,000 | | | | 3,193,604 | |
Willis North America, Inc.
3.875%, due 9/15/49 | | | 840,000 | | | | 926,610 | |
| | | | | | | | |
| | | | | | | 14,952,630 | |
| | | | | | | | |
Internet 1.9% | |
Booking Holdings, Inc.
3.60%, due 6/1/26 (c) | | | 2,875,000 | | | | 3,155,080 | |
Expedia Group, Inc.
| | | | | | | | |
3.25%, due 2/15/30 | | | 2,315,000 | | | | 2,158,379 | |
3.80%, due 2/15/28 | | | 2,245,000 | | | | 2,150,324 | |
5.00%, due 2/15/26 | | | 315,000 | | | | 324,211 | |
6.25%, due 5/1/25 (a) | | | 525,000 | | | | 559,268 | |
Match Group, Inc. (a)
| | | | | | | | |
4.125%, due 8/1/30 | | | 148,000 | | | | 144,901 | |
5.00%, due 12/15/27 | | | 1,775,000 | | | | 1,846,976 | |
VeriSign, Inc.
4.625%, due 5/1/23 | | | 3,670,000 | | | | 3,692,937 | |
Weibo Corp.
| | | | | | | | |
3.375%, due 7/8/30 | | | 1,810,000 | | | | 1,798,000 | |
3.50%, due 7/5/24 | | | 1,625,000 | | | | 1,680,364 | |
| | | | | | | | |
| | | | | | | 17,510,440 | |
| | | | | | | | |
| | | | | | | | |
| | | Principal
Amount | | | Value | |
Investment Company 0.3% | |
Icahn Enterprises, L.P. / Icahn Enterprises Finance Corp.
6.25%, due 5/15/26 | | $ | 2,440,000 | | | $ | 2,441,708 | |
| | | | | | | | |
Iron & Steel 0.7% | |
ArcelorMittal S.A.
4.55%, due 3/11/26 | | | 3,205,000 | | | | 3,248,025 | |
Vale Overseas, Ltd.
6.25%, due 8/10/26 | | | 2,780,000 | | | | 3,269,975 | |
| | | | | | | | |
| | | | | | | 6,518,000 | |
| | | | | | | | |
Leisure Time 0.3% | |
Royal Caribbean Cruises, Ltd.
2.65%, due 11/28/20 | | | 2,630,000 | | | | 2,551,605 | |
| | | | | | | | |
Lodging 1.1% | |
Boyd Gaming Corp.
6.375%, due 4/1/26 | | | 1,000 | | | | 950 | |
8.625%, due 6/1/25 (a) | | | 620,000 | | | | 647,900 | |
Hilton Domestic Operating Co., Inc.
4.875%, due 1/15/30 | | | 2,120,000 | | | | 2,088,200 | |
5.375%, due 5/1/25 (a) | | | 1,135,000 | | | | 1,135,000 | |
Marriott International, Inc.
3.75%, due 10/1/25 | | | 4,205,000 | | | | 4,173,929 | |
MGM Resorts International
6.00%, due 3/15/23 | | | 2,300,000 | | | | 2,323,000 | |
| | | | | | | | |
| | | | | | | 10,368,979 | |
| | | | | | | | |
Machinery—Diversified 1.1% | |
Clark Equipment Co.
5.875%, due 6/1/25 (a) | | | 1,535,000 | | | | 1,569,537 | |
CNH Industrial Capital LLC
4.375%, due 4/5/22 | | | 3,550,000 | | | | 3,710,460 | |
4.875%, due 4/1/21 | | | 4,355,000 | | | | 4,468,215 | |
| | | | | | | | |
| | | | | | | 9,748,212 | |
| | | | | | | | |
Media 1.8% | |
CCO Holdings LLC / CCO Holdings Capital Corp.
5.875%, due 4/1/24 (a) | | | 1,224,000 | | | | 1,262,250 | |
Charter Communications Operating LLC / Charter Communications Operating Capital Corp.
4.464%, due 7/23/22 (c) | | | 2,770,000 | | | | 2,954,463 | |
Diamond Sports Group LLC / Diamond Sports Finance Co.
6.625%, due 8/15/27 (a) | | | 4,528,000 | | | | 2,411,160 | |
Grupo Televisa S.A.B.
5.25%, due 5/24/49 | | | 1,735,000 | | | | 2,008,863 | |
Sirius XM Radio, Inc.(a)
3.875%, due 8/1/22 | | | 2,545,000 | | | | 2,564,367 | |
5.375%, due 7/15/26 | | | 3,000,000 | | | | 3,098,220 | |
Sky, Ltd.
3.75%, due 9/16/24 (a) | | | 1,105,000 | | | | 1,230,439 | |
| | | | |
| 14 | | MainStay VP MacKay Unconstrained Bond Portfolio | | The notes to the financial statements are an integral part of,
and should be read in conjunction with, the financial statements. |
| | | | | | | | |
| | | Principal
Amount | | | Value | |
| Corporate Bonds (continued) | |
Media (continued) | | | | | | | | |
Time Warner Entertainment Co., L.P.
8.375%, due 3/15/23 | | $ | 740,000 | | | $ | 867,111 | |
| | | | | | | | |
| | | | | | | 16,396,873 | |
| | | | | | | | |
Mining 1.1% | |
Anglo American Capital PLC
4.125%, due 4/15/21 (a) | | | 3,300,000 | | | | 3,355,641 | |
Corp. Nacional del Cobre de Chile (a)
3.00%, due 9/30/29 | | | 2,055,000 | | | | 2,125,562 | |
3.75%, due 1/15/31 | | | 1,635,000 | | | | 1,781,954 | |
Indonesia Asahan Aluminium Persero PT
5.45%, due 5/15/30 (a) | | | 2,685,000 | | | | 2,994,312 | |
| | | | | | | | |
| | | | | | | 10,257,469 | |
| | | | | | | | |
Miscellaneous—Manufacturing 0.9% | |
General Electric Co. 3.625%, due 5/1/30 | | | 1,715,000 | | | | 1,716,939 | |
4.25%, due 5/1/40 | | | 1,865,000 | | | | 1,855,821 | |
4.35%, due 5/1/50 | | | 2,525,000 | | | | 2,497,236 | |
Textron Financial Corp.
2.127% (3 Month LIBOR + 1.735%), due 2/15/42 (a)(b) | | | 3,720,000 | | | | 2,325,000 | |
| | | | | | | | |
| | | | | | | 8,394,996 | |
| | | | | | | | |
Oil & Gas 3.5% | |
BP Capital Markets PLC
4.875% (5 Year Treasury Constant Maturity Rate + 4.398%), due 3/22/30 (b)(e) | | | 2,895,000 | | | | 2,989,087 | |
Concho Resources, Inc.
4.30%, due 8/15/28 | | | 2,900,000 | | | | 3,182,878 | |
Gazprom PJSC Via Gaz Capital S.A.
7.288%, due 8/16/37 (a) | | | 2,500,000 | | | | 3,591,045 | |
Marathon Petroleum Corp.
4.50%, due 5/1/23 | | | 1,615,000 | | | | 1,740,500 | |
4.70%, due 5/1/25 | | | 1,755,000 | | | | 1,964,651 | |
5.125%, due 12/15/26 | | | 5,755,000 | | | | 6,621,932 | |
Occidental Petroleum Corp.
(zero coupon), due 10/10/36 | | | 6,555,000 | | | | 2,753,100 | |
Petrobras Global Finance B.V.
6.75%, due 6/3/50 | | | 2,085,000 | | | | 2,144,423 | |
Petroleos Mexicanos
6.75%, due 9/21/47 | | | 4,990,000 | | | | 3,836,561 | |
Valero Energy Corp.
4.00%, due 4/1/29 | | | 2,250,000 | | | | 2,502,834 | |
WPX Energy, Inc.
4.50%, due 1/15/30 | | | 1,320,000 | | | | 1,161,600 | |
| | | | | | | | |
| | | | | | | 32,488,611 | |
| | | | | | | | |
| | | | | | | | |
| | | Principal
Amount | | | Value | |
Packaging & Containers 1.9% | |
Ball Corp.
5.00%, due 3/15/22 | | $ | 4,240,000 | | | $ | 4,405,572 | |
Berry Global, Inc.
4.875%, due 7/15/26 (a) | | | 166,000 | | | | 168,490 | |
Owens Brockway Glass Container, Inc.
6.625%, due 5/13/27 (a) | | | 2,950,000 | | | | 3,068,000 | |
Reynolds Group Issuer, Inc. / Reynolds Group Issuer LLC
5.125%, due 7/15/23 (a) | | | 4,215,000 | | | | 4,246,992 | |
Sealed Air Corp.(a)
4.00%, due 12/1/27 | | | 1,580,000 | | | | 1,580,000 | |
4.875%, due 12/1/22 | | | 1,875,000 | | | | 1,926,563 | |
WestRock RKT Co.
4.00%, due 3/1/23 | | | 2,230,000 | | | | 2,378,592 | |
| | | | | | | | |
| | | | | | | 17,774,209 | |
| | | | | | | | |
Pharmaceuticals 2.0% | |
AbbVie, Inc. (a)
3.45%, due 3/15/22 | | | 4,165,000 | | | | 4,331,850 | |
4.25%, due 11/21/49 | | | 3,065,000 | | | | 3,715,299 | |
Bausch Health Cos., Inc. (a)
5.50%, due 11/1/25 | | | 4,590,000 | | | | 4,704,750 | |
6.25%, due 2/15/29 | | | 1,440,000 | | | | 1,447,200 | |
Becton Dickinson and Co.
3.363%, due 6/6/24 | | | 2,245,000 | | | | 2,422,969 | |
Teva Pharmaceutical Finance Netherlands III B.V.
3.15%, due 10/1/26 | | | 2,575,000 | | | | 2,299,166 | |
| | | | | | | | |
| | | | | | | 18,921,234 | |
| | | | | | | | |
Pipelines 1.6% | |
Enterprise Products Operating LLC
3.95%, due 1/31/60 | | | 1,760,000 | | | | 1,813,684 | |
4.20%, due 1/31/50 | | | 545,000 | | | | 608,088 | |
Hess Midstream Operations L.P.
5.625%, due 2/15/26 (a) | | | 389,000 | | | | 384,912 | |
MPLX, L.P.
4.00%, due 3/15/28 | | | 2,500,000 | | | | 2,634,473 | |
4.125%, due 3/1/27 | | | 1,780,000 | | | | 1,896,093 | |
Plains All American Pipeline, L.P. / PAA Finance Corp.
3.80%, due 9/15/30 | | | 1,330,000 | | | | 1,303,104 | |
Sabine Pass Liquefaction LLC
5.75%, due 5/15/24 | | | 2,710,000 | | | | 3,051,866 | |
Spectra Energy Partners, L.P.
4.75%, due 3/15/24 | | | 818,000 | | | | 913,632 | |
Targa Resources Partners, L.P. / Targa Resources Partners Finance Corp.
5.25%, due 5/1/23 | | | 950,000 | | | | 926,250 | |
Western Midstream Operating L.P.
5.25%, due 2/1/50 | | | 1,975,000 | | | | 1,708,967 | |
| | | | | | | | |
| | | | | | | 15,241,069 | |
| | | | | | | | |
| | | | | | |
The notes to the financial statements are an integral part of,
and should be read in conjunction with, the financial statements. | | | | | 15 | |
Portfolio of Investments June 30, 2020 (Unaudited) (continued)
| | | | | | | | |
| | | Principal
Amount | | | Value | |
| Corporate Bonds (continued) | |
Real Estate 0.3% | |
Realogy Group LLC / Realogy Co-Issuer Corp. (a) | | | | | | | | |
5.25%, due 12/1/21 | | $ | 640,000 | | | $ | 648,640 | |
7.625%, due 6/15/25 | | | 1,900,000 | | | | 1,900,380 | |
| | | | | | | | |
| | | | | | | 2,549,020 | |
| | | | | | | | |
Real Estate Investment Trusts 1.2% | |
Boston Properties, L.P.
3.20%, due 1/15/25 | | | 4,800,000 | | | | 5,152,613 | |
Crown Castle International Corp.
3.40%, due 2/15/21 | | | 1,255,000 | | | | 1,274,672 | |
CyrusOne L.P. / CyrusOne Finance Corp.
3.45%, due 11/15/29 | | | 2,030,000 | | | | 2,113,128 | |
Equinix, Inc.
5.875%, due 1/15/26 | | | 2,275,000 | | | | 2,394,210 | |
Host Hotels & Resorts, L.P.
3.75%, due 10/15/23 | | | 329,000 | | | | 335,788 | |
Iron Mountain, Inc.
4.875%, due 9/15/29 (a) | | | 269,000 | | | | 261,603 | |
| | | | | | | | |
| | | | | | | 11,532,014 | |
| | | | | | | | |
Retail 2.0% | |
1011778 B.C. ULC / New Red Finance, Inc.
5.75%, due 4/15/25 (a) | | | 618,000 | | | | 648,900 | |
Alimentation Couche-Tard, Inc.
2.70%, due 7/26/22 (a) | | | 1,650,000 | | | | 1,689,044 | |
AutoNation, Inc.
4.75%, due 6/1/30 | | | 2,880,000 | | | | 3,120,677 | |
Darden Restaurants, Inc.
3.85%, due 5/1/27 | | | 2,025,000 | | | | 2,087,876 | |
Dollar General Corp.
3.25%, due 4/15/23 (c) | | | 2,794,000 | | | | 2,983,262 | |
Kohl’s Corp.
9.50%, due 5/15/25 | | | 2,975,000 | | | | 3,397,700 | |
Macy’s, Inc.
8.375%, due 6/15/25 (a) | | | 2,605,000 | | | | 2,593,251 | |
Starbucks Corp.
4.45%, due 8/15/49 | | | 2,065,000 | | | | 2,495,393 | |
| | | | | | | | |
| | | | | | | 19,016,103 | |
| | | | | | | | |
Semiconductors 1.0% | |
Broadcom, Inc.
3.625%, due 10/15/24 (a) | | | 2,470,000 | | | | 2,682,836 | |
NXP B.V. / NXP Funding LLC (a) | | | | | | | | |
4.625%, due 6/15/22 | | | 1,755,000 | | | | 1,869,621 | |
4.625%, due 6/1/23 | | | 1,065,000 | | | | 1,168,064 | |
NXP B.V. / NXP Funding LLC / NXP USA, Inc. 3.40%, due 5/1/30 (a) | | | 1,380,000 | | | | 1,484,809 | |
| | | | | | | | |
| | | Principal
Amount | | | Value | |
Semiconductors (continued) | |
ON Semiconductor Corp.
2019 Term Loan B
2.178% (1 Month LIBOR + 2.00%), due 9/19/26 | | $ | 1,872,002 | | | $ | 1,790,101 | |
| | | | | | | | |
| | | | | | | 8,995,431 | |
| | | | | | | | |
Telecommunications 4.3% | |
Altice France S.A.
7.375%, due 5/1/26 (a) | | | 2,870,000 | | | | 2,992,836 | |
AT&T, Inc. | | | | | | | | |
2.875% (5 Month Euribor ICE Swap Rate + 3.14%), due 3/2/25 (b)(e) | | EUR | 2,200,000 | | | | 2,340,318 | |
3.65%, due 6/1/51 | | $ | 1,860,000 | | | | 1,947,459 | |
CommScope Technologies LLC
5.00%, due 3/15/27 (a) | | | 3,909,000 | | | | 3,520,836 | |
CommScope, Inc. (a) | | | | | | | | |
5.00%, due 6/15/21 | | | 120,000 | | | | 120,000 | |
7.125%, due 7/1/28 | | | 930,000 | | | | 927,768 | |
Crown Castle Towers LLC (a)
3.72%, due 7/15/23 | | | 1,550,000 | | | | 1,620,859 | |
4.241%, due 7/15/28 | | | 3,755,000 | | | | 4,296,019 | |
Sprint Communications, Inc.
6.00%, due 11/15/22 | | | 1,454,000 | | | | 1,533,578 | |
Sprint Spectrum Co. LLC / Sprint Spectrum Co. II LLC / Sprint Spectrum Co. III LLC
4.738%, due 3/20/25 (a) | | | 4,750,000 | | | | 5,154,795 | |
T-Mobile USA, Inc.
3.50%, due 4/15/25 (a) | | | 2,150,000 | | | | 2,340,039 | |
4.50%, due 2/1/26 | | | 2,245,000 | | | | 2,271,850 | |
4.50%, due 4/15/50 (a) | | | 1,130,000 | | | | 1,344,960 | |
6.00%, due 3/1/23 | | | 1,200,000 | | | | 1,204,848 | |
6.50%, due 1/15/26 | | | 1,235,000 | | | | 1,290,711 | |
Telefonica Emisiones S.A.
4.57%, due 4/27/23 | | | 1,781,000 | | | | 1,955,794 | |
5.462%, due 2/16/21 | | | 279,000 | | | | 287,234 | |
Verizon Communications, Inc.
1.492% (3 Month LIBOR + 1.10%), due 5/15/25 (b) | | | 2,455,000 | | | | 2,484,902 | |
Vodafone Group PLC
4.25%, due 9/17/50 | | | 2,020,000 | | | | 2,405,378 | |
| | | | | | | | |
| | | | | | | 40,040,184 | |
| | | | | | | | |
Transportation 0.6% | |
United Parcel Service, Inc.
2.50%, due 4/1/23 (c) | | | 4,965,000 | | | | 5,216,461 | |
| | | | | | | | |
Total Corporate Bonds
(Cost $557,086,617) | | | | 571,695,144 | |
| | | | | | | | |
| | | | |
| 16 | | MainStay VP MacKay Unconstrained Bond Portfolio | | The notes to the financial statements are an integral part of,
and should be read in conjunction with, the financial statements. |
| | | | | | | | |
| | | Principal
Amount | | | Value | |
| Foreign Government Bonds 1.3% | |
Brazil 0.8% | |
Brazilian Government International Bond
4.625%, due 1/13/28 | | $ | 6,824,000 | | | $ | 7,134,560 | |
| | | | | | | | |
Mexico 0.5% | |
Mexico Government International Bond
3.25%, due 4/16/30 | | | 4,596,000 | | | | 4,554,636 | |
| | | | | | | | |
Total Foreign Government Bonds
(Cost $11,854,675) | | | | | | | 11,689,196 | |
| | | | | | | | |
|
| Loan Assignments 6.1% (b) | |
Automobile 0.0% ‡ | |
KAR Auction Services, Inc.
2019 Term Loan B6
2.50% (1 Month LIBOR + 2.25%), due 9/19/26 | | | 409,691 | | | | 388,182 | |
| | | | | | | | |
Beverage, Food & Tobacco 0.5% | |
U.S. Foods, Inc.
2016 Term Loan B
1.928% (1 Month LIBOR + 1.75%), due 6/27/23 | | | 5,064,000 | | | | 4,684,200 | |
| | | | | | | | |
Buildings & Real Estate 0.4% | |
Realogy Group LLC
2018 Term Loan B
3.00% (3 Month LIBOR + 2.25%), due 2/8/25 | | | 4,331,679 | | | | 3,979,731 | |
| | | | | | | | |
Chemicals, Plastics & Rubber 0.4% | |
Axalta Coating Systems U.S. Holdings, Inc. Term Loan B3
2.058% (3 Month LIBOR + 1.75%), due 6/1/24 | | | 3,736,928 | | | | 3,577,331 | |
| | | | | | | | |
Containers, Packaging & Glass 0.5% | |
BWAY Holding Co.
2017 Term Loan B
4.561% (3 Month LIBOR + 3.25%), due 4/3/24 | | | 5,070,793 | | | | 4,530,753 | |
| | | | | | | | |
Diversified/Conglomerate Service 0.5% | |
Change Healthcare Holdings LLC
2017 Term Loan B
3.50% (1 Month LIBOR + 2.50%, 3 Month LIBOR + 2.50%), due 3/1/24 | | | 4,570,267 | | | | 4,378,887 | |
| | | | | | | | |
Ecological 0.9% | |
Advanced Disposal Services, Inc.
Term Loan B3
3.00% (1 Week LIBOR + 2.25%), due 11/10/23 | | | 5,430,360 | | | | 5,361,123 | |
| | | | | | | | |
| | | Principal
Amount | | | Value | |
Ecological (continued) | |
GFL Environmental, Inc.
2018 Term Loan B
4.00% (1 Month LIBOR + 3.00%, 3 Month LIBOR + 3.000%), due 5/30/25 | | $ | 3,102,977 | | | $ | 3,007,303 | |
| | | | | | | | |
| | | | | | | 8,368,426 | |
| | | | | | | | |
Insurance 0.4% | |
Alliant Holdings Intermediate LLC
2018 Term Loan B
2.928% (1 Month LIBOR + 2.75%), due 5/9/25 | | | 4,009,316 | | | | 3,778,781 | |
| | | | | | | | |
Internet 0.2% | |
Match Group, Inc.
2020 Term Loan B
2.184% (3 Month LIBOR + 1.75%), due 2/13/27 | | | 1,859,000 | | | | 1,756,755 | |
| | | | | | | | |
Leisure, Amusement, Motion Pictures & Entertainment 0.3% | |
Bombardier Recreational Products, Inc.
2020 Term Loan
2.178% (1 Month LIBOR + 2.00%), due 5/24/27 | | | 3,021,303 | | | | 2,863,944 | |
| | | | | | | | |
Personal & Nondurable Consumer Products 0.2% | |
Prestige Brands, Inc.
Term Loan B4
2.178% (1 Month LIBOR + 2.00%), due 1/26/24 | | | 2,049,589 | | | | 2,013,721 | |
| | | | | | | | |
Radio and TV Broadcasting 0.3% | |
Nielsen Finance LLC
Term Loan B4
2.18% (1 Month LIBOR + 2.00%), due 10/4/23 | | | 2,910,000 | | | | 2,799,420 | |
| | | | | | | | |
Software 0.7% | |
IQVIA, Inc.
2018 Term Loan B3
2.058% (3 Month LIBOR + 1.75%), due 6/11/25 | | | 3,773,000 | | | | 3,643,303 | |
Syneos Health, Inc.
2018 Term Loan B
1.928% (1 Month LIBOR + 1.75%), due 8/1/24 | | | 2,550,777 | | | | 2,469,471 | |
| | | | | | | | |
| | | | | | | 6,112,774 | |
| | | | | | | | |
Telecommunications 0.8% | |
Level 3 Financing, Inc.
2019 Term Loan B
1.928% (1 Month LIBOR + 1.75%), due 3/1/27 | | | 3,963,602 | | | | 3,735,695 | |
SBA Senior Finance II LLC
2018 Term Loan B
1.93% (1 Month LIBOR + 1.75%), due 4/11/25 | | | 4,191,498 | | | | 4,011,612 | |
| | | | | | | | |
| | | | | | | 7,747,307 | |
| | | | | | | | |
Total Loan Assignments
(Cost $59,825,092) | | | | | | | 56,980,212 | |
| | | | | | | | |
| | | | | | |
The notes to the financial statements are an integral part of,
and should be read in conjunction with, the financial statements. | | | | | 17 | |
Portfolio of Investments June 30, 2020 (Unaudited) (continued)
| | | | | | | | |
| | | Principal
Amount | | | Value | |
| Mortgage-Backed Securities 13.7% | |
Agency (Collateralized Mortgage Obligations) 1.1% | |
Federal Home Loan Mortgage Corporation | |
REMIC, Series 4908, Class BD
3.00%, due 4/25/49 | | $ | 2,745,000 | | | $ | 2,899,135 | |
REMIC Series 4888, Class BA
3.50%, due 9/15/48 | | | 1,968,423 | | | | 2,041,944 | |
REMIC, Series 4924, Class NS
5.865% (1 Month LIBOR + 6.05%), due 10/25/49 (b) | | | 7,141,361 | | | | 1,052,569 | |
REMIC, Series 4957, Class SB
5.865% (1 Month LIBOR + 6.05%), due 11/25/49 (b) | | | 5,490,482 | | | | 553,694 | |
Federal National Mortgage Association
REMIC, Series 2020-10, Class DA
3.50%, due 3/25/60 | | | 3,435,226 | | | | 3,751,887 | |
| | | | | | | | |
| | | | | | | 10,299,229 | |
| | | | | | | | |
Commercial Mortgage Loans
(Collateralized Mortgage Obligations) 9.0% | |
BANK | |
Series 2019-BN21, Class A5
2.851%, due 10/17/52 | | | 3,800,000 | | | | 4,157,892 | |
Series 2019-BN19, Class A2
2.926%, due 8/15/61 | | | 3,965,000 | | | | 4,358,310 | |
Bayview Commercial Asset Trust
Series 2005-3A, Class A1
0.505% (1 Month LIBOR + 0.32%), due 11/25/35 (a)(b) | | | 1,362,358 | | | | 1,261,023 | |
Benchmark Mortgage Trust | |
Series 2019-B12, Class A5
3.116%, due 8/15/52 | | | 3,752,000 | | | | 4,157,307 | |
Series 2020-IG3, Class AS
3.229%, due 9/15/48 (a)(g) | | | 1,505,000 | | | | 1,633,480 | |
BX Trust (a) | |
Series 2018-BILT, Class A
0.985% (1 Month LIBOR + 0.80%), due 5/15/30 (b) | | | 2,145,000 | | | | 2,026,869 | |
Series 2018-GW, Class A
0.985% (1 Month LIBOR + 0.80%), due 5/15/35 (b) | | | 1,955,000 | | | | 1,852,209 | |
Series 2019-OC11, Class A
3.202%, due 12/9/41 | | | 1,330,000 | | | | 1,385,541 | |
Series 2019-0C11, Class B
3.605%, due 12/9/41 | | | 1,120,000 | | | | 1,125,736 | |
Series 2019-0C11, Class C
3.856%, due 12/9/41 | | | 2,970,000 | | | | 2,828,211 | |
Series 2019-0C11, Class D
4.076%, due 12/9/41 (h) | | | 705,000 | | | | 651,270 | |
CSAIL Commercial Mortgage Trust
Series 2015-C3, Class A4
3.718%, due 8/15/48 | | | 1,950,220 | | | | 2,134,427 | |
| | | | | | | | |
| | | Principal
Amount | | | Value | |
Commercial Mortgage Loans
(Collateralized Mortgage Obligations) (continued) | |
FREMF Mortgage Trust (a)(g) | |
Series 2013-K33, Class B
3.614%, due 8/25/46 | | $ | 3,090,000 | | | $ | 3,239,901 | |
Series 2013-K30, Class B
3.667%, due 6/25/45 | | | 4,220,000 | | | | 4,433,871 | |
Series 2015-K721, Class B
3.681%, due 11/25/47 | | | 2,425,000 | | | | 2,499,700 | |
Series 2013-K35, Class B
4.073%, due 12/25/46 | | | 640,000 | | | | 687,097 | |
GS Mortgage Securities Trust | |
Series 2019-BOCA, Class A
1.385% (1 Month LIBOR + 1.20%), due 6/15/38 (a)(b) | | | 5,395,000 | | | | 5,151,865 | |
Series 2019-GC42, Class A4
3.001%, due 9/1/52 | | | 1,490,000 | | | | 1,641,284 | |
Series 2019-GC40, Class A4
3.16%, due 7/10/52 | | | 2,699,000 | | | | 2,986,143 | |
Series 2017-GS7, Class A4
3.43%, due 8/10/50 | | | 2,990,000 | | | | 3,337,969 | |
Hawaii Hotel Trust
Series 2019-MAUI, Class A
1.335% (1 Month LIBOR + 1.15%), due 5/15/38 (a)(b) | | | 2,265,000 | | | | 2,182,975 | |
Hudson Yards Mortgage Trust
Series 2019-30HY, Class A
3.228%, due 7/10/39 (a) | | | 1,805,000 | | | | 2,016,639 | |
JP Morgan Chase Commercial Mortgage Securities Trust | | | | | | | | |
Series 2018-AON, Class A
4.128%, due 7/5/31 (a) | | | 3,043,000 | | | | 3,223,953 | |
Series 2013-C16, Class A4
4.166%, due 12/15/46 | | | 2,930,000 | | | | 3,166,159 | |
JPMBB Commercial Mortgage Securities Trust
Series 2014-C26, Class A3
3.231%, due 1/15/48 | | | 2,092,995 | | | | 2,237,884 | |
Morgan Stanley Bank of America Merrill Lynch Trust
Series-2015-C23, Class A3
3.451%, due 7/15/50 | | | 1,430,000 | | | | 1,540,793 | |
One Bryant Park Trust
Series 2019-OBP, Class A
2.516%, due 9/15/54 (a) | | | 3,825,000 | | | | 4,047,411 | |
Wells Fargo Commercial Mortgage Trust | |
Series 2019-C53, Class A3
2.787%, due 10/15/52 | | | 1,005,000 | | | | 1,093,198 | |
Series 2019-C53, Class A4
3.04%, due 10/15/52 | | | 3,566,000 | | | | 3,950,796 | |
Series 2018-1745, Class A
3.874%, due 6/15/36 (a)(g) | | | 2,900,000 | | | | 3,198,692 | |
| | | | |
| 18 | | MainStay VP MacKay Unconstrained Bond Portfolio | | The notes to the financial statements are an integral part of,
and should be read in conjunction with, the financial statements. |
| | | | | | | | |
| | | Principal
Amount | | | Value | |
| Mortgage-Backed Securities (continued) | |
Commercial Mortgage Loans
(Collateralized Mortgage Obligations) (continued) | |
Series 2018-AUS, Class A
4.194%, due 8/17/36 (a)(g) | | $ | 4,325,000 | | | $ | 4,705,860 | |
| | | | | | | | |
| | | | | | | 82,914,465 | |
| | | | | | | | |
Whole Loan (Collateralized Mortgage Obligations) 3.6% | |
Chase Home Lending Mortgage Trust
Series 2019-ATR2, Class A3
3.50%, due 7/25/49 (a)(h) | | | 728,123 | | | | 745,826 | |
Connecticut Avenue Securities Trust (Mortgage Pass-Through Securities)
Series 2020-R02, Class 2M2
2.185% (1 Month LIBOR + 2.00%), due 1/25/40 (a)(b) | | | 2,010,000 | | | | 1,902,871 | |
Fannie Mae Connecticut Avenue Securities (Mortgage Pass-Through Securities) (b) | | | | | | | | |
Series 2017-C02, Class 2M2
3.835% (1 Month LIBOR + 3.65%), due 9/25/29 | | | 1,108,213 | | | | 1,108,212 | |
Series 2016-C04, Class 1M2
4.435% (1 Month LIBOR + 4.25%), due 1/25/29 | | | 2,159,947 | | | | 2,235,265 | |
Series 2016-C06, Class 1M2
4.435% (1 Month LIBOR + 4.25%), due 4/25/29 | | | 2,895,744 | | | | 3,024,561 | |
Series 2016-C07, Class 2M2
4.535% (1 Month LIBOR + 4.35%), due 5/25/29 | | | 1,459,189 | | | | 1,509,493 | |
Series 2016-C05, Class 2M2
4.635% (1 Month LIBOR + 4.45%), due 1/25/29 | | | 4,068,202 | | | | 4,156,926 | |
Series 2016-C05, Class 2M2B
4.635% (1 Month LIBOR + 4.45%), due 1/25/29 | | | 3,405,000 | | | | 3,368,440 | |
Federal Home Loan Mortgage Corporation Structured Agency Credit Risk Debt Notes (b) | | | | | | | | |
Series 2020-DNA2, Class M2
2.035% (1 Month LIBOR + 1.85%), due 2/25/50 (a) | | | 720,000 | | | | 682,635 | |
Series 2016-DNA4, Class M3
3.985% (1 Month LIBOR + 3.80%), due 3/25/29 | | | 1,950,000 | | | | 1,969,539 | |
Series 2016-HQA3, Class M3
4.035% (1 Month LIBOR + 3.85%), due 3/25/29 | | | 5,458,561 | | | | 5,604,810 | |
Series 2016-HQA1, Class M3
6.535% (1 Month LIBOR + 6.35%), due 9/25/28 | | | 2,121,362 | | | | 2,225,324 | |
Galton Funding Mortgage Trust
Series 2018-2, Class A51
4.50%, due 10/25/58 (a)(h) | | | 1,750,000 | | | | 1,842,307 | |
| | | | | | | | |
| | | Principal
Amount | | | Value | |
Whole Loan (Collateralized Mortgage Obligations) (continued) | |
GreenPoint Mortgage Funding Trust
Series 2007-AR3, Class A1
0.405% (1 Month LIBOR + 0.22%), due 6/25/37 (b) | | $ | 801,133 | | | $ | 737,152 | |
Sequoia Mortgage Trust (a)(h) | |
Series 2017-1, Class A4
3.50%, due 2/25/47 | | | 719,992 | | | | 738,219 | |
Series 2018-7, Class B3
4.224%, due 9/25/48 | | | 1,630,675 | | | | 1,509,326 | |
| | | | | | | | |
| | | | | | | 33,360,906 | |
| | | | | | | | |
Total Mortgage-Backed Securities
(Cost $121,931,445) | | | | | | | 126,574,600 | |
| | | | | | | | |
|
| Municipal Bonds 0.4% | |
Texas 0.4% | |
New York State Thruway Authority, Revenue Bonds
Series M
2.90%, due 1/1/35 | | | 640,000 | | | | 688,621 | |
Regents of the University of California Medical Center Pooled Revenue, Revenue Bonds
Series N
3.006%, due 5/15/50 | | | 3,170,000 | | | | 3,222,336 | |
| | | | | | | | |
Total Municipal Bonds
(Cost $3,810,000) | | | | | | | 3,910,957 | |
| | | | | | | | |
|
| U.S. Government & Federal Agencies 8.6% | |
Federal Home Loan Mortgage Corporation (Mortgage Pass-Through Securities) 0.7% | |
2.50%, due 5/1/50 | | | 2,654,149 | | | | 2,766,178 | |
2.50%, due 6/1/50 | | | 3,165,785 | | | | 3,301,588 | |
| | | | | | | | |
| | | | | | | 6,067,766 | |
| | | | | | | | |
United States Treasury Bonds 0.1% | |
2.00%, due 2/15/50 | | | 960,000 | | | | 1,099,425 | |
| | | | | | | | |
United States Treasury Notes 0.1% | |
0.625%, due 5/15/30 | | | 1,245,000 | | | | 1,241,547 | |
| | | | | | | | |
United States Treasury Inflation—Indexed Bond 0.6% (i) | |
0.125%, due 1/15/30 | | | 5,038,571 | | | | 5,443,178 | |
| | | | | | | | |
United States Treasury Inflation—Indexed Notes 7.1% (i) | |
0.75%, due 7/15/28 | | | 22,297,075 | | | | 25,137,915 | |
0.875%, due 1/15/29 | | | 35,404,513 | | | | 40,334,853 | |
| | | | | | | | |
| | | | | | | 65,472,768 | |
| | | | | | | | |
Total U.S. Government & Federal Agencies (Cost $72,502,170) | | | | | | | 79,324,684 | |
| | | | | | | | |
Total Long-Term Bonds
(Cost $880,303,707) | | | | | | | 906,170,066 | |
| | | | | | | | |
| | | | | | |
The notes to the financial statements are an integral part of,
and should be read in conjunction with, the financial statements. | | | | | 19 | |
Portfolio of Investments June 30, 2020 (Unaudited) (continued)
| | | | | | | | |
| | | Shares | | | Value | |
| Common Stocks 0.0%‡ | |
Software 0.0% ‡ | |
salesforce.com, Inc. (j) | | $ | 1,267 | | | $ | 237,347 | |
| | | | | | | | |
Total Common Stocks
(Cost $146,796) | | | | | | | 237,347 | |
| | | | | | | | |
|
| Short-Term Investments 2.5% | |
Affiliated Investment Company 2.3% | |
MainStay U.S. Government Liquidity Fund, 0.05% (k) | | | 21,743,254 | | | | 21,743,254 | |
| | | | | | | | |
Unaffiliated Investment Company 0.2% | |
State Street Navigator Securities Lending Government Money Market Portfolio, 0.13% (k)(l) | | | 1,628,960 | | | | 1,628,960 | |
| | | | | | | | |
Total Short-Term Investments
(Cost $23,372,214) | | | | | | | 23,372,214 | |
| | | | | | | | |
Total Investments, Before Investments Sold Short
(Cost $903,822,717) | | | 100.3 | % | | | 929,779,627 | |
| | | | | | | | |
| | |
| | | | | | | | |
| | | Principal
Amount | | | | |
Investments Sold Short (0.9%) Corporate Bonds Sold Short (0.9%) | |
Health Care Providers & Services (0.3%) | |
Davita, Inc.
5.00%, due 5/1/25 | | $ | (3,015,000 | ) | | | (3,082,837 | ) |
| | | | | | | | |
Metals & Mining (0.6%) | |
FMG Resources (August 2006) Pty, Ltd.
5.125%, due 5/15/24 (a) | | | (5,000,000 | ) | | | (5,150,000 | ) |
| | | | | | | | |
Total Investments Sold Short
(Proceeds $8,069,769) | | | | | | | (8,232,837 | ) |
| | | | | | | | |
Total Investments, Net of Investments Sold Short
(Cost $895,752,948) | | | 99.4 | % | | | 921,546,790 | |
Other Assets, Less Liabilities | | | 0.6 | | | | 5,895,639 | |
Net Assets | | | 100.0 | % | | $ | 927,442,429 | |
| † | Percentages indicated are based on Portfolio net assets. |
| ‡ | Less than one-tenth of a percent. |
| (a) | May be sold to institutional investors only under Rule 144A or securities offered pursuant to Section 4(a)(2) of the Securities Act of 1933, as amended. |
| (b) | Floating rate—Rate shown was the rate in effect as of June 30, 2020. |
| (c) | Security, or a portion thereof, was maintained in a segregated account at the Portfolio’s custodian as collateral for securities sold short. |
| (d) | Fixed to floating rate—Rate shown was the rate in effect as of June 30, 2020. |
| (e) | Securities are perpetual and, thus, do not have a predetermined maturity date. The date shown, if applicable, reflects the next call date. |
| (f) | All or a portion of this security was held on loan. As of June 30, 2020, the aggregate market value of securities on loan was $1,603,295. The Portfolio received cash collateral with a value of $1,628,960 (See Note 2(N)). |
| (g) | Collateral strip rate—A bond whose interest was based on the weighted net interest rate of the collateral. The coupon rate adjusts periodically based on a predetermined schedule. Rate shown was the rate in effect as of June 30, 2020. |
| (h) | Coupon rate may change based on changes of the underlying collateral or prepayments of principal. Rate shown was the rate in effect as of June 30, 2020. |
| (i) | Treasury Inflation Protected Security—Pays a fixed rate of interest on a principal amount that is continuously adjusted for inflation based on the Consumer Price Index-Urban Consumers. |
| (j) | Non-income producing security. |
| (k) | Current yield as of June 30, 2020. |
| (l) | Represents a security purchased with cash collateral received for securities on loan. |
| | | | |
| 20 | | MainStay VP MacKay Unconstrained Bond Portfolio | | The notes to the financial statements are an integral part of,
and should be read in conjunction with, the financial statements. |
Foreign Currency Forward Contracts
As of June 30, 2020, the Portfolio held the following foreign currency forward contracts1:
| | | | | | | | | | | | | | | | | | |
Currency Purchased | | | Currency Sold | | | Counterparty | | Settlement Date | | Unrealized
Appreciation
(Depreciation) | |
| | | | | | |
USD | | | 1,497,876 | | | GBP | | | 1,206,000 | | | JPMorgan Chase Bank N.A. | | 8/3/20 | | $ | 3,207 | |
Total unrealized appreciation | | | 3,207 | |
| | | | | | |
GBP | | | 774,000 | | | USD | | | 964,483 | | | JPMorgan Chase Bank N.A. | | 8/3/20 | | | (5,218 | ) |
USD | | | 5,442,571 | | | EUR | | | 5,012,000 | | | JPMorgan Chase Bank N.A. | | 8/3/20 | | | (192,318 | ) |
Total unrealized depreciation | | | (197,536 | ) |
Net unrealized depreciation | | $ | (194,329 | ) |
| 1. | Foreign Currency Forward Contracts are subject to limitations such that they cannot be “sold or repurchased,” although the Portfolio would be able to exit the transaction through other means, such as through the execution of an offsetting transaction. |
Futures Contracts
As of June 30, 2020, the Portfolio held the following futures contracts1:
| | | | | | | | | | | | | | | | | | | | |
Type | | Number of
Contracts | | | Expiration
Date | | | Value at
Trade Date | | | Current
Notional
Amount | | | Unrealized
Appreciation
(Depreciation)2 | |
| | | | | |
Long Contracts | | | | | | | | | | | | | | | | | | | | |
| 2-Year United States Treasury Note | | | 132 | | | | September 2020 | | | $ | 29,135,161 | | | $ | 29,149,312 | | | $ | 14,151 | |
| | | | | | | | | | | | | | | | | | | | |
| Total Long Contracts | | | | | | | | | | | | | | | | | | | 14,151 | |
| | | | | | | | | | | | | | | | | | | | |
| | | | | |
Short Contracts | | | | | | | | | | | | | | | | | | | | |
| 5-Year United States Treasury Note | | | (58 | ) | | | September 2020 | | | | (7,269,372 | ) | | | (7,293,047 | ) | | | (23,675 | ) |
| 10-Year United States Treasury Note | | | (512 | ) | | | September 2020 | | | | (70,968,361 | ) | | | (71,256,000 | ) | | | (287,639 | ) |
| 10-Year United States Treasury Ultra Note | | | (701 | ) | | | September 2020 | | | | (109,765,718 | ) | | | (110,396,547 | ) | | | (630,829 | ) |
| United States Treasury Long Bond | | | (89 | ) | | | September 2020 | | | | (15,753,356 | ) | | | (15,892,062 | ) | | | (138,706 | ) |
| United States Treasury Ultra Bond | | | (118 | ) | | | September 2020 | | | | (25,692,545 | ) | | | (25,742,438 | ) | | | (49,893 | ) |
| | | | | | | | | | | | | | | | | | | | |
| Total Short Contracts | | | | | | | | | | | | | | | | | | | (1,130,742 | ) |
| | | | | | | | | | | | | | | | | | | | |
| Net Unrealized Depreciation | | | | | | | | | | | | | | | | | | $ | (1,116,591 | ) |
| | | | | | | | | | | | | | | | | | | | |
| 1. | As of June 30, 2020, cash in the amount of $5,148,110 was on deposit with a broker or futures commission merchant for futures transactions. |
| 2. | Represents the difference between the value of the contracts at the time they were opened and the value as of June 30, 2020. |
Swap Contracts
As of June 30, 2020, the Portfolio held the following centrally cleared interest rate swap agreements1:
| | | | | | | | | | | | | | | | | | | | | | | | | | | | |
Notional
Amount | | | Currency | | | Expiration
Date | | | Payments
made by
Portfolio | | Payments
Received by
Portfolio | | Payment Frequency
Paid/Received | | Upfront
Premiums
Received/
(Paid) | | | Value | | | Unrealized
Appreciation /
(Depreciation) | |
| | | | | | | | |
| | $50,000,000 | | | | USD | | | | 3/16/2023 | | | Fixed 2.793% | | 3-Month USD-LIBOR | | Semi-Annually/Quarterly | | $ | — | | | $ | (3,473,616 | ) | | $ | (3,473,616 | ) |
| | 50,000,000 | | | | USD | | | | 3/29/2023 | | | Fixed 2.762% | | 3-Month USD-LIBOR | | Semi-Annually/Quarterly | | | — | | | | (3,477,261 | ) | | | (3,477,261 | ) |
| | | | | | | | | | | | | | | | | | | $ | — | | | $ | (6,950,877 | ) | | $ | (6,950,877 | ) |
| 1 | As of June 30, 2020, cash in the amount of $1,434,271 was on deposit with a broker for centrally cleared swap agreements. |
The following abbreviations are used in the preceding pages:
DB—Deutsche Bank
EUR—Euro
GBP—British Pound Sterling
LIBOR—London Interbank Offered Rate
REMIC—Real Estate Mortgage Investment Conduit
USD—United States Dollar
| | | | | | |
The notes to the financial statements are an integral part of,
and should be read in conjunction with, the financial statements. | | | | | 21 | |
Portfolio of Investments June 30, 2020 (Unaudited) (continued)
The following is a summary of the fair valuations according to the inputs used as of June 30, 2020, for valuing the Portfolio’s assets and liabilities:
| | | | | | | | | | | | | | | | |
Description | | Quoted
Prices in
Active
Markets for
Identical
Assets (Level 1) | | | Significant
Other
Observable
Inputs (Level 2) | | | Significant
Unobservable
Inputs (Level 3) | | | Total | |
| | | | |
Asset Valuation Inputs | | | | | | | | | | | | | | | | |
| Investments in Securities (a) | | | | | | | | | | | | | | | | |
| Long-Term Bonds | | | | | | | | | | | | | | | | |
Asset-Backed Securities | | $ | — | | | $ | 49,671,690 | | | $ | — | | | $ | 49,671,690 | |
Convertible Bonds | | | — | | | | 6,323,583 | | | | — | | | | 6,323,583 | |
Corporate Bonds | | | — | | | | 571,695,144 | | | | — | | | | 571,695,144 | |
Foreign Government Bonds | | | — | | | | 11,689,196 | | | | — | | | | 11,689,196 | |
Loan Assignments | | | — | | | | 56,980,212 | | | | — | | | | 56,980,212 | |
Mortgage-Backed Securities | | | — | | | | 126,574,600 | | | | — | | | | 126,574,600 | |
Municipal Bonds | | | — | | | | 3,910,957 | | | | — | | | | 3,910,957 | |
U.S. Government & Federal Agencies | | | — | | | | 79,324,684 | | | | — | | | | 79,324,684 | |
| | | | | | | | | | | | | | | | |
| Total Long-Term Bonds | | | — | | | | 906,170,066 | | | | — | | | | 906,170,066 | |
| | | | | | | | | | | | | | | | |
| Common Stocks | | | 237,347 | | | | — | | | | — | | | | 237,347 | |
| Short-Term Investments | | | | | | | | | | | | | | | | |
Affiliated Investment Company | | | 21,743,254 | | | | — | | | | — | | | | 21,743,254 | |
Unaffiliated Investment Company | | | 1,628,960 | | | | — | | | | — | | | | 1,628,960 | |
| | | | | | | | | | | | | | | | |
| Total Short-Term Investments | | | 23,372,214 | | | | — | | | | — | | | | 23,372,214 | |
| | | | | | | | | | | | | | | | |
| Total Investments in Securities | | | 23,609,561 | | | | 906,170,066 | | | | — | | | | 929,779,627 | |
| | | | | | | | | | | | | | | | |
| Other Financial Instruments | | | | | | | | | | | | | | | | |
Foreign Currency Forward Contracts (b) | | | — | | | | 3,207 | | | | — | | | | 3,207 | |
Futures Contracts (b) | | | 14,151 | | | | — | | | | — | | | | 14,151 | |
| | | | | | | | | | | | | | | | |
| Total Other Financial Instruments | | | 14,151 | | | | 3,207 | | | | — | | | | 17,358 | |
| | | | | | | | | | | | | | | | |
| Total Investments in Securities and Other Financial Instruments | | $ | 23,623,712 | | | $ | 906,173,273 | | | $ | — | | | $ | 929,796,985 | |
| | | | | | | | | | | | | | | | |
| | | | |
Liability Valuation Inputs | | | | | | | | | | | | | | | | |
| Long-Term Bonds Sold Short | | | | | | | | | | | | | | | | |
Corporate Bonds Sold Short | | $ | — | | | $ | (8,232,837 | ) | | $ | — | | | $ | (8,232,837 | ) |
| | | | | | | | | | | | | | | | |
| Total Long-Term Bonds Sold Short | | | — | | | | (8,232,837 | ) | | | — | | | | (8,232,837 | ) |
| | | | | | | | | | | | | | | | |
| Other Financial Instruments | | | | | | | | | | | | | | | | |
Foreign Currency Forward Contracts (b) | | | — | | | | (197,536 | ) | | | — | | | | (197,536 | ) |
Futures Contracts (b) | | | (1,130,742 | ) | | | — | | | | — | | | | (1,130,742 | ) |
Interest Rate Swap Contracts | | | — | | | | (6,950,877 | ) | | | — | | | | (6,950,877 | ) |
| | | | | | | | | | | | | | | | |
| Total Other Financial Instruments | | | (1,130,742 | ) | | | (7,148,413 | ) | | | — | | | | (8,279,155 | ) |
| | | | | | | | | | | | | | | | |
| Total Investments in Securities Sold Short and Other Financial Instruments | | $ | (1,130,742 | ) | | $ | (15,381,250 | ) | | $ | — | | | $ | (16,511,992 | ) |
| | | | | | | | | | | | | | | | |
| (a) | For a complete listing of investments and their industries, see the Portfolio of Investments. |
| (b) | The value listed for these securities reflects unrealized appreciation (depreciation) as shown on the Portfolio of Investments. |
| | | | |
| 22 | | MainStay VP MacKay Unconstrained Bond Portfolio | | The notes to the financial statements are an integral part of,
and should be read in conjunction with, the financial statements. |
Statement of Assets and Liabilities as of June 30, 2020 (Unaudited)
| | | | |
| Assets | | | | |
Investment in unaffiliated securities before investments sold short, at value (identified cost $882,079,463) including securities on loan of $1,603,295 | | $ | 908,036,373 | |
Investment in affiliated investment company, at value (identified cost $21,743,254) | | | 21,743,254 | |
Cash collateral on deposit at broker for futures contracts | | | 5,148,110 | |
Cash collateral on deposit at broker for swap contracts | | | 1,434,271 | |
Cash denominated in foreign currencies
(identified cost $57,759) | | | 59,896 | |
Cash | | | 14,242 | |
Receivables: | |
Dividends and interest | | | 7,133,360 | |
Portfolio shares sold | | | 298,053 | |
Variation margin on futures contracts | | | 263,530 | |
Investment securities sold | | | 128,515 | |
Securities lending | | | 734 | |
Other assets | | | 4,835 | |
Unrealized appreciation on foreign currency forward contracts | | | 3,207 | |
| | | | |
Total assets | | | 944,268,380 | |
| | | | |
|
| Liabilities | |
Investments sold short (proceeds $8,069,769) | | | 8,232,837 | |
Cash collateral received for securities on loan | | | 1,628,960 | |
Payables: | | | | |
Investment securities purchased | | | 5,178,444 | |
Manager (See Note 3) | | | 437,345 | |
Portfolio shares redeemed | | | 430,351 | |
NYLIFE Distributors (See Note 3) | | | 185,300 | |
Variation margin on centrally cleared swap contracts | | | 182,665 | |
Broker fees and charges on short sales | | | 153,277 | |
Shareholder communication | | | 94,512 | |
Interest on investments sold short | | | 57,868 | |
Professional fees | | | 32,142 | |
Custodian | | | 6,697 | |
Trustees | | | 1,285 | |
Accrued expenses | | | 6,732 | |
Unrealized depreciation on foreign currency forward contracts | | | 197,536 | |
| | | | |
Total liabilities | | | 16,825,951 | |
| | | | |
Net assets | | $ | 927,442,429 | |
| | | | |
| |
| Composition of Net Assets | | | | |
Shares of beneficial interest outstanding (par value of $.001 per share) unlimited number of shares authorized | | $ | 95,327 | |
Additional paid-in capital | | | 978,087,035 | |
| | | | |
| | | 978,182,362 | |
Total distributable earnings (loss) | | | (50,739,933 | ) |
| | | | |
Net assets | | $ | 927,442,429 | |
| | | | |
| | | | |
Initial Class | | | | |
Net assets applicable to outstanding shares | | $ | 20,526,477 | |
| | | | |
Shares of beneficial interest outstanding | | | 2,103,304 | |
| | | | |
Net asset value per share outstanding | | $ | 9.76 | |
| | | | |
Service Class | | | | |
Net assets applicable to outstanding shares | | $ | 906,915,952 | |
| | | | |
Shares of beneficial interest outstanding | | | 93,223,235 | |
| | | | |
Net asset value per share outstanding | | $ | 9.73 | |
| | | | |
| | | | | | |
The notes to the financial statements are an integral part of,
and should be read in conjunction with, the financial statements. | | | | | 23 | |
Statement of Operations for the six months ended June 30, 2020 (Unaudited)
| | | | |
| Investment Income (Loss) | |
Income | | | | |
Interest (a) | | $ | 16,631,189 | |
Dividends—affiliated | | | 132,691 | |
Securities lending | | | 15,747 | |
| | | | |
Total income | | | 16,779,627 | |
| | | | |
Expenses | | | | |
Manager (See Note 3) | | | 2,760,566 | |
Distribution/Service—Service Class (See Note 3) | | | 1,155,411 | |
Dividends and interest on investments sold short | | | 326,696 | |
Broker fees and charges on short sales | | | 275,334 | |
Shareholder communication | | | 73,922 | |
Professional fees | | | 68,914 | |
Custodian | | | 32,130 | |
Trustees | | | 12,298 | |
Miscellaneous | | | 19,860 | |
| | | | |
Total expenses | | | 4,725,131 | |
| | | | |
Net investment income (loss) | | | 12,054,496 | |
| | | | |
|
| Realized and Unrealized Gain (Loss) on Investments, Futures Contracts, Swap Contracts and Foreign Currency Transactions | |
Net realized gain (loss) on: | | | | |
Unaffiliated investment transactions | | | 7,584,506 | |
Investments sold short | | | (1,103,697 | ) |
Futures transactions | | | (20,785,642 | ) |
Swap transactions | | | (670,214 | ) |
Foreign currency forward transactions | | | 155,438 | |
Foreign currency transactions | | | (5,271 | ) |
| | | | |
Net realized gain (loss) on investments, investments sold short, futures transactions, swap transactions and foreign currency transactions | | | (14,824,880 | ) |
| | | | |
Net change in unrealized appreciation (depreciation) on: | | | | |
Unaffiliated investments | | | 315,105 | |
Investments sold short | | | 931,403 | |
Futures contracts | | | (2,943,489 | ) |
Swap contracts | | | (3,530,468 | ) |
Foreign currency forward contracts | | | (130,750 | ) |
Translation of other assets and liabilities in foreign currencies | | | (30,209 | ) |
| | | | |
Net change in unrealized appreciation (depreciation) on investments, investments sold short, futures contracts, swap contracts and foreign currencies | | | (5,388,408 | ) |
| | | | |
Net realized and unrealized gain (loss) on investments, investments sold short, futures transactions, swap transactions and foreign currency transactions | | | (20,213,288 | ) |
| | | | |
Net increase (decrease) in net assets resulting from operations | | | $ (8,158,792 | ) |
| | | | |
| (a) | Interest recorded net of foreign withholding taxes in the amount of $375. |
| | | | |
| 24 | | MainStay VP MacKay Unconstrained Bond Portfolio | | The notes to the financial statements are an integral part of,
and should be read in conjunction with, the financial statements. |
Statements of Changes in Net Assets
for the six months ended June 30, 2020 (Unaudited) and the year ended December 31, 2019
| | | | | | | | |
| | | 2020 | | | 2019 | |
| Increase (Decrease) in Net Assets | |
Operations: | | | | | | | | |
Net investment income (loss) | | $ | 12,054,496 | | | $ | 29,229,279 | |
Net realized gain (loss) on investments, investments sold short, futures transactions, swap transactions and foreign currency transactions | | | (14,824,880 | ) | | | (16,799,430 | ) |
Net change in unrealized appreciation (depreciation) on investments, investments sold short, futures contracts, swap contracts and foreign currencies | | | (5,388,408 | ) | | | 59,890,799 | |
| | | | |
Net increase (decrease) in net assets resulting from operations | | | (8,158,792 | ) | | | 72,320,648 | |
| | | | |
Distributions to shareholders: | | | | | | | | |
Initial Class | | | (432,987 | ) | | | (3,033,734 | ) |
Service Class | | | (11,812,850 | ) | | | (33,021,498 | ) |
| | | | |
Total distributions to shareholders | | | (12,245,837 | ) | | | (36,055,232 | ) |
| | | | |
Capital share transactions: | | | | | | | | |
Net proceeds from sale of shares | | | 22,986,986 | | | | 39,299,533 | |
Net asset value of shares issued to shareholders in reinvestment of distributions | | | 12,245,837 | | | | 36,055,232 | |
Cost of shares redeemed | | | (127,417,795 | ) | | | (187,588,436 | ) |
| | | | |
Increase (decrease) in net assets derived from capital share transactions | | | (92,184,972 | ) | | | (112,233,671 | ) |
| | | | |
Net increase (decrease) in net assets | | | (112,589,601 | ) | | | (75,968,255 | ) |
|
| Net Assets | |
Beginning of period | | | 1,040,032,030 | | | | 1,116,000,285 | |
| | | | |
End of period | | $ | 927,442,429 | | | $ | 1,040,032,030 | |
| | | | |
| | | | | | |
The notes to the financial statements are an integral part of,
and should be read in conjunction with, the financial statements. | | | | | 25 | |
Financial Highlights selected per share data and ratios
| | | | | | | | | | | | | | | | | | | | | | | | |
| | |
| | | Six months
ended
June 30, | | | Year ended December 31, | |
| | | | | | |
| Initial Class | | 2020* | | | 2019 | | | 2018 | | | 2017 | | | 2016 | | | 2015 | |
| | | | | | |
Net asset value at beginning of period | | $ | 9.92 | | | $ | 9.60 | | | $ | 10.06 | | | $ | 9.90 | | | $ | 9.54 | | | $ | 10.12 | |
| | | | | | | | | | | | | | | | | | | | | | | | |
| | | | | | |
Net investment income (loss) (a) | | | 0.13 | | | | 0.29 | | | | 0.30 | | | | 0.29 | | | | 0.37 | | | | 0.40 | |
| | | | | | |
Net realized and unrealized gain (loss) on investments | | | (0.15 | ) | | | 0.38 | | | | (0.43 | ) | | | 0.18 | | | | 0.33 | | | | (0.66 | ) |
| | | | | | |
Net realized and unrealized gain (loss) on foreign currency transactions | | | (0.00 | ) ‡ | | | 0.00 | ‡ | | | 0.00 | ‡ | | | 0.00 | ‡ | | | 0.01 | | | | 0.02 | |
| | | | | | | | | | | | | | | | | | | | | | | | |
| | | | | | |
Total from investment operations | | | (0.02 | ) | | | 0.67 | | | | (0.13 | ) | | | 0.47 | | | | 0.71 | | | | (0.24 | ) |
| | | | | | | | | | | | | | | | | | | | | | | | |
| | | | | | |
| Less distributions: | | | | | | | | | | | | | | | | | | | | | | | | |
| | | | | | |
From net investment income | | | (0.14 | ) | | | (0.35 | ) | | | (0.33 | ) | | | (0.31 | ) | | | (0.35 | ) | | | (0.34 | ) |
| | | | | | | | | | | | | | | | | | | | | | | | |
| | | | | | |
Net asset value at end of period | | $ | 9.76 | | | $ | 9.92 | | | $ | 9.60 | | | $ | 10.06 | | | $ | 9.90 | | | $ | 9.54 | |
| | | | | | | | | | | | | | | | | | | | | | | | |
| | | | | | |
Total investment return (b) | | | (0.21 | %) | | | 7.06 | % | | | (1.21 | %) | | | 4.81 | % | | | 7.50 | % | | | (2.42 | %) |
| | | | | | |
| Ratios (to average net assets)/Supplemental Data: | | | | | | | | | | | | | | | | | | | | | | | | |
| | | | | | |
Net investment income (loss) | | | 2.78 | %†† | | | 2.96 | % | | | 3.04 | % | | | 2.89 | % | | | 3.80 | % | | | 4.01 | % |
| | | | | | |
Net expenses (c)(d) | | | 0.74 | %†† | | | 0.76 | % | | | 0.75 | % | | | 0.67 | % | | | 0.72 | % | | | 0.65 | % |
| | | | | | |
Portfolio turnover rate | | | 37 | %(e) | | | 51 | %(e) | | | 33 | % | | | 32 | % | | | 34 | % | | | 26 | % |
| | | | | | |
Net assets at end of period (in 000’s) | | $ | 20,526 | | | $ | 49,296 | | | $ | 116,901 | | | $ | 137,454 | | | $ | 122,586 | | | $ | 129,311 | |
| ‡ | Less than one cent per share. |
| (a) | Per share data based on average shares outstanding during the period. |
| (b) | Total return does not reflect any deduction of sales charges, mortality and expense charges, contract charges or administrative charges. For periods of less than one year, total return is not annualized. |
| (c) | In addition to the fees and expenses which the Portfolio bears directly, it also indirectly bears a pro-rata share of the fees and expenses of the underlying funds in which it invests. Such indirect expenses are not included in the above expense ratios. |
| (d) | The expense ratios presented below show the impact of short sales expense: |
| | | | | | | | | | |
Period Ended | | Net Expenses
(excluding short
sale expenses) | | Short Sale
Expenses |
| June 30, 2020* †† | | | | 0.61 | % | | | | 0.13 | % |
| December 31, 2019 | | | | 0.61 | % | | | | 0.15 | % |
| December 31, 2018 | | | | 0.60 | % | | | | 0.15 | % |
| December 31, 2017 | | | | 0.60 | % | | | | 0.07 | % |
| December 31, 2016 | | | | 0.62 | % | | | | 0.10 | % |
| December 31, 2015 | | | | 0.62 | % | | | | 0.03 | % |
| (e) | The portfolio turnover rate not including mortgage dollar rolls was 36% and 45% for the six months ended June 30, 2020 and for the year ended December 31, 2019. |
| | | | |
| 26 | | MainStay VP MacKay Unconstrained Bond Portfolio | | The notes to the financial statements are an integral part of,
and should be read in conjunction with, the financial statements. |
Financial Highlights selected per share data and ratios
| | | | | | | | | | | | | | | | | | | | | | | | |
| | |
| | | Six months
ended
June 30, | | | Year ended December 31, | |
| | | | | | |
| Service Class | | 2020* | | | 2019 | | | 2018 | | | 2017 | | | 2016 | | | 2015 | |
| | | | | | |
Net asset value at beginning of period | | $ | 9.89 | | | $ | 9.57 | | | $ | 10.03 | | | $ | 9.87 | | | $ | 9.51 | | | $ | 10.09 | |
| | | | | | | | | | | | | | | | | | | | | | | | |
| | | | | | |
Net investment income (loss) (a) | | | 0.12 | | | | 0.26 | | | | 0.28 | | | | 0.26 | | | | 0.34 | | | | 0.38 | |
| | | | | | |
Net realized and unrealized gain (loss) on investments | | | (0.15 | ) | | | 0.39 | | | | (0.43 | ) | | | 0.19 | | | | 0.33 | | | | (0.66 | ) |
| | | | | | |
Net realized and unrealized gain (loss) on foreign currency transactions | | | (0.00 | ) ‡ | | | 0.00 | ‡ | | | 0.00 | ‡ | | | 0.00 | ‡ | | | 0.01 | | | | 0.02 | |
| | | | | | | | | | | | | | | | | | | | | | | | |
| | | | | | |
Total from investment operations | | | (0.03 | ) | | | 0.65 | | | | (0.15 | ) | | | 0.45 | | | | 0.68 | | | | (0.26 | ) |
| | | | | | | | | | | | | | | | | | | | | | | | |
| | | | | | |
| Less distributions: | | | | | | | | | | | | | | | | | | | | | | | | |
| | | | | | |
From net investment income | | | (0.13 | ) | | | (0.33 | ) | | | (0.31 | ) | | | (0.29 | ) | | | (0.32 | ) | | | (0.32 | ) |
| | | | | | | | | | | | | | | | | | | | | | | | |
| | | | | | |
Net asset value at end of period | | $ | 9.73 | | | $ | 9.89 | | | $ | 9.57 | | | $ | 10.03 | | | $ | 9.87 | | | $ | 9.51 | |
| | | | | | | | | | | | | | | | | | | | | | | | |
| | | | | | |
Total investment return (b) | | | (0.33 | %) | | | 6.80 | % | | | (1.46 | %) | | | 4.55 | % | | | 7.23 | % | | | (2.66 | %) |
| | | | | | |
| Ratios (to average net assets)/Supplemental Data: | | | | | | | | | | | | | | | | | | | | | | | | |
| | | | | | |
Net investment income (loss) | | | 2.50 | %†† | | | 2.66 | % | | | 2.79 | % | | | 2.64 | % | | | 3.54 | % | | | 3.77 | % |
| | | | | | |
Net expenses (c)(d) | | | 0.99 | %†† | | | 1.01 | % | | | 1.00 | % | | | 0.92 | % | | | 0.97 | % | | | 0.90 | % |
| | | | | | |
Portfolio turnover rate | | | 37 | %(e) | | | 51 | %(e) | | | 33 | % | | | 32 | % | | | 34 | % | | | 26 | % |
| | | | | | |
Net assets at end of period (in 000’s) | | $ | 906,916 | | | $ | 990,736 | | | $ | 999,100 | | | $ | 1,064,435 | | | $ | 882,928 | | | $ | 748,317 | |
| ‡ | Less than one cent per share. |
| (a) | Per share data based on average shares outstanding during the period. |
| (b) | Total return does not reflect any deduction of sales charges, mortality and expense charges, contract charges or administrative charges. For periods of less than one year, total return is not annualized. |
| (c) | In addition to the fees and expenses which the Portfolio bears directly, it also indirectly bears a pro-rata share of the fees and expenses of the underlying funds in which it invests. Such indirect expenses are not included in the above expense ratios. |
| (d) | The expense ratios presented below show the impact of short sales expense: |
| | | | | | | | | | |
Period Ended | | Net Expenses
(excluding short
sale expenses) | | Short Sale
Expenses |
| June 30, 2020* †† | | | | 0.86 | % | | | | 0.13 | % |
| December 31, 2019 | | | | 0.86 | % | | | | 0.15 | % |
| December 31, 2018 | | | | 0.85 | % | | | | 0.15 | % |
| December 31, 2017 | | | | 0.85 | % | | | | 0.07 | % |
| December 31, 2016 | | | | 0.87 | % | | | | 0.10 | % |
| December 31, 2015 | | | | 0.87 | % | | | | 0.03 | % |
| (e) | The portfolio turnover rate not including mortgage dollar rolls was 36% and 45% for the six months ended June 30, 2020 and for the year ended December 31, 2019. |
| | | | | | |
The notes to the financial statements are an integral part of,
and should be read in conjunction with, the financial statements. | | | | | 27 | |
Notes to Financial Statements (Unaudited)
Note 1–Organization and Business
MainStay VP Funds Trust (the ‘‘Fund’’) was organized as a Delaware statutory trust on February 1, 2011. The Fund is registered under the Investment Company Act of 1940, as amended (the “1940 Act”), as an open-end management investment company. The Fund is comprised of thirty-one separate series (collectively referred to as the “Portfolios”). These financial statements and notes relate to the MainStay VP MacKay Unconstrained Bond Portfolio (the “Portfolio”), a “diversified” portfolio, as that term is defined in the 1940 Act, as interpreted or modified by regulatory authorities having jurisdiction, from time to time.
Shares of the Portfolio are currently offered to certain separate accounts to fund variable annuity policies and variable universal life insurance policies issued by New York Life Insurance and Annuity Corporation (“NYLIAC”), a wholly-owned subsidiary of New York Life Insurance Company (“New York Life”) and may also be offered to fund variable annuity policies and variable universal life insurance policies issued by other insurance companies. NYLIAC allocates shares of the Portfolios to, among others, certain NYLIAC separate accounts. Shares of the Portfolio are also offered to the MainStay VP Conservative Allocation Portfolio, MainStay VP Moderate Allocation Portfolio, MainStay VP Moderate Growth Allocation Portfolio and MainStay VP Growth Allocation Portfolio, which operate as “funds-of-funds,” and other variable insurance funds.
The Portfolio currently offers two classes of shares. Initial Class and Service Class shares commenced operations on April 29, 2011. Shares of the Portfolio are offered and are redeemed at a price equal to their respective net asset value (“NAV”) per share. No sales or redemption charge is applicable to the purchase or redemption of the Portfolio’s shares. Under the terms of the Fund’s multiple class plan, adopted pursuant to Rule 18f-3 under the 1940 Act, the classes differ in that, among other things, Service Class shares of the Portfolio pay a combined distribution and service fee of 0.25% of average daily net assets attributable to Service Class shares of the Portfolio to the Distributor (as defined in Note 3(B)) pursuant to a plan adopted in accordance with Rule 12b-1 under the 1940 Act. Contract owners of variable annuity contracts purchased after June 2, 2003, are permitted to invest only in the Service Class shares.
The Portfolio’s investment objective is to seek total return by investing primarily in domestic and foreign debt securities.
Note 2–Significant Accounting Policies
The Portfolio is an investment company and accordingly follows the investment company accounting and reporting guidance of the Financial Accounting Standards Board (“FASB”) Accounting Standard Codification Topic 946 Financial Services—Investment Companies. The Portfolio prepares its financial statements in accordance with generally accepted accounting principles (“GAAP”) in the United States of America and follows the significant accounting policies described below.
(A) Securities Valuation. Investments are usually valued as of the close of regular trading on the New York Stock Exchange (the “Exchange”) (usually 4:00 p.m. Eastern time) on each day the Portfolio is open for business (“valuation date”).
The Board of Trustees of the Fund (the “Board”) adopted procedures establishing methodologies for the valuation of the Portfolio’s securities
and other assets and delegated the responsibility for valuation determinations under those procedures to the Valuation Committee of the Fund (the “Valuation Committee”). The procedures state that, subject to the oversight of the Board and unless otherwise noted, the responsibility for the day-to-day valuation of portfolio assets (including fair value measurements for the Portfolio’s assets and liabilities) rests with New York Life Investment Management LLC (“New York Life Investments” or the “Manager”), aided to whatever extent necessary by the Subadvisor (as defined in Note 3(A)). To assess the appropriateness of security valuations, the Manager, the Subadvisor or the Portfolio’s third-party service provider, who is subject to oversight by the Manager, regularly compares prior day prices, prices on comparable securities and the sale prices to the prior and current day prices and challenges prices with changes exceeding certain tolerance levels with third-party pricing services or broker sources.
The Board authorized the Valuation Committee to appoint a Valuation Subcommittee (the “Subcommittee”) to establish the prices of securities for which market quotations are not readily available or the prices of which are not otherwise readily determinable under the procedures. The Subcommittee meets (in person, via electronic mail or via teleconference) on an as-needed basis. The Valuation Committee meets to ensure that actions taken by the Subcommittee were appropriate.
For those securities valued through either a standardized fair valuation methodology or a fair valuation measurement, the Subcommittee deals with such valuation and the Valuation Committee reviews and affirms, if appropriate, the reasonableness of the valuation based on such methodologies and measurements on a regular basis after considering information that is reasonably available and deemed relevant by the Valuation Committee. Any action taken by the Subcommittee with respect to the valuation of a portfolio security or other asset is submitted for review and ratification (if appropriate) to the Valuation Committee and the Board at the next regularly scheduled meeting.
“Fair value” is defined as the price the Portfolio would reasonably expect to receive upon selling an asset or liability in an orderly transaction to an independent buyer in the principal or most advantageous market for the asset or liability. Fair value measurements are determined within a framework that establishes a three-tier hierarchy that maximizes the use of observable market data and minimizes the use of unobservable inputs to establish a classification of fair value measurements for disclosure purposes. “Inputs” refer broadly to the assumptions that market participants would use in pricing the asset or liability, including assumptions about risk, such as the risk inherent in a particular valuation technique used to measure fair value using a pricing model and/or the risk inherent in the inputs for the valuation technique. Inputs may be observable or unobservable. Observable inputs reflect the assumptions market participants would use in pricing the asset or liability based on market data obtained from sources independent of the Portfolio. Unobservable inputs reflect the Portfolio’s own assumptions about the assumptions market participants would use in pricing the asset or liability based on the information available. The inputs or methodology used for valuing assets or liabilities may not be an indication of the risks associated with investing in those assets or liabilities. The three-tier hierarchy of inputs is summarized below.
| • | | Level 1—quoted prices in active markets for an identical asset or liability |
| | |
| 28 | | MainStay VP MacKay Unconstrained Bond Portfolio |
| • | | Level 2—other significant observable inputs (including quoted prices for a similar asset or liability in active markets, interest rates and yield curves, prepayment speeds, credit risk, etc.) |
| • | | Level 3—significant unobservable inputs (including the Portfolio’s own assumptions about the assumptions that market participants would use in measuring fair value of an asset or liability) |
The level of an asset or liability within the fair value hierarchy is based on the lowest level of an input, both individually and in the aggregate, that is significant to the fair value measurement. The aggregate value by input level of the Portfolio’s assets and liabilities as of June 30, 2020 is included at the end of the Portfolio of Investments.
The Portfolio may use third-party vendor evaluations, whose prices may be derived from one or more of the following standard inputs, among others:
| | |
• Benchmark yields | | • Reported trades |
• Broker/dealer quotes | | • Issuer spreads |
• Two-sided markets | | • Benchmark securities |
• Bids/offers | | • Reference data (corporate actions or material event notices) |
• Industry and economic events | | • Comparable bonds |
• Monthly payment information | | |
An asset or liability for which market values cannot be measured using the methodologies described above is valued by methods deemed reasonable in good faith by the Valuation Committee, following the procedures established by the Board, to represent fair value. Under these procedures, the Portfolio generally uses a market-based approach which may use related or comparable assets or liabilities, recent transactions, market multiples, book values and other relevant information. The Portfolio may also use an income-based valuation approach in which the anticipated future cash flows of the asset or liability are discounted to calculate fair value. Discounts may also be applied due to the nature and/or duration of any restrictions on the disposition of the asset or liability. Fair value represents a good faith approximation of the value of a security. Fair value determinations involve the consideration of a number of subjective factors, an analysis of applicable facts and circumstances and the exercise of judgment. As a result, it is possible that the fair value for a security determined in good faith in accordance with the Portfolio’s valuation procedures may differ from valuations for the same security determined by other funds using their own valuation procedures. Although the Portfolio’s valuation procedures are designed to value a security at the price the Portfolio may reasonably expect to receive upon the security’s sale in an orderly transaction, there can be no assurance that any fair value determination thereunder would, in fact, approximate the amount that the Portfolio would actually realize upon the sale of the security or the price at which the security would trade if a reliable market price were readily available. During the six-month period ended June 30, 2020, there were no material changes to the fair value methodologies.
Securities which may be valued in this manner include, but are not limited to: (i) a security for which trading has been halted or suspended; (ii) a debt security that has recently gone into default and for which there is not a current market quotation; (iii) a security of an issuer that has entered into a restructuring; (iv) a security that has been delisted
from a national exchange; (v) a security for which the market price is not readily available from a third-party pricing source or, if so provided, does not, in the opinion of the Manager or the Subadvisor, reflect the security’s market value; (vi) a security subject to trading collars for which no or limited trading takes place; and (vii) a security whose principal market has been temporarily closed at a time when, under normal conditions, it would be open. Securities valued in this manner are generally categorized as Level 3 in the hierarchy. As of June 30, 2020, no securities held by the Portfolio were fair valued in such a manner.
Equity securities are valued at the last quoted sales prices as of the close of regular trading on the relevant exchange on each valuation date. Securities that are not traded on the valuation date are valued at the mean of the last quoted bid and ask prices. Prices are normally taken from the principal market in which each security trades. Futures contracts are valued at the last posted settlement price on the market where such futures are primarily traded. These securities are generally categorized as Level 1 in the hierarchy.
Investments in mutual funds, including money market funds, are valued at their respective NAVs as of the close of the Exchange on the valuation date. These securities are generally categorized as Level 1 in the hierarchy.
Debt securities (other than convertible and municipal bonds) are valued at the evaluated bid prices (evaluated mean prices in the case of convertible and municipal bonds) supplied by a pricing agent or broker selected by the Manager, in consultation with the Subadvisor. The evaluations are market-based measurements processed through a pricing application and represents the pricing agent’s good faith determination as to what a holder may receive in an orderly transaction under market conditions. The rules based logic utilizes valuation techniques that reflect participants’ assumptions and vary by asset class and per methodology, maximizing the use of relevant observable data including quoted prices for similar assets, benchmark yield curves and market corroborated inputs. The evaluated bid or mean prices are deemed by the Manager, in consultation with the Subadvisor, to be
representative of market values at the regular close of trading of the Exchange on each valuation date. Debt securities purchased on a delayed delivery basis are marked to market daily until settlement at the forward settlement date. Debt securities, including corporate bonds, U.S. government and federal agency bonds, municipal bonds, foreign bonds, convertible bonds, asset-backed securities and mortgage-backed securities are generally categorized as Level 2 in the hierarchy.
Loan assignments, participations and commitments are valued at the average of bid quotations obtained from the engaged independent pricing service and are generally categorized as Level 2 in the hierarchy. Certain loan assignments, participations and commitments may be valued by utilizing significant unobservable inputs obtained from the pricing service and are generally categorized as Level 3 in the hierarchy. As of June 30, 2020, no securities held by the Portfolio were fair valued in such a manner.
Foreign currency forward contracts are valued at their fair market values measured on the basis of the mean between the last current bid and ask prices based on dealer or exchange quotations and are generally categorized as Level 2 in the hierarchy.
Notes to Financial Statements (Unaudited) (continued)
Swaps are marked to market daily based upon quotations from pricing agents, brokers or market makers. These securities are generally categorized as Level 2 in the hierarchy.
Temporary cash investments acquired in excess of 60 days to maturity at the time of purchase are valued using the latest bid prices or using valuations based on a matrix system (which considers such factors as security prices, yields, maturities and ratings), both as furnished by independent pricing services. Temporary cash investments that mature in 60 days or less at the time of purchase (“Short-Term Investments”) are valued using the amortized cost method of valuation, unless the use of such method would be inappropriate. The amortized cost method involves valuing a security at its cost on the date of purchase and thereafter assuming a constant amortization to maturity of the difference between such cost and the value on maturity date. Amortized cost approximates the current fair value of a security. Securities valued using the amortized cost method are not valued using quoted prices in an active market and are generally categorized as Level 2 in the hierarchy.
The information above is not intended to reflect an exhaustive list of the methodologies that may be used to value portfolio investments. The valuation procedures permit the use of a variety of valuation methodologies in connection with valuing portfolio investments. The methodology used for a specific type of investment may vary based on the market data available or other considerations. The methodologies summarized above may not represent the specific means by which portfolio investments are valued on any particular business day.
(B) Income Taxes. The Portfolio’s policy is to comply with the requirements of the Internal Revenue Code of 1986, as amended (the “Internal Revenue Code”), applicable to regulated investment companies and to distribute all of its taxable income to the shareholders of the Portfolio within the allowable time limits.
The Manager evaluates the Portfolio’s tax positions to determine if the tax positions taken meet the minimum recognition threshold in connection with accounting for uncertainties in income tax positions taken or expected to be taken for the purposes of measuring and recognizing tax liabilities in the financial statements. Recognition of tax benefits of an uncertain tax position is permitted only to the extent the position is “more likely than not” to be sustained assuming examination by taxing authorities. The Manager analyzed the Portfolio’s tax positions taken on federal, state and local income tax returns for all open tax years (for up to three tax years) and has concluded that no provisions for federal, state and local income tax are required in the Portfolio’s financial statements. The Portfolio’s federal, state and local income tax and federal excise tax returns for tax years for which the applicable statutes of limitations have not expired are subject to examination by the Internal Revenue Service and state and local departments of revenue.
(C) Foreign Taxes. The Portfolio may be subject to foreign taxes on income and other transaction-based taxes imposed by certain countries in which it invests. A portion of the taxes on gains on investments or currency purchases/repatriation may be reclaimable. The Portfolio will accrue such taxes and reclaims as applicable, based upon its current interpretation of tax rules and regulations that exist in the markets in which it invests.
The Portfolio may be subject to taxation on realized capital gains, repatriation proceeds and other transaction-based taxes imposed by certain
countries in which it invests. The Portfolio will accrue such taxes as applicable based upon its current interpretation of tax rules and regulations that exist in the market in which it invests. Capital gains taxes relating to positions still held are reflected as a liability in the Statement of Assets and Liabilities, as well as an adjustment to the Portfolio’s net unrealized appreciation (depreciation). Taxes related to capital gains realized, if any, are reflected as part of net realized gain (loss) in the Statement of Operations. Changes in tax liabilities related to capital gains taxes on unrealized investment gains, if any, are reflected as part of the change in net unrealized appreciation (depreciation) on investments in the Statement of Operations. Transaction-based charges are generally assessed as a percentage of the transaction amount.
(D) Dividends and Distributions to Shareholders. Dividends and distributions are recorded on the ex-dividend date. The Portfolio intends to declare and pay dividends from net investment income, if any, at least quarterly and distributions from net realized capital and currency gains, if any, at least annually. Unless a shareholder elects otherwise, all dividends and distributions are reinvested at NAV in the same class of shares of the Portfolio. Dividends and distributions to shareholders are determined in accordance with federal income tax regulations and may differ from determinations using GAAP.
(E) Security Transactions and Investment Income. The Portfolio records security transactions on the trade date. Realized gains and losses on security transactions are determined using the identified cost method. Dividend income is recognized on the ex-dividend date, net of any foreign tax withheld at the source, and interest income is accrued as earned using the effective interest rate method and includes any realized gains and losses from repayments of principal on mortgage-backed securities. Discounts and premiums on securities purchased for the Portfolio are accreted and amortized, respectively, on the effective interest rate method.
Investment income and realized and unrealized gains and losses on investments of the Portfolio are allocated pro rata to the separate classes of shares based upon their relative net assets on the date the income is earned or realized and unrealized gains and losses are incurred.
The Portfolio may place a debt security on non-accrual status and reduce related interest income by ceasing current accruals and writing off all or a portion of any interest receivables when the collection of all or a portion of such interest has become doubtful. A debt security is removed from non-accrual status when the issuer resumes interest payments or when collectability of interest is reasonably assured.
(F) Expenses. Expenses of the Fund are allocated to the individual Portfolios in proportion to the net assets of the respective Portfolios when the expenses are incurred, except where direct allocations of expenses can be made. Expenses (other than fees incurred under the distribution and service plans, further discussed in Note 3(B), which are charged directly to the Service Class shares) are allocated to separate classes of shares pro rata based upon their relative net assets on the date the expenses are incurred. The expenses borne by the Portfolio, including those of related parties to the Portfolio, are shown in the Statement of Operations.
Additionally, the Portfolio may invest in mutual funds, which are subject to management fees and other fees that may cause the costs of
| | |
| 30 | | MainStay VP MacKay Unconstrained Bond Portfolio |
investing in mutual funds to be greater than the costs of owning the underlying securities directly. These indirect expenses of mutual funds are not included in the amounts shown as expenses in the Portfolio’s Statement of Operations or in the expense ratios included in the Financial Highlights.
(G) Use of Estimates. In preparing financial statements in conformity with GAAP, the Manager makes estimates and assumptions that affect the reported amounts and disclosures in the financial statements. Actual results could differ from those estimates.
(H) Loan Assignments, Participations and Commitments. The Portfolio may invest in loan assignments and participations (“loans”). Commitments are agreements to make money available to a borrower in a specified amount, at a specified rate and within a specified time. The Portfolio records an investment when the borrower withdraws money on a commitment or when a funded loan is purchased (trade date) and records interest as earned. These loans pay interest at rates that are periodically reset by reference to a base lending rate plus a spread. These base lending rates are generally the prime rate offered by a designated U.S. bank or the London Interbank Offered Rate (“LIBOR”).
The loans in which the Portfolio may invest are generally readily marketable, but may be subject to some restrictions on resale. For example, the Portfolio may be contractually obligated to receive approval from the agent bank and/or borrower prior to the sale of these investments. If the Portfolio purchases an assignment from a lender, the Portfolio will generally have direct contractual rights against the borrower in favor of the lender. If the Portfolio purchases a participation interest either from a lender or a participant, the Portfolio typically will have established a direct contractual relationship with the seller of the participation interest, but not with the borrower. Consequently, the Portfolio is subject to the credit risk of the lender or participant who sold the participation interest to the Portfolio, in addition to the usual credit risk of the borrower. In the event that the borrower, selling participant or intermediate participants become insolvent or enter into bankruptcy, the Portfolio may incur certain costs and delays in realizing payment, or may suffer a loss of principal and/or interest.
Unfunded commitments represent the remaining obligation of the Portfolio to the borrower. At any point in time, up to the maturity date of the issue, the borrower may demand the unfunded portion. Unfunded amounts, if any, are marked to market and any unrealized gains or losses are recorded in the Statement of Assets and Liabilities. As of June 30, 2020, the Portfolio did not hold any unfunded commitments.
(I) Futures Contracts. A futures contract is an agreement to purchase or sell a specified quantity of an underlying instrument at a specified future date and price, or to make or receive a cash payment based on the value of a financial instrument (e.g., foreign currency, interest rate, security or securities index). The Portfolio is subject to risks such as market price risk and/or interest rate risk in the normal course of investing in these contracts. Upon entering into a futures contract, the Portfolio is required to pledge to the broker or futures commission merchant an amount of cash and/or U.S. government securities equal to a certain percentage of the collateral amount, known as the “initial margin.” During the period the futures contract is open, changes in the value of the contract are recognized as unrealized appreciation or
depreciation by marking to market such contract on a daily basis to reflect the market value of the contract at the end of each day’s trading. The Portfolio agrees to receive from or pay to the broker or futures commission merchant an amount of cash equal to the daily fluctuation in the value of the contract. Such receipts or payments are known as “variation margin.” When the futures contract is closed, the Portfolio records a realized gain or loss equal to the difference between the proceeds from (or cost of) the closing transaction and the Portfolio’s basis in the contract.
The use of futures contracts involves, to varying degrees, elements of market risk in excess of the amount recognized in the Statement of Assets and Liabilities. The contract or notional amounts and variation margin reflect the extent of the Portfolio’s involvement in open futures positions. There are several risks associated with the use of futures contracts as hedging techniques. There can be no assurance that a liquid market will exist at the time when the Portfolio seeks to close out a futures contract. If no liquid market exists, the Portfolio would remain obligated to meet margin requirements until the position is closed. Futures contracts may involve a small initial investment relative to the risk assumed, which could result in losses greater than if the Portfolio did not invest in futures contracts. Futures contracts may be more volatile than direct investments in the instrument underlying the futures and may not correlate to the underlying instrument, causing a given hedge not to achieve its objectives. The Portfolio’s activities in futures contracts have minimal counterparty risk as they are conducted through regulated exchanges that guarantee the futures against default by the counterparty. In the event of a bankruptcy or insolvency of a futures commission merchant that holds margin on behalf of the Portfolio, the Portfolio may not be entitled to the return of the entire margin owed to the Portfolio, potentially resulting in a loss. The Portfolio may invest in futures contracts to help manage the duration and yield curve of the portfolio while minimizing the exposure to wider bid/ask spreads in traditional bonds. The Portfolio’s investment in futures contracts and other derivatives may increase the volatility of the Portfolio’s NAVs and may result in a loss to the Portfolio. Open futures contracts as of June 30, 2020, are shown in the Portfolio of Investments.
(J) Swap Contracts. The Portfolio may enter into credit default, interest rate, equity, index and currency exchange rate swap contracts (“swaps”). In a typical swap transaction, two parties agree to exchange the future returns (or differentials in rates of future returns) earned or realized at periodic intervals on a particular investment or instrument based on a notional principal amount. Generally, the Portfolio will enter into a swap on a net basis, which means that the two payment streams under the swap are netted, with the Portfolio receiving or paying (as the case may be) only the net amount of the two payment streams. Therefore, the Portfolio’s current obligation under a swap generally will be equal to the net amount to be paid or received under the swap, based on the relative value of notional positions attributable to each counterparty to the swap. The payments may be adjusted for transaction costs, interest payments, the amount of interest paid on the investment or instrument or other factors. Collateral, in the form of cash or securities, may be required to be held in segregated accounts with the custodian bank or broker in accordance with the terms of the swap. Swap agreements are privately negotiated in the over the counter (“OTC”) market and may be executed in a multilateral or other trade facilities platform, such as a registered commodities exchange (“centrally cleared swaps”).
Notes to Financial Statements (Unaudited) (continued)
Certain standardized swaps, including certain credit default and interest rate swaps, are subject to mandatory clearing and exchange-trading, and more types of standardized swaps are expected to be subject to mandatory clearing and exchange-trading in the future. The counterparty risk for exchange-traded and cleared derivatives is expected to be generally lower than for uncleared derivatives, but cleared contracts are not risk-free. In a cleared derivative transaction, the Portfolio typically enters into the transaction with a financial institution counterparty, and performance of the transaction is effectively guaranteed by a central clearinghouse, thereby reducing or eliminating the Portfolio’s exposure to the credit risk of its original counterparty. The Portfolio will be required to post specified levels of margin with the clearinghouse or at the instruction of the clearinghouse; the margin required by a clearinghouse may be greater than the margin the Portfolio would be required to post in an uncleared transaction. As of June 30, 2020, all swap positions outstanding are shown in the Portfolio of Investments.
Swaps are marked to market daily based upon quotations from pricing agents, brokers or market makers and the change in value, if any, is recorded as unrealized appreciation or depreciation. Any payments made or received upon entering into a swap would be amortized or accreted over the life of the swap and recorded as a realized gain or loss. Early termination of a swap is recorded as a realized gain or loss. Daily changes in valuation of centrally cleared swaps, if any, are recorded as a receivable or payable for the change in value as appropriate (“variation margin”) on the Statement of Assets and Liabilities.
The Portfolio bears the risk of loss of the amount expected to be received under a swap in the event of the default or bankruptcy of the swap counterparty. The Portfolio may be able to eliminate its exposure under a swap either by assignment or other disposition, or by entering into an offsetting swap with the same party or a similar credit-worthy party. Swaps are not actively traded on financial markets. Entering into swaps involves elements of credit, market and documentation risk in excess of the amounts recognized on the Statement of Assets and Liabilities. Such risks involve the possibilities that there will be no liquid market for these swaps, that the counterparty to the swaps may default on its obligation to perform or disagree as to the meaning of the contractual terms in the swaps and that there may be unfavorable changes in interest rates, the price of the index or the security underlying these transactions.
Interest Rate Swaps: An interest rate swap is an agreement between two parties where one stream of future interest payments is exchanged for another based on a specified principal amount. Interest rate swaps often exchange a fixed payment for a floating payment that is linked to an interest rate (most often LIBOR). The Portfolio will typically use interest rate swaps to limit, or manage, its exposure to fluctuations in interest rates, or to obtain a marginally lower interest rate than it would have been able to get without the swap. Open swap agreements as of June 30, 2020, are shown in the Portfolio of Investments.
(K) Foreign Currency Forward Contracts. The Portfolio may enter into foreign currency forward contracts, which are agreements to buy or sell foreign currencies on a specified future date at a specified rate. The Portfolio is subject to foreign currency exchange rate risk in the normal course of investing in these transactions. During the period the forward contract is open, changes in the value of the contract are recognized as unrealized appreciation or depreciation by marking to
market such contract on a daily basis to reflect the market value of the contract at the end of each day’s trading. Cash movement occurs on settlement date. When the forward contract is closed, the Portfolio records a realized gain or loss equal to the difference between the proceeds from (or cost of) the closing transaction and the Portfolio’s basis in the contract. The Portfolio may purchase and sell foreign currency forward contracts for purposes of seeking to enhance portfolio returns and manage portfolio risk more efficiently. Foreign currency forward contracts may also be used to gain exposure to a particular currency or to hedge against the risk of loss due to changing currency exchange rates. Foreign currency forward contracts to purchase or sell a foreign currency may also be used in anticipation of future purchases or sales of securities denominated in foreign currency, even if the specific investments have not yet been selected.
The use of foreign currency forward contracts involves, to varying degrees, elements of risk in excess of the amount recognized in the Statement of Assets and Liabilities, including counterparty risk, market risk and illiquidity risk. Counterparty risk is heightened for these instruments because foreign currency forward contracts are not exchange-traded and therefore no clearinghouse or exchange stands ready to meet the obligations under such contracts. Thus, the Portfolio faces the risk that its counterparties under such contracts may not perform their obligations. Market risk is the risk that the value of a foreign currency forward contract will depreciate due to unfavorable changes in exchange rates. Illiquidity risk arises because the secondary market for foreign currency forward contracts may have less liquidity relative to markets for other securities and financial instruments. Risks also arise from the possible movements in the foreign exchange rates underlying these instruments. While the Portfolio may enter into forward contracts to reduce currency exchange risks, changes in currency exchange rates may result in poorer overall performance for the Portfolio than if it had not engaged in such transactions. Exchange rate movements can be large, depending on the currency, and can last for extended periods of time, affecting the value of the Portfolio’s assets. Moreover, there may be an imperfect correlation between the Portfolio’s holdings of securities denominated in a particular currency and forward contracts entered into by the Portfolio. Such imperfect correlation may prevent the Portfolio from achieving the intended hedge or expose the Portfolio to the risk of currency exchange loss. The unrealized appreciation (depreciation) on forward contracts also reflects the Portfolio’s exposure at the valuation date to credit loss in the event of a counterparty’s failure to perform its obligations. All open forward currency contracts as of June 30, 2020, are shown in the Portfolio of Investments.
(L) Foreign Currency Transactions. The Portfolio’s books and records are maintained in U.S. dollars. Prices of securities denominated in foreign currency amounts are translated into U.S. dollars at the mean between the buying and selling rates last quoted by any major U.S. bank at the following dates:
| (i) | market value of investment securities, other assets and liabilities—at the valuation date; and |
| (ii) | purchases and sales of investment securities, income and expenses—at the date of such transactions. |
The assets and liabilities that are denominated in foreign currency amounts are presented at the exchange rates and market values at the
| | |
| 32 | | MainStay VP MacKay Unconstrained Bond Portfolio |
close of the period. The realized and unrealized changes in net assets arising from fluctuations in exchange rates and market prices of securities are not separately presented.
Net realized gain (loss) on foreign currency transactions represents net currency gains or losses realized as a result of differences between the amounts of securities sale proceeds or purchase cost, dividends, interest and withholding taxes as recorded on the Portfolio’s books, and the U.S. dollar equivalent amount actually received or paid. Net currency gains or losses from valuing such foreign currency denominated assets and liabilities, other than investments at valuation date exchange rates, are reflected in unrealized foreign exchange gains or losses.
(M) Securities Sold Short. The Portfolio may engage in sales of securities it does not own (“short sales”) as part of its investment strategies. When the Portfolio enters into a short sale, it must segregate or maintain with a broker the cash proceeds from the security sold short or other securities as collateral for its obligation to deliver the security upon conclusion of the sale. During the period a short position is open, depending on the nature and type of security, a short position is reflected as a liability and is marked to market in accordance with the valuation methodologies previously detailed (See Note 2(A)). Liabilities for securities sold short are closed out by purchasing the applicable securities for delivery to the counterparty broker. A gain, limited to the price at which the Portfolio sold the security short, or a loss, unlimited as to dollar amount, will be recognized upon termination of a short sale if the market price on the date the short position is closed out is less or greater, respectively, than the proceeds originally received. Any such gain or loss may be offset, completely or in part, by the change in the value of the hedged investments. Interest on short positions held is accrued daily, while dividends declared on short positions existing on the record date are recorded on the ex-dividend date as a dividend expense in the Statement of Operations. Broker fees and other expenses related to securities sold short are disclosed in the Statement of Operations. Short sales involve risk of loss in excess of the related amounts reflected in the Statement of Assets and Liabilities. As of June 30, 2020, securities sold short are shown in the Portfolio of Investments.
(N) Securities Lending. In order to realize additional income, the Portfolio may engage in securities lending, subject to the limitations set forth in the 1940 Act and relevant guidance by the staff of the Securities and Exchange Commission (“SEC”). If the Portfolio engages in securities lending, the Portfolio will lend through its custodian, currently State Street Bank and Trust Company (“State Street”), acting as securities lending agent on behalf of the Portfolio. Under the current arrangement, State Street will manage the Portfolio’s collateral in accordance with the securities lending agency agreement between the Portfolio and State Street, and indemnify the Portfolio against counterparty risk. The loans will be collateralized by cash (which may be invested in a money market fund) and/or non-cash collateral (which may include U.S. Treasury securities and/or U.S. government agency securities issued or guaranteed by the United States government or its agencies or instrumentalities) at least equal at all times to the market value of the securities loaned. The Portfolio bears the risk of delay in recovery of, or loss of rights in, the securities loaned. The Portfolio may also record a realized gain or loss on securities deemed sold due to a borrower’s inability to return securities on loan. The Portfolio bears the risk of any
loss on investment of cash collateral. The Portfolio will receive compensation for lending its securities in the form of fees or it will retain a portion of interest earned on the investment of any cash collateral. The Portfolio will also continue to receive interest and dividends on the securities loaned and any gain or loss in the market price of the securities loaned that may occur during the term of the loan will be for the account of the Portfolio. Income earned from securities lending activities, if any, is reflected in the Statement of Operations. As of June 30, 2020, the Portfolio had securities on loan with an aggregate market value of $1,603,295 and received cash collateral, which was invested into the State Street Navigator Securities Lending Government Money Market Portfolio, with a value of $1,628,960.
(O) Dollar Rolls. The Portfolio may enter into dollar roll transactions in which it sells mortgage-backed securities (“MBS”) from its portfolio to a counterparty from whom it simultaneously agrees to buy a similar security on a delayed delivery basis. The Portfolio generally transfers MBS where the MBS are “to be announced,” therefore, the Portfolio accounts for these transactions as purchases and sales.
When accounted for as purchase and sales, the securities sold in connection with the dollar rolls are removed from the portfolio and a realized gain or loss is recognized. The securities the Portfolio has agreed to acquire are included at market value in the Portfolio of Investments and liabilities for such purchase commitments are included as payables for investments purchased. During the roll period, the Portfolio foregoes principal and interest paid on the securities. The Portfolio is compensated by the difference between the current sales price and the forward price for the future as well as by the earnings on the cash proceeds of the initial sale. Dollar rolls may be renewed without physical delivery of the securities subject to the contract. The Portfolio maintains liquid assets from its portfolio having a value not less than the repurchase price, including accrued interest. Dollar roll transactions involve certain risks, including the risk that the securities returned to the Portfolio at the end of the roll period, while substantially similar, could be inferior to what was initially sold to the counterparty.
The Portfolio accounts for a dollar roll transaction as a purchase and sale whereby the difference in the sales price and purchase price of the security sold is recorded as a realized gain (loss).
(P) Debt Securities Risk. The ability of issuers of debt securities held by the Portfolio to meet their obligations may be affected by, among other things, economic or political developments in a specific country, industry or region. Debt securities are also subject to the risks associated with changes in interest rates.
The Portfolio may invest in high-yield debt securities (sometimes called “junk bonds”), which are generally considered speculative because they present a greater risk of loss, including default, than higher quality debt securities. These securities pay investors a premium—a higher interest rate or yield than investment grade debt securities—because of the increased risk of loss. These securities can also be subject to greater price volatility. In times of unusual or adverse market, economic or political conditions, these securities may experience higher than normal default rates.
The Portfolio may invest in loans which are usually rated below investment grade and are generally considered speculative because they present a greater risk of loss, including default, than higher rated debt
Notes to Financial Statements (Unaudited) (continued)
securities. These investments pay investors a higher interest rate than investment grade debt securities because of the increased risk of loss. Although certain loans are collateralized, there is no guarantee that the value of the collateral will be sufficient to repay the loan. In a recession or serious credit event, the value of these investments could decline significantly. As a result, the Portfolio’s NAVs could go down and you could lose money.
In addition, loans generally are subject to extended settlement periods that may be longer than seven days. As a result, the Portfolio may be adversely affected by selling other investments at an unfavorable time and/or under unfavorable conditions or engaging in borrowing transactions, such as borrowing against its credit facility, to raise cash to meet redemption obligations or pursue other investment opportunities.
In certain circumstances, loans may not be deemed to be securities. As a result, the Portfolio may not have the protection of anti-fraud provisions of the federal securities laws. In such cases, the Portfolio generally must rely on the contractual provisions in the loan agreement and common-law fraud protections under applicable state law.
The Portfolio may invest in foreign debt securities, which carry certain risks that are in addition to the usual risks inherent in domestic debt securities. These risks include those resulting from currency fluctuations, future adverse political or economic developments and possible imposition of currency exchange blockages or other foreign governmental laws or restrictions. These risks are likely to be greater in emerging markets than in developed markets.
(Q) Counterparty Credit Risk. In order to better define its contractual rights and to secure rights that will help the Portfolio mitigate its counterparty risk, the Portfolio may enter into an International Swaps and Derivatives Association, Inc. Master Agreement (“ISDA Master Agreement”) or similar agreement with its counterparties. An ISDA Master Agreement is a bilateral agreement between the Portfolio and a counterparty that governs certain OTC derivatives and typically contains collateral posting terms and netting provisions. Under an ISDA Master Agreement, the Portfolio may, under certain circumstances, offset with the counterparty certain derivative financial instruments’ payables and/or receivables with collateral held and/or posted and create one single net payment. The provisions of the ISDA Master Agreement typically permit a single net payment in the event of default including the bankruptcy or insolvency of the counterparty. Bankruptcy or insolvency laws of a particular jurisdiction may restrict or prohibit the right of offset in bankruptcy, insolvency or other events. In addition, certain ISDA Master Agreements may contain provisions for early termination of OTC derivative transactions in the event the net assets of the Portfolio decline below specific levels or if the Portfolio fails to meet the terms of its ISDA Master Agreements. The result would cause the Portfolio to accelerate payment of any net liability owed to the counterparty.
For financial reporting purposes, the Portfolio does not offset derivative assets and derivative liabilities that are subject to netting arrangements, if any, in the Statement of Assets and Liabilities.
(R) LIBOR Replacement Risk. The Portfolio may invest in certain debt securities, derivatives or other financial instruments that utilize the London Interbank Offered Rate (“LIBOR”), as a “benchmark” or “reference rate” for various interest rate calculations. The United Kingdom Financial Conduct Authority, which regulates LIBOR,
announced that after 2021 it will cease its active encouragement of banks to provide the quotations needed to sustain LIBOR. As a result, it is anticipated that LIBOR will be discontinued or will no longer be sufficiently robust to be representative of its underlying market around that time. Although financial regulators and industry working groups have suggested alternative reference rates, such as the European Interbank Offer Rate (“EURIBOR”), Sterling Overnight Interbank Average Rate (“SONIA”) and Secured Overnight Financing Rate (“SOFR”), there are challenges to converting certain contracts and transactions to a new benchmark and neither the full effects of the transition process nor its ultimate outcome is known.
The elimination of LIBOR or changes to other reference rates or any other changes or reforms to the determination or supervision of reference rates could have an adverse impact on the market for, or value of, any securities or payments linked to those reference rates, which may adversely affect the Portfolio’s performance and/or net asset value. Uncertainty and risk also remain regarding the willingness and ability of issuers and lenders to include revised provisions in new and existing contracts or instruments. Consequently, the transition away from LIBOR to other reference rates may lead to increased volatility and illiquidity in markets that are tied to LIBOR, fluctuations in values of LIBOR-related investments or investments in issuers that utilize LIBOR, increased difficulty in borrowing or refinancing and diminished effectiveness of hedging strategies, adversely affecting the Portfolio’s performance. Furthermore, the risks associated with the expected discontinuation of LIBOR and transition may be exacerbated if the work necessary to effect an orderly transition to an alternative reference rate is not completed in a timely manner. Because the usefulness of LIBOR as a benchmark could deteriorate during the transition period, these effects could occur prior to the end of 2021.
(S) Indemnifications. Under the Fund’s organizational documents, its officers and trustees are indemnified against certain liabilities that may arise out of performance of their duties to the Fund. Additionally, in the normal course of business, the Portfolio enters into contracts with third-party service providers that contain a variety of representations and warranties and that may provide general indemnifications. The Portfolio’s maximum exposure under these arrangements is unknown, as this would involve future claims that may be made against the Portfolio that have not yet occurred. The Manager believes that the risk of loss in connection with these potential indemnification obligations is remote. However, there can be no assurance that material liabilities related to such obligations will not arise in the future, which could adversely impact the Portfolio.
(T) Quantitative Disclosure of Derivative Holdings. The following tables show additional disclosures related to the Portfolio’s derivative and hedging activities, including how such activities are accounted for and their effect on the Portfolio’s financial positions, performance and cash flows. The Portfolio entered into futures contracts to help manage the duration and yield curve of the portfolio while minimizing the exposure to wider bid/ask spreads in traditional bonds. The Portfolio also entered into interest rate swaps to hedge the potential risk of rising short term interest rates. Foreign currency forward contracts were used to hedge against the risk of loss due to changing currency exchange rates. These derivatives are not accounted for as hedging instruments.
| | |
| 34 | | MainStay VP MacKay Unconstrained Bond Portfolio |
Fair value of derivative instruments as of June 30, 2020:
Asset Derivatives
| | | | | | | | | | | | | | |
| | | Statement of Assets and Liabilities Location | | Foreign
Exchange
Contracts
Risk | | | Interest
Rate
Contracts
Risk | | | Total | |
Futures Contracts | | Net Assets—Net unrealized appreciation on investments, swap contracts and futures contracts (a) | | $ | | | | $ | 14,151 | | | $ | 14,151 | |
Forward Contracts | | Unrealized appreciation on foreign currency forward contracts | | | 3,207 | | | | | | | | 3,207 | |
| | | | | | |
Total Fair Value | | | | $ | 3,207 | | | $ | 14,151 | | | $ | 17,358 | |
| | | | | | |
Liability Derivatives
| | | | | | | | | | | | | | |
| | | Statement of Assets and Liabilities Location | | Foreign
Exchange
Contracts
Risk | | | Interest
Rate
Contracts
Risk | | | Total | |
Futures Contracts | | Net Assets—Net unrealized depreciation on investments, swap contracts and futures contracts (a) | | $ | — | | | $ | (1,130,742 | ) | | $ | (1,130,742 | ) |
Centrally Cleared Swap Contracts | | Net Assets—Net unrealized depreciation on investments, swap contracts and futures contracts (b) | | | — | | | | (6,950,877 | ) | | | (6,950,877 | ) |
Forward Contracts | | Unrealized depreciation on foreign currency forward contracts | | | (197,536 | ) | | | — | | | | (197,536 | ) |
| | | | | | |
Total Fair Value | | | | $ | (197,536 | ) | | $ | (8,081,619 | ) | | $ | (8,279,155 | ) |
| | | | | | |
| (a) | Includes cumulative appreciation (depreciation) of futures contracts as reported in the Portfolio of Investments. Only current day’s variation margin is reported within the Statement of Assets and Liabilities. |
| (b) | Includes cumulative appreciation (depreciation) of centrally cleared swap agreements as reported in the Portfolio of Investments. Only the current day’s variation margin is reported within the Statement of Assets and Liabilities. |
The effect of derivative instruments on the Statement of Operations for the period ended June 30, 2020:
Realized Gain (Loss)
| | | | | | | | | | | | | | |
| | | Statement of
Operations
Location | | Foreign
Exchange
Contracts
Risk | | | Interest
Rate
Contracts
Risk | | | Total | |
| | | | |
Futures Contracts | | Net realized gain (loss) on futures transactions | | $ | — | | | $ | (20,785,642 | ) | | $ | (20,785,642 | ) |
Swap Contracts | | Net realized gain (loss) on swap transactions | | | — | | | | (670,214 | ) | | | (670,214 | ) |
Forward Contracts | | Net realized gain (loss) on foreign currency forward transactions | | | 155,438 | | | | — | | | | 155,438 | |
| | | | | | |
Total Realized Gain (Loss) | | | | $ | 155,438 | | | $ | (21,455,856 | ) | | $ | (21,300,418 | ) |
| | | | | | |
Change in Unrealized Appreciation (Depreciation)
| | | | | | | | | | | | | | |
| | | Statement of Operations Location | | Foreign
Exchange
Contracts
Risk | | | Interest
Rate
Contracts
Risk | | | Total | |
| | | | |
Futures Contracts | | Net change in unrealized appreciation (depreciation) on futures contracts | | $ | — | | | $ | (2,943,489 | ) | | $ | (2,943,489 | ) |
Swap Contracts | | Net change in unrealized appreciation (depreciation) on swap contracts | | | — | | | | (3,530,468 | ) | | | (3,530,468 | ) |
Forward Contracts | | Net change in unrealized appreciation (depreciation) on foreign currency forward contracts | | | (130,750 | ) | | | — | | | | (130,750 | ) |
| | | | | | |
Total Change in Unrealized Appreciation (Depreciation) | | | | $ | (130,750 | ) | | $ | (6,473,957 | ) | | $ | (6,604,707 | ) |
| | | | | | |
Notes to Financial Statements (Unaudited) (continued)
Average Notional Amount
| | | | | | | | | | | | |
| | | Foreign
Exchange
Contracts
Risk | | | Interest
Rate
Contracts
Risk | | | Total | |
| | | |
Futures Contracts Long | | $ | — | | | $ | 75,235,831 | | | $ | 75,235,831 | |
Futures Contracts Short | | $ | — | | | $ | (252,499,588 | ) | | $ | (252,499,588 | ) |
Swap Contracts Long | | $ | — | | | $ | 100,000,000 | | | $ | 100,000,000 | |
Forward Contracts Long(a) | | $ | 3,170,135 | | | $ | — | | | $ | 3,170,135 | |
Forward Contracts Short | | $ | (8,932,409 | ) | | $ | — | | | $ | (8,932,409 | ) |
| | | | |
| (a) | Positions were open five months during the reporting period. |
Note 3–Fees and Related Party Transactions
(A) Manager and Subadvisor. New York Life Investments, a registered investment adviser and an indirect, wholly-owned subsidiary of New York Life, serves as the Portfolio’s Manager pursuant to an Amended and Restated Management Agreement (“Management Agreement”). The Manager provides offices, conducts clerical, recordkeeping and bookkeeping services, and keeps most of the financial and accounting records required to be maintained by the Portfolio. Except for the portion of salaries and expenses that are the responsibility of the Portfolio, the Manager pays the salaries and expenses of all personnel affiliated with the Portfolio and certain operational expenses of the Portfolio. The Portfolio reimburses New York Life Investments in an amount equal to the portion of the compensation of the Chief Compliance Officer attributable to the Portfolio. MacKay Shields LLC (“MacKay Shields” or “Subadvisor”), a registered investment adviser and an indirect, wholly-owned subsidiary of New York Life, serves as Subadvisor to the Portfolio and is responsible for the day-to-day portfolio management of the Portfolio. Pursuant to the terms of an Amended and Restated Subadvisory Agreement (“Subadvisory Agreement”) between New York Life Investments and MacKay Shields, New York Life Investments pays for the services of the Subadvisor.
The Fund, on behalf of the Portfolio, pays New York Life Investments in its capacity as the Portfolio’s investment manager and administrator, pursuant to the Management Agreement, a monthly fee for the services performed and the facilities furnished at an annual rate of the average daily net assets as follows: 0.60% up to $500 million; 0.55% from $500 million to $1 billion; 0.50% from $1 billion to $5 billion; and 0.475% in excess of $5 billion. During the six-month period ended June 30, 2020, the effective management fee rate was 0.58%.
During the six-month period ended June 30, 2020, New York Life Investments earned fees from the Portfolio in the amount of $2,760,566 and paid the Subadvisor in the amount of $1,380,283.
State Street provides sub-administration and sub-accounting services to the Portfolio pursuant to an agreement with New York Life Investments. These services include calculating the daily NAVs of the Portfolio, maintaining the general ledger and sub-ledger accounts for the calculation of the Portfolio’s NAVs and assisting New York Life Investments in conducting various aspects of the Portfolio’s administrative operations. For providing these services to the Portfolio, State Street is compensated by New York Life Investments.
Pursuant to an agreement between the Fund and New York Life Investments, New York Life Investments is responsible for providing or procuring certain regulatory reporting services for the Portfolio. The Portfolio will reimburse New York Life Investments for the actual costs incurred by New York Life Investments in connection with providing or procuring these services for the Portfolio.
(B) Distribution and Service Fees. The Fund, on behalf of the Portfolio, has entered into a distribution agreement with NYLIFE Distributors LLC (the “Distributor”), an indirect, wholly-owned subsidiary of New York Life. The Portfolio has adopted a distribution plan (the “Plan”) in accordance with the provisions of Rule 12b-1 under the 1940 Act. Under the Plan, the Distributor has agreed to provide, through its affiliates or independent third parties, various distribution-related, shareholder and administrative support services to the Service Class shareholders. For its services, the Distributor is entitled to a combined distribution and service fee accrued daily and paid monthly at an annual rate of 0.25% of the average daily net assets attributable to the Service Class shares of the Portfolio.
(C) Investments in Affiliates (in 000’s). During the six-month period ended June 30, 2020, purchases and sales transactions, income earned from investments and shares held of investment companies managed by New York Life Investments or its affiliates were as follows:
| | | | | | | | | | | | | | | | | | | | | | | | | | | | | | | | | | | | |
Affiliated Investment
Company | | Value,
Beginning
of Period | | | Purchases
at Cost | | | Proceeds
from
Sales | | | Net
Realized
Gain/(Loss)
on Sales | | | Change in
Unrealized
Appreciation/
(Depreciation) | | | Value,
End of
Period | | | Dividend
Income | | | Other
Distributions | | | Shares
End of
Period | |
MainStay U.S. Government Liquidity Fund | | $ | 57,671 | | | $ | 253,979 | | | $ | (289,907) | | | $ | — | | | $ | — | | | $ | 21,743 | | | $ | 133 | | | $ | — | | | | 21,743 | |
| | |
| 36 | | MainStay VP MacKay Unconstrained Bond Portfolio |
Note 4–Federal Income Tax
As of June 30, 2020, the cost and unrealized appreciation (depreciation) of the Portfolio’s investment portfolio, including applicable derivative contracts and other financial instruments, as determined on a federal income tax basis, was as follows:
| | | | | | | | | | | | | | | | |
| | | Federal Tax
Cost | | | Gross
Unrealized
Appreciation | | | Gross
Unrealized
(Depreciation) | | | Net
Unrealized
Appreciation/
(Depreciation) | |
| | | | |
Investments in Securities | | $ | 896,131,868 | | | $ | 42,386,562 | | | $ | (16,971,640 | ) | | $ | 25,414,922 | |
As of December 31, 2019, for federal income tax purposes, capital loss carryforwards of $51,269,157, as shown in the table below, were available to the extent provided by the regulations to offset future realized gains of the Portfolio through the years indicated. Accordingly, no capital gains distributions are expected to be paid to shareholders until net gains have been realized in excess of such amounts.
| | | | |
Capital Loss
Available Through | | Short-Term
Capital Loss
Amounts (000’s) | | Long-Term
Capital Loss
Amounts (000’s) |
| | |
| Unlimited | | $11,196 | | $40,073 |
During the year ended December 31, 2019, the tax character of distributions paid as reflected in the Statements of Changes in Net Assets was as follows:
| | | | | | |
|
| 2019 | |
Tax-Based
Distributions from Ordinary
Income | | | Tax-Based
Distributions from Long-Term
Gains | |
| |
| $ | 36,055,232 | | | $ | — | |
Note 5–Custodian
State Street is the custodian of cash and securities held by the Portfolio. Custodial fees are charged to the Portfolio based on the Portfolio’s net assets and/or the market value of securities held by the Portfolio and the number of certain transactions incurred by the Portfolio.
Note 6–Line of Credit
The Portfolio and certain other funds managed by New York Life Investments maintain a line of credit with a syndicate of banks in order to secure a source of funds for temporary purposes to meet unanticipated or excessive redemption requests.
Effective July 28, 2020, under the credit agreement (the “Credit Agreement”), the aggregate commitment amount is $600,000,000 with an additional uncommitted amount of $100,000,000. The commitment fee is an annual rate of 0.15% of the average commitment amount payable quarterly, regardless of usage, to JP Morgan Chase Bank NA, who serves as the agent to the syndicate. The commitment fee is allocated among the Portfolio and certain other funds managed by New York Life Investments based upon their respective net assets and other factors. Interest on any revolving credit loan is charged based upon the
Federal Funds Rate or the one-month LIBOR, whichever is higher. The Credit Agreement expires on July 27, 2021, although the Portfolio, certain other funds managed by New York Life Investments and the syndicate of banks may renew the Credit Agreement for an additional year on the same or different terms or enter into a credit agreement with a different syndicate of banks. Prior to July 28, 2020, the aggregate commitment amount and the commitment fee were the same as those under the current Credit Agreement, but State Street Served as agent to the syndicate. As of June 30, 2020, there were no borrowings outstanding with respect to the Portfolio under the Credit Agreement or the credit agreement for which State Street served as agent.
Note 7–Interfund Lending Program
Pursuant to an exemptive order issued by the SEC, the Portfolio, along with certain other funds managed by New York Life Investments, may participate in an interfund lending program. The interfund lending program provides an alternative credit facility that permits the Portfolio and certain other funds managed by New York Life Investments to lend or borrow money for temporary purposes directly to or from one another subject to the conditions of the exemptive order. During the six-month period ended June 30, 2020, there were no interfund loans made or outstanding with respect to the Portfolio.
Note 8–Purchases and Sales of Securities (in 000’s)
During the six-month period ended June 30, 2020, purchases and sales of U.S. government securities were $109,790 and $145,302, respectively. Purchases and sales of securities, other than U.S. government securities and short-term securities, were $254,178 and $320,731, respectively.
Note 9–Capital Share Transactions
Transactions in capital shares for the six-month period ended June 30, 2020 and the year ended December 31, 2019, were as follows:
| | | | | | | | |
Initial Class | | Shares | | | Amount | |
| | |
Six-month period ended June 30, 2020: | | | | | | | | |
Shares sold | | | 92,196 | | | $ | 906,571 | |
Shares issued to shareholders in reinvestment of distributions | | | 46,366 | | | | 432,987 | |
Shares redeemed | | | (3,003,474 | ) | | | (28,898,862 | ) |
| | | | |
Net increase (decrease) | | | (2,864,912 | ) | | $ | (27,559,304 | ) |
| | | | | | | | |
Year ended December 31, 2019: | | | | | | | | |
Shares sold | | | 248,157 | | | $ | 2,451,502 | |
Shares issued to shareholders in reinvestment of distributions | | | 308,514 | | | | 3,033,734 | |
Shares redeemed | | | (7,761,613 | ) | | | (76,641,030 | ) |
| | | | | | | | |
Net increase (decrease) | | | (7,204,942 | ) | | $ | (71,155,794 | ) |
| | | | | | | | |
Notes to Financial Statements (Unaudited) (continued)
| | | | | | | | |
Service Class | | Shares | | | Amount | |
Six-month period ended June 30, 2020: | | | | | | | | |
Shares sold | | | 2,261,049 | | | $ | 22,080,415 | |
Shares issued to shareholders in reinvestment of distributions | | | 1,257,465 | | | | 11,812,850 | |
Shares redeemed | | | (10,459,263 | ) | | | (98,518,933 | ) |
| | | | | | | | |
Net increase (decrease) | | | (6,940,749 | ) | | $ | (64,625,668 | ) |
| | | | | | | | |
Year ended December 31, 2019: | | | | | | | | |
Shares sold | | | 3,740,489 | | | $ | 36,848,031 | |
Shares issued to shareholders in reinvestment of distributions | | | 3,364,366 | | | | 33,021,498 | |
Shares redeemed | | | (11,297,274 | ) | | | (110,947,406 | ) |
| | | | | | | | |
Net increase (decrease) | | | (4,192,419 | ) | | $ | (41,077,877 | ) |
| | | | | | | | |
Note 10–Recent Accounting Pronouncement
In March 2020, the Financial Accounting Standards Board (“FASB”) issued Accounting Standards Update 2020-04 (“ASU 2020-04”), which provides optional guidance to ease the potential accounting burden associated with transitioning away from LIBOR and other reference rates that are expected to be discontinued. ASU 2020-04 is effective immediately upon release of the update on March 12, 2020 through December 31, 2022. At this time, the Manager is evaluating the implications of certain other provisions of ASU 2020-04 related to new disclosure requirements and any impact on the financial statement disclosures has not yet been determined.
Note 11–Subsequent Events
In connection with the preparation of the financial statements of the Portfolio as of and for the six-month period ended June 30, 2020, events and transactions subsequent to June 30, 2020, through the date the financial statements were issued have been evaluated by the Manager, for possible adjustment and/or disclosure. No subsequent events requiring financial statement adjustment or disclosure have been identified.
Note 12–Other Matters
An outbreak of COVID-19, first detected in December 2019, has developed into a global pandemic and has resulted in travel restrictions, closure of international borders, certain businesses and securities markets, restrictions on securities trading activities, prolonged quarantines, supply chain disruptions, and lower consumer demand, as well as general concern and uncertainty. The continued impact of COVID-19 is uncertain and could further adversely affect the global economy, national economies, individual issuers and capital markets in unforeseeable ways and result in a substantial and extended economic downturn. Developments that disrupt global economies and financial markets, such as COVID-19, may magnify factors that affect the Portfolio’s performance.
| | |
| 38 | | MainStay VP MacKay Unconstrained Bond Portfolio |
Discussion of the Operation and Effectiveness of the Portfolio’s
Liquidity Risk Management Program (Unaudited)
In compliance with Rule 22e-4 under the Investment Company Act of 1940, as amended (the “Liquidity Rule”), the Portfolio has adopted and implemented a liquidity risk management program (the “Program”), which New York Life Investment Management LLC believes is reasonably designed to assess and manage the Portfolio’s liquidity risk. The Board designated New York Life Investment Management LLC as administrator of the Program (the “Administrator”). The Administrator has established a Liquidity Risk Management Committee to assist the Administrator in the implementation and day-to-day administration of the Program and to otherwise support the Administrator in fulfilling its responsibilities under the Program.
At a meeting of the Board held on March 11, 2020, the Administrator provided the Board with a written report addressing the Program’s operation, adequacy and effectiveness of implementation for the period from December 1, 2018 through December 31, 2019, as required under the Liquidity Rule. The report noted that the Administrator concluded that (i) the Program operated effectively to assess and manage the Portfolio’s liquidity risk, (ii) the Program has been adequately and effectively implemented to monitor and, as applicable, respond to the Portfolio’s liquidity developments and (iii) the Portfolio’s investment strategy continues to be appropriate for an open-end portfolio.
In accordance with the Program, the Portfolio’s liquidity risk is assessed no less frequently than annually taking into consideration certain factors, as applicable, such as (i) investment strategy and liquidity of portfolio investments, (ii) short-term and long-term cash flow projections and (iii) holdings of cash and cash equivalents and borrowing arrangements and other funding sources. Certain factors are considered under both normal and reasonably foreseeable stressed conditions.
Each Portfolio portfolio investment is classified into one of four liquidity categories. The classification is based on a determination of the number of days it is reasonably expected to take to convert the investment into cash, or sell or dispose of the investment, in current market conditions without significantly changing the market value of the investment. The Administrator has delegated liquidity classification determinations to the Portfolio’s subadvisor, subject to appropriate oversight by the Administrator, and classification determinations are made by taking into account the Portfolio’s reasonably anticipated trade size, various market, trading and investment-specific considerations, as well as market depth, and, in certain cases, third-party vendor data.
The Liquidity Rule requires portfolios that do not primarily hold assets that are highly liquid investments to adopt a minimum amount of net assets that must be invested in highly liquid investments that are assets (an “HLIM”). In addition, the Liquidity Rule limits a portfolio’s investments in illiquid investments. Specifically, the Liquidity Rule prohibits acquisition of illiquid investments if doing so would result in a portfolio holding more than 15% of its net assets in illiquid investments that are assets. The Program includes provisions reasonably designed to determine, periodically review and comply with the HLIM requirement, as applicable, and to comply with the 15% limit on illiquid investments.
Proxy Voting Policies and Procedures and Proxy Voting Record
A description of the policies and procedures that New York Life Investments uses to vote proxies related to the Portfolio’s securities is available free of charge upon request (i) by calling 800-598-2019; (ii) by visiting New York Life Investments’ website at https://www.nylinvestments.com/mainstay/products-and-performance/mainstay-vp-funds-trust; or (iii) by visiting the SEC’s website at www.sec.gov.
The Portfolio is required to file with the SEC its proxy voting record for the 12-month period ending June 30 on Form N-PX. The Portfolio’s most recent Form N-PX or proxy voting record is available free of charge upon request (i) by calling 800-598-2019; (ii) by visiting New York Life Investments’ website at https://www.nylinvestments.com/mainstay/products-and-performance/mainstay-vp-funds-trust ; or (iii) by visiting the SEC’s website at www.sec.gov.
Shareholder Reports and Quarterly Portfolio Disclosure
The Portfolio is required to file its complete schedule of portfolio holdings with the SEC 60 days after its first and third fiscal quarter on Form N-PORT. The Portfolio’s holdings report is available free of charge upon request by calling 800-598-2019 or by visiting the SEC’s website at www.sec.gov.
| | |
| 40 | | MainStay VP MacKay Unconstrained Bond Portfolio |
MainStay VP Portfolios
MainStay VP offers a wide range of Portfolios. The full array of MainStay VP offerings is listed here, with information about the manager, subadvisors, legal counsel, and independent registered public accounting firm.
Equity Portfolios
MainStay VP Emerging Markets Equity Portfolio
MainStay VP Epoch U.S. Equity Yield Portfolio
MainStay VP Fidelity Institutional AM® Utilities Portfolio†
MainStay VP MacKay Common Stock Portfolio
MainStay VP MacKay Growth Portfolio
MainStay VP MacKay International Equity Portfolio
MainStay VP MacKay Mid Cap Core Portfolio
MainStay VP MacKay S&P 500 Index Portfolio
MainStay VP MacKay Small Cap Core Portfolio
MainStay VP Mellon Natural Resources Portfolio
MainStay VP Small Cap Growth Portfolio
MainStay VP T. Rowe Price Equity Income Portfolio
MainStay VP Winslow Large Cap Growth Portfolio
Mixed Asset Portfolios
MainStay VP Balanced Portfolio
MainStay VP Income Builder Portfolio
MainStay VP Janus Henderson Balanced Portfolio
MainStay VP MacKay Convertible Portfolio
Income Portfolios
MainStay VP Bond Portfolio
MainStay VP Floating Rate Portfolio
MainStay VP Indexed Bond Portfolio
MainStay VP MacKay Government Portfolio
MainStay VP MacKay High Yield Corporate Bond Portfolio
MainStay VP MacKay Unconstrained Bond Portfolio
MainStay VP PIMCO Real Return Portfolio
Money Market
MainStay VP U.S. Government Money Market Portfolio
Alternative
MainStay VP CBRE Global Infrastructure Portfolio
MainStay VP IQ Hedge Multi-Strategy Portfolio
Asset Allocation Portfolios
MainStay VP Conservative Allocation Portfolio
MainStay VP Growth Allocation Portfolio
MainStay VP Moderate Allocation Portfolio
MainStay VP Moderate Growth Allocation Portfolio
Manager
New York Life Investment Management LLC
New York, New York
Subadvisors
Brown Advisory LLC
Baltimore, Maryland
Candriam Belgium S.A.*
Brussels, Belgium
CBRE Clarion Securities LLC
Radnor, Pennsylvania
Epoch Investment Partners, Inc.
New York, New York
FIAM LLC
Smithfield, Rhode Island
IndexIQ Advisors LLC*
New York, New York
Janus Capital Management LLC
Denver, Colorado
MacKay Shields LLC*
New York, New York
Mellon Investments Corporation
Boston, Massachusetts
NYL Investors LLC*
New York, New York
Pacific Investment Management Company LLC
Newport Beach, California
Segall Bryant & Hamill, LLC
Chicago, Illinois
T. Rowe Price Associates, Inc.
Baltimore, Maryland
Winslow Capital Management, LLC
Minneapolis, Minnesota
Distributor
NYLIFE Distributors LLC*
Jersey City, New Jersey
Custodian
State Street Bank and Trust Company
Boston, Massachusetts
Independent Registered Public Accounting Firm
PricewaterhouseCoopers LLP
New York, New York
Legal Counsel
Dechert LLP
Washington, District of Columbia
Some Portfolios may not be available in all products.
| † | Fidelity Institutional AM is a registered trade mark of FMR LLC. Used with permission. |
| * | An affiliate of New York Life Investment Management LLC |
Not part of the Semiannual Report
2020 Semiannual Report
This report is for the general information of New York Life Variable Annuities and NYLIAC Variable Universal Life Insurance Products policyowners. It must be preceded or accompanied by the appropriate product(s) and funds prospectuses if it is given to anyone who is not an owner of a New York Life variable annuity policy or a NYLIAC Variable Universal Life Insurance Product. This report does not offer for sale or solicit orders to purchase securities.
The performance data quoted in this report represents past performance. Past performance is no guarantee of future results. Due to market volatility and other factors, current performance may be lower or higher than the figures shown. The most recent month-end performance summary for your variable annuity or variable life policy is available by calling 800-598-2019 and is updated periodically on www.newyorklife.com.
The New York Life Variable Annuities and NYLIAC Variable Universal Life Insurance Products are issued by New York Life Insurance and Annuity Corporation (a Delaware Corporation) and distributed by NYLIFE Distributors LLC (Member FINRA/SIPC).
New York Life Insurance Company
New York Life Insurance and Annuity Corporation (NYLIAC) (A Delaware Corporation)
51 Madison Avenue, Room 551
New York, NY 10010
www.newyorklife.com
Printed on recycled paper
nylinvestments.com
NYLIFE Distributors LLC, 30 Hudson Street, Jersey City, NJ 07302
New York Life Investment Management LLC is the investment manager to the MainStay VP Funds Trust
©2020 by NYLIFE Distributors LLC. All rights reserved.
You may obtain copies of the Prospectus and the Statement of Additional Information free of charge, upon request, by calling toll-free 800-598-2019 or writing to New York Life Insurance and Annuity Corporation, 51 Madison Avenue, New York, NY 10010.
| | | | |
| Not FDIC Insured | | No Bank Guarantee | | May Lose Value |
| | | | |
| 1781647 | | | | MSVPUB10-08/20 (NYLIAC) NI532 |
MainStay VP IQ Hedge Multi-Strategy Portfolio
Message from the President and Semiannual Report
Unaudited | June 30, 2020
Beginning on January 1, 2021, as permitted by regulations adopted by the Securities and Exchange Commission, paper copies of the MainStay VP Portfolio annual and semi-annual shareholder reports may no longer be sent by mail, unless you specifically request paper copies of the reports from the insurance company that offers your policy. Instead, the reports will be made available online, and you will be notified by mail each time a report is posted and provided with a website link to access the report. Instructions for requesting paper copies will be provided by your insurance company.
If you already elected to receive shareholder reports electronically, you will not be affected by this change and you need not take any action. At any time, you may elect to receive reports and other communications from the insurance company electronically by following the instructions provided by the insurance company.
You may elect to receive all future shareholder reports in paper form free of charge. You can inform the insurance company that you wish to receive paper copies of reports by following the instructions provided by the insurance company. Your election to receive reports in paper form will apply to all portfolio companies available under your contract.
| | | | | | | | |
| Not FDIC/NCUA Insured | | Not a Deposit | | May Lose Value | | No Bank Guarantee | | Not Insured by Any Government Agency |

This page intentionally left blank
Message from the President
High levels of volatility shook financial markets in response to the COVID-19 pandemic and an abrupt decline in global economic activity during the six months ended June 30, 2020.
Markets entered 2020 riding strong fourth quarter performance and an economic expansion of historic longevity. Most broad stock and bond indices began to dip in late February as growing numbers of COVID-19 cases were seen in hotspots around the world. On March 11, 2020, the World Health Organization acknowledged that the disease had reached pandemic proportions, with over 80,000 identified cases in China, thousands in Italy, South Korea and the United States, and more in dozens of additional countries. Governments and central banks pledged trillions of dollars to address the mounting economic and public health crisis; however, “stay-at-home” orders and other restrictions on non-essential activity caused global economic activity to slow. Most stocks and bonds lost significant ground in this challenging environment, with equities declining by roughly a third and the yield on high-yield credit indices shooting higher.
Policymakers responded with extraordinary speed to address the situation. In the United States, the Federal Reserve (“Fed”) cut interest rates to near zero and announced unlimited quantitative easing. With help from Treasury, the Fed later rolled out a series of lending facilities to directly support market functioning. In late March, the Federal government declared a national emergency; Congress passed, and the President signed, a $2 trillion CARES Act (The Coronavirus Aid, Relief, and Economic Security Act), with the promise of further assistance for consumers and businesses to come. This enormous wave of policy support helped fuel a rapid recovery in market pricing as stocks bounced back and credit spreads narrowed. Some states rushed to ease restrictions on travel and social gatherings, further fueling optimism that the effects of the pandemic might prove short lived. However, the final weeks of the reporting period saw infection rates beginning to rise in some of the first states to reopen, raising concerns that a second round of restrictive government policies might prove necessary, once again stifling economic activity.
Despite all the market volatility, the broadly based S&P 500® Index finished the first half of 2020 only slightly below its starting point and the technology-heavy NASDAQ Composite Index posted gains, closing in near record territory. Small-cap stocks tended to trail their large cap counterparts, as illustrated by the Russell 2000® Index’s loss of approximately 15%, while value-oriented stocks lagged growth-oriented issues. From a global perspective, U.S. stocks generally outperformed international equities, with emerging markets hit particularly hard by the flight from risk.
Fixed-income markets also experienced unusually high levels of volatility. Recognized safe havens, such as U.S. government bonds, attracted increased investment, driving yields lower and prices higher, positioning long-term Treasury bonds to deliver particularly strong gains. Investment-grade corporate bonds lost value in March before recovering in the closing months of the reporting period, while relatively speculative high-yield credit faced the brunt of risk-off sentiment. Emerging market debt underperformed most other bonds types as investors sought to minimize currency and sovereign risks.
Today, as we at New York Life Investments continue to track the ongoing health crisis and its financial ramifications, we are particularly mindful of the people at the heart of our enterprise—our colleagues and valued clients. By taking appropriate steps to minimize community spread of COVID-19 within our organization, we strive to safeguard the health of our investment professionals so they can continue to provide you, as a MainStay investor, with world class investment solutions in this rapidly evolving environment.
Sincerely,

Kirk C. Lehneis
President
The opinions expressed are as of the date of this report and are subject to change. There is no guarantee that any forecast made will come to pass. This material does not constitute investment advice and is not intended as an endorsement of any specific investment. Past performance is no guarantee of future results.
Not part of the Semiannual Report
Table of Contents
Investors should refer to the Portfolio’s Summary Prospectus and/or Prospectus and consider the Portfolio’s investment objectives, strategies, risks, charges and expenses carefully before investing. The Summary Prospectus and/or Prospectus contain this and other information about the Portfolio. You may obtain copies of the Portfolio’s Summary Prospectus and/or the Prospectus and the Statement of Additional Information free of charge, upon request, by calling toll-free 800-598-2019, by writing to New York Life Insurance and Annuity Corporation, 51 Madison Avenue, Room 251, New York, New York 10010 or by sending an email to MainStayShareholdersServices@nylim.com. These documents are also available at nylinvestments.com/vpdocuments. Please read the Summary Prospectus and/or Prospectus carefully before investing. MainStay VP Funds Trust portfolios are separate account options which are purchased through a variable insurance or variable annuity contract.
Investment and Performance Comparison1 (Unaudited)
Performance data quoted represents past performance. Past performance is no guarantee of future results. Because of market volatility and other factors, current performance may be lower or higher than the figures shown. Investment return and principal value will fluctuate, and as a result, when shares are redeemed, they may be worth more or less than their original cost. The performance table and graph do not reflect any deduction of sales charges, mortality and expense charges, contract charges or administrative charges. Please refer to the Performance Summary appropriate for your policy. For performance information current to the most recent month-end, please call 800-598-2019 or visit www.newyorklife.com.

Average Annual Total Returns for the Period-Ended June 30, 2020
| | | | | | | | | | | | | | | | | | | | | | |
| Class | | Inception
Date | | Six Months | | | One Year | | | Five Years | | | Since
Inception2 | | | Gross
Expense
Ratio3 | |
| | | | | | |
| Initial Class Shares | | 5/1/2013 | | | –1.59 | % | | | 1.46 | % | | | –1.46 | % | | | –1.51 | % | | | 1.46 | % |
| Service Class Shares | | 5/1/2013 | | | –1.70 | | | | 1.22 | | | | –1.65 | | | | –1.71 | | | | 1.71 | |
| | | | | | | | | | | | | | | | |
| Benchmark Performance | | Six
Months | | | One
Year | | | Five
Years | | | Since
Inception | |
| | | | |
S&P Balanced Equity and Bond-Conservative Index4 | | | 7.55 | % | | | 11.63 | % | | | 6.65 | % | | | 5.83 | % |
HFRI Fund of Funds Composite Index5 | | | –2.25 | | | | –0.19 | | | | 1.36 | | | | 2.43 | |
IQ Hedge Multi-Strategy Index | | | –1.19 | | | | 2.24 | | | | 2.25 | | | | 2.85 | |
Morningstar Multialternative Category Average6 | | | –5.36 | | | | –2.99 | | | | 0.73 | | | | 0.42 | |
| 1. | Performance figures may reflect certain fee waivers and/or expense limitations, without which total returns may have been different. For information on current fee waivers and/or expense limitations (if any), please refer to the Notes to the Financial Statements. |
| 2. | Effective November 30, 2018, the Portfolio’s predecessor fund, MainStay VP Absolute Return Multi-Strategy Portfolio (the “VP ARMS Portfolio”), was reorganized into the Portfolio. The Portfolio assumed the VP ARMS Portfolio’s historical performance and accounting information. Therefore, the performance information prior to November 30, 2018, shown in this report is that of the VP ARMS Portfolio, which had a different investment objective and different principal investment strategies and subadvisors. Past performance may have been different if the Portfolio’s current subadvisor, investment objective or principal investment strategies had been in place during the periods. |
| 3. | The gross expense ratios presented reflect the Portfolio’s “Total Annual Portfolio Operating Expenses” from the most recent Prospectus, as supplemented, and may differ from other expense ratios disclosed in this report. |
| 4. | The Portfolio has selected the S&P Balanced Equity and Bond-Conservative Index as its primary benchmark. The S&P Balanced Equity and Bond- |
| | Conservative Index consists of a position in the S&P 500 Total Return Index (25%) and a position in the S&P U.S. Treasury Bond 7-10 Year Index (75%). Results assume reinvestment of all dividends and capital gains. An investment cannot be made directly in an index. |
| 5. | The Portfolio has selected the HFRI Fund of Funds Composite Index as its secondary benchmark. The HFRI Fund of Funds Composite Index is an equally weighted hedge fund index including over 650 domestic and off-shore fund of funds. The index is rebalanced monthly with performance updates three times per month. Results assume reinvestment of all dividends and capital gains. An investment cannot be made directly in an index. |
| 6. | The Morningstar Multialternative Category Average is representative of funds that have a majority of their assets exposed to alternative strategies. Funds in this category include both funds with static allocations to alternative strategies and funds tactically allocating among alternative strategies and asset classes. Results are based on average total returns of similar funds with all dividends and capital gain distributions reinvested. |
Cost in Dollars of a $1,000 Investment in MainStay VP IQ Hedge Multi-Strategy Portfolio (Unaudited)
The example below is intended to describe the fees and expenses borne by shareholders during the six-month period from January 1, 2020, to June 30, 2020, and the impact of those costs on your investment.
Example
As a shareholder of the Portfolio you incur two types of costs: (1) transaction costs, including exchange fees and sales charges (loads) on purchases (as applicable), and (2) ongoing costs, including management fees, distribution and/or service (12b-1) fees, and other Portfolio expenses (as applicable). This example is intended to help you understand your ongoing costs (in dollars) of investing in the Portfolio and to compare these costs with the ongoing costs of investing in other mutual funds. The example is based on an investment of $1,000 made at the beginning of the six-month period and held for the entire period from January 1, 2020, to June 30, 2020. Shares are only sold in connection with variable life and annuity contracts and the example does not reflect any contract level or transactional fees or expenses. If these costs had been included, your costs would have been higher.
This example illustrates your Portfolio’s ongoing costs in two ways:
Actual Expenses
The second and third data columns in the table below provide information about actual account values and actual expenses. You may use the information in these columns, together with the amount you invested, to estimate the expenses that you paid during the six months
ended June 30, 2020. Simply divide your account value by $1,000 (for example, an $8,600 account value divided by $1,000 = 8.6), then multiply the result by the number under the heading entitled “Expenses Paid During Period” to estimate the expenses you paid on your account during this period.
Hypothetical Example for Comparison Purposes
The fourth and fifth data columns in the table below provide information about hypothetical account values and hypothetical expenses based on the Portfolio’s actual expense ratio and an assumed rate of return of 5% per year before expenses, which is not the Portfolio’s actual return. The hypothetical account values and expenses may not be used to estimate the actual ending account balances or expenses you paid for the six-month period shown. You may use this information to compare the ongoing costs of investing in the Portfolio with the ongoing costs of investing in other mutual funds. To do so, compare this 5% hypothetical example with the 5% hypothetical examples that appear in the shareholder reports of the other mutual funds.
Please note that the expenses shown in the table are meant to highlight your ongoing costs only and do not reflect any transactional costs, such as exchange fees or sales charges (loads). Therefore, the fourth and fifth data columns of the table are useful in comparing ongoing costs only and will not help you determine the relative total costs of owning different funds. In addition, if these transactional costs were included, your costs would have been higher.
| | | | | | | | | | | | | | | | | | | | | | |
| | | | | | | | | | | | | | | | | | |
| Share Class | | Beginning
Account
Value
1/1/20 | | | Ending Account
Value (Based
on Actual
Returns and
Expenses)
6/30/20 | | | Expenses
Paid
During
Period1 | | | Ending Account
Value (Based
on Hypothetical
5% Annualized
Return and
Actual Expenses)
6/30/20 | | | Expenses
Paid
During
Period1 | | | Net Expense
Ratio
During
Period2 |
| | | | | | |
| Initial Class Shares | | $ | 1,000.00 | | | $ | 984.10 | | | $ | 3.45 | | | $ | 1,021.38 | | | $ | 3.52 | | | 0.70% |
| | | | | | |
| Service Class Shares | | $ | 1,000.00 | | | $ | 983.00 | | | $ | 4.68 | | | $ | 1,020.14 | | | $ | 4.77 | | | 0.95% |
| 1. | Expenses are equal to the Portfolio’s annualized expense ratio of each class multiplied by the average account value over the period, divided by 366 and multiplied by 182 (to reflect the six-month period). The table above represents the actual expenses incurred during the six-month period. In addition to the fees and expenses which the Portfolio bears directly, it also indirectly bears a pro rata share of the fees and expenses of the underlying funds in which it invests. Such indirect expenses are not included in the above-reported expense figures. |
| 2. | Expenses are equal to the Portfolio’s annualized expense ratio to reflect the six-month period. |
| | |
| 6 | | MainStay VP IQ Hedge Multi-Strategy Portfolio |
Portfolio Composition as of June 30, 2020 (Unaudited)
| | | | |
| |
| U.S. Ultra Short Term Bond Funds | | | 31.0 | % |
| |
| Short-Term Investments | | | 18.2 | |
| |
| Bank Loan Funds | | | 14.6 | |
| |
| Investment Grade Corporate Bond Funds | | | 10.3 | |
| |
| Mortgage-Backed Security Funds | | | 5.4 | |
| |
| U.S. Medium Term Treasury Bond Funds | | | 4.1 | |
| |
| Europe Equity Funds | | | 3.6 | |
| |
| High Yield Corporate Bond Funds | | | 3.5 | |
| |
| International Small Cap Equity Funds | | | 3.5 | |
| |
| Emerging Bonds—Local Currency Funds | | | 3.0 | |
| |
| International Equity Core Funds | | | 2.8 | |
| |
| U.S. Small Cap Growth Funds | | | 2.8 | |
| |
| Euro Fund | | | 2.3 | |
| |
| Emerging Bonds—USD Funds | | | 1.5 | |
| |
| Floating Rate—Investment Grade Funds | | | 1.5 | |
| |
| BRIC Equity Funds | | | 1.3 | |
| | | | |
| |
| U.S. Large Cap Core Funds | | | 1.2 | % |
| |
| Emerging Small Cap Equity Funds | | | 1.1 | |
| |
| British Pound Fund | | | 0.8 | |
| |
| Gold Funds | | | 0.8 | |
| |
| Japan Equity Fund | | | 0.8 | |
| |
| Broad Fund | | | 0.7 | |
| |
| Asia Pacific Equity Funds | | | 0.6 | |
| |
| Emerging Equity Funds | | | 0.6 | |
| |
| Volatility Note | | | 0.3 | |
| |
| International Large Cap Growth Funds | | | 0.2 | |
| |
| Silver Fund | | | 0.2 | |
| |
| U.S. Dollar Fund | | | 0.2 | |
| |
| Other Assets, Less Liabilities | | | –16.9 | |
| | | | |
| |
| | | 100.0 | % |
| | | | |
See Portfolio of Investments beginning on page 10 for specific holdings within these categories. The Portfolio’s holdings are subject to change.
Top Ten Holdings as of June 30, 2020 (excluding short-term investments) (Unaudited)
| 1. | Invesco Senior Loan ETF |
| 2. | IQ Ultra Short Duration ETF |
| 3. | iShares Short Treasury Bond ETF |
| 4. | Invesco Treasury Collateral ETF |
| 5. | Goldman Sachs Access Treasury 0-1 Year ETF |
| 6. | SPDR Bloomberg Barclays 1-3 Month T-Bill ETF |
| 7. | iShares iBoxx $ Investment Grade Corporate Bond ETF |
| 8. | SPDR Blackstone / GSO Senior Loan ETF |
| 10. | Vanguard FTSE Europe ETF |
Portfolio Management Discussion and Analysis (Unaudited)
Answers to the questions reflect the views of portfolio managers Greg Barrato and James Harrison of Index IQ Advisors LLC, the Portfolio’s Subadvisor.
How did MainStay VP IQ Hedge Multi-Strategy Portfolio perform relative to its benchmarks and peers during the six months ended June 30, 2020?
For the six months ended June 30, 2020, MainStay VP IQ Hedge Multi-Strategy Portfolio returned –1.59% for Initial Class shares and –1.70% for Service Class shares. Over the same period, both share classes underperformed the 7.55% return for the S&P Balanced Equity and Bond-Conservative Index, which is the Portfolio’s primary benchmark. For the six months ended June 30, 2020, both share classes outperformed the –2.25% return for the HFRI Fund of Funds Composite Index, which is the Portfolio’s secondary benchmark, underperformed the –1.19% return of the IQ Hedge Multi-Strategy Index (“Underlying Index”), which is the Portfolio’s underlying index, and outperformed the –5.36% return of the Morningstar Multialternative Category Average.1
During the reporting period, were there any market events that materially impacted the Portfolio’s performance or liquidity?
The COVID-19 pandemic and related economic shutdowns had a material impact on the economy, the capital markets and subsequently the Portfolio. Among the Portfolio’s long positions, volatility and bonds provided positive returns, while commodities, equity and currency proved negative. The total return for short positions was negative for real estate.
Markets largely ignored the pandemic in January and February 2020. However, the economic effects began to become clearer in early March, when we saw a rapid and sharp rotation out of risky assets, such as equities and corporate bonds, into less risky assets, such as U.S. Treasury bills and the U.S. dollar. Risk premiums widened dramatically as investors sought safety.
The sell-off continued until late March when the U.S. federal government introduced a massive fiscal stimulus package to blunt some of the negative economic impact of the shutdowns. At the same time, the U.S. Federal Reserve (“Fed”) announced a series of monetary steps to stabilize the capital markets, including dropping interest rates to near zero and bond and bond exchange-traded fund (“ETF”) purchases to address liquidity concerns in the corporate bond market. Capital markets began to recover with the federal government and the Fed providing much-needed liquidity. Equity markets rose sharply and credit conditions improved dramatically. The economy continued to struggle to recover from the impact of the shutdowns through the end of the reporting period, but started to show signs of improvement. However, this improvement appeared tenuous as states that had
reopened earlier showed increasing COVID-19 infection rates threatening the fragile recovery.
What factors affected the Portfolio’s relative performance during the reporting period?
Although the Portfolio’s asset allocation mix was similar to that of the S&P Balanced Equity and Bond-Conservative Index, which allocates 75% to U.S. Treasury bonds and 25% to U.S. equities, the Portfolio was more exposed to credit-related bonds among its fixed-income holdings, which detracted from the Portfolio’s relative performance. Relative performance also suffered due to the Portfolio’s additional geographic risk among equity holdings, which included international and emerging-market equities that underperformed the U.S. equity market.
During the reporting period, how did the Portfolio’s performance correlate with traditional equity and fixed-income indices?
During the reporting period, the Portfolio maintained a higher correlation to traditional equity indices and a lower correlation to investment-grade fixed-income indices. The Portfolio’s correlation to the S&P 500® Index2 was approximately 87%. The Portfolio’s correlation to the Bloomberg Barclays U.S. Aggregate Bond Index3 was approximately 7%.
During the reporting period, how did the Portfolio’s volatility compare to that of traditional fixed-income indices?
During the reporting period, the annualized daily volatility of the Portfolio was 13.5%, which compared to a volatility of 6.16% for the Bloomberg Barclays U.S. Aggregate Bond Index.
How did you allocate the Portfolio’s assets among each of the strategies during the reporting period and why?
The Portfolio’s allocations are driven by the weightings of the component securities in the Underlying Index, which uses quantitative models to determine the weights across the various hedge fund investment styles represented in the Underlying Index as well as the weights of the assets within these styles. Given the rules-based nature of the process, there is no subjectivity involved in the allocation decision process.
| 1. | See page 5 for more information on benchmark and peer group returns. |
| 2. | “S&P 500®” is a trademark of The McGraw-Hill Companies, Inc. The S&P 500® Index is widely regarded as the standard index for measuring large-cap U.S. stock market performance. Results assume reinvestment of all dividends and capital gains. An investment cannot be made directly in an index. |
| 3. | The Bloomberg Barclays U.S. Aggregate Bond Index is a broad-based benchmark that measures the investment grade, U.S. dollar-denominated, fixed-rate taxable bond market, including Treasuries, government-related and corporate securities, mortgage-backed securities (agency fixed-rate and hybrid adjustable rate mortgage passthroughs), asset-backed securities and commercial mortgage-backed securities. Results assume reinvestment of all dividends and capital gains. An investment cannot be made directly in an index. |
| | |
| 8 | | MainStay VP IQ Hedge Multi-Strategy Portfolio |
How did the tactical allocation among the hedge fund investment styles affect the Portfolio’s performance during the reporting period?
The Portfolio allocates its assets among six underlying hedge fund investment styles: emerging-markets, long/short, market neutral, event-driven, fixed-income arbitrage, and global macro. During the reporting period, the Portfolio maintained gross exposure ranging from 100% to 120% due to periodic short allocations to event-driven and global macro strategies for several months.
The aggregate performance of the weighted Underlying Index versus an equal-weighted allocation of the same strategy components indicates that the Portfolio experienced a negative allocation effect attributable to weighting changes during the reporting period, particularly among event-driven strategies that saw a sharp sell-off followed by an almost equally dramatic recovery. The Portfolio’s ability to replicate broad hedge funds added value, as measured between the equal-weighted strategy index and the equal-weighted hedge fund strategy indexes.
During the reporting period, how did each investment style either contribute to or detract from the Portfolio’s absolute performance?
During the reporting period, contributions from the Portfolio’s equity long/short, market neutral and global macro strategies generated over 100% of the Portfolio’s overall absolute
performance. (Contributions take weightings and total returns into account.) The Portfolio’s event-driven strategy was the largest detractor from absolute performance.
How did the Portfolio’s investment style weightings change during the reporting period?
The Portfolio’s allocation to its market neutral and fixed-income arbitrage investment styles remained relatively constant throughout the reporting period, with each strategy generally staying above 25%. The Portfolio’s allocation to its emerging-market investment style also remained relatively steady, hovering in the mid-teens for much of the same period.
The Portfolio’s other allocations experienced more significant changes during the reporting period. Its event-driven allocation stood at over 25% in January 2020, but dropped to a negative allocation following the challenging developments that occurred in March. The allocation turned positive again in May although it stayed below 10%. The Portfolio’s allocation to its global macro investment style turned positive early in the reporting period although it decreased from 18% down to 5% in the second part of the same period. Finally, the Portfolio’s allocation to its long/short investment style stood at 19% in January and decreased over the next several months as equity risk rose. The allocation jumped in April to 25% then began to decrease again over the second quarter of the year.
The opinions expressed are those of the portfolio managers as of the date of this report and are subject to change. There is no guarantee that any forecasts will come to pass. This material does not constitute investment advice and is not intended as an endorsement of any specific investment.
Not all MainStay VP Portfolios and/or share classes are available under all policies.
Portfolio of Investments June 30, 2020 (Unaudited)
| | | | | | | | |
| | |
Shares | | |
Value | |
Exchange-Traded Funds 94.1%† Bonds 74.9% | |
Bank Loan Funds 14.6% | |
Invesco Senior Loan ETF (a) | | | 1,832,608 | | | $ | 39,126,181 | |
SPDR Blackstone / GSO Senior Loan ETF (a) | | | 321,130 | | | | 13,930,619 | |
| | | | | | | | |
| | | | | | | 53,056,800 | |
| | | | | | | | |
Emerging Bonds—Local Currency Funds 3.0% | |
SPDR Bloomberg Barclays Convertible Securities ETF (a) | | | 116,819 | | | | 7,067,550 | |
SPDR Bloomberg Barclays Emerging Markets Local Bond ETF (a) | | | 30,490 | | | | 799,143 | |
VanEck Vectors J.P. Morgan EM Local Currency Bond ETF | | | 94,924 | | | | 2,917,964 | |
WisdomTree Emerging Markets Local Debt Fund (a) | | | 3,865 | | | | 123,409 | |
| | | | | | | | |
| | | | | | | 10,908,066 | |
| | | | | | | | |
Emerging Bonds—USD Funds 1.5% | |
iShares JP Morgan USD Emerging Markets Bond ETF | | | 44,861 | | | | 4,899,719 | |
Vanguard Emerging Markets Government Bond ETF | | | 7,253 | | | | 563,993 | |
| | | | | | | | |
| | | | | | | 5,463,712 | |
| | | | | | | | |
Floating Rate—Investment Grade Funds 1.5% | |
iShares Floating Rate Bond ETF (a) | | | 77,762 | | | | 3,933,980 | |
SPDR Bloomberg Barclays Investment Grade Floating Rate ETF (a) | | | 54,967 | | | | 1,675,394 | |
| | | | | | | | |
| | | | | | | 5,609,374 | |
| | | | | | | | |
High Yield Corporate Bond Funds 3.5% | |
iShares 0-5 Year High Yield Corporate Bond ETF | | | 159,985 | | | | 6,861,756 | |
SPDR Bloomberg Barclays Short Term High Yield Bond ETF | | | 227,409 | | | | 5,730,707 | |
| | | | | | | | |
| | | | | | | 12,592,463 | |
| | | | | | | | |
Investment Grade Corporate Bond Funds 10.3% | |
iShares Broad USD Investment Grade Corporate Bond ETF | | | 22,015 | | | | 1,330,146 | |
iShares iBoxx $ Investment Grade Corporate Bond ETF | | | 110,675 | | | | 14,885,788 | |
SPDR Portfolio Short Term Corporate Bond ETF | | | 76,413 | | | | 2,394,784 | |
Vanguard Intermediate-Term Corporate Bond ETF | | | 93,431 | | | | 8,889,025 | |
Vanguard Short-Term Corporate Bond ETF | | | 119,241 | | | | 9,856,461 | |
| | | | | | | | |
| | | | | | | 37,356,204 | |
| | | | | | | | |
Mortgage-Backed Security Funds 5.4% | |
iShares MBS ETF | | | 114,858 | | | | 12,714,780 | |
Vanguard Mortgage-Backed Securities ETF | | | 123,194 | | | | 6,698,058 | |
| | | | | | | | |
| | | | | | | 19,412,838 | |
| | | | | | | | |
U.S. Medium Term Treasury Bond Funds 4.1% | |
iShares 3-7 Year Treasury Bond ETF (a) | | | 57,791 | | | | 7,724,923 | |
| | | | | | | | |
| | |
Shares | | |
Value | |
U.S. Medium Term Treasury Bond Funds (continued) | |
Schwab Intermediate-Term U.S. Treasury ETF | | | 57,156 | | | $ | 3,359,629 | |
Vanguard Intermediate-Term Treasury ETF | | | 56,117 | | | | 3,960,177 | |
| | | | | | | | |
| | | | | | | 15,044,729 | |
| | | | | | | | |
U.S. Ultra Short Term Bond Funds 31.0% | |
Goldman Sachs Access Treasury 0-1 Year ETF | | | 215,767 | | | | 21,682,426 | |
IQ Ultra Short Duration ETF | | | 624,540 | | | | 30,914,730 | |
Invesco Treasury Collateral ETF | | | 205,756 | | | | 21,768,985 | |
iShares Short Treasury Bond ETF | | | 202,692 | | | | 22,446,112 | |
SPDR Bloomberg Barclays 1-3 Month T-Bill ETF | | | 170,962 | | | | 15,648,152 | |
| | | | | | | | |
| | | | | | | 112,460,405 | |
| | | | | | | | |
Total Bonds
(Cost $269,044,252) | | | | | | | 271,904,591 | |
| | | | | | | | |
|
| Equities 19.2% | |
Asia Pacific Equity Funds 0.6% | |
iShares Core MSCI Pacific ETF | | | 9,415 | | | | 496,170 | |
Vanguard FTSE Pacific ETF (a) | | | 27,689 | | | | 1,762,405 | |
| | | | | | | | |
| | | | | | | 2,258,575 | |
| | | | | | | | |
BRIC Equity Funds 1.3% | |
iShares China Large-Cap ETF (a) | | | 35,820 | | | | 1,422,054 | |
iShares MSCI China ETF | | | 39,739 | | | | 2,600,918 | |
SPDR S&P China ETF | | | 5,583 | | | | 585,768 | |
| | | | | | | | |
| | | | | | | 4,608,740 | |
| | | | | | | | |
Broad Fund 0.7% | |
FlexShares Global Upstream Natural Resources Index Fund | | | 87,589 | | | | 2,420,960 | |
| | | | | | | | |
|
Emerging Equity Funds 0.6% | |
iShares Core MSCI Emerging Markets ETF | | | 22,458 | | | | 1,069,001 | |
Vanguard FTSE Emerging Markets ETF | | | 30,355 | | | | 1,202,361 | |
| | | | | | | | |
| | | | | | | 2,271,362 | |
| | | | | | | | |
Emerging Small Cap Equity Fund 1.1% | |
SPDR S&P Emerging Markets Small Cap ETF (a) | | | 101,296 | | | | 4,135,916 | |
| | | | | | | | |
|
Europe Equity Funds 3.6% | |
iShares Core MSCI Europe ETF (a) | | | 69,394 | | | | 2,967,287 | |
Vanguard FTSE Europe ETF (a) | | | 196,405 | | | | 9,885,064 | |
| | | | | | | | |
| | | | | | | 12,852,351 | |
| | | | | | | | |
International Equity Core Funds 2.8% | |
iShares Core MSCI EAFE ETF | | | 84,938 | | | | 4,855,056 | |
Vanguard FTSE Developed Markets ETF | | | 135,479 | | | | 5,255,231 | |
| | | | | | | | |
| | | | | | | 10,110,287 | |
| | | | | | | | |
International Large Cap Growth Fund 0.2% | |
iShares MSCI EAFE Growth ETF (a) | | | 10,394 | | | | 863,845 | |
| | | | | | | | |
| | | | |
| 10 | | MainStay VP IQ Hedge Multi-Strategy Portfolio | | The notes to the financial statements are an integral part of,
and should be read in conjunction with, the financial statements. |
| | | | | | | | |
| | |
Shares | | |
Value | |
| Equities (continued) | |
International Small Cap Equity Funds 3.5% | |
Schwab International Small-Cap Equity ETF (a) | | | 136,858 | | | $ | 4,046,891 | |
Vanguard FTSE All World ex-U.S. Small-Cap ETF (a) | | | 88,298 | | | | 8,531,353 | |
| | | | | | | | |
| | | | | | | 12,578,244 | |
| | | | | | | | |
Japan Equity Fund 0.8% | |
Xtrackers MSCI Japan Hedged Equity ETF | | | 78,275 | | | | 3,028,460 | |
| | | | | | | | |
|
U.S. Large Cap Core Funds 1.2% | |
Energy Select Sector SPDR Fund | | | 27,672 | | | | 1,047,385 | |
Financial Select Sector SPDR Fund | | | 102,403 | | | | 2,369,605 | |
Health Care Select Sector SPDR Fund (a) | | | 4,447 | | | | 445,011 | |
Technology Select Sector SPDR Fund | | | 5,242 | | | | 547,737 | |
| | | | | | | | |
| | | | | | | 4,409,738 | |
| | | | | | | | |
U.S. Small Cap Growth Funds 2.8% | |
iShares Russell 2000 Growth ETF (a) | | | 18,331 | | | | 3,792,134 | |
iShares S&P Small-Cap 600 Growth ETF (a) | | | 10,994 | | | | 1,866,671 | |
Vanguard Small-Cap Growth ETF (a) | | | 22,695 | | | | 4,529,922 | |
| | | | | | | | |
| | | | | | | 10,188,727 | |
| | | | | | | | |
Total Equities
(Cost $66,274,644) | | | | | | | 69,727,205 | |
| | | | | | | | |
Total Exchange-Traded Funds
(Cost $335,318,896) | | | | | | | 341,631,796 | |
| | | | | | | | |
|
| Exchange-Traded Note 0.3% | |
Volatility 0.3% | |
iPath Series B S&P 500 VIX Short-Term Futures ETN (a)(b) | | | 29,706 | | | | 1,008,519 | |
| | | | | | | | |
Total Exchange-Traded Note
(Cost $617,321) | | | | | | | 1,008,519 | |
| | | | | | | | |
|
| Exchange-Traded Vehicles 4.3% | |
Commodities 1.0% | |
Gold Funds 0.8% | |
Aberdeen Standard Physical Gold Shares ETF (b) | | | 11,446 | | | | 196,184 | |
Graniteshares Gold Trust (b) | | | 5,209 | | | | 92,408 | |
iShares Gold Trust (b) | | | 137,856 | | | | 2,342,174 | |
SPDR Gold MiniShares Trust (a)(b) | | | 11,678 | | | | 207,401 | |
| | | | | | | | |
| | | | | | | 2,838,167 | |
| | | | | | | | |
Silver Fund 0.2% | |
iShares Silver Trust (b) | | | 36,911 | | | | 627,856 | |
| | | | | | | | |
Total Commodities
(Cost $3,162,447) | | | | | | | 3,466,023 | |
| | | | | | | | |
| | | | | | | | |
| | |
Shares | | |
Value | |
Currencies 3.3% | |
British Pound Fund 0.8% | |
Invesco CurrencyShares British Pound Sterling Trust (b) | | | 22,582 | | | $ | 2,709,388 | |
| | | | | | | | |
|
Euro Fund 2.3% | |
Invesco CurrencyShares Euro Trust (b) | | | 80,020 | | | | 8,481,320 | |
| | | | | | | | |
|
US Dollar Fund 0.2% | |
Invesco DB U.S. Dollar Index Bullish Fund (a) | | | 33,464 | | | | 880,772 | |
| | | | | | | | |
Total Currencies
(Cost $12,027,590) | | | | | | | 12,071,480 | |
| | | | | | | | |
Total Exchange-Traded Vehicles (Cost $15,190,037) | | | | | | | 15,537,503 | |
| | | | | | | | |
|
| Short-Term Investments 18.2% | |
Affiliated Investment Company 1.3% | |
MainStay U.S. Government Liquidity Fund, 0.05% (c) | | | 4,776,540 | | | | 4,776,540 | |
| | | | | | | | |
|
Unaffiliated Investment Company 16.9% | |
State Street Navigator Securities Lending Government Money Market Portfolio, 0.13% (c)(d) | | | 61,239,996 | | | | 61,239,996 | |
| | | | | | | | |
Total Short-Term Investments
(Cost $66,016,536) | | | | | | | 66,016,536 | |
| | | | | | | | |
Total Investments
(Cost $417,142,790) | | | 116.9 | % | | | 424,194,354 | |
Other Assets, Less Liabilities | | | (16.9 | ) | | | (61,412,847 | ) |
Net Assets | | | 100.0 | % | | $ | 362,781,507 | |
| † | Percentages indicated are based on Portfolio net assets. |
| (a) | All or a portion of this security was held on loan. As of June 30, 2020, the aggregate market value of securities on loan was $75,276,164; the total market value of collateral held by the Portfolio was $76,870,296. The market value of the collateral held included non-cash collateral in the form of U.S. Treasury securities with a value of $15,630,300 (See Note 2(K)). |
| (b) | Non-income producing security. |
| (c) | Current yield as of June 30, 2020. |
| (d) | Represents a security purchased with cash collateral received for securities on loan. |
| | | | | | |
The notes to the financial statements are an integral part of,
and should be read in conjunction with, the financial statements. | | | | | 11 | |
Portfolio of Investments June 30, 2020 (Unaudited) (continued)
Swap Contracts
Open OTC total return equity swap contracts as of June 30, 2020 were as follows1:
| | | | | | | | | | | | | | | | | | | | |
Swap Counterparty | | Reference Obligation | | Floating Rate2 | | Termination
Date(s) | | | Payment
Frequency
Paid/
Received | | | Notional
Amount
Long/
(Short)
(000)* | | | Unrealized
Appreciation3 | |
| | | | | | |
Bank of America Merrill Lynch | | Aberdeen Standard Physical Gold Shares ETF | | 1 month LIBOR plus 0.50% | | | 10/04/2021 | | | | Monthly | | | $ | 10 | | | $ | — | |
Morgan Stanley & Co. | | Aberdeen Standard Physical Gold Shares ETF | | Federal Fund Rate plus 0.50% | | | 9/15/2020 | | | | Monthly | | | | 10 | | | | — | |
Bank of America Merrill Lynch | | Consumer Discretionary Select Sector SPDR Fund | | 1 month LIBOR | | | 10/04/2021 | | | | Monthly | | | | (408 | ) | | | — | |
Morgan Stanley & Co. | | Consumer Discretionary Select Sector SPDR Fund | | Federal Fund Rate minus 0.05% | | | 9/15/2020 | | | | Monthly | | | | (408 | ) | | | — | |
Bank of America Merrill Lynch | | Energy Select Sector SPDR Fund | | 1 month LIBOR plus 0.50% | | | 10/04/2021 | | | | Monthly | | | | 54 | | | | — | |
Morgan Stanley & Co. | | Energy Select Sector SPDR Fund | | Federal Fund Rate plus 0.50% | | | 9/15/2020 | | | | Monthly | | | | 54 | | | | — | |
Bank of America Merrill Lynch | | Financial Select Sector SPDR Fund | | 1 month LIBOR plus 0.50% | | | 10/04/2021 | | | | Monthly | | | | 124 | | | | — | |
Morgan Stanley & Co. | | Financial Select Sector SPDR Fund | | Federal Fund Rate plus 0.50% | | | 9/15/2020 | | | | Monthly | | | | 124 | | | | — | |
Bank of America Merrill Lynch | | Flexshares Global Upstream | | 1 month LIBOR plus 0.50% | | | 10/04/2021 | | | | Monthly | | | | 119 | | | | — | |
Morgan Stanley & Co. | | Flexshares Global Upstream | | Federal Fund Rate plus 0.50% | | | 9/15/2020 | | | | Monthly | | | | 119 | | | | — | |
Bank of America Merrill Lynch | | Goldman Sachs Access Treasury 0-1 Year ETF | | 1 month LIBOR plus 0.50% | | | 10/04/2021 | | | | Monthly | | | | 1,088 | | | | — | |
Morgan Stanley & Co. | | Goldman Sachs Access Treasury 0-1 Year ETF | | Federal Fund Rate plus 0.50% | | | 9/15/2020 | | | | Monthly | | | | 1,088 | | | | — | |
Bank of America Merrill Lynch | | Graniteshares Gold Trust | | 1 month LIBOR plus 0.50% | | | 10/04/2021 | | | | Monthly | | | | 4 | | | | — | |
Morgan Stanley & Co. | | Graniteshares Gold Trust | | Federal Fund Rate plus 0.50% | | | 9/15/2020 | | | | Monthly | | | | 4 | | | | — | |
Bank of America Merrill Lynch | | Health Care Select Sector SPDR Fund | | 1 month LIBOR plus 0.50% | | | 10/04/2021 | | | | Monthly | | | | 23 | | | | — | |
Morgan Stanley & Co. | | Health Care Select Sector SPDR Fund | | Federal Fund Rate plus 0.50% | | | 9/15/2020 | | | | Monthly | | | | 23 | | | | — | |
Bank of America Merrill Lynch | | Invesco CurrencyShares Australian Dollar Trust | | 1 month LIBOR | | | 10/04/2021 | | | | Monthly | | | | (1,233 | ) | | | — | |
Morgan Stanley & Co. | | Invesco CurrencyShares Australian Dollar Trust | | Federal Fund Rate minus 5.38% | | | 9/15/2020 | | | | Monthly | | | | (116 | ) | | | — | |
Bank of America Merrill Lynch | | Invesco CurrencyShares British Pound Sterling Trust | | 1 month LIBOR plus 0.50% | | | 10/04/2021 | | | | Monthly | | | | 138 | | | | — | |
Morgan Stanley & Co. | | Invesco CurrencyShares British Pound Sterling Trust | | Federal Fund Rate plus 0.50% | | | 9/15/2020 | | | | Monthly | | | | 138 | | | | — | |
Bank of America Merrill Lynch | | Invesco CurrencyShares Euro Currency Trust | | 1 month LIBOR plus 0.50% | | | 10/04/2021 | | | | Monthly | | | | 421 | | | | — | |
Morgan Stanley & Co. | | Invesco CurrencyShares Euro Currency Trust | | Federal Fund Rate plus 0.50% | | | 9/15/2020 | | | | Monthly | | | | 421 | | | | — | |
Bank of America Merrill Lynch | | Invesco DB US Dollar Index Bullish Fund | | 1 month LIBOR plus 0.50% | | | 10/04/2021 | | | | Monthly | | | | 45 | | | | — | |
Morgan Stanley & Co. | | Invesco DB US Dollar Index Bullish Fund | | Federal Fund Rate plus 0.50% | | | 9/15/2020 | | | | Monthly | | | | 45 | | | | — | |
Bank of America Merrill Lynch | | Invesco KBW Bank ETF | | 1 month LIBOR | | | 10/04/2021 | | | | Monthly | | | | (32 | ) | | | — | |
Morgan Stanley & Co. | | Invesco KBW Bank ETF | | Federal Fund Rate minus 2.08% | | | 9/15/2020 | | | | Monthly | | | | (32 | ) | | | — | |
Bank of America Merrill Lynch | | Invesco Preferred ETF | | 1 month LIBOR | | | 10/04/2021 | | | | Monthly | | | | (287 | ) | | | — | |
Morgan Stanley & Co. | | Invesco Preferred ETF | | Federal Fund Rate minus 1.48% | | | 9/15/2020 | | | | Monthly | | | | (287 | ) | | | — | |
Bank of America Merrill Lynch | | Invesco S&P 500 Low Volatility | | 1 month LIBOR | | | 10/04/2021 | | | | Monthly | | | | (566 | ) | | | — | |
Morgan Stanley & Co. | | Invesco S&P 500 Low Volatility | | Federal Fund Rate minus 1.53% | | | 9/15/2020 | | | | Monthly | | | | (566 | ) | | | — | |
| | | | |
| 12 | | MainStay VP IQ Hedge Multi-Strategy Portfolio | | The notes to the financial statements are an integral part of,
and should be read in conjunction with, the financial statements. |
| | | | | | | | | | | | | | | | | | | | |
Swap Counterparty | | Reference Obligation | | Floating Rate2 | | Termination
Date(s) | | | Payment
Frequency
Paid/
Received | | | Notional
Amount
Long/
(Short)
(000)* | | | Unrealized
Appreciation3 | |
Bank of America Merrill Lynch | | Invesco Senior Loan ETF | | 1 month LIBOR plus 0.50% | | | 10/04/2021 | | | | Monthly | | | $ | 1,971 | | | $ | — | |
Morgan Stanley & Co. | | Invesco Senior Loan ETF | | Federal Fund Rate plus 0.50% | | | 9/15/2020 | | | | Monthly | | | | 1,971 | | | | — | |
Bank of America Merrill Lynch | | Invesco Treasury Collateral ETF | | 1 month LIBOR plus 0.50% | | | 10/04/2021 | | | | Monthly | | | | 1,093 | | | | — | |
Morgan Stanley & Co. | | Invesco Treasury Collateral ETF | | Federal Fund Rate plus 0.50% | | | 9/15/2020 | | | | Monthly | | | | 1,093 | | | | — | |
Bank of America Merrill Lynch | | iPath Series B S&P 500 VIX Short-Term Futures ETN | | 1 month LIBOR plus 0.50% | | | 10/04/2021 | | | | Monthly | | | | 49 | | | | — | |
Morgan Stanley & Co. | | iPath Series B S&P 500 VIX Short-Term Futures ETN | | Federal Fund Rate plus 0.50% | | | 9/15/2020 | | | | Monthly | | | | 49 | | | | — | |
Bank of America Merrill Lynch | | IQ Ultra Short Duration ETF | | 1 month LIBOR plus 0.50% | | | 10/04/2021 | | | | Monthly | | | | 1,544 | | | | — | |
Morgan Stanley & Co. | | IQ Ultra Short Duration ETF | | Federal Fund Rate plus 0.50% | | | 9/15/2020 | | | | Monthly | | | | 1,544 | | | | — | |
Bank of America Merrill Lynch | | iShares 0-5 Year High Yield Corporate Bond ETF | | 1 month LIBOR plus 0.50% | | | 10/04/2021 | | | | Monthly | | | | 345 | | | | — | |
Morgan Stanley & Co. | | iShares 0-5 Year High Yield Corporate Bond ETF | | Federal Fund Rate plus 0.50% | | | 9/15/2020 | | | | Monthly | | | | 345 | | | | — | |
Bank of America Merrill Lynch | | iShares 20+ Year Treasury Bond ETF | | 1 month LIBOR | | | 10/04/2021 | | | | Monthly | | | | (40 | ) | | | — | |
Morgan Stanley & Co. | | iShares 20+ Year Treasury Bond ETF | | Federal Fund Rate minus 0.35% | | | 9/15/2020 | | | | Monthly | | | | (40 | ) | | | — | |
Bank of America Merrill Lynch | | iShares 3-7 Year Treasury Bond ETF | | 1 month LIBOR plus 0.50% | | | 10/04/2021 | | | | Monthly | | | | 386 | | | | — | |
Morgan Stanley & Co. | | iShares 3-7 Year Treasury Bond ETF | | Federal Fund Rate plus 0.50% | | | 9/15/2020 | | | | Monthly | | | | 386 | | | | — | |
Bank of America Merrill Lynch | | iShares Broad USD Investment Grade Corporate Bond ETF | | 1 month LIBOR plus 0.50% | | | 10/04/2021 | | | | Monthly | | | | 65 | | | | — | |
Morgan Stanley & Co. | | iShares Broad USD Investment Grade Corporate Bond ETF | | Federal Fund Rate plus 0.50% | | | 9/15/2020 | | | | Monthly | | | | 65 | | | | — | |
Bank of America Merrill Lynch | | iShares China Large-Cap ETF | | 1 month LIBOR plus 0.50% | | | 10/04/2021 | | | | Monthly | | | | 70 | | | | — | |
Morgan Stanley & Co. | | iShares China Large-Cap ETF | | Federal Fund Rate plus 0.50% | | | 9/15/2020 | | | | Monthly | | | | 70 | | | | — | |
Bank of America Merrill Lynch | | iShares Core MSCI EAFE ETF | | 1 month LIBOR plus 0.50% | | | 10/04/2021 | | | | Monthly | | | | 244 | | | | — | |
Morgan Stanley & Co. | | iShares Core MSCI EAFE ETF | | Federal Fund Rate plus 0.50% | | | 9/15/2020 | | | | Monthly | | | | 244 | | | | — | |
Bank of America Merrill Lynch | | iShares Core MSCI Emerging Markets ETF | | 1 month LIBOR plus 0.50% | | | 10/04/2021 | | | | Monthly | | | | 51 | | | | — | |
Morgan Stanley & Co. | | iShares Core MSCI Emerging Markets ETF | | Federal Fund Rate plus 0.50% | | | 9/15/2020 | | | | Monthly | | | | 51 | | | | — | |
Bank of America Merrill Lynch | | iShares Core MSCI Europe ETF | | 1 month LIBOR plus 0.50% | | | 10/04/2021 | | | | Monthly | | | | 145 | | | | — | |
Morgan Stanley & Co. | | iShares Core MSCI Europe ETF | | Federal Fund Rate plus 0.50% | | | 9/15/2020 | | | | Monthly | | | | 145 | | | | — | |
Bank of America Merrill Lynch | | iShares Core MSCI Pacific ETF | | 1 month LIBOR plus 0.50% | | | 10/04/2021 | | | | Monthly | | | | 25 | | | | — | |
Morgan Stanley & Co. | | iShares Core MSCI Pacific ETF | | Federal Fund Rate plus 0.50% | | | 9/15/2020 | | | | Monthly | | | | 25 | | | | — | |
Bank of America Merrill Lynch | | iShares Core S&P U.S. Growth ETF | | 1 month LIBOR | | | 10/04/2021 | | | | Monthly | | | | (103 | ) | | | — | |
Morgan Stanley & Co. | | iShares Core S&P U.S. Growth ETF | | Federal Fund Rate minus 6.43% | | | 9/15/2020 | | | | Monthly | | | | (103 | ) | | | — | |
Bank of America Merrill Lynch | | iShares Core S&P U.S. Value ETF | | 1 month LIBOR | | | 10/04/2021 | | | | Monthly | | | | (249 | ) | | | — | |
Morgan Stanley & Co. | | iShares Core S&P U.S. Value ETF | | Federal Fund Rate minus 3.38% | | | 9/15/2020 | | | | Monthly | | | | (249 | ) | | | — | |
Bank of America Merrill Lynch | | iShares Core US REIT ETF | | 1 month LIBOR | | | 10/04/2021 | | | | Monthly | | | | (190 | ) | | | — | |
Morgan Stanley & Co. | | iShares Core US REIT ETF | | Federal Fund Rate minus 3.13% | | | 9/15/2020 | | | | Monthly | | | | (190 | ) | | | — | |
Bank of America Merrill Lynch | | iShares Edge MSCI Min Vol Emerging Markets ETF | | 1 month LIBOR | | | 10/04/2021 | | | | Monthly | | | | (277 | ) | | | — | |
Morgan Stanley & Co. | | iShares Edge MSCI Min Vol Emerging Markets ETF | | Federal Fund Rate minus 0.35% | | | 9/15/2020 | | | | Monthly | | | | (277 | ) | | | — | |
Bank of America Merrill Lynch | | iShares Edge MSCI Min Vol USA ETF | | 1 month LIBOR | | | 10/04/2021 | | | | Monthly | | | | (2,214 | ) | | | — | |
| | | | | | |
The notes to the financial statements are an integral part of,
and should be read in conjunction with, the financial statements. | | | | | 13 | |
Portfolio of Investments June 30, 2020 (Unaudited) (continued)
| | | | | | | | | | | | | | | | | | | | |
Swap Counterparty | | Reference Obligation | | Floating Rate2 | | Termination
Date(s) | | | Payment
Frequency
Paid/
Received | | | Notional
Amount
Long/
(Short)
(000)* | | | Unrealized
Appreciation3 | |
Morgan Stanley & Co. | | iShares Edge MSCI Min Vol USA ETF | | Federal Fund Rate minus 0.35% | | | 9/15/2020 | | | | Monthly | | | $ | (2,214 | ) | | $ | — | |
Bank of America Merrill Lynch | | iShares Edge MSCI USA Momentum Factor ETF | | 1 month LIBOR | | | 10/04/2021 | | | | Monthly | | | | (215 | ) | | | — | |
Morgan Stanley & Co. | | iShares Edge MSCI USA Momentum Factor ETF | | Federal Fund Rate minus 0.78% | | | 9/15/2020 | | | | Monthly | | | | (215 | ) | | | — | |
Bank of America Merrill Lynch | | iShares Floating Rate Bond ETF | | 1 month LIBOR plus 0.50% | | | 10/04/2021 | | | | Monthly | | | | 196 | | | | — | |
Morgan Stanley & Co. | | iShares Floating Rate Bond ETF | | Federal Fund Rate plus 0.50% | | | 9/15/2020 | | | | Monthly | | | | 196 | | | | — | |
Bank of America Merrill Lynch | | iShares Gold Trust | | 1 month LIBOR plus 0.50% | | | 10/04/2021 | | | | Monthly | | | | 114 | | | | — | |
Morgan Stanley & Co. | | iShares Gold Trust | | Federal Fund Rate plus 0.50% | | | 9/15/2020 | | | | Monthly | | | | 114 | | | | — | |
Bank of America Merrill Lynch | | iShares iBoxx USD Investment Grade Corporate Bond ETF | | 1 month LIBOR plus 0.50% | | | 10/04/2021 | | | | Monthly | | | | 733 | | | | — | |
Morgan Stanley & Co. | | iShares iBoxx USD Investment Grade Corporate Bond ETF | | Federal Fund Rate plus 0.50% | | | 9/15/2020 | | | | Monthly | | | | 733 | | | | — | |
Bank of America Merrill Lynch | | iShares iBoxx High Yield Corporate Bond ETF | | 1 month LIBOR | | | 10/04/2021 | | | | Monthly | | | | (869 | ) | | | — | |
Morgan Stanley & Co. | | iShares iBoxx High Yield Corporate Bond ETF | | Federal Fund Rate minus 0.35% | | | 9/15/2020 | | | | Monthly | | | | (869 | ) | | | — | |
Bank of America Merrill Lynch | | iShares JP Morgan USD Emerging Markets Bond ETF | | 1 month LIBOR plus 0.50% | | | 10/04/2021 | | | | Monthly | | | | 239 | | | | — | |
Morgan Stanley & Co. | | iShares JP Morgan USD Emerging Markets Bond ETF | | Federal Fund Rate plus 0.50% | | | 9/15/2020 | | | | Monthly | | | | 239 | | | | — | |
Bank of America Merrill Lynch | | iShares MBS ETF | | 1 month LIBOR plus 0.50% | | | 10/04/2021 | | | | Monthly | | | | 640 | | | | — | |
Morgan Stanley & Co. | | iShares MBS ETF | | Federal Fund Rate plus 0.50% | | | 9/15/2020 | | | | Monthly | | | | 640 | | | | — | |
Bank of America Merrill Lynch | | iShares MSCI China ETF | | 1 month LIBOR plus 0.50% | | | 10/04/2021 | | | | Monthly | | | | 122 | | | | — | |
Morgan Stanley & Co. | | iShares MSCI China ETF | | Federal Fund Rate plus 0.50% | | | 9/15/2020 | | | | Monthly | | | | 122 | | | | — | |
Bank of America Merrill Lynch | | iShares MSCI EAFE Growth ETF | | 1 month LIBOR plus 0.50% | | | 10/04/2021 | | | | Monthly | | | | 44 | | | | — | |
Morgan Stanley & Co. | | iShares MSCI EAFE Growth ETF | | Federal Fund Rate plus 0.50% | | | 9/15/2020 | | | | Monthly | | | | 44 | | | | — | |
Bank of America Merrill Lynch | | iShares MSCI Japan ETF | | 1 month LIBOR | | | 10/04/2021 | | | | Monthly | | | | (454 | ) | | | — | |
Morgan Stanley & Co. | | iShares MSCI Japan ETF | | Federal Fund Rate minus 0.35% | | | 9/15/2020 | | | | Monthly | | | | (454 | ) | | | — | |
Bank of America Merrill Lynch | | iShares Russell 2000 Growth ETF | | 1 month LIBOR plus 0.50% | | | 10/04/2021 | | | | Monthly | | | | 183 | | | | — | |
Morgan Stanley & Co. | | iShares Russell 2000 Growth ETF | | Federal Fund Rate plus 0.50% | | | 9/15/2020 | | | | Monthly | | | | 183 | | | | — | |
Bank of America Merrill Lynch | | iShares Russell 2000 Value ETF | | 1 month LIBOR | | | 10/04/2021 | | | | Monthly | | | | (668 | ) | | | — | |
Morgan Stanley & Co. | | iShares Russell 2000 Value ETF | | Federal Fund Rate minus 0.35% | | | 9/15/2020 | | | | Monthly | | | | (668 | ) | | | — | |
Bank of America Merrill Lynch | | iShares S&P Small CAP 600 Value ETF | | 1 month LIBOR | | | 10/04/2021 | | | | Monthly | | | | (416 | ) | | | — | |
Morgan Stanley & Co. | | iShares S&P Small CAP 600 Value ETF | | Federal Fund Rate minus 4.53% | | | 9/15/2020 | | | | Monthly | | | | (416 | ) | | | — | |
Bank of America Merrill Lynch | | iShares S&P Small-Cap 600 Growth ETF | | 1 month LIBOR plus 0.50% | | | 10/04/2021 | | | | Monthly | | | | 90 | | | | — | |
Morgan Stanley & Co. | | iShares S&P Small-Cap 600 Growth ETF | | Federal Fund Rate plus 0.50% | | | 9/15/2020 | | | | Monthly | | | | 90 | | | | — | |
Bank of America Merrill Lynch | | iShares Short Treasury Bond ETF | | 1 month LIBOR plus 0.50% | | | 10/04/2021 | | | | Monthly | | | | 1,126 | | | | — | |
Morgan Stanley & Co. | | iShares Short Treasury Bond ETF | | Federal Fund Rate plus 0.50% | | | 9/15/2020 | | | | Monthly | | | | 1,126 | | | | — | |
Bank of America Merrill Lynch | | iShares Silver Trust | | 1 month LIBOR plus 0.50% | | | 10/04/2021 | | | | Monthly | | | | 31 | | | | — | |
Morgan Stanley & Co. | | iShares Silver Trust | | Federal Fund Rate plus 0.50% | | | 9/15/2020 | | | | Monthly | | | | 31 | | | | — | |
Bank of America Merrill Lynch | | iShares TIPS Bond ETF | | 1 month LIBOR | | | 10/04/2021 | | | | Monthly | | | | (1,372 | ) | | | — | |
Morgan Stanley & Co. | | iShares TIPS Bond ETF | | Federal Fund Rate minus 0.35% | | | 9/15/2020 | | | | Monthly | | | | (1,372 | ) | | | — | |
| | | | |
| 14 | | MainStay VP IQ Hedge Multi-Strategy Portfolio | | The notes to the financial statements are an integral part of,
and should be read in conjunction with, the financial statements. |
| | | | | | | | | | | | | | | | | | | | |
Swap Counterparty | | Reference Obligation | | Floating Rate2 | | Termination
Date(s) | | | Payment
Frequency
Paid/
Received | | | Notional
Amount
Long/
(Short)
(000)* | | | Unrealized
Appreciation3 | |
Bank of America Merrill Lynch | | iShares US Preferred Stock ETF | | 1 month LIBOR | | | 10/04/2021 | | | | Monthly | | | $ | (792 | ) | | $ | — | |
Morgan Stanley & Co. | | iShares US Preferred Stock ETF | | Federal Fund Rate minus 0.35% | | | 9/15/2020 | | | | Monthly | | | | (792 | ) | | | — | |
Bank of America Merrill Lynch | | Schwab Intermediate-Term U.S. Treasury ETF | | 1 month LIBOR plus 0.50% | | | 10/04/2021 | | | | Monthly | | | | 168 | | | | — | |
Morgan Stanley & Co. | | Schwab Intermediate-Term U.S. Treasury ETF | | Federal Fund Rate plus 0.50% | | | 9/15/2020 | | | | Monthly | | | | 168 | | | | — | |
Bank of America Merrill Lynch | | Schwab International Small-Cap Equity ETF | | 1 month LIBOR plus 0.50% | | | 10/04/2021 | | | | Monthly | | | | 199 | | | | — | |
Morgan Stanley & Co. | | Schwab International Small-Cap Equity ETF | | Federal Fund Rate plus 0.50% | | | 9/15/2020 | | | | Monthly | | | | 199 | | | | — | |
Bank of America Merrill Lynch | | Schwab U.S. Large Cap Value ETF | | 1 month LIBOR | | | 10/04/2021 | | | | Monthly | | | | (245 | ) | | | — | |
Morgan Stanley & Co. | | Schwab U.S. Large Cap Value ETF | | Federal Fund Rate minus 2.58% | | | 9/15/2020 | | | | Monthly | | | | (245 | ) | | | — | |
Bank of America Merrill Lynch | | Schwab U.S. Large-Cap Growth ETF | | 1 month LIBOR | | | 10/04/2021 | | | | Monthly | | | | (119 | ) | | | — | |
Morgan Stanley & Co. | | Schwab U.S. Large-Cap Growth ETF | | Federal Fund Rate minus 4.18% | | | 9/15/2020 | | | | Monthly | | | | (119 | ) | | | — | |
Bank of America Merrill Lynch | | Schwab U.S. REIT ETF | | 1 month LIBOR | | | 10/04/2021 | | | | Monthly | | | | (678 | ) | | | — | |
Morgan Stanley & Co. | | Schwab U.S. REIT ETF | | Federal Fund Rate minus 1.50% | | | 9/15/2020 | | | | Monthly | | | | (678 | ) | | | — | |
Bank of America Merrill Lynch | | SPDR Blackstone / GSO Senior Loan ETF | | 1 month LIBOR plus 0.50% | | | 10/04/2021 | | | | Monthly | | | | 696 | | | | — | |
Morgan Stanley & Co. | | SPDR Blackstone / GSO Senior Loan ETF | | Federal Fund Rate plus 0.50% | | | 9/15/2020 | | | | Monthly | | | | 696 | | | | — | |
Bank of America Merrill Lynch | | SPDR Bloomberg Barclays 1-3 Month T-Bill ETF | | 1 month LIBOR plus 0.50% | | | 10/04/2021 | | | | Monthly | | | | 785 | | | | — | |
Morgan Stanley & Co. | | SPDR Bloomberg Barclays 1-3 Month T-Bill ETF | | Federal Fund Rate plus 0.50% | | | 9/15/2020 | | | | Monthly | | | | 785 | | | | — | |
Bank of America Merrill Lynch | | SPDR Bloomberg Barclays Convertible Securities ETF | | 1 month LIBOR plus 0.50% | | | 10/04/2021 | | | | Monthly | | | | 333 | | | | — | |
Morgan Stanley & Co. | | SPDR Bloomberg Barclays Convertible Securities ETF | | Federal Fund Rate plus 0.50% | | | 9/15/2020 | | | | Monthly | | | | 333 | | | | — | |
Bank of America Merrill Lynch | | SPDR Bloomberg Barclays Emerging Markets Local Bond ETF | | 1 month LIBOR plus 0.50% | | | 10/04/2021 | | | | Monthly | | | | 40 | | | | — | |
Morgan Stanley & Co. | | SPDR Bloomberg Barclays Emerging Markets Local Bond ETF | | Federal Fund Rate plus 0.50% | | | 9/15/2020 | | | | Monthly | | | | 40 | | | | — | |
Bank of America Merrill Lynch | | SPDR Bloomberg Barclays High Yield Bond ETF | | 1 month LIBOR | | | 10/04/2021 | | | | Monthly | | | | (422 | ) | | | — | |
Morgan Stanley & Co. | | SPDR Bloomberg Barclays High Yield Bond ETF | | Federal Fund Rate minus 0.35% | | | 9/15/2020 | | | | Monthly | | | | (422 | ) | | | — | |
Bank of America Merrill Lynch | | SPDR Bloomberg Barclays Invest | | 1 month LIBOR plus 0.50% | | | 10/04/2021 | | | | Monthly | | | | 84 | | | | — | |
Morgan Stanley & Co. | | SPDR Bloomberg Barclays Invest | | Federal Fund Rate plus 0.50% | | | 9/15/2020 | | | | Monthly | | | | 84 | | | | — | |
Bank of America Merrill Lynch | | SPDR Bloomberg Barclays Short Term High Yield Bond ETF | | 1 month LIBOR plus 0.50% | | | 10/04/2021 | | | | Monthly | | | | 287 | | | | — | |
Morgan Stanley & Co. | | SPDR Bloomberg Barclays Short Term High Yield Bond ETF | | Federal Fund Rate plus 0.50% | | | 9/15/2020 | | | | Monthly | | | | 287 | | | | — | |
Bank of America Merrill Lynch | | SPDR Dow Jones International Real Estate ETF | | 1 month LIBOR | | | 10/04/2021 | | | | Monthly | | | | (633 | ) | | | — | |
Morgan Stanley & Co. | | SPDR Dow Jones International Real Estate ETF | | Federal Fund Rate minus 1.13% | | | 9/15/2020 | | | | Monthly | | | | (633 | ) | | | — | |
Bank of America Merrill Lynch | | SPDR Gold MiniShares Trust | | 1 month LIBOR plus 0.50% | | | 10/04/2021 | | | | Monthly | | | | 10 | | | | — | |
| | | | | | |
The notes to the financial statements are an integral part of,
and should be read in conjunction with, the financial statements. | | | | | 15 | |
Portfolio of Investments June 30, 2020 (Unaudited) (continued)
| | | | | | | | | | | | | | | | | | | | |
Swap Counterparty | | Reference Obligation | | Floating Rate2 | | Termination
Date(s) | | | Payment
Frequency
Paid/
Received | | | Notional
Amount
Long/
(Short)
(000)* | | | Unrealized
Appreciation3 | |
Morgan Stanley & Co. | | SPDR Gold MiniShares Trust | | Federal Fund Rate plus 0.50% | | | 9/15/2020 | | | | Monthly | | | $ | 10 | | | $ | — | |
Bank of America Merrill Lynch | | SPDR Portfolio Long Term Treasury ETF | | 1 month LIBOR | | | 10/04/2021 | | | | Monthly | | | | (6 | ) | | | — | |
Morgan Stanley & Co. | | SPDR Portfolio Long Term Treasury ETF | | Federal Fund Rate minus 0.68% | | | 9/15/2020 | | | | Monthly | | | | (6 | ) | | | — | |
Bank of America Merrill Lynch | | SPDR Portfolio S&P 500 Growth ETF | | 1 month LIBOR | | | 10/04/2021 | | | | Monthly | | | | (92 | ) | | | — | |
Morgan Stanley & Co. | | SPDR Portfolio S&P 500 Growth ETF | | Federal Fund Rate minus 2.08% | | | 9/15/2020 | | | | Monthly | | | | (92 | ) | | | — | |
Bank of America Merrill Lynch | | SPDR Portfolio S&P 500 Value ETF | | 1 month LIBOR | | | 10/04/2021 | | | | Monthly | | | | (185 | ) | | | — | |
Morgan Stanley & Co. | | SPDR Portfolio S&P 500 Value ETF | | Federal Fund Rate minus 2.48% | | | 9/15/2020 | | | | Monthly | | | | (185 | ) | | | — | |
Bank of America Merrill Lynch | | SPDR Portfolio Short Term Corporate Bond ETF | | 1 month LIBOR plus 0.50% | | | 10/04/2021 | | | | Monthly | | | | 120 | | | | — | |
Morgan Stanley & Co. | | SPDR Portfolio Short Term Corporate Bond ETF | | Federal Fund Rate plus 0.50% | | | 9/15/2020 | | | | Monthly | | | | 120 | | | | — | |
Bank of America Merrill Lynch | | SPDR S&P Bank ETF | | 1 month LIBOR | | | 10/04/2021 | | | | Monthly | | | | (99 | ) | | | — | |
Morgan Stanley & Co. | | SPDR S&P Bank ETF | | Federal Fund Rate minus 0.78% | | | 9/15/2020 | | | | Monthly | | | | (99 | ) | | | — | |
Bank of America Merrill Lynch | | SPDR S&P China ETF | | 1 month LIBOR plus 0.50% | | | 10/04/2021 | | | | Monthly | | | | 27 | | | | — | |
Morgan Stanley & Co. | | SPDR S&P China ETF | | Federal Fund Rate plus 0.50% | | | 9/15/2020 | | | | Monthly | | | | 27 | | | | — | |
Bank of America Merrill Lynch | | SPDR S&P Emerging Markets Small Cap ETF | | 1 month LIBOR plus 0.50% | | | 10/04/2021 | | | | Monthly | | | | 193 | | | | — | |
Morgan Stanley & Co. | | SPDR S&P Emerging Markets Small Cap ETF | | Federal Fund Rate plus 0.50% | | | 9/15/2020 | | | | Monthly | | | | 193 | | | | — | |
Bank of America Merrill Lynch | | Technology Select Sector SPDR Fund | | 1 month LIBOR plus 0.50% | | | 10/04/2021 | | | | Monthly | | | | 26 | | | | — | |
Morgan Stanley & Co. | | Technology Select Sector SPDR Fund | | Federal Fund Rate plus 0.50% | | | 9/15/2020 | | | | Monthly | | | | 26 | | | | — | |
Bank of America Merrill Lynch | | VanEck Vectors High-Yield Municipal Index ETF | | 1 month LIBOR | | | 10/04/2021 | | | | Monthly | | | | (630 | ) | | | — | |
Morgan Stanley & Co. | | VanEck Vectors High-Yield Municipal Index ETF | | Federal Fund Rate minus 2.58% | | | 9/15/2020 | | | | Monthly | | | | (630 | ) | | | — | |
Bank of America Merrill Lynch | | VanEck Vectors J.P. Morgan EM Local Currency Bond ETF | | 1 month LIBOR plus 0.50% | | | 10/04/2021 | | | | Monthly | | | | 147 | | | | — | |
Morgan Stanley & Co. | | VanEck Vectors J.P. Morgan EM Local Currency Bond ETF | | Federal Fund Rate plus 0.50% | | | 9/15/2020 | | | | Monthly | | | | 147 | | | | — | |
Bank of America Merrill Lynch | | Vanguard Emerging Markets Government Bond ETF | | 1 month LIBOR plus 0.50% | | | 10/04/2021 | | | | Monthly | | | | 28 | | | | — | |
Morgan Stanley & Co. | | Vanguard Emerging Markets Government Bond ETF | | Federal Fund Rate plus 0.50% | | | 9/15/2020 | | | | Monthly | | | | 28 | | | | — | |
Bank of America Merrill Lynch | | Vanguard FTSE All World ex-U.S. Small-Cap ETF | | 1 month LIBOR plus 0.50% | | | 10/04/2021 | | | | Monthly | | | | 411 | | | | — | |
Morgan Stanley & Co. | | Vanguard FTSE All World ex-U.S. Small-Cap ETF | | Federal Fund Rate plus 0.50% | | | 9/15/2020 | | | | Monthly | | | | 411 | | | | — | |
Bank of America Merrill Lynch | | Vanguard FTSE Developed Markets ETF | | 1 month LIBOR plus 0.50% | | | 10/04/2021 | | | | Monthly | | | | 261 | | | | — | |
Morgan Stanley & Co. | | Vanguard FTSE Developed Markets ETF | | Federal Fund Rate plus 0.50% | | | 9/15/2020 | | | | Monthly | | | | 261 | | | | — | |
Bank of America Merrill Lynch | | Vanguard FTSE Emerging Markets ETF | | 1 month LIBOR plus 0.50% | | | 10/04/2021 | | | | Monthly | | | | 57 | | | | — | |
Morgan Stanley & Co. | | Vanguard FTSE Emerging Markets ETF | | Federal Fund Rate plus 0.50% | | | 9/15/2020 | | | | Monthly | | | | 57 | | | | — | |
Bank of America Merrill Lynch | | Vanguard FTSE Europe ETF | | 1 month LIBOR plus 0.50% | | | 10/04/2021 | | | | Monthly | | | | 481 | | | | — | |
Morgan Stanley & Co. | | Vanguard FTSE Europe ETF | | Federal Fund Rate plus 0.50% | | | 9/15/2020 | | | | Monthly | | | | 481 | | | | — | |
| | | | |
| 16 | | MainStay VP IQ Hedge Multi-Strategy Portfolio | | The notes to the financial statements are an integral part of,
and should be read in conjunction with, the financial statements. |
| | | | | | | | | | | | | | | | | | | | |
Swap Counterparty | | Reference Obligation | | Floating Rate2 | | Termination
Date(s) | | | Payment
Frequency
Paid/
Received | | | Notional
Amount
Long/
(Short)
(000)* | | | Unrealized
Appreciation3 | |
Bank of America Merrill Lynch | | Vanguard FTSE Pacific ETF | | 1 month LIBOR plus 0.50% | | | 10/04/2021 | | | | Monthly | | | $ | 86 | | | $ | — | |
Morgan Stanley & Co. | | Vanguard FTSE Pacific ETF | | Federal Fund Rate plus 0.50% | | | 9/15/2020 | | | | Monthly | | | | 86 | | | | — | |
Bank of America Merrill Lynch | | Vanguard Growth ETF | | 1 month LIBOR | | | 10/04/2021 | | | | Monthly | | | | (639 | ) | | | — | |
Morgan Stanley & Co. | | Vanguard Growth ETF | | Federal Fund Rate minus 0.83% | | | 9/15/2020 | | | | Monthly | | | | (639 | ) | | | — | |
Bank of America Merrill Lynch | | Vanguard Intermediate-Term Corporate Bond ETF | | 1 month LIBOR plus 0.50% | | | 10/04/2021 | | | | Monthly | | | | 439 | | | | — | |
Morgan Stanley & Co. | | Vanguard Intermediate-Term Corporate Bond ETF | | Federal Fund Rate plus 0.50% | | | 9/15/2020 | | | | Monthly | | | | 439 | | | | — | |
Bank of America Merrill Lynch | | Vanguard Intermediate-Term Treasury ETF | | 1 month LIBOR plus 0.50% | | | 10/04/2021 | | | | Monthly | | | | 198 | | | | — | |
Morgan Stanley & Co. | | Vanguard Intermediate-Term Treasury ETF | | Federal Fund Rate plus 0.50% | | | 9/15/2020 | | | | Monthly | | | | 198 | | | | — | |
Bank of America Merrill Lynch | | Vanguard Long-Term Treasury ETF | | 1 month LIBOR | | | 10/04/2021 | | | | Monthly | | | | (4 | ) | | | — | |
Morgan Stanley & Co. | | Vanguard Long-Term Treasury ETF | | Federal Fund Rate minus 3.33% | | | 9/15/2020 | | | | Monthly | | | | (4 | ) | | | — | |
Bank of America Merrill Lynch | | Vanguard Mortgage-Backed Securities ETF | | 1 month LIBOR plus 0.50% | | | 10/04/2021 | | | | Monthly | | | | 337 | | | | — | |
Morgan Stanley & Co. | | Vanguard Mortgage-Backed Securities ETF | | Federal Fund Rate plus 0.50% | | | 9/15/2020 | | | | Monthly | | | | 337 | | | | — | |
Bank of America Merrill Lynch | | Vanguard Russell 1000 Value ETF | | 1 month LIBOR | | | 10/04/2021 | | | | Monthly | | | | (98 | ) | | | — | |
Morgan Stanley & Co. | | Vanguard Russell 1000 Value ETF | | Federal Fund Rate minus 5.08% | | | 9/15/2020 | | | | Monthly | | | | (98 | ) | | | — | |
Bank of America Merrill Lynch | | Vanguard Russell 1000 Growth ETF | | 1 month LIBOR | | | 10/04/2021 | | | | Monthly | | | | (46 | ) | | | — | |
Morgan Stanley & Co. | | Vanguard Russell 1000 Growth ETF | | Federal Fund Rate minus 2.08% | | | 9/15/2020 | | | | Monthly | | | | (46 | ) | | | — | |
Bank of America Merrill Lynch | | Vanguard Short-Term Corporate Bond ETF | | 1 month LIBOR plus 0.50% | | | 10/04/2021 | | | | Monthly | | | | 491 | | | | — | |
Morgan Stanley & Co. | | Vanguard Short-Term Corporate Bond ETF | | Federal Fund Rate plus 0.50% | | | 9/15/2020 | | | | Monthly | | | | 491 | | | | — | |
Bank of America Merrill Lynch | | Vanguard Small-Cap Growth ETF | | 1 month LIBOR plus 0.50% | | | 10/04/2021 | | | | Monthly | | | | 221 | | | | — | |
Morgan Stanley & Co. | | Vanguard Small-Cap Growth ETF | | Federal Fund Rate plus 0.50% | | | 9/15/2020 | | | | Monthly | | | | 221 | | | | — | |
Bank of America Merrill Lynch | | Vanguard Small-Cap Value ETF | | 1 month LIBOR | | | 10/04/2021 | | | | Monthly | | | | (1,114 | ) | | | — | |
Morgan Stanley & Co. | | Vanguard Small-Cap Value ETF | | Federal Fund Rate minus 0.83% | | | 9/15/2020 | | | | Monthly | | | | (1,114 | ) | | | — | |
Bank of America Merrill Lynch | | Vanguard Value ETF | | 1 month LIBOR | | | 10/04/2021 | | | | Monthly | | | | (2,002 | ) | | | — | |
Morgan Stanley & Co. | | Vanguard Value ETF | | Federal Fund Rate minus 0.35% | | | 9/15/2020 | | | | Monthly | | | | (2,002 | ) | | | — | |
Bank of America Merrill Lynch | | WisdomTree Emerging Markets Local Debt Fund | | 1 month LIBOR plus 0.50% | | | 10/04/2021 | | | | Monthly | | | | 6 | | | | — | |
Morgan Stanley & Co. | | WisdomTree Emerging Markets Local Debt Fund | | Federal Fund Rate plus 0.50% | | | 9/15/2020 | | | | Monthly | | | | 6 | | | | — | |
Bank of America Merrill Lynch | | Xtrackers MSCI Europe Hedged Equity ETF | | 1 month LIBOR | | | 10/04/2021 | | | | Monthly | | | | (64 | ) | | | — | |
Morgan Stanley & Co. | | Xtrackers MSCI Europe Hedged Equity ETF | | Federal Fund Rate minus 13.38% | | | 9/15/2020 | | | | Monthly | | | | (64 | ) | | | — | |
Bank of America Merrill Lynch | | Xtrackers MSCI Japan Hedged Equity ETF | | 1 month LIBOR plus 0.50% | | | 10/04/2021 | | | | Monthly | | | | 158 | | | | — | |
Morgan Stanley & Co. | | Xtrackers MSCI Japan Hedged Equity ETF | | Federal Fund Rate plus 0.50% | | | 9/15/2020 | | | | Monthly | | | | 158 | | | | — | |
Bank of America Merrill Lynch | | Xtrackers USD High Yield Corporate Bond ETF | | 1 month LIBOR | | | 10/04/2021 | | | | Monthly | | | | (159 | ) | | | — | |
| | | | | | |
The notes to the financial statements are an integral part of,
and should be read in conjunction with, the financial statements. | | | | | 17 | |
Portfolio of Investments June 30, 2020 (Unaudited) (continued)
| | | | | | | | | | | | | | | | | | | | |
Swap Counterparty | | Reference Obligation | | Floating Rate2 | | Termination
Date(s) | | | Payment
Frequency
Paid/
Received | | | Notional
Amount
Long/
(Short)
(000)* | | | Unrealized
Appreciation3 | |
Morgan Stanley & Co. | | Xtrackers USD High Yield Corporate Bond ETF | | Federal Fund Rate minus 2.08% | | | 9/15/2020 | | | | Monthly | | | $ | (159 | ) | | $ | — | |
| | | | | | | | | | | | | | | $ | 1,519 | | | $ | — | |
| 1 | As of June 30, 2020, cash in the amount of $150,000 was on deposit with a broker for total return equity swap contracts. |
| 2 | Portfolio pays or receives the floating rate and receives or pays the total return of the reference entity. |
| 3 | Reflects the value at reset date as of June 30, 2020. |
| * | Notional amounts reflected as a positive value indicate a long position held by the Portfolio or Index and a negative value indicates a short position. |
The following abbreviations are used in the preceding pages:
BRIC—Brazil, Russia, India and China
DB—Deutsche Bank
EAFE—Europe, Australasia and Far East
EM—Emerging Markets
ETF—Exchange-Traded Fund
ETN—Exchange-Traded Note
FTSE—Financial Times Stock Exchange
KBW—Keefe, Bruyette & Woods
LIBOR—London Interbank Offered Rate
MBS—Mortgage-Backed Security
MSCI—Morgan Stanley Capital International
REIT—Real Estate Investment Trust
SPDR—Standard & Poor’s Depositary Receipt
TIPS—Treasury Inflation- Protected Security
USD —United States Dollar
VIX —CBOE Volatility Index
The following is a summary of the fair valuations according to the inputs used as of June 30, 2020, for valuing the Portfolio’s assets:
| | | | | | | | | | | | | | | | |
Description | | Quoted
Prices in
Active
Markets for
Identical
Assets
(Level 1) | | | Significant
Other
Observable
Inputs
(Level 2) | | | Significant
Unobservable
Inputs
(Level 3) | | | Total | |
| | | | |
Asset Valuation Inputs | | | | | | | | | | | | | | | | |
| Investments in Securities (a) | | | | | | | | | | | | | | | | |
| Exchange-Traded Funds | | $ | 341,631,796 | | | $ | — | | | $ | — | | | $ | 341,631,796 | |
| Exchange-Traded Notes | | | 1,008,519 | | | | — | | | | — | | | | 1,008,519 | |
| Exchange-Traded Vehicles | | | 15,537,503 | | | | — | | | | — | | | | 15,537,503 | |
| Short-Term Investments | | | | | | | | | | | | | | | | |
Affiliated Investment Company | | | 4,776,540 | | | | — | | | | — | | | | 4,776,540 | |
Unaffiliated Investment Company | | | 61,239,996 | | | | — | | | | — | | | | 61,239,996 | |
| | | | | | | | | | | | | | | | |
| Total Short-Term Investments | | | 66,016,536 | | | | — | | | | — | | | | 66,016,536 | |
| | | | | | | | | | | | | | | | |
| Total Investments in Securities | | $ | 424,194,354 | | | $ | — | | | $ | — | | | $ | 424,194,354 | |
| | | | | | | | | | | | | | | | |
| (a) | For a complete listing of investments and their industries, see the Portfolio of Investments. |
| | | | |
| 18 | | MainStay VP IQ Hedge Multi-Strategy Portfolio | | The notes to the financial statements are an integral part of,
and should be read in conjunction with, the financial statements. |
Statement of Assets and Liabilities as of June 30, 2020 (Unaudited)
| | | | |
| Assets | |
Investment in unaffiliated securities, at value (identified cost $412,366,250) including securities on loan of $75,276,164 | | $ | 419,417,814 | |
Investment in affiliated investment company, at value (identified cost $4,776,540) | | | 4,776,540 | |
Cash | | | 274,052 | |
Cash collateral on deposit at broker for swap contracts | | | 150,000 | |
Receivables: | | | | |
Dividends and interest | | | 282,237 | |
Portfolio shares sold | | | 46,962 | |
Securities lending | | | 43,846 | |
Other assets | | | 2,197 | |
| | | | |
Total assets | | | 424,993,648 | |
| | | | |
| |
| Liabilities | | | | |
Cash collateral received for securities on loan | | | 61,239,996 | |
Payables: | | | | |
Custodian | | | 394,337 | |
Portfolio shares redeemed | | | 219,557 | |
Manager (See Note 3) | | | 141,213 | |
Shareholder communication | | | 92,939 | |
NYLIFE Distributors (See Note 3) | | | 71,879 | |
Professional fees | | | 40,443 | |
Offering costs | | | 5,000 | |
Trustees | | | 482 | |
Accrued expenses | | | 6,295 | |
| | | | |
Total liabilities | | | 62,212,141 | |
| | | | |
Net assets | | $ | 362,781,507 | |
| | | | |
| |
| Composition of Net Assets | | | | |
Shares of beneficial interest outstanding (par value of $.001 per share) unlimited number of shares authorized | | $ | 42,274 | |
Additional paid-in capital | | | 430,391,707 | |
| | | | |
| | | 430,433,981 | |
Total distributable earnings (loss) | | | (67,652,474 | ) |
| | | | |
Net assets | | $ | 362,781,507 | |
| | | | |
| | | | |
Initial Class | | | | |
Net assets applicable to outstanding shares | | $ | 10,606,154 | |
| | | | |
Shares of beneficial interest outstanding | | | 1,233,345 | |
| | | | |
Net asset value per share outstanding | | $ | 8.60 | |
| | | | |
Service Class | | | | |
Net assets applicable to outstanding shares | | $ | 352,175,353 | |
| | | | |
Shares of beneficial interest outstanding | | | 41,040,617 | |
| | | | |
Net asset value per share outstanding | | $ | 8.58 | |
| | | | |
| | | | | | |
The notes to the financial statements are an integral part of,
and should be read in conjunction with, the financial statements. | | | | | 19 | |
Statement of Operations for the six months ended June 30, 2020 (Unaudited)
| | | | |
| Investment Income (Loss) | | | | |
Income | | | | |
Dividends-unaffiliated | | $ | 3,488,651 | |
Securities lending | | | 492,482 | |
Dividends-affiliated | | | 5,738 | |
Interest | | | 1,619 | |
| | | | |
Total income | | | 3,988,490 | |
| | | | |
Expenses | | | | |
Manager (See Note 3) | | | 1,385,474 | |
Custodian | | | 503,008 | |
Distribution/Service—Service Class (See Note 3) | | | 448,950 | |
Shareholder communication | | | 55,284 | |
Professional fees | | | 37,929 | |
Trustees | | | 4,651 | |
Miscellaneous | | | 12,587 | |
| | | | |
Total expenses before waiver/reimbursement | | | 2,447,883 | |
Expense waiver/reimbursement from Manager (See Note 3) | | | (705,824 | ) |
| | | | |
Net expenses | | | 1,742,059 | |
| | | | |
Net investment income (loss) | | | 2,246,431 | |
| | | | |
|
| Realized and Unrealized Gain (Loss) on Investments, Swap Contracts and Foreign Currency Transactions | |
Net realized gain (loss) on: | | | | |
Unaffiliated investment transactions | | | (9,642,707 | ) |
Swap transactions | | | 1,284,369 | |
Foreign currency transactions | | | (7 | ) |
| | | | |
Net realized gain (loss) on investments, swap transactions and foreign currency transactions | | | (8,358,345 | ) |
| | | | |
Net change in unrealized appreciation (depreciation) on: | | | | |
Unaffiliated investments | | | (2,144,348 | ) |
Translation of other assets and liabilities in foreign currencies | | | (343 | ) |
| | | | |
Net change in unrealized appreciation (depreciation) on investments and foreign currencies | | | (2,144,691 | ) |
| | | | |
Net realized and unrealized gain (loss) on investments, swap transactions and foreign currency transactions | | | (10,503,036 | ) |
| | | | |
Net increase (decrease) in net assets resulting from operations | | $ | (8,256,605 | ) |
| | | | |
| | | | |
| 20 | | MainStay VP IQ Hedge Multi-Strategy Portfolio | | The notes to the financial statements are an integral part of,
and should be read in conjunction with, the financial statements. |
Statements of Changes in Net Assets
for the six months ended June 30, 2020 (Unaudited) and the year ended December 31, 2019
| | | | | | | | |
| | | 2020 | | | 2019 | |
| Increase (Decrease) in Net Assets | |
Operations: | | | | | | | | |
Net investment income (loss) | | $ | 2,246,431 | | | $ | 8,379,515 | |
Net realized gain (loss) on investments, swap transactions and foreign currency transactions | | | (8,358,345 | ) | | | 3,885,815 | |
Net change in unrealized appreciation (depreciation) on investments and foreign currencies | | | (2,144,691 | ) | | | 19,050,296 | |
| | | | |
Net increase (decrease) in net assets resulting from operations | | | (8,256,605 | ) | | | 31,315,626 | |
| | | | |
Distributions to shareholders: | | | | | | | | |
Initial Class | | | — | | | | (192,294 | ) |
Service Class | | | — | | | | (5,105,960 | ) |
| | | | |
| | | — | | | | (5,298,254 | ) |
| | | | |
Distributions to shareholders from return of capital: | | | | | | | | |
Initial Class | | | — | | | | (8,032 | ) |
Service Class | | | — | | | | (213,271 | ) |
| | | — | | | | (221,303 | ) |
| | | | |
Total distributions to shareholders | | | — | | | | (5,519,557 | ) |
| | | | |
Capital share transactions: | | | | | | | | |
Net proceeds from sale of shares | | | 6,262,338 | | | | 10,347,572 | |
Net asset value of shares issued to shareholders in reinvestment of distributions | | | — | | | | 5,519,557 | |
Cost of shares redeemed | | | (35,074,030 | ) | | | (41,966,563 | ) |
| | | | |
Increase (decrease) in net assets derived from capital share transactions | | | (28,811,692 | ) | | | (26,099,434 | ) |
| | | | |
Net increase (decrease) in net assets | | | (37,068,297 | ) | | | (303,365 | ) |
| | |
| Net Assets | | | | | | | | |
Beginning of period | | | 399,849,804 | | | | 400,153,169 | |
| | | | |
End of period | | $ | 362,781,507 | | | $ | 399,849,804 | |
| | | | |
| | | | | | |
The notes to the financial statements are an integral part of,
and should be read in conjunction with, the financial statements. | | | | | 21 | |
Financial Highlights selected per share data and ratios
| | | | | | | | | | | | | | | | | | | | | | | | | | | | |
| | | |
| | | Six months
ended
June 30, | | | | | | Year ended December 31, | |
| | | | | | | |
| Initial Class | | 2020* | | | | | | 2019 | | | 2018† | | | 2017† | | | 2016† | | | 2015 | |
| | | | | | | |
Net asset value at beginning of period | | $ | 8.74 | | | | | | | $ | 8.22 | | | $ | 8.92 | | | $ | 9.04 | | | $ | 9.03 | | | $ | 9.82 | |
| | | | | | | | | | | | | | | | | | | | | | | | | | | | |
| | | | | | | |
Net investment income (loss) (a) | | | 0.06 | | | | | | | | 0.20 | | | | (0.05 | ) | | | (0.08 | ) | | | (0.10 | ) | | | (0.06 | ) |
| | | | | | | |
Net realized and unrealized gain (loss) on investments | | | (0.20 | ) | | | | | | | 0.49 | | | | (0.55 | ) | | | 0.16 | | | | 0.03 | | | | (0.72 | ) |
| | | | | | | |
Net realized and unrealized gain (loss) on foreign currency transactions | | | (0.00 | )‡ | | | | | | | (0.00 | )‡ | | | 0.00 | ‡ | | | (0.10 | ) | | | 0.08 | | | | (0.01 | ) |
| | | | | | | | | | | | | | | | | | | | | | | | | | | | |
| | | | | | | |
Total from investment operations | | | (0.14 | ) | | | | | | | 0.69 | | | | (0.60 | ) | | | (0.02 | ) | | | 0.01 | | | | (0.79 | ) |
| | | | | | | | | | | | | | | | | | | | | | | | | | | | |
| | | | | | | |
| Less distributions: | | | | | | | | | | | | | | | | | | | | | | | | | | | | |
| | | | | | | |
From net investment income | | | — | | | | | | | | (0.16 | ) | | | (0.10 | ) | | | (0.10 | ) | | | — | | | | — | |
| | | | | | | |
Return of capital | | | — | | | | | | | | (0.01 | ) | | | — | | | | — | | | | — | | | | — | |
| | | | | | | | | | | | | | | | | | | | | | | | | | | | |
| | | | | | | |
Total distributions | | | — | | | | | | | | (0.17 | ) | | | (0.10 | ) | | | (0.10 | ) | | | — | | | | — | |
| | | | | | | | | | | | | | | | | | | | | | | | | | | | |
| | | | | | | |
Net asset value at end of period | | $ | 8.60 | | | | | | | $ | 8.74 | | | $ | 8.22 | | | $ | 8.92 | | | $ | 9.04 | | | $ | 9.03 | |
| | | | | | | | | | | | | | | | | | | | | | | | | | | | |
| | | | | | | |
Total investment return (b) | | | (1.60 | %)(c) | | | | | | | 8.47 | % | | | (6.88 | %) | | | (0.25 | %) | | | 0.11 | % (c) | | | (8.04 | %) |
| | | | | | | |
| Ratios (to average net assets)/Supplemental Data: | | | | | | | | | | | | | | | | | | | | | | | | | | | | |
| | | | | | | |
Net investment income (loss) | | | 1.47 | % †† | | | | | | | 2.36 | % | | | (0.53 | %) | | | (0.93 | %) | | | (1.11 | %) | | | (0.59 | %) |
| | | | | | | |
Net expenses (d) | | | 0.70 | % †† | | | | | | | 0.70 | % | | | 1.43 | % | | | 1.43 | % | | | 1.46 | % | | | 1.47 | % |
| | | | | | | |
Net expenses (before waiver/reimbursement) (d)(e) | | | 1.07 | % †† | | | | | | | 1.20 | % | | | 2.96 | % | | | 2.63 | % | | | 2.63 | % | | | 2.00 | % |
| | | | | | | |
Portfolio turnover rate | | | 100 | % | | | | | | | 151 | % | | | 450 | % | | | 185 | % | | | 267 | % | | | 115 | % |
| | | | | | | |
Net assets at end of period (in 000’s) | | $ | 10,606 | | | | | | | $ | 10,749 | | | $ | 9,059 | | | $ | 149,753 | | | $ | 201,252 | | | $ | 3,051 | |
| † | Consolidated Financial Highlights for the periods January 1, 2018 to November 30, 2018, January 1, 2017 to December 31, 2017 and January 9, 2016 to December 31, 2016. |
| ‡ | Less than one cent per share. |
| (a) | Per share data based on average shares outstanding during the period. |
| (b) | Total return does not reflect any deduction of sales charges, mortality and expense charges, contract charges or administrative charges. For periods of less than one year, total return is not annualized. |
| (c) | Total investment return may reflect adjustments to conform to generally accepted accounting principles. |
| (d) | In addition to the fees and expenses which the Portfolio bears directly, it also indirectly bears a pro-rata share of the fees and expenses of the underlying funds in which it invests. Such indirect expenses are not included in the above expense ratios. |
| (e) | The expense ratios presented below show the impact of short sales expense: |
| | | | | | | | | | |
Period Ended | | Net Expenses
(excluding short
sale expenses) | | Short Sale
Expenses |
| June 30, 2020*†† | | | | 0.70 | % | | | | — | |
| December 31, 2019 | | | | 0.70 | % | | | | — | |
| December 31, 2018 | | | | 1.43 | % | | | | 1.28 | % |
| December 31, 2017 | | | | 1.43 | % | | | | 1.05 | % |
| December 31, 2016 | | | | 1.46 | % | | | | 0.95 | % |
| December 31, 2015 | | | | 1.47 | % | | | | 0.53 | % |
| | | | |
| 22 | | MainStay VP IQ Hedge Multi-Strategy Portfolio | | The notes to the financial statements are an integral part of,
and should be read in conjunction with, the financial statements. |
Financial Highlights selected per share data and ratios
| | | | | | | | | | | | | | | | | | | | | | | | | | | | |
| | | |
| | | Six months
ended
June 30, | | | | | | Year ended December 31, | |
| | | | | | | |
| Service Class | | 2020* | | | | | | 2019 | | | 2018† | | | 2017† | | | 2016† | | | 2015 | |
| | | | | | | |
Net asset value at beginning of period | | $ | 8.73 | | | | | | | $ | 8.18 | | | $ | 8.87 | | | $ | 8.99 | | | $ | 9.00 | | | $ | 9.79 | |
| | | | | | | | | | | | | | | | | | | | | | | | | | | | |
| | | | | | | |
Net investment income (loss) (a) | | | 0.05 | | | | | | | | 0.18 | | | | (0.00 | )‡ | | | (0.11 | ) | | | (0.12 | ) | | | (0.11 | ) |
| | | | | | | |
Net realized and unrealized gain (loss) on investments | | | (0.20 | ) | | | | | | | 0.49 | | | | (0.63 | ) | | | 0.18 | | | | 0.03 | | | | (0.67 | ) |
| | | | | | | |
Net realized and unrealized gain (loss) on foreign currency transactions | | | (0.00 | )‡ | | | | | | | (0.00 | )‡ | | | 0.00 | ‡ | | | (0.11 | ) | | | 0.08 | | | | (0.01 | ) |
| | | | | | | | | | | | | | | | | | | | | | | | | | | | |
| | | | | | | |
Total from investment operations | | | (0.15 | ) | | | | | | | 0.67 | | | | (0.63 | ) | | | (0.04 | ) | | | (0.01 | ) | | | (0.79 | ) |
| | | | | | | | | | | | | | | | | | | | | | | | | | | | |
| | | | | | | |
| Less distributions: | | | | | | | | | | | | | | | | | | | | | | | | | | | | |
| | | | | | | |
From net investment income | | | — | | | | | | | | (0.12 | ) | | | (0.06 | ) | | | (0.08 | ) | | | — | | | | — | |
| | | | | | | |
Return of capital | | | — | | | | | | | | (0.00 | )‡ | | | — | | | | — | | | | — | | | | — | |
| | | | | | | | | | | | | | | | | | | | | | | | | | | | |
| | | | | | | |
Total distributions | | | — | | | | | | | | (0.12 | ) | | | (0.06 | ) | | | (0.08 | ) | | | — | | | | — | |
| | | | | | | | | | | | | | | | | | | | | | | | | | | | |
| | | | | | | |
Net asset value at end of period | | $ | 8.58 | | | | | | | $ | 8.73 | | | $ | 8.18 | | | $ | 8.87 | | | $ | 8.99 | | | $ | 9.00 | |
| | | | | | | | | | | | | | | | | | | | | | | | | | | | |
| | | | | | | |
Total investment return (b) | | | (1.72 | %)(c) | | | | | | | 8.23 | % | | | (7.14 | %) | | | (0.51 | %) | | | (0.11 | %)(c) | | | (8.07 | %)(c) |
| | | | | | | |
| Ratios (to average net assets)/Supplemental Data: | | | | | | | | | | | | | | | | | | | | | | | | | | | | |
| | | | | | | |
Net investment income (loss) | | | 1.21 | % †† | | | | | | | 2.09 | % | | | 0.03 | % | | | (1.20 | %) | | | (1.36 | %) | | | (1.15 | %) |
| | | | | | | |
Net expenses (d) | | | 0.95 | % †† | | | | | | | 0.95 | % | | | 1.60 | % | | | 1.68 | % | | | 1.71 | % | | | 1.72 | % |
| | | | | | | |
Net expenses (before waiver/reimbursement) (d)(e) | | | 1.33 | % †† | | | | | | | 1.45 | % | | | 2.84 | % | | | 2.88 | % | | | 2.80 | % | | | 2.51 | % |
| | | | | | | |
Portfolio turnover rate | | | 100 | % | | | | | | | 151 | % | | | 450 | % | | | 185 | % | | | 267 | % | | | 115 | % |
| | | | | | | |
Net assets at end of period (in 000’s) | | $ | 352,175 | | | | | | | $ | 389,101 | | | $ | 391,094 | | | $ | 423,600 | | | $ | 366,470 | | | $ | 330,375 | |
| † | Consolidated Financial Highlights for the periods January 1, 2018 to November 30, 2018, January 1, 2017 to December 31, 2017 and January 9, 2016 to December 31, 2016. |
| ‡ | Less than one cent per share. |
| (a) | Per share data based on average shares outstanding during the period. |
| (b) | Total return does not reflect any deduction of sales charges, mortality and expense charges, contract charges or administrative charges. For periods of less than one year, total return is not annualized. |
| (c) | Total investment return may reflect adjustments to conform to generally accepted accounting principles. |
| (d) | In addition to the fees and expenses which the Portfolio bears directly, it also indirectly bears a pro-rata share of the fees and expenses of the underlying funds in which it invests. Such indirect expenses are not included in the above expense ratios. |
| (e) | The expense ratios presented below show the impact of short sales expense: |
| | | | | | | | | | |
Period Ended | | Net Expenses
(excluding short
sale expenses) | | Short Sale
Expenses |
| June 30, 2020*†† | | | | 0.95 | % | | | | — | |
| December 31, 2019 | | | | 0.95 | % | | | | — | |
| December 31, 2018 | | | | 1.60 | % | | | | 0.99 | % |
| December 31, 2017 | | | | 1.68 | % | | | | 1.05 | % |
| December 31, 2016 | | | | 1.71 | % | | | | 0.90 | % |
| December 31, 2015 | | | | 1.72 | % | | | | 0.79 | % |
| | | | | | |
The notes to the financial statements are an integral part of,
and should be read in conjunction with, the financial statements. | | | | | 23 | |
Notes to Financial Statements (Unaudited)
Note 1–Organization and Business
MainStay VP Funds Trust (the “Fund”) was organized as a Delaware statutory trust on February 1, 2011. The Fund is registered under the Investment Company Act of 1940, as amended (the “1940 Act”), as an open-end management investment company. The Fund is comprised of thirty-one separate series (collectively referred to as the “Portfolios”). These financial statements and notes relate to the MainStay VP IQ Hedge Multi-Strategy Portfolio (the “Portfolio”), a “diversified” portfolio, as that term is defined in the 1940 Act, as interpreted or modified by regulatory authorities having jurisdiction, from time to time.
Effective at the close of business on November 30, 2018, the Portfolio acquired the assets and liabilities of MainStay VP Absolute Return Multi-Strategy Portfolio (the “Reorganization”), which was a separate series of the Fund (the “VP ARMS Portfolio”). The Reorganization was approved by the Fund’s Board of Trustees (the “Board”) and shareholders pursuant to an Agreement and Plan of Reorganization (the “Reorganization Agreement”). The VP ARMS Portfolio was the accounting survivor in the Reorganization and as such, the financial statements and the financial highlights reflect the financial information of the VP ARMS Portfolio through November 30, 2018.
Shares of the Portfolio are currently offered to certain separate accounts to fund variable annuity policies and variable universal life insurance policies issued by New York Life Insurance and Annuity Corporation (“NYLIAC”), a wholly-owned subsidiary of New York Life Insurance Company (“New York Life”) and may also be offered to fund variable annuity policies and variable universal life insurance policies issued by other insurance companies. NYLIAC allocates shares of the Portfolios to, among others, certain NYLIAC separate accounts. Shares of the Portfolio are also offered to the MainStay VP Conservative Allocation Portfolio, MainStay VP Moderate Allocation Portfolio, MainStay VP Moderate Growth Allocation Portfolio and MainStay VP Growth Allocation Portfolio, which operate as “funds-of-funds,” and other variable insurance funds.
The Portfolio currently offers two classes of shares. Initial Class and Service Class shares commenced operations on May 1, 2013. Shares of the Portfolio are offered and are redeemed at a price equal to their respective net asset value (“NAV”) per share. No sales or redemption charge is applicable to the purchase or redemption of the Portfolio’s shares. Under the terms of the Fund’s multiple class plan adopted pursuant to Rule 18f-3 under the 1940 Act, the classes differ in that, among other things, Service Class shares of the Portfolio pay a combined distribution and service fee of 0.25% of average daily net assets attributable to Service Class shares of the Portfolio to the Distributor (as defined in Note 3(B)) pursuant to a plan adopted in accordance with Rule 12b-1 under the 1940 Act. Contract owners of variable annuity contracts purchased after June 2, 2003, are permitted to invest only in the Service Class shares.
The Portfolio’s investment objective is to seek investment returns that correspond (before fees and expenses) generally to the price and yield performance of its underlying index, the IQ Hedge Multi-Strategy Index. The IQ Hedge Multi-Strategy Index seeks to achieve performance similar to the overall hedge fund universe by replicating the “beta” portion of the hedge fund return characteristics (i.e., that portion of the returns that are non-idiosyncratic, or unrelated to manager skill) by using the
following hedge fund investment styles: long/short equity; global macro; market neutral; event-driven; fixed-income arbitrage; and emerging markets.
The Portfolio is a “fund of funds” that seeks to achieve its investment objective by investing primarily in exchange-traded funds (“ETFs”), other exchange-traded vehicles issuing equity securities organized in the U.S., such as exchange-traded commodity pools (“ETVs”), and exchange-traded notes (“ETNs”) (such ETFs, ETVs and ETNs are referred to collectively as “exchange-traded products” or “ETPs”), but may also invest in one or more financial instruments, including but not limited to, futures contracts, reverse repurchase agreements, options, and swap agreements (collectively, “Financial Instruments”) in order to seek to achieve exposure to investment strategies and/or asset classes that are similar to those of the IQ Hedge Multi-Strategy Index.
Note 2–Significant Accounting Policies
The Portfolio is an investment company and accordingly follows the investment company accounting and reporting guidance of the Financial Accounting Standards Board (“FASB”) Accounting Standard Codification Topic 946 Financial Services—Investment Companies. The Portfolio prepares its financial statements in accordance with generally accepted accounting principles (“GAAP”) in the United States of America and follows the significant accounting policies described below.
(A) Securities Valuation. Investments are usually valued as of the close of regular trading on the New York Stock Exchange (the “Exchange”) (usually 4:00 p.m. Eastern time) on each day the Portfolio is open for business (“valuation date”).
The Board of Trustee of the Fund (the “Board”) adopted procedures establishing methodologies for the valuation of the Portfolio’s securities and other assets and delegated the responsibility for valuation determinations under those procedures to the Valuation Committee of the Fund (the “Valuation Committee”). The procedures state that, subject to the oversight of the Board and unless otherwise noted, the responsibility for the day-to-day valuation of portfolio assets (including fair value measurements for the Portfolio’s assets and liabilities) rests with New York Life Investment Management LLC (“New York Life Investments” or the “Manager”), aided to whatever extent necessary by the Subadvisor (as defined in Note 3(A)). To assess the appropriateness of security valuations, the Manager, the Subadvisor or the Fund’s third-party service provider, who is subject to oversight by the Manager, regularly compares prior day prices, prices on comparable securities and the sale prices to the prior and current day prices and challenges prices with changes exceeding certain tolerance levels with third-party pricing services or broker sources.
The Board authorized the Valuation Committee to appoint a Valuation Subcommittee (the “Subcommittee”) to establish the prices of securities for which market quotations are not readily available or the prices of which are not otherwise readily determinable under the procedures. The Subcommittee meets (in person, via electronic mail or via teleconference) on an as-needed basis. The Valuation Committee meets to ensure that actions taken by the Subcommittee were appropriate.
For those securities valued through either a standardized fair valuation methodology or a fair valuation measurement, the Subcommittee deals with such valuation and the Valuation Committee reviews and affirms, if appropriate, the reasonableness of the valuation based on such
| | |
| 24 | | MainStay VP IQ Hedge Multi-Strategy Portfolio |
methodologies and measurements on a regular basis after considering information that is reasonably available and deemed relevant by the Valuation Committee. Any action taken by the Subcommittee with respect to the valuation of a portfolio security or other asset is submitted for review and ratification (if appropriate) to the Valuation Committee and the Board at the next regularly scheduled meeting.
“Fair value” is defined as the price the Portfolio would reasonably expect to receive upon selling an asset or liability in an orderly transaction to an independent buyer in the principal or most advantageous market for the asset or liability. Fair value measurements are determined within a framework that establishes a three-tier hierarchy that maximizes the use of observable market data and minimizes the use of unobservable inputs to establish a classification of fair value measurements for disclosure purposes. “Inputs” refer broadly to the assumptions that market participants would use in pricing the asset or liability, including assumptions about risk, such as the risk inherent in a particular valuation technique used to measure fair value using a pricing model and/or the risk inherent in the inputs for the valuation technique. Inputs may be observable or unobservable. Observable inputs reflect the assumptions market participants would use in pricing the asset or liability based on market data obtained from sources independent of the Portfolio. Unobservable inputs reflect the Portfolio’s own assumptions about the assumptions market participants would use in pricing the asset or liability based on the information available. The inputs or methodology used for valuing assets or liabilities may not be an indication of the risks associated with investing in those assets or liabilities. The three-tier hierarchy of inputs is summarized below.
| • | | Level 1—quoted prices in active markets for an identical asset or liability |
| • | | Level 2—other significant observable inputs (including quoted prices for a similar asset or liability in active markets, interest rates and yield curves, prepayment speeds, credit risk, etc.) |
| • | | Level 3—significant unobservable inputs (including the Portfolio’s own assumptions about the assumptions that market participants would use in measuring fair value of an asset or liability) |
The level of an asset or liability within the fair value hierarchy is based on the lowest level of an input, both individually and in the aggregate, that is significant to the fair value measurement. The aggregate value by input level of the Portfolio’s assets and liabilities as of June 30, 2020 is included at the end of the Portfolio of Investments.
The Portfolio may use third-party vendor evaluations, whose prices may be derived from one or more of the following standard inputs, among others:
| | |
• Benchmark yields | | • Reported trades |
• Broker/dealer quotes | | • Issuer spreads |
• Two-sided markets | | • Benchmark securities |
• Bids/offers | | • Reference data (corporate actions or material event notices) |
• Industry and economic events | | • Comparable bonds |
• Monthly payment information | | |
An asset or liability for which market values cannot be measured using the methodologies described above is valued by methods deemed reasonable in good faith by the Valuation Committee, following the procedures established by the Board, to represent fair value. Under these procedures, the Portfolio generally uses a market-based approach which may use related or comparable assets or liabilities, recent transactions, market multiples, book values and other relevant information. The Portfolio may also use an income-based valuation approach in which the anticipated future cash flows of the asset or liability are discounted to calculate fair value. Discounts may also be applied due to the nature and/or duration of any restrictions on the disposition of the asset or liability. Fair value represents a good faith approximation of the value of a security. Fair value determinations involve the consideration of a number of subjective factors, an analysis of applicable facts and circumstances and the exercise of judgment. As a result, it is possible that the fair value for a security determined in good faith in accordance with the Portfolio’s valuation procedures may differ from valuations for the same security determined by other funds using their own valuation procedures. Although the Portfolio’s valuation procedures are designed to value a security at the price the Portfolio may reasonably expect to receive upon the security’s sale in an orderly transaction, there can be no assurance that any fair value determination thereunder would, in fact, approximate the amount that the Portfolio would actually realize upon the sale of the security or the price at which the security would trade if a reliable market price were readily available. During the six-month period ended June 30, 2020, there were no material changes to the fair value methodologies.
Securities which may be valued in this manner include, but are not limited to: (i) a security for which trading has been halted or suspended; (ii) a debt security that has recently gone into default and for which there is not a current market quotation; (iii) a security of an issuer that has entered into a restructuring; (iv) a security that has been delisted from a national exchange; (v) a security for which the market price is not readily available from a third-party pricing source or, if so provided, does not, in the opinion of the Manager or the Subadvisor, reflect the security’s market value; (vi) a security subject to trading collars for which no or limited trading takes place; and (vii) a security whose principal market has been temporarily closed at a time when, under normal conditions, it would be open. Securities valued in this manner are generally categorized as Level 3 in the hierarchy. As of June 30, 2020, no securities held by the Portfolio were fair valued in such a manner.
Certain securities held by the Portfolio may principally trade in foreign markets. Events may occur between the time the foreign markets close and the time at which the Portfolio’s NAVs are calculated. These events may include, but are not limited to, situations relating to a single issuer in a market sector, significant fluctuations in U.S. or foreign markets, natural disasters, armed conflicts, governmental actions or other developments not tied directly to the securities markets. Should the Manager or the Subadvisor conclude that such events may have affected the accuracy of the last price of such securities reported on the local foreign market, the Subcommittee may, pursuant to procedures adopted by the Board, adjust the value of the local price to reflect the estimated impact on the price of such securities as a result of such events. In this instance, securities are generally categorized as Level 3 in the hierarchy. Additionally, certain foreign equity securities are also fair valued
Notes to Financial Statements (Unaudited) (continued)
whenever the movement of a particular index exceeds certain thresholds. In such cases, the securities are fair valued by applying factors provided by a third-party vendor in accordance with valuation procedures adopted by the Board and are generally categorized as Level 2 in the hierarchy. As of June 30, 2020, no securities held by the Portfolio were fair valued in such a manner.
Equity securities, including ETPs, are valued at the last quoted sales prices as of the close of regular trading on the relevant exchange on each valuation date. Securities that are not traded on the valuation date are valued at the mean of the last quoted bid and ask prices. Prices are normally taken from the principal market in which each security trades. These securities are generally categorized as Level 1 in the hierarchy.
Investments in mutual funds, including money market funds, are valued at their respective NAVs as of the close of the Exchange on the valuation date. These securities are generally categorized as Level 1 in the hierarchy.
Swaps are marked to market daily based upon quotations from pricing agents, brokers or market makers. These securities are generally categorized as Level 2 in the hierarchy.
Total return swap contracts, which are arrangements to exchange a market-linked return for a periodic payment, are based on a notional principal amount. To the extent that the total return of the security, index or other financial measure underlying the transaction exceeds or falls short of the offsetting interest rate obligation, the Portfolio will receive a payment from or make a payment to the counterparty. Total return swap contracts are marked to market daily based upon quotations from market makers and these securities are generally categorized as Level 2 in the hierarchy.
Temporary cash investments acquired in excess of 60 days to maturity at the time of purchase are valued using the latest bid prices or using valuations based on a matrix system (which considers such factors as security prices, yields, maturities and ratings), both as furnished by independent pricing services. Temporary cash investments that mature in 60 days or less at the time of purchase (“Short-Term Investments”) are valued using the amortized cost method of valuation, unless the use of such method would be inappropriate. The amortized cost method involves valuing a security at its cost on the date of purchase and thereafter assuming a constant amortization to maturity of the difference between such cost and the value on maturity date. Amortized cost approximates the current fair value of a security. Securities valued using the amortized cost method are not valued using quoted prices in an active market and are generally categorized as Level 2 in the hierarchy.
The information above is not intended to reflect an exhaustive list of the methodologies that may be used to value portfolio investments. The valuation procedures permit the use of a variety of valuation methodologies in connection with valuing portfolio investments. The methodology used for a specific type of investment may vary based on the market data available or other considerations. The methodologies summarized above may not represent the specific means by which portfolio investments are valued on any particular business day.
(B) Income Taxes. The Portfolio’s policy is to comply with the requirements of the Internal Revenue Code of 1986, as amended (the “Internal Revenue Code”), applicable to regulated investment companies
and to distribute all of its taxable income to the shareholders of the Portfolio within the allowable time limits.
The Manager evaluates the Portfolio’s tax positions to determine if the tax positions taken meet the minimum recognition threshold in connection with accounting for uncertainties in income tax positions taken or expected to be taken for the purposes of measuring and recognizing tax liabilities in the financial statements. Recognition of tax benefits of an uncertain tax position is permitted only to the extent the position is “more likely than not” to be sustained assuming examination by taxing authorities. The Manager analyzed the Portfolio’s tax positions taken on federal, state and local income tax returns for all open tax years (for up to three tax years) and has concluded that no provisions for federal, state and local income tax are required in the Portfolio’s financial statements. The Portfolio’s federal, state and local income tax and federal excise tax returns for tax years for which the applicable statutes of limitations have not expired are subject to examination by the Internal Revenue Service and state and local departments of revenue.
(C) Foreign Taxes. The Portfolio may be subject to foreign taxes on income and other transaction-based taxes imposed by certain countries in which it invests. A portion of the taxes on gains on investments or currency purchases/repatriation may be reclaimable. The Portfolio will accrue such taxes and reclaims as applicable, based upon its current interpretation of tax rules and regulations that exist in the markets in which it invests.
The Portfolio may be subject to taxation on realized capital gains, repatriation proceeds and other transaction-based taxes imposed by certain countries in which it invests. The Portfolio will accrue such taxes as applicable based upon its current interpretation of tax rules and regulations that exist in the market in which it invests. Capital gains taxes relating to positions still held are reflected as a liability in the Statement of Assets and Liabilities, as well as an adjustment to the Portfolio’s net unrealized appreciation (depreciation). Taxes related to capital gains realized, if any, are reflected as part of net realized gain (loss) in the Statement of Operations. Changes in tax liabilities related to capital gains taxes on unrealized investment gains, if any, are reflected as part of the change in net unrealized appreciation (depreciation) on investments in the Statement of Operations. Transaction-based charges are generally assessed as a percentage of the transaction amount.
(D) Dividends and Distributions to Shareholders. Dividends and distributions are recorded on the ex-dividend date. The Portfolio intends to declare and pay dividends from net investment income and distributions from net realized capital and currency gains, if any, at least annually. Unless a shareholder elects otherwise, all dividends and distributions are reinvested at NAV in the same class of shares of the Portfolio. Dividends and distributions to shareholders are determined in accordance with federal income tax regulations and may differ from determinations using GAAP.
(E) Security Transactions and Investment Income. The Portfolio records security transactions on the trade date. Realized gains and losses on security transactions are determined using the identified cost method. Dividend income is recognized on the ex-dividend date, net of any foreign tax withheld at the source, and interest income is accrued as earned using the effective interest rate method. Distributions received from real estate investment trusts may be classified as dividends, capital gains and/or return of capital.
| | |
| 26 | | MainStay VP IQ Hedge Multi-Strategy Portfolio |
Investment income and realized and unrealized gains and losses on investments of the Portfolio are allocated pro rata to the separate classes of shares based upon their relative net assets on the date the income is earned or realized and unrealized gains and losses are incurred.
(F) Expenses. Expenses of the Fund are allocated to the individual Portfolios in proportion to the net assets of the respective Portfolios when the expenses are incurred, except where direct allocations of expenses can be made. Expenses (other than fees incurred under the distribution and service plans, further discussed in Note 3(B), which are charged directly to the Service Class shares) are allocated to separate classes of shares pro rata based upon their relative net assets on the date the expenses are incurred. The expenses borne by the Portfolio, including those of related parties to the Portfolio, are shown in the Statement of Operations.
Additionally, the Portfolio may invest in ETPs and mutual funds, which are subject to management fees and other fees that may cause the costs of investing in ETPs and mutual funds to be greater than the costs of owning the underlying securities directly. These indirect expenses of ETPs and mutual funds are not included in the amounts shown as expenses in the Portfolio’s Statement of Operations or in the expense ratios included in the Financial Highlights.
In addition, the Portfolio bears a pro rata share of the fees and expenses of the ETPs in which it invests. Because the ETPs have varied expense and fee levels and the Portfolio may own different proportions of the ETPs at different times, the amount of fees and expenses incurred indirectly by the Portfolio may vary.
(G) Use of Estimates. In preparing the financial statements in conformity with GAAP, management makes estimates and assumptions that affect the reported amounts and disclosures in the financial statements. Actual results could differ from those estimates.
(H) Repurchase Agreements. The Portfolio may enter into repurchase agreements (i.e., buy a security from another party with the agreement that it will be sold back in the future) to earn income. The Portfolio may enter into repurchase agreements only with counterparties, usually financial institutions, that are deemed by the Manager or the Subadvisor to be creditworthy, pursuant to guidelines established by the Board. During the term of any repurchase agreement, the Manager or the Subadvisor will continue to monitor the creditworthiness of the counterparty. Under the 1940 Act, repurchase agreements are considered to be collateralized loans by the Portfolio to the counterparty secured by the securities transferred to the Portfolio.
Repurchase agreements are subject to counterparty risk, meaning the Portfolio could lose money by the counterparty’s failure to perform under the terms of the agreement. The Portfolio mitigates this risk by ensuring the repurchase agreement is collateralized by cash, U.S. government securities, fixed income securities and/or other securities. The collateral is held by the Portfolio’s custodian and valued daily on a mark to market basis to determine if the value, including accrued interest, exceeds the repurchase price. In the event of the counterparty’s default on the obligation to repurchase, the Portfolio has the right to liquidate the collateral and apply the proceeds in satisfaction of the obligation. Under certain circumstances, such as in the event of default or bankruptcy by the counterparty, realization and/or retention of
the collateral may be limited or subject to delay, to legal proceedings and possible realized loss to the Portfolio. As of June 30, 2020, the Portfolio did not hold any repurchase agreements.
(I) Foreign Currency Transactions. The Portfolio’s books and records are maintained in U.S. dollars. Prices of securities denominated in foreign currency amounts are translated into U.S. dollars at the mean between the buying and selling rates last quoted by any major U.S. bank at the following dates:
| (i) | market value of investment securities, other assets and liabilities— at the valuation date; and |
| (ii) | purchases and sales of investment securities, income and expenses—at the date of such transactions. |
The assets and liabilities that are denominated in foreign currency amounts are presented at the exchange rates and market values at the close of the period. The realized and unrealized changes in net assets arising from fluctuations in exchange rates and market prices of securities are not separately presented.
Net realized gain (loss) on foreign currency transactions represents net currency gains or losses realized as a result of differences between the amounts of securities sale proceeds or purchase cost, dividends, interest and withholding taxes as recorded on the Portfolio’s books, and the U.S. dollar equivalent amount actually received or paid. Net currency gains or losses from valuing such foreign currency denominated assets and liabilities, other than investments at valuation date exchange rates, are reflected in unrealized foreign exchange gains or losses.
(J) Swap Contracts. The Portfolio may enter into credit default, interest rate, equity, index and currency exchange rate swap contracts (“swaps”). In a typical swap transaction, two parties agree to exchange the future returns (or differentials in rates of future returns) earned or realized at periodic intervals on a particular investment or instrument based on a notional principal amount. Generally, the Portfolio will enter into a swap on a net basis, which means that the two payment streams under the swap are netted, with the Portfolio receiving or paying (as the case may be) only the net amount of the two payment streams. Therefore, the Portfolio’s current obligation under a swap generally will be equal to the net amount to be paid or received under the swap, based on the relative value of notional positions attributable to each counterparty to the swap. The payments may be adjusted for transaction costs, interest payments, the amount of interest paid on the investment or instrument or other factors. Collateral, in the form of cash or securities, may be required to be held in segregated accounts with the custodian bank or broker in accordance with the terms of the swap. Swap agreements are privately negotiated in the over the counter (“OTC”) market and may be executed in a multilateral or other trade facilities platform, such as a registered commodities exchange (“centrally cleared swaps”).
Certain standardized swaps, including certain credit default and interest rate swaps, are subject to mandatory clearing and exchange-trading, and more types of standardized swaps are expected to be subject to mandatory clearing and exchange-trading in the future. The counterparty risk for exchange-traded and cleared derivatives is expected to be generally lower than for uncleared derivatives, but cleared contracts are not risk-free. In a cleared derivative transaction, the Portfolio typically enters into the transaction with a financial institution counterparty, and
Notes to Financial Statements (Unaudited) (continued)
performance of the transaction is effectively guaranteed by a central clearinghouse, thereby reducing or eliminating the Portfolio’s exposure to the credit risk of its original counterparty. The Portfolio will be required to post specified levels of margin with the clearinghouse or at the instruction of the clearinghouse; the margin required by a clearinghouse may be greater than the margin the Portfolio would be required to post in an uncleared transaction. As of June 30, 2020, all swap positions outstanding are shown in the Portfolio of Investments.
Swaps are marked to market daily based upon quotations from pricing agents, brokers, or market makers and the change in value, if any, is recorded as unrealized appreciation or depreciation. Any payments made or received upon entering into a swap would be amortized or accreted over the life of the swap and recorded as a realized gain or loss. Early termination of a swap is recorded as a realized gain or loss. Daily changes in valuation of centrally cleared swaps, if any, are recorded as a receivable or payable for the change in value as appropriate on the Statement of Assets and Liabilities.
The Portfolio bears the risk of loss of the amount expected to be received under a swap in the event of the default or bankruptcy of the swap counterparty. The Portfolio may be able to eliminate its exposure under a swap either by assignment or other disposition, or by entering into an offsetting swap with the same party or a similar credit-worthy party. Swaps are not actively traded on financial markets. Entering into swaps involves elements of credit, market, and documentation risk in excess of the amounts recognized on the Statement of Assets and Liabilities. Such risks involve the possibilities that there will be no liquid market for these swaps, that the counterparty to the swaps may default on its obligation to perform or disagree as to the meaning of the contractual terms in the swaps and that there may be unfavorable changes in interest rates, the price of the index or the security underlying these transactions.
Equity Swaps (Total Return Swaps): Total return swap contracts are agreements between counterparties to exchange cash flow, one based on a market-linked return of an individual asset or group of assets (such as an index), and the other on a fixed or floating rate. As a total return swap, an equity swap may be structured in different ways. For example, when the Portfolio enters into a “long” equity swap, the counterparty may agree to pay the Portfolio the amount, if any, by which the notional amount of the equity swap would have increased in value had it been invested in a particular referenced security or securities, plus the dividends that would have been received on those securities. In return, the Portfolio will generally agree to pay the counterparty interest on the notional amount of the equity swap plus the amount, if any, by which that notional amount would have decreased in value had it been invested in such referenced security or securities, plus, in certain instances, commissions or trading spreads on the notional amounts. Therefore, the Portfolio’s return on the equity swap generally should equal the gain or loss on the notional amount, plus dividends on the referenced security or securities less the interest paid by the Portfolio on the notional amount. Alternatively, when the Portfolio enters into a “short” equity swap, the counterparty will generally agree to pay the Portfolio the amount, if any, by which the notional amount of the equity swap would have decreased in value had the Portfolio sold a particular referenced security or securities short, less the dividend expense that the Portfolio would have incurred on the referenced security or secu
rities, as adjusted for interest payments or other economic factors. In this situation, the Portfolio will generally be obligated to pay the amount, if any, by which the notional amount of the swap would have increased in value had it been invested directly in the referenced security or securities.
Equity swaps generally do not involve the delivery of securities or other referenced assets. Accordingly, the risk of loss with respect to equity swaps is normally limited to the net amount of payments that the Portfolio is contractually obligated to make. If the other party to an equity swap defaults, the Portfolio’s risk of loss consists of the net amount of payments that the Portfolio is contractually entitled to receive, if any. The Portfolio will segregate cash or liquid assets, enter into offsetting transactions or use other measures permitted by applicable law to “cover” the Portfolio’s current obligations. The Portfolio and New York Life Investments, however, believe these transactions do not constitute senior securities under the 1940 Act and, accordingly, will not treat them as being subject to the Portfolio’s borrowing restrictions.
Equity swaps are derivatives and their value can be very volatile. The Portfolio may engage in total return swaps to gain exposure to emerging markets securities, along with offsetting long total return swap positions to maintain appropriate currency balances and risk exposures across all swap positions. To the extent that the Manager, or the Subadvisor do not accurately analyze and predict future market trends, the values or assets or economic factors, the Portfolio may suffer a loss, which may be substantial.
(K) Securities Lending. In order to realize additional income, the Portfolio may engage in securities lending, subject to the limitations set forth in the 1940 Act and relevant guidance by the staff of the Securities and Exchange Commission (“SEC”). If the Portfolio engages in securities lending, the Portfolio will lend through its custodian, currently State Street Bank and Trust Company (“State Street”), acting as securities lending agent on behalf of the Portfolio. Under the current arrangement, State Street will manage the Portfolio’s collateral in accordance with the securities lending agency agreement between the Portfolio and State Street, and indemnify the Portfolio against counterparty risk. The loans will be collateralized by cash (which may be invested in a money market fund) and/or non-cash collateral (which may include U.S. Treasury securities and/or U.S. government agency securities issued or guaranteed by the United States government or its agencies or instrumentalities) at least equal at all times to the market value of the securities loaned. The Portfolio bears the risk of delay in recovery of, or loss of rights in, the securities loaned. The Portfolio may also record a realized gain or loss on securities deemed sold due to a borrower’s inability to return securities on loan. The Portfolio bears the risk of any loss on investment of cash collateral. The Portfolio will receive compensation for lending its securities in the form of fees or it will retain a portion of interest earned on the investment of any cash collateral. The Portfolio will also continue to receive interest and dividends on the securities loaned and any gain or loss in the market price of the securities loaned that may occur during the term of the loan will be for the account of the Portfolio. Income earned from securities lending activities, if any, is reflected in the Statement of Operations. As of June 30, 2020, the Portfolio had securities on loan with an aggregate market value of $75,276,164; the total market value of collateral held by the Portfolio was $76,870,296. The market value of the collateral held
| | |
| 28 | | MainStay VP IQ Hedge Multi-Strategy Portfolio |
included non-cash collateral, in the form of U.S. Treasury securities, with a value of $15,630,300 and cash collateral, which was invested into the State Street Navigator Securities Lending Government Money Market Portfolio, with a value of $61,239,996.
(L) Foreign Securities Risk. The Portfolio may invest in foreign securities, which carry certain risks that are in addition to the usual risks inherent in domestic securities. These risks include those resulting from currency fluctuations, future adverse political or economic developments and possible imposition of currency exchange blockages or other foreign governmental laws or restrictions. These risks are likely to be greater in emerging markets than in developed markets. The ability of issuers of securities held by the Portfolio to meet their obligations may be affected by, among other things, economic or political developments in a specific country, industry or region.
(M) Counterparty Credit Risk. In order to better define its contractual rights and to secure rights that will help the Portfolio mitigate its counterparty risk, the Portfolio may enter into an International Swaps and Derivatives Association, Inc. Master Agreement (“ISDA Master Agreement”) or similar agreement with its counterparties. An ISDA Master Agreement is a bilateral agreement between the Portfolio and a counterparty that governs certain OTC derivatives and typically contains collateral posting terms and netting provisions. Under an ISDA Master Agreement, the Portfolio may, under certain circumstances, offset with the counterparty certain derivative financial instruments’ payables and/ or receivables with collateral held and/or posted and create one single net payment. The provisions of the ISDA Master Agreement typically permit a single net payment in the event of default including the bankruptcy or insolvency of the counterparty. Bankruptcy or insolvency laws of a particular jurisdiction may restrict or prohibit the right of offset in bankruptcy, insolvency or other events. In addition, certain ISDA Master Agreements may contain provisions for early termination of OTC derivative transactions in the event the net assets of the Portfolio decline below specific levels or if the Portfolio fails to meet the terms of its ISDA Master Agreements. The result would cause the Portfolio to accelerate payment of any net liability owed to the counterparty.
For financial reporting purposes, the Portfolio does not offset derivative assets and derivative liabilities that are subject to netting arrangements, if any, in the Statement of Assets and Liabilities.
(N) LIBOR Replacement Risk. The Portfolio may invest in certain debt securities, derivatives or other financial instruments that utilize the London Interbank Offered Rate (“LIBOR”), as a “benchmark” or “reference rate” for various interest rate calculations. The United Kingdom Financial Conduct Authority, which regulates LIBOR, announced that after 2021 it will cease its active encouragement of banks to provide the quotations needed to sustain LIBOR. As a result, it is anticipated that LIBOR will be discontinued or will no longer be sufficiently robust to be representative of its underlying market around that time. Although financial regulators and industry working groups have suggested alternative reference rates, such as the European Interbank Offer Rate (“EURIBOR”), Sterling Overnight Interbank Average Rate (“SONIA”) and Secured Overnight Financing Rate (“SOFR”), there are challenges to converting certain contracts and transactions to a new benchmark and neither the full effects of the transition process nor its ultimate outcome is known.
The elimination of LIBOR or changes to other reference rates or any other changes or reforms to the determination or supervision of reference rates could have an adverse impact on the market for, or value of, any securities or payments linked to those reference rates, which may adversely affect the Portfolio’s performance and/or net asset value. Uncertainty and risk also remain regarding the willingness and ability of issuers and lenders to include revised provisions in new and existing contracts or instruments. Consequently, the transition away from LIBOR to other reference rates may lead to increased volatility and illiquidity in markets that are tied to LIBOR, fluctuations in values of LIBOR-related investments or investments in issuers that utilize LIBOR, increased difficulty in borrowing or refinancing and diminished effectiveness of hedging strategies, adversely affecting the Portfolio’s performance. Furthermore, the risks associated with the expected discontinuation of LIBOR and transition may be exacerbated if the work necessary to effect an orderly transition to an alternative reference rate is not completed in a timely manner. Because the usefulness of LIBOR as a benchmark could deteriorate during the transition period, these effects could occur prior to the end of 2021.
(O) Indemnifications. Under the Fund’s organizational documents, its officers and trustees are indemnified against certain liabilities that may arise out of performance of their duties to the Fund. Additionally, in the normal course of business, the Portfolio enters into contracts with third-party service providers that contain a variety of representations and warranties and that may provide general indemnifications. The Portfolio’s maximum exposure under these arrangements is unknown, as this would involve future claims that may be made against the Portfolio that have not yet occurred. The Manager believes that the risk of loss in connection with these potential indemnification obligations is remote. However, there can be no assurance that material liabilities related to such obligations will not arise in the future, which could adversely impact the Portfolio.
(P) Quantitative Disclosure of Derivative Holdings. The following tables show additional disclosures related to the Portfolio’s derivative and hedging activities, including how such activities are accounted for and their effect on the Portfolio’s financial positions, performance and cash flows.
The Portfolio utilizes a range of derivative instruments for a variety of different purposes. Total return swaps (“TRS”) are one form of derivative that is used. In some cases, TRS contracts are entered into so as to affect long and short exposure to individual securities or indices within a particular strategy. In other cases, TRS are used to gain exposure to the strategy itself, which may also use derivatives. For example, a TRS contract is used to generate the return available from a customized index comprised of a diversified basket of exchange-traded futures. Other examples of derivative positions into which the Portfolio may enter include interest rate swaps, credit default swaps and option contracts. These instruments are frequently used to obtain a desired return at a lower cost to the Portfolio than is available when investing directly in the underlying instrument or to hedge against credit and interest rate risks. The Portfolio may also enter into foreign currency forward contracts to gain exposure to a particular currency or to hedge against the risk of loss due to changing currency exchange rates. These derivatives are not accounted for as hedging instruments.
Notes to Financial Statements (Unaudited) (continued)
The effect of derivative instruments on the Statement of Operations for the period ended June 30, 2020:
Realized Gain (Loss)
| | | | | | | | | | |
| | | Statement of
Operations
Location | | Equity
Contracts
Risk | | | Total | |
| | | |
Swap Contracts | | Net realized gain (loss) on swap transactions | | $ | 1,284,369 | | | $ | 1,284,369 | |
| | | | | | |
Total Realized Gain (Loss) | | | | $ | 1,284,369 | | | $ | 1,284,369 | |
| | | | | | |
Average Notional Amount
| | | | | | | | |
| | | Equity
Contracts
Risk | | | Total | |
| | |
Swap Contracts Long | | $ | 36,696,674 | | | $ | 36,696,674 | |
Swap Contracts Short | | $ | (35,967,870 | ) | | $ | (35,967,870 | ) |
| | | | | | | | |
Note 3–Fees and Related Party Transactions
(A) Manager and Subadvisor. New York Life Investments, a registered investment adviser and an indirect, wholly-owned subsidiary of New York Life, serves as the Portfolio’s Manager, pursuant to an Amended and Restated Management Agreement (“Management Agreement”). The Manager provides offices, conducts clerical, recordkeeping and bookkeeping services, and keeps most of the financial and accounting records required to be maintained by the Portfolio. Except for the portion of salaries and expenses that are the responsibility of the Portfolio, the Manager pays the salaries and expenses of all personnel affiliated with the Portfolio and certain operational expenses of the Portfolio. The Portfolio reimburses New York Life Investments in an amount equal to the portion of the compensation of the Chief Compliance Officer attributable to the Portfolio. IndexIQ Advisors LLC (“IndexIQ Advisors” or “Subadvisor”), a registered investment adviser and an affiliate of New York Life Investments, serves as Subadvisor to the Portfolio and is responsible for the day-to-day portfolio management of the Portfolio. Pursuant to the terms of a Subadvisory Agreement (“Subadvisory Agreement”) between New York Life Investments and IndexIQ Advisors, New York Life Investments pays for the services of the Subadvisor.
The Fund, on behalf of the Portfolio, pays New York Life Investments in its capacity as the Portfolio’s investment manager and administrator, pursuant to the Management Agreement, a monthly fee for the services
performed and the facilities furnished at an annual rate of 0.75% of the Portfolio’s average daily net assets.
Effective May 1, 2020, New York Life Investments has contractually agreed to waive fees and/or reimburse expenses so that the total annual operating expenses (excluding taxes, interest, litigation, extraordinary expenses, brokerage and other transaction expenses relating to the purchase or sale of portfolio investments, and acquired (underlying) portfolio/fund fees and expenses) of Initial Class shares and Service Class shares do not exceed 0.70% and 0.95% of the Portfolio’s average daily net assets, respectively. This agreement will remain in effect until May 1, 2021, and shall renew automatically for one-year terms unless New York Life Investments provides written notice of termination prior to the start of the next term or upon approval of the Board.
During the six-month period ended June 30, 2020, New York Life Investments earned fees from the Portfolio in the amount of $1,385,474 and waived its fees and/or reimbursed expenses in the amount of $705,824 and paid the Subadvisor in the amount of $339,825.
State Street provides sub-administration and sub-accounting services to the Portfolio pursuant to an agreement with New York Life Investments. These services include calculating the daily NAVs of the Portfolio, maintaining the general ledger and sub-ledger accounts for the calculation of the Portfolio’s NAVs and assisting New York Life Investments in conducting various aspects of the Portfolio’s administrative operations. For providing these services to the Portfolio, State Street is compensated by New York Life Investments.
Pursuant to an agreement between the Fund and New York Life Investments, New York Life Investments is responsible for providing or procuring certain regulatory reporting services for the Portfolio. The Portfolio will reimburse New York Life Investments for the actual costs incurred by New York Life Investments in connection with providing or procuring these services for the Portfolio.
(B) Distribution and Service Fees. The Fund, on behalf of the Portfolio, has entered into a distribution agreement with NYLIFE Distributors LLC (the “Distributor”), an indirect, wholly-owned subsidiary of New York Life. The Portfolio has adopted a distribution plan (the “Plan”) in accordance with the provisions of Rule 12b-1 under the 1940 Act. Under the Plan, the Distributor has agreed to provide, through its affiliates or independent third parties, various distribution-related, shareholder and administrative support services to the Service Class shareholders. For its services, the Distributor is entitled to a combined distribution and service fee accrued daily and paid monthly at an annual rate of 0.25% of the average daily net assets attributable to the Service Class shares of the Portfolio.
(C) Investments in Affiliates (in 000’s). During the six-month period ended June 30, 2020, purchases and sales transactions, income earned from investments and shares held of investment companies managed by New York Life Investments or its affiliates were as follows:
| | | | | | | | | | | | | | | | | | | | | | | | | | | | | | | | | | | | |
Affiliated Investment Company | | Value,
Beginning
of Period | | | Purchases
at Cost | | | Proceeds
from
Sales | | | Net Realized
Gain/(Loss)
on Sales | | | Change in
Unrealized
Appreciation/
(Depreciation) | | | Value,
End of
Period | | | Dividend
Income | | | Other
Distributions | | | Shares
End of
Period | |
MainStay U.S. Government Liquidity Fund | | $ | 3,675 | | | $ | 25,649 | | | $ | (24,547 | ) | | $ | — | | | $ | — | | | $ | 4,777 | | | $ | 6 | | | $ | — | | | | 4,777 | |
| | |
| 30 | | MainStay VP IQ Hedge Multi-Strategy Portfolio |
(D) Capital. As of June 30, 2020, New York Life and its affiliates beneficially held shares of the Portfolio with the values and percentages of net assets as follows:
| | | | | | | | |
Initial Class | | $ | 1,516,396 | | | | 14.3 | % |
Service Class | | | 25,595 | | | | 0.0 | ‡ |
| ‡ | Less than one-tenth of a percent. |
Note 4–Federal Income Tax
As of June 30, 2020, the cost and unrealized appreciation (depreciation) of the Portfolio’s investment portfolio, including applicable derivative contracts and other financial instruments, as determined on a federal income tax basis, was as follows:
| | | | | | | | | | | | | | | | |
| | | Federal Tax
Cost | | | Gross
Unrealized
Appreciation | | | Gross
Unrealized
(Depreciation) | | | Net
Unrealized
Appreciation/
(Depreciation) | |
Investments in Securities | | $ | 417,561,270 | | | $ | 10,169,048 | | | $ | (3,535,964 | ) | | $ | 6,633,084 | |
As of December 31, 2019, for federal income tax purposes, capital loss carryforwards of $68,115,836, as shown in the table below, were available to the extent provided by the regulations to offset future realized gains of the Portfolio through the years indicated. Accordingly, no capital gains distributions are expected to be paid to shareholders until net gains have been realized in excess of such amounts.
| | | | |
Capital Loss
Available Through | | Short-Term
Capital Loss
Amounts (000’s) | | Long-Term
Capital Loss
Amounts (000’s) |
| | |
| Unlimited | | $68,093 | | $23 |
During the year ended December 31, 2019, the tax character of distributions paid as reflected in the Statements of Changes in Net Assets was as follows:
| | | | |
| | | 2019 | |
| |
Distributions paid from: | | | | |
Ordinary Income | | $ | 5,298,254 | |
Return of Capital | | | 221,303 | |
Total | | $ | 5,519,557 | |
Note 5–Custodian
State Street is the custodian of cash and securities held by the Portfolio. Custodial fees are charged to the Portfolio based on the Portfolio’s net assets and/or the market value of securities held by the Portfolio and the number of certain transactions incurred by the Portfolio.
Note 6–Line of Credit
The Portfolio and certain other funds managed by New York Life Investments maintain a line of credit with a syndicate of banks in order to secure a source of funds for temporary purposes to meet unanticipated or excessive redemption requests.
Effective July 28, 2020, under the credit agreement (the “Credit Agreement”), the aggregate commitment amount is $600,000,000 with
an additional uncommitted amount of $100,000,000. The commitment fee is an annual rate of 0.15% of the average commitment amount payable quarterly, regardless of usage, to JP Morgan Chase Bank NA, who serves as the agent to the syndicate. The commitment fee is allocated among the Portfolio and certain other funds managed by New York Life Investments based upon their respective net assets and other factors. Interest on any revolving credit loan is charged based upon the Federal Funds Rate or the one-month LIBOR, whichever is higher. The Credit Agreement expires on July 27, 2021, although the Portfolio, certain other funds managed by New York Life Investments and the syndicate of banks may renew the Credit Agreement for an additional year on the same or different terms or enter into a credit agreement with a different syndicate of banks. Prior to July 28, 2020, the aggregate commitment amount and the commitment fee were the same as those under the current Credit Agreement, but State Street served as agent to the syndicate. As of June 30, 2020, there were no borrowings outstanding with respect to the Portfolio under the Credit Agreement or the credit agreement for which State Street served as agent.
Note 7–Interfund Lending Program
Pursuant to an exemptive order issued by the SEC, the Portfolio, along with certain other funds managed by New York Life Investments, may participate in an interfund lending program. The interfund lending program provides an alternative credit facility that permits the Portfolio and certain other funds managed by New York Life Investments to lend or borrow money for temporary purposes directly to or from one another subject to the conditions of the exemptive order. During the six-month period ended June 30, 2020, there were no interfund loans made or outstanding with respect to the Portfolio.
Note 8–Purchases and Sales of Securities (in 000’s)
During the six-month period ended June 30, 2020, purchases and sales of securities, other than short-term securities, were $371,596 and $398,286, respectively.
Note 9–Capital Share Transactions
Transactions in capital shares for the six-month period ended June 30, 2020 and the year ended December 31, 2019, were as follows:
| | | | | | | | |
Initial Class | | Shares | | | Amount | |
| | |
Six-month period ended June 30, 2020: | | | | | | | | |
Shares sold | | | 56,185 | | | $ | 483,549 | |
Shares redeemed | | | (53,049 | ) | | | (434,654 | ) |
| | | | |
Net increase (decrease) | | | 3,136 | | | $ | 48,895 | |
| | | | |
Year ended December 31, 2019: | | | | | | | | |
Shares sold | | | 163,150 | | | $ | 1,400,071 | |
Shares issued to shareholders in reinvestment of distributions | | | 23,044 | | | | 200,326 | |
Shares redeemed | | | (58,615 | ) | | | (505,432 | ) |
| | | | |
Net increase (decrease) | | | 127,579 | | | $ | 1,094,965 | |
| | | | |
| | |
| | | | | | | | |
Notes to Financial Statements (Unaudited) (continued)
| | | | | | | | |
Service Class | | Shares | | | Amount | |
Six-month period ended June 30, 2020: | | | | | | | | |
Shares sold | | | 671,880 | | | $ | 5,778,789 | |
Shares redeemed | | | (4,205,178 | ) | | | (34,639,376 | ) |
| | | | |
Net increase (decrease) | | | (3,533,298 | ) | | $ | (28,860,587 | ) |
| | | | |
Year ended December 31, 2019: | | | | | | | | |
Shares sold | | | 1,046,021 | | | $ | 8,947,501 | |
Shares issued to shareholders in reinvestment of distributions | | | 611,715 | | | | 5,319,231 | |
Shares redeemed | | | (4,883,438 | ) | | | (41,461,131 | ) |
| | | | |
Net increase (decrease) | | | (3,225,702 | ) | | $ | (27,194,399 | ) |
| | | | |
Note 10–Recent Accounting Pronouncement
In March 2020, the Financial Accounting Standards Board (“FASB”) issued Accounting Standards Update 2020-04 (“ASU 2020-04”), which provides optional guidance to ease the potential accounting burden associated with transitioning away from LIBOR and other reference rates that are expected to be discontinued. ASU 2020-04 is effective immediately upon release of the update on March 12, 2020 through December 31, 2022. At this time, the Manager is evaluating the implications of certain other provisions of ASU 2020-04 related to new disclosure requirements and any impact on the financial statement disclosures has not yet been determined.
Note 11–Subsequent Events
In connection with the preparation of the financial statements of the Portfolio as of and for the six-month period ended June 30, 2020, events and transactions subsequent to June 30, 2020, through the date the financial statements were issued have been evaluated by the Manager, for possible adjustment and/or disclosure. No subsequent events requiring financial statement adjustment or disclosure have been identified.
Note 12–Other Matters
An outbreak of COVID-19, first detected in December 2019, has developed into a global pandemic and has resulted in travel restrictions, closure of international borders, certain businesses and securities markets, restrictions on securities trading activities, prolonged quarantines, supply chain disruptions, and lower consumer demand, as well as general concern and uncertainty. The continued impact of COVID-19 is uncertain and could further adversely affect the global economy, national economies, individual issuers and capital markets in unforeseeable ways and result in a substantial and extended economic downturn. Developments that disrupt global economies and financial markets, such as COVID-19, may magnify factors that affect the Portfolio’s performance.
| | |
| 32 | | MainStay VP IQ Hedge Multi-Strategy Portfolio |
Discussion of the Operation and Effectiveness of the Portfolio’s
Liquidity Risk Management Program (Unaudited)
In compliance with Rule 22e-4 under the Investment Company Act of 1940, as amended (the “Liquidity Rule”), the Portfolio has adopted and implemented a liquidity risk management program (the “Program”), which New York Life Investment Management LLC believes is reasonably designed to assess and manage the Portfolio’s liquidity risk. The Board designated New York Life Investment Management LLC as administrator of the Program (the “Administrator”). The Administrator has established a Liquidity Risk Management Committee to assist the Administrator in the implementation and day-to-day administration of the Program and to otherwise support the Administrator in fulfilling its responsibilities under the Program.
At a meeting of the Board held on March 11, 2020, the Administrator provided the Board with a written report addressing the Program’s operation, adequacy and effectiveness of implementation for the period from December 1, 2018 through December 31, 2019, as required under the Liquidity Rule. The report noted that the Administrator concluded that (i) the Program operated effectively to assess and manage the Portfolio’s liquidity risk, (ii) the Program has been adequately and effectively implemented to monitor and, as applicable, respond to the Portfolio’s liquidity developments and (iii) the Portfolio’s investment strategy continues to be appropriate for an open-end portfolio.
In accordance with the Program, the Portfolio’s liquidity risk is assessed no less frequently than annually taking into consideration certain factors, as applicable, such as (i) investment strategy and liquidity of portfolio investments, (ii) short-term and long-term cash flow projections and (iii) holdings of cash and cash equivalents and borrowing arrangements and other funding sources. Certain factors are considered under both normal and reasonably foreseeable stressed conditions.
Each Portfolio portfolio investment is classified into one of four liquidity categories. The classification is based on a determination of the number of days it is reasonably expected to take to convert the investment into cash, or sell or dispose of the investment, in current market conditions without significantly changing the market value of the investment. The Administrator has delegated liquidity classification determinations to the Portfolio’s subadvisor, subject to appropriate oversight by the Administrator, and classification determinations are made by taking into account the Portfolio’s reasonably anticipated trade size, various market, trading and investment-specific considerations, as well as market depth, and, in certain cases, third-party vendor data.
The Liquidity Rule requires portfolios that do not primarily hold assets that are highly liquid investments to adopt a minimum amount of net assets that must be invested in highly liquid investments that are assets (an “HLIM”). In addition, the Liquidity Rule limits a portfolio’s investments in illiquid investments. Specifically, the Liquidity Rule prohibits acquisition of illiquid investments if doing so would result in a portfolio holding more than 15% of its net assets in illiquid investments that are assets. The Program includes provisions reasonably designed to determine, periodically review and comply with the HLIM requirement, as applicable, and to comply with the 15% limit on illiquid investments.
Proxy Voting Policies and Procedures and Proxy Voting Record
A description of the policies and procedures that New York Life Investments uses to vote proxies related to the Portfolio’s securities is available free of charge upon request (i) by calling 800-598-2019; (ii) by visiting New York Life Investments’ website at https://www.nylinvestments.com/mainstay/products-and-performance/mainstay-vp-funds-trust; or (iii) by visiting the SEC’s website at www.sec.gov.
The Portfolio is required to file with the SEC its proxy voting record for the 12-month period ending June 30 on Form N-PX. The Portfolio’s most recent Form N-PX or proxy voting record is available free of charge upon request (i) by calling 800-598-2019; (ii) by visiting New York Life Investments’ website at https://www.nylinvestments.com/mainstay/products-and-performance/mainstay-vp-funds-trust; or (iii) by visiting the SEC’s website at www.sec.gov.
Shareholder Reports and Quarterly Portfolio Disclosure
The Portfolio is required to file its complete schedule of portfolio holdings with the SEC 60 days after its first and third fiscal quarter on Form N-PORT. The Portfolio’s holdings report is available free of charge upon request by calling 800-598-2019 or by visiting the SEC’s website at www.sec.gov.
| | |
| 34 | | MainStay VP IQ Hedge Multi-Strategy Portfolio |
MainStay VP Portfolios
MainStay VP offers a wide range of Portfolios. The full array of MainStay VP offerings is listed here, with information about the manager, subadvisors, legal counsel, and independent registered public accounting firm.
Equity Portfolios
MainStay VP Emerging Markets Equity Portfolio
MainStay VP Epoch U.S. Equity Yield Portfolio
MainStay VP Fidelity Institutional AM® Utilities Portfolio†
MainStay VP MacKay Common Stock Portfolio
MainStay VP MacKay Growth Portfolio
MainStay VP MacKay International Equity Portfolio
MainStay VP MacKay Mid Cap Core Portfolio
MainStay VP MacKay S&P 500 Index Portfolio
MainStay VP MacKay Small Cap Core Portfolio
MainStay VP Mellon Natural Resources Portfolio
MainStay VP Small Cap Growth Portfolio
MainStay VP T. Rowe Price Equity Income Portfolio
MainStay VP Winslow Large Cap Growth Portfolio
Mixed Asset Portfolios
MainStay VP Balanced Portfolio
MainStay VP Income Builder Portfolio
MainStay VP Janus Henderson Balanced Portfolio
MainStay VP MacKay Convertible Portfolio
Income Portfolios
MainStay VP Bond Portfolio
MainStay VP Floating Rate Portfolio
MainStay VP Indexed Bond Portfolio
MainStay VP MacKay Government Portfolio
MainStay VP MacKay High Yield Corporate Bond Portfolio
MainStay VP MacKay Unconstrained Bond Portfolio
MainStay VP PIMCO Real Return Portfolio
Money Market
MainStay VP U.S. Government Money Market Portfolio
Alternative
MainStay VP CBRE Global Infrastructure Portfolio
MainStay VP IQ Hedge Multi-Strategy Portfolio
Asset Allocation Portfolios
MainStay VP Conservative Allocation Portfolio
MainStay VP Growth Allocation Portfolio
MainStay VP Moderate Allocation Portfolio
MainStay VP Moderate Growth Allocation Portfolio
Manager
New York Life Investment Management LLC
New York, New York
Subadvisors
Brown Advisory LLC
Baltimore, Maryland
Candriam Belgium S.A.*
Brussels, Belgium
CBRE Clarion Securities LLC
Radnor, Pennsylvania
Epoch Investment Partners, Inc.
New York, New York
FIAM LLC
Smithfield, Rhode Island
IndexIQ Advisors LLC*
New York, New York
Janus Capital Management LLC
Denver, Colorado
MacKay Shields LLC*
New York, New York
Mellon Investments Corporation
Boston, Massachusetts
NYL Investors LLC*
New York, New York
Pacific Investment Management Company LLC
Newport Beach, California
Segall Bryant & Hamill, LLC
Chicago, Illinois
T. Rowe Price Associates, Inc.
Baltimore, Maryland
Winslow Capital Management, LLC
Minneapolis, Minnesota
Distributor
NYLIFE Distributors LLC*
Jersey City, New Jersey
Custodian
State Street Bank and Trust Company
Boston, Massachusetts
Independent Registered Public Accounting Firm
PricewaterhouseCoopers LLP
New York, New York
Legal Counsel
Dechert LLP
Washington, District of Columbia
Some Portfolios may not be available in all products.
| † | Fidelity Institutional AM is a registered trade mark of FMR LLC. Used with permission. |
| * | An affiliate of New York Life Investment Management LLC |
Not part of the Semiannual Report
2020 Semiannual Report
This report is for the general information of New York Life Variable Annuities and NYLIAC Variable Universal Life Insurance Products policyowners. It must be preceded or accompanied by the appropriate product(s) and funds prospectuses if it is given to anyone who is not an owner of a New York Life variable annuity policy or a NYLIAC Variable Universal Life Insurance Product. This report does not offer for sale or solicit orders to purchase securities.
The performance data quoted in this report represents past performance. Past performance is no guarantee of future results. Due to market volatility and other factors, current performance may be lower or higher than the figures shown. The most recent month-end performance summary for your variable annuity or variable life policy is available by calling 800-598-2019 and is updated periodically on www.newyorklife.com.
The New York Life Variable Annuities and NYLIAC Variable Universal Life Insurance Products are issued by New York Life Insurance and Annuity Corporation (a Delaware Corporation) and distributed by NYLIFE Distributors LLC (Member FINRA/SIPC).
New York Life Insurance Company
New York Life Insurance and Annuity Corporation (NYLIAC) (A Delaware Corporation)
51 Madison Avenue, Room 551
New York, NY 10010
www.newyorklife.com
Printed on recycled paper
nylinvestments.com
NYLIFE Distributors LLC, 30 Hudson Street, Jersey City, NJ 07302
New York Life Investment Management LLC is the investment manager to the MainStay VP Funds Trust
©2020 by NYLIFE Distributors LLC. All rights reserved.
You may obtain copies of the Prospectus and the Statement of Additional Information free of charge, upon request, by calling toll-free 800-598-2019 or writing to New York Life Insurance and Annuity Corporation, 51 Madison Avenue, New York, NY 10010.
| | | | |
| Not FDIC Insured | | No Bank Guarantee | | May Lose Value |
| | | | |
| 1781596 | | | | MSVPARM10-08/20 (NYLIAC) NI506 |
MainStay VP PIMCO Real Return Portfolio
Message from the President and Semiannual Report
Unaudited | June 30, 2020
Beginning on January 1, 2021, as permitted by regulations adopted by the Securities and Exchange Commission, paper copies of the MainStay VP Portfolio annual and semi-annual shareholder reports may no longer be sent by mail, unless you specifically request paper copies of the reports from the insurance company that offers your policy. Instead, the reports will be made available online, and you will be notified by mail each time a report is posted and provided with a website link to access the report. Instructions for requesting paper copies will be provided by your insurance company.
If you already elected to receive shareholder reports electronically, you will not be affected by this change and you need not take any action. At any time, you may elect to receive reports and other communications from the insurance company electronically by following the instructions provided by the insurance company.
You may elect to receive all future shareholder reports in paper form free of charge. You can inform the insurance company that you wish to receive paper copies of reports by following the instructions provided by the insurance company. Your election to receive reports in paper form will apply to all portfolio companies available under your contract.
| | | | | | | | |
| Not FDIC/NCUA Insured | | Not a Deposit | | May Lose Value | | No Bank Guarantee | | Not Insured by Any Government Agency |

This page intentionally left blank
Message from the President
High levels of volatility shook financial markets in response to the COVID-19 pandemic and an abrupt decline in global economic activity during the six months ended June 30, 2020.
Markets entered 2020 riding strong fourth quarter performance and an economic expansion of historic longevity. Most broad stock and bond indices began to dip in late February as growing numbers of COVID-19 cases were seen in hotspots around the world. On March 11, 2020, the World Health Organization acknowledged that the disease had reached pandemic proportions, with over 80,000 identified cases in China, thousands in Italy, South Korea and the United States, and more in dozens of additional countries. Governments and central banks pledged trillions of dollars to address the mounting economic and public health crisis; however, “stay-at-home” orders and other restrictions on non-essential activity caused global economic activity to slow. Most stocks and bonds lost significant ground in this challenging environment, with equities declining by roughly a third and the yield on high-yield credit indices shooting higher.
Policymakers responded with extraordinary speed to address the situation. In the United States, the Federal Reserve (“Fed”) cut interest rates to near zero and announced unlimited quantitative easing. With help from Treasury, the Fed later rolled out a series of lending facilities to directly support market functioning. In late March, the Federal government declared a national emergency; Congress passed, and the President signed, a $2 trillion CARES Act (The Coronavirus Aid, Relief, and Economic Security Act), with the promise of further assistance for consumers and businesses to come. This enormous wave of policy support helped fuel a rapid recovery in market pricing as stocks bounced back and credit spreads narrowed. Some states rushed to ease restrictions on travel and social gatherings, further fueling optimism that the effects of the pandemic might prove short lived. However, the final weeks of the reporting period saw infection rates beginning to rise in some of the first states to reopen, raising concerns that a second round of restrictive government policies might prove necessary, once again stifling economic activity.
Despite all the market volatility, the broadly based S&P 500® Index finished the first half of 2020 only slightly below its starting point and the technology-heavy NASDAQ Composite Index posted gains, closing in near record territory. Small-cap stocks tended to trail their large cap counterparts, as illustrated by the Russell 2000® Index’s loss of approximately 15%, while value-oriented stocks lagged growth-oriented issues. From a global perspective, U.S. stocks generally outperformed international equities, with emerging markets hit particularly hard by the flight from risk.
Fixed-income markets also experienced unusually high levels of volatility. Recognized safe havens, such as U.S. government bonds, attracted increased investment, driving yields lower and prices higher, positioning long-term Treasury bonds to deliver particularly strong gains. Investment-grade corporate bonds lost value in March before recovering in the closing months of the reporting period, while relatively speculative high-yield credit faced the brunt of risk-off sentiment. Emerging market debt underperformed most other bonds types as investors sought to minimize currency and sovereign risks.
Today, as we at New York Life Investments continue to track the ongoing health crisis and its financial ramifications, we are particularly mindful of the people at the heart of our enterprise—our colleagues and valued clients. By taking appropriate steps to minimize community spread of COVID-19 within our organization, we strive to safeguard the health of our investment professionals so they can continue to provide you, as a MainStay investor, with world class investment solutions in this rapidly evolving environment.
Sincerely,

Kirk C. Lehneis
President
The opinions expressed are as of the date of this report and are subject to change. There is no guarantee that any forecast made will come to pass. This material does not constitute investment advice and is not intended as an endorsement of any specific investment. Past performance is no guarantee of future results.
Not part of the Semiannual Report
Table of Contents
Investors should refer to the Portfolio’s Summary Prospectus and/or Prospectus and consider the Portfolio’s investment objectives, strategies, risks, charges and expenses carefully before investing. The Summary Prospectus and/or Prospectus contain this and other information about the Portfolio. You may obtain copies of the Portfolio’s Summary Prospectus and/or the Prospectus and the Statement of Additional Information free of charge, upon request, by calling toll-free 800-598-2019, by writing to New York Life Insurance and Annuity Corporation, 51 Madison Avenue, Room 251, New York, New York 10010 or by sending an email to MainStayShareholdersServices@nylim.com. These documents are also available at nylinvestments.com/vpdocuments. Please read the Summary Prospectus and/or Prospectus carefully before investing. MainStay VP Funds Trust portfolios are separate account options which are purchased through a variable insurance or variable annuity contract.
Investment and Performance Comparison1 (Unaudited)
Performance data quoted represents past performance. Past performance is no guarantee of future results. Because of market volatility and other factors, current performance may be lower or higher than the figures shown. Investment return and principal value will fluctuate, and as a result, when shares are redeemed, they may be worth more or less than their original cost. The performance table and graph do not reflect any deduction of sales charges, mortality and expense charges, contract charges or administrative charges. Please refer to the Performance Summary appropriate for your policy. For performance information current to the most recent month-end, please call 800-598-2019 or visit www.newyorklife.com.
Average Annual Total Returns for the Period-Ended June 30, 2020
| | | | | | | | | | | | | | | | |
| Class | | Inception
Date | | Six Months | | | One Year | | Five Years | | Since Inception | | Gross
Expense
Ratio2 | |
| | | | | | |
| Initial Class Shares | | 2/17/2012 | | | 6.03 | % | | 8.30% | | 3.55% | | 1.99% | | | 1.71 | % |
| Service Class Shares | | 2/17/2012 | | | 5.90 | | | 8.03 | | 3.29 | | 1.75 | | | 1.96 | |
| | | | | | | | | | | | | | | | |
| Benchmark Performance | | Six
Months | | | One Year | | | Five
Years | | | Since Inception | |
| | | | |
Bloomberg Barclays U.S. TIPS Index3 | | | 6.01 | % | | | 8.28 | % | | | 3.75 | % | | | 2.25 | % |
Morningstar Inflation-Protected Bond Category Average4 | | | 4.70 | | | | 6.78 | | | | 3.09 | | | | 1.64 | |
| 1. | Performance figures may reflect certain fee waivers and/or expense limitations, without which total returns may have been different. For information on current fee waivers and/or expense limitations (if any), please refer to the Notes to Financial Statements. |
| 2. | The gross expense ratios presented reflect the Portfolio’s “Total Annual Portfolio Operating Expenses” from the most recent Prospectus, as supplemented, and may differ from other expense ratios disclosed in this report. |
| 3. | The Bloomberg Barclays U.S. TIPS Index is the Portfolio’s primary broad-based securities market index for comparison purposes. The Bloomberg Barclays U.S. TIPS Index includes all publicly issued U.S. Treasury |
| | Inflation-Protected Securities (“TIPS”) that have at least one year remaining to maturity and are rated investment grade. Results assume reinvestment of all dividends and capital gains. An investment cannot be made directly in an index. |
| 4. | The Morningstar Inflation-Protected Bond Category Average is representative of funds that invest primarily in debt securities that adjust their principal values in line with the rate of inflation. These bonds can be issued by any organization, but the U.S. Treasury is currently the largest issuer for these types of securities. Results are based on average total returns of similar funds with all dividends and capital gain distributions reinvested. |
Cost in Dollars of a $1,000 Investment in MainStay VP PIMCO Real Return Portfolio (Unaudited)
The example below is intended to describe the fees and expenses borne by shareholders during the six-month period from January 1, 2020, to June 30, 2020, and the impact of those costs on your investment.
Example
As a shareholder of the Portfolio you incur two types of costs: (1) transaction costs, including exchange fees and sales charges (loads) on purchases (as applicable), and (2) ongoing costs, including management fees, distribution and/or service (12b-1) fees, and other Portfolio expenses (as applicable). This example is intended to help you understand your ongoing costs (in dollars) of investing in the Portfolio and to compare these costs with the ongoing costs of investing in other mutual funds. The example is based on an investment of $1,000 made at the beginning of the six-month period and held for the entire period from January 1, 2020, to June 30, 2020. Shares are only sold in connection with variable life and annuity contracts and the example does not reflect any contract level or transactional fees or expenses. If these costs had been included, your costs would have been higher.
This example illustrates your Portfolio’s ongoing costs in two ways:
Actual Expenses
The second and third data columns in the table below provide information about actual account values and actual expenses. You may use the information in these columns, together with the amount you invested, to estimate the expenses that you paid during the six months ended June 30, 2020. Simply divide your account value by $1,000
(for example, an $8,600 account value divided by $1,000 = 8.6), then multiply the result by the number under the heading entitled “Expenses Paid During Period” to estimate the expenses you paid on your account during this period.
Hypothetical Example for Comparison Purposes
The fourth and fifth data columns in the table below provide information about hypothetical account values and hypothetical expenses based on the Portfolio’s actual expense ratio and an assumed rate of return of 5% per year before expenses, which is not the Portfolio’s actual return. The hypothetical account values and expenses may not be used to estimate the actual ending account balances or expenses you paid for the six-month period shown. You may use this information to compare the ongoing costs of investing in the Portfolio with the ongoing costs of investing in other mutual funds. To do so, compare this 5% hypothetical example with the 5% hypothetical examples that appear in the shareholder reports of the other mutual funds.
Please note that the expenses shown in the table are meant to highlight your ongoing costs only and do not reflect any transactional costs, such as exchange fees or sales charges (loads). Therefore, the fourth and fifth data columns of the table are useful in comparing ongoing costs only and will not help you determine the relative total costs of owning different funds. In addition, if these transactional costs were included, your costs would have been higher.
| | | | | | | | | | | | | | | | | | | | | | |
| | | | | | | | | | | | | | | | | | |
| Share Class | | Beginning Account Value 1/1/20 | | | Ending Account Value (Based on Actual Returns and Expenses) 6/30/20 | | | Expenses Paid
During
Period1 | | | Ending Account
Value (Based
on Hypothetical
5% Annualized
Return and
Actual Expenses)
6/30/20 | | | Expenses
Paid
During
Period1 | | | Net Expense
Ratio
During
Period2,3 |
| | | | | | |
| Initial Class Shares | | $ | 1,000.00 | | | $ | 1,060.30 | | | $ | 5.12 | | | $ | 1,019.89 | | | $ | 5.02 | | | 1.00% |
| | | | | | |
| Service Class Shares | | $ | 1,000.00 | | | $ | 1,059.00 | | | $ | 6.40 | | | $ | 1,018.65 | | | $ | 6.27 | | | 1.25% |
| 1. | Expenses are equal to the Portfolio’s annualized expense ratio of each class multiplied by the average account value over the period, divided by 366 and multiplied by 182 (to reflect the six-month period). The table above represents the actual expenses incurred during the six-month period. In addition to the fees and expenses which the Portfolio bears directly, it also indirectly bears a pro rata share of the fees and expenses of the underlying funds in which it invests. Such indirect expenses are not included in the above-reported expense figures. |
| 2. | Expenses are equal to the Portfolio’s annualized expense ratio to reflect the six-month period. |
| 3. | Expenses are inclusive of dividends and interest on investments sold short. |
| | |
| 6 | | MainStay VP PIMCO Real Return Portfolio |
Portfolio Composition as of June 30, 2020 (Unaudited)
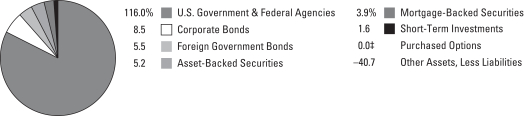
See Portfolio of Investments beginning on page 10 for specific holdings within these categories. The Portfolio’s holdings are subject to change.
| ‡ | Less than one-tenth of a percent. |
Top Ten Issuers Held as of June 30, 2020 (excluding short-term investments) (Unaudited)
| 1. | United States Treasury Inflation—Indexed Notes, 0.125%–1.125%, due 1/15/21–7/15/29 |
| 2. | United States Treasury Inflation—Indexed Bonds, 0.125%–3.375%, due 1/15/25–2/15/49 |
| 3. | Federal National Mortgage Association (Mortgage Pass-Through Securities), 2.00%–4.32%, due 11/1/34–9/1/50 TBA |
| 4. | Federal Home Loan Mortgage Corporation (Mortgage Pass-Through Securities), 2.50%, due 2/1/50 TBA |
| 5. | Italy Buoni Poliennali Del Tesoro, 1.40%, due 5/26/25 |
| 6. | Japanese Government CPI Linked Bond, 0.10%, due 3/10/28–3/10/29 |
| 7. | Nykredit Realkredit A/S, 1.00%–2.50%, due 10/1/47–10/1/50 |
| 8. | Jyske Realkredit A/S, 1.00%–2.50%, due 10/1/47–10/1/50 |
| 9. | New Zealand Government Inflation Linked Bond, 2.00%–3.00%, due 9/20/25–9/20/35 |
| 10. | Brazil Letras do Tesouro Nacional (zero coupon), due 10/1/20 |
Portfolio Management Discussion and Analysis (Unaudited)
Answers to the questions reflect the views of portfolio managers Stephen A. Rodosky and Daniel He of Pacific Investment Management Company LLC, the Portfolio’s Subadvisor.
How did MainStay VP PIMCO Real Return Portfolio perform relative to its benchmark and peers during the six months ended June 30, 2020?
For the six months ended June 30, 2020, MainStay VP PIMCO Real Return Portfolio returned 6.03% for Initial Class shares and 5.90% for Service Class shares. Over the same period, Initial Class shares outperformed and Service Class shares underperformed the 6.01% return of the Bloomberg Barclays U.S. TIPS Index, which is the Portfolio’s benchmark. As of June 30, 2020, both share classes outperformed the 4.70% return of the Morningstar Inflation-Protected Bond Category Average.1
What factors affected the Portfolio’s relative performance during the reporting period?
Several strategies made positive contributions to the Portfolio’s performance relative to the Bloomberg Barclays U.S. TIPS Index during the reporting period. (Contributions take weightings and total returns into account.) Positive strategies included:
| • | | Holding overweight exposure to U.S. interest rate positioning as U.S. rates fell amid pandemic-related fears and central bank policy softening; |
| • | | Maintaining underweight exposure to European and U.K. breakeven inflation exposure (the difference between nominal and real yields) as inflation expectations in the region fell; |
| • | | Tactically adopting U.S. breakeven inflation exposure as inflation expectations in the United States fluctuated; and |
| • | | Short in high-yield corporate exposure as credit spreads2 widened. |
Conversely, several strategies detracted from relative performance during the same period, including:
| • | | Holding positions in agency and non-agency mortgage-backed securities (“MBS”); |
| • | | Holding positions in investment-grade corporate credit; |
| • | | Holding a long position in the Russian ruble; and |
| • | | Holding underweight nominal duration3 positions in the United States, the U.K. and Germany. |
During the reporting period, how was the Portfolio’s performance materially affected by investments in derivatives?
Derivatives may be used in the Portfolio as a means of gaining or decreasing exposure to securities, markets or sectors; as a substitute for exposure that may not otherwise be accessible
through the use of cash bonds; for purposes of liquidity; or to take advantage of anticipated changes in market volatility.
U.S. breakeven inflation positioning, which was in part achieved through swaps, options and futures, made a positive contribution to the Portfolio’s relative performance during the reporting period. Exposure to German nominal duration, partially facilitated with futures and options, detracted from performance. Within spread sectors, underweight positioning on high-yield credit default swaps indices (“CDX”) enhanced performance. Finally, currency exposure employing currency forwards detracted from overall performance.
What was the Portfolio’s duration strategy during the reporting period?
The Portfolio’s average duration remained longer than that of the Bloomberg Barclays U.S. TIPS Index during the reporting period. More specifically, the Portfolio maintained overweight exposure to real duration in the United States. The Portfolio increased its U.S. breakeven inflation exposure during April, which enhanced relative performance during the second quarter of 2020 as inflation expectations rebounded.
The Portfolio’s average duration increased during the reporting period, standing at 8.08 years as of June 30, 2020.
What specific factors, risks or market forces prompted significant decisions for the Portfolio during the reporting period?
While the Portfolio entered the reporting period defensively positioned, it experienced bouts of volatility as risk markets sold off in March 2020 amid fears of a global pandemic. Inflation expectations fell, which was negative for performance as the Portfolio held overweight exposure to U.S. breakeven inflation. The Portfolio increased breakeven inflation exposure as breakeven inflation reached the cheapest levels ever. Breakeven inflation, among other risk assets, later rebounded from its lows, which bolstered the Portfolio’s relative performance. Spread sectors underperformed Treasury securities as concerns of a global shutdown weighed on corporate earnings projections, and mortgages sold off, negatively affecting the Portfolio’s out-of-benchmark exposure to Agency MBS, non-Agency MBS and corporate credit. Policy responses from the U.S. Federal Reserve and Congress eased financial stress on the corporate and MBS sectors, causing spreads to tighten from March levels. The Portfolio held a short high-yield CDX position, which partially offset negative performance from investment-grade credit and MBS.
| 1. | See page 5 for more information on benchmark and peer group returns. |
| 2. | The terms “spread” and “yield spread” may refer to the difference in yield between a security or type of security and comparable U.S. Treasury issues. The terms may also refer to the difference in yield between two specific securities or types of securities at a given time. |
| 3. | Duration is a measure of the price sensitivity of a fixed-income investment to changes in interest rates. Duration is expressed as a number of years and is considered a more accurate sensitivity gauge than average maturity. |
| | |
| 8 | | MainStay VP PIMCO Real Return Portfolio |
During the reporting period, which market segments were the strongest positive contributors to the Portfolio’s performance and which market segments were particularly weak?
Within real duration, a long position in U.S. Treasury Inflation-Protected Securities (“TIPS”) enhanced Portfolio performance as rates across the real yield curve4 declined. Underweight nominal duration positions in the United States, the U.K. and Germany detracted from performance amid falling global rates. Falling inflation expectations in the U.K. and eurozone were positive for performance given the Portfolio’s short exposure to U.K. and eurozone breakeven inflation rates. Out-of-benchmark exposures to spread sectors such as investment-grade corporate credit and residential MBS detracted as spreads widened. Lastly a long position in the Russian ruble detracted over the reporting period.
Did the Portfolio make any significant purchases or sales during the reporting period?
During the reporting period, the Portfolio maintained overweight exposure to overall duration relative to the Bloomberg Barclays
U.S. TIPS Index. As previously mentioned, the Portfolio increased its U.S. breakeven inflation exposure in April, as inflation expectations fell with rising pandemic fears. The Portfolio maintained this exposure through the remainder of the second quarter of 2020, benefiting from a rebound in inflation expectations. Lastly, the Portfolio maintained exposure to mortgages, corporate credit and emerging-market debt.
How was the Portfolio positioned at the end of the reporting period?
As of June 30, 2020, the Portfolio held overweight exposure to U.S. TIPS relative to the Bloomberg Barclays U.S. TIPS Index while maintaining a defensive posture toward nominal yields. The Portfolio also continued to hold out-of-Index exposure to MBS, corporate securities, bonds of non-U.S. developed nations and dollar-denominated emerging-market securities.
| 4. | The yield curve is a line that plots the yields of various securities of similar quality—typically U.S. Treasury issues—across a range of maturities. The U.S. Treasury yield curve serves as a benchmark for other debt and is used in economic forecasting. |
The opinions expressed are those of the portfolio managers as of the date of this report and are subject to change. There is no guarantee that any forecasts will come to pass. This material does not constitute investment advice and is not intended as an endorsement of any specific investment.
Not all MainStay VP Portfolios and/or share classes are available under all policies.
Portfolio of Investments June 30, 2020 (Unaudited)
| | | | | | | | |
| | | Principal
Amount | | | Value | |
Long-Term Bonds 139.1%† Asset-Backed Securities 5.2% | |
Other Asset-Backed Securities 5.2% | |
Argent Securities, Inc.
Series 2006-W4, Class A2C
0.345% (1 Month LIBOR + 0.16%), due 5/25/36 (a) | | $ | 322,038 | | | $ | 113,915 | |
Atrium XII
Series 2012-A, Class AR
1.928% (3 Month LIBOR + 0.83%), due 4/22/27 (a)(b) | | | 297,540 | | | | 294,872 | |
Black Diamond CLO, Ltd.
Series 2015-1A, Class A1R
0.65% (3 Month EURIBOR + 0.65%), due 10/3/29 (a)(b) | | EUR | 257,139 | | | | 287,853 | |
Catamaran CLO, Ltd.
Series 2013-1A, Class AR
1.841% (3 Month LIBOR + 0.85%), due 1/27/28 (a)(b) | | $ | 1,096,782 | | | | 1,078,532 | |
CoreVest American Finance Trust
Series 2017-1, Class A
2.968%, due 10/15/49 (b) | | | 66,397 | | | | 67,537 | |
Countrywide Asset-Backed Certificates
Series 2007-08, Class 1A1
0.375% (1 Month LIBOR + 0.19%), due 11/25/37 (a) | | | 757,187 | | | | 700,151 | |
Credit Suisse First Boston Mortgage Securities Corp.
Series 2001-HE17, Class A1
0.805% (1 Month LIBOR + 0.62%), due 1/25/32 (a) | | | 954,522 | | | | 891,622 | |
Credit-Based Asset Servicing & Securitization LLC
Series 2007-CB6, Class A3
0.405% (1 Month LIBOR + 0.22%), due 7/25/37 (a)(b) | | | 1,107,400 | | | | 838,860 | |
First Franklin Mortgage Loan Trust
Series 2006-FF17, Class A2
0.305% (1 Month LIBOR + 0.12%), due 12/25/36 (a) | | | 566,909 | | | | 469,181 | |
GSAA Home Equity Trust
Series 2006-17, Class A3A
0.425% (1 Month LIBOR + 0.24%), due 11/25/36 (a) | | | 1,289,145 | | | | 609,187 | |
Halcyon Loan Advisors Funding, Ltd.
Series 2015-1A, Class AR
2.055% (3 Month LIBOR + 0.92%), due 4/20/27 (a)(b) | | | 147,760 | | | | 146,424 | |
Home Equity Asset Trust (a) | | | | | | | | |
Series 2005-8, Class M2
0.635% (1 Month LIBOR + 0.45%), due 2/25/36 | | | 300,000 | | | | 278,972 | |
| | | | | | | | |
| | | Principal
Amount | | | Value | |
Other Asset-Backed Securities (continued) | |
Home Equity Asset Trust (continued) | | | | | | | | |
Series 2004-2, Class M1
0.98% (1 Month LIBOR + 0.795%), due 7/25/34 | | $ | 98,596 | | | $ | 96,275 | |
Jamestown CLO IV, Ltd.
Series 2014-4A, Class A1AR
1.909% (3 Month LIBOR + 0.69%), due 7/15/26 (a)(b) | | | 108,307 | | | | 107,973 | |
Jamestown CLO VII, Ltd.
Series 2015-7A, Class A1R
1.821% (3 Month LIBOR + 0.83%), due 7/25/27 (a)(b) | | | 1,056,743 | | | | 1,046,606 | |
Jubilee CLO B.V.
Series 2015-16A, Class A1R
0.442% (3 Month EURIBOR + 0.80%), due 12/15/29 (a)(b) | | EUR | 1,660,000 | | | | 1,842,107 | |
KVK CLO, Ltd.
Series 2013-1A, Class AR
2.211% (3 Month LIBOR + 0.90%), due 1/14/28 (a)(b) | | $ | 1,364,826 | | | | 1,349,435 | |
Legacy Mortgage Asset Trust
Series 2019-GS3, Class A1
3.75%, due 4/25/59 (b)(c) | | | 175,079 | | | | 177,740 | |
Long Beach Mortgage Loan Trust
Series 2006-7, Class 2A2
0.305% (1 Month LIBOR + 0.12%), due 8/25/36 (a) | | | 274,082 | | | | 134,276 | |
MacKay Shields Euro CLO
Series 2A, Class A
1.55% (3 Month EURIBOR + 1.55%), due 8/15/33 (a)(b) | | EUR | 250,000 | | | | 280,875 | |
Man GLG Euro CLO
Series 2A, Class A1R
0.87% (3 Month EURIBOR + 0.87%), due 1/15/30 (a)(b) | | | 250,000 | | | | 277,669 | |
Marathon CLO V, Ltd.
Series 2013-5A, Class A1R
1.244% (3 Month LIBOR + 0.87%), due 11/21/27 (a)(b) | | $ | 1,516,329 | | | | 1,483,308 | |
Marlette Funding Trust
Series 2019-3A, Class A
2.69%, due 9/17/29 (b) | | | 98,948 | | | | 99,469 | |
MASTR Asset Backed Securities Trust
Series 2006-WMC4, Class A5
0.335% (1 Month LIBOR + 0.15%), due 10/25/36 (a) | | | 129,913 | | | | 53,098 | |
Morgan Stanley ABS Capital I, Inc. Trust
Series 2005-WMC1, Class M3
0.965% (1 Month LIBOR + 0.78%), due 1/25/35 (a) | | | 269,563 | | | | 258,876 | |
| | | | |
| 10 | | MainStay VP PIMCO Real Return Portfolio | | The notes to the financial statements are an integral part of,
and should be read in conjunction with, the financial statements. |
| | | | | | | | |
| | | Principal
Amount | | | Value | |
| Asset-Backed Securities (continued) | |
Other Asset-Backed Securities (continued) | |
New Century Home Equity Loan Trust
Series 2004-04, Class M1
0.95% (1 Month LIBOR + 0.765%), due 2/25/35 (a) | | $ | 76,232 | | | $ | 72,617 | |
New Residential Mortgage Loan Trust
Series 2018-3A, Class A1
4.50%, due 5/25/58 (b)(d) | | | 214,371 | | | | 231,820 | |
OCP CLO, Ltd. (a)(b) | | | | | | | | |
Series 2015-10A, Class A1R
1.811% (3 Month LIBOR + 0.82%), due 10/26/27 | | | 1,257,784 | | | | 1,247,413 | |
Series 2015-9A, Class A1R
2.019% (3 Month LIBOR + 0.80%), due 7/15/27 | | | 169,103 | | | | 167,960 | |
RASC Trust (a) | | | | | | | | |
Series 2006-EMX4, Class A4
0.415% (1 Month LIBOR + 0.23%), due 6/25/36 | | | 821,944 | | | | 783,545 | |
Series 2006-KS6, Class A4
0.435% (1 Month LIBOR + 0.25%), due 8/25/36 | | | 295,551 | | | | 291,277 | |
Series 2005-KS8, Class M4
0.775% (1 Month LIBOR + 0.59%), due 8/25/35 | | | 600,000 | | | | 591,374 | |
Series 2005-EMX1, Class M2
1.28% (1 Month LIBOR + 1.095%), due 3/25/35 | | | 631,322 | | | | 599,601 | |
Saxon Asset Securities Trust
Series 2007-03, Class 1A
0.495% (1 Month LIBOR + 0.31%), due 9/25/37 (a) | | | 172,733 | | | | 161,410 | |
Securitized Asset-Backed Receivables LLC Trust (a) | | | | | | | | |
Series 2006-HE2, Class A2C
0.335% (1 Month LIBOR + 0.15%), due 7/25/36 | | | 228,194 | | | | 121,296 | |
Series 2006-HE1, Class A2C
0.345% (1 Month LIBOR + 0.16%), due 7/25/36 | | | 633,440 | | | | 294,824 | |
SLM Student Loan Trust (a) | | | | | | | | |
Series 2003-5, Class A5
0.00% (3 Month EURIBOR + 0.27%), due 6/17/24 | | EUR | 22,944 | | | | 25,702 | |
Series 2004-2, Class A5
0.019% (3 Month EURIBOR + 0.18%), due 1/25/24 | | | 64,574 | | | | 72,530 | |
Series 2004-3A, Class A6B
1.541% (3 Month LIBOR + 0.55%), due 10/25/64 (b) | | $ | 479,464 | | | | 455,567 | |
| | | | | | | | |
| | | Principal
Amount | | | Value | |
Other Asset-Backed Securities (continued) | |
SLM Student Loan Trust (continued) | | | | | | | | |
Series 2011-B, Class A3
2.435% (1 Month LIBOR + 2.25%), due 6/16/42 (a)(b) | | $ | 55,559 | | | $ | 55,713 | |
Soundview Home Equity Loan Trust (a) | | | | | | | | |
Series 2007-OPT2, Class 2A3
0.365% (1 Month LIBOR + 0.18%), due 7/25/37 | | | 231,523 | | | | 213,599 | |
Series 2007-OPT1, Class 1A1
0.385% (1 Month LIBOR + 0.20%), due 6/25/37 | | | 352,021 | | | | 274,844 | |
SpringCastle Funding Asset-Backed Notes
Series 2019-AA, Class A
3.20%, due 5/27/36 (b) | | | 725,313 | | | | 733,097 | |
Stanwich Mortgage Loan LLC
Series 2019-NPB1, Class A1
3.375%, due 8/15/24 (b)(c) | | | 198,609 | | | | 198,390 | |
Symphony CLO XIV, Ltd.
Series 2014-14A, Class AR
2.261% (3 Month LIBOR + 0.95%), due 7/14/26 (a)(b) | | | 258,684 | | | | 256,375 | |
THL Credit Wind River CLO, Ltd.
Series 2012-1A, Class AR2
2.099% (3 Month LIBOR + 0.88%), due 1/15/26 (a)(b) | | | 95,182 | | | | 94,874 | |
Venture CLO, Ltd.
Series 2018-35A, Class AS
2.248% (3 Month LIBOR + 1.15%), due 10/22/31 (a)(b) | | | 200,000 | | | | 195,161 | |
Venture XX CLO, Ltd.
Series 2015-20A, Class AR
2.039% (3 Month LIBOR + 0.82%), due 4/15/27 (a)(b) | | | 661,479 | | | | 654,420 | |
Venture XXI CLO, Ltd.
Series 2015-21A, Class AR
2.099% (3 Month LIBOR + 0.88%), due 7/15/27 (a)(b) | | | 349,741 | | | | 345,362 | |
Voya CLO, Ltd.
Series 2014-3A, Class A1R
1.711% (3 Month LIBOR + 0.72%), due 7/25/26 (a)(b) | | | 224,492 | | | | 223,237 | |
Wachovia Mortgage Loan Trust
Series 2005-WMC1, Class M1
0.845% (1 Month LIBOR + 0.66%), due 10/25/35 (a) | | | 9,196 | | | | 9,246 | |
Z Capital Credit Partners CLO, Ltd.
Series 2015-1A, Class A1R
2.126% (3 Month LIBOR + 0.95%), due 7/16/27 (a)(b) | | | 467,805 | | | | 460,510 | |
| | | | | | | | |
Total Asset-Backed Securities
(Cost $22,137,837) | | | | | | | 21,816,577 | |
| | | | | | | | |
| | | | | | |
The notes to the financial statements are an integral part of,
and should be read in conjunction with, the financial statements. | | | | | 11 | |
Portfolio of Investments June 30, 2020 (Unaudited) (continued)
| | | | | | | | |
| | | Principal
Amount | | | Value | |
| Corporate Bonds 8.5% | |
Agriculture 0.1% | |
Reynolds American, Inc.
4.00%, due 6/12/22 | | $ | 200,000 | | | $ | 211,298 | |
| | | | | | | | |
|
Auto Manufacturers 1.0% | |
BMW U.S. Capital LLC
3.40%, due 8/13/21 (b) | | | 600,000 | | | | 615,884 | |
FCE Bank PLC | | | | | | | | |
Series Reg S
0.221% (3 Month EURIBOR + 0.50%), due 8/26/20 (a) | | EUR | 800,000 | | | | 892,005 | |
Series Reg S
1.875%, due 6/24/21 | | | 900,000 | | | | 987,833 | |
Nissan Motor Acceptance Corp. (b) | | | | | | | | |
1.90%, due 9/14/21 | | $ | 100,000 | | | | 98,191 | |
2.65%, due 7/13/22 | | | 200,000 | | | | 196,908 | |
Volkswagen Group of America Finance LLC (b) | | | | | | | | |
1.157% (3 Month LIBOR + 0.86%), due 9/24/21 (a) | | | 900,000 | | | | 896,804 | |
4.00%, due 11/12/21 | | | 600,000 | | | | 624,602 | |
| | | | | | | | |
| | | | | | | 4,312,227 | |
| | | | | | | | |
Banks 2.6% | |
Banco Bilbao Vizcaya Argentaria S.A.
Series Reg S
5.875% (EUR 5 Year Interest Swap Rate + 5.66%), due 9/24/23 (a)(e) | | EUR | 400,000 | | | | 435,952 | |
Bank of America Corp. 5.875%, (3 Month LIBOR + 2.931%) due 3/15/28 (e)(f) | | $ | 190,000 | | | | 194,093 | |
Cooperatieve Rabobank U.A.
Series Reg S
6.625% (EUR 5 Year Interest Swap Rate + 6.697%), due 6/29/21 (a)(e) | | EUR | 200,000 | | | | 230,598 | |
Credit Suisse Group Funding Guernsey, Ltd.
3.80%, due 9/15/22 | | $ | 300,000 | | | | 318,740 | |
Deutsche Bank A.G.
4.25%, due 10/14/21 | | | 1,400,000 | | | | 1,436,417 | |
ING Bank N.V.
2.625%, due 12/5/22 (b) | | | 400,000 | | | | 419,480 | |
Intesa Sanpaolo S.p.A.
6.50%, due 2/24/21 (b) | | | 400,000 | | | | 411,261 | |
Lloyds Banking Group PLC (a) | | | | | | | | |
1.106% (3 Month LIBOR + 0.80%), due 6/21/21 | | | 400,000 | | | | 401,672 | |
Series Reg S
4.947% (EUAM DB05+ 5.29%), due 6/27/25 (e) | | EUR | 200,000 | | | | 217,678 | |
| | | | | | | | |
| | | Principal
Amount | | | Value | |
Banks (continued) | |
Nykredit Realkredit A/S | | | | | | | | |
Series Reg S
1.00%, due 10/1/50 | | DKK | 28,468,867 | | | $ | 4,262,282 | |
Series Reg S
2.50%, due 10/1/47 | | | 3,930 | | | | 622 | |
Royal Bank of Scotland Group PLC | | | | | | | | |
1.847% (3 Month LIBOR + 1.55%), due 6/25/24 (a) | | $ | 300,000 | | | | 300,175 | |
4.519%, due 6/25/24 (f) | | | 200,000 | | | | 217,184 | |
UniCredit S.p.A.
7.83%, due 12/4/23 (b) | | | 1,800,000 | | | | 2,074,426 | |
| | | | | | | | |
| | | | | | | 10,920,580 | |
| | | | | | | | |
Beverages 0.6% | |
Keurig Dr. Pepper, Inc. | | | | | | | | |
3.551%, due 5/25/21 | | | 1,400,000 | | | | 1,438,906 | |
4.057%, due 5/25/23 | | | 100,000 | | | | 108,981 | |
Pernod-Ricard S.A.
5.75%, due 4/7/21 (b) | | | 794,000 | | | | 824,776 | |
| | | | | | | | |
| | | | | | | 2,372,663 | |
| | | | | | | | |
Biotechnology 0.1% | |
Amgen, Inc.
3.625%, due 5/15/22 | | | 400,000 | | | | 418,527 | |
| | | | | | | | |
|
Commercial Services 0.1% | |
ERAC USA Finance LLC
4.50%, due 8/16/21 (b) | | | 400,000 | | | | 412,801 | |
RELX Capital, Inc.
3.50%, due 3/16/23 | | | 100,000 | | | | 106,638 | |
| | | | | | | | |
| | | | | | | 519,439 | |
| | | | | | | | |
Distribution & Wholesale 0.1% | |
Toyota Tsusho Corp.
Series Reg S
3.625%, due 9/13/23 | | | 200,000 | | | | 214,107 | |
| | | | | | | | |
|
Diversified Financial Services 1.3% | |
AerCap Ireland Capital DAC / AerCap Global Aviation Trust
4.625%, due 10/30/20 | | | 100,000 | | | | 100,435 | |
Ally Financial, Inc. | | | | | | | | |
4.125%, due 2/13/22 | | | 200,000 | | | | 205,506 | |
4.25%, due 4/15/21 | | | 100,000 | | | | 101,803 | |
Avolon Holdings Funding, Ltd.
5.50%, due 1/15/23 (b) | | | 100,000 | | | | 94,152 | |
BOC Aviation, Ltd.
2.375%, due 9/15/21 (b) | | | 200,000 | | | | 199,914 | |
Jyske Realkredit A/S | | | | | | | | |
Series Reg S
1.00%, due 10/1/50 | | DKK | 18,105,195 | | | | 2,712,026 | |
Series Reg S
2.50%, due 10/1/47 | | | 11,472 | | | | 1,816 | |
| | | | |
| 12 | | MainStay VP PIMCO Real Return Portfolio | | The notes to the financial statements are an integral part of,
and should be read in conjunction with, the financial statements. |
| | | | | | | | |
| | | Principal
Amount | | | Value | |
| Corporate Bonds (continued) | |
Diversified Financial Services (continued) | |
Mitsubishi UFJ Lease & Finance Co., Ltd.
2.652%, due 9/19/22 (b) | | $ | 200,000 | | | $ | 205,246 | |
Nordea Kredit Realkreditaktieselskab | | | | | | | | |
Series Reg S
1.00%, due 10/1/50 | | DKK | 11,630,325 | | | | 1,740,384 | |
2.50%, due 10/1/47 | | | 4,595 | | | | 727 | |
Park Aerospace Holdings, Ltd.
5.25%, due 8/15/22 (b) | | $ | 200,000 | | | | 187,735 | |
Realkredit Danmark A/S
Series Reg S
2.50%, due 4/1/47 | | DKK | 20,080 | | | | 3,170 | |
| | | | | | | | |
| | | | | | | 5,552,914 | |
| | | | | | | | |
Electric 0.1% | |
American Electric Power Co., Inc.
3.65%, due 12/1/21 | | $ | 100,000 | | | | 104,288 | |
LG&E & KU Energy LLC
4.375%, due 10/1/21 | | | 100,000 | | | | 103,384 | |
Sempra Energy
0.763% (3 Month LIBOR + 0.45%), due 3/15/21 (a) | | | 100,000 | | | | 100,167 | |
| | | | | | | | |
| | | | | | | 307,839 | |
| | | | | | | | |
Food 0.2% | |
Campbell Soup Co.
3.30%, due 3/15/21 | | | 300,000 | | | | 305,071 | |
Conagra Brands, Inc.
3.25%, due 9/15/22 | | | 200,000 | | | | 209,821 | |
Danone S.A. (b) | | | | | | | | |
2.077%, due 11/2/21 | | | 200,000 | | | | 203,262 | |
3.00%, due 6/15/22 | | | 200,000 | | | | 208,446 | |
| | | | | | | | |
| | | | | | | 926,600 | |
| | | | | | | | |
Gas 0.3% | |
Southern Co. Gas Capital Corp.
3.50%, due 9/15/21 | | | 1,400,000 | | | | 1,438,506 | |
| | | | | | | | |
|
Home Builders 0.0%‡ | |
D.R. Horton, Inc.
5.75%, due 8/15/23 | | | 100,000 | | | | 113,013 | |
| | | | | | | | |
|
Home Furnishing 0.2% | |
Panasonic Corp.
2.536%, due 7/19/22 (b) | | | 800,000 | | | | 823,077 | |
| | | | | | | | |
|
Machinery—Diversified 0.1% | |
Westinghouse Air Brake Technologies Corp.
1.613% (3 Month LIBOR + 1.30%), due 9/15/21 (a) | | | 600,000 | | | | 600,000 | |
| | | | | | | | |
| | | | | | | | |
| | | Principal
Amount | | | Value | |
Media 0.2% | |
Charter Communications Operating LLC / Charter Communications Operating Capital Corp.
4.464%, due 7/23/22 | | $ | 600,000 | | | $ | 639,956 | |
Cox Communications, Inc.
3.25%, due 12/15/22 (b) | | | 200,000 | | | | 210,766 | |
| | | | | | | | |
| | | | | | | 850,722 | |
| | | | | | | | |
Miscellaneous—Manufacturing 0.1% | |
Textron, Inc.
0.998% (3 Month LIBOR + 0.55%), due 11/10/20 (a) | | | 580,000 | | | | 578,245 | |
| | | | | | | | |
|
Oil & Gas 0.2% | |
Petrobras Global Finance B.V. | | | | | | | | |
5.093%, due 1/15/30 (b) | | | 543,000 | | | | 540,828 | |
6.125%, due 1/17/22 | | | 33,000 | | | | 34,567 | |
YPF S.A
33.088% (BADLARPP Index + 6.00%), due 3/4/21 (a)(g) | | ARS | 3,130,000 | | | | 47,858 | |
| | | | | | | | |
| | | | | | | 623,253 | |
| | | | | | | | |
Pharmaceuticals 0.3% | |
Cigna Corp.
3.75%, due 7/15/23 | | $ | 133,000 | | | | 144,369 | |
CVS Health��Corp. | | | | | | | | |
2.125%, due 6/1/21 | | | 800,000 | | | | 810,539 | |
3.70%, due 3/9/23 | | | 200,000 | | | | 214,787 | |
| | | | | | | | |
| | | | | | | 1,169,695 | |
| | | | | | | | |
Pipelines 0.2% | |
Florida Gas Transmission Co. LLC
5.45%, due 7/15/20 (b) | | | 700,000 | | | | 701,040 | |
| | | | | | | | |
|
Real Estate Investment Trusts 0.1% | |
American Tower Corp.
3.30%, due 2/15/21 | | | 300,000 | | | | 305,099 | |
| | | | | | | | |
|
Semiconductors 0.1% | |
NXP B.V. / NXP Funding LLC
3.875%, due 9/1/22 (b) | | | 400,000 | | | | 422,854 | |
| | | | | | | | |
|
Software 0.1% | |
Activision Blizzard, Inc.
2.60%, due 6/15/22 | | | 200,000 | | | | 207,540 | |
| | | | | | | | |
|
Telecommunications 0.4% | |
AT&T, Inc. | | | | | | | | |
1.10% (3 Month LIBOR + 0.75%), due 6/1/21 (a) | | | 500,000 | | | | 502,533 | |
5.15%, due 2/15/50 | | | 300,000 | | | | 384,684 | |
5.30%, due 8/15/58 | | | 100,000 | | | | 129,874 | |
| | | | | | |
The notes to the financial statements are an integral part of,
and should be read in conjunction with, the financial statements. | | | | | 13 | |
Portfolio of Investments June 30, 2020 (Unaudited) (continued)
| | | | | | | | |
| | | Principal
Amount | | | Value | |
| Corporate Bonds (continued) | |
Telecommunications (continued) | |
Sprint Corp.
7.25%, due 9/15/21 | | $ | 300,000 | | | $ | 314,505 | |
Telstra Corp., Ltd.
4.80%, due 10/12/21 (b) | | | 300,000 | | | | 314,175 | |
| | | | | | | | |
| | | | | | | 1,645,771 | |
| | | | | | | | |
Trucking & Leasing 0.0%‡ | |
Penske Truck Leasing Co., L.P. / PTL Finance Corp.
3.65%, due 7/29/21 (b) | | | 200,000 | | | | 204,707 | |
| | | | | | | | |
Total Corporate Bonds
(Cost $34,901,285) | | | | | | | 35,439,716 | |
| | | | | | | | |
|
| Foreign Government Bonds 5.5% | |
Argentina 0.0%‡ | |
Argentina Bocon
30.022%, due 10/4/22 (d)(g) | | ARS | 63,170 | | | | 1,255 | |
Bonos del Tesoro Nacional en Pesos Badlar
26.415% (BADLARPP Index + 2.00%), due 4/3/22 (a)(g) | | | 2,854,000 | | | | 41,317 | |
| | | | | | | | |
| | | | | | | 42,572 | |
| | | | | | | | |
Australia 0.5% | |
Australia Government Bond | | | | | | | | |
Series Reg S
1.25%, due 2/21/22 | | AUD | 980,000 | | | | 802,766 | |
Series Reg S
3.00%, due 9/20/25 | | | 1,450,000 | | | | 1,462,173 | |
| | | | | | | | |
| | | | | | | 2,264,939 | |
| | | | | | | | |
Brazil 0.6% | |
Brazil Letras do Tesouro Nacional
(zero coupon), due 10/1/20 | | BRL | 13,706,000 | | | | 2,507,176 | |
| | | | | | | | |
|
Canada 0.2% | |
Canadian Government Real Return Bond
4.25%, due 12/1/26 | | CAD | 927,270 | | | | 886,159 | |
| | | | | | | | |
|
Italy 2.1% | |
Italy Buoni Poliennali Del Tesoro
Series Reg S
1.40%, due 5/26/25 (b) | | EUR | 7,594,300 | | | | 8,713,689 | |
| | | | | | | | |
|
Japan 1.1% | |
Japanese Government CPI Linked Bond | | | | | | | | |
0.10%, due 3/10/28 | | JPY | 209,055,510 | | | | 1,928,015 | |
0.10%, due 3/10/29 | | | 263,778,480 | | | | 2,441,249 | |
| | | | | | | | |
| | | | | | | 4,369,264 | |
| | | | | | | | |
| | | | | | | | |
| | | Principal
Amount | | | Value | |
New Zealand 0.6% | |
New Zealand Government Inflation Linked Bond | | | | | | | | |
Series Reg S
2.00%, due 9/20/25 | | NZD | 1,800,000 | | | $ | 1,410,133 | |
Series Reg S
2.50%, due 9/20/35 | | | 800,000 | | | | 737,103 | |
Series Reg S
3.00%, due 9/20/30 | | | 500,000 | | | | 454,781 | |
| | | | | | | | |
| | | | | | | 2,602,017 | |
| | | | | | | | |
Peru 0.3% | |
Peru Government Bond (b) | | | | | | | | |
Series Reg S
5.94%, due 2/12/29 | | PEN | 1,300,000 | | | | 423,696 | |
Series Reg S
6.15%, due 8/12/32 | | | 2,600,000 | | | | 838,852 | |
| | | | | | | | |
| | | | | | | 1,262,548 | |
| | | | | | | | |
Qatar 0.1% | |
Qatar Government International Bond
Series Reg S
3.875%, due 4/23/23 | | $ | 300,000 | | | | 321,708 | |
| | | | | | | | |
Total Foreign Government Bonds
(Cost $22,713,387) | | | | | | | 22,970,072 | |
| | | | | | | | |
|
| Mortgage-Backed Securities 3.9% | |
Agency (Collateralized Mortgage Obligations) 1.1% | |
Federal Home Loan Mortgage Corporation REMIC (Collateralized Mortgage Obligations)
Series 4779, Class WF
0.72% (1 Month LIBOR + 0.35%), due 7/15/44 (a) | | | 330,636 | | | | 331,560 | |
Federal Home Loan Mortgage Corporation Strips
Series 278, Class F1
0.635% (1 Month LIBOR + 0.45%), due 9/15/42 (a) | | | 455,352 | | | | 460,931 | |
Federal National Mortgage Association REMICS REMIC, Series 2019-5, Class FA
0.585% (1 Month LIBOR + 0.40%), due 3/25/49 (a) | | | 1,407,207 | | | | 1,405,894 | |
Government National Mortgage Association (a) | | | | | | | | |
REMIC, Series 2019-20, Class FE
0.59% (1 Month LIBOR + 0.40%), due 2/20/49 | | | 1,286,386 | | | | 1,284,090 | |
REMIC, Series 2018-H15, Class FG
2.266% (12 Month LIBOR + 0.15%), due 8/20/68 | | | 615,986 | | | | 609,505 | |
| | | | |
| 14 | | MainStay VP PIMCO Real Return Portfolio | | The notes to the financial statements are an integral part of,
and should be read in conjunction with, the financial statements. |
| | | | | | | | |
| | | Principal
Amount | | | Value | |
| Mortgage-Backed Securities (continued) | |
Agency (Collateralized Mortgage Obligations) (continued) | |
Government National Mortgage Association (Mortgage Pass-Through Securities)
Series 2017-H10, Class FB
1.904% (12 Month LIBOR + 0.75%), due 4/20/67 (a) | | $ | 341,366 | | | $ | 348,027 | |
| | | | | | | | |
| | | | | | | 4,440,007 | |
| | | | | | | | |
Commercial Mortgage Loans
(Collateralized Mortgage Obligations) 0.1% | |
AREIT Trust
Series 2020-CRE4, Class A
2.805% (1 Month LIBOR + 2.62%), due 4/14/37 (a)(b) | | | 400,000 | | | | 400,651 | |
| | | | | | | | |
|
Whole Loan (Collateralized Mortgage Obligations) 2.7% | |
CHL Mortgage Pass-Through Trust
Series 2007-1, Class A1
6.00%, due 3/25/37 | | | 41,744 | | | | 32,921 | |
Citigroup Mortgage Loan Trust
Series 2007-AR4, Class 1A1A
4.004%, due 3/25/37 (h) | | | 365,604 | | | | 334,419 | |
Citigroup Mortgage Loan Trust, Inc. | | | | | | | | |
Series 2019-B, Class A1
3.258%, due 4/25/66 (b)(d) | | | 274,378 | | | | 273,584 | |
Series 2004-NCM2, Class 1CB1
5.50%, due 8/25/34 | | | 244,185 | | | | 246,820 | |
Countrywide Alternative Loan Trust | | | | | | | | |
Series 2005-29CB, Class A4
5.00%, due 7/25/35 | | | 47,968 | | | | 39,430 | |
Series 2007-1T1, Class 1A1
6.00%, due 3/25/37 | | | 714,769 | | | | 444,502 | |
Credit Suisse Mortgage Trust (b) | | | | | | | | |
Series 2019-RPL9, Class A1
3.092%, due 10/27/59 (d) | | | 973,375 | | | | 1,000,342 | |
Series 2019-RPL4, Class A1
3.522%, due 8/26/58 | | | 277,137 | | | | 282,972 | |
Eurosail-UK PLC (a) | | | | | | | | |
Series 2007-3A, Class A3C
1.143% (3 Month LIBOR + 0.95%), due 6/13/45 (b) | | | 45,599 | | | | 55,749 | |
Series 2007-3X, Class A3A, Reg S
1.143% (3 Month LIBOR + 0.95%), due 6/13/45 | | GBP | 171,015 | | | | 209,083 | |
Series 2007-3X, Class A3C, Reg S
1.143% (3 Month LIBOR + 0.95%), due 6/13/45 | | | 45,599 | | | | 55,749 | |
GreenPoint Mortgage Funding Trust
Series 2006-AR4, Class A6A
0.365% (1 Month LIBOR + 0.18%), due 9/25/46 (a) | | $ | 102,243 | | | | 90,647 | |
| | | | | | | | |
| | | Principal
Amount | | | Value | |
Whole Loan (Collateralized Mortgage Obligations) (continued) | |
IndyMac INDEX Mortgage Loan Trust
Series 2005-AR14, Class 1A1A
0.465% (1 Month LIBOR + 0.28%), due 7/25/35 (a) | | $ | 1,068,439 | | | $ | 867,734 | |
Series 2005-AR12 Class 2A1A 0.665% (1 Month LIBOR + 0.48%), due 7/25/35 (a) | | | 150,533 | | | | 137,214 | |
Lehman XS Trust
Series 2007-20N, Class A1
1.335% (1 Month LIBOR + 1.15%), due 12/25/37 (a) | | | 50,948 | | | | 45,791 | |
Merrill Lynch Mortgage Investors Trust
Series 2005-A4, Class 1A
3.496%, due 7/25/35 (h) | | | 202,682 | | | | 141,674 | |
New Residential Mortgage Loan Trust
Series 2019-RPL3, Class A1
2.75%, due 7/25/59 (b)(d) | | | 369,775 | | | | 387,664 | |
OBX Trust
Series 2018-1, Class A2
0.835% (1 Month LIBOR + 0.65%), due 6/25/57 (a)(b) | | | 62,437 | | | | 61,617 | |
Opteum Mortgage Acceptance Corporation
Series 2005-2, Class M7
1.985% (1 Month LIBOR + 1.80%), due 4/25/35 (a) | | | 100,000 | | | | 91,427 | |
Paragon Mortgages No. 13 PLC
Series 13X, Class A1, Reg S
0.908% (3 Month LIBOR + 0.24%), due 1/15/39 (a) | | GBP | 1,942,181 | | | | 2,302,753 | |
Residential Asset Securitization Trust
Series 2006-A10, Class A5
6.50%, due 9/25/36 | | $ | 258,297 | | | | 156,230 | |
Silverstone Master Issuer PLC
Series 2019-1A, Class 2A
1.235% (SONIA + 0.75%), due 1/21/70 (a)(b) | | GBP | 219,000 | | | | 272,954 | |
Structured Asset Securities Corp. Mortgage Loan Trust
Series 2005-OPT1, Class A2
0.395% (1 Month LIBOR + 0.21%), due 11/25/35 (a) | | $ | 1,201,876 | | | | 1,188,991 | |
Towd Point Mortgage Funding
Series 2019-GR4A, Class A1
1.677% (3 Month LIBOR + 1.025%), due 10/20/51 (a)(b) | | GBP | 1,110,900 | | | | 1,375,763 | |
Trinity Square PLC
Series 2015-1A, Class A
1.818% (3 Month LIBOR + 1.15%), due 7/15/51 (a)(b) | | | 528,161 | | | | 654,606 | |
| | | | | | |
The notes to the financial statements are an integral part of,
and should be read in conjunction with, the financial statements. | | | | | 15 | |
Portfolio of Investments June 30, 2020 (Unaudited) (continued)
| | | | | | | | |
| | | Principal Amount | | | Value | |
| Mortgage-Backed Securities (continued) | |
Whole Loan (Collateralized Mortgage Obligations) (continued) | |
Washington Mutual Mortgage Pass-Through Certificates | | | | | | | | |
Series 2007-HY1, Class A2A
0.345% (1 Month LIBOR + 0.16%), due 2/25/37 (a) | | $ | 659,094 | | | $ | 531,887 | |
Series 2006-5, Class 2CB1
6.00%, due 7/25/36 | | | 46,208 | | | | 40,060 | |
| | | | | | | | |
| | | | | | | 11,322,583 | |
| | | | | | | | |
Total Mortgage-Backed Securities
(Cost $17,029,707) | | | | | | | 16,163,241 | |
| | | | | | | | |
|
| U.S. Government & Federal Agencies 116.0% | |
Federal Home Loan Mortgage Corporation
(Mortgage Pass-Through Securities) 3.6% | |
2.50%, due 2/1/50 TBA (i) | | | 14,600,000 | | | | 15,164,833 | |
| | | | | | | | |
|
Federal National Mortgage Association
(Mortgage Pass-Through Securities) 7.7% | |
2.00%, due 3/1/50 TBA (i) | | | 2,700,000 | | | | 2,751,510 | |
2.89% (12 Month Monthly Treasury Average Index + 1.20%), due 6/1/43 (a) | | | 240,254 | | | | 240,794 | |
3.00%, due 12/1/49 TBA (i) | | | 8,500,000 | | | | 8,925,337 | |
3.50%, due 4/1/49 TBA (i) | | | 12,900,000 | | | | 13,562,921 | |
4.00%, due 8/1/48 TBA (i) | | | 800,000 | | | | 845,910 | |
4.00%, due 8/1/48 TBA (i) | | | 5,000,000 | | | | 5,301,269 | |
4.122% (11th District Cost of Funds Index+1.926%), due 12/1/36 (a) | | | 205,766 | | | | 212,360 | |
4.32% (1 Year Treasury Constant Maturity Rate + 2.36%), due 11/1/34 (a) | | | 280,632 | | | | 294,601 | |
| | | | | | | | |
| | | | | | | 32,134,702 | |
| | | | | | | | |
United States Treasury Notes 0.1% | |
1.75%, due 12/31/24 (j) | | | 330,000 | | | | 352,095 | |
| | | | | | | | |
|
United States Treasury Inflation—Indexed Bonds 36.9% | |
0.125%, due 1/15/30 | | | 956,880 | | | | 1,033,719 | |
0.375%, due 7/15/27 (j) | | | 19,411,182 | | | | 21,095,740 | |
0.625%, due 2/15/43 | | | 1,985,448 | | | | 2,334,845 | |
0.75%, due 2/15/42 | | | 3,892,776 | | | | 4,657,851 | |
0.75%, due 2/15/45 | | | 1,644,435 | | | | 2,009,510 | |
0.875%, due 2/15/47 | | | 12,156,585 | | | | 15,485,702 | |
1.00%, due 2/15/46 (j) | | | 4,859,572 | | | | 6,286,747 | |
1.00%, due 2/15/48 | | | 2,608,170 | | | | 3,444,487 | |
1.00%, due 2/15/49 (j) | | | 3,107,859 | | | | 4,141,676 | |
1.375%, due 2/15/44 (j) | | | 16,380,489 | | | | 22,331,308 | |
1.75%, due 1/15/28 (j) | | | 14,229,055 | | | | 16,972,962 | |
2.00%, due 1/15/26 | | | 11,160,901 | | | | 12,970,305 | |
2.125%, due 2/15/40 | | | 4,105,255 | | | | 6,048,026 | |
| | | | | | | | |
| | | Principal Amount | | | Value | |
United States Treasury Inflation—Indexed Bonds (continued) | |
2.125%, due 2/15/41 | | $ | 3,782,459 | | | $ | 5,643,575 | |
2.375%, due 1/15/25 (j) | | | 12,366,763 | | | | 14,229,206 | |
2.375%, due 1/15/27 | | | 5,061,167 | | | | 6,144,825 | |
2.50%, due 1/15/29 | | | 6,366,365 | | | | 8,159,660 | |
3.375%, due 4/15/32 (k) | | | 472,440 | | | | 703,034 | |
| | | | | | | | |
| | | | | | | 153,693,178 | |
| | | | | | | | |
United States Treasury Inflation—Indexed Notes 67.7% | |
0.125%, due 4/15/21 (j) | | | 19,995,622 | | | | 20,089,918 | |
0.125%, due 4/15/22 (j) | | | 45,701,550 | | | | 46,365,743 | |
0.125%, due 1/15/22 (j) | | | 10,229,094 | | | | 10,366,966 | |
0.125%, due 7/15/22 | | | 4,262,142 | | | | 4,362,414 | |
0.125%, due 1/15/23 | | | 13,035,480 | | | | 13,352,847 | |
0.125%, due 10/15/24 (j) | | | 5,996,043 | | | | 6,279,764 | |
0.125%, due 7/15/26 (j) | | | 17,124,616 | | | | 18,182,448 | |
0.25%, due 7/15/29 (j) | | | 26,903,196 | | | | 29,430,781 | |
0.375%, due 7/15/23 | | | 6,316,435 | | | | 6,577,571 | |
0.375%, due 1/15/27 (j) | | | 16,285,404 | | | | 17,547,422 | |
0.50%, due 1/15/28 (j) | | | 17,058,961 | | | | 18,700,012 | |
0.625%, due 7/15/21 | | | 2,025,320 | | | | 2,060,494 | |
0.625%, due 4/15/23 | | | 10,159,111 | | | | 10,563,109 | |
0.625%, due 1/15/24 (k) | | | 688,018 | | | | 724,589 | |
0.625%, due 1/15/26 (j) | | | 39,061,342 | | | | 42,290,824 | |
0.75%, due 7/15/28 (j) | | | 18,497,554 | | | | 20,854,303 | |
0.875%, due 1/15/29 | | | 11,161,647 | | | | 12,715,988 | |
1.125%, due 1/15/21 | | | 1,992,927 | | | | 2,011,058 | |
| | | | | | | | |
| | | | | | | 282,476,251 | |
| | | | | | | | |
Total U.S. Government & Federal Agencies
(Cost $452,522,155) | | | | | | | 483,821,059 | |
| | | | | | | | |
Total Long-Term Bonds
(Cost $549,304,371) | | | | | | | 580,210,665 | |
| | | | | | | | |
| | |
| | | | | | | | |
| | |
| | | Shares | | | | |
| Short-Term Investments 1.6% | |
Affiliated Investment Company 0.5% | |
MainStay U.S. Government Liquidity Fund, 0.05% (l) | | | 1,860,439 | | | | 1,860,439 | |
| | | | | | | | |
Total Affiliated Investment Company
(Cost $1,860,439) | | | | | | | 1,860,439 | |
| | | | | | | | |
|
Foreign Government Bonds 0.0%‡ | |
Argentina Treasury Bills (g) | | | | | | | | |
(zero coupon), due 8/27/20 | | ARS | 1,126,250 | | | | 21,196 | |
30.366%, due 8/28/20 | | | 3,628,000 | | | | 58,187 | |
| | | | | | | | |
Total Foreign Government Bonds
(Cost $84,582) | | | | | | | 79,383 | |
| | | | | | | | |
| | | | |
| 16 | | MainStay VP PIMCO Real Return Portfolio | | The notes to the financial statements are an integral part of,
and should be read in conjunction with, the financial statements. |
| | | | | | | | |
| | | Principal Amount | | | Value | |
Repurchase Agreement 1.1% | |
Credit Agricole Corp.
0.12%, dated 6/30/20
due 7/1/20
Proceeds at Maturity $4,700,016 (Collateralized by a United States Treasury Note with a rate of 3.38% and a maturity date of 5/15/44, with a Principal Amount of $3,363,000 and a Market Value of $4,780,386) | | $ | 4,700,000 | | | $ | 4,700,000 | |
| | | | | | | | |
Total Repurchase Agreement
(Cost $4,700,000) | | | | | | | 4,700,000 | |
| | | | | | | | |
Total Short-Term Investments
(Cost $6,645,021) | | | | | | | 6,639,822 | |
| | | | | | | | |
Total Investments Excluding
Purchased Options
(Cost $555,949,392) | | | 140.7 | % | | | 586,850,487 | |
| | | | | | | | |
Total Purchased Options
(Cost $6,755) | | | 0.0 | %‡ | | | 3,592 | |
| | | | | | | | |
Total Investments
(Cost $555,956,147) | | | 140.7 | % | | | 586,854,079 | |
Other Assets, Less Liabilities | | | (40.7 | ) | | | (169,826,312 | ) |
Net Assets | | | 100.0 | % | | $ | 417,027,767 | |
| † | Percentages indicated are based on Portfolio net assets. |
| ‡ | Less than one-tenth of a percent. |
| (a) | Floating rate—Rate shown was the rate in effect as of June 30, 2020. |
| (b) | May be sold to institutional investors only under Rule 144A or securities offered pursuant to Section 4(a)(2) of the Securities Act of 1933, as amended. |
| (c) | Step coupon—Rate shown was the rate in effect as of June 30, 2020. |
| (d) | Coupon rate may change based on changes of the underlying collateral or prepayments of principal. Rate shown was the rate in effect as of June 30, 2020. |
| (e) | Securities are perpetual and, thus, do not have a predetermined maturity date. The date shown, if applicable, reflects the next call date. |
| (f) | Fixed to floating rate—Rate shown was the rate in effect as of June 30, 2020. |
| (g) | Illiquid security—As of June 30, 2020, the total market value of these securities deemed illiquid under procedures approved by the Board of Trustees was $169,812, which represented less than one-tenth of a percent of the Portfolio’s net assets. |
| (h) | Collateral strip rate—A bond whose interest was based on the weighted net interest rate of the collateral. The coupon rate adjusts periodically based on a predetermined schedule. Rate shown was the rate in effect as of June 30, 2020. |
| (i) | TBA—Securities purchased on a forward commitment basis with an approximate principal amount and maturity date. The actual principal amount and maturity date will be determined upon settlement. As of June 30, 2020, the total net market value of these securities was $46,551,780, which represented 11.2% of the Portfolio’s net assets. All or a portion of these securities are a part of a mortgage dollar roll agreement. |
| (j) | Delayed delivery security. |
| (k) | Security, or a portion thereof, was maintained in a segregated account at the Portfolio’s custodian as collateral for securities sold short . |
| (l) | Current yield as of June 30, 2020. |
Foreign Currency Forward Contracts
As of June 30, 2020, the Portfolio held the following foreign currency forward contracts1,2:
| | | | | | | | | | | | | | | | | | | | |
Currency Purchased | | | Currency Sold | | | Counterparty | | Settlement
Date | | Unrealized
Appreciation
(Depreciation) | |
| | | | | | |
BRL | | | 14,021,438 | | | | USD | | | | 2,561,461 | | | Bank of America, N.A* | | 7/2/20 | | $ | 16,911 | |
BRL | | | 13,706,000 | | | | USD | | | | 2,502,922 | | | JPMorgan Chase Bank N.A.* | | 7/2/20 | | | 17,444 | |
BRL | | | 13,706,000 | | | | USD | | | | 2,511,107 | | | JPMorgan Chase Bank N.A.* | | 8/4/20 | | | 5,110 | |
DKK | | | 12,137,344 | | | | USD | | | | 1,816,070 | | | Societe Generale | | 7/1/20 | | | 13,910 | |
EUR | | | 635,000 | | | | USD | | | | 708,424 | | | JPMorgan Chase Bank N.A. | | 7/2/20 | | | 4,998 | |
USD | | | 3,273,465 | | | | BRL | | | | 13,706,000 | | | JPMorgan Chase Bank N.A. | | 7/2/20 | | | 753,100 | |
USD | | | 996,067 | | | | DKK | | | | 6,562,789 | | | JPMorgan Chase Bank N.A. | | 10/1/20 | | | 4,612 | |
USD | | | 6,312,121 | | | | DKK | | | | 41,737,194 | | | Morgan Stanley & Co. | | 10/1/20 | | | 6,788 | |
USD | | | 1,880,700 | | | | EUR | | | | 1,667,000 | | | Bank of America, N.A | | 7/2/20 | | | 7,826 | |
USD | | | 971,777 | | | | GBP | | | | 768,000 | | | Bank of America, N.A | | 7/2/20 | | | 20,148 | |
USD | | | 6,015,658 | | | | GBP | | | | 4,853,000 | | | JPMorgan Chase Bank N.A. | | 7/2/20 | | | 2,303 | |
| | | | | | |
The notes to the financial statements are an integral part of,
and should be read in conjunction with, the financial statements. | | | | | 17 | |
Portfolio of Investments June 30, 2020 (Unaudited) (continued)
| | | | | | | | | | | | | | | | | | | | |
Currency Purchased | | | Currency Sold | | | Counterparty | | Settlement
Date | | Unrealized
Appreciation
(Depreciation) | |
USD | | | 1,733,649 | | | | JPY | | | | 185,162,382 | | | Bank of America, N.A | | 8/4/20 | | $ | 18,083 | |
USD | | | 4,709,497 | | | | JPY | | | | 507,600,000 | | | Bank of America, N.A. | | 7/2/20 | | | 8,409 | |
USD | | | 1,510,966 | | | | JPY | | | | 161,559,315 | | | Morgan Stanley & Co. | | 8/4/20 | | | 14,087 | |
USD | | | 1,291,342 | | | | PEN | | | | 4,457,841 | | | Bank of America, N.A | | 10/5/20 | | | 34,887 | |
Total unrealized appreciation | | | | $ | 928,616 | |
| | | | | | | | | | | | | | | | | | | | |
Currency Purchased | | | Currency Sold | | | Counterparty | | Settlement
Date | | Unrealized
Appreciation
(Depreciation) | |
DKK | | | 6,562,789 | | | | USD | | | | 993,929 | | | JPMorgan Chase Bank N.A. | | 7/1/20 | | $ | (4,440 | ) |
DKK | | | 28,873,718 | | | | USD | | | | 4,355,997 | | | Morgan Stanley & Co. | | 7/1/20 | | | (2,628 | ) |
EUR | | | 593,000 | | | | USD | | | | 668,728 | | | Morgan Stanley & Co. | | 7/2/20 | | | (2,493 | ) |
ILS | | | 8,993 | | | | USD | | | | 2,618 | | | Bank of America, N.A | | 9/15/20 | | | (18 | ) |
JPY | | | 185,162,382 | | | | USD | | | | 1,732,919 | | | Bank of America, N.A | | 7/2/20 | | | (18,055 | ) |
JPY | | | 161,559,315 | | | | USD | | | | 1,510,324 | | | Morgan Stanley & Co. | | 7/2/20 | | | (14,058 | ) |
USD | | | 2,180,841 | | | | AUD | | | | 3,235,000 | | | JPMorgan Chase Bank N.A. | | 7/2/20 | | | (51,633 | ) |
USD | | | 2,558,540 | | | | BRL | | | | 14,021,438 | | | Bank of America, N.A | | 8/4/20 | | | (15,586 | ) |
USD | | | 2,562,341 | | | | BRL | | | | 14,021,438 | | | Bank of America, N.A. | | 7/2/20 | | | (16,030 | ) |
USD | | | 2,504,614 | | | | BRL | | | | 13,706,000 | | | JPMorgan Chase Bank N.A. | | 10/2/20 | | | (6,286 | ) |
USD | | | 845,624 | | | | CAD | | | | 1,159,000 | | | Bank of America, N.A | | 7/2/20 | | | (8,088 | ) |
USD | | | 8,620,964 | | | | DKK | | | | 59,113,088 | | | Bank of America, N.A. | | 7/1/20 | | | (291,676 | ) |
USD | | | 220,417 | | | | DKK | | | | 1,470,000 | | | JPMorgan Chase Bank N.A. | | 7/1/20 | | | (1,219 | ) |
USD | | | 1,356,752 | | | | DKK | | | | 8,987,344 | | | Societe Generale | | 10/1/20 | | | (987 | ) |
USD | | | 11,927,079 | | | | EUR | | | | 10,680,000 | | | JPMorgan Chase Bank N.A. | | 7/2/20 | | | (71,897 | ) |
USD | | | 12,484,091 | | | | EUR | | | | 11,119,000 | | | JPMorgan Chase Bank N.A. | | 8/4/20 | | | (17,048 | ) |
USD | | | 6,896,082 | | | | GBP | | | | 5,621,000 | | | Morgan Stanley & Co. | | 8/4/20 | | | (70,400 | ) |
USD | | | 2,451,875 | | | | NZD | | | | 3,933,000 | | | Morgan Stanley & Co. | | 7/2/20 | | | (86,089 | ) |
Total unrealized depreciation | | | | | (678,631 | ) |
Net unrealized appreciation | | | | $ | 249,985 | |
| * | Non-deliverable forward. |
| 1. | As of June 30, 2020, cash collateral of $680,000 was due to a broker for foreign currency forward contracts. |
| 2. | Foreign Currency Forward Contracts are subject to limitations such that they cannot be “sold or repurchased,” although the Portfolio would be able to exit the transaction through other means, such as through the execution of an offsetting transaction. |
Futures Contracts
As of June 30, 2020, the Portfolio held the following futures contracts1:
| | | | | | | | | | | | | | | | | | | | |
Type | | Number of
Contracts | | | Expiration
Date | | | Value at
Trade Date | | | Current
Notional
Amount | | | Unrealized Appreciation
(Depreciation)2 | |
Long Contracts | | | | | | | | | | | | | | | | | | | | |
| 5-Year United States Treasury Note | | | 249 | | | | September 2020 | | | $ | 31,238,011 | | | $ | 31,309,805 | | | $ | 71,794 | |
| Euro BOBL | | | 101 | | | | September 2020 | | | | 15,237,651 | | | | 15,316,647 | | | | 78,996 | |
| Euro Bund | | | 61 | | | | September 2020 | | | | 12,066,159 | | | | 12,097,529 | | | | 31,370 | |
| United States Treasury Ultra Bond | | | 14 | | | | September 2020 | | | | 3,079,617 | | | | 3,054,188 | | | | (25,429 | ) |
| 10-Year United States Treasury Ultra Note | | | 84 | | | | September 2020 | | | | 13,241,002 | | | | 13,228,688 | | | | (12,314 | ) |
| | | | | | | | | | | | | | | | | | | | |
| Total Long Contracts | | | | | | | | | | | | | | | | | | | 144,417 | |
| | | | | | | | | | | | | | | | | | | | |
| | | | |
| 18 | | MainStay VP PIMCO Real Return Portfolio | | The notes to the financial statements are an integral part of,
and should be read in conjunction with, the financial statements. |
| | | | | | | | | | | | | | | | | | | | |
Type | | Number of
Contracts | | | Expiration
Date | | | Value at
Trade Date | | | Current
Notional
Amount | | | Unrealized Appreciation
(Depreciation)2 | |
Short Contracts | | | | | | | | | | | | | |
| 10-Year Australia Government Bond | | | (7 | ) | | | September 2020 | | | $ | (707,198 | ) | | $ | (718,752 | ) | | $ | (11,554 | ) |
| 10-Year Japan Government Bond | | | (3 | ) | | | September 2020 | | | | (4,220,921 | ) | | | (4,221,811 | ) | | | (890 | ) |
| 10-Year United States Treasury Note | | | (476 | ) | | | September 2020 | | | | (66,011,543 | ) | | | (66,245,813 | ) | | | (234,270 | ) |
| 2-Year United States Treasury Note | | | (63 | ) | | | September 2020 | | | | (13,910,615 | ) | | | (13,912,172 | ) | | | (1,557 | ) |
| 3-Year Australia Government Bond | | | (13 | ) | | | September 2020 | | | | (1,049,715 | ) | | | (1,050,179 | ) | | | (464 | ) |
| Euro Schatz | | | (594 | ) | | | September 2020 | | | | (74,785,488 | ) | | | (74,837,609 | ) | | | (52,121 | ) |
| Euro-BTP | | | (14 | ) | | | September 2020 | | | | (2,204,386 | ) | | | (2,263,088 | ) | | | (58,702 | ) |
| Euro-Buxl 30 Year Bond | | | (23 | ) | | | September 2020 | | | | (5,550,790 | ) | | | (5,683,874 | ) | | | (133,084 | ) |
| Short-Term Euro-BTP | | | (86 | ) | | | September 2020 | | | | (10,760,350 | ) | | | (10,809,953 | ) | | | (49,603 | ) |
| United States Treasury Long Bond | | | (89 | ) | | | September 2020 | | | | (15,855,783 | ) | | | (15,892,063 | ) | | | (36,280 | ) |
| | | | | | | | | | | | | | | | | | | | |
| Total Short Contracts | | | | | | | | | | | | | | | | | | | (578,525 | ) |
| | | | | | | | | | | | | | | | | | | | |
| Net Unrealized Depreciation | | | | | | | | | | | | | | | | | | $ | (434,108 | ) |
| | | | | | | | | | | | | | | | | | | | |
| 1. | As of June 30, 2020, cash in the amount of $1,332,154 was on deposit with a broker or futures commission merchant for futures transactions. |
| 2. | Represents the difference between the value of the contracts at the time they were opened and the value as of June 30, 2020. |
Purchased Options on Futures Contracts
| | | | | | | | | | | | | | | | | | | | | | | | | | | | |
Description | | Counterparty | | | Strike Price | | | Expiration
Date | | | Number of
Contracts | | | Notional
Amount | | | Premium Paid
(Received) | | | Market
Value | |
| | | | | | | |
Put- 5-Year United States Treasury Note | | | Morgan Stanley & Co., LLC | | | $ | 106.75 | | | | 7/24/2020 | | | | 118 | | | | 118,000 | | | $ | 1,070 | | | $ | 118 | |
| | | | | | | | | | | | | | | | | | | | | | | $ | 1,070 | | | $ | 118 | |
| | | | | | | | | | | | | | | | | | | | | | | | | | | | |
Description | | Counterparty | | | Strike Price | | | Expiration
Date | | | Number of
Contracts | | | Notional
Amount | | | Premium Paid
(Received) | | | Market
Value | |
| | | | | | | |
Call- Euro Schatz | | | Morgan Stanley & Co., LLC | | | EUR | 116.00 | | | | 8/21/2020 | | | | 577 | | | | EUR 57,700,000 | | | $ | 3,572 | | | $ | 3,241 | |
| | | | | | | |
Call- 5-Year United States Treasury Note | | | Morgan Stanley & Co., LLC | | | $ | 136.00 | | | | 7/24/2020 | | | | 233 | | | | 233,000 | | | | 2,113 | | | | 233 | |
| | | | | | | |
| | | | | | | | | | | | | | | | | | | | | | | $ | 5,685 | | | $ | 3,474 | |
Written Inflation-Capped Options
| | | | | | | | | | | | | | | | | | | | | | | | | | | | |
Description | | Counterparty | | Initial
Index | | | Floating Rate | | Expiration
Date | | | Number of
Contracts | | | Notional
Amount | | | Premium Paid
(Received) | | | Market
Value | |
| | | | | | | | |
Cap-OTC USA Non-Revised Consumer Price Index-Urban (CPI-U), American Style-Call | | JPMorgan Chase Bank N.A. | | | 238.643 | | | Maximum of [0, Final Index/Initial Index –(1 + 4.000%)10] | | | 5/16/2024 | | | $ | (300,000 | ) | | $ | (300,000 | ) | | $ | (2,085 | ) | | $ | (4 | ) |
Floor-OTC USA Non-Revised Consumer Price Index-Urban (CPI-U), American Style-Put | | JPMorgan Chase Bank N.A. | | | 234.781 | | | Maximum of [0, Final Index/Initial Index] | | | 10/02/2020 | | | | (1,900,000 | ) | | | (1,900,000 | ) | | | (35,068 | ) | | | — | |
| | | | | | | | | | | | | | | | | | | | | | | $ | (37,153 | ) | | $ | (4 | ) |
Written Swaptions
| | | | | | | | | | | | | | | | | | | | | | | | | | | | |
Description | | Counterparty | | | Strike
Price | | | Expiration
Date | | | Number of
Contracts | | | Notional
Amount | | | Premium Paid
(Received) | | | Market
Value | |
| | | | | | | |
Put-Federal National Mortgage Association | | | JPMorgan Chase Bank N.A. | | | $ | 102.09 | | | | 8/6/2020 | | | | (2,200,000 | ) | | | $(2,200,000) | | | $ | (8,594 | ) | | $ | (2,174 | ) |
Put-Federal National Mortgage Association | | | JPMorgan Chase Bank N.A. | | | | 102.56 | | | | 8/6/2020 | | | | (900,000 | ) | | | (900,000 | ) | | | (4,781 | ) | | | (1,175 | ) |
Put-Federal National Mortgage Association | | | JPMorgan Chase Bank N.A. | | | | 100.79 | | | | 7/7/2020 | | | | (2,300,000 | ) | | | (2,300,000 | ) | | | (14,914 | ) | | | (841 | ) |
Put-Federal National Mortgage Association | | | JPMorgan Chase Bank N.A. | | | | 100.46 | | | | 7/7/2020 | | | | (1,500,000 | ) | | | (1,500,000 | ) | | | (10,313 | ) | | | (382 | ) |
Put-Federal National Mortgage Association | | | JPMorgan Chase Bank N.A. | | | | 100.87 | | | | 7/7/2020 | | | | (800,000 | ) | | | (800,000 | ) | | | (5,250 | ) | | | (318 | ) |
Put-Federal National Mortgage Association | | | JPMorgan Chase Bank N.A. | | | | 102.50 | | | | 7/7/2020 | | | | (1,400,000 | ) | | | (1,400,000 | ) | | | (6,508 | ) | | | — | |
Put-Federal National Mortgage Association | | | JPMorgan Chase Bank N.A. | | | | 102.53 | | | | 7/7/2020 | | | | (900,000 | ) | | | (900,000 | ) | | | (3,164 | ) | | | — | |
| | | | | | | | | | | | | | | | | | | | | | | $ | (53,524 | ) | | $ | (4,890 | ) |
| | | | | | |
The notes to the financial statements are an integral part of,
and should be read in conjunction with, the financial statements. | | | | | 19 | |
Portfolio of Investments June 30, 2020 (Unaudited) (continued)
| | | | | | | | | | | | | | | | | | | | | | | | | | | | |
Description | | Counterparty | | | Strike
Price | | | Expiration
Date | | | Number of
Contracts | | | Notional
Amount | | | Premium Paid
(Received) | | | Market
Value | |
Call-OTC CDX.IG-34 5-Year Index | | | BOFA Securities, Inc. | | | $ | 0.55 | | | | 9/16/2020 | | | | (1,300,000 | ) | | $ | (1,300,000 | ) | | $ | (910 | ) | | $ | (632 | ) |
Call-OTC CDX.IG-34 5-Year Index | | | BOFA Securities, Inc. | | | | 0.60 | | | | 8/19/2020 | | | | (1,500,000 | ) | | | (1,500,000 | ) | | | (900 | ) | | | (788 | ) |
Call-OTC iTraxx Europe 33 5-Year Index | | | Bank of America, N.A. | | | | 0.48 | | | | 9/16/2020 | | | | (1,300,000 | ) | | | EUR (1,300,000) | | | | (735 | ) | | | (579 | ) |
| | | | | | | | | | | | | | | | | | | | | | | $ | (2,545 | ) | | $ | (1,999 | ) |
| | | | | | | | | | | | | | | | | | | | | | | | | | | | |
Description | | Counterparty | | | Strike
Price | | | Expiration
Date | | | Number of
Contracts | | | Notional
Amount | | | Premium Paid
(Received) | | | Market
Value | |
Put-OTC iTraxx Europe 33 5-Year Index | | | Bank of America, N.A. | | | $ | 1.00 | | | | 9/16/2020 | | | | (1,300,000 | ) | | $ | (1,300,000 | ) | | $ | (2,535 | ) | | $ | (2,682 | ) |
Put-OTC CDX.IG-34 5-Year Index | | | BOFA Securities, Inc. | | | | 1.10 | | | | 8/19/2020 | | | | (1,500,000 | ) | | | (1,500,000 | ) | | | (2,895 | ) | | | (1,907 | ) |
Put-OTC CDX.IG-34 5-Year Index | | | BOFA Securities, Inc. | | | | 1.15 | | | | 8/19/2020 | | | | (4,600,000 | ) | | | (4,600,000 | ) | | | (6,440 | ) | | | (5,052 | ) |
Put-OTC CDX.IG-34 5-Year Index | | | BOFA Securities, Inc. | | | | 1.10 | | | | 9/16/2020 | | | | (1,300,000 | ) | | | (1,300,000 | ) | | | (2,633 | ) | | | (2,856 | ) |
| | | | | | | | | | | | | | | | | | | | | | | $ | (14,503 | ) | | $ | (12,497 | ) |
Swap Contracts
As of June 30, 2020, the Portfolio held the following centrally cleared interest rate swap agreements1:
| | | | | | | | | | | | | | | | | | | | | | | | | | | | |
Notional
Amount | | | Currency | | | Expiration
Date | | | Payments
made by Portfolio | | Payments
Received by Portfolio | | Payment
Frequency Paid/Received | | Upfront
Premiums
Received/
(Paid) | | | Value | | | Unrealized
Appreciation /
(Depreciation) | |
| | $14,000,000 | | | | JPY | | | | 9/20/2027 | | | Fixed 3.00% | | 6-Month JPY-LIBOR | | Quarterly/Semi-Annually | | $ | 183 | | | $ | (2,925 | ) | | $ | (2,742 | ) |
| | 50,000,000 | | | | JPY | | | | 3/20/2028 | | | Fixed 3.00% | | 6-Month JPY-LIBOR | | Quarterly/Semi-Annually | | | 681 | | | | (10,891 | ) | | | (10,210 | ) |
| | 1,600,000 | | | | NZD | | | | 3/21/2028 | | | Fixed 3.25% | | 3-Month NZD Bank Bill | | Quarterly/Semi-Annually | | | (3,703 | ) | | | (212,253 | ) | | | (215,956 | ) |
| | 106,980,000 | | | | JPY | | | | 3/20/2029 | | | Fixed 0.45% | | 6-Month JPY-LIBOR | | Quarterly/Semi-Annually | | | 4,255 | | | | (37,763 | ) | | | (33,508 | ) |
| | | | | | | | | | | | | | | | | | | $ | 1,416 | | | $ | (263,832 | ) | | $ | (262,416 | ) |
Open OTC interest rate swap agreements as of June 30, 2020 were as follows:1
| | | | | | | | | | | | | | | | | | | | | | | | | | | | | | |
Notional
Amount | | Currency | | | Expiration
Date | | | Counterparty | | | Payments
made by Portfolio | | Payments
Received by Portfolio | | Payment
Frequency
Paid/
Received | | Upfront
Premiums
Received/
(Paid) | | | Value | | | Unrealized
Appreciation /
(Depreciation) | |
$880,000 | | | ILS | | | | 2/16/2028 | | | | Bank of America N.A. | | | Fixed 1.963% | | 3-Month TELBOR | | Quarterly/Annually | | $ | — | | | $ | 31,548 | | | $ | 31,548 | |
540,000 | | | ILS | | | | 6/20/2028 | | | | Bank of America N.A. | | | Fixed 1.998% | | 3-Month TELBOR | | Quarterly/Annually | | | — | | | | 19,230 | | | | 19,230 | |
| | | | | | | | | | | | | | | | | | | | | $ | — | | | $ | 50,778 | | | $ | 50,778 | |
As of June 30, 2020, the Portfolio held the following open centrally cleared inflation swap agreements1:
| | | | | | | | | | | | | | | | | | | | | | | | | | | | |
Notional
Amount | | Currency | | | Expiration
Date | | | Payments
made by Portfolio | | | Payments
Received by Portfolio | | Payment
Frequency Paid/
Received | | Upfront
Premiums
Received/
(Paid) | | | Value | | | Unrealized
Appreciation /
(Depreciation) | |
1,300,000 | | | USD | | | | 11/23/2020 | | | | Fixed 2.027 | % | | 12-Month USD-CPI | | At Maturity | | $ | — | | | $ | (21,511 | ) | | $ | (21,511 | ) |
1,300,000 | | | USD | | | | 11/25/2020 | | | | Fixed 2.021 | % | | 12-Month USD-CPI | | At Maturity | | | — | | | | (21,380 | ) | | | (21,380 | ) |
4,600,000 | | | USD | | | | 9/20/2021 | | | | Fixed 1.58 | % | | 12-Month USD-CPI | | At Maturity | | | — | | | | (72,328 | ) | | | (72,328 | ) |
3,300,000 | | | GBP | | | | 5/15/2022 | | | | Fixed 2.60 | % | | UK RPI | | At Maturity | | | (437 | ) | | | 23,048 | | | | 22,611 | |
3,400,000 | | | GBP | | | | 6/15/2022 | | | | Fixed 2.89 | % | | UK RPI | | At Maturity | | | (1,269 | ) | | | 26,336 | | | | 25,067 | |
1,100,000 | | | USD | | | | 4/27/2023 | | | | Fixed 2.263 | % | | 12-Month USD-CPI | | At Maturity | | | — | | | | (59,136 | ) | | | (59,136 | ) |
510,000 | | | USD | | | | 5/9/2023 | | | | Fixed 2.263 | % | | 12-Month USD-CPI | | At Maturity | | | — | | | | (27,291 | ) | | | (27,291 | ) |
780,000 | | | USD | | | | 5/10/2023 | | | | Fixed 2.281 | % | | 12-Month USD-CPI | | At Maturity | | | — | | | | (42,488 | ) | | | (42,488 | ) |
2,800,000 | | | EUR | | | | 3/15/2024 | | | | Fixed 1.03 | % | | 12-Month EUR-CPI | | At Maturity | | | 835 | | | | (102,678 | ) | | | (101,843 | ) |
| | | | |
| 20 | | MainStay VP PIMCO Real Return Portfolio | | The notes to the financial statements are an integral part of,
and should be read in conjunction with, the financial statements. |
| | | | | | | | | | | | | | | | | | | | | | | | | | | | |
Notional
Amount | | Currency | | | Expiration
Date | | | Payments
made by Portfolio | | | Payments
Received by Portfolio | | Payment
Frequency Paid/
Received | | Upfront
Premiums
Received/
(Paid) | | | Value | | | Unrealized
Appreciation /
(Depreciation) | |
2,200,000 | | | GBP | | | | 9/15/2024 | | | | Fixed 3.85 | % | | UK RPI | | At Maturity | | $ | (316 | ) | | $ | 167,830 | | | $ | 167,514 | |
6,800,000 | | | GBP | | | | 1/15/2025 | | | | Fixed 3.33 | % | | UK RPI | | At Maturity | | | (199,075 | ) | | | 122,725 | | | | (76,350 | ) |
800,000 | | | EUR | | | | 6/15/2027 | | | | Fixed 1.36 | % | | 12-Month EUR-CPI | | At Maturity | | | 8,749 | | | | 55,124 | | | | 63,873 | |
1,000,000 | | | EUR | | | | 3/15/2028 | | | | Fixed 1.535 | % | | 12-Month EUR-CPI | | At Maturity | | | (104 | ) | | | 93,533 | | | | 93,429 | |
510,000 | | | USD | | | | 5/9/2028 | | | | Fixed 2.353 | % | | 12-Month USD-CPI | | At Maturity | | | — | | | | 52,874 | | | | 52,874 | |
770,000 | | | USD | | | | 5/9/2028 | | | | Fixed 2.36 | % | | 12-Month USD-CPI | | At Maturity | | | — | | | | 80,526 | | | | 80,526 | |
2,600,000 | | | USD | | | | 11/4/2029 | | | | Fixed 1.76 | % | | 12-Month USD-CPI | | At Maturity | | | 1,323 | | | | 82,969 | | | | 84,292 | |
4,200,000 | | | GBP | | | | 1/15/2030 | | | | Fixed 3.39 | % | | UK RPI | | At Maturity | | | 33,089 | | | | 95,071 | | | | 128,160 | |
2,200,000 | | | USD | | | | 5/19/2030 | | | | Fixed 1.28 | % | | 12-Month USD-CPI | | At Maturity | | | — | | | | (49,600 | ) | | | (49,600 | ) |
3,460,000 | | | GBP | | | | 6/15/2030 | | | | Fixed 3.40 | % | | UK RPI | | At Maturity | | | (11,046 | ) | | | 292,807 | | | | 281,761 | |
200,000 | | | EUR | | | | 3/15/2033 | | | | Fixed 1.71 | % | | 12-Month EUR-CPI | | At Maturity | | | 332 | | | | (31,288 | ) | | | (30,956 | ) |
| | | | | | | | | | | | | | | | | | | $ | (167,919 | ) | | $ | 665,143 | | | $ | 497,224 | |
As of June 30, 2020, the Portfolio held the following centrally cleared credit default swap contracts1:
| | | | | | | | | | | | | | | | | | | | | | | | | | | | | | | | |
Reference Obligation | | Termination
Date | | | Buy/Sell
Protection2 | | | Notional
Amount
(000)3 | | | (Pay)/
Receive
Fixed
Rate4 | | | Payment
Frequency
Paid/
Received | | | Upfront
Premiums
Received/
(Paid) | | | Value | | | Unrealized
Appreciation /
(Depreciation)5 | |
| | | | | | | | |
Daimler AG 0.625%, 03/05/20 | | | 12/20/2020 | | | | Buy | | | | 150 | | | | 1.00 | % | | | Quarterly | | | $ | (575 | ) | | $ | 553 | | | $ | (22 | ) |
General Electric Co. 2.70%, 10/09/22 | | | 12/20/2020 | | | | Sell | | | | 100 | | | | 1.00 | % | | | Quarterly | | | | 658 | | | | 59 | | | | 717 | |
General Electric Co. 2.70%, 10/09/22 | | | 12/20/2023 | | | | Sell | | | | 100 | | | | 1.00 | % | | | Quarterly | | | | 3,354 | | | | (1,608 | ) | | | 1,746 | |
CDX North American High Yield Series 33 | | | 12/20/2024 | | | | Sell | | | | 1,288 | | | | 5.00 | % | | | Quarterly | | | | 70,934 | | | | 7,717 | | | | 78,651 | |
CDX North American High Yield Series 34 | | | 6/20/2025 | | | | Sell | | | | 4,750 | | | | 5.00 | % | | | Quarterly | | | | (268,870 | ) | | | 34,602 | | | | (234,268 | ) |
| | | | | | | | | | | | | | | | | | | | | | | $ | (194,499 | ) | | $ | 41,323 | | | $ | (153,176 | ) |
| 1. | As of June 30, 2020, cash in the amount of $3,175,000 was on deposit with a broker for centrally cleared swap agreements. |
| 2. | Buy—Portfolio pays premium and buys credit protection. If a credit event occurs, as defined under the terms of that particular swap agreement, the Portfolio will either (i) receive from the seller of protection an amount equal to the notional amount of the swap and deliver the referenced obligation or underlying securities comprising the referenced index or (ii) receive a net settlement amount in the form of cash or securities equal to the notional amount of the swap less the recovery value of the referenced obligation or underlying securities comprising the referenced index. |
| | Sell—Portfolio receives premium and sells credit protection. If a credit event occurs, as defined under the terms of that particular swap agreement, the Portfolio will either (i) pay to the buyer of protection an amount equal to the notional amount of the swap and take delivery of the referenced obligation or underlying securities comprising the referenced index or (ii) pay a net settlement amount in the form of cash or securities equal to the notional amount of the swap less the recovery value of the referenced obligation or underlying securities comprising the referenced index. |
| 3. | The maximum potential amount the Portfolio could be required to pay as a seller of credit protection or receive as a buyer of credit protection if a credit event occurs as defined under the terms of that particular swap contract. |
| 4. | The annual fixed rate represents the interest received by the Portfolio (as a seller of protection) or paid by the Portfolio (as a buyer of protection) annually on the notional amount of the credit default swap contract. |
| 5. | Represents the difference between the value of the credit default swap contracts at the time they were opened and the value at June 30, 2020. |
| | | | | | |
The notes to the financial statements are an integral part of,
and should be read in conjunction with, the financial statements. | | | | | 21 | |
Portfolio of Investments June 30, 2020 (Unaudited) (continued)
The following abbreviations are used in the preceding pages:
ARS—Argentine Peso
AUD—Australian Dollar
BADLARPP—Average rate on 30-day deposits of at least 1 million Argentinian Pesos
BRL—Brazilian Real
BTP—Buoni del Tesoro Poliennali (Eurex Exchange index)
CAD—Canadian Dollar
DKK—Danish Krone
EUAM —European Union Advisory Mission
EUR—Euro
EURIBOR—Euro Interbank Offered Rate
GBP—British Pound Sterling
ILS—Israeli Shekel
JPY—Japanese Yen
LIBOR—London Interbank Offered Rate
NZD—New Zealand Dollar
PEN—Peruvian Sol
REMIC—Real Estate Mortgage Investment Conduit
TBA—To Be Announced
TELBOR—Tel Aviv Interbank Offered Rate
USD—United States Dollar
The following is a summary of the fair valuations according to the inputs used as of June 30, 2020, for valuing the Portfolio’s assets and liabilities:
| | | | | | | | | | | | | | | | |
Description | | Quoted
Prices in
Active
Markets for
Identical
Assets
(Level 1) | | | Significant
Other
Observable
Inputs
(Level 2) | | | Significant
Unobservable
Inputs
(Level 3) | | | Total | |
| | | | |
Asset Valuation Inputs | | | | | | | | | | | | | | | | |
| Investments in Securities (a) | | | | | | | | | | | | | | | | |
| Long-Term Bonds | | | | | | | | | | | | | | | | |
Asset-Backed Securities | | $ | — | | | $ | 21,816,577 | | | $ | — | | | $ | 21,816,577 | |
Corporate Bonds | | | — | | | | 35,439,716 | | | | — | | | | 35,439,716 | |
Foreign Government Bonds | | | — | | | | 22,970,072 | | | | — | | | | 22,970,072 | |
Mortgage-Backed Securities | | | — | | | | 16,163,241 | | | | — | | | | 16,163,241 | |
U.S. Government & Federal Agencies | | | — | | | | 483,821,059 | | | | — | | | | 483,821,059 | |
| | | | | | | | | | | | | | | | |
| Total Long-Term Bonds | | | — | | | | 580,210,665 | | | | — | | | | 580,210,665 | |
| | | | | | | | | | | | | | | | |
| Purchased Options | | | 3,592 | | | | — | | | | — | | | | 3,592 | |
| Short-Term Investments | | | | | | | | | | | | | | | | |
Affiliated Investment Company | | | 1,860,439 | | | | — | | | | — | | | | 1,860,439 | |
Repurchase Agreement | | | — | | | | 4,700,000 | | | | — | | | | 4,700,000 | |
Foreign Government Bonds | | | — | | | | 79,383 | | | | — | | | | 79,383 | |
| | | | | | | | | | | | | | | | |
| Total Short-Term Investments | | | 1,860,439 | | | | 4,779,383 | | | | — | | | | 6,639,822 | |
| | | | | | | | | | | | | | | | |
| Total Investments in Securities | | | 1,864,031 | | | | 584,990,048 | | | | — | | | | 586,854,079 | |
| Other Financial Instruments | | | | | | | | | | | | | | | | |
Credit Default Swap Contracts (b) | | | — | | | | 81,114 | | | | — | | | | 81,114 | |
Foreign Currency Forward Contracts (b) | | | — | | | | 928,616 | | | | — | | | | 928,616 | |
Futures Contracts (b) | | | 182,160 | | | | — | | | | — | | | | 182,160 | |
Inflation Swap Contracts (b) | | | — | | | | 1,000,107 | | | | — | | | | 1,000,107 | |
Interest Rate Swap Contracts (b) | | | — | | | | 50,778 | | | | — | | | | 50,778 | |
| | | | | | | | | | | | | | | | |
| Total Other Financial Instruments | | | 182,160 | | | | 2,060,615 | | | | — | | | | 2,242,775 | |
| | | | | | | | | | | | | | | | |
| Total Investments in Securities and Other Financial Instruments | | $ | 2,046,191 | | | $ | 587,050,663 | | | $ | — | | | $ | 589,096,854 | |
| | | | | | | | | | | | | | | | |
| | | | |
| Liability Valuation Inputs | | | | | | | | | | | | | | | | |
| Other Financial Instruments | | | | | | | | | | | | | | | | |
Foreign Currency Forward Contracts (b) | | $ | — | | | $ | (678,631 | ) | | $ | — | | | $ | (678,631 | ) |
Futures Contracts (b) | | | (616,268 | ) | | | — | | | | — | | | | (616,268 | ) |
Credit Default Swap Contracts (b) | | | — | | | | (234,290 | ) | | | — | | | | (234,290 | ) |
Inflation Rate Swap Contracts (b) | | | — | | | | (502,883 | ) | | | — | | | | (502,883 | ) |
Interest Rate Swap Contracts (b) | | | — | | | | (262,416 | ) | | | — | | | | (262,416 | ) |
Written Options | | | — | | | | (19,390 | ) | | | — | | | | (19,390 | |
| | | | | | | | | | | | | | | | |
| Total Other Financial Instruments | | $ | (616,268 | ) | | $ | (1,697,610 | ) | | $ | — | | | $ | (2,313,878 | ) |
| | | | | | | | | | | | | | | | |
| (a) | For a complete listing of investments and their industries, see the Portfolio of Investments. |
| (b) | The value listed for these securities reflects unrealized appreciation (depreciation) as shown on the Portfolio of Investments. |
| | | | |
| 22 | | MainStay VP PIMCO Real Return Portfolio | | The notes to the financial statements are an integral part of,
and should be read in conjunction with, the financial statements. |
Sale-Buyback Transactions :
| | | | | | | | | | | | | | | | | | | | |
Counterparty | | Borrowing
Rate (a) | | | Borrowing
Date | | | Maturity
Date | | | Ammount
Borrowed (a) | | | Payable for
Sale-Buyback
Transcations (b) | |
Barclays Capital Inc. | | | 0.23 | % | | | 6/25/2020 | | | | 7/2/2020 | | | $ | 22,423,806 | | | $ | 22,424,282 | |
Barclays Capital Inc. | | | 0.23 | | | | 6/25/2020 | | | | 7/2/2020 | | | | 10,362,925 | | | | 10,362,894 | |
Barclays Capital Inc. | | | 0.23 | | | | 6/25/2020 | | | | 7/2/2020 | | | | 18,697,725 | | | | 18,697,840 | |
Barclays Capital Inc. | | | 0.23 | | | | 6/25/2020 | | | | 7/2/2020 | | | | 18,135,331 | | | | 18,135,274 | |
Barclays Capital Inc. | | | 0.23 | | | | 6/25/2020 | | | | 7/2/2020 | | | | 20,868,131 | | | | 20,868,379 | |
Barclays Capital Inc. | | | 0.23 | | | | 6/25/2020 | | | | 7/2/2020 | | | | 21,082,732 | | | | 21,082,797 | |
Barclays Capital Inc. | | | 0.23 | | | | 6/25/2020 | | | | 7/2/2020 | | | | 20,069,743 | | | | 20,069,683 | |
Barclays Capital Inc. | | | 0.23 | | | | 5/4/2020 | | | | 7/6/2020 | | | | 822,215 | | | | 822,250 | |
Barclays Capital Inc. | | | 0.23 | | | | 5/5/2020 | | | | 7/6/2020 | | | | 309,332 | | | | 309,317 | |
Barclays Capital Inc. | | | 0.23 | | | | 5/18/2020 | | | | 7/20/2020 | | | | 5,911,711 | | | | 5,898,383 | |
Barclays Capital Inc. | | | 0.23 | | | | 5/26/2020 | | | | 7/27/2020 | | | | 41,297,399 | | | | 41,195,209 | |
Barclays Capital Inc. | | | 0.23 | | | | 5/26/2020 | | | | 7/27/2020 | | | | 46,095,817 | | | | 45,959,317 | |
Barclays Capital Inc. | | | 0.23 | | | | 5/26/2020 | | | | 7/27/2020 | | | | 30,562,293 | | | | 30,479,831 | |
Barclays Capital Inc. | | | 0.23 | | | | 5/11/2020 | | | | 8/6/2020 | | | | 471,420 | | | | 471,838 | |
Barclays Capital Inc. | | | 0.22 | | | | 5/21/2020 | | | | 8/21/2020 | | | | 6,601,385 | | | | 6,586,860 | |
| | | | | | | | | | | | | | | | | | | | |
| | | | | | | | | | | | | | $ | 263,711,965 | | | $ | 263,364,154 | |
| | | | | | | | | | | | | | | | | | | | |
| (a) | During the period ended June 30, 2020, the Portfolio’s average amount of borrowing was $155,916,537 at a weighted average interest rate of 1.19%. |
| (b) | Payable for sale-buyback transactions includes $347,811 of deferred price drop. |
| | | | | | |
The notes to the financial statements are an integral part of,
and should be read in conjunction with, the financial statements. | | | | | 23 | |
Statement of Assets and Liabilities as of June 30, 2020 (Unaudited)
| | | | |
| Assets | | | | |
Investment in unaffiliated securities before outstanding written options, at value (identified cost $554,095,708) | | $ | 584,993,640 | |
Investment in affiliated investment company, at value (identified cost $1,860,439) | | | 1,860,439 | |
Cash denominated in foreign currencies
(identified cost $1,510,432) | | | 1,479,961 | |
Cash collateral on deposit at broker for futures contracts | | | 1,332,154 | |
Cash collateral on deposit at broker for swap contracts | | | 1,485,000 | |
Receivables: | | | | |
Investment securities sold | | | 216,372,199 | |
Dividends and interest | | | 1,393,219 | |
Portfolio shares sold | | | 336,465 | |
Variation margin on futures contracts | | | 19,713 | |
Unrealized appreciation on foreign currency forward contracts | | | 928,616 | |
Unrealized appreciation on OTC swap contracts | | | 50,778 | |
Other assets | | | 2,444 | |
| | | | |
Total assets | | | 810,254,628 | |
| | | | |
| |
| Liabilities | | | | |
Cash collateral due to broker for foreign currency forward contracts | | | 680,000 | |
Cash collateral due to broker for swap contracts | | | 1,010,000 | |
Due to custodian | | | 43,036 | |
Written options, at value (premiums received $107,724) | | | 19,390 | |
Payables: | | | | |
Sale buyback transaction | | | 263,711,965 | |
Investment securities purchased | | | 126,407,223 | |
Portfolio shares redeemed | | | 253,925 | |
Manager (See Note 3) | | | 147,423 | |
NYLIFE Distributors (See Note 3) | | | 74,003 | |
Shareholder communication | | | 72,807 | |
Professional fees | | | 47,321 | |
Custodian | | | 44,122 | |
Variation margin on centrally cleared swap contracts | | | 32,520 | |
Trustees | | | 458 | |
Accrued expenses | | | 4,037 | |
Unrealized depreciation on foreign currency forward contracts | | | 678,631 | |
| | | | |
Total liabilities | | | 393,226,861 | |
| | | | |
Net assets | | $ | 417,027,767 | |
| | | | |
| |
| Composition of Net Assets | | | | |
Shares of beneficial interest outstanding (par value of $.001 per share) unlimited number of shares authorized | | $ | 45,616 | |
Additional paid-in capital | | | 457,213,953 | |
| | | | |
| | | 457,259,569 | |
Total distributable earnings (loss) | | | (40,231,802 | ) |
| | | | |
Net assets | | $ | 417,027,767 | |
| | | | |
| | | | |
Initial Class | | | | |
Net assets applicable to outstanding shares | | $ | 49,311,424 | |
| | | | |
Shares of beneficial interest outstanding | | | 5,378,731 | |
| | | | |
Net asset value per share outstanding | | $ | 9.17 | |
| | | | |
Service Class | | | | |
Net assets applicable to outstanding shares | | $ | 367,716,343 | |
| | | | |
Shares of beneficial interest outstanding | | | 40,237,428 | |
| | | | |
Net asset value per share outstanding | | $ | 9.14 | |
| | | | |
| | | | |
| 24 | | MainStay VP PIMCO Real Return Portfolio | | The notes to the financial statements are an integral part of,
and should be read in conjunction with, the financial statements. |
Statement of Operations for the six months ended June 30, 2020 (Unaudited)
| | | | |
| Investment Income (Loss) | | | | |
Income | | | | |
Interest | | $ | 2,050,392 | |
Dividends—affiliated | | | 3,496 | |
Securities lending | | | 549 | |
| | | | |
Total income | | | 2,054,437 | |
| | | | |
Expenses | | | | |
Manager (See Note 3) | | | 1,011,106 | |
Interest expense | | | 945,100 | |
Distribution/Service—Service Class (See Note 3) | | | 443,603 | |
Custodian | | | 79,293 | |
Professional fees | | | 62,572 | |
Shareholder communication | | | 52,145 | |
Trustees | | | 4,749 | |
Miscellaneous | | | 7,958 | |
| | | | |
Total expenses before waiver/reimbursement | | | 2,606,526 | |
Expense waiver/reimbursement from Manager (See Note 3) | | | (146,050 | ) |
| | | | |
Net expenses | | | 2,460,476 | |
| | | | |
Net investment income (loss) | | | (406,039 | ) |
| | | | |
|
| Realized and Unrealized Gain (Loss) on Investments, Futures Contracts, Swap Contracts, Written Options and Foreign Currency Transactions | |
Net realized gain (loss) on: | | | | |
Unaffiliated investment transactions | | | 2,676,776 | |
Futures transactions | | | (3,480,522 | ) |
Written option transactions | | | (148,824 | ) |
Swap transactions | | | (187,542 | ) |
Foreign currency forward transactions | | | (23,905 | ) |
Foreign currency transactions | | | 693,122 | |
| | | | |
Net realized gain (loss) on investments, futures transactions, swap transactions, written option transactions and foreign currency transactions | | | (470,895 | ) |
| | | | |
Net change in unrealized appreciation (depreciation) on: | | | | |
Unaffiliated investments | | | 24,876,403 | |
Futures contracts | | | (613,184 | ) |
Swap contracts | | | (14,556 | ) |
Written option contracts | | | (21,498 | ) |
Foreign currency forward contracts | | | 541,576 | |
Translation of other assets and liabilities in foreign currencies | | | 64,114 | |
| | | | |
Net change in unrealized appreciation (depreciation) on investments, futures contracts, swap contracts, written options and foreign currencies | | | 24,832,855 | |
| | | | |
Net realized and unrealized gain (loss) on investments, futures transactions, written options, swap transactions and foreign currency transactions | | | 24,361,960 | |
| | | | |
Net increase (decrease) in net assets resulting from operations | | $ | 23,955,921 | |
| | | | |
| | | | | | |
The notes to the financial statements are an integral part of,
and should be read in conjunction with, the financial statements. | | | | | 25 | |
Statements of Changes in Net Assets
for the six months ended June 30, 2020 (Unaudited) and the year ended December 31, 2019
| | | | | | | | |
| | | 2020 | | | 2019 | |
| Increase (Decrease) in Net Assets | | | | | |
Operations: | | | | | | | | |
Net investment income (loss) | | $ | (406,039 | ) | | $ | 7,790,803 | |
Net realized gain (loss) on investments, investments sold short, futures transactions, swap transactions, written option transactions and foreign currency transactions | | | (470,895 | ) | | | (2,013,650 | ) |
Net change in unrealized appreciation (depreciation) on investments, futures contracts, written options, swap contracts, written options and foreign currencies | | | 24,832,855 | | | | 22,392,886 | |
| | | | |
Net increase (decrease) in net assets resulting from operations | | | 23,955,921 | | | | 28,170,039 | |
| | | | |
Distributions to shareholders: | | | | | | | | |
Initial Class | | | — | | | | (1,424,708 | ) |
Service Class | | | — | | | | (9,622,993 | ) |
| | | | |
Total distributions to shareholders | | | — | | | | (11,047,701 | ) |
| | | | |
Capital share transactions: | | | | | | | | |
Net proceeds from sale of shares | | | 46,803,292 | | | | 82,521,582 | |
Net asset value of shares issued to shareholders in reinvestment of distributions | | | — | | | | 11,047,701 | |
Cost of shares redeemed | | | (45,770,608 | ) | | | (45,227,235 | ) |
| | | | |
Increase (decrease) in net assets derived from capital share transactions | | | 1,032,684 | | | | 48,342,048 | |
| | | | |
Net increase (decrease) in net assets | | | 24,988,605 | | | | 65,464,386 | |
| | |
| Net Assets | | | | | | | | |
Beginning of period | | | 392,039,162 | | | | 326,574,776 | |
| | | | |
End of period | | $ | 417,027,767 | | | $ | 392,039,162 | |
| | | | |
| | | | |
| 26 | | MainStay VP PIMCO Real Return Portfolio | | The notes to the financial statements are an integral part of,
and should be read in conjunction with, the financial statements. |
Statement of Cash Flows
for the six months ended June 30, 2020 (Unaudited)
| | | | |
| Cash flows used in operating activities: | |
Net increase in net assets resulting from operations | | $ | 23,955,921 | |
Adjustments to reconcile net increase in net assets resulting from operations to net cash used in operating activities | | | | |
Long term investments purchased | | | (613,946,110 | ) |
Long term investments sold | | | 631,365,432 | |
Sale of short term investments, net | | | 15,362,868 | |
Sale of affiliated investments, net | | | (331,972 | ) |
Amortization (accretion) of discount and premium, net | | | (1,371,000 | ) |
Increase in investment securities sold receivable | | | (69,740,376 | ) |
Decrease in dividends and interest receivable | | | 90,081 | |
Decrease in premiums paid for OTC swap contracts | | | 18,126 | |
Decrease in other assets | | | 62,312 | |
Increase in unrealized appreciation for open forward foreign currency contracts | | | (348,486 | ) |
Decrease in premiums from written options | | | (147,668 | ) |
Increase in investment securities purchased payable | | | 34,090,610 | |
Increase in cash collateral due to broker for foreign currency forward contracts | | | 650,000 | |
Decrease in professional fees payable | | | (16,120 | ) |
Decrease in custodian payable | | | (23,485 | ) |
Increase in shareholder communication payable | | | 27,033 | |
Decrease in due to Trustees | | | (135 | ) |
Increase in due to manager | | | 20,482 | |
Increase in due to NYLIFE Distributors | | | 1,752 | |
Increase in variation margin on centrally cleared swap contracts | | | 320,764 | |
Decrease in variation margin on futures contracts | | | (612,855 | ) |
Decrease in unrealized depreciation for open forward foreign currency contracts | | | (193,090 | ) |
Increase in accrued expenses | | | 3,026 | |
Increase in unrealized appreciation on OTC swap contracts | | | (3,263 | ) |
Decrease in unrealized depreciation on OTC swap contracts | | | (62,861 | ) |
Net realized gain from unaffiliated investments | | | (2,676,776 | ) |
Net change in unrealized (appreciation) depreciation on unaffiliated investments | | | (24,876,403 | ) |
Net change in unrealized (appreciation) depreciation on written options | | | 21,498 | |
| | | | |
Net cash used in operating activities* | | | (8,360,695 | ) |
| | | | |
| | | | |
| Cash flows from financing activities: | |
Proceeds from shares sold | | | 46,745,904 | |
Payment on shares redeemed | | | (45,664,242 | ) |
Increase in due to custodian | | | 43,036 | |
Proceeds from reverse repurchase agreements | | | (9,816,375 | ) |
Payments on reverse repurchase agreements | | | 9,816,375 | |
Payments from sale-buyback transactions | | | (2,147,008,233 | ) |
Proceeds on sale-buyback transactions | | | 2,153,235,819 | |
| | | | |
Net cash from financing activities | | | 7,352,284 | |
| | | | |
Effect of exchange rate changes on cash | | | (12,806 | ) |
Net decrease in cash and restricted cash | | | (341,217 | ) |
Cash, restricted cash and foreign currency at beginning of period | | | 4,638,332 | |
| | | | |
Cash, restricted cash and foreign currency at end of period | | $ | 4,297,115 | |
| | | | |
| * | Included in operating expenses is cash of $945,100 paid for interest on borrowings. |
| | | | |
|
| Supplemental disclosure of cash flow information: | |
| The following tables provide a reconciliation of cash and restricted cash reported within the Statement of Assets and Liabilities that sums to the total of the such amounts shown on the Statement of Cash Flows: | |
Cash and restricted cash at beginning of period | | | | |
Cash | | $ | 56,570 | |
Cash denominated in foreign currencies | | | 976,757 | |
Cash collateral on deposit at broker for futures contracts | | | 1,781,005 | |
Cash collateral on deposit at broker for swap contracts | | | 1,824,000 | |
| | | | |
Total cash and restricted cash shown in the Statement of Cash Flows | | $ | 4,638,332 | |
| | | | |
Cash and restricted cash at end of period | | | | |
Cash denominated in foreign currencies | | $ | 1,479,961 | |
Cash collateral on deposit at broker for futures contracts | | | 1,332,154 | |
Cash collateral on deposit at broker for swap contracts | | | 1,485,000 | |
| | | | |
Total cash and restricted cash shown in the Statement of Cash Flows | | $ | 4,297,115 | |
| | | | |
Restricted cash consists of cash that has been segregated to cover the Portfolio’s collateral or margin obligations under derivative contracts. It is separately reported on the Statement of Assets and Liabilities as cash collateral on deposit at brokers.
| | | | | | |
The notes to the financial statements are an integral part of,
and should be read in conjunction with, the financial statements. | | | | | 27 | |
Financial Highlights selected per share data and ratios
| | | | | | | | | | | | | | | | | | | | | | | | | | | | |
| | | |
| | | Six months
ended June 30, | | | | | | Year ended December 31, | |
| | | | | | | |
| Initial Class | | 2020* | | | | | | 2019 | | | 2018 | | | 2017 | | | 2016 | | | 2015 | |
| | | | | | | |
Net asset value at beginning of period | | $ | 8.63 | | | | | | | $ | 8.20 | | | $ | 8.54 | | | $ | 8.40 | | | $ | 8.11 | | | $ | 8.71 | |
| | | | | | | | | | | | | | | | | | | | | | | | | | | | |
| | | | | | | |
Net investment income (loss) (a) | | | 0.00 | ‡ | | | | | | | 0.20 | | | | 0.23 | | | | 0.23 | | | | 0.17 | | | | 0.11 | |
| | | | | | | |
Net realized and unrealized gain (loss) on investments | | | 0.51 | | | | | | | | 0.50 | | | | (0.53 | ) | | | 0.15 | | | | 0.21 | | | | (0.51 | ) |
| | | | | | | |
Net realized and unrealized gain (loss) on foreign currency transactions | | | 0.03 | | | | | | | | 0.01 | | | | 0.10 | | | | (0.09 | ) | | | 0.05 | | | | 0.19 | |
| | | | | | | | | | | | | | | | | | | | | | | | | | | | |
| | | | | | | |
Total from investment operations | | | 0.54 | | | | | | | | 0.71 | | | | (0.20 | ) | | | 0.29 | | | | 0.43 | | | | (0.21 | ) |
| | | | | | | | | | | | | | | | | | | | | | | | | | | | |
| | | | | | | |
| Less distributions: | | | | | | | | | | | | | | | | | | | | | | | | | | | | |
| | | | | | | |
From net investment income | | | — | | | | | | | | (0.28 | ) | | | (0.14 | ) | | | (0.15 | ) | | | (0.14 | ) | | | (0.39 | ) |
| | | | | | | | | | | | | | | | | | | | | | | | | | | | |
| | | | | | | |
Net asset value at end of period | | $ | 9.17 | | | | | | | $ | 8.63 | | | $ | 8.20 | | | $ | 8.54 | | | $ | 8.40 | | | $ | 8.11 | |
| | | | | | | | | | | | | | | | | | | | | | | | | | | | |
| | | | | | | |
Total investment
return (b) | | | 6.26 | %(c) | | | | | | | 8.56 | %(c) | | | (2.38 | %)(c) | | | 3.45 | % | | | 5.28 | % | | | (2.51 | %) |
| | | | | | | |
| Ratios (to average net assets)/Supplemental Data: | | | | | | | | | | | | | | | | | | | | | | | | | | | | |
| | | | | | | |
Net investment income (loss) | | | 0.03 | %†† | | | | | | | 2.35 | % | | | 2.78 | % | | | 2.71 | % | | | 2.05 | %(d) | | | 1.26 | % |
| | | | | | | |
Net expenses (e) | | | 1.00 | %†† | | | | | | | 1.65 | % | | | 1.43 | % | | | 1.03 | % | | | 0.91 | %(f) | | | 0.72 | % |
| | | | | | | |
Expenses (before waiver/reimbursement) (e) | | | 1.07 | %†† | | | | | | | 1.71 | % | | | 1.43 | % | | | 1.03 | % | | | 0.91 | %(f) | | | 0.72 | % |
| | | | | | | |
Interest expense and fees | | | 0.47 | %†† | | | | | | | 1.09 | % | | | 0.81 | % | | | 0.42 | % | | | 0.32 | % | | | 0.15 | % |
| | | | | | | |
Portfolio turnover rate (g) | | | 105 | % | | | | | | | 187 | % | | | 157 | % | | | 121 | % | | | 143 | % | | | 84 | % |
| | | | | | | |
Net assets at end of period (in 000’s) | | $ | 49,311 | | | | | | | $ | 48,707 | | | $ | 44,523 | | | $ | 45,563 | | | $ | 36,060 | | | $ | 68,794 | |
| ‡ | Less than one cent per share. |
| (a) | Per share data based on average shares outstanding during the period. |
| (b) | Total return does not reflect any deduction of sales charges, mortality and expense charges, contract charges or administrative charges. For periods of less than one year, total return is not annualized. |
| (c) | Total investment return may reflect adjustments to conform to generally accepted accounting principles. |
| (d) | Without the custody fee reimbursement, net investment income (loss) would have been 2.04%. |
| (e) | In addition to the fees and expenses which the Portfolio bears directly, it also indirectly bears a pro-rata share of the fees and expenses of the underlying funds in which it invests. Such indirect expenses are not included in the above expense ratios. |
| (f) | Without the custody fee reimbursement, net expenses would have been 0.92%. |
| (g) | The portfolio turnover rates not including mortgage dollar rolls were 65%, 139%, 48%, 96%, 91% and 59% for the six months ended June 30, 2020 and for the years ended December 31, 2019, 2018, 2017, 2016 and 2015, respectively. |
| | | | |
| 28 | | MainStay VP PIMCO Real Return Portfolio | | The notes to the financial statements are an integral part of,
and should be read in conjunction with, the financial statements. |
Financial Highlights selected per share data and ratios
| | | | | | | | | | | | | | | | | | | | | | | | | | | | |
| | | |
| | | Six months
ended June 30, | | | | | | Year ended December 31, | |
| | | | | | | |
| Service Class | | 2020* | | | | | | 2019 | | | 2018 | | | 2017 | | | 2016 | | | 2015 | |
| | | | | | | |
Net asset value at beginning of period | | $ | 8.61 | | | | | | | $ | 8.19 | | | $ | 8.53 | | | $ | 8.39 | | | $ | 8.10 | | | $ | 8.70 | |
| | | | | | | | | | | | | | | | | | | | | | | | | | | | |
| | | | | | | |
Net investment income (loss) (a) | | | (0.01 | ) | | | | | | | 0.18 | | | | 0.21 | | | | 0.21 | | | | 0.18 | | | | 0.05 | |
| | | | | | | |
Net realized and unrealized gain (loss) on investments | | | 0.51 | | | | | | | | 0.49 | | | | (0.54 | ) | | | 0.15 | | | | 0.19 | | | | (0.46 | ) |
| | | | | | | |
Net realized and unrealized gain (loss) on foreign currency transactions | | | 0.03 | | | | | | | | 0.01 | | | | 0.10 | | | | (0.09 | ) | | | 0.04 | | | | 0.17 | |
| | | | | | | | | | | | | | | | | | | | | | | | | | | | |
| | | | | | | |
Total from investment operations | | | 0.53 | | | | | | | | 0.68 | | | | (0.23 | ) | | | 0.27 | | | | 0.41 | | | | (0.24 | ) |
| | | | | | | | | | | | | | | | | | | | | | | | | | | | |
| | | | | | | |
| Less distributions: | | | | | | | | | | | | | | | | | | | | | | | | | | | | |
| | | | | | | |
From net investment income | | | — | | | | | | | | (0.26 | ) | | | (0.11 | ) | | | (0.13 | ) | | | (0.12 | ) | | | (0.36 | ) |
| | | | | | | | | | | | | | | | | | | | | | | | | | | | |
| | | | | | | |
Net asset value at end of period | | $ | 9.14 | | | | | | | $ | 8.61 | | | $ | 8.19 | | | $ | 8.53 | | | $ | 8.39 | | | $ | 8.10 | |
| | | | | | | | | | | | | | | | | | | | | | | | | | | | |
| | | | | | | |
Total investment
return (b) | | | 6.16 | % (c) | | | | | | | 8.30 | %(c) | | | (2.63 | %)(c) | | | 3.20 | % | | | 5.03 | % | | | (2.76 | %) |
| | | | | | | |
| Ratios (to average net assets)/Supplemental Data: | | | | | | | | | | | | | | | | | | | | | | | | | | | | |
| | | | | | | |
Net investment income (loss) | | | (0.23 | %)†† | | | | | | | 2.14 | % | | | 2.53 | % | | | 2.46 | % | | | 2.15 | %(d) | | | 0.56 | % |
| | | | | | | |
Net expenses (e) | | | 1.25 | % †† | | | | | | | 1.89 | % | | | 1.68 | % | | | 1.28 | % | | | 1.16 | %(f) | | | 0.97 | % |
| | | | | | | |
Expenses (before waiver/reimbursement) (e) | | | 1.32 | % †† | | | | | | | 1.96 | % | | | 1.68 | % | | | 1.28 | % | | | 1.16 | %(f) | | | 0.97 | % |
| | | | | | | |
Interest expense and fees | | | 0.47 | % †† | | | | | | | 1.09 | % | | | 0.81 | % | | | 0.42 | % | | | 0.32 | % | | | 0.15 | % |
| | | | | | | |
Portfolio turnover rate (g) | | | 105 | % | | | | | | | 187 | % | | | 157 | % | | | 121 | % | | | 143 | % | | | 84 | % |
| | | | | | | |
Net assets at end of period (in 000’s) | | $ | 367,716 | | | | | | | $ | 343,332 | | | $ | 282,052 | | | $ | 287,520 | | | $ | 282,006 | | | $ | 283,273 | |
| (a) | Per share data based on average shares outstanding during the period. |
| (b) | Total return does not reflect any deduction of sales charges, mortality and expense charges, contract charges or administrative charges. For periods of less than one year, total return is not annualized. |
| (c) | Total investment return may reflect adjustments to conform to generally accepted accounting principles. |
| (d) | Without the custody fee reimbursement, net investment income (loss) would have been 2.14%. |
| (e) | In addition to the fees and expenses which the Portfolio bears directly, it also indirectly bears a pro-rata share of the fees and expenses of the underlying funds in which it invests. Such indirect expenses are not included in the above expense ratios. |
| (f) | Without the custody fee reimbursement, net expenses would have been 1.17%. |
| (g) | The portfolio turnover rates not including mortgage dollar rolls were 65%, 139%, 48%, 96%, 91% and 59% for the six months ended June 30, 2020 and for the years ended December 31, 2019, 2018, 2017, 2016 and 2015, respectively. |
| | | | | | |
The notes to the financial statements are an integral part of,
and should be read in conjunction with, the financial statements. | | | | | 29 | |
Notes to Financial Statements (Unaudited)
Note 1–Organization and Business
MainStay VP Funds Trust (the “Fund”) was organized as a Delaware statutory trust on February 1, 2011. The Fund is registered under the Investment Company Act of 1940, as amended (the “1940 Act”), as an open-end management investment company. The Fund is comprised of thirty-one separate series (collectively referred to as the “Portfolios”). These financial statements and notes relate to the MainStay VP PIMCO Real Return Portfolio (the “Portfolio”), a “non-diversified” portfolio, as that term is defined in the 1940 Act, as interpreted or modified by regulatory authorities having jurisdiction, from time to time. Since the Portfolio has historically operated as a “diversified” portfolio, it will not operate as “non-diversified” without first obtaining shareholder approval.
Shares of the Portfolio are currently offered to certain separate accounts to fund variable annuity policies and variable universal life insurance policies issued by New York Life Insurance and Annuity Corporation (“NYLIAC”), a wholly-owned subsidiary of New York Life Insurance Company (“New York Life”) and may also be offered to fund variable annuity policies and variable universal life insurance policies issued by other insurance companies. NYLIAC allocates shares of the Portfolios to, among others, certain NYLIAC separate accounts. Shares of the Portfolio are also offered to the MainStay VP Conservative Allocation Portfolio, MainStay VP Moderate Allocation Portfolio, MainStay VP Moderate Growth Allocation Portfolio and MainStay VP Growth Allocation Portfolio, which operate as “funds-of-funds,” and other variable insurance funds.
The Portfolio currently offers two classes of shares. Initial Class and Service Class shares commenced operations on February 17, 2012. Shares of the Portfolio are offered and are redeemed at a price equal to their respective net asset value (“NAV”) per share. No sales or redemption charge is applicable to the purchase or redemption of the Portfolio’s shares. Under the terms of the Fund’s multiple class plan adopted pursuant to Rule 18f-3 under the 1940 Act, the classes differ in that, among other things, Service Class shares of the Portfolio pay a combined distribution and service fee of 0.25% of average daily net assets attributable to Service Class shares of the Portfolio to the Distributor (as defined in Note 3(B)) pursuant to a plan adopted in accordance with Rule 12b-1 under the 1940 Act. Contract owners of variable annuity contracts purchased after June 2, 2003, are permitted to invest only in the Service Class shares.
The Portfolio’s investment objective is to seek maximum real return, consistent with preservation of real capital and prudent investment management.
Note 2–Significant Accounting Policies
The Portfolio is an investment company and accordingly follows the investment company accounting and reporting guidance of the Financial Accounting Standards Board (“FASB”) Accounting Standard Codification Topic 946 Financial Services – Investment Companies. The Portfolio prepares its financial statements in accordance with generally accepted accounting principles (“GAAP”) in the United States of America and follows the significant accounting policies described below.
(A) Securities Valuation. Investments are usually valued as of the close of regular trading on the New York Stock Exchange (the
“Exchange”) (usually 4:00 p.m. Eastern time) on each day the Portfolio is open for business (“valuation date”).
The Board of Trustees of the Fund (the “Board”) adopted procedures establishing methodologies for the valuation of the Portfolio’s securities and other assets and delegated the responsibility for valuation determinations under those procedures to the Valuation Committee of the Fund (the “Valuation Committee”). The procedures state that, subject to the oversight of the Board and unless otherwise noted, the responsibility for the day-to-day valuation of portfolio assets (including fair value measurements for the Portfolio’s assets and liabilities) rests with New York Life Investment Management LLC (“New York Life Investments” or the “Manager”), aided to whatever extent necessary by the Subadvisor (as defined in Note 3(A)). To assess the appropriateness of security valuations, the Manager, the Subadvisor or the Portfolio’s third-party service provider, who is subject to oversight by the Manager, regularly compares prior day prices, prices on comparable securities and the sale prices to the prior and current day prices and challenges prices with changes exceeding certain tolerance levels with third-party pricing services or broker sources.
The Board authorized the Valuation Committee to appoint a Valuation Subcommittee (the “Subcommittee”) to establish the prices of securities for which market quotations are not readily available or the prices of which are not otherwise readily determinable under the procedures. The Subcommittee meets (in person, via electronic mail or via teleconference) on an as-needed basis. The Valuation Committee meets to ensure that actions taken by the Subcommittee were appropriate.
For those securities valued through either a standardized fair valuation methodology or a fair valuation measurement, the Subcommittee deals with such valuation and the Valuation Committee reviews and affirms, if appropriate, the reasonableness of the valuation based on such methodologies and measurements on a regular basis after considering information that is reasonably available and deemed relevant by the Valuation Committee. Any action taken by the Subcommittee with respect to the valuation of a portfolio security or other asset is submitted for review and ratification (if appropriate) to the Valuation Committee and the Board at the next regularly scheduled meeting.
“Fair value” is defined as the price the Portfolio would reasonably expect to receive upon selling an asset or liability in an orderly transaction to an independent buyer in the principal or most advantageous market for the asset or liability. Fair value measurements are determined within a framework that establishes a three-tier hierarchy that maximizes the use of observable market data and minimizes the use of unobservable inputs to establish a classification of fair value measurements for disclosure purposes. “Inputs” refer broadly to the assumptions that market participants would use in pricing the asset or liability, including assumptions about risk, such as the risk inherent in a particular valuation technique used to measure fair value using a pricing model and/or the risk inherent in the inputs for the valuation technique. Inputs may be observable or unobservable. Observable inputs reflect the assumptions market participants would use in pricing the asset or liability based on market data obtained from sources independent of the Portfolio. Unobservable inputs reflect the Portfolio’s own assumptions about the assumptions market participants would use in pricing the asset or liability based on the information available. The inputs or methodology used for valuing assets or liabilities may not be an indication of the risks
| | |
| 30 | | MainStay VP PIMCO Real Return Portfolio |
associated with investing in those assets or liabilities. The three-tier hierarchy of inputs is summarized below.
| • | | Level 1—quoted prices in active markets for an identical asset or liability |
| • | | Level 2—other significant observable inputs (including quoted prices for a similar asset or liability in active markets, interest rates and yield curves, prepayment speeds, credit risk, etc.) |
| • | | Level 3—significant unobservable inputs (including the Portfolio’s own assumptions about the assumptions that market participants would use in measuring fair value of an asset or liability) |
The level of an asset or liability within the fair value hierarchy is based on the lowest level of an input, both individually and in the aggregate, that is significant to the fair value measurement. The aggregate value by input level of the Portfolio’s assets and liabilities as of June 30, 2020 is included at the end of the Portfolio of Investments.
The Portfolio may use third-party vendor evaluations, whose prices may be derived from one or more of the following standard inputs, among others:
| | |
• Benchmark yields | | • Reported trades |
• Broker/dealer quotes | | • Issuer spreads |
• Two-sided markets | | • Benchmark securities |
• Bids/offers | | • Reference data (corporate actions or material event notices) |
• Industry and economic events | | • Comparable bonds |
• Monthly payment information | | |
An asset or liability for which market values cannot be measured using the methodologies described above is valued by methods deemed reasonable in good faith by the Valuation Committee, following the procedures established by the Board, to represent fair value. Under these procedures, the Portfolio generally uses a market-based approach which may use related or comparable assets or liabilities, recent transactions, market multiples, book values and other relevant information. The Portfolio may also use an income-based valuation approach in which the anticipated future cash flows of the asset or liability are discounted to calculate fair value. Discounts may also be applied due to the nature and/or duration of any restrictions on the disposition of the asset or liability. Fair value represents a good faith approximation of the value of a security. Fair value determinations involve the consideration of a number of subjective factors, an analysis of applicable facts and circumstances and the exercise of judgment. As a result, it is possible that the fair value for a security determined in good faith in accordance with the Portfolio’s valuation procedures may differ from valuations for the same security determined by other funds using their own valuation procedures. Although the Portfolio’s valuation procedures are designed to value a security at the price the Portfolio may reasonably expect to receive upon the security’s sale in an orderly transaction, there can be no assurance that any fair value determination thereunder would, in fact, approximate the amount that the Portfolio would actually realize upon the sale of the security or the price at which the security would trade if a reliable market price were readily available. During the six-month period ended June 30, 2020, there were no material changes to the fair value methodologies.
Securities which may be valued in this manner include, but are not limited to: (i) a security for which trading has been halted or suspended; (ii) a debt security that has recently gone into default and for which there is not a current market quotation; (iii) a security of an issuer that has entered into a restructuring; (iv) a security that has been delisted from a national exchange; (v) a security for which the market price is not readily available from a third-party pricing source or, if so provided, does not, in the opinion of the Manager or the Subadvisor, reflect the security’s market value; (vi) a security subject to trading collars for which no or limited trading takes place; and (vii) a security whose principal market has been temporarily closed at a time when, under normal conditions, it would be open. Securities valued in this manner are generally categorized as Level 3 in the hierarchy. As of June 30, 2020, no securities held by the Portfolio were fair valued in such a manner.
Certain securities held by the Portfolio may principally trade in foreign markets. Events may occur between the time the foreign markets close and the time at which the Portfolio’s NAVs are calculated. These events may include, but are not limited to, situations relating to a single issuer in a market sector, significant fluctuations in U.S. or foreign markets, natural disasters, armed conflicts, governmental actions or other developments not tied directly to the securities markets. Should the Manager or the Subadvisor conclude that such events may have affected the accuracy of the last price of such securities reported on the local foreign market, the Subcommittee may, pursuant to procedures adopted by the Board, adjust the value of the local price to reflect the estimated impact on the price of such securities as a result of such events. In this instance, securities are generally categorized as Level 3 in the hierarchy. Additionally, certain foreign equity securities are also fair valued whenever the movement of a particular index exceeds certain thresholds. In such cases, the securities are fair valued by applying factors provided by a third-party vendor in accordance with valuation procedures adopted by the Board and are generally categorized as Level 2 in the hierarchy. As of June 30, 2020, no foreign equity securities were held by the Portfolio.
Futures contracts are valued at the last posted settlement price on the market where such futures are primarily traded. These securities are generally categorized as Level 1 in the hierarchy.
Investments in mutual funds, including money market funds, are valued at their respective NAVs as of the close of the Exchange on the valuation date. These securities are generally categorized as Level 1 in the hierarchy.
Options contracts are valued at the last posted settlement price on the market where such options are primarily traded.
Debt securities (other than convertible and municipal bonds) are valued at the evaluated bid prices (evaluated mean prices in the case of convertible and municipal bonds) supplied by a pricing agent or broker selected by the Manager, in consultation with the Subadvisor. The evaluations are market-based measurements processed through a pricing application and represents the pricing agent’s good faith determination as to what a holder may receive in an orderly transaction under market conditions. The rules based logic utilizes valuation techniques that reflect participants’ assumptions and vary by asset class and per methodology, maximizing the use of relevant observable data
Notes to Financial Statements (Unaudited) (continued)
including quoted prices for similar assets, benchmark yield curves and market corroborated inputs. The evaluated bid or mean prices are deemed by the Manager, in consultation with the Subadvisor, to be representative of market values at the regular close of trading of the Exchange on each valuation date. Debt securities purchased on a delayed delivery basis are marked to market daily until settlement at the forward settlement date. Debt securities, including corporate bonds, U.S. government and federal agency bonds, municipal bonds, foreign bonds, convertible bonds, asset-backed securities and mortgage-backed securities are generally categorized as Level 2 in the hierarchy.
Foreign currency forward contracts are valued at their fair market values measured on the basis of the mean between the last current bid and ask prices based on dealer or exchange quotations and are generally categorized as Level 2 in the hierarchy.
Swaps are marked to market daily based upon quotations from pricing agents, brokers or market makers. These securities are generally categorized as Level 2 in the hierarchy.
Loan assignments, participations and commitments are valued at the average of bid quotations obtained from the engaged independent pricing service and are generally categorized as Level 2 in the hierarchy. Certain loan assignments, participations and commitments may be valued by utilizing significant unobservable inputs obtained from the pricing service and are generally categorized as Level 3 in the hierarchy. As of June 30, 2020, no securities held by the Portfolio were fair valued in such a manner.
Temporary cash investments acquired in excess of 60 days to maturity at the time of purchase are valued using the latest bid prices or using valuations based on a matrix system (which considers such factors as security prices, yields, maturities and ratings), both as furnished by independent pricing services. Temporary cash investments that mature in 60 days or less at the time of purchase (“Short-Term Investments”) are valued using the amortized cost method of valuation, unless the use of such method would be inappropriate. The amortized cost method involves valuing a security at its cost on the date of purchase and thereafter assuming a constant amortization to maturity of the difference between such cost and the value on maturity date. Amortized cost approximates the current fair value of a security. Securities valued using the amortized cost method are not valued using quoted prices in an active market and are generally categorized as Level 2 in the hierarchy.
The information above is not intended to reflect an exhaustive list of the methodologies that may be used to value portfolio investments. The valuation procedures permit the use of a variety of valuation methodologies in connection with valuing portfolio investments. The methodology used for a specific type of investment may vary based on the market data available or other considerations. The methodologies summarized above may not represent the specific means by which portfolio investments are valued on any particular business day.
A portfolio investment may be classified as an illiquid investment under the Portfolio’s written liquidity risk management program and related procedures (“Liquidity Program”). Illiquidity of an investment might prevent the sale of such investment at a time when the Manager or the Subadvisor might wish to sell, and these investments could have the effect of decreasing the overall level of the Portfolio’s liquidity. Further, the lack of an established secondary market may make it more difficult
to value illiquid investments, requiring the Portfolio to rely on judgments that may be somewhat subjective in measuring value, which could vary materially from the amount that the Portfolio could realize upon disposition. Difficulty in selling illiquid investments may result in a loss or may be costly to the Portfolio. An illiquid investment is any investment that the Manager or Subadvisor reasonably expects cannot be sold or disposed of in current market conditions in seven calendar days or less without the sale or disposition significantly changing the market value of the investment. The liquidity classification of each investment will be made using information obtained after reasonable inquiry and taking into account, among other things, relevant market, trading and investment-specific considerations in accordance with the Liquidity Program. Illiquid investments are often valued in accordance with methods deemed by the Board in good faith to be reasonable and appropriate to accurately reflect their fair value. The liquidity of the Portfolio’s investments, was determined as of June 30, 2020 and can change at any time. Illiquid investments as of June 30, 2020, are shown in the Portfolio of Investments.
(B) Income Taxes. The Portfolio’s policy is to comply with the requirements of the Internal Revenue Code of 1986, as amended (the “Internal Revenue Code”), applicable to regulated investment companies and to distribute all of its taxable income to the shareholders of the Portfolio within the allowable time limits.
The Manager evaluates the Portfolio’s tax positions to determine if the tax positions taken meet the minimum recognition threshold in connection with accounting for uncertainties in income tax positions taken or expected to be taken for the purposes of measuring and recognizing tax liabilities in the financial statements. Recognition of tax benefits of an uncertain tax position is permitted only to the extent the position is “more likely than not” to be sustained assuming examination by taxing authorities. The Manager analyzed the Portfolio’s tax positions taken on federal, state and local income tax returns for all open tax years (for up to three tax years) and has concluded that no provisions for federal, state and local income tax are required in the Portfolio’s financial statements. The Portfolio’s federal, state and local income tax and federal excise tax returns for tax years for which the applicable statutes of limitations have not expired are subject to examination by the Internal Revenue Service and state and local departments of revenue.
(C) Foreign Taxes. The Portfolio may be subject to foreign taxes on income and other transaction-based taxes imposed by certain countries in which it invests. A portion of the taxes on gains on investments or currency purchases/repatriation may be reclaimable. The Portfolio will accrue such taxes and reclaims as applicable, based upon its current interpretation of tax rules and regulations that exist in the markets in which it invests.
The Portfolio may be subject to taxation on realized capital gains, repatriation proceeds and other transaction-based taxes imposed by certain countries in which it invests. The Portfolio will accrue such taxes as applicable based upon its current interpretation of tax rules and regulations that exist in the market in which it invests. Capital gains taxes relating to positions still held are reflected as a liability in the Statement of Assets and Liabilities, as well as an adjustment to the Portfolio’s net unrealized appreciation (depreciation). Taxes related to capital gains realized, if any, are reflected as part of net realized gain (loss) in the Statement of Operations. Changes in tax liabilities related to capital
| | |
| 32 | | MainStay VP PIMCO Real Return Portfolio |
gains taxes on unrealized investment gains, if any, are reflected as part of the change in net unrealized appreciation (depreciation) on investments in the Statement of Operations. Transaction-based charges are generally assessed as a percentage of the transaction amount.
(D) Dividends and Distributions to Shareholders. Dividends and distributions are recorded on the ex-dividend date. The Portfolio intends to declare and pay dividends from net investment income and distributions from net realized capital and currency gains, if any, at least annually. Unless a shareholder elects otherwise, all dividends and distributions are reinvested at NAV in the same class of shares of the Portfolio. Dividends and distributions to shareholders are determined in accordance with federal income tax regulations and may differ from determinations using GAAP.
(E) Security Transactions and Investment Income. The Portfolio records security transactions on the trade date. Realized gains and losses on security transactions are determined using the identified cost method. Dividend income is recognized on the ex-dividend date, net of any foreign tax withheld at the source, and interest income is accrued as earned using the effective interest rate method. Discounts and premiums on securities purchased for the Portfolio are accreted and amortized, respectively, on the effective interest rate method.
Investment income and realized and unrealized gains and losses on investments of the Portfolio are allocated pro rata to the separate classes of shares based upon their relative net assets on the date the income is earned or realized and unrealized gains and losses are incurred.
The Portfolio may place a debt security on non-accrual status and reduce related interest income by ceasing current accruals and writing off all or a portion of any interest receivables when the collection of all or a portion of such interest has become doubtful. A debt security is removed from non-accrual status when the issuer resumes interest payments or when collectability of interest is reasonably assured.
(F) Expenses. Expenses of the Fund are allocated to the individual Portfolios in proportion to the net assets of the respective Portfolios when the expenses are incurred, except where direct allocations of expenses can be made. Expenses (other than fees incurred under the distribution and service plans, further discussed in Note 3(B), which are charged directly to the Service Class shares) are allocated to separate classes of shares pro rata based upon their relative net assets on the date the expenses are incurred. The expenses borne by the Portfolio, including those of related parties to the Portfolio, are shown in the Statement of Operations.
Additionally, the Portfolio may invest in mutual funds, which are subject to management fees and other fees that may cause the costs of investing in mutual funds to be greater than the costs of owning the underlying securities directly. These indirect expenses of mutual funds are not included in the amounts shown as expenses in the Portfolio’s Statement of Operations or in the expense ratios included in the Financial Highlights.
(G) Use of Estimates. In preparing financial statements in conformity with GAAP, the Manager makes estimates and assumptions that affect the reported amounts and disclosures in the financial statements. Actual results could differ from those estimates.
(H) Repurchase Agreements. The Portfolio may enter into repurchase agreements (i.e., buy a security from another party with the agreement that it will be sold back in the future) to earn income. The Portfolio may enter into repurchase agreements only with counterparties, usually financial institutions, that are deemed by the Manager or the Subadvisor to be creditworthy, pursuant to guidelines established by the Board. During the term of any repurchase agreement, the Manager or the Subadvisor will continue to monitor the creditworthiness of the counterparty. Under the 1940 Act, repurchase agreements are considered to be collateralized loans by the Portfolio to the counterparty secured by the securities transferred to the Portfolio.
Repurchase agreements are subject to counterparty risk, meaning the Portfolio could lose money by the counterparty’s failure to perform under the terms of the agreement. The Portfolio mitigates this risk by ensuring the repurchase agreement is collateralized by cash, U.S. government securities, fixed income securities and/or other securities. The collateral is held by the Portfolio’s custodian and valued daily on a mark to market basis to determine if the value, including accrued interest, exceeds the repurchase price. In the event of the counterparty’s default on the obligation to repurchase, the Portfolio has the right to liquidate the collateral and apply the proceeds in satisfaction of the obligation. Under certain circumstances, such as in the event of default or bankruptcy by the counterparty, realization and/or retention of the collateral may be limited or subject to delay, to legal proceedings and possible realized loss to the Portfolio. Repurchase agreements as of June 30, 2020, are shown in the Portfolio of Investments.
(I) Futures Contracts. A futures contract is an agreement to purchase or sell a specified quantity of an underlying instrument at a specified future date and price, or to make or receive a cash payment based on the value of a financial instrument (e.g., foreign currency, interest rate, security or securities index). The Portfolio is subject to risks such as market price risk and/or interest rate risk in the normal course of investing in these contracts. Upon entering into a futures contract, the Portfolio is required to pledge to the broker or futures commission merchant an amount of cash and/or U.S. government securities equal to a certain percentage of the collateral amount, known as the “initial margin.” During the period the futures contract is open, changes in the value of the contract are recognized as unrealized appreciation or depreciation by marking to market such contract on a daily basis to reflect the market value of the contract at the end of each day’s trading. The Portfolio agrees to receive from or pay to the broker or futures commission merchant an amount of cash equal to the daily fluctuation in the value of the contract. Such receipts or payments are known as “variation margin.” When the futures contract is closed, the Portfolio records a realized gain or loss equal to the difference between the proceeds from (or cost of) the closing transaction and the Portfolio’s basis in the contract.
The use of futures contracts involves, to varying degrees, elements of market risk in excess of the amount recognized in the Statement of Assets and Liabilities. The contract or notional amounts and variation margin reflect the extent of the Portfolio’s involvement in open futures positions. There are several risks associated with the use of futures contracts as hedging techniques. There can be no assurance that a liquid market will exist at the time when the Portfolio seeks to close out a futures contract. If no liquid market exists, the Portfolio would remain
Notes to Financial Statements (Unaudited) (continued)
obligated to meet margin requirements until the position is closed. Futures contracts may involve a small initial investment relative to the risk assumed, which could result in losses greater than if the Portfolio did not invest in futures contracts. Futures contracts may be more volatile than direct investments in the instrument underlying the futures and may not correlate to the underlying instrument, causing a given hedge not to achieve its objectives. The Portfolio’s activities in futures contracts have minimal counterparty risk as they are conducted through regulated exchanges that guarantee the futures against default by the counterparty. In the event of a bankruptcy or insolvency of a futures commission merchant that holds margin on behalf of the Portfolio, the Portfolio may not be entitled to the return of the entire margin owed to the Portfolio, potentially resulting in a loss. The Portfolio’s investment in futures contracts and other derivatives may increase the volatility of the Portfolio’s NAVs and may result in a loss to the Portfolio. Open futures contracts as of June 30, 2020, are shown in the Portfolio of Investments.
(J) Foreign Currency Forward Contracts. The Portfolio may enter into foreign currency forward contracts, which are agreements to buy or sell foreign currencies on a specified future date at a specified rate. The Portfolio is subject to foreign currency exchange rate risk in the normal course of investing in these transactions. During the period the forward contract is open, changes in the value of the contract are recognized as unrealized appreciation or depreciation by marking to market such contract on a daily basis to reflect the market value of the contract at the end of each day’s trading. Cash movement occurs on settlement date. When the forward contract is closed, the Portfolio records a realized gain or loss equal to the difference between the proceeds from (or cost of) the closing transaction and the Portfolio’s basis in the contract. The Portfolio may purchase and sell foreign currency forward contracts for purposes of seeking to enhance portfolio returns and manage portfolio risk more efficiently. Foreign currency forward contracts may also be used to gain exposure to a particular currency or to hedge against the risk of loss due to changing currency exchange rates. Foreign currency forward contracts to purchase or sell a foreign currency may also be used in anticipation of future purchases or sales of securities denominated in foreign currency, even if the specific investments have not yet been selected.
The use of foreign currency forward contracts involves, to varying degrees, elements of risk in excess of the amount recognized in the Statement of Assets and Liabilities, including counterparty risk, market risk and illiquidity risk. Counterparty risk is heightened for these instruments because foreign currency forward contracts are not exchange-traded and therefore no clearinghouse or exchange stands ready to meet the obligations under such contracts. Thus, the Portfolio faces the risk that its counterparties under such contracts may not perform their obligations. Market risk is the risk that the value of a foreign currency forward contract will depreciate due to unfavorable changes in exchange rates. Illiquidity risk arises because the secondary market for foreign currency forward contracts may have less liquidity relative to markets for other securities and financial instruments. Risks also arise from the possible movements in the foreign exchange rates underlying these instruments. While the Portfolio may enter into forward contracts to reduce currency exchange risks, changes in currency exchange rates may result in poorer overall performance for the Portfolio than if it had not engaged in such transactions. Exchange rate movements can be
large, depending on the currency, and can last for extended periods of time, affecting the value of the Portfolio’s assets. Moreover, there may be an imperfect correlation between the Portfolio’s holdings of securities denominated in a particular currency and forward contracts entered into by the Portfolio. Such imperfect correlation may prevent the Portfolio from achieving the intended hedge or expose the Portfolio to the risk of currency exchange loss. The unrealized appreciation (depreciation) on forward contracts also reflects the Portfolio’s exposure at the valuation date to credit loss in the event of a counterparty’s failure to perform its obligations. As of June 30, 2020, all open forward currency contracts are shown in the Portfolio of Investments.
(K) Foreign Currency Transactions. The Portfolio’s books and records are maintained in U.S. dollars. Prices of securities denominated in foreign currency amounts are translated into U.S. dollars at the mean between the buying and selling rates last quoted by any major U.S. bank at the following dates:
| (i) | market value of investment securities, other assets and liabilities— at the valuation date; and |
| (ii) | purchases and sales of investment securities, income and expenses—at the date of such transactions. |
The assets and liabilities that are denominated in foreign currency amounts are presented at the exchange rates and market values at the close of the period. The realized and unrealized changes in net assets arising from fluctuations in exchange rates and market prices of securities are not separately presented.
Net realized gain (loss) on foreign currency transactions represents net currency gains or losses realized as a result of differences between the amounts of securities sale proceeds or purchase cost, dividends, interest and withholding taxes as recorded on the Portfolio’s books, and the U.S. dollar equivalent amount actually received or paid. Net currency gains or losses from valuing such foreign currency denominated assets and liabilities, other than investments at valuation date exchange rates, are reflected in unrealized foreign exchange gains or losses.
(L) Swap Contracts. The Portfolio may enter into credit default, interest rate, equity, index and currency exchange rate swap contracts (“swaps”). In a typical swap transaction, two parties agree to exchange the future returns (or differentials in rates of future returns) earned or realized at periodic intervals on a particular investment or instrument based on a notional principal amount. Generally, the Portfolio will enter into a swap on a net basis, which means that the two payment streams under the swap are netted, with the Portfolio receiving or paying (as the case may be) only the net amount of the two payment streams. Therefore, the Portfolio’s current obligation under a swap generally will be equal to the net amount to be paid or received under the swap, based on the relative value of notional positions attributable to each counterparty to the swap. The payments may be adjusted for transaction costs, interest payments, the amount of interest paid on the investment or instrument or other factors. Collateral, in the form of cash or securities, may be required to be held in segregated accounts with the custodian bank or broker in accordance with the terms of the swap. Swap agreements are privately negotiated in the over the counter (“OTC”) market and may be executed in a multilateral or other trade facilities platform, such as a registered commodities exchange (“centrally cleared swaps”).
| | |
| 34 | | MainStay VP PIMCO Real Return Portfolio |
Certain standardized swaps, including certain credit default and interest rate swaps, are subject to mandatory clearing and exchange-trading, and more types of standardized swaps are expected to be subject to mandatory clearing and exchange-trading in the future. The counterparty risk for exchange-traded and cleared derivatives is expected to be generally lower than for uncleared derivatives, but cleared contracts are not risk-free. In a cleared derivative transaction, the Portfolio typically enters into the transaction with a financial institution counterparty, and performance of the transaction is effectively guaranteed by a central clearinghouse, thereby reducing or eliminating the Portfolio’s exposure to the credit risk of its original counterparty. The Portfolio will be required to post specified levels of margin with the clearinghouse or at the instruction of the clearinghouse; the margin required by a clearinghouse may be greater than the margin the Portfolio would be required to post in an uncleared transaction. As of June 30, 2020, all swap positions outstanding are shown in the Portfolio of Investments.
Swaps are marked to market daily based upon quotations from pricing agents, brokers, or market makers and the change in value, if any, is recorded as unrealized appreciation or depreciation. Any payments made or received upon entering into a swap would be amortized or accreted over the life of the swap and recorded as a realized gain or loss. Early termination of a swap is recorded as a realized gain or loss. Daily changes in valuation of centrally cleared swaps, if any, are recorded as a receivable or payable for the change in value as appropriate (“variation margin”) on the Statement of Assets and Liabilities.
The Portfolio bears the risk of loss of the amount expected to be received under a swap in the event of the default or bankruptcy of the swap counterparty. The Portfolio may be able to eliminate its exposure under a swap either by assignment or other disposition, or by entering into an offsetting swap with the same party or a similar creditworthy party. Swaps are not actively traded on financial markets. Entering into swaps involves elements of credit, market, and documentation risk in excess of the amounts recognized on the Statement of Assets and Liabilities. Such risks involve the possibilities that there will be no liquid market for these swaps, that the counterparty to the swaps may default on its obligation to perform or disagree as to the meaning of the contractual terms in the swaps and that there may be unfavorable changes in interest rates, the price of the index or the security underlying these transactions.
Inflation Swaps: Inflation swap agreements are contracts in which one party agrees to pay the cumulative percentage increase in a price index (the Consumer Price Index with respect to CPI swaps) over the term of the swap (with some lag on the inflation index), and the other pays a compounded fixed rate. Inflation swaps may be used to protect the net asset value, or NAV, of a Fund against an unexpected change in the rate of inflation measured by an inflation index since the value of these agreements is expected to increase if there are unexpected inflation increases.
Interest Rate Swaps: An interest rate swap is an agreement between two parties where one stream of future interest payments is exchanged for another based on a specified principal amount. Interest rate swaps often exchange a fixed payment for a floating payment that is linked to an interest rate (most often the London Interbank Offered Rate (“LIBOR”)). The Portfolio will typically use interest rate swaps to limit, or manage, its exposure to fluctuations in interest rates, or to obtain a marginally lower interest rate than it would have been able to get without the swap.
Credit Default Swaps: The Portfolio may enter into credit default swaps to simulate long and short bond positions or to take an active long or short position with respect to the likelihood of a default or credit event by the issuer of the underlying reference obligation. The types of reference obligations underlying the swaps that may be entered into by the Portfolio include debt obligations of a single issuer of corporate or sovereign debt, a basket of obligations of different issuers or a credit index. A credit index is an equally-weighted credit default swap index that is designed to track a representative segment of the credit default swap market (e.g., investment grade, high volatility, below investment grade or emerging markets) and provides an investor with exposure to specific “baskets” of issuers of certain debt instruments. Index credit default swaps have standardized terms including a fixed spread and standard maturity dates. The composition of the obligations within a particular index changes periodically. Credit default swaps involve one party, the protection buyer, making a stream of payments to another party, the protection seller, in exchange for the right to receive a contingent payment if there is a credit event related to the underlying reference obligation. In the event that the reference obligation matures prior to the termination date of the contract, a similar security will be substituted for the duration of the contract term. Credit events are defined under individual swap agreements and generally include bankruptcy, failure to pay, restructuring, repudiation/moratorium, obligation acceleration and obligation default. Selling protection effectively adds leverage to a portfolio up to the notional amount of the swap agreement. Potential liabilities under these contracts may be reduced by: the auction rates of the underlying reference obligations; upfront payments received at the inception of a swap; and net amounts received from credit default swaps purchased with the identical reference obligation.
(M) Options Contracts. The Portfolio may write call and put options on securities and financial derivative instruments it owns or in which it may invest. Writing put options tends to increase the Portfolio’s exposure to the underlying instrument. Writing call options tends to decrease the Portfolio’s exposure to the underlying instrument. When the Portfolio writes a call or put, an amount equal to the premium received is recorded as a liability and subsequently marked to market to reflect the current value of the option written. These liabilities are reflected as written options outstanding on the Statement of Assets and Liabilities. Premiums received from writing options which expire are treated as realized gains. Premiums received from writing options which are exercised or closed are added to the proceeds or offset against amounts paid on the underlying futures, swaps, security or currency transaction to determine the realized gain or loss. Certain options may be written with premiums to be determined on a future date. The Portfolio, as a writer of an option, has no control over whether the underlying instrument may be sold (call) or purchased (put) and as a result bears the market risk of an unfavorable change in the price of the instrument underlying the written option. There is the risk the Portfolio may not be able to enter into a closing transaction because of an illiquid market. Writing call options involves risk of loss in excess of the related amounts reflected in the Statement of Assets and Liabilities.
The Portfolio may also purchase put and call options. Purchasing call options tends to increase the Portfolio’s exposure to the underlying instrument. Alternatively, purchasing put options tends to decrease the Portfolio’s exposure to the underlying instrument. The Portfolio pays a premium which is included on the Portfolio’s Statement of Assets and
Notes to Financial Statements (Unaudited) (continued)
Liabilities as an investment and subsequently marked to market to reflect the current value of the option. Premiums paid for purchasing options which expire are treated as realized losses. Certain options may be purchased with premiums to be determined on a future date. The premiums for these options are based upon implied volatility parameters at specified terms. The risk associated with purchasing put and call options is limited to the premium paid. Premiums paid for purchasing options which are exercised or closed are added to the amounts paid or offset against the proceeds on the underlying investment transaction to determine the realized gain or loss when the underlying transaction is sold.
The Portfolio may purchase or write foreign currency options. Purchasing a foreign currency option gives the Portfolio the right, but not the obligation, to buy or sell a specified amount of the currency at a specified rate of exchange that may be exercised on or before the option’s expiration date. Writing a foreign currency option obligates the Portfolio to buy or sell a specified amount of foreign currency at a specified rate of exchange, and such option may be exercised on or before the option’s expiration date in exchange for an option premium. These options may be used as a short or long hedge against possible variations in foreign exchange rates or to gain exposure to foreign currencies. The risks associated with writing a foreign currency put option include the risk that the Portfolio may incur a loss if the value of the referenced foreign currency decreases and the option is exercised. The risks associated with writing a foreign currency call option include the risk that if the value of the referenced foreign currency increases, and if the option is exercised, the Portfolio must either acquire the referenced foreign currency at the then higher price for delivery or, if the Portfolio already owns the referenced foreign currency, forego the opportunity for profit with respect to such foreign currency.
The Portfolio may purchase or write option on exchanged-traded futures contracts (“Futures Option”) to hedge an existing position or futures investment, for speculative purposes or to manage exposure to market movements. A Futures Option is an option contract in which the underlying instrument is a single futures contract.
The Portfolio may purchase or write inflation-capped options to enhance returns or for hedging opportunities. An inflation-capped option pays out if inflation exceeds a certain level over a specified period of time. The purpose of purchasing inflation-capped options is to protect the Portfolio from inflation erosion above a certain rate on a given notional exposure. When the Portfolio writes an inflation-capped option, an amount equal to the premium received is recorded as a liability and subsequently marked to market to reflect the current value of the option written. As of June 30, 2020, all open options are shown in the Portfolio of Investments.
(N) Interest Rate and Credit Default Swaptions. The Portfolio may enter into interest rate or credit default swaption agreements. A swaption is an option to enter into a pre-defined swap agreement at a specified date in the future. The writer of the swaption becomes the counterparty to the swap if the buyer exercises. The interest rate swaption agreement will specify whether the buyer of the swaption will be a fixed-rate receiver or a fixed rate buyer. The credit default swaption agreement will specify whether the buyer of the swaption will be buying protection or selling protection. As of June 30, 2020, all open swaptions are shown in the Portfolio of Investments.
(O) Loan Assignments, Participations and Commitments. The Portfolio may invest in loan assignments and participations (“loans”). Commitments are agreements to make money available to a borrower in a specified amount, at a specified rate and within a specified time. The Portfolio records an investment when the borrower withdraws money on a commitment or when a funded loan is purchased (trade date) and records interest as earned. These loans pay interest at rates that are periodically reset by reference to a base lending rate plus a spread. These base lending rates are generally the prime rate offered by a designated U.S. bank or the LIBOR.
The loans in which the Portfolio may invest are generally readily marketable, but may be subject to some restrictions on resale. For example, the Portfolio may be contractually obligated to receive approval from the agent bank and/or borrower prior to the sale of these investments. If the Portfolio purchases an assignment from a lender, the Portfolio will generally have direct contractual rights against the borrower in favor of the lender. If the Portfolio purchases a participation interest either from a lender or a participant, the Portfolio typically will have established a direct contractual relationship with the seller of the participation interest, but not with the borrower. Consequently, the Portfolio is subject to the credit risk of the lender or participant who sold the participation interest to the Portfolio, in addition to the usual credit risk of the borrower. In the event that the borrower, selling participant or intermediate participants become insolvent or enter into bankruptcy, the Portfolio may incur certain costs and delays in realizing payment, or may suffer a loss of principal and/or interest.
Unfunded commitments represent the remaining obligation of the Portfolio to the borrower. At any point in time, up to the maturity date of the issue, the borrower may demand the unfunded portion. Unfunded amounts, if any, are marked to market and any unrealized gains or losses are recorded in the Statement of Assets and Liabilities. As of June 30, 2020, the Portfolio did not hold any unfunded commitments.
(P) Dollar Rolls. The Portfolio may enter into dollar roll transactions in which it sells mortgage-backed securities (“MBS”) from its portfolios to a counterparty from whom the Portfolio simultaneously agrees to buy a similar security on a delayed delivery basis. The Portfolio generally transfers MBS where the MBS are “to be announced,” therefore, the Portfolio accounts for these transactions as purchases and sales.
When accounted for as purchase and sales, the securities sold in connection with the dollar rolls are removed from a portfolio and a realized gain or loss is recognized. The securities the Portfolio has agreed to acquire are included at market value in the Portfolio of Investments and liabilities for such purchase commitments are included as payables for investments purchased. During the roll period, the Portfolio foregoes principal and interest paid on the securities. The Portfolio is compensated by the difference between the current sales price and the forward price for the future as well as by the earnings on the cash proceeds of the initial sale. Dollar rolls may be renewed without physical delivery of the securities subject to the contract. The Portfolio maintains liquid assets from its portfolio having a value not less than the repurchase price, including accrued interest. Dollar roll transactions involve certain risks, including the risk that the securities returned to the Portfolio at the end of the roll period, while substantially similar, could be inferior to what was initially sold to the counterparty.
| | |
| 36 | | MainStay VP PIMCO Real Return Portfolio |
The Portfolio accounts for a dollar roll transaction as a purchase and sale whereby the difference in the sales price and purchase price of the security sold is recorded as a realized gain (loss).
(Q) Reverse Repurchase Agreements. The Portfolio may enter into reverse repurchase agreements with banks or broker/dealers, which involve the sale of a security by a Portfolio and its agreement to repurchase the instrument at a specified time and price. Under a reverse repurchase agreement, the Portfolio continues to receive any principal and interest payments on the underlying security during the term of the agreement. These agreements involve the sale of debt securities, or obligations, held by a Portfolio, with an agreement to repurchase the obligations at an agreed-upon price, date and interest payment. The proceeds will be used to purchase other debt securities either maturing, or under an agreement to resell, at a date simultaneous with or prior to the expiration of the reverse repurchase agreement. Reverse repurchase agreements will be utilized, when permitted by law, only when the interest income to be earned from the investment of the proceeds from the transaction is greater than the interest expense of the reverse repurchase transaction.
The Portfolio will limit its investments in reverse repurchase agreements and other borrowing to no more than 33%, or as otherwise limited herein, of its total assets. While a reverse repurchase agreement is outstanding, the Portfolios will maintain liquid assets in an amount at least equal in value to the Portfolios’ commitments to cover their obligations under the agreement. The use of reverse repurchase agreements by the Portfolio creates leverage that increases the Portfolio’s investment risk. If the income and gains on securities purchased with the proceeds of reverse repurchase agreements exceed the cost of the agreements, the Portfolio’s earnings or NAV will increase faster than otherwise would be the case; conversely, if the income and gains fail to exceed the costs, earnings or NAV would decline faster than otherwise would be the case. If the buyer of the obligation subject to the reverse repurchase agreement becomes bankrupt, realization upon the underlying securities may be delayed and there is a risk of loss due to any decline in their value. During the period ended June 30, 2020, the Portfolio’s average amount of borrowing was $66,442 at a weighted average interest rate of 0.12%. As of June 30, 2020, the Portfolio did not hold any reverse repurchase agreements.
(R) Sale-Buybacks. The Portfolio may enter into financing transactions referred to as ‘sale-buybacks’. A sale-buyback transaction consists of a sale of a security by the Portfolio to a financial institution, the counterparty, with a simultaneous agreement to repurchase the same or substantially the same security at an agreed-upon price and date. The Portfolio is not entitled to receive principal and interest payments, if any, made on the security sold to the counterparty during the term of the agreement. The agreed-upon proceeds for securities to be repurchased by the Portfolio are reflected as a liability on the Statement of Assets and Liabilities. The Portfolio will recognize net income represented by the price differential between the price received for the transferred security and the agreed-upon repurchase price. This is commonly referred to as the “price drop”. A price drop consists of (i) the foregone interest and inflationary income adjustments, if any, the Portfolio would have otherwise received had the security not been sold and (ii) the negotiated financing terms between the Portfolio and counterparty. Foregone interest and inflationary income adjustments, if
any, are recorded as components of interest income on the Statement of Operations. Interest payments based upon negotiated financing terms made by the Portfolio to counterparties are recorded as a component of interest expense on the Statement of Operations. In periods of increased demand for the security, the Portfolio may receive a fee for use of the security by the counterparty, which may result in interest income to the Portfolio. The Portfolio will segregate cash or liquid assets, enter into off-setting transactions or use other measures permitted by applicable laws to “cover” the Portfolio’s current obligations.
(S) Securities Sold Short. The Portfolio may engage in sales of securities it does not own (“short sales”) as part of its investment strategies. When the Portfolio enters into a short sale, it must segregate or maintain with a broker the cash proceeds from the security sold short or other securities as collateral for its obligation to deliver the security upon conclusion of the sale. During the period a short position is open, depending on the nature and type of security, a short position is reflected as a liability and is marked to market in accordance with the valuation methodologies previously detailed (See Note 2(A)). Liabilities for securities sold short are closed out by purchasing the applicable securities for delivery to the counterparty broker. A gain, limited to the price at which the Portfolio sold the security short, or a loss, unlimited as to dollar amount, will be recognized upon termination of a short sale if the market price on the date the short position is closed out is less or greater, respectively, than the proceeds originally received. Any such gain or loss may be offset, completely or in part, by the change in the value of the hedged investments. Interest on short positions held is accrued daily, while dividends declared on short positions existing on the record date are recorded on the ex-dividend date as a dividend expense in the Statement of Operations. Broker fees and other expenses related to securities sold short are disclosed in the Statement of Operations. Short sales involve risk of loss in excess of the related amounts reflected in the Statement of Assets and Liabilities. As of June 30, 2020, the Portfolio did not enter into any securities sold short.
(T) Delayed Delivery Transactions. The Portfolio may purchase or sell securities on a delayed delivery basis. These transactions involve a commitment by the Portfolio to purchase or sell securities for a predetermined price or yield, with payment and delivery taking place beyond the customary settlement period. When delayed delivery purchases are outstanding, the Portfolio will designate liquid assets in an amount sufficient to meet the purchase price. When purchasing a security on a delayed delivery basis, the Portfolio assumes the rights and risks of ownership of the security, including the risk of price and yield fluctuations, and takes such fluctuations into account when determining its NAV. The Portfolio may dispose of or renegotiate a delayed delivery transaction after it is entered into, and may sell delayed delivery securities before they are delivered, which may result in a realized gain or loss. When the Portfolio has sold a security it owns on a delayed delivery basis, the Portfolio does not participate in future gains and losses with respect to the security. As of June 30, 2020, delayed delivery transactions are shown in the Portfolio of investments.
(U) Treasury Inflation-Protected Securities. The Portfolio invests in Treasury Inflation-Protected Securities (“TIPS”) which are specially structured bonds in which the principal amount is adjusted to keep pace with inflation. The inflation (deflation) adjustment is applied to the principal of each bond on a monthly basis and is accounted for as
Notes to Financial Statements (Unaudited) (continued)
interest income on the Statement of Operations. TIPS are subject to interest rate risk.
(V) Securities Lending. In order to realize additional income, the Portfolio may engage in securities lending, subject to the limitations set forth in the 1940 Act and relevant guidance by the staff of the Securities and Exchange Commission (“SEC”). If the Portfolio engages in securities lending, the Portfolio will lend through its custodian, currently State Street Bank and Trust Company (“State Street”), acting as securities lending agent on behalf of the Portfolio. Under the current arrangement, State Street will manage the Portfolio’s collateral in accordance with the securities lending agency agreement between the Portfolio and State Street, and indemnify the Portfolio against counterparty risk. The loans will be collateralized by cash (which may be invested in a money market fund) and/or non-cash collateral (which may include U.S. Treasury securities and/or U.S. government agency securities issued or guaranteed by the United States government or its agencies or instrumentalities) at least equal at all times to the market value of the securities loaned. The Portfolio bears the risk of delay in recovery of, or loss of rights in, the securities loaned. The Portfolio may also record a realized gain or loss on securities deemed sold due to a borrower’s inability to return securities on loan. The Portfolio bears the risk of any loss on investment of cash collateral. The Portfolio will receive compensation for lending its securities in the form of fees or it will retain a portion of interest earned on the investment of any cash collateral. The Portfolio will also continue to receive interest and dividends on the securities loaned and any gain or loss in the market price of the securities loaned that may occur during the term of the loan will be for the account of the Portfolio. Income earned from securities lending activities, if any, is reflected in the Statement of Operations. As of June 30, 2020, the Portfolio did not have any portfolio securities on loan.
(W) Securities Risk. The ability of issuers of debt securities held by the Portfolio to meet their obligations may be affected by, among other things, economic or political developments in a specific country, industry or region. Debt securities are also subject to the risks associated with changes in interest rates.
The Portfolio primarily invests in high yield debt securities (commonly referred to as “junk bonds”), which are considered speculative because they present a greater risk of loss, including default, than higher rated debt securities. These securities pay investors a premium—a higher interest rate or yield than investment grade debt securities—because of the increased risk of loss. These securities can also be subject to greater price volatility. In times of unusual or adverse market, economic or political conditions, these securities may experience higher than normal default rates.
Investments in the Portfolio are not guaranteed, even though some of the Portfolio’s underlying investments are guaranteed by the U.S. government or its agencies or instrumentalities. The principal risk of mortgage-related and asset-backed securities is that the underlying debt may be prepaid ahead of schedule, if interest rates fall, thereby reducing the value of the Portfolio’s investment. If interest rates rise, less of the debt may be prepaid and the Portfolio may lose money. The Portfolio is subject to interest-rate risk and its holdings in bonds can lose principal value when interest rates rise. Bonds are also subject to credit risk, in which the bond issuer may fail to pay interest and principal in a timely manner.
The Portfolio may invest in foreign debt securities, which carry certain risks that are in addition to the usual risks inherent in domestic debt securities. These risks include those resulting from currency fluctuations, future adverse political or economic developments and possible imposition of currency exchange blockages or other foreign governmental laws or restrictions. These risks are likely to be greater in emerging markets than in developed markets. The ability of issuers of securities held by the Portfolio to meet their obligations may be affected by, among other things, economic or political developments in a specific country, industry or region.
(X) Counterparty Credit Risk. In order to better define its contractual rights and to secure rights that will help the Portfolio mitigate its counterparty risk, the Portfolio may enter into an International Swaps and Derivatives Association, Inc. Master Agreement (“ISDA Master Agreement”) or similar agreement with its counterparties. An ISDA Master Agreement is a bilateral agreement between the Portfolio and a counterparty that governs certain OTC derivatives and typically contains collateral posting terms and netting provisions. Under an ISDA Master Agreement, the Portfolio may, under certain circumstances, offset with the counterparty certain derivative financial instruments’ payables and/or receivables with collateral held and/or posted and create one single net payment. The provisions of the ISDA Master Agreement typically permit a single net payment in the event of default including the bankruptcy or insolvency of the counterparty. Bankruptcy or insolvency laws of a particular jurisdiction may restrict or prohibit the right of offset in bankruptcy, insolvency or other events. In addition, certain ISDA Master Agreements may contain provisions for early termination of OTC derivative transactions in the event the net assets of the Portfolio declines below specific levels or if the Portfolio fails to meet the terms of its ISDA Master Agreements. The result would cause the Portfolio to accelerate payment of any net liability owed to the counterparty.
For financial reporting purposes, the Portfolio does not offset derivative assets and derivative liabilities that are subject to netting arrangements, if any, in the Statement of Assets and Liabilities.
(Y) LIBOR Replacement Risk. The Portfolio may invest in certain debt securities, derivatives or other financial instruments that utilize the London Interbank Offered Rate (“LIBOR”), as a “benchmark” or “reference rate” for various interest rate calculations. The United Kingdom Financial Conduct Authority, which regulates LIBOR, announced that after 2021 it will cease its active encouragement of banks to provide the quotations needed to sustain LIBOR. As a result, it is anticipated that LIBOR will be discontinued or will no longer be sufficiently robust to be representative of its underlying market around that time. Although financial regulators and industry working groups have suggested alternative reference rates, such as the European Interbank Offer Rate (“EURIBOR”), Sterling Overnight Interbank Average Rate (“SONIA”) and Secured Overnight Financing Rate (“SOFR”), there are challenges to converting certain contracts and transactions to a new benchmark and neither the full effects of the transition process nor its ultimate outcome is known.
The elimination of LIBOR or changes to other reference rates or any other changes or reforms to the determination or supervision of reference rates could have an adverse impact on the market for, or value of, any securities or payments linked to those reference rates, which may adversely affect the Portfolio’s performance and/or net asset value.
| | |
| 38 | | MainStay VP PIMCO Real Return Portfolio |
Uncertainty and risk also remain regarding the willingness and ability of issuers and lenders to include revised provisions in new and existing contracts or instruments. Consequently, the transition away from LIBOR to other reference rates may lead to increased volatility and illiquidity in markets that are tied to LIBOR, fluctuations in values of LIBOR-related investments or investments in issuers that utilize LIBOR, increased difficulty in borrowing or refinancing and diminished effectiveness of hedging strategies, adversely affecting the Portfolio’s performance. Furthermore, the risks associated with the expected discontinuation of LIBOR and transition may be exacerbated if the work necessary to effect an orderly transition to an alternative reference rate is not completed in a timely manner. Because the usefulness of LIBOR as a benchmark could deteriorate during the transition period, these effects could occur prior to the end of 2021.
(Z) Indemnifications. Under the Fund’s organizational documents, its officers and trustees are indemnified against certain liabilities that may arise out of performance of their duties to the Fund. Additionally, in the normal course of business, the Portfolio enters into contracts with third-party service providers that contain a variety of representations and warranties and that may provide general indemnifications. The
Portfolio’s maximum exposure under these arrangements is unknown, as this would involve future claims that may be made against the Portfolio that have not yet occurred. The Manager believes that the risk of loss in connection with these potential indemnification obligations is remote. However, there can be no assurance that material liabilities related to such obligations will not arise in the future, which could adversely impact the Portfolio.
(AA) Quantitative Disclosure of Derivative Holdings. The following tables show additional disclosures related to the Portfolio’s derivative and hedging activities, including how such activities are accounted for and their effect on the Portfolio’s financial positions, performance and cash flows. The Portfolio entered into futures contracts to manage its exposure to the securities markets or to movements in interest rates and currency values. The Portfolio wrote or purchased options to enhance returns or to hedge an existing position or future investment. The Portfolio entered into forward foreign currency contracts to hedge the currency exposure associated with some or all of the Portfolio’s securities or as a part of an investment strategy. The Portfolio utilizes credit default, interest rate and inflation swap agreements to manage its exposure to credit, interest rate and inflation risk.
Fair value of derivative instruments as of June 30, 2020:
Asset Derivatives
| | | | | | | | | | | | | | | | | | |
| | | Statement of Assets and Liabilities Location | | Foreign
Exchange
Contracts
Risk | | | Credit
Contracts
Risk | | | Interest
Rate
Contracts
Risk | | | Total | |
| | | | | |
Purchased Options | | Investments in securities, at value | | $ | — | | | $ | — | | | $ | 3,593 | | | $ | 3,593 | |
Futures Contracts | | Net Assets—Net unrealized appreciation on investments, swap contracts and futures contracts (a) | | | — | | | | — | | | | 182,160 | | | | 182,160 | |
OTC Swap Contracts | | Unrealized appreciation on OTC swap contracts | | | — | | | | — | | | | 50,778 | | | | 50,778 | |
Centrally Cleared Swap Contracts | | Net Assets—Net unrealized appreciation on investments, swap contracts and futures contracts (b) | | | — | | | | 81,114 | | | | 1,000,108 | | | | 1,081,222 | |
Forward Contracts | | Unrealized appreciation on foreign currency forward contracts | | | 928,616 | | | | — | | | | — | | | | 928,616 | |
| | | | | | |
Total Fair Value | | | | $ | 928,616 | | | $ | 81,114 | | | $ | 1,236,639 | | | $ | 2,246,369 | |
| | | | | | |
Liability Derivatives
| | | | | | | | | | | | | | | | | | |
| | | Statement of
Assets and Liabilities
Location | | Foreign
Exchange
Contracts
Risk | | | Credit
Contracts
Risk | | | Interest
Rate
Contracts
Risk | | | Total | |
| | | | | |
Written Options | | Investments in written options, at value | | $ | — | | | $ | — | | | $ | (19,390 | ) | | $ | (19,390 | ) |
Futures Contracts | | Net Assets—Net unrealized depreciation on investments, swap contracts and futures contracts (a) | | | — | | | | — | | | | (616,268 | ) | | | (616,268 | ) |
Centrally Cleared Swap Contracts | | Net Assets—Net unrealized depreciation on investments, swap contracts and futures contracts (b) | | | — | | | | (234,290 | ) | | | (765,300 | ) | | | (999,590 | ) |
Forward Contracts | | Unrealized depreciation on foreign currency forward contracts | | | (678,631 | ) | | | — | | | | — | | | | (678,631 | ) |
| | | | | | |
Total Fair Value | | | | $ | (678,631 | ) | | $ | (234,290 | ) | | $ | (1,400,958 | ) | | $ | (2,313,879 | ) |
| | | | | | |
| (a) | Includes cumulative appreciation (depreciation) of futures contracts as reported in the Portfolio of Investments. Only current day’s variation margin is reported within the Statement of Assets and Liabilities. |
Notes to Financial Statements (Unaudited) (continued)
| (b) | Includes cumulative appreciation (depreciation) of centrally cleared swap agreements as reported in the Portfolio of Investments. Only the current day’s variation margin is reported within the Statement of Assets and Liabilities. |
The effect of derivative instruments on the Statement of Operations for the period ended June 30, 2020:
Realized Gain (Loss)
| | | | | | | | | | | | | | | | | | |
| | | Statement of Operations Location | | Foreign
Exchange
Contracts
Risk | | | Credit
Contracts
Risk | | | Interest
Rate
Contracts
Risk | | | Total | |
| | | | | |
Purchased Options | | Net realized gain (loss) on investment transactions | | $ | — | | | $ | — | | | $ | 927,570 | | | $ | 927,570 | |
Written Options | | Net realized gain (loss) on written option transactions | | | — | | | | — | | | | (148,824 | ) | | | (148,824 | ) |
Futures Contracts | | Net realized gain (loss) on futures transactions | | | — | | | | — | | | | (3,480,522 | ) | | | (3,480,522 | ) |
Swap Contracts | | Net realized gain (loss) on swap transactions | | | — | | | | 651,227 | | | | (838,769 | ) | | | (187,542 | ) |
Forward Contracts | | Net realized gain (loss) on foreign currency forward transactions | | | (23,905 | ) | | | — | | | | — | | | | (23,905 | ) |
| | | | | | |
Total Realized Gain (Loss) | | | | $ | (23,905 | ) | | $ | 651,227 | | | $ | (3,540,545 | ) | | $ | (2,913,223 | ) |
| | | | | | |
Change in Unrealized Appreciation (Depreciation)
| | | | | | | | | | | | | | | | | | |
| | | Statement of Operations Location | | Foreign
Exchange
Contracts
Risk | | | Credit
Contracts
Risk | | | Interest
Rate
Contracts
Risk | | | Total | |
| | | | | |
Purchased Options | | Net change in unrealized appreciation (depreciation) on investments | | $ | — | | | $ | — | | | $ | 59,621 | | | $ | 59,621 | |
Written Options | | Net change in unrealized appreciation (depreciation) on written options | | | — | | | | — | | | | (21,498 | ) | | | (21,498 | ) |
Futures Contracts | | Net change in unrealized appreciation (depreciation) on futures contracts | | | — | | | | — | | | | (613,184 | ) | | | (613,184 | ) |
Swap Contracts | | Net change in unrealized appreciation (depreciation) on swap contracts | | | — | | | | 404,658 | | | | (419,214 | ) | | | (14,556 | ) |
Forward Contracts | | Net change in unrealized appreciation (depreciation) on foreign currency forward contracts | | | 541,576 | | | | — | | | | — | | | | 541,576 | |
| | | | | | |
Total Change in Unrealized Appreciation (Depreciation) | | $ | 541,576 | | | $ | 404,658 | | | $ | (994,275 | ) | | $ | (48,041 | ) |
| | | | | | |
Average Notional Amount
| | | | | | | | | | | | | | | | |
| | | Foreign
Exchange
Contracts
Risk | | | Credit
Contracts
Risk | | | Interest
Rate
Contracts
Risk | | | Total | |
| | | | |
Purchased Options | | $ | — | | | $ | — | | | $ | 152,960,478 | | | $ | 152,960,478 | |
Written Options (a) | | $ | — | | | $ | — | | | $ | (11,923,080 | ) | | $ | (11,923,080 | ) |
Written Swaptions | | $ | — | | | $ | — | | | $ | (24,510,092 | ) | | $ | (24,510,092 | ) |
Written Inflation—Capped Options | | $ | — | | | $ | — | | | $ | (2,200,000 | ) | | $ | (2,200,000 | ) |
Futures Contracts Long | | $ | — | | | $ | — | | | $ | 74,283,075 | | | $ | 74,283,075 | |
Futures Contracts Short | | $ | — | | | $ | — | | | $ | (184,201,326 | ) | | $ | (184,201,326 | ) |
Swap Contracts Long | | $ | — | | | $ | 9,825,812 | | | $ | 82,574,807 | | | $ | 92,400,619 | |
Forward Contracts Long | | $ | 22,988,441 | | | $ | — | | | $ | — | | | $ | 22,988,441 | |
Forward Contracts Short | | $ | (69,491,693 | ) | | $ | — | | | $ | — | | | $ | (69,491,693 | ) |
| | | | | | | | |
| (a) | Positions were open five months during the reporting period. |
| | |
| 40 | | MainStay VP PIMCO Real Return Portfolio |
Borrowings and other financing transactions summary
The following is a summary by counterparty of the market value of Borrowings and Other Financing Transactions and collateral (received)/pledged as of June 30, 2020:
| | | | | | | | | | | | | | | | |
Counterparty | | Payable for
Sale-Buyback
Transactions | | | Total
Borrowings and
Other Financing
Transactions | | | Collateral
(Received)/
Pledged | | | Net
Exposure (a) | |
| | | | |
Master Securities Forward Transaction Agreement | | | | | | | | | | | | | | | | |
| | | | |
Barclays Capital Inc. | | $ | (263,364,154 | ) | | $ | (263,364,154 | ) | | $ | 265,031,325 | | | $ | 1,667,171 | |
| | | | | | | | | | | | | | | | |
| | | | |
Total Borrowings and Other Financing Transactions | | $ | (263,364,154 | ) | | | | | | | | | | | | |
| | | | | | | | | | | | | | | | |
| (a) | Net Exposure represents the net receivable/(payable) that would be due from/to the counterparty in the event of default. Exposure from borrowings and other financing transactions can only be netted across transactions governed under the same master agreement with the same legal entity. |
Certain Transfers Accounted for as Secured Borrowings
Remaining Contractual Maturity of the Agreements
| | | | | | | | | | | | | | | | | | | | |
| | | Overnight and
Continuous | | | Up to 30 days | | | 31-90 days | | | Greater than
90 days | | | Total | |
Sale-Buyback Transactions | | | | | | | | | | | | | | | | | | | | |
United States Treasury Obligations | | $ | — | | | $ | 256,305,456 | | | $ | 7,058,698 | | | $ | — | | | $ | 263,364,154 | |
| | | | |
Total Borrowings | | $ | — | | | $ | 256,305,456 | | | $ | 7,058,698 | | | $ | — | | | $ | 263,364,154 | |
| | | | |
Gross amount of recognized liabilities for reverse repurchase agreements and sale-buyback financing transactions | | | | | | | | | | | | | | | | | | $ | 263,364,154 | |
| | | | | | | | | | | | | | | | | | | | |
Note 3–Fees and Related Party Transactions
(A) Manager and Subadvisor. New York Life Investments, a registered investment adviser and an indirect, wholly-owned subsidiary of New York Life, serves as the Portfolio’s Manager pursuant to an Amended and Restated Management Agreement (“Management Agreement”). The Manager provides offices, conducts clerical, recordkeeping and bookkeeping services, and keeps most of the financial and accounting records required to be maintained by the Portfolio. Except for the portion of salaries and expenses that are the responsibility of the Portfolio, the Manager pays the salaries and expenses of all personnel affiliated with the Portfolio and certain operational expenses of the Portfolio. The Portfolio reimburses New York Life Investments in an amount equal to the portion of the compensation of the Chief Compliance Officer attributable to the Portfolio. Pacific Investment Management Company LLC (“ PIMCO” or the “Subadvisor”), a registered investment adviser, serves as Subadvisor to the Portfolio and is responsible for the day-to-day portfolio management of the Portfolio. Pursuant to the terms of a Subadvisory Agreement (“Subadvisory Agreement”) between New York Life Investments and PIMCO, New York Life Investments pays for the services of the Subadvisor.
The Fund, on behalf of the Portfolio, pays New York Life Investments in its capacity as the Portfolio’s investment manager and administrator, pursuant to the Management Agreement, a monthly fee for the services performed and the facilities furnished at an annual percentage of the Portfolio’s average daily net assets of 0.50% on all assets. During the six-month period ended June 30, 2020, the effective management fee rate (exclusive of any applicable waivers/reimbursements) was 0.50%.
New York Life Investment Management LLC (“New York Life Investments”) has contractually agreed to waive fees and/or reimburse
expenses so that Total Annual Portfolio Operating Expenses (excluding taxes, interest, litigation, extraordinary expenses, brokerage and other transaction expenses relating to the purchase or sale of portfolio investments, and acquired (underlying) portfolio/fund fees and expenses) Initial and of Service Class shares do not exceed 0.53% and 0.78% of the Portfolio’s average daily net assets, respectively. This agreement will remain in effect until May 1, 2021, and shall renew automatically for one-year terms unless New York Life Investments provides written notice of termination prior to the start of the next term or upon approval of the Board.
During the six-month period ended June 30, 2020, New York Life Investments earned fees from the Portfolio in the amount of $1,011,106 and waived its fees and/or reimbursed expenses in the amount of $146,050 and paid the Subadvisor in the amount of $505,553.
State Street provides sub-administration and sub-accounting services to the Portfolio pursuant to an agreement with New York Life Investments. These services include calculating the daily NAVs of the Portfolio, maintaining the general ledger and sub-ledger accounts for the calculation of the Portfolio’s NAVs and assisting New York Life Investments in conducting various aspects of the Portfolio’s administrative operations. For providing these services to the Portfolio, State Street is compensated by New York Life Investments.
Pursuant to an agreement between the Fund and New York Life Investments, New York Life Investments is responsible for providing or procuring certain regulatory reporting services for the Portfolio. The Portfolio will reimburse New York Life Investments for the actual costs incurred by New York Life Investments in connection with providing or procuring these services for the Portfolio.
Notes to Financial Statements (Unaudited) (continued)
(B) Distribution and Service Fees. The Fund, on behalf of the Portfolio, has entered into a distribution agreement with NYLIFE Distributors LLC (the “Distributor”), an indirect, wholly-owned subsidiary of New York Life. The Portfolio has adopted a distribution plan (the “Plan”) in accordance with the provisions of Rule 12b-1 under the 1940 Act. Under the Plan, the Distributor has agreed to provide, through its affili-
ates or independent third parties, various distribution-related, shareholder and administrative support services to the Service Class shareholders. For its services, the Distributor is entitled to a combined distribution and service fee accrued daily and paid monthly at an annual rate of 0.25% of the average daily net assets attributable to the Service Class shares of the Portfolio.
(C) Investments in Affiliates (in 000’s). During the six-month period ended June 30, 2020, purchases and sales transactions, income earned from investments and shares held of investment companies managed by New York Life Investments or its affiliates were as follows:
| | | | | | | | | | | | | | | | | | | | | | | | | | | | | | | | | | | | |
Affiliated Investment
Company | | Value,
Beginning
of Period | | | Purchases
at Cost | | | Proceeds
from
Sales | | | Net
Realized
Gain/(Loss)
on Sales | | | Change in
Unrealized
Appreciation/
(Depreciation) | | | Value,
End
of Period | | | Dividend
Income | | | Other
Distributions | | | Shares
End of
Period | |
MainStay U.S. Government Liquidity Fund | | $ | 1,528 | | | $ | 71,499 | | | $ | (71,167 | ) | | $ | — | | | $ | — | | | $ | 1,860 | | | $ | 3 | | | $ | — | | | | 1,860 | |
Note 4–Federal Income Tax
As of June 30, 2020, the cost and unrealized appreciation (depreciation) of the Portfolio’s investment portfolio, including applicable derivative contracts and other financial instruments, as determined on a federal income tax basis, was as follows:
| | | | | | | | | | | | | | | | |
| | | Federal
Tax Cost | | | Gross
Unrealized
Appreciation | | | Gross
Unrealized
(Depreciation) | | | Net
Unrealized
Appreciation/
(Depreciation) | |
| | | | |
Investments in Securities | | $ | 556,322,186 | | | $ | 33,330,223 | | | $ | (2,798,330 | ) | | $ | 30,531,893 | |
As of December 31, 2019, for federal income tax purposes, capital loss carryforwards of $78,764,667, as shown in the table below, were available to the extent provided by the regulations to offset future realized gains of the Portfolio through the years indicated. Accordingly, no capital gains distributions are expected to be paid to shareholders until net gains have been realized in excess of such amounts.
| | | | |
Capital Loss
Available Through | | Short-Term
Capital Loss
Amounts (000’s) | | Long-Term
Capital Loss
Amounts (000’s) |
| | |
| Unlimited | | $25,699 | | $53,066 |
During the year ended December 31, 2019, the tax character of distributions paid as reflected in the Statements of Changes in Net Assets was as follows:
| | |
|
| 2019 |
Tax-Based
Distributions
from Ordinary
Income | | Tax-Based
Distributions
from Long-Term
Gains |
| |
| $11,047,701 | | $ — |
Note 5–Custodian
State Street is the custodian of cash and securities held by the Portfolio. Custodial fees are charged to the Portfolio based on the Portfolio’s net assets and/or the market value of securities held by the Portfolio and the number of certain transactions incurred by the Portfolio.
Note 6–Line of Credit
The Portfolio and certain other funds managed by New York Life Investments maintain a line of credit with a syndicate of banks in order to secure a source of funds for temporary purposes to meet unanticipated or excessive redemption requests.
Effective July 28, 2020, under the credit agreement (the “Credit Agreement”), the aggregate commitment amount is $600,000,000 with an additional uncommitted amount of $100,000,000. The commitment fee is an annual rate of 0.15% of the average commitment amount payable quarterly, regardless of usage, to JP Morgan Chase Bank NA, who serves as the agent to the syndicate. The commitment fee is allocated among the Portfolio and certain other funds managed by New York Life Investments based upon their respective net assets and other factors. Interest on any revolving credit loan is charged based upon the Federal Funds Rate or the one-month LIBOR, whichever is higher. The Credit Agreement expires on July 27, 2021, although the Portfolio, certain other funds managed by New York Life Investments and the syndicate of banks may renew the Credit Agreement for an additional year on the same or different terms or enter into a credit agreement with a different syndicate of banks. Prior to July 28, 2020, the aggregate commitment amount and the commitment fee were the same as those under the current Credit Agreement, but State Street Served as agent to the syndicate. As of June 30, 2020, there were no borrowings outstanding with respect to the Portfolio under the Credit Agreement or the credit agreement for which State Street served as agent.
Note 7–Interfund Lending Program
Pursuant to an exemptive order issued by the SEC, the Portfolio, along with certain other funds managed by New York Life Investments, may participate in an interfund lending program. The interfund lending program provides an alternative credit facility that permits the Portfolio and certain other funds managed by New York Life Investments to lend or borrow money for temporary purposes directly to or from one another subject to the conditions of the exemptive order. During the six-month period ended June 30, 2020, there were no interfund loans made or outstanding with respect to the Portfolio.
| | |
| 42 | | MainStay VP PIMCO Real Return Portfolio |
Note 8–Purchases and Sales of Securities (in 000’s)
During the six-month period ended June 30, 2020, purchases and sales of U.S. government securities were $602,508 and $613,359, respectively. Purchases and sales of securities, other than U.S. government securities and short-term securities, were $11,438 and $18,007, respectively.
The Portfolio may purchase securities from or sell securities to other portfolios managed by the Subadvisor. These interportfolio transactions are primarily used for cash management purposes and are made pursuant to Rule 17a-7 under the 1940 Act. The Rule 17a-7 transactions during the six-month period ended June 30, 2020, were as follows:
| | | | |
Purchases
(000’s) | | Sales
(000’s) | | Realized Gain/
(Loss) (000’s) |
| | |
| $XX | | $XXX | | $XX |
Note 9–Capital Share Transactions
Transactions in capital shares for the six-month period ended June 30, 2020 and the year ended December 31, 2019, were as follows:
| | | | | | | | |
Initial Class | | Shares | | | Amount | |
| | |
Six-month period ended June 30, 2020: | | | | | | | | |
Shares sold | | | 117,417 | | | $ | 1,043,221 | |
Shares redeemed | | | (384,067 | ) | | | (3,455,378 | ) |
| | | | |
Net increase (decrease) | | | (266,650 | ) | | $ | (2,412,157 | ) |
| | | | |
Year ended December 31, 2019: | | | | | | | | |
Shares sold | | | 651,387 | | | $ | 5,608,170 | |
Shares issued to shareholders in reinvestment of distributions | | | 165,706 | | | | 1,424,708 | |
Shares redeemed | | | (599,073 | ) | | | (5,169,589 | ) |
| | | | |
Net increase (decrease) | | | 218,020 | | | $ | 1,863,289 | |
| | | | |
| | |
| | | | | | | | |
Service Class | | Shares | | | Amount | |
Six-month period ended June 30, 2020: | | | | | | | | |
Shares sold | | | 5,158,085 | | | $ | 45,760,071 | |
Shares redeemed | | | (4,790,572 | ) | | | (42,315,230 | ) |
| | | | |
Net increase (decrease) | | | 367,513 | | | $ | 3,444,841 | |
| | | | |
Year ended December 31, 2019: | | | | | | | | |
Shares sold | | | 8,984,695 | | | $ | 76,913,412 | |
Shares issued to shareholders in reinvestment of distributions | | | 1,120,695 | | | | 9,622,993 | |
Shares redeemed | | | (4,671,355 | ) | | | (40,057,646 | ) |
| | | | |
Net increase (decrease) | | | 5,434,035 | | | $ | 46,478,759 | |
| | | | |
Note 10–Recent Accounting Pronouncement
In March 2020, the Financial Accounting Standards Board (“FASB”) issued Accounting Standards Update 2020-04 (“ASU 2020-04”), which provides optional guidance to ease the potential accounting burden associated with transitioning away from LIBOR and other reference rates that are expected to be discontinued. ASU 2020-04 is effective immediately upon release of the update on March 12, 2020 through December 31, 2022. At this time, the Manager is evaluating the implications of certain other provisions of ASU 2020-04 related to new disclosure requirements and any impact on the financial statement disclosures has not yet been determined.
Note 11–Subsequent Events
In connection with the preparation of the financial statements of the Portfolio as of and for the six-month period ended June 30, 2020, events and transactions subsequent to June 30, 2020, through the date the financial statements were issued have been evaluated by the Manager, for possible adjustment and/or disclosure. No subsequent events requiring financial statement adjustment or disclosure have been identified.
Note 12–Other Matters
An outbreak of COVID-19, first detected in December 2019, has developed into a global pandemic and has resulted in travel restrictions, closure of international borders, certain businesses and securities markets, restrictions on securities trading activities, prolonged quarantines, supply chain disruptions, and lower consumer demand, as well as general concern and uncertainty. The continued impact of COVID-19 is uncertain and could further adversely affect the global economy, national economies, individual issuers and capital markets in unforeseeable ways and result in a substantial and extended economic downturn. Developments that disrupt global economies and financial markets, such as COVID-19, may magnify factors that affect the Portfolio’s performance.
Discussion of the Operation and Effectiveness of the Portfolio’s Liquidity Risk
Management Program (Unaudited)
In compliance with Rule 22e-4 under the Investment Company Act of 1940, as amended (the “Liquidity Rule”), the Portfolio has adopted and implemented a liquidity risk management program (the “Program”), which New York Life Investment Management LLC believes is reasonably designed to assess and manage the Portfolio’s liquidity risk. The Board designated New York Life Investment Management LLC as administrator of the Program (the “Administrator”). The Administrator has established a Liquidity Risk Management Committee to assist the Administrator in the implementation and day-to-day administration of the Program and to otherwise support the Administrator in fulfilling its responsibilities under the Program.
At a meeting of the Board held on March 11, 2020, the Administrator provided the Board with a written report addressing the Program’s operation, adequacy and effectiveness of implementation for the period from December 1, 2018 through December 31, 2019, as required under the Liquidity Rule. The report noted that the Administrator concluded that (i) the Program operated effectively to assess and manage the Portfolio’s liquidity risk, (ii) the Program has been adequately and effectively implemented to monitor and, as applicable, respond to the Portfolio’s liquidity developments and (iii) the Portfolio’s investment strategy continues to be appropriate for an open-end portfolio.
In accordance with the Program, the Portfolio’s liquidity risk is assessed no less frequently than annually taking into consideration certain factors, as applicable, such as (i) investment strategy and liquidity of portfolio investments, (ii) short-term and long-term cash flow projections and (iii) holdings of cash and cash equivalents and borrowing arrangements and other funding sources. Certain factors are considered under both normal and reasonably foreseeable stressed conditions.
Each Portfolio portfolio investment is classified into one of four liquidity categories. The classification is based on a determination of the number of days it is reasonably expected to take to convert the investment into cash, or sell or dispose of the investment, in current market conditions without significantly changing the market value of the investment. The Administrator has delegated liquidity classification determinations to the Portfolio’s subadvisors, subject to appropriate oversight by the Administrator, and classification determinations are made by taking into account the Portfolio’s reasonably anticipated trade size, various market, trading and investment-specific considerations, as well as market depth, and, in certain cases, third-party vendor data.
The Liquidity Rule requires portfolios that do not primarily hold assets that are highly liquid investments to adopt a minimum amount of net assets that must be invested in highly liquid investments that are assets (an “HLIM”). In addition, the Liquidity Rule limits a portfolio’s investments in illiquid investments. Specifically, the Liquidity Rule prohibits acquisition of illiquid investments if doing so would result in a portfolio holding more than 15% of its net assets in illiquid investments that are assets. The Program includes provisions reasonably designed to determine, periodically review and comply with the HLIM requirement, as applicable, and to comply with the 15% limit on illiquid investments.
| | |
| 44 | | MainStay VP PIMCO Real Return Portfolio |
Proxy Voting Policies and Procedures and Proxy Voting Record
A description of the policies and procedures that New York Life Investments uses to vote proxies related to the Portfolio’s securities is available free of charge upon request (i) by calling 800-598-2019; (ii) by visiting New York Life Investments’ website at https://www.nylinvestments.com/mainstay/products-and-performance/mainstay-vp-funds-trust; or (iii) by visiting the SEC’s website at www.sec.gov.
The Portfolio is required to file with the SEC its proxy voting record for the 12-month period ending June 30 on Form N-PX. The Portfolio’s most recent Form N-PX or proxy voting record is available free of charge upon request (i) by calling 800-598-2019; (ii) by visiting New York Life Investments’ website at https://www.nylinvestments.com/mainstay/products-and-performance/mainstay-vp-funds-trust; or (iii) by visiting the SEC’s website at www.sec.gov.
Shareholder Reports and Quarterly Portfolio Disclosure
The Portfolio is required to file its complete schedule of portfolio holdings with the SEC 60 days after its first and third fiscal quarter on Form N-PORT. The Portfolio’s holdings report is available free of charge upon request by calling 800-598-2019 or by visiting the SEC’s website at www.sec.gov.
MainStay VP Portfolios
MainStay VP offers a wide range of Portfolios. The full array of MainStay VP offerings is listed here, with information about the manager, subadvisors, legal counsel, and independent registered public accounting firm.
Equity Portfolios
MainStay VP Emerging Markets Equity Portfolio
MainStay VP Epoch U.S. Equity Yield Portfolio
MainStay VP Fidelity Institutional AM® Utilities Portfolio†
MainStay VP MacKay Common Stock Portfolio
MainStay VP MacKay Growth Portfolio
MainStay VP MacKay International Equity Portfolio
MainStay VP MacKay Mid Cap Core Portfolio
MainStay VP MacKay S&P 500 Index Portfolio
MainStay VP MacKay Small Cap Core Portfolio
MainStay VP Mellon Natural Resources Portfolio
MainStay VP Small Cap Growth Portfolio
MainStay VP T. Rowe Price Equity Income Portfolio
MainStay VP Winslow Large Cap Growth Portfolio
Mixed Asset Portfolios
MainStay VP Balanced Portfolio
MainStay VP Income Builder Portfolio
MainStay VP Janus Henderson Balanced Portfolio
MainStay VP MacKay Convertible Portfolio
Income Portfolios
MainStay VP Bond Portfolio
MainStay VP Floating Rate Portfolio
MainStay VP Indexed Bond Portfolio
MainStay VP MacKay Government Portfolio
MainStay VP MacKay High Yield Corporate Bond Portfolio
MainStay VP MacKay Unconstrained Bond Portfolio
MainStay VP PIMCO Real Return Portfolio
Money Market
MainStay VP U.S. Government Money Market Portfolio
Alternative
MainStay VP CBRE Global Infrastructure Portfolio
MainStay VP IQ Hedge Multi-Strategy Portfolio
Asset Allocation Portfolios
MainStay VP Conservative Allocation Portfolio
MainStay VP Growth Allocation Portfolio
MainStay VP Moderate Allocation Portfolio
MainStay VP Moderate Growth Allocation Portfolio
Manager
New York Life Investment Management LLC
New York, New York
Subadvisors
Brown Advisory LLC
Baltimore, Maryland
Candriam Belgium S.A.*
Brussels, Belgium
CBRE Clarion Securities LLC
Radnor, Pennsylvania
Epoch Investment Partners, Inc.
New York, New York
FIAM LLC
Smithfield, Rhode Island
IndexIQ Advisors LLC*
New York, New York
Janus Capital Management LLC
Denver, Colorado
MacKay Shields LLC*
New York, New York
Mellon Investments Corporation
Boston, Massachusetts
NYL Investors LLC*
New York, New York
Pacific Investment Management Company LLC
Newport Beach, California
Segall Bryant & Hamill, LLC
Chicago, Illinois
T. Rowe Price Associates, Inc.
Baltimore, Maryland
Winslow Capital Management, LLC
Minneapolis, Minnesota
Distributor
NYLIFE Distributors LLC*
Jersey City, New Jersey
Custodian
State Street Bank and Trust Company
Boston, Massachusetts
Independent Registered Public Accounting Firm
PricewaterhouseCoopers LLP
New York, New York
Legal Counsel
Dechert LLP
Washington, District of Columbia
Some Portfolios may not be available in all products.
| † | Fidelity Institutional AM is a registered trade mark of FMR LLC. Used with permission. |
| * | An affiliate of New York Life Investment Management LLC |
Not part of the Semiannual Report
2020 Semiannual Report
This report is for the general information of New York Life Variable Annuities and NYLIAC Variable Universal Life Insurance Products policyowners. It must be preceded or accompanied by the appropriate product(s) and funds prospectuses if it is given to anyone who is not an owner of a New York Life variable annuity policy or a NYLIAC Variable Universal Life Insurance Product. This report does not offer for sale or solicit orders to purchase securities.
The performance data quoted in this report represents past performance. Past performance is no guarantee of future results. Due to market volatility and other factors, current performance may be lower or higher than the figures shown. The most recent month-end performance summary for your variable annuity or variable life policy is available by calling 800-598-2019 and is updated periodically on www.newyorklife.com.
The New York Life Variable Annuities and NYLIAC Variable Universal Life Insurance Products are issued by New York Life Insurance and Annuity Corporation (a Delaware Corporation) and distributed by NYLIFE Distributors LLC (Member FINRA/SIPC).
New York Life Insurance Company
New York Life Insurance and Annuity Corporation (NYLIAC) (A Delaware Corporation)
51 Madison Avenue, Room 551
New York, NY 10010
www.newyorklife.com
Printed on recycled paper
nylinvestments.com
NYLIFE Distributors LLC, 30 Hudson Street, Jersey City, NJ 07302
New York Life Investment Management LLC is the investment manager to the MainStay VP Funds Trust
©2020 by NYLIFE Distributors LLC. All rights reserved.
You may obtain copies of the Prospectus and the Statement of Additional Information free of charge, upon request, by calling toll-free 800-598-2019 or writing to New York Life Insurance and Annuity Corporation, 51 Madison Avenue, New York, NY 10010.
| | | | |
| Not FDIC Insured | | No Bank Guarantee | | May Lose Value |
| | | | |
| 1781636 | | | | MSVPPRR10-08/20 (NYLIAC) NI528 |
Not applicable.
| Item 3. | Audit Committee Financial Expert. |
Not applicable.
| Item 4. | Principal Accountant Fees and Services. |
Not applicable.
| Item 5. | Audit Committee of Listed Registrants. |
Not applicable.
The Schedule of Investments is included as part of Item 1 of this report.
| Item 7. | Disclosure of Proxy Voting Policies and Procedures for Closed-End Management Investment Companies. |
Not applicable.
| Item 8. | Portfolio Managers of Closed-End Management Investment Companies. |
Not applicable.
| Item 9. | Purchases of Equity Securities by Closed-End Management Investment Company and Affiliated Purchasers. |
Not applicable.
| Item 10. | Submission of Matters to a Vote of Security Holders. |
Since the Registrant’s last response to this Item, there have been no material changes to the procedures by which shareholders may recommend nominees to the Registrant’s Board of Trustees.
| Item 11. | Controls and Procedures. |
| (a) | Based on an evaluation of the Registrant’s Disclosure Controls and Procedures (as defined in Rule 30a-3(c) under the Investment Company Act of 1940) (the “Disclosure Controls”), as of a date within 90 days prior to the filing date (the “Filing Date”) of this Form N-CSR (the “Report”), the Registrant’s principal executive officer and principal |
| | financial officer have concluded that the Disclosure Controls are reasonably designed to ensure that information required to be disclosed by the Registrant in the Report is recorded, processed, summarized and reported by the Filing Date, including ensuring that information required to be disclosed in the Report is accumulated and communicated to the Registrant’s management, including the Registrant’s principal executive officer and principal financial officer, as appropriate to allow timely decisions regarding required disclosure. |
| (b) | There were no changes in the Registrant’s internal control over financial reporting (as defined in Rule 30a-3(d)) under the Investment Company Act of 1940 that occurred during the period covered by this report that has materially affected, or is reasonably likely to materially affect, the Registrant’s internal control over financial reporting. |
Item 12. Disclosure of Securities Lending Activities for Closed-End Management Investment Companies.
Not applicable.
Item 13. Exhibits.
SIGNATURES
Pursuant to the requirements of the Securities Exchange Act of 1934 and the Investment Company Act of 1940, the Registrant has duly caused this Report to be signed on its behalf by the undersigned, thereunto duly authorized.
MAINSTAY VP FUNDS TRUST
| | |
| By: | | /s/ Kirk C. Lehneis |
| | Kirk C. Lehneis President and Principal Executive Officer |
| |
| Date: | | September 4, 2020 |
|
| Pursuant to the requirements of the Securities Exchange Act of 1934 and the Investment Company Act of 1940, this Report has been signed below by the following persons on behalf of the Registrant and in the capacities and on the dates indicated. |
| |
| By: | | /s/ Kirk C. Lehneis |
| | Kirk C. Lehneis President and Principal Executive Officer |
| |
| Date: | | September 4, 2020 |
| |
| By: | | /s/ Jack R. Benintende |
| | Jack R. Benintende Treasurer and Principal Financial and Accounting Officer |
| |
| Date: | | September 4, 2020 |
EXHIBIT INDEX